Verdict — Performance Of An 18-inch Gaming Laptop In A 16-inch Screen Size
The Raider 16 Max HX may be smaller than the massive Raider 18 or Titan 18, but it still prioritizes performance before anything else. The Arrow Lake-HX CPU and 175 W GPU are some of the fastest options available to make the Raider 16 Max HX one of the fastest solutions for gaming in the market regardless of size. The glossy OLED display is equally as impressive if you can mitigate the inevitable glare while the SODIMM/SSD subpanel is a practical feature we would love to see on all MSI gaming laptops moving forward.
The extreme performance comes with costs. Most notably, the Raider 16 Max HX is chunkier and heavier than many other 16-inch gaming laptops including the already large Alienware 16X Aurora. The plastic chassis doesn't feel as luxurious as the Alienware 16 Area-51 despite their similar price points while the lack of G-Sync and Advanced Optimus is difficult to forgive given the costs involved. Users who like to travel and game on-the-move may find more value from lighter and more portable 16-inch solutions like the MSI Stealth 16 or Razer Blade 16 which come with similar RTX 5090 graphics running at slightly slower performance levels.
Pros
Cons
Price and Availability
The MSI Raider 16 Max HX is now shipping at Microcenter for up to $2500 USD if configured with the GeForce RTX 5080 GPU.
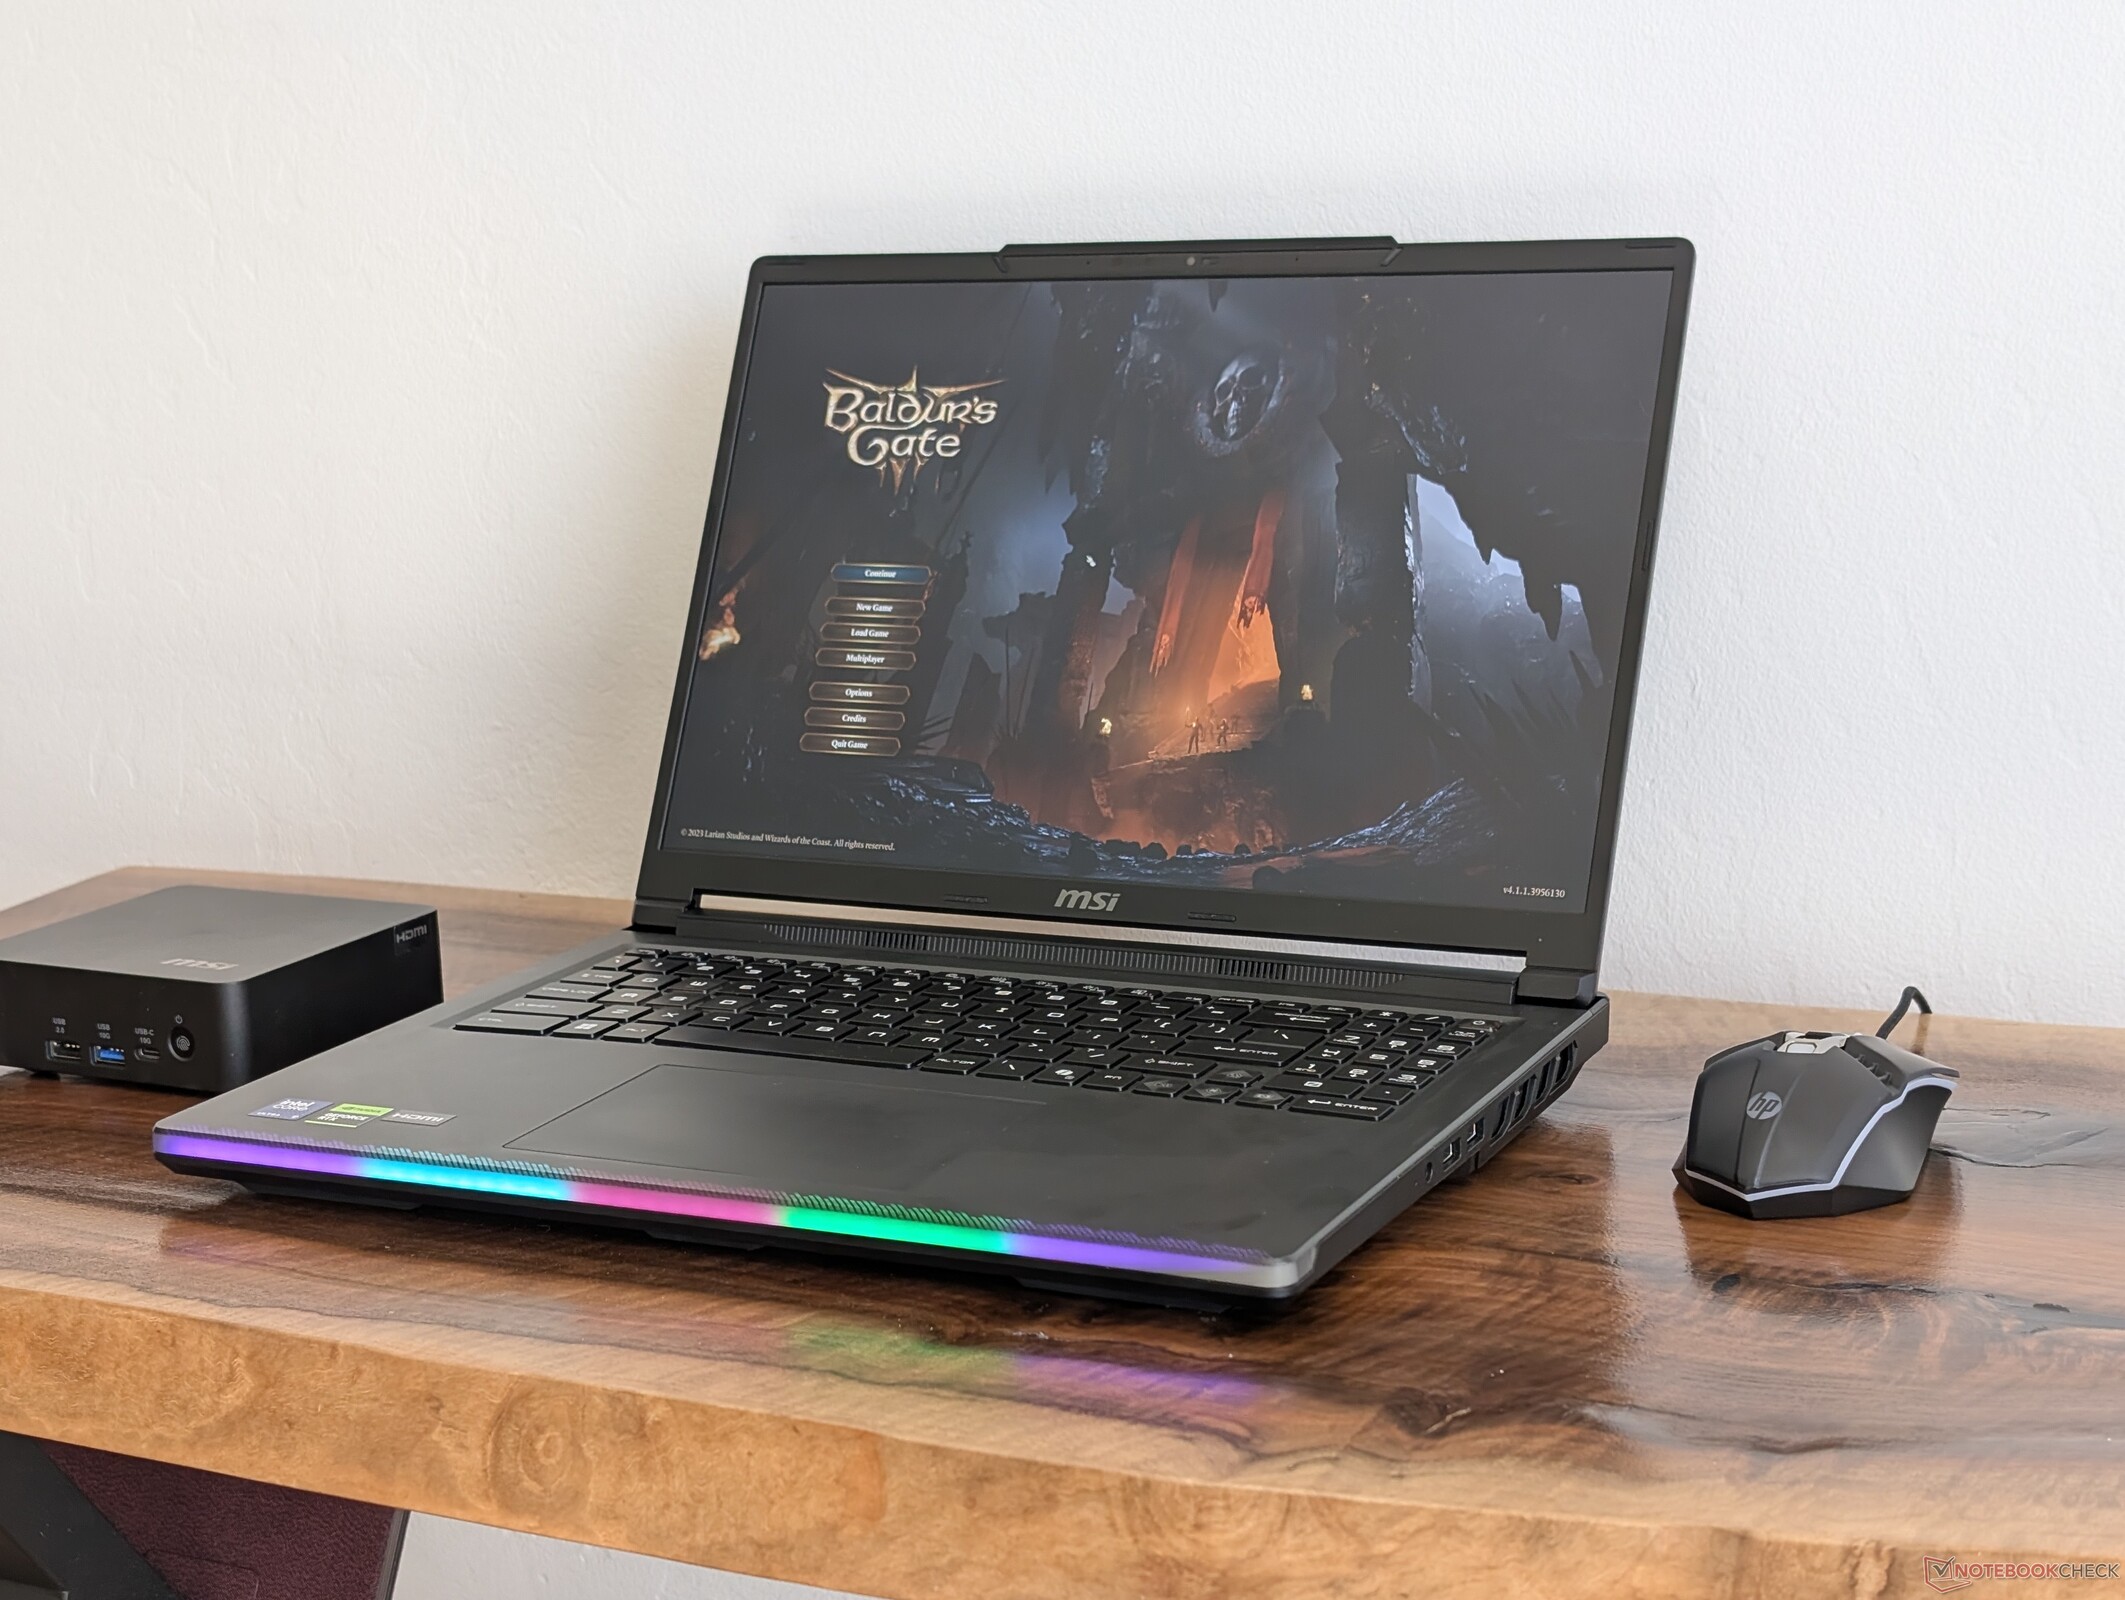
The MSI Raider 16 Max HX was unveiled at CES 2026 as the first 16-inch laptop in the Raider series. It also happens to be one of the first MSI gaming laptops with an OLED display instead of the usual IPS or Mini-LED. Much like with the Raider 18 series, the Raider 16 Max HX represents one of the fastest laptops that MSI has to offer.
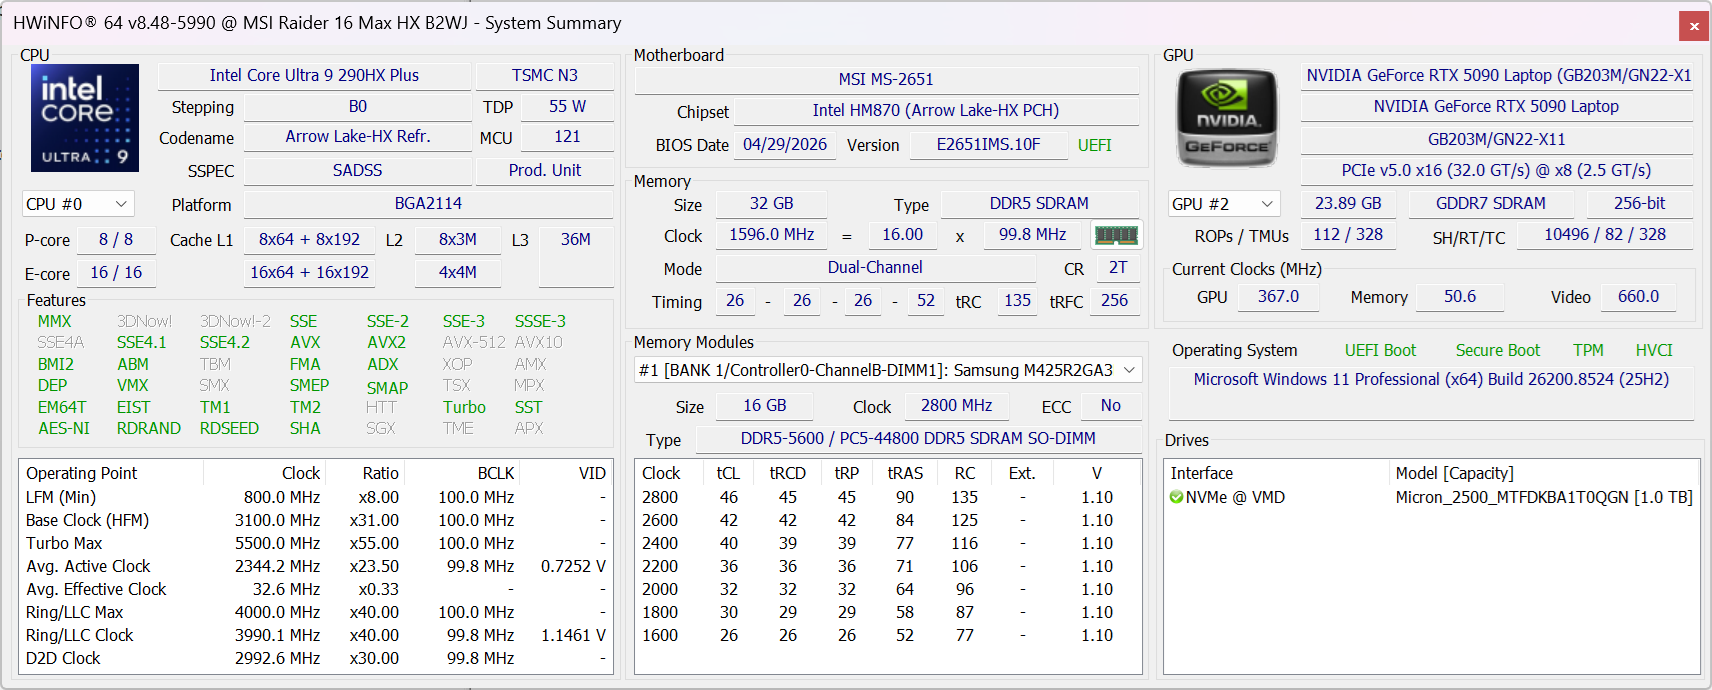
Our test unit is the highest-end configuration with the Arrow Lake Core Ultra 9 290HX Plus CPU and 175 W GeForce RTX 5090 GPU for approximately $4400 USD. All SKUs at the moment ship with the same CPU and QHD+ 240 Hz OLED glossy display but may start with the GeForce RTX 5070 Ti instead.
Competitors include other high-end or flagship 16-inch gaming laptops like the Dell Alienware 16 Area-51, Asus Zephyrus Duo, or Razer Blade 16.
More MSI reviews:
Specifications
Case
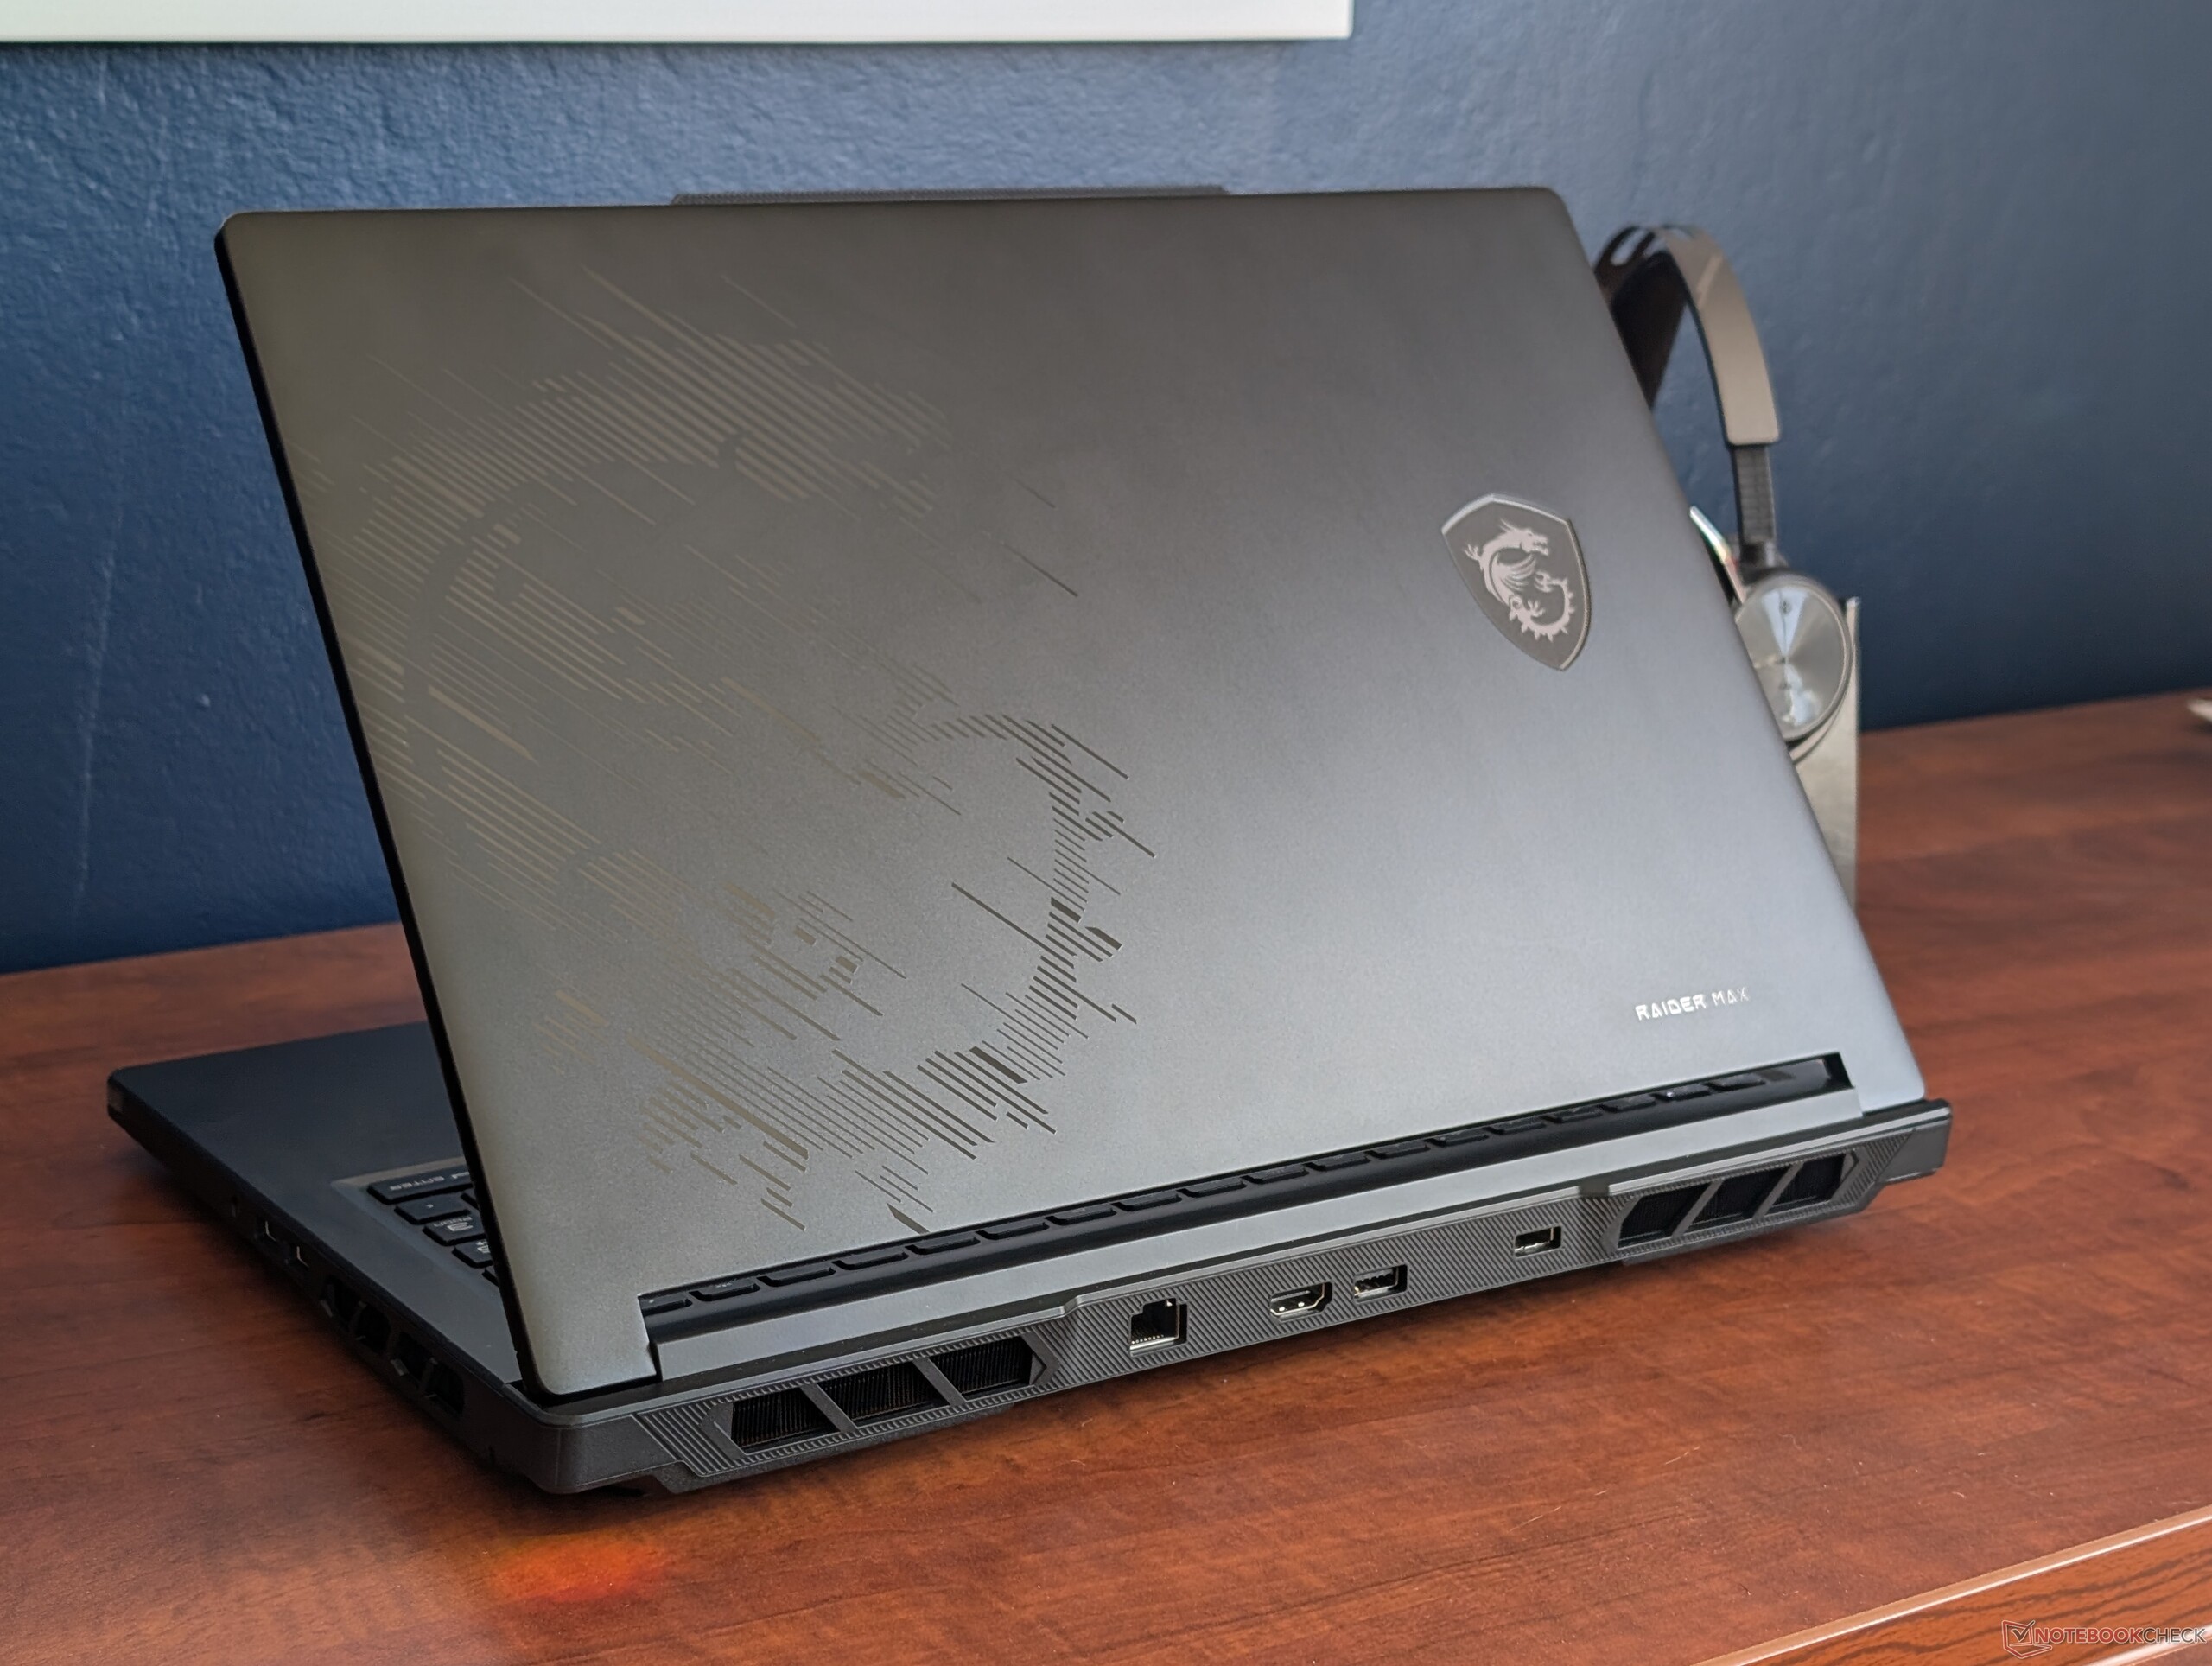
The outer lid is smooth matte metal while the base is largely plastic. While not terrible by any means, surfaces flex and don't feel as rigid as competing models like the Alienware 16 Area-51 or Razer Blade 16. We expected a stronger or more premium chassis design considering the high asking price.
Connectivity
Port options are identical to the Raider 18 HX albeit rearranged.


SD Card Reader
| SD Card Reader | |
| average JPG Copy Test (av. of 3 runs) | |
| MSI Raider 16 Max HX B2WJ (Toshiba Exceria Pro SDXC 64 GB UHS-II) | |
| Razer Blade 16 Core Ultra 9 386H (Toshiba Exceria Pro SDXC 64 GB UHS-II) | |
| Lenovo Legion 7 16IAX10 (Toshiba Exceria Pro SDXC 64 GB UHS-II) | |
| maximum AS SSD Seq Read Test (1GB) | |
| Lenovo Legion 7 16IAX10 (Toshiba Exceria Pro SDXC 64 GB UHS-II) | |
| Razer Blade 16 Core Ultra 9 386H (Toshiba Exceria Pro SDXC 64 GB UHS-II) | |
| MSI Raider 16 Max HX B2WJ (Toshiba Exceria Pro SDXC 64 GB UHS-II) | |
Communication
Webcam
2 MP webcam with IR and physical shutter all come standard.


Maintenance
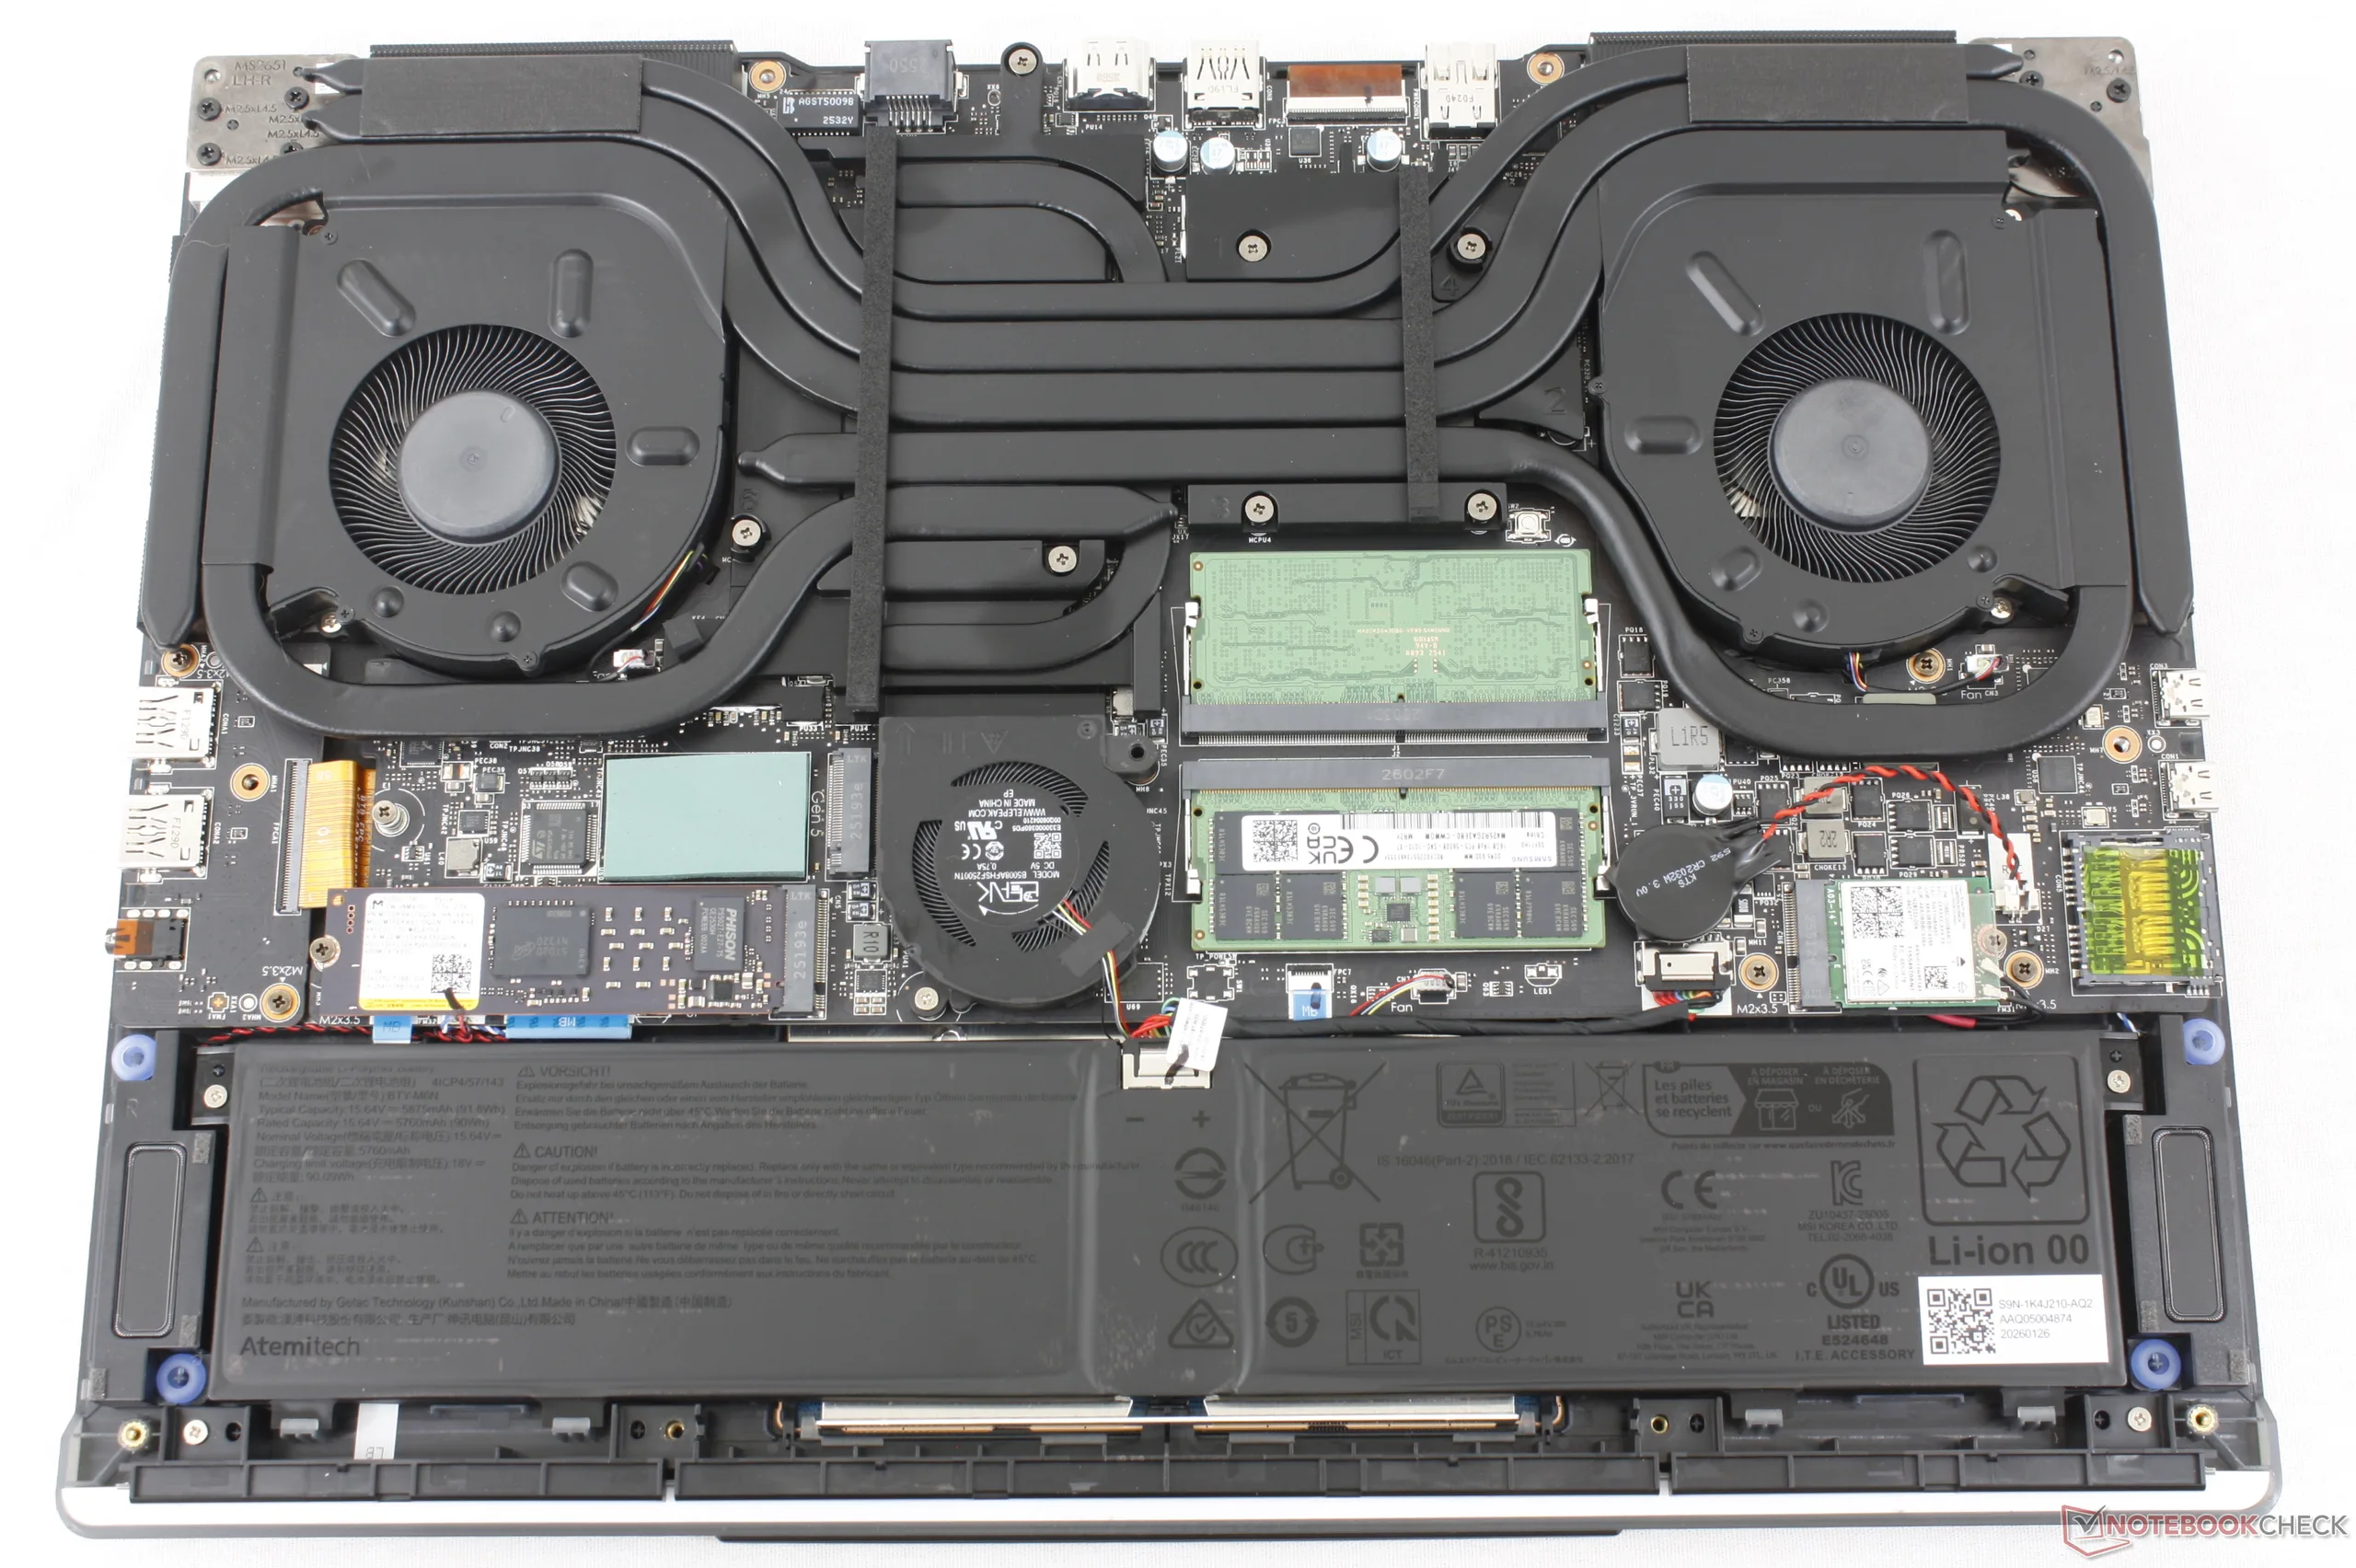
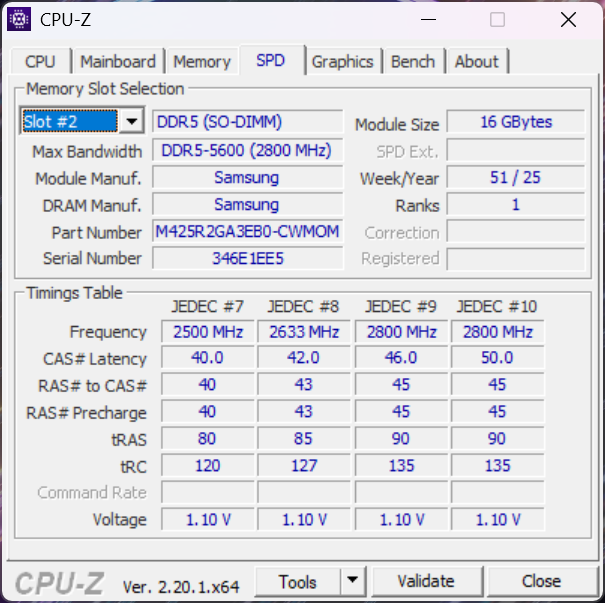
The bottom panel includes a subpanel for easier access to the two M.2 2280 SSD slots (one PCIe5 plus one PCIe4) and two DDR5 SODIMM slots. Otherwise, the entire bottom panel is still relatively easy to remove with a standard Phillips screwdriver.
Sustainability
MSI makes no mention of recycled materials used during manufacturing of the Raider 16 Max HX. The packaging is plastic-free.
Accessories And Warranty
There are no extras in the box other than the AC adapter and paperwork. The usual one-year limited manufacturer warranty applies if purchased in the US.
Input Devices
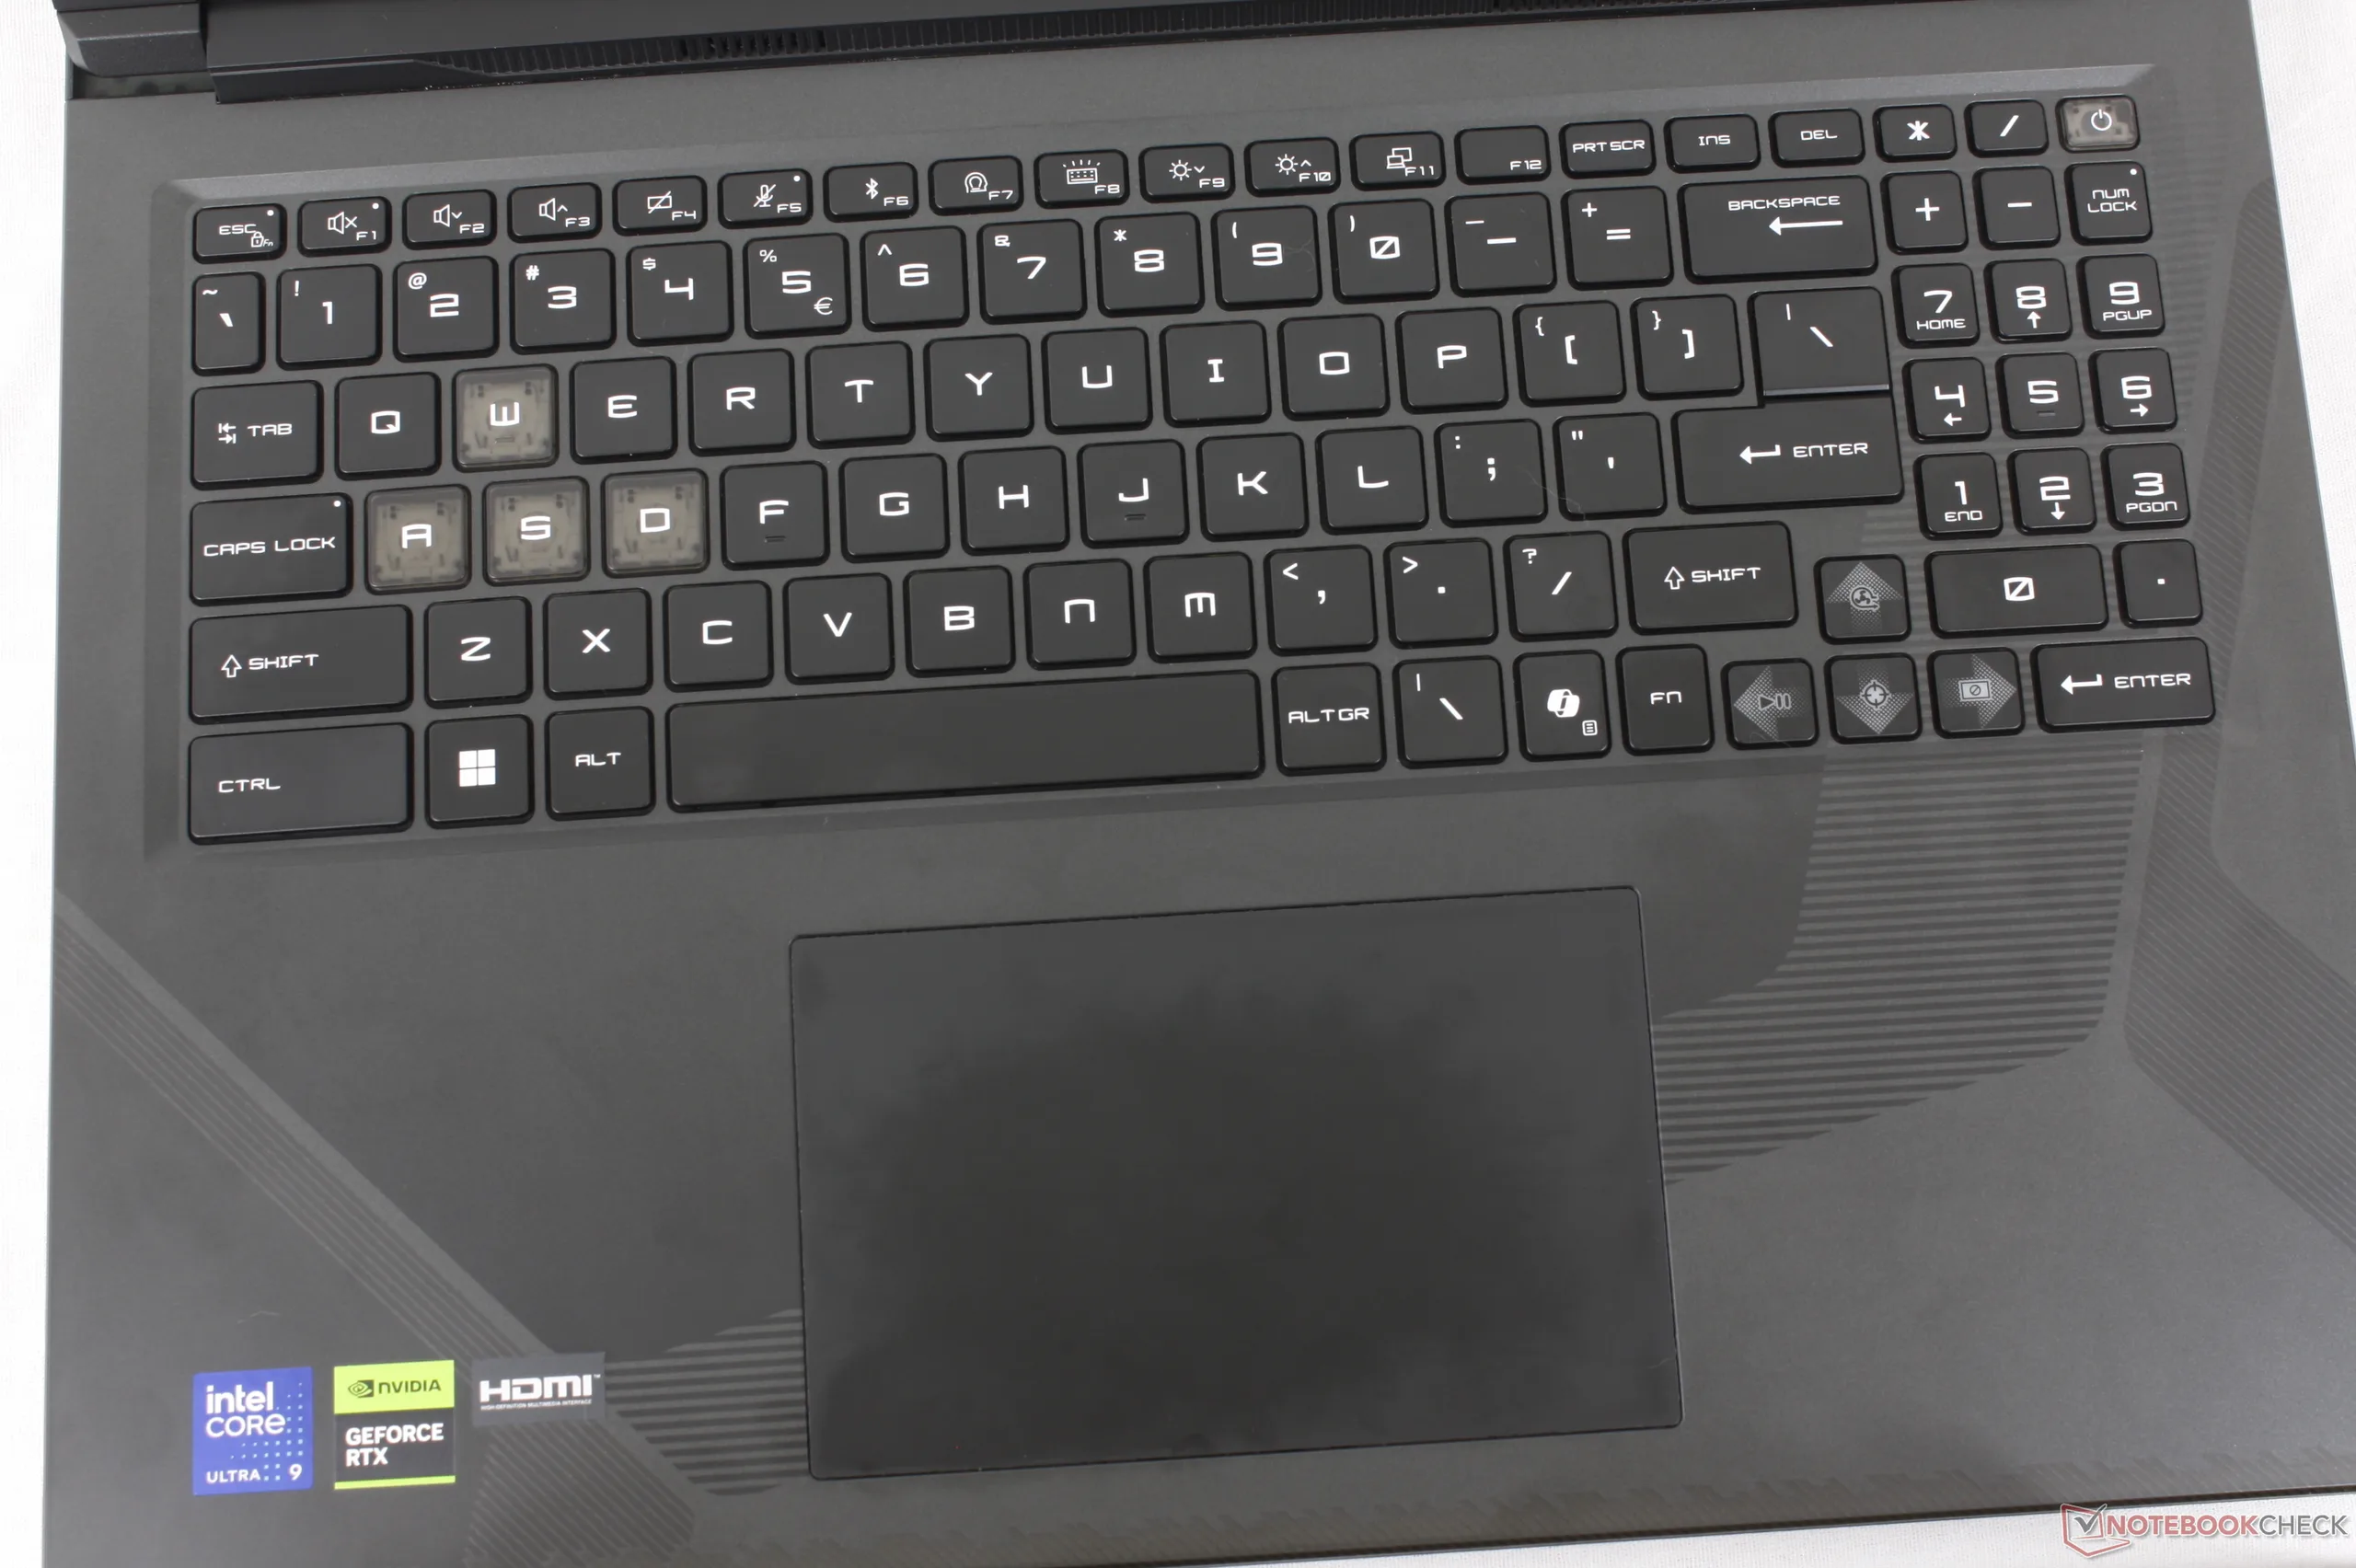
The keyboard and clickpad on the Raider 16 Max HX are identical to what is available on the Crosshair 16 HX even though the latter is a lower-end gaming model from MSI. On the Raider, however, the keys have per-key RGB lighting for more user customization whereas the Crosshair has more limited RGB zones.
Display

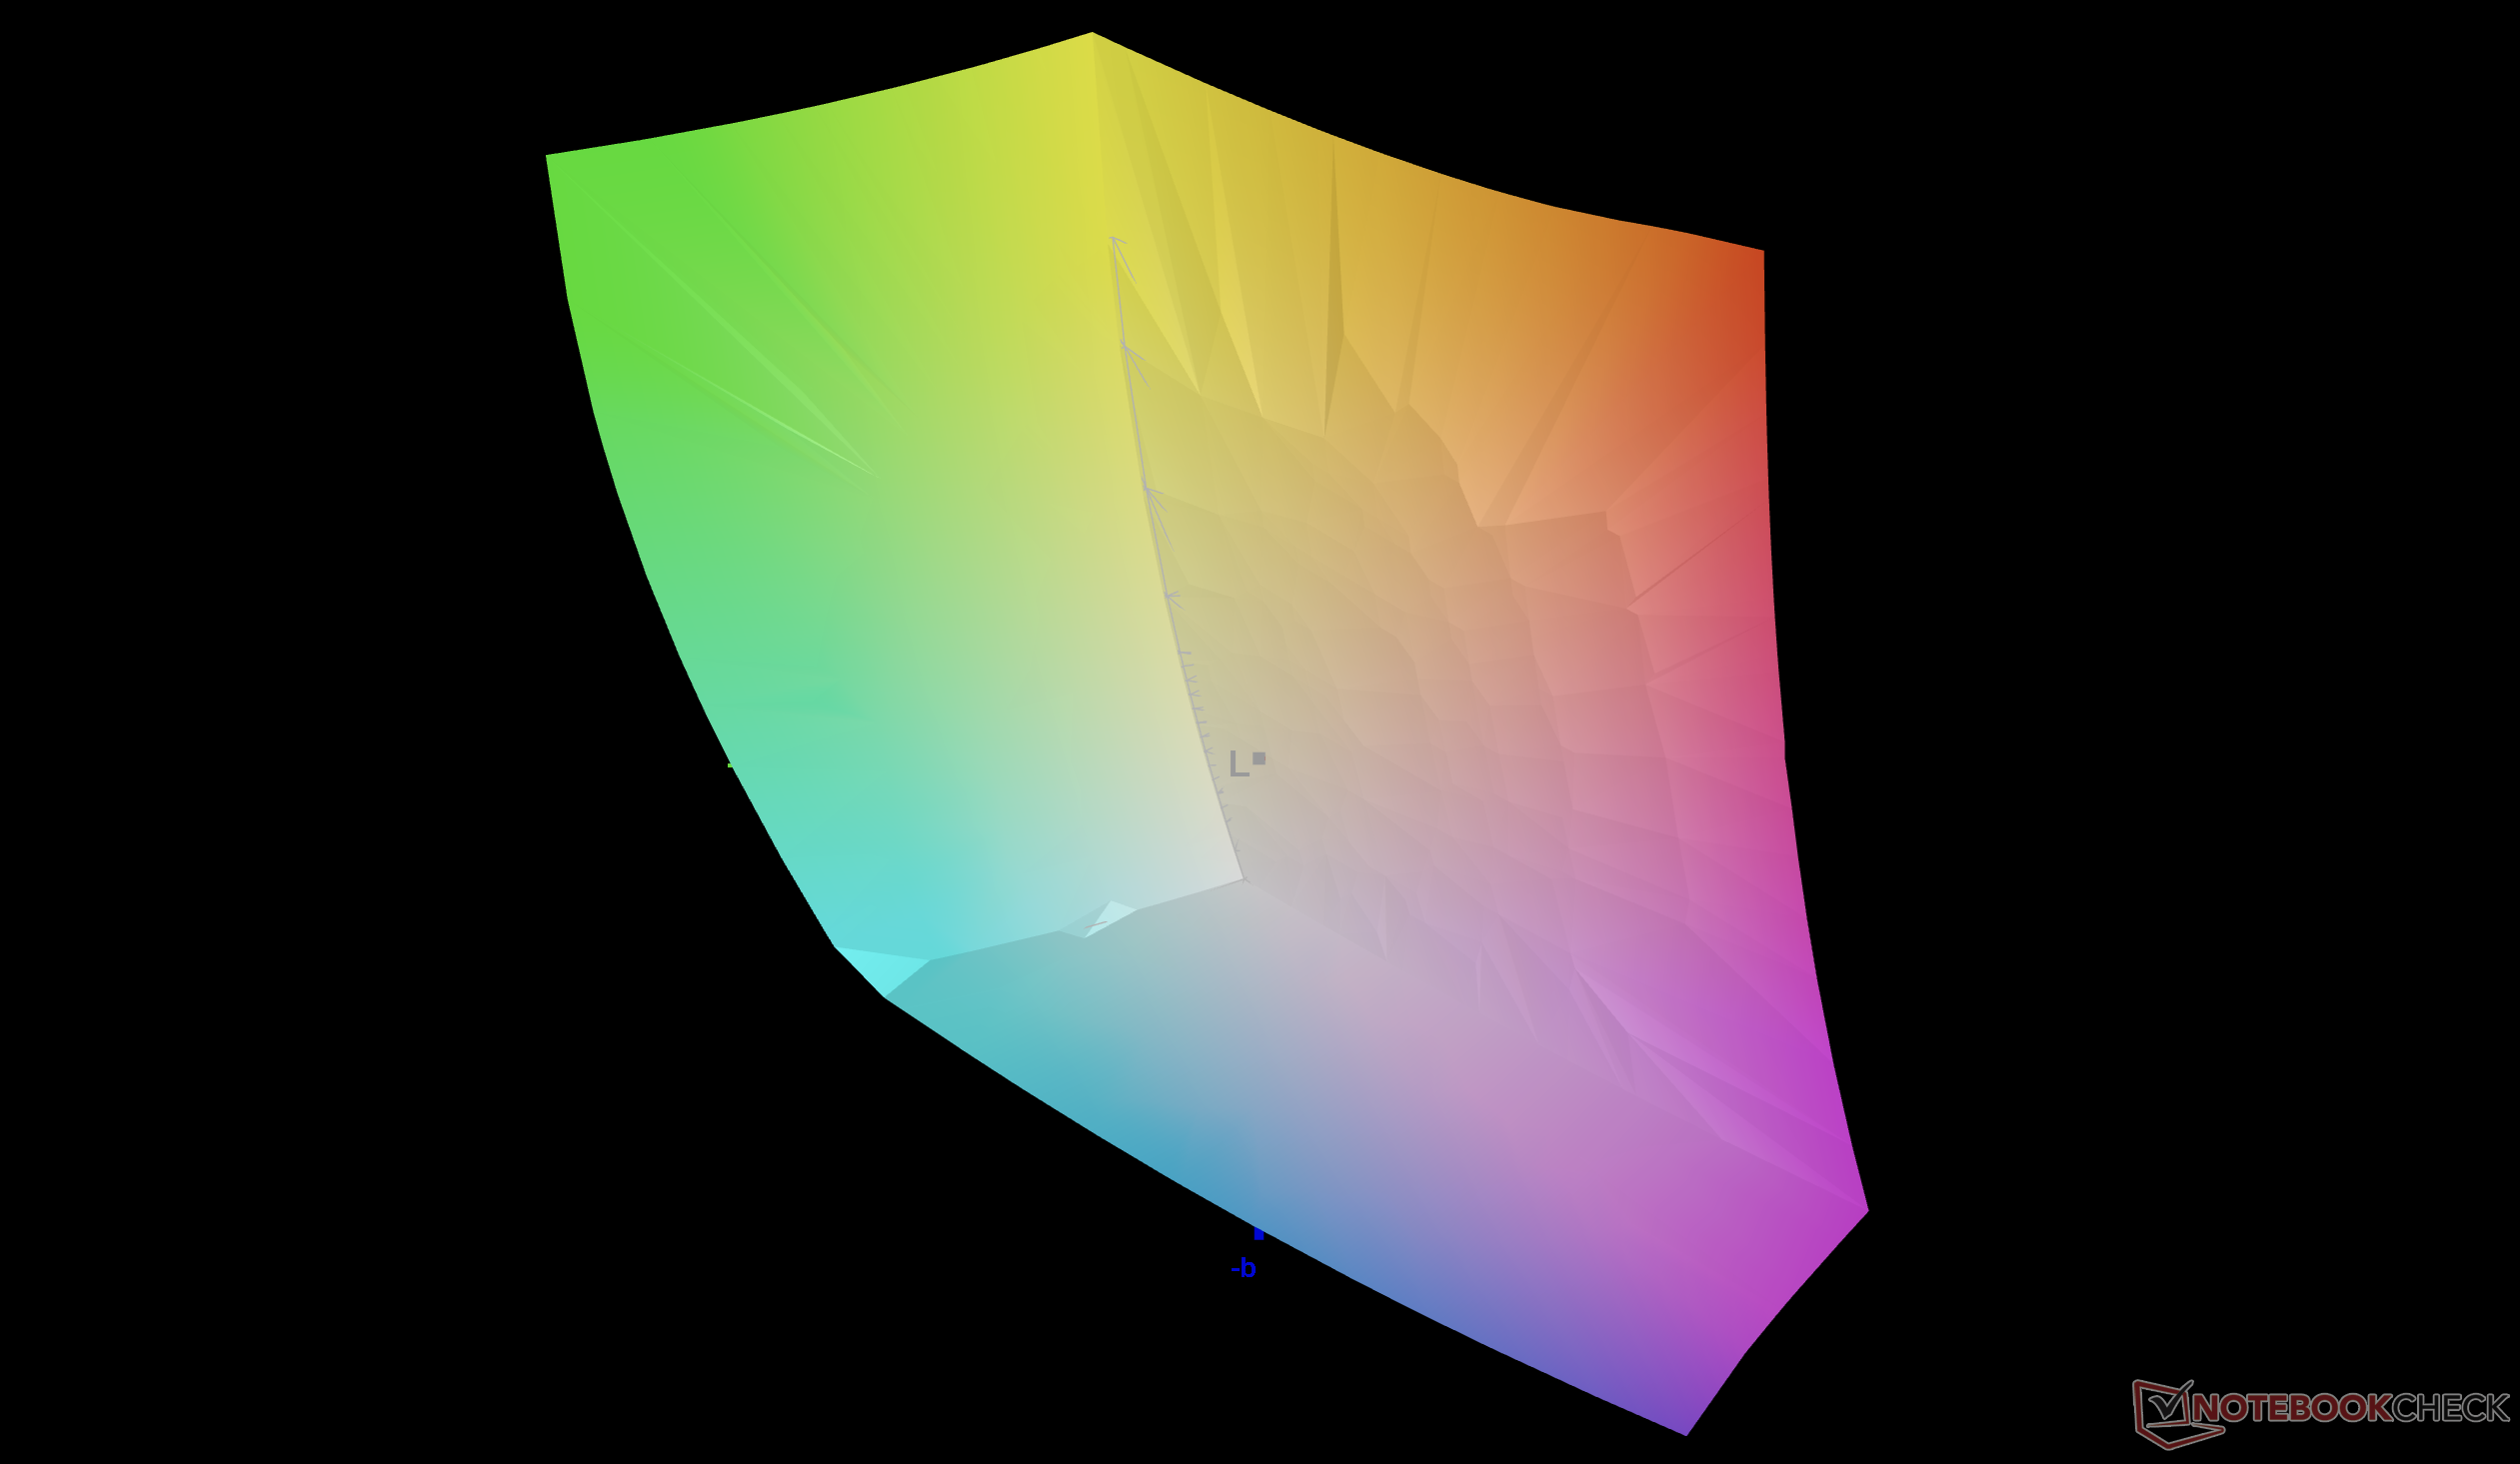
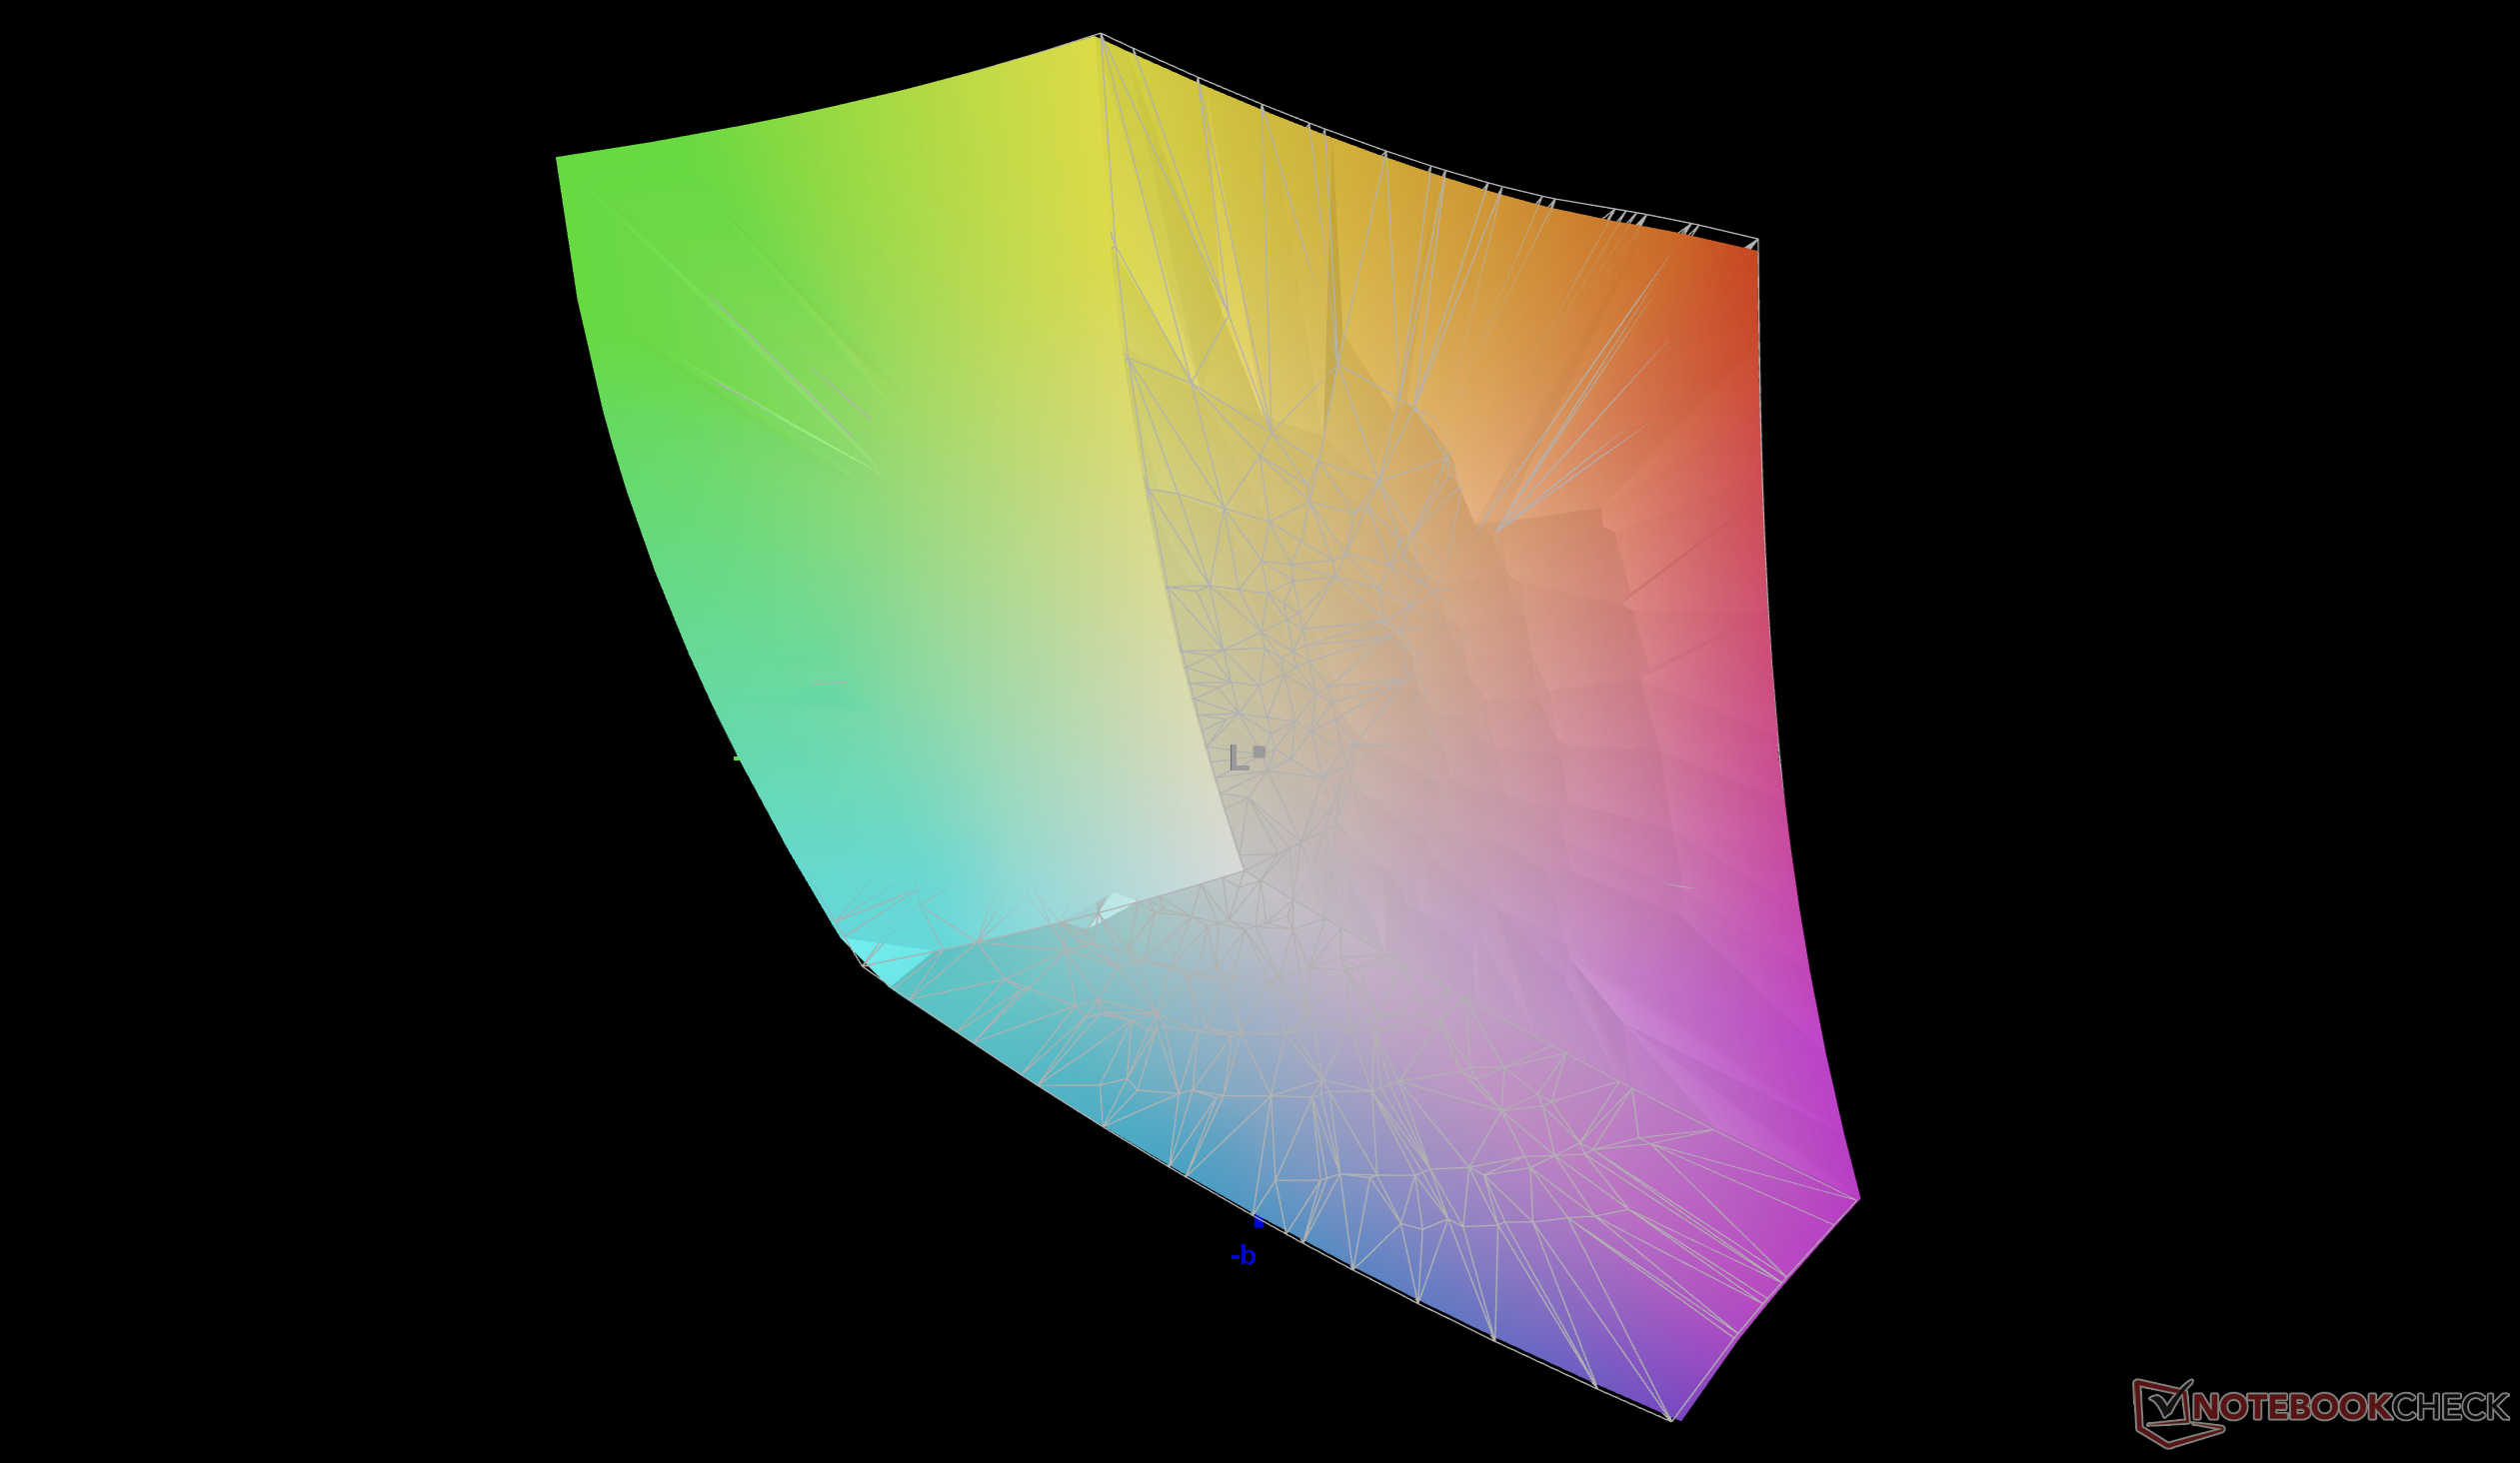
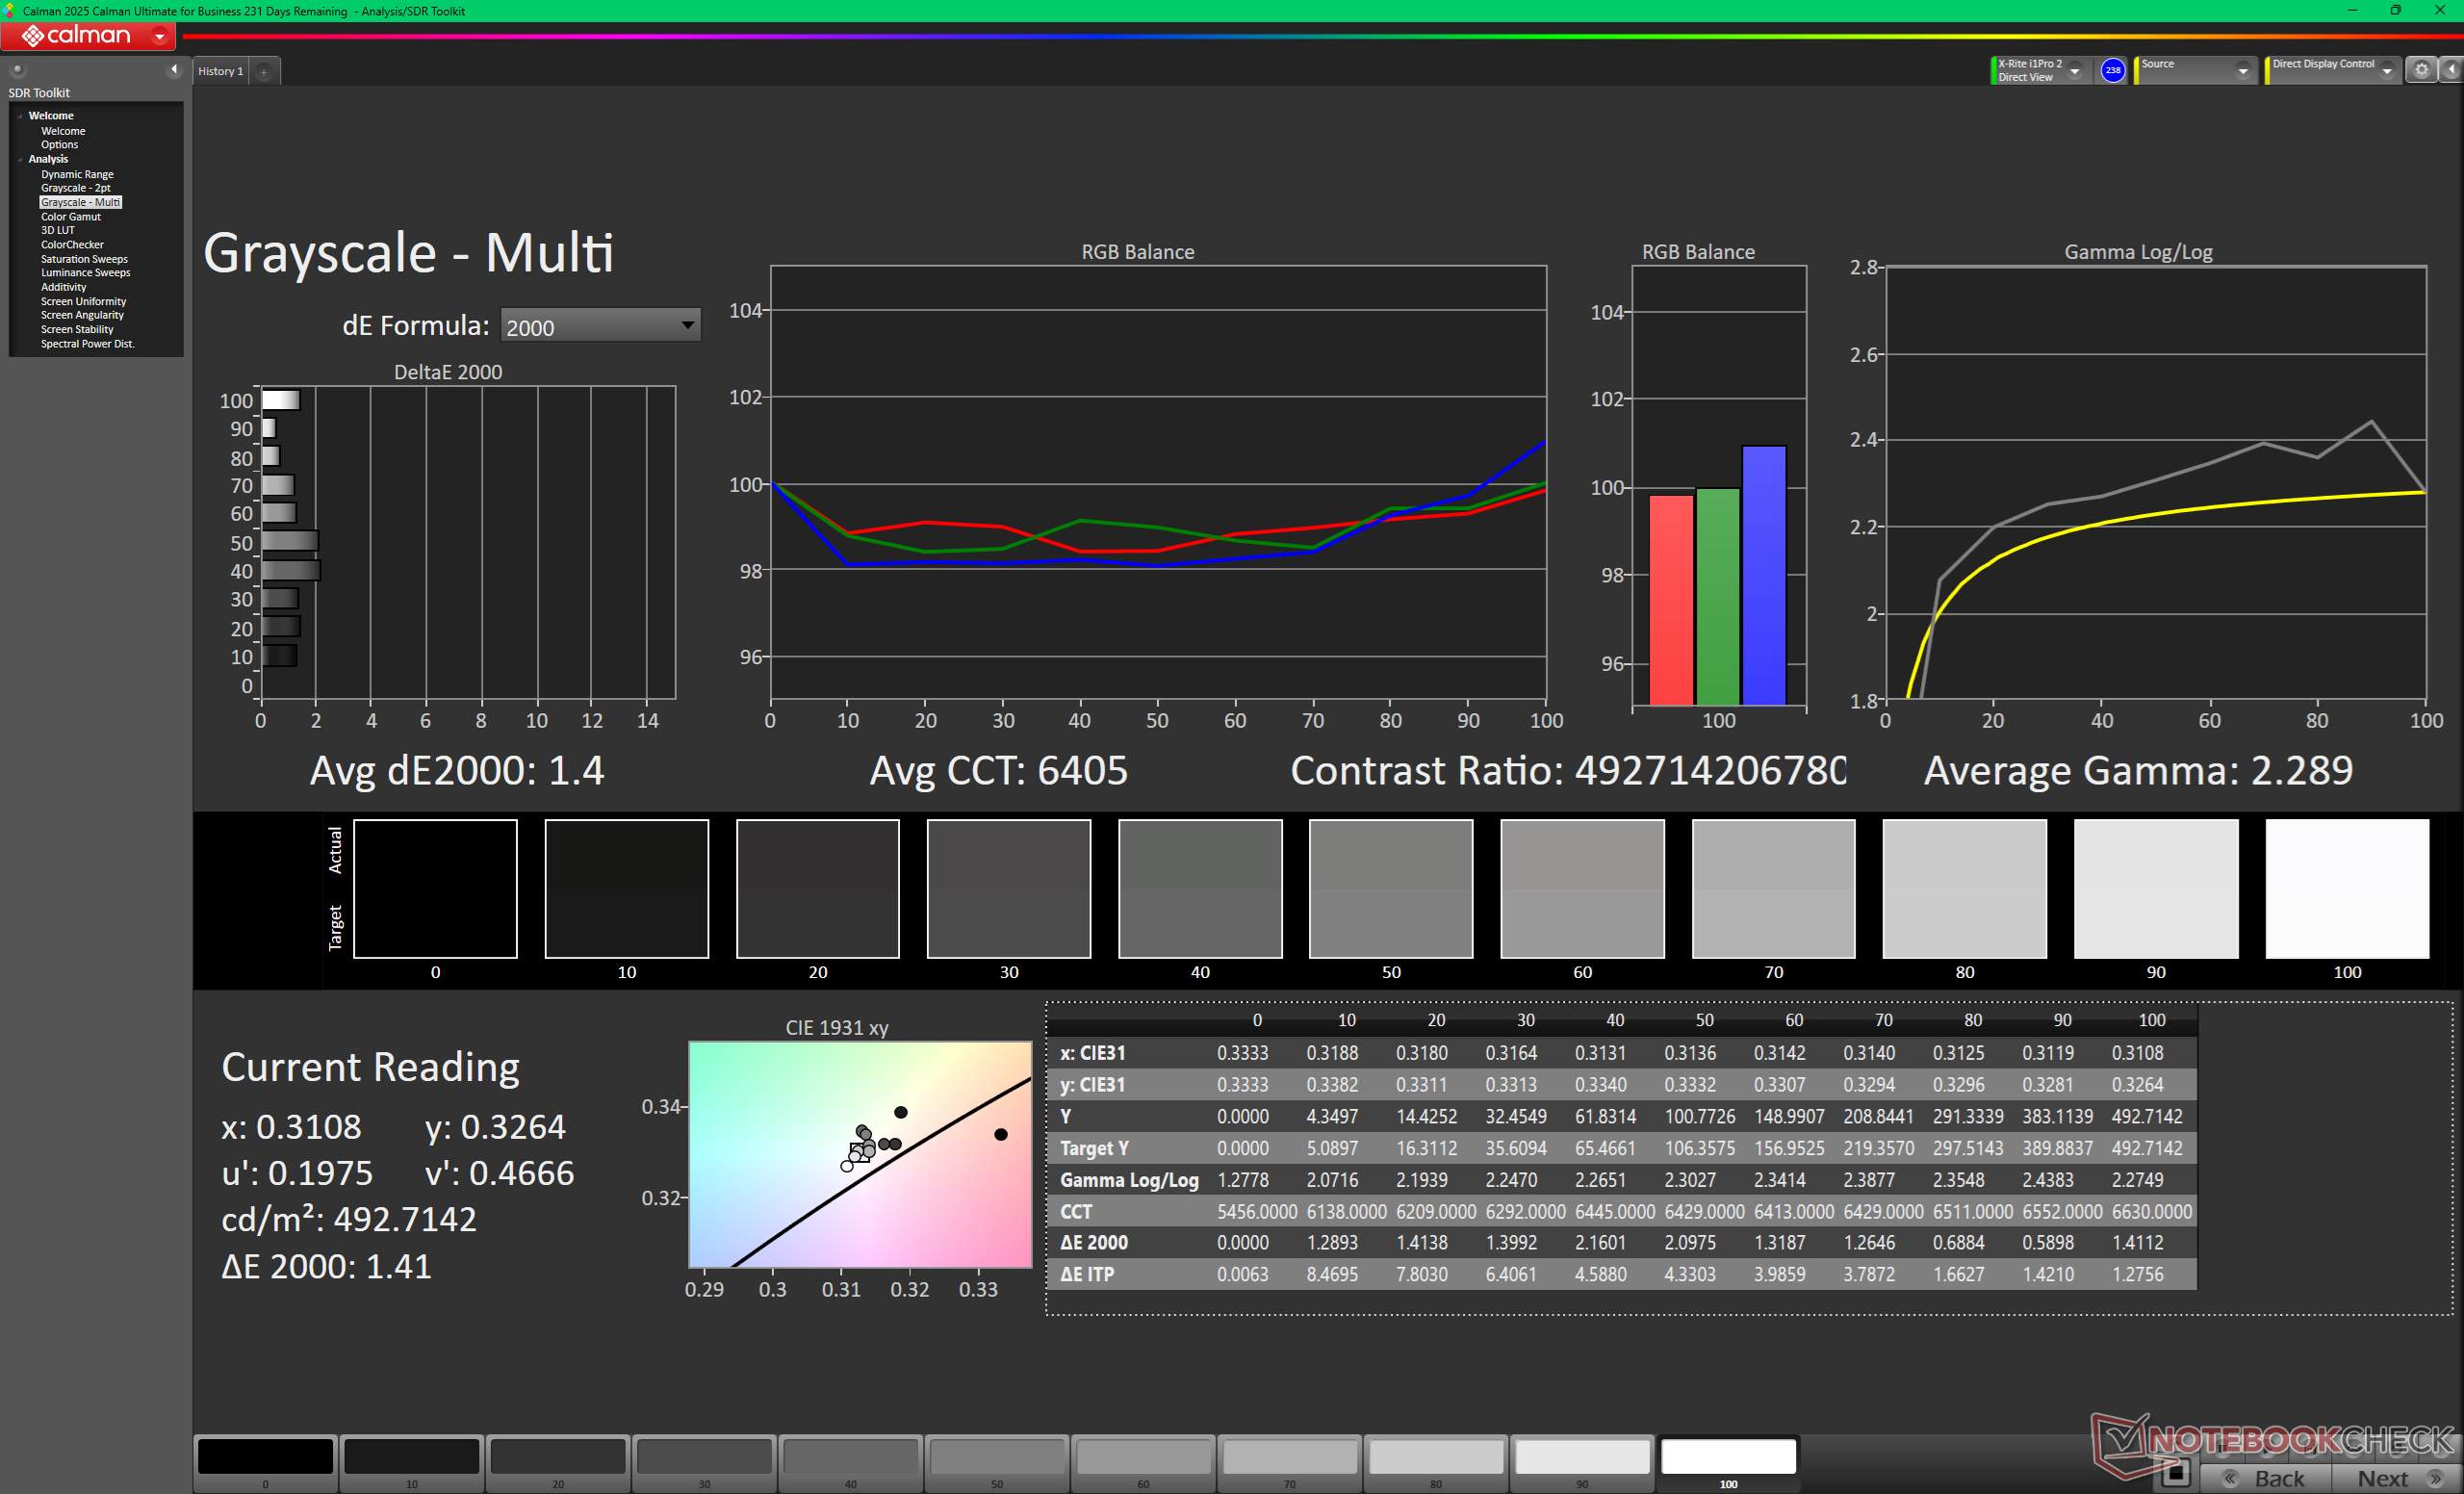
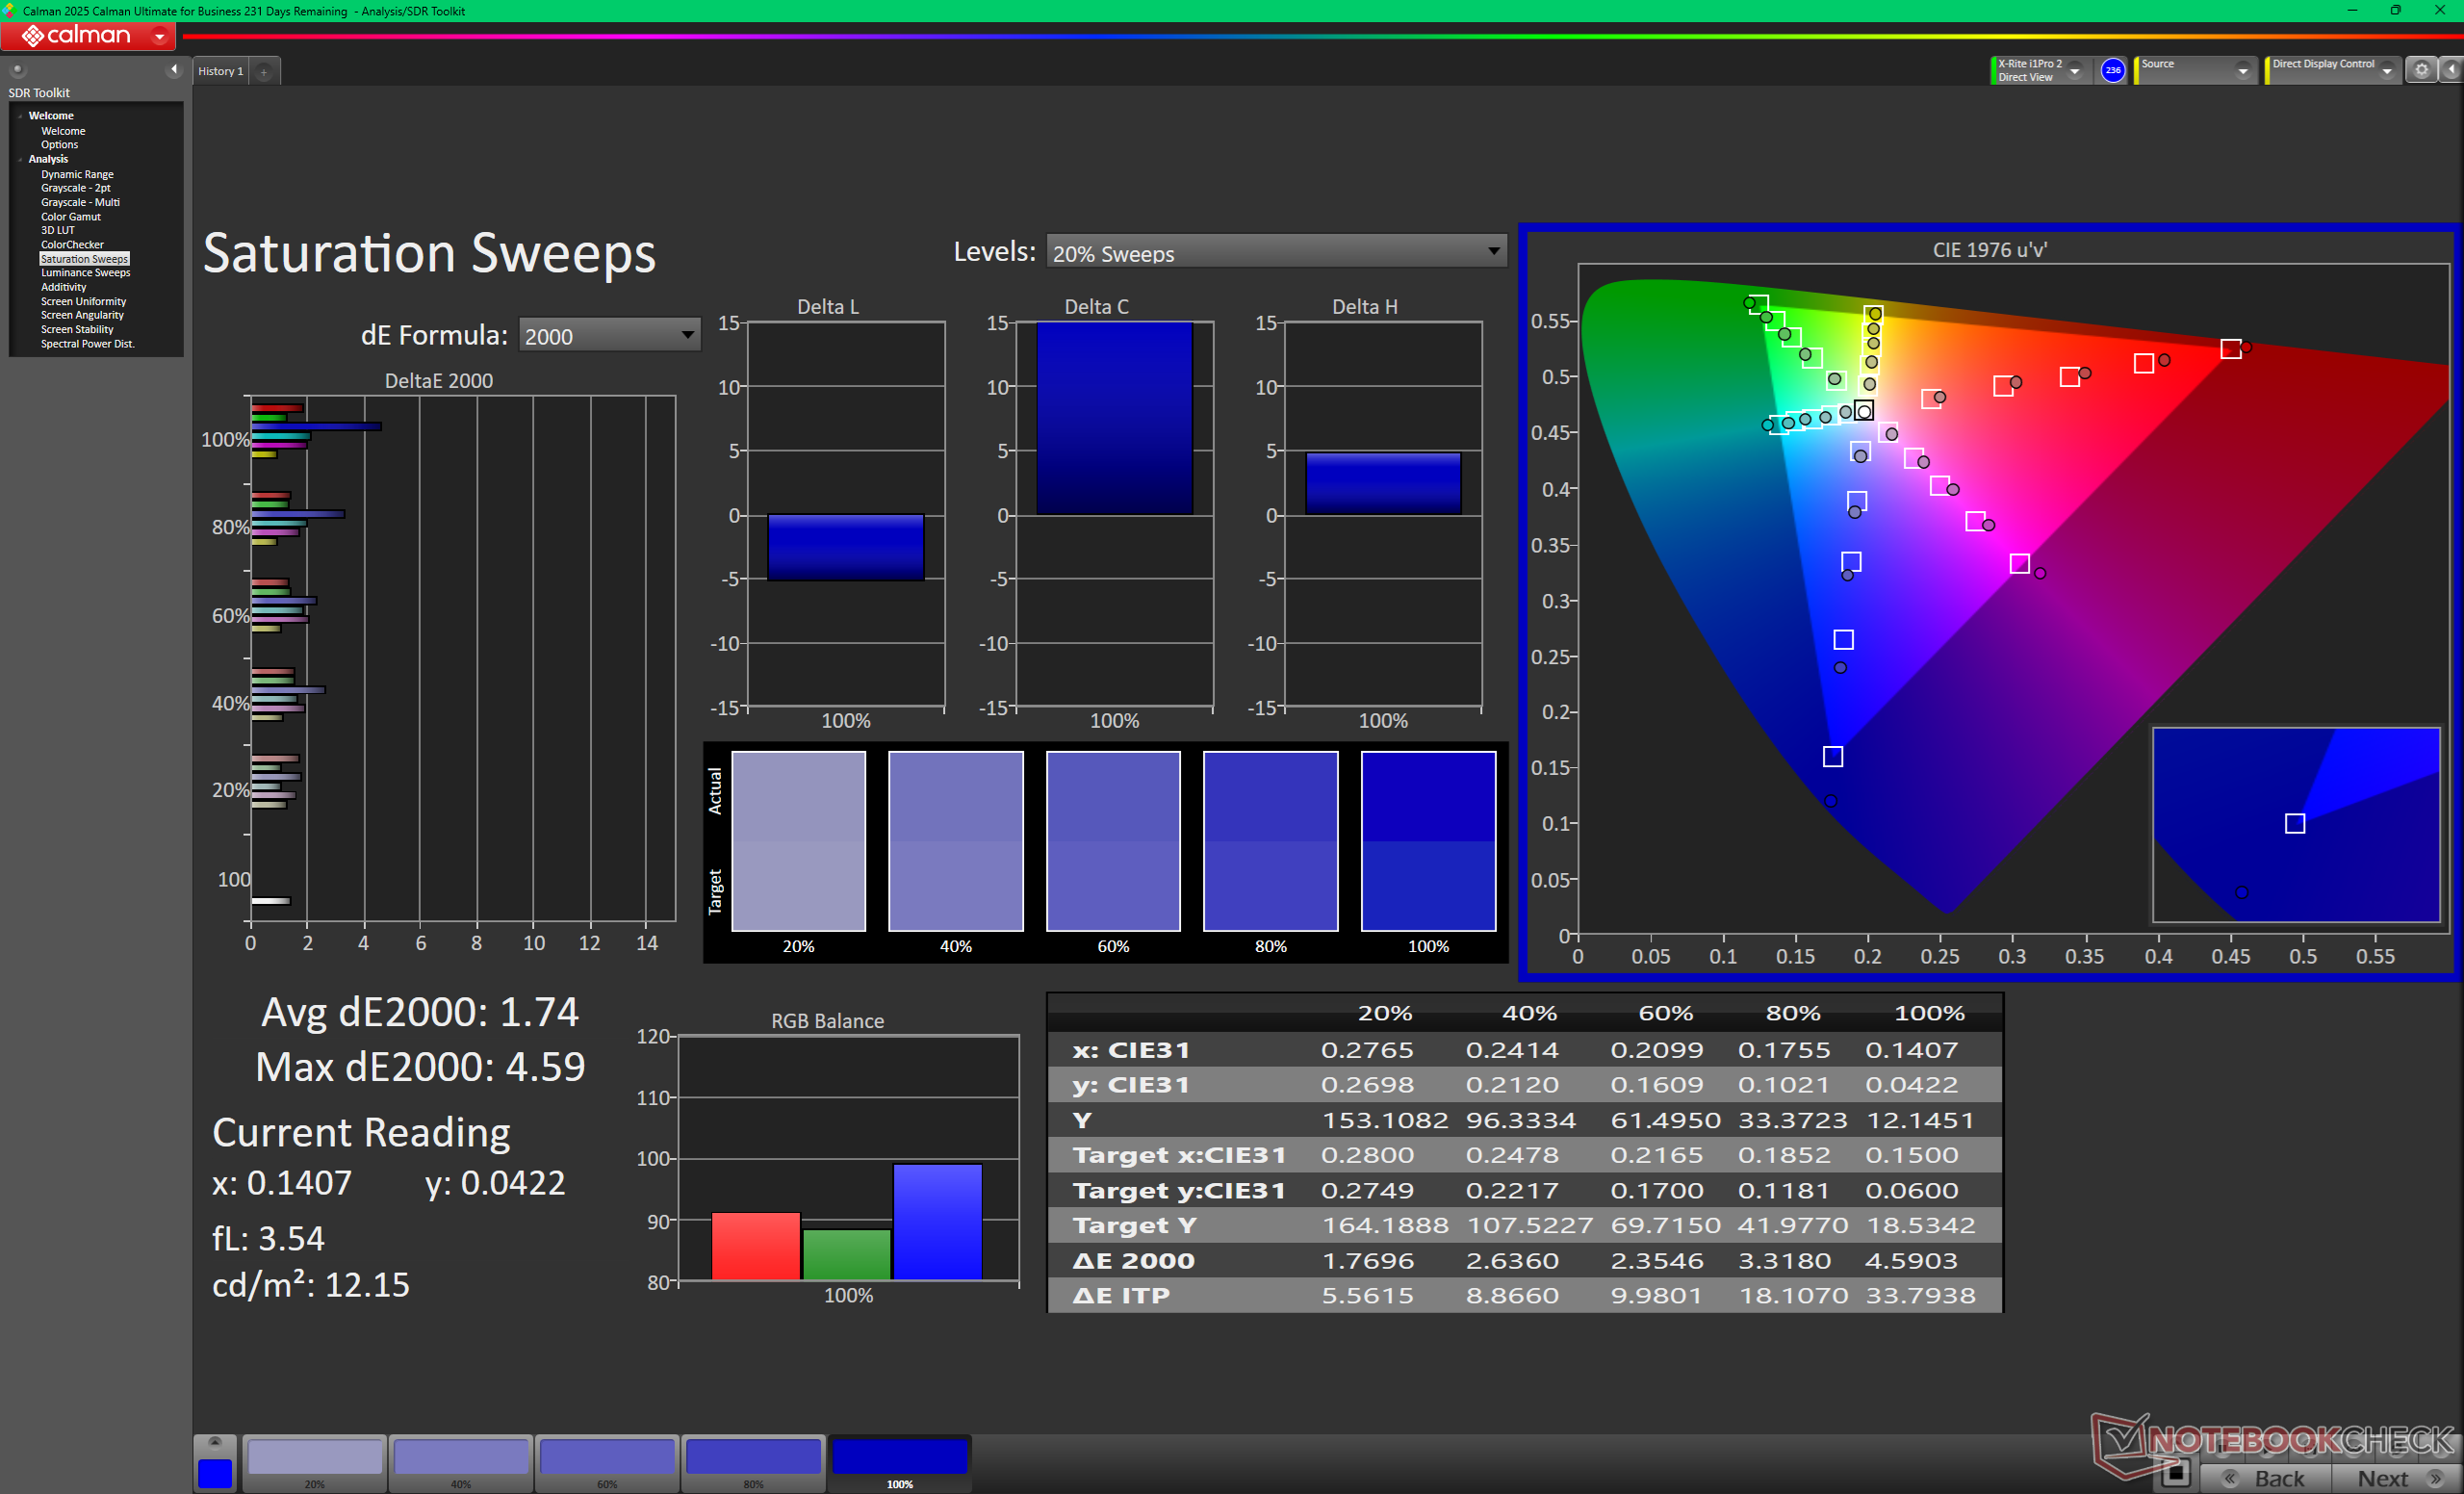
MSI is beginning to turn more towards OLED instead of IPS or Mini-LED for many of its gaming laptops. For the Raider 16 Max HX, the 240 Hz QHD+ OLED panel is crisp with perfect black levels, accurate P3 colors, DisplayHDR1000 support, and no "halo" effect commonly found on competing mini-LED options.
The two most notable drawbacks to the display are its very glossy overlay and lack of G-Sync support in contrast to most older MSI gaming laptops where matte panels were standard. Be prepared to fight glare when gaming in bright indoor conditions.
| |||||||||||||||||||||||||
Brightness Distribution: 98 %
Center on Battery: 478.6 cd/m²
Contrast: ∞:1 (Black: 0 cd/m²)
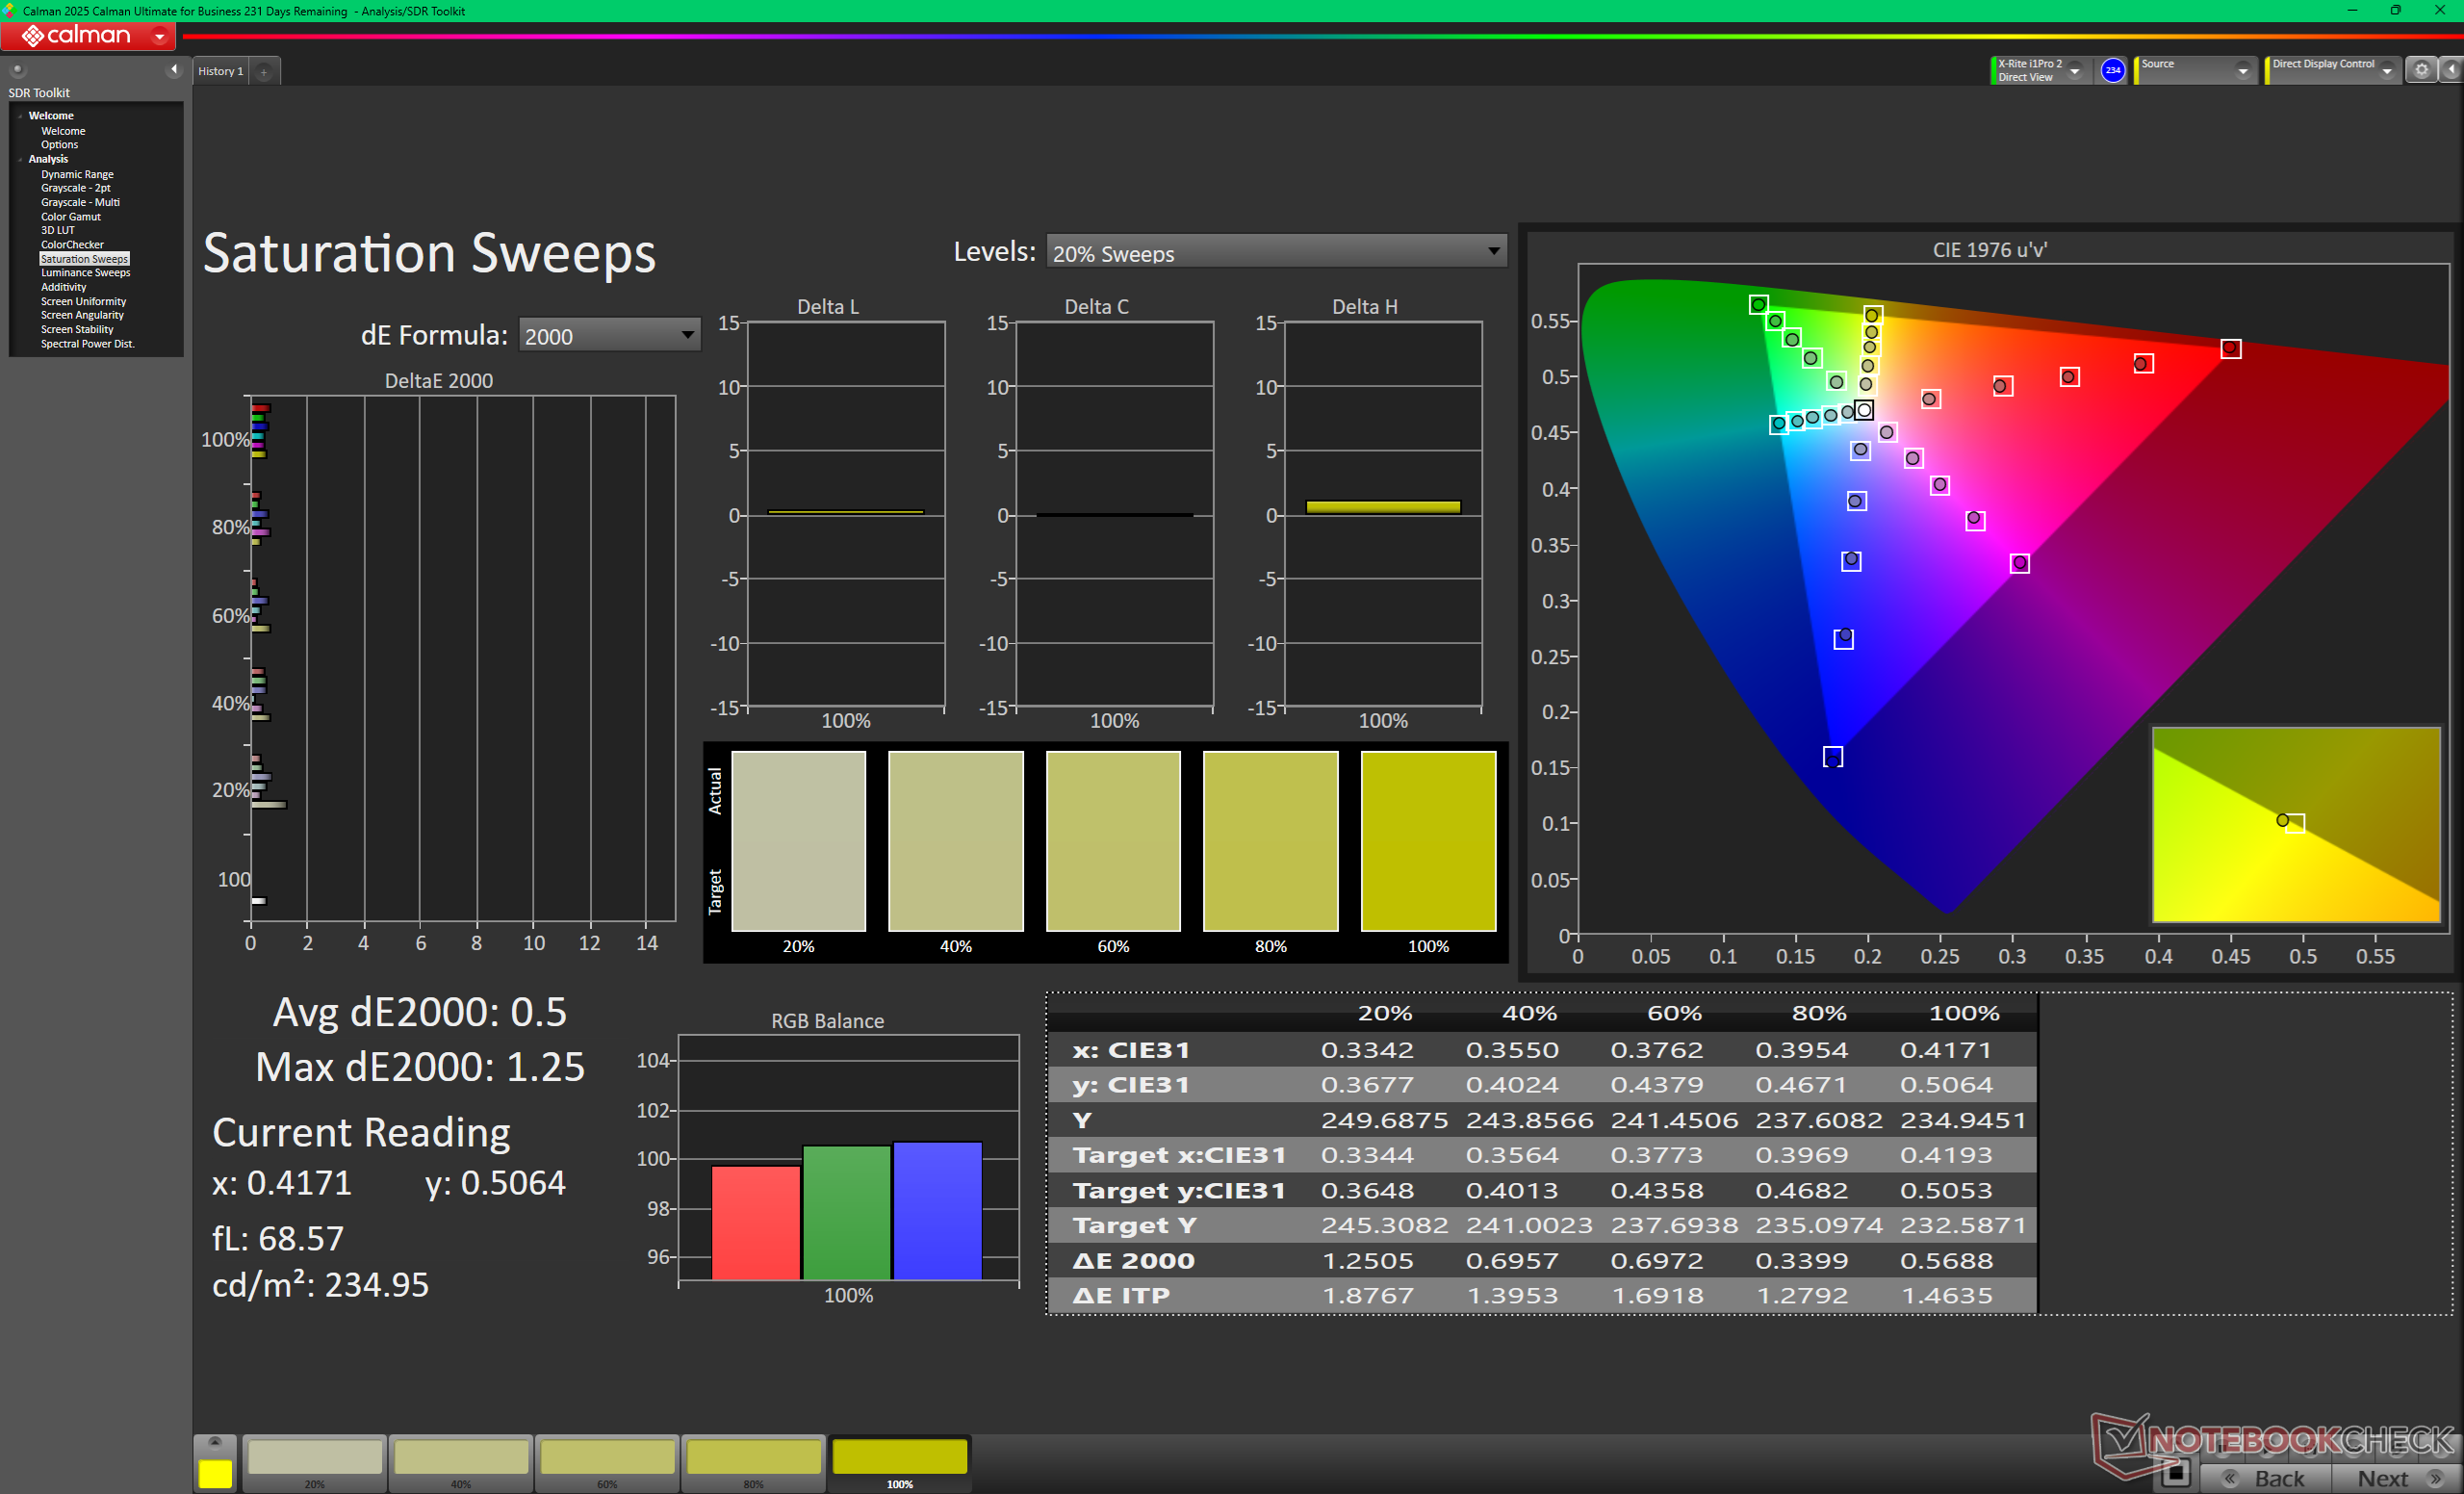
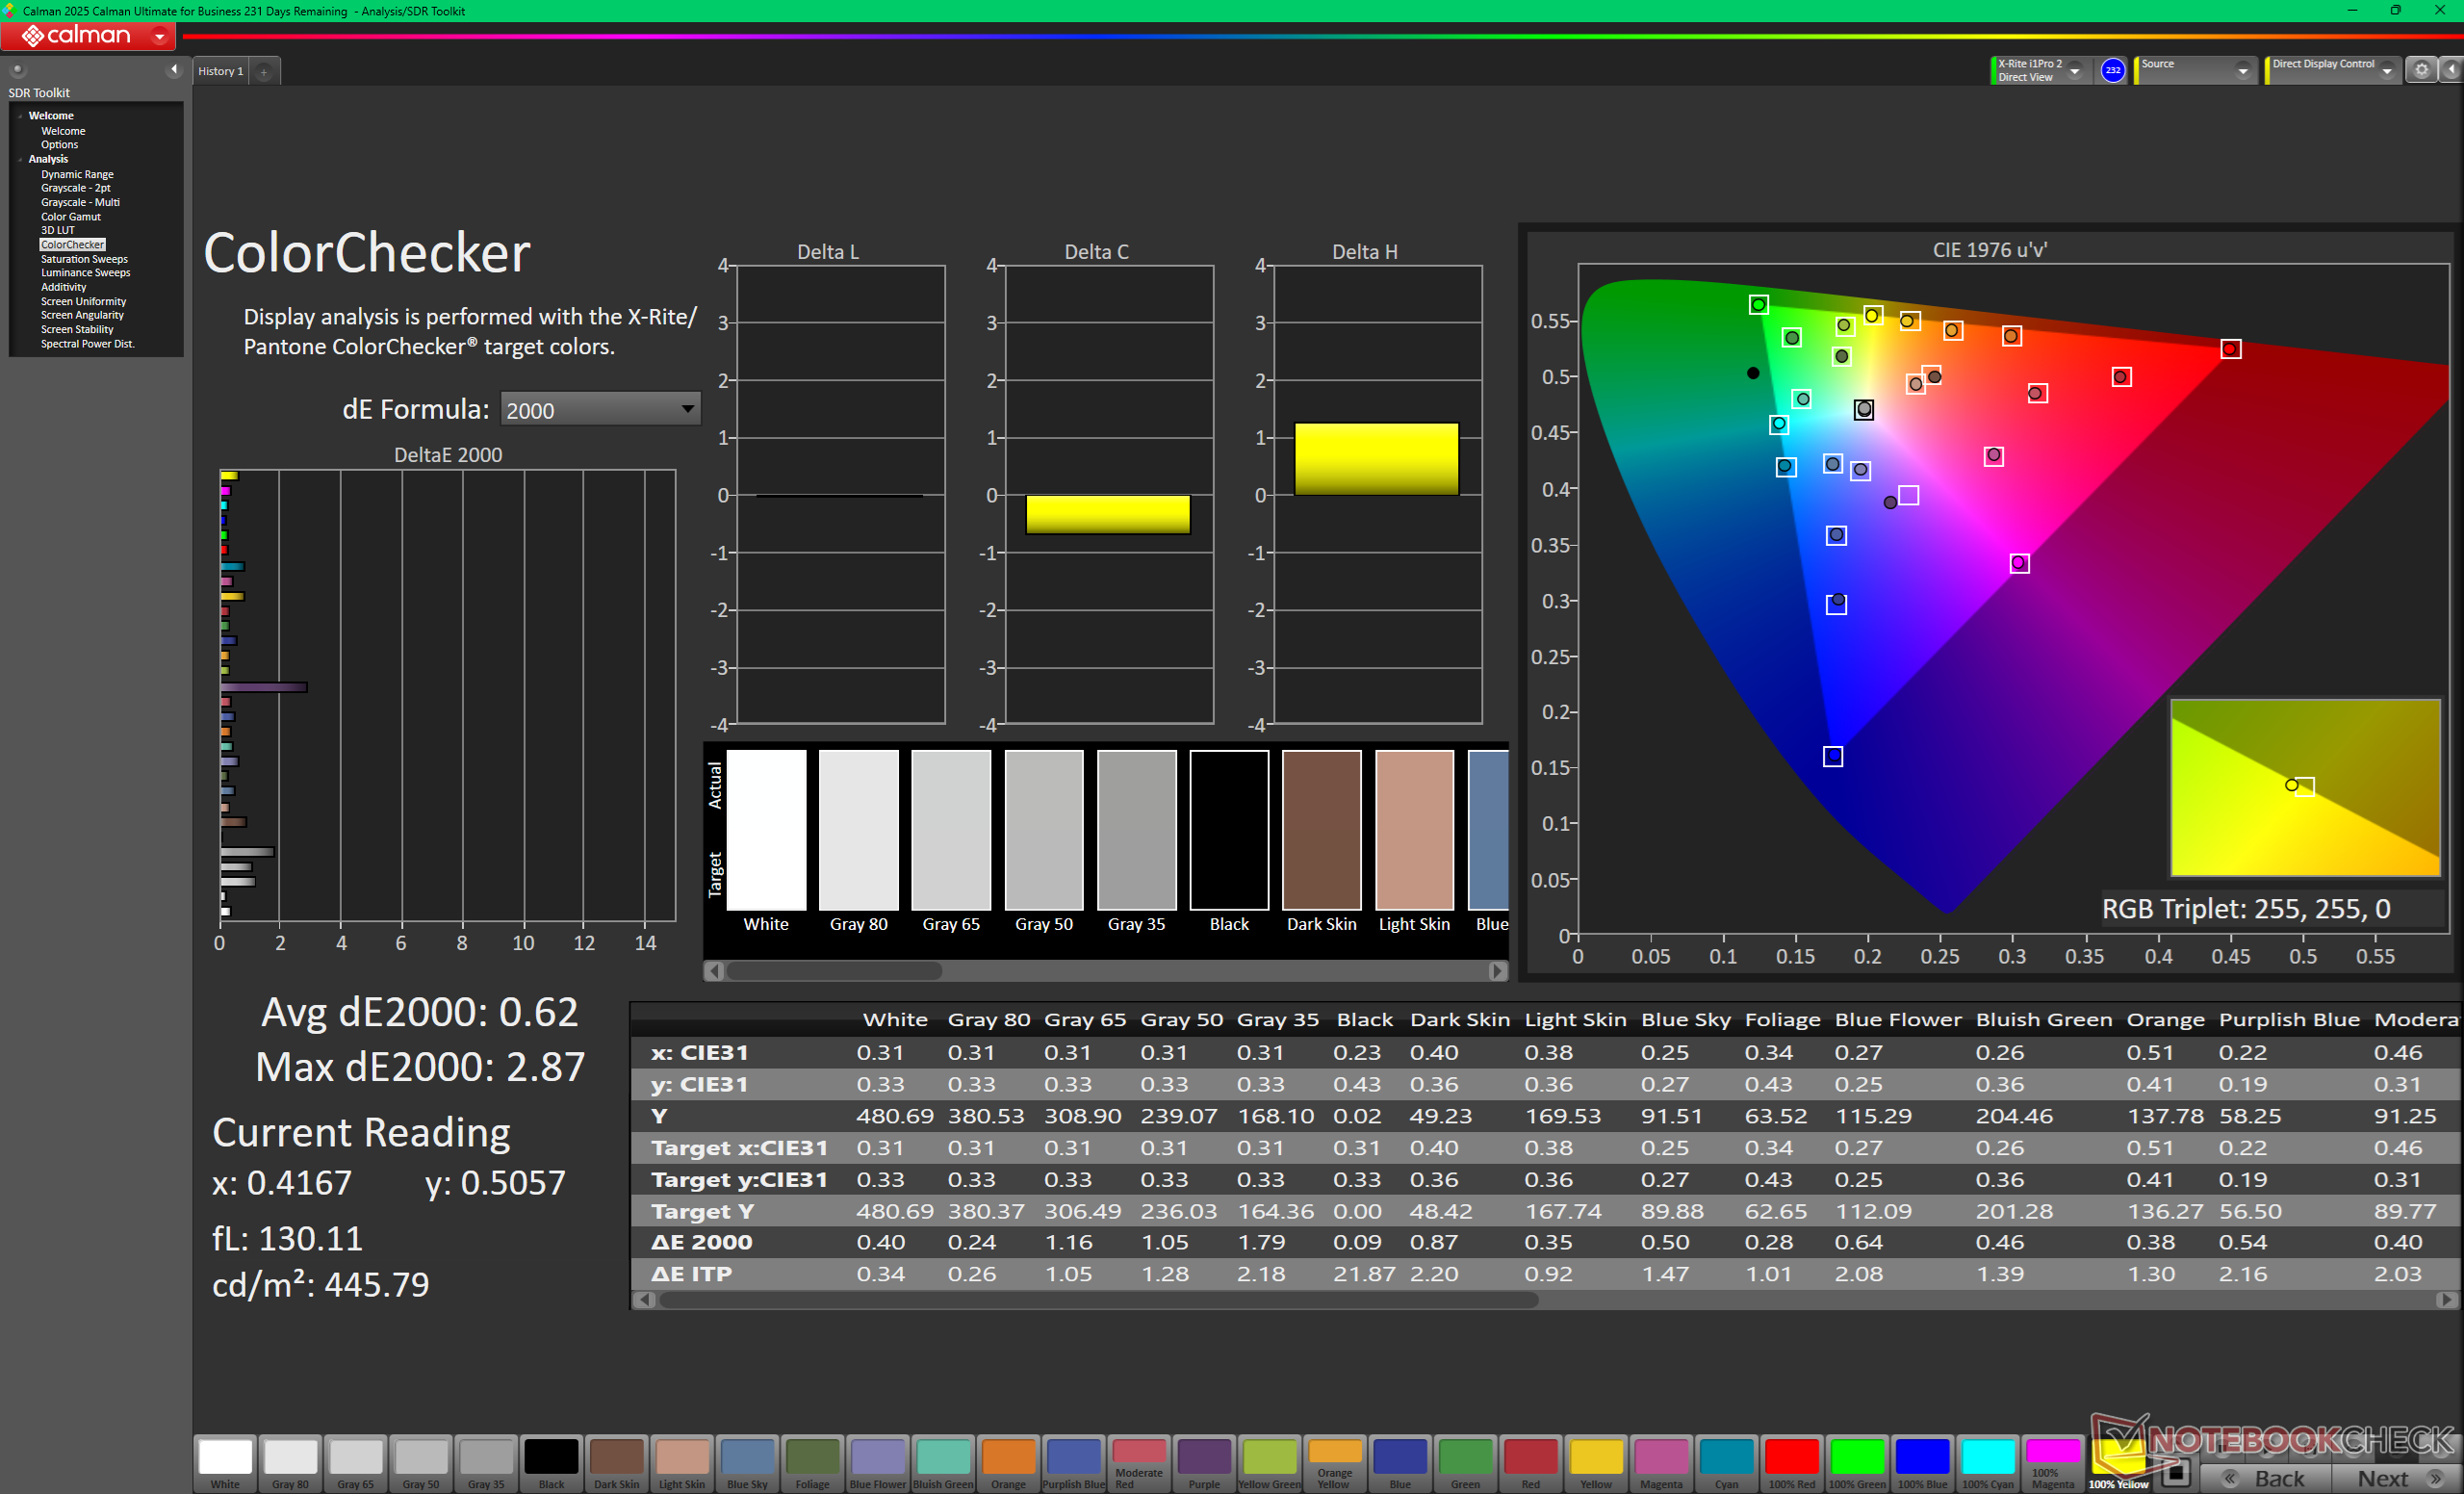
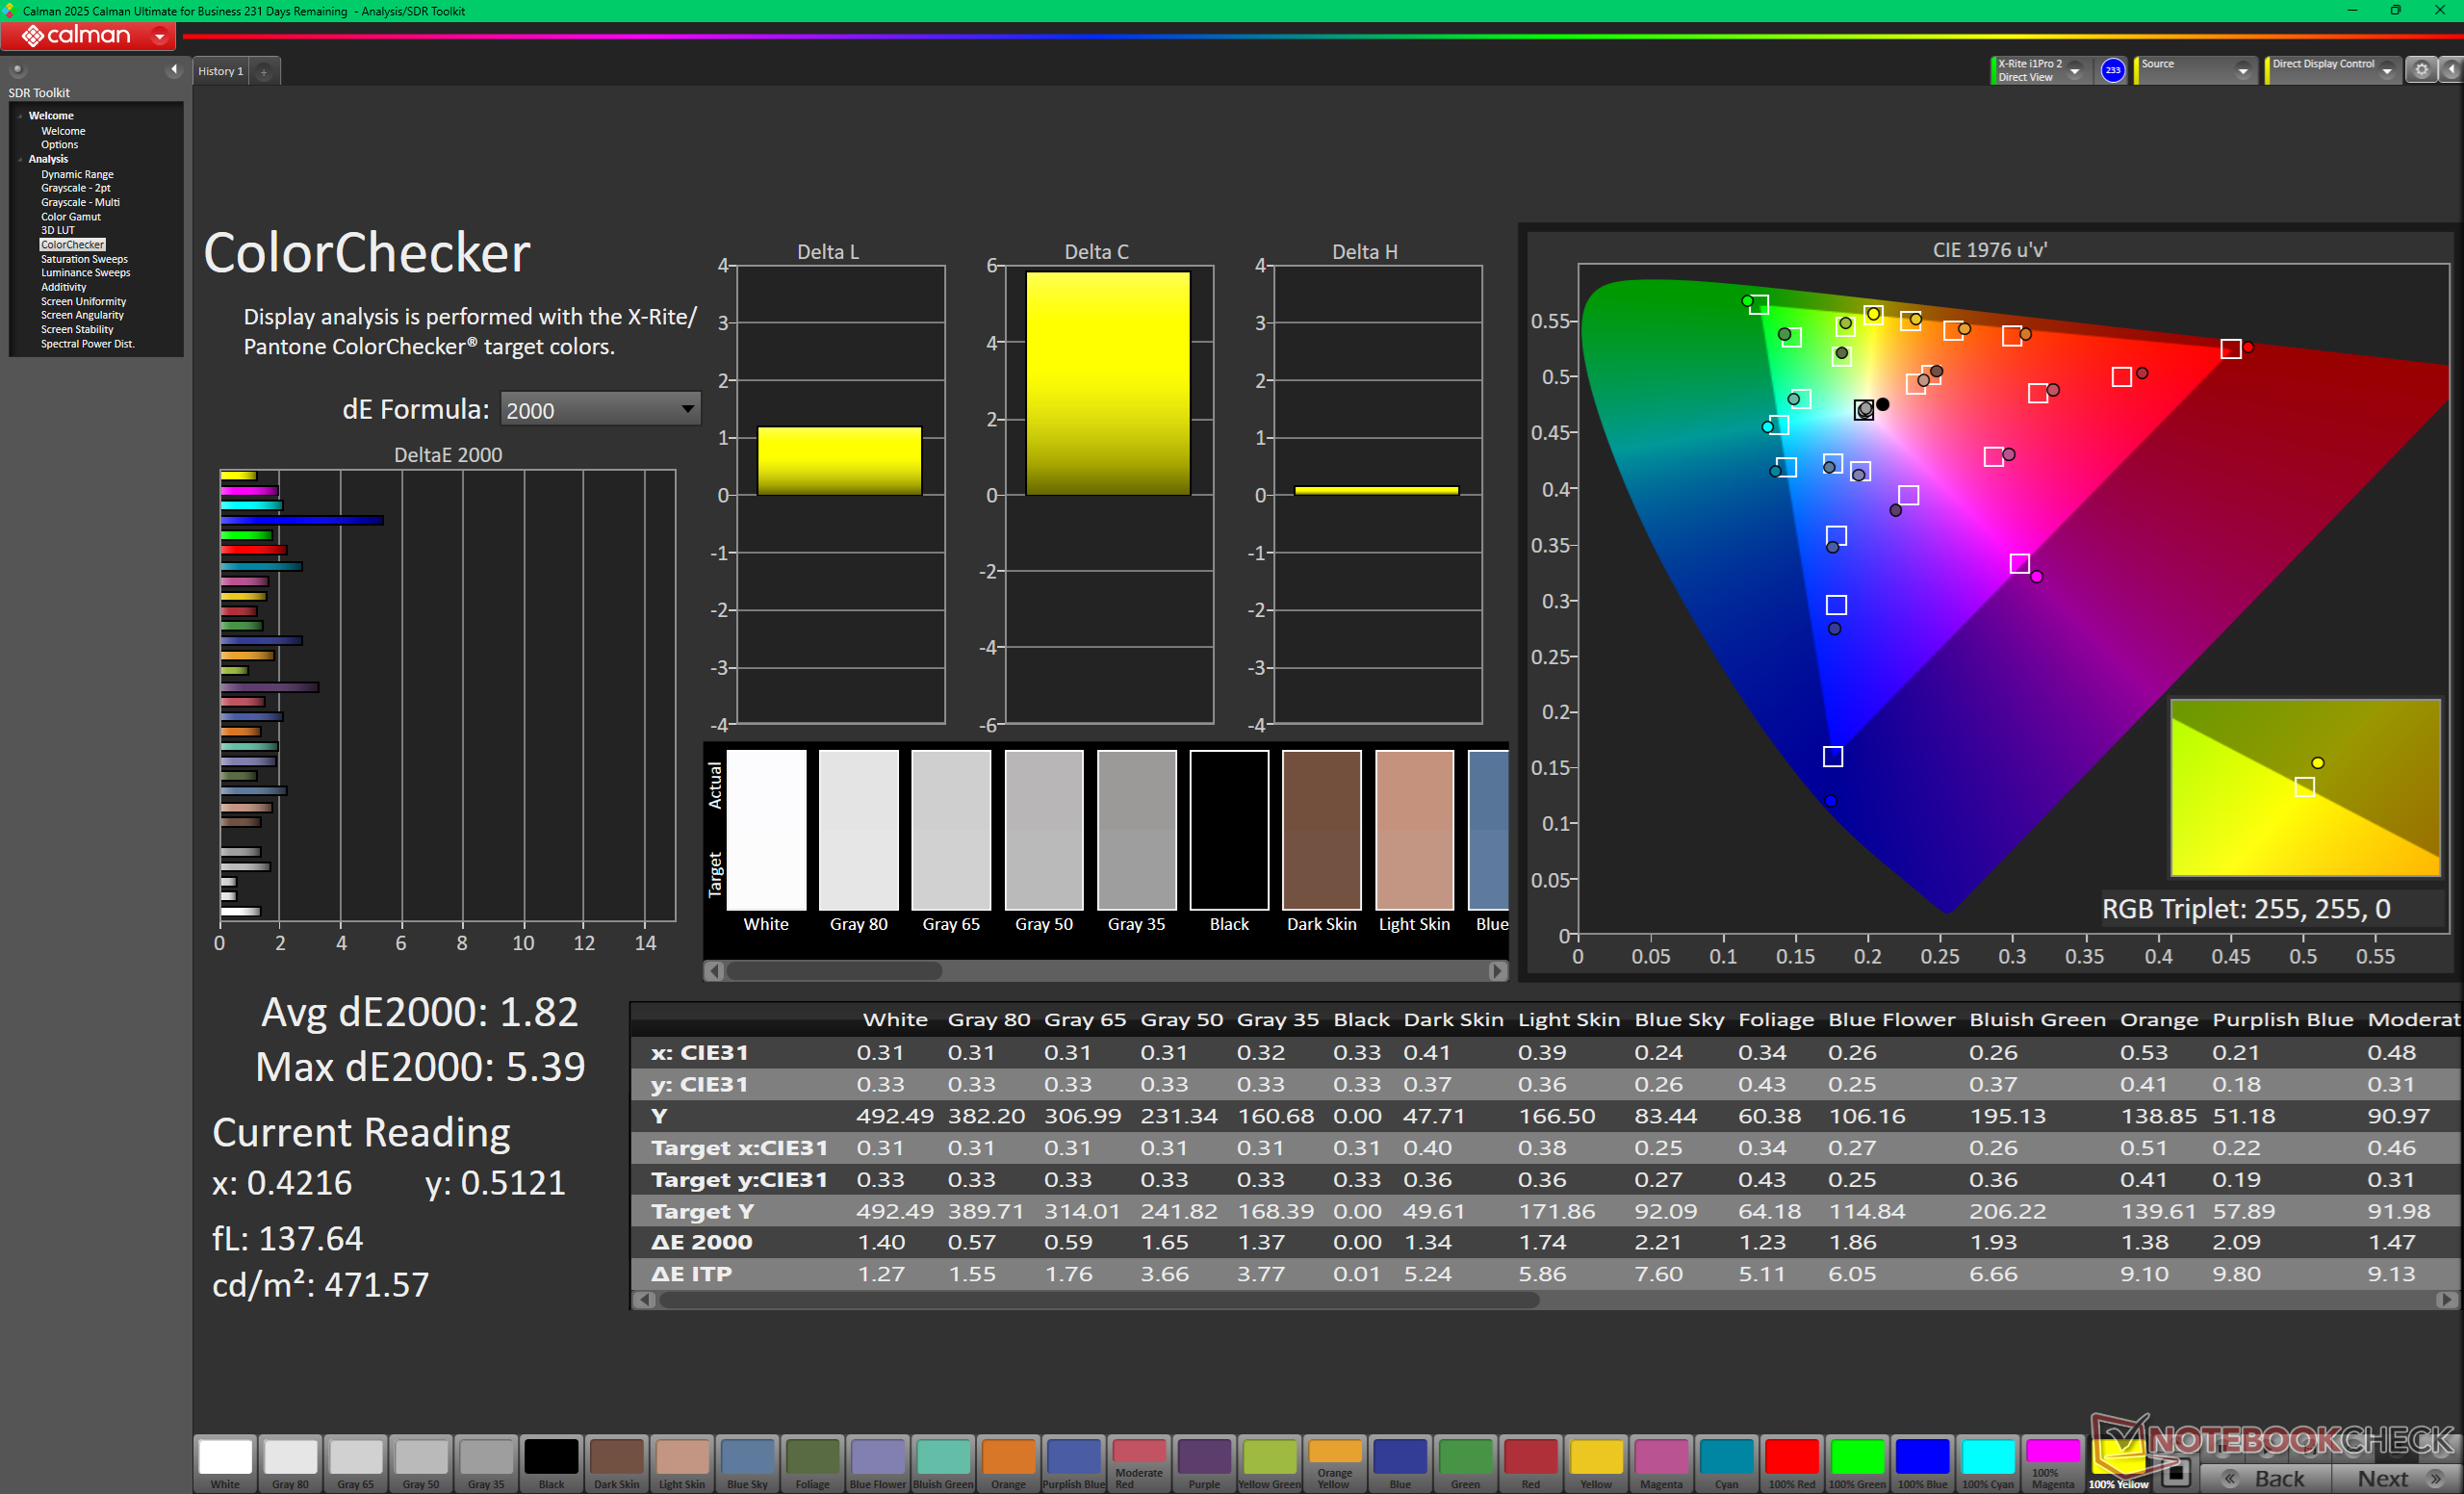
ΔE ColorChecker Calman: 0.62 | ∀{0.5-29.43 Ø4.72}
ΔE Greyscale Calman: 0.7 | ∀{0.09-98 Ø4.97}
87.5% AdobeRGB 1998 (Argyll 3D)
99.9% sRGB (Argyll 3D)
99.3% Display P3 (Argyll 3D)
Gamma: 2.16
CCT: 6535 K
| MSI Raider 16 Max HX B2WJ Samsung ATNA60HU01-0, OLED, 2560x1600, 16", 240 Hz | MSI Crosshair 16 HX AI D2XWGKG AUO B160QAN02.3, IPS, 2560x1600, 16", 240 Hz | Razer Blade 16 Core Ultra 9 386H Samsung ATNA60HU06-0, OLED, 2560x1600, 16", 240 Hz | Alienware 16X Aurora Core Ultra 9 290HX Plus Samsung 160HU05, OLED, 2560x1600, 16", 240 Hz | Asus TUF Gaming A16 FA608UP MNG007DA5-3, IPS, 2560x1600, 16", 165 Hz | Lenovo Legion 7 16IAX10 Samsung ATNA60HS01-0, OLED, 2560x1600, 16", 165 Hz | |
|---|---|---|---|---|---|---|
| Display | -3% | 2% | 2% | -17% | 2% | |
| Display P3 Coverage (%) | 99.3 | 95.5 -4% | 99.7 0% | 99.6 0% | 69.4 -30% | 99.6 0% |
| sRGB Coverage (%) | 99.9 | 99.7 0% | 100 0% | 100 0% | 97.2 -3% | 100 0% |
| AdobeRGB 1998 Coverage (%) | 87.5 | 83.9 -4% | 93.5 7% | 93.9 7% | 71.9 -18% | 93.5 7% |
| Response Times | -1450% | 2% | -1% | -1641% | -62% | |
| Response Time Grey 50% / Grey 80% * (ms) | 0.28 ? | 3.59 ? -1182% | 0.28 ? -0% | 0.29 ? -4% | 6.3 ? -2150% | 0.6 ? -114% |
| Response Time Black / White * (ms) | 0.39 ? | 7.09 ? -1718% | 0.4 ? -3% | 0.45 ? -15% | 4.8 ? -1131% | 0.8 ? -105% |
| PWM Frequency (Hz) | 1440 ? | 1441 | 1439.8 ? | 1317 ? | ||
| PWM Amplitude * (%) | 35 | 32 9% | 29 17% | 23 34% | ||
| Screen | -326% | -81% | -105% | -33% | -91% | |
| Brightness middle (cd/m²) | 478.6 | 472 -1% | 462.2 -3% | 380.5 -20% | 480 0% | 477.6 0% |
| Brightness (cd/m²) | 481 | 438 -9% | 465 -3% | 384 -20% | 456 -5% | 483 0% |
| Brightness Distribution (%) | 98 | 88 -10% | 97 -1% | 98 0% | 91 -7% | 95 -3% |
| Black Level * (cd/m²) | 0.4 | 0.32 | ||||
| Colorchecker dE 2000 * | 0.62 | 6.07 -879% | 3.03 -389% | 3.27 -427% | 1.4 -126% | 3.11 -402% |
| Colorchecker dE 2000 max. * | 2.87 | 9.76 -240% | 5.84 -103% | 6.31 -120% | 2.5 13% | 5.99 -109% |
| Greyscale dE 2000 * | 0.7 | 6.4 -814% | 0.6 14% | 1 -43% | 1.2 -71% | 0.9 -29% |
| Gamma | 2.16 102% | 2.52 87% | 2.2 100% | 2.23 99% | 2.16 102% | 2.18 101% |
| CCT | 6535 99% | 7987 81% | 6452 101% | 6410 101% | 6620 98% | 6405 101% |
| Contrast (:1) | 1180 | 1500 | ||||
| Colorchecker dE 2000 calibrated * | 2.25 | 0.6 | 1.1 | 1.3 | 0.79 | |
| Total Average (Program / Settings) | -593% /
-442% | -26% /
-39% | -35% /
-52% | -564% /
-321% | -50% /
-60% |
* ... smaller is better

Display Response Times
| ↔ Response Time Black to White | ||
|---|---|---|
| 0.39 ms ... rise ↗ and fall ↘ combined | ↗ 0.21 ms rise | 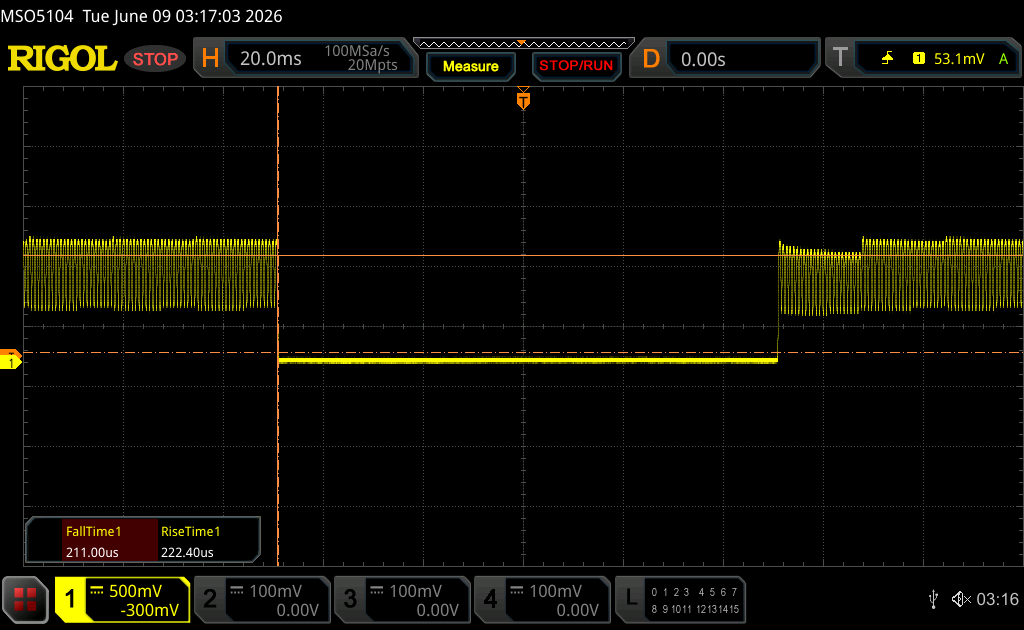 |
| ↘ 0.18 ms fall | ||
| The screen shows very fast response rates in our tests and should be very well suited for fast-paced gaming. In comparison, all tested devices range from 0.1 (minimum) to 240 (maximum) ms. » 0 % of all devices are better. This means that the measured response time is better than the average of all tested devices (19.8 ms). | ||
| ↔ Response Time 50% Grey to 80% Grey | ||
| 0.28 ms ... rise ↗ and fall ↘ combined | ↗ 0.14 ms rise | 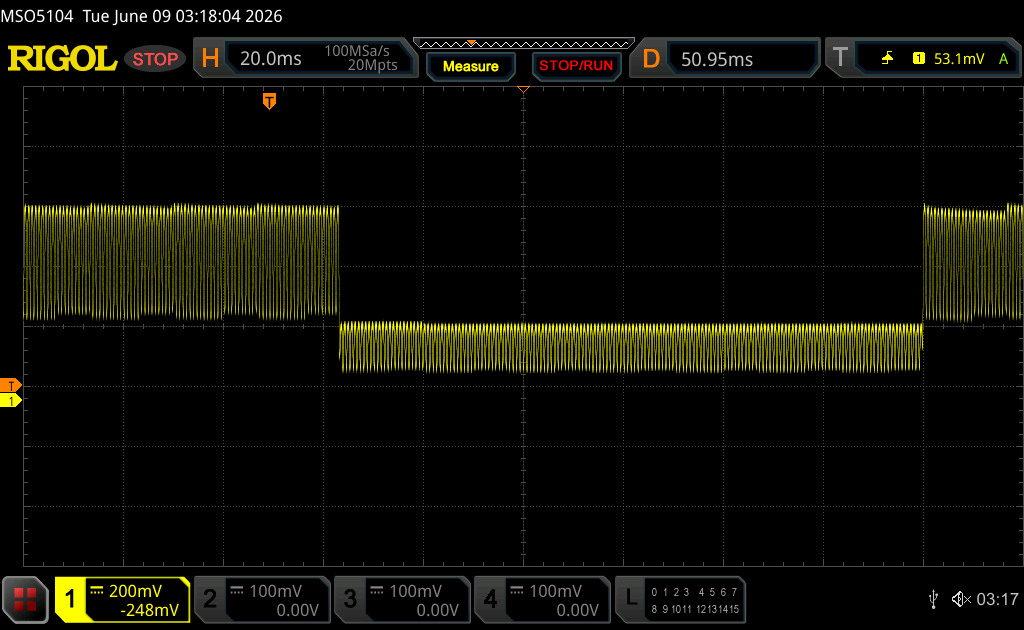 |
| ↘ 0.14 ms fall | ||
| The screen shows very fast response rates in our tests and should be very well suited for fast-paced gaming. In comparison, all tested devices range from 0.165 (minimum) to 636 (maximum) ms. » 0 % of all devices are better. This means that the measured response time is better than the average of all tested devices (31 ms). | ||
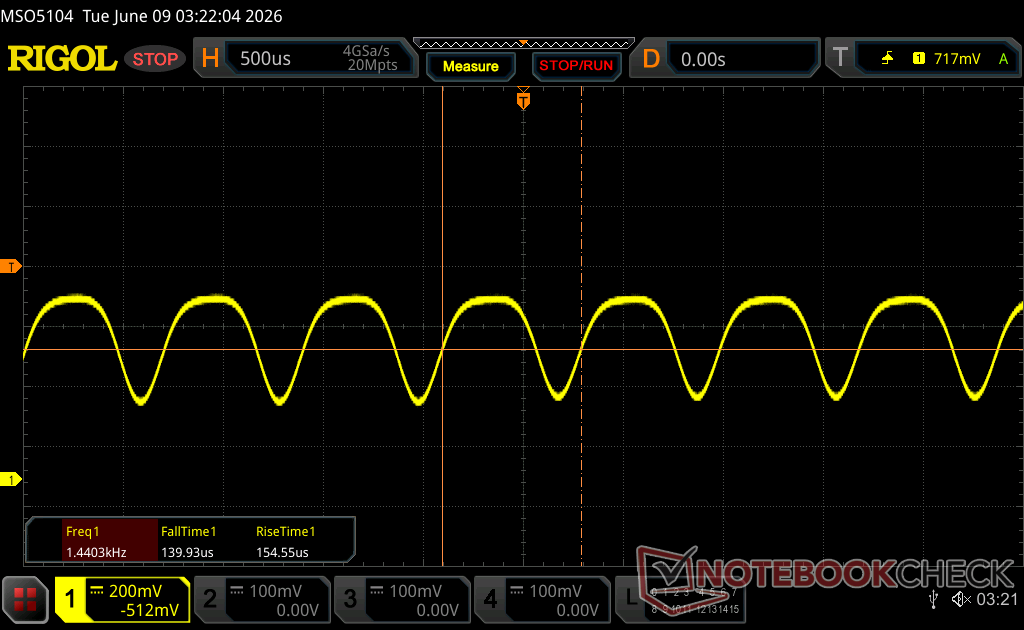
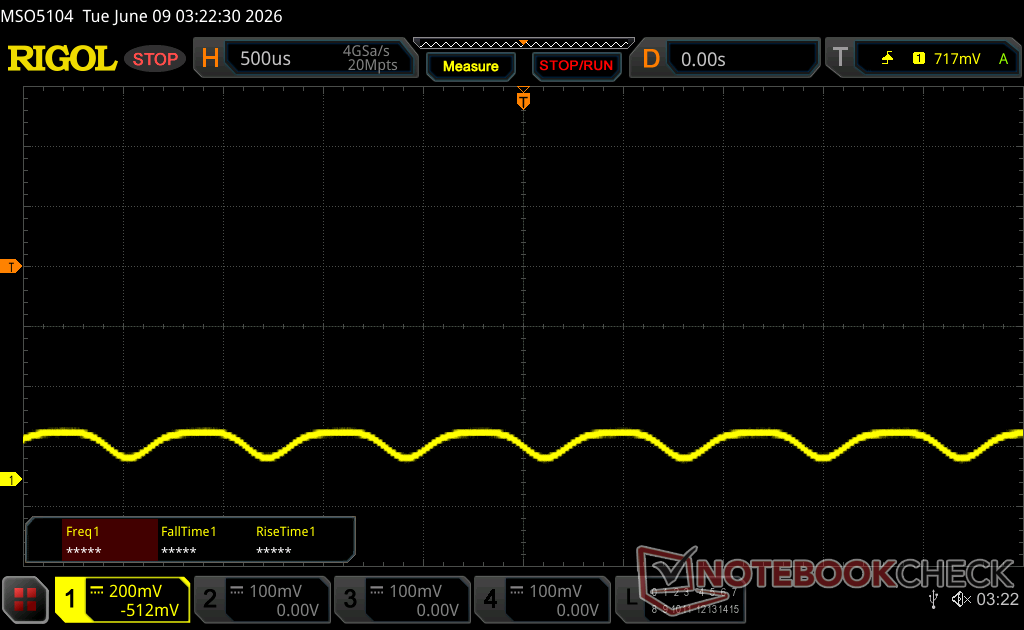
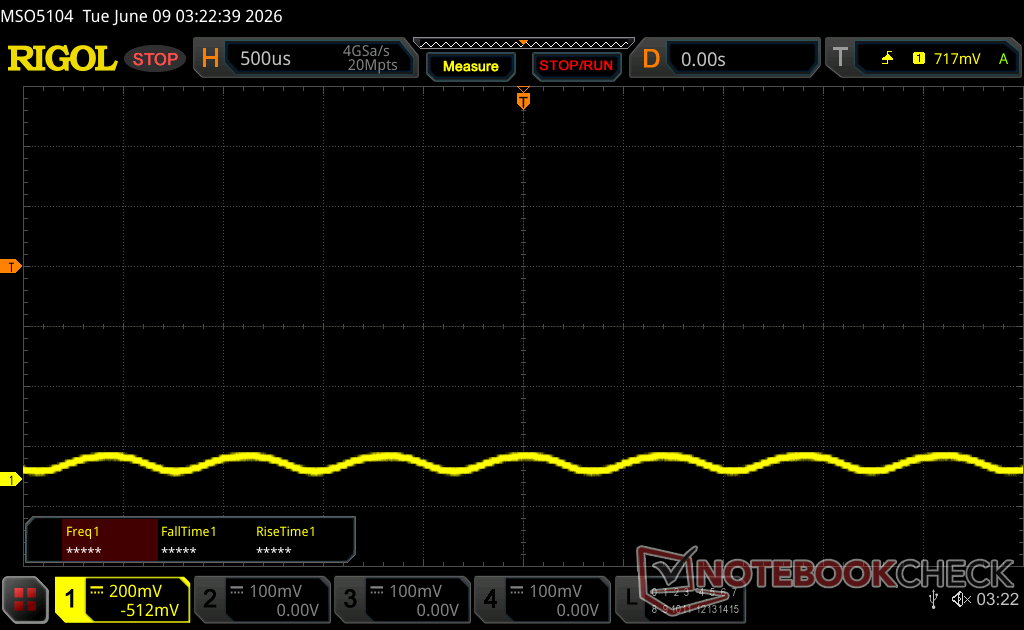
Screen Flickering / PWM (Pulse-Width Modulation)
| Screen flickering / PWM detected | 1440 Hz Amplitude: 35 % | ≤ 100 % brightness setting | 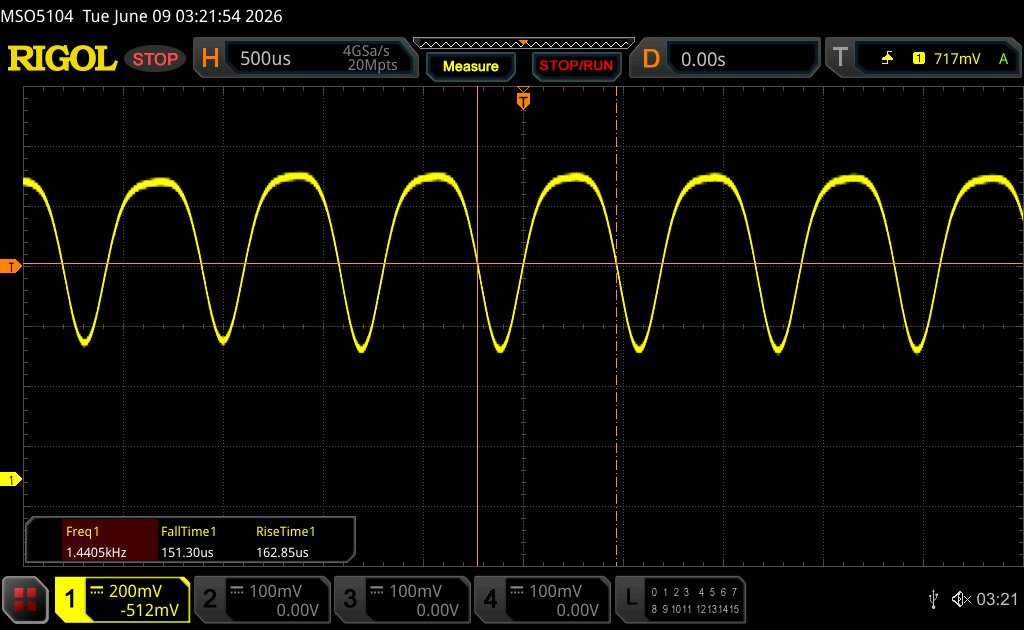 |
The display backlight flickers at 1440 Hz (worst case, e.g., utilizing PWM) Flickering detected at a brightness setting of 100 % and below. There should be no flickering or PWM above this brightness setting. The frequency of 1440 Hz is quite high, so most users sensitive to PWM should not notice any flickering. In comparison: 52 % of all tested devices do not use PWM to dim the display. If PWM was detected, an average of 7747 (minimum: 5 - maximum: 343500) Hz was measured. | |||


Performance
Testing Conditions
We set MSI Center to Extreme Performance mode and discrete graphics mode prior to running the benchmarks below.
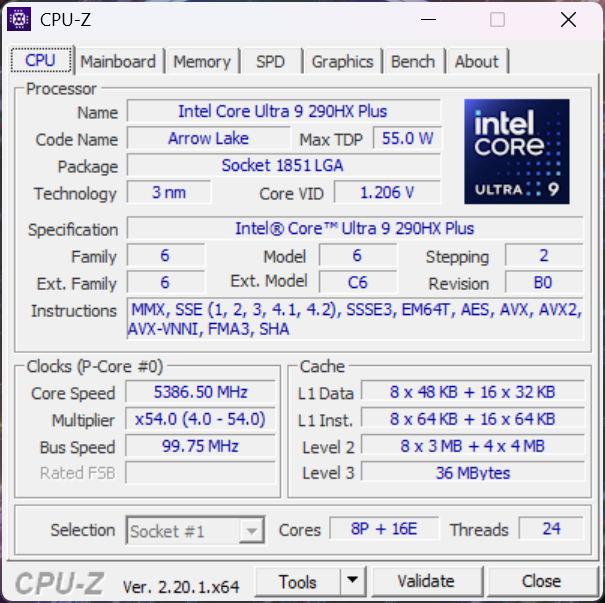
Processor
The Core Ultra 9 290HX Plus is essentially an overclocked Core Ultra 9 275HX with the exact same cache sizes and number of cores. Users can expect roughly 15 percent faster CPU performance when compared to the MSI Crosshair 16 HX. More interestingly, our MSI would run up to 10 percent faster than the Dell Alienware 16X Aurora with the exact same Core Ultra 9 290HX Plus processor as shown by the comparison charts below.
Cinebench R15 Multi Loop
Cinebench R23: Multi Core | Single Core
Cinebench R20: CPU (Multi Core) | CPU (Single Core)
Cinebench R15: CPU Multi 64Bit | CPU Single 64Bit
Blender: v2.79 BMW27 CPU
7-Zip 18.03: 7z b 4 | 7z b 4 -mmt1
Geekbench 6.7: Multi-Core | Single-Core
Geekbench 5.5: Multi-Core | Single-Core
HWBOT x265 Benchmark v2.2: 4k Preset
LibreOffice : 20 Documents To PDF
R Benchmark 2.5: Overall mean
* ... smaller is better
AIDA64: FP32 Ray-Trace | FPU Julia | CPU SHA3 | CPU Queen | FPU SinJulia | FPU Mandel | CPU AES | CPU ZLib | FP64 Ray-Trace | CPU PhotoWorxx | CPU CheckMate
| Performance rating | |
| MSI Raider 16 Max HX B2WJ -1! | |
| Average Intel Core Ultra 9 290HX Plus -1! | |
| Alienware 16X Aurora Core Ultra 9 290HX Plus -1! | |
| MSI Crosshair 16 HX AI D2XWGKG -1! | |
| Lenovo Legion 7 16IAX10 -1! | |
| Asus TUF Gaming A16 FA608UP -1! | |
| Razer Blade 16 Core Ultra 9 386H -1! | |
| AIDA64 / FP32 Ray-Trace | |
| MSI Raider 16 Max HX B2WJ (v8.20.8100) | |
| Average Intel Core Ultra 9 290HX Plus (34761 - 40761, n=4) | |
| MSI Crosshair 16 HX AI D2XWGKG (v6.92.6600) | |
| Alienware 16X Aurora Core Ultra 9 290HX Plus (v8.20.8100) | |
| Lenovo Legion 7 16IAX10 (v6.92.6600) | |
| Asus TUF Gaming A16 FA608UP (v6.92.6600) | |
| Razer Blade 16 Core Ultra 9 386H (v8.20.8100) | |
| AIDA64 / FPU Julia | |
| MSI Raider 16 Max HX B2WJ (v8.20.8100) | |
| Average Intel Core Ultra 9 290HX Plus (174665 - 208083, n=4) | |
| MSI Crosshair 16 HX AI D2XWGKG (v6.92.6600) | |
| Alienware 16X Aurora Core Ultra 9 290HX Plus (v8.20.8100) | |
| Lenovo Legion 7 16IAX10 (v6.92.6600) | |
| Asus TUF Gaming A16 FA608UP (v6.92.6600) | |
| Razer Blade 16 Core Ultra 9 386H (v8.20.8100) | |
| AIDA64 / CPU SHA3 | |
| MSI Raider 16 Max HX B2WJ (v8.20.8100) | |
| Average Intel Core Ultra 9 290HX Plus (8352 - 9784, n=4) | |
| MSI Crosshair 16 HX AI D2XWGKG (v6.92.6600) | |
| Alienware 16X Aurora Core Ultra 9 290HX Plus (v8.20.8100) | |
| Lenovo Legion 7 16IAX10 (v6.92.6600) | |
| Razer Blade 16 Core Ultra 9 386H (v8.20.8100) | |
| Asus TUF Gaming A16 FA608UP (v6.92.6600) | |
| AIDA64 / CPU Queen | |
| Lenovo Legion 7 16IAX10 (v6.92.6600) | |
| MSI Crosshair 16 HX AI D2XWGKG (v6.92.6600) | |
| Asus TUF Gaming A16 FA608UP (v6.92.6600) | |
| AIDA64 / FPU SinJulia | |
| Asus TUF Gaming A16 FA608UP (v6.92.6600) | |
| MSI Raider 16 Max HX B2WJ (v8.20.8100) | |
| Average Intel Core Ultra 9 290HX Plus (13612 - 14461, n=4) | |
| Alienware 16X Aurora Core Ultra 9 290HX Plus (v8.20.8100) | |
| MSI Crosshair 16 HX AI D2XWGKG (v6.92.6600) | |
| Lenovo Legion 7 16IAX10 (v6.92.6600) | |
| Razer Blade 16 Core Ultra 9 386H (v8.20.8100) | |
| AIDA64 / FPU Mandel | |
| MSI Raider 16 Max HX B2WJ (v8.20.8100) | |
| Average Intel Core Ultra 9 290HX Plus (91215 - 108275, n=4) | |
| MSI Crosshair 16 HX AI D2XWGKG (v6.92.6600) | |
| Alienware 16X Aurora Core Ultra 9 290HX Plus (v8.20.8100) | |
| Lenovo Legion 7 16IAX10 (v6.92.6600) | |
| Asus TUF Gaming A16 FA608UP (v6.92.6600) | |
| Razer Blade 16 Core Ultra 9 386H (v8.20.8100) | |
| AIDA64 / CPU AES | |
| MSI Raider 16 Max HX B2WJ (v8.20.8100) | |
| Average Intel Core Ultra 9 290HX Plus (127585 - 136781, n=4) | |
| Alienware 16X Aurora Core Ultra 9 290HX Plus (v8.20.8100) | |
| MSI Crosshair 16 HX AI D2XWGKG (v6.92.6600) | |
| Lenovo Legion 7 16IAX10 (v6.92.6600) | |
| Asus TUF Gaming A16 FA608UP (v6.92.6600) | |
| Razer Blade 16 Core Ultra 9 386H (v8.20.8100) | |
| AIDA64 / CPU ZLib | |
| MSI Raider 16 Max HX B2WJ (v8.20.8100) | |
| Average Intel Core Ultra 9 290HX Plus (1967 - 2206, n=4) | |
| MSI Crosshair 16 HX AI D2XWGKG (v6.92.6600) | |
| Alienware 16X Aurora Core Ultra 9 290HX Plus (v8.20.8100) | |
| Lenovo Legion 7 16IAX10 (v6.92.6600) | |
| Razer Blade 16 Core Ultra 9 386H (v8.20.8100) | |
| Asus TUF Gaming A16 FA608UP (v6.92.6600) | |
| AIDA64 / FP64 Ray-Trace | |
| MSI Raider 16 Max HX B2WJ (v8.20.8100) | |
| Average Intel Core Ultra 9 290HX Plus (18611 - 21949, n=4) | |
| MSI Crosshair 16 HX AI D2XWGKG (v6.92.6600) | |
| Alienware 16X Aurora Core Ultra 9 290HX Plus (v8.20.8100) | |
| Lenovo Legion 7 16IAX10 (v6.92.6600) | |
| Asus TUF Gaming A16 FA608UP (v6.92.6600) | |
| Razer Blade 16 Core Ultra 9 386H (v8.20.8100) | |
| AIDA64 / CPU PhotoWorxx | |
| Razer Blade 16 Core Ultra 9 386H (v8.20.8100) | |
| Average Intel Core Ultra 9 290HX Plus (51134 - 55731, n=4) | |
| Alienware 16X Aurora Core Ultra 9 290HX Plus (v8.20.8100) | |
| MSI Raider 16 Max HX B2WJ (v8.20.8100) | |
| Lenovo Legion 7 16IAX10 (v6.92.6600) | |
| Asus TUF Gaming A16 FA608UP (v6.92.6600) | |
| MSI Crosshair 16 HX AI D2XWGKG (v6.92.6600) | |
| AIDA64 / CPU CheckMate | |
| MSI Raider 16 Max HX B2WJ (v8.20.8100) | |
| Average Intel Core Ultra 9 290HX Plus (7624 - 8322, n=4) | |
| Alienware 16X Aurora Core Ultra 9 290HX Plus (v8.20.8100) | |
| Razer Blade 16 Core Ultra 9 386H (v8.20.8100) | |
System Performance
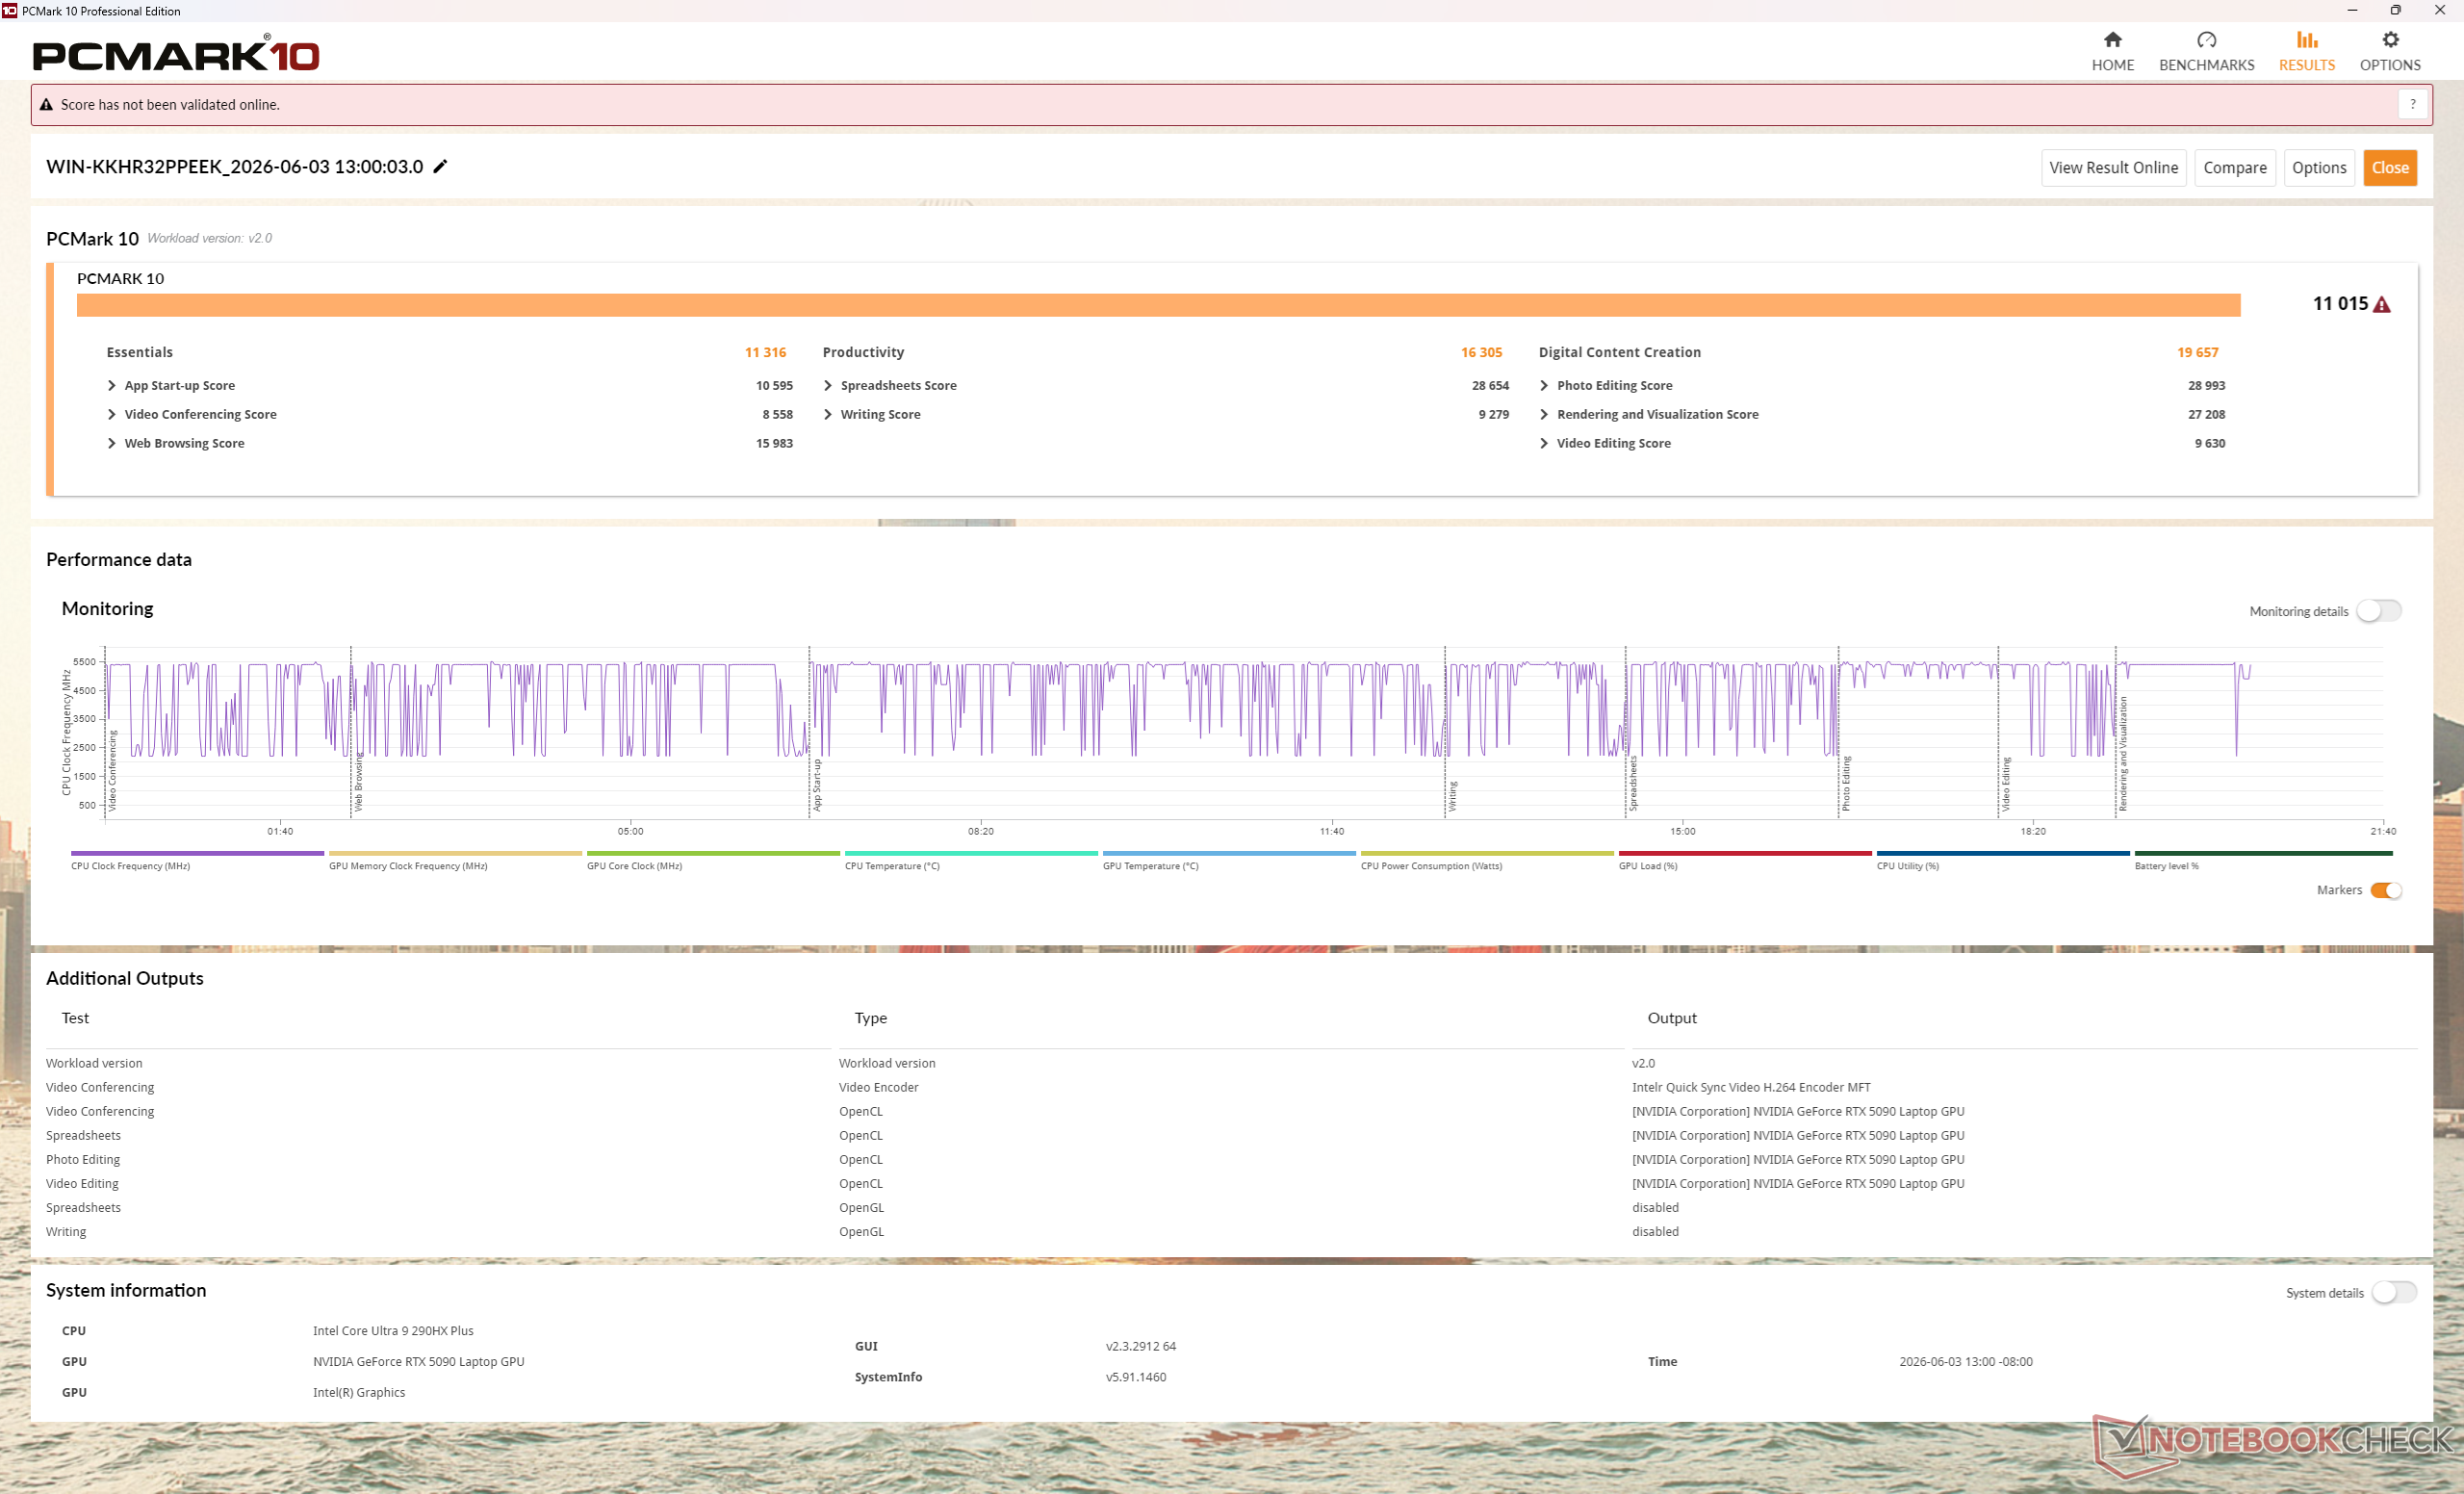
PCMark 10: Score | Essentials | Productivity | Digital Content Creation
CrossMark: Overall | Productivity | Creativity | Responsiveness
WebXPRT 3: Overall
WebXPRT 4: Overall
Mozilla Kraken 1.1: Total
Geekbench AI: Quantized GPU 1.7 | Half Precision GPU 1.7 | Single Precision GPU 1.7
| Performance rating | |
| MSI Raider 16 Max HX B2WJ | |
| Average Intel Core Ultra 9 290HX Plus, NVIDIA GeForce RTX 5090 Laptop | |
| Alienware 16X Aurora Core Ultra 9 290HX Plus | |
| Razer Blade 16 Core Ultra 9 386H | |
| MSI Crosshair 16 HX AI D2XWGKG | |
| Lenovo Legion 7 16IAX10 | |
| Asus TUF Gaming A16 FA608UP -4! | |
| PCMark 10 / Score | |
| Average Intel Core Ultra 9 290HX Plus, NVIDIA GeForce RTX 5090 Laptop (11015 - 11730, n=2) | |
| MSI Raider 16 Max HX B2WJ | |
| Alienware 16X Aurora Core Ultra 9 290HX Plus | |
| Razer Blade 16 Core Ultra 9 386H | |
| MSI Crosshair 16 HX AI D2XWGKG | |
| Lenovo Legion 7 16IAX10 | |
| PCMark 10 / Essentials | |
| Alienware 16X Aurora Core Ultra 9 290HX Plus | |
| Lenovo Legion 7 16IAX10 | |
| Average Intel Core Ultra 9 290HX Plus, NVIDIA GeForce RTX 5090 Laptop (11316 - 11484, n=2) | |
| MSI Raider 16 Max HX B2WJ | |
| Razer Blade 16 Core Ultra 9 386H | |
| MSI Crosshair 16 HX AI D2XWGKG | |
| PCMark 10 / Productivity | |
| Average Intel Core Ultra 9 290HX Plus, NVIDIA GeForce RTX 5090 Laptop (16305 - 19111, n=2) | |
| Alienware 16X Aurora Core Ultra 9 290HX Plus | |
| MSI Raider 16 Max HX B2WJ | |
| Razer Blade 16 Core Ultra 9 386H | |
| Lenovo Legion 7 16IAX10 | |
| MSI Crosshair 16 HX AI D2XWGKG | |
| PCMark 10 / Digital Content Creation | |
| Average Intel Core Ultra 9 290HX Plus, NVIDIA GeForce RTX 5090 Laptop (19657 - 19954, n=2) | |
| MSI Raider 16 Max HX B2WJ | |
| Alienware 16X Aurora Core Ultra 9 290HX Plus | |
| MSI Crosshair 16 HX AI D2XWGKG | |
| Razer Blade 16 Core Ultra 9 386H | |
| Lenovo Legion 7 16IAX10 | |
| CrossMark / Overall | |
| MSI Raider 16 Max HX B2WJ | |
| Alienware 16X Aurora Core Ultra 9 290HX Plus | |
| Average Intel Core Ultra 9 290HX Plus, NVIDIA GeForce RTX 5090 Laptop (2177 - 2401, n=2) | |
| Razer Blade 16 Core Ultra 9 386H | |
| MSI Crosshair 16 HX AI D2XWGKG | |
| Lenovo Legion 7 16IAX10 | |
| Asus TUF Gaming A16 FA608UP | |
| CrossMark / Productivity | |
| Alienware 16X Aurora Core Ultra 9 290HX Plus | |
| MSI Raider 16 Max HX B2WJ | |
| Average Intel Core Ultra 9 290HX Plus, NVIDIA GeForce RTX 5090 Laptop (1994 - 2213, n=2) | |
| Razer Blade 16 Core Ultra 9 386H | |
| MSI Crosshair 16 HX AI D2XWGKG | |
| Lenovo Legion 7 16IAX10 | |
| Asus TUF Gaming A16 FA608UP | |
| CrossMark / Creativity | |
| MSI Raider 16 Max HX B2WJ | |
| Average Intel Core Ultra 9 290HX Plus, NVIDIA GeForce RTX 5090 Laptop (2548 - 2661, n=2) | |
| Alienware 16X Aurora Core Ultra 9 290HX Plus | |
| Razer Blade 16 Core Ultra 9 386H | |
| MSI Crosshair 16 HX AI D2XWGKG | |
| Lenovo Legion 7 16IAX10 | |
| Asus TUF Gaming A16 FA608UP | |
| CrossMark / Responsiveness | |
| Alienware 16X Aurora Core Ultra 9 290HX Plus | |
| MSI Raider 16 Max HX B2WJ | |
| Average Intel Core Ultra 9 290HX Plus, NVIDIA GeForce RTX 5090 Laptop (1766 - 2249, n=2) | |
| Razer Blade 16 Core Ultra 9 386H | |
| MSI Crosshair 16 HX AI D2XWGKG | |
| Lenovo Legion 7 16IAX10 | |
| Asus TUF Gaming A16 FA608UP | |
| WebXPRT 3 / Overall | |
| Alienware 16X Aurora Core Ultra 9 290HX Plus | |
| MSI Raider 16 Max HX B2WJ | |
| Average Intel Core Ultra 9 290HX Plus, NVIDIA GeForce RTX 5090 Laptop (354 - 361, n=2) | |
| Lenovo Legion 7 16IAX10 | |
| MSI Crosshair 16 HX AI D2XWGKG | |
| Razer Blade 16 Core Ultra 9 386H | |
| Asus TUF Gaming A16 FA608UP | |
| WebXPRT 4 / Overall | |
| Alienware 16X Aurora Core Ultra 9 290HX Plus | |
| MSI Raider 16 Max HX B2WJ | |
| Average Intel Core Ultra 9 290HX Plus, NVIDIA GeForce RTX 5090 Laptop (310 - 336, n=2) | |
| Lenovo Legion 7 16IAX10 | |
| MSI Crosshair 16 HX AI D2XWGKG | |
| Razer Blade 16 Core Ultra 9 386H | |
| Asus TUF Gaming A16 FA608UP | |
| Mozilla Kraken 1.1 / Total | |
| Asus TUF Gaming A16 FA608UP | |
| Razer Blade 16 Core Ultra 9 386H | |
| Lenovo Legion 7 16IAX10 | |
| MSI Crosshair 16 HX AI D2XWGKG | |
| MSI Raider 16 Max HX B2WJ | |
| Average Intel Core Ultra 9 290HX Plus, NVIDIA GeForce RTX 5090 Laptop (393 - 399, n=2) | |
| Alienware 16X Aurora Core Ultra 9 290HX Plus | |
| Geekbench AI / Quantized GPU 1.7 | |
| Average Intel Core Ultra 9 290HX Plus, NVIDIA GeForce RTX 5090 Laptop (25151 - 25211, n=2) | |
| MSI Raider 16 Max HX B2WJ | |
| Razer Blade 16 Core Ultra 9 386H | |
| Alienware 16X Aurora Core Ultra 9 290HX Plus | |
| MSI Crosshair 16 HX AI D2XWGKG | |
| Asus TUF Gaming A16 FA608UP | |
| Lenovo Legion 7 16IAX10 | |
| Geekbench AI / Half Precision GPU 1.7 | |
| Average Intel Core Ultra 9 290HX Plus, NVIDIA GeForce RTX 5090 Laptop (55223 - 56393, n=2) | |
| MSI Raider 16 Max HX B2WJ | |
| Alienware 16X Aurora Core Ultra 9 290HX Plus | |
| Razer Blade 16 Core Ultra 9 386H | |
| MSI Crosshair 16 HX AI D2XWGKG | |
| Asus TUF Gaming A16 FA608UP | |
| Lenovo Legion 7 16IAX10 | |
| Geekbench AI / Single Precision GPU 1.7 | |
| Average Intel Core Ultra 9 290HX Plus, NVIDIA GeForce RTX 5090 Laptop (31828 - 32576, n=2) | |
| MSI Raider 16 Max HX B2WJ | |
| Razer Blade 16 Core Ultra 9 386H | |
| Alienware 16X Aurora Core Ultra 9 290HX Plus | |
| MSI Crosshair 16 HX AI D2XWGKG | |
| Asus TUF Gaming A16 FA608UP | |
| Lenovo Legion 7 16IAX10 | |
* ... smaller is better
| PCMark 10 Score | 11015 points | |
Help | ||
| AIDA64 / Memory Copy | |
| Razer Blade 16 Core Ultra 9 386H | |
| Lenovo Legion 7 16IAX10 | |
| Average Intel Core Ultra 9 290HX Plus (76912 - 86055, n=4) | |
| MSI Raider 16 Max HX B2WJ | |
| Alienware 16X Aurora Core Ultra 9 290HX Plus | |
| MSI Crosshair 16 HX AI D2XWGKG | |
| Asus TUF Gaming A16 FA608UP | |
| AIDA64 / Memory Read | |
| Razer Blade 16 Core Ultra 9 386H | |
| Average Intel Core Ultra 9 290HX Plus (84638 - 96309, n=4) | |
| MSI Raider 16 Max HX B2WJ | |
| Lenovo Legion 7 16IAX10 | |
| Alienware 16X Aurora Core Ultra 9 290HX Plus | |
| MSI Crosshair 16 HX AI D2XWGKG | |
| Asus TUF Gaming A16 FA608UP | |
| AIDA64 / Memory Write | |
| Razer Blade 16 Core Ultra 9 386H | |
| Asus TUF Gaming A16 FA608UP | |
| Average Intel Core Ultra 9 290HX Plus (76094 - 85001, n=4) | |
| MSI Raider 16 Max HX B2WJ | |
| Lenovo Legion 7 16IAX10 | |
| Alienware 16X Aurora Core Ultra 9 290HX Plus | |
| MSI Crosshair 16 HX AI D2XWGKG | |
| AIDA64 / Memory Latency | |
| MSI Crosshair 16 HX AI D2XWGKG | |
| Alienware 16X Aurora Core Ultra 9 290HX Plus | |
| Lenovo Legion 7 16IAX10 | |
| MSI Raider 16 Max HX B2WJ | |
| Average Intel Core Ultra 9 290HX Plus (100.7 - 108.4, n=4) | |
| Asus TUF Gaming A16 FA608UP | |
| Razer Blade 16 Core Ultra 9 386H | |
* ... smaller is better
DPC Latency
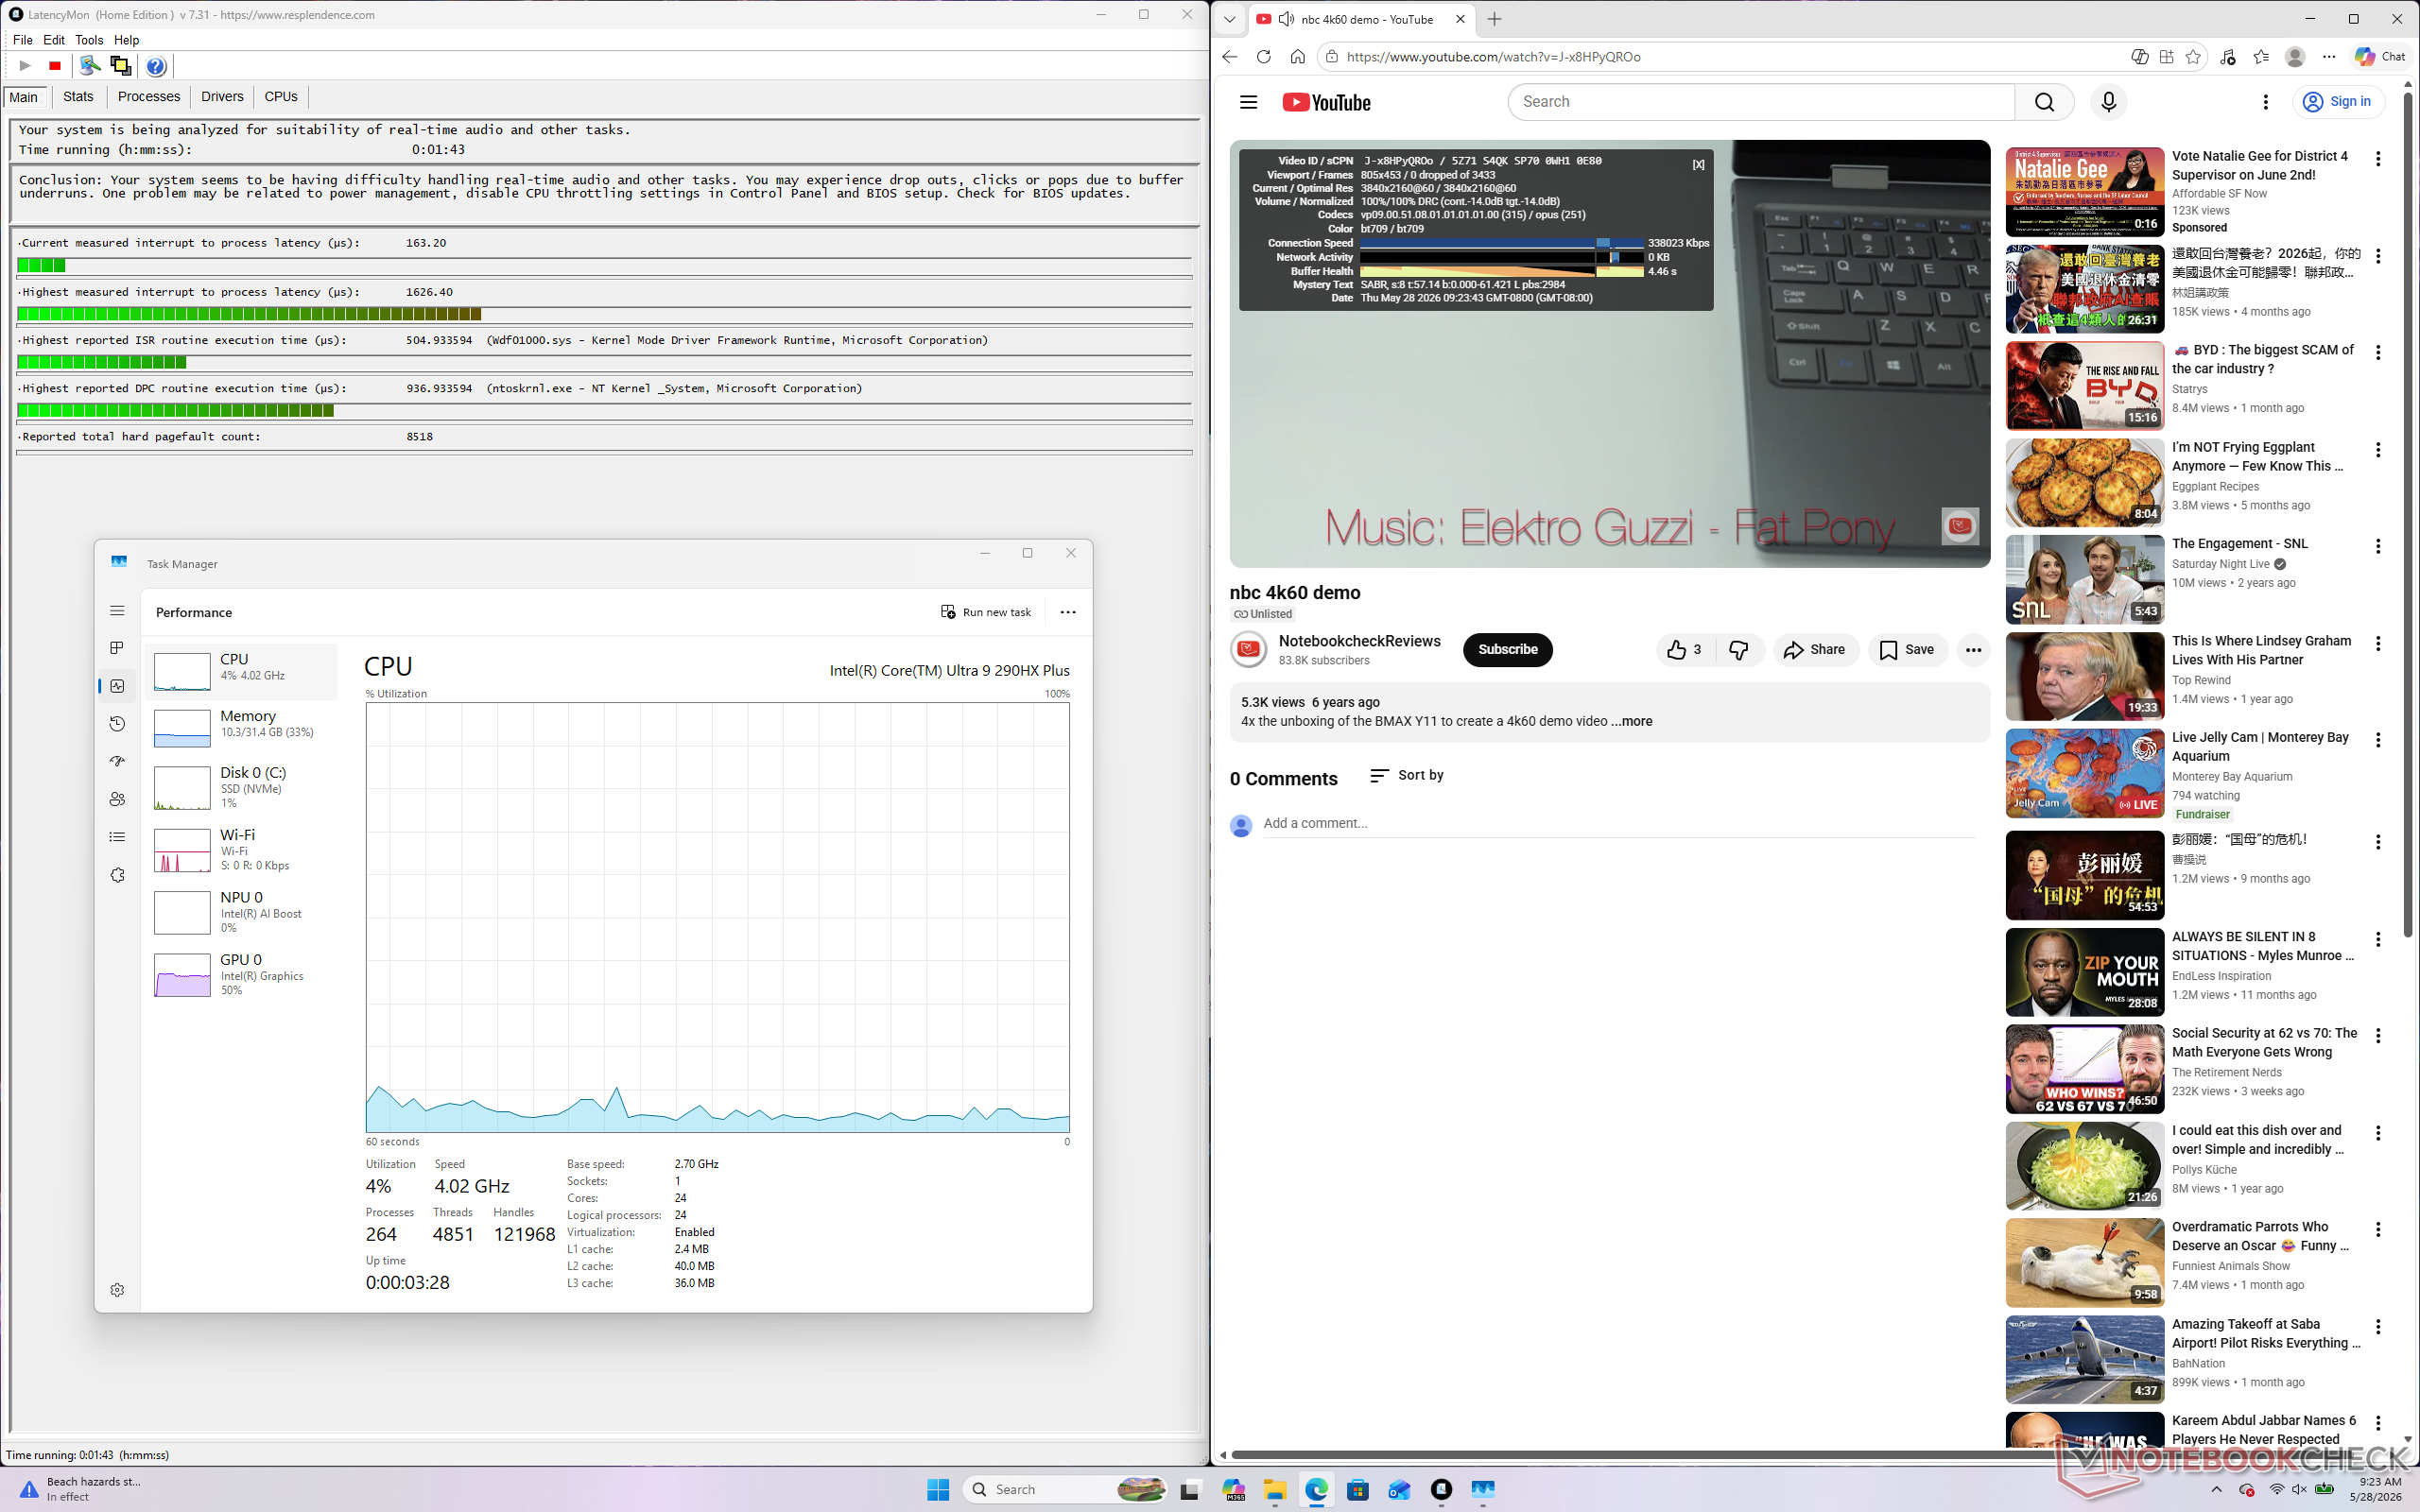
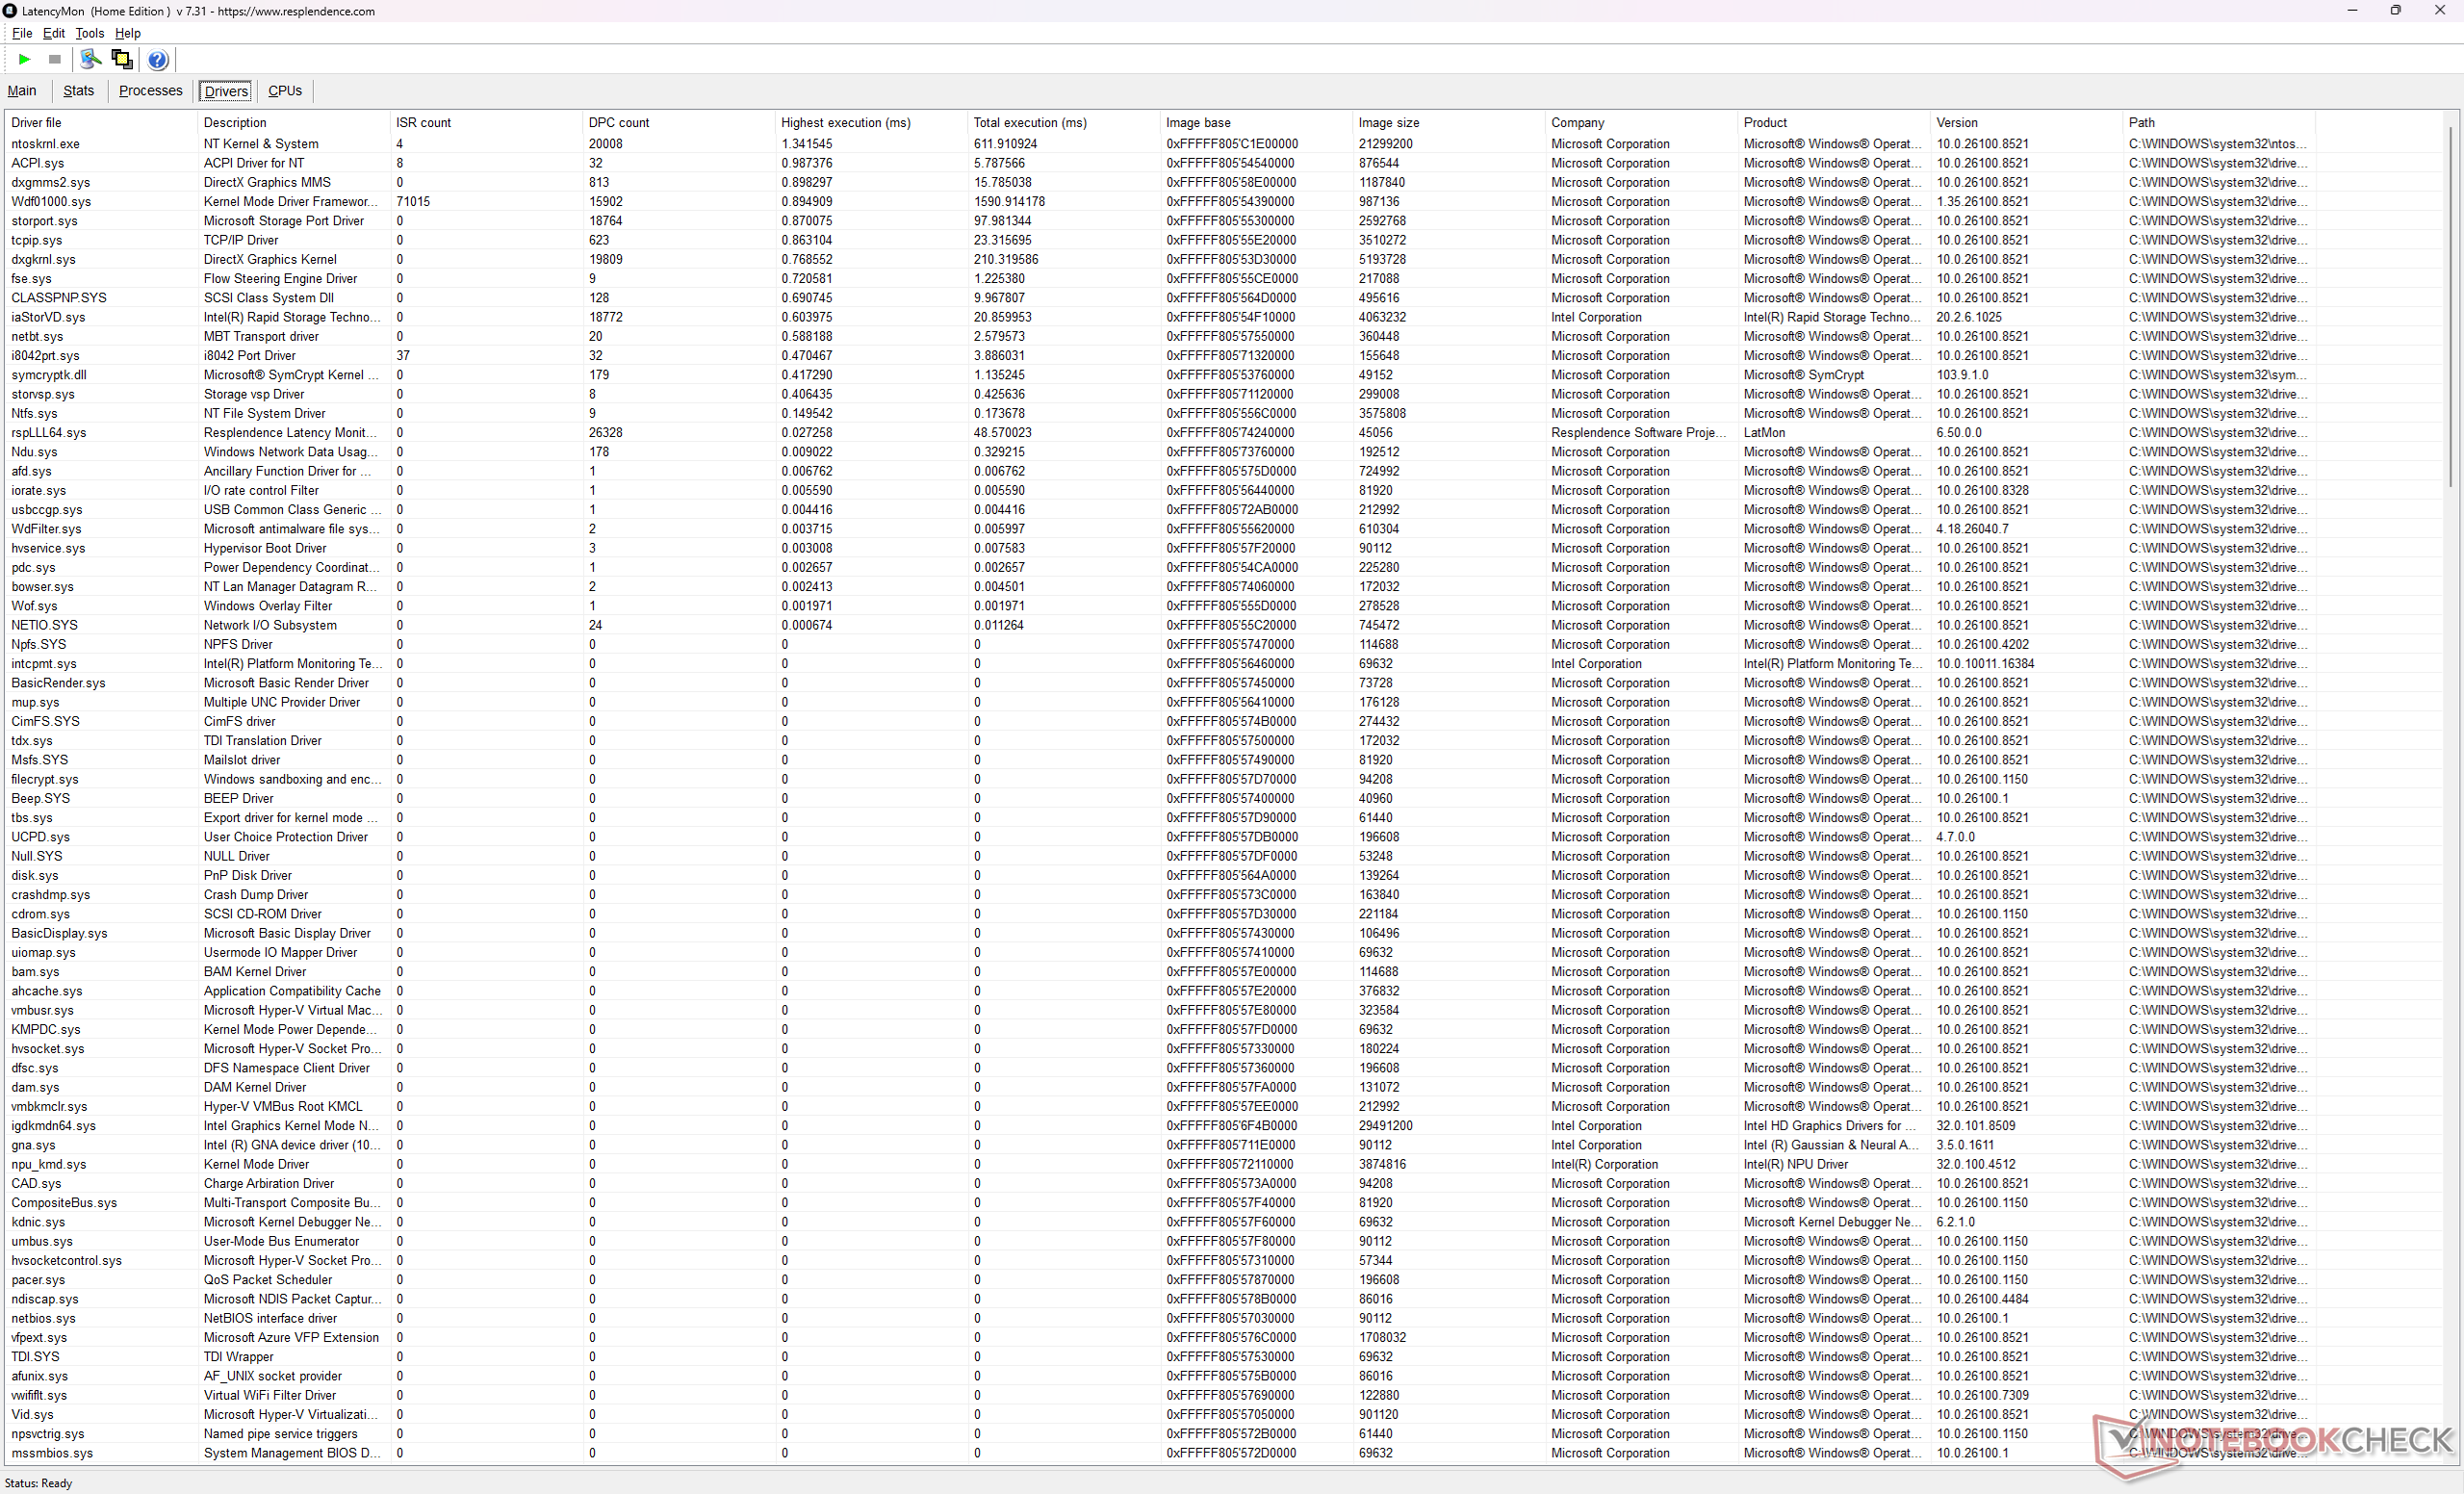
| DPC Latencies / LatencyMon - interrupt to process latency (max), Web, Youtube, Prime95 | |
| Alienware 16X Aurora Core Ultra 9 290HX Plus | |
| Razer Blade 16 Core Ultra 9 386H | |
| MSI Raider 16 Max HX B2WJ | |
| MSI Crosshair 16 HX AI D2XWGKG | |
| Lenovo Legion 7 16IAX10 | |
| Asus TUF Gaming A16 FA608UP | |
* ... smaller is better
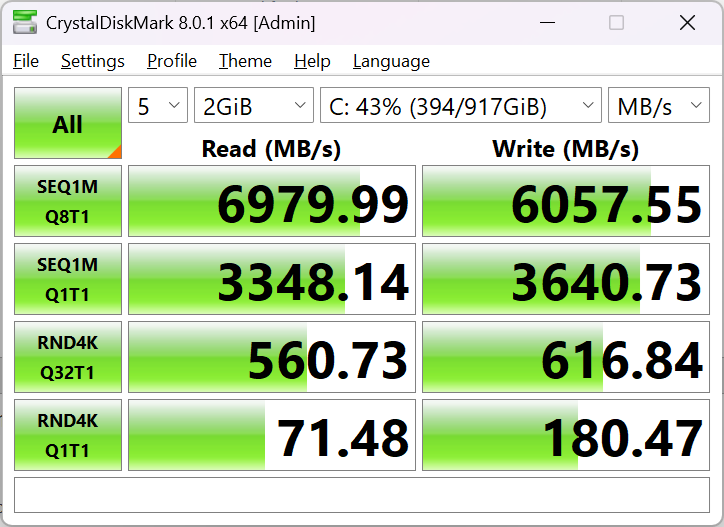
Storage Devices
Our test unit ships with the same Micron 2500 PCIe4 x4 NVMe SSD as found on the Crosshair 16 HX.
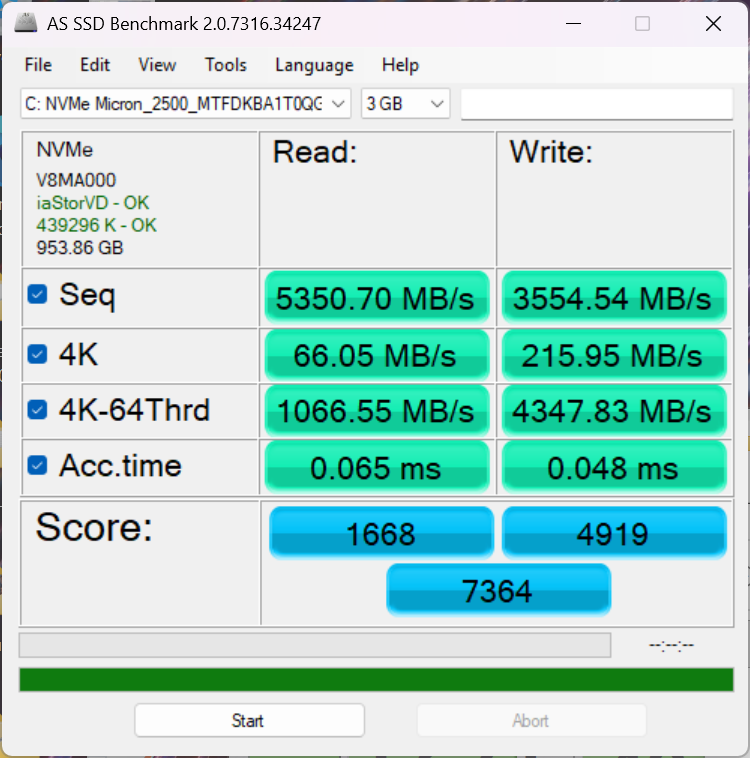

* ... smaller is better
Disk Throttling: DiskSpd Read Loop, Queue Depth 8
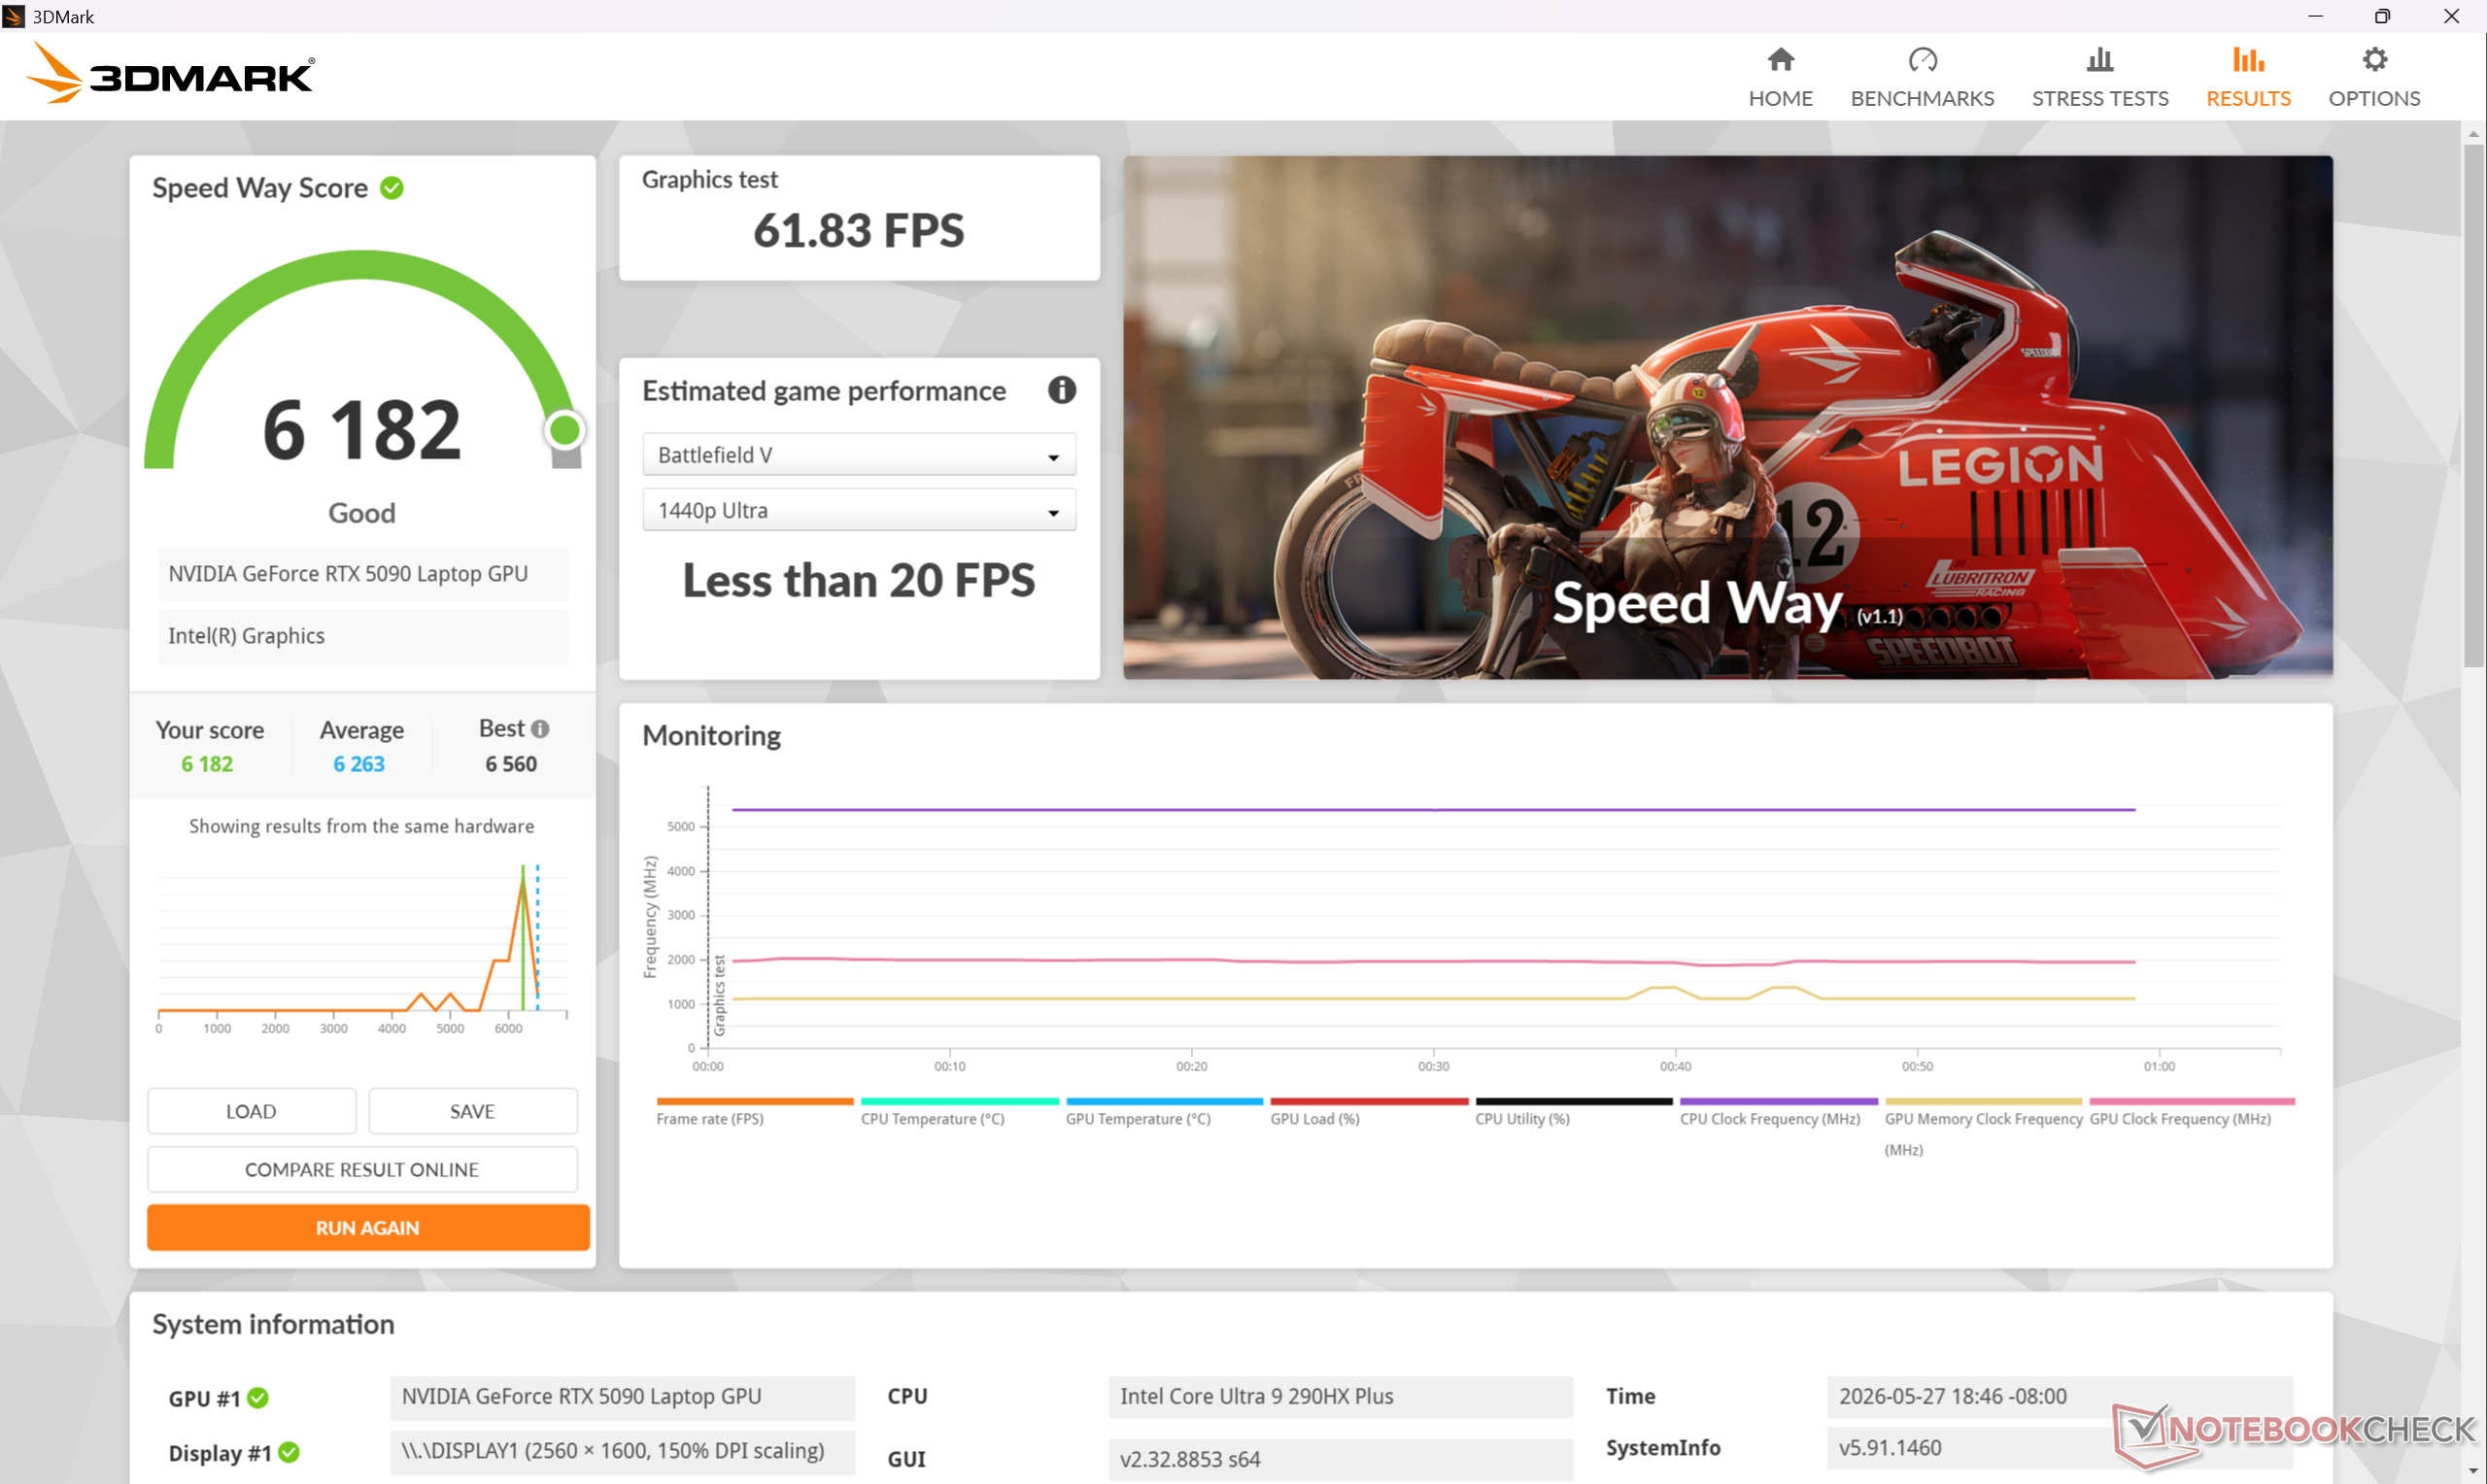
GPU Performance
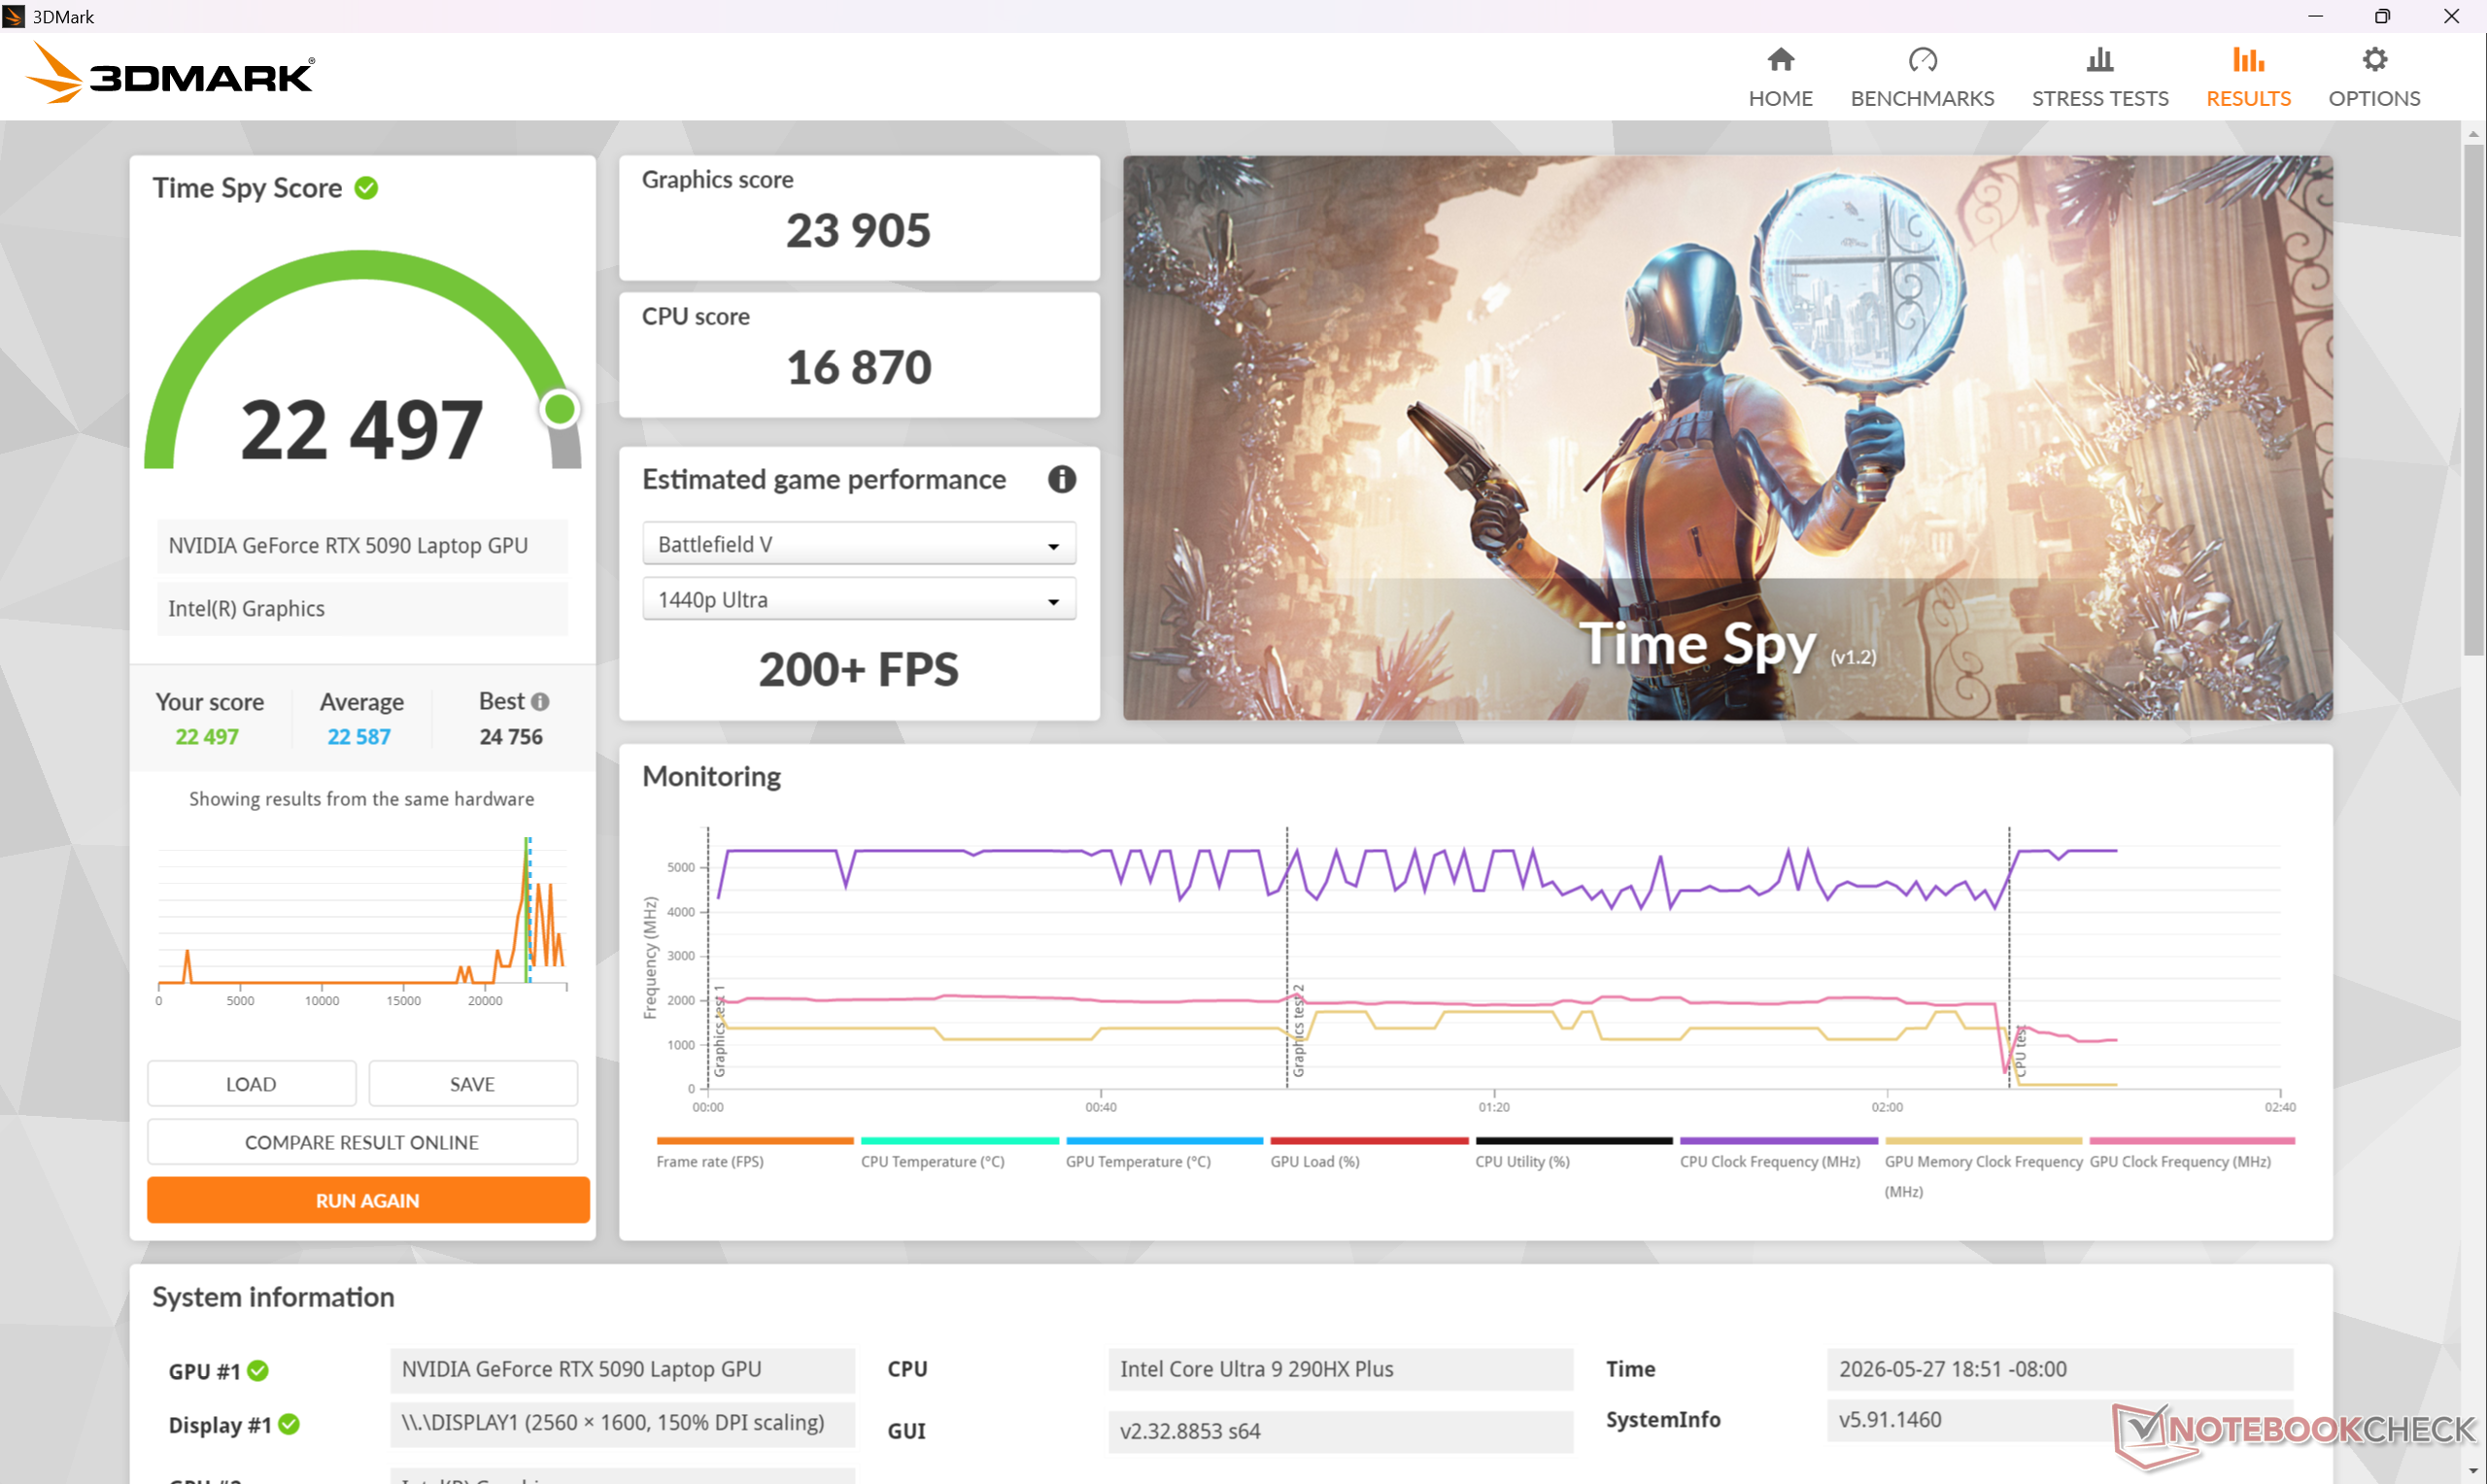
Running the system on Apex mode or Cooler Boost mode (i.e., maximum fan noise mode) is the only way to get the most processing power from both the CPU and GeForce RTX 5090 GPU as shown by our Time Spy results table below. Dropping down to the quieter Balanced mode reduces overall performance by roughly 10 percent.
| Power Profile | Graphics Score | Physics Score | Combined Score |
| Cooler Boost Mode | 26009 | 16635 | 23981 |
| Apex Mode | 25594 (-2%) | 16938 (-2%) | 23771 (-1%) |
| Extreme Performance Mode | 23905 (-8%) | 16870 (-1%) | 22497 (-6%) |
| Balanced Mode | 23572 (-9%) | 14462 (-13%) | 21536 (-10%) |
| Power Saver | 18192 (-30%) | 13786 (-17%) | 17912 (-25%) |
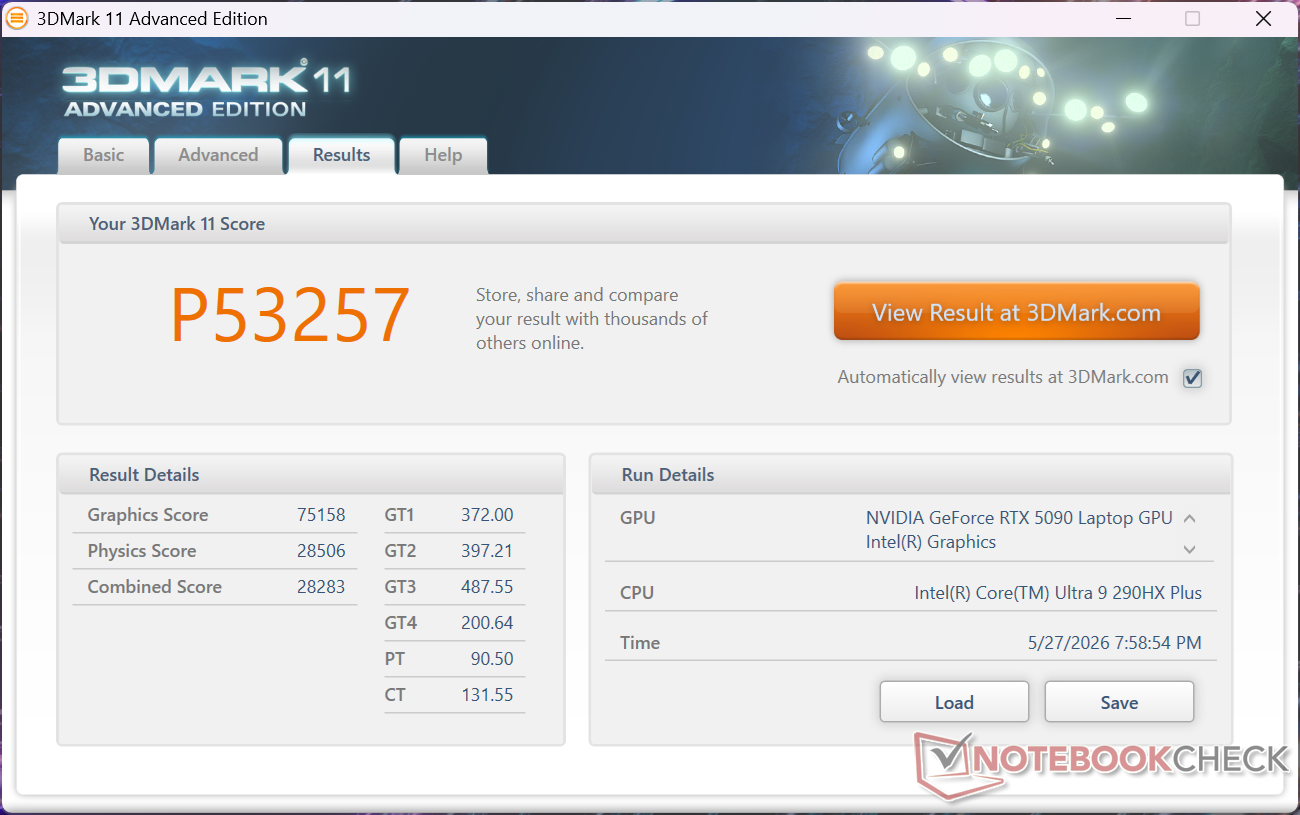
| 3DMark 11 Performance | 53257 points | |
| 3DMark Cloud Gate Standard Score | 77700 points | |
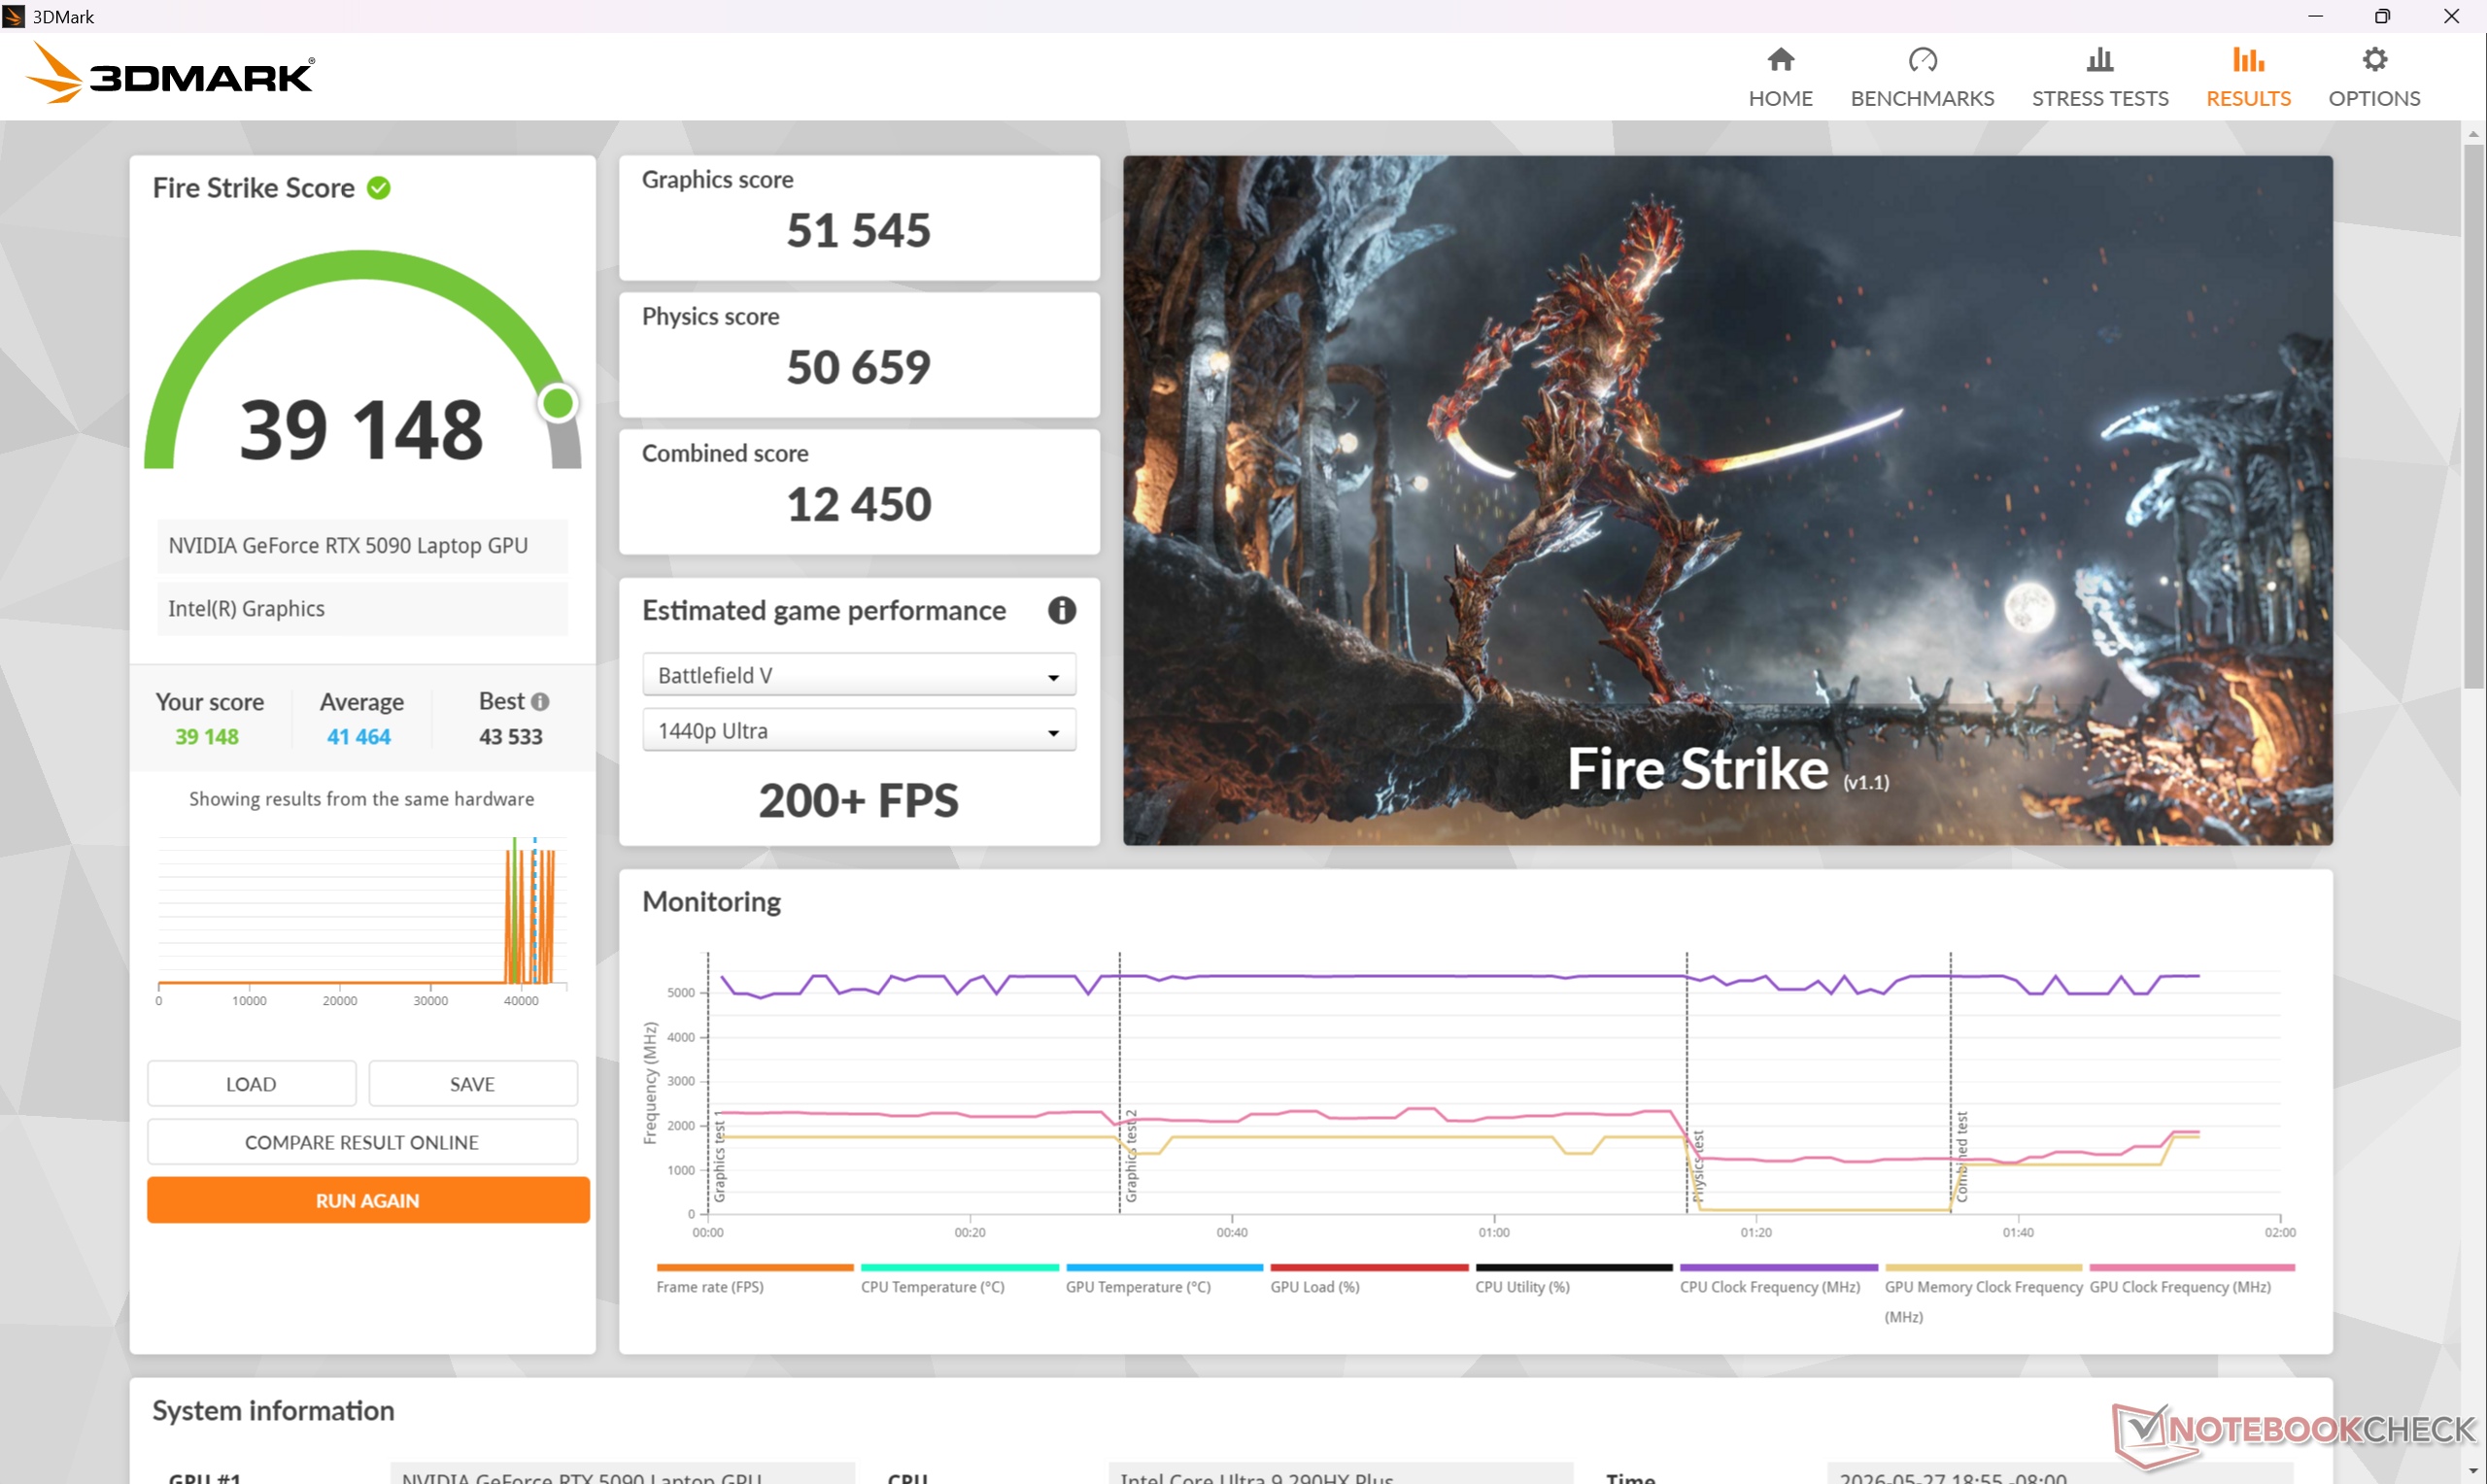
| 3DMark Fire Strike Score | 39148 points | |
| 3DMark Time Spy Score | 22497 points | |
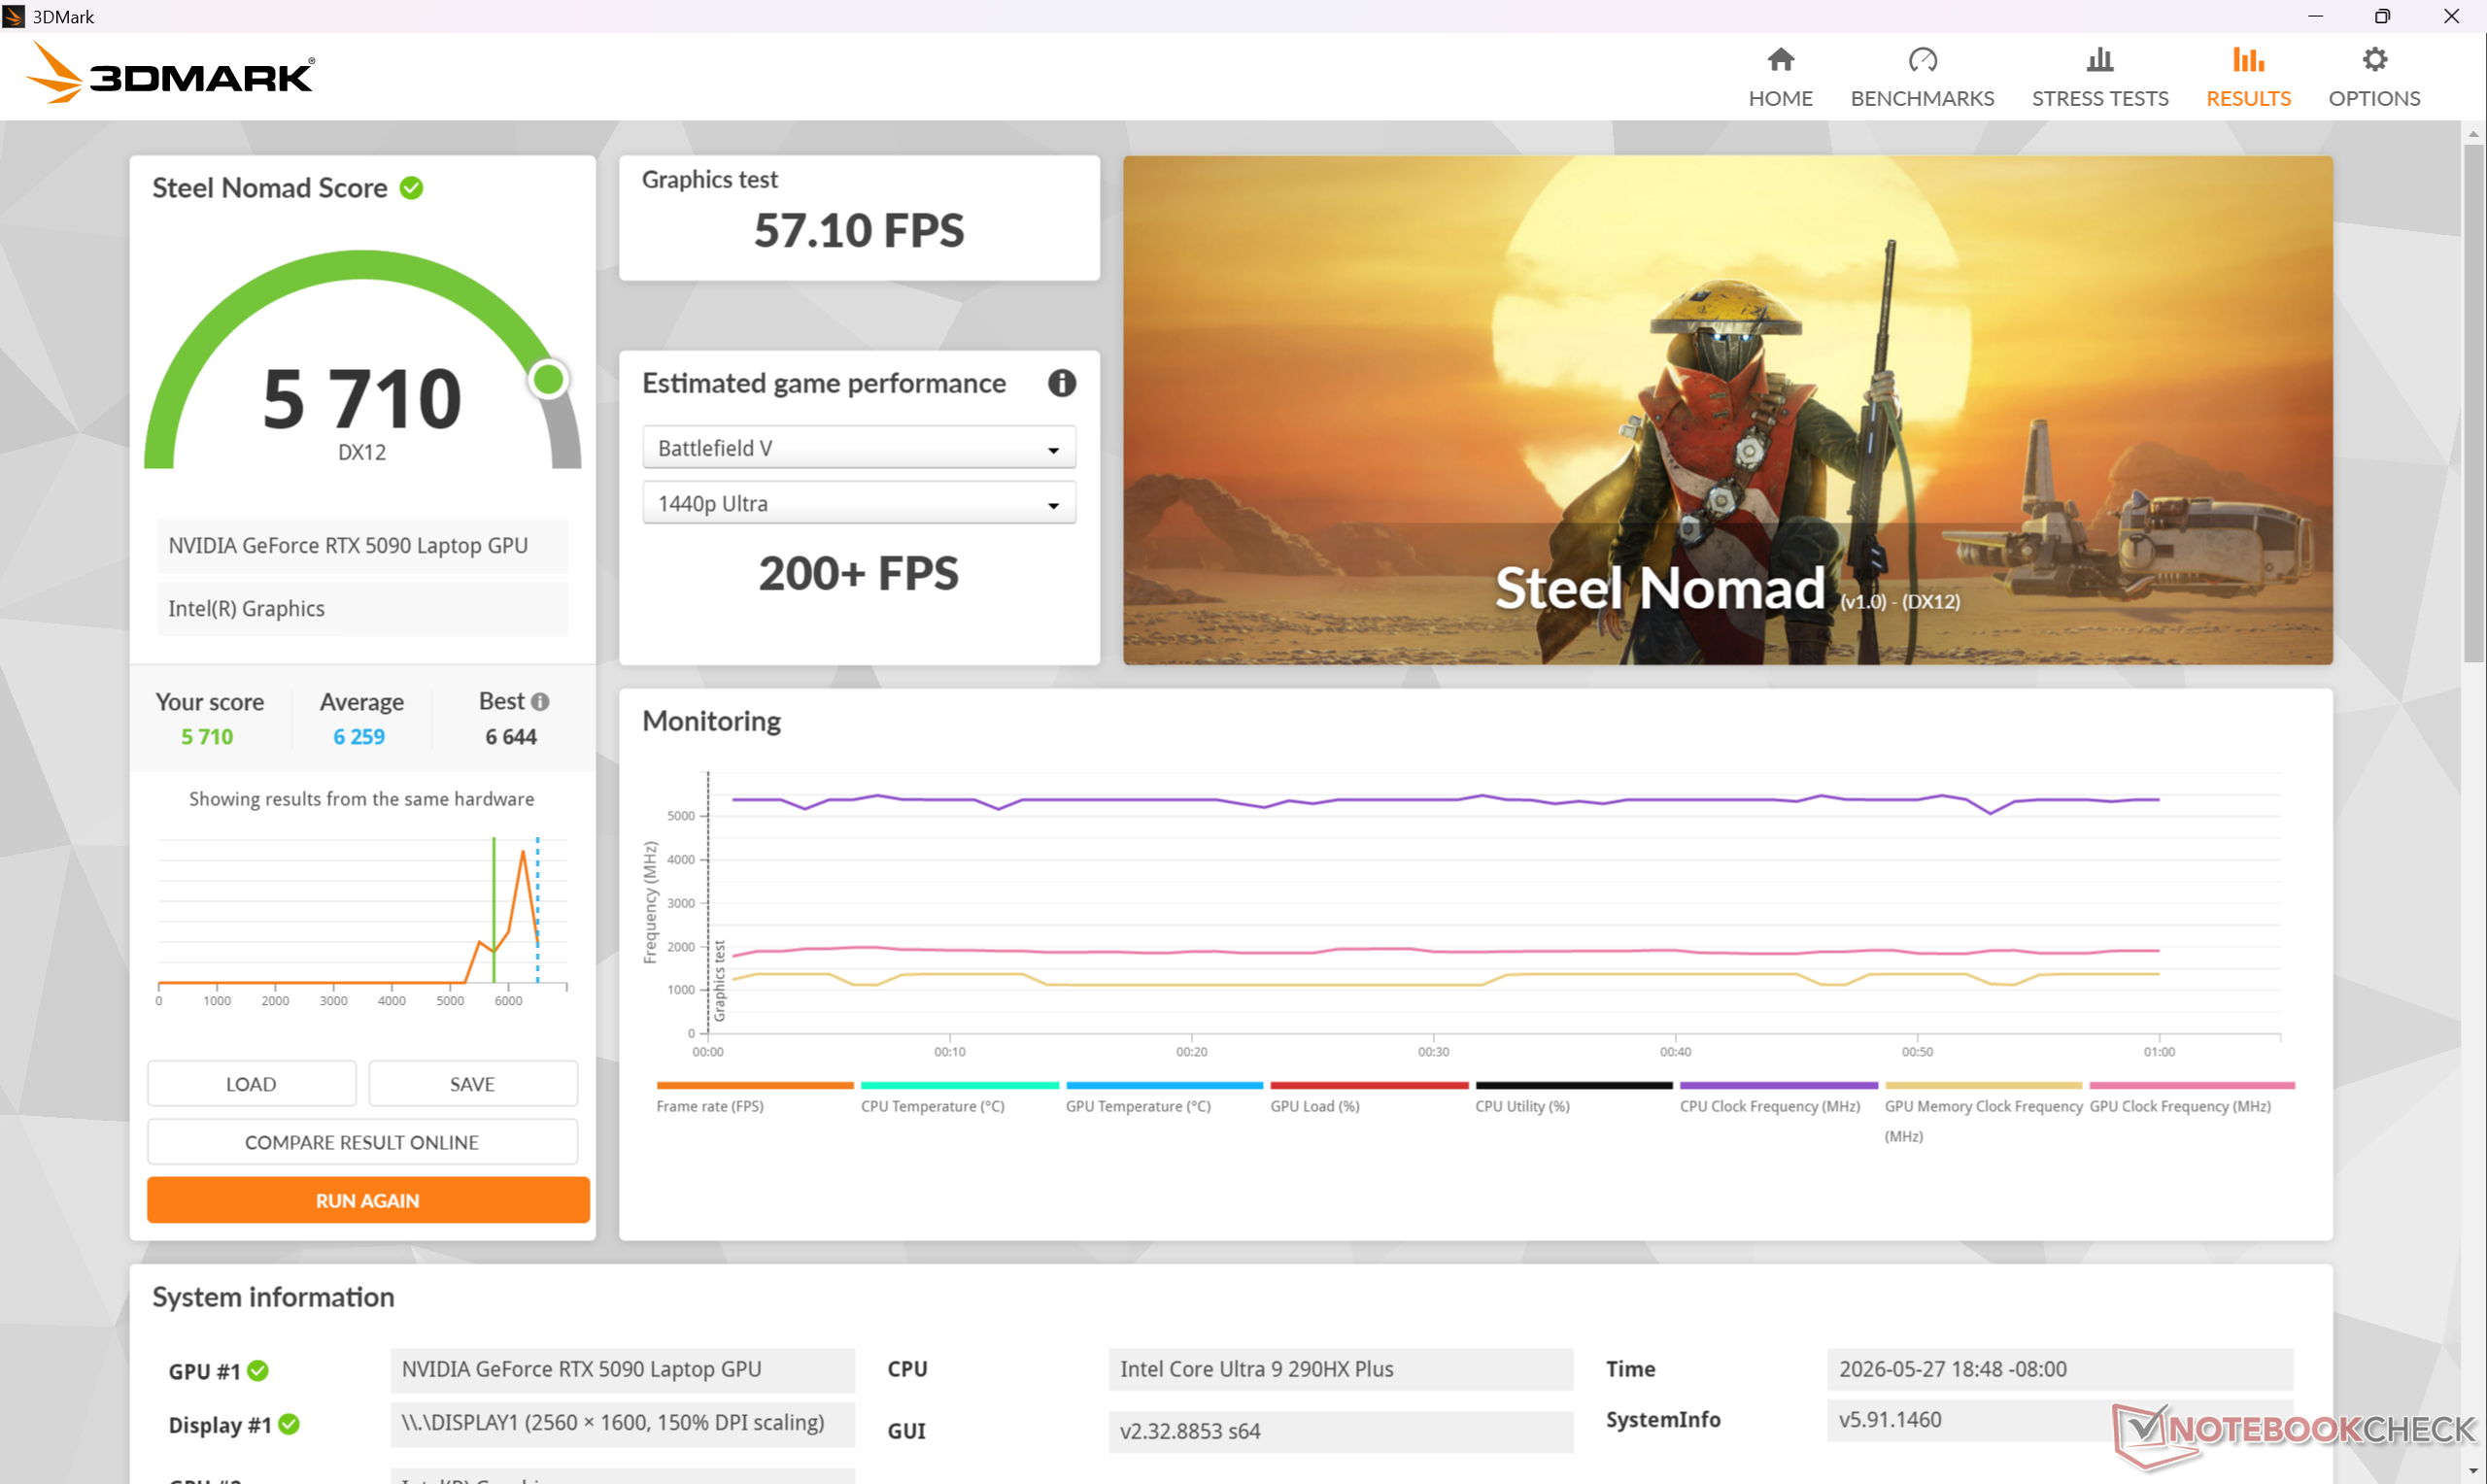
| 3DMark Steel Nomad Score | 5710 points | |
Help | ||
* ... smaller is better
Gaming Performance
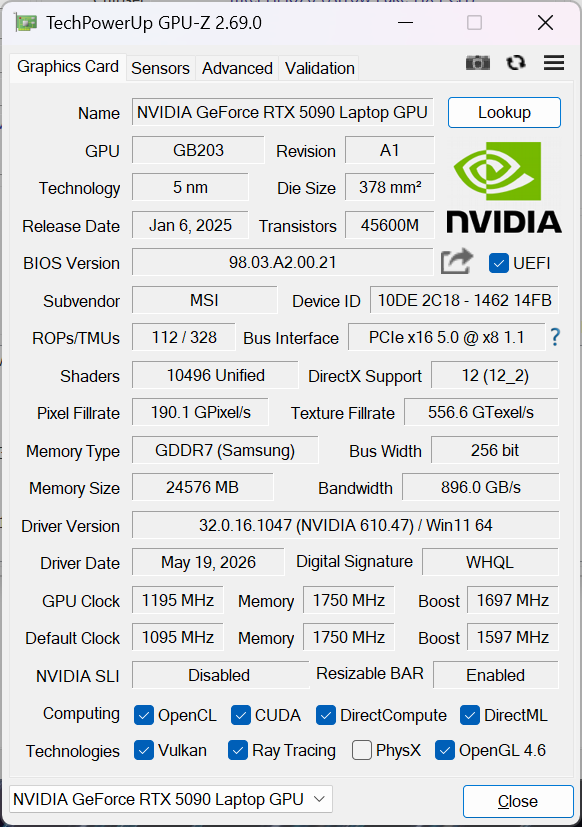
The mobile GeForce RTX 5090 arguably pairs better with a native 1600p display instead of 4K when considering that the desktop version can be two times more powerful. Keep in mind that the system must be set to Apex mode or Cooler Boost mode to fully exploit the advertised 175 W TGP.
| Cyberpunk 2077 - 1920x1080 Ultra Preset (FSR off) | |
| MSI Raider 16 Max HX B2WJ | |
| Razer Blade 16 Core Ultra 9 386H | |
| Alienware 16X Aurora Core Ultra 9 290HX Plus | |
| Asus TUF Gaming A16 FA608UP | |
| MSI Crosshair 16 HX AI D2XWGKG | |
| Lenovo Legion 7 16IAX10 | |
| Baldur's Gate 3 - 1920x1080 Ultra Preset AA:T | |
| MSI Raider 16 Max HX B2WJ | |
| Razer Blade 16 Core Ultra 9 386H | |
| Alienware 16X Aurora Core Ultra 9 290HX Plus | |
| MSI Crosshair 16 HX AI D2XWGKG | |
| Asus TUF Gaming A16 FA608UP | |
| Lenovo Legion 7 16IAX10 | |
| GTA V - 1920x1080 Highest AA:4xMSAA + FX AF:16x | |
| MSI Raider 16 Max HX B2WJ | |
| Alienware 16X Aurora Core Ultra 9 290HX Plus | |
| Lenovo Legion 7 16IAX10 | |
| MSI Crosshair 16 HX AI D2XWGKG | |
| Asus TUF Gaming A16 FA608UP | |
| Razer Blade 16 Core Ultra 9 386H | |
| Final Fantasy XV Benchmark - 1920x1080 High Quality | |
| MSI Raider 16 Max HX B2WJ | |
| Razer Blade 16 Core Ultra 9 386H | |
| Alienware 16X Aurora Core Ultra 9 290HX Plus | |
| Asus TUF Gaming A16 FA608UP | |
| MSI Crosshair 16 HX AI D2XWGKG | |
| Lenovo Legion 7 16IAX10 | |
| Strange Brigade - 1920x1080 ultra AA:ultra AF:16 | |
| MSI Raider 16 Max HX B2WJ | |
| Razer Blade 16 Core Ultra 9 386H | |
| Alienware 16X Aurora Core Ultra 9 290HX Plus | |
| MSI Crosshair 16 HX AI D2XWGKG | |
| Lenovo Legion 7 16IAX10 | |
| Asus TUF Gaming A16 FA608UP | |
| Dota 2 Reborn - 1920x1080 ultra (3/3) best looking | |
| Alienware 16X Aurora Core Ultra 9 290HX Plus | |
| MSI Raider 16 Max HX B2WJ | |
| MSI Crosshair 16 HX AI D2XWGKG | |
| Lenovo Legion 7 16IAX10 | |
| Razer Blade 16 Core Ultra 9 386H | |
| Asus TUF Gaming A16 FA608UP | |
Cyberpunk 2077 ultra FPS Chart
| low | med. | high | ultra | QHD DLSS | QHD | 4K DLSS | 4K | |
|---|---|---|---|---|---|---|---|---|
| GTA V (2015) | 191.4 | 190.9 | 187.5 | 165.2 | 162.3 | 181.5 | ||
| Dota 2 Reborn (2015) | 225 | 206 | 189.6 | 176.1 | 160 | |||
| Final Fantasy XV Benchmark (2018) | 234 | 236 | 205 | 171.3 | 96.3 | |||
| X-Plane 11.11 (2018) | 154.8 | 138 | 112.6 | 93.8 | ||||
| Strange Brigade (2018) | 639 | 503 | 471 | 433 | 329 | 179.6 | ||
| Baldur's Gate 3 (2023) | 287 | 242 | 211 | 207 | 202 | 147.7 | 125.9 | 83.1 |
| Cyberpunk 2077 (2023) | 199.4 | 196.6 | 177.3 | 161.7 | 122.7 | 111.2 | 61 | 50.4 |
| F1 24 (2024) | 353 | 379 | 364 | 153.8 | 154.1 | 99.8 | 85.3 | 50.5 |
| Black Myth: Wukong (2024) | 122 | 97 | 58 | 65 | 45 | 46 | 27 | |
| Assassin's Creed Shadows (2025) | 102 | 89 | 69 | 70 | 59 | 56 | 43 |
Emissions
System Noise
Fan noise is intimately tied to the five power profile settings in order from lowest to highest performance: Eco, Balanced, Extreme Performance, Apex, and Cooler Boost. When running Cyberpunk 2077 on these profiles, fan noise tends to stabilize at 36.2 dB(A), 47.5 dB(A), 51.1 dB(A), 57 dB(A), and 60.2 dB(A), respectively. Pulsing behavior is generally minimal when set to Balanced mode or lower. Even so, 51.1 dB(A) when gaming on Extreme Performance mode is slightly quieter than competing models like the Lenovo Legion 7 16IAX10 or Razer Blade 16.
Noise level
| Idle |
| 26.6 / 26.7 / 26.9 dB(A) |
| Load |
| 36 / 60.2 dB(A) |
 | ||
30 dB silent 40 dB(A) audible 50 dB(A) loud |
||
min: | ||
| MSI Raider 16 Max HX B2WJ Ultra 9 290HX Plus, GeForce RTX 5090 Laptop | MSI Crosshair 16 HX AI D2XWGKG Ultra 9 275HX, GeForce RTX 5070 Laptop | Razer Blade 16 Core Ultra 9 386H Ultra 9 386H, GeForce RTX 5090 Laptop | Alienware 16X Aurora Core Ultra 9 290HX Plus Ultra 9 290HX Plus, GeForce RTX 5070 Ti Laptop | Asus TUF Gaming A16 FA608UP R7 260, GeForce RTX 5070 Laptop | Lenovo Legion 7 16IAX10 Ultra 7 255HX, GeForce RTX 5060 Laptop | |
|---|---|---|---|---|---|---|
| Noise | -11% | -1% | -4% | -11% | 1% | |
| off / environment * (dB) | 23.1 | 25.56 -11% | 23.1 -0% | 23.4 -1% | 25.1 -9% | 23.9 -3% |
| Idle Minimum * (dB) | 26.6 | 28.3 -6% | 23.4 12% | 23.8 11% | 32.2 -21% | 24 10% |
| Idle Average * (dB) | 26.7 | 28.3 -6% | 25.4 5% | 23.8 11% | 32.2 -21% | 26 3% |
| Idle Maximum * (dB) | 26.9 | 28.3 -5% | 29.3 -9% | 31.4 -17% | 32.2 -20% | 29.4 -9% |
| Load Average * (dB) | 36 | 50.26 -40% | 42.6 -18% | 48.7 -35% | 38.1 -6% | 35.4 2% |
| Cyberpunk 2077 ultra * (dB) | 51.1 | 57.8 -13% | 53.6 -5% | 51.5 -1% | 53.9 -5% | 54.6 -7% |
| Load Maximum * (dB) | 60.2 | 57.95 4% | 53.7 11% | 59.8 1% | 57.1 5% | 54.7 9% |
* ... smaller is better
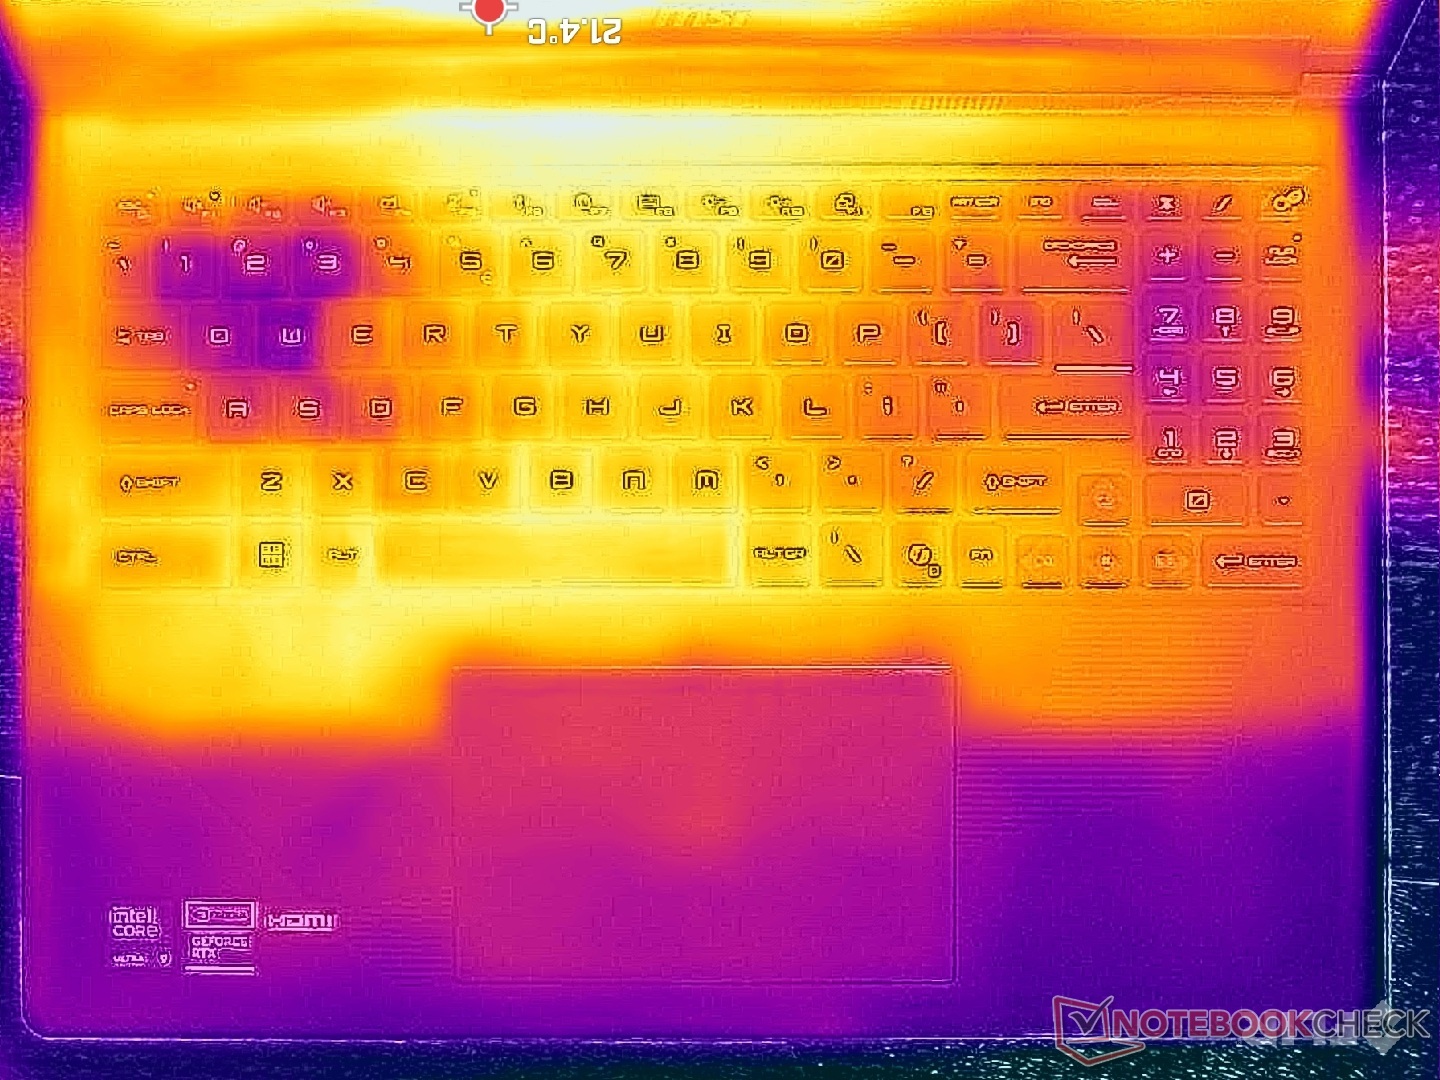
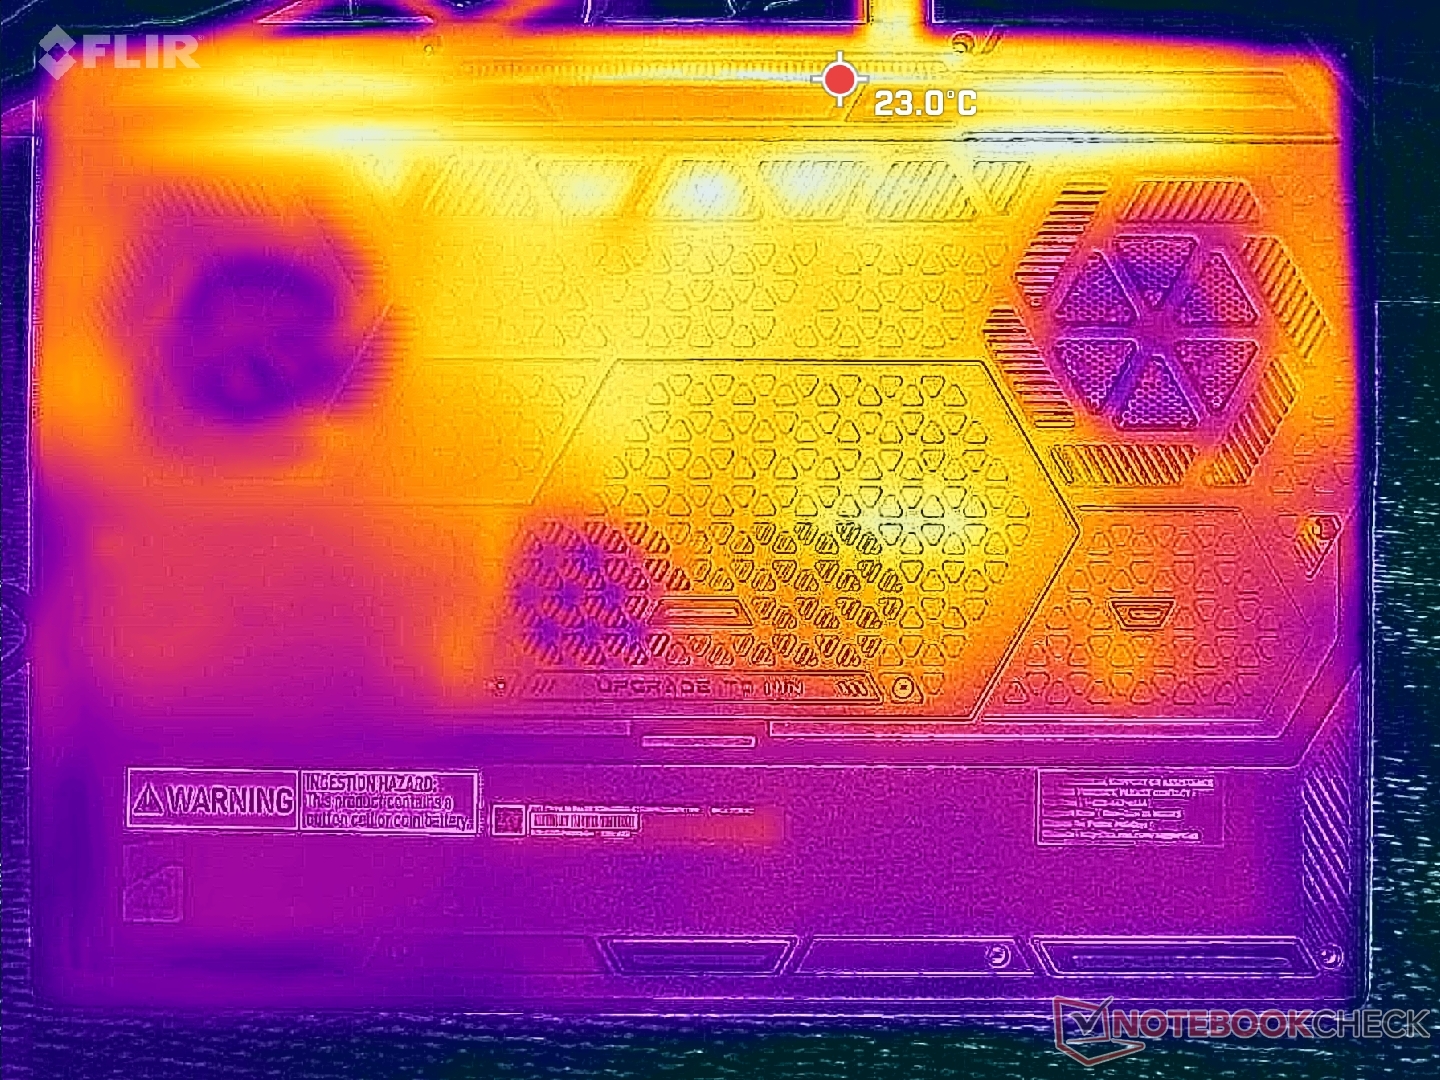
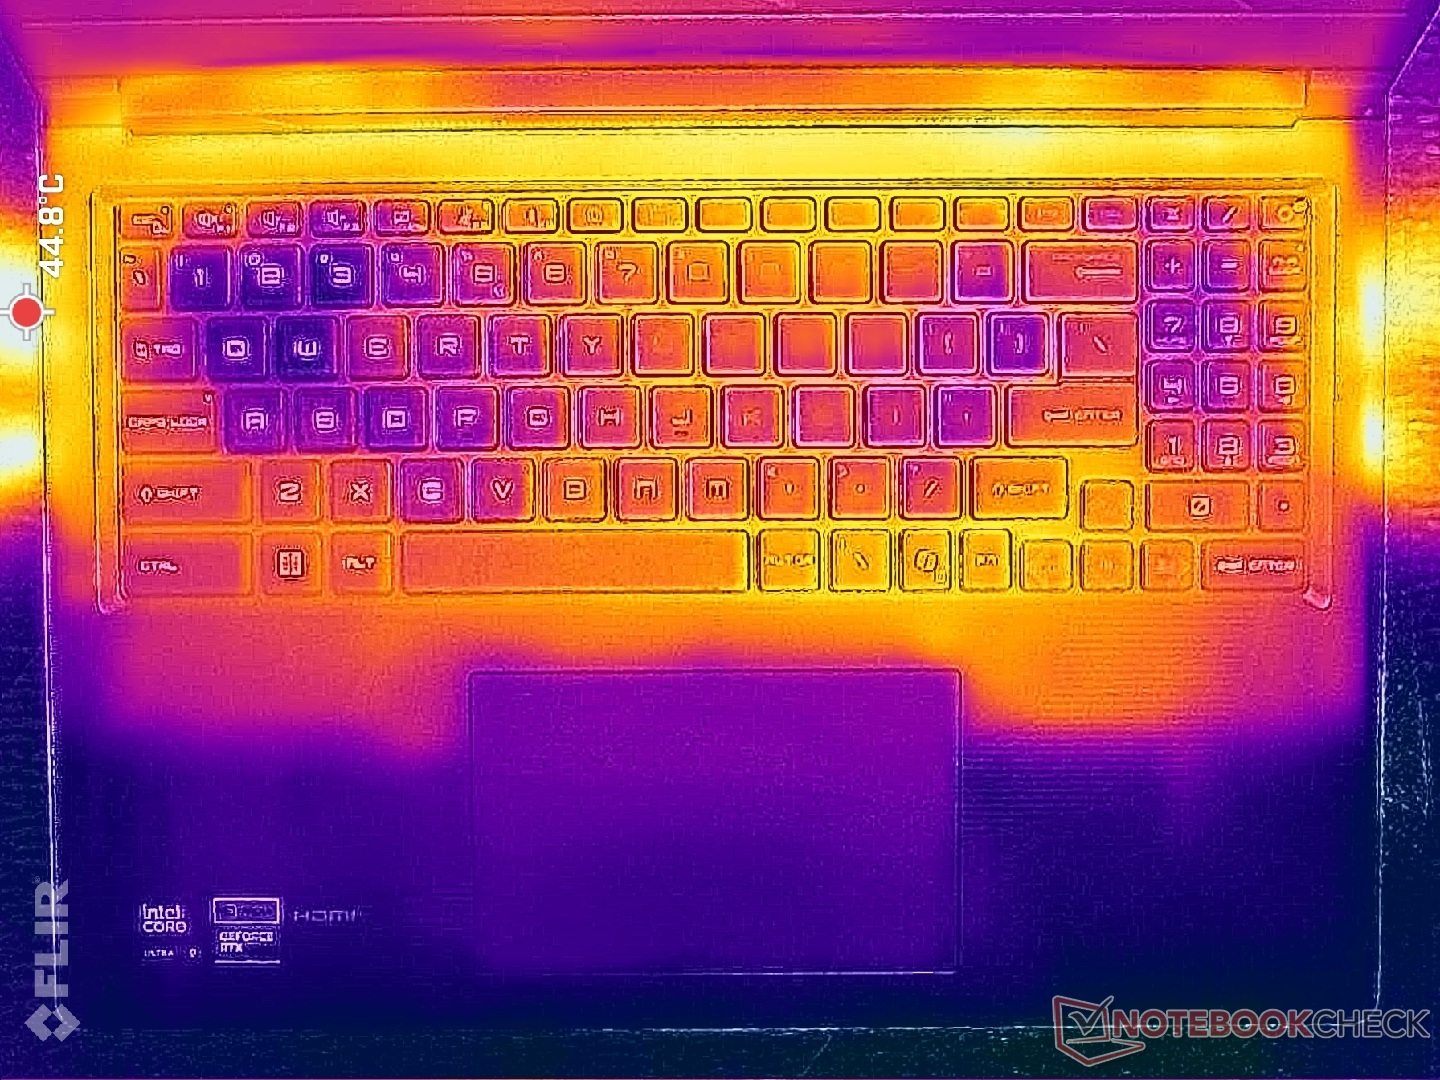
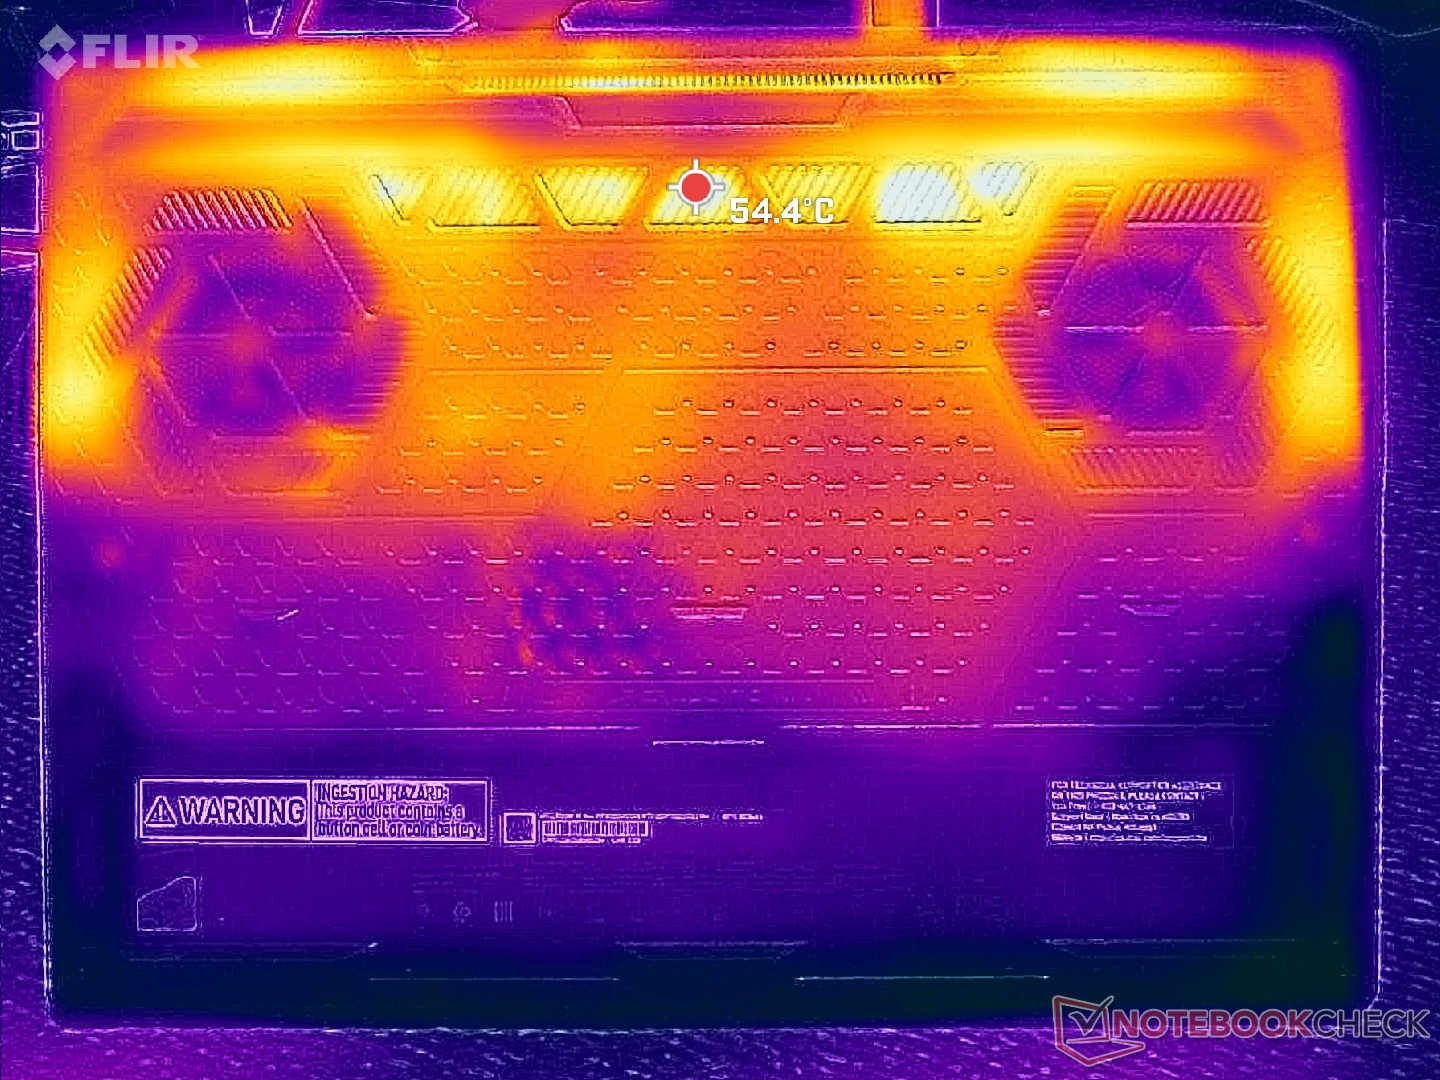
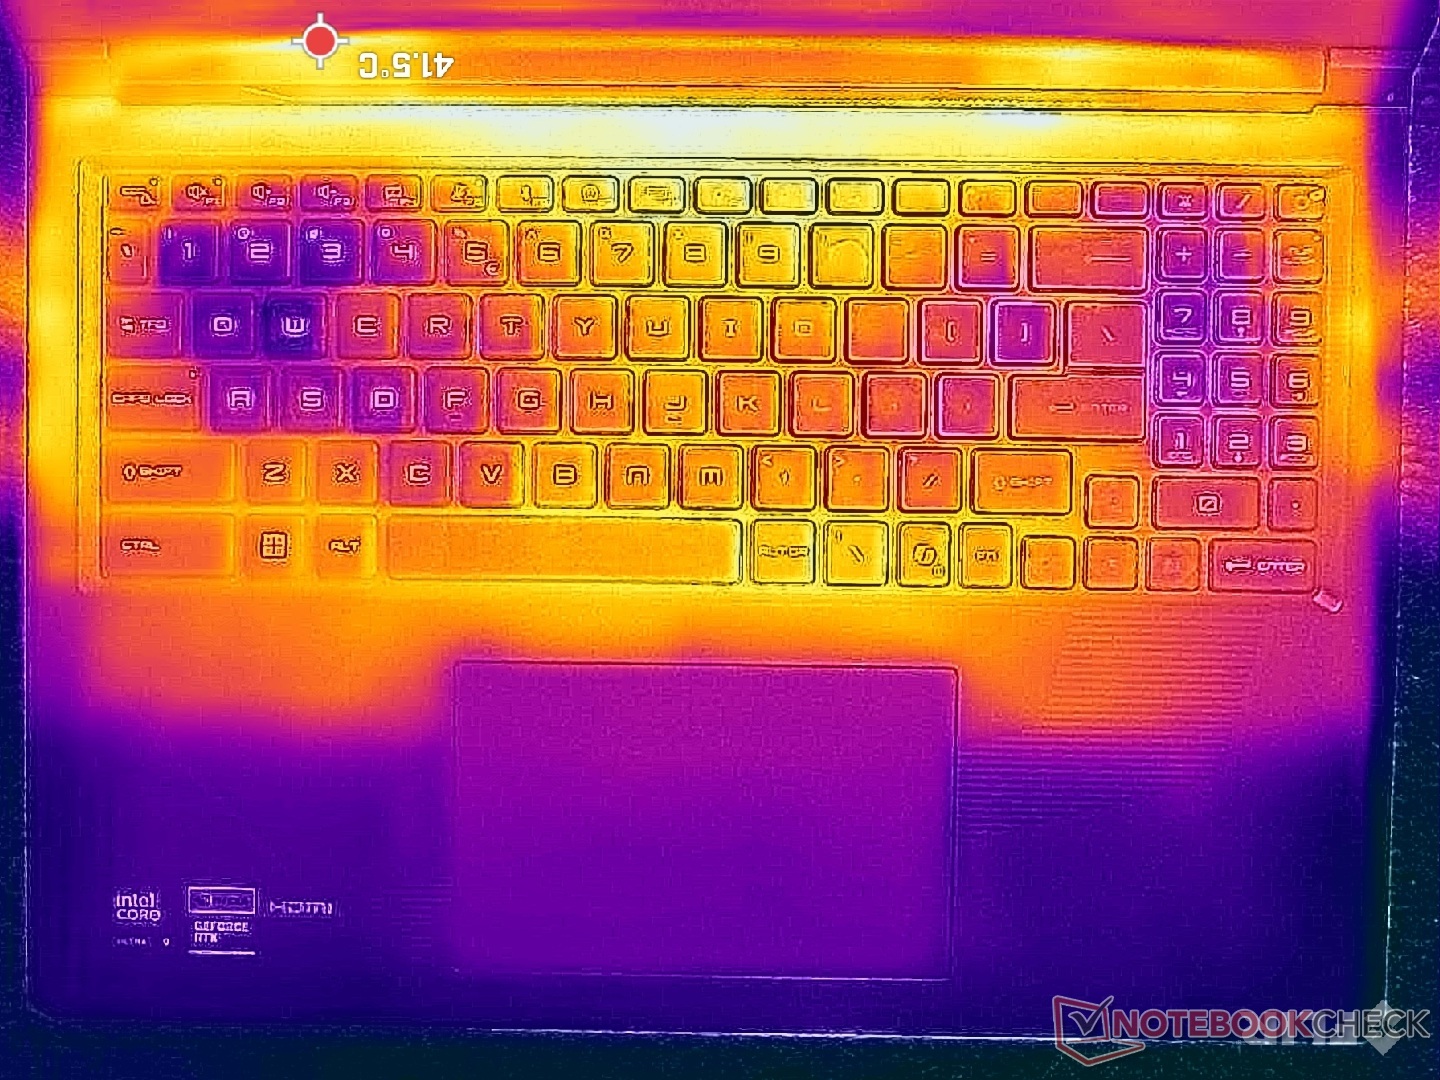
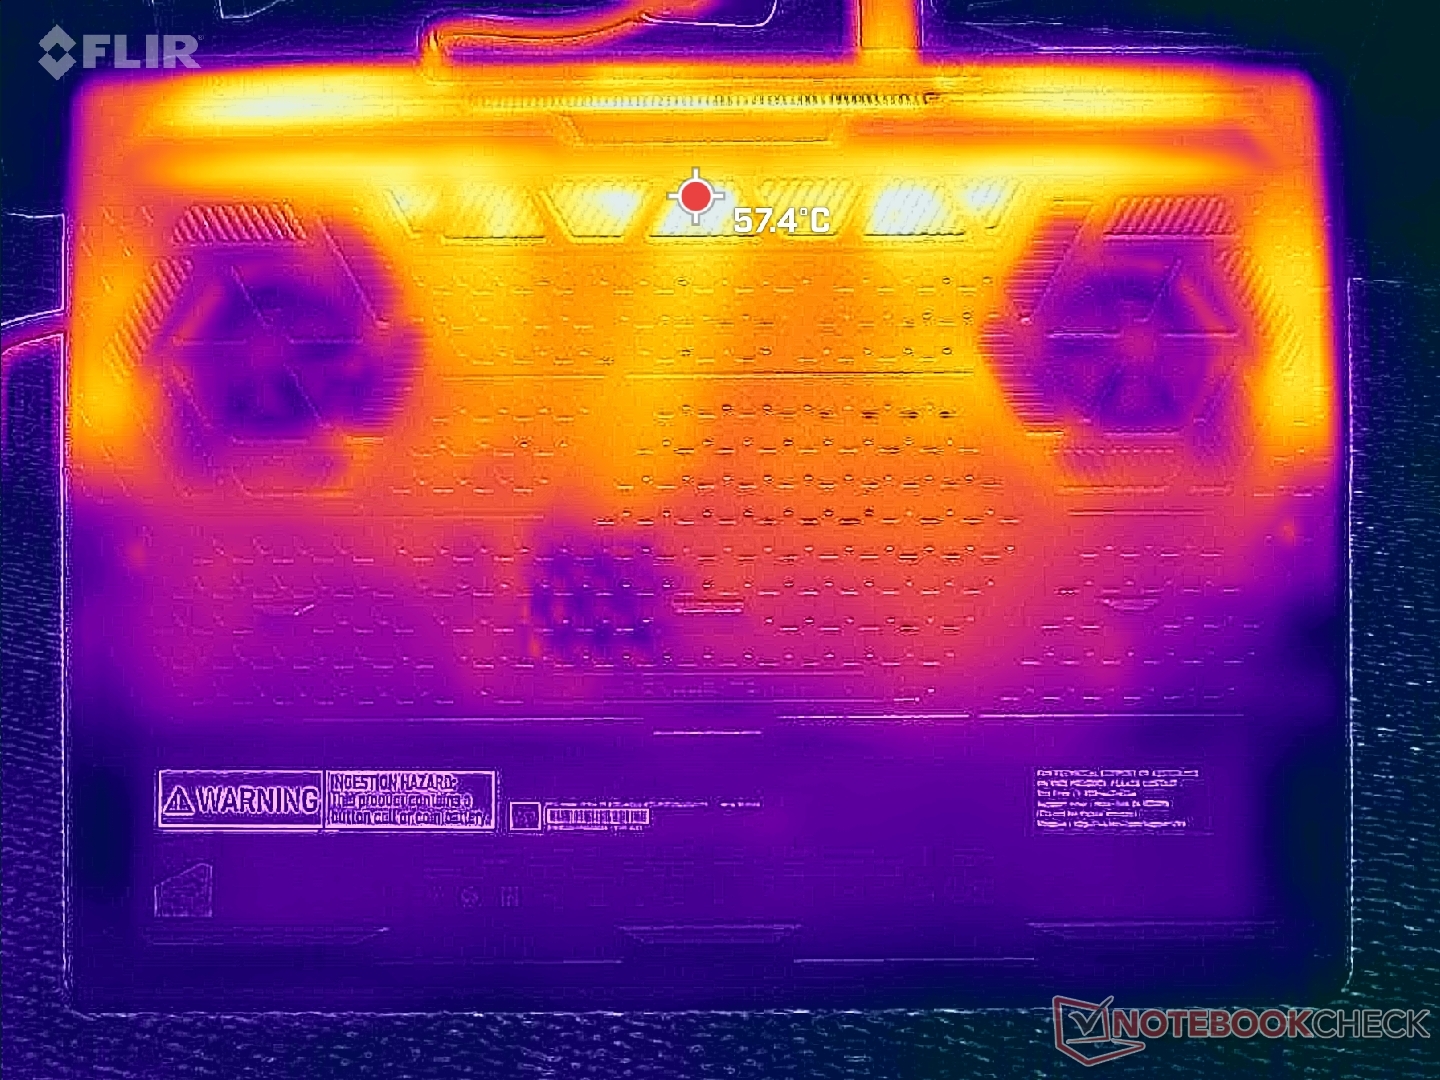
Temperature
Surface temperature hot spots would reach 44 C and 46 C on the keyboard deck and bottom cover, respectively, which is a few degrees C cooler than what we observed on the thinner Razer Blade 16.
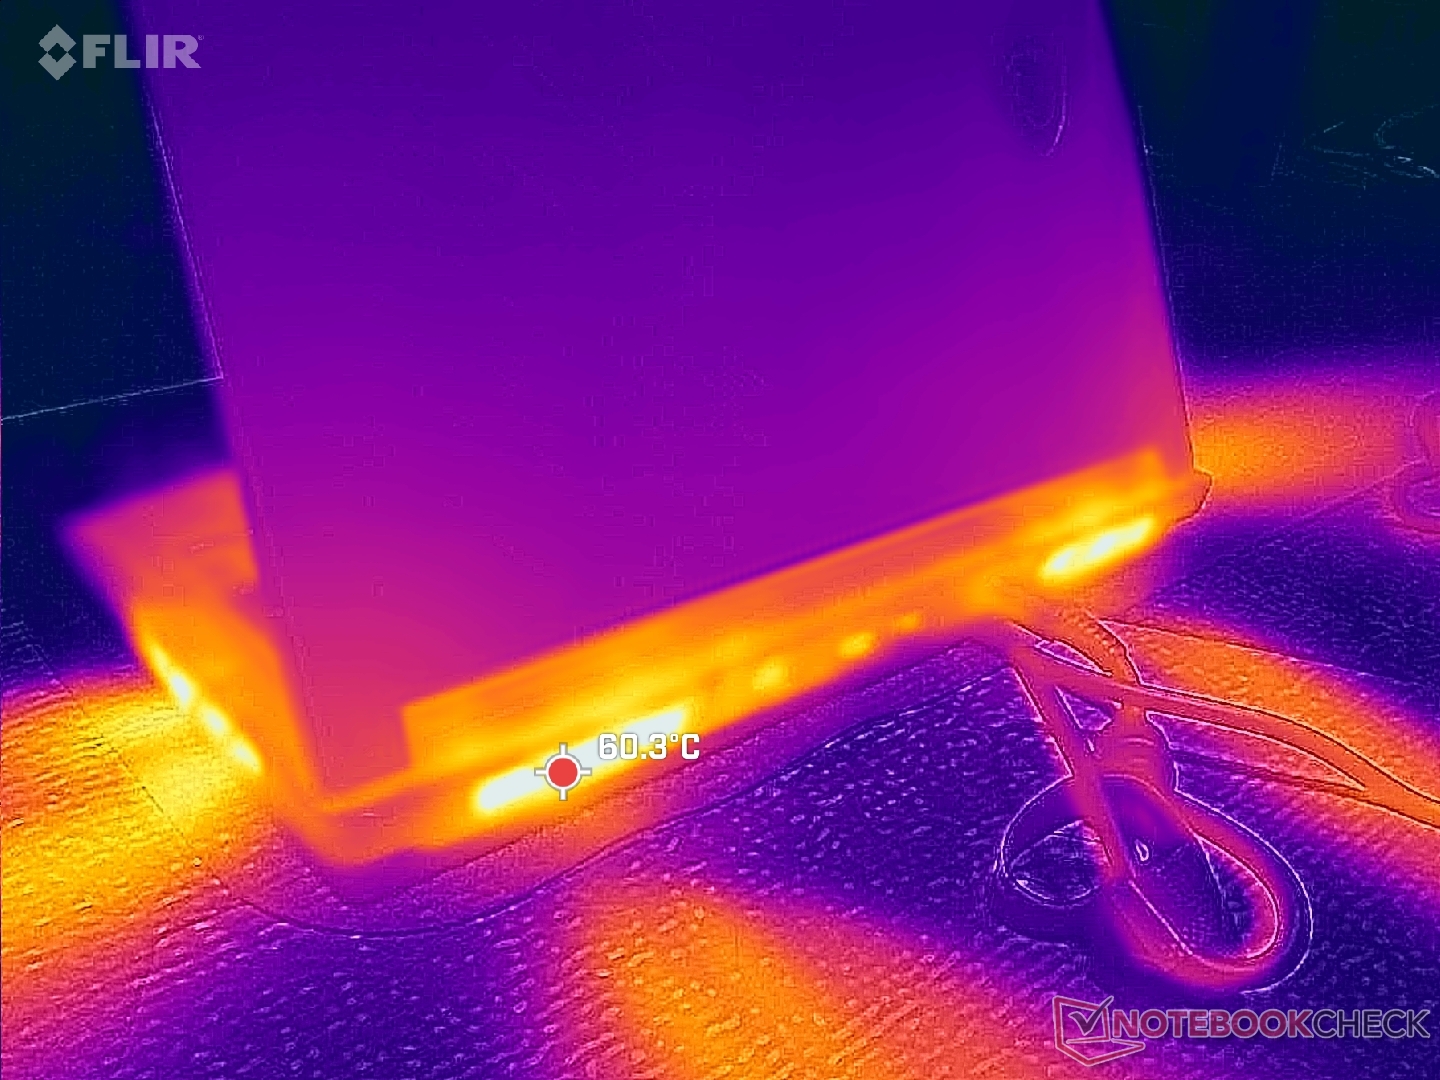

(±) The maximum temperature on the upper side is 43.2 °C / 110 F, compared to the average of 40.4 °C / 105 F, ranging from 21.2 to 68.8 °C for the class Gaming.
(-) The bottom heats up to a maximum of 45.6 °C / 114 F, compared to the average of 43.2 °C / 110 F
(+) In idle usage, the average temperature for the upper side is 26.1 °C / 79 F, compared to the device average of 33.9 °C / 93 F.
(±) 3: The average temperature for the upper side is 34.1 °C / 93 F, compared to the average of 33.9 °C / 93 F for the class Gaming.
(+) The palmrests and touchpad are reaching skin temperature as a maximum (33.6 °C / 92.5 F) and are therefore not hot.
(-) The average temperature of the palmrest area of similar devices was 28.8 °C / 83.8 F (-4.8 °C / -8.7 F).
| MSI Raider 16 Max HX B2WJ Ultra 9 290HX Plus, GeForce RTX 5090 Laptop | MSI Crosshair 16 HX AI D2XWGKG Ultra 9 275HX, GeForce RTX 5070 Laptop | Razer Blade 16 Core Ultra 9 386H Ultra 9 386H, GeForce RTX 5090 Laptop | Alienware 16X Aurora Core Ultra 9 290HX Plus Ultra 9 290HX Plus, GeForce RTX 5070 Ti Laptop | Asus TUF Gaming A16 FA608UP R7 260, GeForce RTX 5070 Laptop | Lenovo Legion 7 16IAX10 Ultra 7 255HX, GeForce RTX 5060 Laptop | |
|---|---|---|---|---|---|---|
| Heat | -3% | -17% | 2% | 8% | -14% | |
| Maximum Upper Side * (°C) | 43.2 | 44.8 -4% | 45.6 -6% | 48.2 -12% | 39.5 9% | 47 -9% |
| Maximum Bottom * (°C) | 45.6 | 43.4 5% | 47 -3% | 41 10% | 45.1 1% | 44 4% |
| Idle Upper Side * (°C) | 27.8 | 31.2 -12% | 35.2 -27% | 28.2 -1% | 25.7 8% | 35.6 -28% |
| Idle Bottom * (°C) | 29 | 28.8 1% | 37.6 -30% | 26.2 10% | 25.5 12% | 35.2 -21% |
* ... smaller is better
Stress Test
The CPU would boost to 4.5 GHz, 215 W, and 105 C for approximately a minute after initiating Prime95 stress. It would then fall to 3.9 GHz and ~152 W to maintain a more manageable core temperature of 96 C. The Alienware 16 Area-51, which ships with the exact same CPU as our MSI, would also stabilize at the high 90 C range when under similar conditions to suggest that the Core Ultra 9 290HX Plus is one of the warmest-running mobile CPUs in the market.
Note the steadily increasing average GPU clock rates when changing to faster power profiles as shown by the screenshots and table below.
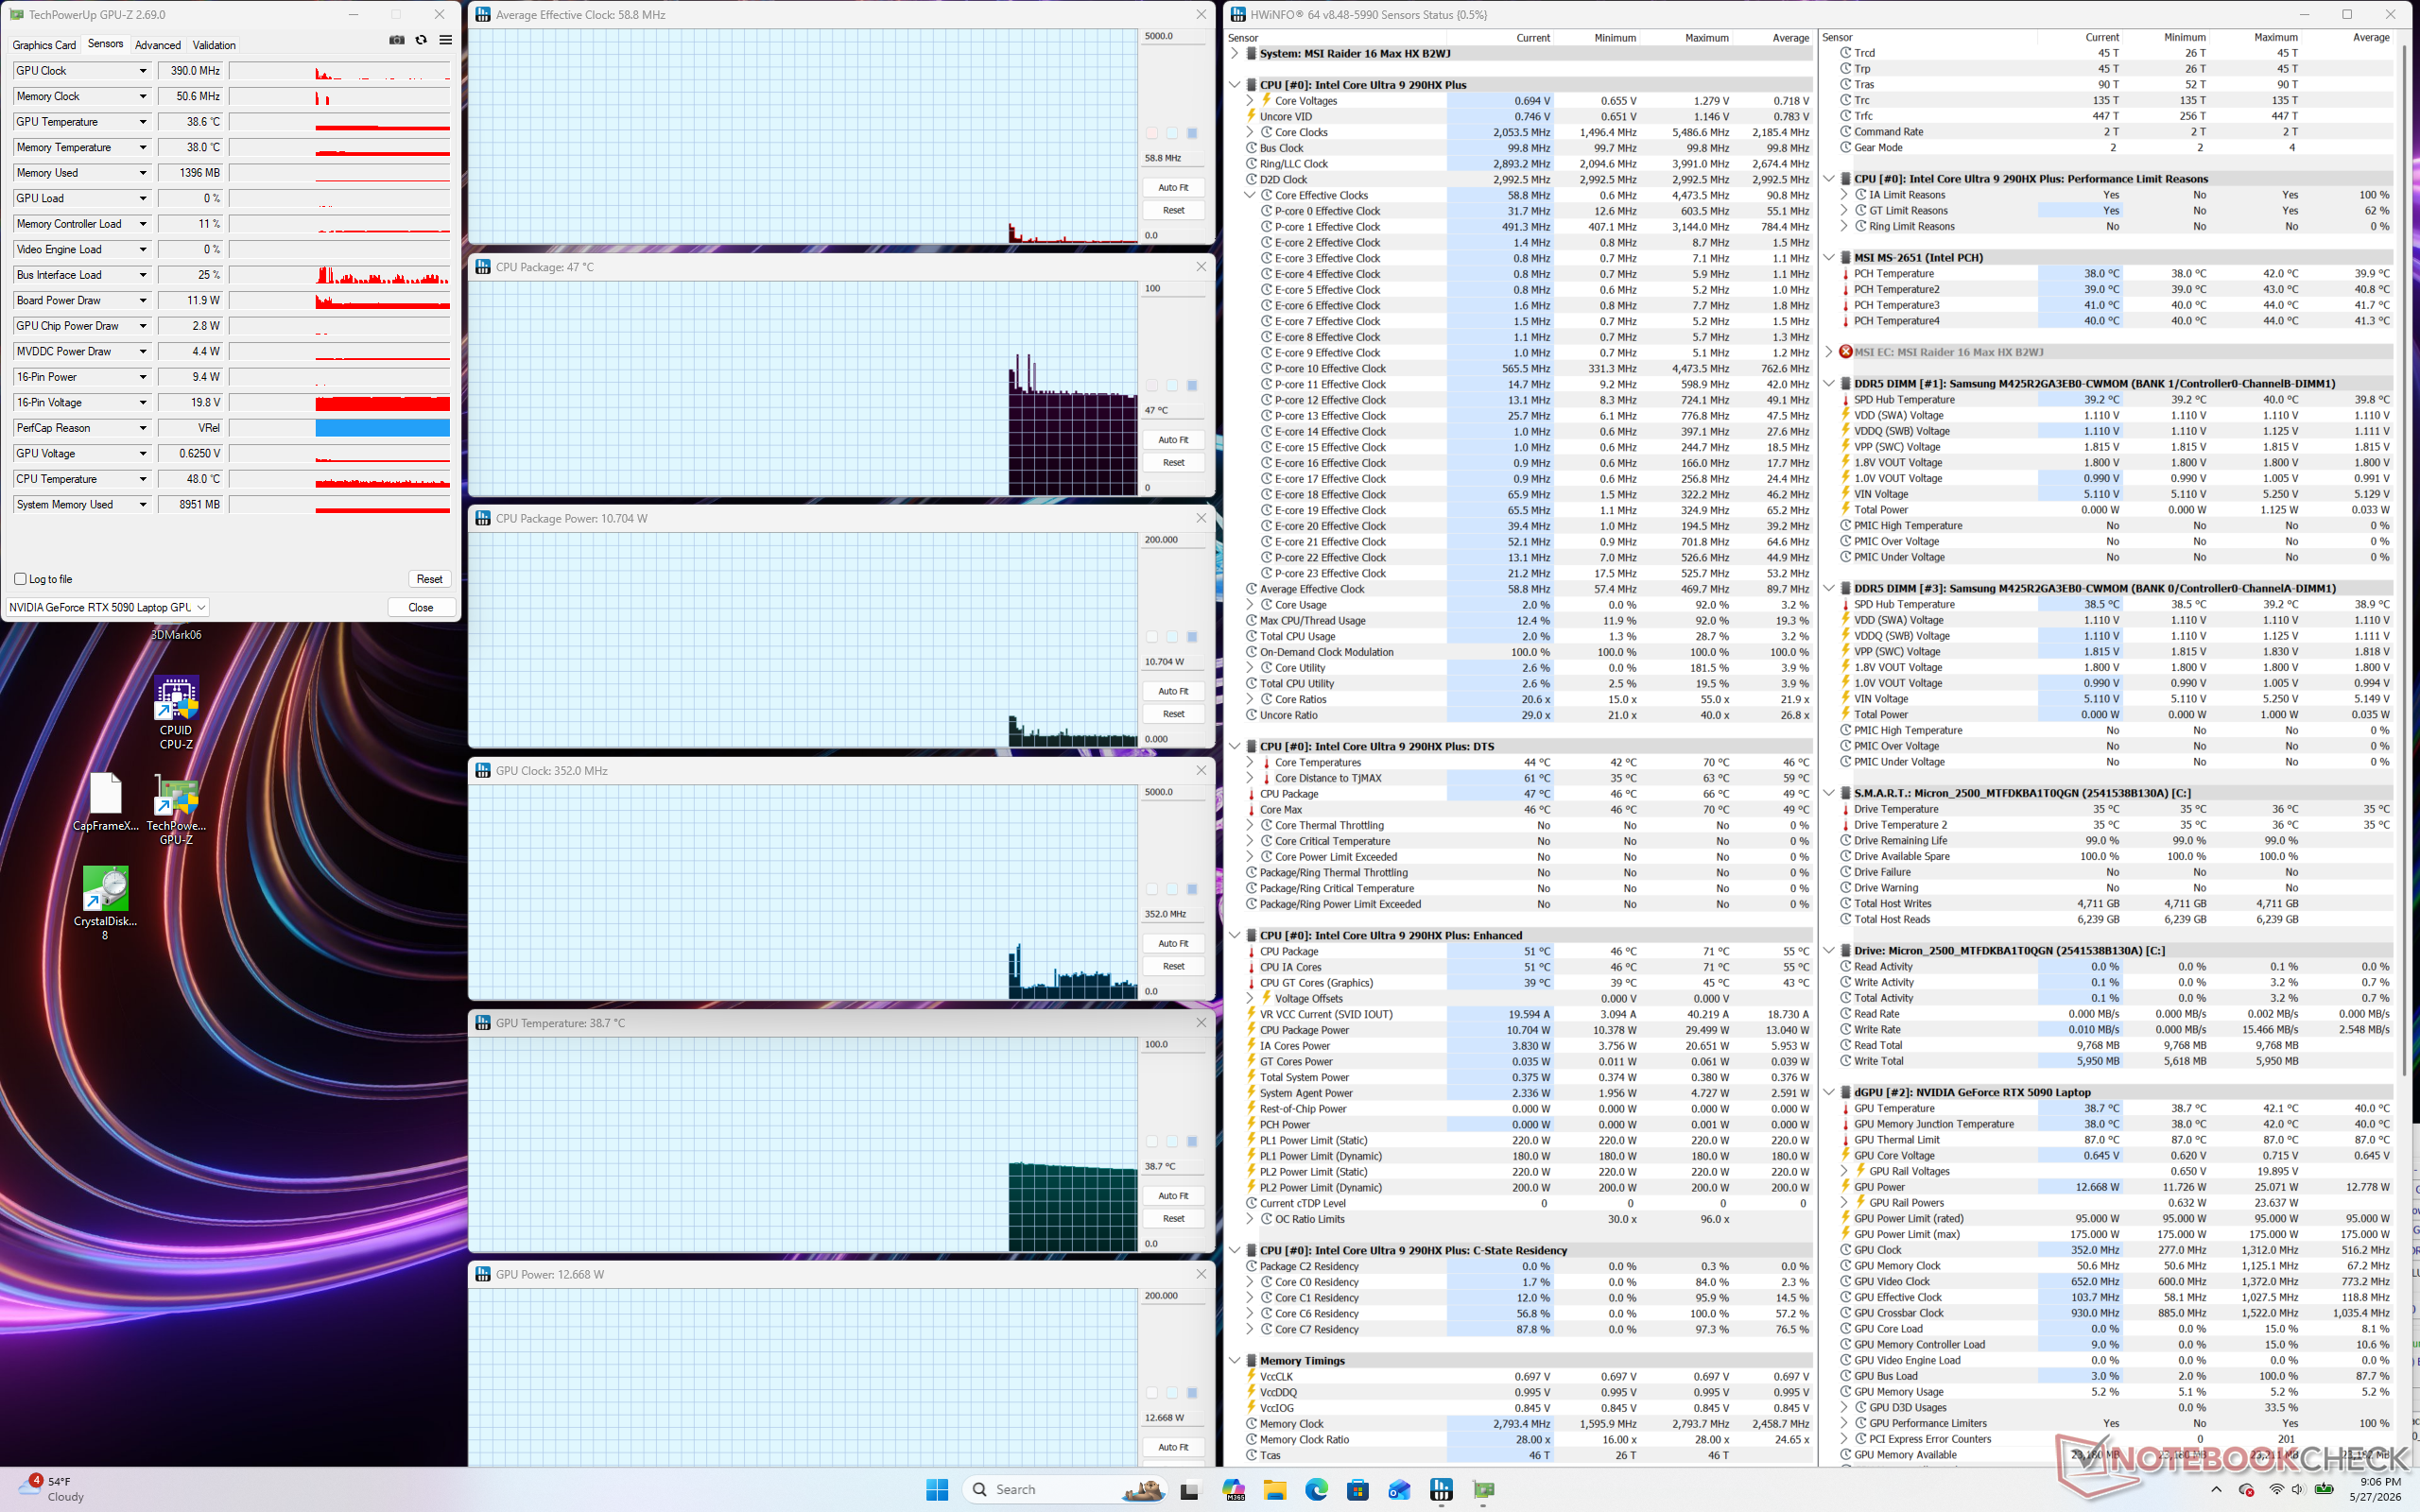
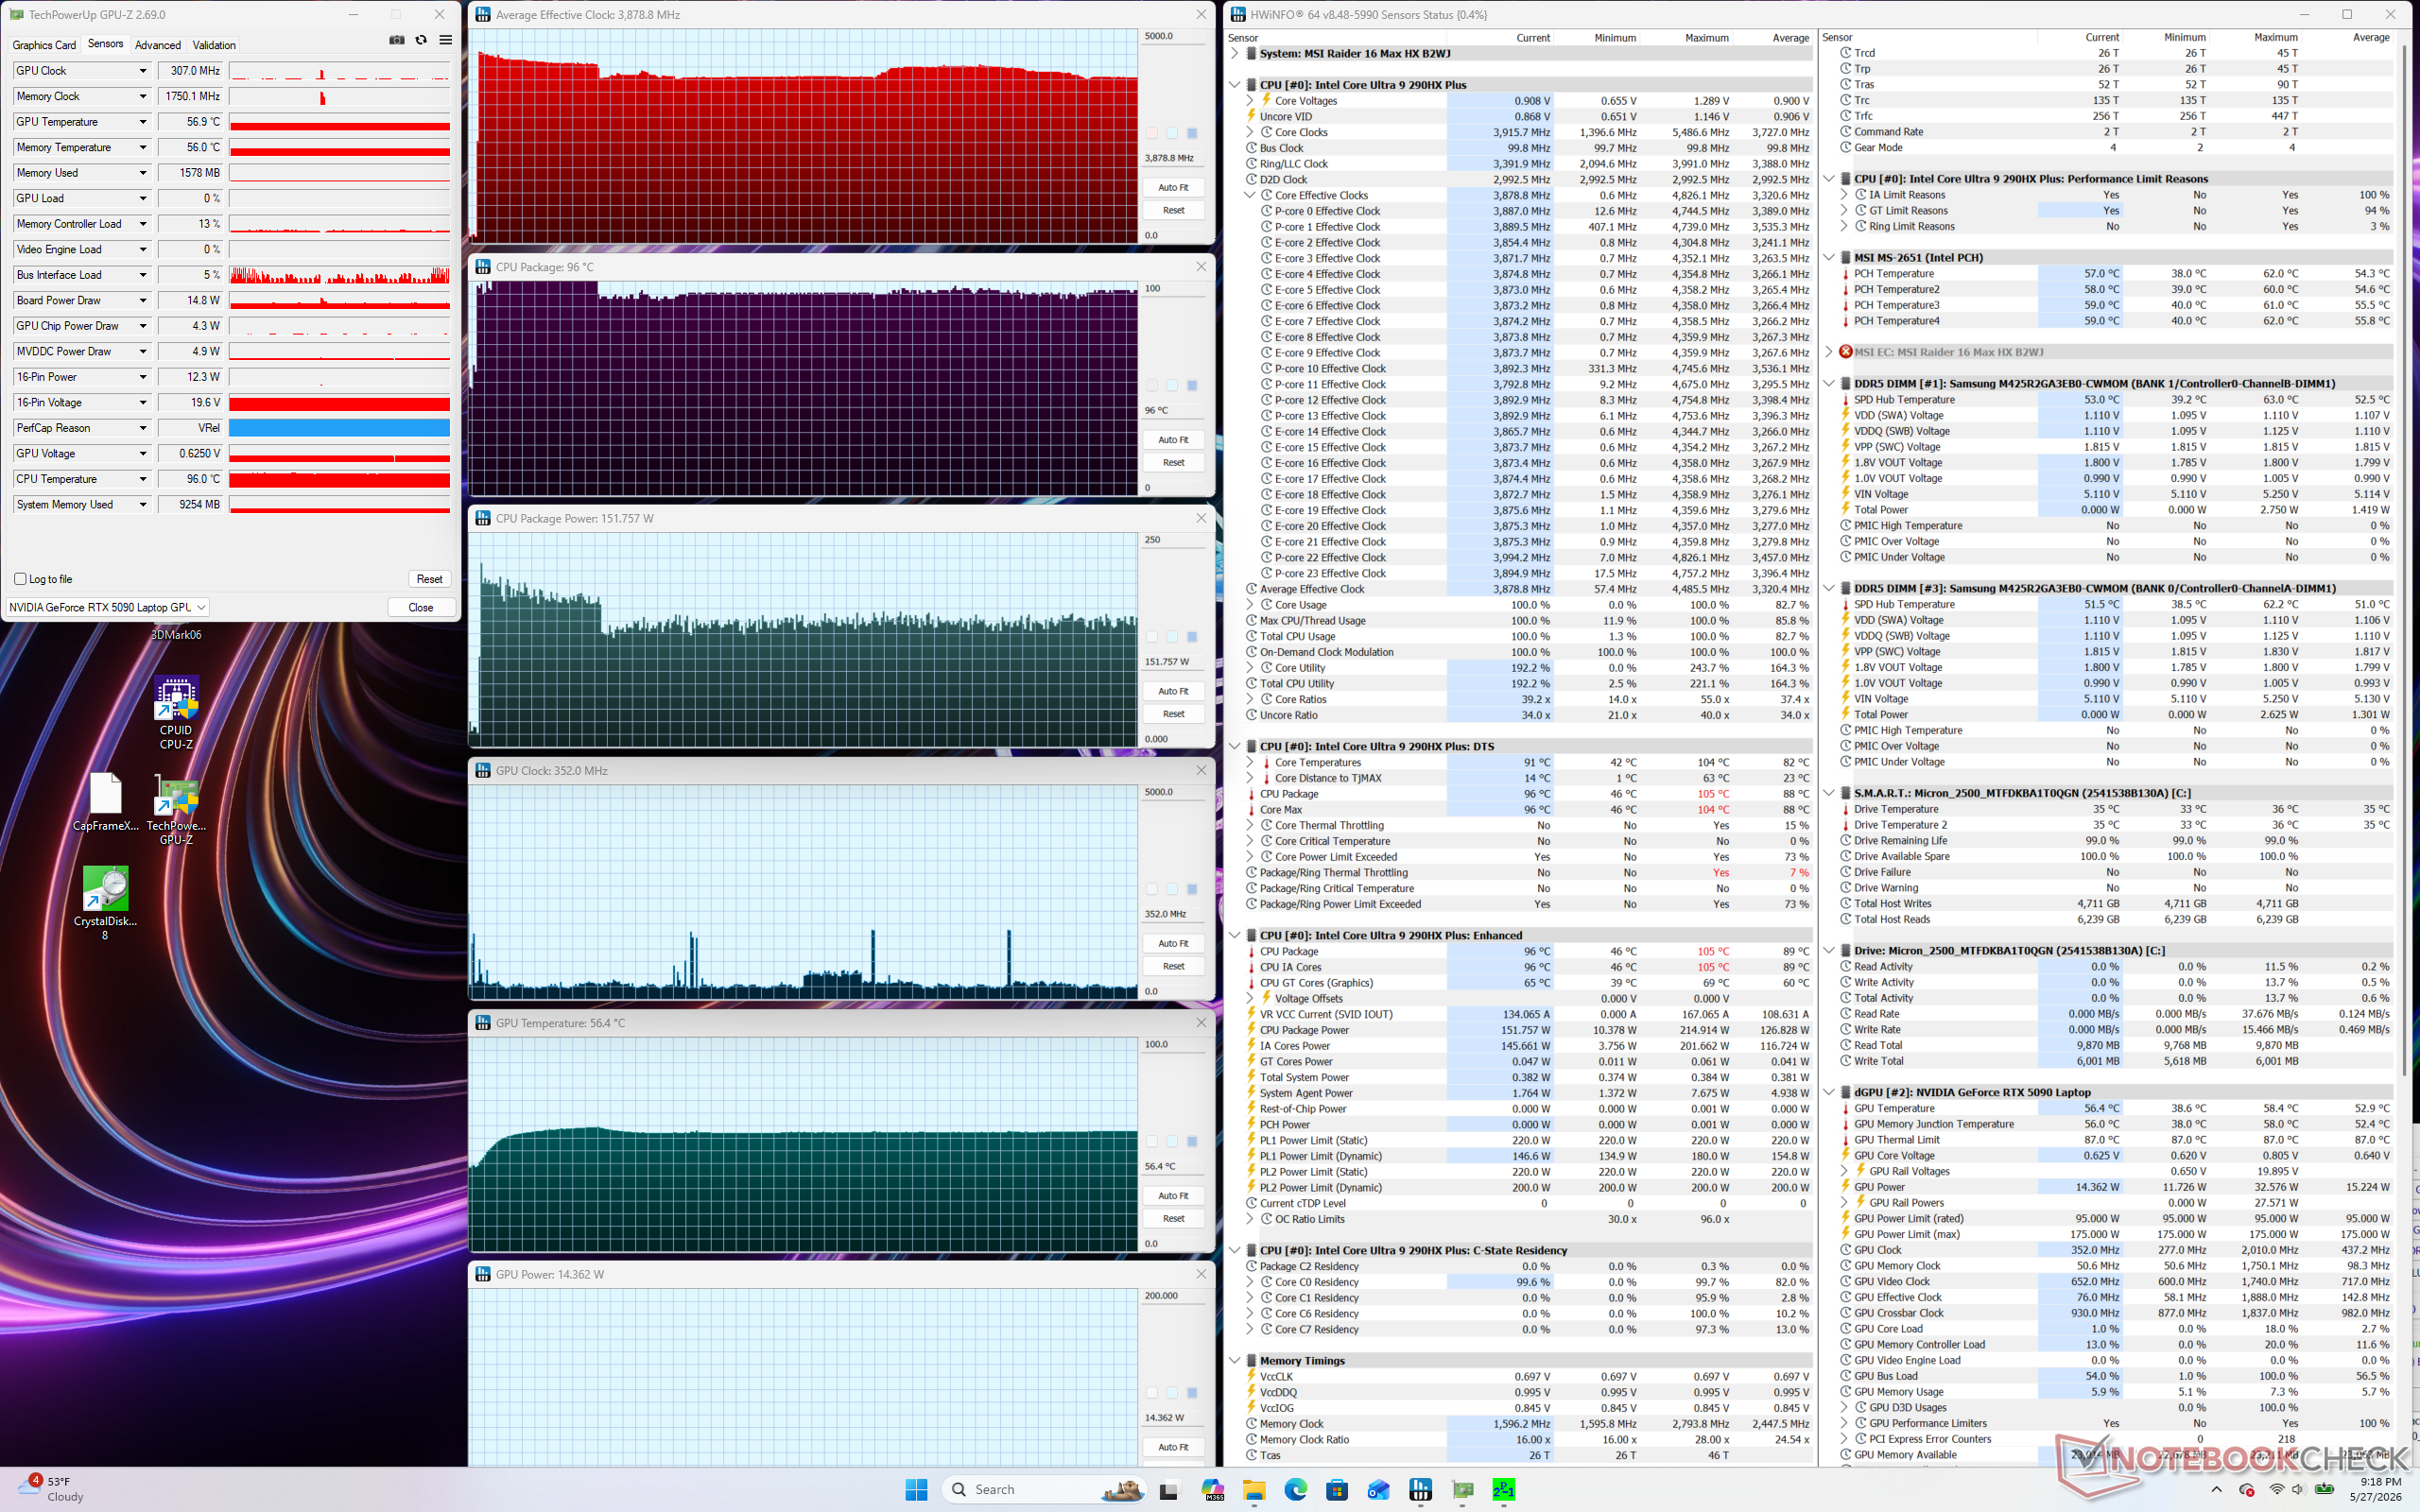
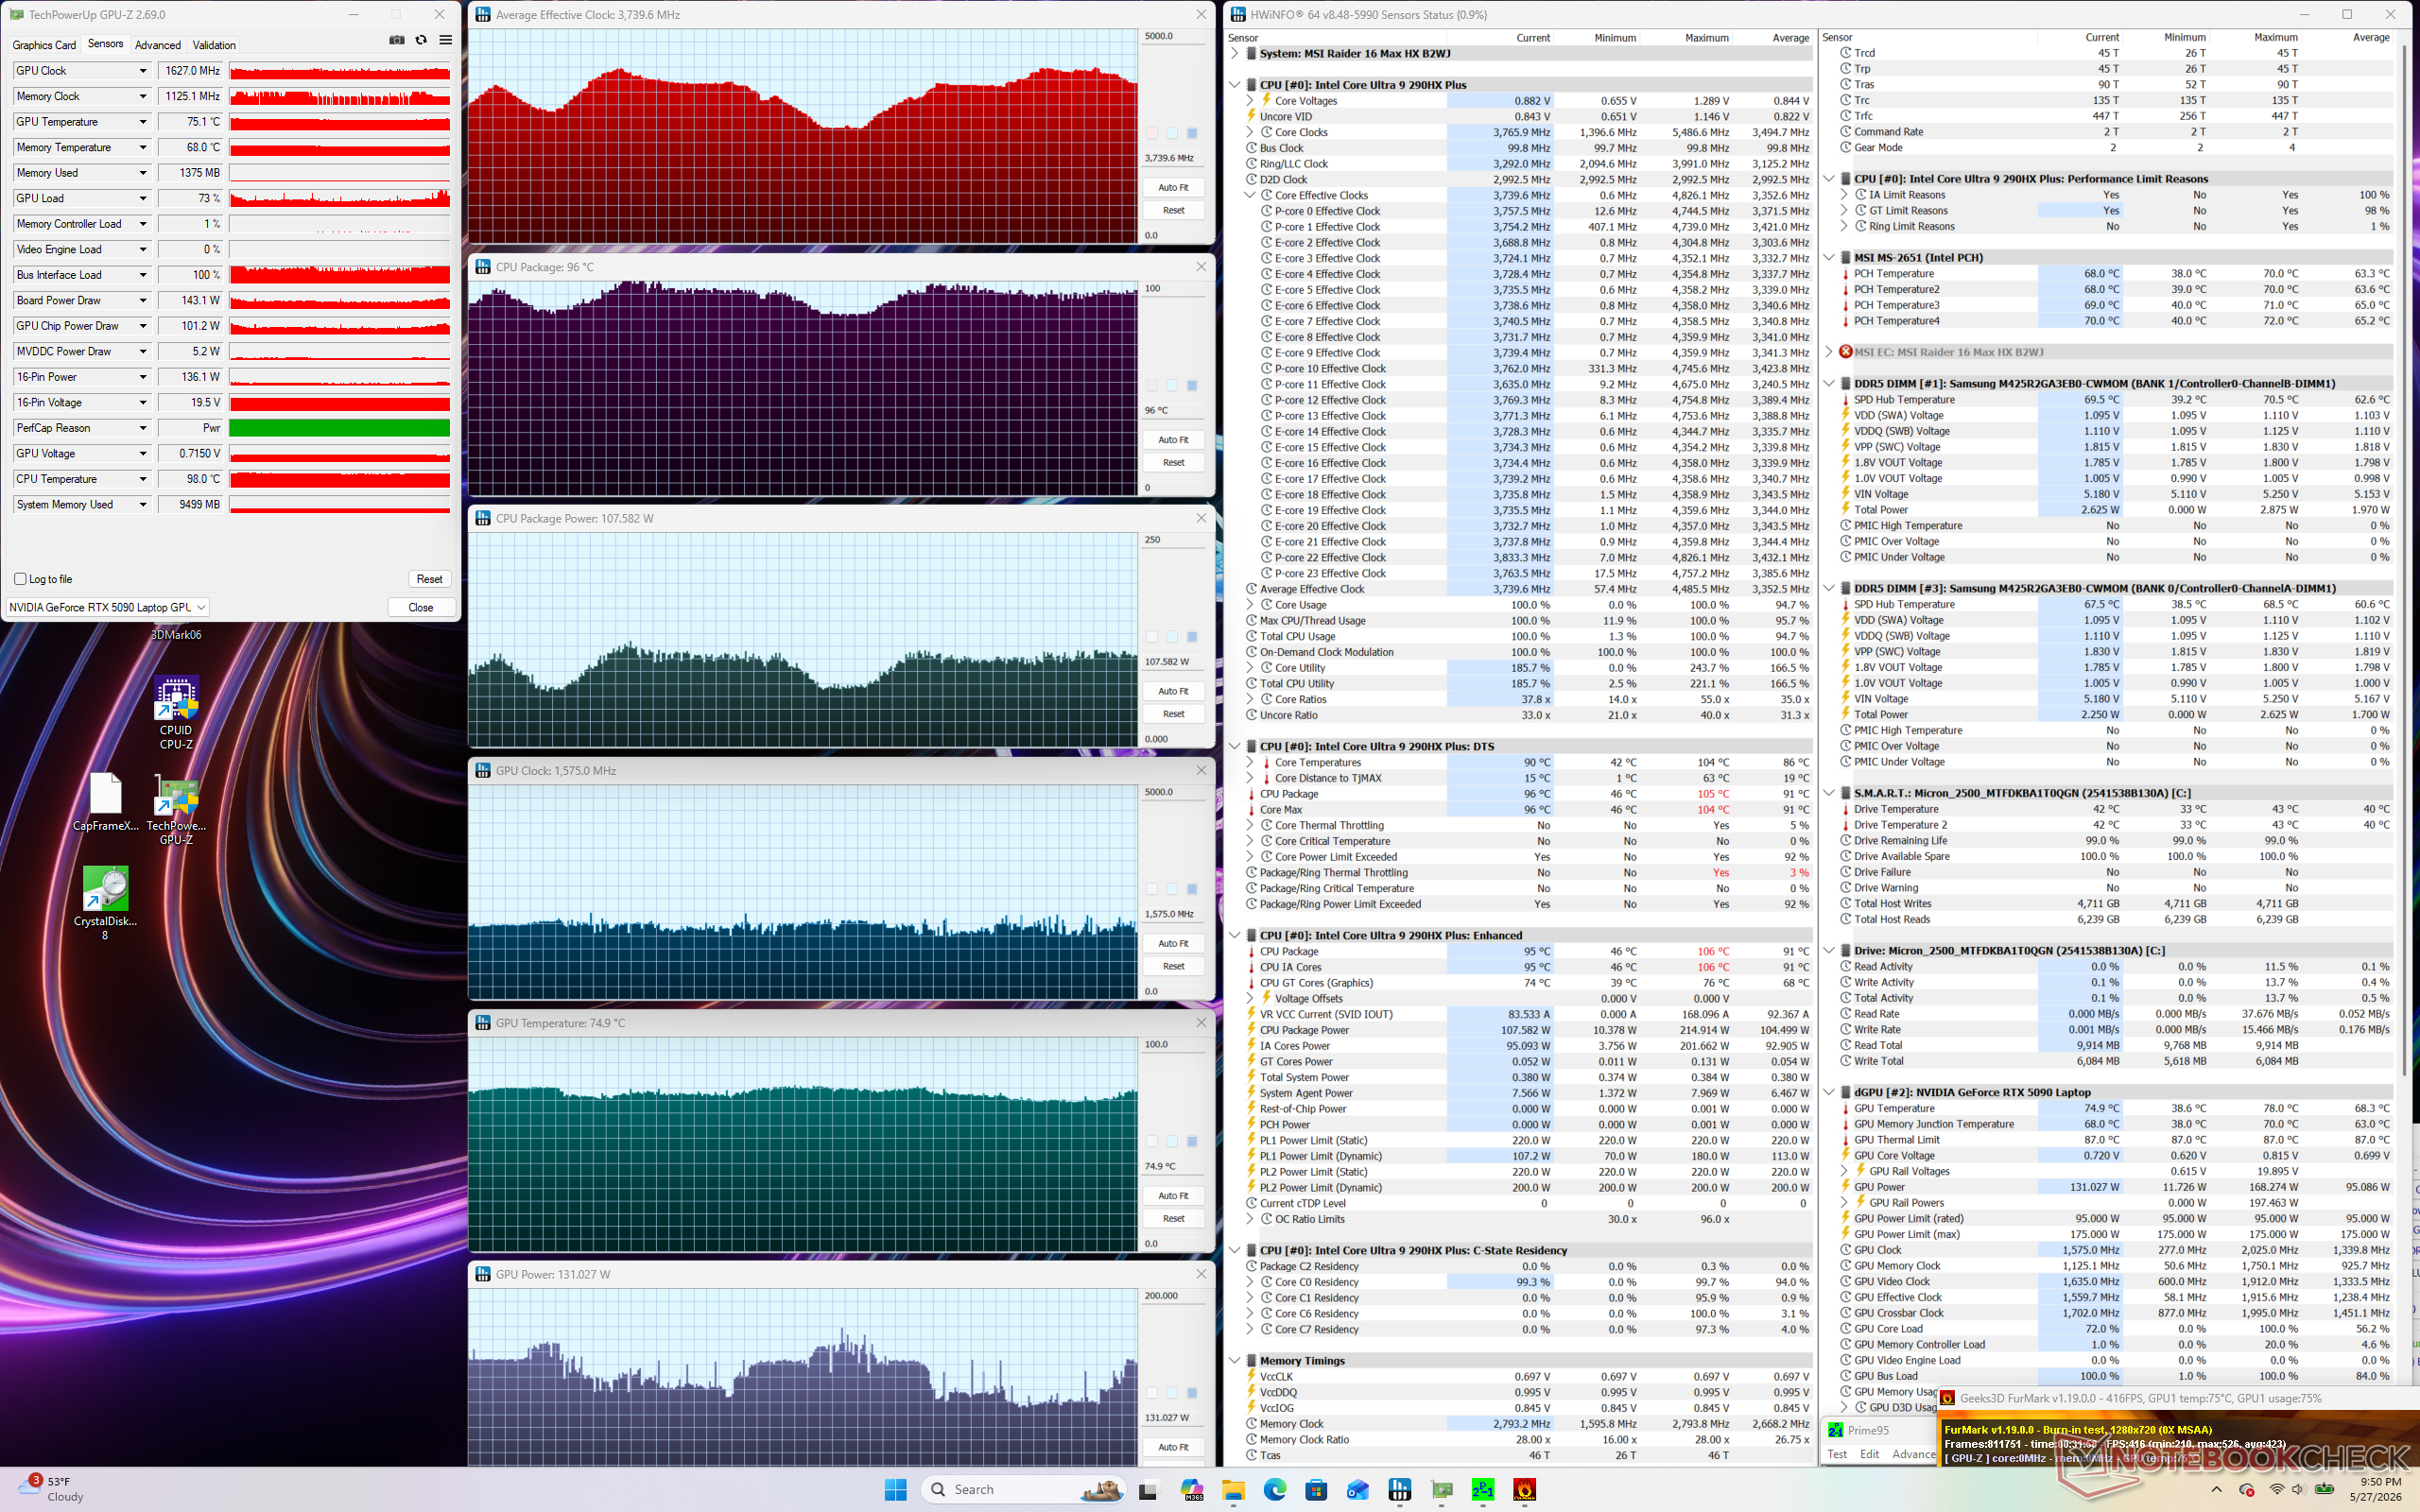
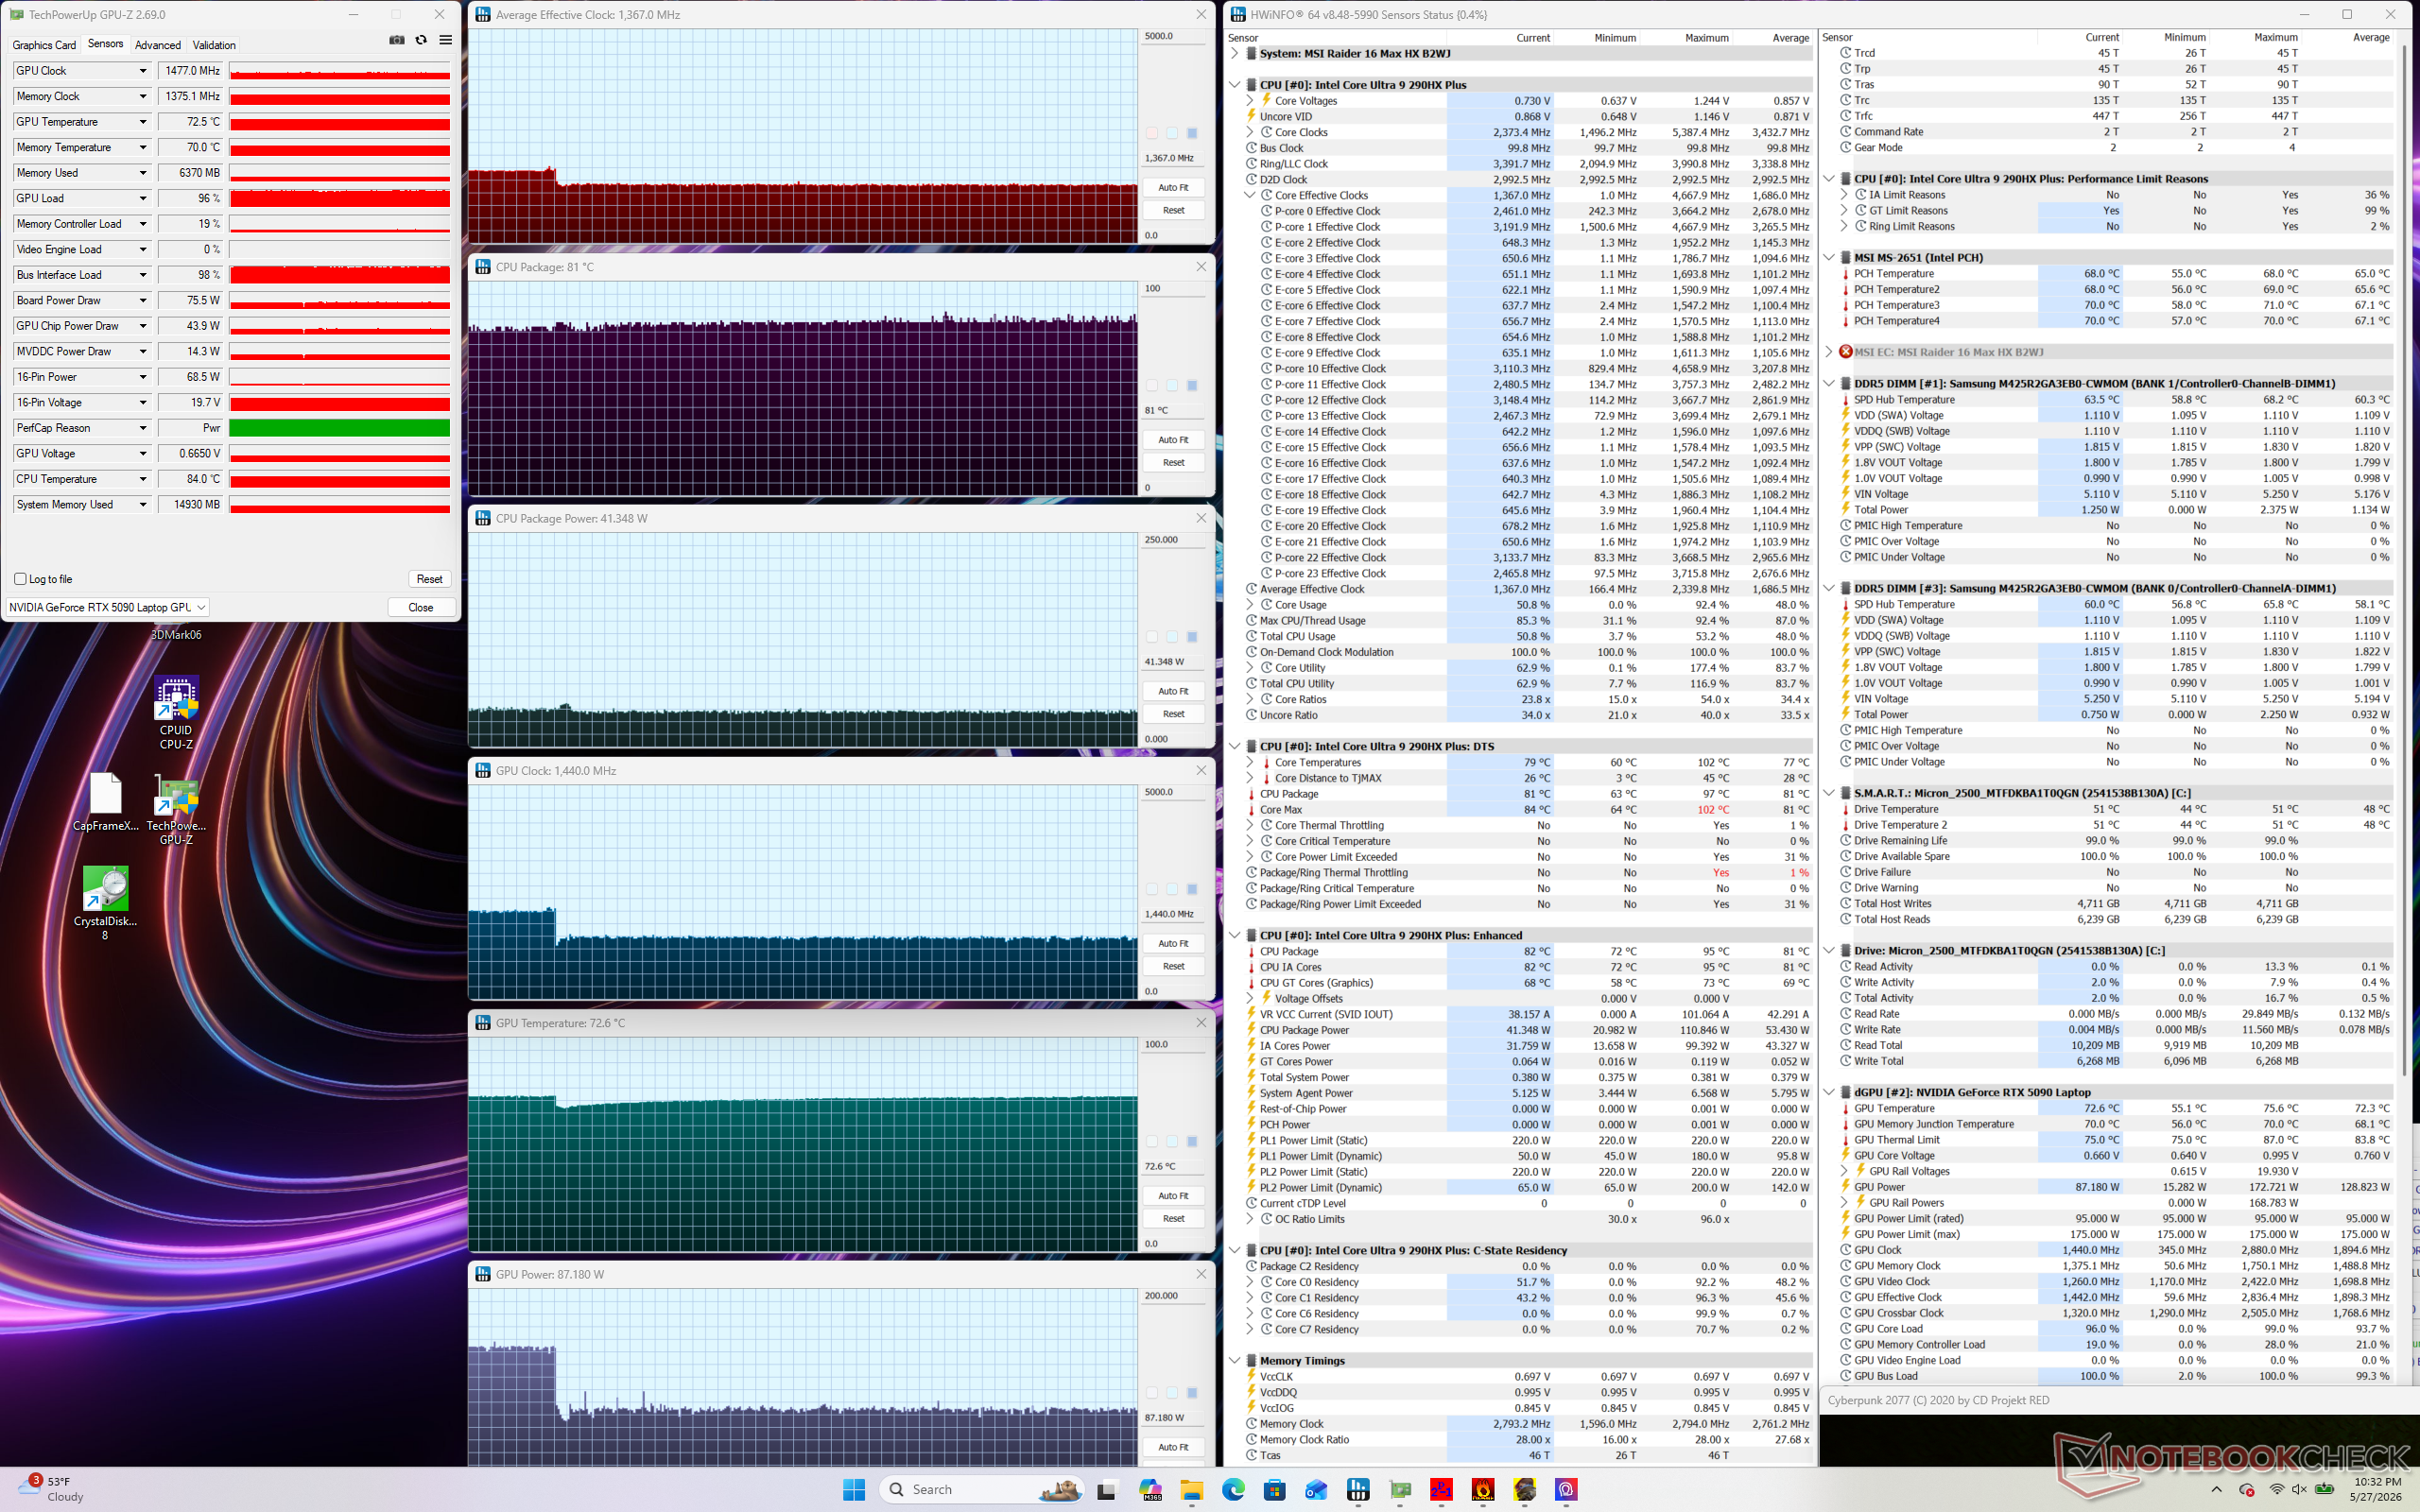
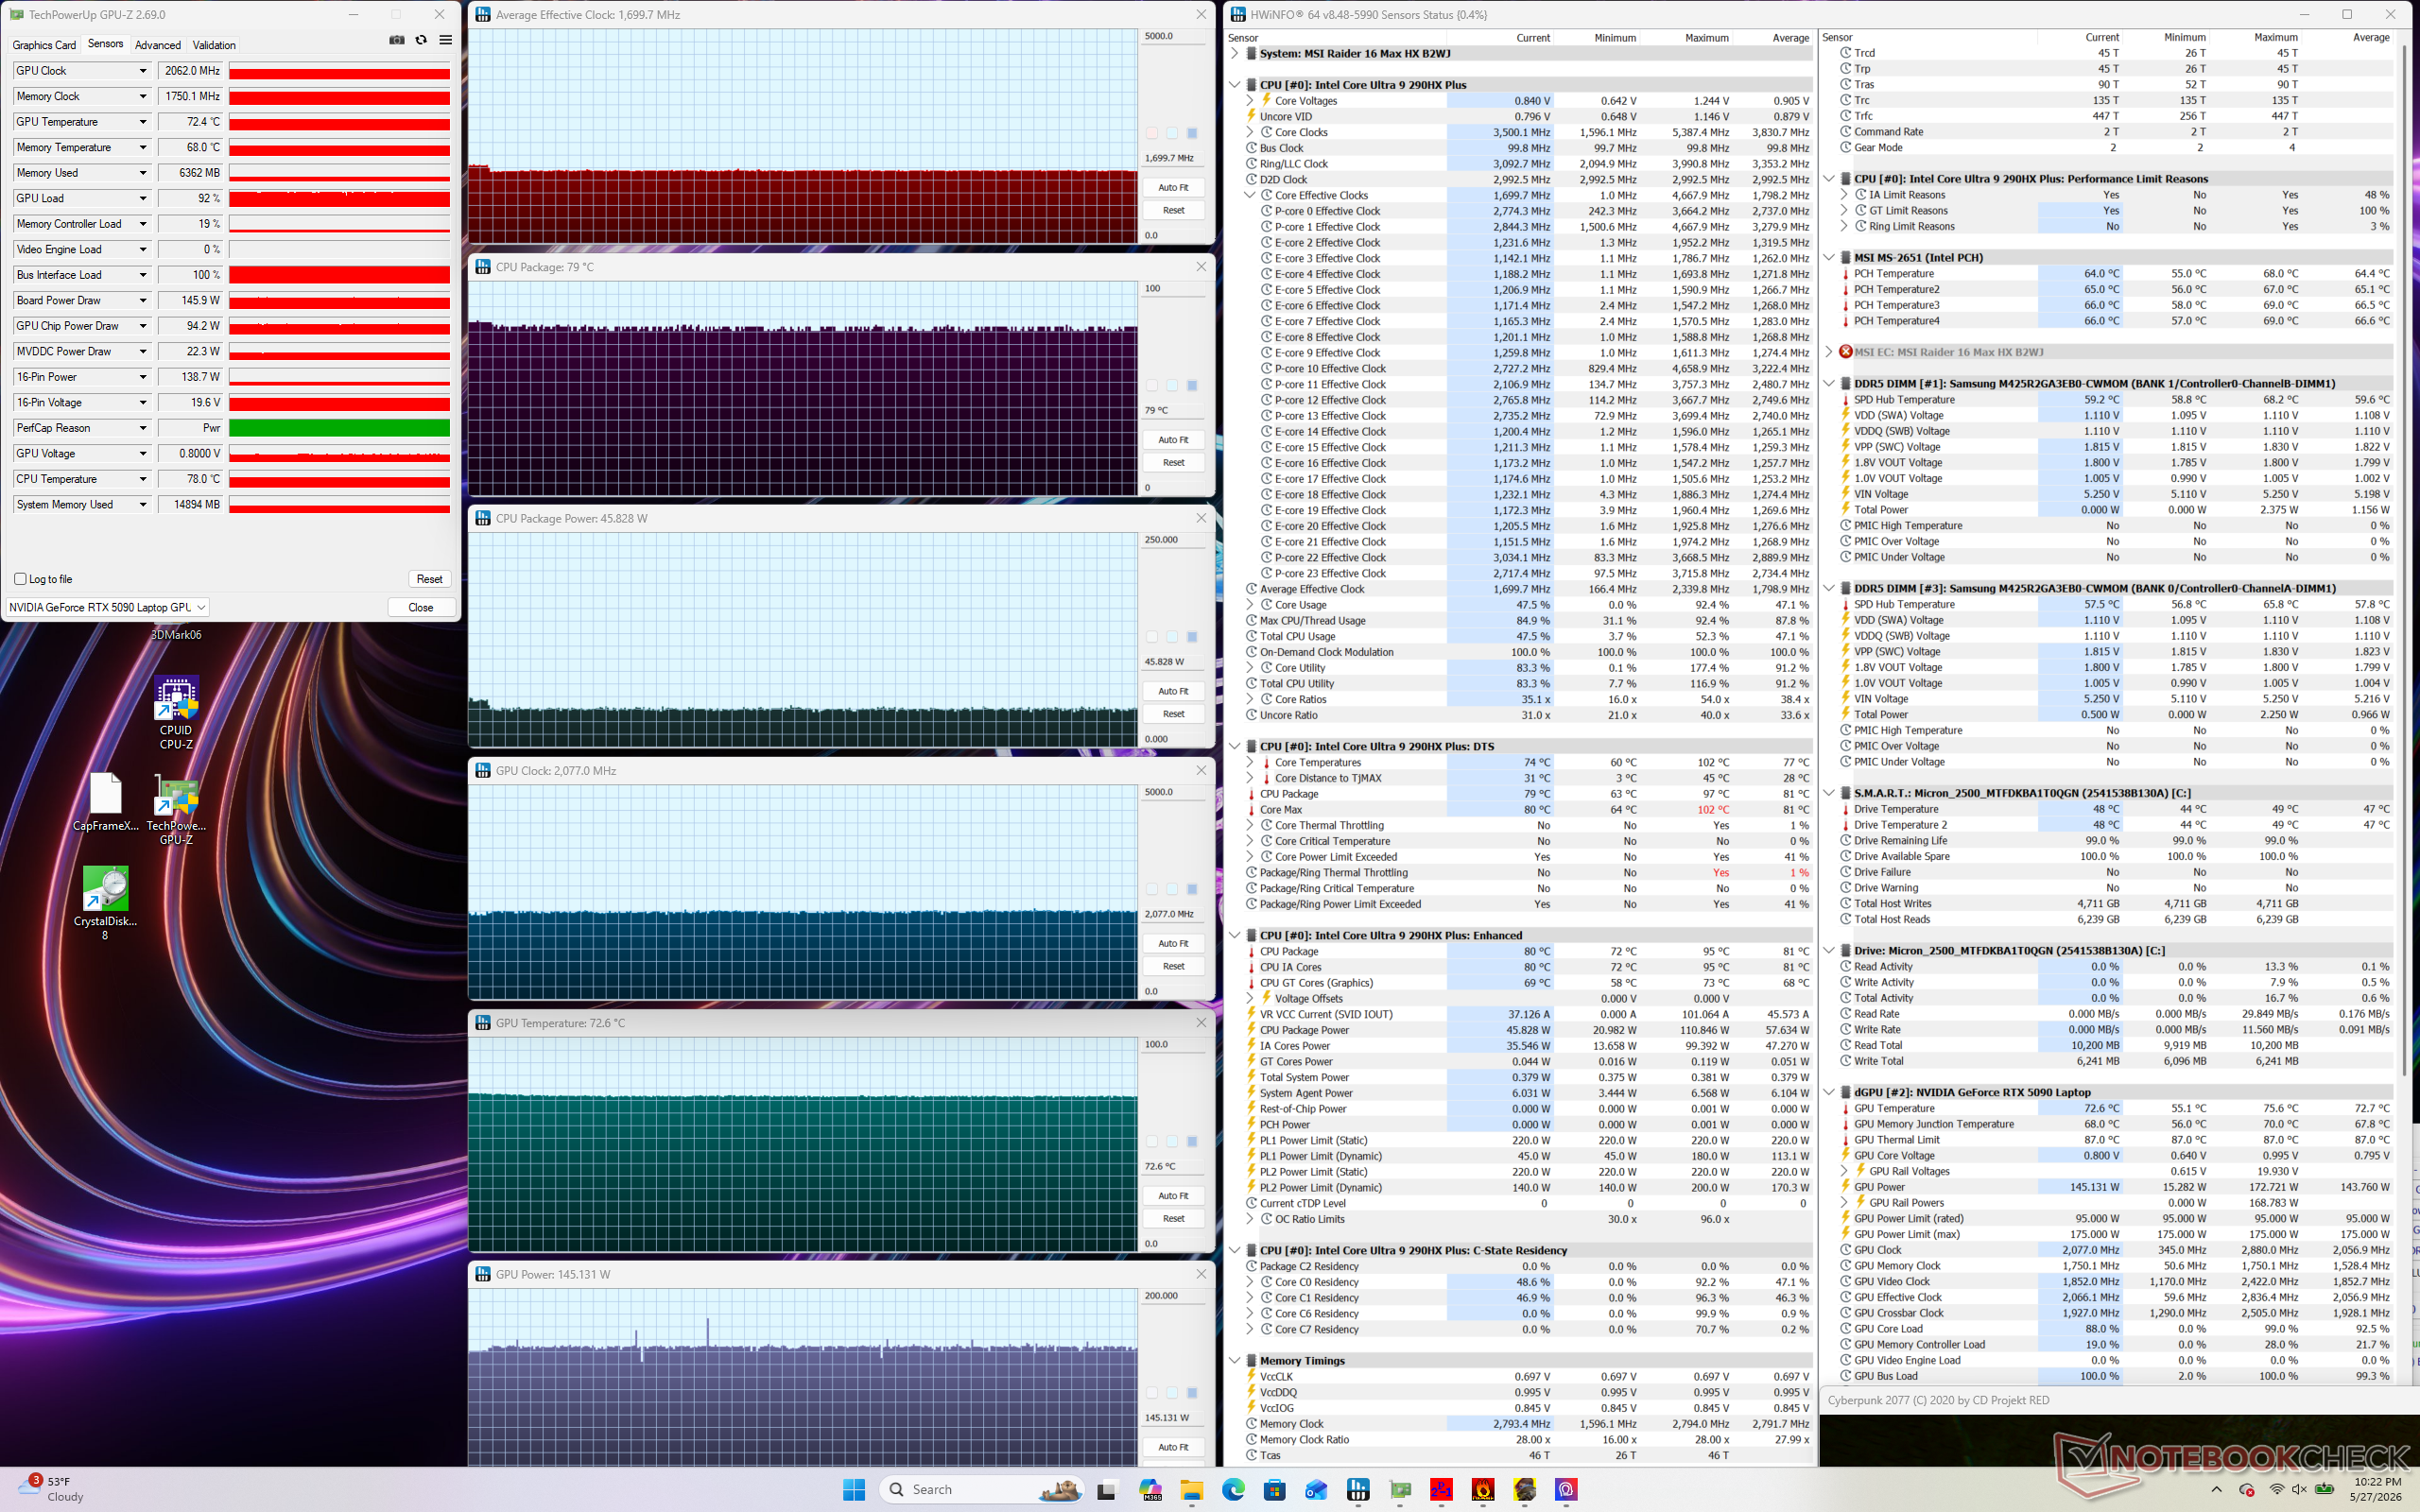
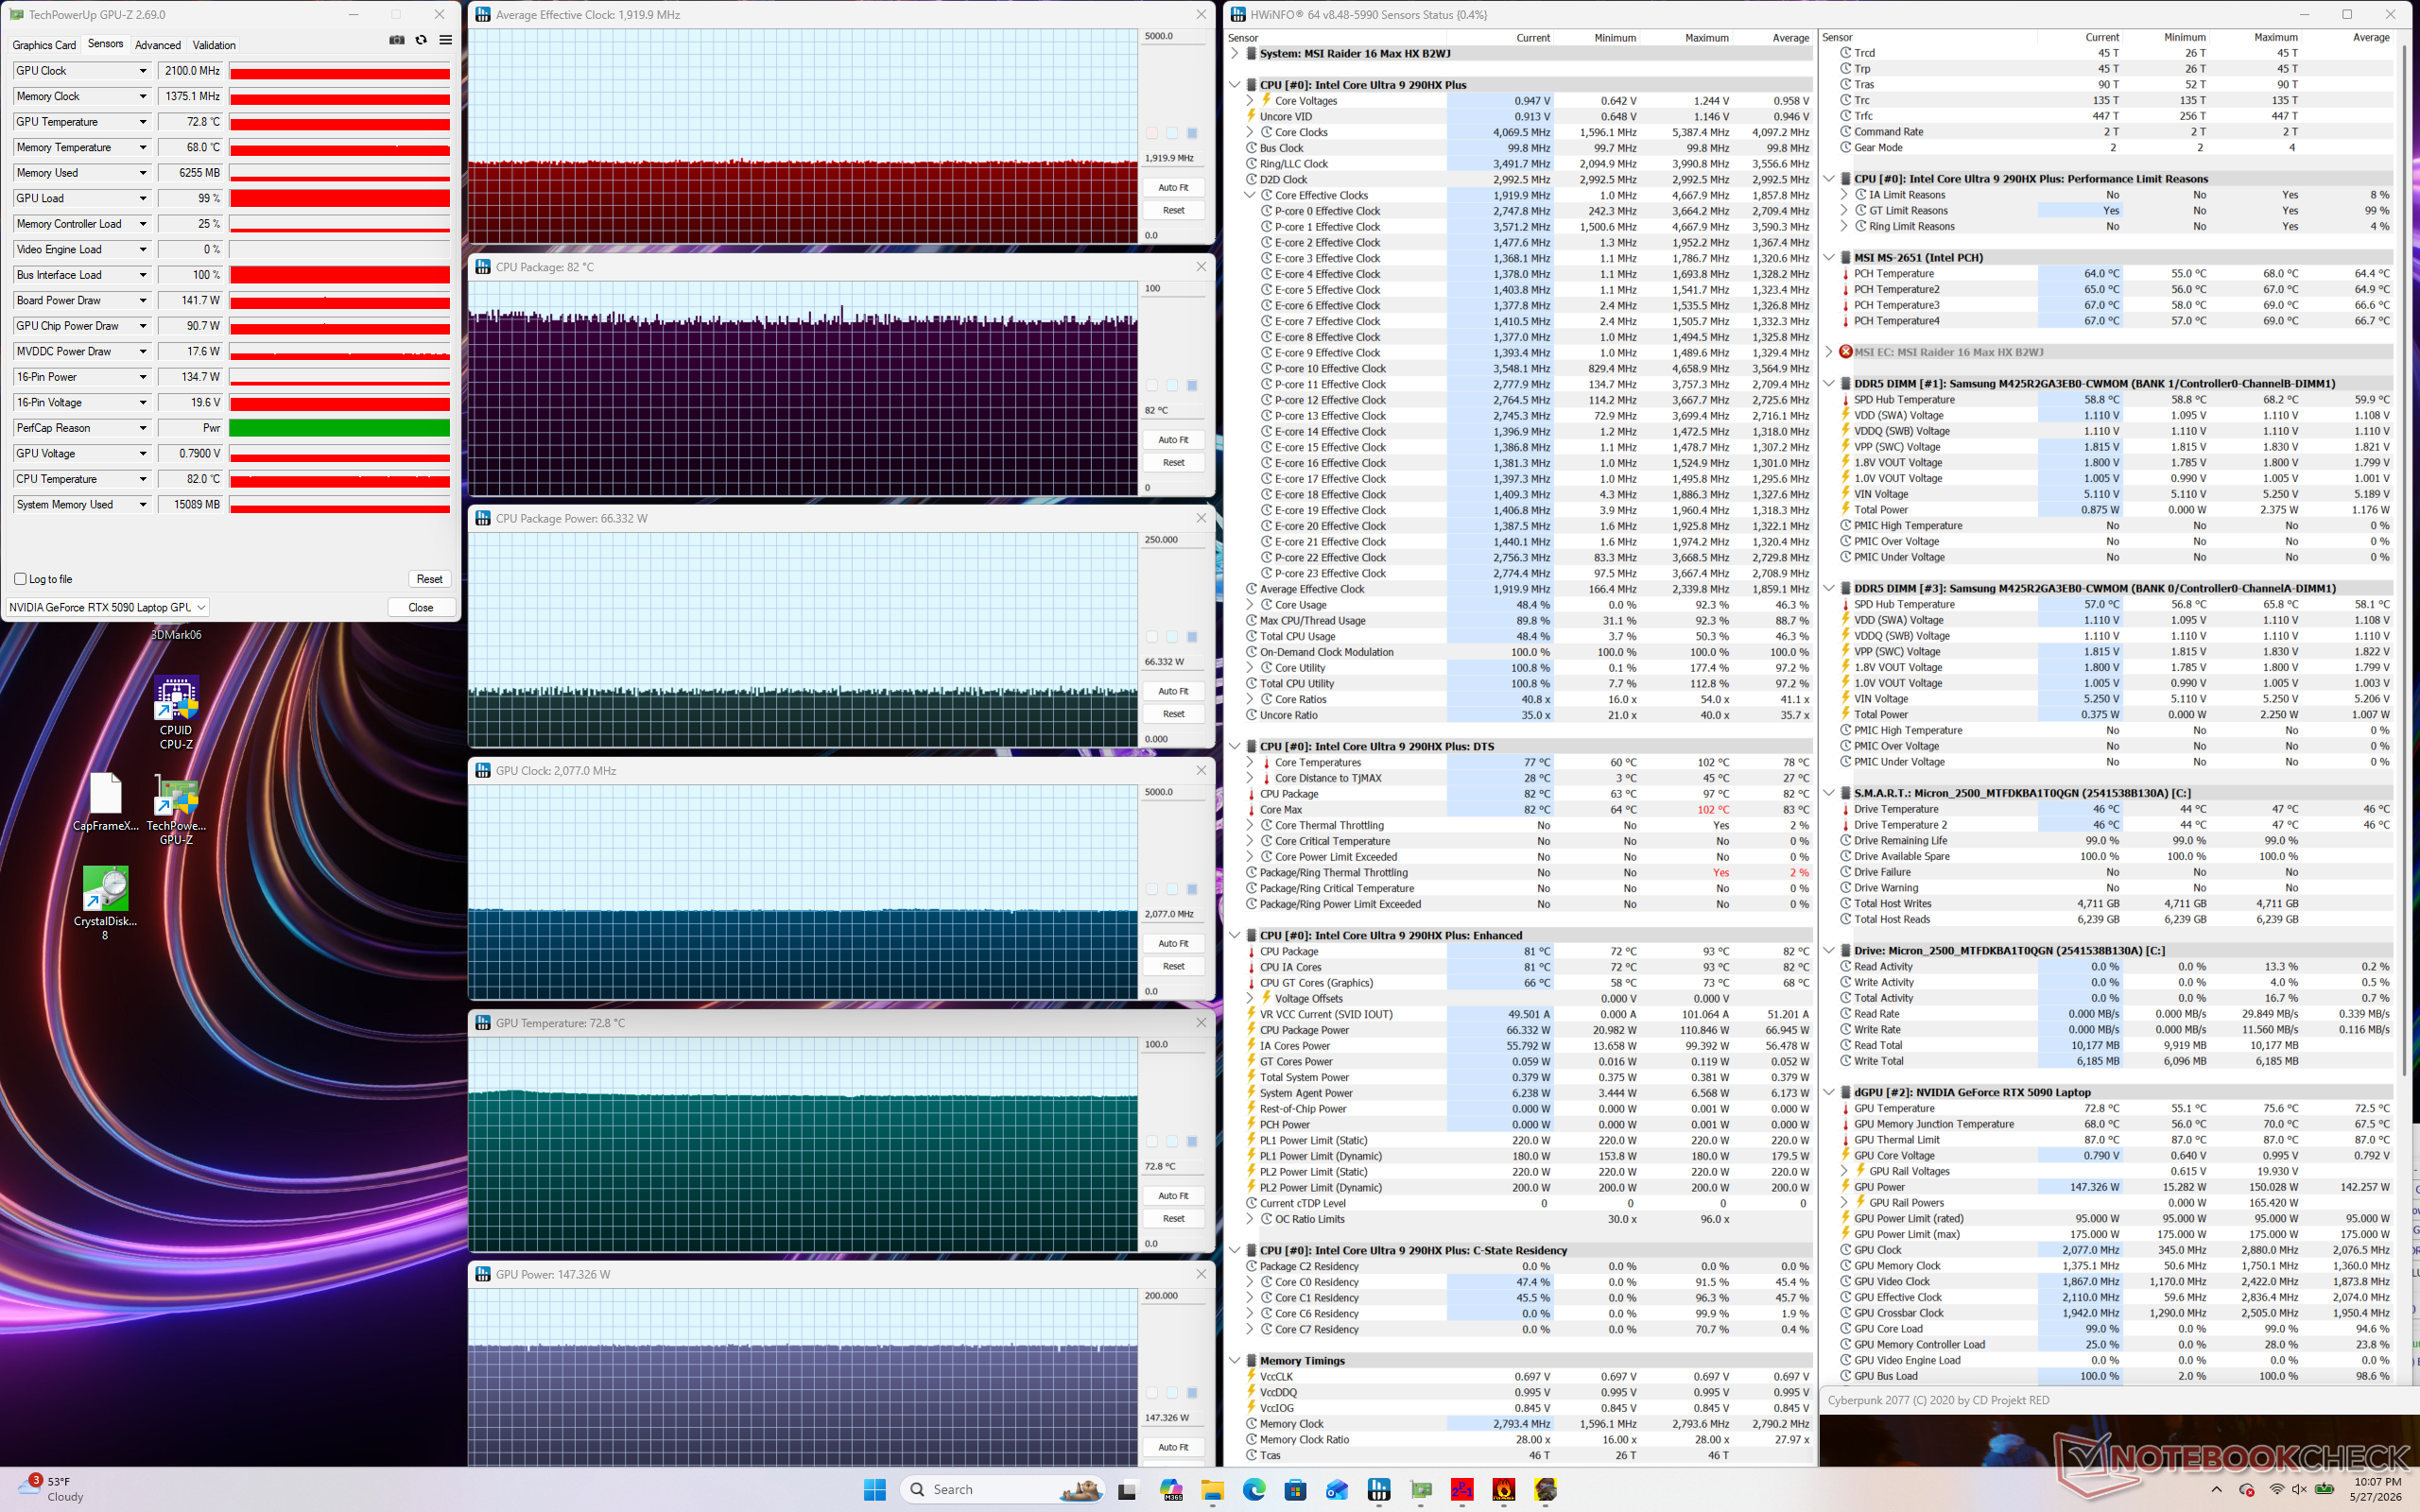

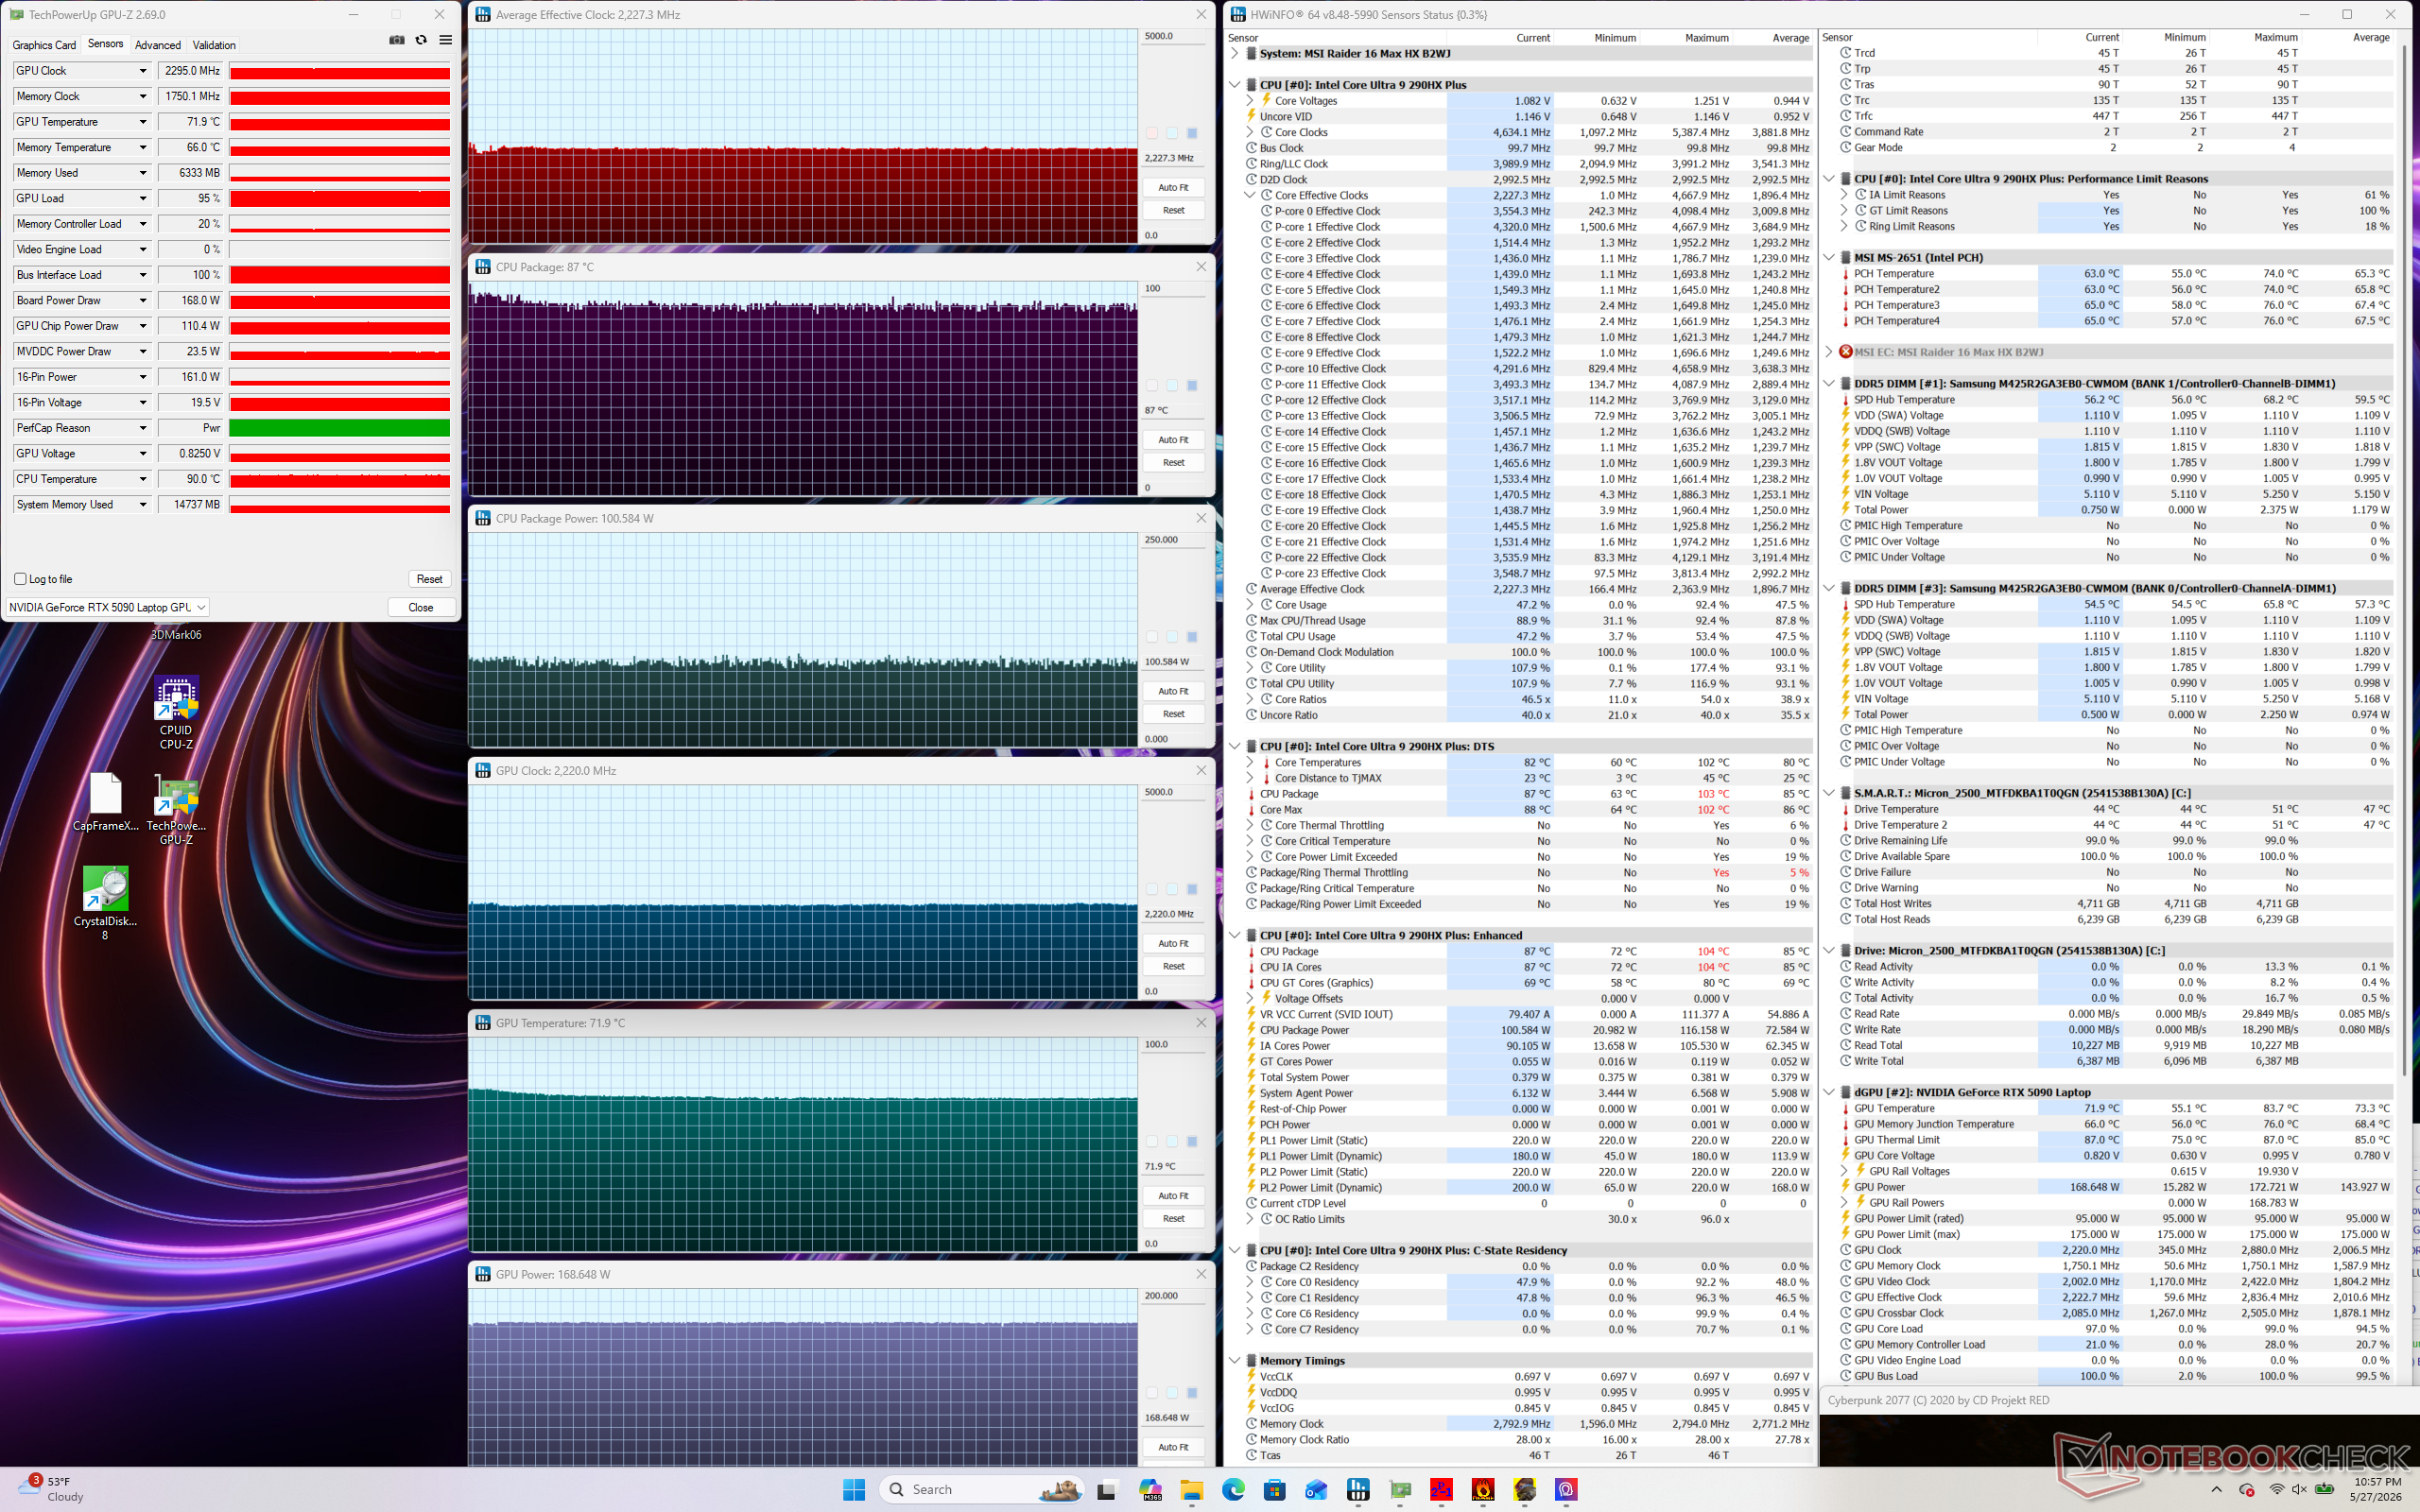
| Average CPU Clock (GHz) | GPU Clock (MHz) | Average CPU Temperature (°C) | Average GPU Temperature (°C) | |
| System Idle | -- | -- | 47 | 39 |
| Prime95 Stress | 3.9 | -- | 96 | 56 |
| Prime95 + FurMark Stress | 2.7 - 3.9 | ~1600 | 96 | 75 |
| Cyberpunk 2077 Stress (Quiet Mode) | 1.4 | 1440 | 81 | 73 |
| Cyberpunk 2077 Stress (Balanced Mode) | 1.7 | 2062 | 79 | 73 |
| Cyberpunk 2077 Stress (Extreme Performance Mode) | 1.9 | 2100 | 82 | 73 |
| Cyberpunk 2077 Stress (Apex Mode) | 2.3 | 2175 | 96 | 76 |
| Cyberpunk 2077 Stress (Cooler Boost Mode) | 2.2 | 2295 | 87 | 72 |
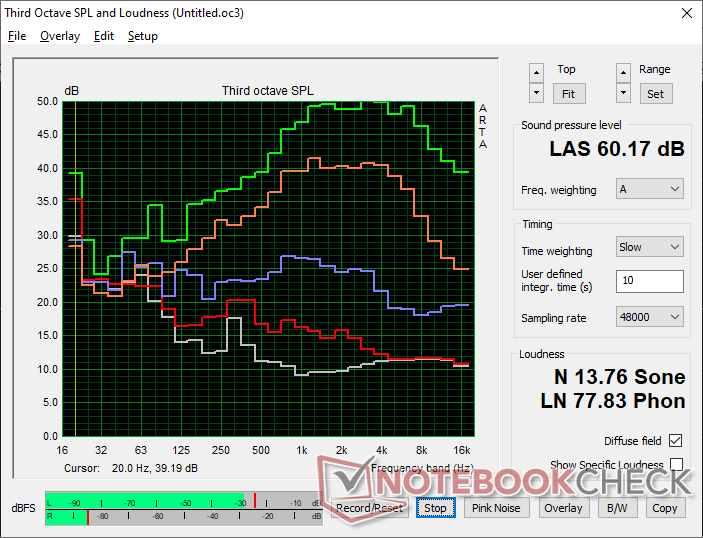
Speakers
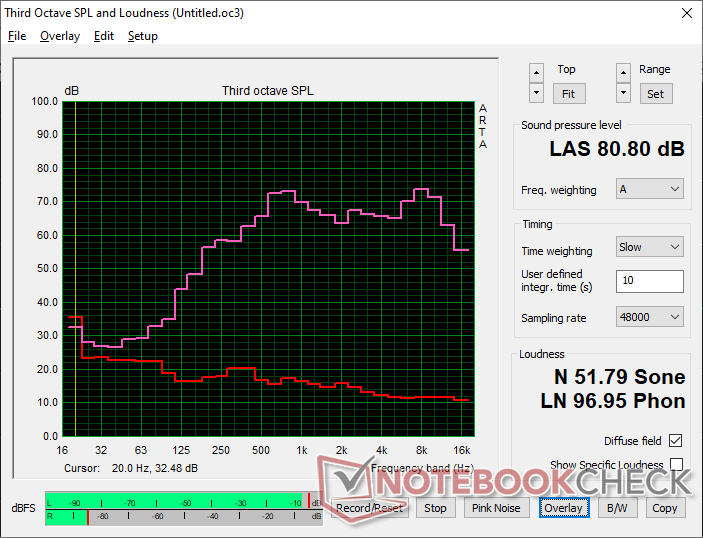
MSI Raider 16 Max HX B2WJ audio analysis
(±) | speaker loudness is average but good (80.8 dB)
Bass 100 - 315 Hz
(-) | nearly no bass - on average 15.7% lower than median
(±) | linearity of bass is average (8.6% delta to prev. frequency)
Mids 400 - 2000 Hz
(+) | balanced mids - only 3.2% away from median
(+) | mids are linear (6.1% delta to prev. frequency)
Highs 2 - 16 kHz
(+) | balanced highs - only 2.9% away from median
(+) | highs are linear (4.9% delta to prev. frequency)
Overall 100 - 16.000 Hz
(+) | overall sound is linear (14.5% difference to median)
Compared to same class
» 27% of all tested devices in this class were better, 7% similar, 66% worse
» The best had a delta of 6%, average was 18%, worst was 132%
Compared to all devices tested
» 18% of all tested devices were better, 4% similar, 77% worse
» The best had a delta of 4%, average was 23%, worst was 134%
Apple MacBook Pro 16 2021 M1 Pro audio analysis
(+) | speakers can play relatively loud (84.7 dB)
Bass 100 - 315 Hz
(+) | good bass - only 3.8% away from median
(+) | bass is linear (5.2% delta to prev. frequency)
Mids 400 - 2000 Hz
(+) | balanced mids - only 1.3% away from median
(+) | mids are linear (2.1% delta to prev. frequency)
Highs 2 - 16 kHz
(+) | balanced highs - only 1.9% away from median
(+) | highs are linear (2.7% delta to prev. frequency)
Overall 100 - 16.000 Hz
(+) | overall sound is linear (4.6% difference to median)
Compared to same class
» 0% of all tested devices in this class were better, 0% similar, 100% worse
» The best had a delta of 5%, average was 17%, worst was 45%
Compared to all devices tested
» 0% of all tested devices were better, 0% similar, 100% worse
» The best had a delta of 4%, average was 23%, worst was 134%
Energy Management
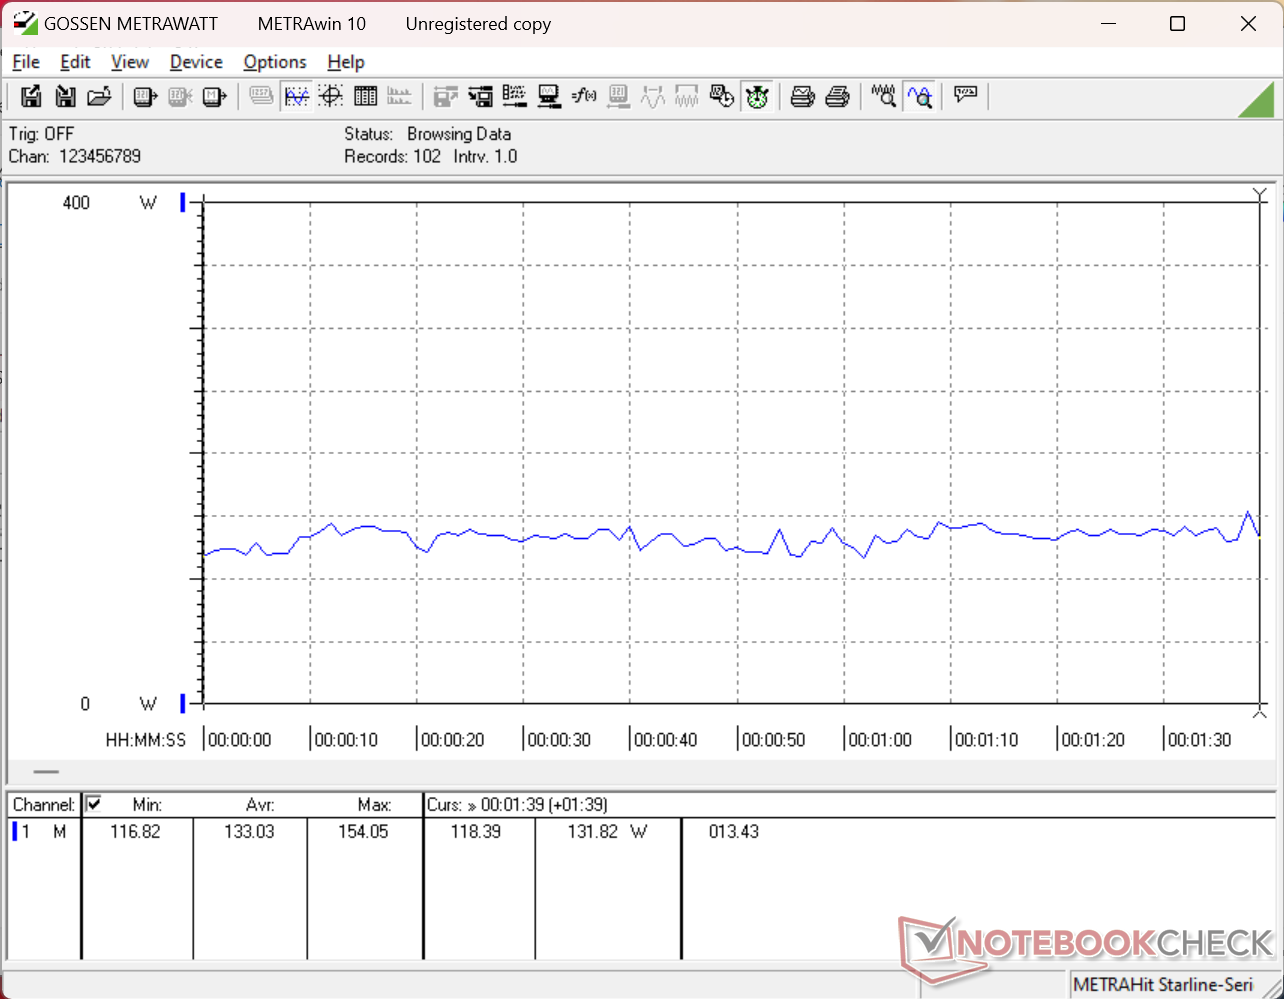
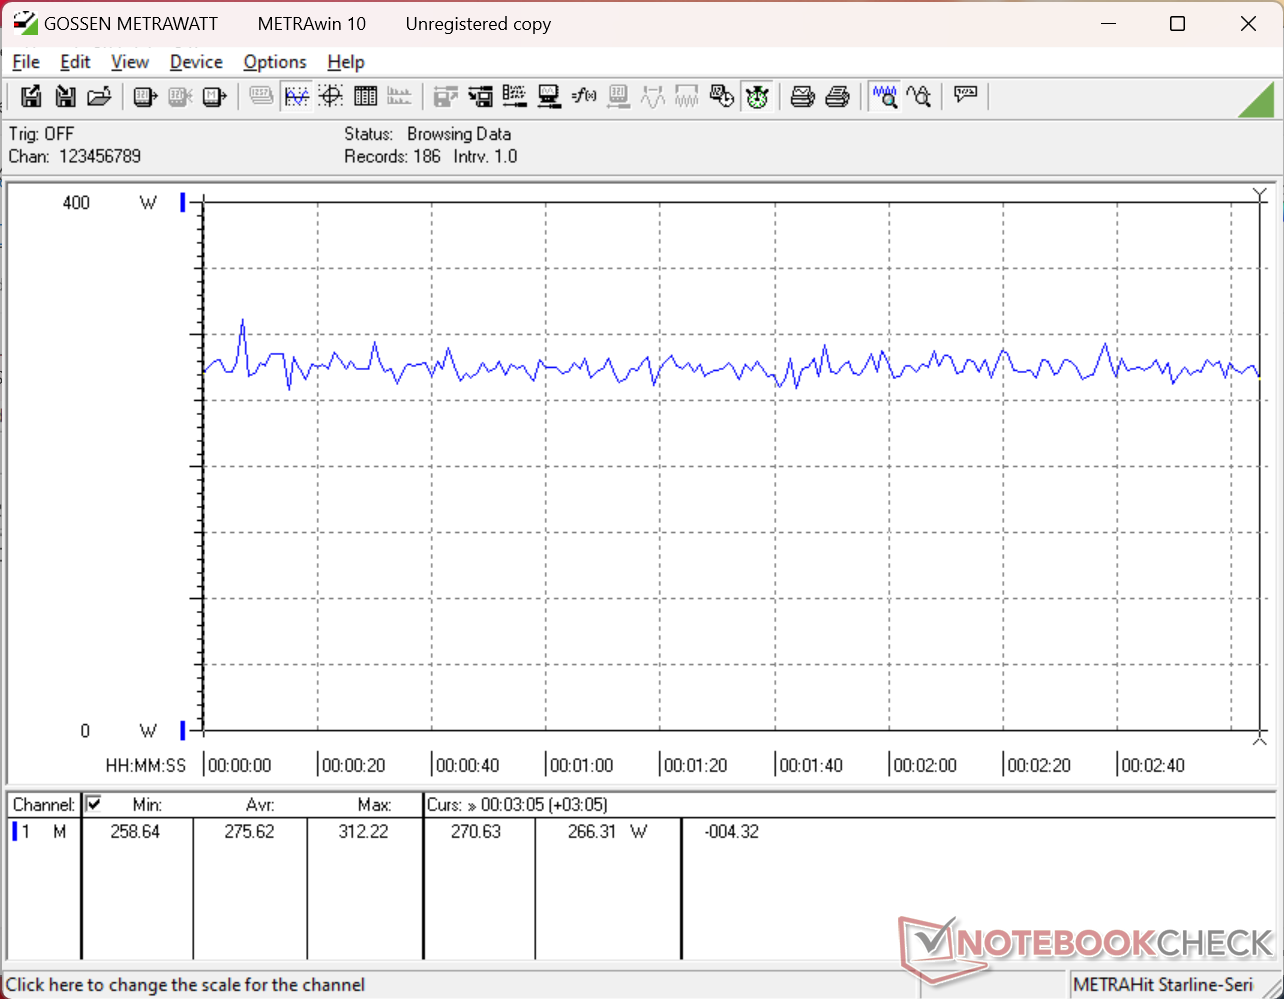
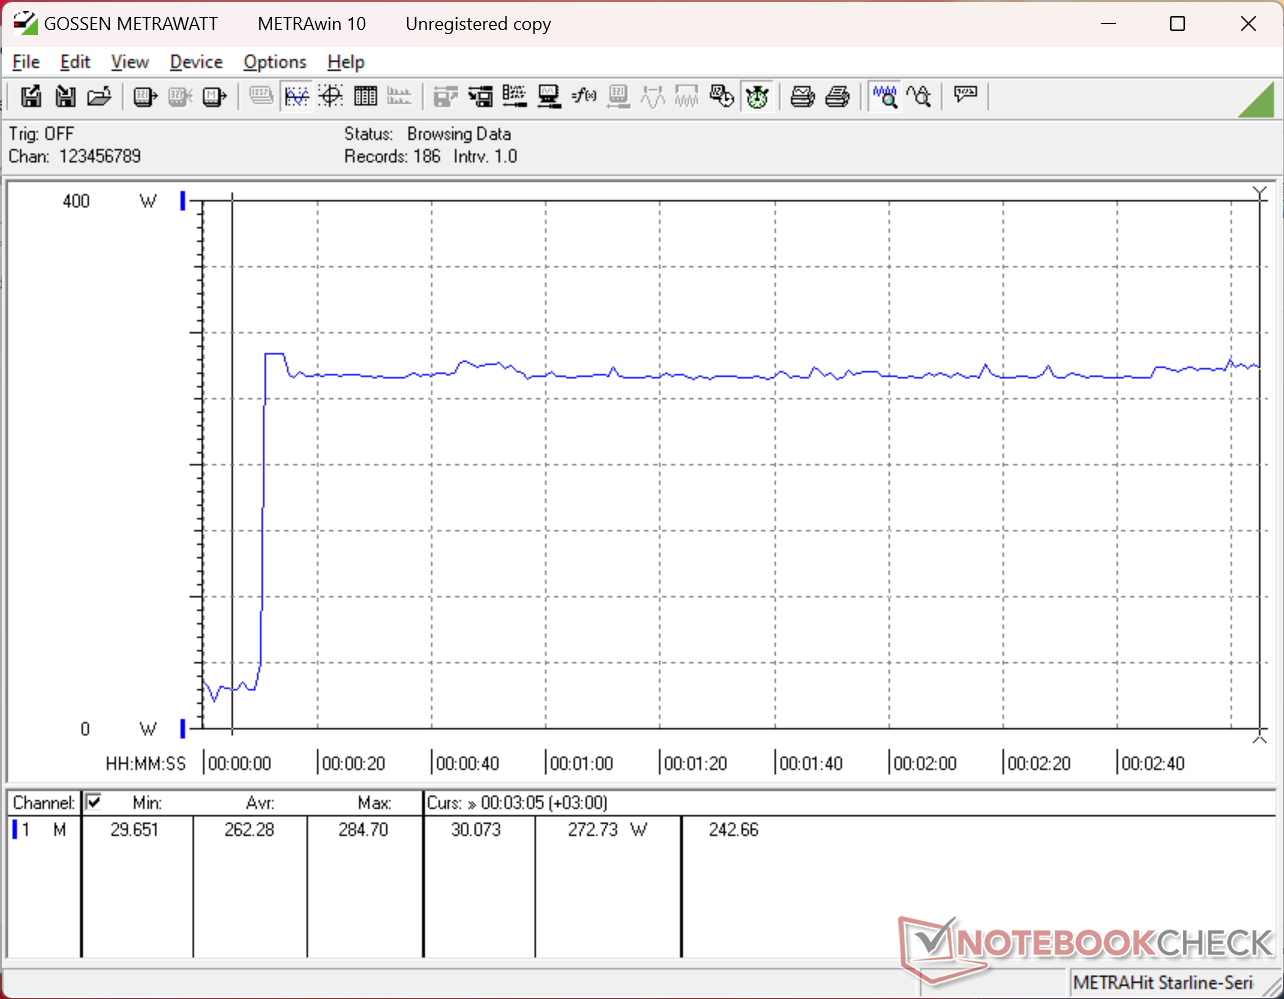
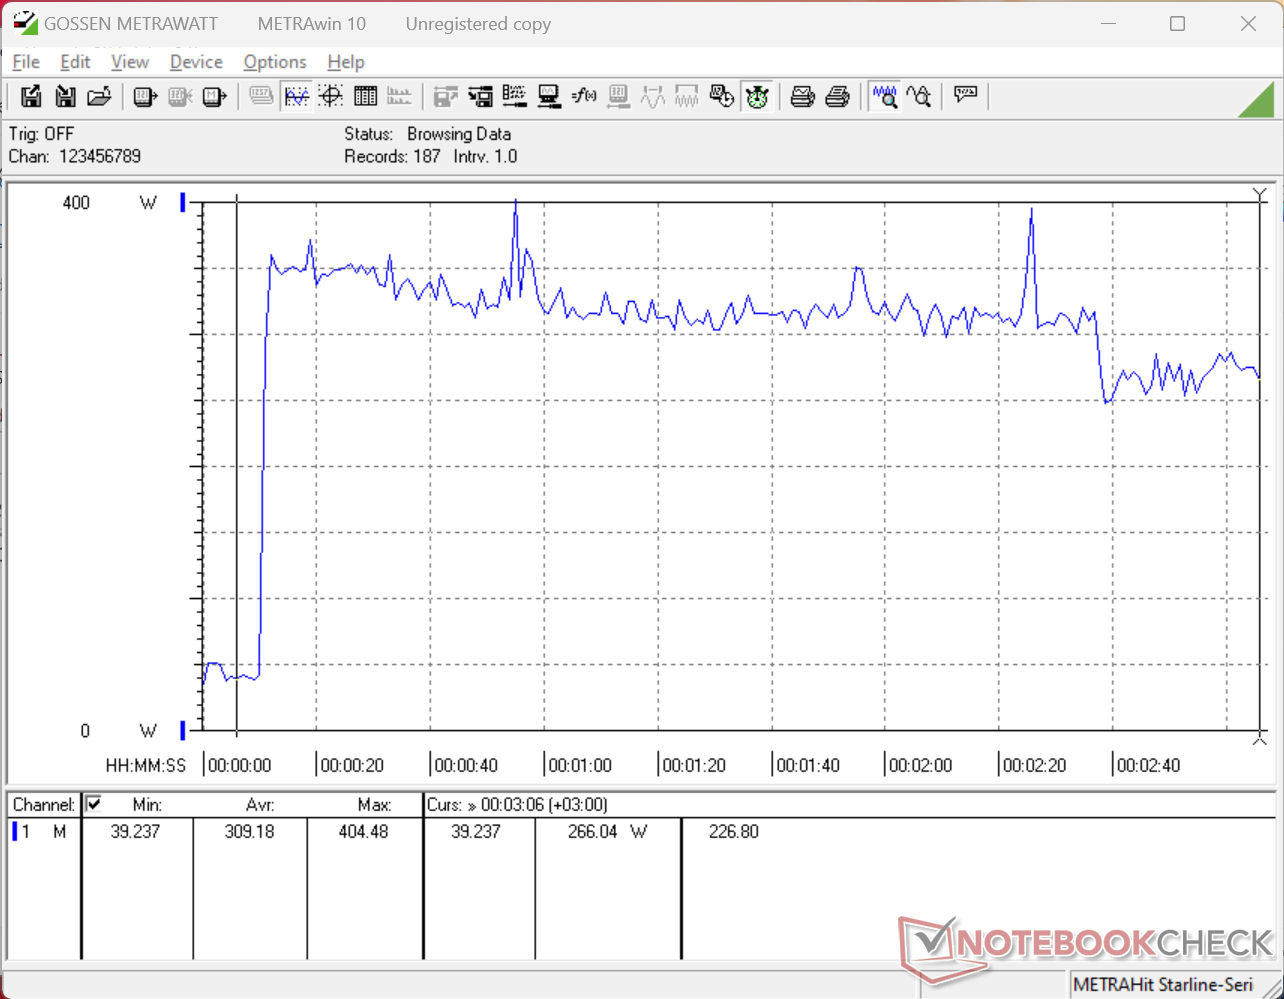
Power Consumption
Power consumption is predictably very high considering the hardware involved. Running Cyberpunk 2077 on Extreme Performance mode is roughly 28 percent more demanding than the Razer Blade 16 even though the latter comes with the same RTX 5090 GPU. The large discrepancy can be attributed to the Arrow Lake-HX CPU when compared to the slower but much more efficient Panther Lake-H series.
We're able to record a temporary maximum draw of 405 W when from large (~18.8 x 8.8 x 3.4 cm) 400 W AC adapter.
| Off / Standby | |
| Idle | |
| Load |
|
Key:
min: | |
| MSI Raider 16 Max HX B2WJ Ultra 9 290HX Plus, GeForce RTX 5090 Laptop, Micron 2500 1TB MTFDKBA1T0QGN, OLED, 2560x1600, 16" | MSI Crosshair 16 HX AI D2XWGKG Ultra 9 275HX, GeForce RTX 5070 Laptop, Micron 2500 1TB MTFDKBA1T0QGN, IPS, 2560x1600, 16" | Razer Blade 16 Core Ultra 9 386H Ultra 9 386H, GeForce RTX 5090 Laptop, Lexar NM790 2TB, OLED, 2560x1600, 16" | Alienware 16X Aurora Core Ultra 9 290HX Plus Ultra 9 290HX Plus, GeForce RTX 5070 Ti Laptop, , OLED, 2560x1600, 16" | Asus TUF Gaming A16 FA608UP R7 260, GeForce RTX 5070 Laptop, Western Digital PC SN5000S SDEQNSJ-1T00, IPS, 2560x1600, 16" | Lenovo Legion 7 16IAX10 Ultra 7 255HX, GeForce RTX 5060 Laptop, WD PC SN7100S SDFPMSL-1T00-1101, OLED, 2560x1600, 16" | |
|---|---|---|---|---|---|---|
| Power Consumption | -53% | 8% | 19% | 38% | 13% | |
| Idle Minimum * (Watt) | 7.2 | 26.2 -264% | 4.4 39% | 6.9 4% | 4.6 36% | 9.4 -31% |
| Idle Average * (Watt) | 12 | 33.8 -182% | 22.3 -86% | 8.1 32% | 9.8 18% | 10.6 12% |
| Idle Maximum * (Watt) | 32.8 | 34 -4% | 30.4 7% | 31 5% | 10.2 69% | 36.4 -11% |
| Load Average * (Watt) | 133 | 112 16% | 110.7 17% | 131.6 1% | 76.1 43% | 107.7 19% |
| Cyberpunk 2077 ultra external monitor * (Watt) | 275 | 220 20% | 216 21% | 172.1 37% | 198.1 28% | 187.5 32% |
| Cyberpunk 2077 ultra * (Watt) | 276 | 224 19% | 216 22% | 198.3 28% | 198.9 28% | 188 32% |
| Load Maximum * (Watt) | 404.5 | 315 22% | 251.3 38% | 300.1 26% | 235.2 42% | 247 39% |
* ... smaller is better
Power Consumption Cyberpunk / Stress Test
Power Consumption external Monitor
Battery Life
Runtimes are decent but shorter than many previous generation models partly due to the move from IPS to OLED.
| MSI Raider 16 Max HX B2WJ Ultra 9 290HX Plus, GeForce RTX 5090 Laptop, 91.8 Wh | MSI Crosshair 16 HX AI D2XWGKG Ultra 9 275HX, GeForce RTX 5070 Laptop, 90 Wh | Razer Blade 16 Core Ultra 9 386H Ultra 9 386H, GeForce RTX 5090 Laptop, 90 Wh | Alienware 16X Aurora Core Ultra 9 290HX Plus Ultra 9 290HX Plus, GeForce RTX 5070 Ti Laptop, 96 Wh | Asus TUF Gaming A16 FA608UP R7 260, GeForce RTX 5070 Laptop, 90 Wh | Lenovo Legion 7 16IAX10 Ultra 7 255HX, GeForce RTX 5060 Laptop, 84 Wh | |
|---|---|---|---|---|---|---|
| Battery runtime | 41% | 48% | -6% | 65% | -41% | |
| WiFi v1.3 (h) | 7.9 | 11.1 41% | 11.7 48% | 7.4 -6% | 13 65% | 4.7 -41% |
| H.264 (h) | 14.2 |
Notebookcheck Rating
The Raider 16 Max HX is heavier and bigger than many other 16-inch gaming laptops, but it's able to squeeze more performance from the CPU and GPU as a result.
MSI Raider 16 Max HX B2WJ
- 06/09/2026 v8
Allen Ngo
 Total Sustainability Score:
 Potential Competitors in Comparison
Image | Model / Review | Price | Weight | Height | Display |
|---|---|---|---|---|---|
1. 87.7%  | MSI Raider 16 Max HX B2WJ Intel Core Ultra 9 290HX Plus ⎘ NVIDIA GeForce RTX 5090 Laptop ⎘ 32 GB Memory, 1024 GB SSD | Amazon: List Price: 4200 USD | 2.7 kg | 28.9 mm | 16.00" 2560x1600 189 PPI OLED |
2. 81.9%  | MSI Crosshair 16 HX AI D2XWGKG Intel Core Ultra 9 275HX ⎘ NVIDIA GeForce RTX 5070 Laptop ⎘ 16 GB Memory, 1024 GB SSD | Amazon: List Price: 2500 EUR | 2.5 kg | 27.9 mm | 16.00" 2560x1600 189 PPI IPS |
3. 87.7%  | Razer Blade 16 Core Ultra 9 386H Intel Core Ultra 9 386H ⎘ NVIDIA GeForce RTX 5090 Laptop ⎘ 32 GB Memory, 2048 GB SSD | Amazon: 1. $3,499.99 Razer Blade 16 (2026) Gaming... 2. $4,899.99 Razer Blade 16 (2026) Gaming... 3. $5,599.99 Razer Blade 16 (2026) Gaming... List Price: 4900 USD | 2.1 kg | 17.4 mm | 16.00" 2560x1600 189 PPI OLED |
4. 85.9%  | Alienware 16X Aurora Core Ultra 9 290HX Plus Intel Core Ultra 9 290HX Plus ⎘ NVIDIA GeForce RTX 5070 Ti Laptop ⎘ 32 GB Memory | Amazon: List Price: 3000 USD | 2.6 kg | 23.4 mm | 16.00" 2560x1600 189 PPI OLED |
5. 83.8%  | Asus TUF Gaming A16 FA608UP AMD Ryzen 7 260 ⎘ NVIDIA GeForce RTX 5070 Laptop ⎘ 32 GB Memory, 1024 GB SSD | Amazon: List Price: 2199€ | 2.2 kg | 25.7 mm | 16.00" 2560x1600 189 PPI IPS |
6. 86.6%  | Lenovo Legion 7 16IAX10 Intel Core Ultra 7 255HX ⎘ NVIDIA GeForce RTX 5060 Laptop ⎘ 32 GB Memory, 1024 GB SSD | Amazon: List Price: 1650 USD | 2 kg | 17.9 mm | 16.00" 2560x1600 189 PPI OLED |
Transparency
The selection of devices to be reviewed is made by our editorial team. The test sample was provided to the author as a loan by the manufacturer or retailer for the purpose of this review. The lender had no influence on this review, nor did the manufacturer receive a copy of this review before publication. There was no obligation to publish this review. As an independent media company, Notebookcheck is not subjected to the authority of manufacturers, retailers or publishers.
This is how Notebookcheck is testing
Every year, Notebookcheck independently reviews hundreds of laptops and smartphones using standardized procedures to ensure that all results are comparable. We have continuously developed our test methods for around 20 years and set industry standards in the process. In our test labs, high-quality measuring equipment is utilized by experienced technicians and editors. These tests involve a multi-stage validation process. Our complex rating system is based on hundreds of well-founded measurements and benchmarks, which maintains objectivity. Further information on our test methods can be found here.
