Verdict — Raw Performance With Only Minimal Luxuries
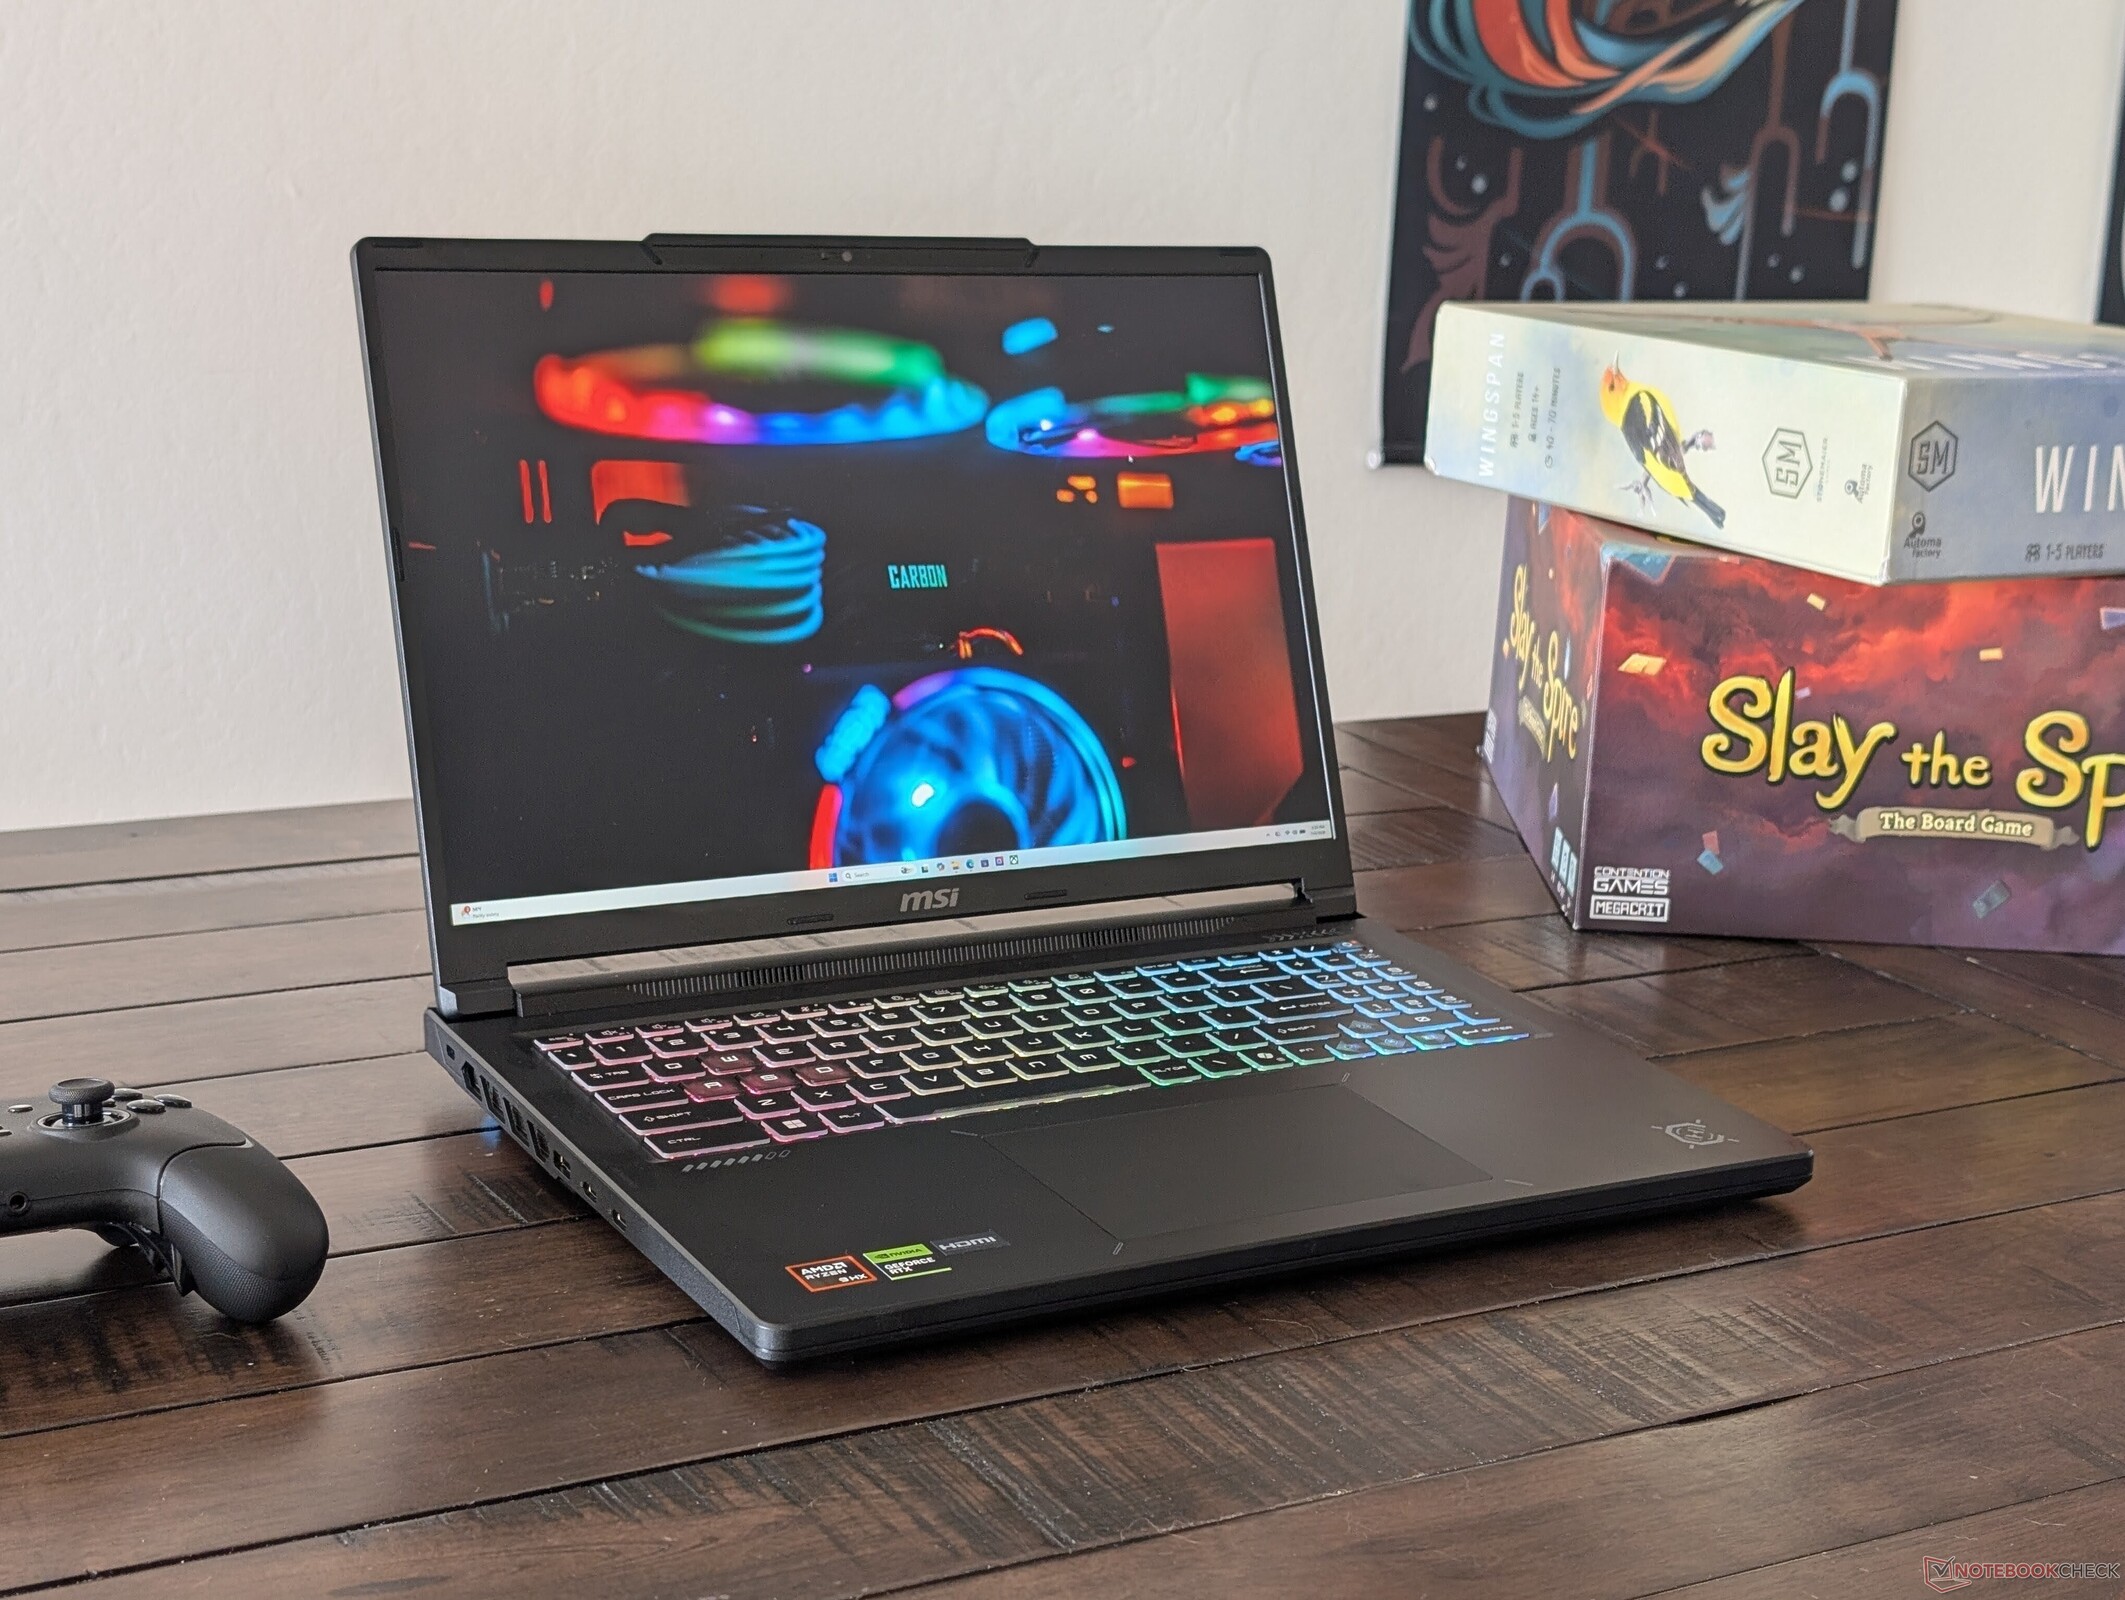
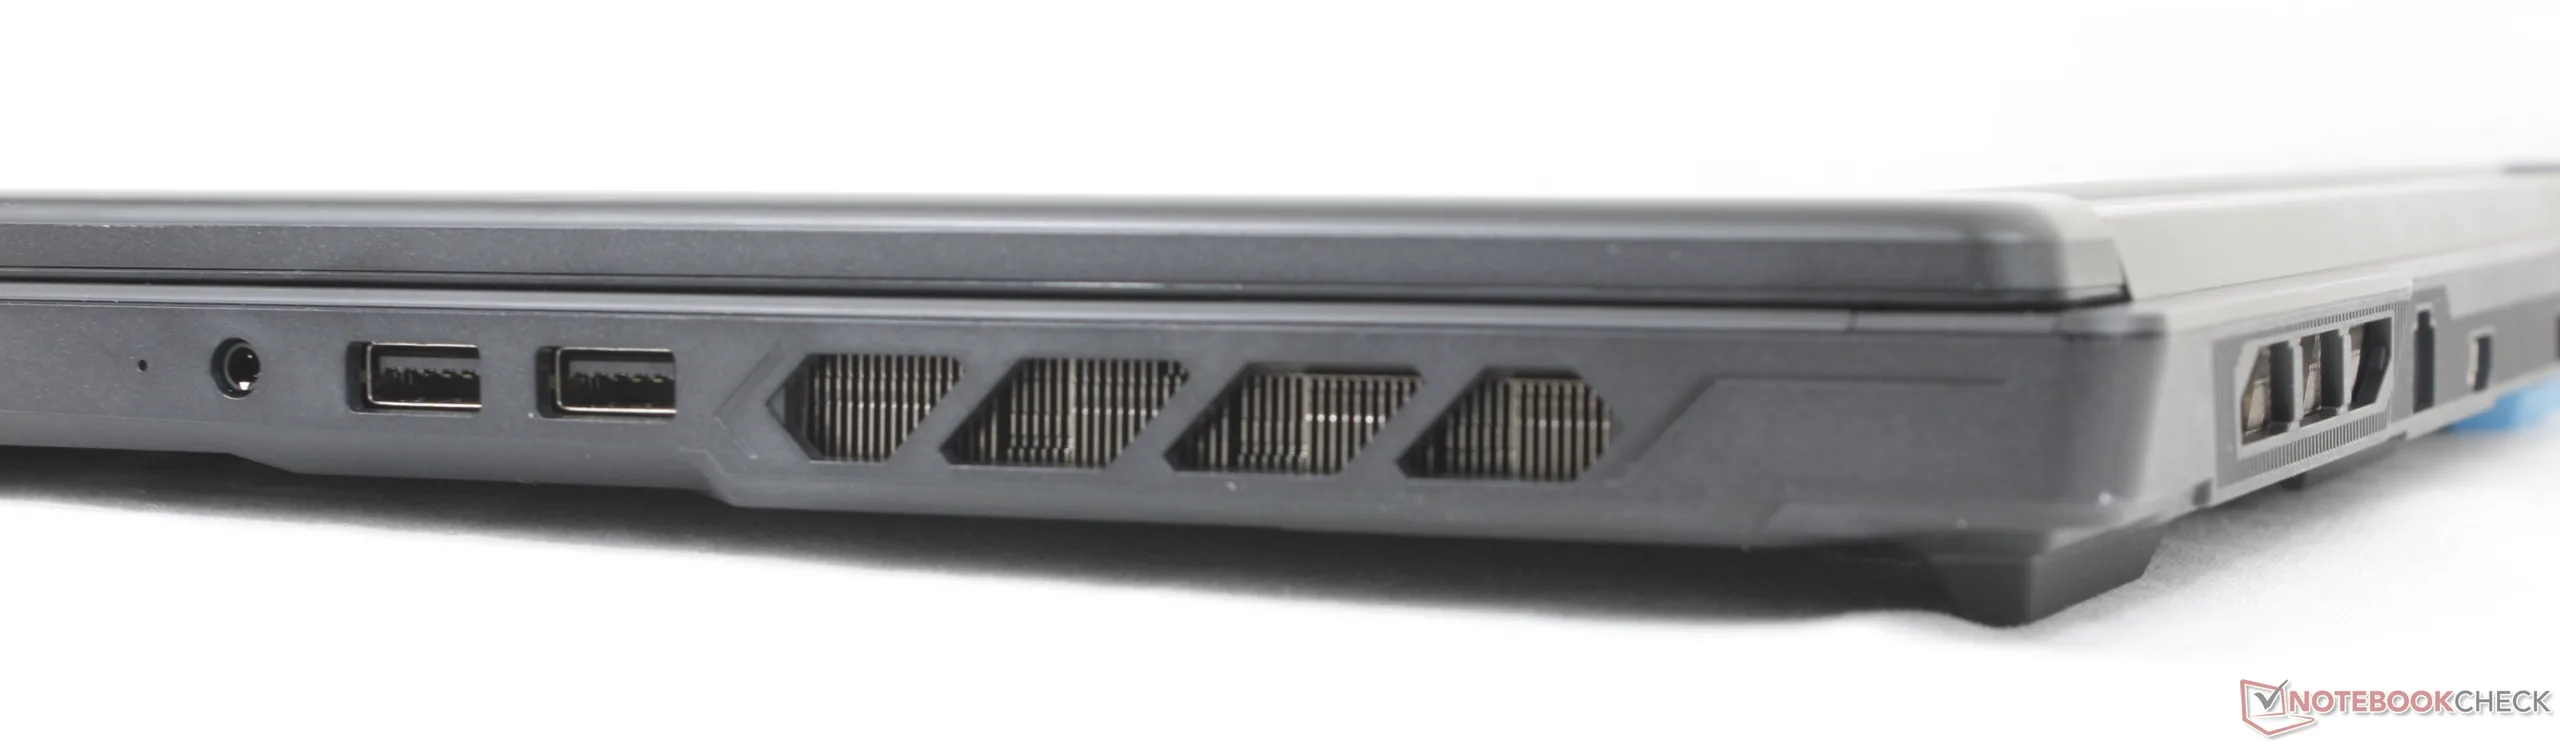
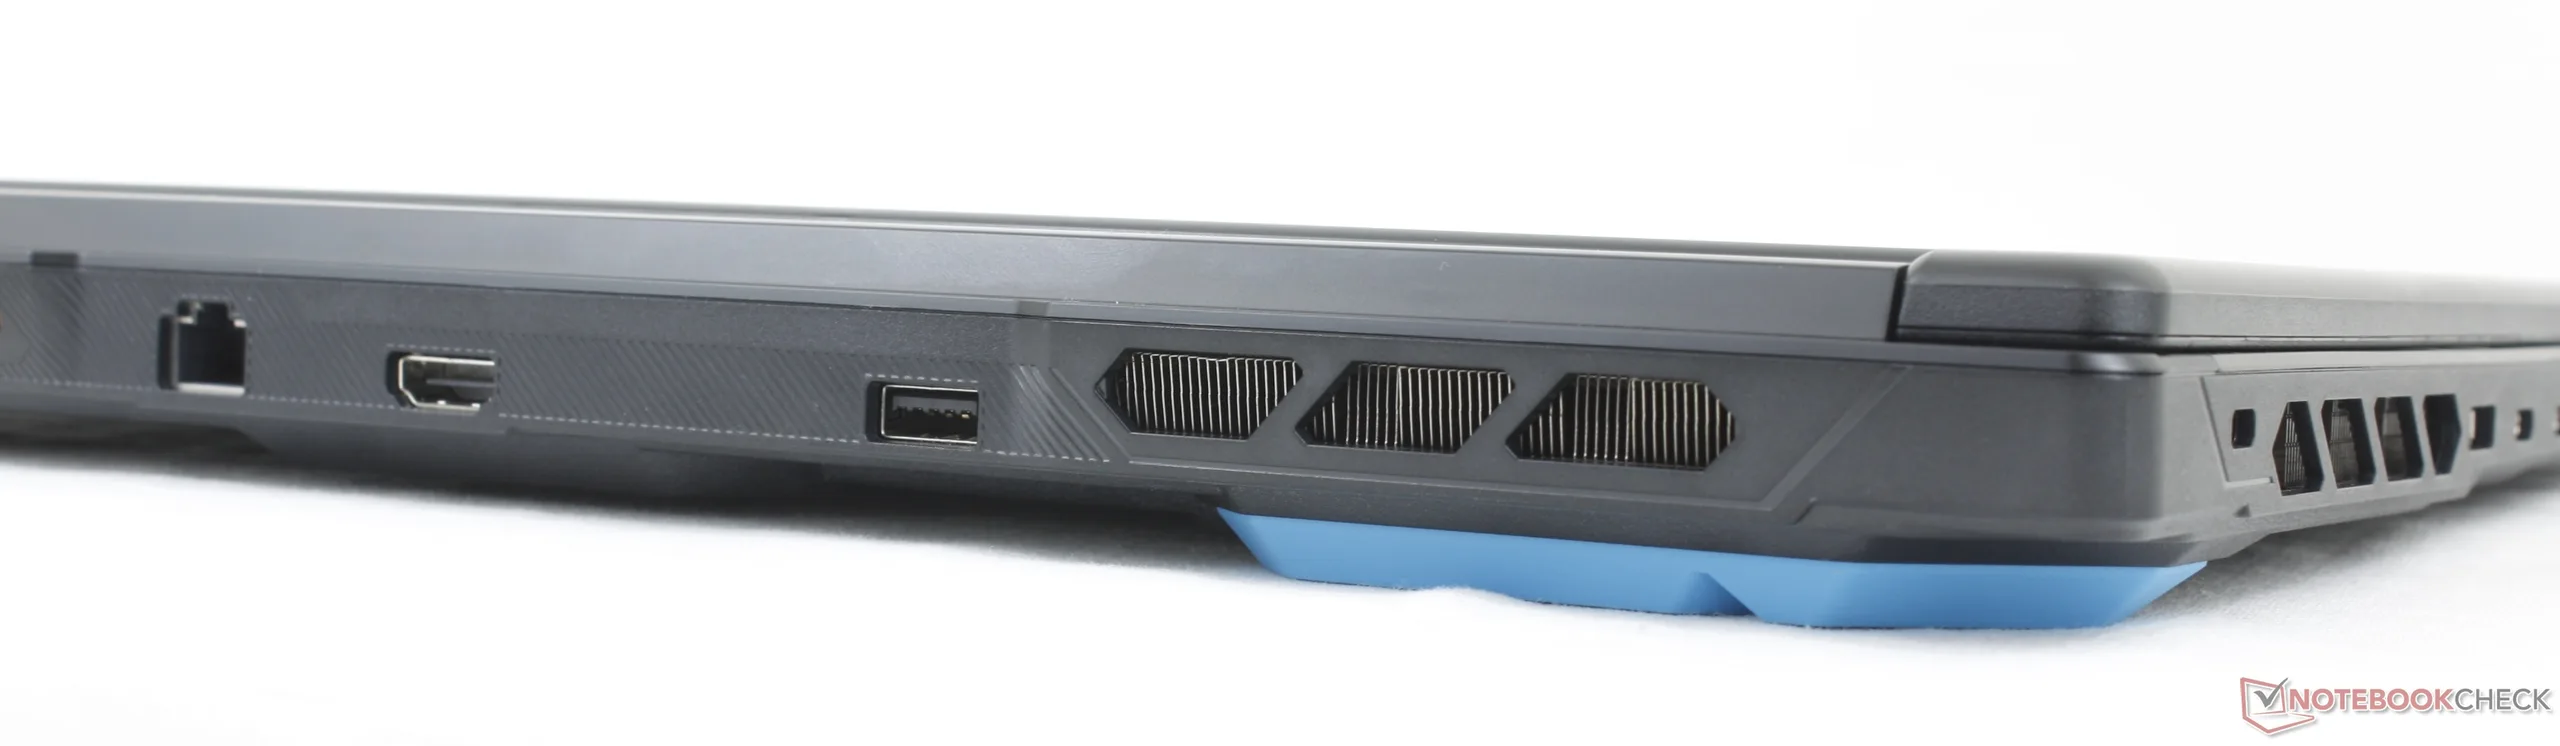
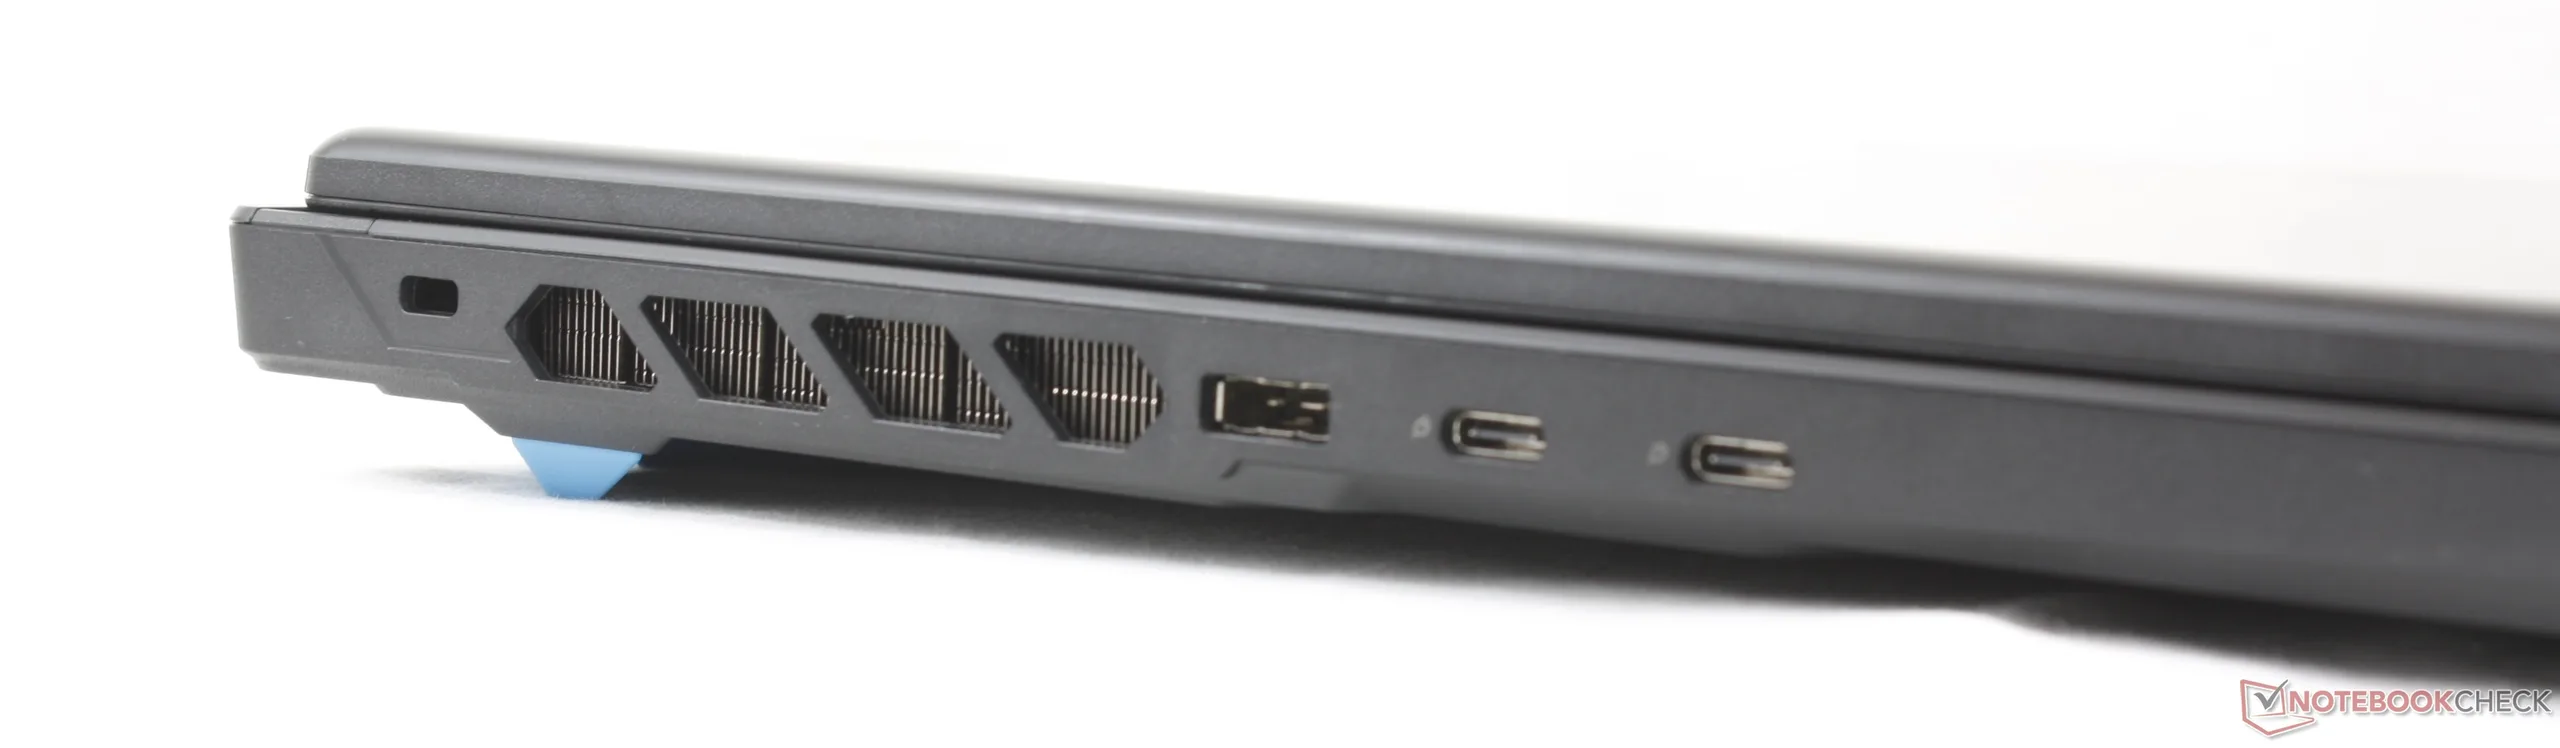
The Crosshair A16 HX excels at performance especially for a midrange AMD-Nvidia gaming laptop. Despite it running on an older Zen 4 platform, the Ryzen 9 8840HS CPU outperforms the newer Ryzen AI 9 470 Zen 5 CPU while being within 5 to 10 percent of the more expensive Intel Core Ultra 9 275HX. The physical updates to the chassis are also a step in the right direction as the system offers more ports, a larger clickpad, and a slightly thinner and lighter design than the Intel-based Crosshair 16 HX for easier transport.
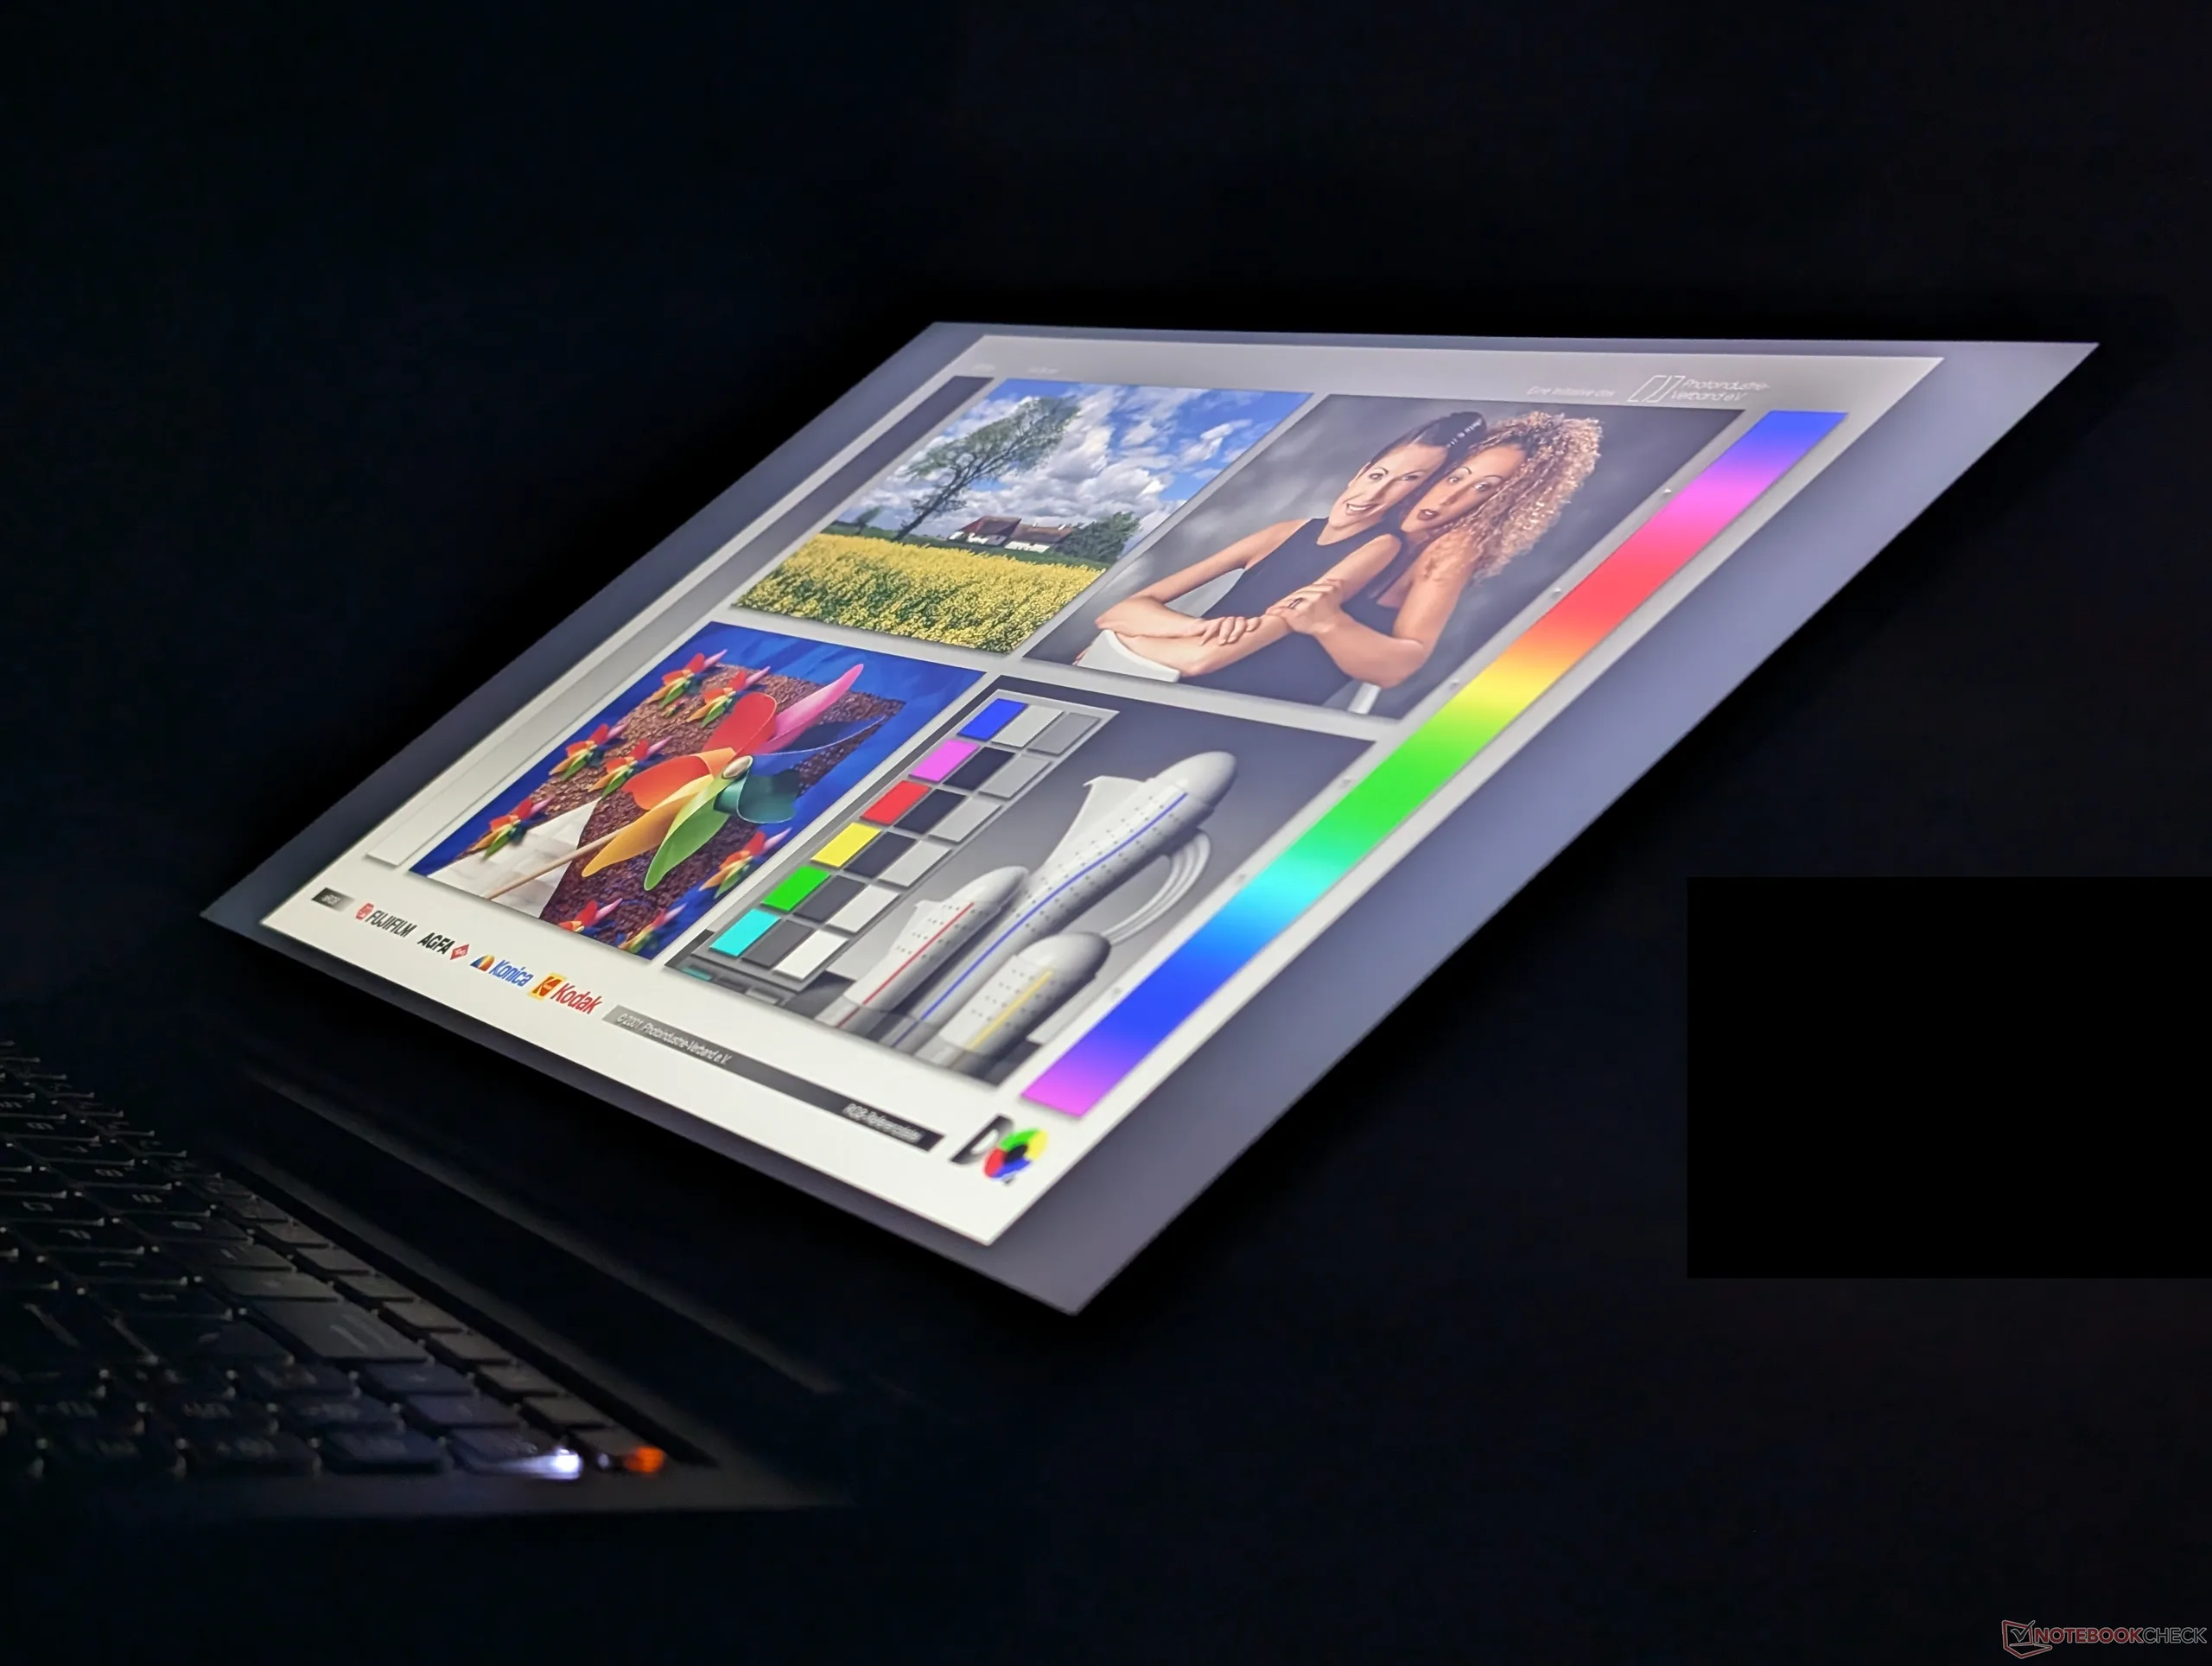
The 1600p240 IPS display with 95% P3 colors deserves a mention as well. We appreciate that all current configurations ship with the same high quality panel including even the base RTX 5060 SKU and so buyers needn't worry about lowly 45% NTSC options.
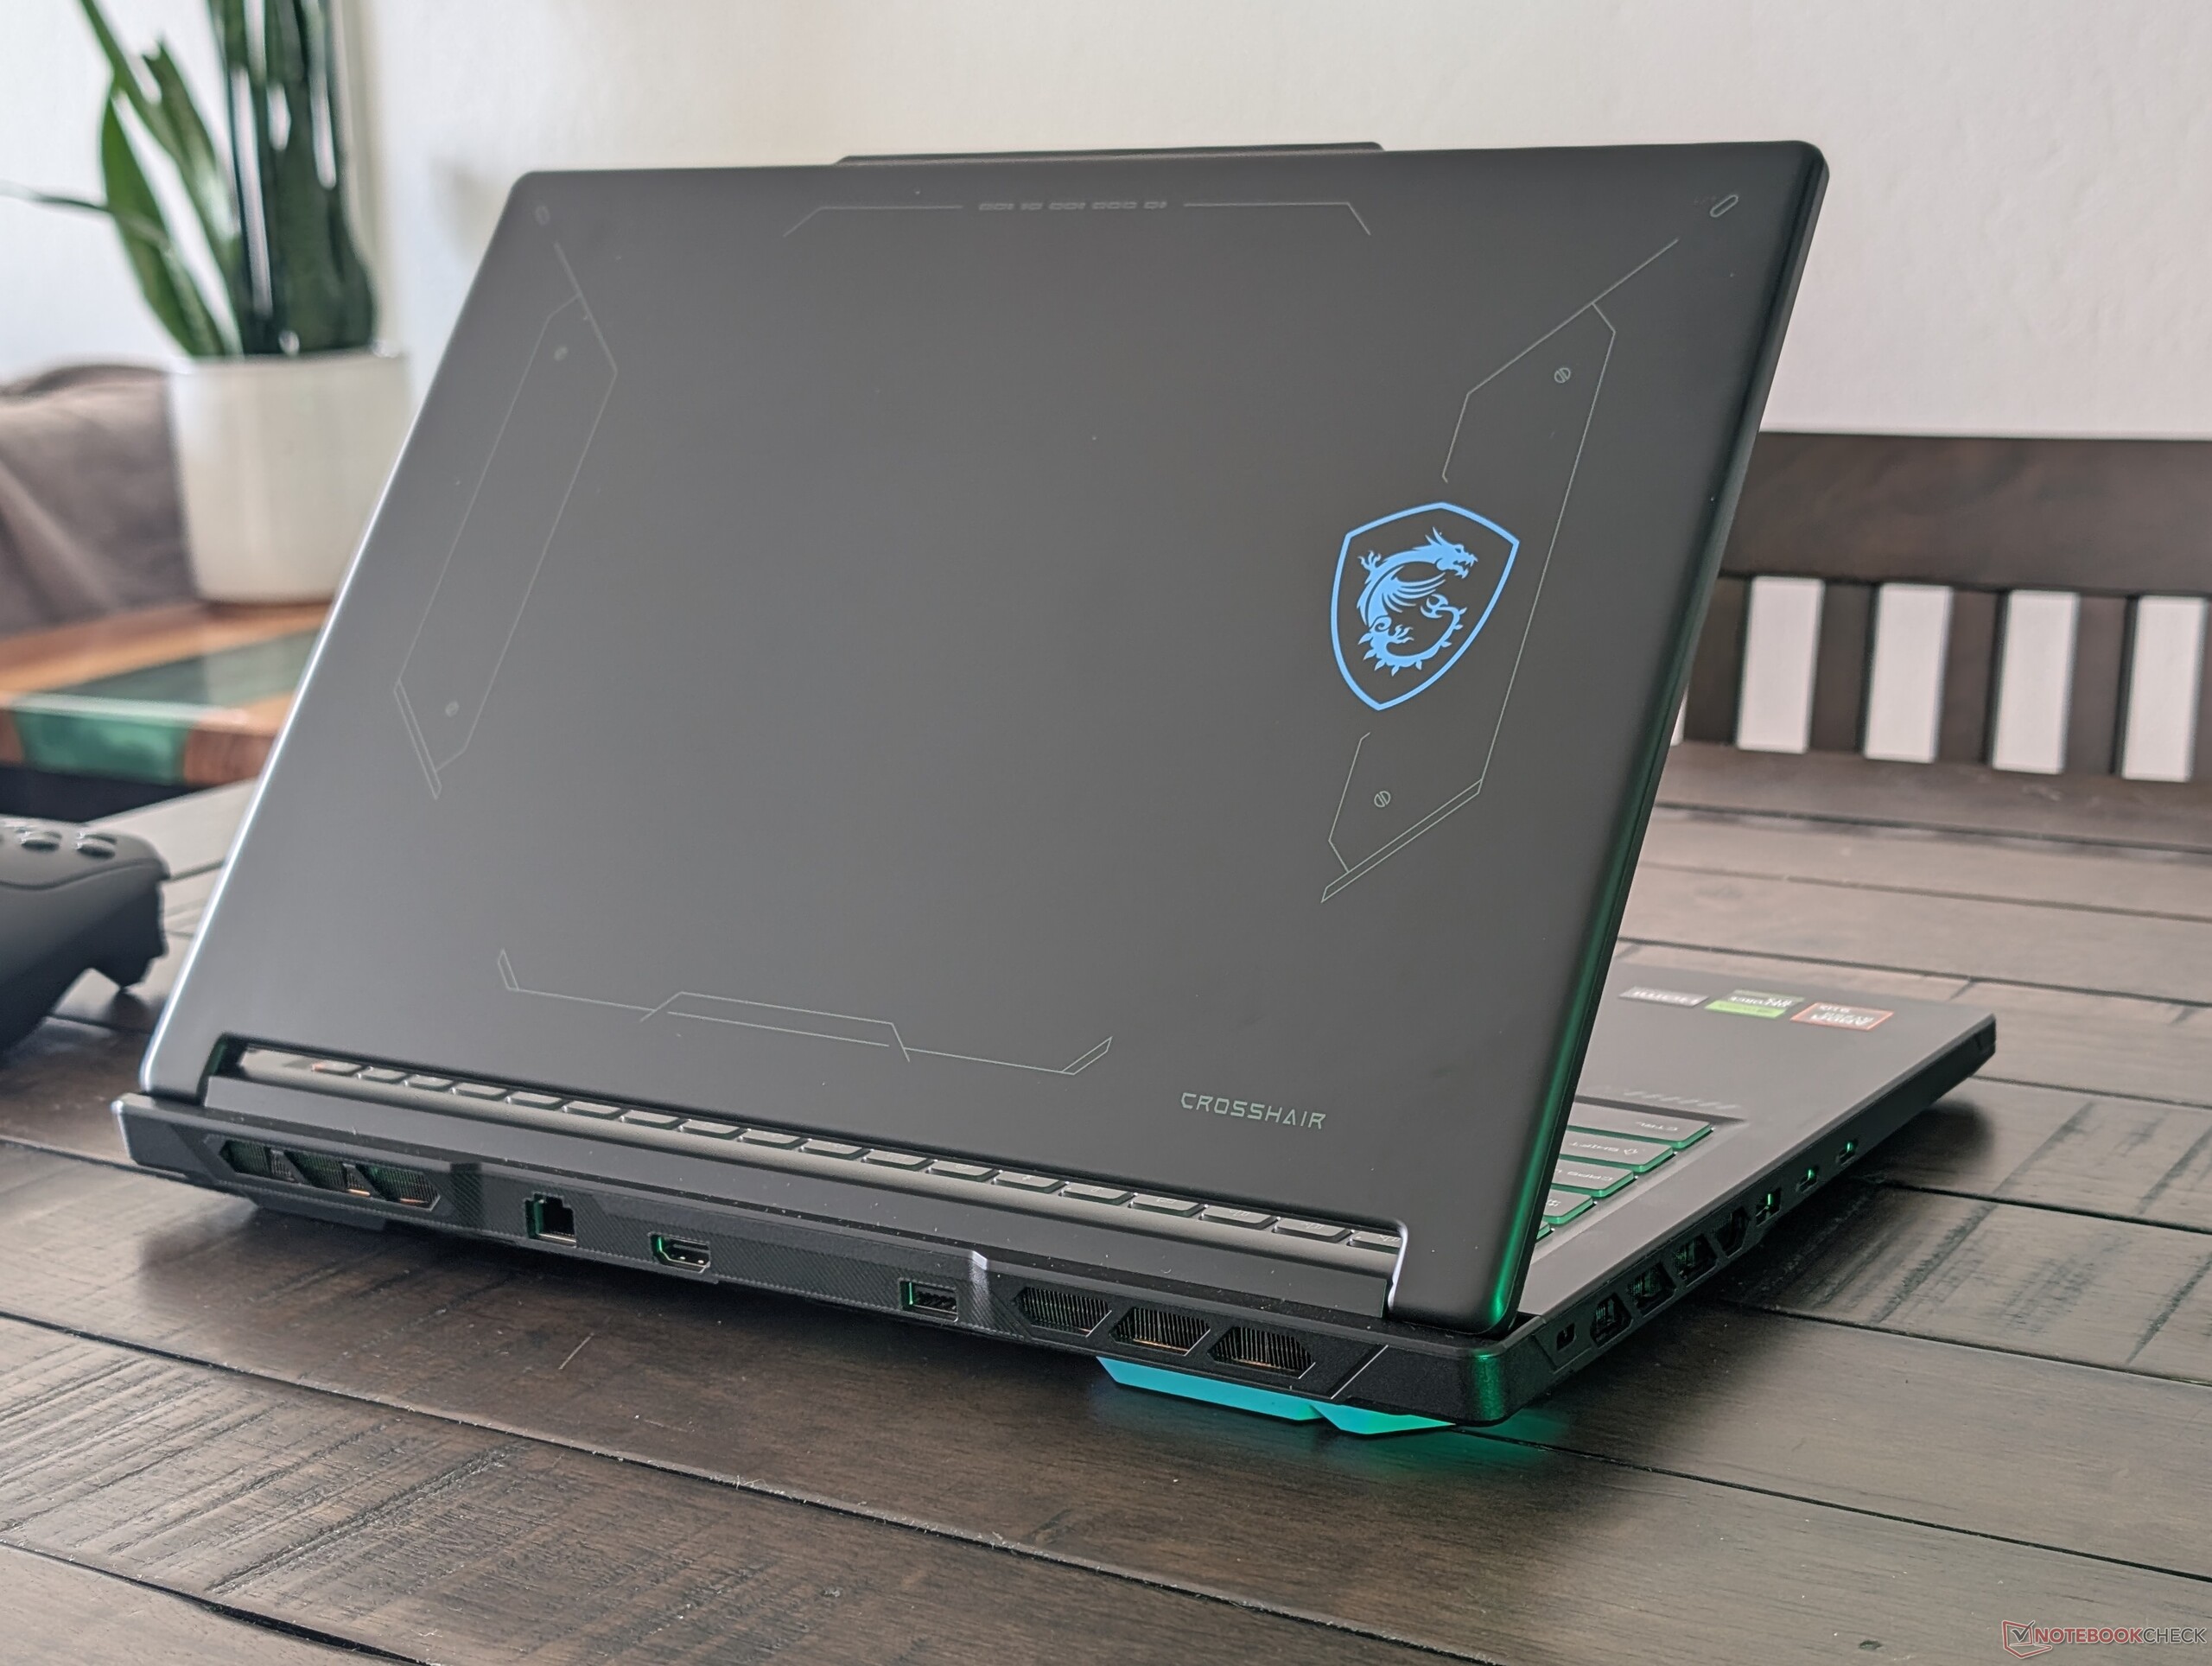
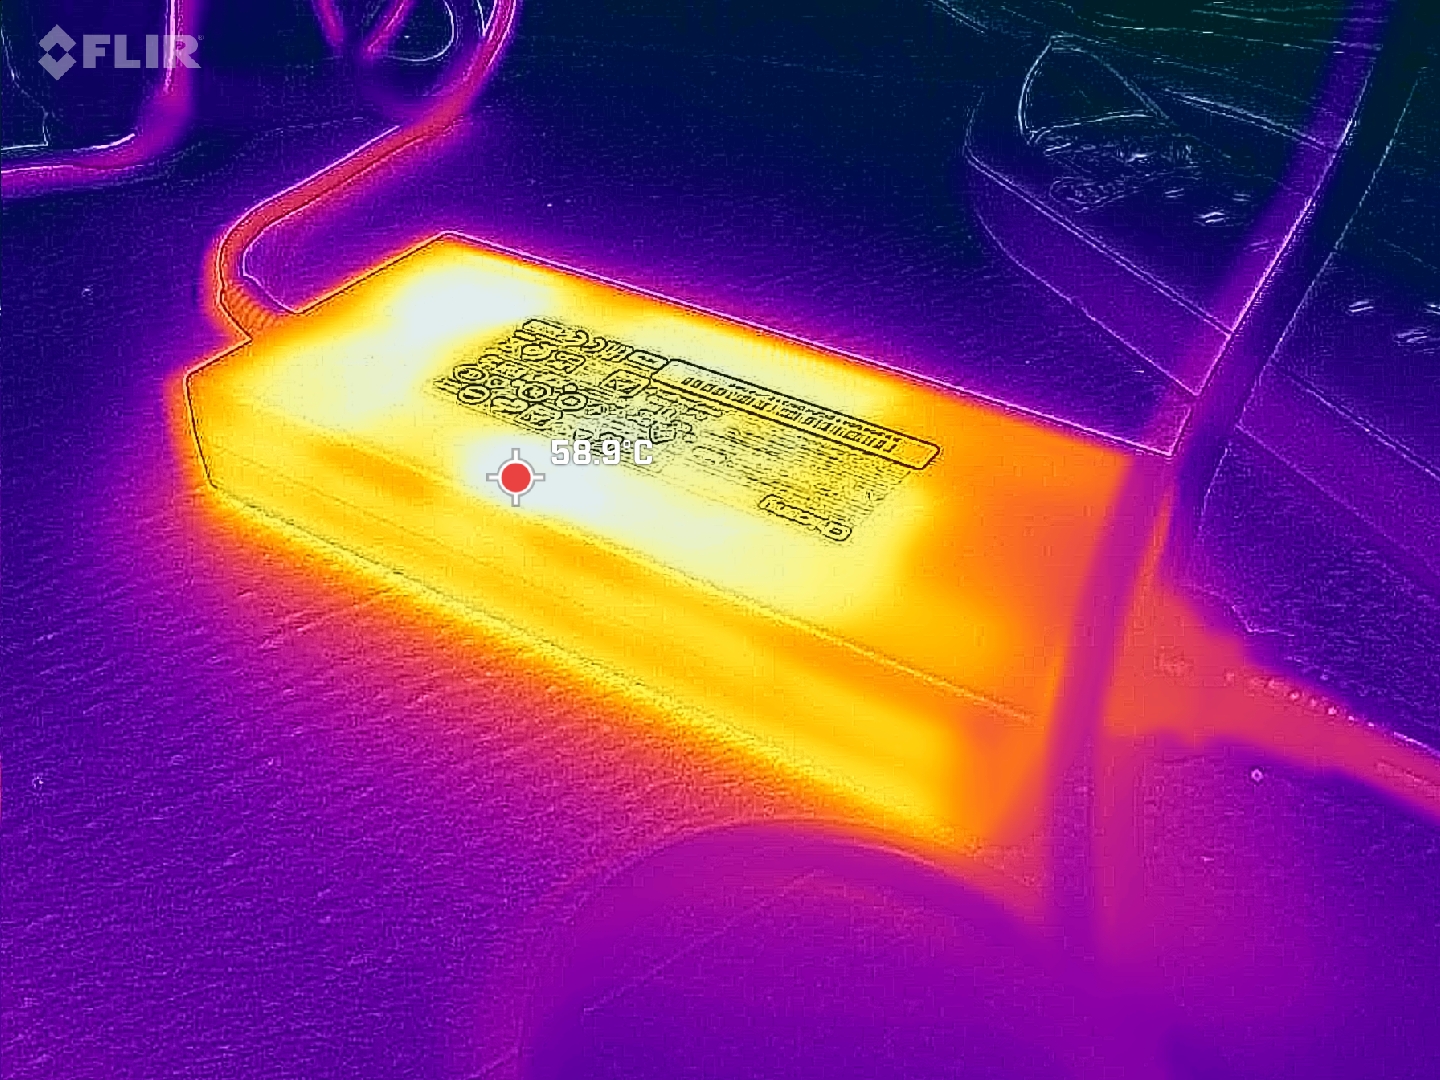
While the performance and chassis updates are great, the Crosshair A16 HX is still a budget-oriented model and so the cut corners are noticeable. The dull plastic chassis in particular is very prone to fingerprints while the poor speakers, lack of G-Sync, Advanced Optimus, HDR, and per-key RGB lighting are thorns to the overall gaming experience. The 240 W AC adapter feels a bit too small as the demanding laptop already averages almost 250 W when gaming leading to very warm AC adapter temperatures and generally shorter battery life.
Pros
Cons
Price and Availability
The configuration as reviewed with the RTX 5070 is now shipping on Amazon for $2700.
The Crosshair A16 HX is the AMD version of the Intel-based Crosshair 16 HX. Nonetheless, there are several differences between the models both inside and out. The Crosshair series is home to some of MSI's more affordable gaming laptops in contrast to the pricier Raider or Titan series.
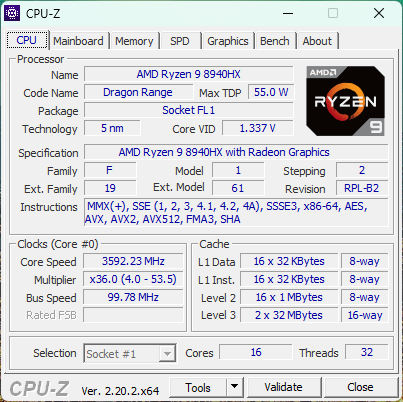
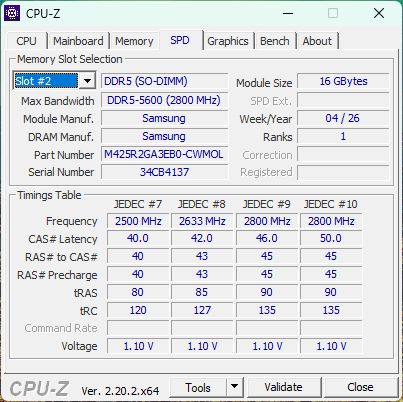
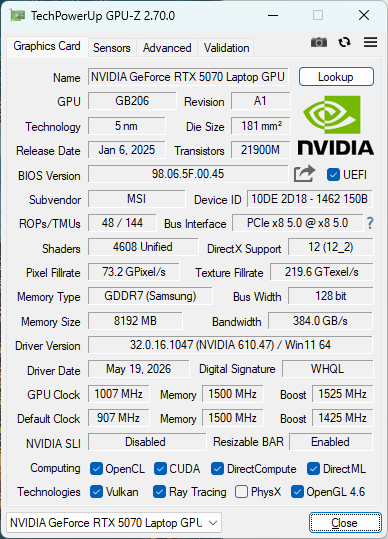
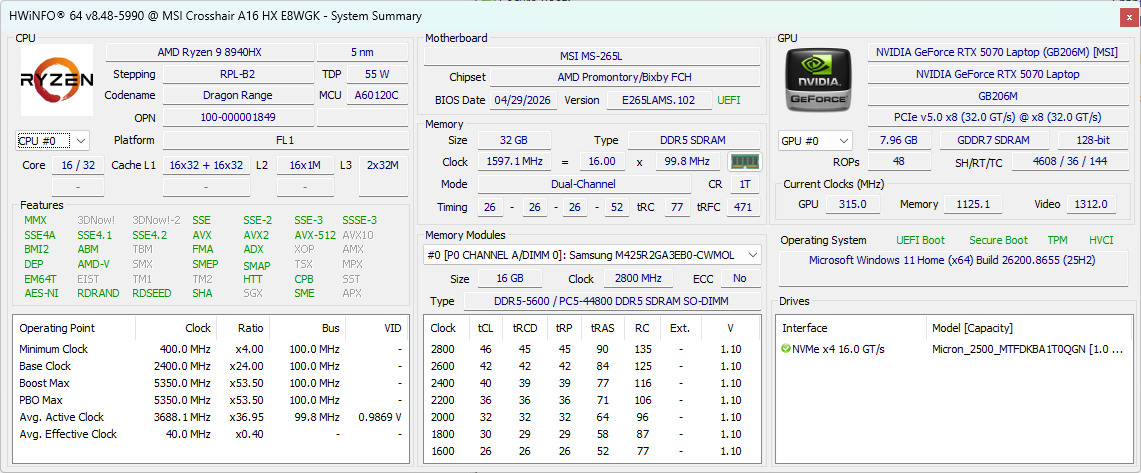
Our test unit is a higher-end configuration with the Ryzen 9 8940HX Zen 4 CPU, 115 W GeForce RTX 5070 GPU, and 1600p IPS display for approximately $2700. Lesser SKUs ship with the RTX 5060 instead but all configurations come with the same IPS display.
Alternatives include other affordable to midrange gaming laptops like the Asus TUF series, Alienware 16 Aurora, or the Acer Nitro V 16.
More MSI reviews:
Specifications
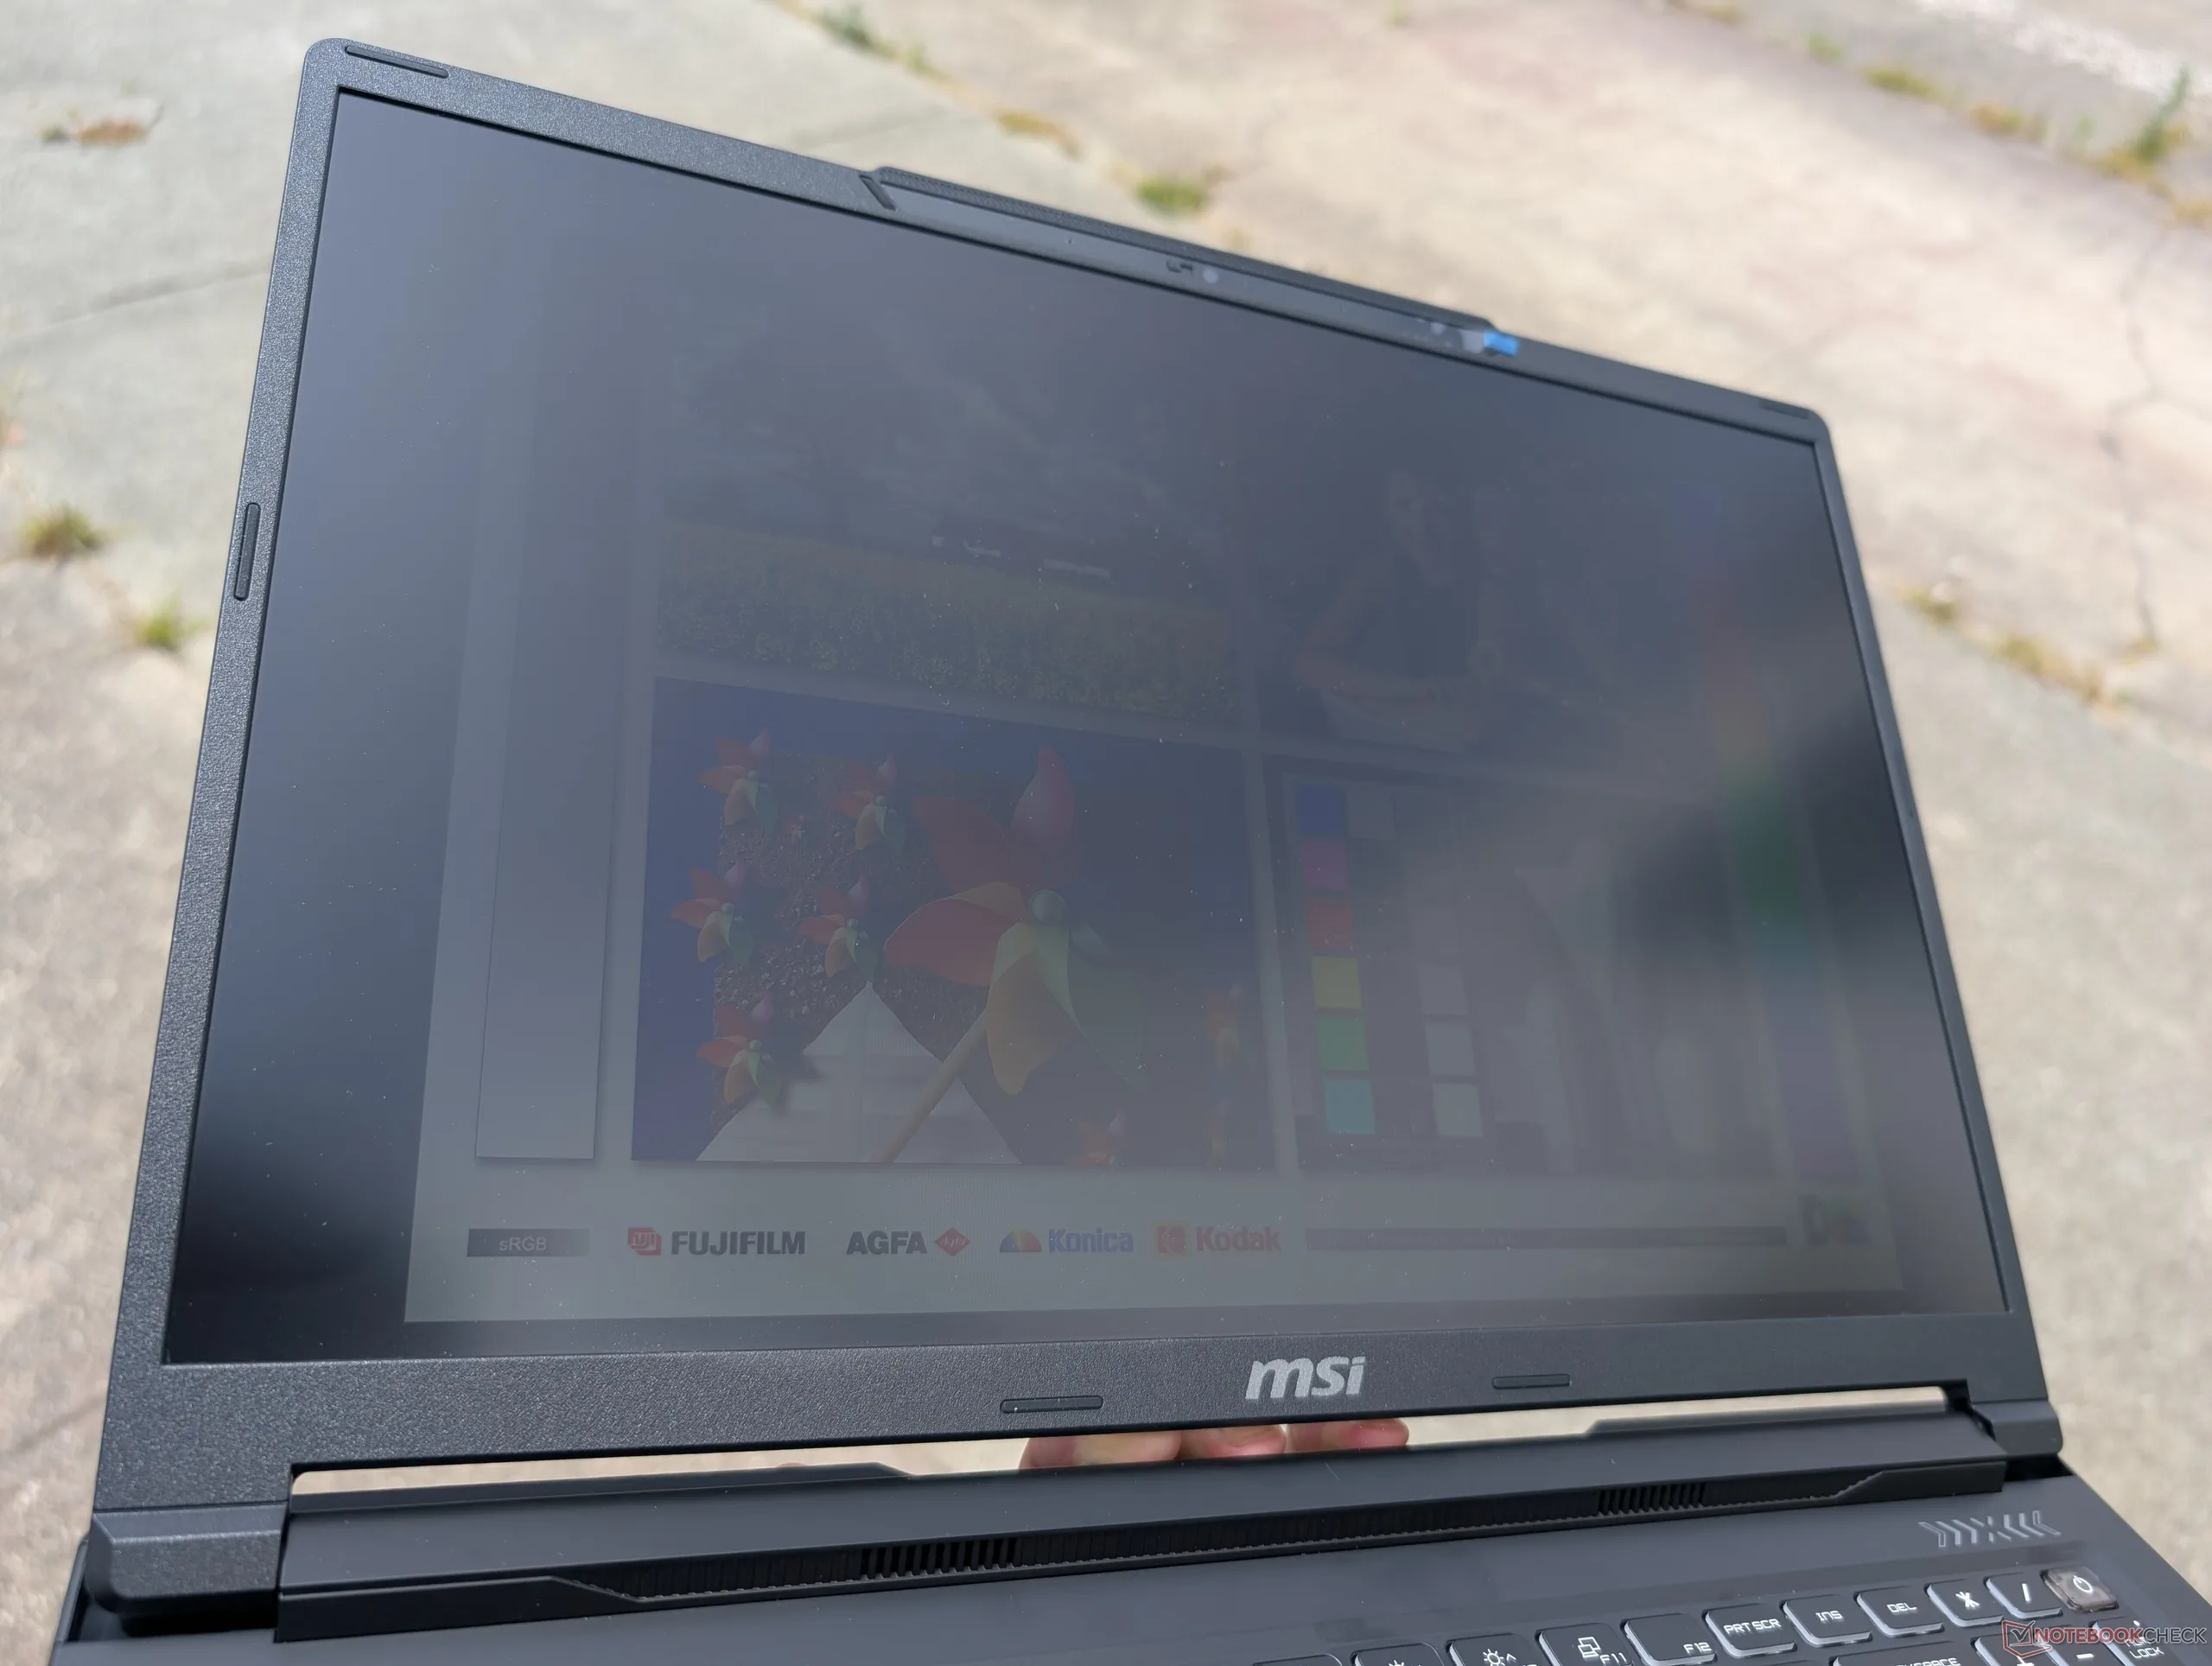
Case
The chassis is mostly matte black plastic with no extraneous RGB lights to save on costs. The display hinges open up to about 150 degrees maximum.
Connectivity
Communication
Webcam


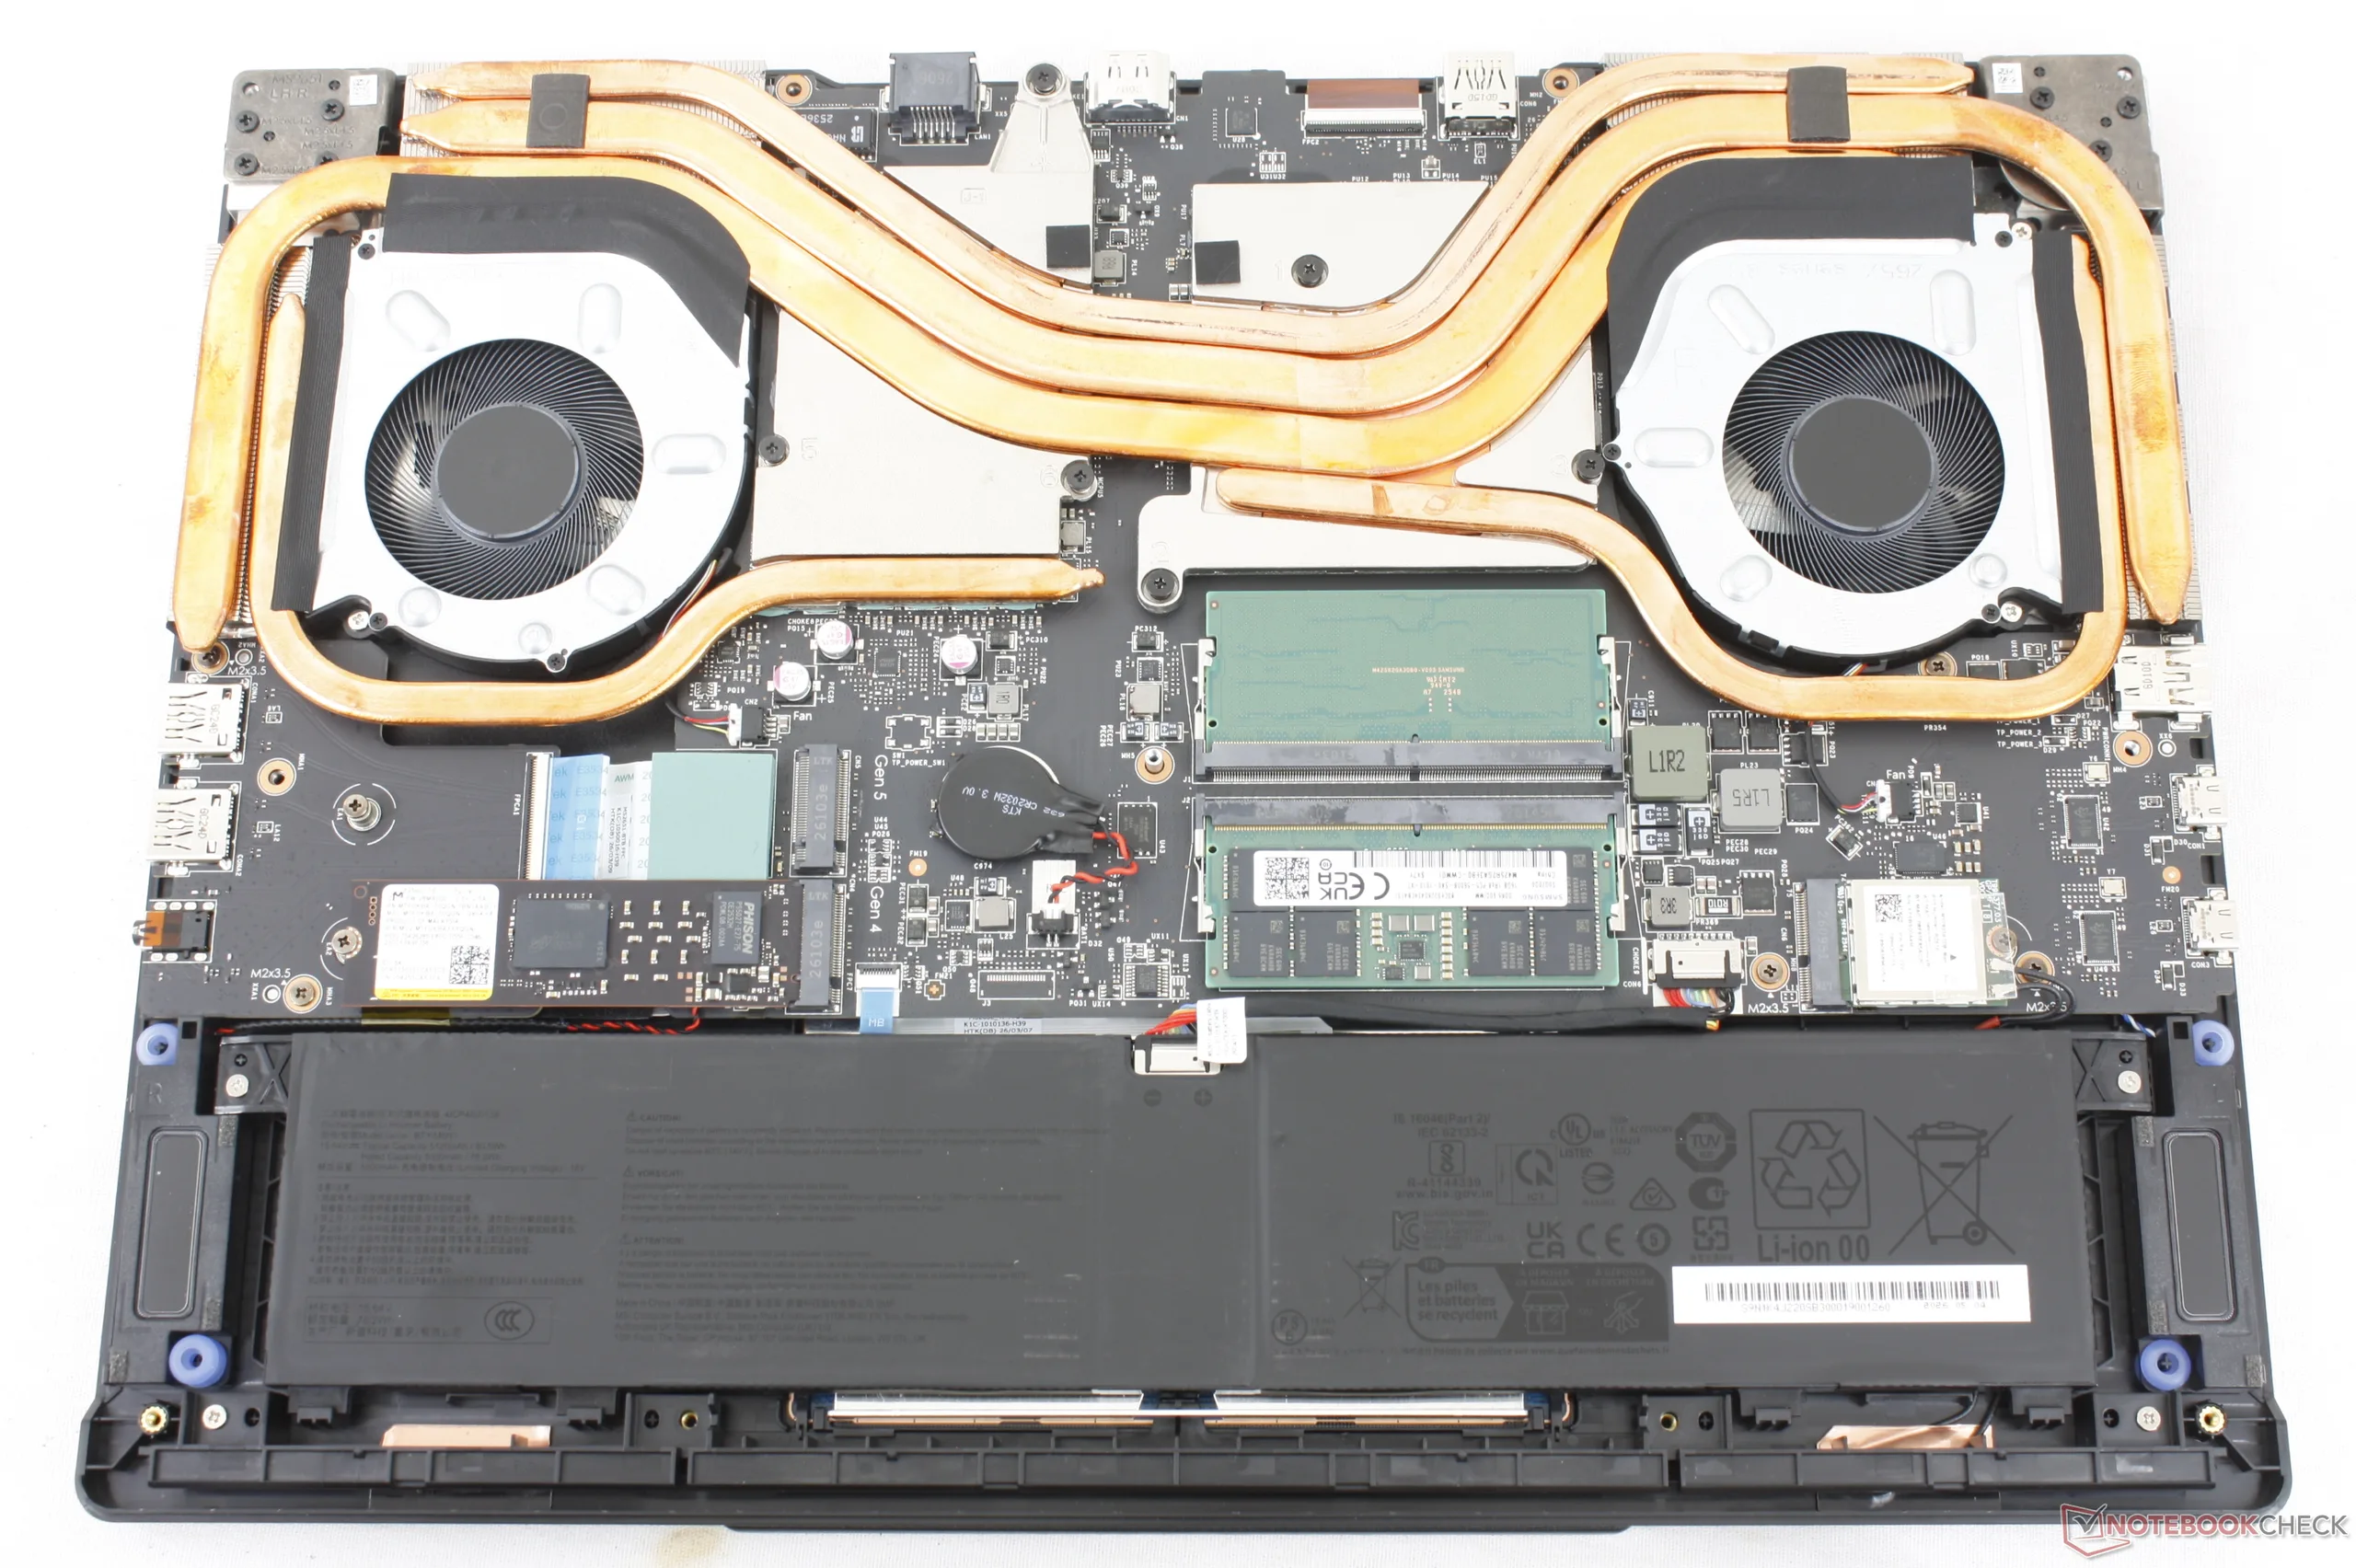
Maintenance

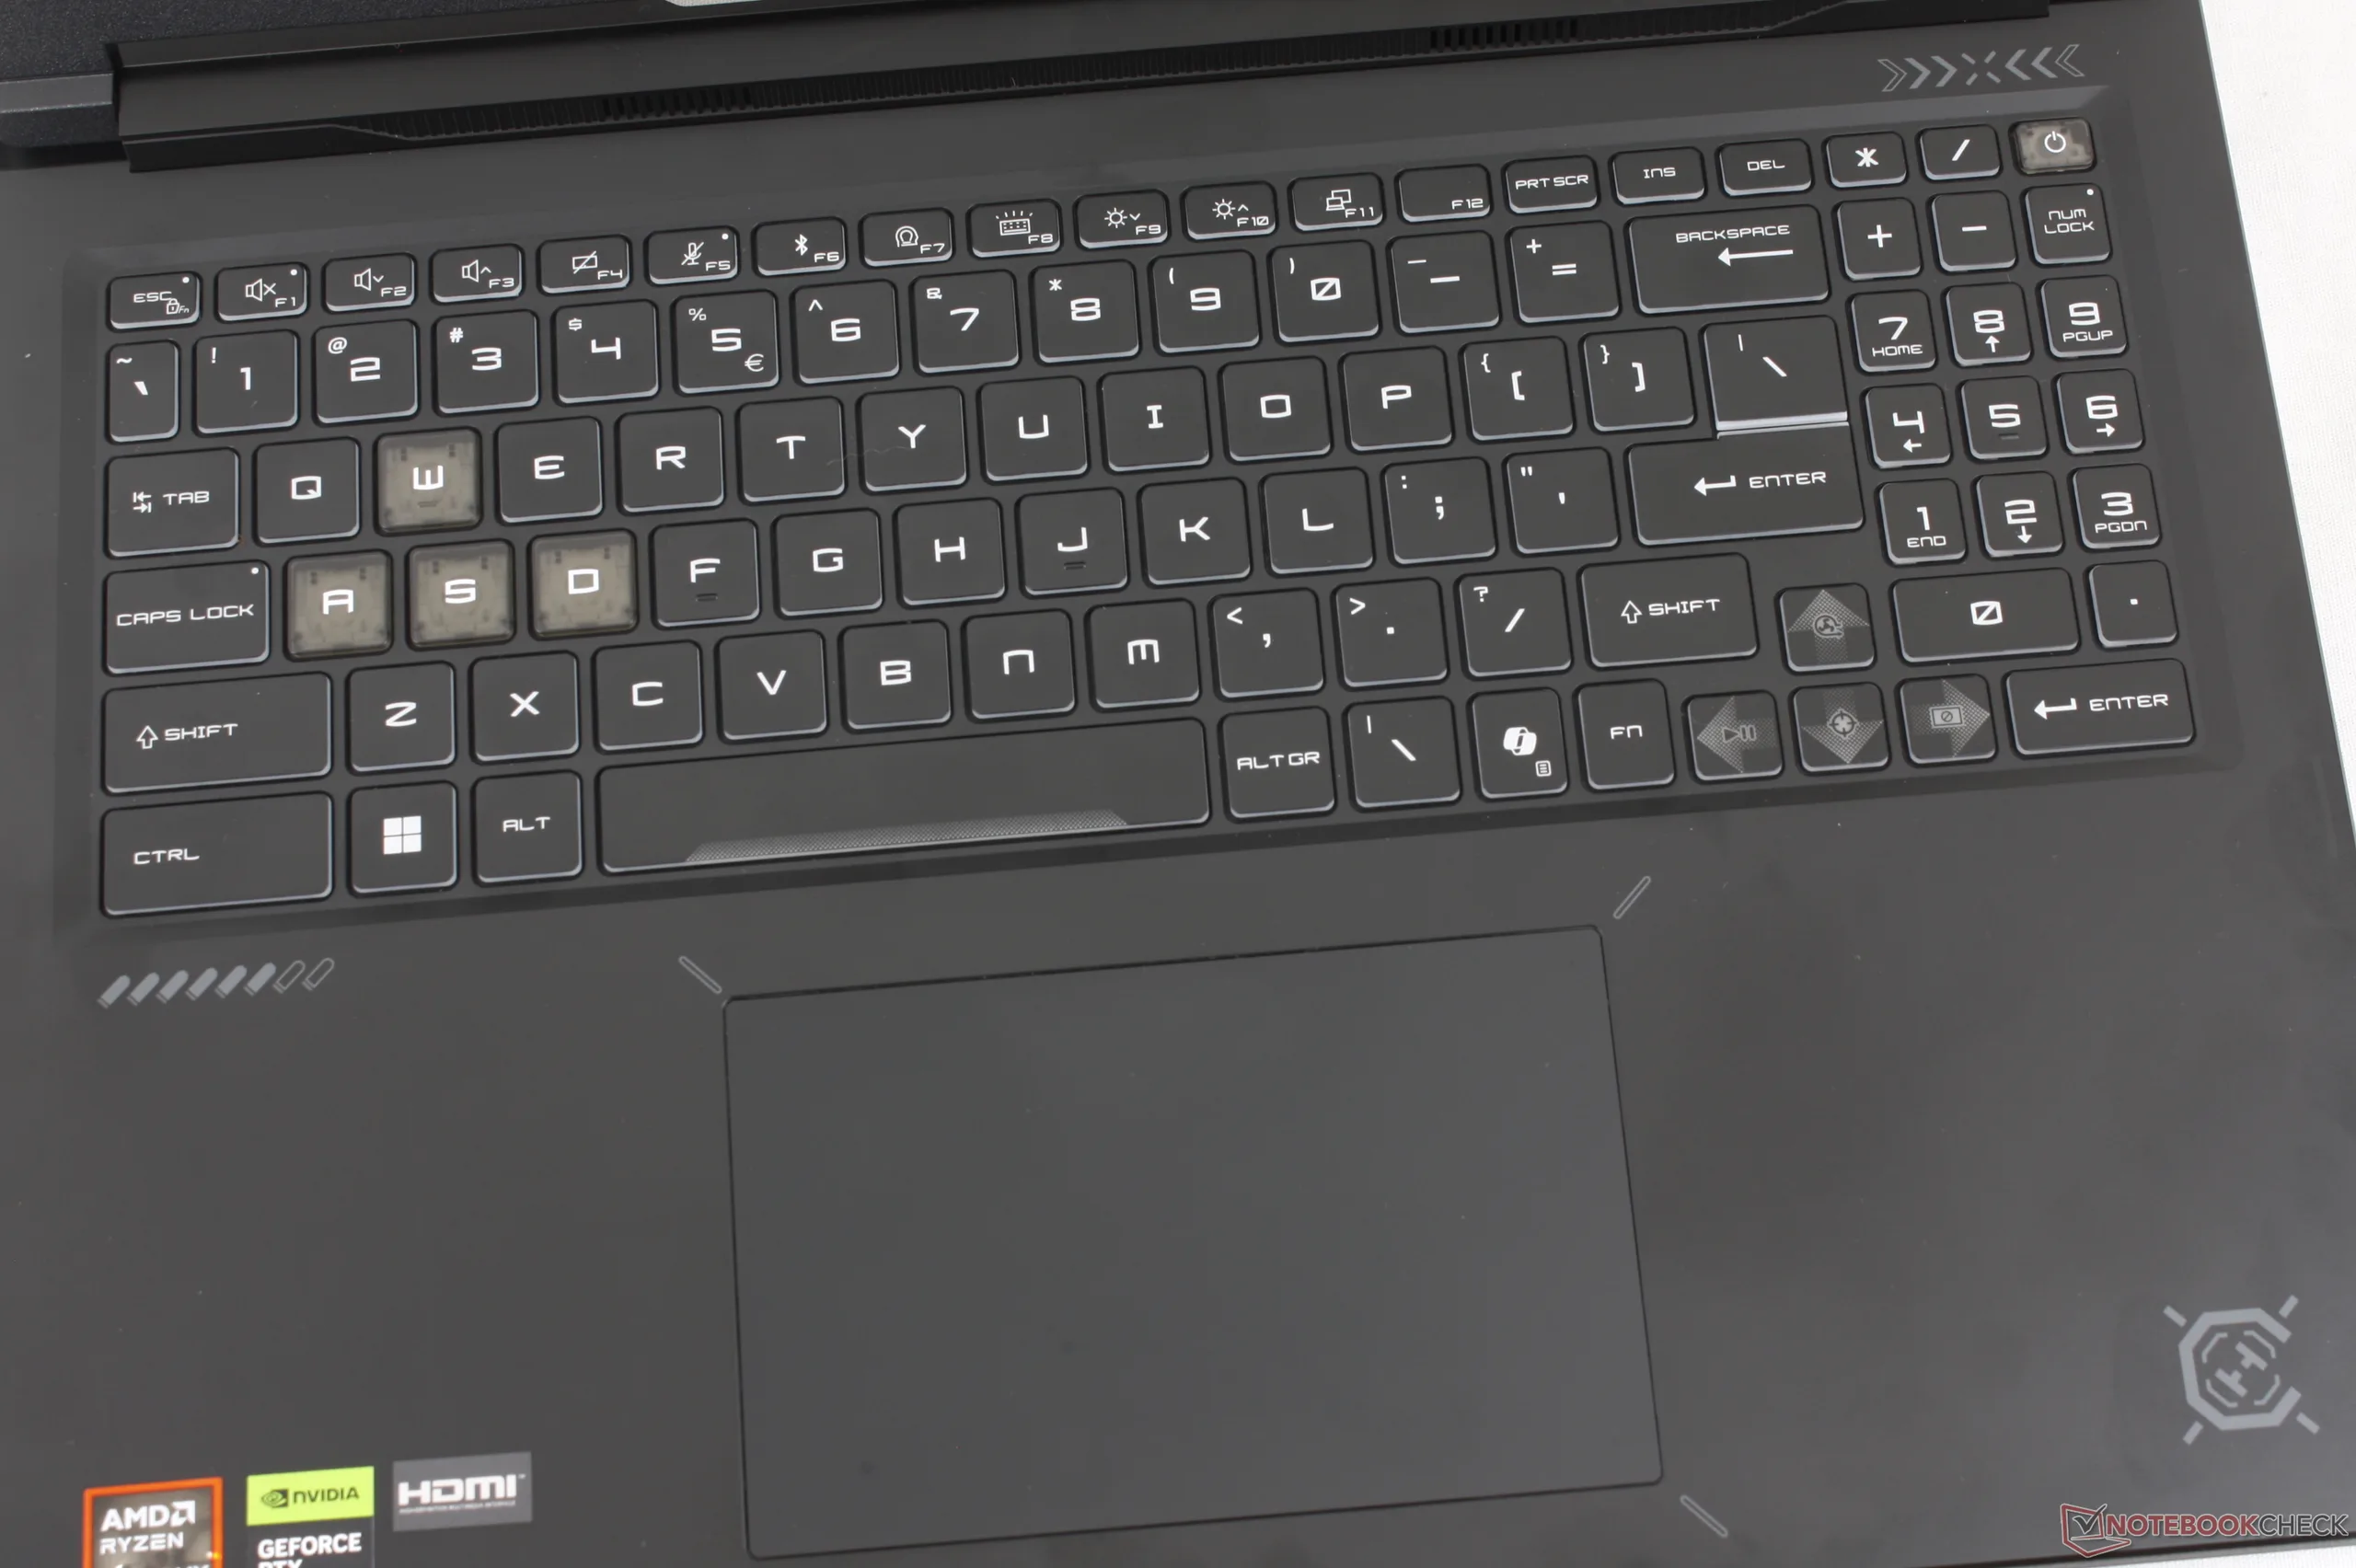
Input Devices
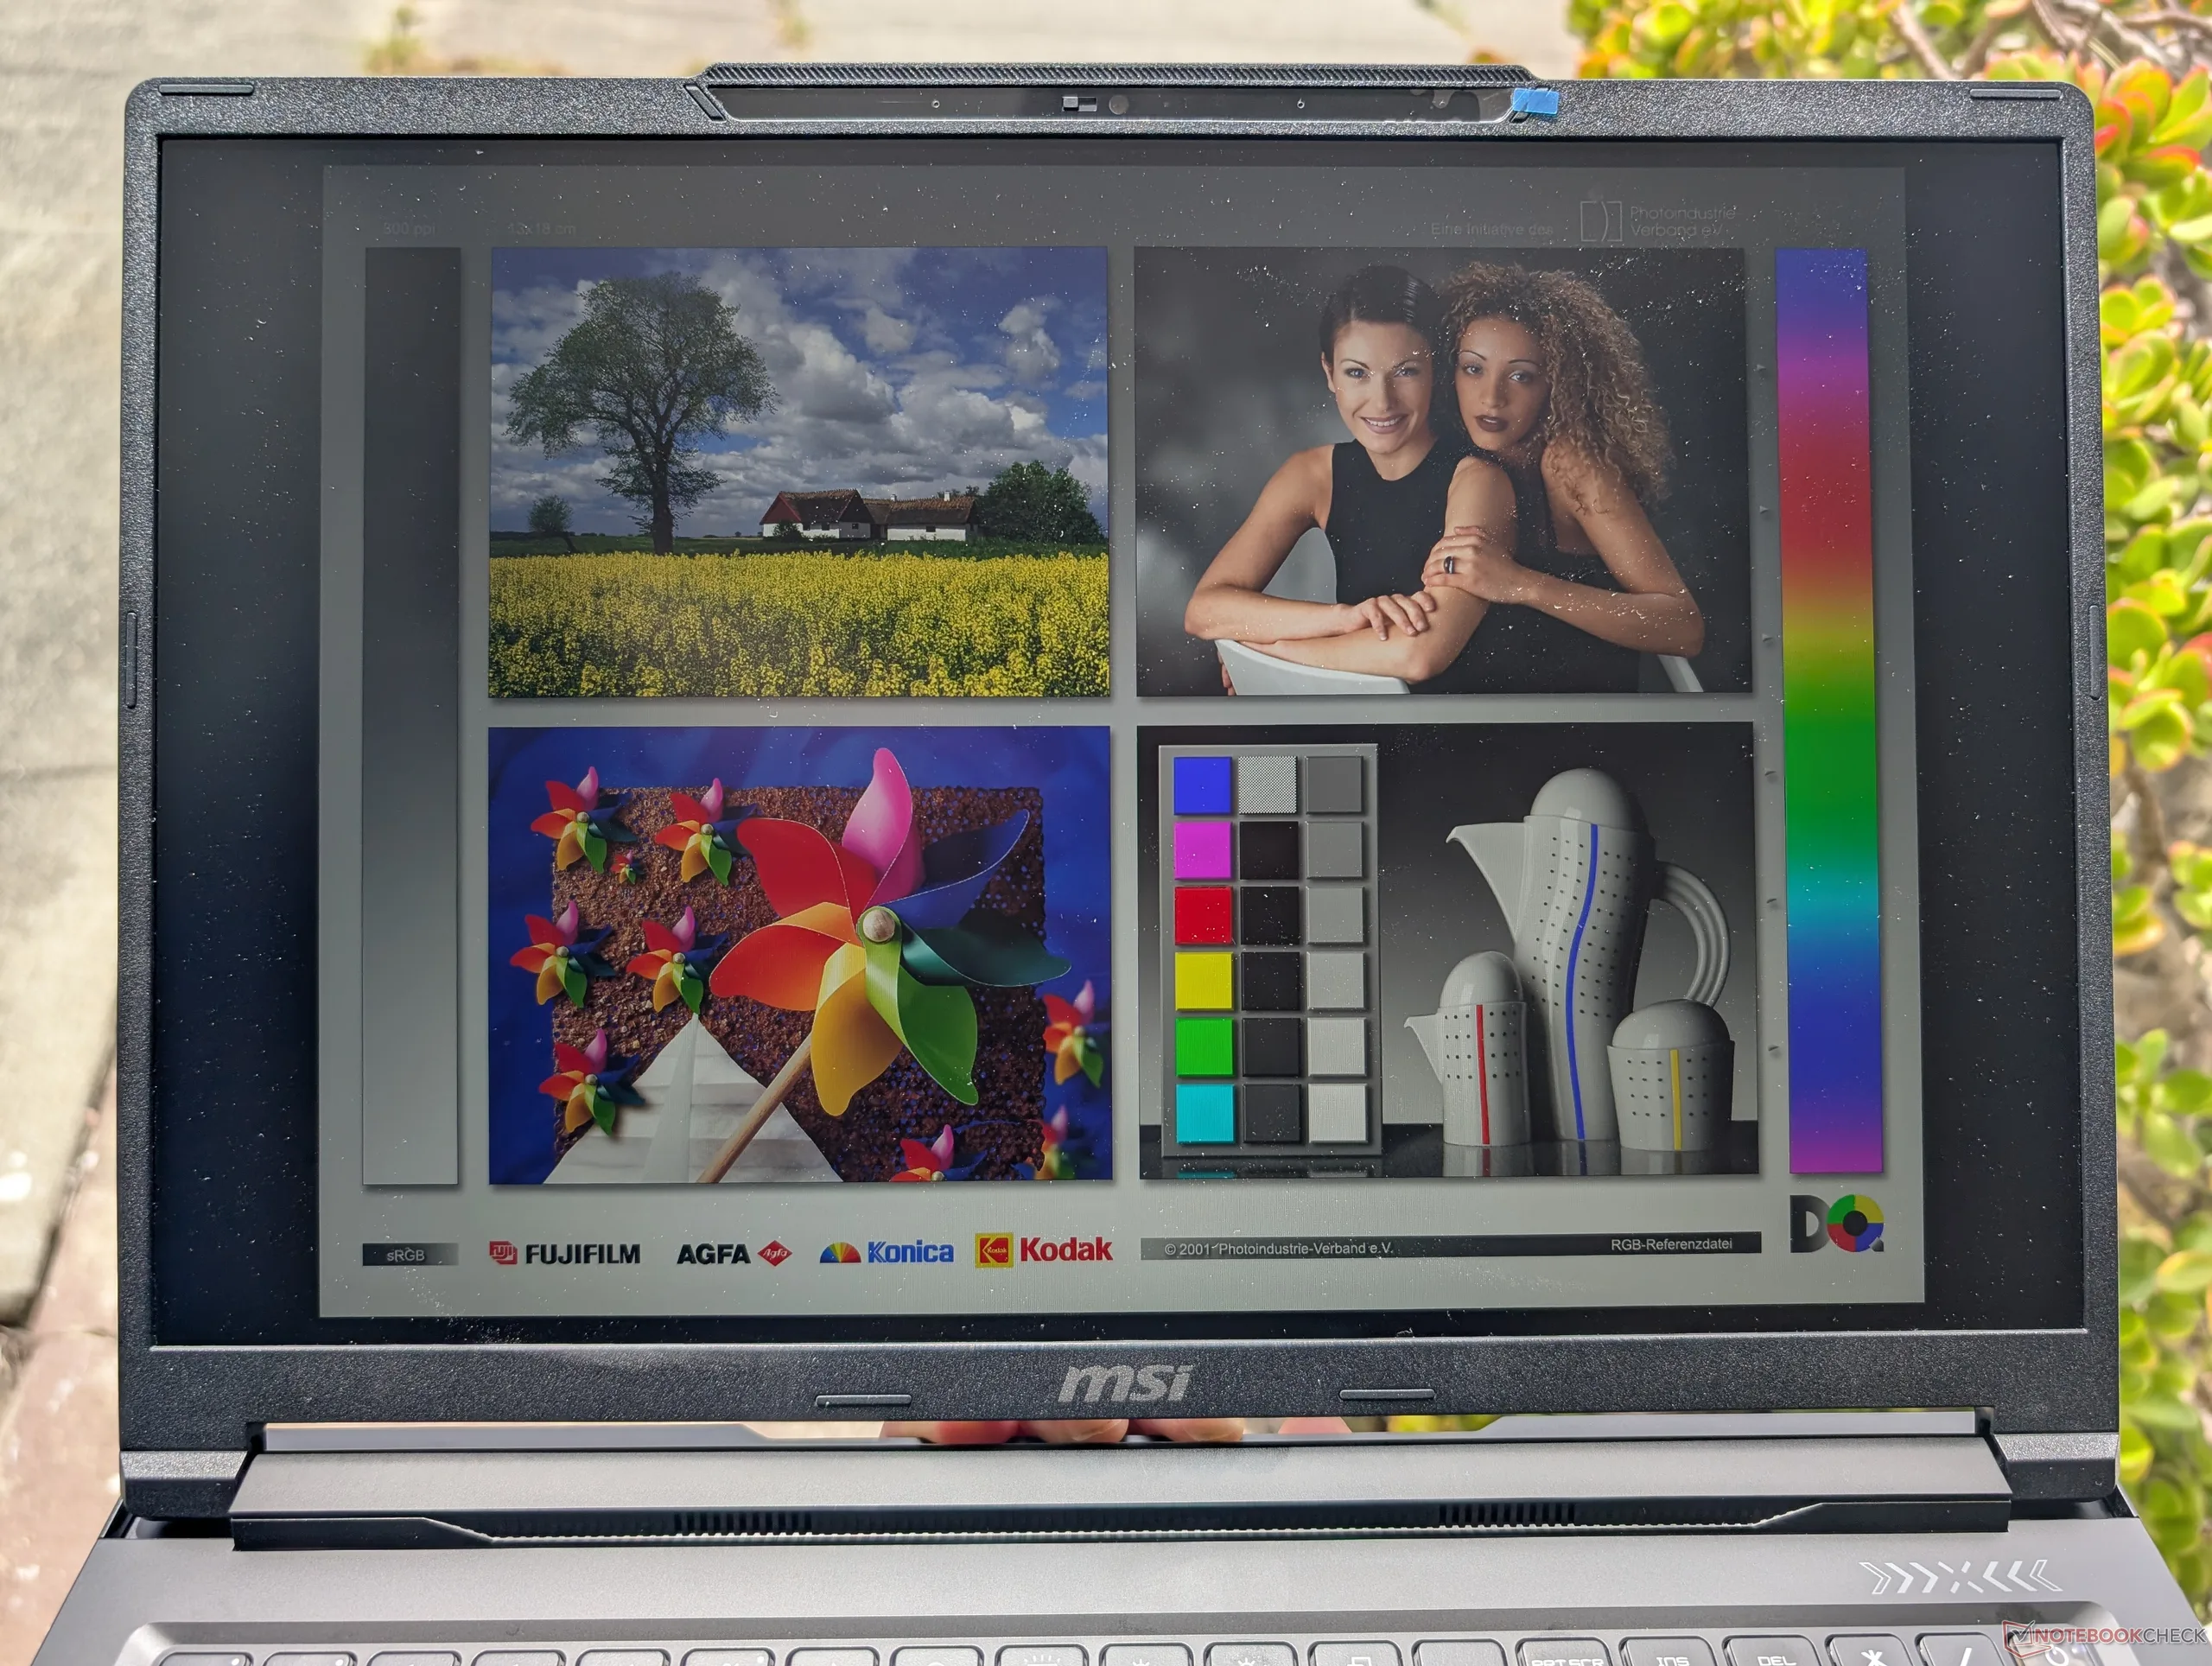
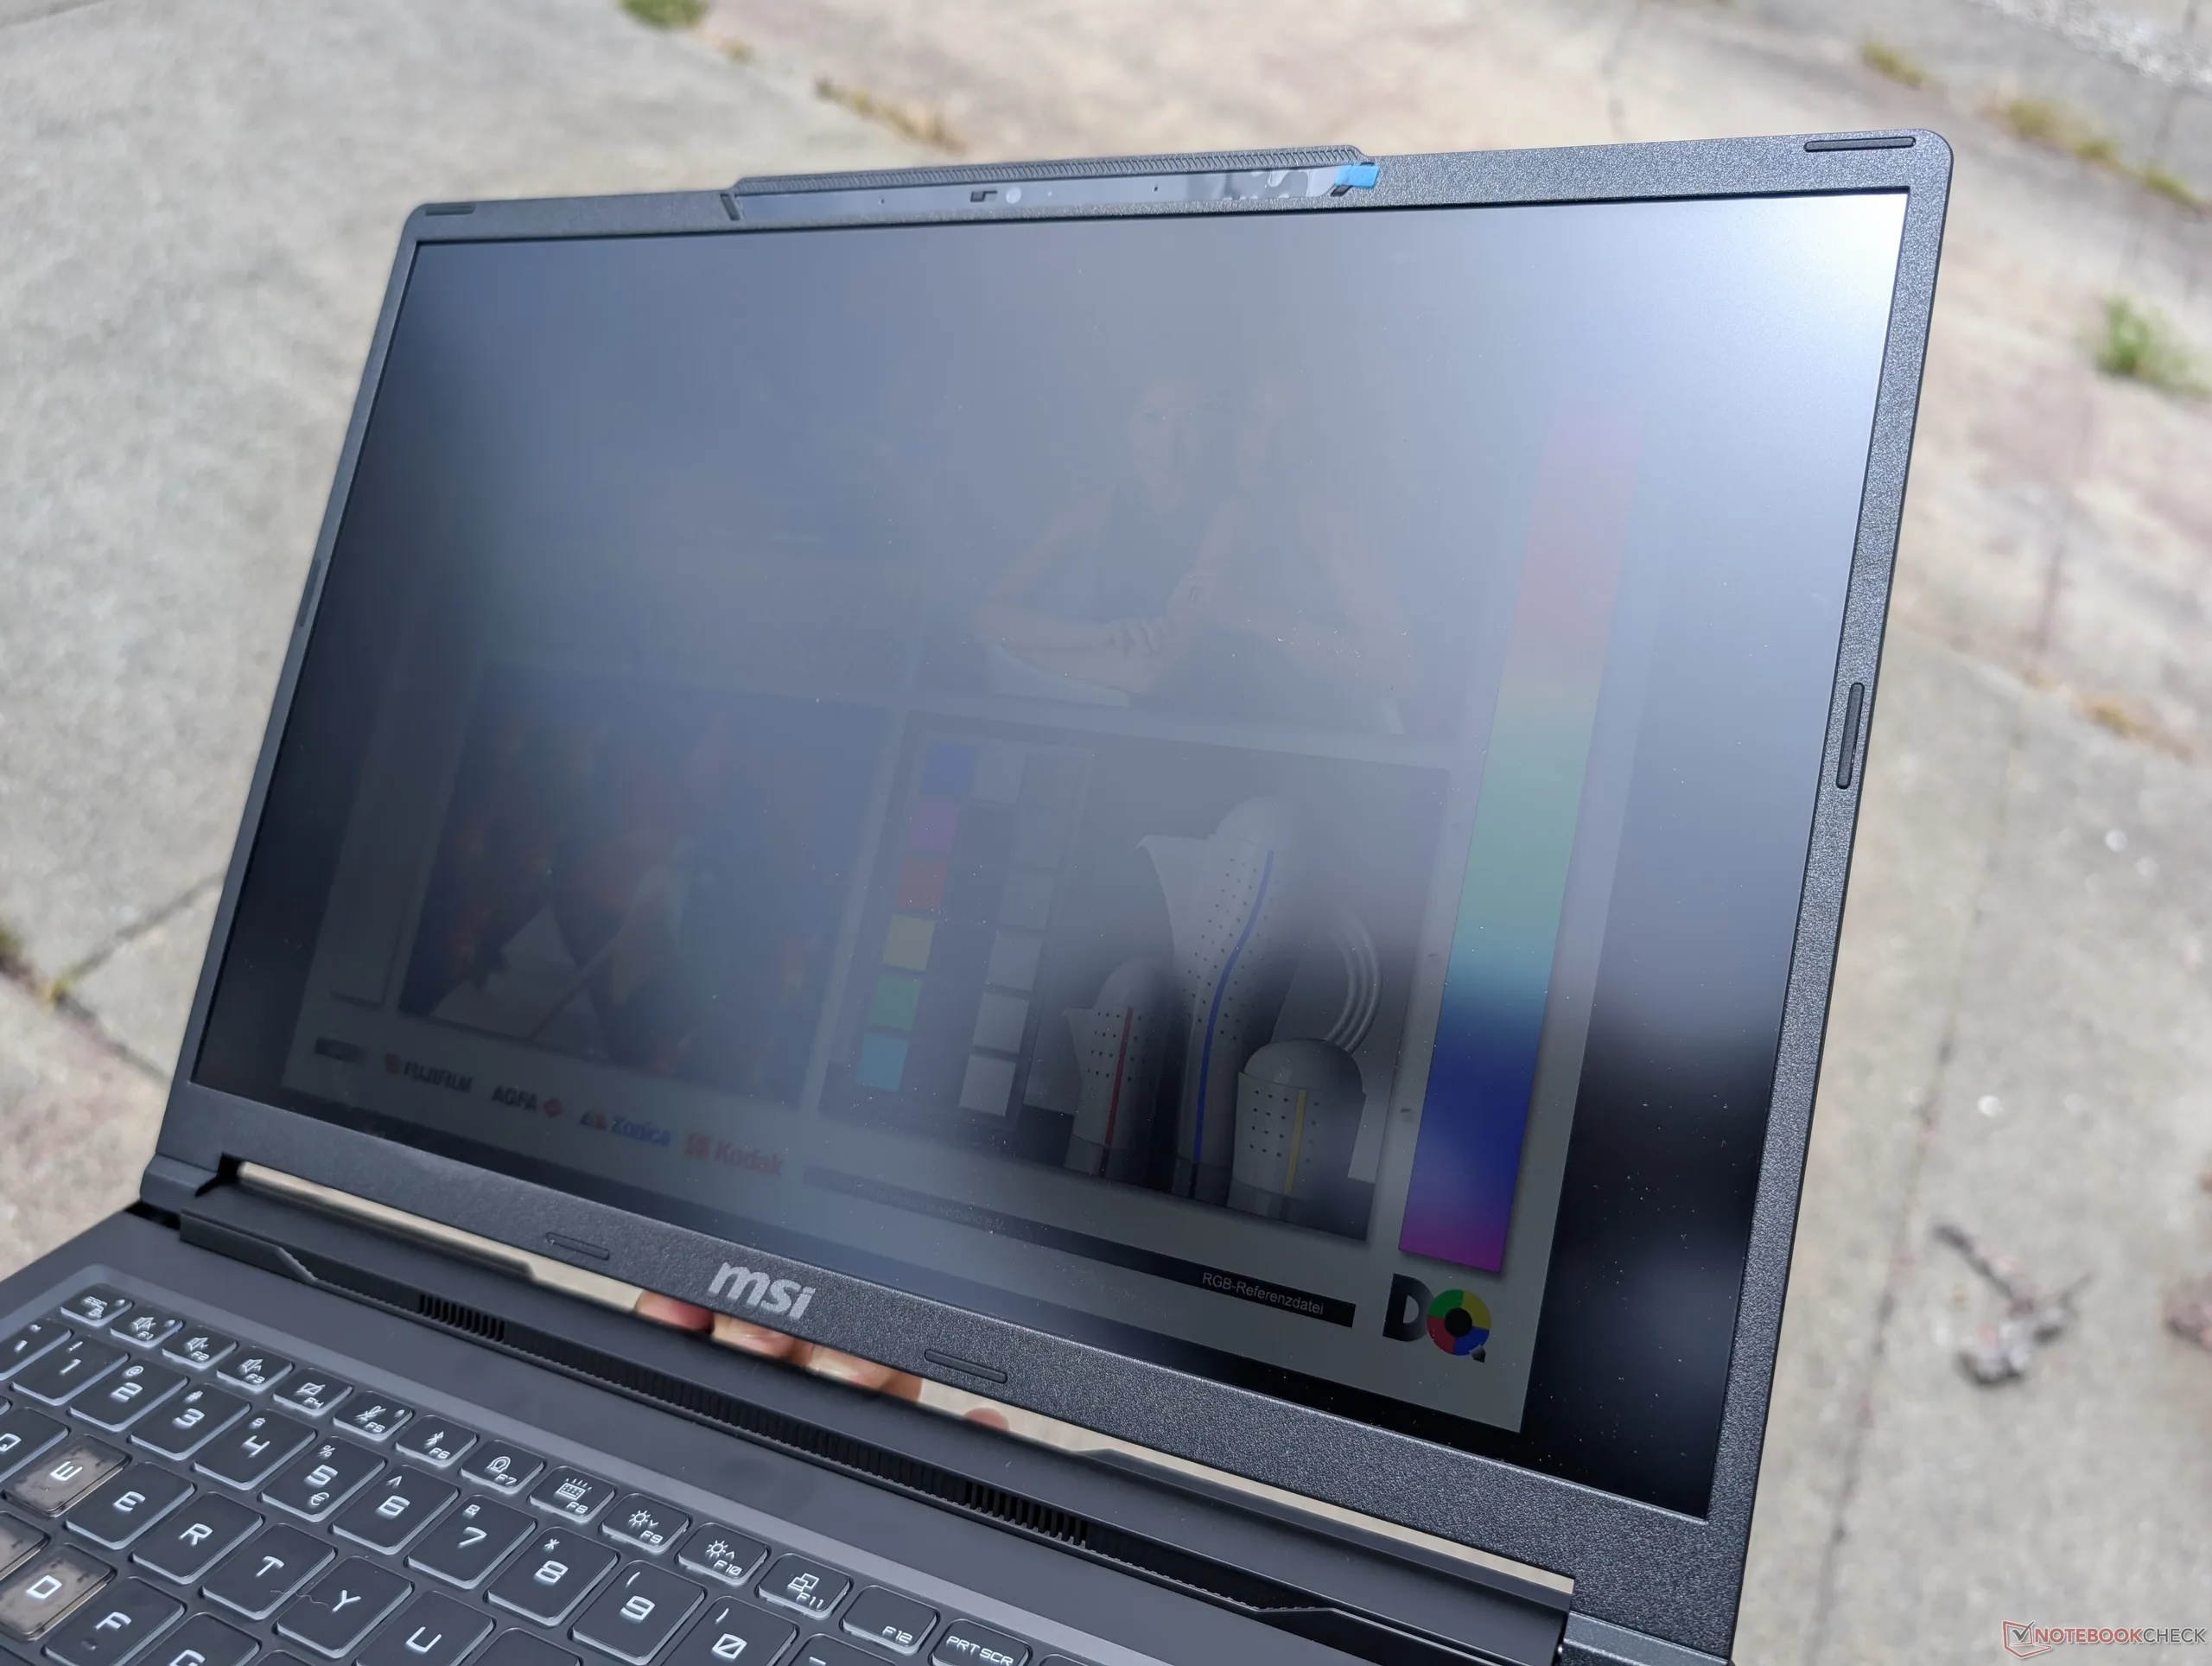
Display
The model utilizes the same B160QAN02.3 IPS panel from AU Optronics as found on the Intel-based Crosshair 16 HX AI.


| |||||||||||||||||||||||||
Brightness Distribution: 89 %
Center on Battery: 512.4 cd/m²
Contrast: 1314:1 (Black: 0.39 cd/m²)
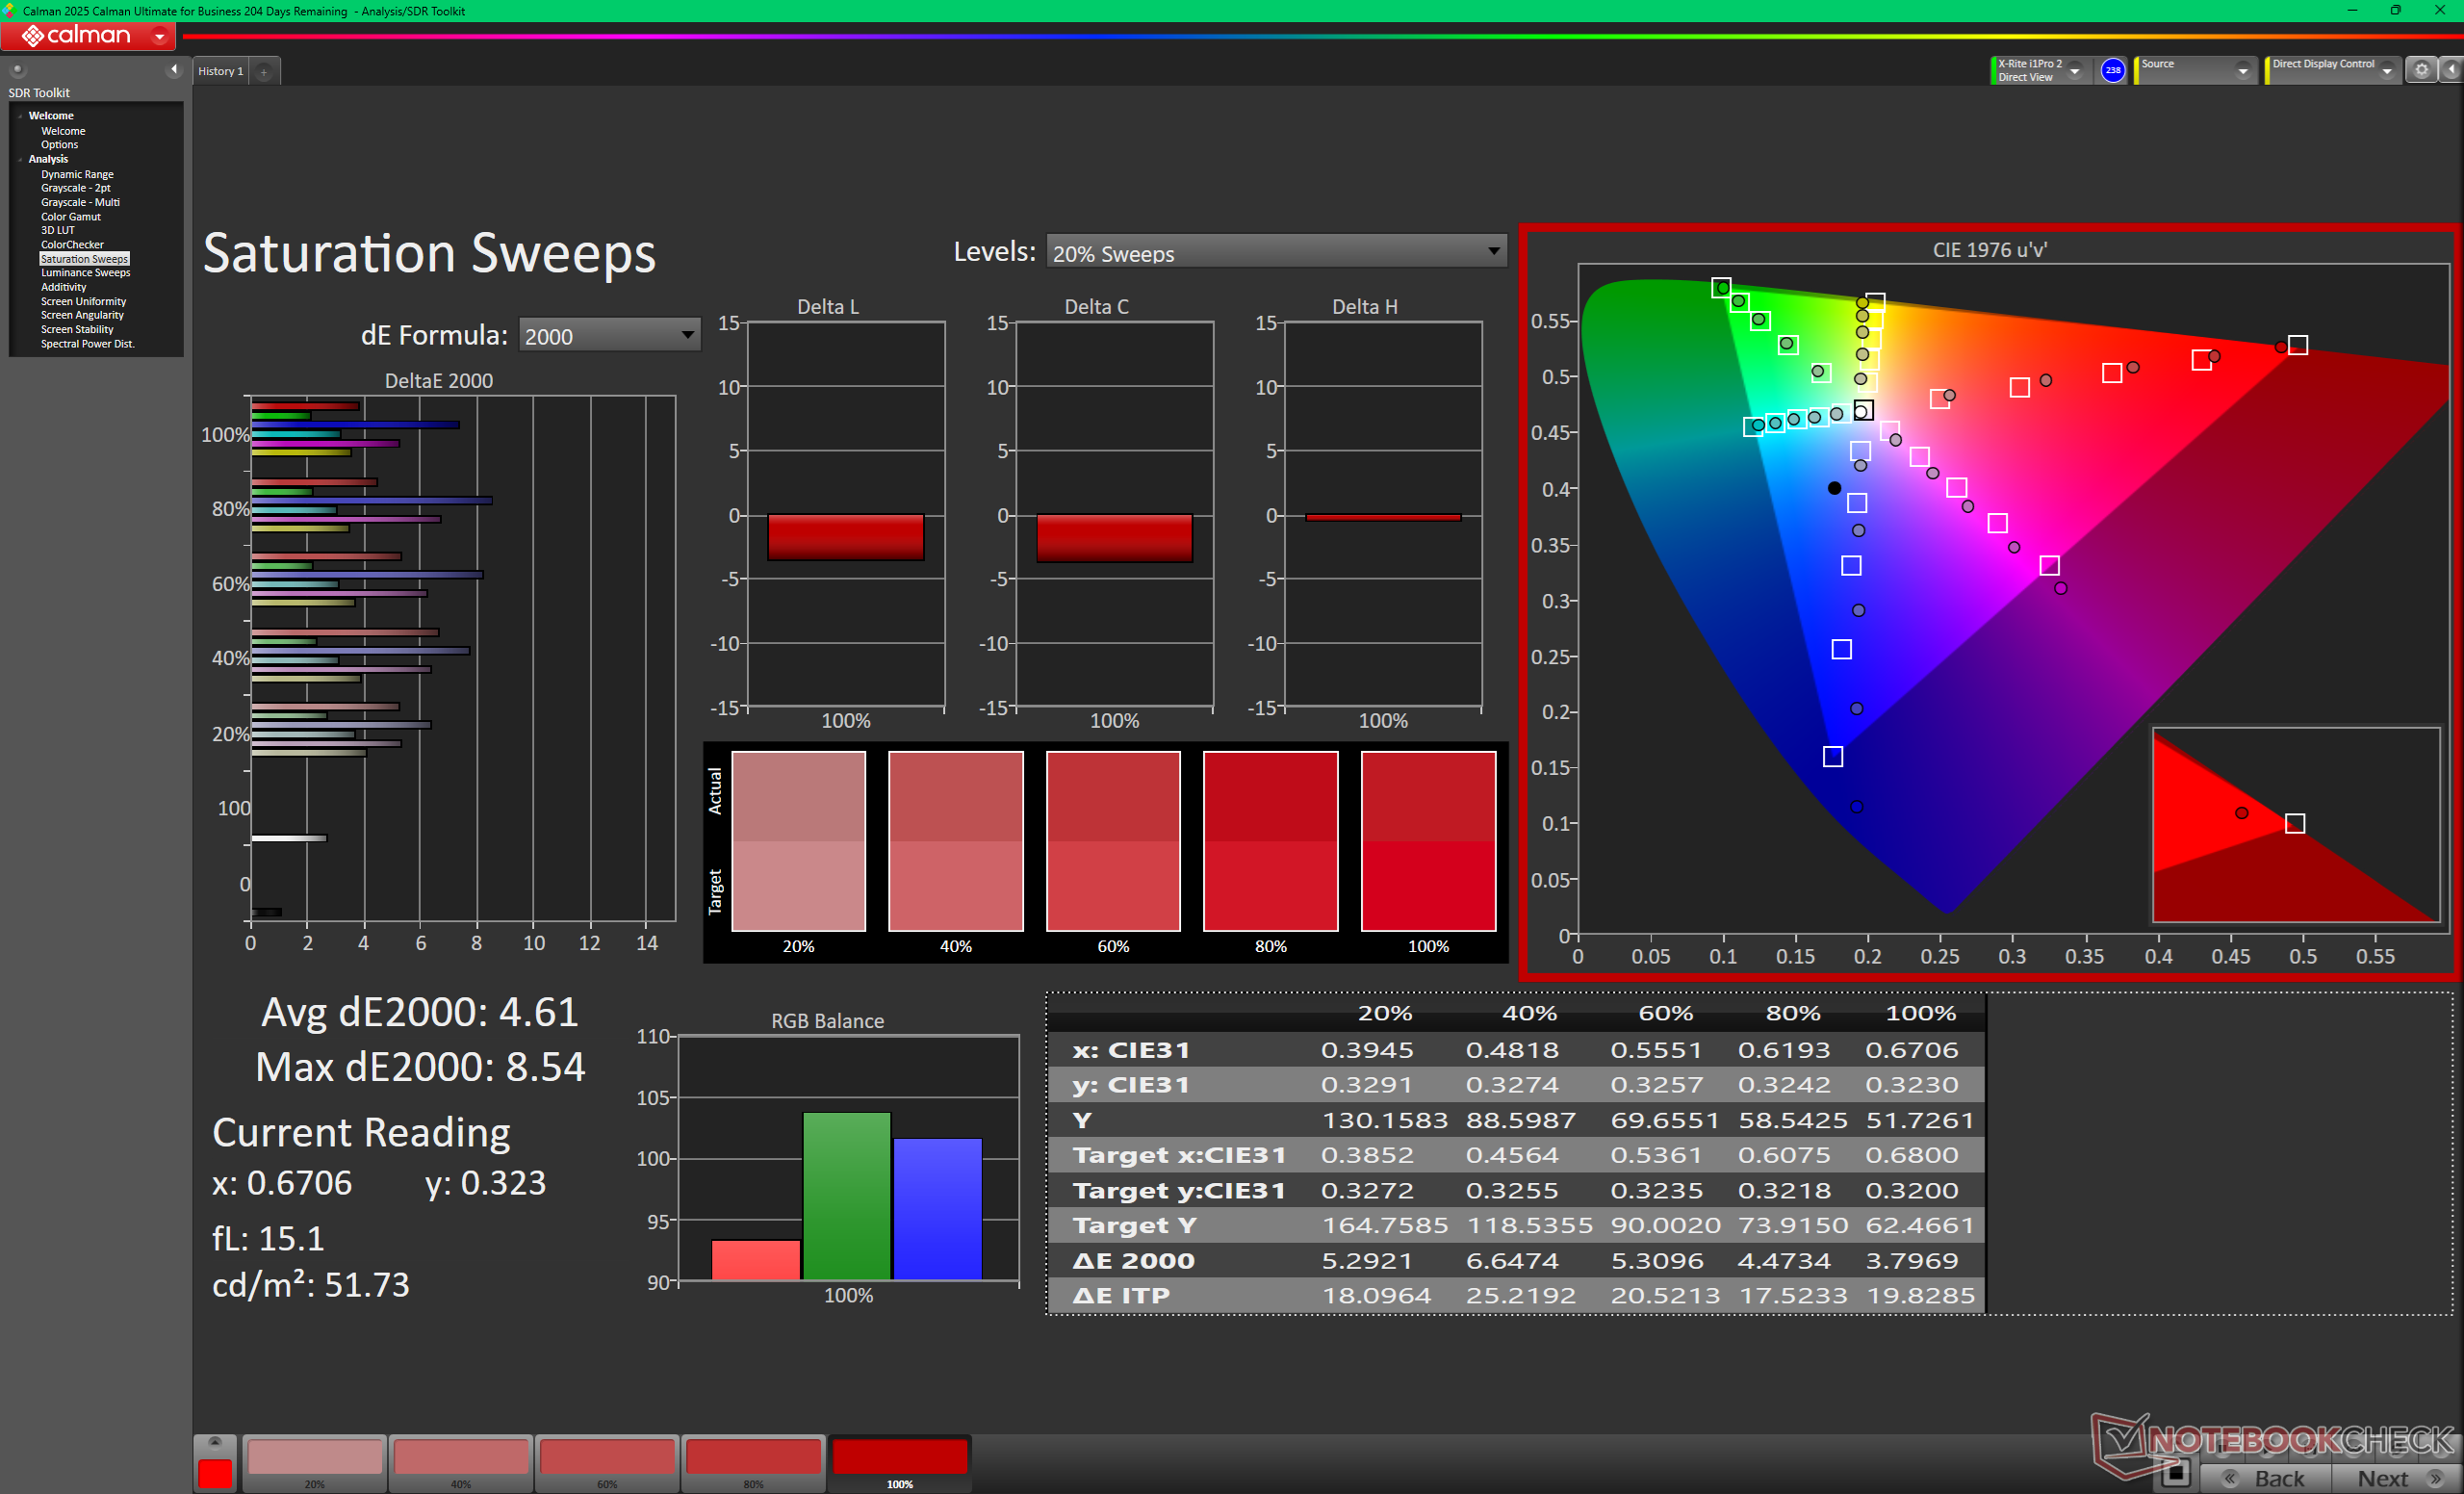
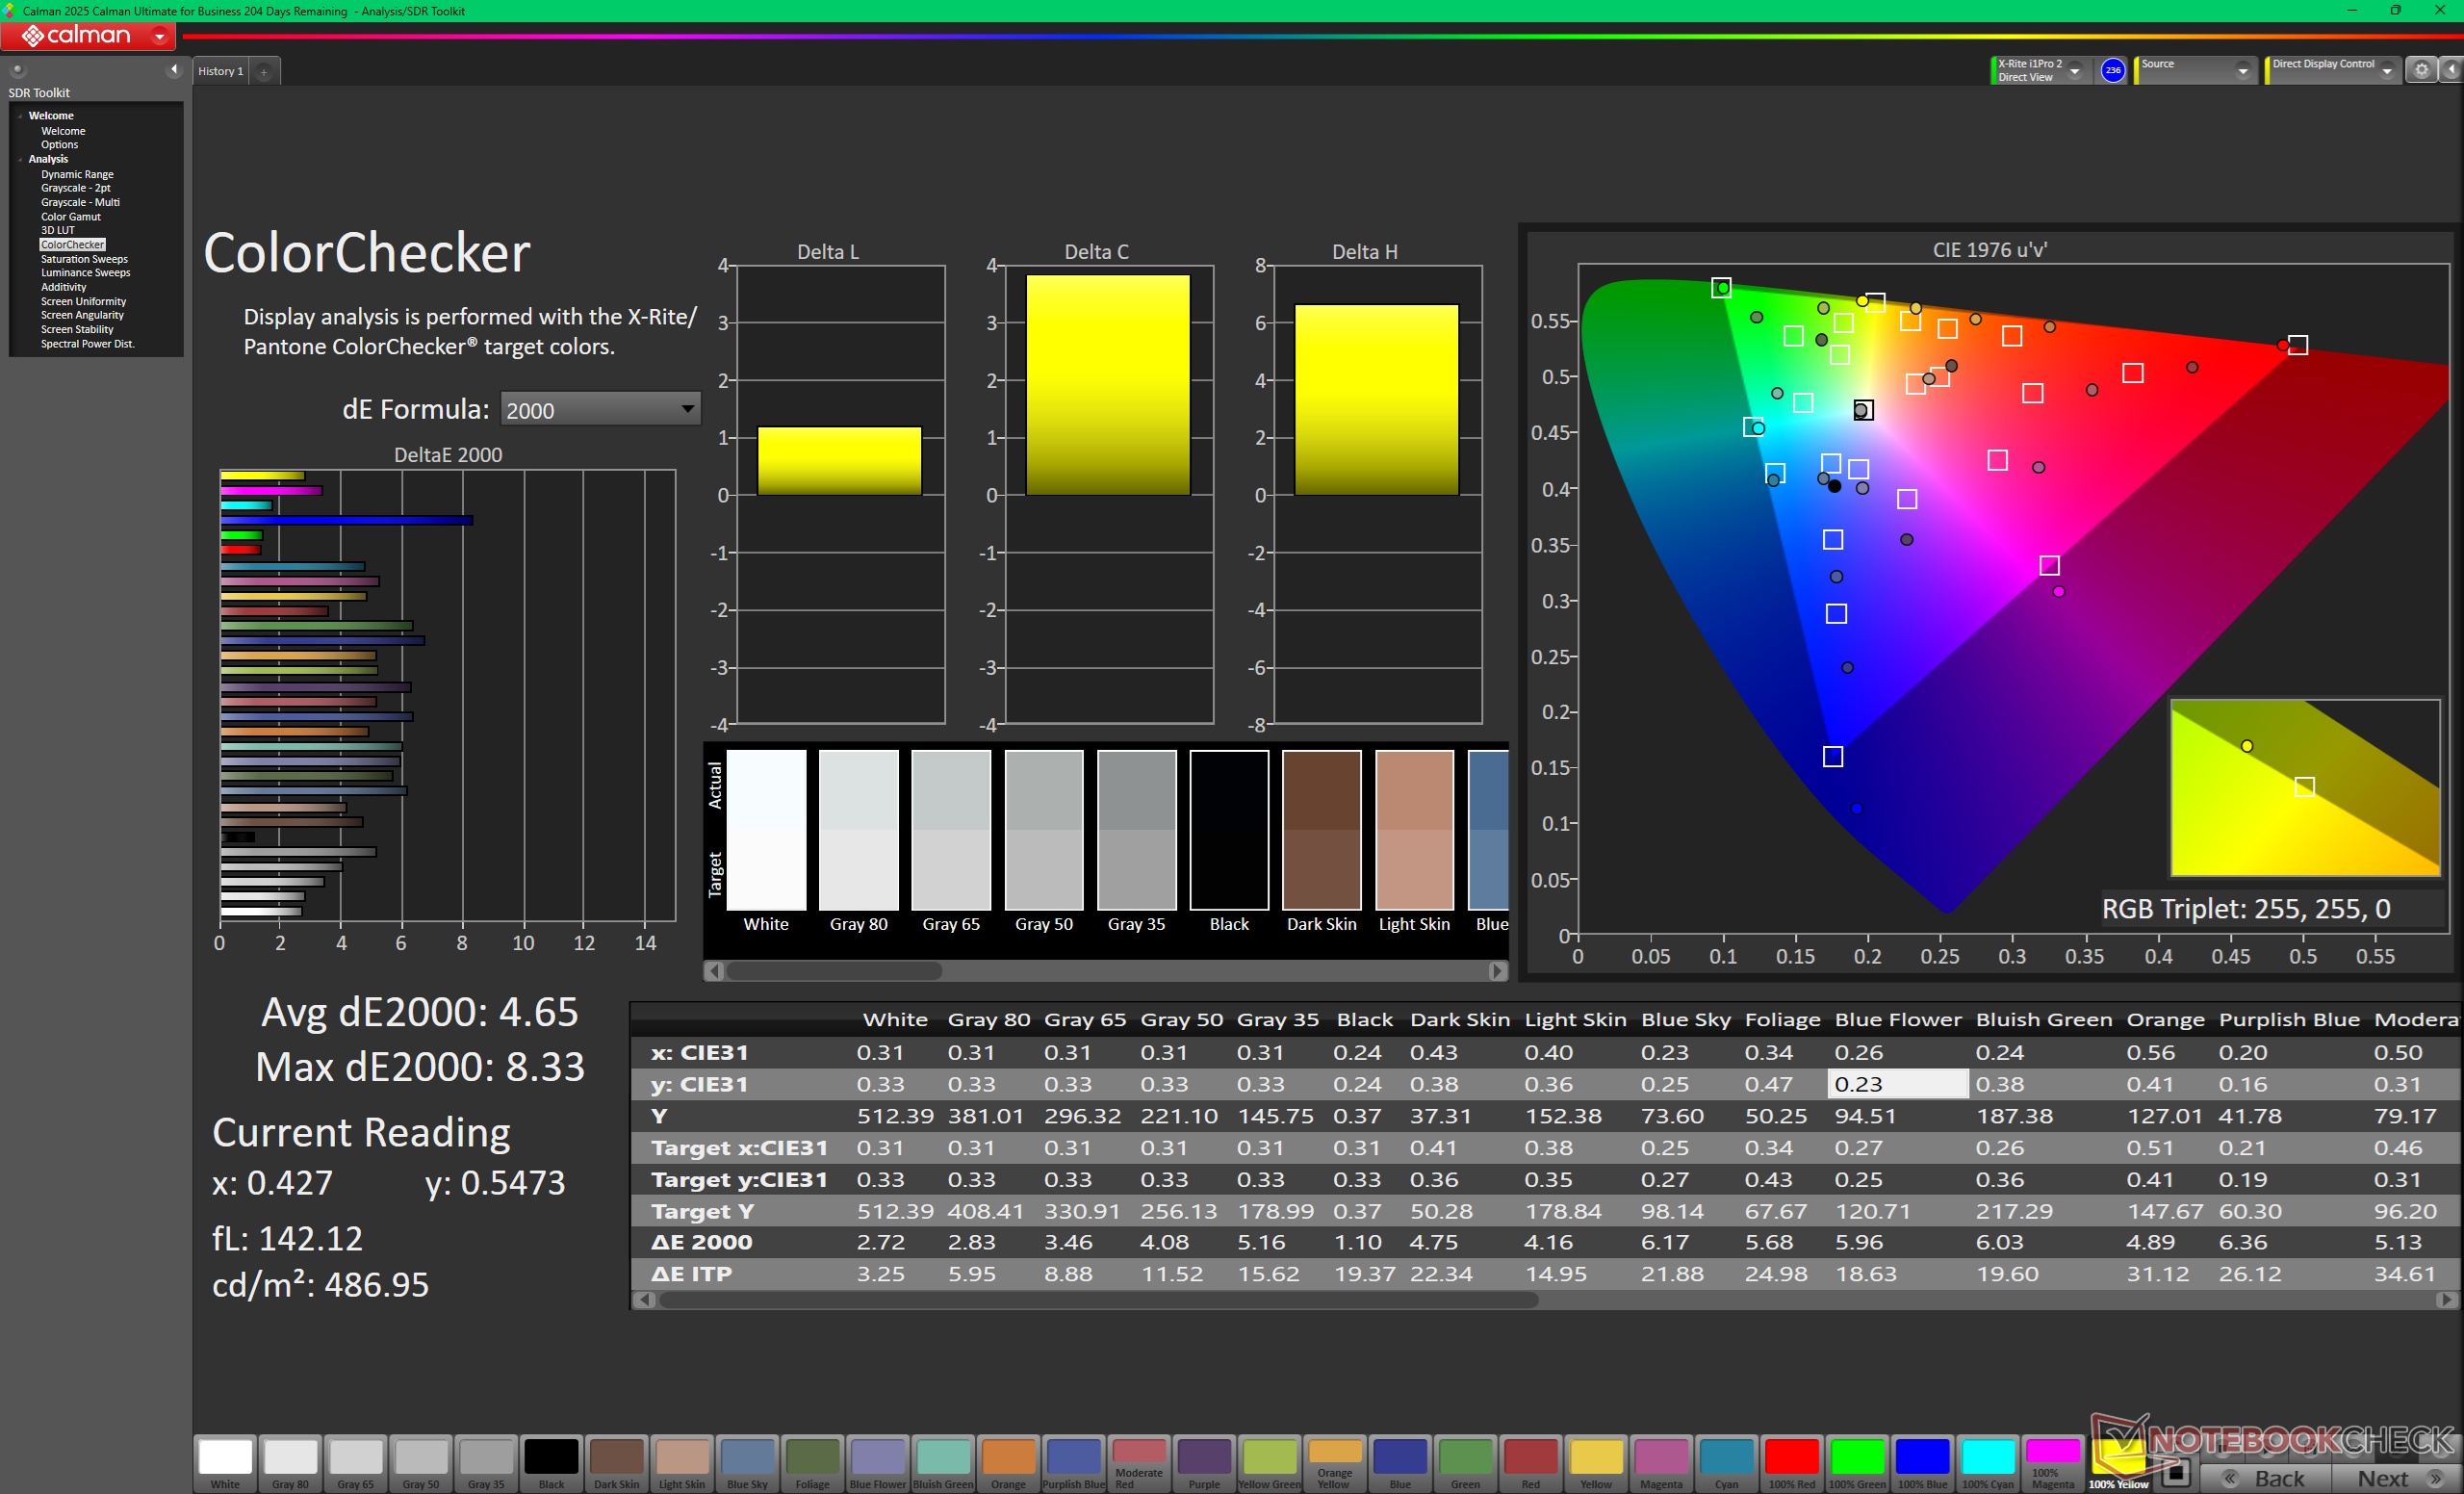
ΔE ColorChecker Calman: 4.65 | ∀{0.5-29.43 Ø4.72}
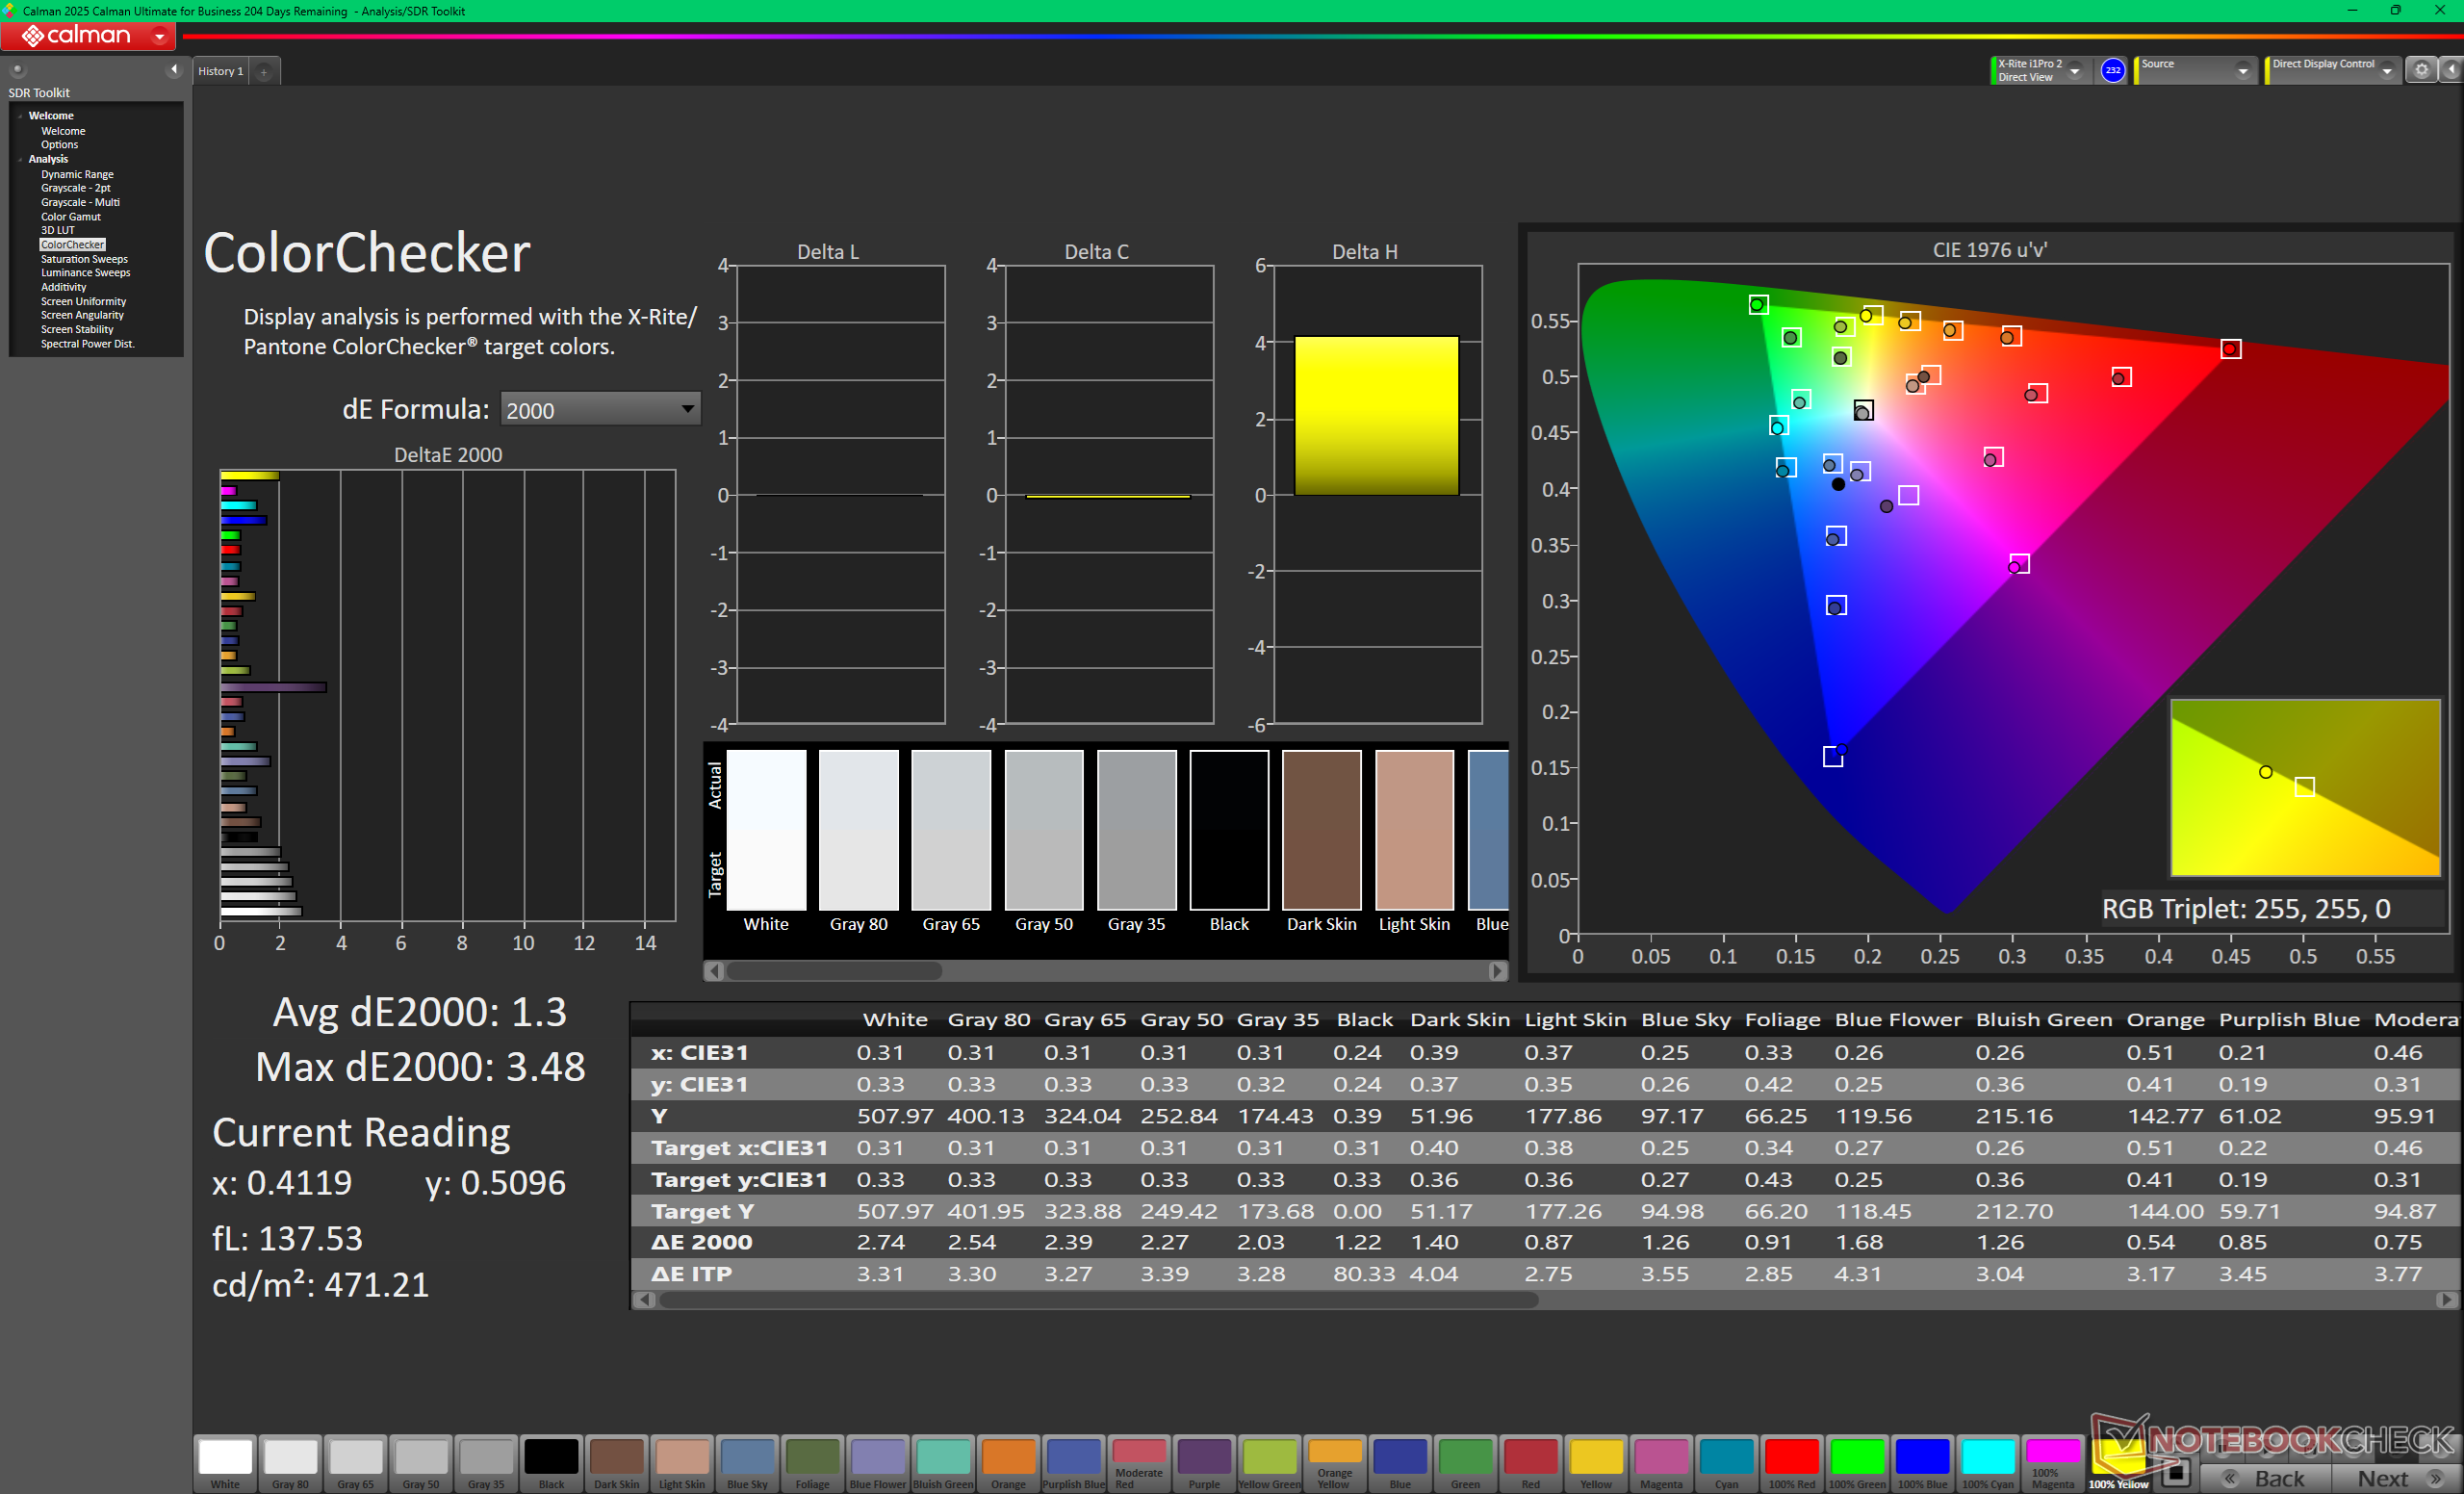
calibrated: 1.3
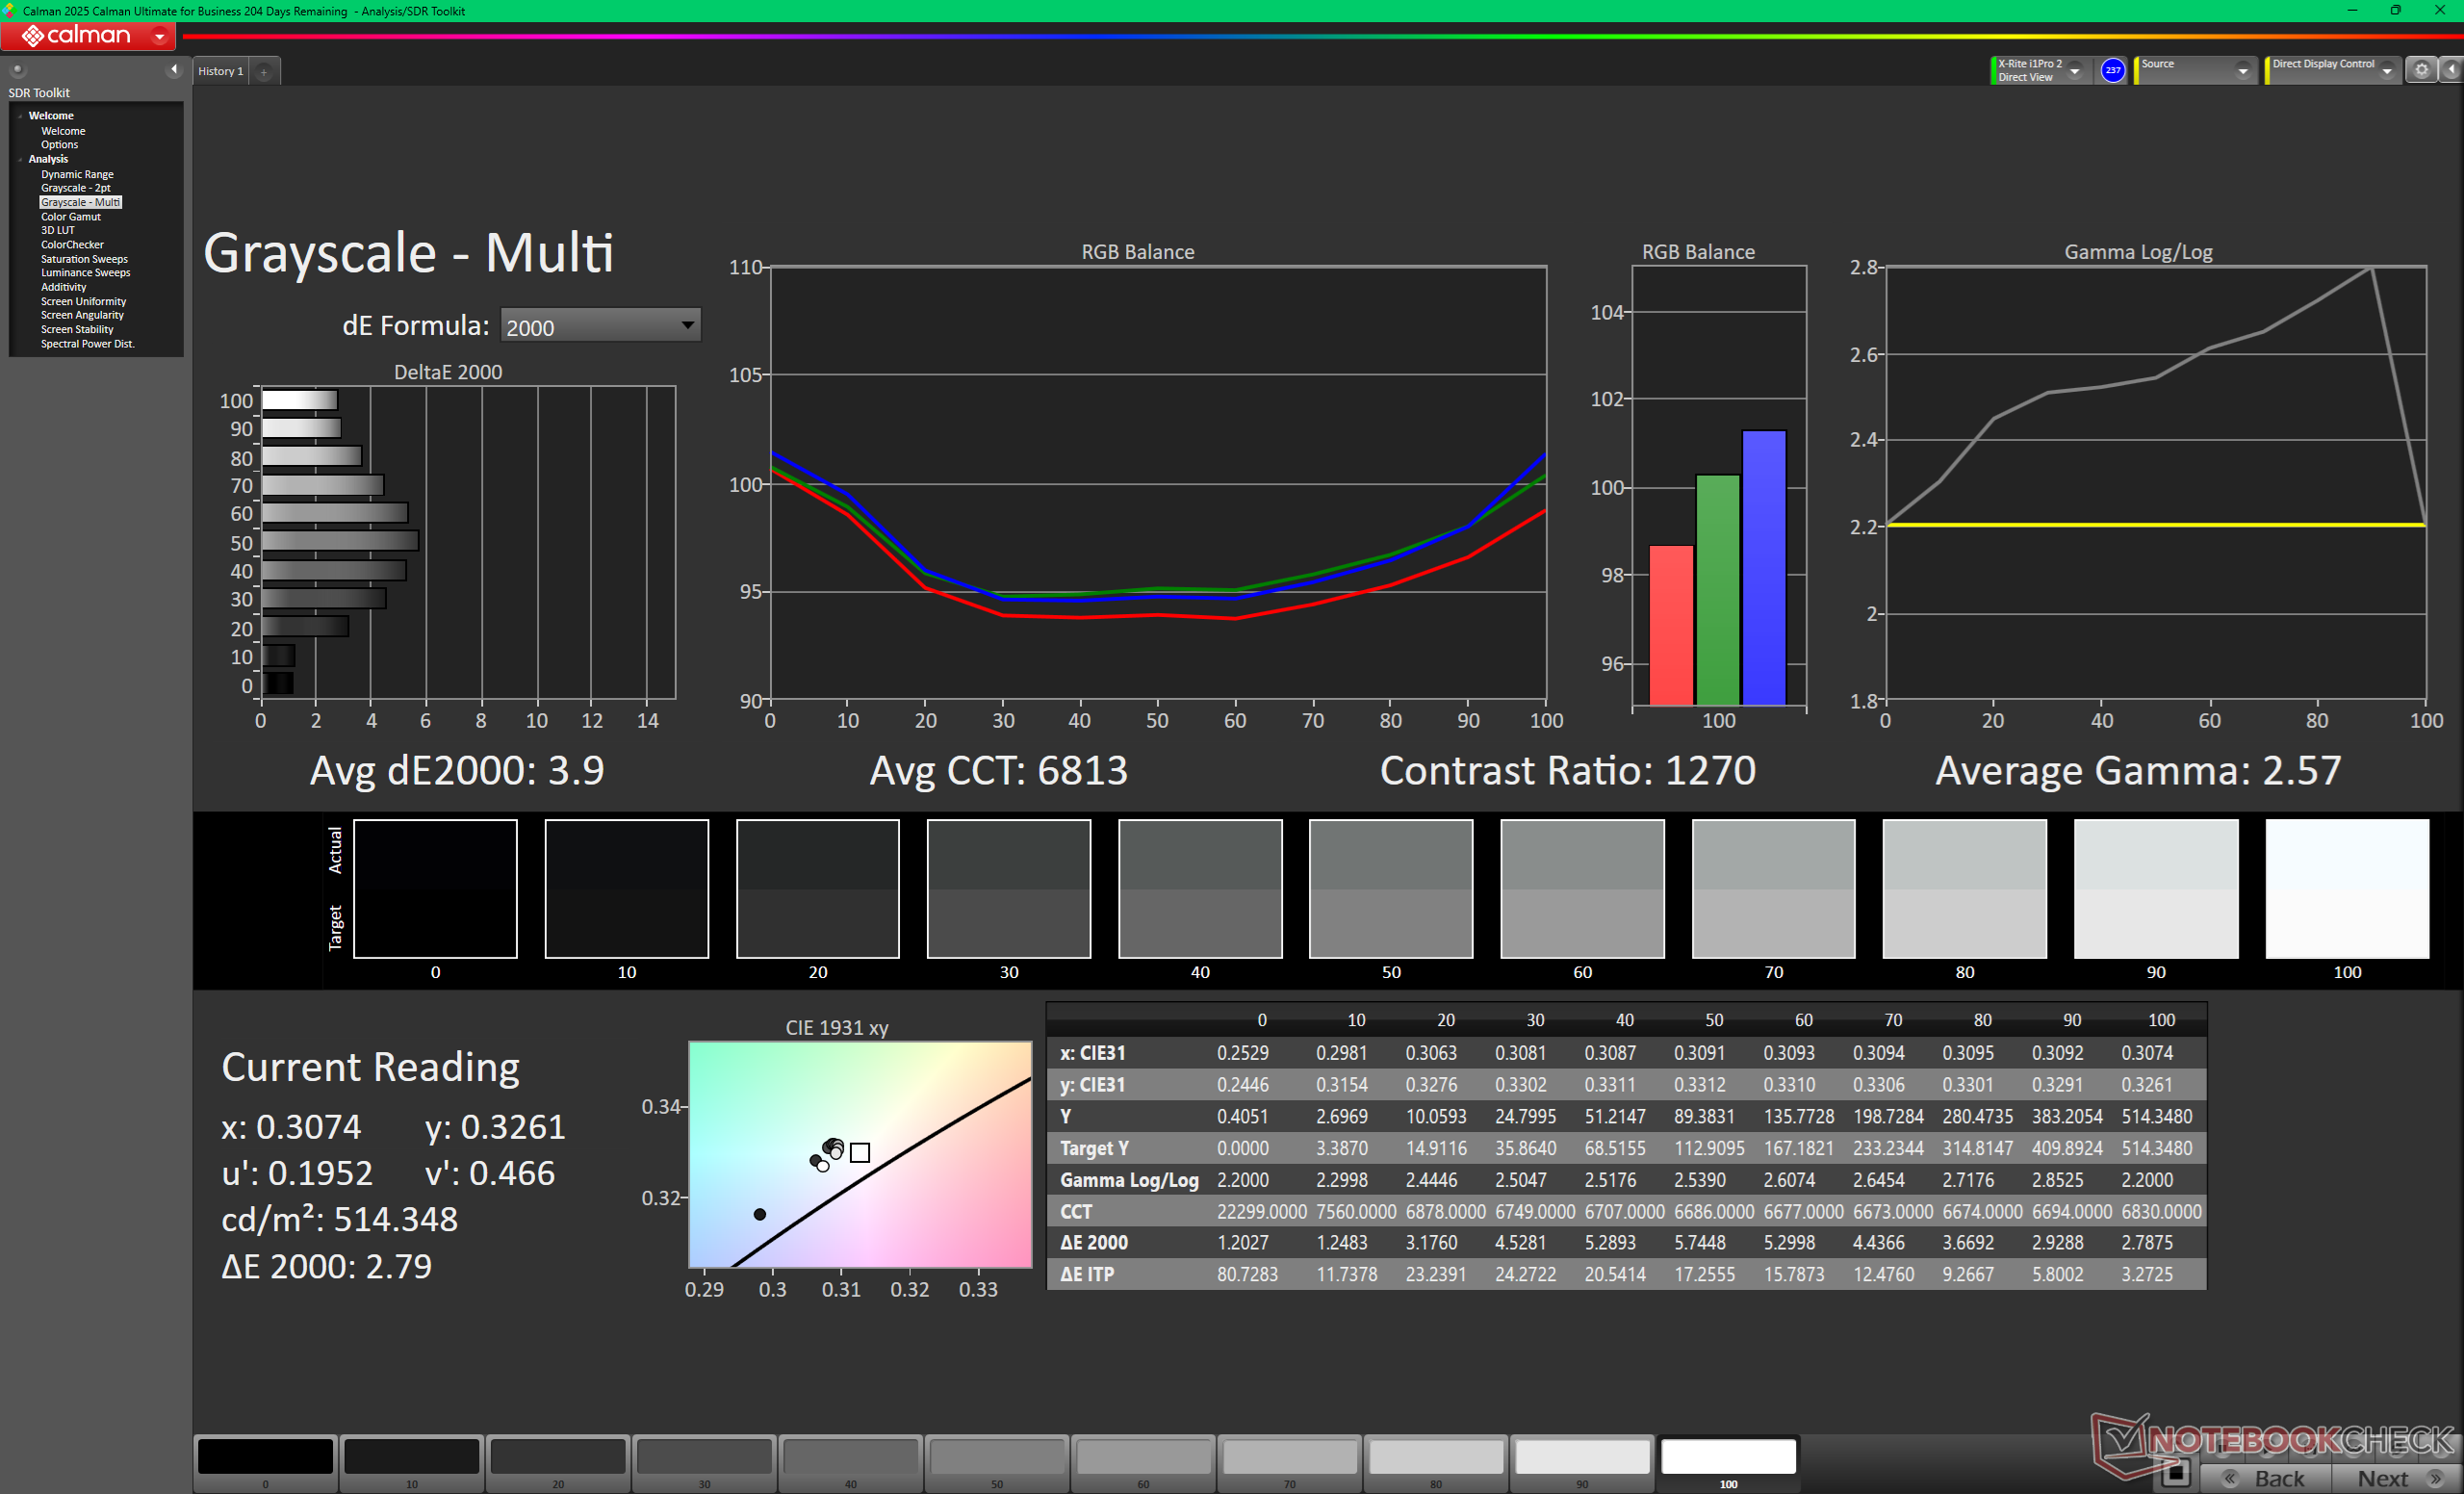
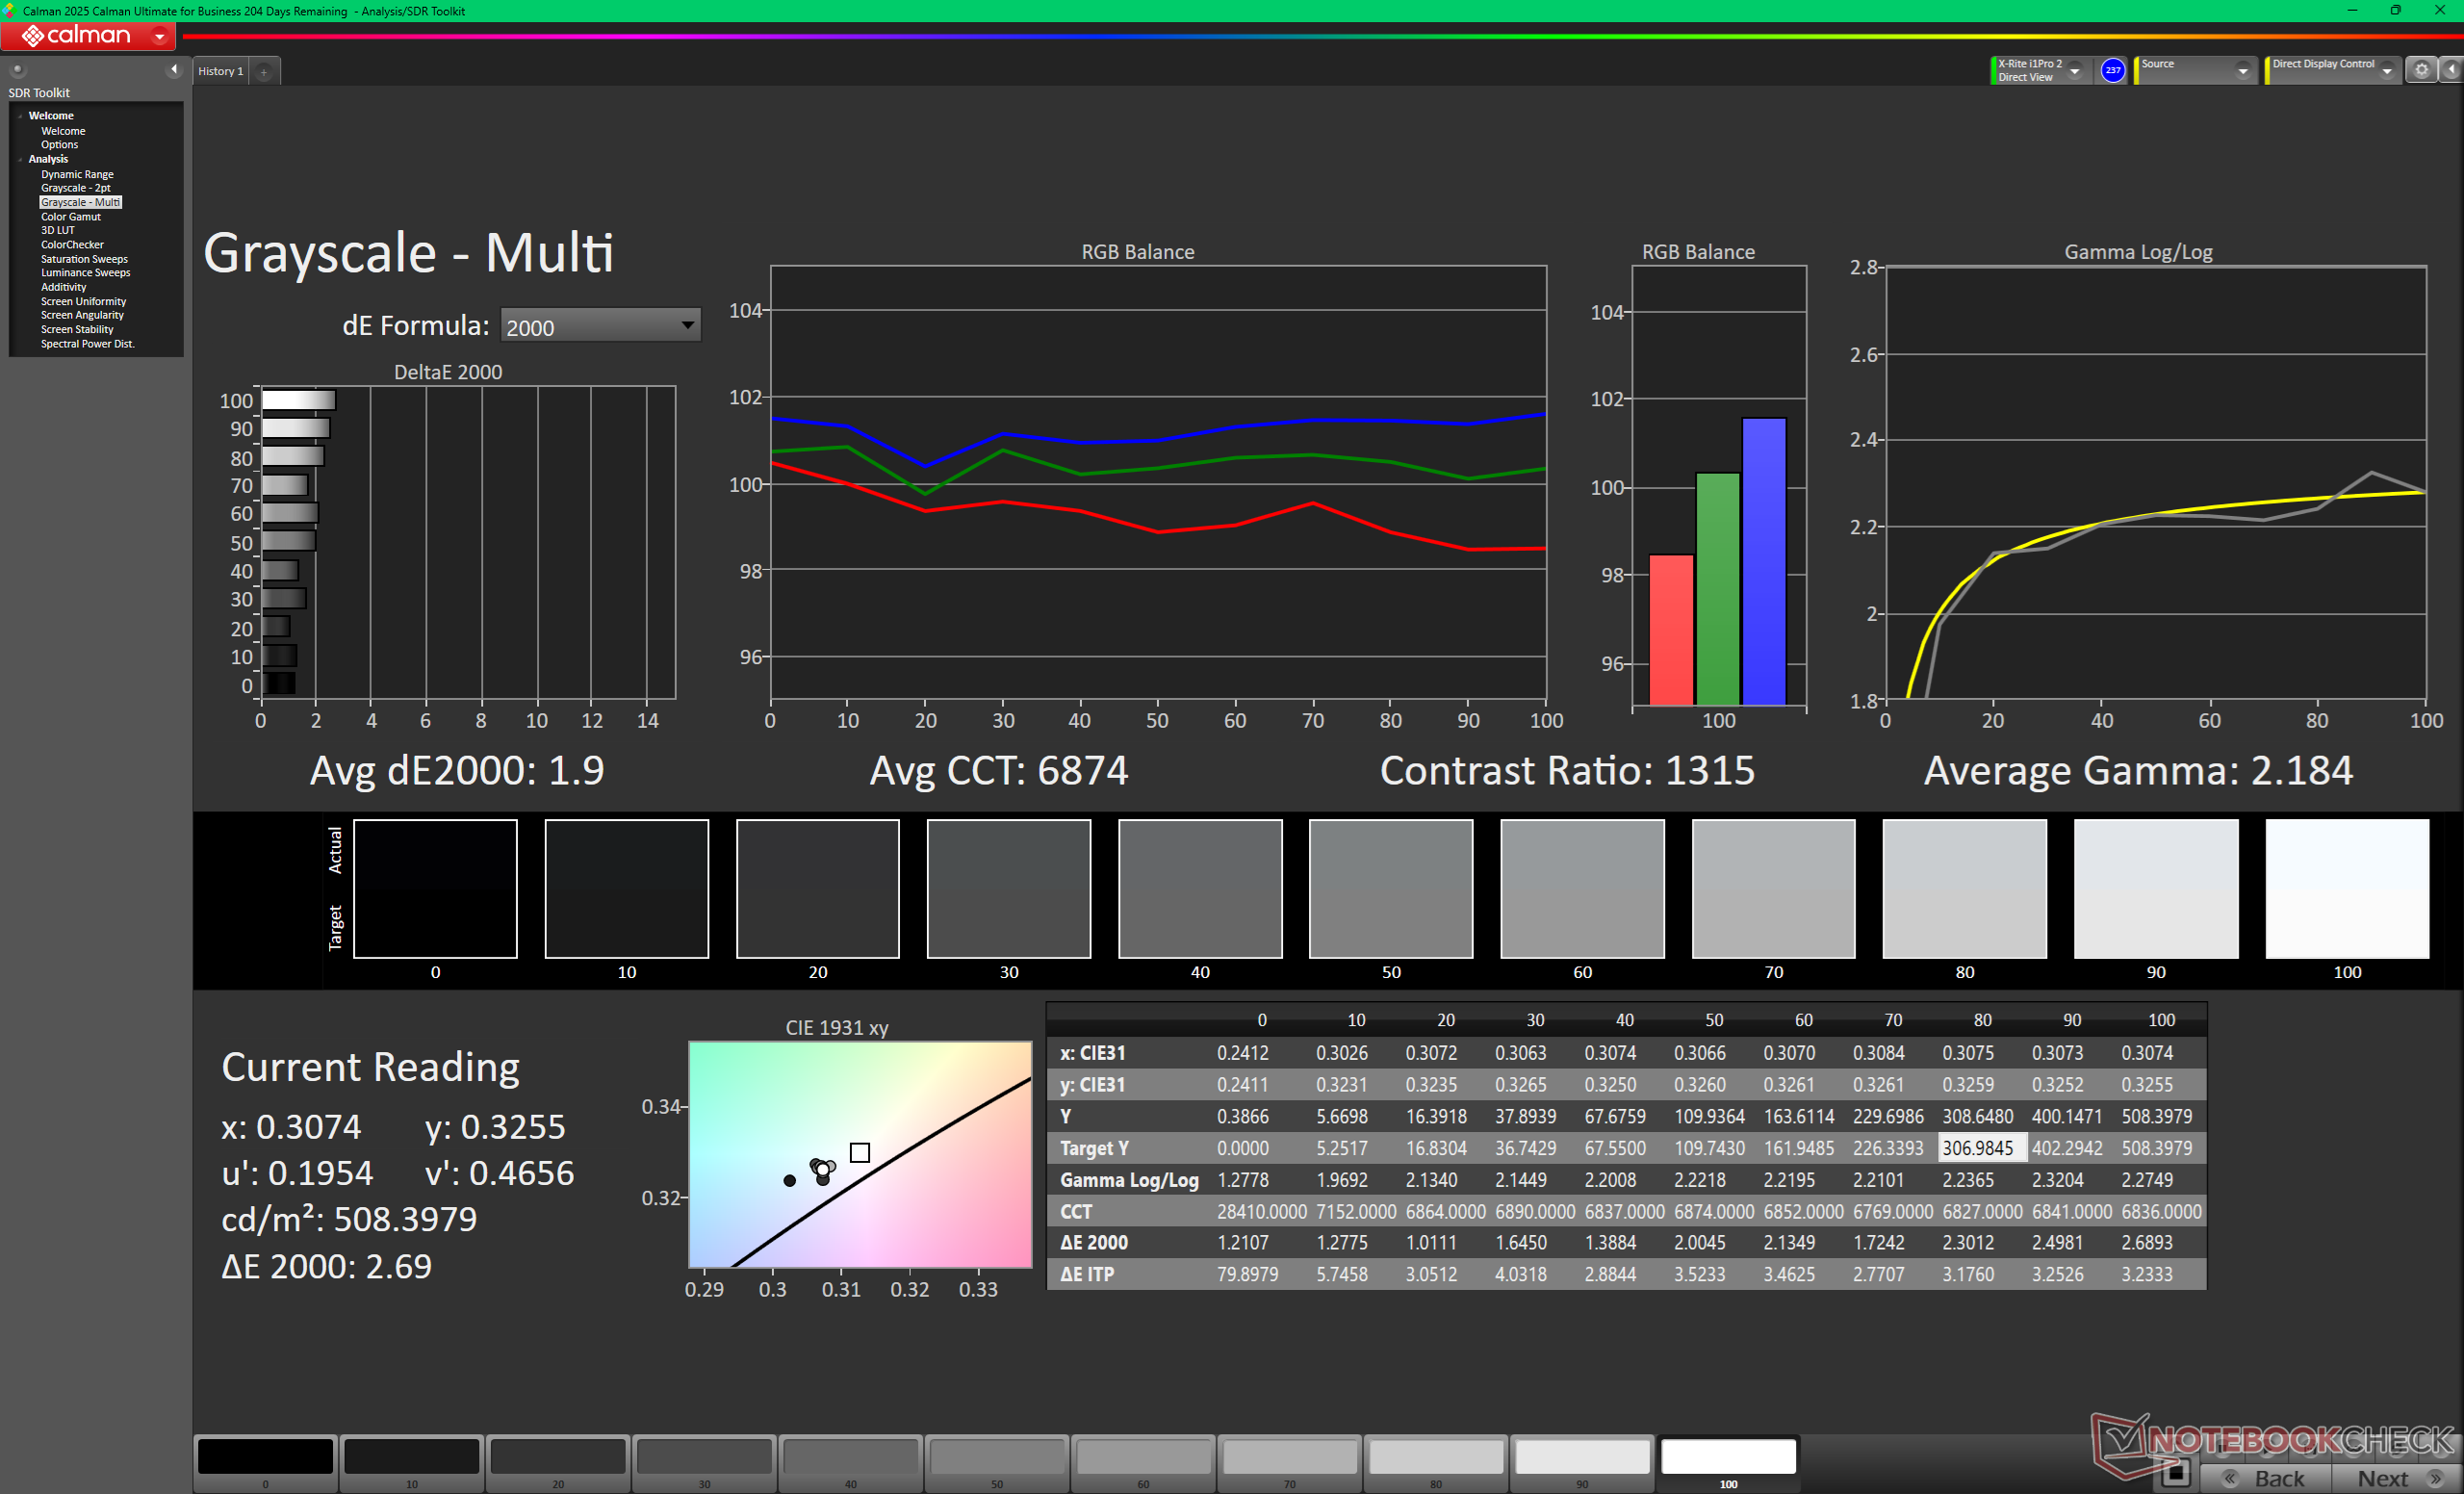
ΔE Greyscale Calman: 3.9 | ∀{0.09-98 Ø4.97}
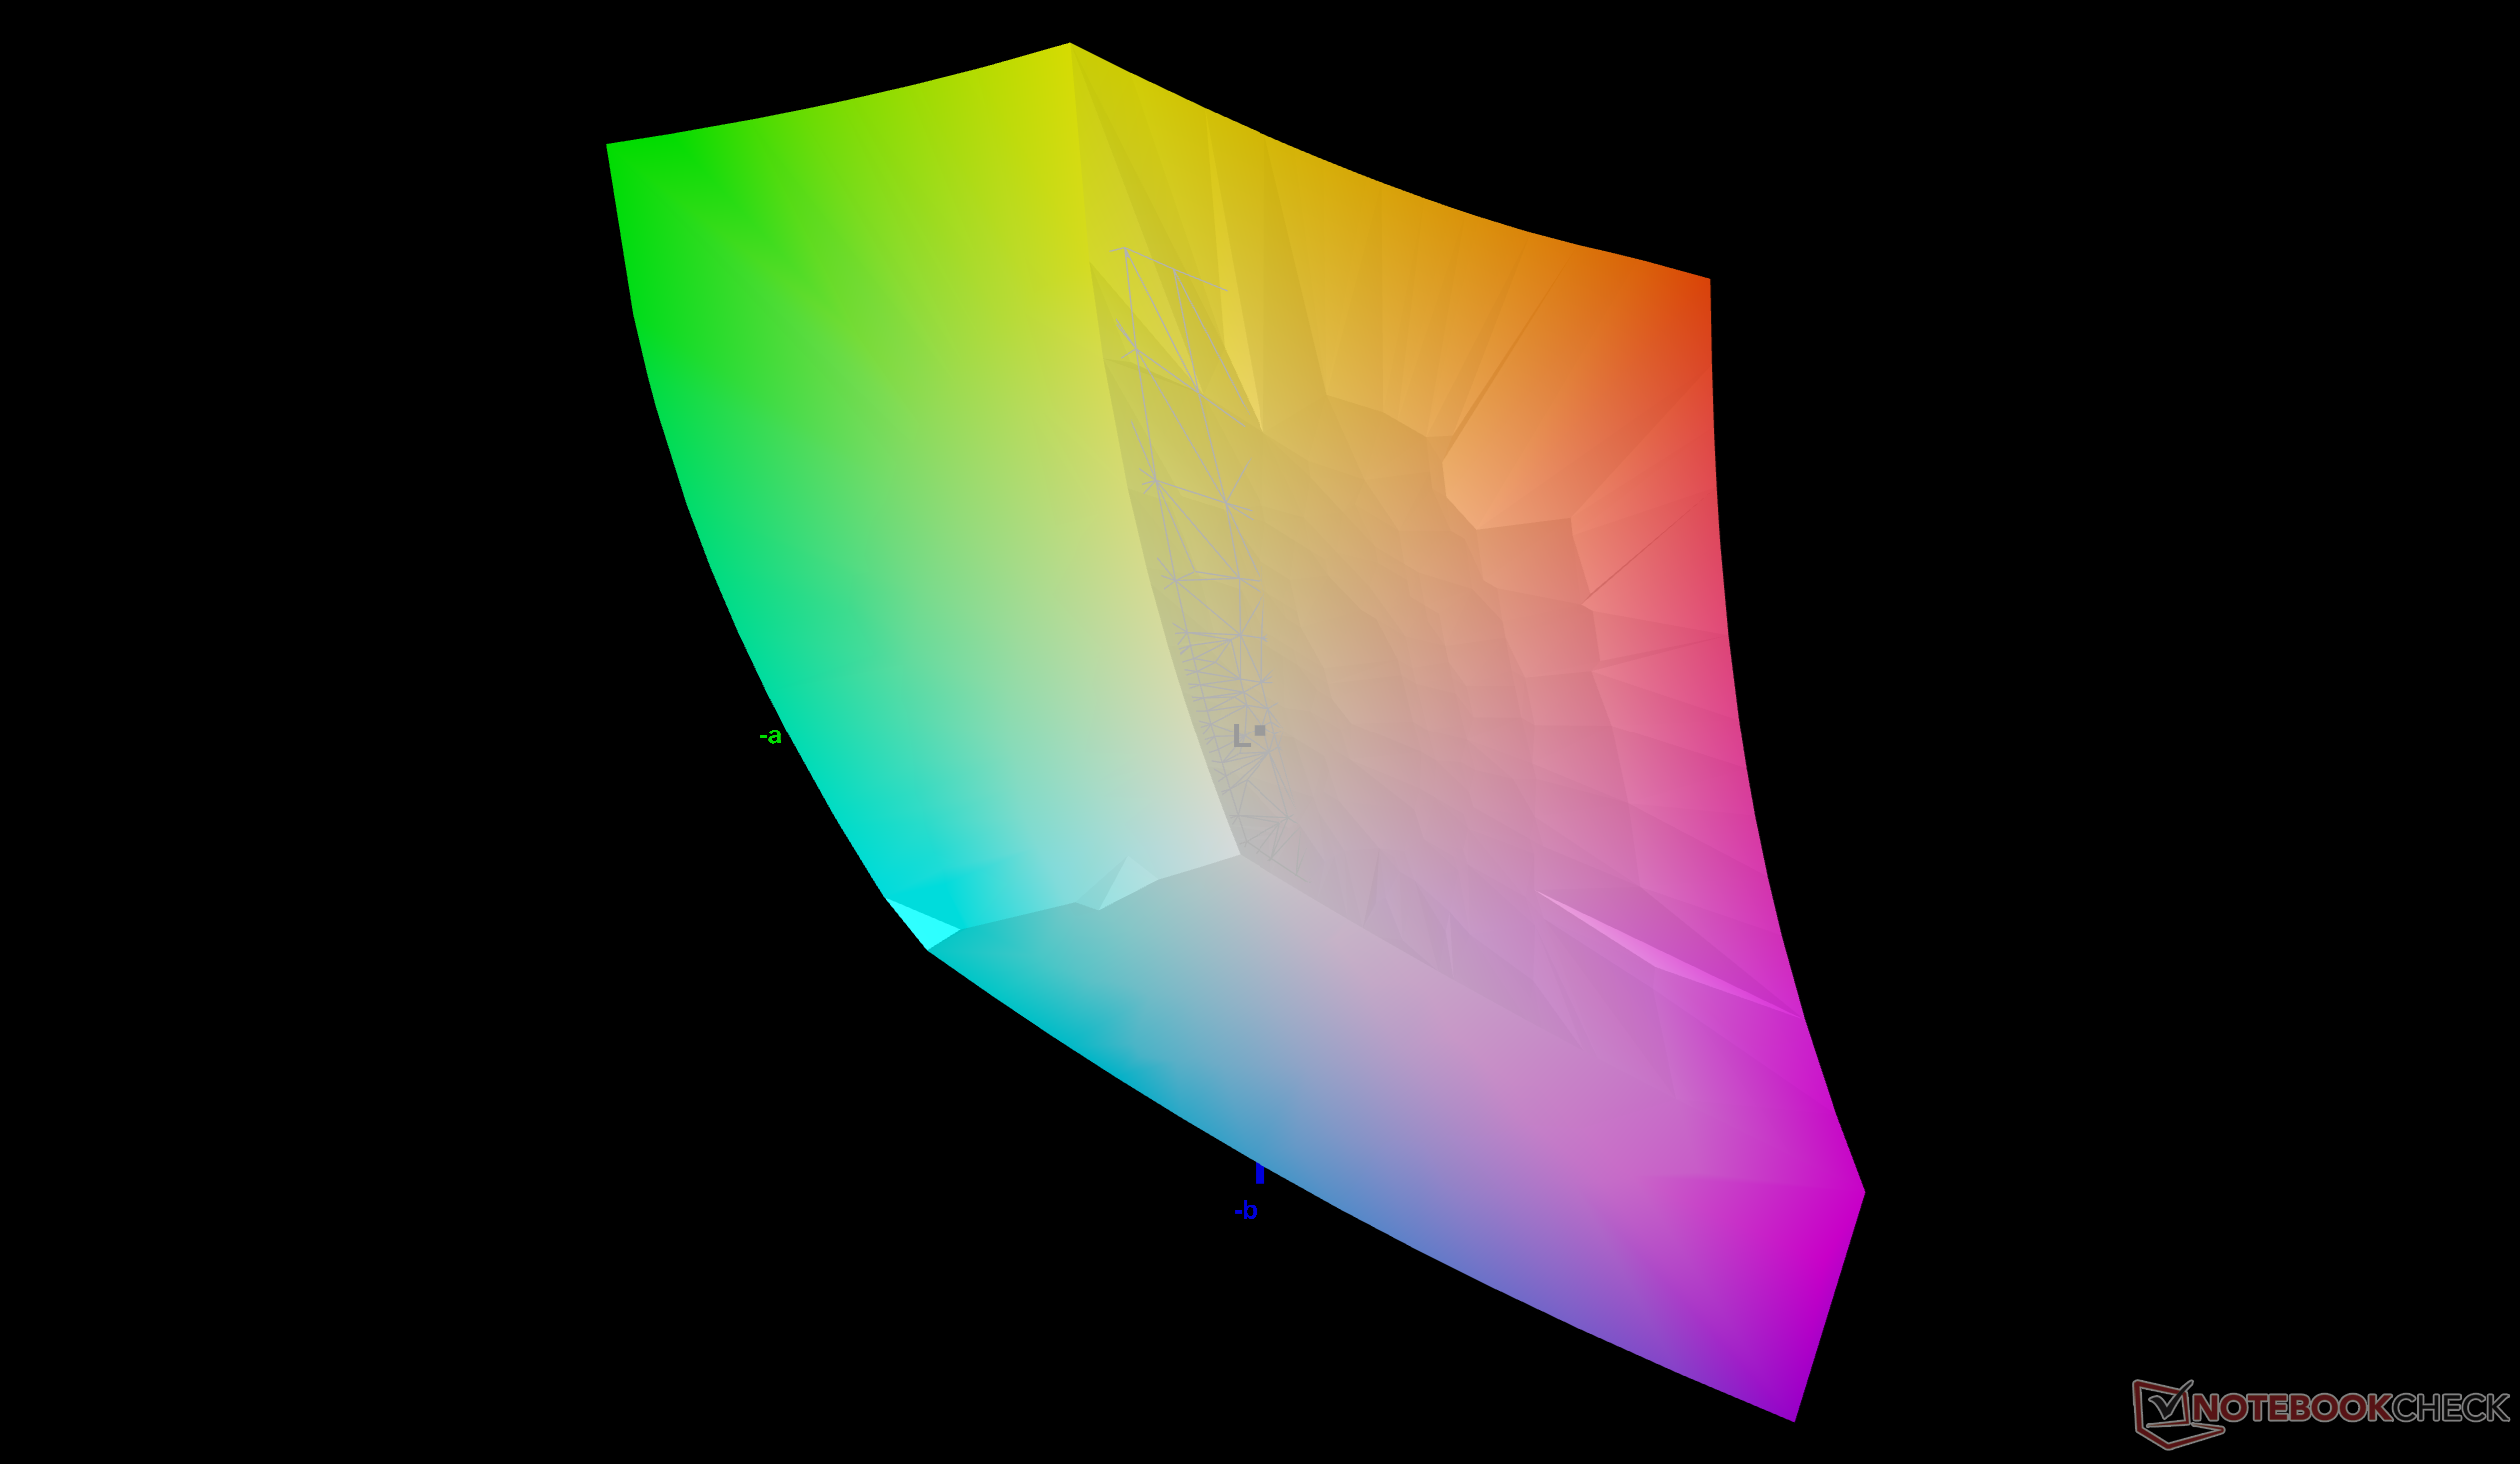
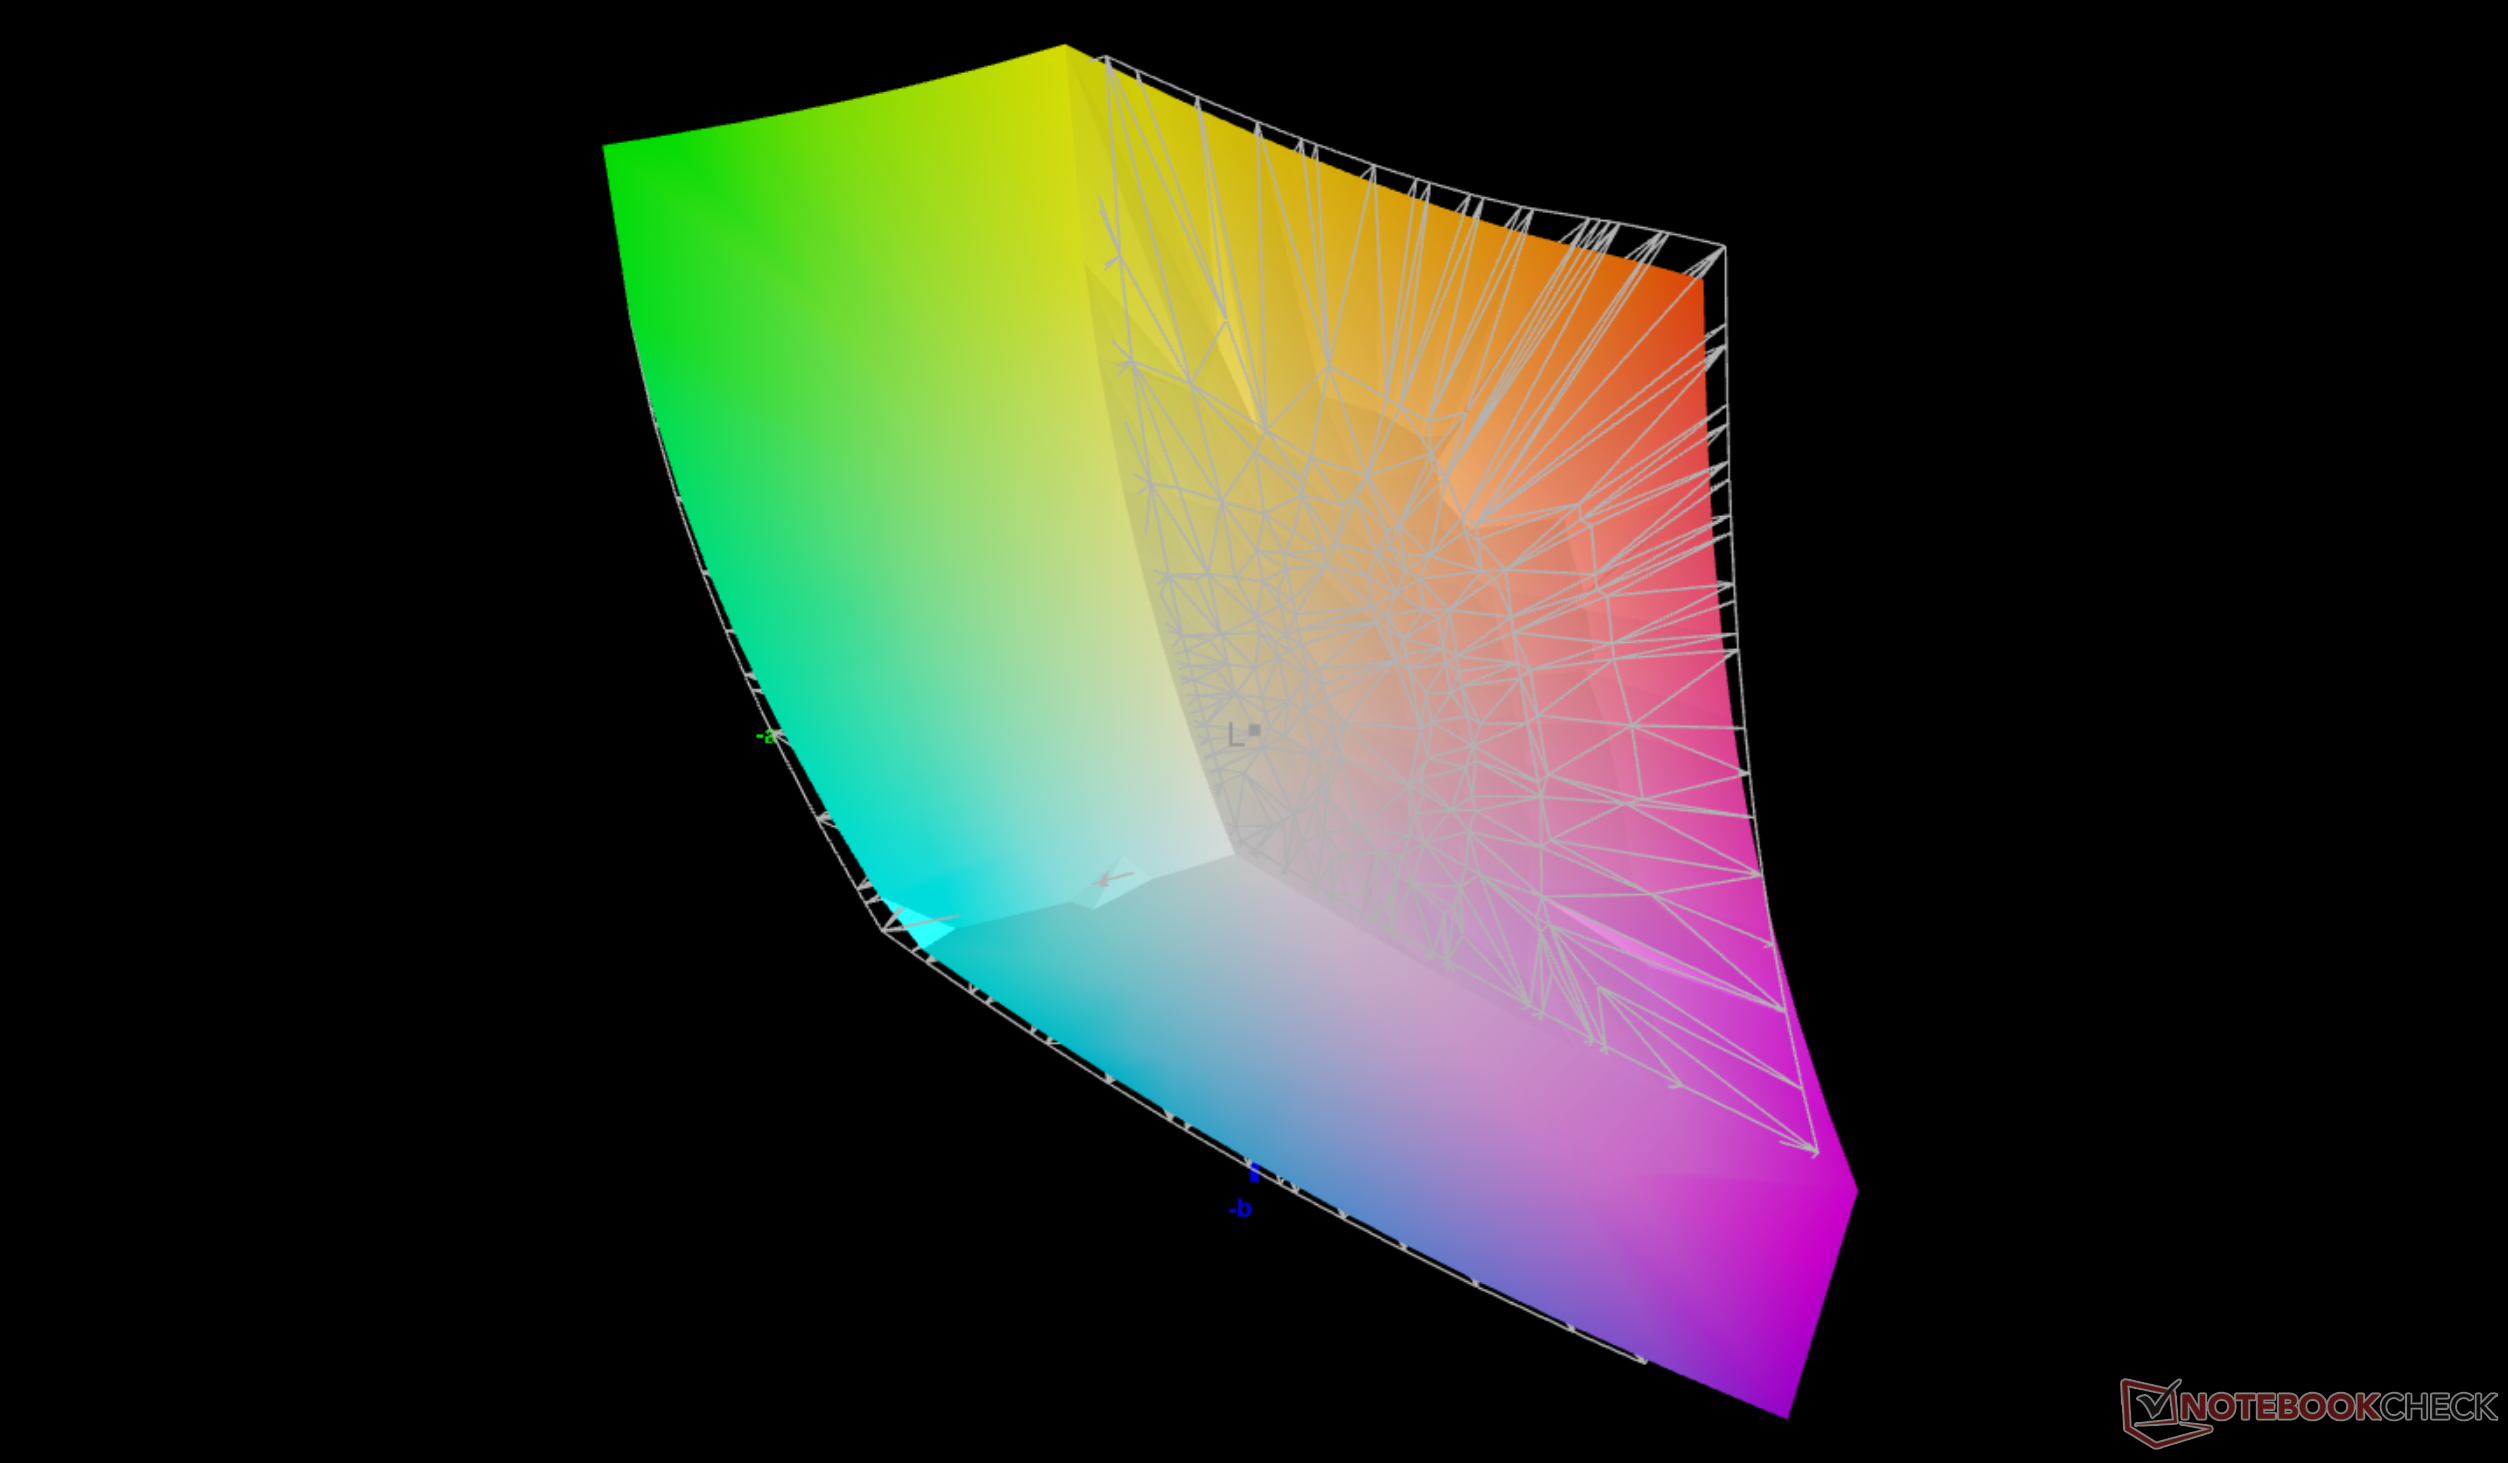
83.1% AdobeRGB 1998 (Argyll 3D)
99.6% sRGB (Argyll 3D)
94.9% Display P3 (Argyll 3D)
Gamma: 2.57
CCT: 6813 K
| MSI Crosshair A16 HX E8WGK AU Optronics B160QAN02.3, IPS, 2560x1600, 16", 240 Hz | MSI Crosshair 16 HX AI D2XWGKG AUO B160QAN02.3, IPS, 2560x1600, 16", 240 Hz | Alienware 16X Aurora Core Ultra 9 290HX Plus Samsung 160HU05, OLED, 2560x1600, 16", 240 Hz | Lenovo Legion 7 16 AGP11 ATNA60HU02-0, OLED, 2560x1600, 16", 240 Hz | Gigabyte Gaming A16 Pro GA6DH (Core 7 240H, RTX 5070 Ti) BOE0D86 (NS160QDM-NY3), IPS, 2560x1600, 16", 165 Hz | Acer Predator Helios Neo 16S AI PHN16S-71-94L9 Samsung ATNA60DL03-0, OLED, 2560x1600, 16", 240 Hz | |
|---|---|---|---|---|---|---|
| Display | 1% | 6% | 5% | -13% | 7% | |
| Display P3 Coverage (%) | 94.9 | 95.5 1% | 99.6 5% | 99.2 5% | 72.5 -24% | 99.9 5% |
| sRGB Coverage (%) | 99.6 | 99.7 0% | 100 0% | 100 0% | 99.3 0% | 100 0% |
| AdobeRGB 1998 Coverage (%) | 83.1 | 83.9 1% | 93.9 13% | 90.2 9% | 70.4 -15% | 96.5 16% |
| Response Times | 19% | 94% | 82% | -7% | 96% | |
| Response Time Grey 50% / Grey 80% * (ms) | 4.2 ? | 3.59 ? 15% | 0.29 ? 93% | 1.41 ? 66% | 6.8 ? -62% | 0.2 ? 95% |
| Response Time Black / White * (ms) | 9.2 ? | 7.09 ? 23% | 0.45 ? 95% | 0.25 ? 97% | 4.8 ? 48% | 0.25 ? 97% |
| PWM Frequency (Hz) | 1439.8 ? | 1440 ? | 960 | |||
| PWM Amplitude * (%) | 29 | 44 | 50 | |||
| Screen | -24% | 15% | 242% | 18% | 97% | |
| Brightness middle (cd/m²) | 512.4 | 472 -8% | 380.5 -26% | 499 -3% | 517 1% | 390 -24% |
| Brightness (cd/m²) | 476 | 438 -8% | 384 -19% | 502 5% | 490 3% | 394 -17% |
| Brightness Distribution (%) | 89 | 88 -1% | 98 10% | 98 10% | 92 3% | 98 10% |
| Black Level * (cd/m²) | 0.39 | 0.4 -3% | 0.02 95% | 0.39 -0% | 0.04 90% | |
| Contrast (:1) | 1314 | 1180 -10% | 24950 1799% | 1326 1% | 9750 642% | |
| Colorchecker dE 2000 * | 4.65 | 6.07 -31% | 3.27 30% | 2.5 46% | 1.62 65% | 1.61 65% |
| Colorchecker dE 2000 max. * | 8.33 | 9.76 -17% | 6.31 24% | 7.8 6% | 3.52 58% | 3.49 58% |
| Colorchecker dE 2000 calibrated * | 1.3 | 2.25 -73% | 1.1 15% | 1.62 -25% | 1.59 -22% | |
| Greyscale dE 2000 * | 3.9 | 6.4 -64% | 1 74% | 4.7 -21% | 1.85 53% | 1.2 69% |
| Gamma | 2.57 86% | 2.52 87% | 2.23 99% | 2.21 100% | 2.36 93% | 2.235 98% |
| CCT | 6813 95% | 7987 81% | 6410 101% | 6715 97% | 6596 99% | 6580 99% |
| Total Average (Program / Settings) | -1% /
-13% | 38% /
26% | 110% /
163% | -1% /
8% | 67% /
77% |
* ... smaller is better
Display Response Times
| ↔ Response Time Black to White | ||
|---|---|---|
| 9.2 ms ... rise ↗ and fall ↘ combined | ↗ 4.9 ms rise | 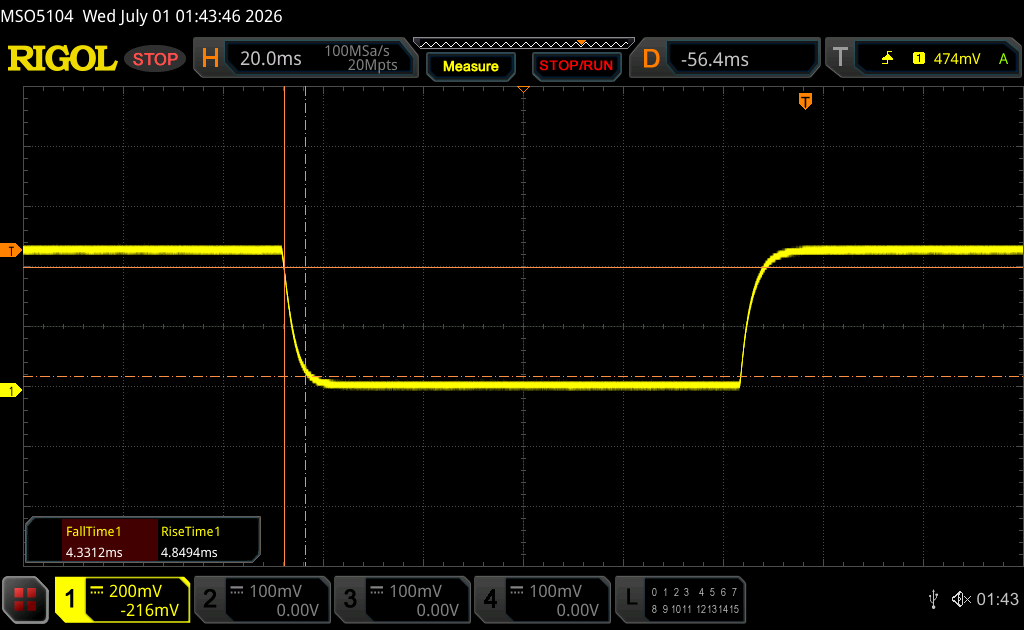 |
| ↘ 4.3 ms fall | ||
| The screen shows fast response rates in our tests and should be suited for gaming. In comparison, all tested devices range from 0.1 (minimum) to 240 (maximum) ms. » 26 % of all devices are better. This means that the measured response time is better than the average of all tested devices (19.8 ms). | ||
| ↔ Response Time 50% Grey to 80% Grey | ||
| 4.2 ms ... rise ↗ and fall ↘ combined | ↗ 1.8 ms rise | 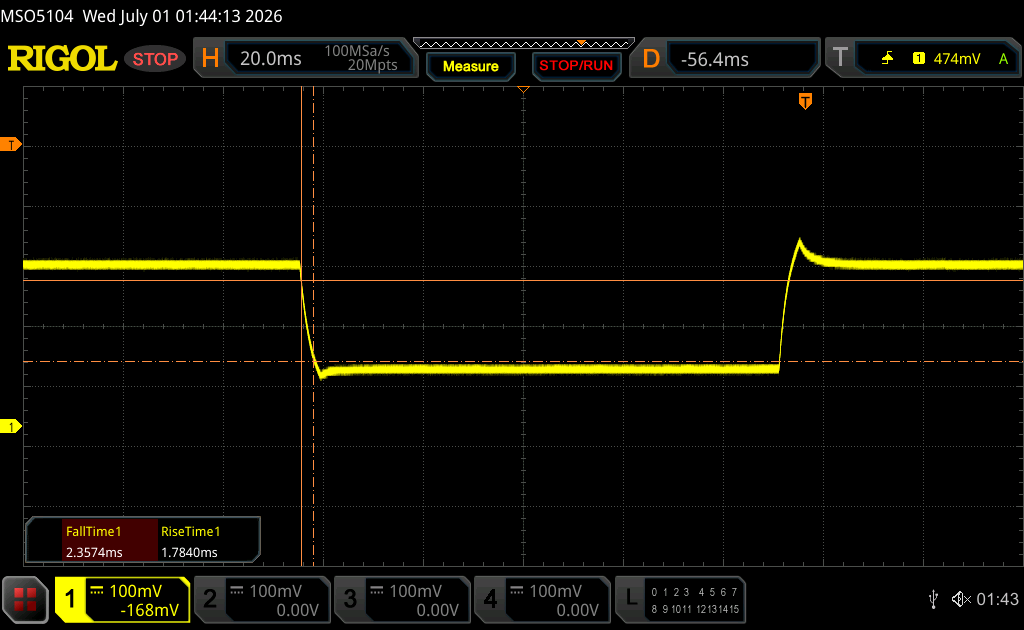 |
| ↘ 2.4 ms fall | ||
| The screen shows very fast response rates in our tests and should be very well suited for fast-paced gaming. In comparison, all tested devices range from 0.165 (minimum) to 636 (maximum) ms. » 16 % of all devices are better. This means that the measured response time is better than the average of all tested devices (31 ms). | ||
Screen Flickering / PWM (Pulse-Width Modulation)
| Screen flickering / PWM not detected | 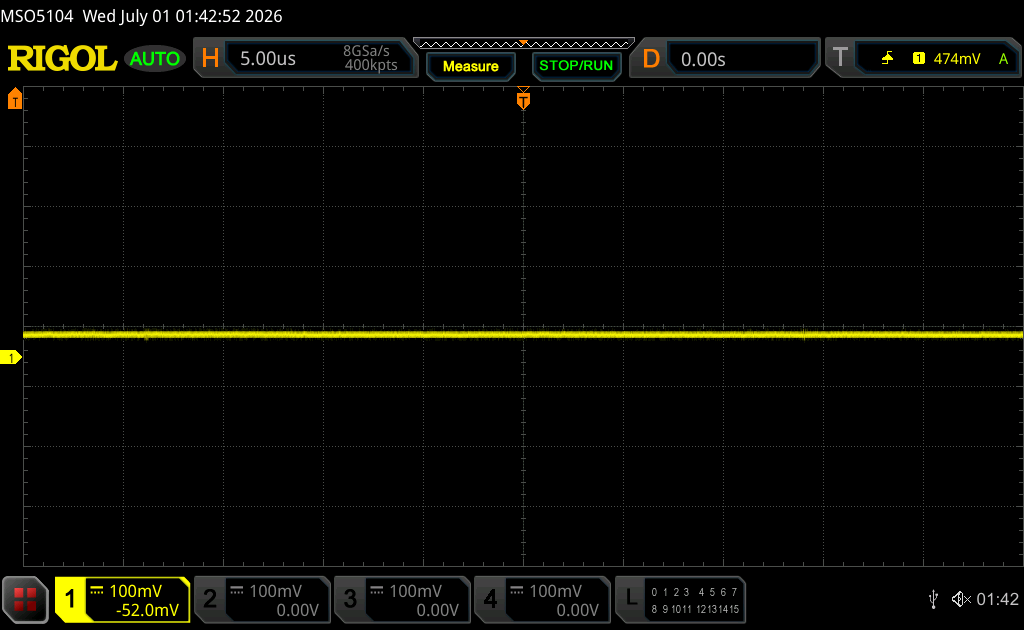 | ||
In comparison: 52 % of all tested devices do not use PWM to dim the display. If PWM was detected, an average of 7772 (minimum: 5 - maximum: 343500) Hz was measured. | |||
Performance
Testing Conditions
The system comes preset in Performance mode with Apex mode active. We also set the system to dGPU mode prior to running the benchmarks below.
Processor Performance
Cinebench R15 Multi Loop
Cinebench R23: Multi Core | Single Core
Cinebench R20: CPU (Multi Core) | CPU (Single Core)
Cinebench R15: CPU Multi 64Bit | CPU Single 64Bit
Blender: v2.79 BMW27 CPU
7-Zip 18.03: 7z b 4 | 7z b 4 -mmt1
Geekbench 6.7: Multi-Core | Single-Core
Geekbench 5.5: Multi-Core | Single-Core
HWBOT x265 Benchmark v2.2: 4k Preset
LibreOffice : 20 Documents To PDF
R Benchmark 2.5: Overall mean
* ... smaller is better
AIDA64: FP32 Ray-Trace | FPU Julia | CPU SHA3 | CPU Queen | FPU SinJulia | FPU Mandel | CPU AES | CPU ZLib | FP64 Ray-Trace | CPU PhotoWorxx | CPU CheckMate
| Performance rating | |
| MSI Crosshair A16 HX E8WGK -1! | |
| Average AMD Ryzen 9 8940HX | |
| Alienware 16X Aurora Core Ultra 9 290HX Plus -1! | |
| MSI Crosshair 16 HX AI D2XWGKG -1! | |
| Lenovo Legion 7 16 AGP11 -1! | |
| Acer Predator Helios Neo 16S AI PHN16S-71-94L9 -1! | |
| Gigabyte Gaming A16 Pro GA6DH (Core 7 240H, RTX 5070 Ti) -1! | |
| AIDA64 / FP32 Ray-Trace | |
| MSI Crosshair A16 HX E8WGK (v8.20.8100) | |
| Average AMD Ryzen 9 8940HX (43311 - 53747, n=3) | |
| Lenovo Legion 7 16 AGP11 (v8.20.8100) | |
| MSI Crosshair 16 HX AI D2XWGKG (v6.92.6600) | |
| Alienware 16X Aurora Core Ultra 9 290HX Plus (v8.20.8100) | |
| Acer Predator Helios Neo 16S AI PHN16S-71-94L9 (v6.92.6600) | |
| Gigabyte Gaming A16 Pro GA6DH (Core 7 240H, RTX 5070 Ti) (v8.20.8100) | |
| AIDA64 / FPU Julia | |
| MSI Crosshair A16 HX E8WGK (v8.20.8100) | |
| Average AMD Ryzen 9 8940HX (171374 - 218716, n=3) | |
| MSI Crosshair 16 HX AI D2XWGKG (v6.92.6600) | |
| Alienware 16X Aurora Core Ultra 9 290HX Plus (v8.20.8100) | |
| Lenovo Legion 7 16 AGP11 (v8.20.8100) | |
| Acer Predator Helios Neo 16S AI PHN16S-71-94L9 (v6.92.6600) | |
| Gigabyte Gaming A16 Pro GA6DH (Core 7 240H, RTX 5070 Ti) (v8.20.8100) | |
| AIDA64 / CPU SHA3 | |
| MSI Crosshair A16 HX E8WGK (v8.20.8100) | |
| Average AMD Ryzen 9 8940HX (7988 - 9427, n=3) | |
| MSI Crosshair 16 HX AI D2XWGKG (v6.92.6600) | |
| Alienware 16X Aurora Core Ultra 9 290HX Plus (v8.20.8100) | |
| Acer Predator Helios Neo 16S AI PHN16S-71-94L9 (v6.92.6600) | |
| Lenovo Legion 7 16 AGP11 (v8.20.8100) | |
| Gigabyte Gaming A16 Pro GA6DH (Core 7 240H, RTX 5070 Ti) (v8.20.8100) | |
| AIDA64 / CPU Queen | |
| Average AMD Ryzen 9 8940HX (169334 - 172010, n=2) | |
| MSI Crosshair 16 HX AI D2XWGKG (v6.92.6600) | |
| Acer Predator Helios Neo 16S AI PHN16S-71-94L9 (v6.92.6600) | |
| AIDA64 / FPU SinJulia | |
| MSI Crosshair A16 HX E8WGK (v8.20.8100) | |
| Average AMD Ryzen 9 8940HX (26855 - 29886, n=3) | |
| Lenovo Legion 7 16 AGP11 (v8.20.8100) | |
| Alienware 16X Aurora Core Ultra 9 290HX Plus (v8.20.8100) | |
| MSI Crosshair 16 HX AI D2XWGKG (v6.92.6600) | |
| Acer Predator Helios Neo 16S AI PHN16S-71-94L9 (v6.92.6600) | |
| Gigabyte Gaming A16 Pro GA6DH (Core 7 240H, RTX 5070 Ti) (v8.20.8100) | |
| AIDA64 / FPU Mandel | |
| MSI Crosshair A16 HX E8WGK (v8.20.8100) | |
| Average AMD Ryzen 9 8940HX (90684 - 117231, n=3) | |
| MSI Crosshair 16 HX AI D2XWGKG (v6.92.6600) | |
| Alienware 16X Aurora Core Ultra 9 290HX Plus (v8.20.8100) | |
| Lenovo Legion 7 16 AGP11 (v8.20.8100) | |
| Acer Predator Helios Neo 16S AI PHN16S-71-94L9 (v6.92.6600) | |
| Gigabyte Gaming A16 Pro GA6DH (Core 7 240H, RTX 5070 Ti) (v8.20.8100) | |
| AIDA64 / CPU AES | |
| MSI Crosshair A16 HX E8WGK (v8.20.8100) | |
| Average AMD Ryzen 9 8940HX (150768 - 175214, n=3) | |
| Alienware 16X Aurora Core Ultra 9 290HX Plus (v8.20.8100) | |
| MSI Crosshair 16 HX AI D2XWGKG (v6.92.6600) | |
| Lenovo Legion 7 16 AGP11 (v8.20.8100) | |
| Acer Predator Helios Neo 16S AI PHN16S-71-94L9 (v6.92.6600) | |
| Gigabyte Gaming A16 Pro GA6DH (Core 7 240H, RTX 5070 Ti) (v8.20.8100) | |
| AIDA64 / CPU ZLib | |
| MSI Crosshair A16 HX E8WGK (v8.20.8100) | |
| Average AMD Ryzen 9 8940HX (1784 - 2122, n=3) | |
| MSI Crosshair 16 HX AI D2XWGKG (v6.92.6600) | |
| Alienware 16X Aurora Core Ultra 9 290HX Plus (v8.20.8100) | |
| Acer Predator Helios Neo 16S AI PHN16S-71-94L9 (v6.92.6600) | |
| Lenovo Legion 7 16 AGP11 (v8.20.8100) | |
| Gigabyte Gaming A16 Pro GA6DH (Core 7 240H, RTX 5070 Ti) (v8.20.8100) | |
| AIDA64 / FP64 Ray-Trace | |
| MSI Crosshair A16 HX E8WGK (v8.20.8100) | |
| Average AMD Ryzen 9 8940HX (23193 - 28773, n=3) | |
| Lenovo Legion 7 16 AGP11 (v8.20.8100) | |
| MSI Crosshair 16 HX AI D2XWGKG (v6.92.6600) | |
| Alienware 16X Aurora Core Ultra 9 290HX Plus (v8.20.8100) | |
| Acer Predator Helios Neo 16S AI PHN16S-71-94L9 (v6.92.6600) | |
| Gigabyte Gaming A16 Pro GA6DH (Core 7 240H, RTX 5070 Ti) (v8.20.8100) | |
| AIDA64 / CPU PhotoWorxx | |
| Lenovo Legion 7 16 AGP11 (v8.20.8100) | |
| Acer Predator Helios Neo 16S AI PHN16S-71-94L9 (v6.92.6600) | |
| Alienware 16X Aurora Core Ultra 9 290HX Plus (v8.20.8100) | |
| Gigabyte Gaming A16 Pro GA6DH (Core 7 240H, RTX 5070 Ti) (v8.20.8100) | |
| MSI Crosshair 16 HX AI D2XWGKG (v6.92.6600) | |
| MSI Crosshair A16 HX E8WGK (v8.20.8100) | |
| Average AMD Ryzen 9 8940HX (18283 - 35274, n=3) | |
| AIDA64 / CPU CheckMate | |
| MSI Crosshair A16 HX E8WGK (v8.20.8100) | |
| Average AMD Ryzen 9 8940HX (n=1) | |
| Lenovo Legion 7 16 AGP11 (v8.20.8100) | |
| Alienware 16X Aurora Core Ultra 9 290HX Plus (v8.20.8100) | |
| Gigabyte Gaming A16 Pro GA6DH (Core 7 240H, RTX 5070 Ti) (v8.20.8100) | |
System Performance
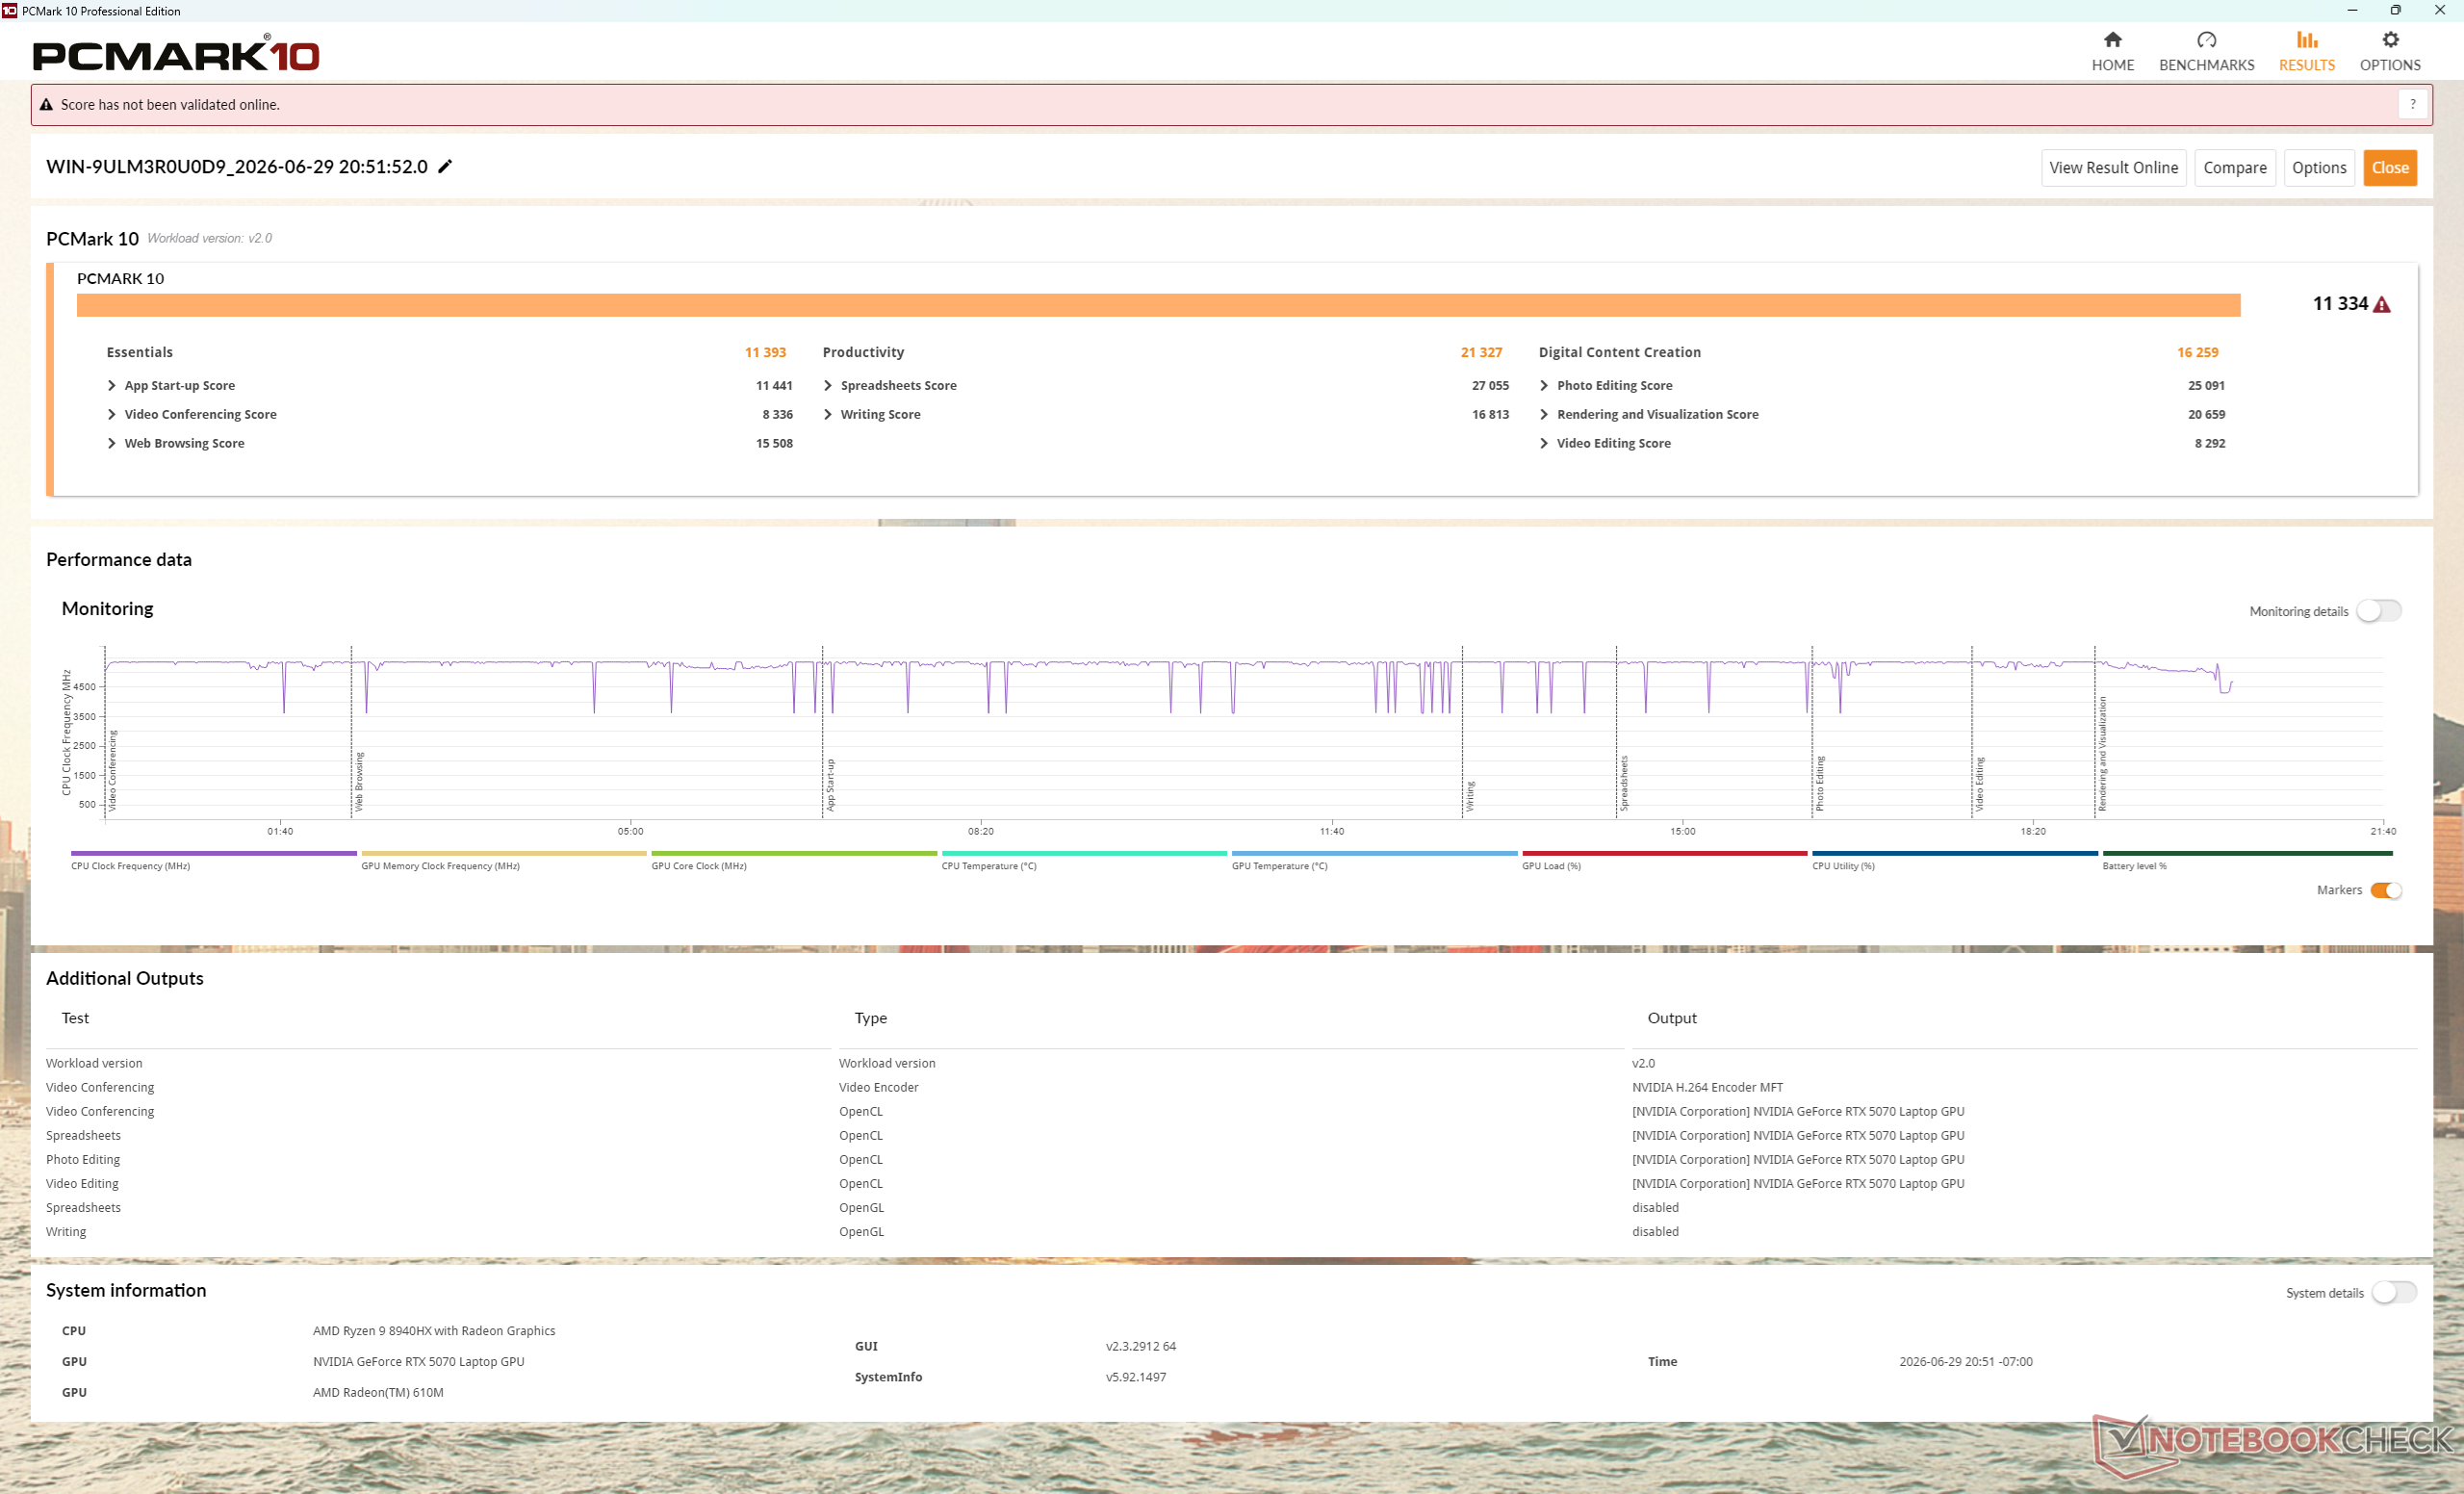
PCMark 10: Score | Essentials | Productivity | Digital Content Creation
CrossMark: Overall | Productivity | Creativity | Responsiveness
WebXPRT 3: Overall
WebXPRT 4: Overall
Mozilla Kraken 1.1: Total
Geekbench AI: Quantized GPU 1.7 | Half Precision GPU 1.7 | Single Precision GPU 1.7
| Performance rating | |
| Alienware 16X Aurora Core Ultra 9 290HX Plus | |
| MSI Crosshair A16 HX E8WGK | |
| Average AMD Ryzen 9 8940HX, NVIDIA GeForce RTX 5070 Laptop | |
| MSI Crosshair 16 HX AI D2XWGKG | |
| Acer Predator Helios Neo 16S AI PHN16S-71-94L9 -3! | |
| Lenovo Legion 7 16 AGP11 -3! | |
| Gigabyte Gaming A16 Pro GA6DH (Core 7 240H, RTX 5070 Ti) | |
| PCMark 10 / Score | |
| MSI Crosshair A16 HX E8WGK | |
| Alienware 16X Aurora Core Ultra 9 290HX Plus | |
| Average AMD Ryzen 9 8940HX, NVIDIA GeForce RTX 5070 Laptop (8106 - 11334, n=2) | |
| Lenovo Legion 7 16 AGP11 | |
| Gigabyte Gaming A16 Pro GA6DH (Core 7 240H, RTX 5070 Ti) | |
| Acer Predator Helios Neo 16S AI PHN16S-71-94L9 | |
| MSI Crosshair 16 HX AI D2XWGKG | |
| PCMark 10 / Essentials | |
| Alienware 16X Aurora Core Ultra 9 290HX Plus | |
| MSI Crosshair A16 HX E8WGK | |
| Average AMD Ryzen 9 8940HX, NVIDIA GeForce RTX 5070 Laptop (11371 - 11393, n=2) | |
| Acer Predator Helios Neo 16S AI PHN16S-71-94L9 | |
| MSI Crosshair 16 HX AI D2XWGKG | |
| Lenovo Legion 7 16 AGP11 | |
| Gigabyte Gaming A16 Pro GA6DH (Core 7 240H, RTX 5070 Ti) | |
| PCMark 10 / Productivity | |
| MSI Crosshair A16 HX E8WGK | |
| Alienware 16X Aurora Core Ultra 9 290HX Plus | |
| Lenovo Legion 7 16 AGP11 | |
| Average AMD Ryzen 9 8940HX, NVIDIA GeForce RTX 5070 Laptop (9492 - 21327, n=2) | |
| Gigabyte Gaming A16 Pro GA6DH (Core 7 240H, RTX 5070 Ti) | |
| Acer Predator Helios Neo 16S AI PHN16S-71-94L9 | |
| MSI Crosshair 16 HX AI D2XWGKG | |
| PCMark 10 / Digital Content Creation | |
| Alienware 16X Aurora Core Ultra 9 290HX Plus | |
| MSI Crosshair 16 HX AI D2XWGKG | |
| MSI Crosshair A16 HX E8WGK | |
| Average AMD Ryzen 9 8940HX, NVIDIA GeForce RTX 5070 Laptop (13392 - 16259, n=2) | |
| Acer Predator Helios Neo 16S AI PHN16S-71-94L9 | |
| Lenovo Legion 7 16 AGP11 | |
| Gigabyte Gaming A16 Pro GA6DH (Core 7 240H, RTX 5070 Ti) | |
| CrossMark / Overall | |
| Alienware 16X Aurora Core Ultra 9 290HX Plus | |
| Acer Predator Helios Neo 16S AI PHN16S-71-94L9 | |
| MSI Crosshair 16 HX AI D2XWGKG | |
| MSI Crosshair A16 HX E8WGK | |
| Average AMD Ryzen 9 8940HX, NVIDIA GeForce RTX 5070 Laptop (1977 - 2011, n=2) | |
| Gigabyte Gaming A16 Pro GA6DH (Core 7 240H, RTX 5070 Ti) | |
| Lenovo Legion 7 16 AGP11 | |
| CrossMark / Productivity | |
| Alienware 16X Aurora Core Ultra 9 290HX Plus | |
| MSI Crosshair 16 HX AI D2XWGKG | |
| Acer Predator Helios Neo 16S AI PHN16S-71-94L9 | |
| MSI Crosshair A16 HX E8WGK | |
| Average AMD Ryzen 9 8940HX, NVIDIA GeForce RTX 5070 Laptop (1844 - 1869, n=2) | |
| Gigabyte Gaming A16 Pro GA6DH (Core 7 240H, RTX 5070 Ti) | |
| Lenovo Legion 7 16 AGP11 | |
| CrossMark / Creativity | |
| Alienware 16X Aurora Core Ultra 9 290HX Plus | |
| Acer Predator Helios Neo 16S AI PHN16S-71-94L9 | |
| MSI Crosshair 16 HX AI D2XWGKG | |
| MSI Crosshair A16 HX E8WGK | |
| Average AMD Ryzen 9 8940HX, NVIDIA GeForce RTX 5070 Laptop (2225 - 2298, n=2) | |
| Gigabyte Gaming A16 Pro GA6DH (Core 7 240H, RTX 5070 Ti) | |
| Lenovo Legion 7 16 AGP11 | |
| CrossMark / Responsiveness | |
| Alienware 16X Aurora Core Ultra 9 290HX Plus | |
| MSI Crosshair 16 HX AI D2XWGKG | |
| Acer Predator Helios Neo 16S AI PHN16S-71-94L9 | |
| Average AMD Ryzen 9 8940HX, NVIDIA GeForce RTX 5070 Laptop (1680 - 1709, n=2) | |
| MSI Crosshair A16 HX E8WGK | |
| Gigabyte Gaming A16 Pro GA6DH (Core 7 240H, RTX 5070 Ti) | |
| Lenovo Legion 7 16 AGP11 | |
| WebXPRT 3 / Overall | |
| Alienware 16X Aurora Core Ultra 9 290HX Plus | |
| MSI Crosshair 16 HX AI D2XWGKG | |
| Lenovo Legion 7 16 AGP11 | |
| Acer Predator Helios Neo 16S AI PHN16S-71-94L9 | |
| MSI Crosshair A16 HX E8WGK | |
| Average AMD Ryzen 9 8940HX, NVIDIA GeForce RTX 5070 Laptop (274 - 322, n=2) | |
| Gigabyte Gaming A16 Pro GA6DH (Core 7 240H, RTX 5070 Ti) | |
| WebXPRT 4 / Overall | |
| Alienware 16X Aurora Core Ultra 9 290HX Plus | |
| MSI Crosshair 16 HX AI D2XWGKG | |
| Acer Predator Helios Neo 16S AI PHN16S-71-94L9 | |
| MSI Crosshair A16 HX E8WGK | |
| Lenovo Legion 7 16 AGP11 | |
| Average AMD Ryzen 9 8940HX, NVIDIA GeForce RTX 5070 Laptop (230 - 283, n=2) | |
| Gigabyte Gaming A16 Pro GA6DH (Core 7 240H, RTX 5070 Ti) | |
| Mozilla Kraken 1.1 / Total | |
| Gigabyte Gaming A16 Pro GA6DH (Core 7 240H, RTX 5070 Ti) | |
| Average AMD Ryzen 9 8940HX, NVIDIA GeForce RTX 5070 Laptop (474 - 507, n=2) | |
| MSI Crosshair A16 HX E8WGK | |
| Lenovo Legion 7 16 AGP11 | |
| Acer Predator Helios Neo 16S AI PHN16S-71-94L9 | |
| MSI Crosshair 16 HX AI D2XWGKG | |
| Alienware 16X Aurora Core Ultra 9 290HX Plus | |
| Geekbench AI / Quantized GPU 1.7 | |
| Alienware 16X Aurora Core Ultra 9 290HX Plus | |
| MSI Crosshair A16 HX E8WGK | |
| Average AMD Ryzen 9 8940HX, NVIDIA GeForce RTX 5070 Laptop (n=1) | |
| MSI Crosshair 16 HX AI D2XWGKG | |
| Gigabyte Gaming A16 Pro GA6DH (Core 7 240H, RTX 5070 Ti) | |
| Geekbench AI / Half Precision GPU 1.7 | |
| MSI Crosshair A16 HX E8WGK | |
| Average AMD Ryzen 9 8940HX, NVIDIA GeForce RTX 5070 Laptop (n=1) | |
| Alienware 16X Aurora Core Ultra 9 290HX Plus | |
| MSI Crosshair 16 HX AI D2XWGKG | |
| Gigabyte Gaming A16 Pro GA6DH (Core 7 240H, RTX 5070 Ti) | |
| Geekbench AI / Single Precision GPU 1.7 | |
| Alienware 16X Aurora Core Ultra 9 290HX Plus | |
| MSI Crosshair A16 HX E8WGK | |
| Average AMD Ryzen 9 8940HX, NVIDIA GeForce RTX 5070 Laptop (n=1) | |
| MSI Crosshair 16 HX AI D2XWGKG | |
| Gigabyte Gaming A16 Pro GA6DH (Core 7 240H, RTX 5070 Ti) | |
* ... smaller is better
| PCMark 10 Score | 11334 points | |
Help | ||
* ... smaller is better
DPC Latency
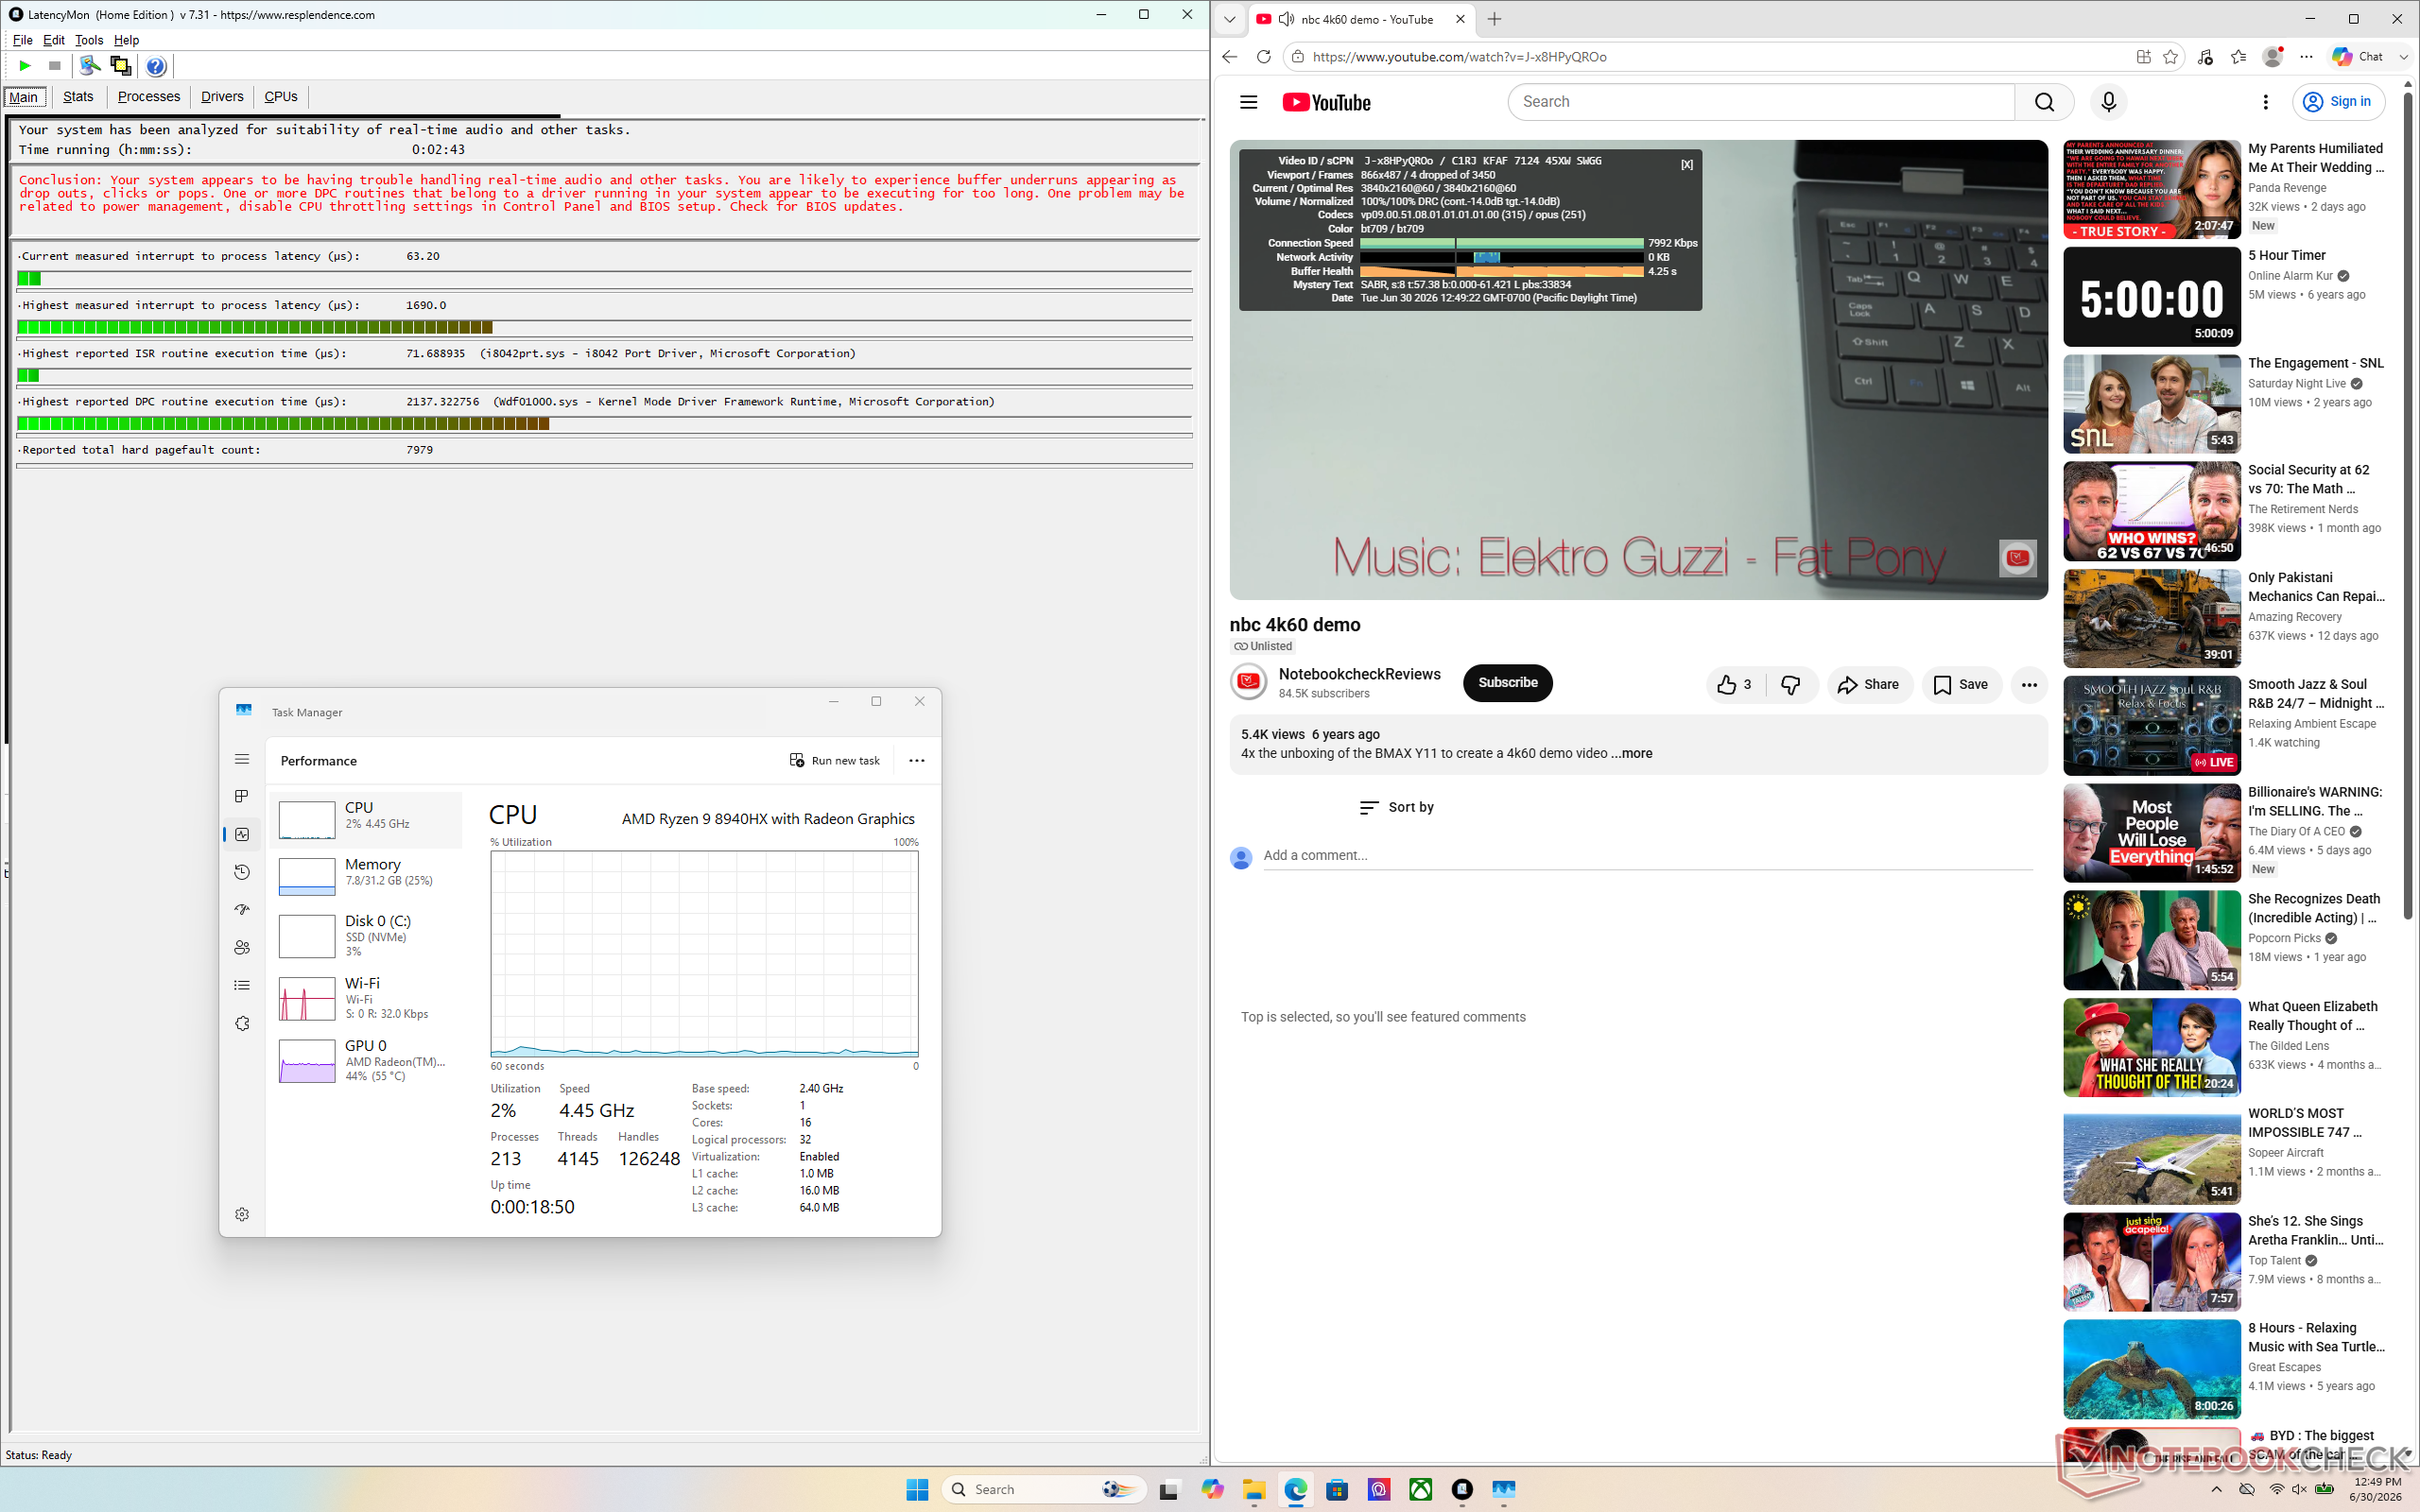
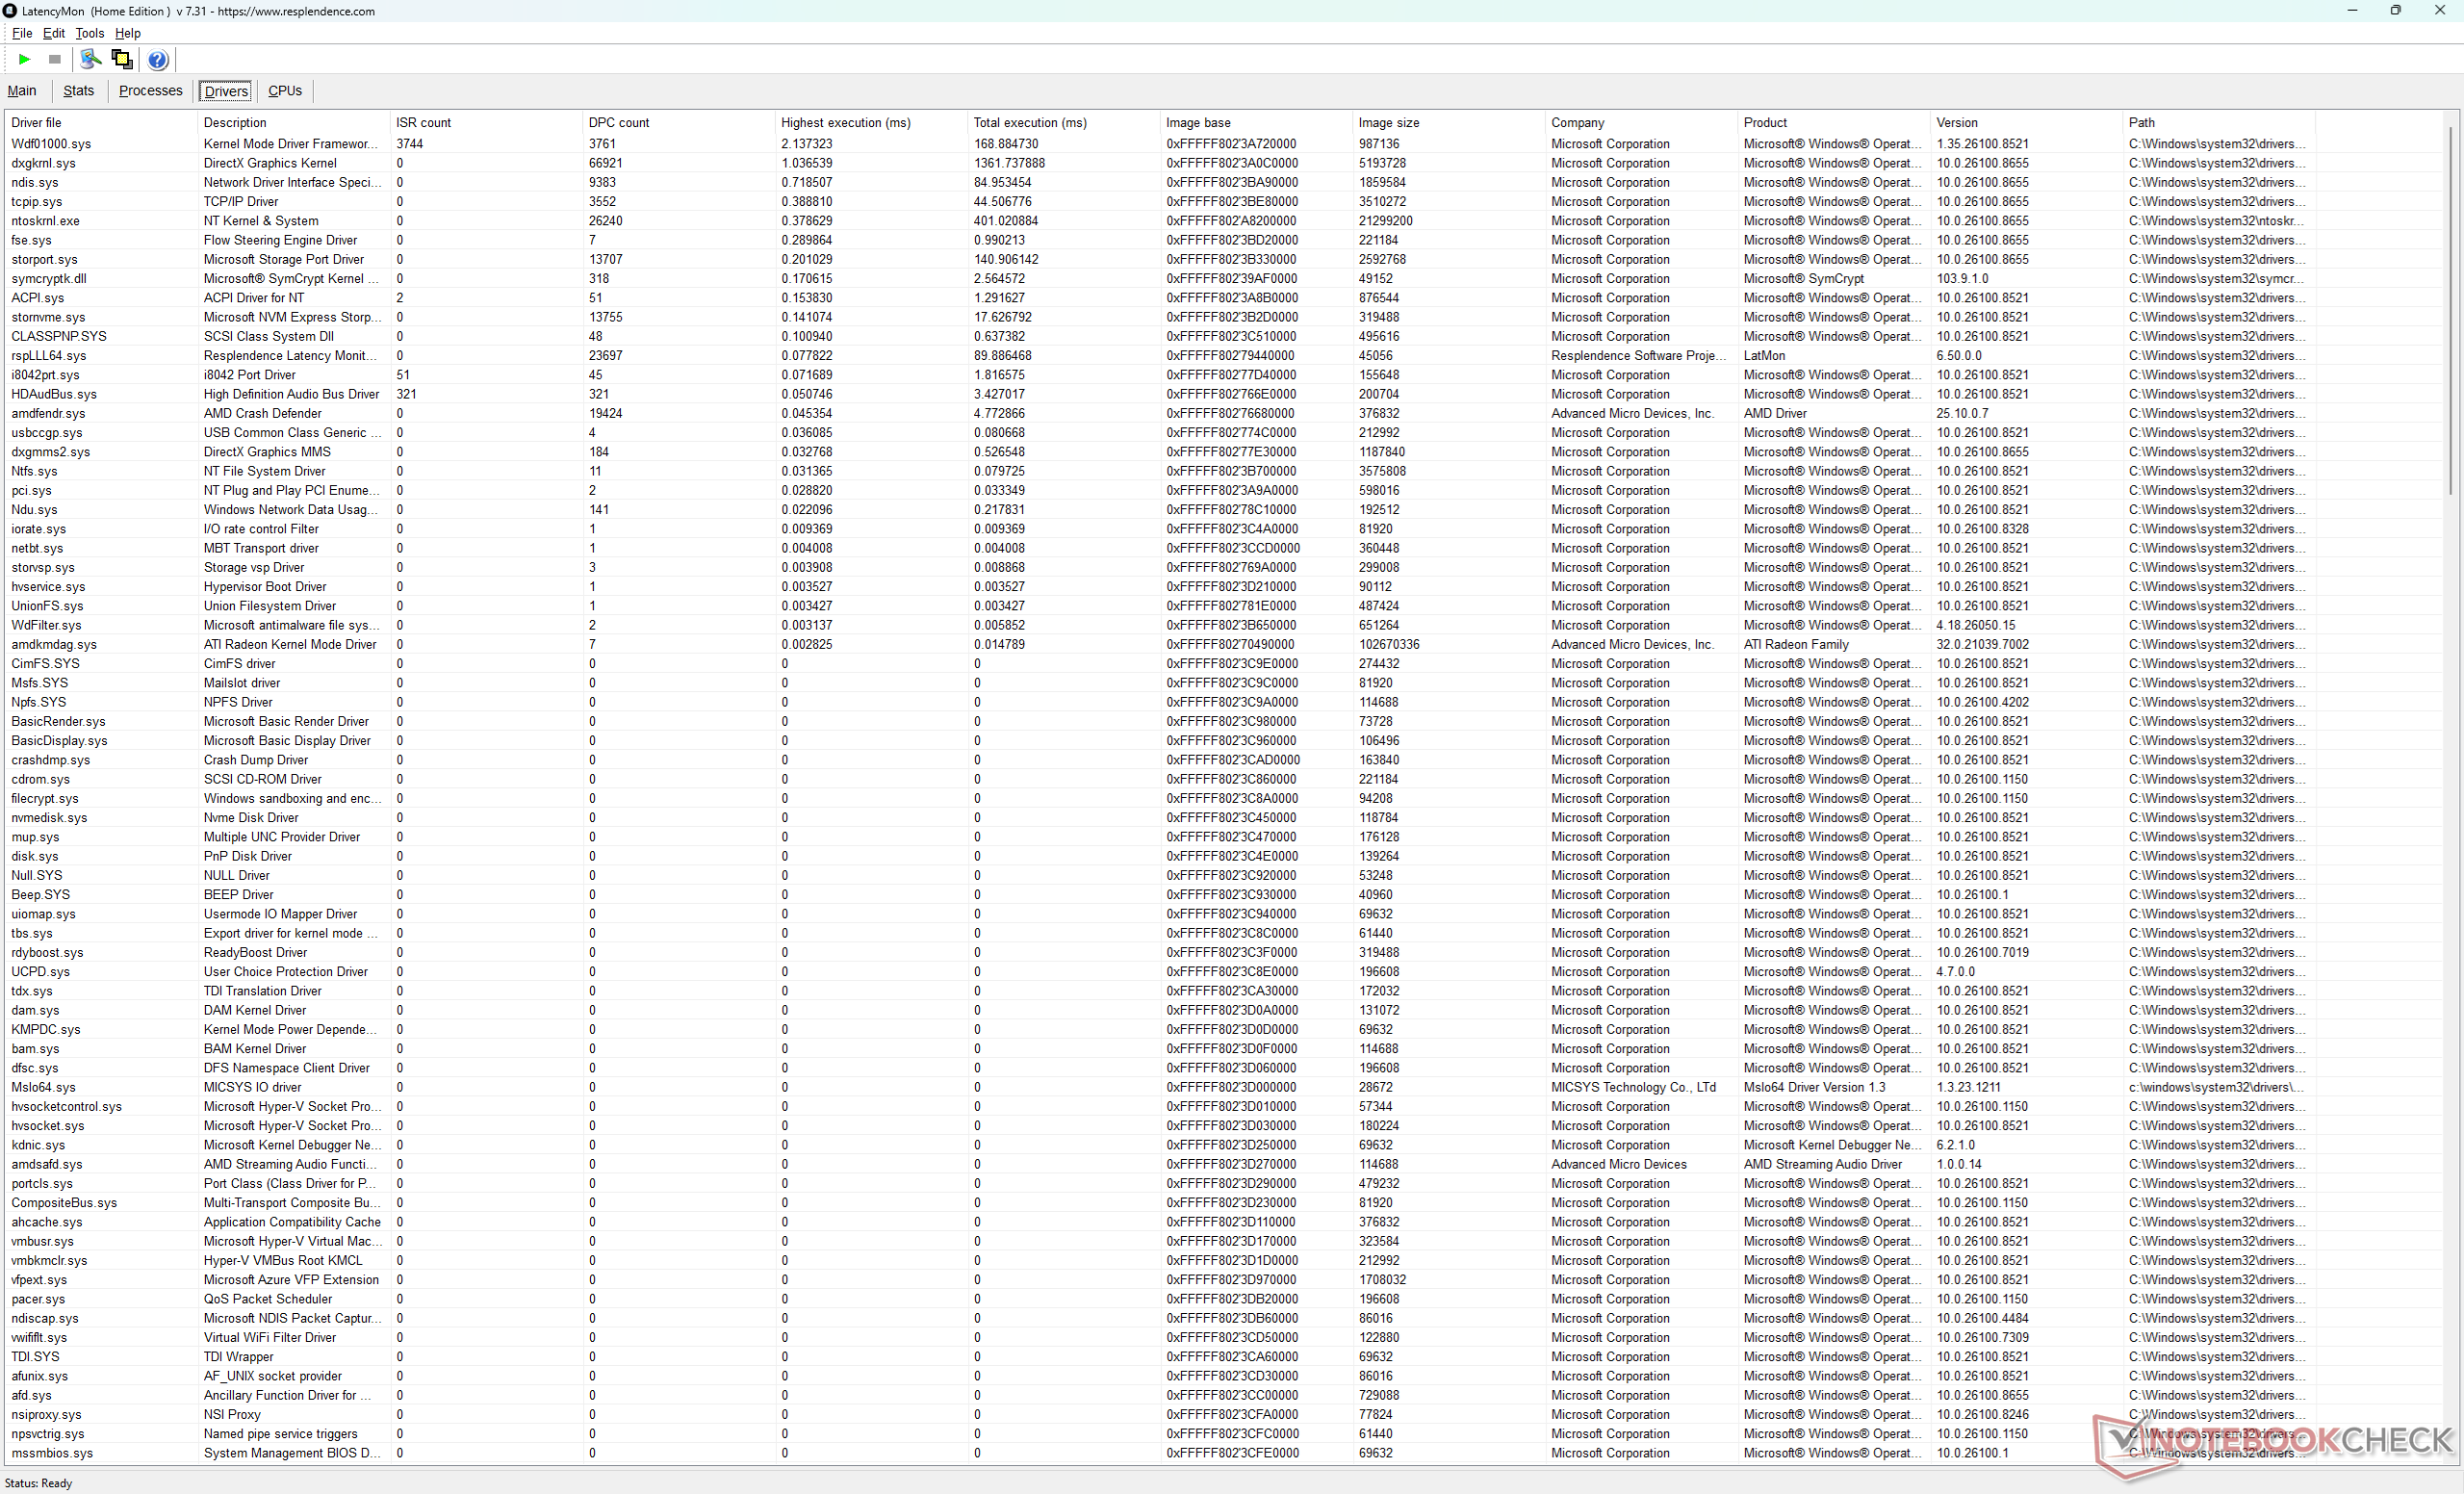
| DPC Latencies / LatencyMon - interrupt to process latency (max), Web, Youtube, Prime95 | |
| Lenovo Legion 7 16 AGP11 | |
| Gigabyte Gaming A16 Pro GA6DH (Core 7 240H, RTX 5070 Ti) | |
| Alienware 16X Aurora Core Ultra 9 290HX Plus | |
| Acer Predator Helios Neo 16S AI PHN16S-71-94L9 | |
| MSI Crosshair A16 HX E8WGK | |
| MSI Crosshair 16 HX AI D2XWGKG | |
* ... smaller is better
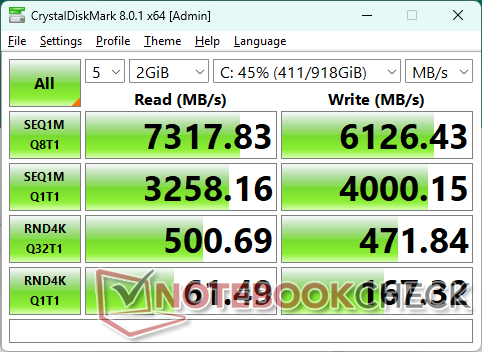
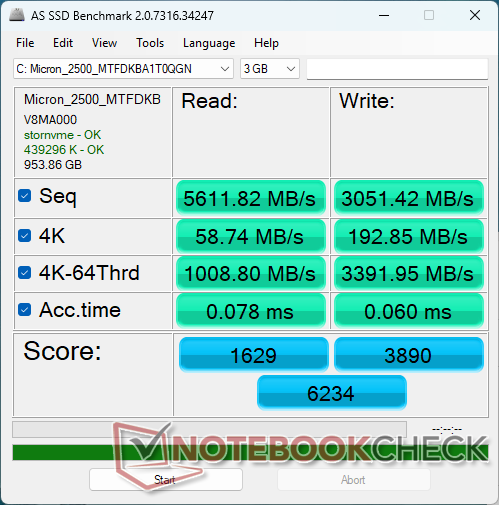
Storage Devices

* ... smaller is better
Disk Throttling: DiskSpd Read Loop, Queue Depth 8
GPU Performance
| Power Profile | Graphics Score | Physics Score | Combined Score |
| Performance Mode, Cooler Boost on, Apex on | 14087 | 13104 | 13930 |
| Performance Mode, Cooler Boost off, Apex on | 14118 (-0%) | 13154 (-0%) | 13964 (-0%) |
| Performance Mode, Cooler Boost off, Apex off | 13991 (-1%) | 13109 (-0%) | 13851 (-0%) |
| Balanced Mode | 13451 (-5%) | 12174 (-7%) | 13242 (-5%) |
| Battery Power | 4400 (-69%) | 6518 (-50%) | 4625 (-67%) |
| 3DMark 11 Performance | 37786 points | |
| 3DMark Cloud Gate Standard Score | 71413 points | |
| 3DMark Fire Strike Score | 35205 points | |
| 3DMark Time Spy Score | 13964 points | |
| 3DMark Steel Nomad Score | 3087 points | |
Help | ||
* ... smaller is better
| Final Fantasy XV Benchmark - 1920x1080 High Quality | |
| Alienware 16X Aurora Core Ultra 9 290HX Plus | |
| MSI Crosshair 16 HX AI D2XWGKG | |
| MSI Crosshair A16 HX E8WGK | |
| Lenovo Legion 7 16 AGP11 | |
| Gigabyte Gaming A16 Pro GA6DH (Core 7 240H, RTX 5070 Ti) | |
| Strange Brigade - 1920x1080 ultra AA:ultra AF:16 | |
| Alienware 16X Aurora Core Ultra 9 290HX Plus | |
| Gigabyte Gaming A16 Pro GA6DH (Core 7 240H, RTX 5070 Ti) | |
| MSI Crosshair 16 HX AI D2XWGKG | |
| MSI Crosshair A16 HX E8WGK | |
| Lenovo Legion 7 16 AGP11 | |
Cyberpunk 2077 ultra FPS Chart
| low | med. | high | ultra | QHD DLSS | QHD | |
|---|---|---|---|---|---|---|
| GTA V (2015) | 187.6 | 186.6 | 184.6 | 152.6 | 129.7 | |
| Dota 2 Reborn (2015) | 240 | 208 | 199.1 | 183.3 | ||
| Final Fantasy XV Benchmark (2018) | 229 | 187.8 | 140 | 102 | ||
| X-Plane 11.11 (2018) | 141.9 | 131.5 | 104.8 | |||
| Strange Brigade (2018) | 502 | 369 | 305 | 258 | 170.4 | |
| Baldur's Gate 3 (2023) | 239 | 183.9 | 154.6 | 133.2 | 129.6 | 90.3 |
| Cyberpunk 2077 (2023) | 173.8 | 149 | 124.8 | 112.1 | 81.9 | 68.8 |
| F1 24 (2024) | 345 | 336 | 269 | 94.7 | 93.1 | 59.3 |
Emissions
System Noise
Noise level
| Idle |
| 29.1 / 29.1 / 29.1 dB(A) |
| Load |
| 41.7 / 59 dB(A) |
 | ||
30 dB silent 40 dB(A) audible 50 dB(A) loud |
||
min: | ||
| MSI Crosshair A16 HX E8WGK R9 8940HX, GeForce RTX 5070 Laptop | MSI Crosshair 16 HX AI D2XWGKG Ultra 9 275HX, GeForce RTX 5070 Laptop | Alienware 16X Aurora Core Ultra 9 290HX Plus Ultra 9 290HX Plus, GeForce RTX 5070 Ti Laptop | Lenovo Legion 7 16 AGP11 Ryzen AI 9 HX 470, GeForce RTX 5060 Laptop | Gigabyte Gaming A16 Pro GA6DH (Core 7 240H, RTX 5070 Ti) Core 7 240H, GeForce RTX 5070 Ti Laptop | Acer Predator Helios Neo 16S AI PHN16S-71-94L9 Ultra 9 275HX, GeForce RTX 5070 Ti Laptop | |
|---|---|---|---|---|---|---|
| Noise | -2% | 3% | 10% | 11% | -2% | |
| off / environment * (dB) | 23.4 | 25.56 -9% | 23.4 -0% | 24.5 -5% | 23 2% | 24 -3% |
| Idle Minimum * (dB) | 29.1 | 28.3 3% | 23.8 18% | 24.5 16% | 23 21% | 24 18% |
| Idle Average * (dB) | 29.1 | 28.3 3% | 23.8 18% | 24.5 16% | 24.35 16% | 30 -3% |
| Idle Maximum * (dB) | 29.1 | 28.3 3% | 31.4 -8% | 27.1 7% | 24.35 16% | 35 -20% |
| Load Average * (dB) | 41.7 | 50.26 -21% | 48.7 -17% | 34.6 17% | 34.77 17% | 53 -27% |
| Cyberpunk 2077 ultra * (dB) | 58.7 | 57.8 2% | 51.5 12% | 53 10% | 56.18 4% | 52 11% |
| Load Maximum * (dB) | 59 | 57.95 2% | 59.8 -1% | 53 10% | 56.43 4% | 54 8% |
* ... smaller is better
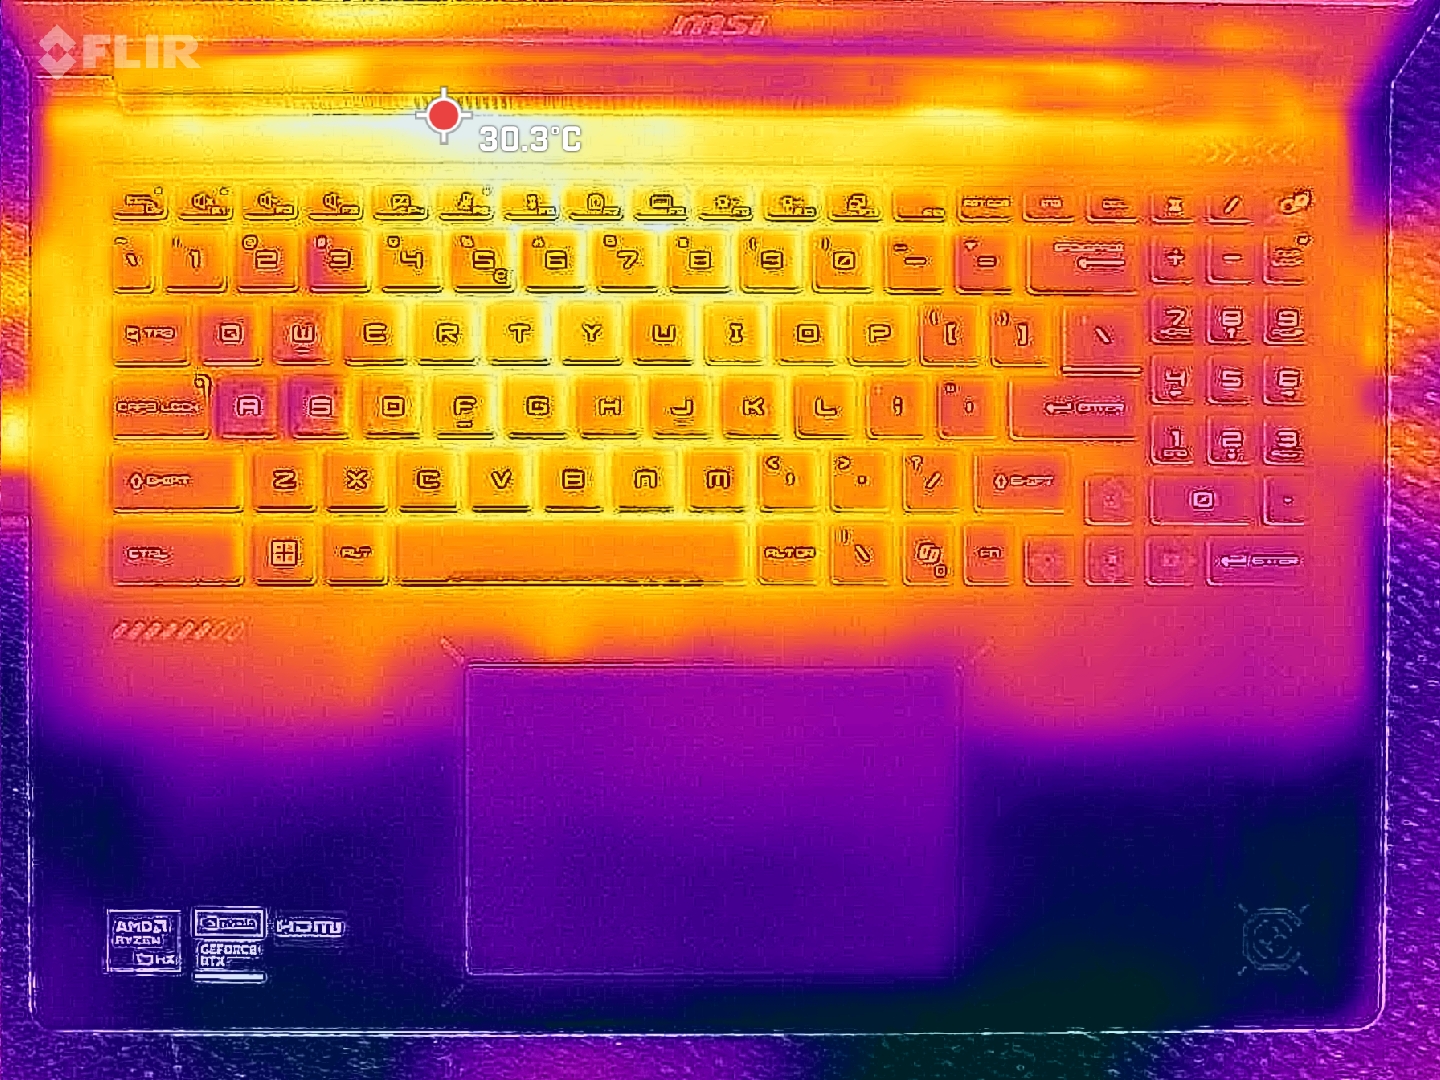
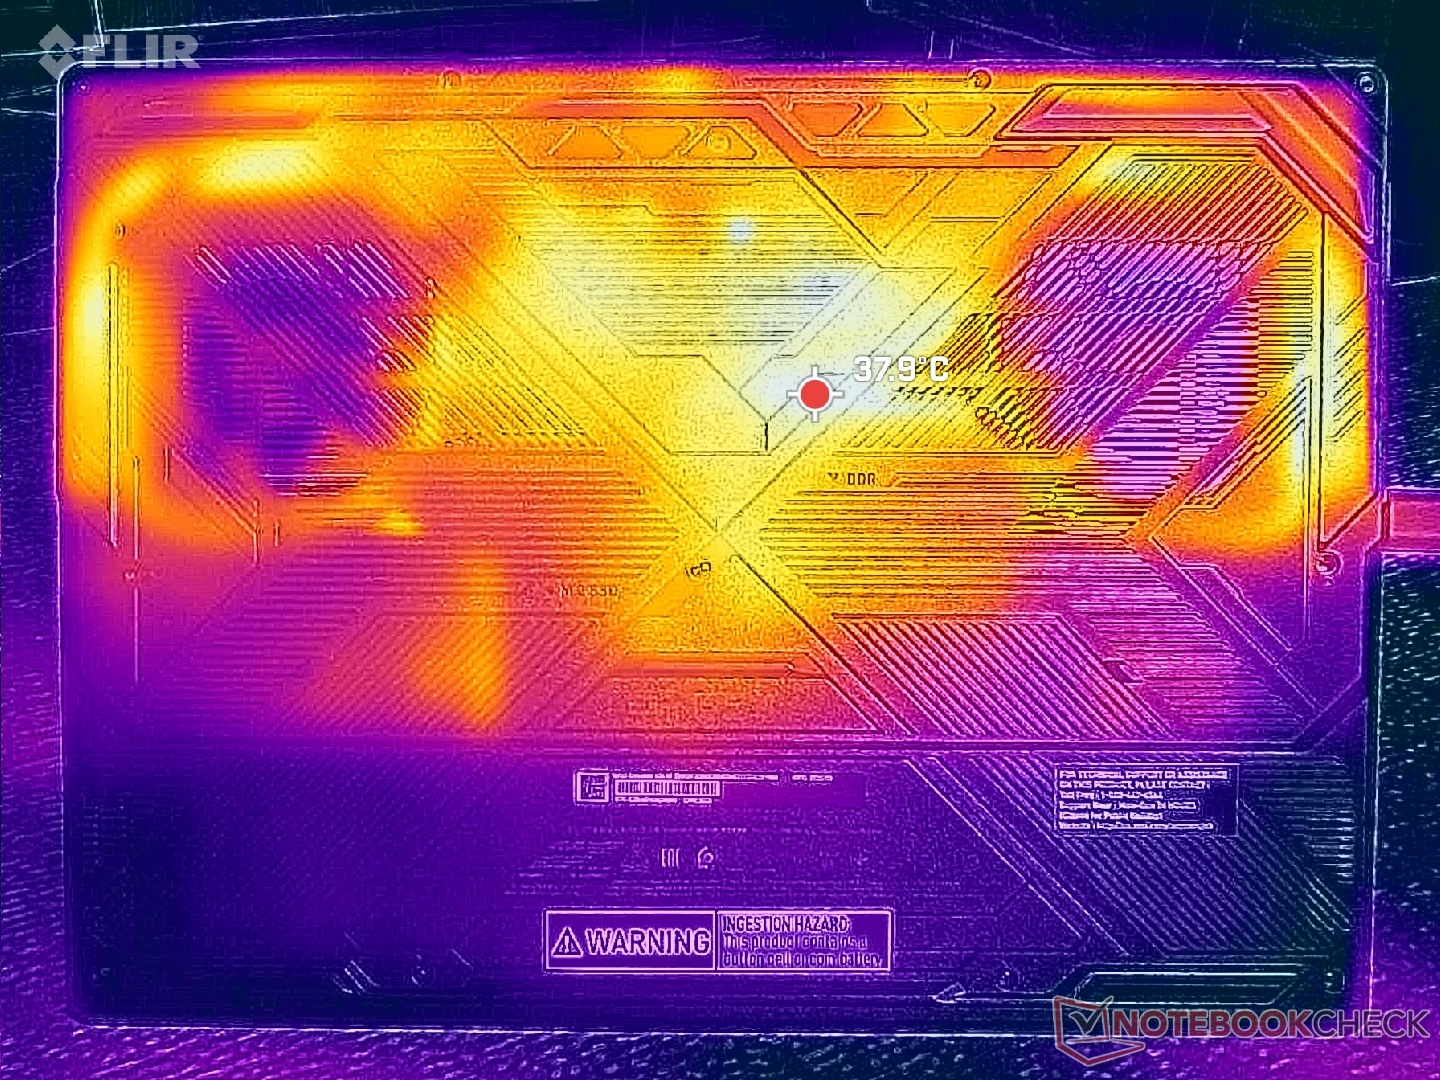
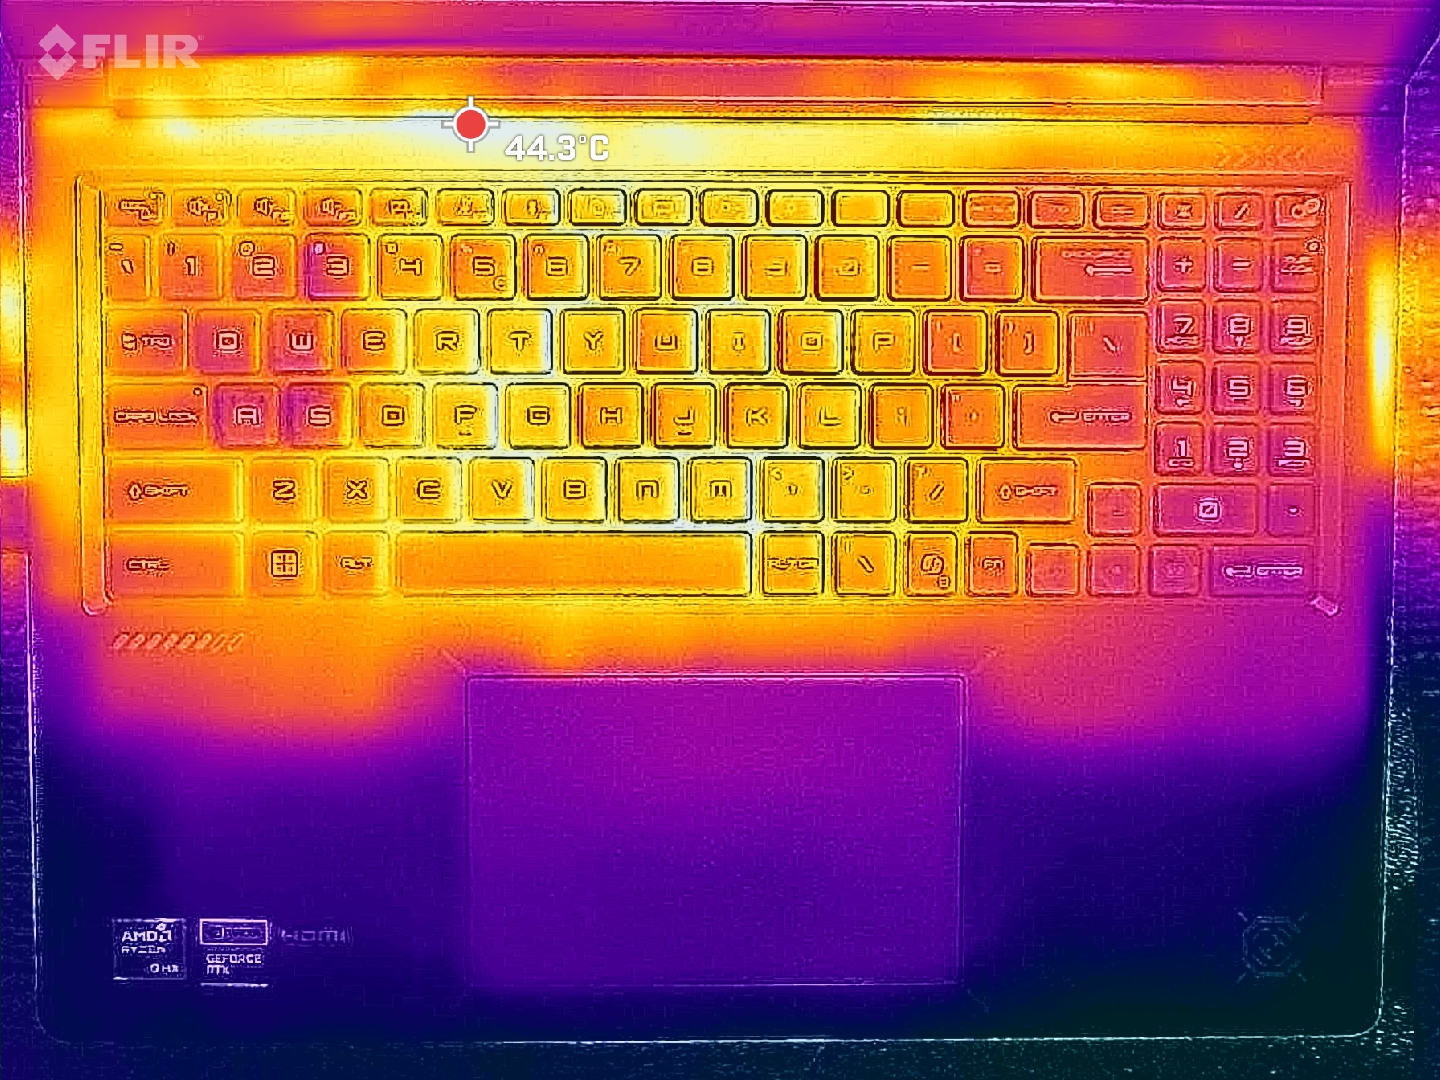
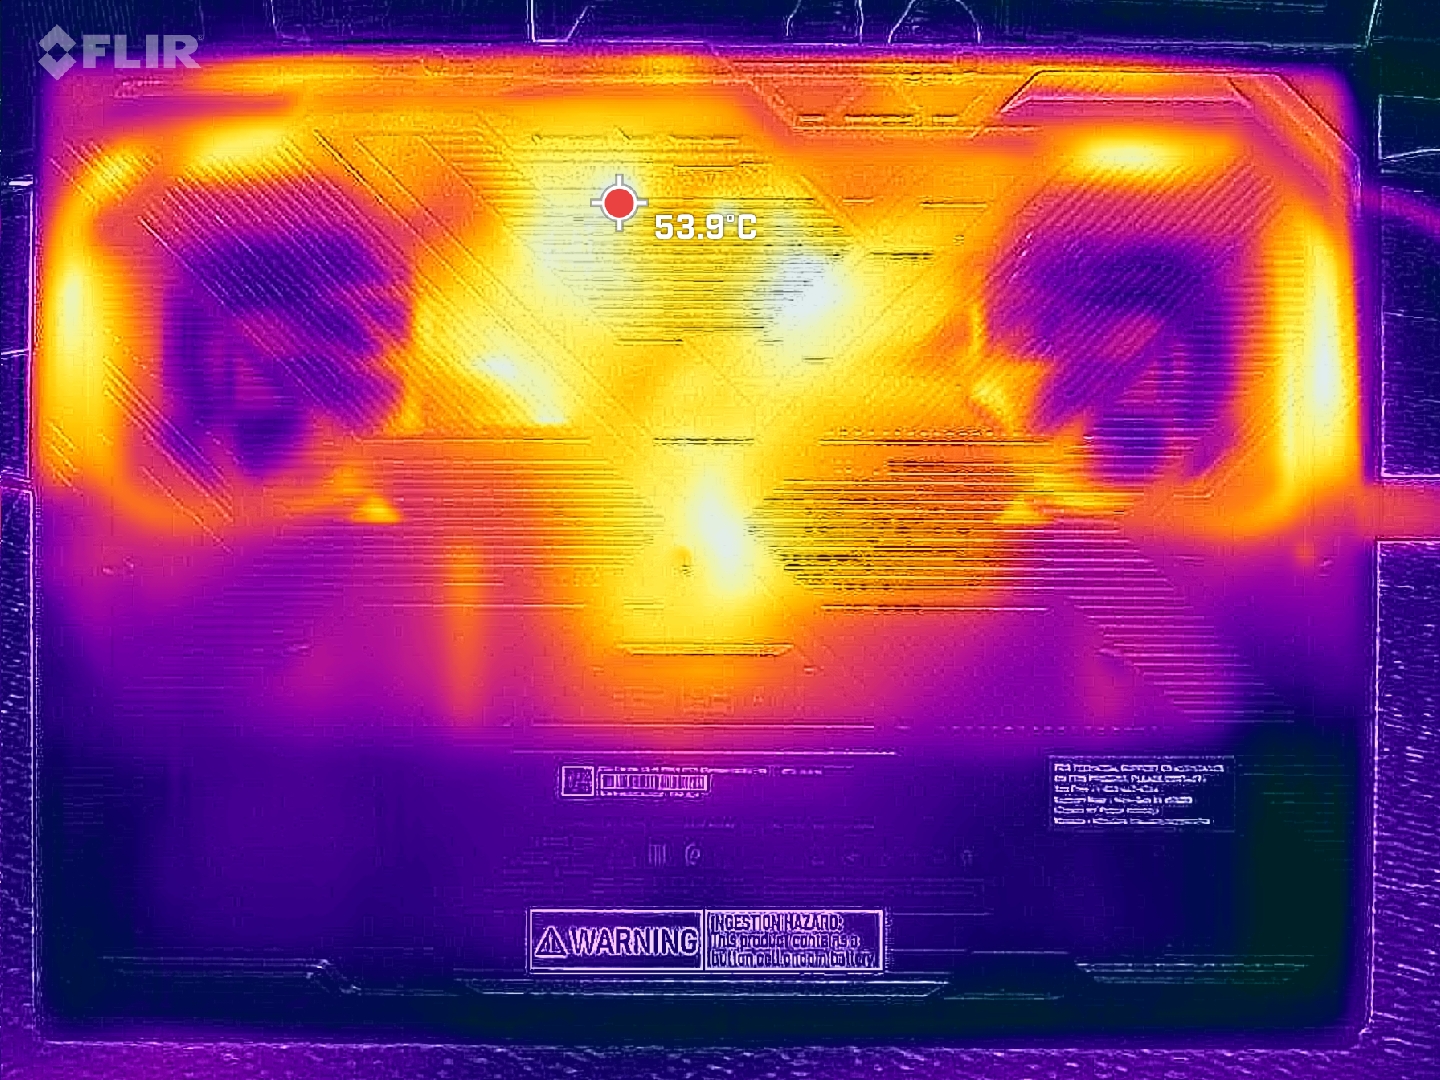
Temperature
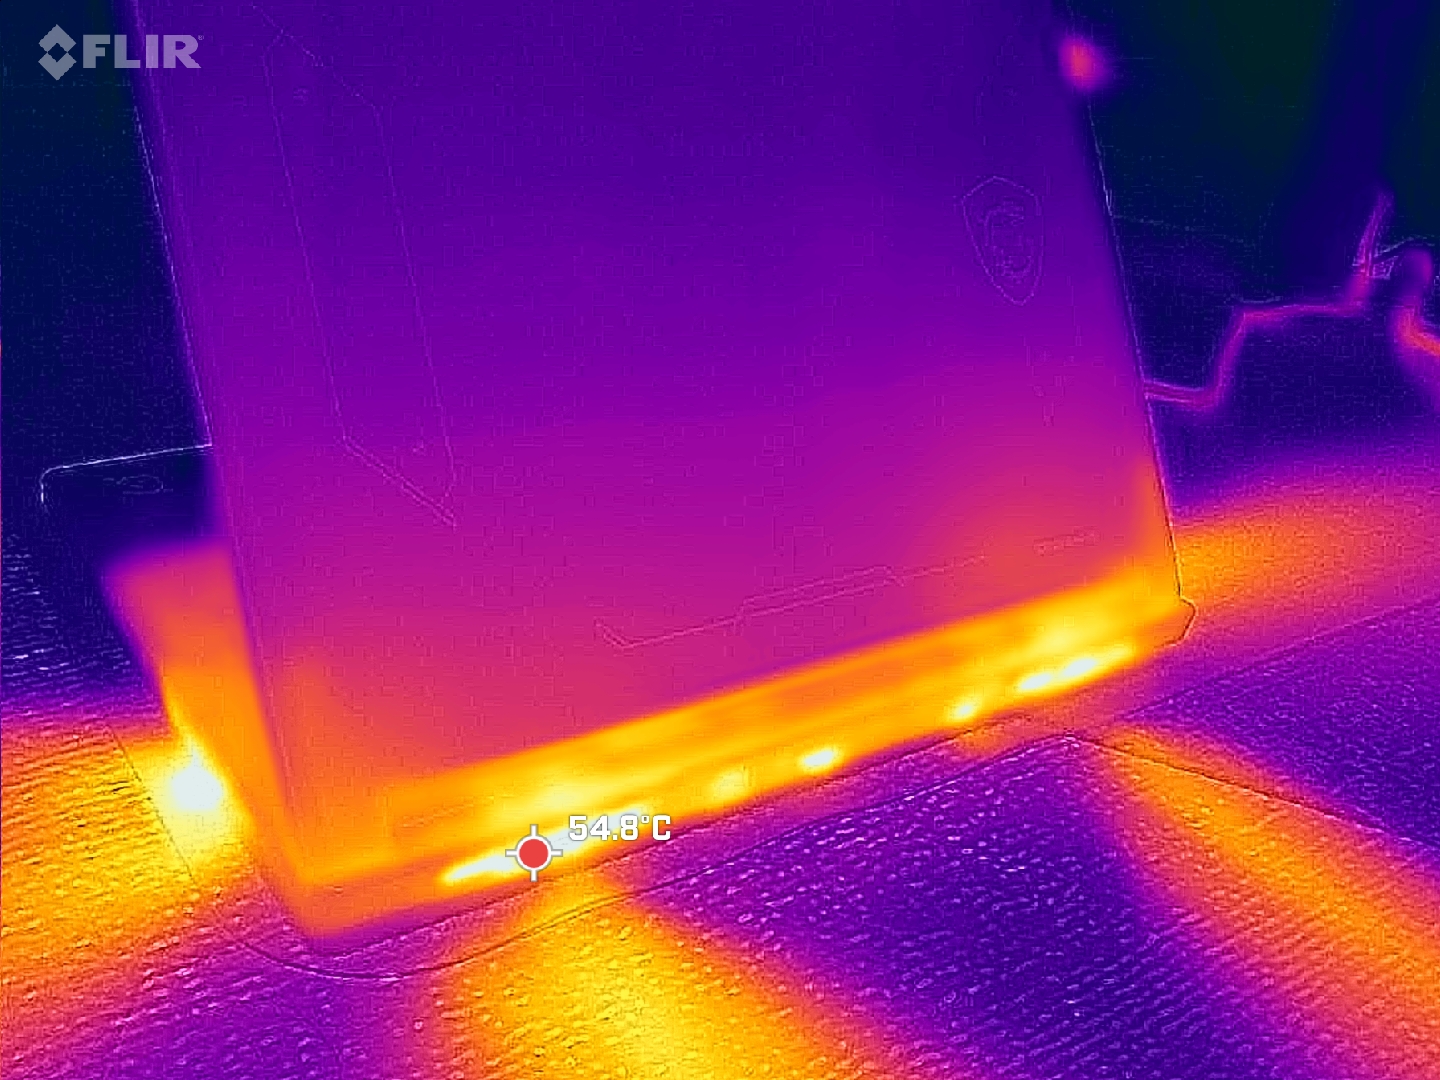
(±) The maximum temperature on the upper side is 41.8 °C / 107 F, compared to the average of 40.4 °C / 105 F, ranging from 21.2 to 68.8 °C for the class Gaming.
(-) The bottom heats up to a maximum of 50.6 °C / 123 F, compared to the average of 43.2 °C / 110 F
(+) In idle usage, the average temperature for the upper side is 26.2 °C / 79 F, compared to the device average of 33.9 °C / 93 F.
(+) The palmrests and touchpad are cooler than skin temperature with a maximum of 31.6 °C / 88.9 F and are therefore cool to the touch.
(-) The average temperature of the palmrest area of similar devices was 28.8 °C / 83.8 F (-2.8 °C / -5.1 F).
| MSI Crosshair A16 HX E8WGK R9 8940HX, GeForce RTX 5070 Laptop | MSI Crosshair 16 HX AI D2XWGKG Ultra 9 275HX, GeForce RTX 5070 Laptop | Alienware 16X Aurora Core Ultra 9 290HX Plus Ultra 9 290HX Plus, GeForce RTX 5070 Ti Laptop | Lenovo Legion 7 16 AGP11 Ryzen AI 9 HX 470, GeForce RTX 5060 Laptop | Gigabyte Gaming A16 Pro GA6DH (Core 7 240H, RTX 5070 Ti) Core 7 240H, GeForce RTX 5070 Ti Laptop | Acer Predator Helios Neo 16S AI PHN16S-71-94L9 Ultra 9 275HX, GeForce RTX 5070 Ti Laptop | |
|---|---|---|---|---|---|---|
| Heat | 7% | 10% | 7% | -2% | 2% | |
| Maximum Upper Side * (°C) | 41.8 | 44.8 -7% | 48.2 -15% | 44.9 -7% | 42 -0% | 47 -12% |
| Maximum Bottom * (°C) | 50.6 | 43.4 14% | 41 19% | 50.5 -0% | 49 3% | 55 -9% |
| Idle Upper Side * (°C) | 30.8 | 31.2 -1% | 28.2 8% | 27.3 11% | 34 -10% | 28 9% |
| Idle Bottom * (°C) | 36 | 28.8 20% | 26.2 27% | 27.5 24% | 36 -0% | 29 19% |
* ... smaller is better
Stress Test
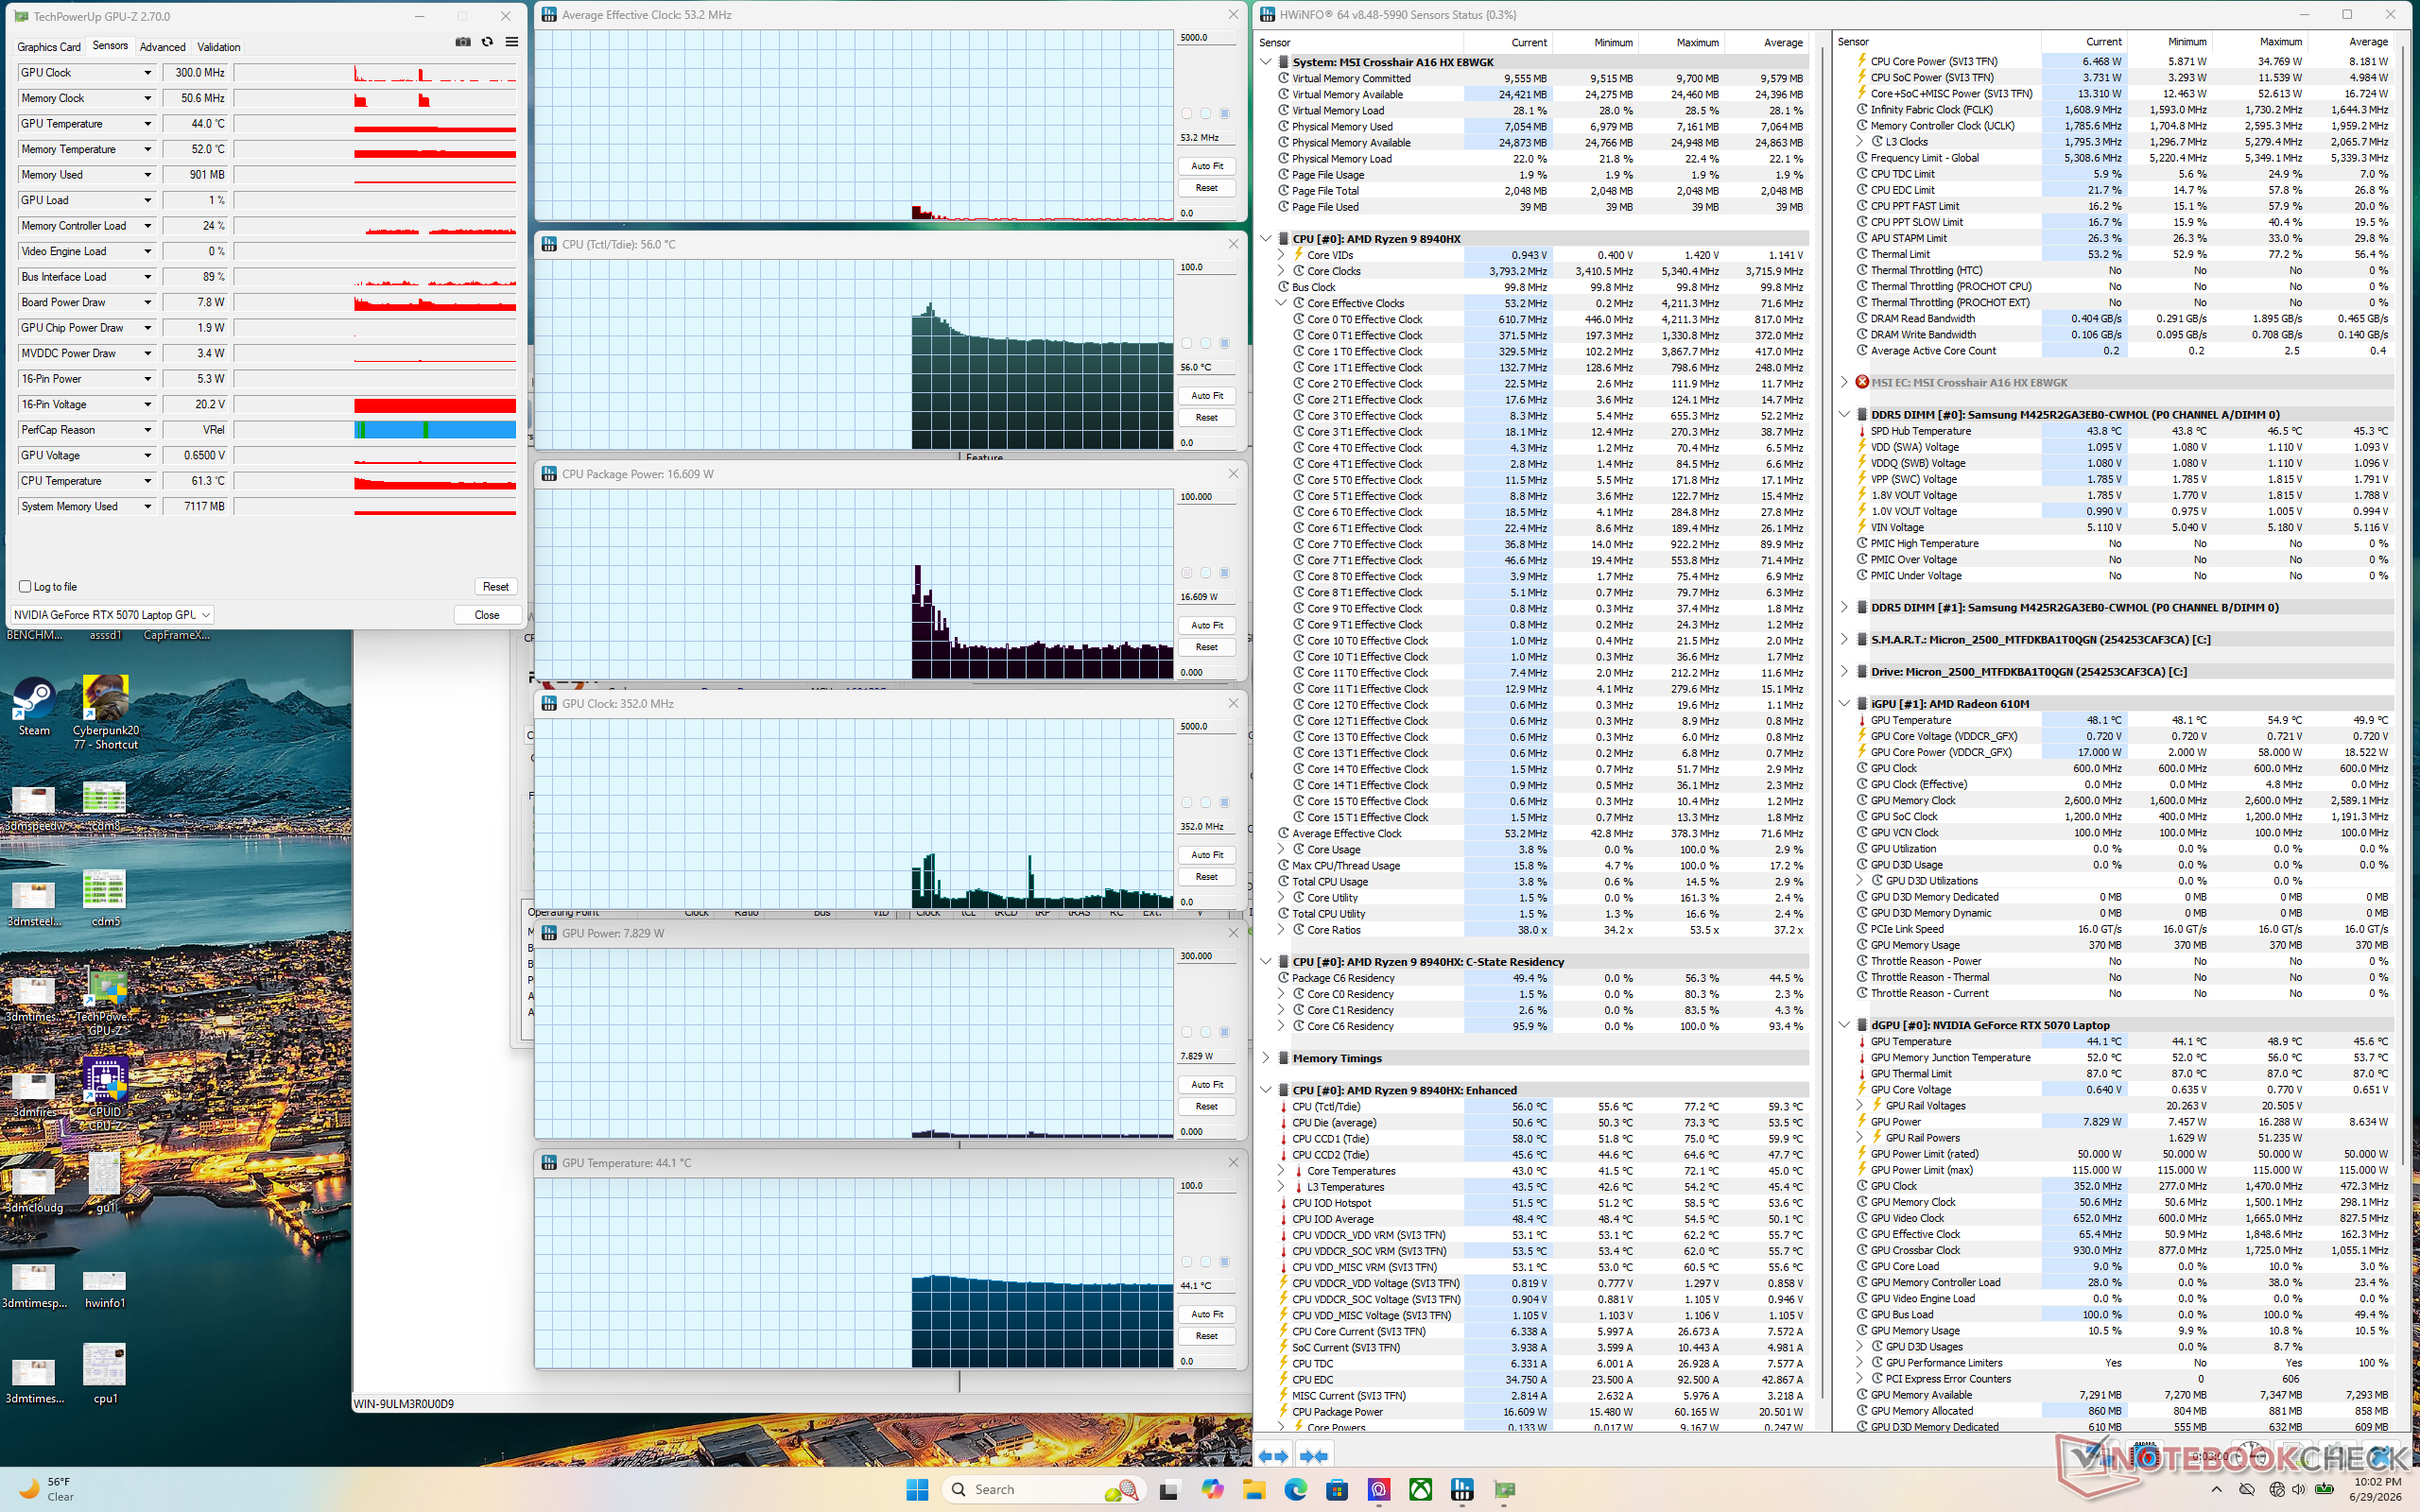
CPU and GPU temperatures when gaming on Performance mode would average in the mid 80s and low 80s, respectively. Core temperatures would be a few degrees C cooler when running on Balanced mode instead, but average TGP would fall from 113 W to 99 W for slower graphics performance.
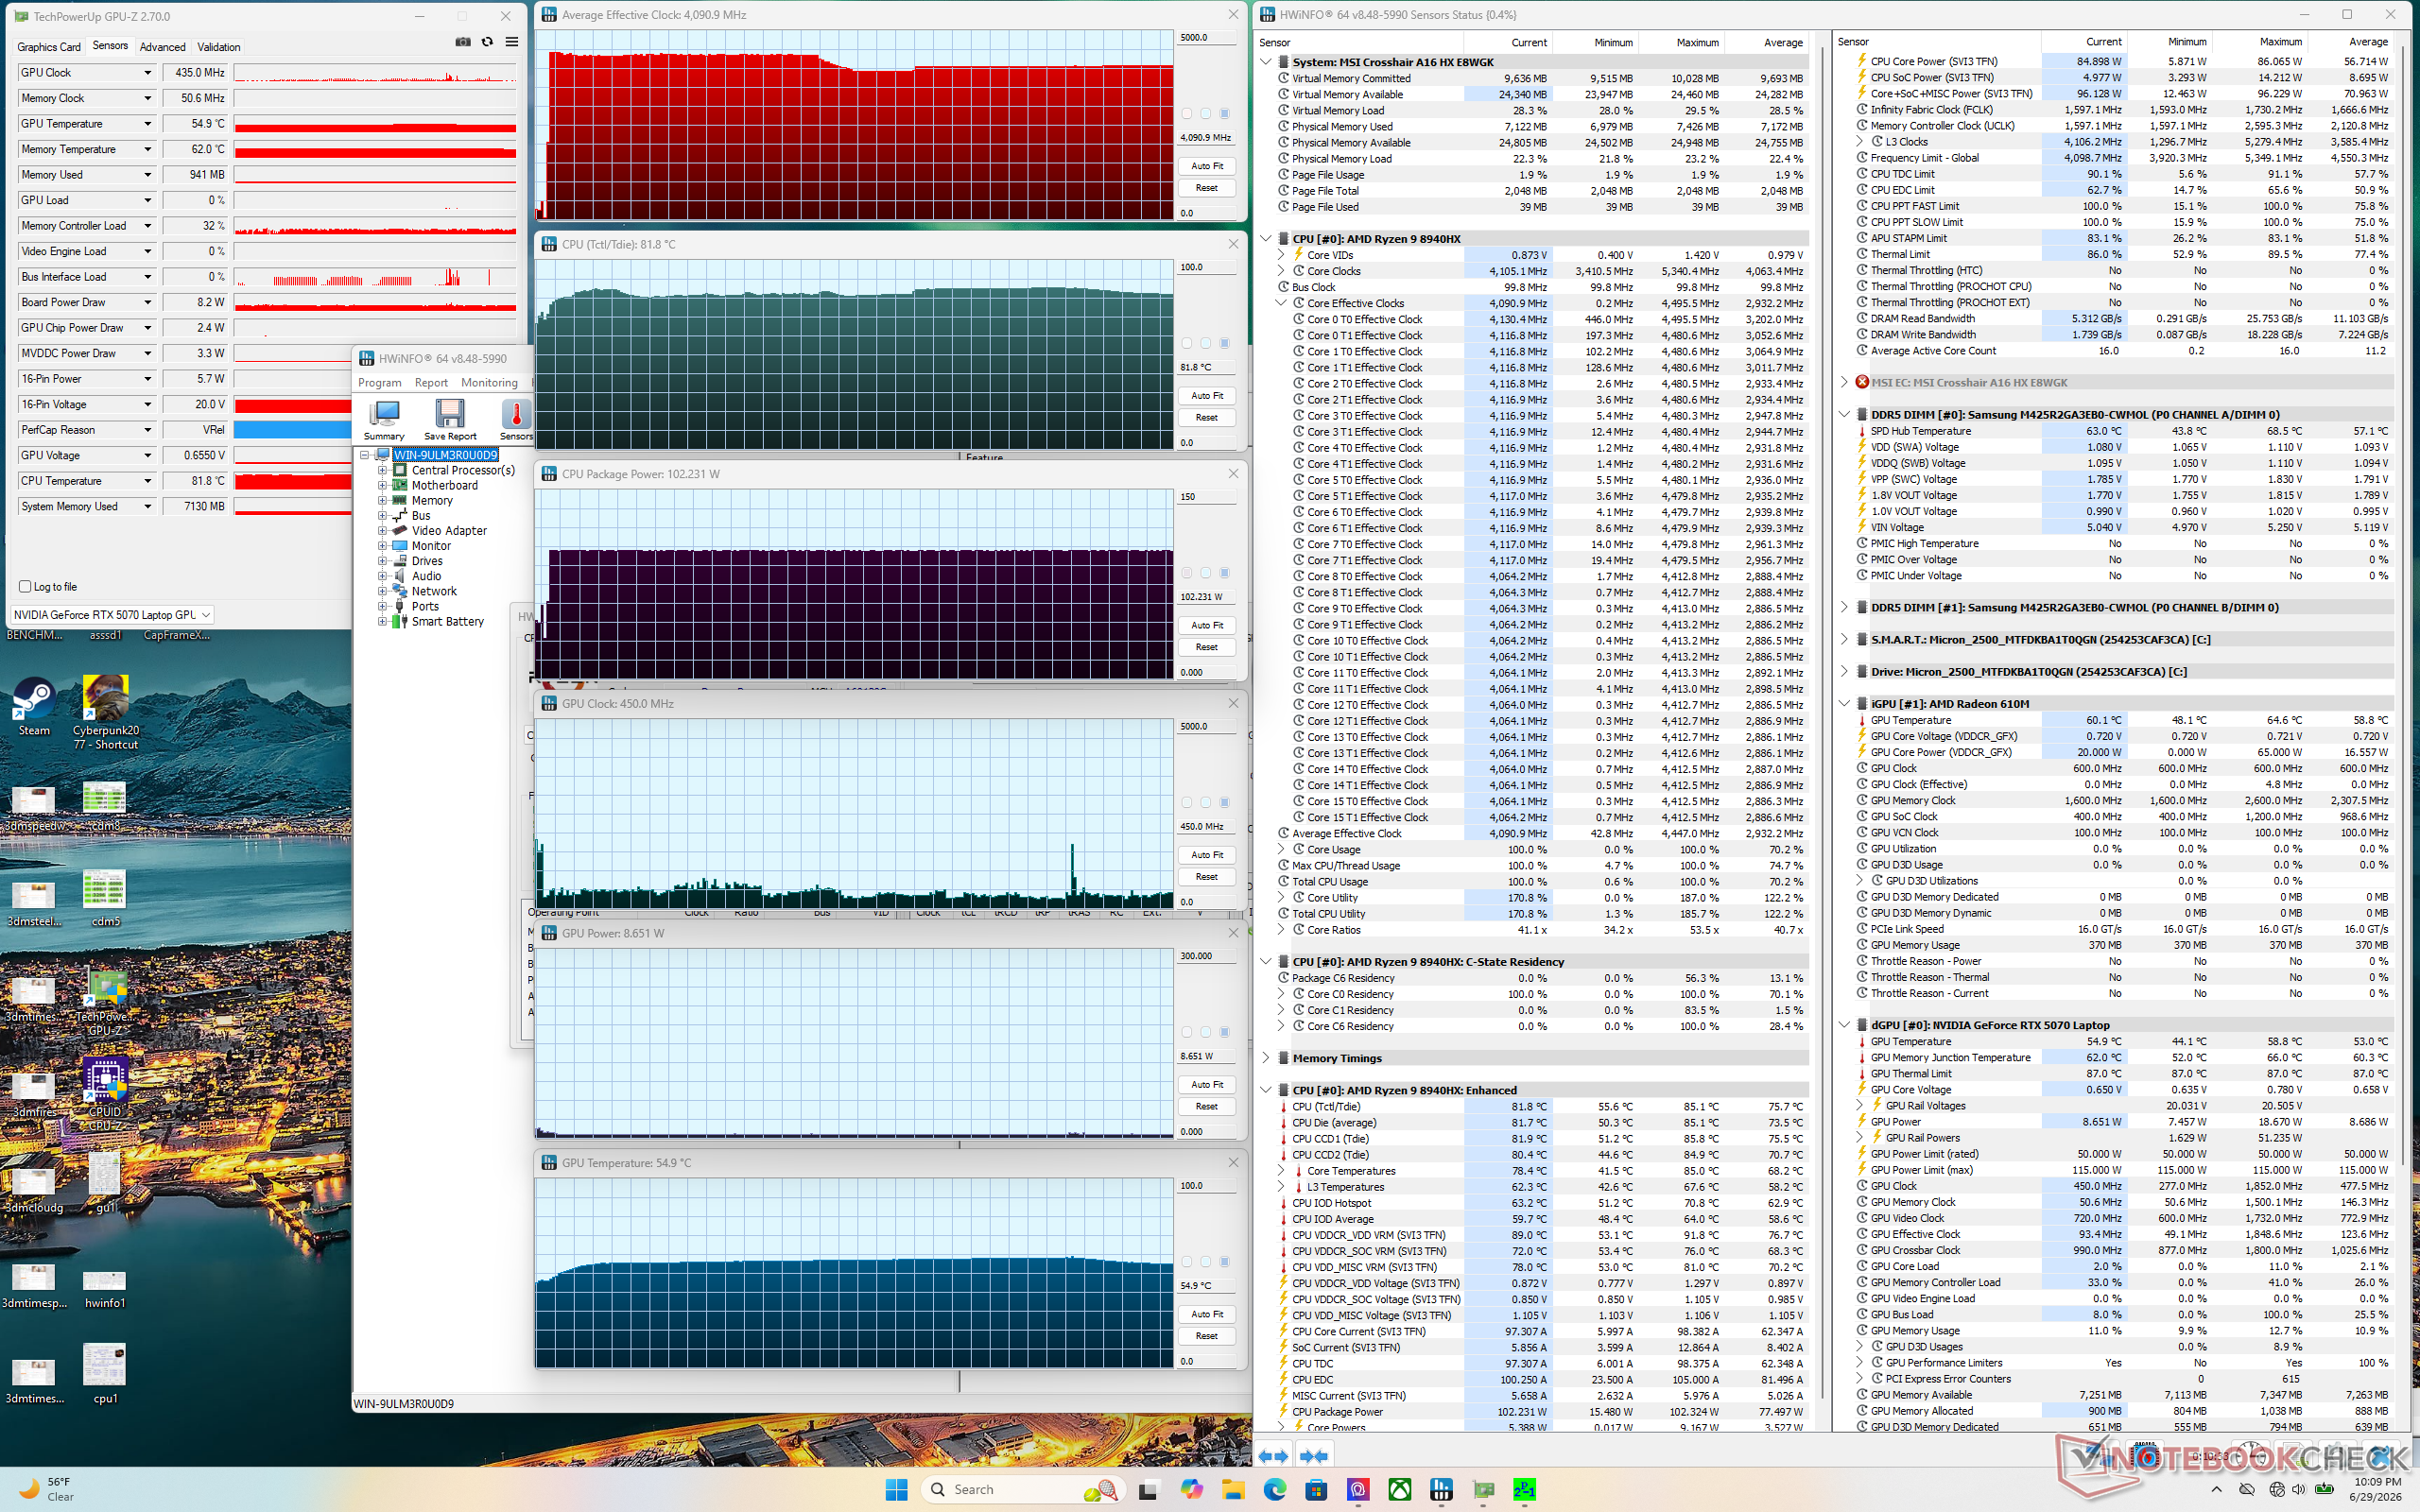
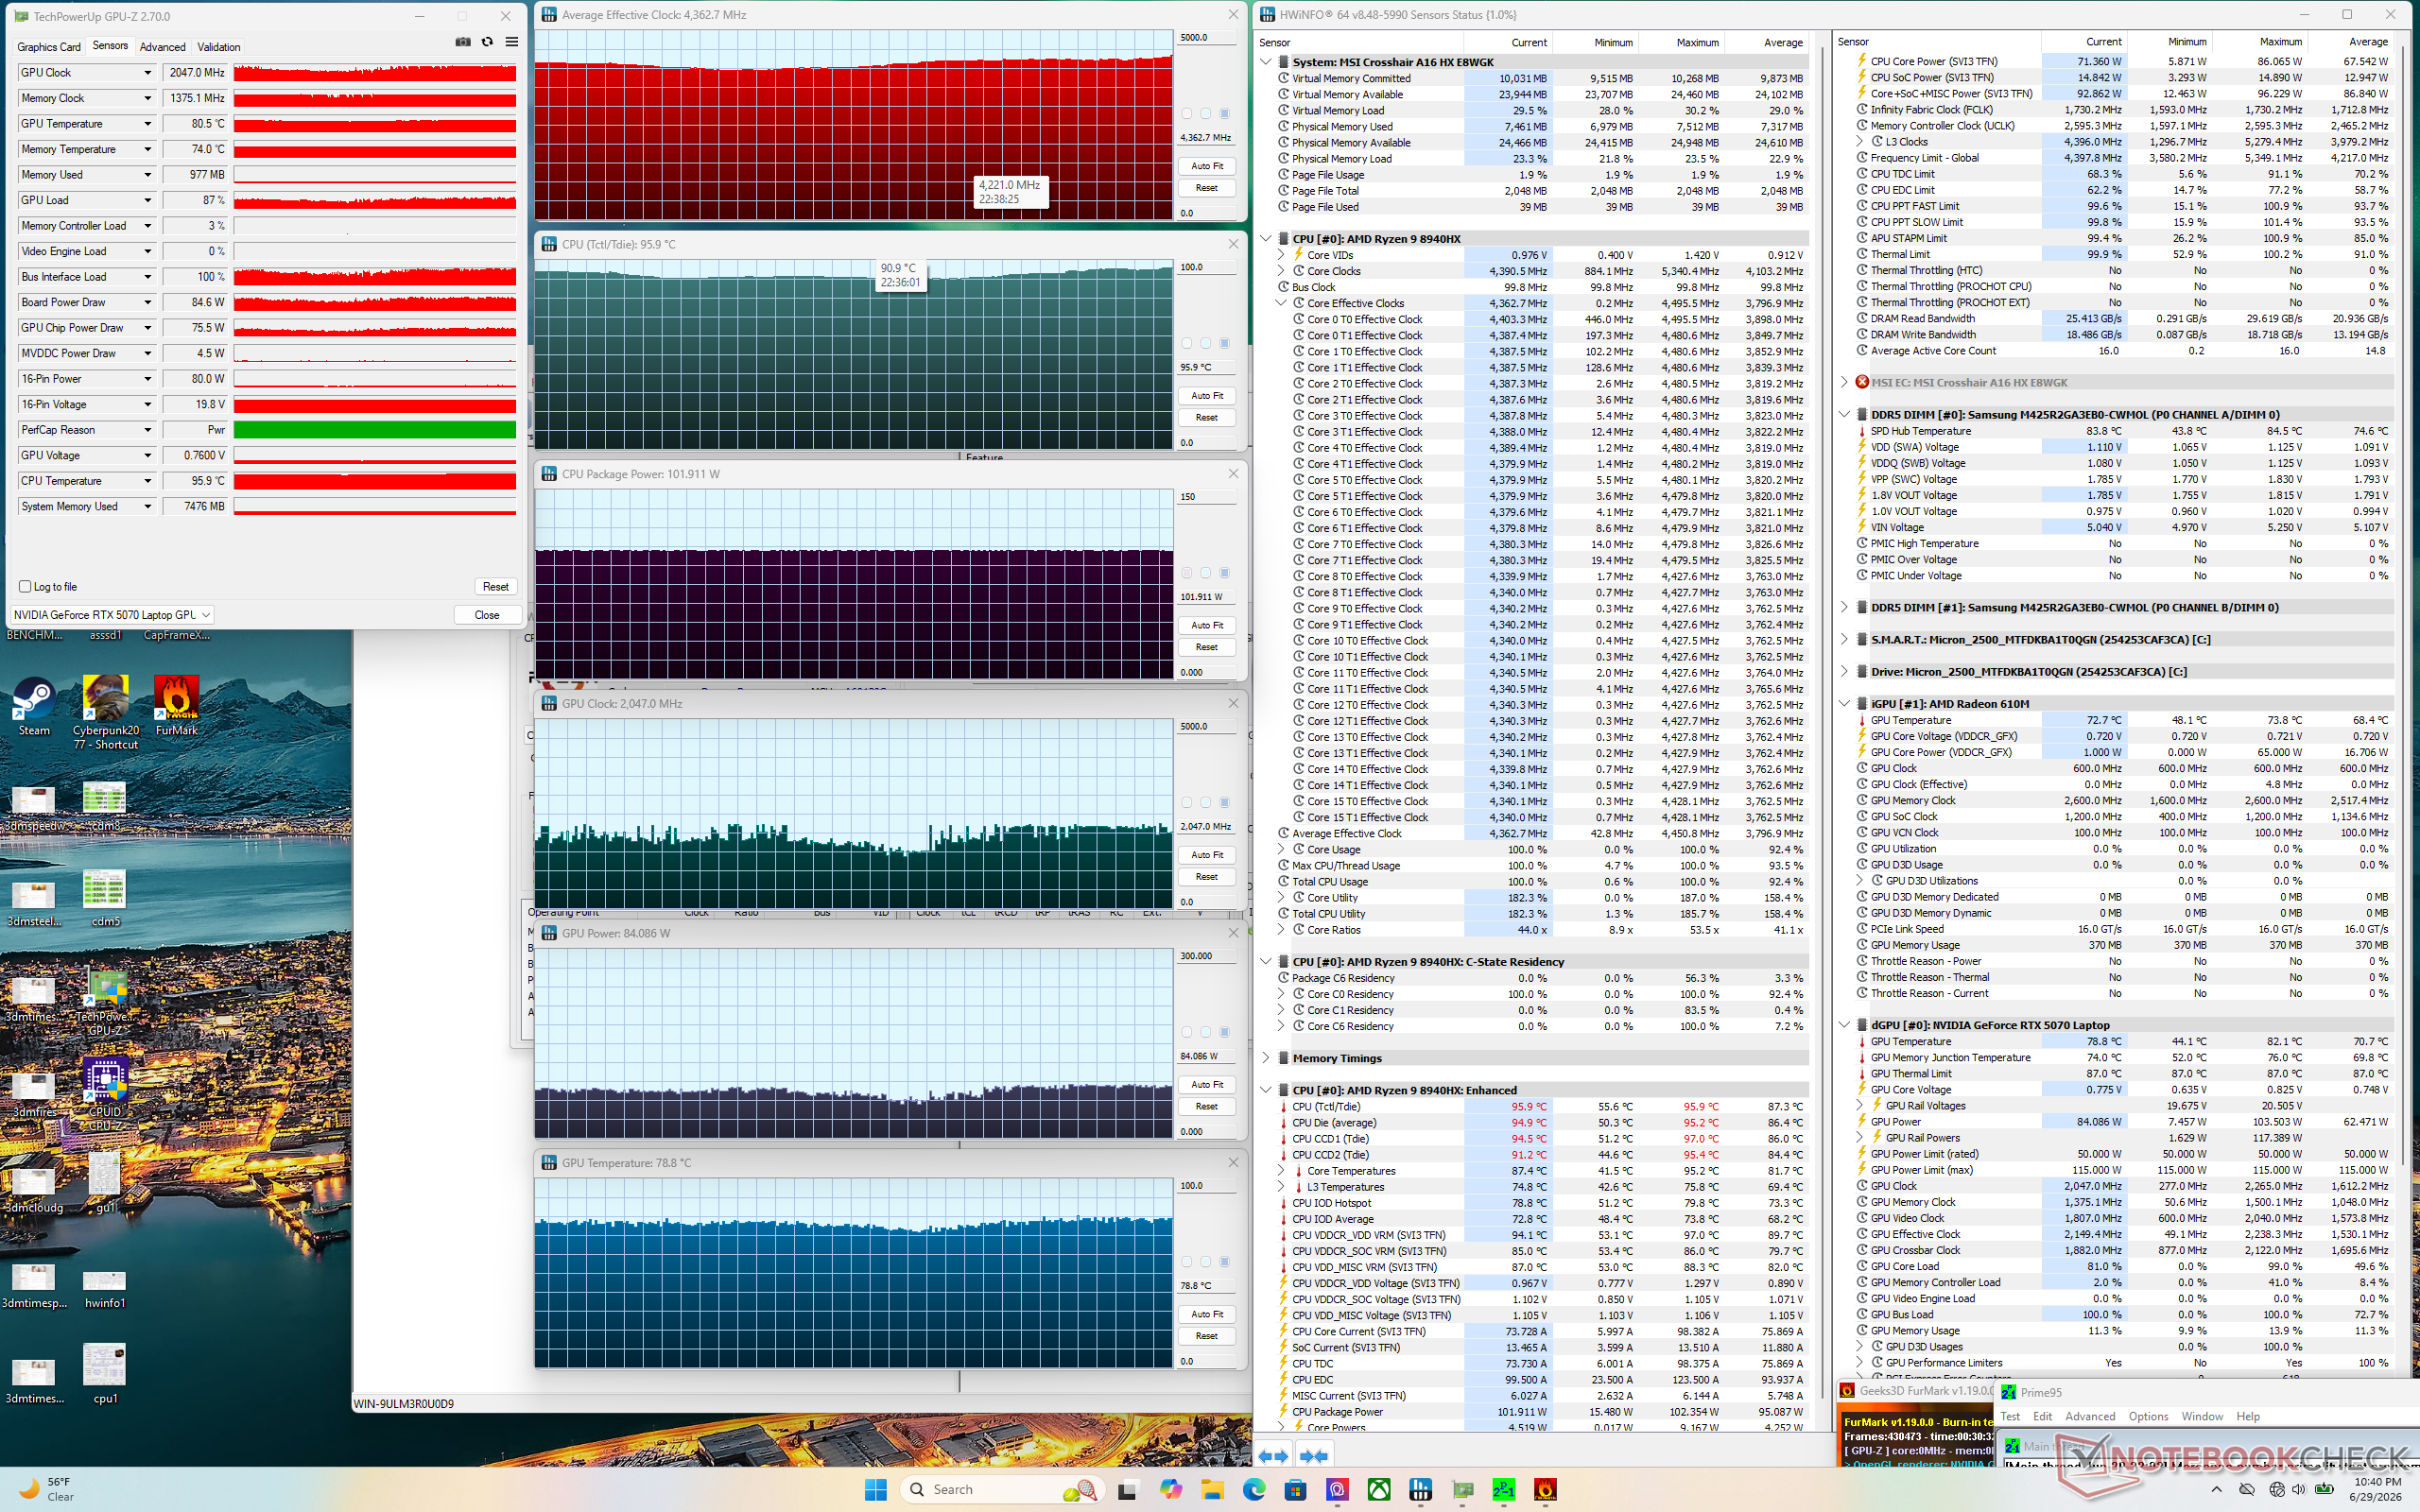
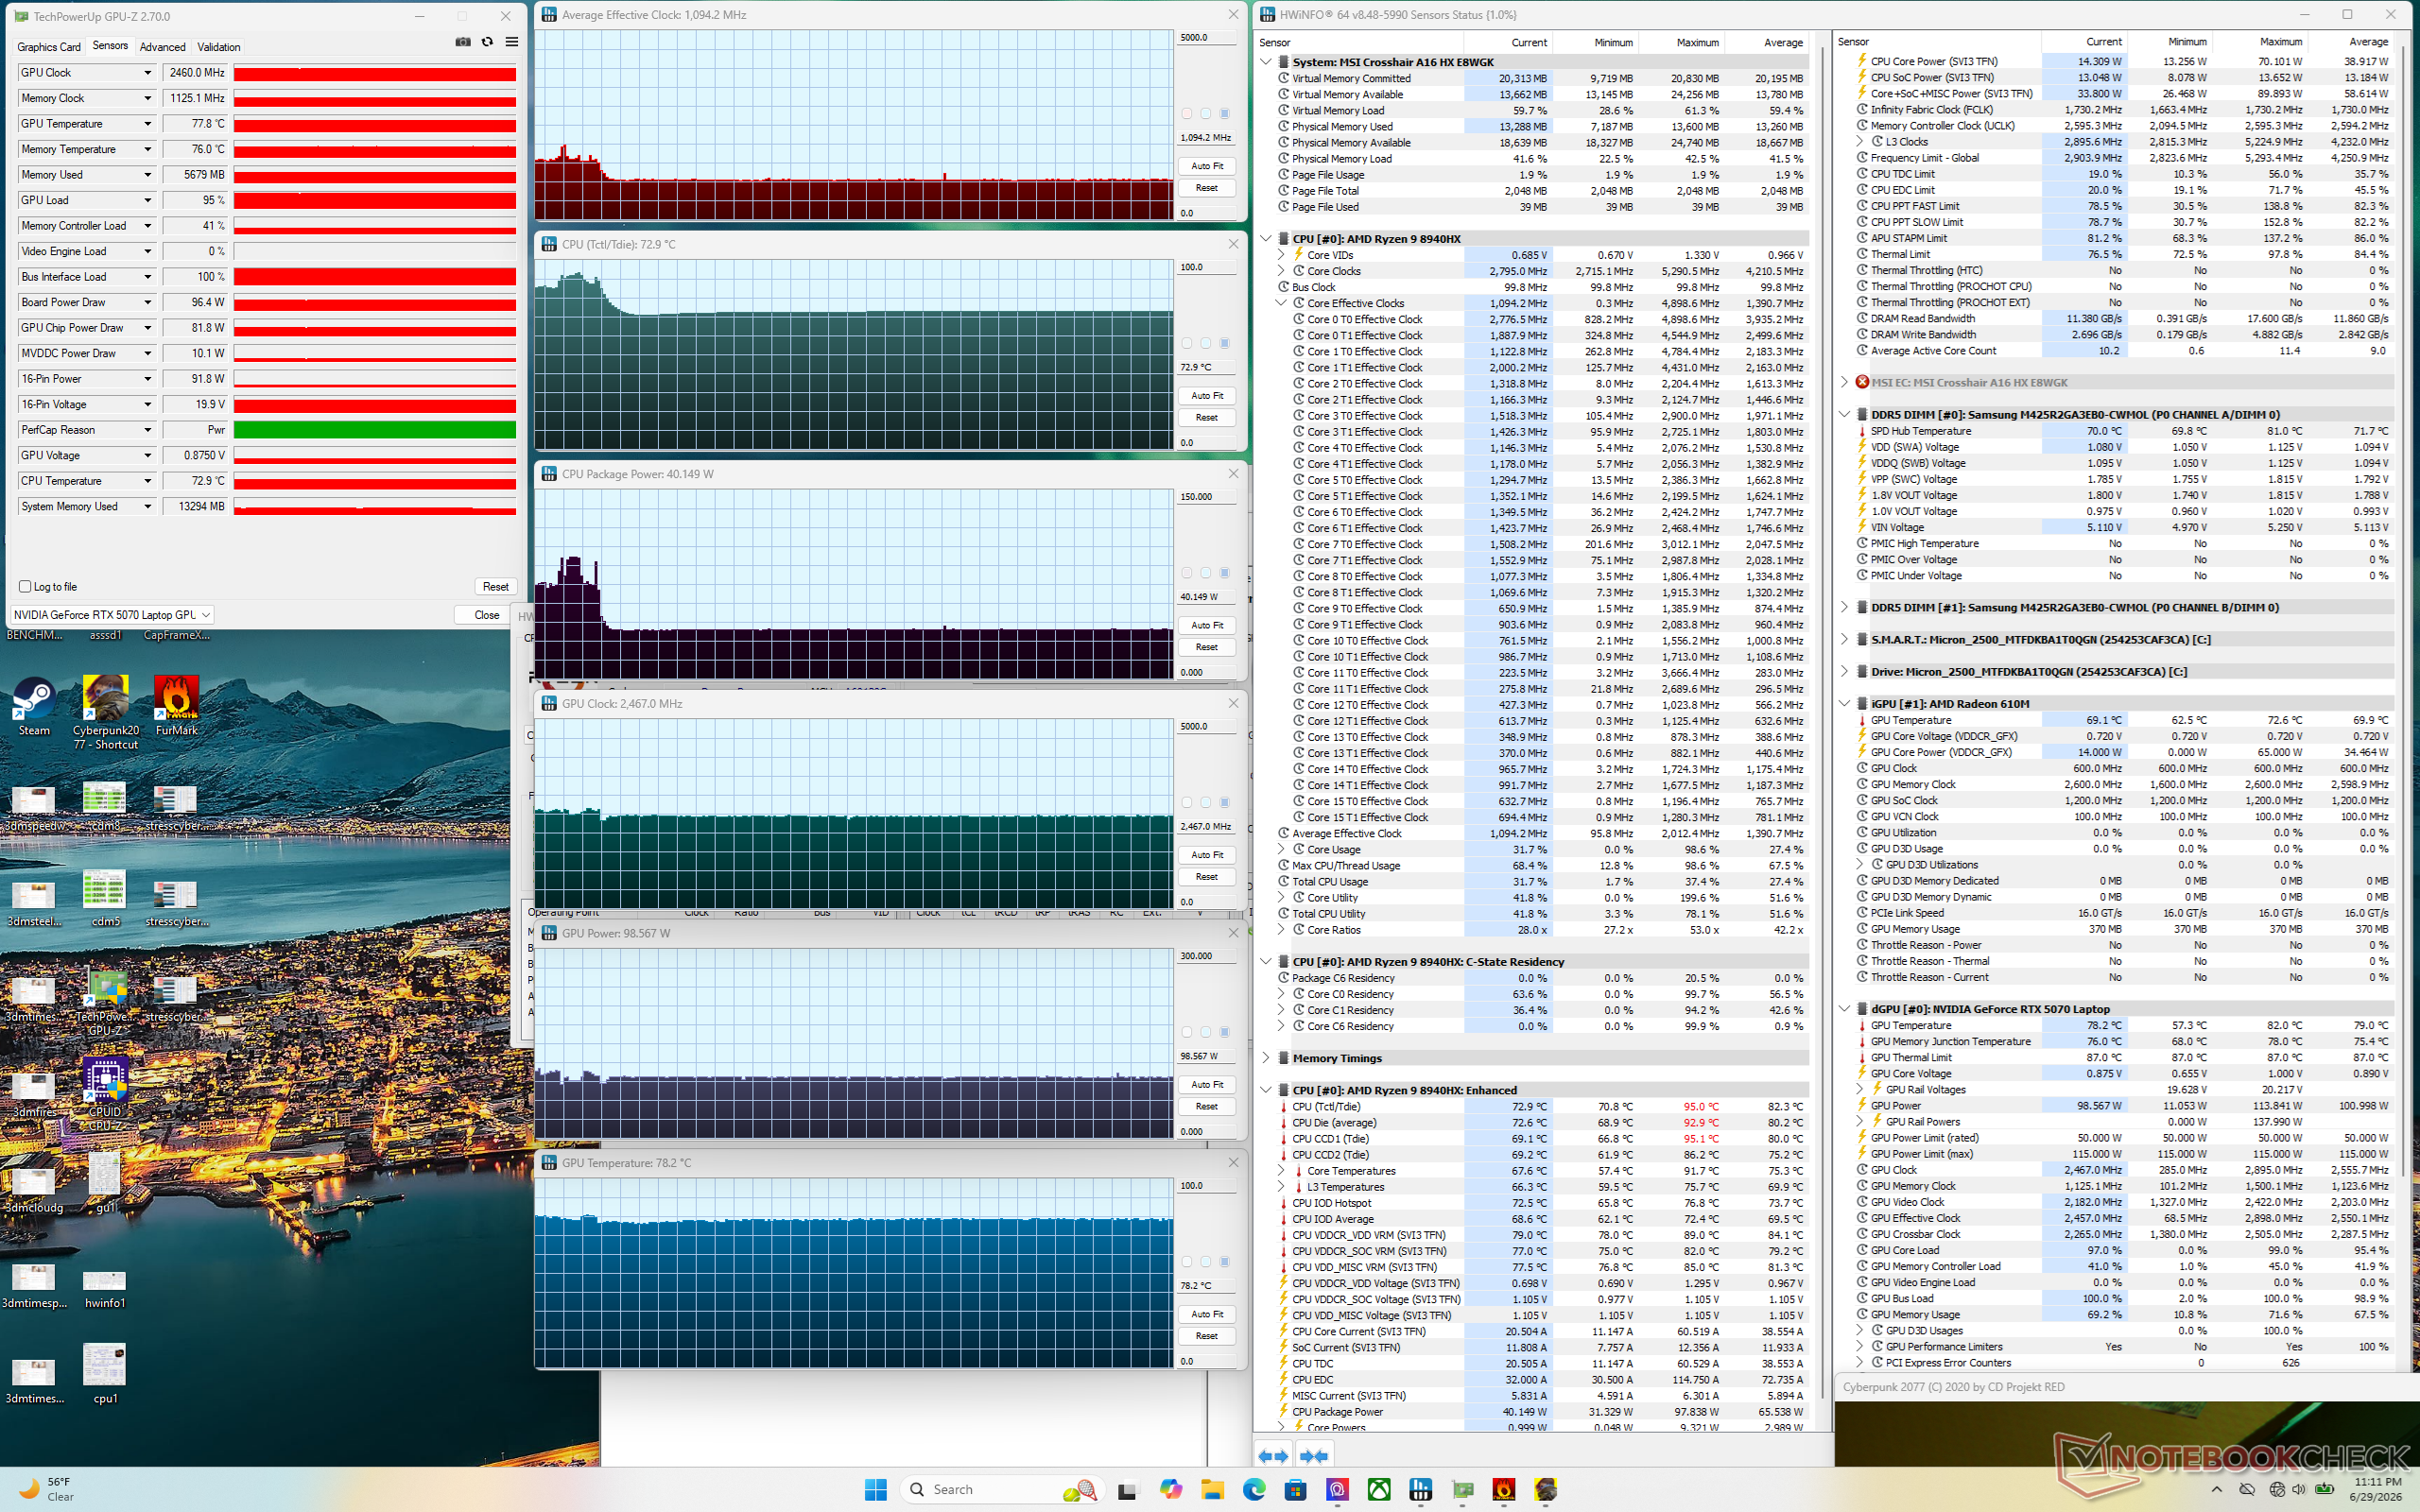

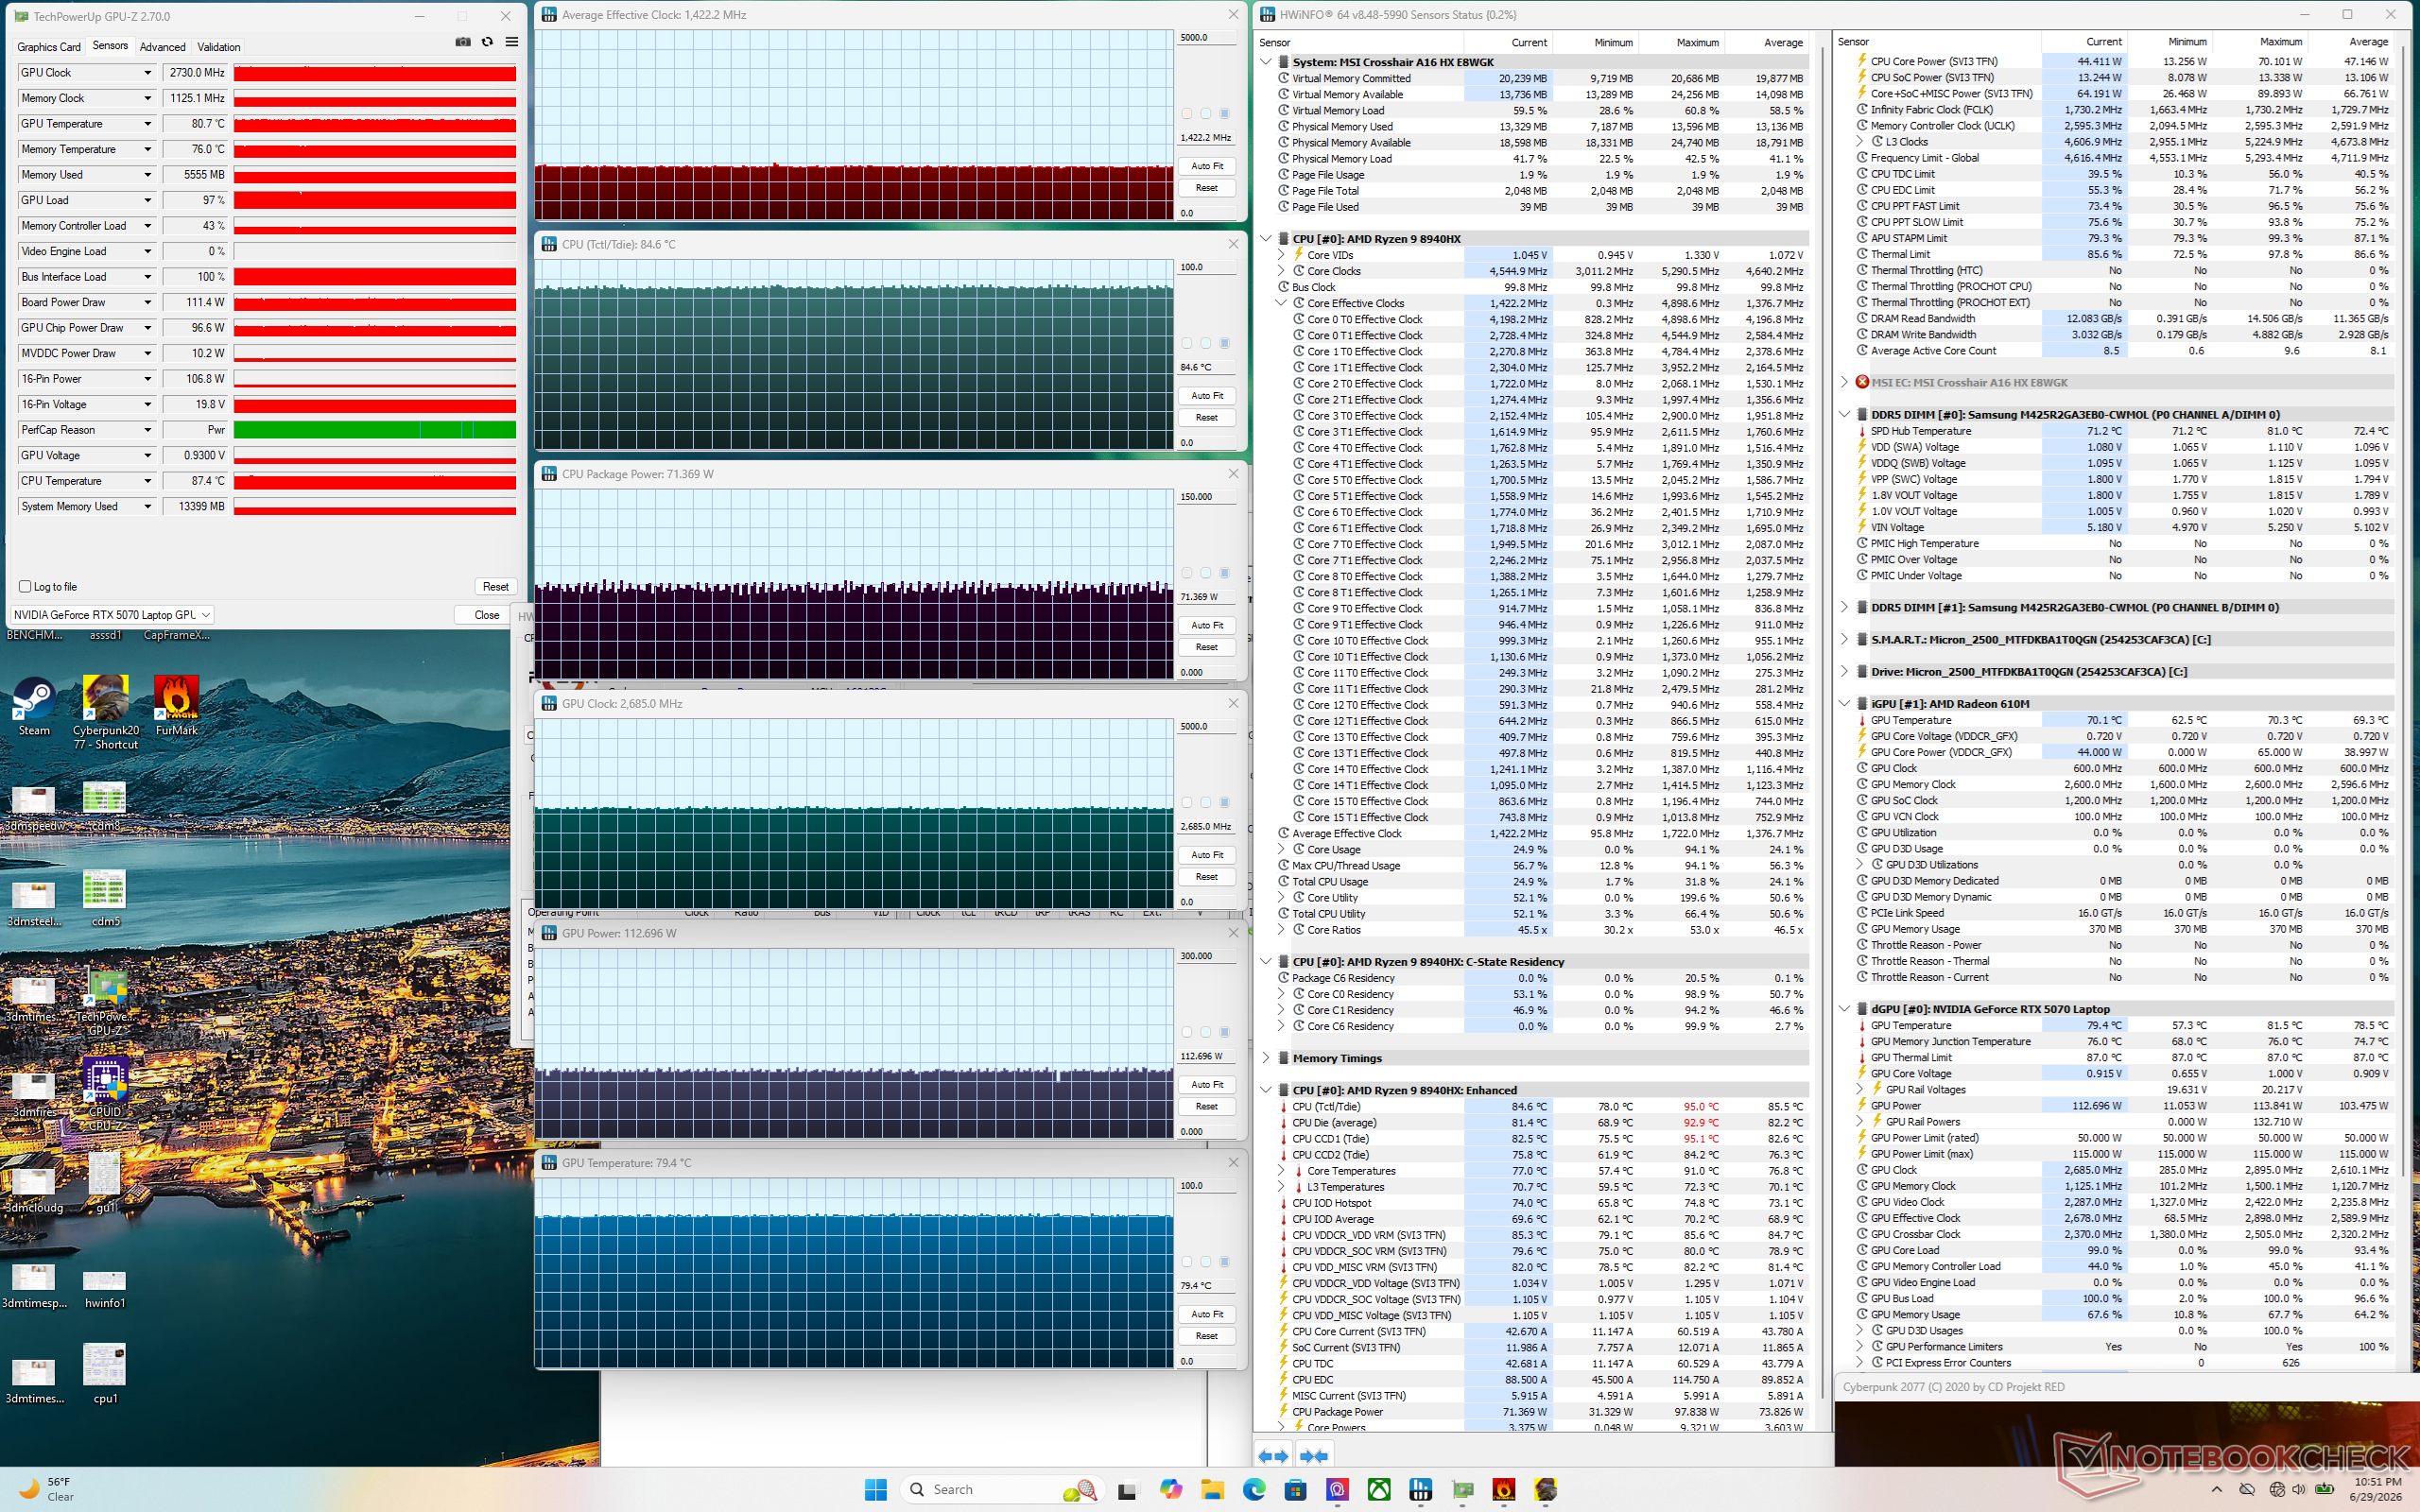
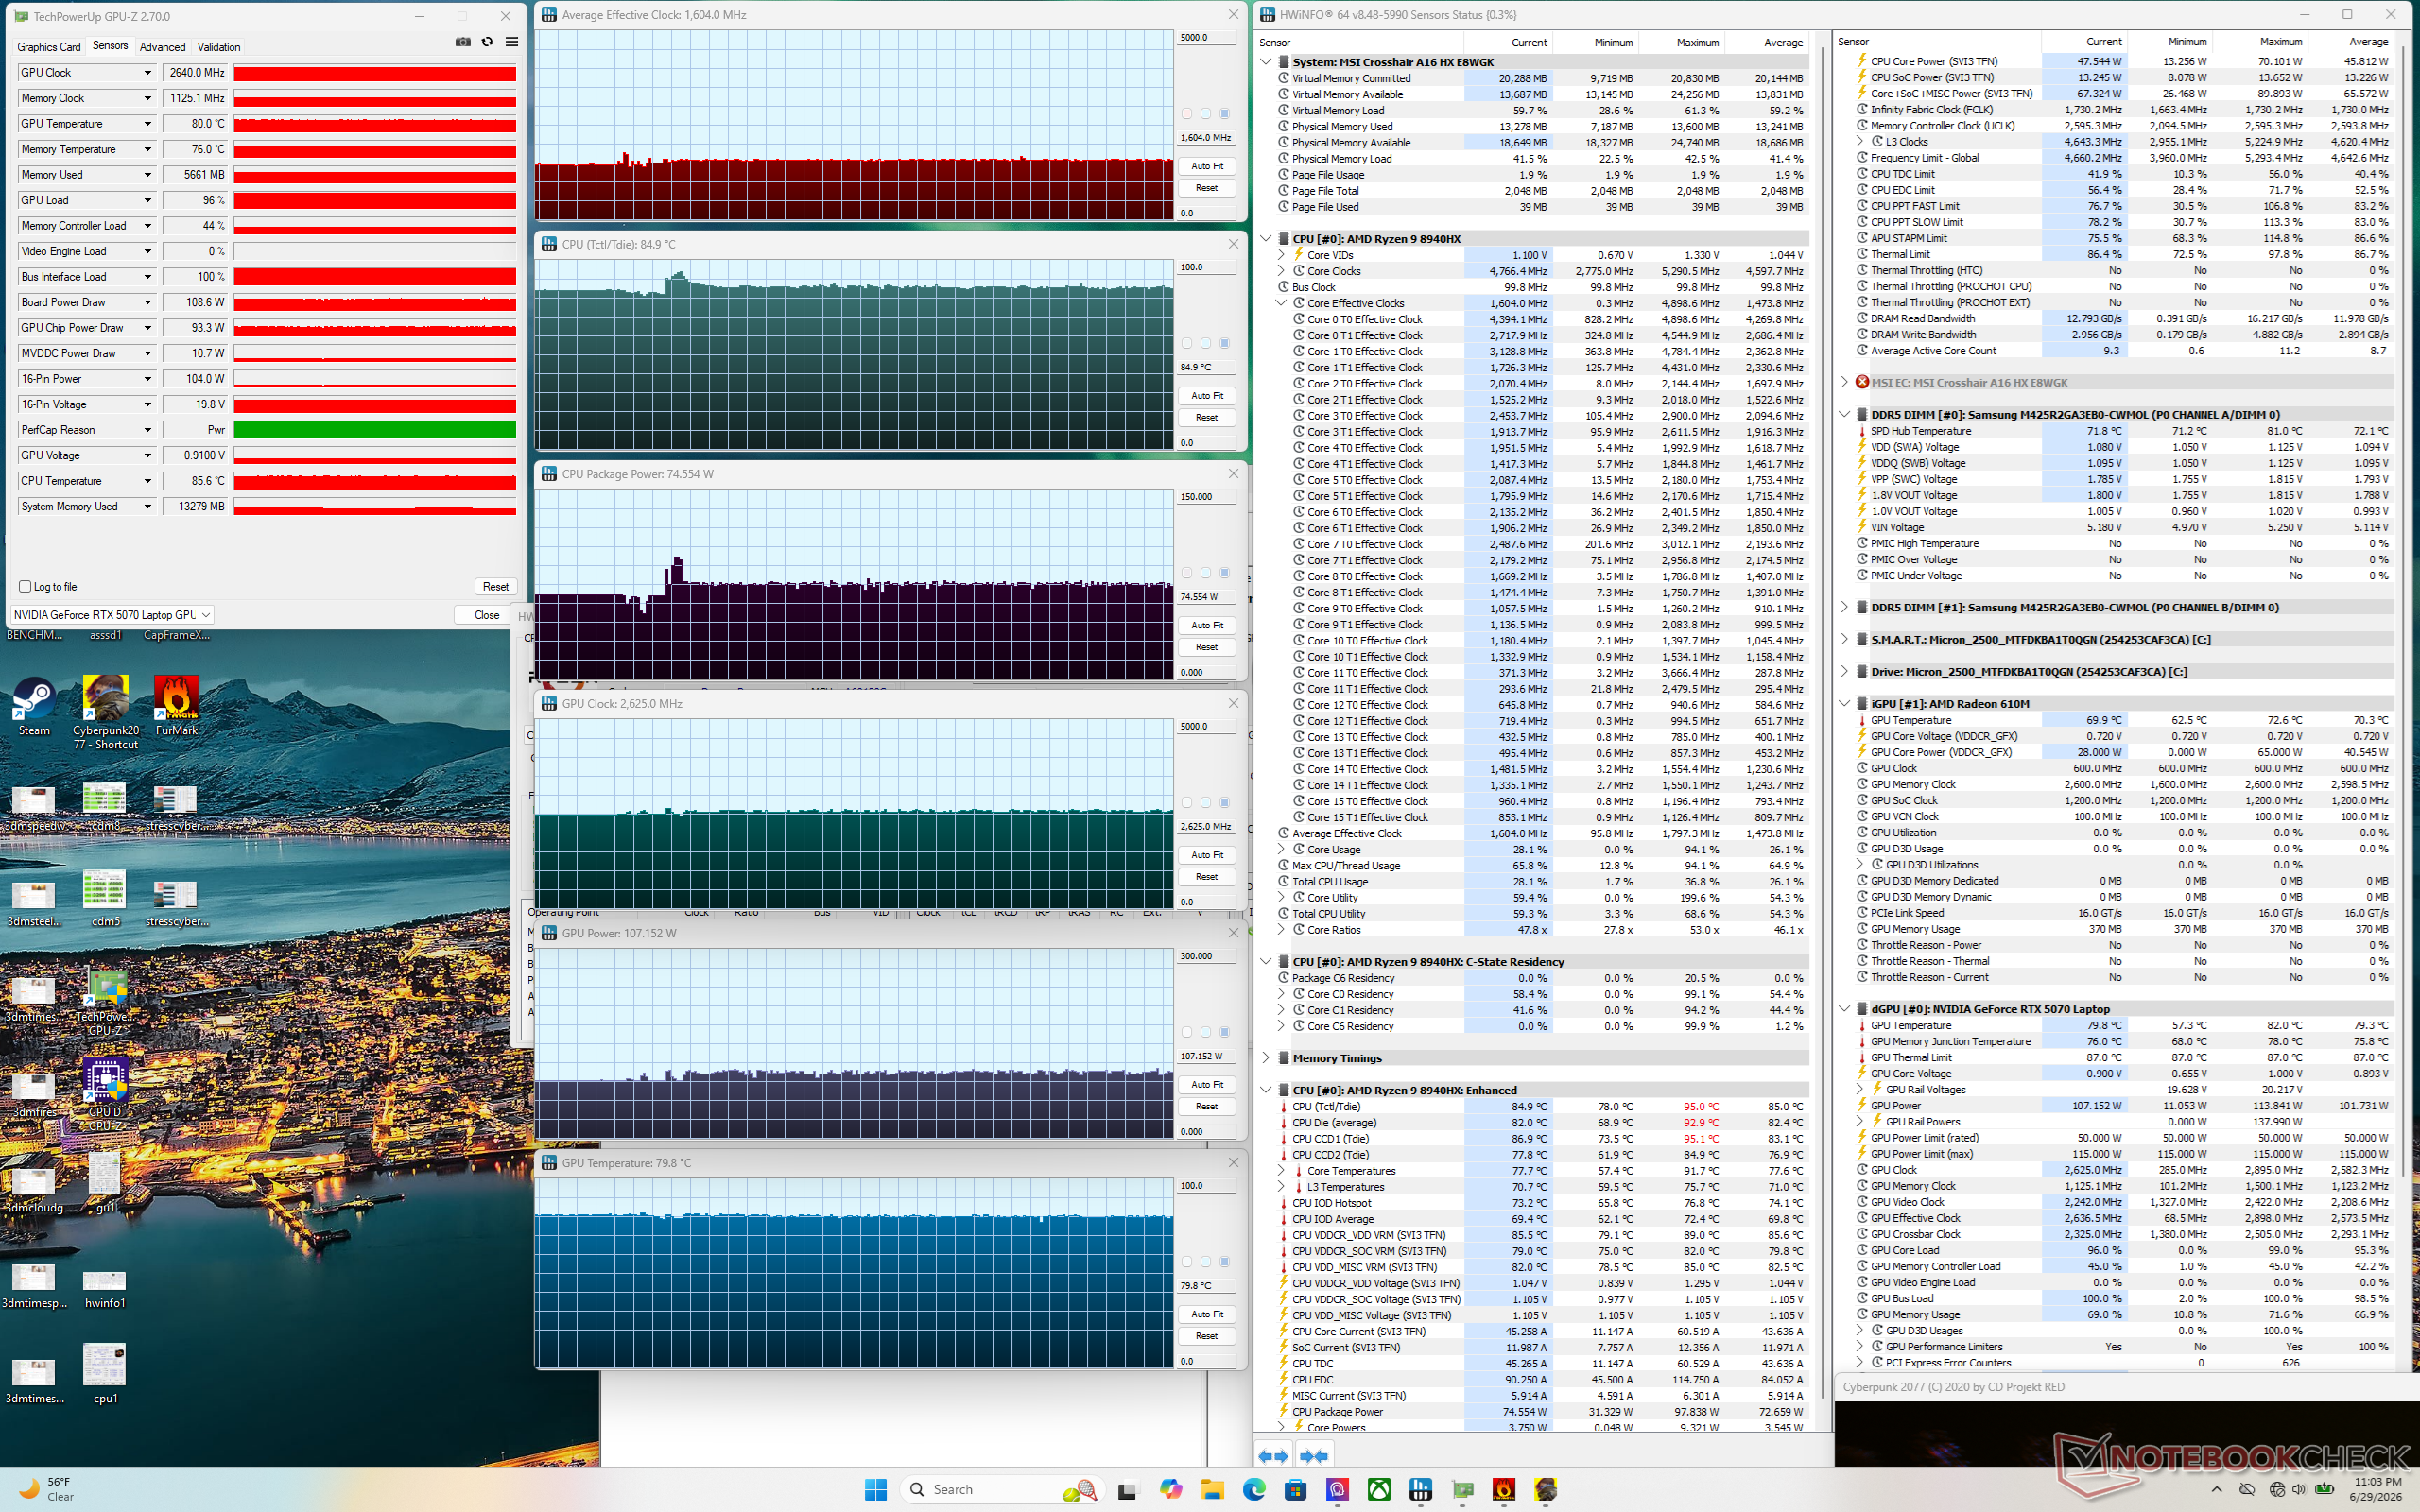
| Average CPU Clock (GHz) | GPU Clock (MHz) | Average CPU Temperature (°C) | Average GPU Temperature (°C) | |
| System Idle | -- | -- | 56 | 44 |
| Prime95 Stress | 4.1 | -- | 82 | 55 |
| Prime95 + FurMark Stress | 4.4 | ~2047 | 96 | 79 |
| Cyberpunk 2077 Stress (Balanced mode) | 1.1 | 2467 | 73 | 78 |
| Cyberpunk 2077 Stress (Apex off, Performance mode) | 1.5 | 2512 | 84 | 81 |
| Cyberpunk 2077 Stress (Apex on, Performance mode) | 1.4 | 2685 | 85 | 79 |
| Cyberpunk 2077 Stress (Apex on, Cooler Boost mode) | 1.6 | 2625 | 85 | 80 |
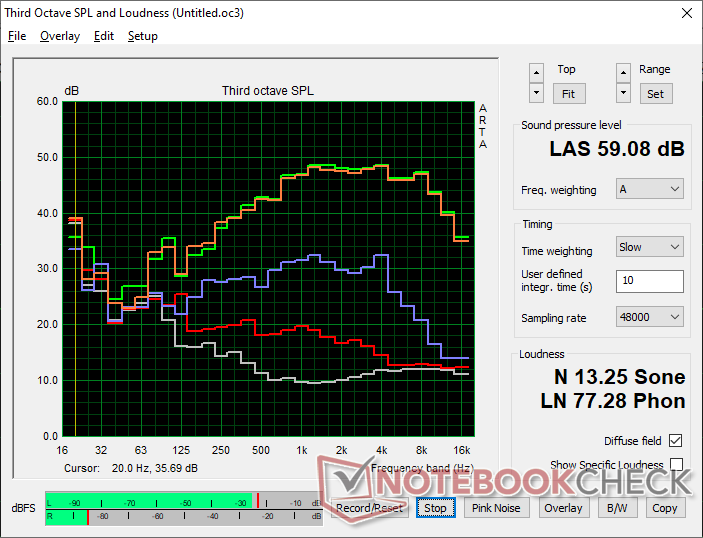
Speakers

MSI Crosshair A16 HX E8WGK audio analysis
(±) | speaker loudness is average but good (79.7 dB)
Bass 100 - 315 Hz
(±) | reduced bass - on average 8.8% lower than median
(±) | linearity of bass is average (10% delta to prev. frequency)
Mids 400 - 2000 Hz
(+) | balanced mids - only 4.5% away from median
(+) | mids are linear (4.6% delta to prev. frequency)
Highs 2 - 16 kHz
(+) | balanced highs - only 1.7% away from median
(+) | highs are linear (3.6% delta to prev. frequency)
Overall 100 - 16.000 Hz
(+) | overall sound is linear (12.7% difference to median)
Compared to same class
» 16% of all tested devices in this class were better, 4% similar, 80% worse
» The best had a delta of 6%, average was 18%, worst was 132%
Compared to all devices tested
» 12% of all tested devices were better, 3% similar, 86% worse
» The best had a delta of 4%, average was 24%, worst was 134%
Apple MacBook Pro 16 2021 M1 Pro audio analysis
(+) | speakers can play relatively loud (84.7 dB)
Bass 100 - 315 Hz
(+) | good bass - only 3.8% away from median
(+) | bass is linear (5.2% delta to prev. frequency)
Mids 400 - 2000 Hz
(+) | balanced mids - only 1.3% away from median
(+) | mids are linear (2.1% delta to prev. frequency)
Highs 2 - 16 kHz
(+) | balanced highs - only 1.9% away from median
(+) | highs are linear (2.7% delta to prev. frequency)
Overall 100 - 16.000 Hz
(+) | overall sound is linear (4.6% difference to median)
Compared to same class
» 0% of all tested devices in this class were better, 0% similar, 100% worse
» The best had a delta of 5%, average was 17%, worst was 45%
Compared to all devices tested
» 0% of all tested devices were better, 0% similar, 100% worse
» The best had a delta of 4%, average was 24%, worst was 134%
Energy Management
Power Consumption
| Off / Standby | |
| Idle | |
| Load |
|
Key:
min: | |
| MSI Crosshair A16 HX E8WGK R9 8940HX, GeForce RTX 5070 Laptop, Micron 2500 1TB MTFDKBA1T0QGN, IPS, 2560x1600, 16" | MSI Crosshair 16 HX AI D2XWGKG Ultra 9 275HX, GeForce RTX 5070 Laptop, Micron 2500 1TB MTFDKBA1T0QGN, IPS, 2560x1600, 16" | Alienware 16X Aurora Core Ultra 9 290HX Plus Ultra 9 290HX Plus, GeForce RTX 5070 Ti Laptop, , OLED, 2560x1600, 16" | Lenovo Legion 7 16 AGP11 Ryzen AI 9 HX 470, GeForce RTX 5060 Laptop, Lenovo UMIS AM541 1TB, OLED, 2560x1600, 16" | Gigabyte Gaming A16 Pro GA6DH (Core 7 240H, RTX 5070 Ti) Core 7 240H, GeForce RTX 5070 Ti Laptop, Samsung PM9C1b MZVL81T0HFLB-00BTW, IPS, 2560x1600, 16" | Acer Predator Helios Neo 16S AI PHN16S-71-94L9 Ultra 9 275HX, GeForce RTX 5070 Ti Laptop, Micron 3500 1TB MTFDKBA1T0TGD, OLED, 2560x1600, 16" | |
|---|---|---|---|---|---|---|
| Power Consumption | -25% | 22% | 42% | 3% | 37% | |
| Idle Minimum * (Watt) | 12.3 | 26.2 -113% | 6.9 44% | 5.7 54% | 21.5 -75% | 3.9 68% |
| Idle Average * (Watt) | 17.1 | 33.8 -98% | 8.1 53% | 8.7 49% | 28.3 -65% | 11 36% |
| Idle Maximum * (Watt) | 42.4 | 34 20% | 31 27% | 9.1 79% | 26.3 38% | 16.9 60% |
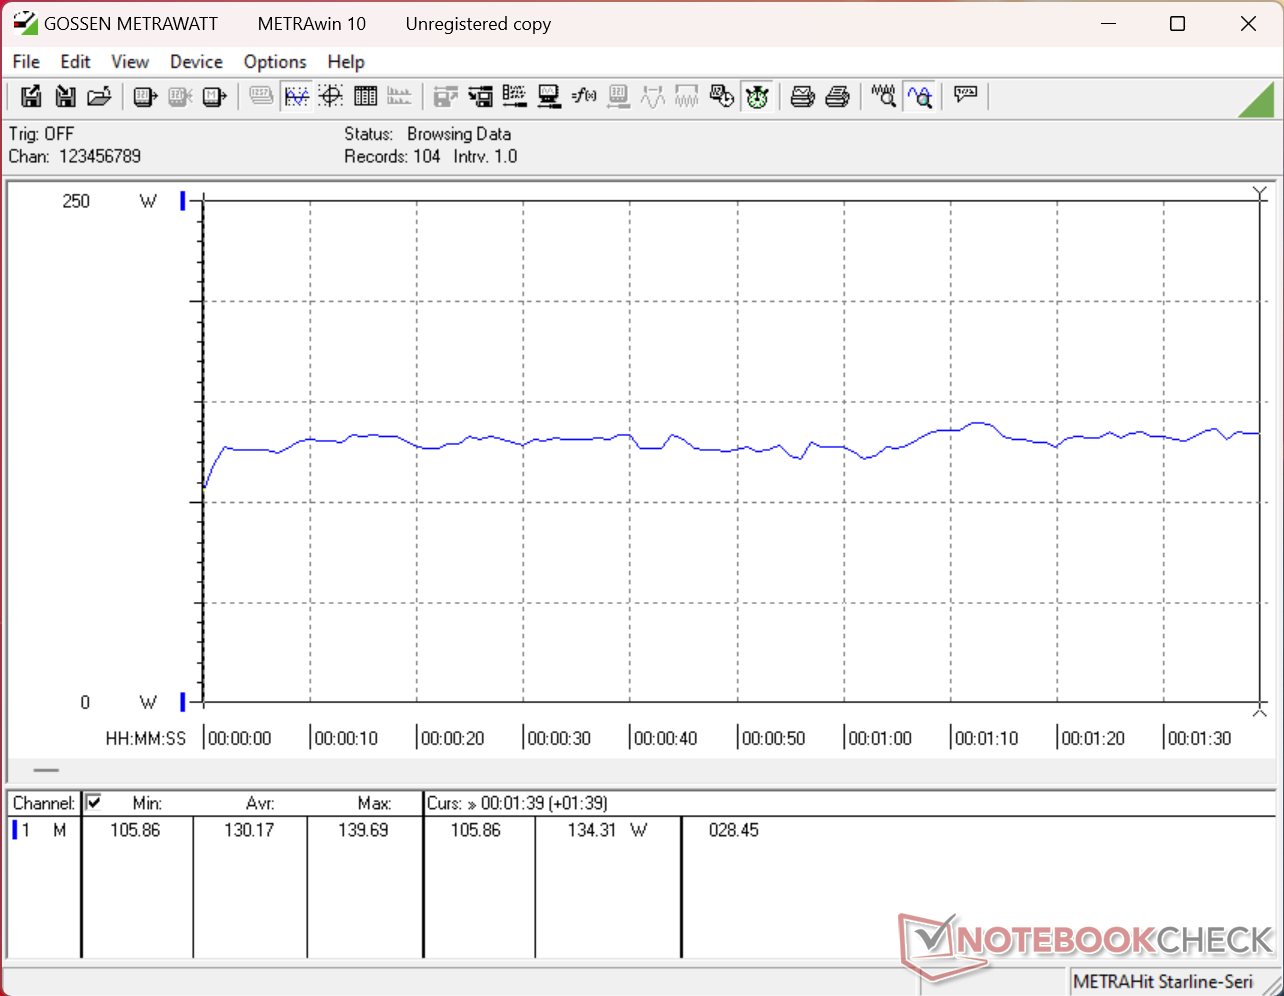
| Load Average * (Watt) | 130.2 | 112 14% | 131.6 -1% | 88.7 32% | 92.5 29% | 123 6% |
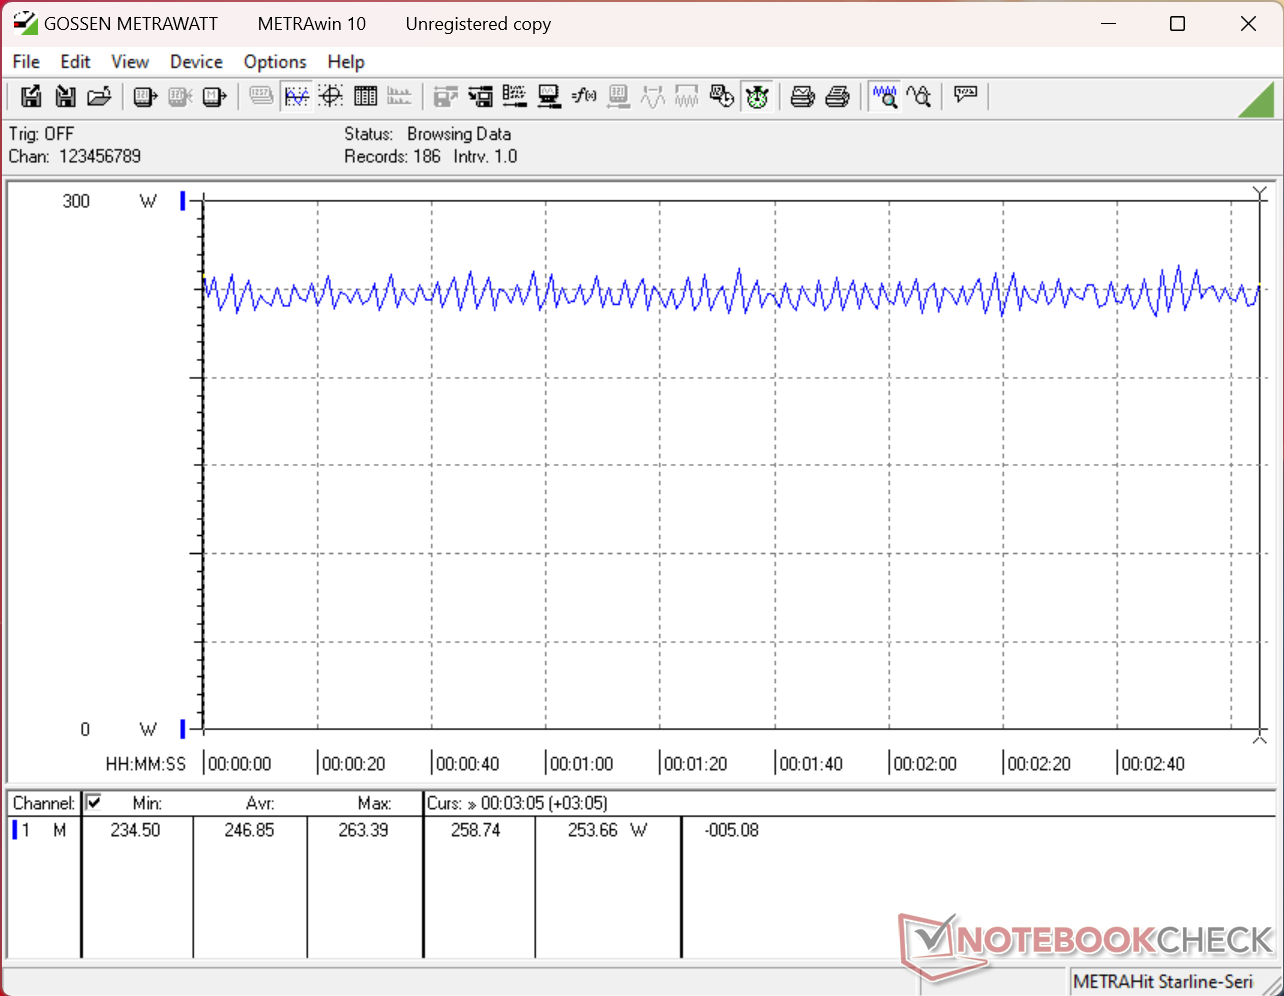
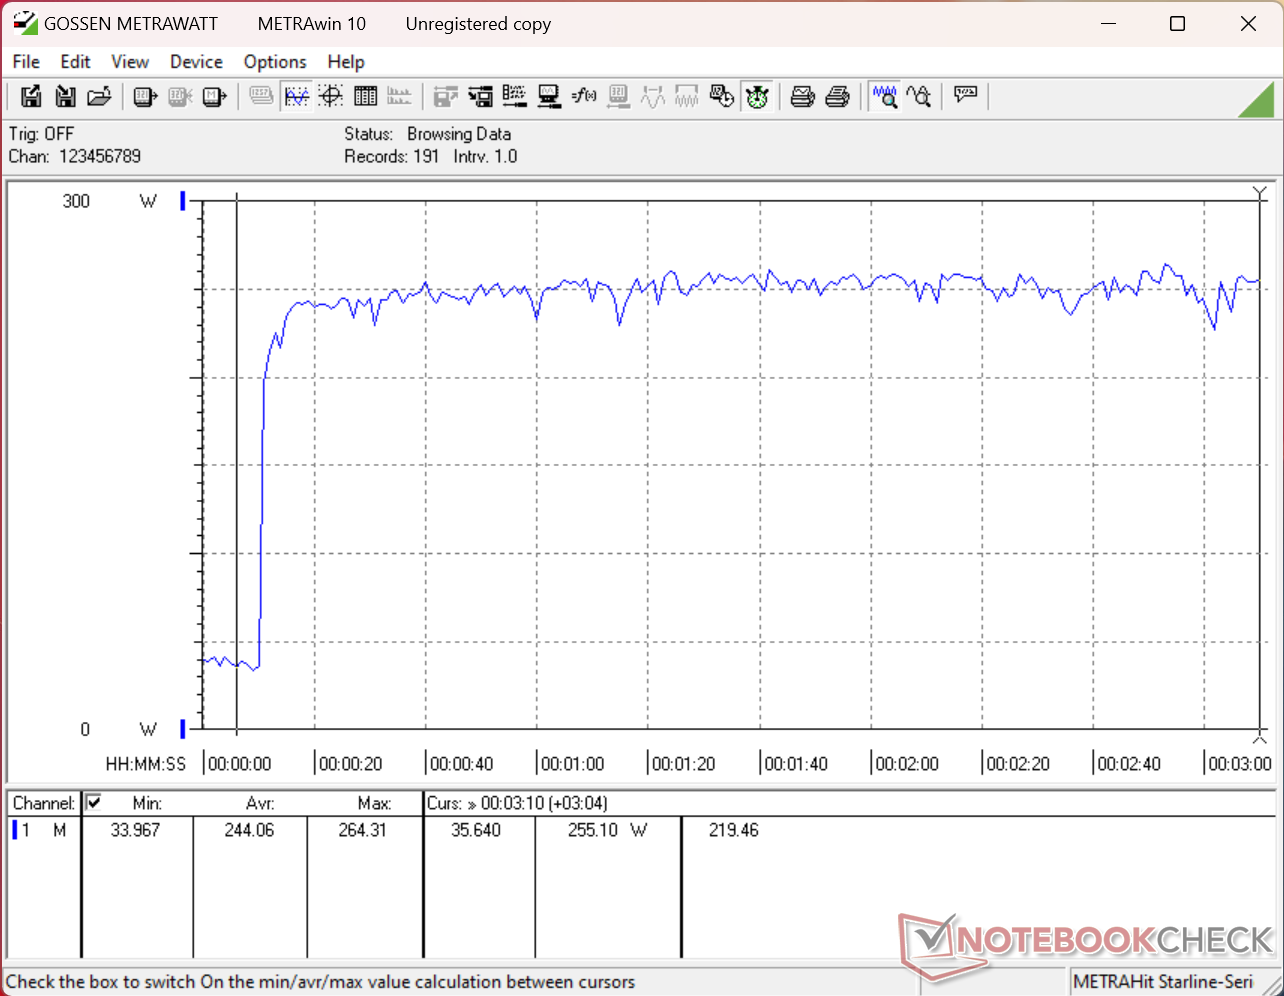
| Cyberpunk 2077 ultra * (Watt) | 246 | 224 9% | 198.3 19% | 160.3 35% | 165 33% | 152.7 38% |
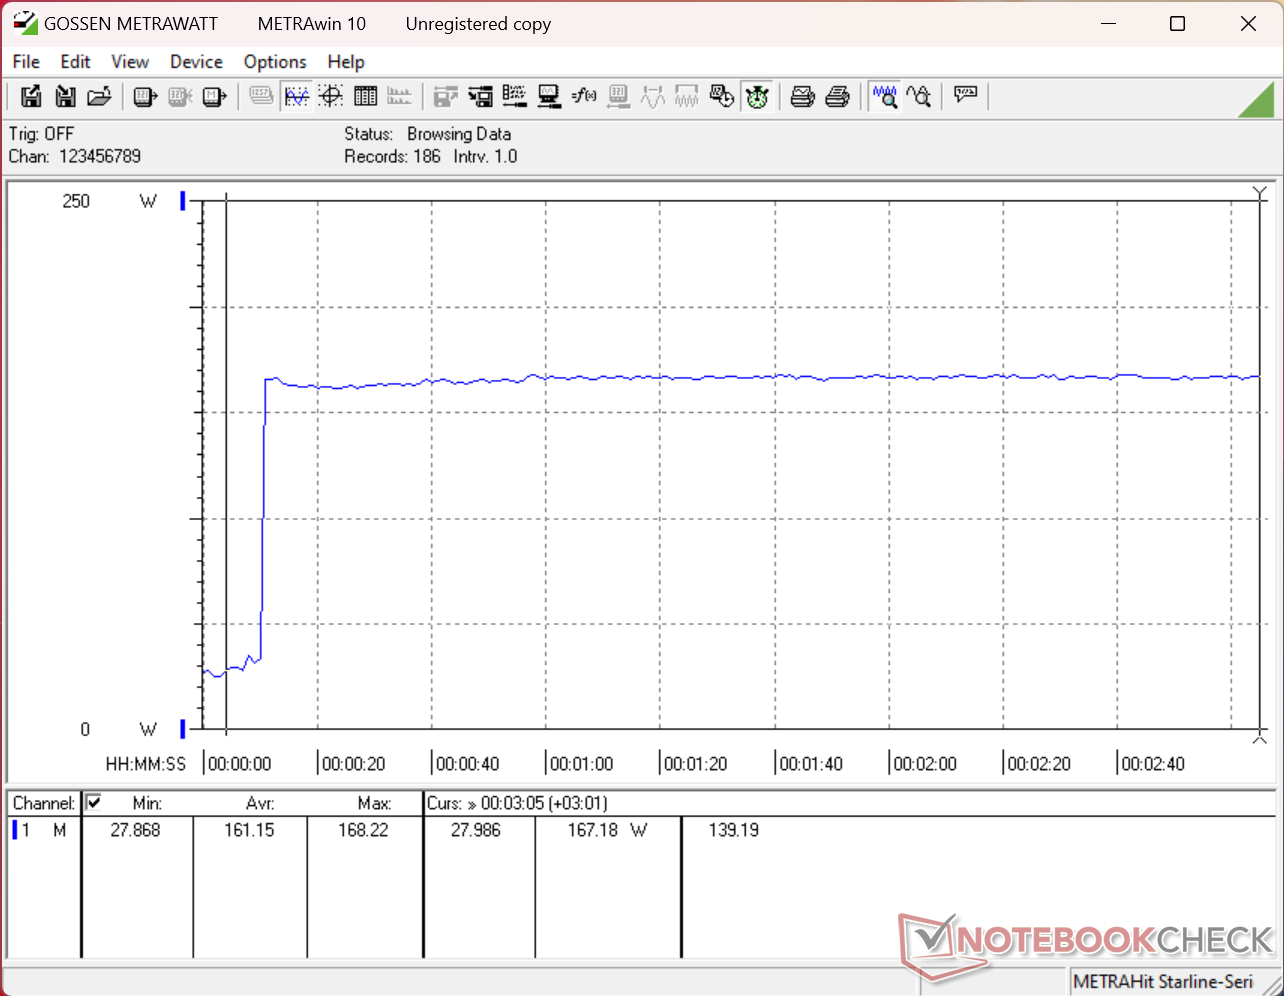
| Cyberpunk 2077 ultra external monitor * (Watt) | 242 | 220 9% | 172.1 29% | 156.9 35% | 158 35% | 144.9 40% |
| Load Maximum * (Watt) | 264.3 | 315 -19% | 300.1 -14% | 234.9 11% | 195 26% | 229 13% |
* ... smaller is better
Power Consumption Cyberpunk / Stress Test
Power Consumption external Monitor
Battery Life
| MSI Crosshair A16 HX E8WGK R9 8940HX, GeForce RTX 5070 Laptop, 80 Wh | MSI Crosshair 16 HX AI D2XWGKG Ultra 9 275HX, GeForce RTX 5070 Laptop, 90 Wh | Alienware 16X Aurora Core Ultra 9 290HX Plus Ultra 9 290HX Plus, GeForce RTX 5070 Ti Laptop, 96 Wh | Lenovo Legion 7 16 AGP11 Ryzen AI 9 HX 470, GeForce RTX 5060 Laptop, 84 Wh | Gigabyte Gaming A16 Pro GA6DH (Core 7 240H, RTX 5070 Ti) Core 7 240H, GeForce RTX 5070 Ti Laptop, 76 Wh | Acer Predator Helios Neo 16S AI PHN16S-71-94L9 Ultra 9 275HX, GeForce RTX 5070 Ti Laptop, 76 Wh | |
|---|---|---|---|---|---|---|
| Battery runtime | 102% | 35% | 67% | 51% | -9% | |
| WiFi v1.3 (h) | 5.5 | 11.1 102% | 7.4 35% | 9.2 67% | 8.3 51% | 5 -9% |
| H.264 (h) | 14.2 |
Notebookcheck Rating
The Crosshair A16 is one of MSI's more affordable gaming laptops prioritizing performance and display quality over auxiliary or luxurious features to save on costs.
MSI Crosshair A16 HX E8WGK
- 07/03/2026 v8
Allen Ngo
 Total Sustainability Score:
 Potential Competitors in Comparison
Image | Model / Review | Price | Weight | Height | Display |
|---|---|---|---|---|---|
1. 82.5%  | MSI Crosshair A16 HX E8WGK AMD Ryzen 9 8940HX ⎘ NVIDIA GeForce RTX 5070 Laptop ⎘ 32 GB Memory, 1024 GB SSD | Amazon: $2,629.00 List Price: 2700 USD | 2.3 kg | 25.55 mm | 16.00" 2560x1600 189 PPI IPS |
2. 81.9%  | MSI Crosshair 16 HX AI D2XWGKG Intel Core Ultra 9 275HX ⎘ NVIDIA GeForce RTX 5070 Laptop ⎘ 16 GB Memory, 1024 GB SSD | Amazon: List Price: 2500 EUR | 2.5 kg | 27.9 mm | 16.00" 2560x1600 189 PPI IPS |
3. 85.9%  | Alienware 16X Aurora Core Ultra 9 290HX Plus Intel Core Ultra 9 290HX Plus ⎘ NVIDIA GeForce RTX 5070 Ti Laptop ⎘ 32 GB Memory | Amazon: List Price: 3000 USD | 2.6 kg | 23.4 mm | 16.00" 2560x1600 189 PPI OLED |
4. 86.4%  | Lenovo Legion 7 16 AGP11 AMD Ryzen AI 9 HX 470 ⎘ NVIDIA GeForce RTX 5060 Laptop ⎘ 32 GB Memory, 1024 GB SSD | Amazon: List Price: 2500€ | 1.8 kg | 16.9 mm | 16.00" 2560x1600 189 PPI OLED |
5. 81%  | Gigabyte Gaming A16 Pro GA6DH (Core 7 240H, RTX 5070 Ti) Intel Core 7 240H ⎘ NVIDIA GeForce RTX 5070 Ti Laptop ⎘ 32 GB Memory, 1000 GB SSD | Amazon: List Price: 2300 Euro | 2.4 kg | 22.99 mm | 16.00" 2560x1600 189 PPI IPS |
6. 82%  | Acer Predator Helios Neo 16S AI PHN16S-71-94L9 Intel Core Ultra 9 275HX ⎘ NVIDIA GeForce RTX 5070 Ti Laptop ⎘ 32 GB Memory, 1024 GB SSD | Amazon: List Price: 2400 EUR | 2.2 kg | 19.9 mm | 16.00" 2560x1600 189 PPI OLED |
Transparency
The selection of devices to be reviewed is made by our editorial team. The test sample was provided to the author as a loan by the manufacturer or retailer for the purpose of this review. The lender had no influence on this review, nor did the manufacturer receive a copy of this review before publication. There was no obligation to publish this review. As an independent media company, Notebookcheck is not subjected to the authority of manufacturers, retailers or publishers.
This is how Notebookcheck is testing
Every year, Notebookcheck independently reviews hundreds of laptops and smartphones using standardized procedures to ensure that all results are comparable. We have continuously developed our test methods for around 20 years and set industry standards in the process. In our test labs, high-quality measuring equipment is utilized by experienced technicians and editors. These tests involve a multi-stage validation process. Our complex rating system is based on hundreds of well-founded measurements and benchmarks, which maintains objectivity. Further information on our test methods can be found here.
No comments for this article
