
Verdict - Not really “pro” for gaming, but maybe for…?
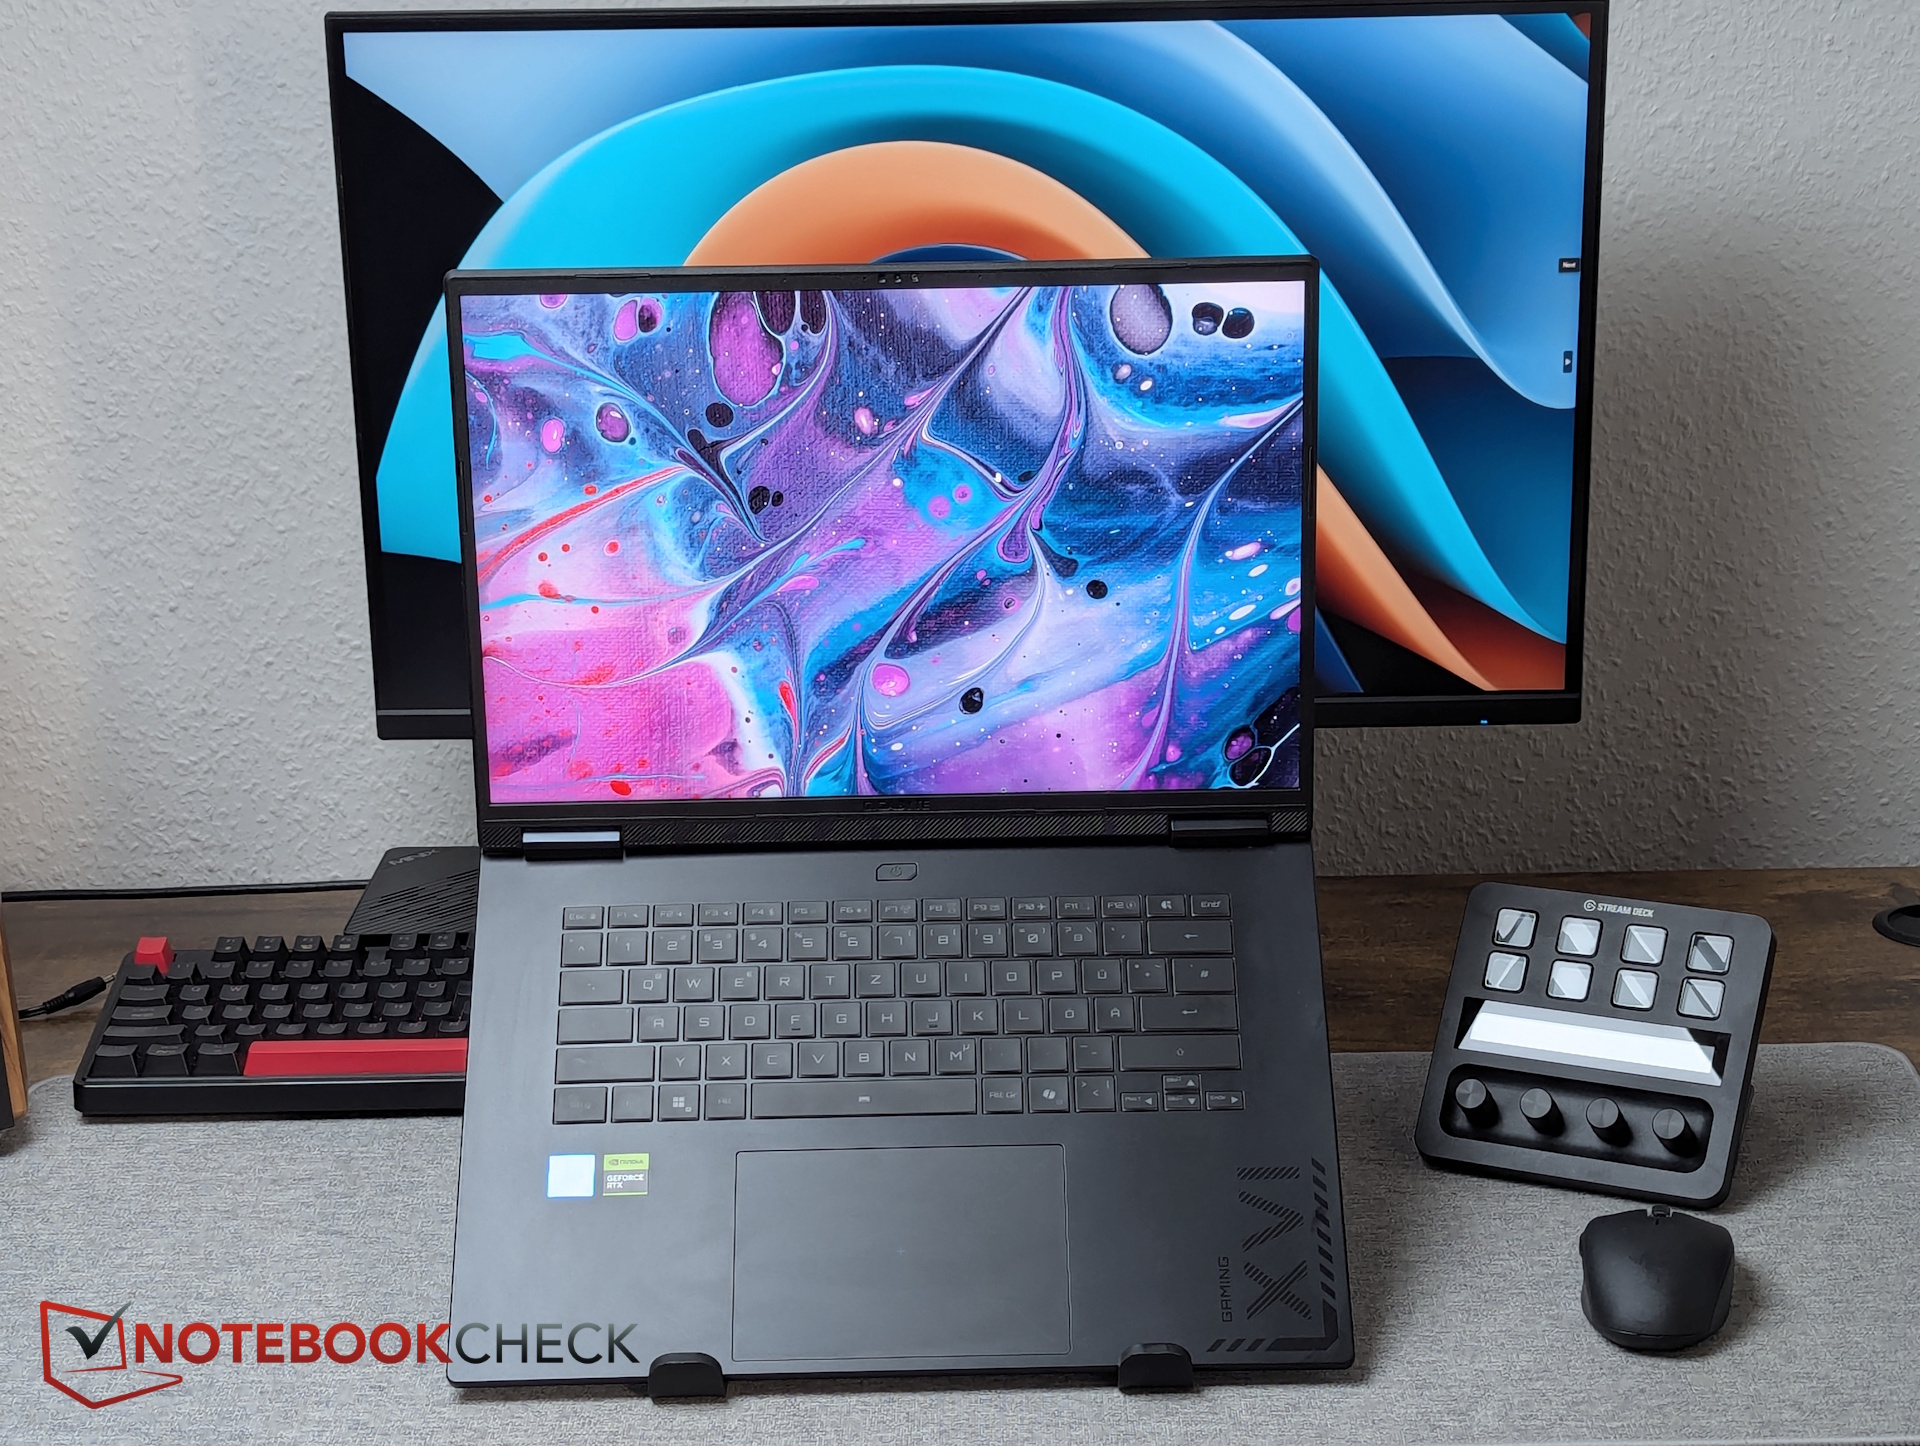
Typical RTX 5070 Ti laptops are usually thicker, heavier (and more powerful) than the Gigabyte A16 Pro. With its slim chassis, solid battery life, low power draw under load, and bright display, it leans more toward being an affordable entry-level machine for mobile video editing, local AI workloads, or 3D modeling. The extra VRAM of the RTX 5070 Ti is particularly beneficial here.
However, when it comes to connectivity (only 5 Gbps USB), we expected significantly more “pro.” More importantly, optimization is lacking. High latencies, SSD throttling, and elevated idle power consumption point to missed potential. We hope Gigabyte addresses these issues with future updates.
Pros
Cons
Table of Contents
- Verdict - Not really “pro” for gaming, but maybe for…?
- Specifications
- Chassis & build – Slim, but not very sturdy
- Input devices – Reliable typing and navigation
- Display - 500-nit WQXGA with sRGB
- Performance – Barely faster than the non-pro
- Emissions & energy – High idle power consumption
- Possible alternatives
Following last year’s Gigabyte Gaming A16, the lineup introduces the Gigabyte Gaming A16 Pro—with a new processor, improved GPU, and hopefully upgrades to features and cooling.
Specifications
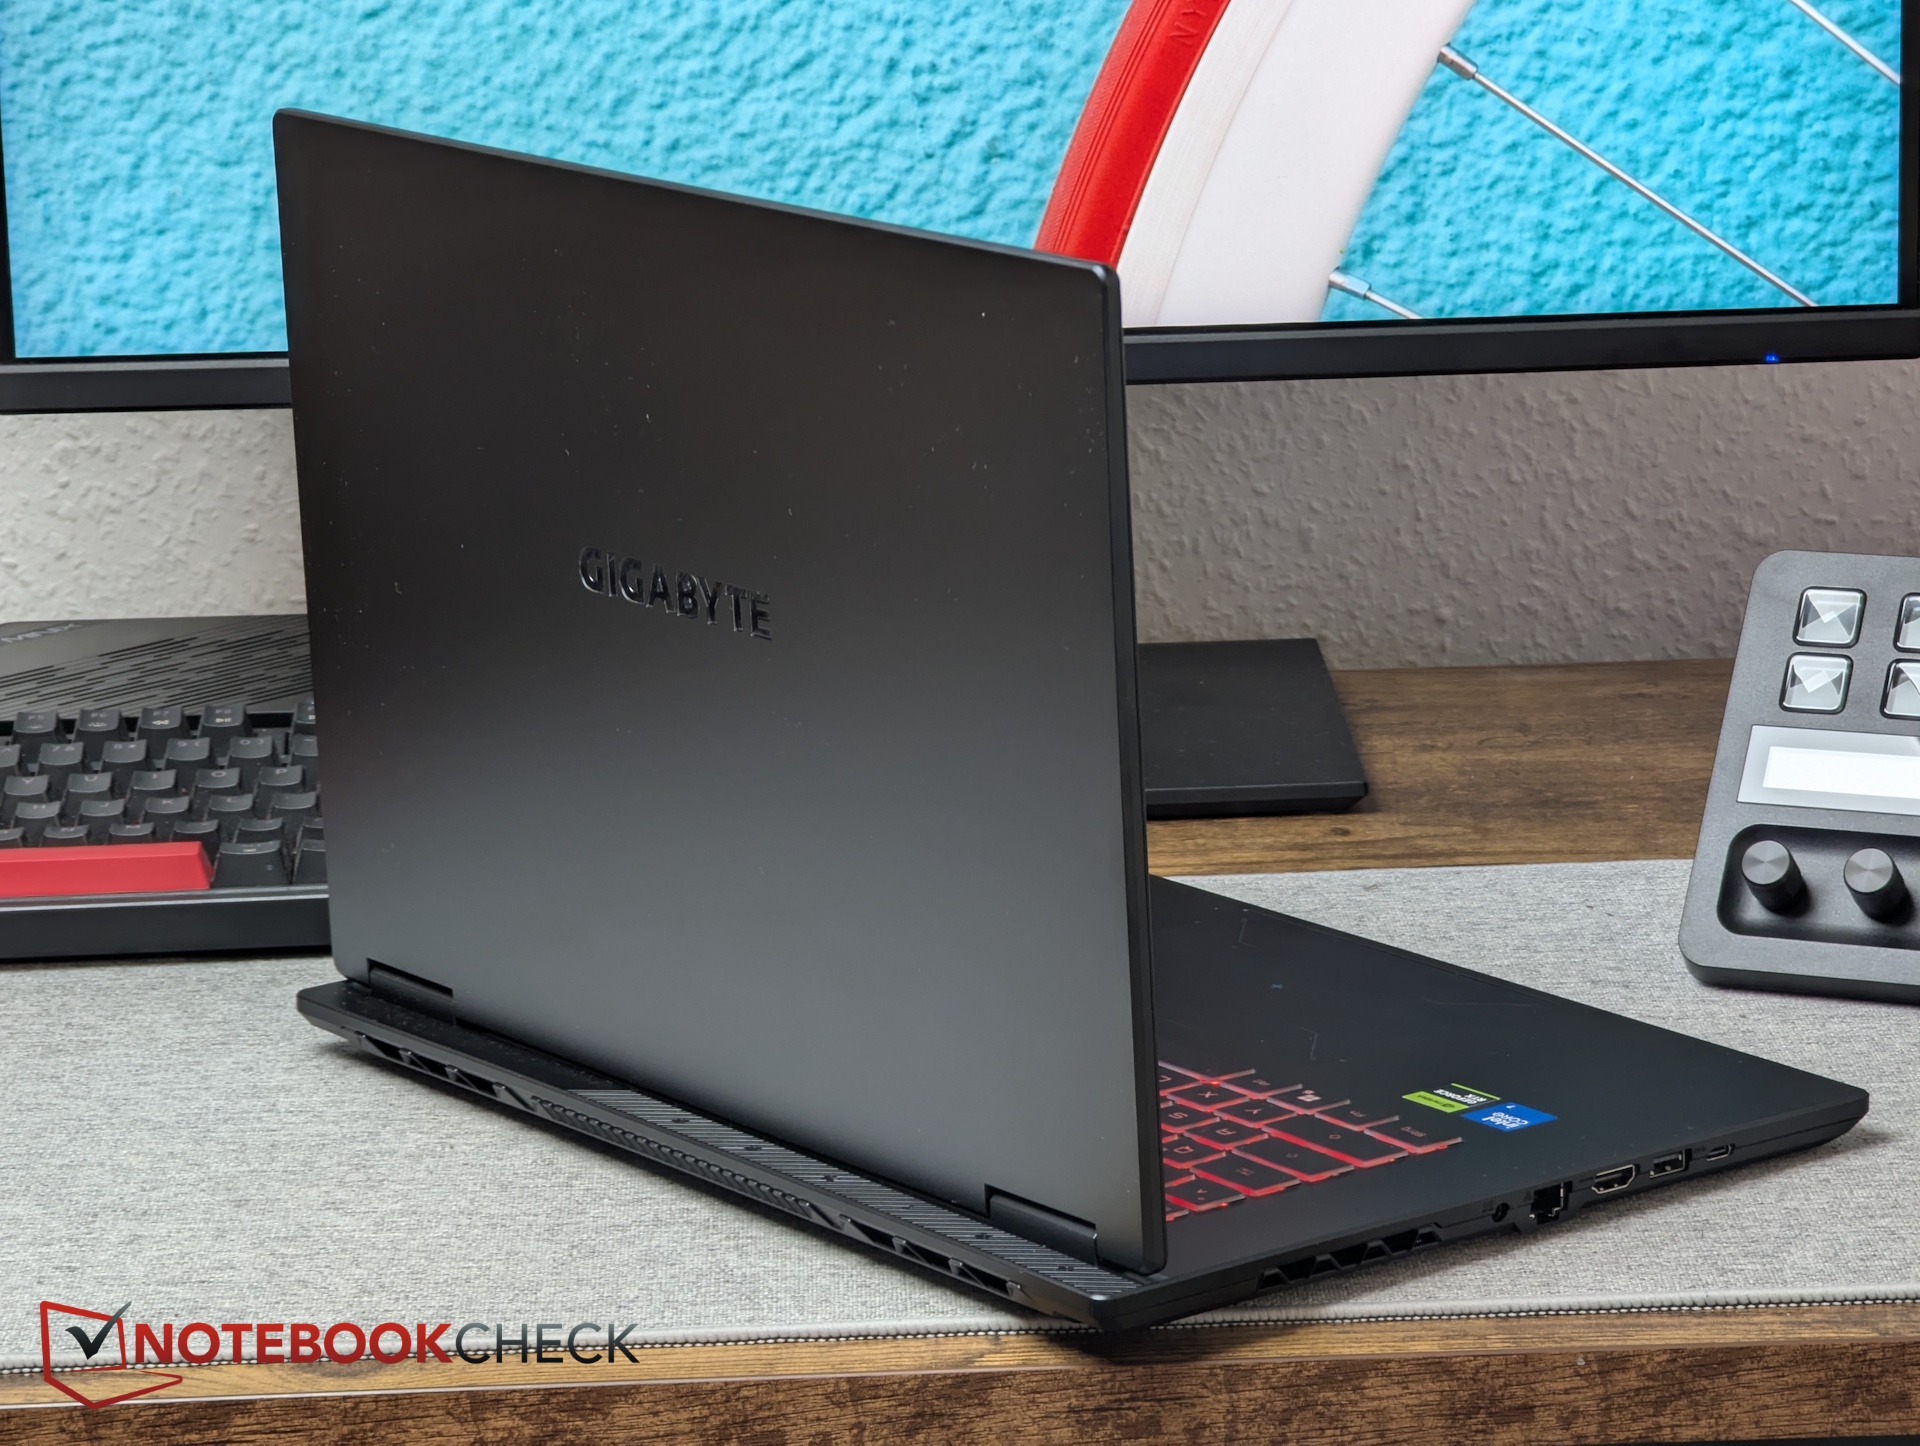
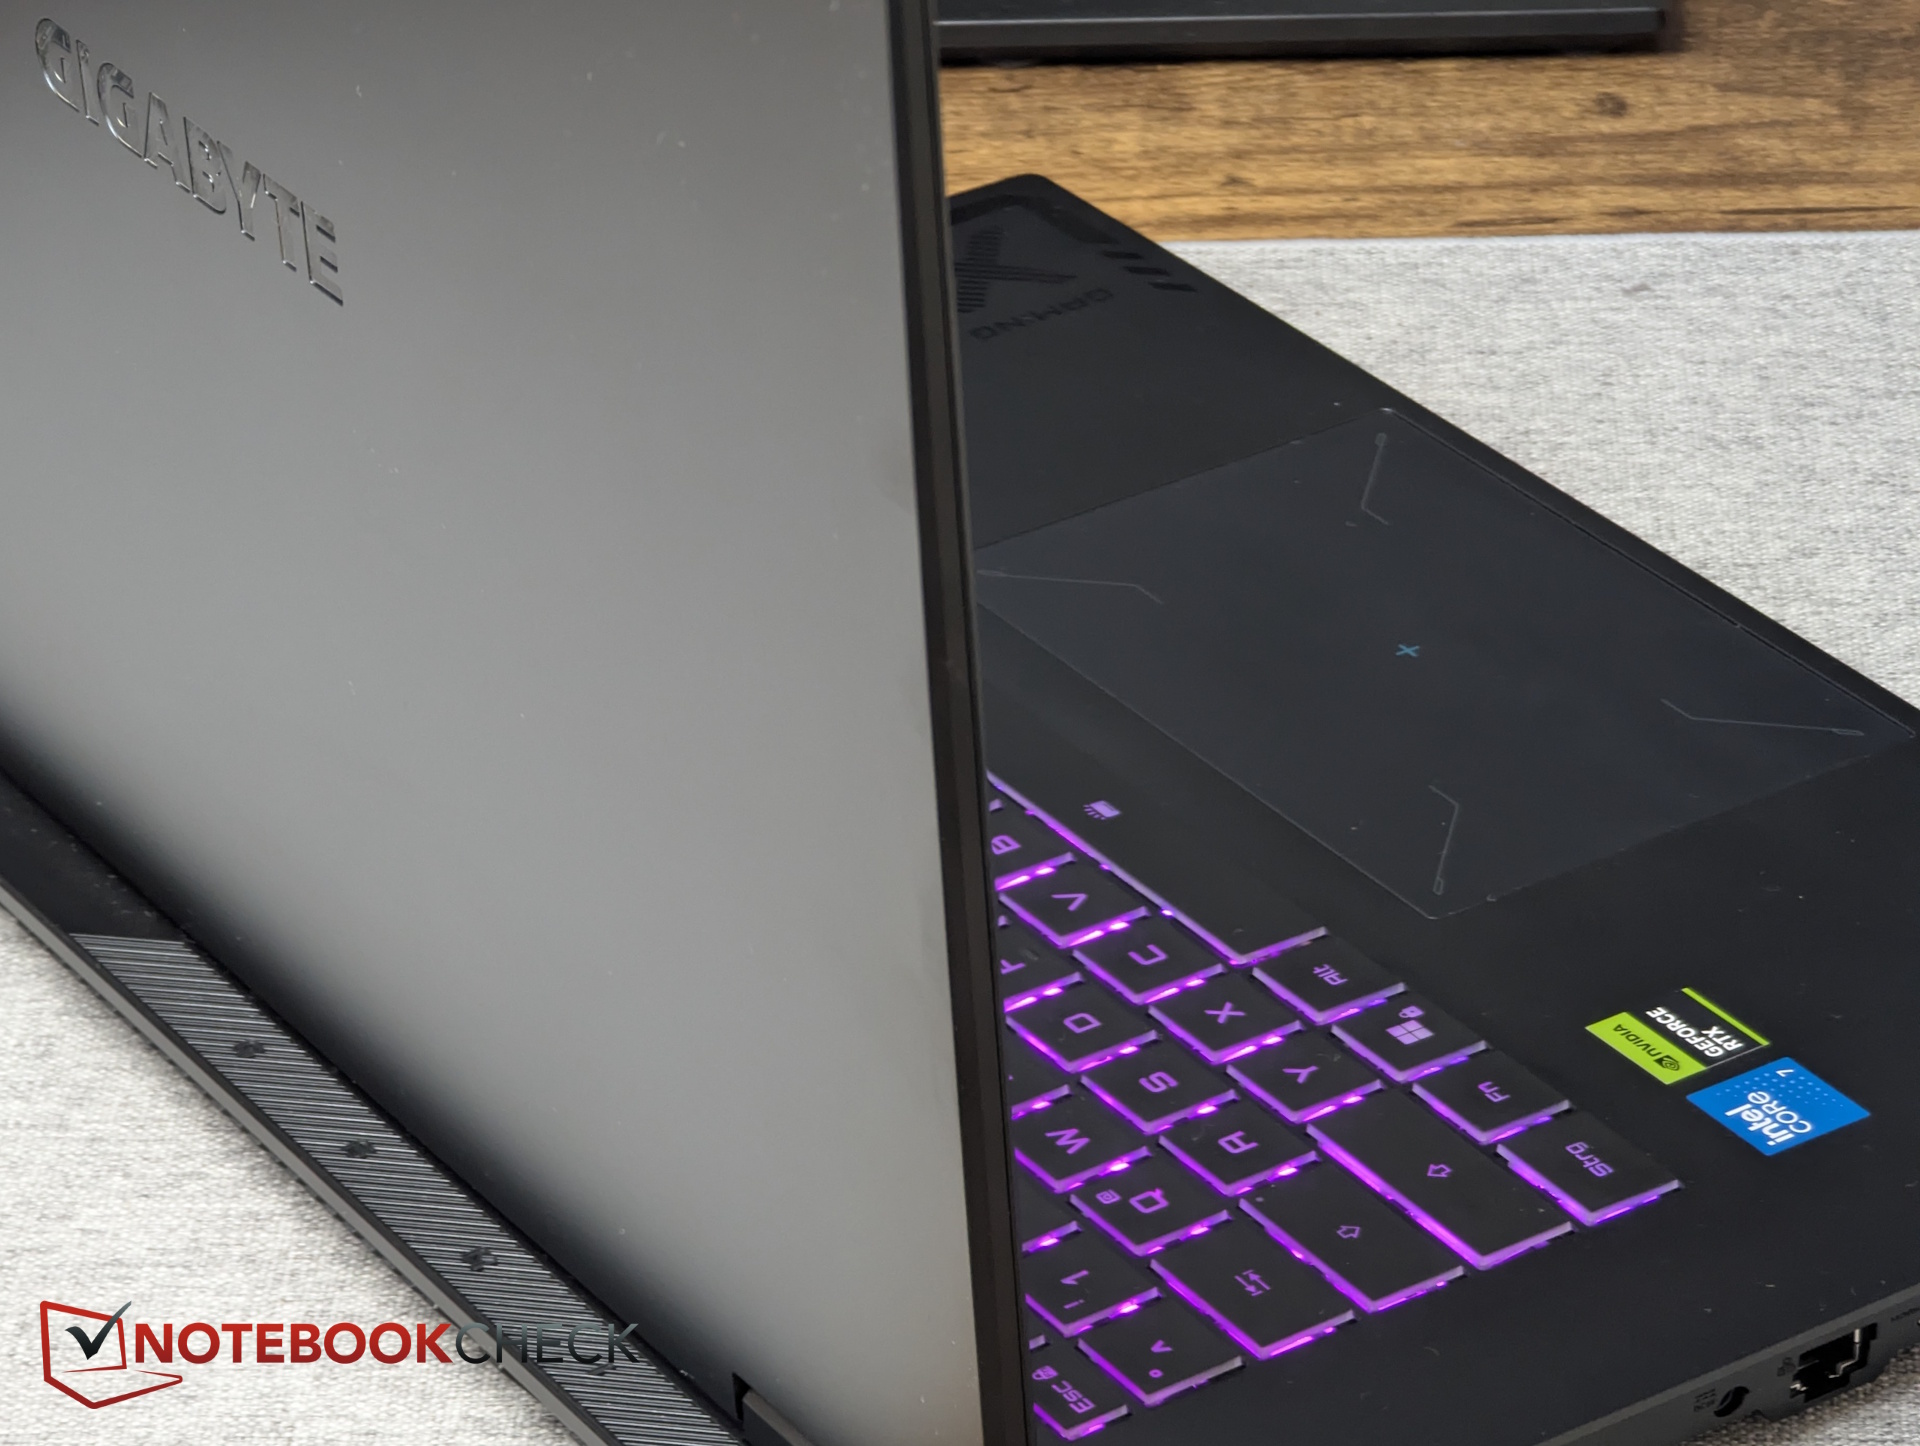
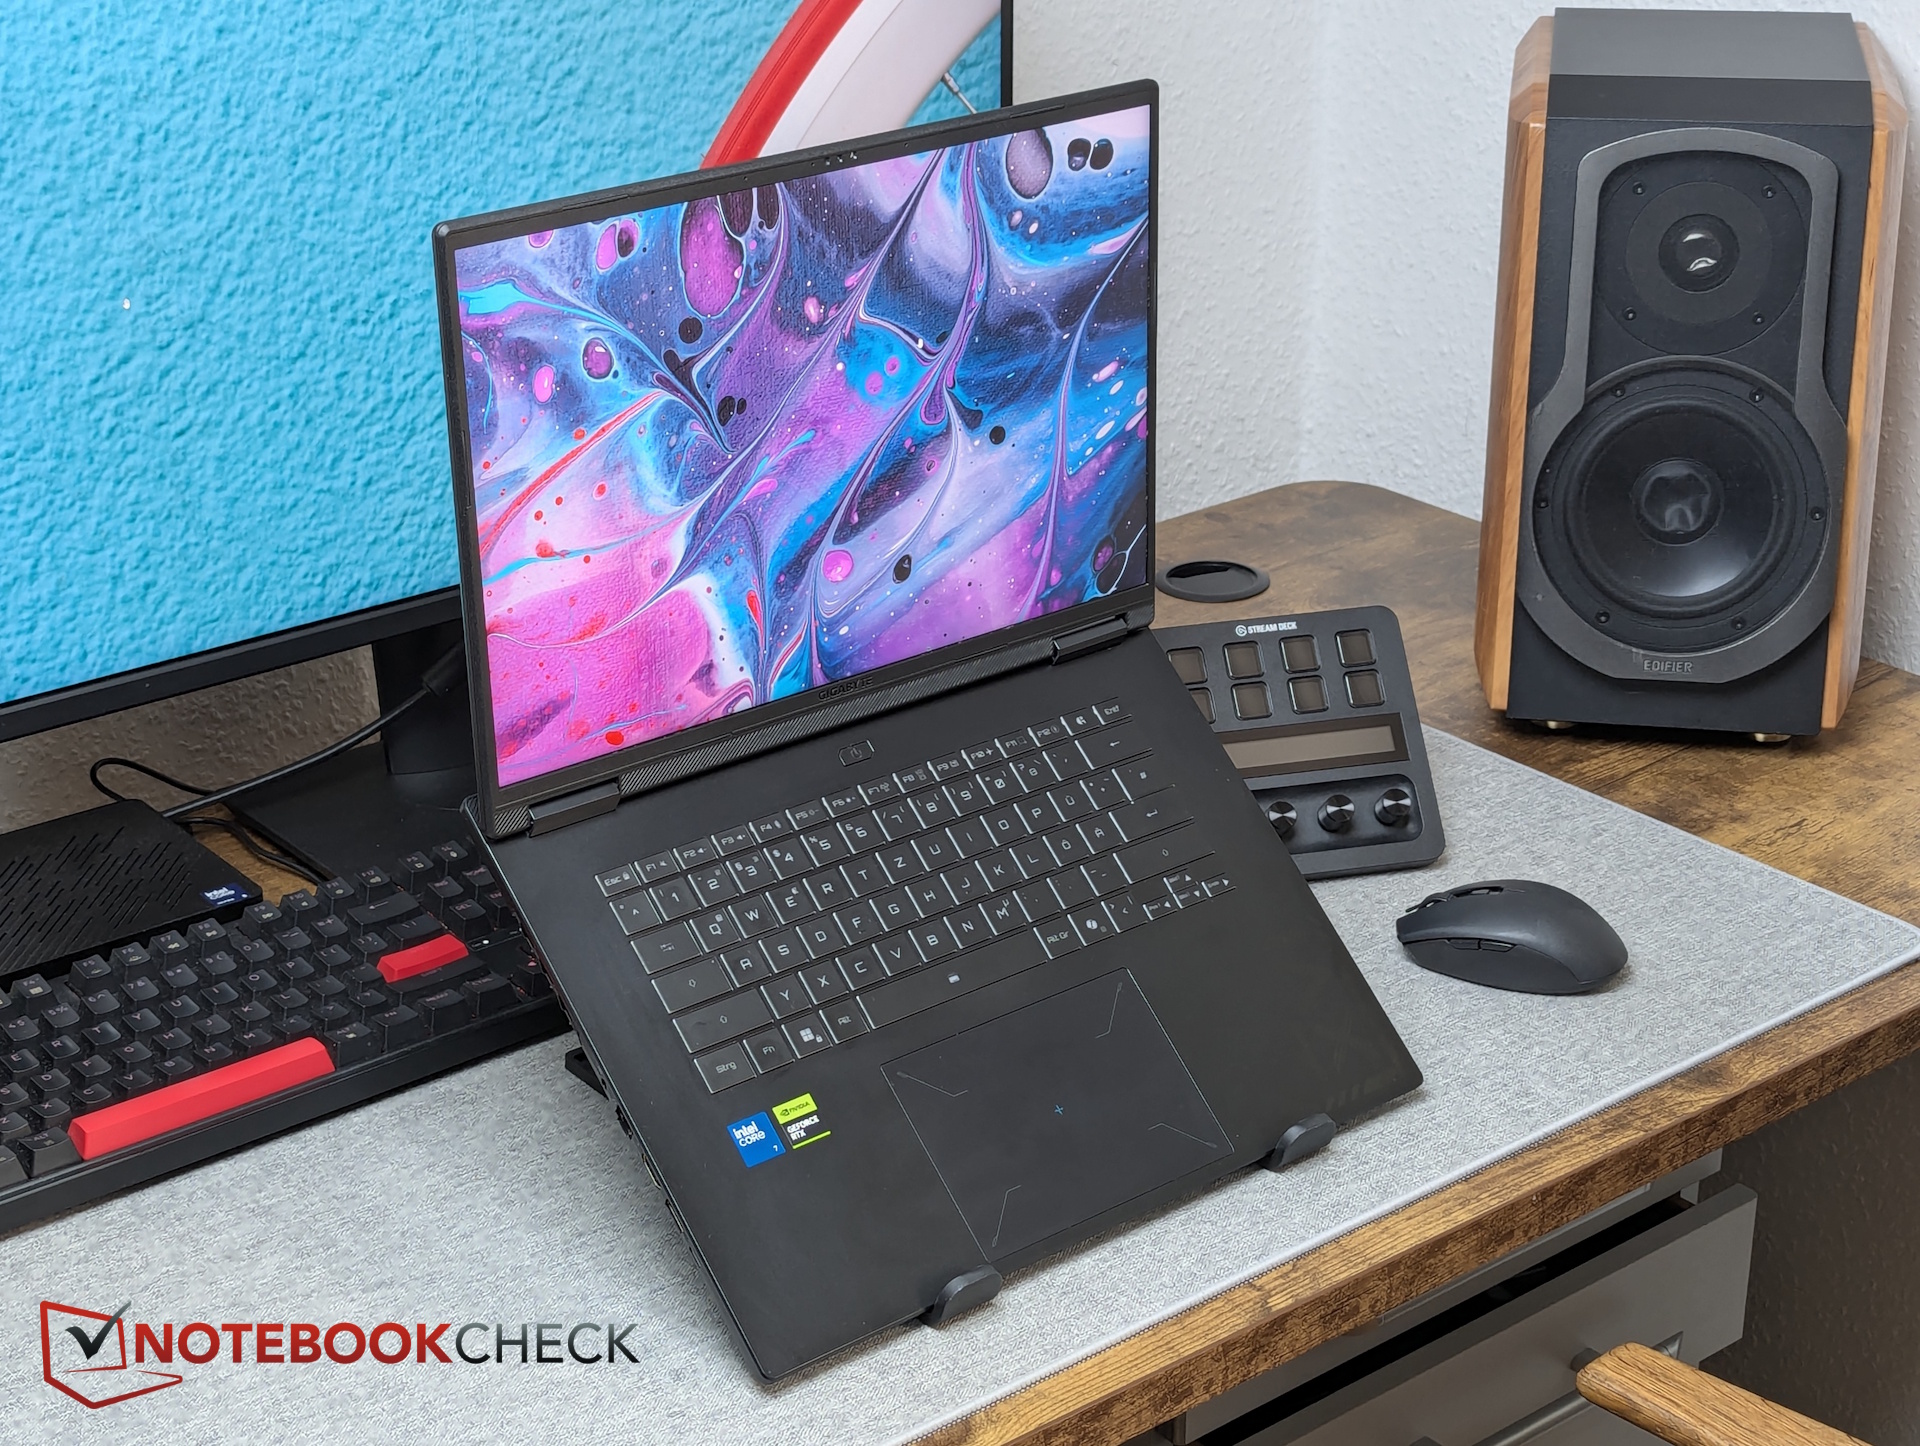
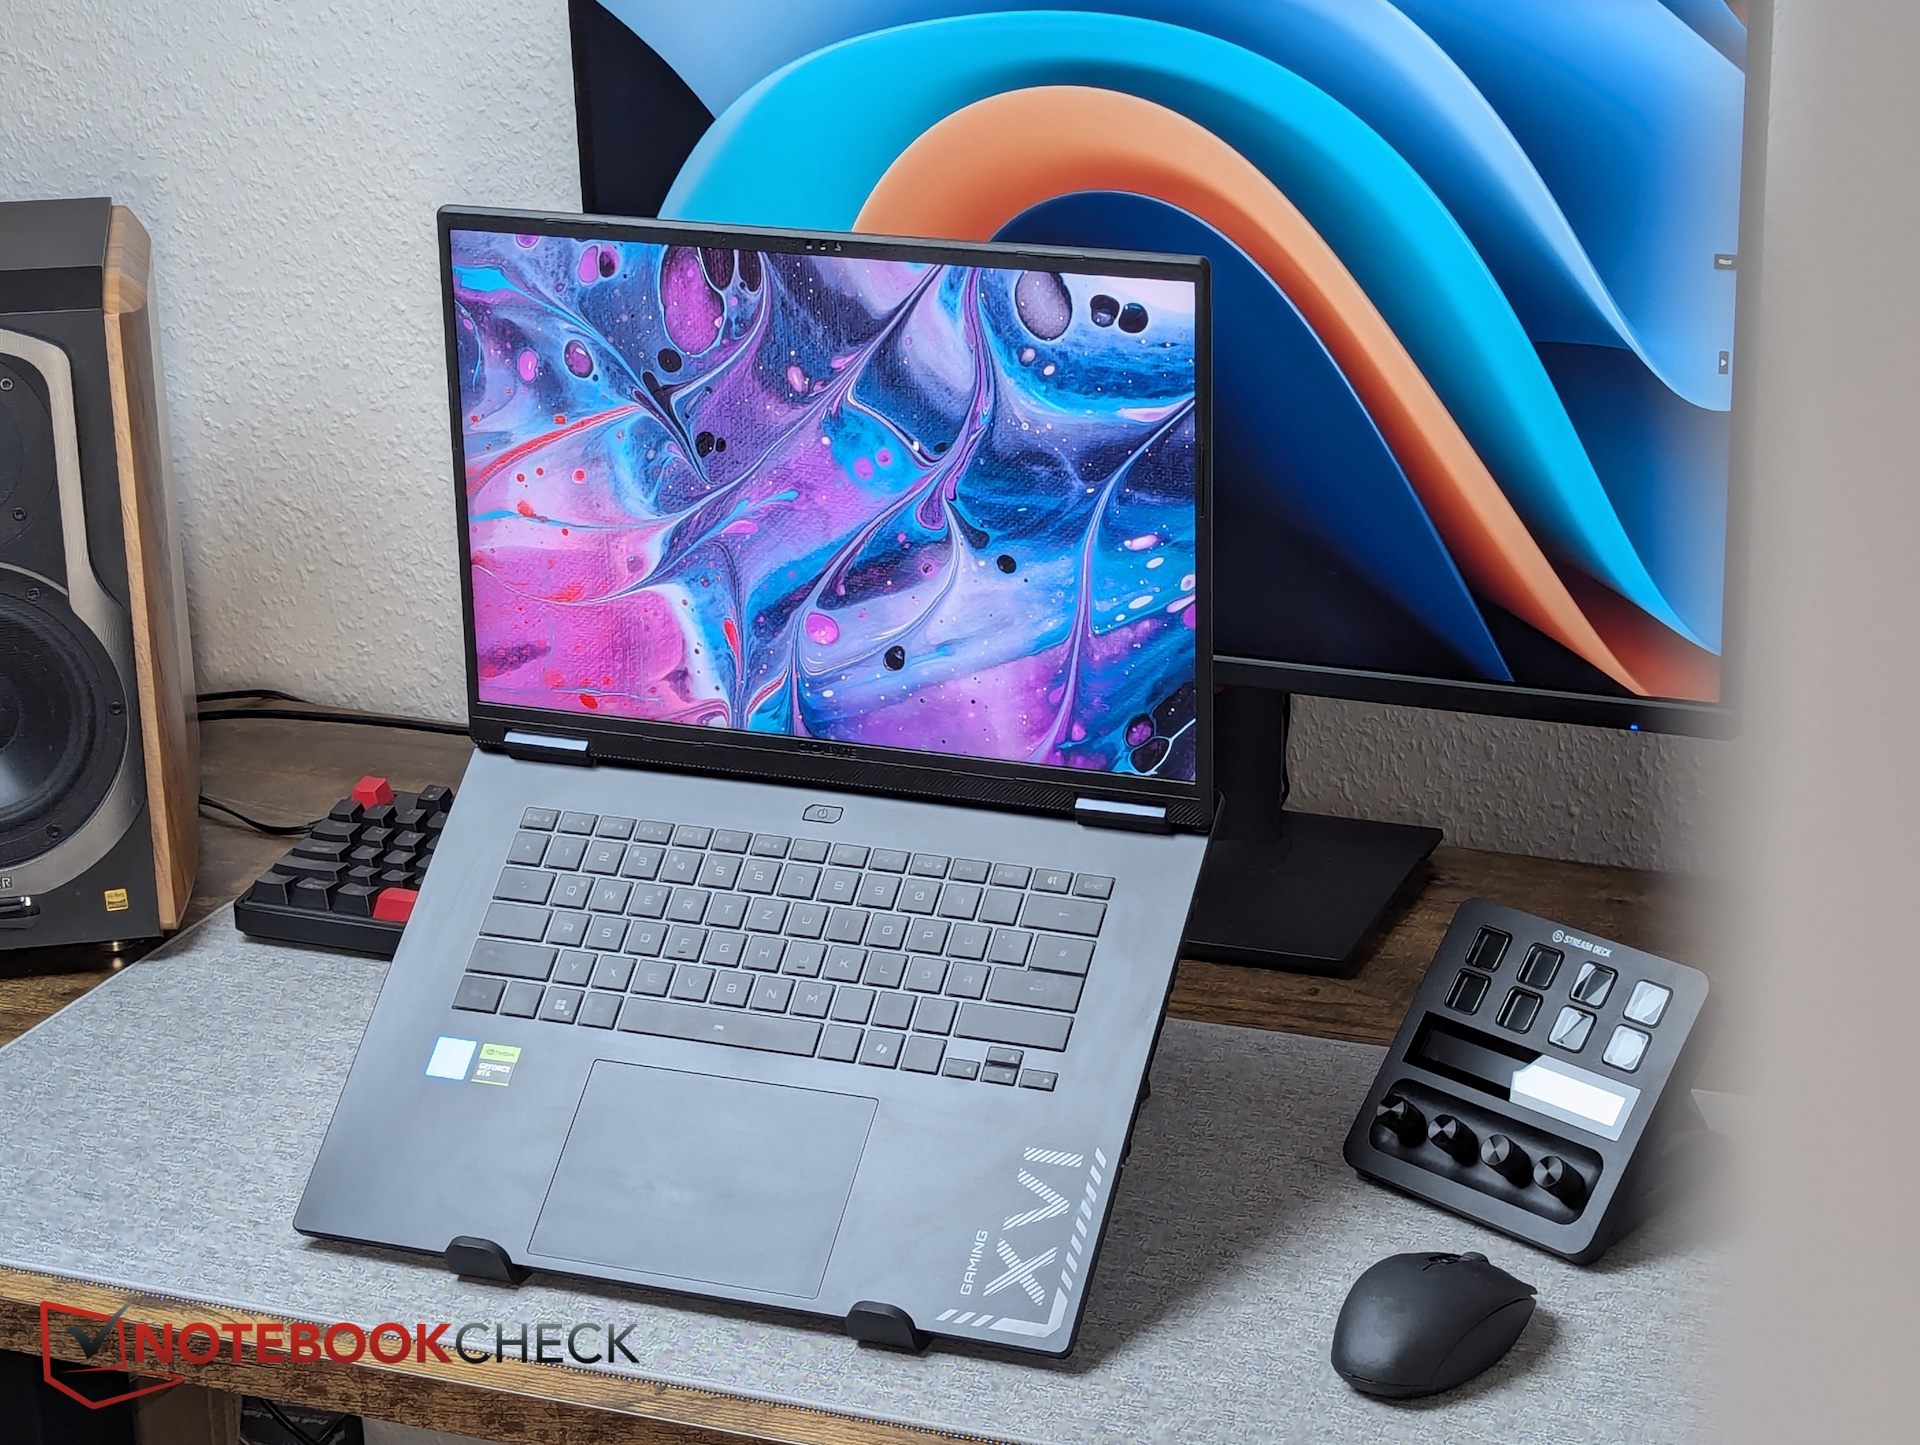
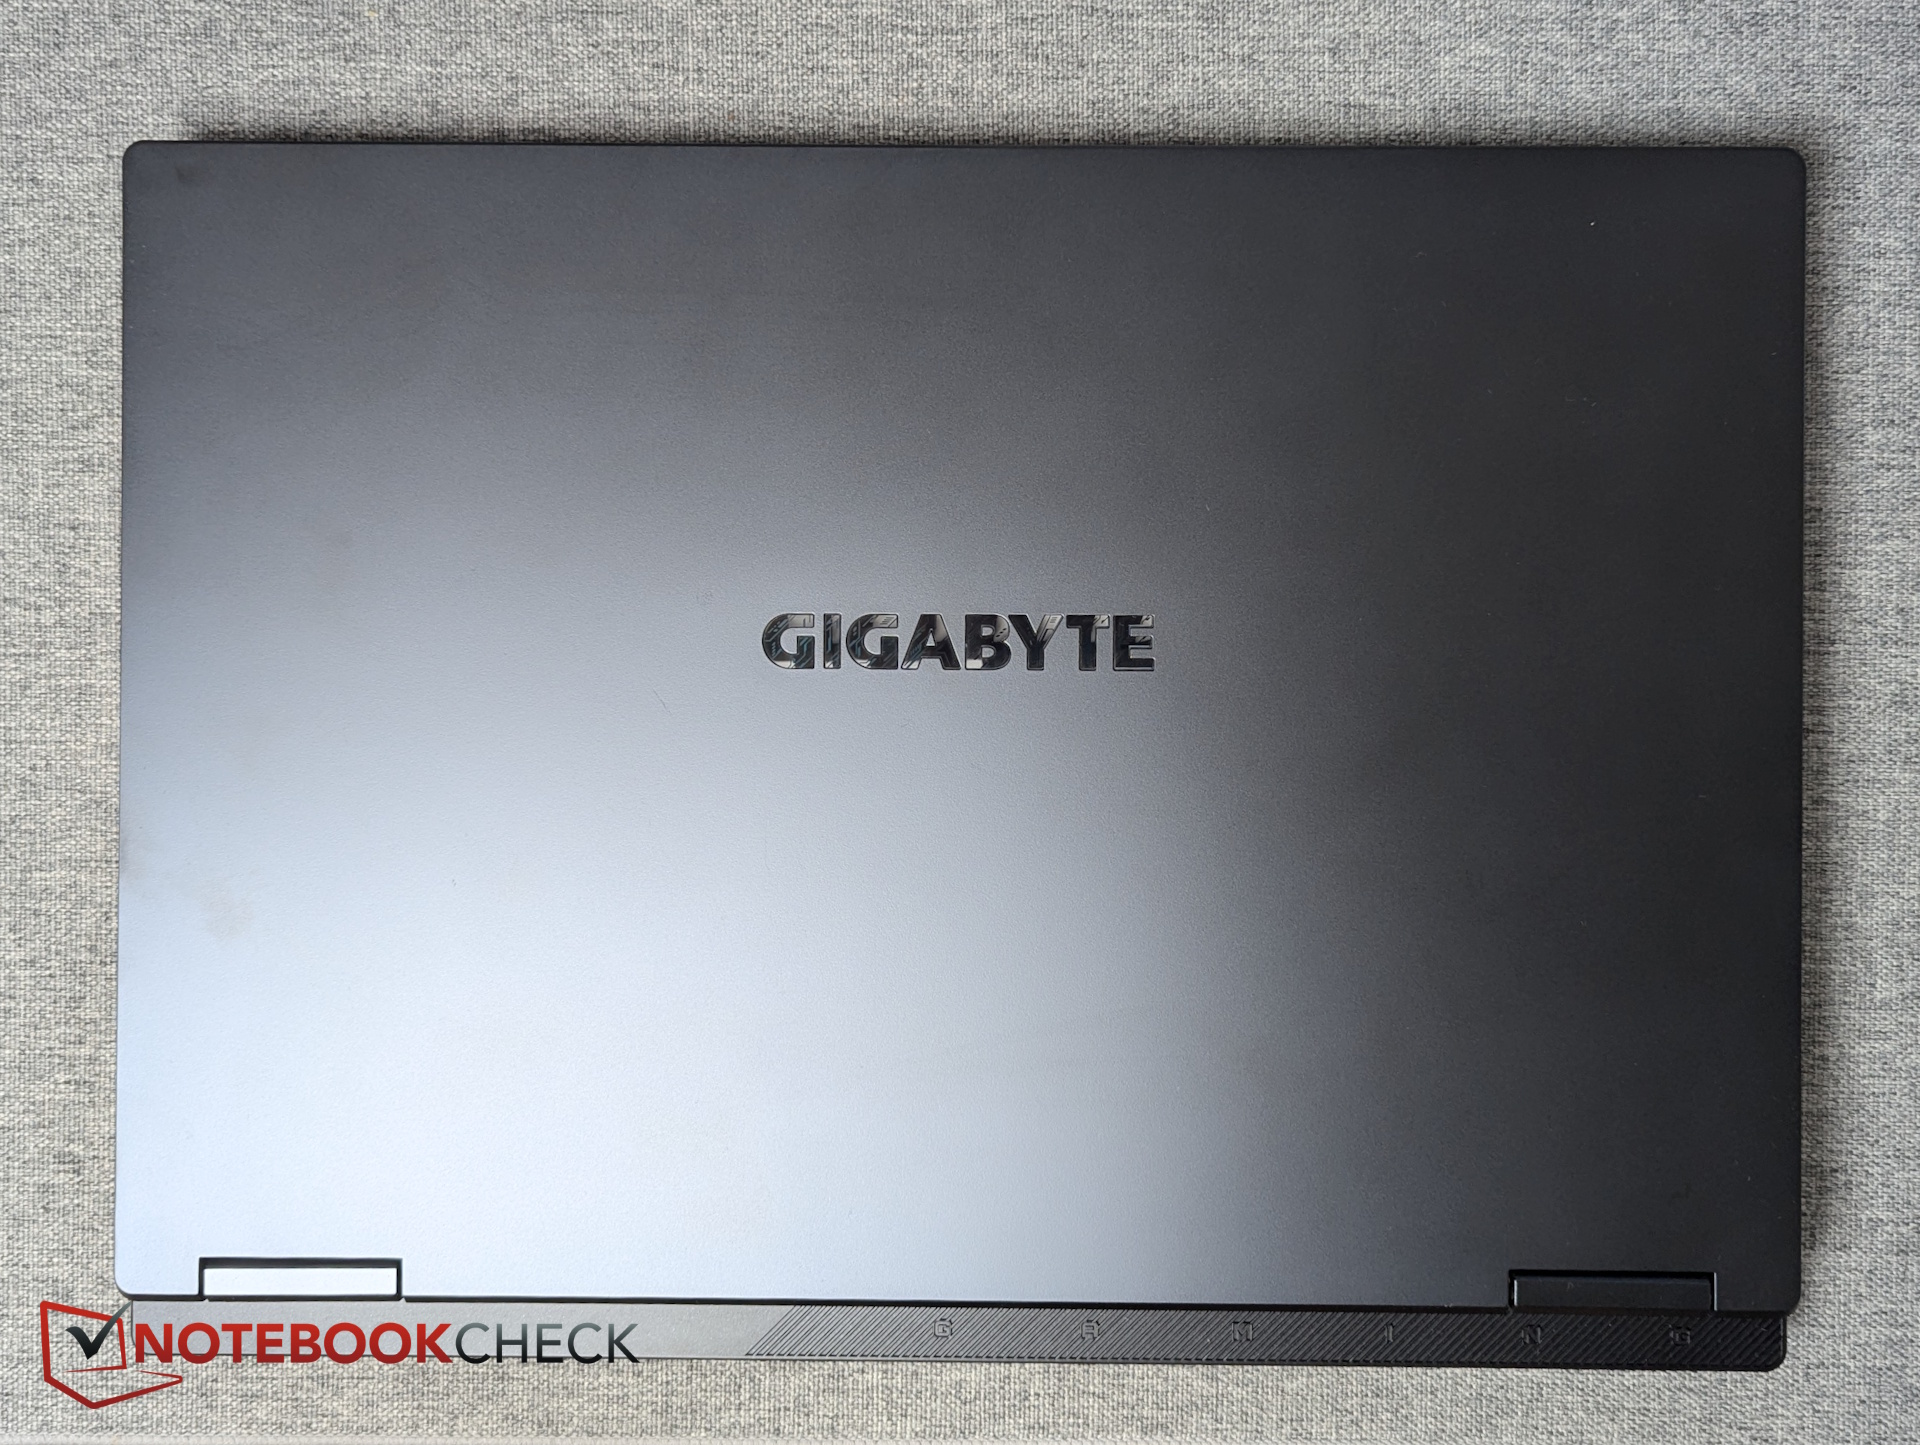
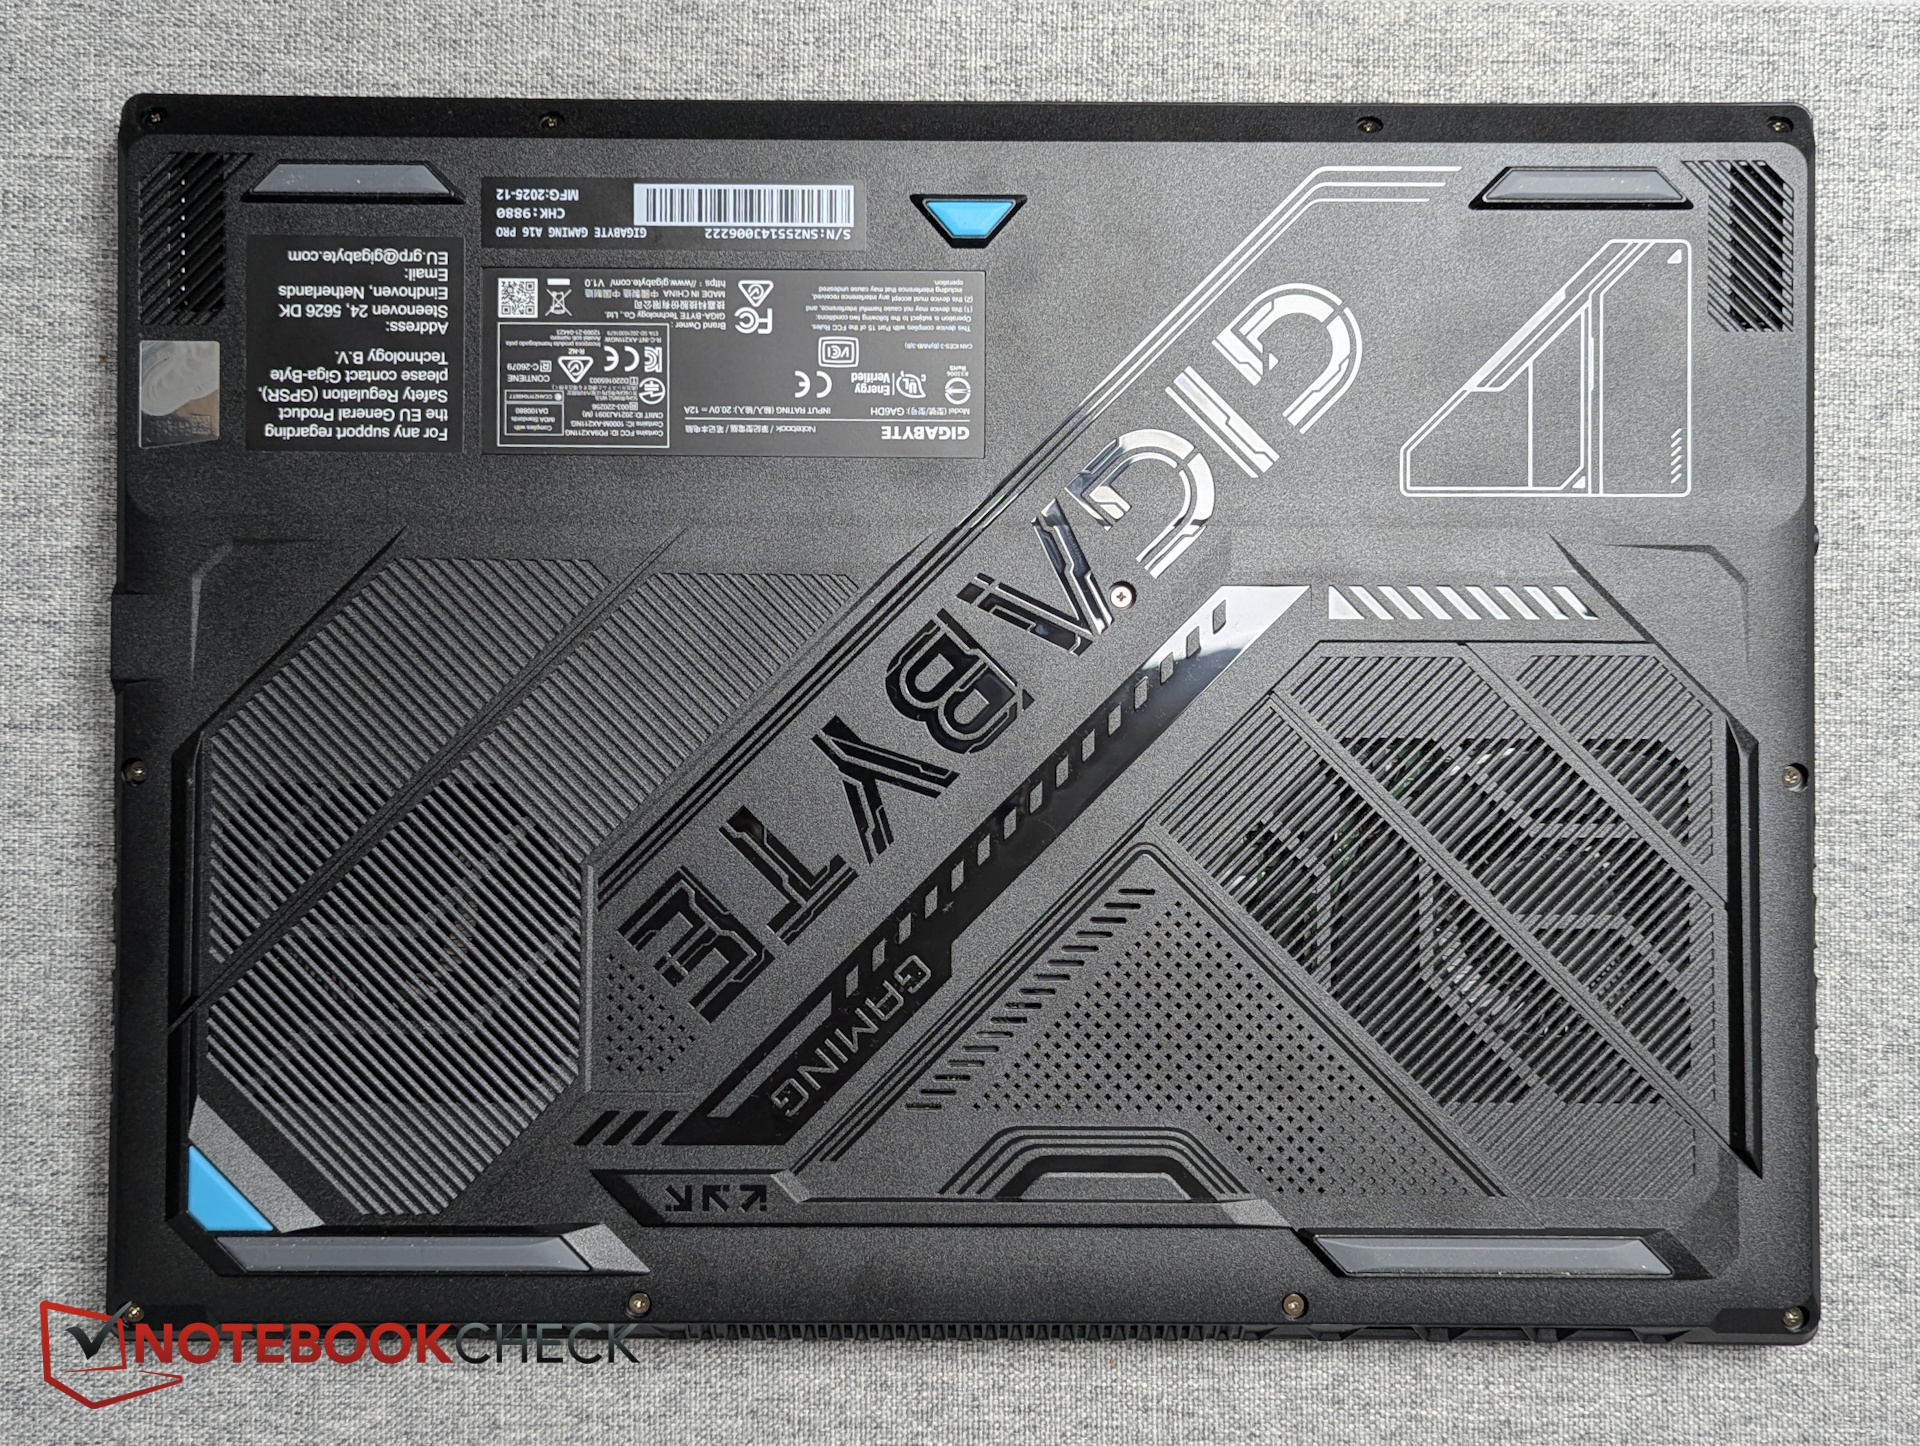
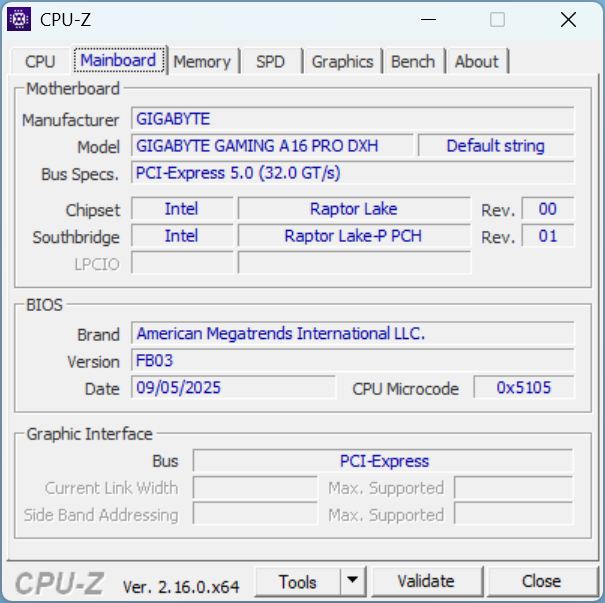
Chassis & build – Slim, but not very sturdy
The sleek, slim design is identical to last year’s non-Pro A16. The plastic used is fairly thin, allowing the black base unit to flex while producing creaking noises, especially around the ports on the left side.
The stylized bottom panel is made of particularly soft plastic, and the thin ventilation grilles can flex enough under pressure to touch the fans beneath.
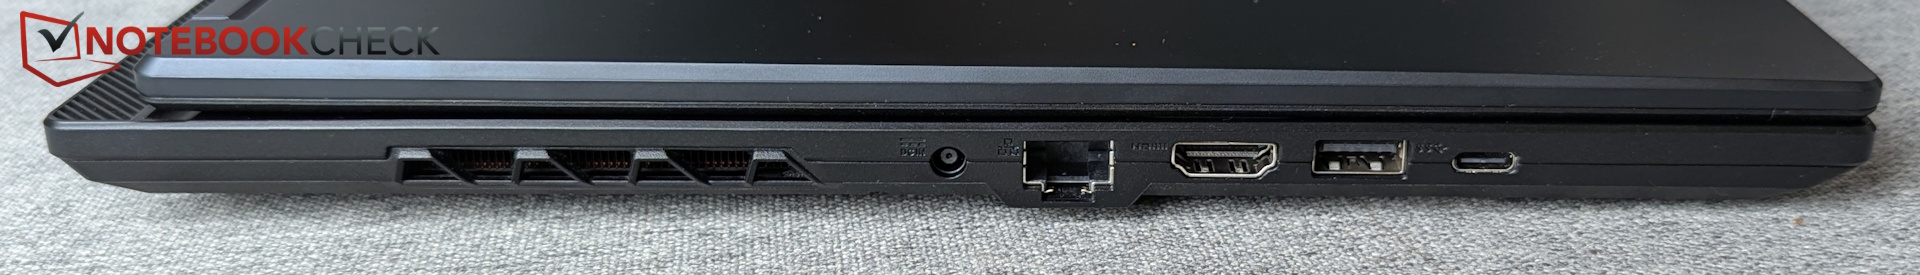
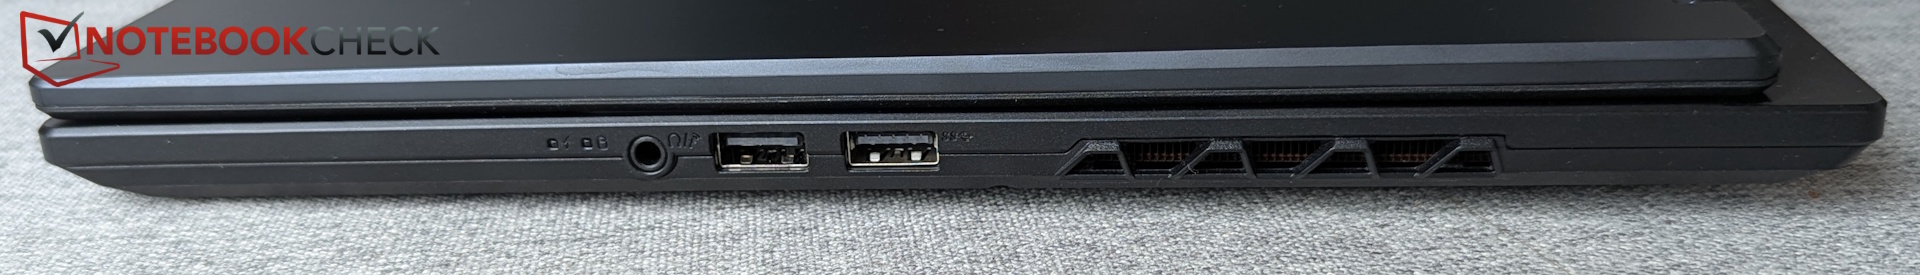
Ports
Despite the “Pro” label, the device still includes USB 2.0, but lacks Thunderbolt, USB 4, USB 3.2 Gen 2, or even an SD card reader.
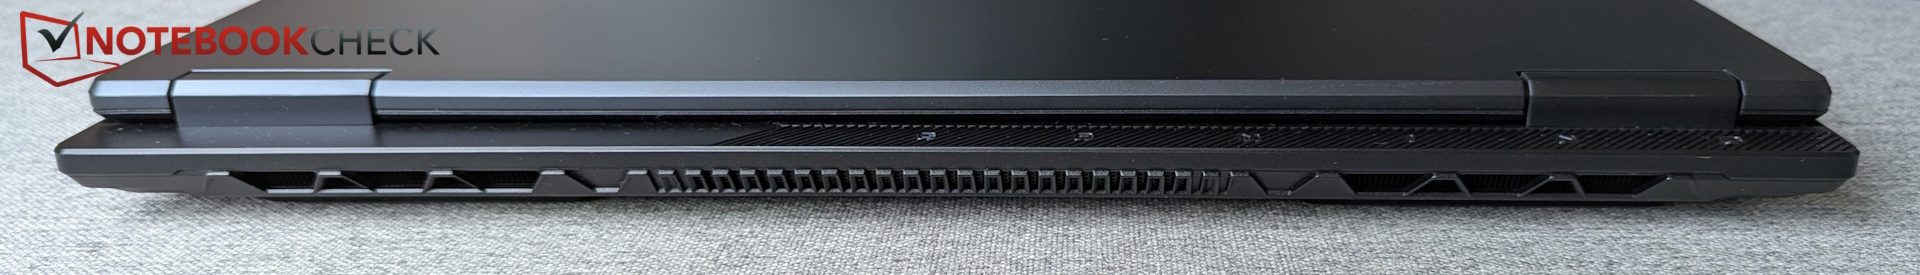
There are no ports on the rear, and due to side-mounted exhaust vents, all connections are positioned quite far forward—potentially interfering with mouse use.
Webcam
The A16 Pro features an FHD (1080p) IR webcam with Windows Hello support, but no physical shutter. Color accuracy is fairly poor, though sharpness is acceptable.

 GeForce RTX 5070 Ti Laptop, Core 7 240H, Samsung PM9C1b MZVL81T0HFLB-00BTW")
 GeForce RTX 5070 Ti Laptop, Core 7 240H, Samsung PM9C1b MZVL81T0HFLB-00BTW")
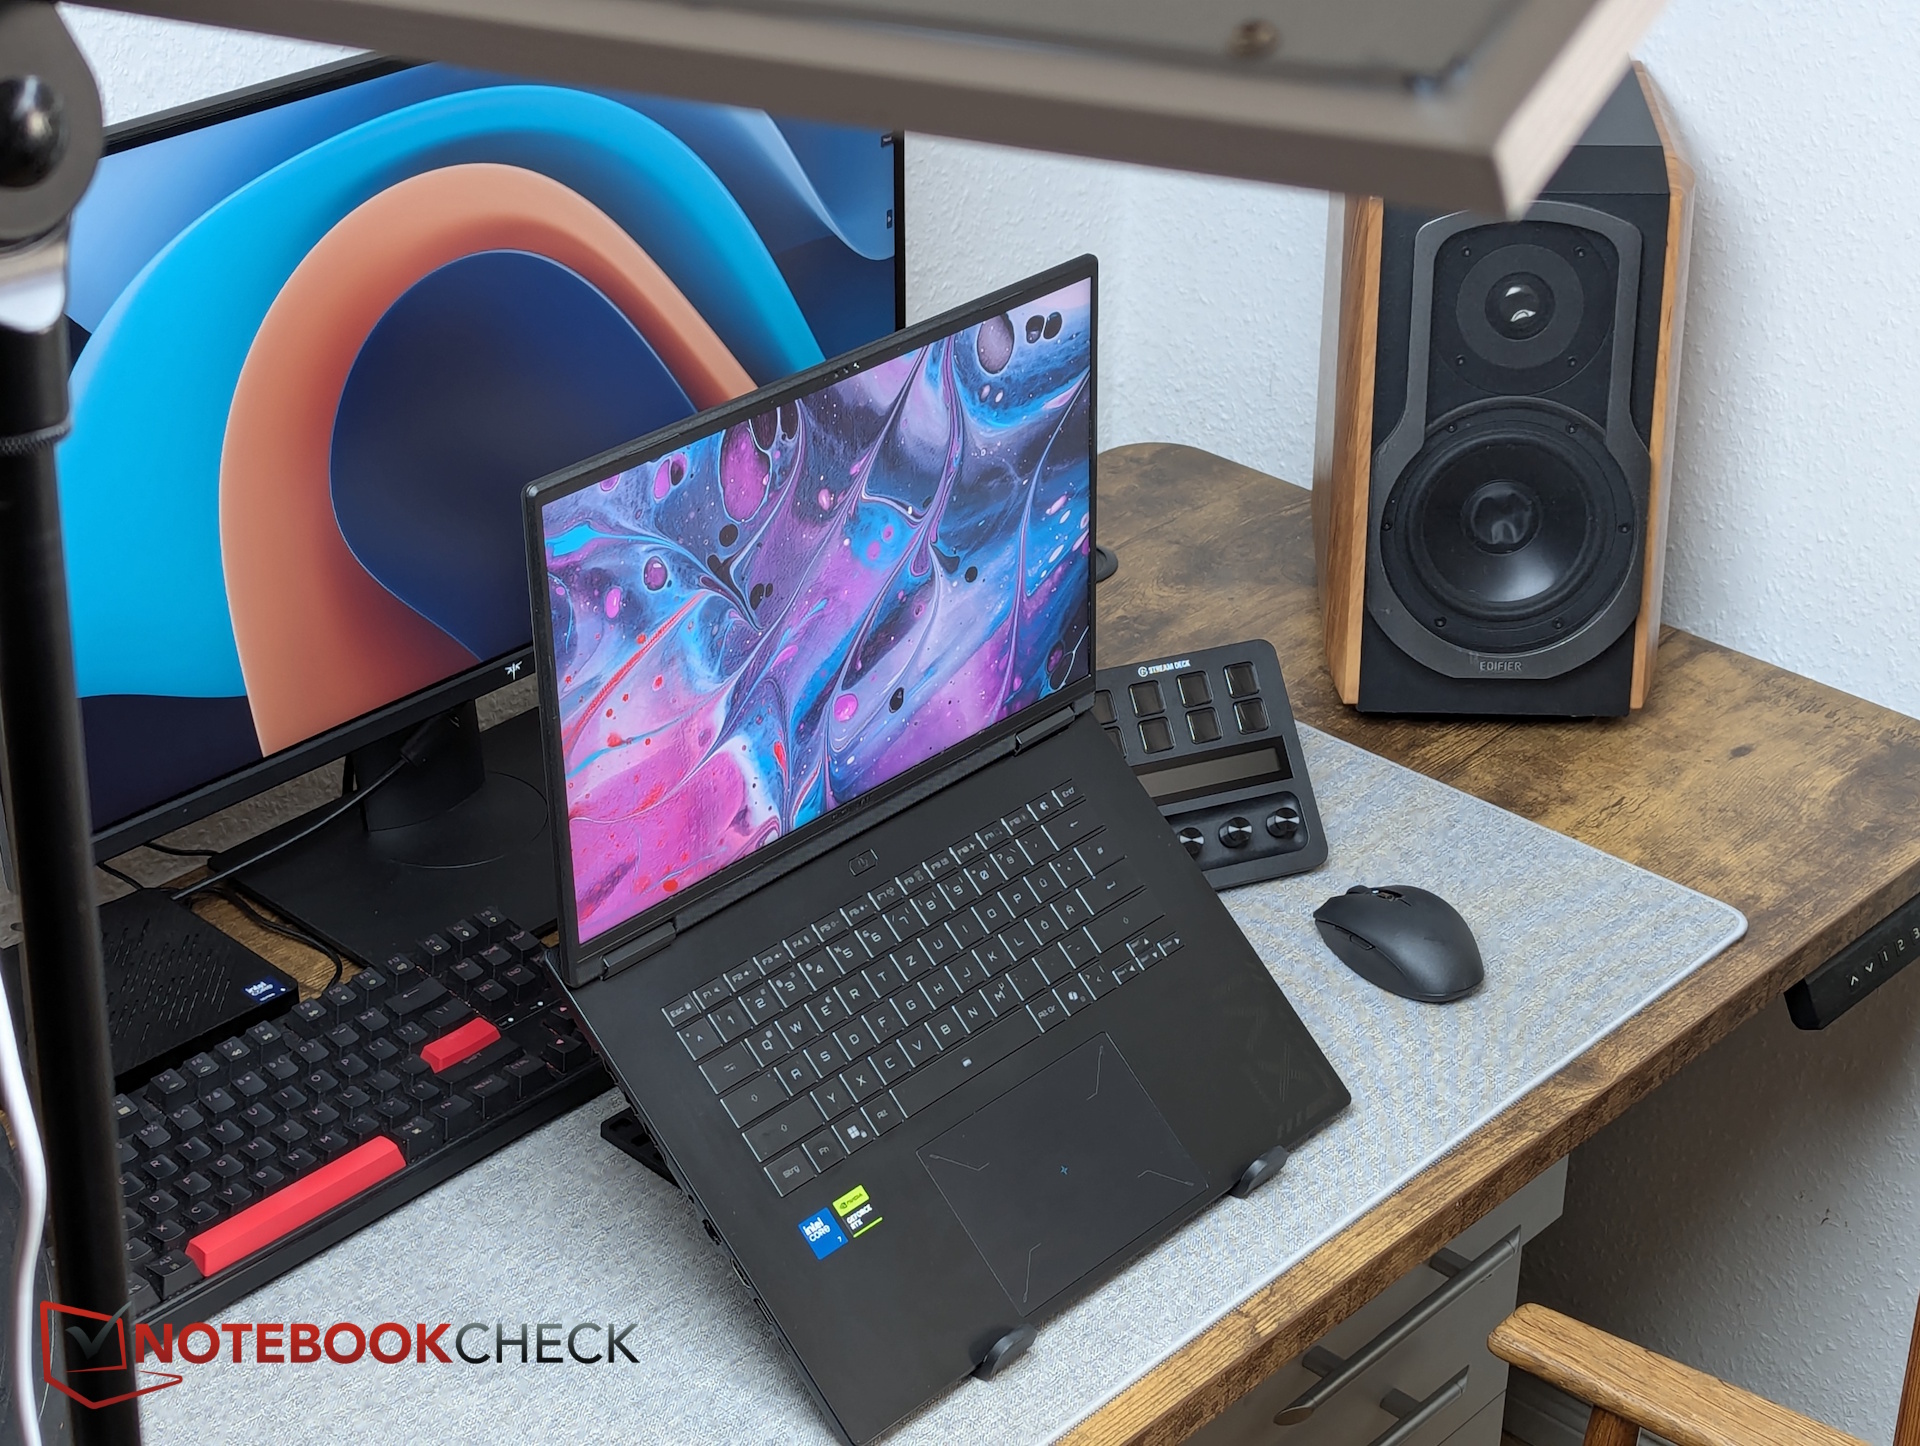
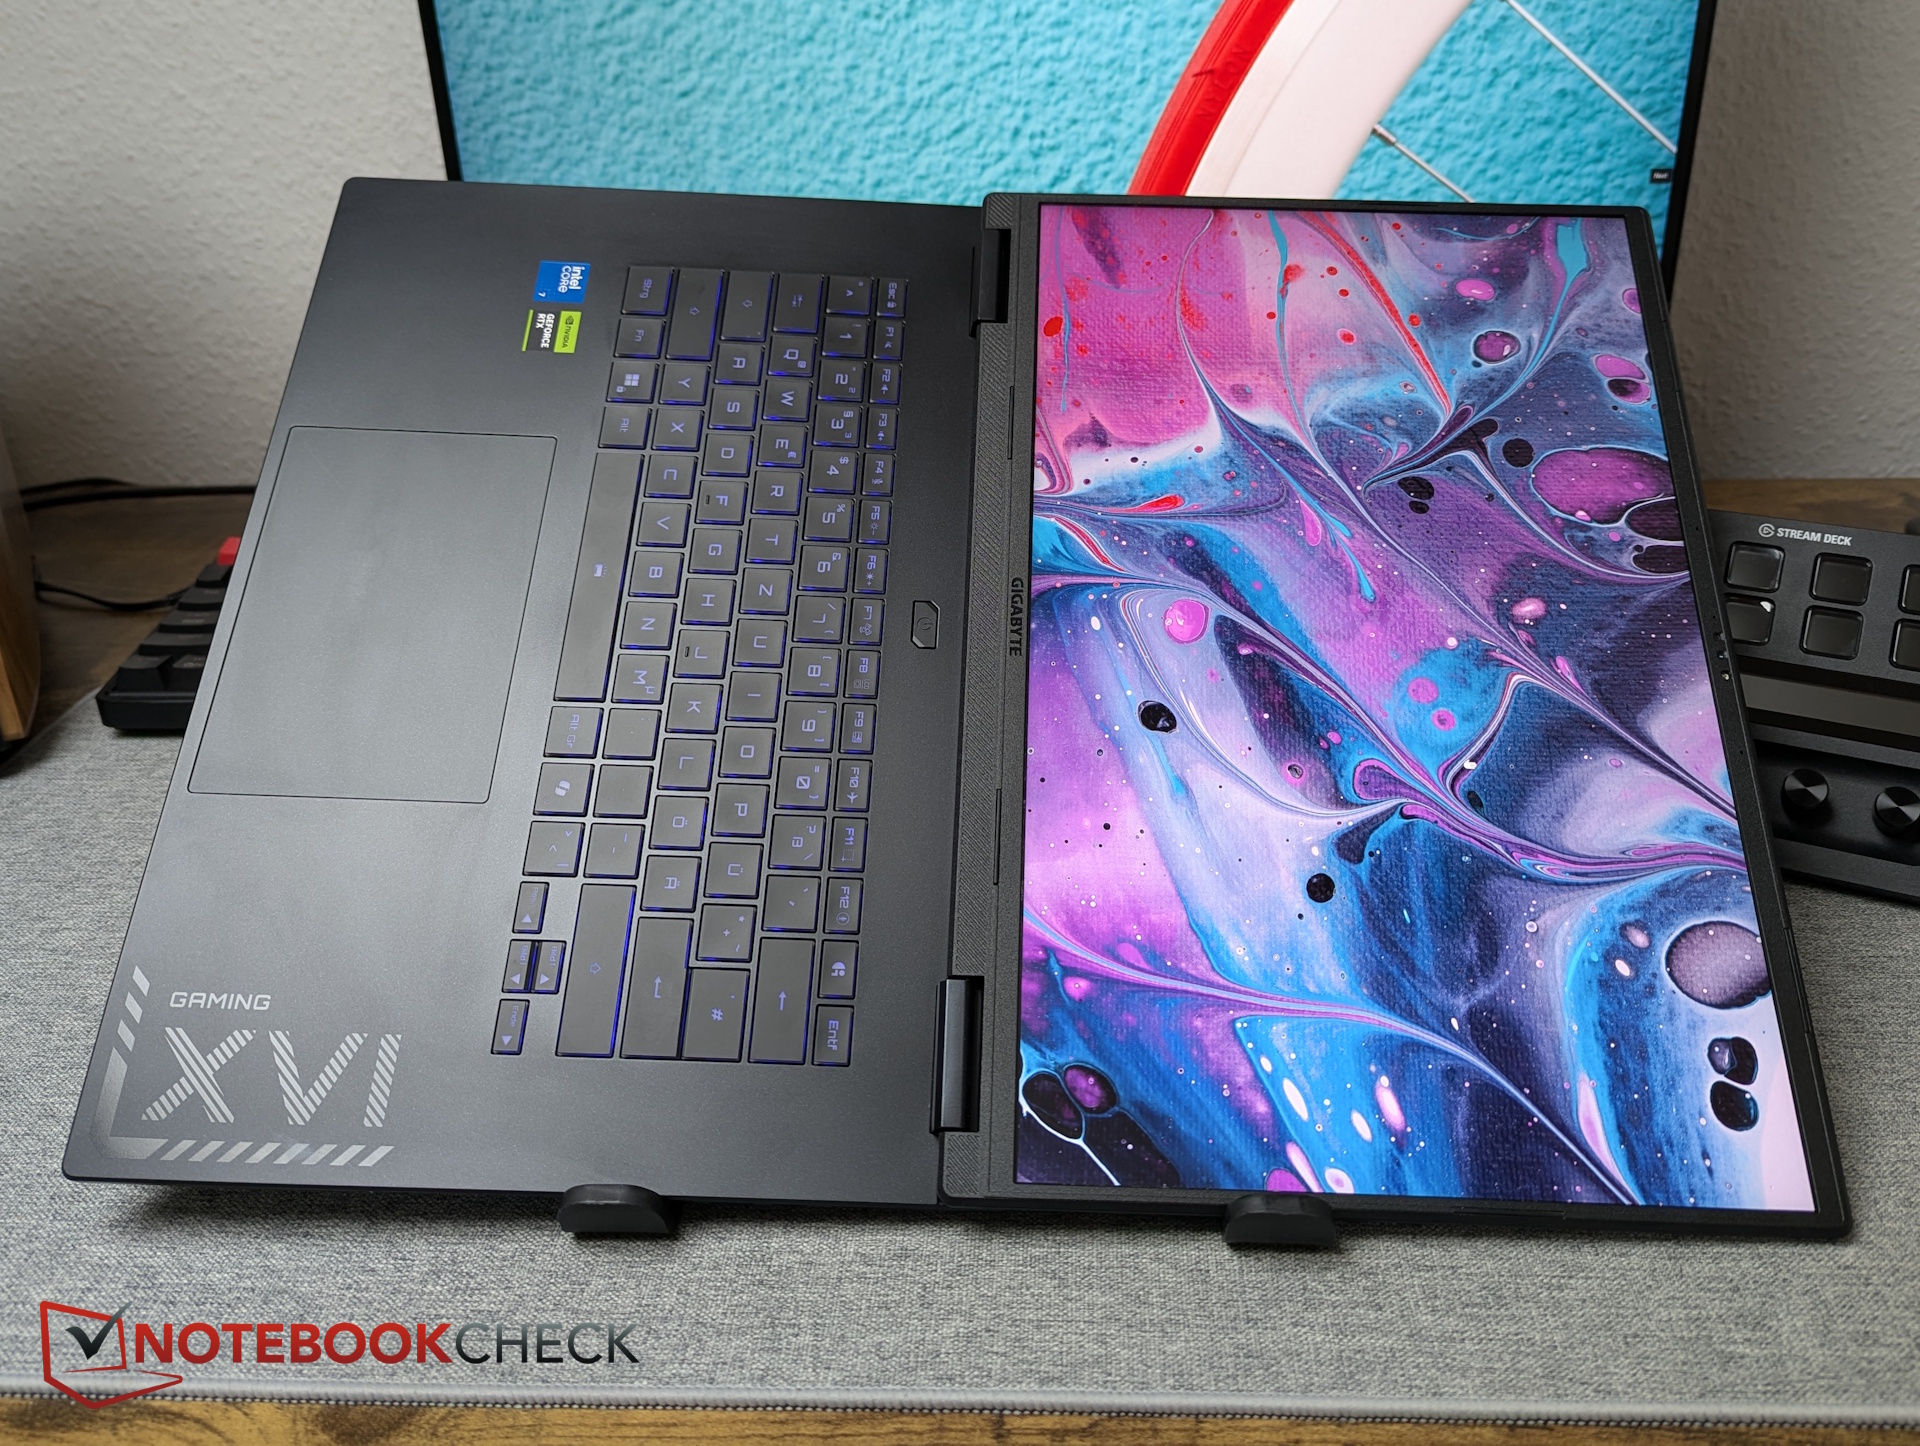
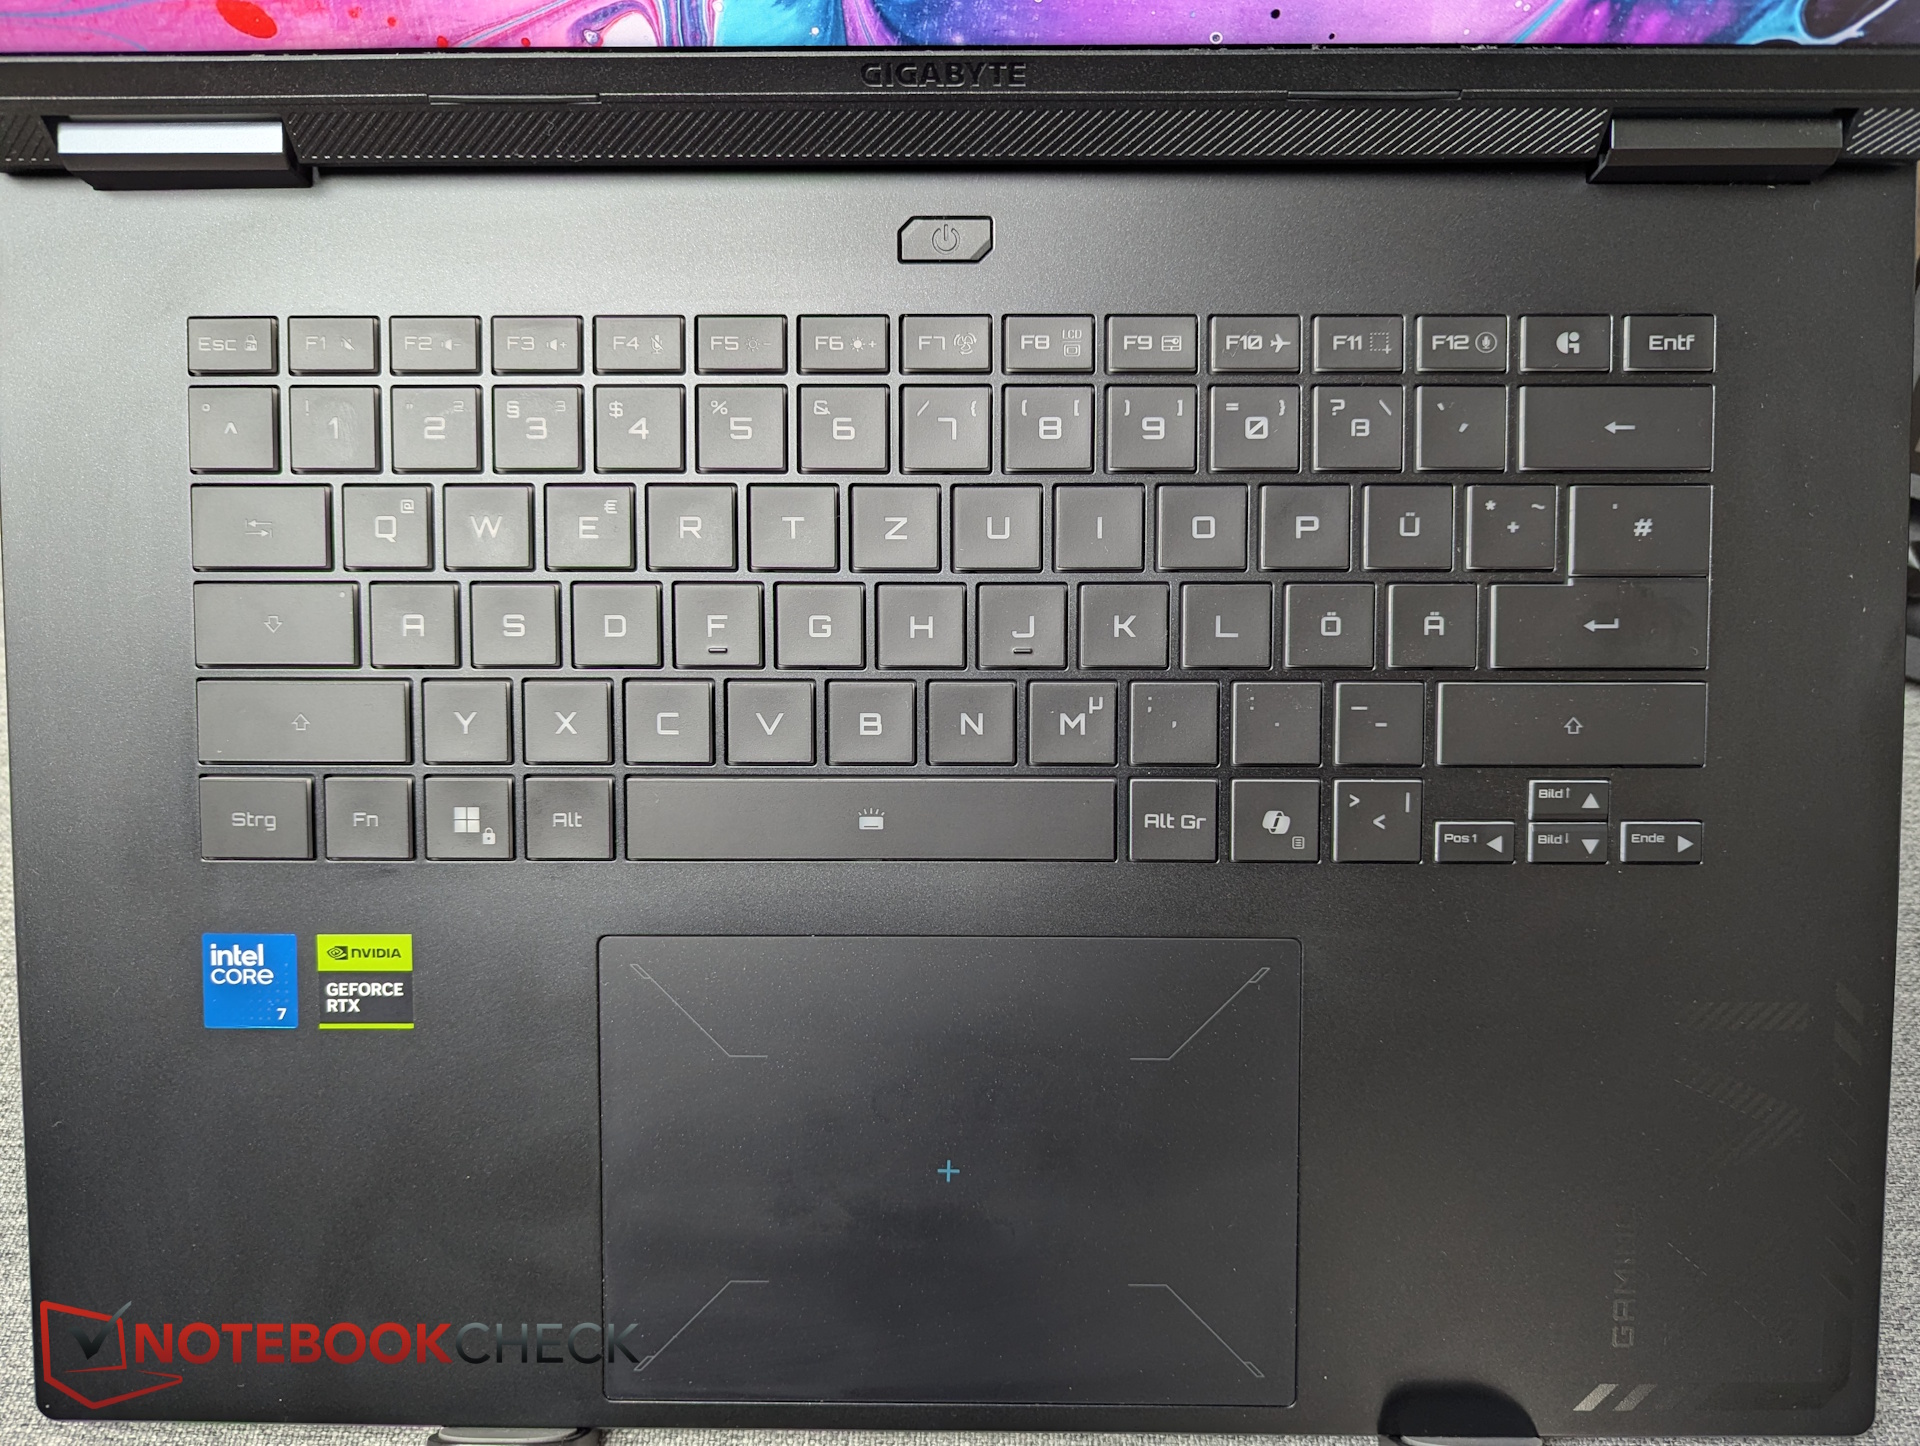
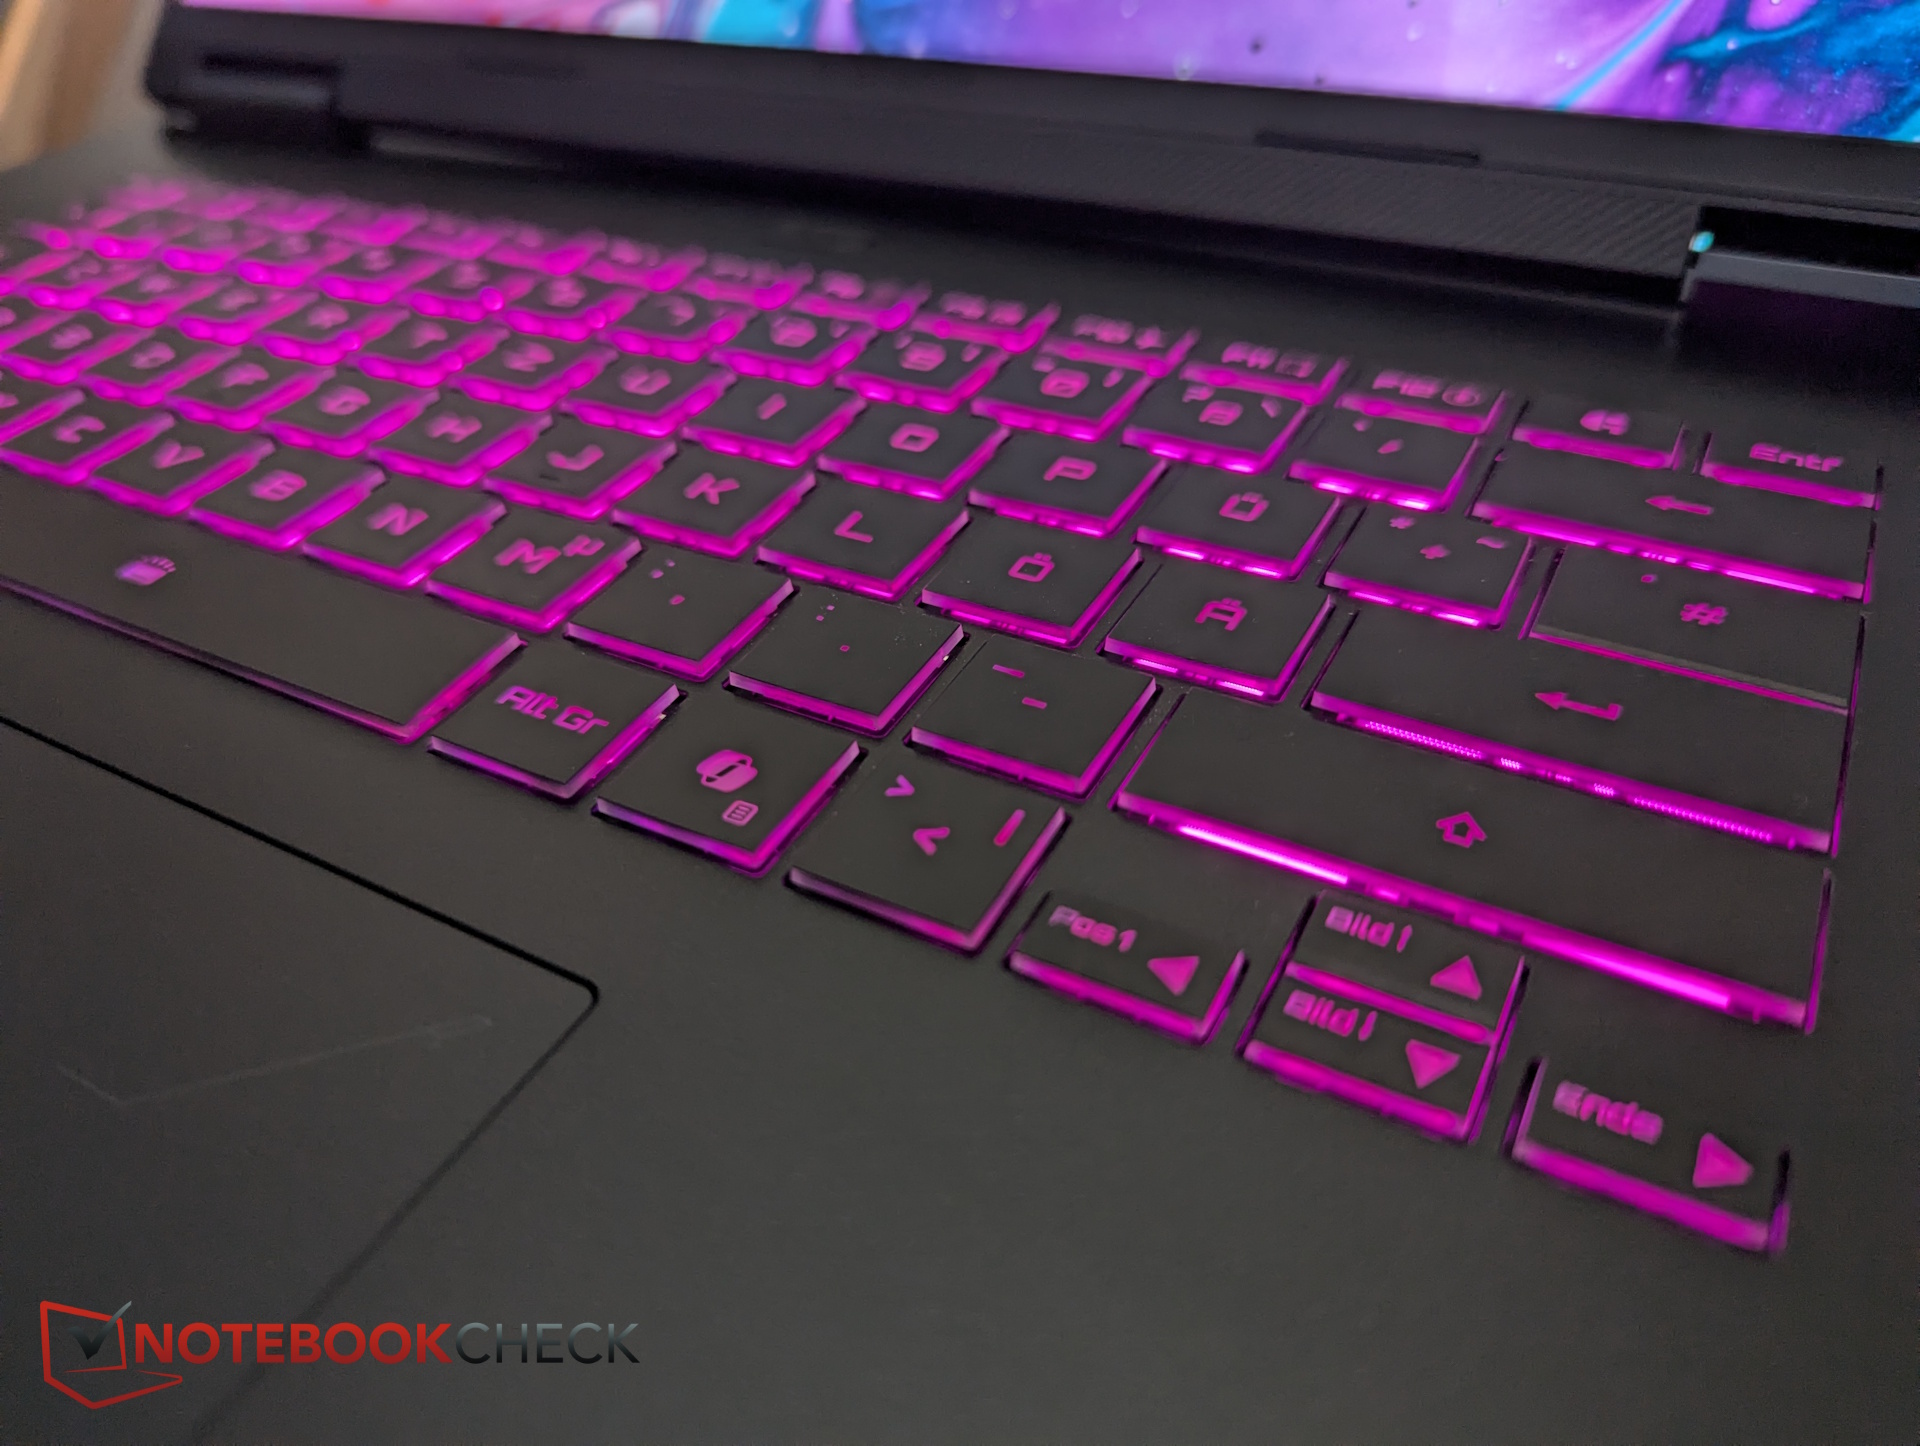
Input devices – Reliable typing and navigation
The A16 Pro does not include a numpad, but the layout feels clean and well-organized. The arrow keys, however, are quite small.
Key travel is sufficient, though the feedback could be crisper (as seen with the spacebar and Enter key). Typing is still fast and relatively quiet.
At roughly 13.3 × 9 cm, the touchpad is generously sized. The integrated buttons respond reliably with solid feedback and moderate noise.
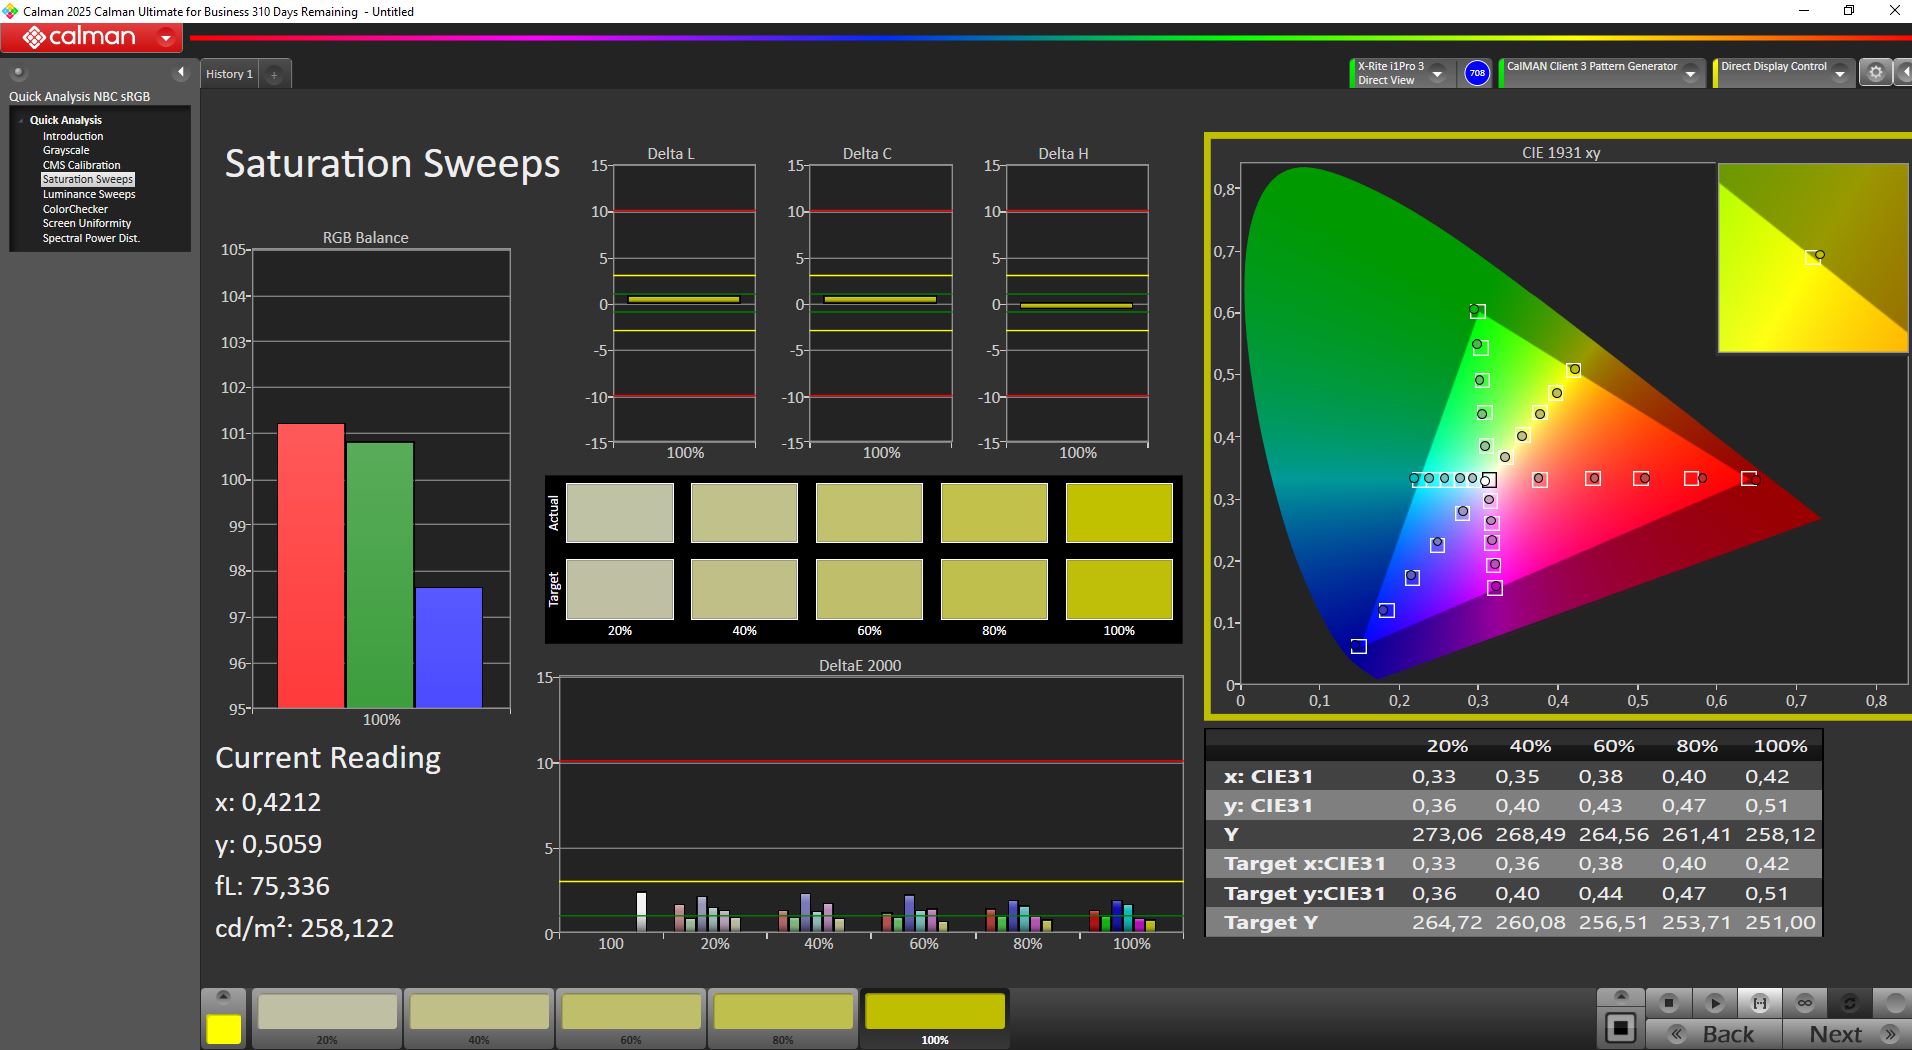
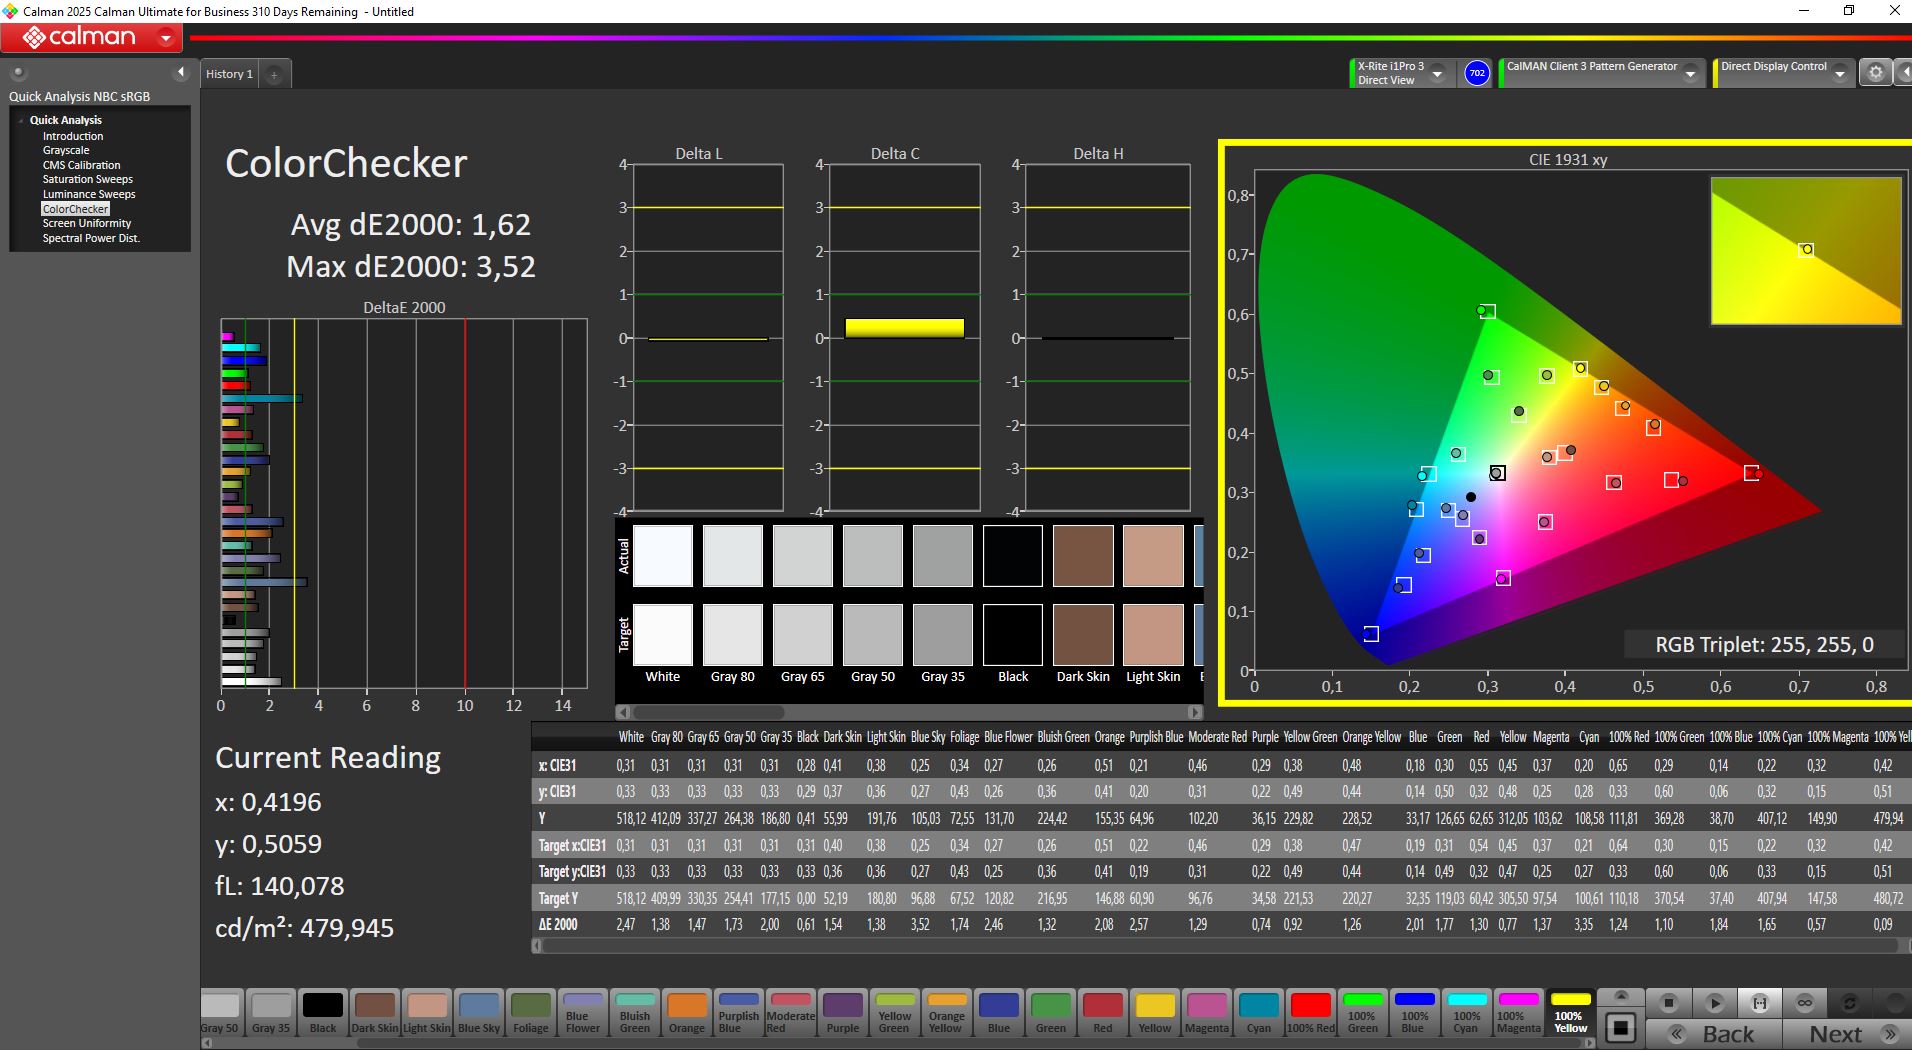
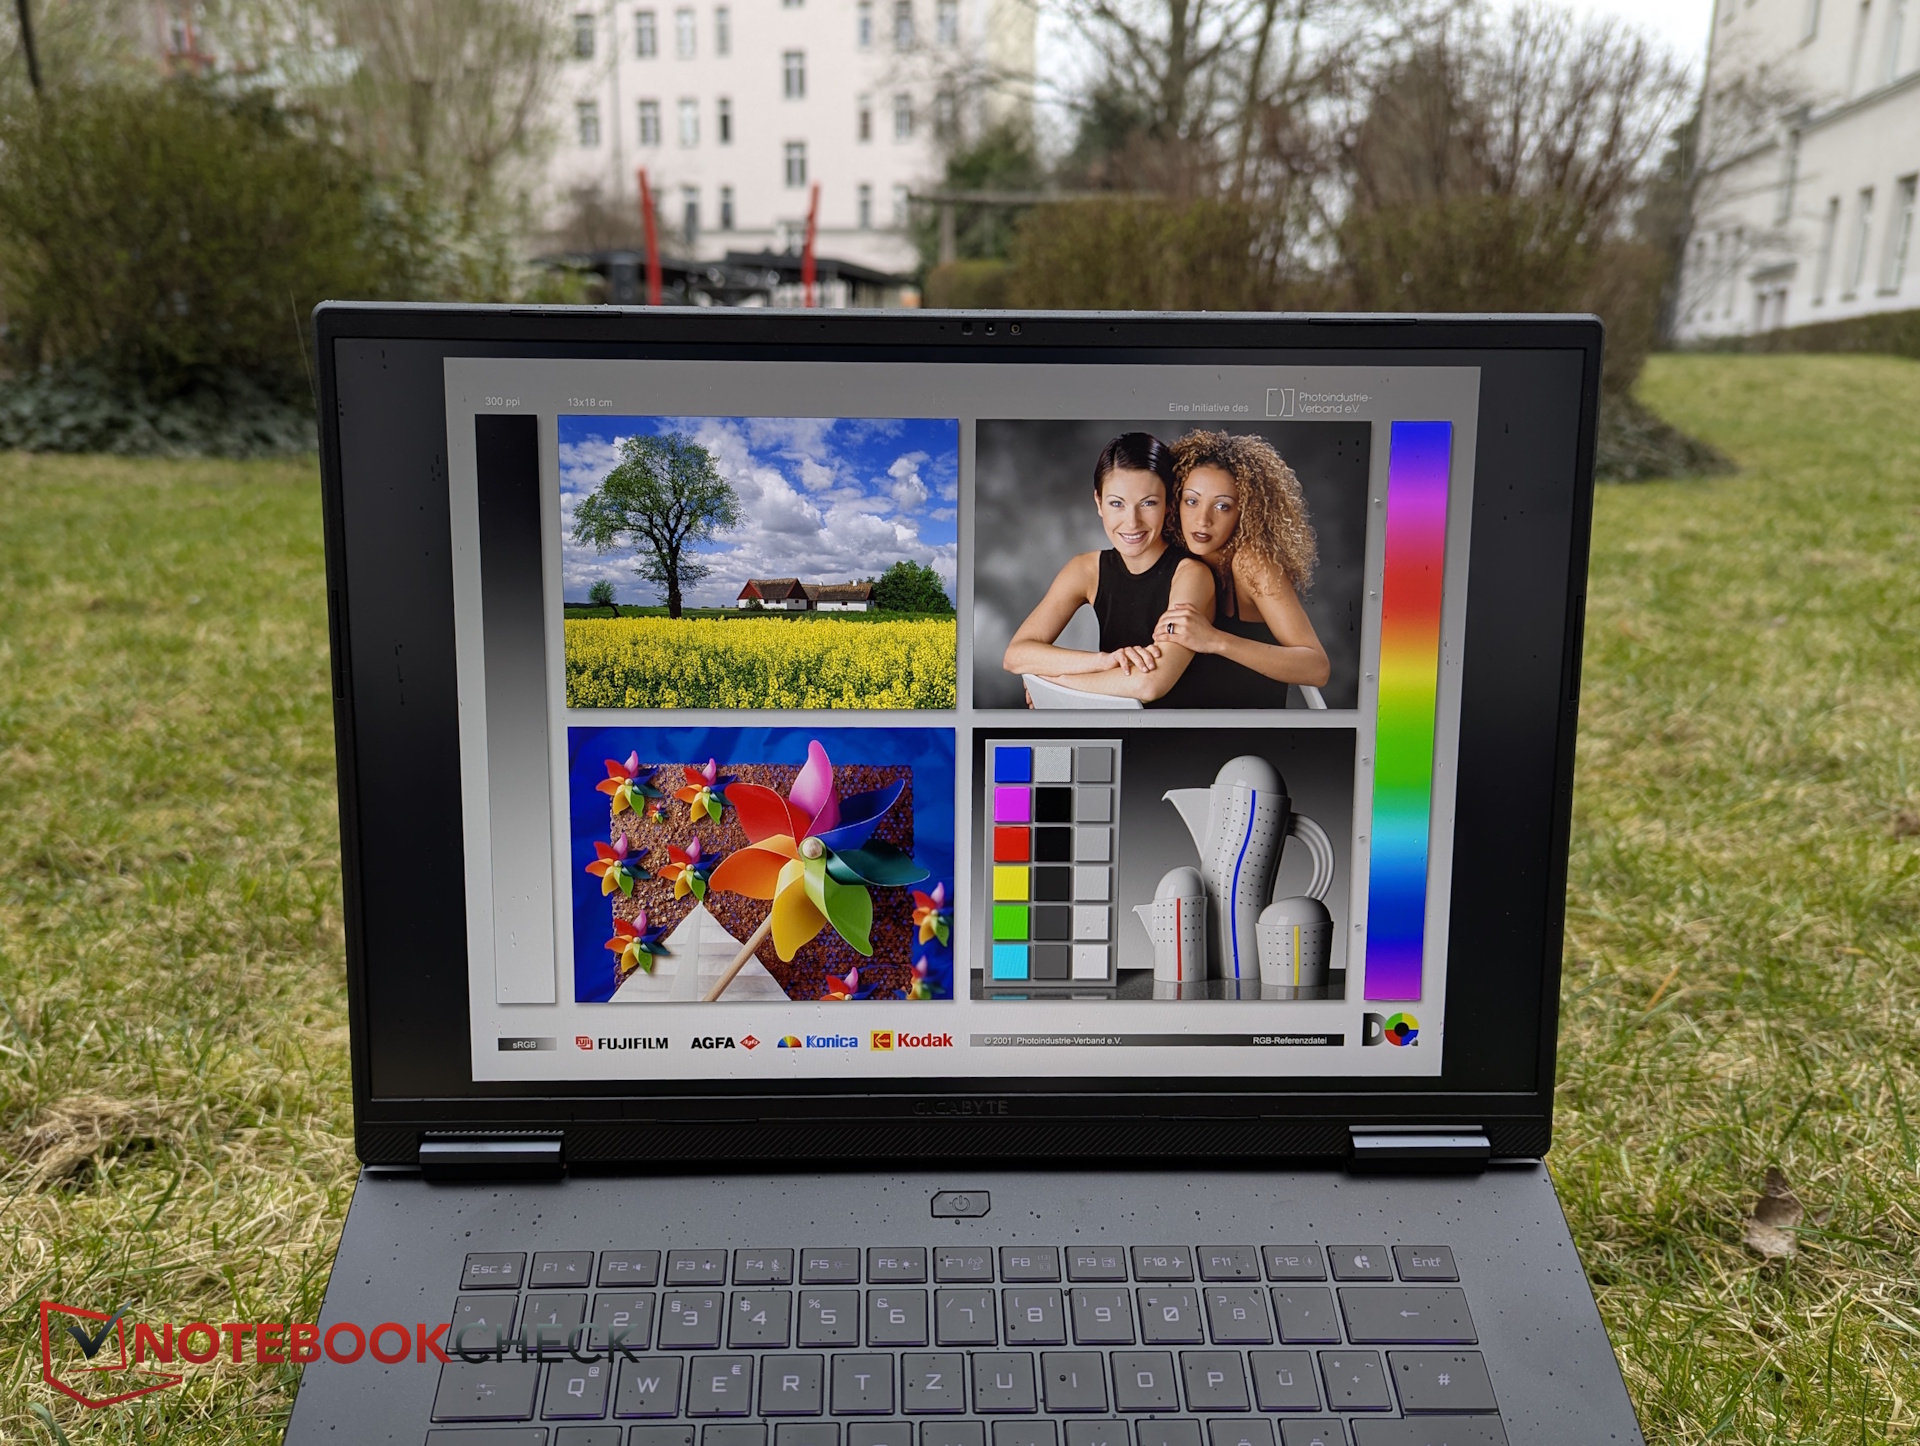
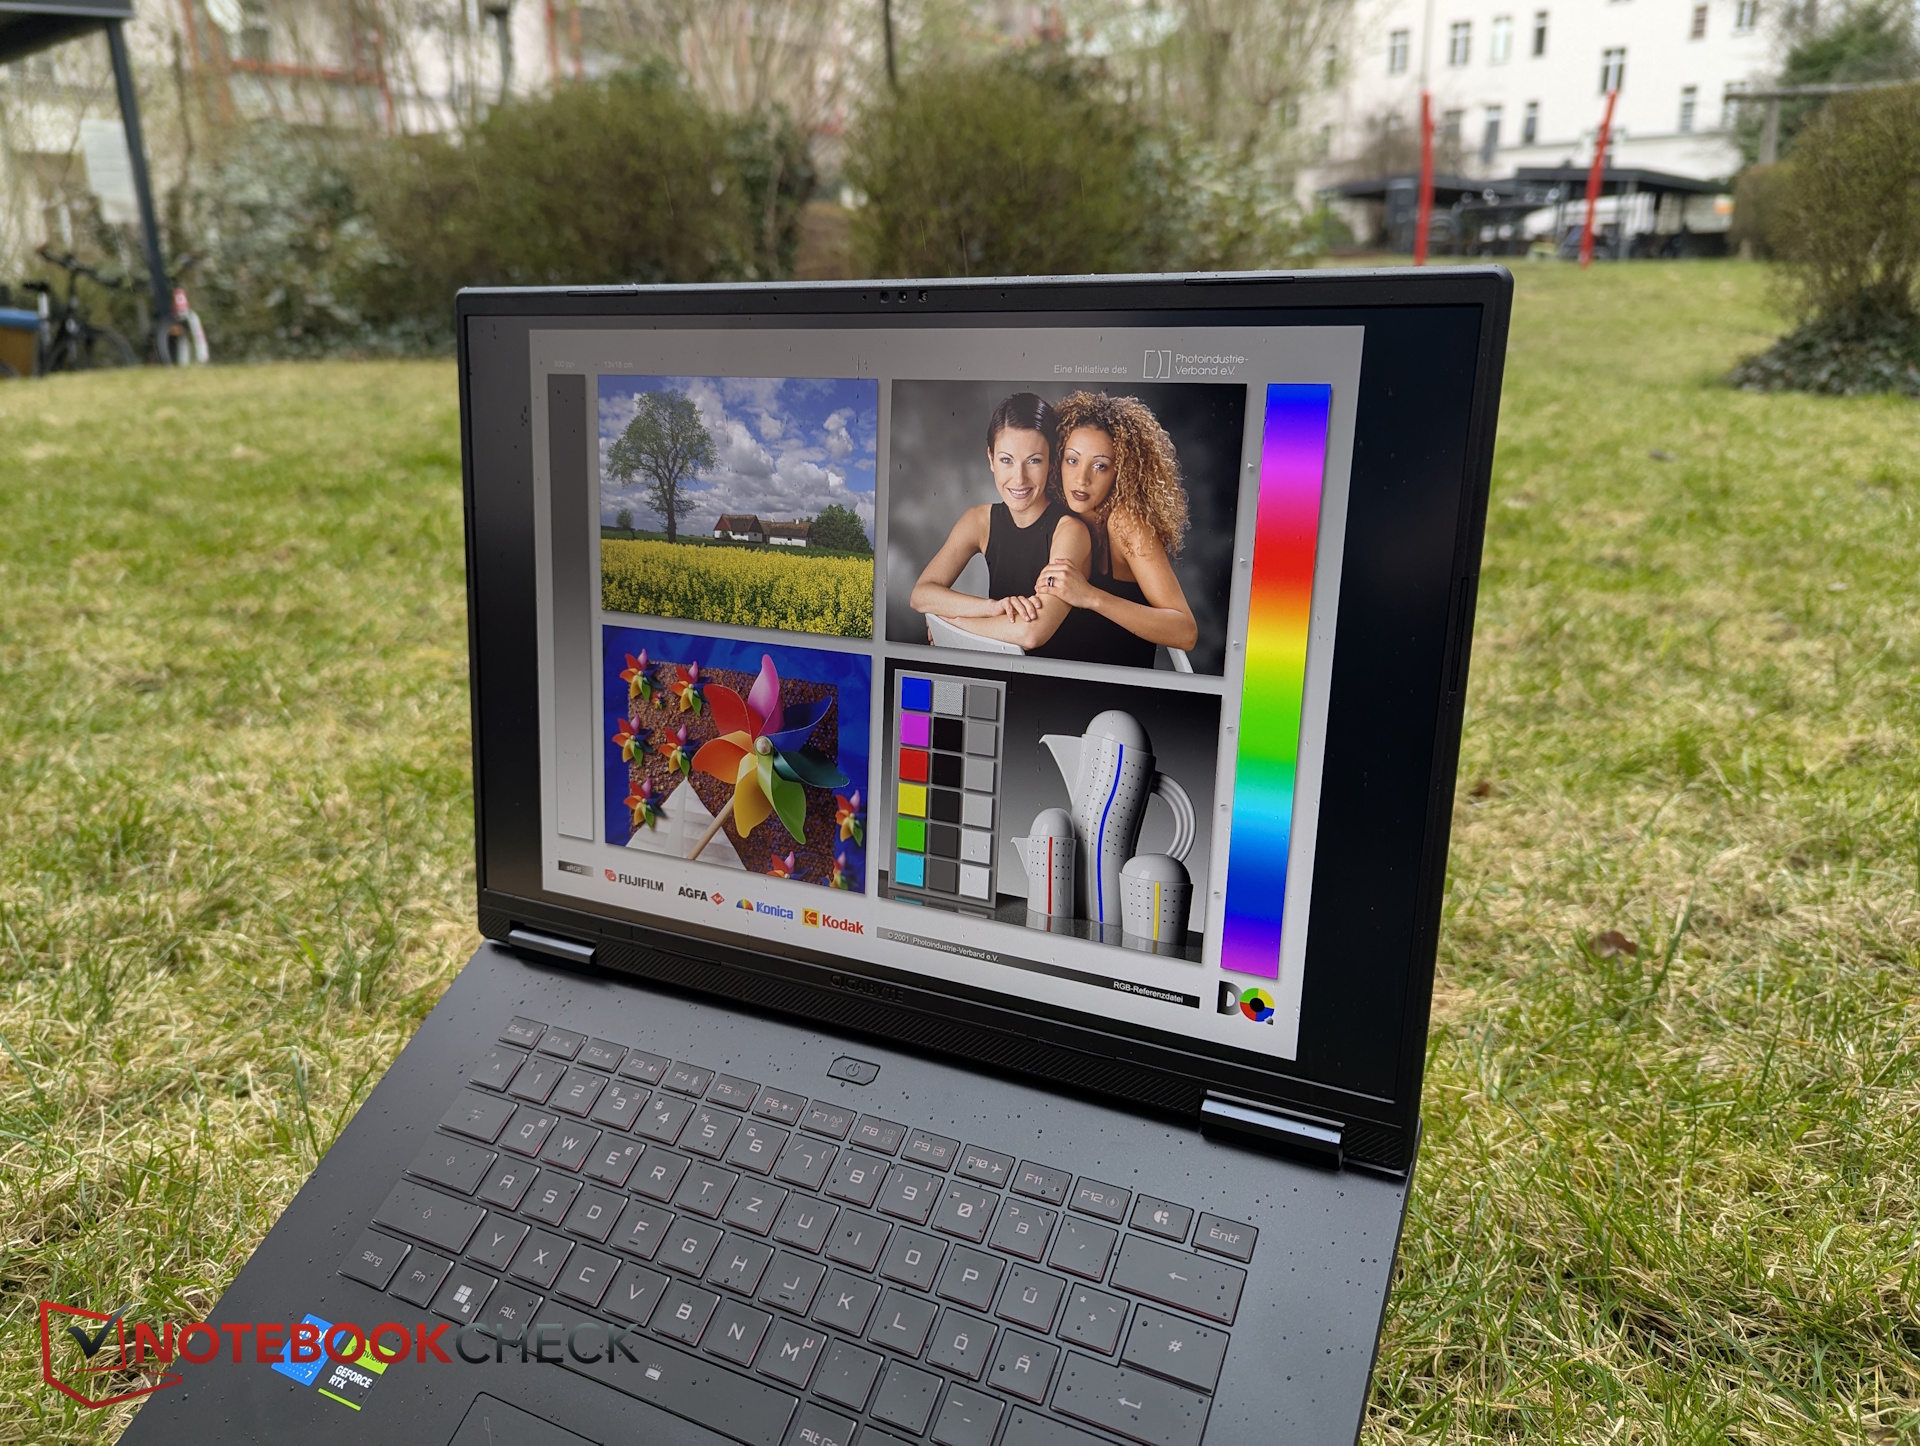
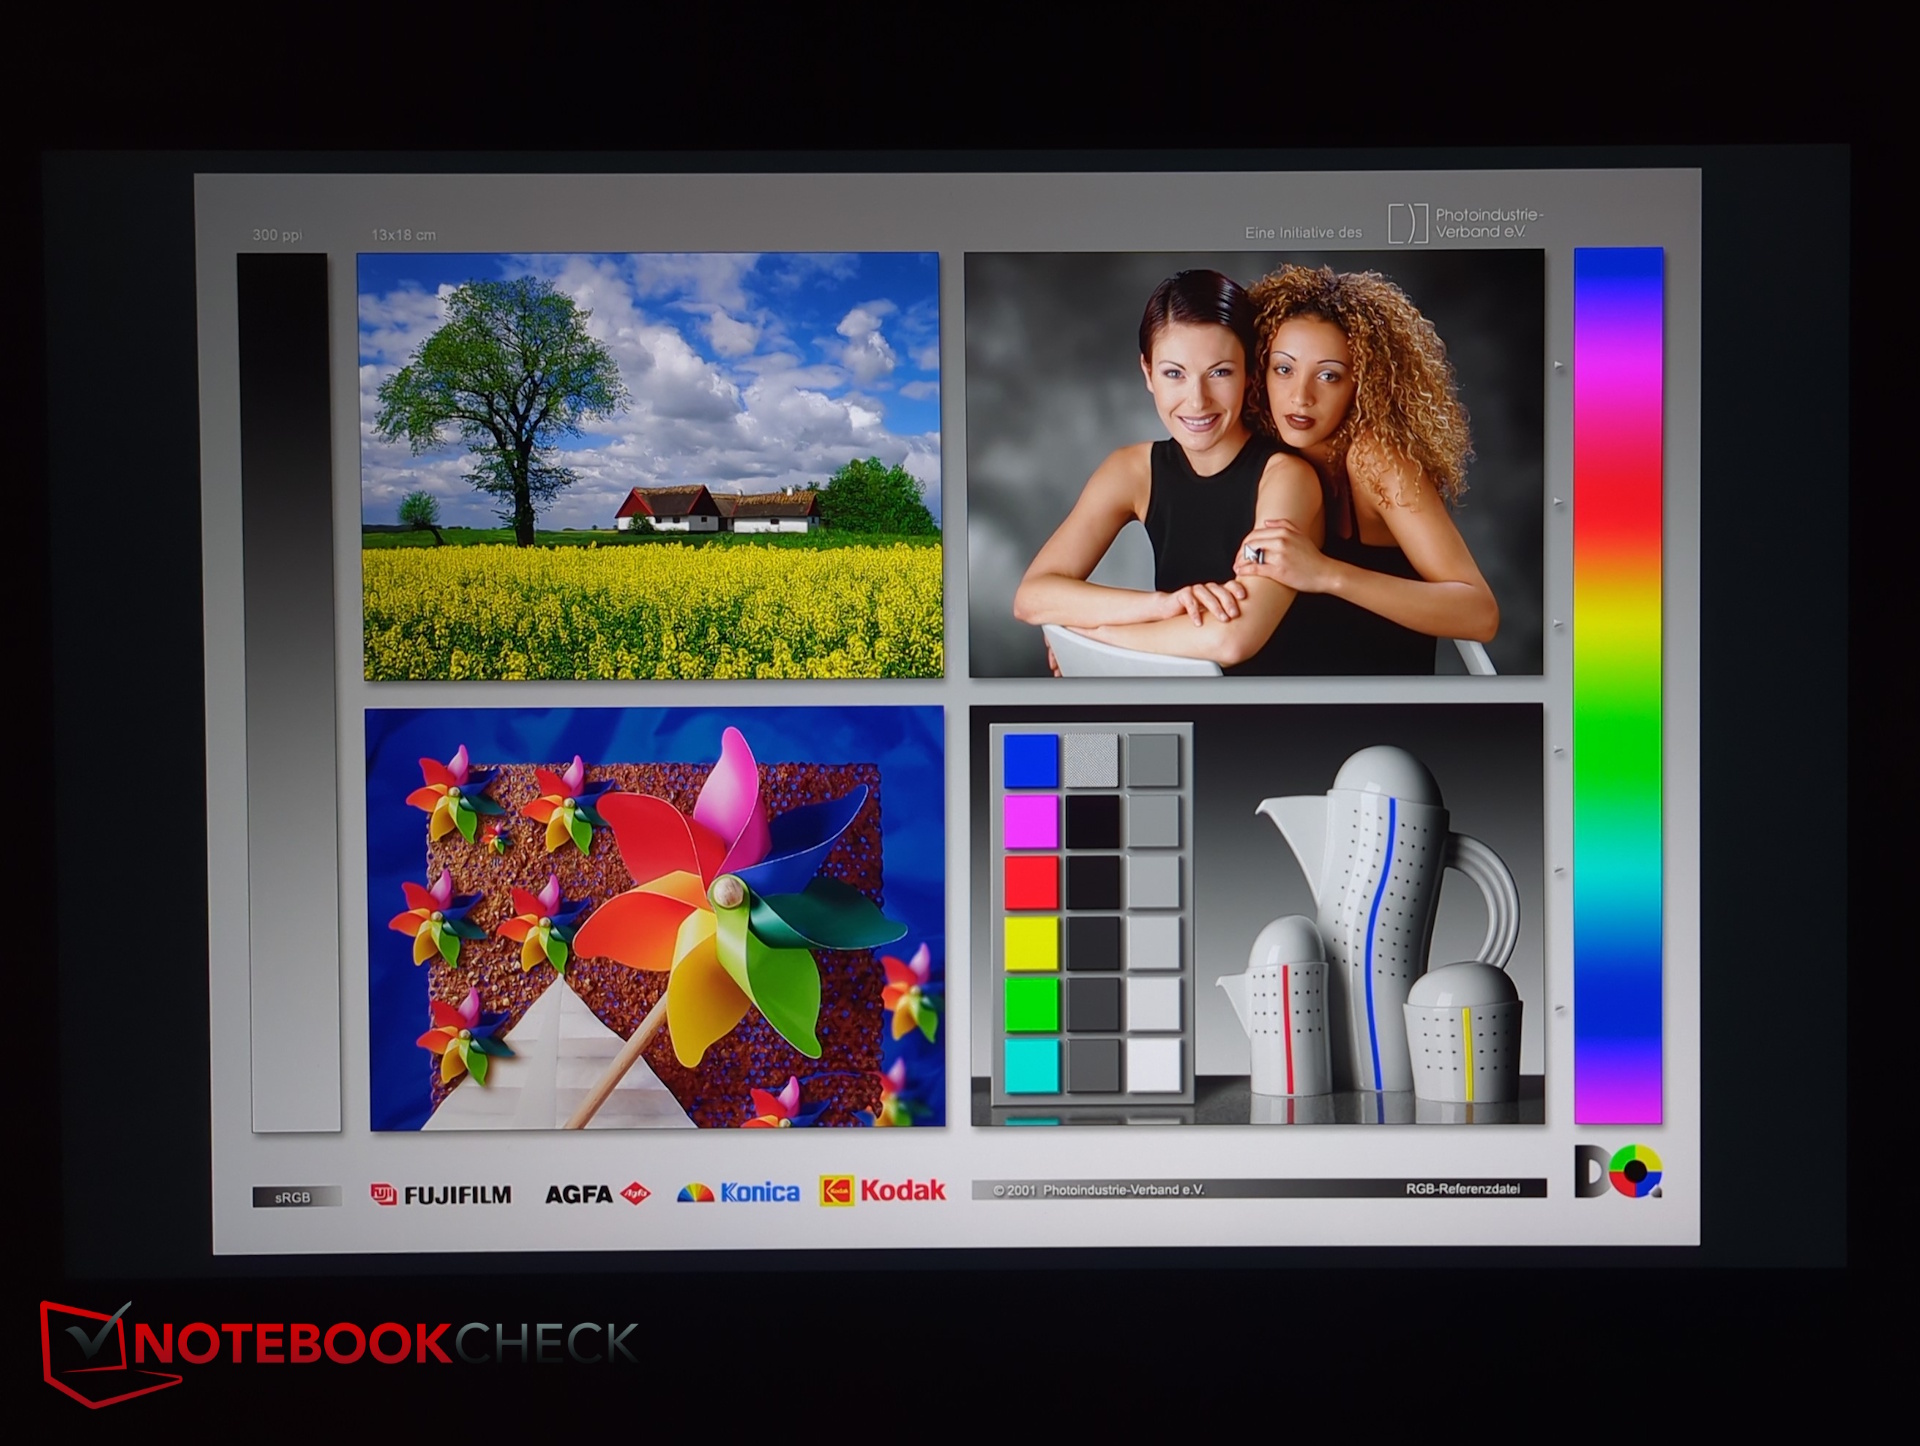
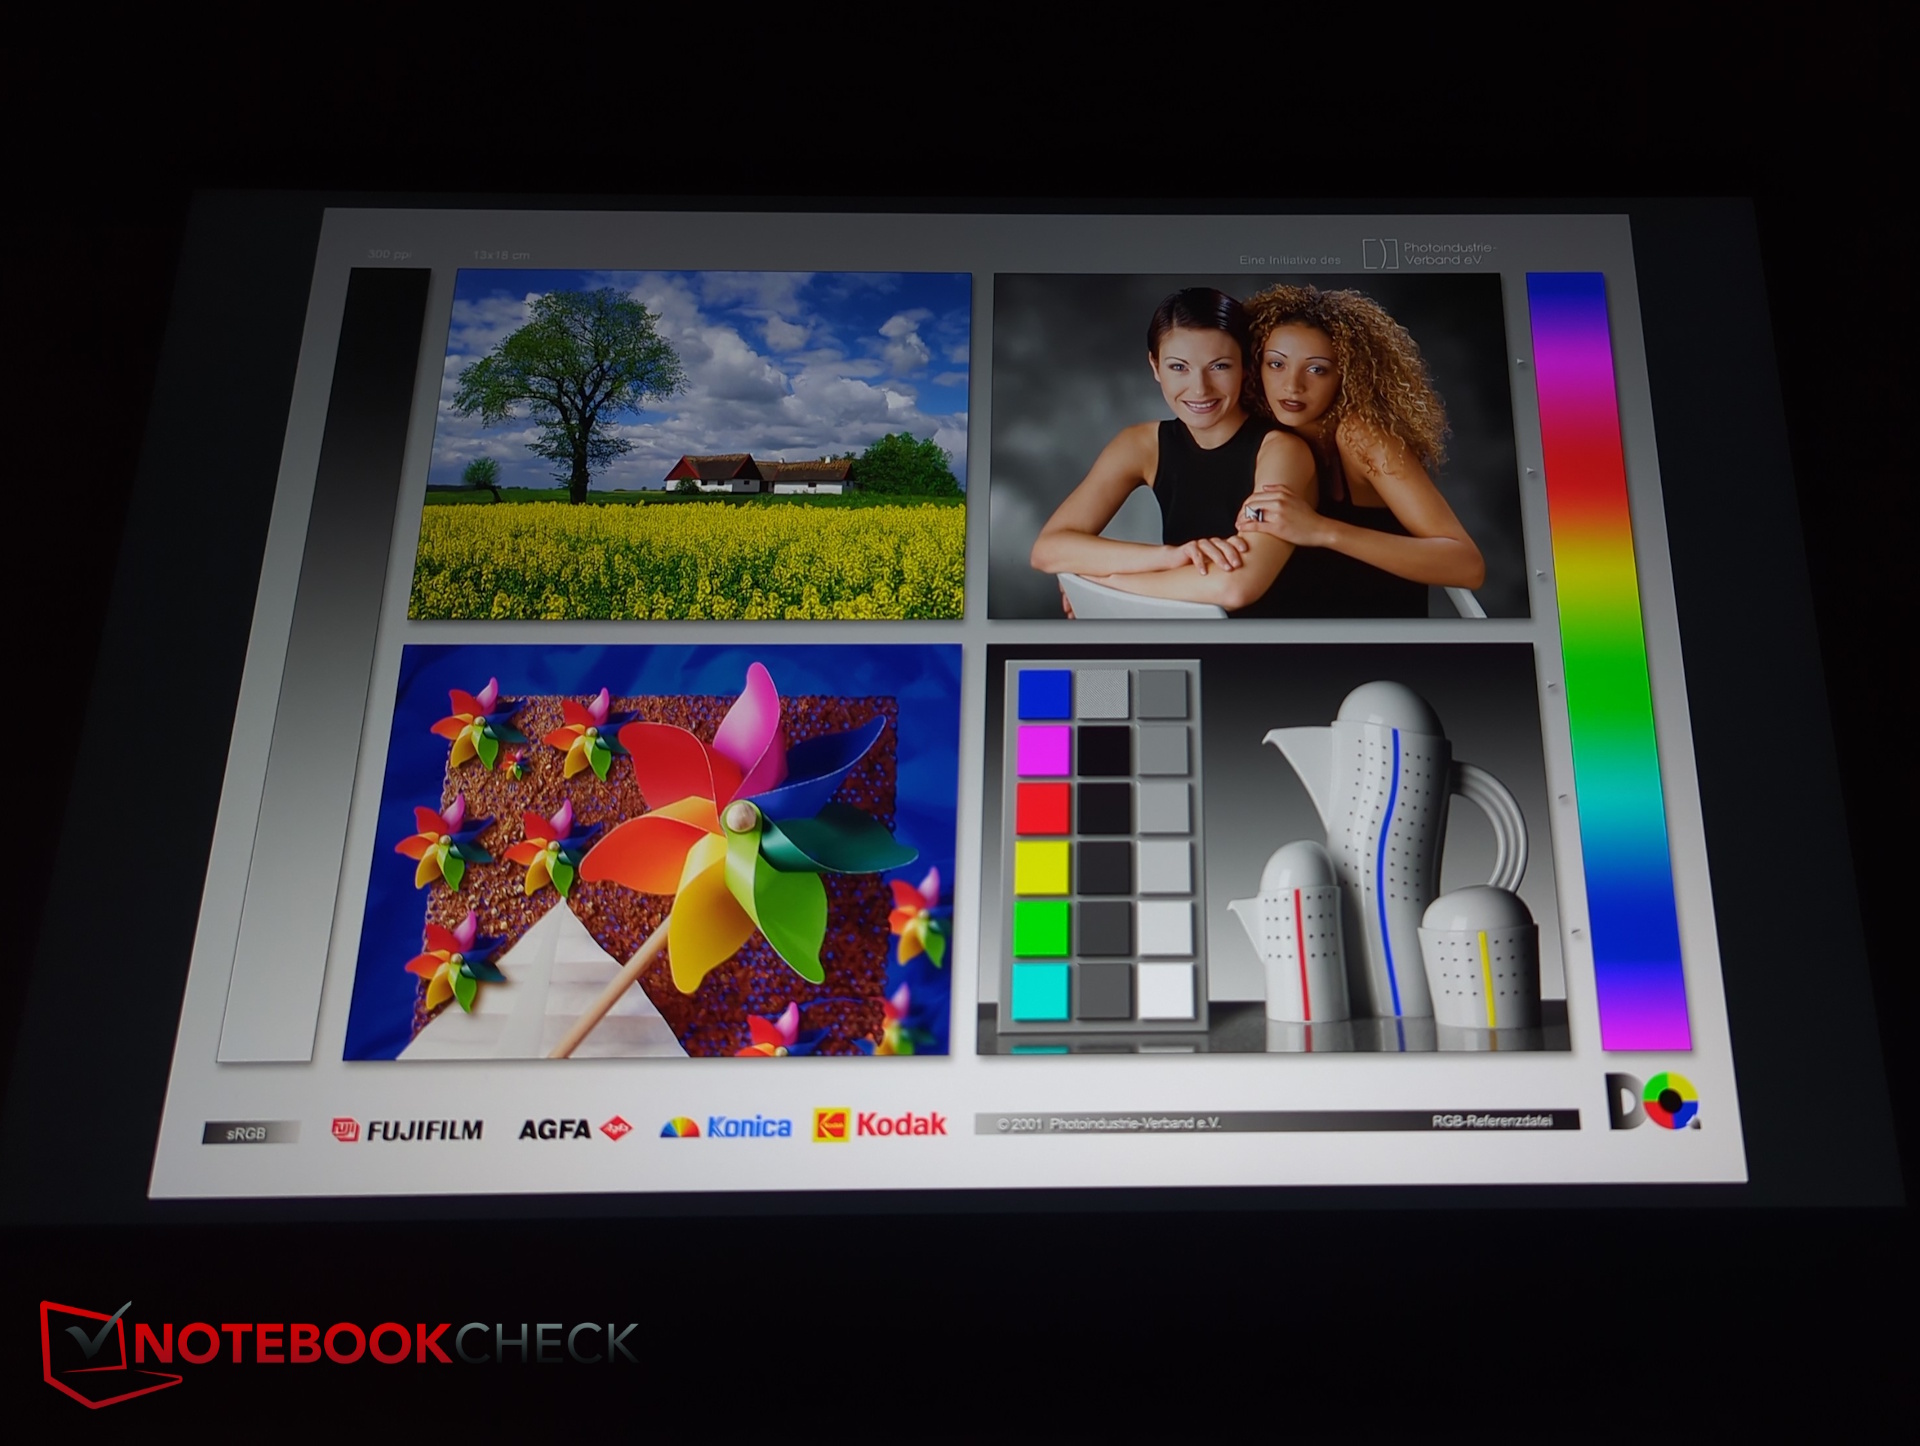
Display - 500-nit WQXGA with sRGB
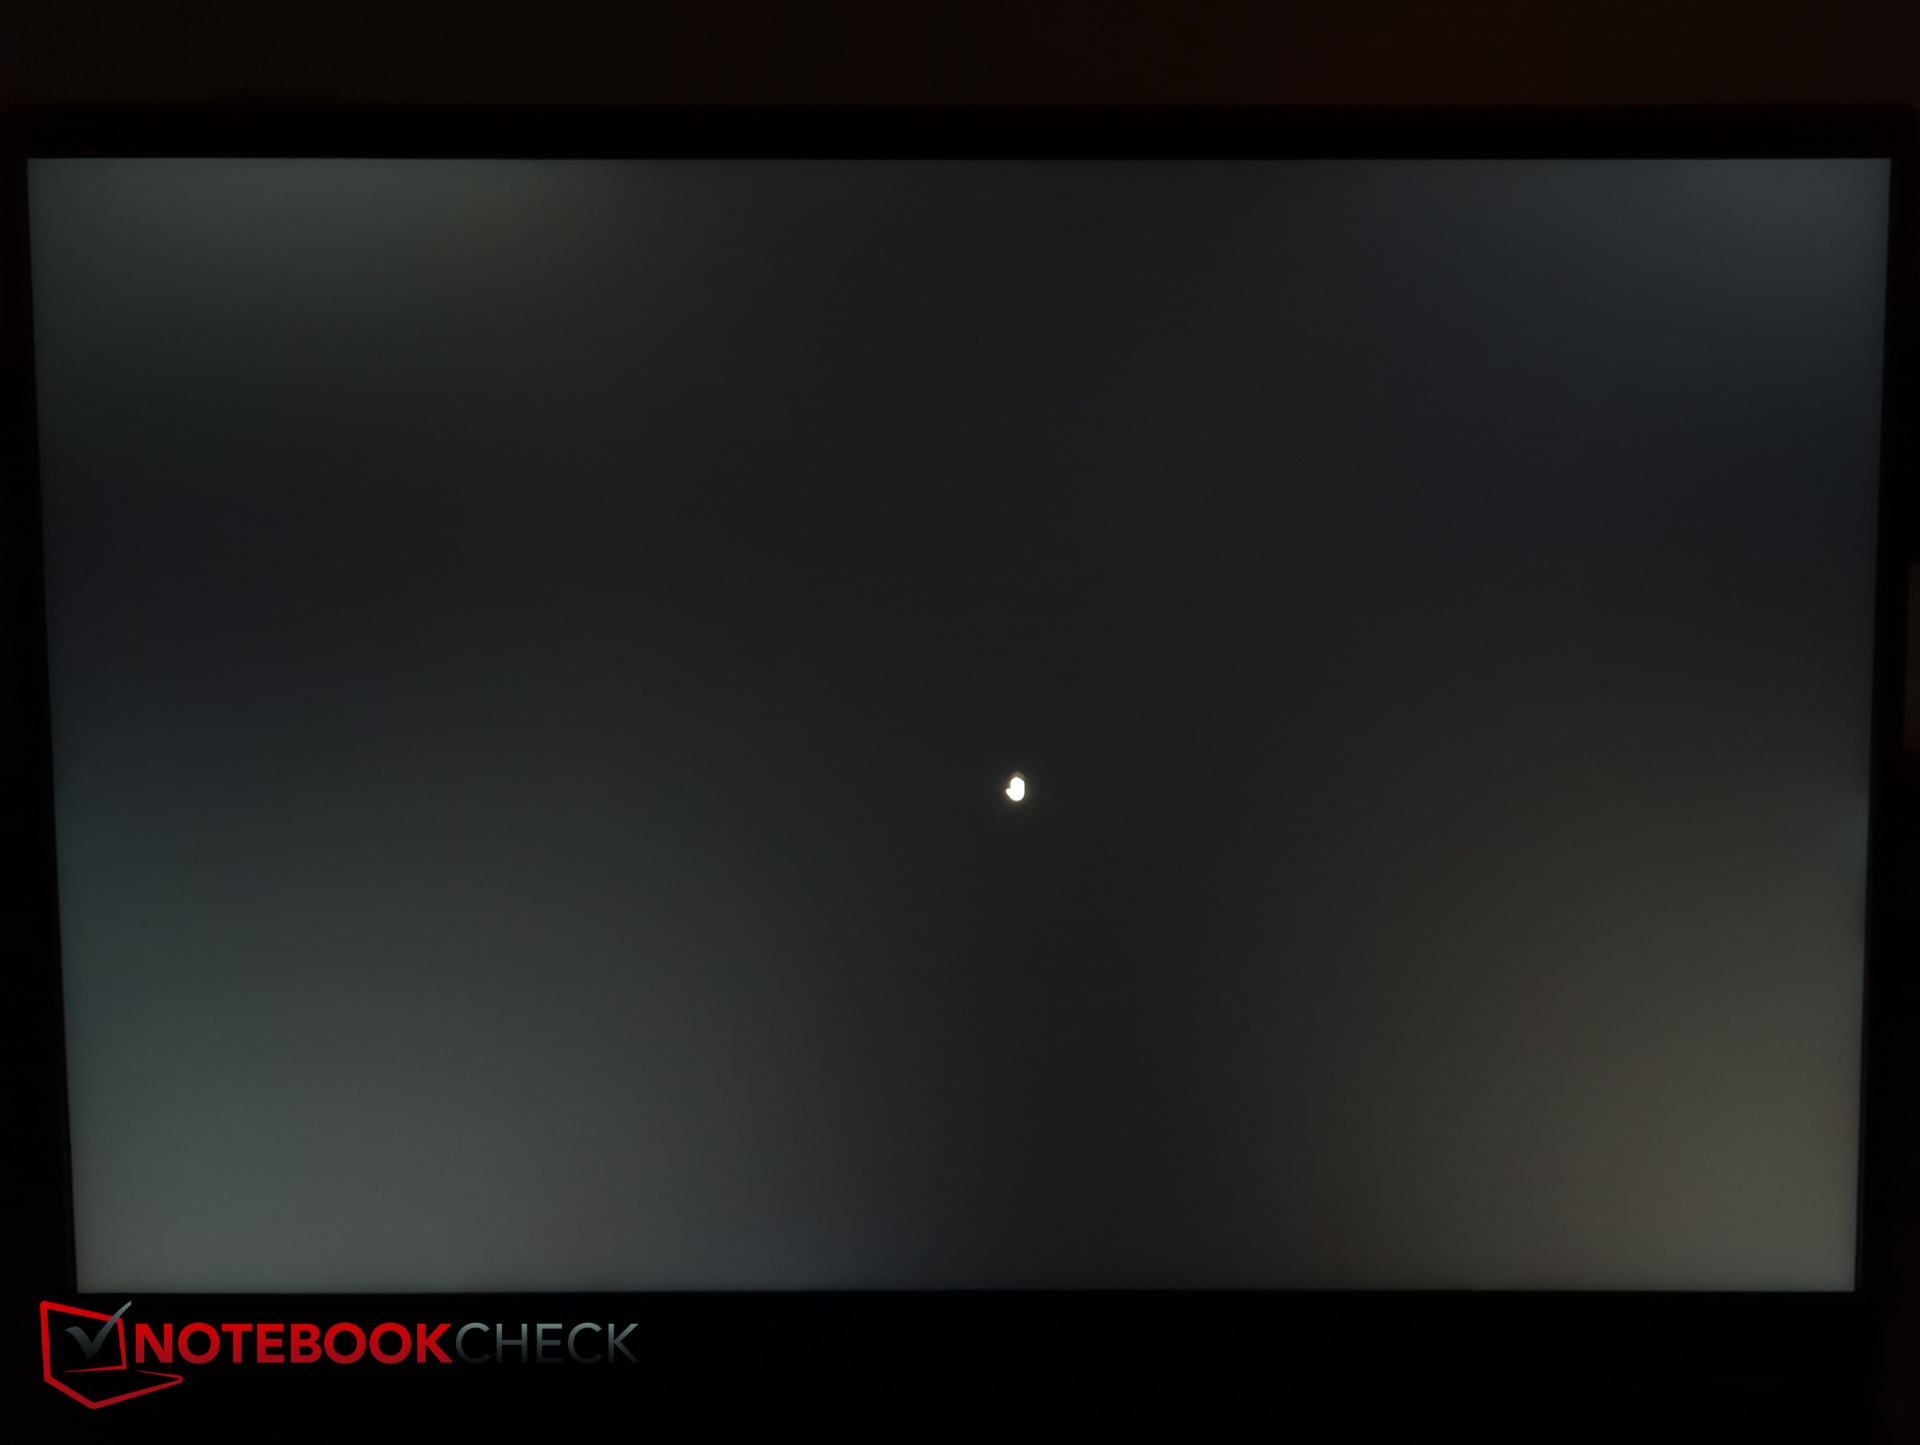
The matte IPS panel (2,560 × 1,600) runs at 165 Hz and covers the sRGB color space. It reaches just under 500 nits with good brightness uniformity. Black levels are slightly elevated, but contrast remains strong. No alternative display options are available.
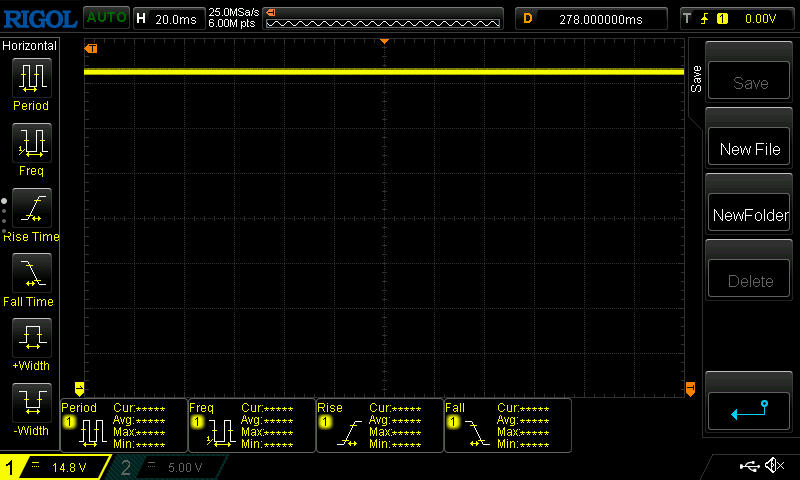
PWM is not an issue, and response times have improved. Minor backlight bleed is visible.

| |||||||||||||||||||||||||
Brightness Distribution: 92 %
Center on Battery: 517 cd/m²
Contrast: 1326:1 (Black: 0.39 cd/m²)
ΔE ColorChecker Calman: 1.62 | ∀{0.5-29.43 Ø4.73}
calibrated: 1.62
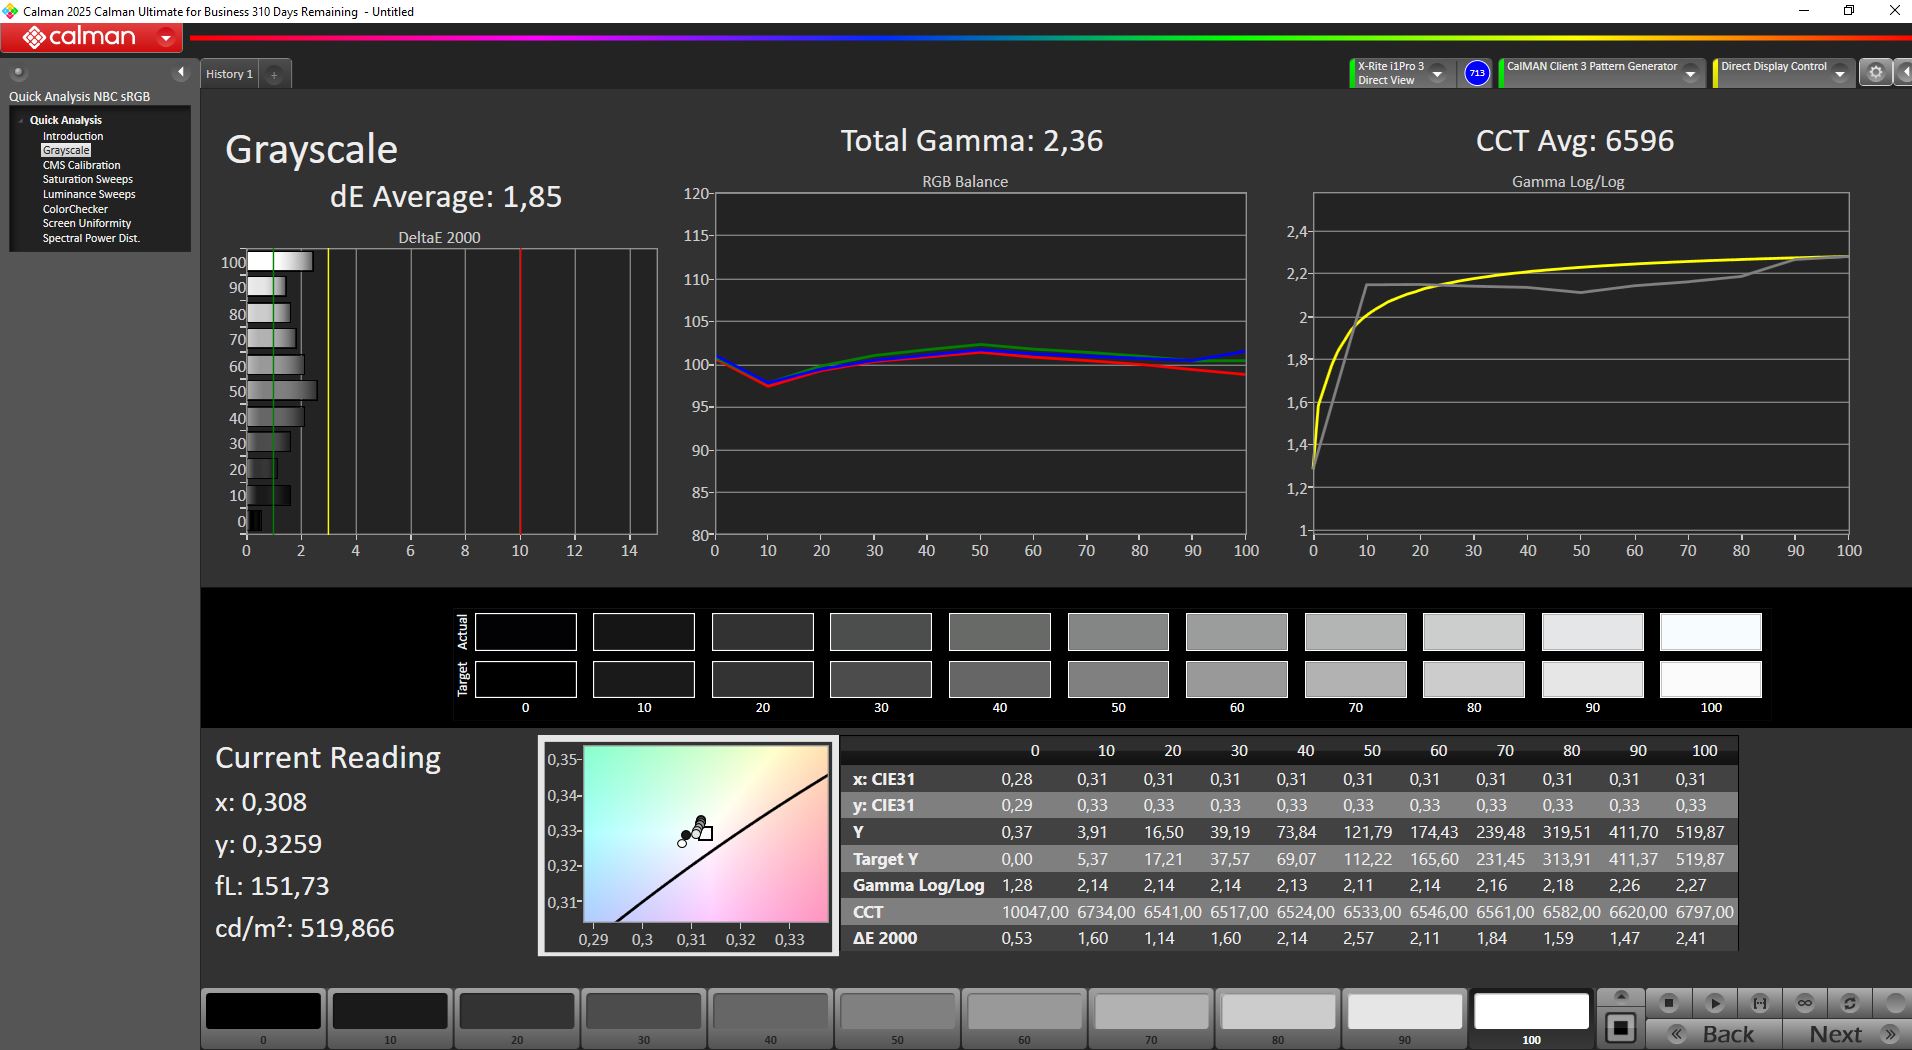
ΔE Greyscale Calman: 1.85 | ∀{0.09-98 Ø4.97}
70.4% AdobeRGB 1998 (Argyll 3D)
99.3% sRGB (Argyll 3D)
72.5% Display P3 (Argyll 3D)
Gamma: 2.36
CCT: 6596 K
| Gigabyte Gaming A16 Pro GA6DH (Core 7 240H, RTX 5070 Ti) BOE0D86 (NS160QDM-NY3), IPS, 2560x1600, 16", 165 Hz | Gigabyte Gaming A16 GA6H NE160QDM-NYJ (BOE0C80), IPS, 2560x1600, 16", 165 Hz | Schenker XMG APEX 16 MAX NE160QDM-NM9, Mini-LED, 2560x1600, 16", 300 Hz | Acer Predator Helios Neo 16S AI PHN16S-71-94L9 Samsung ATNA60DL03-0, OLED, 2560x1600, 16", 240 Hz | Medion Erazer Major 16 X1 MD62736 NE160QDM-NZL (BOE0D55), IPS, 2560x1600, 16", 300 Hz | Lenovo Legion 5 Pro 16IAX10H ATNA60HS01-0 (Samsung SDC420A), OLED, 2560x1600, 16", 165 Hz | |
|---|---|---|---|---|---|---|
| Display | -1% | 21% | 25% | 2% | 24% | |
| Display P3 Coverage (%) | 72.5 | 69.4 -4% | 99.7 38% | 99.9 38% | 73.2 1% | 99.9 38% |
| sRGB Coverage (%) | 99.3 | 99.5 0% | 100 1% | 100 1% | 99.8 1% | 100 1% |
| AdobeRGB 1998 Coverage (%) | 70.4 | 71.6 2% | 87.9 25% | 96.5 37% | 73.9 5% | 94.1 34% |
| Response Times | -78% | -164% | 96% | -28% | 71% | |
| Response Time Grey 50% / Grey 80% * (ms) | 6.8 ? | 14.3 ? -110% | 17.4 ? -156% | 0.2 ? 97% | 10 ? -47% | 2 ? 71% |
| Response Time Black / White * (ms) | 4.8 ? | 7 ? -46% | 13 ? -171% | 0.25 ? 95% | 5.2 ? -8% | 1.4 ? 71% |
| PWM Frequency (Hz) | 20253 ? | 960 | 1300 | |||
| PWM Amplitude * (%) | 75 | 50 | 16.7 | |||
| Screen | -65% | 612% | 81% | -6% | -27% | |
| Brightness middle (cd/m²) | 517 | 432 -16% | 742 44% | 390 -25% | 577 12% | 518 0% |
| Brightness (cd/m²) | 490 | 425 -13% | 733 50% | 394 -20% | 539 10% | 522 7% |
| Brightness Distribution (%) | 92 | 91 -1% | 93 1% | 98 7% | 85 -8% | 97 5% |
| Black Level * (cd/m²) | 0.39 | 0.37 5% | 0.01 97% | 0.04 90% | 0.5 -28% | |
| Contrast (:1) | 1326 | 1168 -12% | 74200 5496% | 9750 635% | 1154 -13% | |
| Colorchecker dE 2000 * | 1.62 | 4.76 -194% | 3 -85% | 1.61 1% | 2.12 -31% | 2.49 -54% |
| Colorchecker dE 2000 max. * | 3.52 | 8.59 -144% | 4.3 -22% | 3.49 1% | 3.32 6% | 5.25 -49% |
| Colorchecker dE 2000 calibrated * | 1.62 | 1.18 27% | 1.2 26% | 1.59 2% | 1.33 18% | 2.15 -33% |
| Greyscale dE 2000 * | 1.85 | 6.2 -235% | 3.6 -95% | 1.2 35% | 2.2 -19% | 3.02 -63% |
| Gamma | 2.36 93% | 2.079 106% | 2.43 91% | 2.235 98% | 2.123 104% | 2.37 93% |
| CCT | 6596 99% | 6690 97% | 6559 99% | 6580 99% | 6457 101% | 6426 101% |
| Total Average (Program / Settings) | -48% /
-53% | 156% /
375% | 67% /
71% | -11% /
-7% | 23% /
2% |
* ... smaller is better
Out of the box, the display is well calibrated for sRGB, with deviations below 2—no recalibration is necessary.
Display Response Times
| ↔ Response Time Black to White | ||
|---|---|---|
| 4.8 ms ... rise ↗ and fall ↘ combined | ↗ 1.4 ms rise | 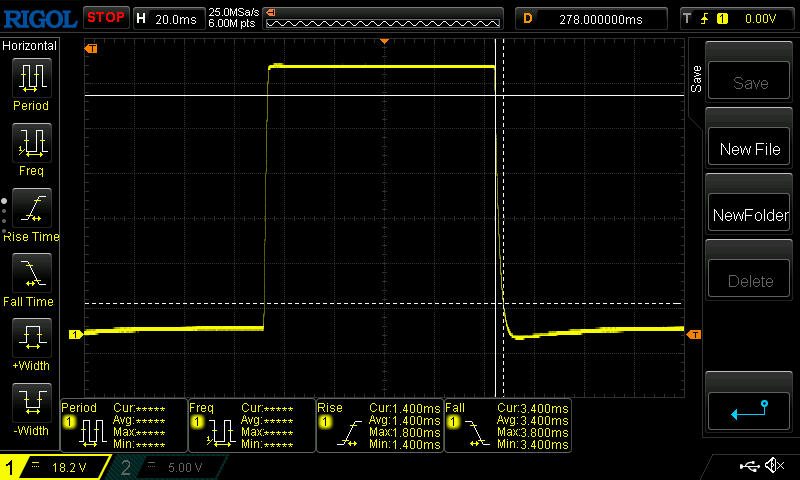 |
| ↘ 3.4 ms fall | ||
| The screen shows very fast response rates in our tests and should be very well suited for fast-paced gaming. In comparison, all tested devices range from 0.1 (minimum) to 240 (maximum) ms. » 17 % of all devices are better. This means that the measured response time is better than the average of all tested devices (19.9 ms). | ||
| ↔ Response Time 50% Grey to 80% Grey | ||
| 6.8 ms ... rise ↗ and fall ↘ combined | ↗ 3 ms rise | 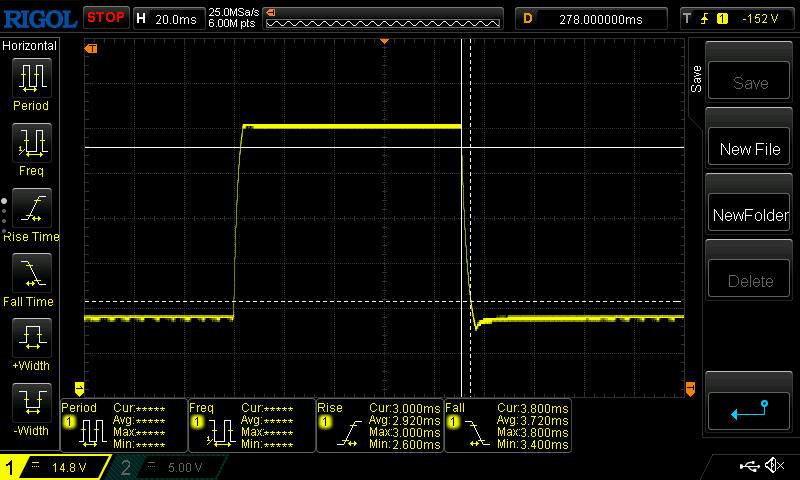 |
| ↘ 3.8 ms fall | ||
| The screen shows very fast response rates in our tests and should be very well suited for fast-paced gaming. In comparison, all tested devices range from 0.165 (minimum) to 636 (maximum) ms. » 19 % of all devices are better. This means that the measured response time is better than the average of all tested devices (31.1 ms). | ||
Screen Flickering / PWM (Pulse-Width Modulation)
| Screen flickering / PWM not detected |  | ||
In comparison: 52 % of all tested devices do not use PWM to dim the display. If PWM was detected, an average of 7798 (minimum: 5 - maximum: 343500) Hz was measured. | |||

Outdoor visibility is decent, especially in shaded conditions.

Performance – Barely faster than the non-pro
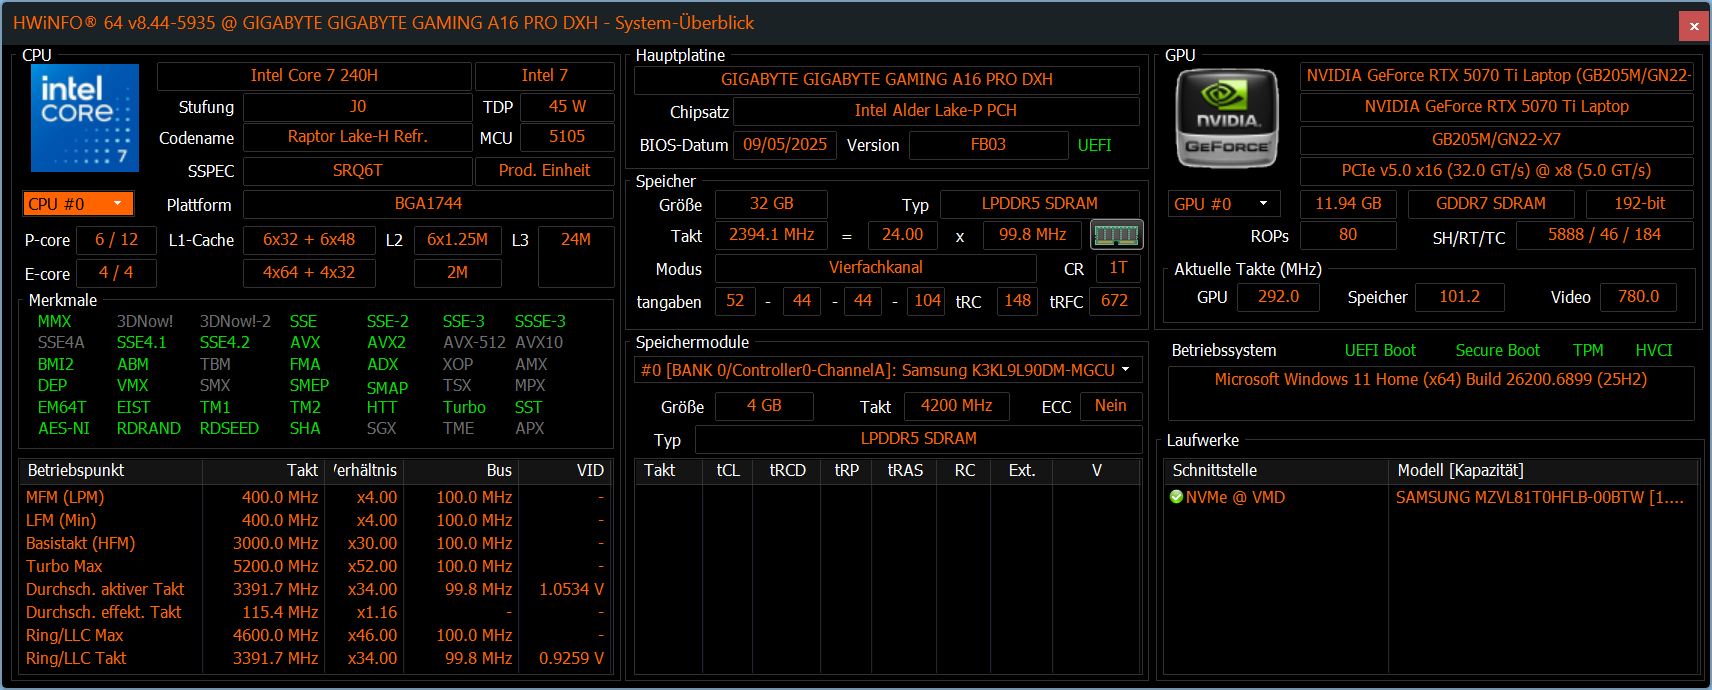
With its RTX 5070 Ti, Core 7 240H, and 32 GB of RAM, the A16 Pro clearly positions itself as a gaming machine. It's slim design and bright display could also interest beginner content creators and video editors.
Test conditions
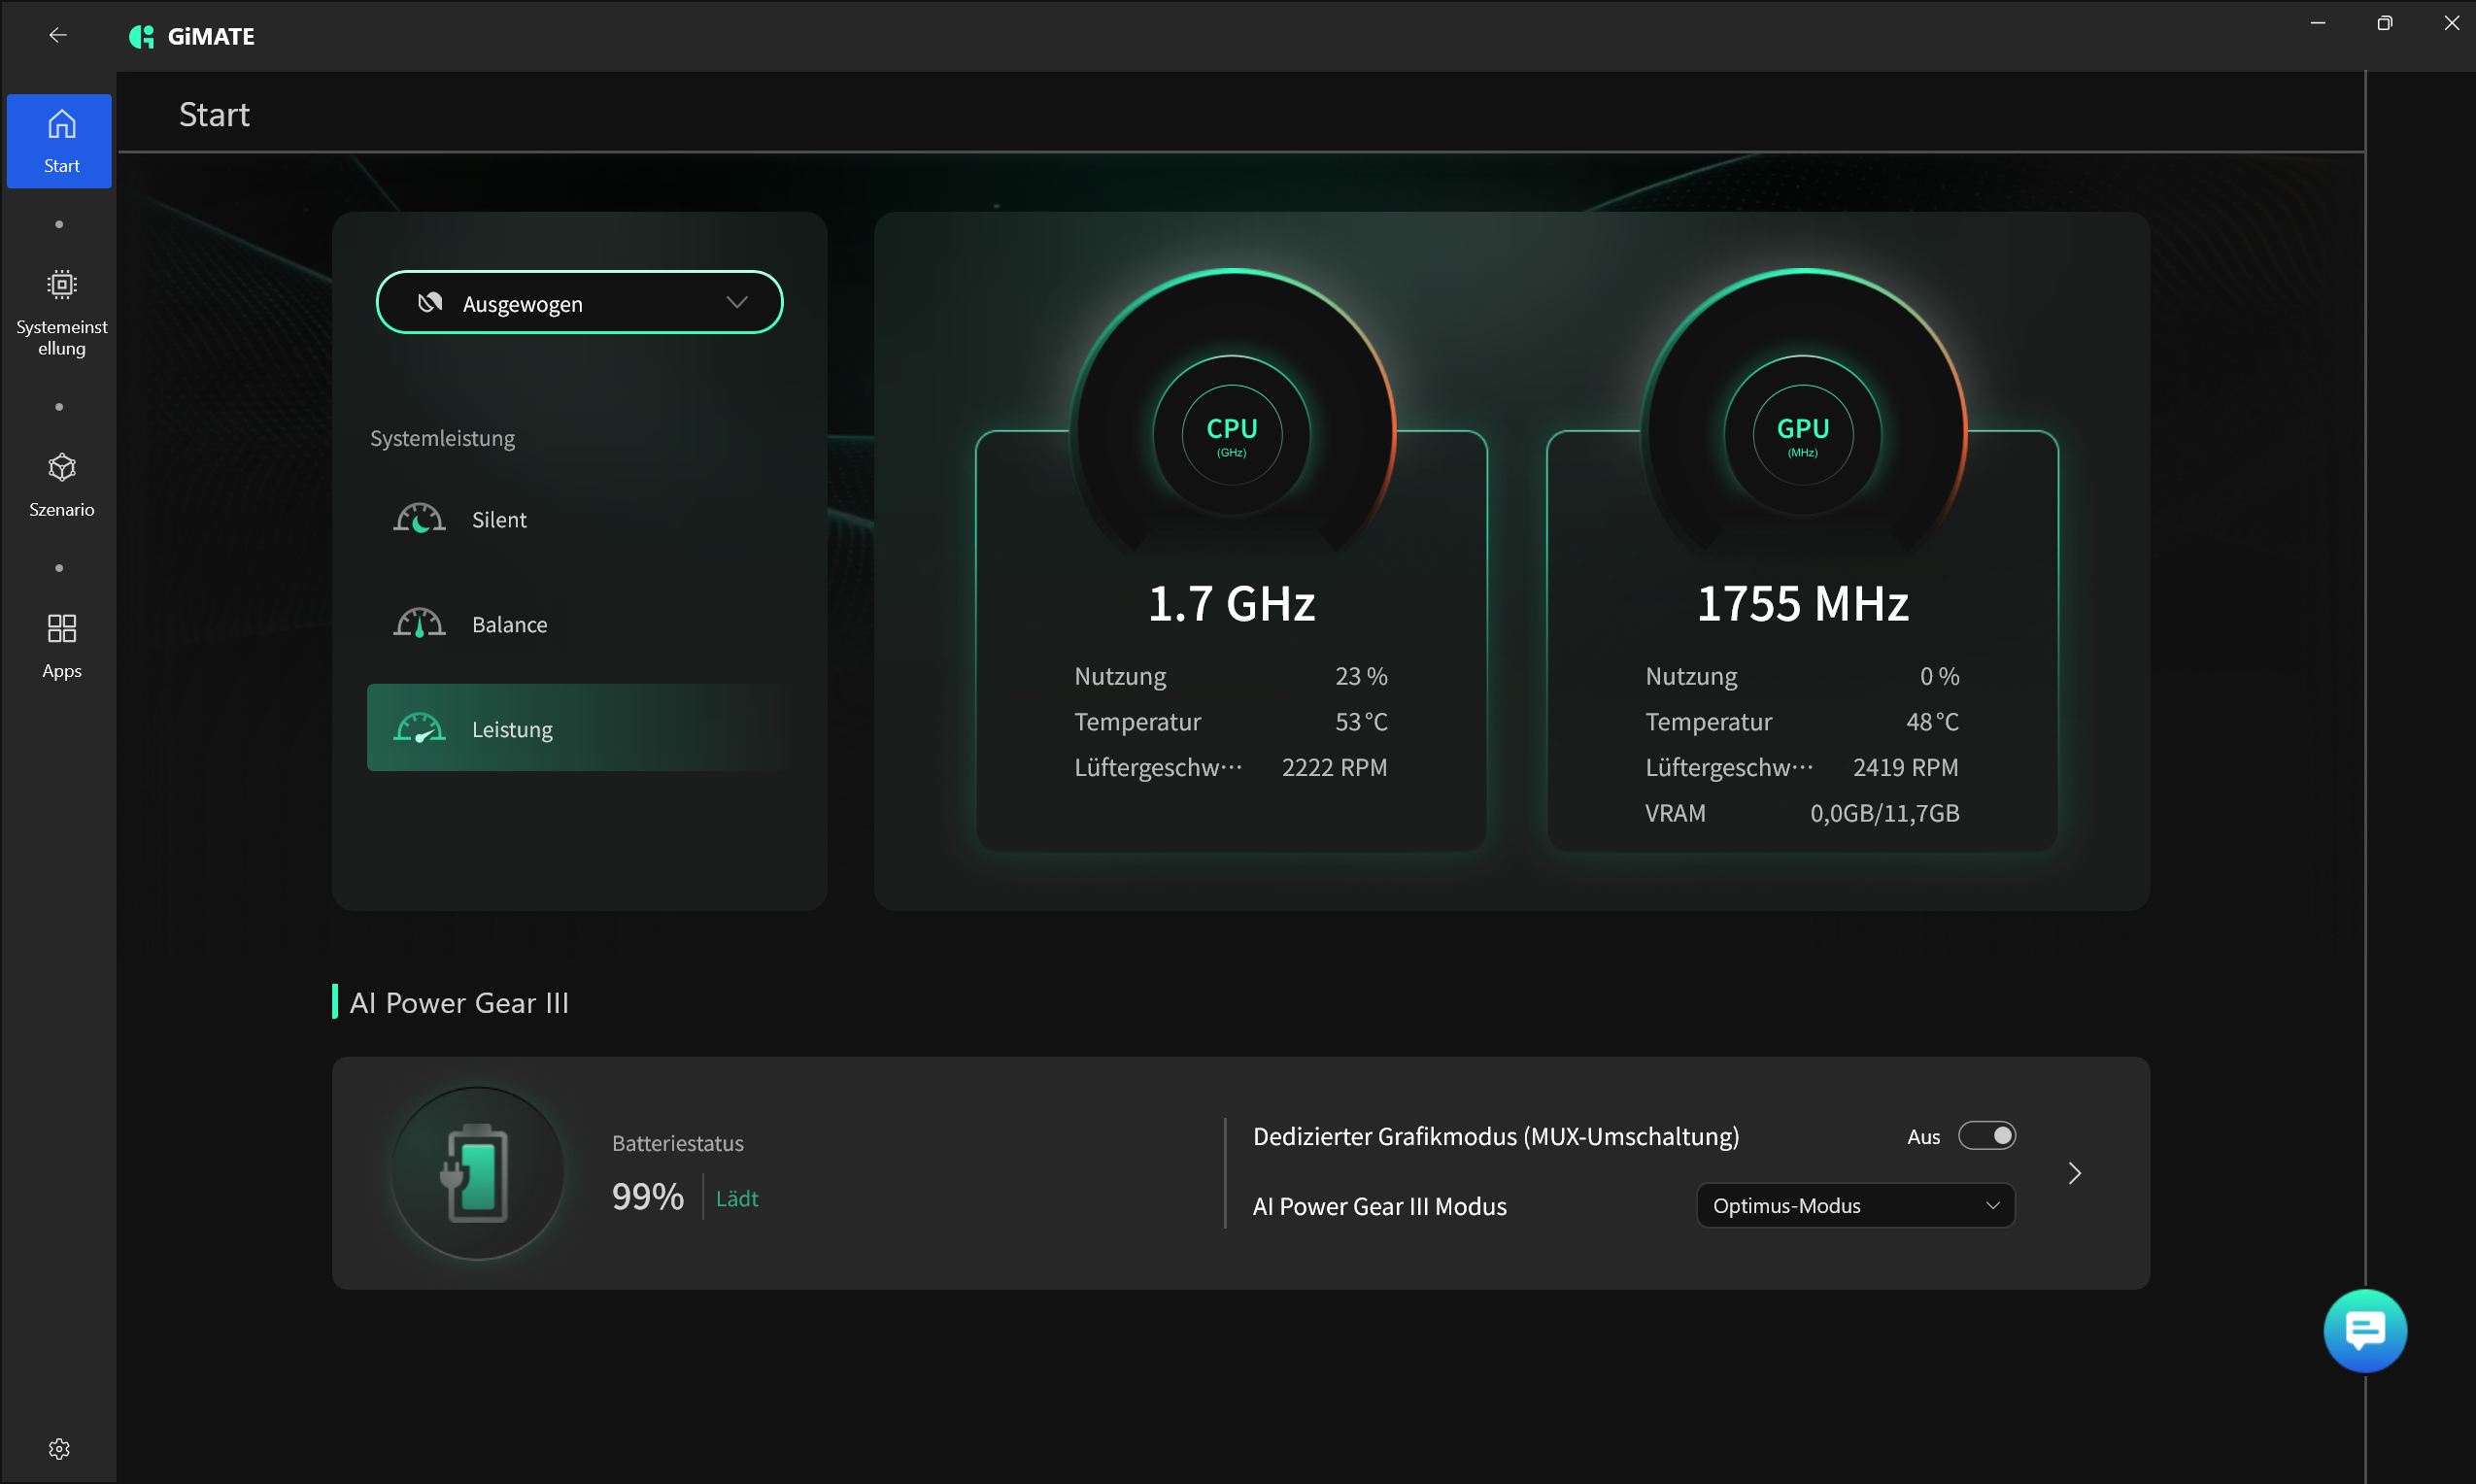
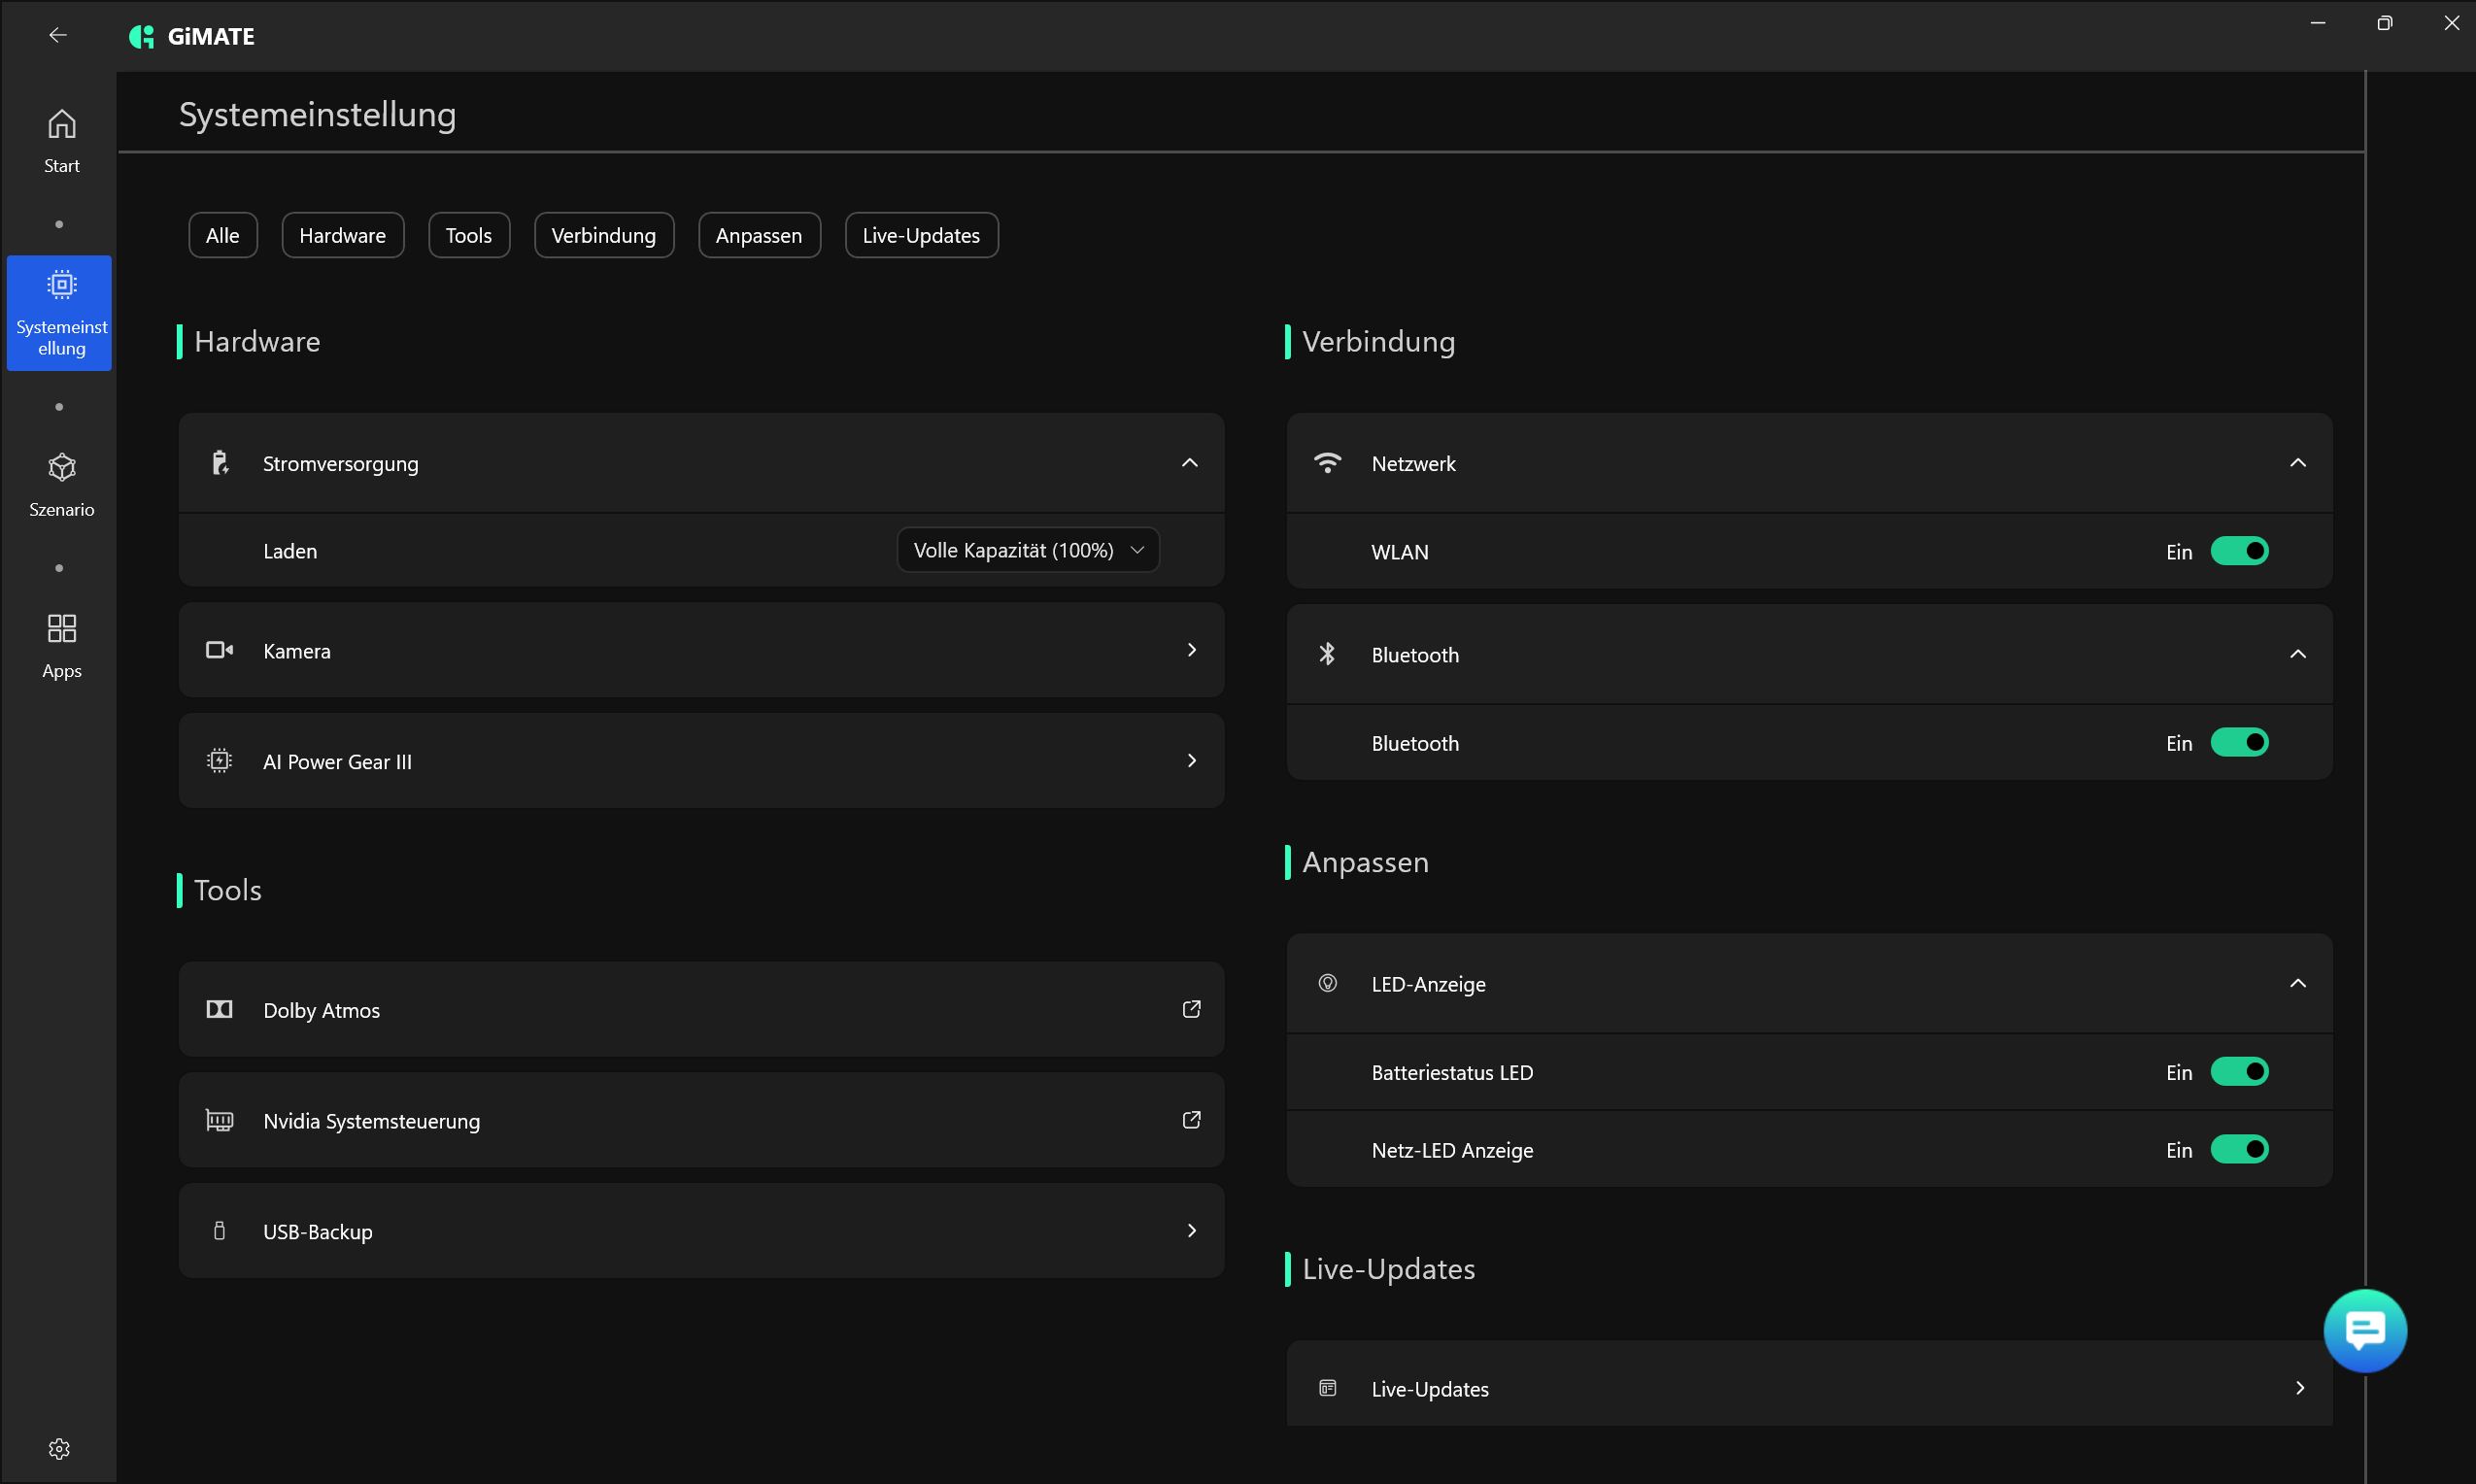
Using the GiMate control center, we selected performance mode (Silence, Balanced, Performance). There is no manual mode, but a MUX switch is included.
| Performance Mode | Cinebench R15 Multi | Fire Strike Graphics | Cyberpunk 2077 FHD Ultra (fps) | Noise Cyberpunk (dB) | Power Cyberpunk (W) |
|---|---|---|---|---|---|
| Performance | 2401 | 42580 | 96.3 | 56.18 | 165 |
| Balanced | 2368 | 39276 | 89.4 | 47.62 | 140 |
| Silence | 2136 | 30977 | 56.4 | 33 | 86 |
| Battery (Performance) | 1735 | 15631 | 30 |
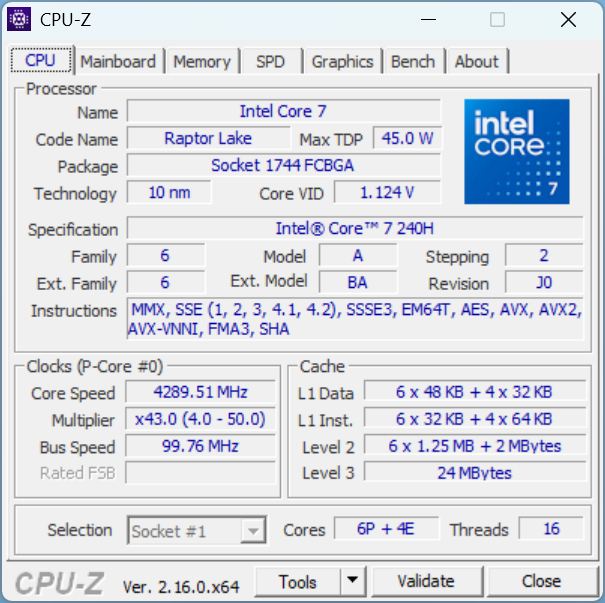
Processor
The Intel Core 7 240H features 6 performance cores and 4 efficiency cores, clocking from 1.8 to 5.2 GHz. Unfortunately, it fails to outperform the i7-13620H used in the predecessor. Even in turbo mode, TDP is capped at 82 W, though up to 115 W would be possible. Many RTX 5070 Ti gaming laptops ship with faster CPUs—performance trails the Lenovo Legion 5 Pro by nearly 80%.
On battery power, CPU performance drops by about 28%.
Cinebench R15 Multi Dauertest
Cinebench R23: Multi Core | Single Core
Cinebench R20: CPU (Multi Core) | CPU (Single Core)
Cinebench R15: CPU Multi 64Bit | CPU Single 64Bit
Blender: v2.79 BMW27 CPU
7-Zip 18.03: 7z b 4 | 7z b 4 -mmt1
Geekbench 6.7: Multi-Core | Single-Core
Geekbench 5.5: Multi-Core | Single-Core
HWBOT x265 Benchmark v2.2: 4k Preset
LibreOffice : 20 Documents To PDF
R Benchmark 2.5: Overall mean
| CPU Performance rating | |
| Medion Erazer Major 16 X1 MD62736 | |
| Average of class Gaming | |
| Medion Erazer Deputy 15 P1 MD62761 | |
| Alienware 16 Aurora | |
| Gigabyte Gaming A16 GA6H | |
| Average Intel Core 7 240H | |
| Gigabyte Gaming A16 Pro GA6DH (Core 7 240H, RTX 5070 Ti) | |
| MSI Cyborg 15 B2RWEKG | |
| Cinebench R23 / Multi Core | |
| Medion Erazer Major 16 X1 MD62736 | |
| Average of class Gaming (10488 - 40970, n=113, last 2 years) | |
| Alienware 16 Aurora | |
| Medion Erazer Deputy 15 P1 MD62761 | |
| Gigabyte Gaming A16 Pro GA6DH (Core 7 240H, RTX 5070 Ti) | |
| Gigabyte Gaming A16 GA6H | |
| Average Intel Core 7 240H (10488 - 16588, n=5) | |
| MSI Cyborg 15 B2RWEKG | |
| Cinebench R23 / Single Core | |
| Medion Erazer Major 16 X1 MD62736 | |
| Average of class Gaming (1166 - 2356, n=113, last 2 years) | |
| Medion Erazer Deputy 15 P1 MD62761 | |
| Gigabyte Gaming A16 GA6H | |
| Alienware 16 Aurora | |
| Average Intel Core 7 240H (1649 - 1905, n=5) | |
| MSI Cyborg 15 B2RWEKG | |
| Gigabyte Gaming A16 Pro GA6DH (Core 7 240H, RTX 5070 Ti) | |
| Cinebench R20 / CPU (Multi Core) | |
| Medion Erazer Major 16 X1 MD62736 | |
| Average of class Gaming (4029 - 16108, n=112, last 2 years) | |
| Medion Erazer Deputy 15 P1 MD62761 | |
| Alienware 16 Aurora | |
| Gigabyte Gaming A16 Pro GA6DH (Core 7 240H, RTX 5070 Ti) | |
| Gigabyte Gaming A16 GA6H | |
| Average Intel Core 7 240H (4535 - 6386, n=5) | |
| MSI Cyborg 15 B2RWEKG | |
| Cinebench R20 / CPU (Single Core) | |
| Medion Erazer Major 16 X1 MD62736 | |
| Average of class Gaming (442 - 895, n=112, last 2 years) | |
| Medion Erazer Deputy 15 P1 MD62761 | |
| Gigabyte Gaming A16 GA6H | |
| Alienware 16 Aurora | |
| Average Intel Core 7 240H (633 - 730, n=5) | |
| MSI Cyborg 15 B2RWEKG | |
| Gigabyte Gaming A16 Pro GA6DH (Core 7 240H, RTX 5070 Ti) | |
| Cinebench R15 / CPU Multi 64Bit | |
| Medion Erazer Major 16 X1 MD62736 | |
| Average of class Gaming (1578 - 6271, n=113, last 2 years) | |
| Medion Erazer Deputy 15 P1 MD62761 | |
| Alienware 16 Aurora | |
| Gigabyte Gaming A16 Pro GA6DH (Core 7 240H, RTX 5070 Ti) | |
| Average Intel Core 7 240H (1800 - 2582, n=5) | |
| Gigabyte Gaming A16 GA6H | |
| MSI Cyborg 15 B2RWEKG | |
| Cinebench R15 / CPU Single 64Bit | |
| Medion Erazer Major 16 X1 MD62736 | |
| Medion Erazer Deputy 15 P1 MD62761 | |
| Average of class Gaming (188.8 - 343, n=112, last 2 years) | |
| Alienware 16 Aurora | |
| Gigabyte Gaming A16 GA6H | |
| Average Intel Core 7 240H (242 - 276, n=5) | |
| MSI Cyborg 15 B2RWEKG | |
| Gigabyte Gaming A16 Pro GA6DH (Core 7 240H, RTX 5070 Ti) | |
| Blender / v2.79 BMW27 CPU | |
| MSI Cyborg 15 B2RWEKG | |
| Average Intel Core 7 240H (195 - 281, n=5) | |
| Gigabyte Gaming A16 GA6H | |
| Gigabyte Gaming A16 Pro GA6DH (Core 7 240H, RTX 5070 Ti) | |
| Alienware 16 Aurora | |
| Medion Erazer Deputy 15 P1 MD62761 | |
| Average of class Gaming (80 - 330, n=110, last 2 years) | |
| Medion Erazer Major 16 X1 MD62736 | |
| 7-Zip 18.03 / 7z b 4 | |
| Medion Erazer Major 16 X1 MD62736 | |
| Average of class Gaming (33491 - 148086, n=111, last 2 years) | |
| Medion Erazer Deputy 15 P1 MD62761 | |
| Alienware 16 Aurora | |
| Gigabyte Gaming A16 Pro GA6DH (Core 7 240H, RTX 5070 Ti) | |
| Gigabyte Gaming A16 GA6H | |
| Average Intel Core 7 240H (45123 - 65058, n=5) | |
| MSI Cyborg 15 B2RWEKG | |
| 7-Zip 18.03 / 7z b 4 -mmt1 | |
| Medion Erazer Deputy 15 P1 MD62761 | |
| Medion Erazer Major 16 X1 MD62736 | |
| Average of class Gaming (4199 - 7436, n=111, last 2 years) | |
| Alienware 16 Aurora | |
| Gigabyte Gaming A16 GA6H | |
| Average Intel Core 7 240H (5061 - 6172, n=5) | |
| Gigabyte Gaming A16 Pro GA6DH (Core 7 240H, RTX 5070 Ti) | |
| MSI Cyborg 15 B2RWEKG | |
| Geekbench 6.7 / Multi-Core | |
| Medion Erazer Major 16 X1 MD62736 | |
| Average of class Gaming (6625 - 22104, n=112, last 2 years) | |
| Medion Erazer Deputy 15 P1 MD62761 | |
| Alienware 16 Aurora | |
| Gigabyte Gaming A16 Pro GA6DH (Core 7 240H, RTX 5070 Ti) | |
| Average Intel Core 7 240H (9713 - 13681, n=6) | |
| Gigabyte Gaming A16 GA6H | |
| MSI Cyborg 15 B2RWEKG | |
| Geekbench 6.7 / Single-Core | |
| Medion Erazer Major 16 X1 MD62736 | |
| Average of class Gaming (1490 - 3259, n=112, last 2 years) | |
| Medion Erazer Deputy 15 P1 MD62761 | |
| Alienware 16 Aurora | |
| Average Intel Core 7 240H (2348 - 2648, n=6) | |
| Gigabyte Gaming A16 GA6H | |
| MSI Cyborg 15 B2RWEKG | |
| Gigabyte Gaming A16 Pro GA6DH (Core 7 240H, RTX 5070 Ti) | |
| Geekbench 5.5 / Multi-Core | |
| Medion Erazer Major 16 X1 MD62736 | |
| Average of class Gaming (6460 - 27010, n=111, last 2 years) | |
| Medion Erazer Deputy 15 P1 MD62761 | |
| Alienware 16 Aurora | |
| Gigabyte Gaming A16 Pro GA6DH (Core 7 240H, RTX 5070 Ti) | |
| Average Intel Core 7 240H (8072 - 12276, n=5) | |
| Gigabyte Gaming A16 GA6H | |
| MSI Cyborg 15 B2RWEKG | |
| Geekbench 5.5 / Single-Core | |
| Medion Erazer Major 16 X1 MD62736 | |
| Average of class Gaming (986 - 2474, n=111, last 2 years) | |
| Medion Erazer Deputy 15 P1 MD62761 | |
| Alienware 16 Aurora | |
| Gigabyte Gaming A16 GA6H | |
| Average Intel Core 7 240H (1644 - 1862, n=5) | |
| MSI Cyborg 15 B2RWEKG | |
| Gigabyte Gaming A16 Pro GA6DH (Core 7 240H, RTX 5070 Ti) | |
| HWBOT x265 Benchmark v2.2 / 4k Preset | |
| Medion Erazer Major 16 X1 MD62736 | |
| Average of class Gaming (11.5 - 44.3, n=111, last 2 years) | |
| Medion Erazer Deputy 15 P1 MD62761 | |
| Alienware 16 Aurora | |
| Gigabyte Gaming A16 Pro GA6DH (Core 7 240H, RTX 5070 Ti) | |
| Gigabyte Gaming A16 GA6H | |
| Average Intel Core 7 240H (12.7 - 19, n=5) | |
| MSI Cyborg 15 B2RWEKG | |
| LibreOffice / 20 Documents To PDF | |
| MSI Cyborg 15 B2RWEKG | |
| Gigabyte Gaming A16 Pro GA6DH (Core 7 240H, RTX 5070 Ti) | |
| Medion Erazer Deputy 15 P1 MD62761 | |
| Average Intel Core 7 240H (51.2 - 72.8, n=5) | |
| Gigabyte Gaming A16 GA6H | |
| Alienware 16 Aurora | |
| Average of class Gaming (19 - 88.8, n=111, last 2 years) | |
| Medion Erazer Major 16 X1 MD62736 | |
| R Benchmark 2.5 / Overall mean | |
| Gigabyte Gaming A16 Pro GA6DH (Core 7 240H, RTX 5070 Ti) | |
| MSI Cyborg 15 B2RWEKG | |
| Alienware 16 Aurora | |
| Average Intel Core 7 240H (0.4329 - 0.4992, n=5) | |
| Gigabyte Gaming A16 GA6H | |
| Average of class Gaming (0.3439 - 0.759, n=112, last 2 years) | |
| Medion Erazer Deputy 15 P1 MD62761 | |
| Medion Erazer Major 16 X1 MD62736 | |
* ... smaller is better
AIDA64: FP32 Ray-Trace | FPU Julia | CPU SHA3 | CPU Queen | FPU SinJulia | FPU Mandel | CPU AES | CPU ZLib | FP64 Ray-Trace | CPU PhotoWorxx | CPU CheckMate
| Performance rating | |
| Medion Erazer Major 16 X1 MD62736 -1! | |
| Average of class Gaming | |
| Medion Erazer Deputy 15 P1 MD62761 -1! | |
| Gigabyte Gaming A16 Pro GA6DH (Core 7 240H, RTX 5070 Ti) -1! | |
| Alienware 16 Aurora -1! | |
| Average Intel Core 7 240H | |
| MSI Cyborg 15 B2RWEKG -1! | |
| Gigabyte Gaming A16 GA6H -1! | |
| AIDA64 / FP32 Ray-Trace | |
| Medion Erazer Major 16 X1 MD62736 (v6.92.6600) | |
| Average of class Gaming (10227 - 85542, n=110, last 2 years) | |
| Medion Erazer Deputy 15 P1 MD62761 (v6.92.6600) | |
| Gigabyte Gaming A16 Pro GA6DH (Core 7 240H, RTX 5070 Ti) (v8.20.8100) | |
| Alienware 16 Aurora (v6.92.6600) | |
| Average Intel Core 7 240H (11867 - 15972, n=5) | |
| Gigabyte Gaming A16 GA6H (v6.92.6600) | |
| MSI Cyborg 15 B2RWEKG (v6.92.6600) | |
| AIDA64 / FPU Julia | |
| Medion Erazer Major 16 X1 MD62736 (v6.92.6600) | |
| Average of class Gaming (51376 - 238426, n=110, last 2 years) | |
| Medion Erazer Deputy 15 P1 MD62761 (v6.92.6600) | |
| Gigabyte Gaming A16 Pro GA6DH (Core 7 240H, RTX 5070 Ti) (v8.20.8100) | |
| Alienware 16 Aurora (v6.92.6600) | |
| Average Intel Core 7 240H (59260 - 80238, n=5) | |
| Gigabyte Gaming A16 GA6H (v6.92.6600) | |
| MSI Cyborg 15 B2RWEKG (v6.92.6600) | |
| AIDA64 / CPU SHA3 | |
| Medion Erazer Major 16 X1 MD62736 (v6.92.6600) | |
| Average of class Gaming (2180 - 9817, n=110, last 2 years) | |
| Medion Erazer Deputy 15 P1 MD62761 (v6.92.6600) | |
| Gigabyte Gaming A16 Pro GA6DH (Core 7 240H, RTX 5070 Ti) (v8.20.8100) | |
| Alienware 16 Aurora (v6.92.6600) | |
| Average Intel Core 7 240H (2455 - 3287, n=5) | |
| Gigabyte Gaming A16 GA6H (v6.92.6600) | |
| MSI Cyborg 15 B2RWEKG (v6.92.6600) | |
| AIDA64 / CPU Queen | |
| Medion Erazer Major 16 X1 MD62736 (v6.92.6600) | |
| Average of class Gaming (49785 - 173351, n=101, last 2 years) | |
| Medion Erazer Deputy 15 P1 MD62761 (v6.92.6600) | |
| Alienware 16 Aurora (v6.92.6600) | |
| Average Intel Core 7 240H (75356 - 86602, n=3) | |
| Gigabyte Gaming A16 GA6H (v6.92.6600) | |
| MSI Cyborg 15 B2RWEKG (v6.92.6600) | |
| AIDA64 / FPU SinJulia | |
| Average of class Gaming (4424 - 33636, n=110, last 2 years) | |
| Medion Erazer Major 16 X1 MD62736 (v6.92.6600) | |
| Medion Erazer Deputy 15 P1 MD62761 (v6.92.6600) | |
| Gigabyte Gaming A16 Pro GA6DH (Core 7 240H, RTX 5070 Ti) (v8.20.8100) | |
| Alienware 16 Aurora (v6.92.6600) | |
| Average Intel Core 7 240H (7777 - 9366, n=5) | |
| Gigabyte Gaming A16 GA6H (v6.92.6600) | |
| MSI Cyborg 15 B2RWEKG (v6.92.6600) | |
| AIDA64 / FPU Mandel | |
| Medion Erazer Major 16 X1 MD62736 (v6.92.6600) | |
| Average of class Gaming (25115 - 128721, n=110, last 2 years) | |
| Medion Erazer Deputy 15 P1 MD62761 (v6.92.6600) | |
| Gigabyte Gaming A16 Pro GA6DH (Core 7 240H, RTX 5070 Ti) (v8.20.8100) | |
| Alienware 16 Aurora (v6.92.6600) | |
| Average Intel Core 7 240H (29381 - 39967, n=5) | |
| Gigabyte Gaming A16 GA6H (v6.92.6600) | |
| MSI Cyborg 15 B2RWEKG (v6.92.6600) | |
| AIDA64 / CPU AES | |
| Medion Erazer Major 16 X1 MD62736 (v6.92.6600) | |
| Average of class Gaming (39258 - 247074, n=110, last 2 years) | |
| Medion Erazer Deputy 15 P1 MD62761 (v6.92.6600) | |
| Gigabyte Gaming A16 Pro GA6DH (Core 7 240H, RTX 5070 Ti) (v8.20.8100) | |
| Alienware 16 Aurora (v6.92.6600) | |
| Average Intel Core 7 240H (50528 - 67855, n=5) | |
| Gigabyte Gaming A16 GA6H (v6.92.6600) | |
| MSI Cyborg 15 B2RWEKG (v6.92.6600) | |
| AIDA64 / CPU ZLib | |
| Medion Erazer Major 16 X1 MD62736 (v6.92.6600) | |
| Average of class Gaming (574 - 2531, n=110, last 2 years) | |
| Medion Erazer Deputy 15 P1 MD62761 (v6.92.6600) | |
| Gigabyte Gaming A16 Pro GA6DH (Core 7 240H, RTX 5070 Ti) (v8.20.8100) | |
| Alienware 16 Aurora (v6.92.6600) | |
| Average Intel Core 7 240H (725 - 951, n=5) | |
| Gigabyte Gaming A16 GA6H (v6.92.6600) | |
| MSI Cyborg 15 B2RWEKG (v6.92.6600) | |
| AIDA64 / FP64 Ray-Trace | |
| Medion Erazer Major 16 X1 MD62736 (v6.92.6600) | |
| Average of class Gaming (5509 - 45446, n=110, last 2 years) | |
| Medion Erazer Deputy 15 P1 MD62761 (v6.92.6600) | |
| Gigabyte Gaming A16 Pro GA6DH (Core 7 240H, RTX 5070 Ti) (v8.20.8100) | |
| Alienware 16 Aurora (v6.92.6600) | |
| Average Intel Core 7 240H (6389 - 8569, n=5) | |
| Gigabyte Gaming A16 GA6H (v6.92.6600) | |
| MSI Cyborg 15 B2RWEKG (v6.92.6600) | |
| AIDA64 / CPU PhotoWorxx | |
| Medion Erazer Major 16 X1 MD62736 (v6.92.6600) | |
| Gigabyte Gaming A16 Pro GA6DH (Core 7 240H, RTX 5070 Ti) (v8.20.8100) | |
| Average of class Gaming (12271 - 89891, n=110, last 2 years) | |
| Medion Erazer Deputy 15 P1 MD62761 (v6.92.6600) | |
| Alienware 16 Aurora (v6.92.6600) | |
| Average Intel Core 7 240H (21710 - 44874, n=5) | |
| MSI Cyborg 15 B2RWEKG (v6.92.6600) | |
| Gigabyte Gaming A16 GA6H (v6.92.6600) | |
| AIDA64 / CPU CheckMate | |
| Average of class Gaming (2930 - 8322, n=9, last 2 years) | |
| Gigabyte Gaming A16 Pro GA6DH (Core 7 240H, RTX 5070 Ti) (v8.20.8100) | |
| Average Intel Core 7 240H (2930 - 2938, n=2) | |
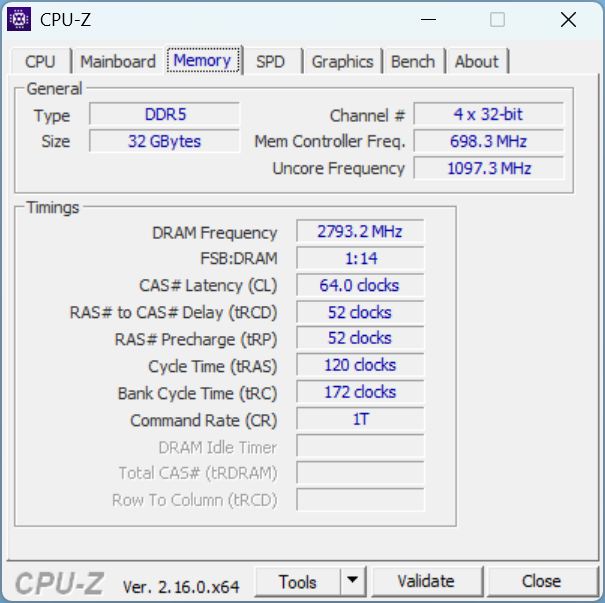
System performance
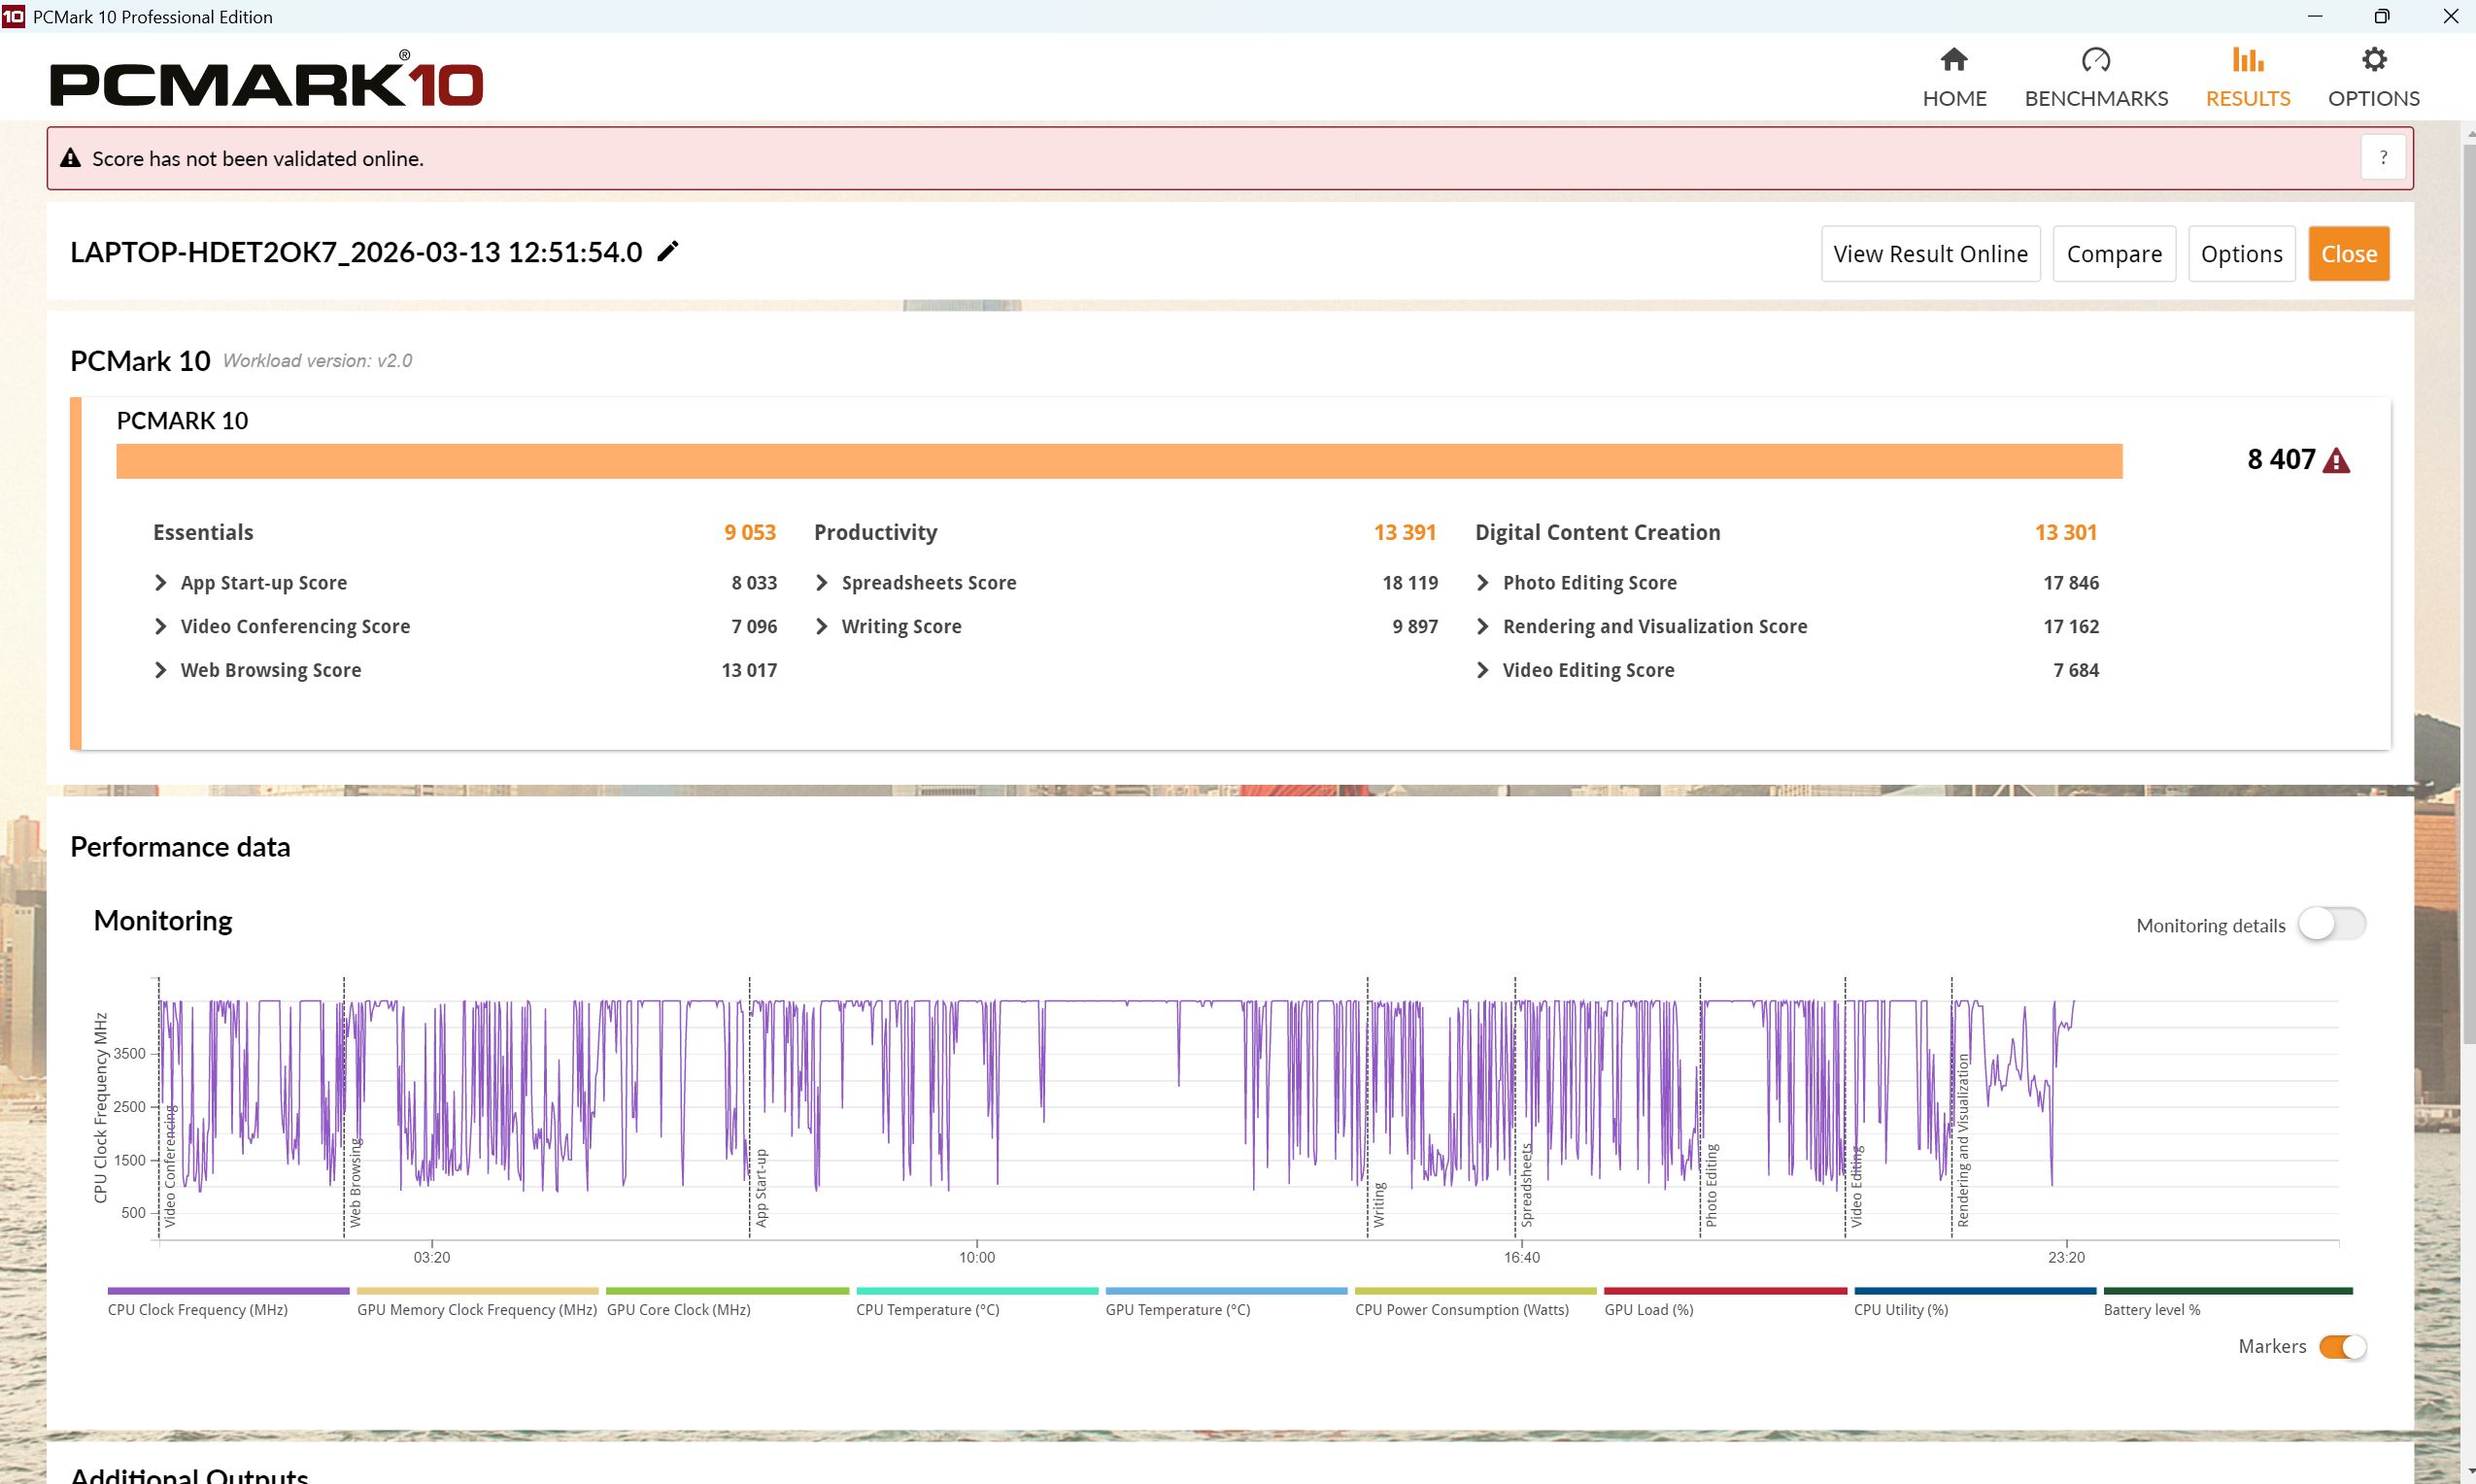
System benchmarks show the new A16 is barely faster than its predecessor and slower than many other RTX 5070 Ti gaming laptops. RAM is unlikely to be the bottleneck, as it remains competitive.
PCMark 10: Score | Essentials | Productivity | Digital Content Creation
CrossMark: Overall | Productivity | Creativity | Responsiveness
WebXPRT 3: Overall
WebXPRT 4: Overall
Mozilla Kraken 1.1: Total
| Performance rating | |
| Lenovo Legion 5 Pro 16IAX10H | |
| Acer Predator Helios Neo 16S AI PHN16S-71-94L9 | |
| Medion Erazer Major 16 X1 MD62736 | |
| Average of class Gaming | |
| Average Intel Core 7 240H, NVIDIA GeForce RTX 5070 Ti Laptop | |
| Gigabyte Gaming A16 Pro GA6DH (Core 7 240H, RTX 5070 Ti) | |
| Acer Nitro v 17 (ANV17-41-R4CJ) | |
| Gigabyte Gaming A16 GA6H | |
| PCMark 10 / Score | |
| Gigabyte Gaming A16 Pro GA6DH (Core 7 240H, RTX 5070 Ti) | |
| Acer Predator Helios Neo 16S AI PHN16S-71-94L9 | |
| Average Intel Core 7 240H, NVIDIA GeForce RTX 5070 Ti Laptop (8234 - 8407, n=2) | |
| Average of class Gaming (5828 - 11574, n=96, last 2 years) | |
| Lenovo Legion 5 Pro 16IAX10H | |
| Acer Nitro v 17 (ANV17-41-R4CJ) | |
| Medion Erazer Major 16 X1 MD62736 | |
| Gigabyte Gaming A16 GA6H | |
| PCMark 10 / Essentials | |
| Acer Predator Helios Neo 16S AI PHN16S-71-94L9 | |
| Medion Erazer Major 16 X1 MD62736 | |
| Lenovo Legion 5 Pro 16IAX10H | |
| Average of class Gaming (8810 - 12600, n=100, last 2 years) | |
| Gigabyte Gaming A16 GA6H | |
| Acer Nitro v 17 (ANV17-41-R4CJ) | |
| Average Intel Core 7 240H, NVIDIA GeForce RTX 5070 Ti Laptop (9053 - 9807, n=2) | |
| Gigabyte Gaming A16 Pro GA6DH (Core 7 240H, RTX 5070 Ti) | |
| PCMark 10 / Productivity | |
| Average Intel Core 7 240H, NVIDIA GeForce RTX 5070 Ti Laptop (13391 - 13612, n=2) | |
| Gigabyte Gaming A16 Pro GA6DH (Core 7 240H, RTX 5070 Ti) | |
| Acer Nitro v 17 (ANV17-41-R4CJ) | |
| Average of class Gaming (6845 - 18766, n=98, last 2 years) | |
| Acer Predator Helios Neo 16S AI PHN16S-71-94L9 | |
| Lenovo Legion 5 Pro 16IAX10H | |
| Medion Erazer Major 16 X1 MD62736 | |
| Gigabyte Gaming A16 GA6H | |
| PCMark 10 / Digital Content Creation | |
| Lenovo Legion 5 Pro 16IAX10H | |
| Acer Predator Helios Neo 16S AI PHN16S-71-94L9 | |
| Average of class Gaming (7602 - 19657, n=98, last 2 years) | |
| Gigabyte Gaming A16 Pro GA6DH (Core 7 240H, RTX 5070 Ti) | |
| Medion Erazer Major 16 X1 MD62736 | |
| Average Intel Core 7 240H, NVIDIA GeForce RTX 5070 Ti Laptop (11348 - 13301, n=2) | |
| Gigabyte Gaming A16 GA6H | |
| Acer Nitro v 17 (ANV17-41-R4CJ) | |
| CrossMark / Overall | |
| Lenovo Legion 5 Pro 16IAX10H | |
| Acer Predator Helios Neo 16S AI PHN16S-71-94L9 | |
| Medion Erazer Major 16 X1 MD62736 | |
| Average of class Gaming (1366 - 2409, n=98, last 2 years) | |
| Gigabyte Gaming A16 GA6H | |
| Average Intel Core 7 240H, NVIDIA GeForce RTX 5070 Ti Laptop (1740 - 1852, n=2) | |
| Gigabyte Gaming A16 Pro GA6DH (Core 7 240H, RTX 5070 Ti) | |
| Acer Nitro v 17 (ANV17-41-R4CJ) | |
| CrossMark / Productivity | |
| Lenovo Legion 5 Pro 16IAX10H | |
| Acer Predator Helios Neo 16S AI PHN16S-71-94L9 | |
| Medion Erazer Major 16 X1 MD62736 | |
| Average of class Gaming (1386 - 2254, n=98, last 2 years) | |
| Gigabyte Gaming A16 GA6H | |
| Acer Nitro v 17 (ANV17-41-R4CJ) | |
| Average Intel Core 7 240H, NVIDIA GeForce RTX 5070 Ti Laptop (1613 - 1732, n=2) | |
| Gigabyte Gaming A16 Pro GA6DH (Core 7 240H, RTX 5070 Ti) | |
| CrossMark / Creativity | |
| Lenovo Legion 5 Pro 16IAX10H | |
| Acer Predator Helios Neo 16S AI PHN16S-71-94L9 | |
| Medion Erazer Major 16 X1 MD62736 | |
| Average of class Gaming (1343 - 2729, n=98, last 2 years) | |
| Average Intel Core 7 240H, NVIDIA GeForce RTX 5070 Ti Laptop (1925 - 1996, n=2) | |
| Gigabyte Gaming A16 Pro GA6DH (Core 7 240H, RTX 5070 Ti) | |
| Gigabyte Gaming A16 GA6H | |
| Acer Nitro v 17 (ANV17-41-R4CJ) | |
| CrossMark / Responsiveness | |
| Lenovo Legion 5 Pro 16IAX10H | |
| Gigabyte Gaming A16 GA6H | |
| Acer Predator Helios Neo 16S AI PHN16S-71-94L9 | |
| Medion Erazer Major 16 X1 MD62736 | |
| Average Intel Core 7 240H, NVIDIA GeForce RTX 5070 Ti Laptop (1611 - 1809, n=2) | |
| Average of class Gaming (1226 - 2334, n=98, last 2 years) | |
| Gigabyte Gaming A16 Pro GA6DH (Core 7 240H, RTX 5070 Ti) | |
| Acer Nitro v 17 (ANV17-41-R4CJ) | |
| WebXPRT 3 / Overall | |
| Lenovo Legion 5 Pro 16IAX10H | |
| Acer Predator Helios Neo 16S AI PHN16S-71-94L9 | |
| Medion Erazer Major 16 X1 MD62736 | |
| Average of class Gaming (242 - 532, n=101, last 2 years) | |
| Acer Nitro v 17 (ANV17-41-R4CJ) | |
| Gigabyte Gaming A16 GA6H | |
| Gigabyte Gaming A16 Pro GA6DH (Core 7 240H, RTX 5070 Ti) | |
| Average Intel Core 7 240H, NVIDIA GeForce RTX 5070 Ti Laptop (257 - 264, n=2) | |
| WebXPRT 4 / Overall | |
| Lenovo Legion 5 Pro 16IAX10H | |
| Medion Erazer Major 16 X1 MD62736 | |
| Acer Predator Helios Neo 16S AI PHN16S-71-94L9 | |
| Average of class Gaming (176.4 - 354, n=101, last 2 years) | |
| Gigabyte Gaming A16 GA6H | |
| Average Intel Core 7 240H, NVIDIA GeForce RTX 5070 Ti Laptop (238 - 239, n=2) | |
| Gigabyte Gaming A16 Pro GA6DH (Core 7 240H, RTX 5070 Ti) | |
| Acer Nitro v 17 (ANV17-41-R4CJ) | |
| Mozilla Kraken 1.1 / Total | |
| Gigabyte Gaming A16 Pro GA6DH (Core 7 240H, RTX 5070 Ti) | |
| Average Intel Core 7 240H, NVIDIA GeForce RTX 5070 Ti Laptop (552 - 555, n=2) | |
| Acer Nitro v 17 (ANV17-41-R4CJ) | |
| Gigabyte Gaming A16 GA6H | |
| Average of class Gaming (391 - 590, n=106, last 2 years) | |
| Medion Erazer Major 16 X1 MD62736 | |
| Lenovo Legion 5 Pro 16IAX10H | |
| Acer Predator Helios Neo 16S AI PHN16S-71-94L9 | |
* ... smaller is better
| PCMark 10 Score | 8407 points | |
Help | ||
| AIDA64 / Memory Copy | |
| Acer Predator Helios Neo 16S AI PHN16S-71-94L9 | |
| Lenovo Legion 5 Pro 16IAX10H | |
| Medion Erazer Major 16 X1 MD62736 | |
| Average of class Gaming (21750 - 129946, n=110, last 2 years) | |
| Gigabyte Gaming A16 Pro GA6DH (Core 7 240H, RTX 5070 Ti) | |
| Average Intel Core 7 240H (34965 - 69215, n=5) | |
| Acer Nitro v 17 (ANV17-41-R4CJ) | |
| Gigabyte Gaming A16 GA6H | |
| AIDA64 / Memory Read | |
| Acer Predator Helios Neo 16S AI PHN16S-71-94L9 | |
| Lenovo Legion 5 Pro 16IAX10H | |
| Medion Erazer Major 16 X1 MD62736 | |
| Average of class Gaming (22956 - 118858, n=110, last 2 years) | |
| Gigabyte Gaming A16 Pro GA6DH (Core 7 240H, RTX 5070 Ti) | |
| Average Intel Core 7 240H (39706 - 71870, n=5) | |
| Gigabyte Gaming A16 GA6H | |
| Acer Nitro v 17 (ANV17-41-R4CJ) | |
| AIDA64 / Memory Write | |
| Medion Erazer Major 16 X1 MD62736 | |
| Acer Predator Helios Neo 16S AI PHN16S-71-94L9 | |
| Gigabyte Gaming A16 Pro GA6DH (Core 7 240H, RTX 5070 Ti) | |
| Lenovo Legion 5 Pro 16IAX10H | |
| Average of class Gaming (22297 - 135096, n=110, last 2 years) | |
| Average Intel Core 7 240H (33560 - 80488, n=5) | |
| Acer Nitro v 17 (ANV17-41-R4CJ) | |
| Gigabyte Gaming A16 GA6H | |
| AIDA64 / Memory Latency | |
| Lenovo Legion 5 Pro 16IAX10H | |
| Acer Predator Helios Neo 16S AI PHN16S-71-94L9 | |
| Medion Erazer Major 16 X1 MD62736 | |
| Average Intel Core 7 240H (97.1 - 125.6, n=5) | |
| Average of class Gaming (75.3 - 259, n=110, last 2 years) | |
| Gigabyte Gaming A16 GA6H | |
| Gigabyte Gaming A16 Pro GA6DH (Core 7 240H, RTX 5070 Ti) | |
| Acer Nitro v 17 (ANV17-41-R4CJ) | |
* ... smaller is better
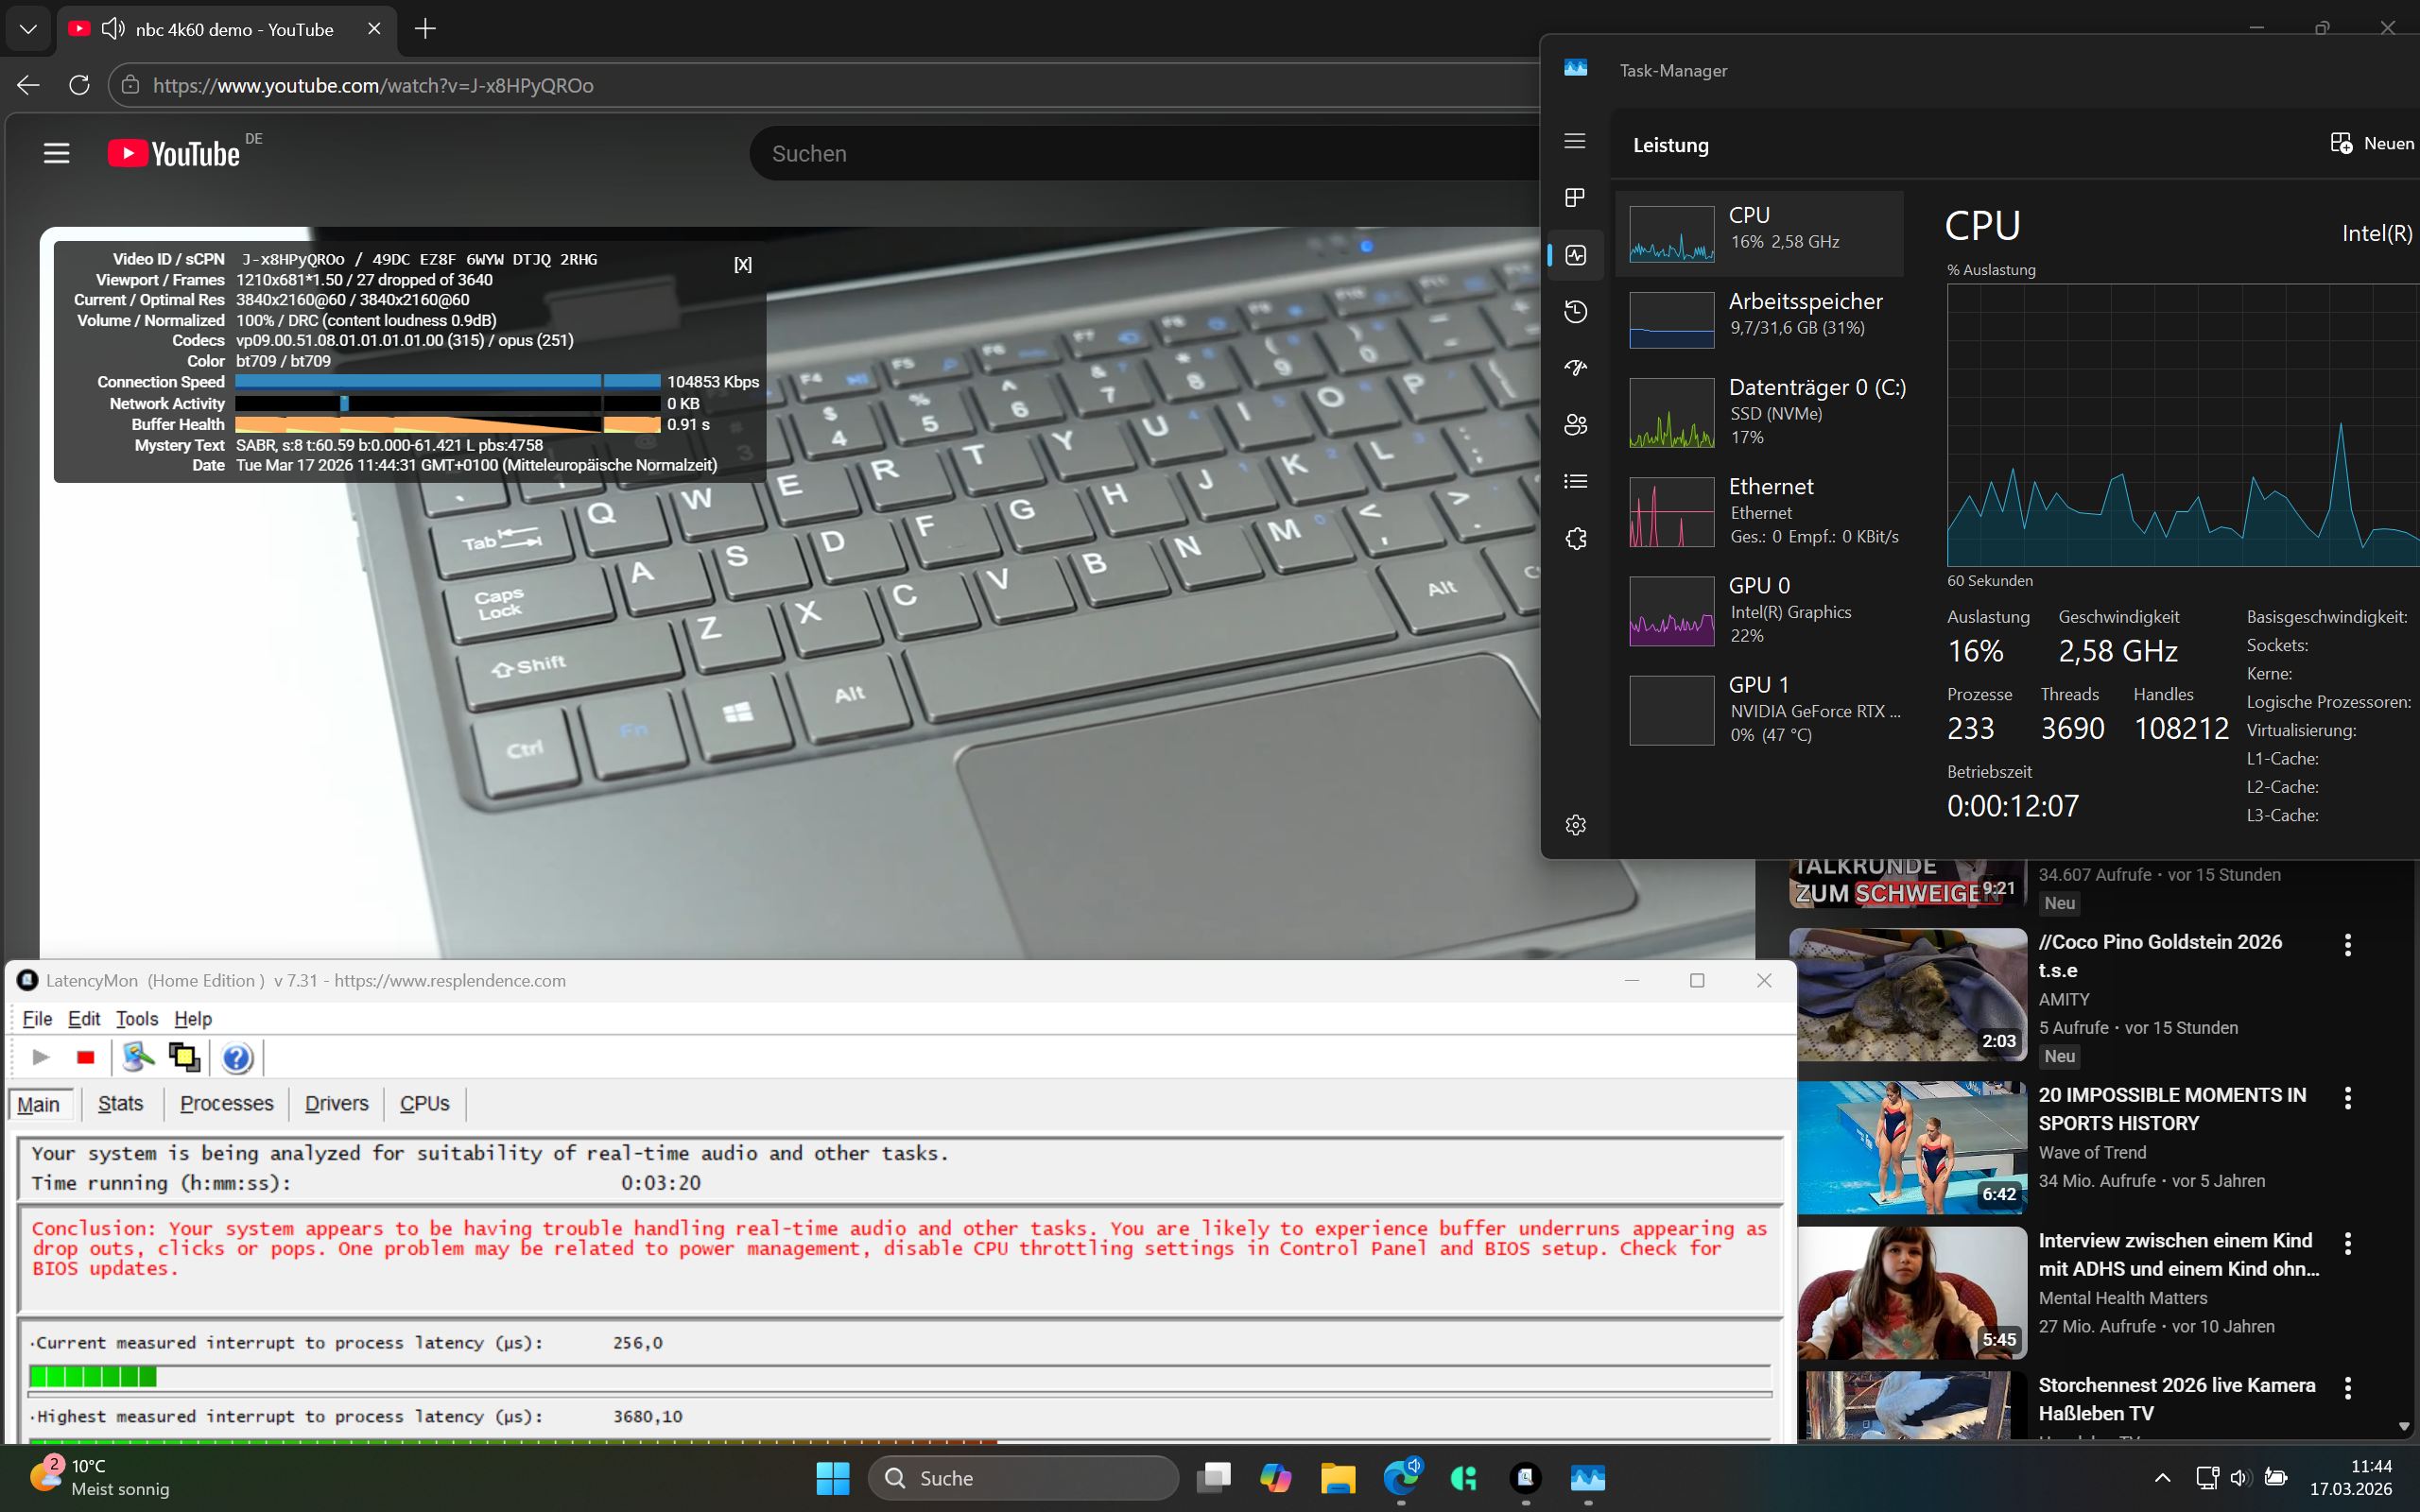
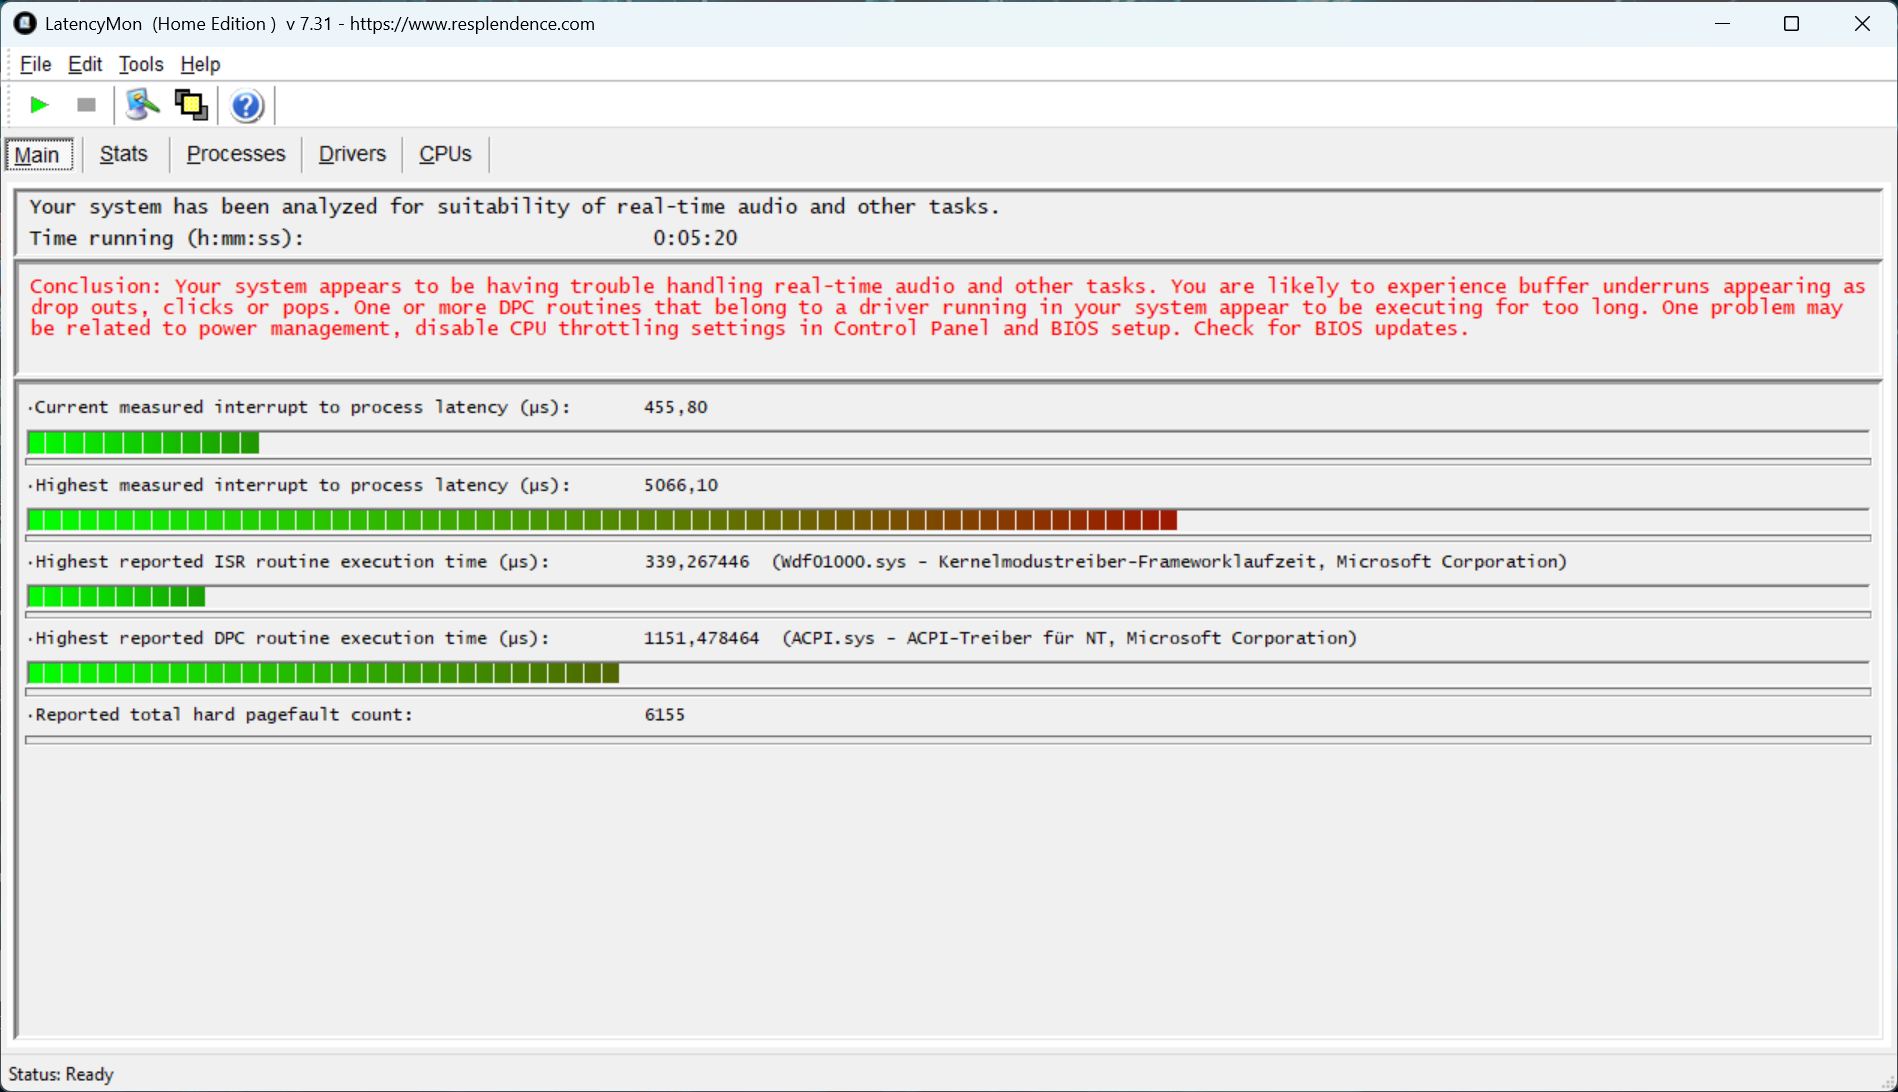
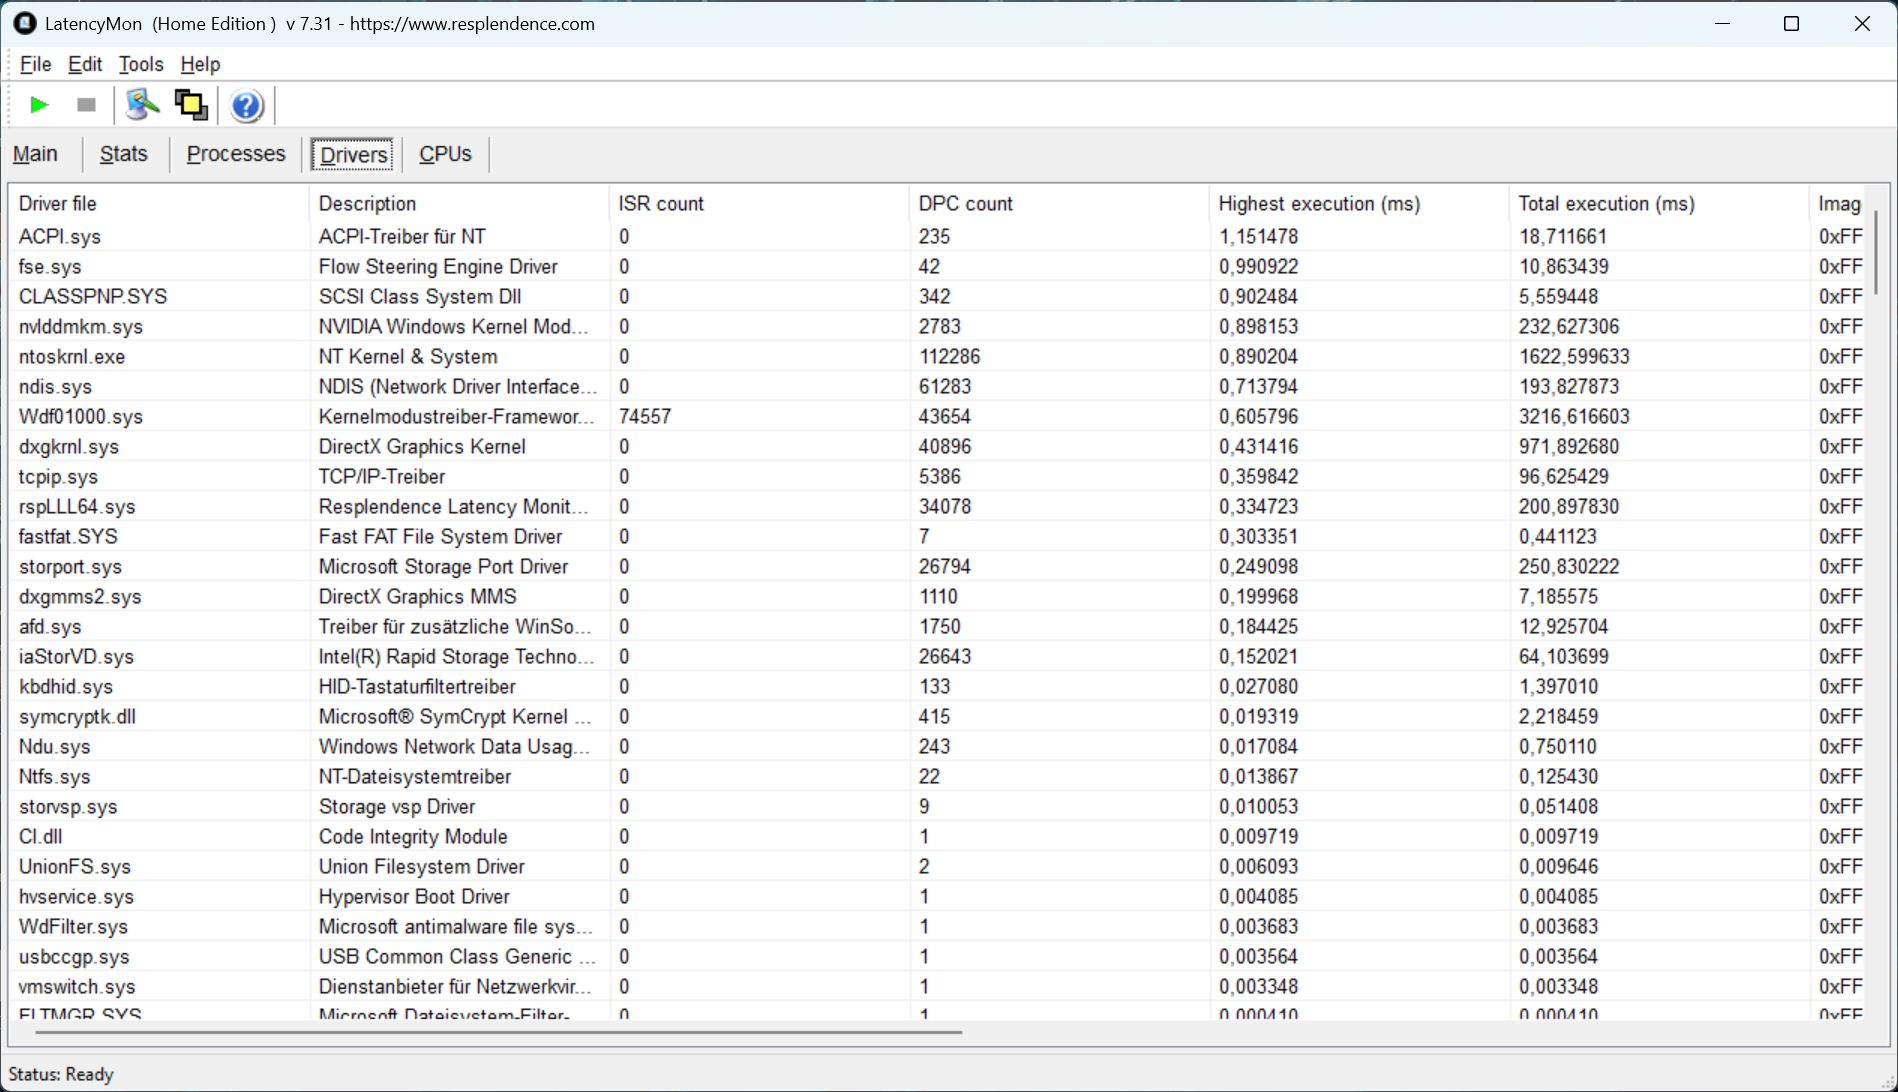
DPC latency
Latency issues appear when opening multiple browser tabs and increase significantly during YouTube playback, where 27 frames are dropped.
| DPC Latencies / LatencyMon - interrupt to process latency (max), Web, Youtube, Prime95 | |
| Gigabyte Gaming A16 Pro GA6DH (Core 7 240H, RTX 5070 Ti) | |
| Gigabyte Gaming A16 GA6H | |
| Medion Erazer Major 16 X1 MD62736 | |
| Acer Predator Helios Neo 16S AI PHN16S-71-94L9 | |
| Schenker XMG APEX 16 MAX | |
| Lenovo Legion 5 Pro 16IAX10H | |
* ... smaller is better
Mass storage
The 1 TB Samsung SSD is inherently very fast, but suffers from thermal throttling in the A16 Pro, leading to highly inconsistent transfer rates. This is disappointing, especially since the A16 had similar issues.

* ... smaller is better
Dauerleistung Lesen: DiskSpd Read Loop, Queue Depth 8
GPU performance
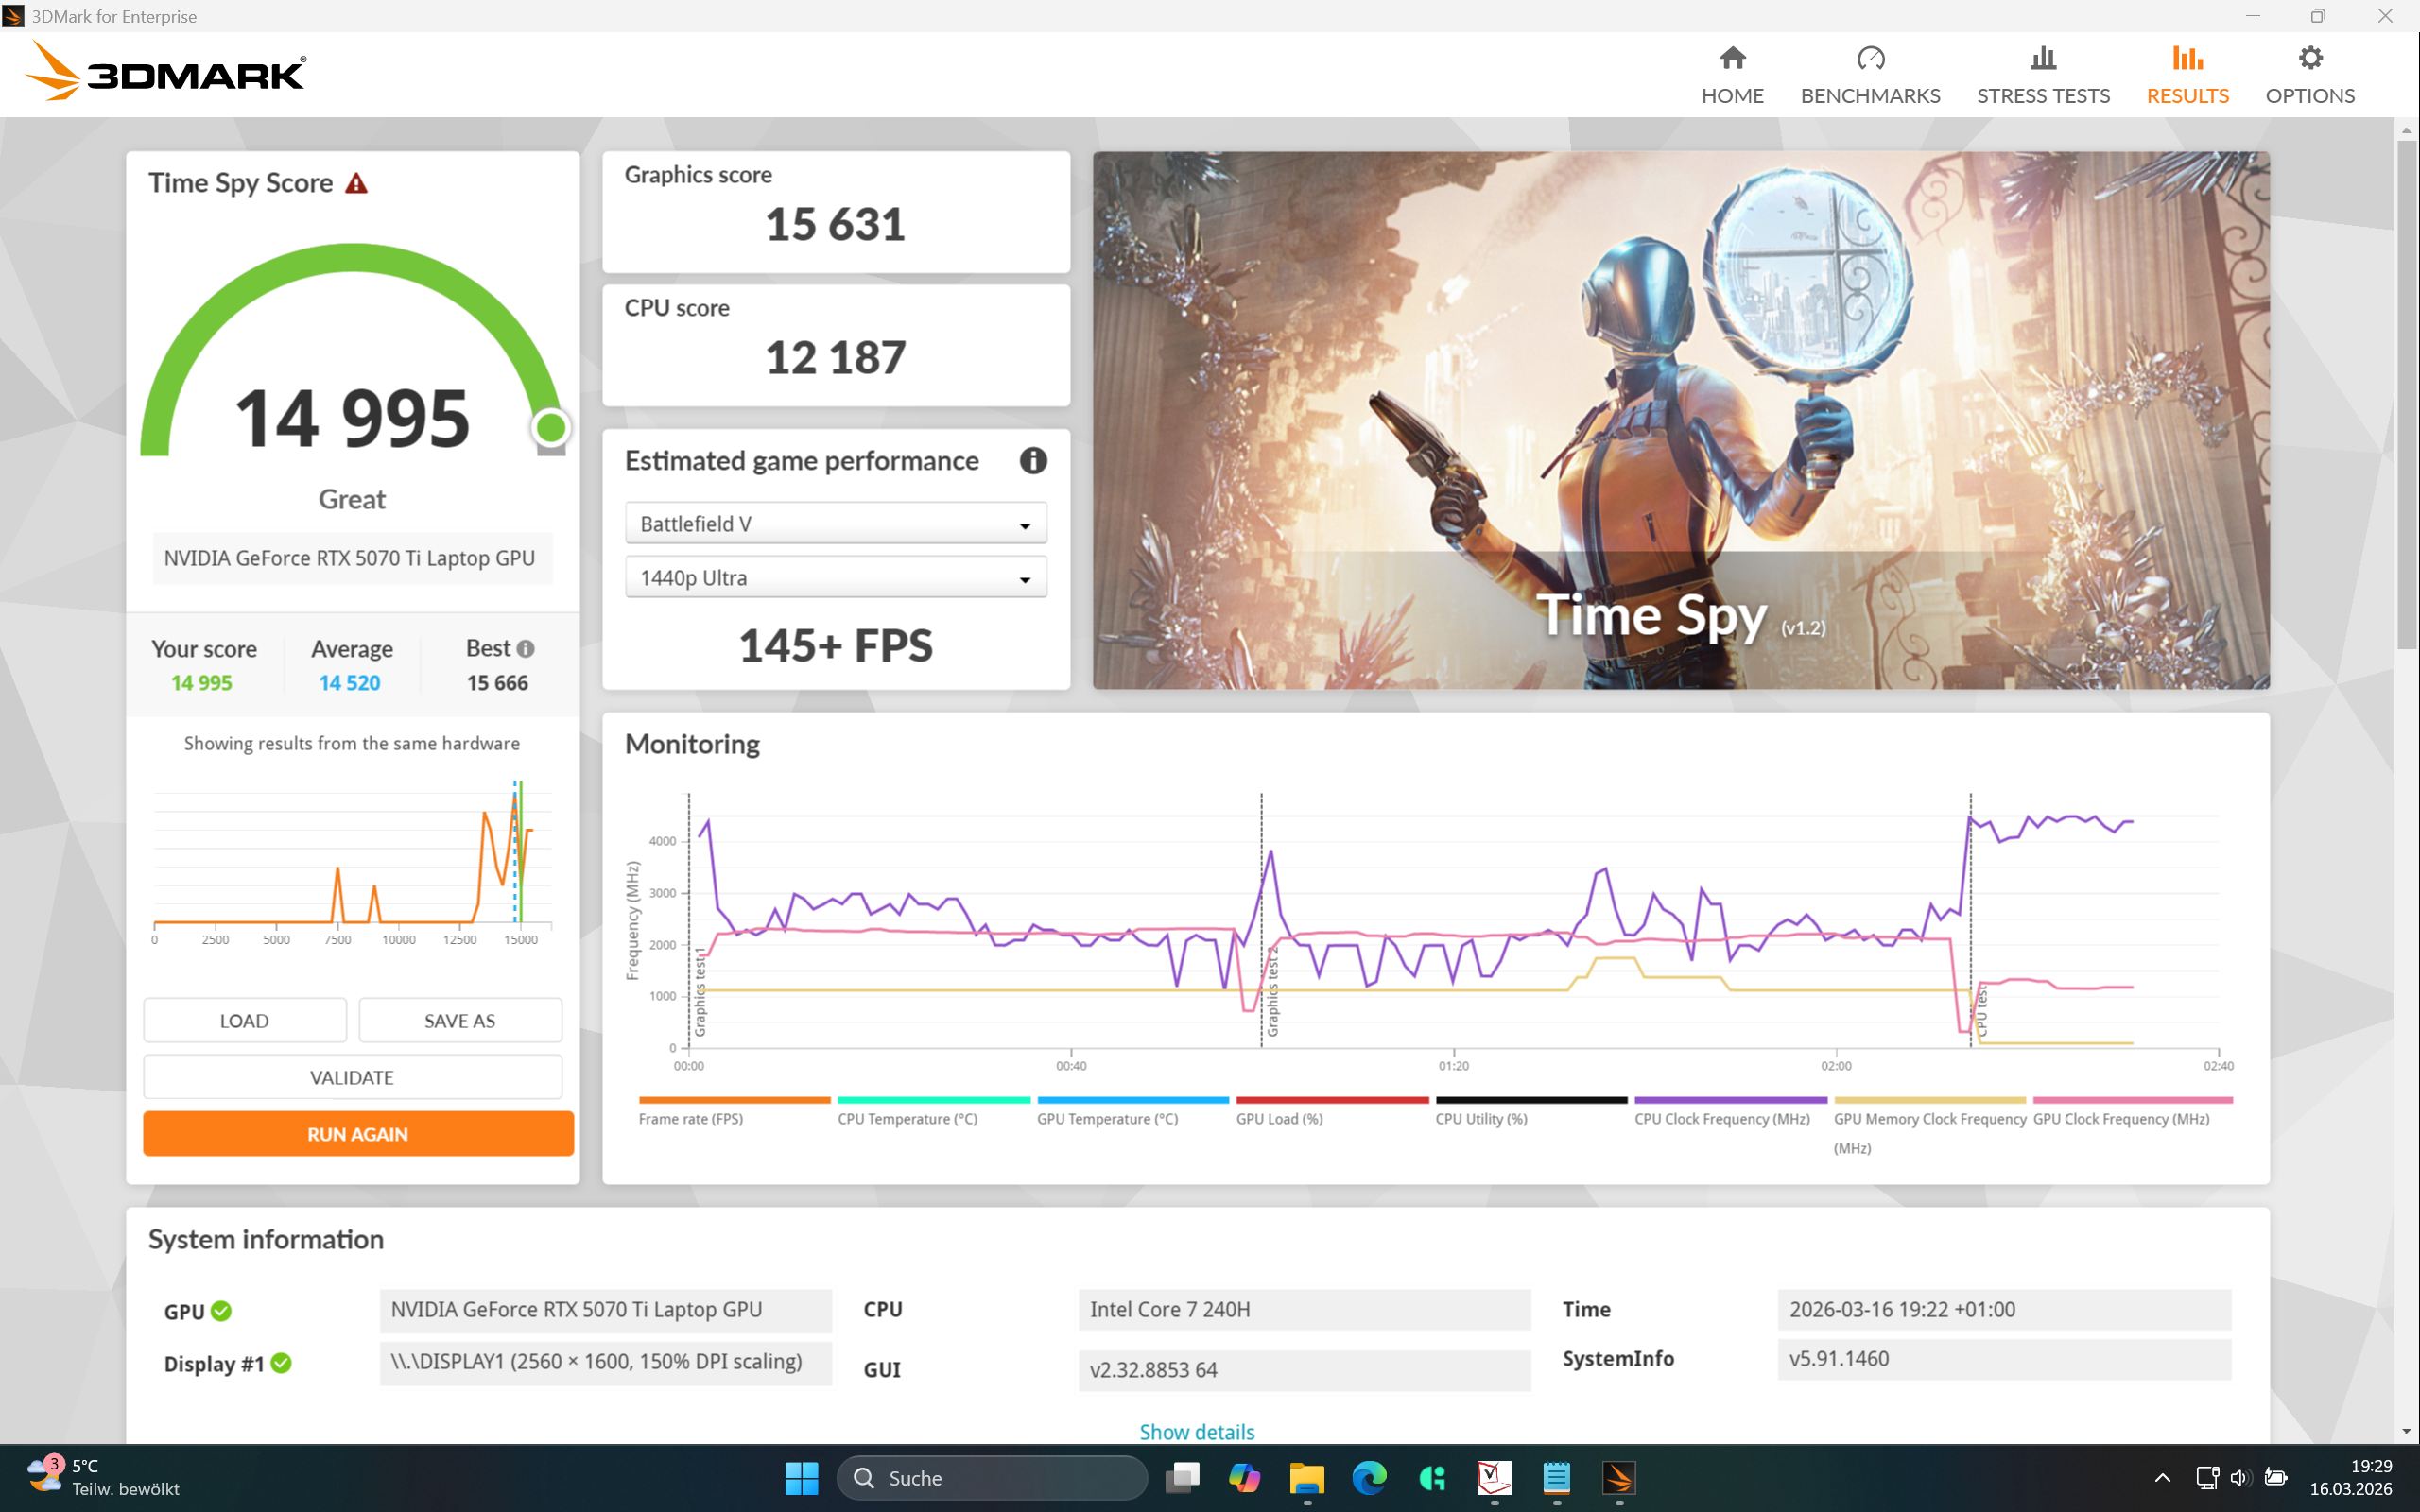
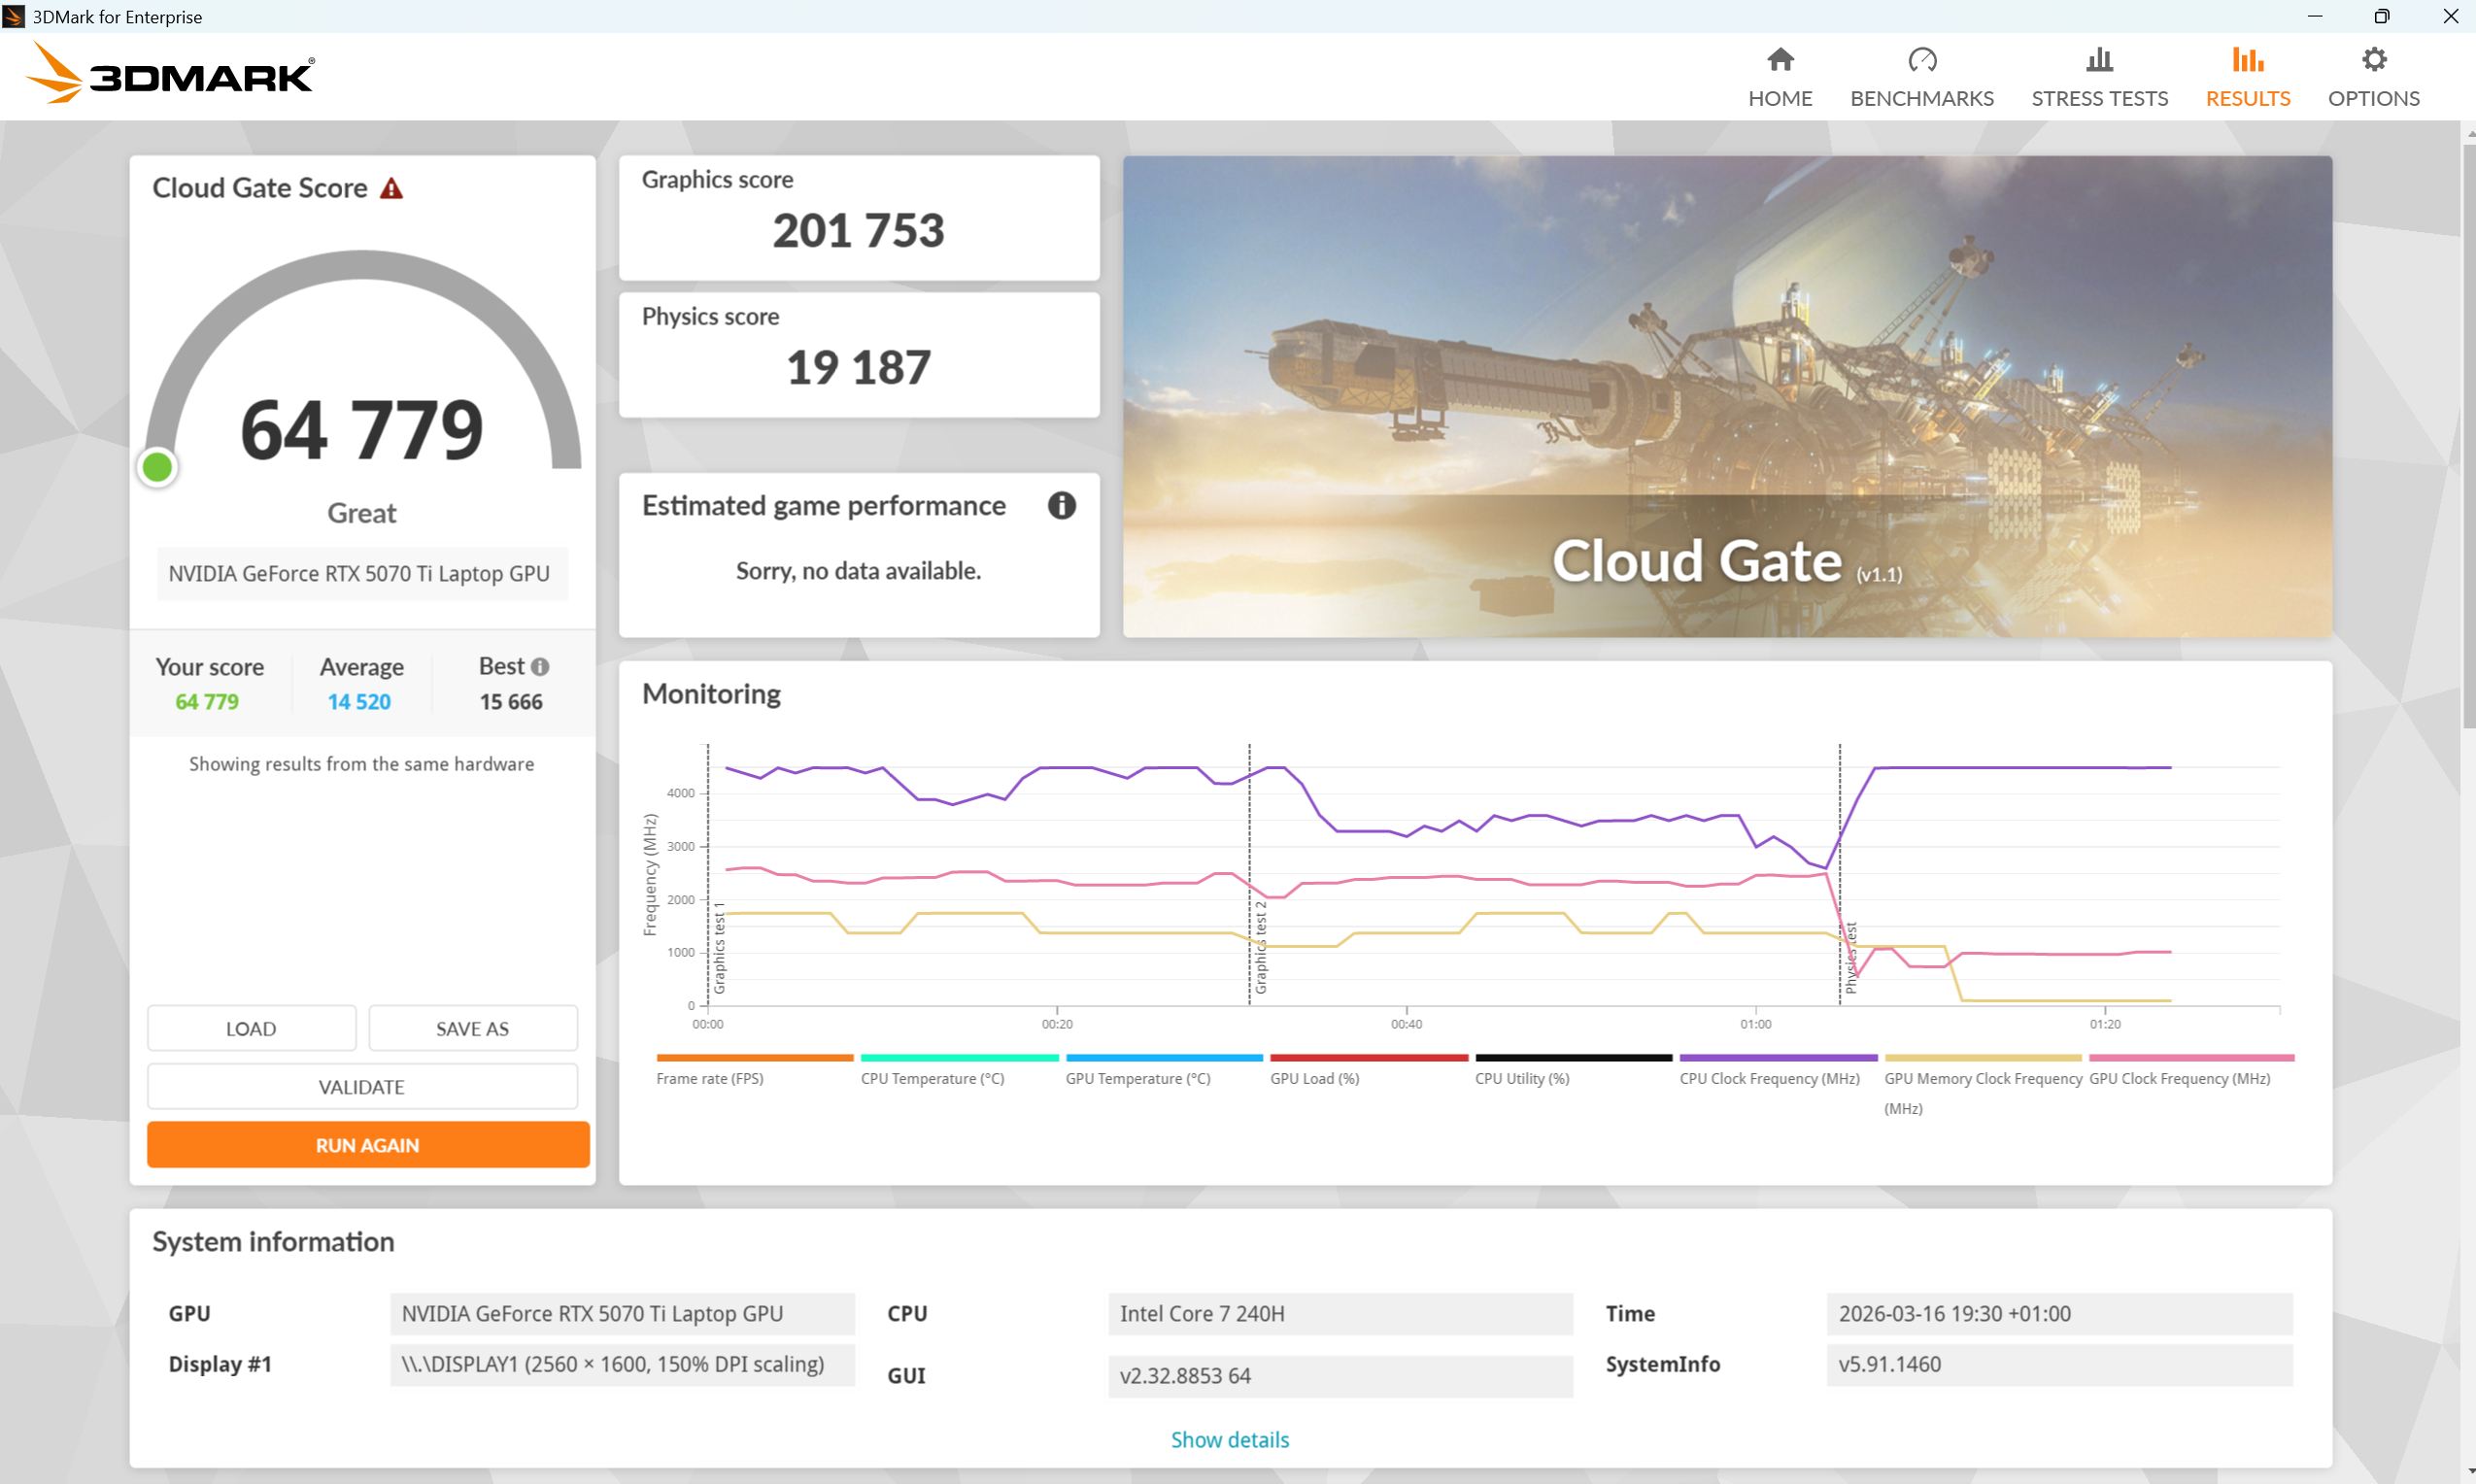
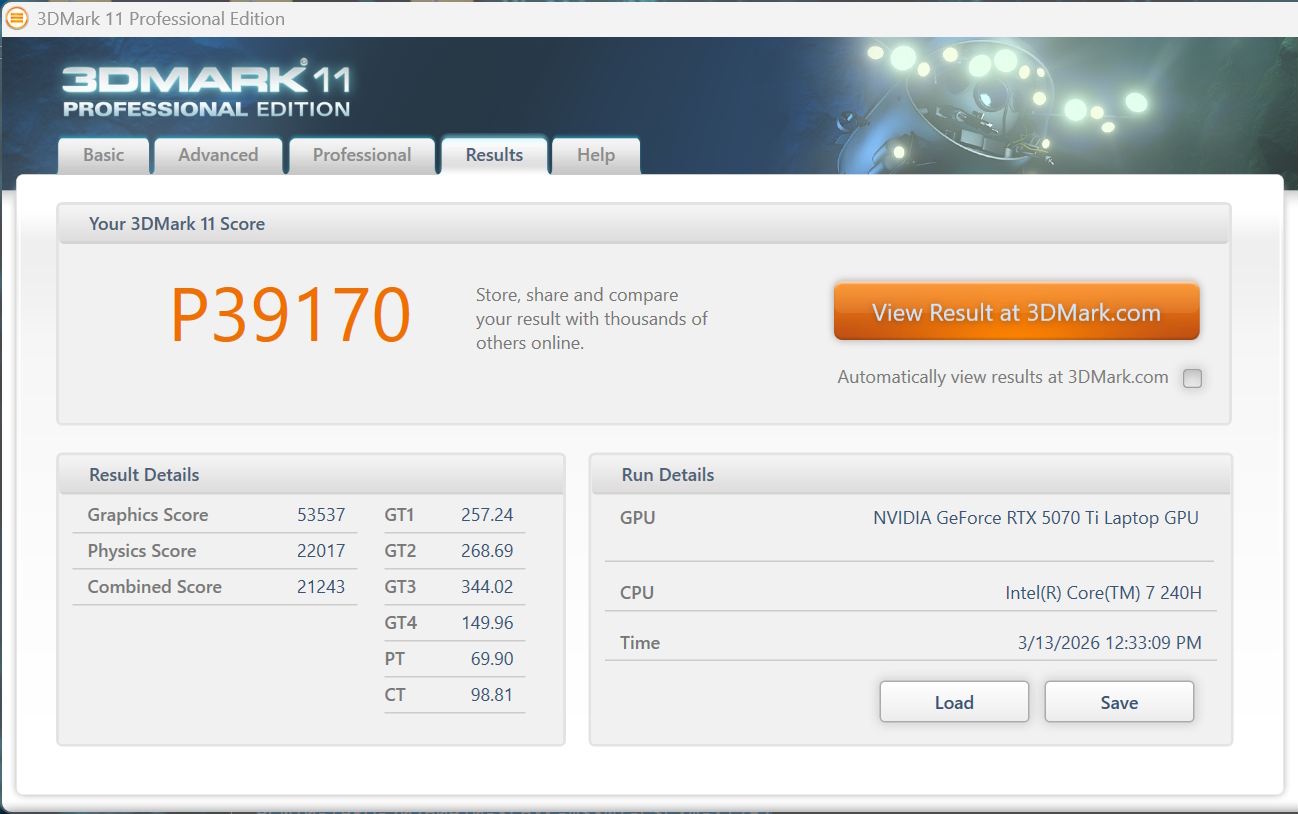
In synthetic benchmarks, the A16 Pro performs slightly lower than expected. Without being plugged in, 3D performance drops by around 63%.
| 3DMark 11 Performance | 39170 points | |
| 3DMark Cloud Gate Standard Score | 64779 points | |
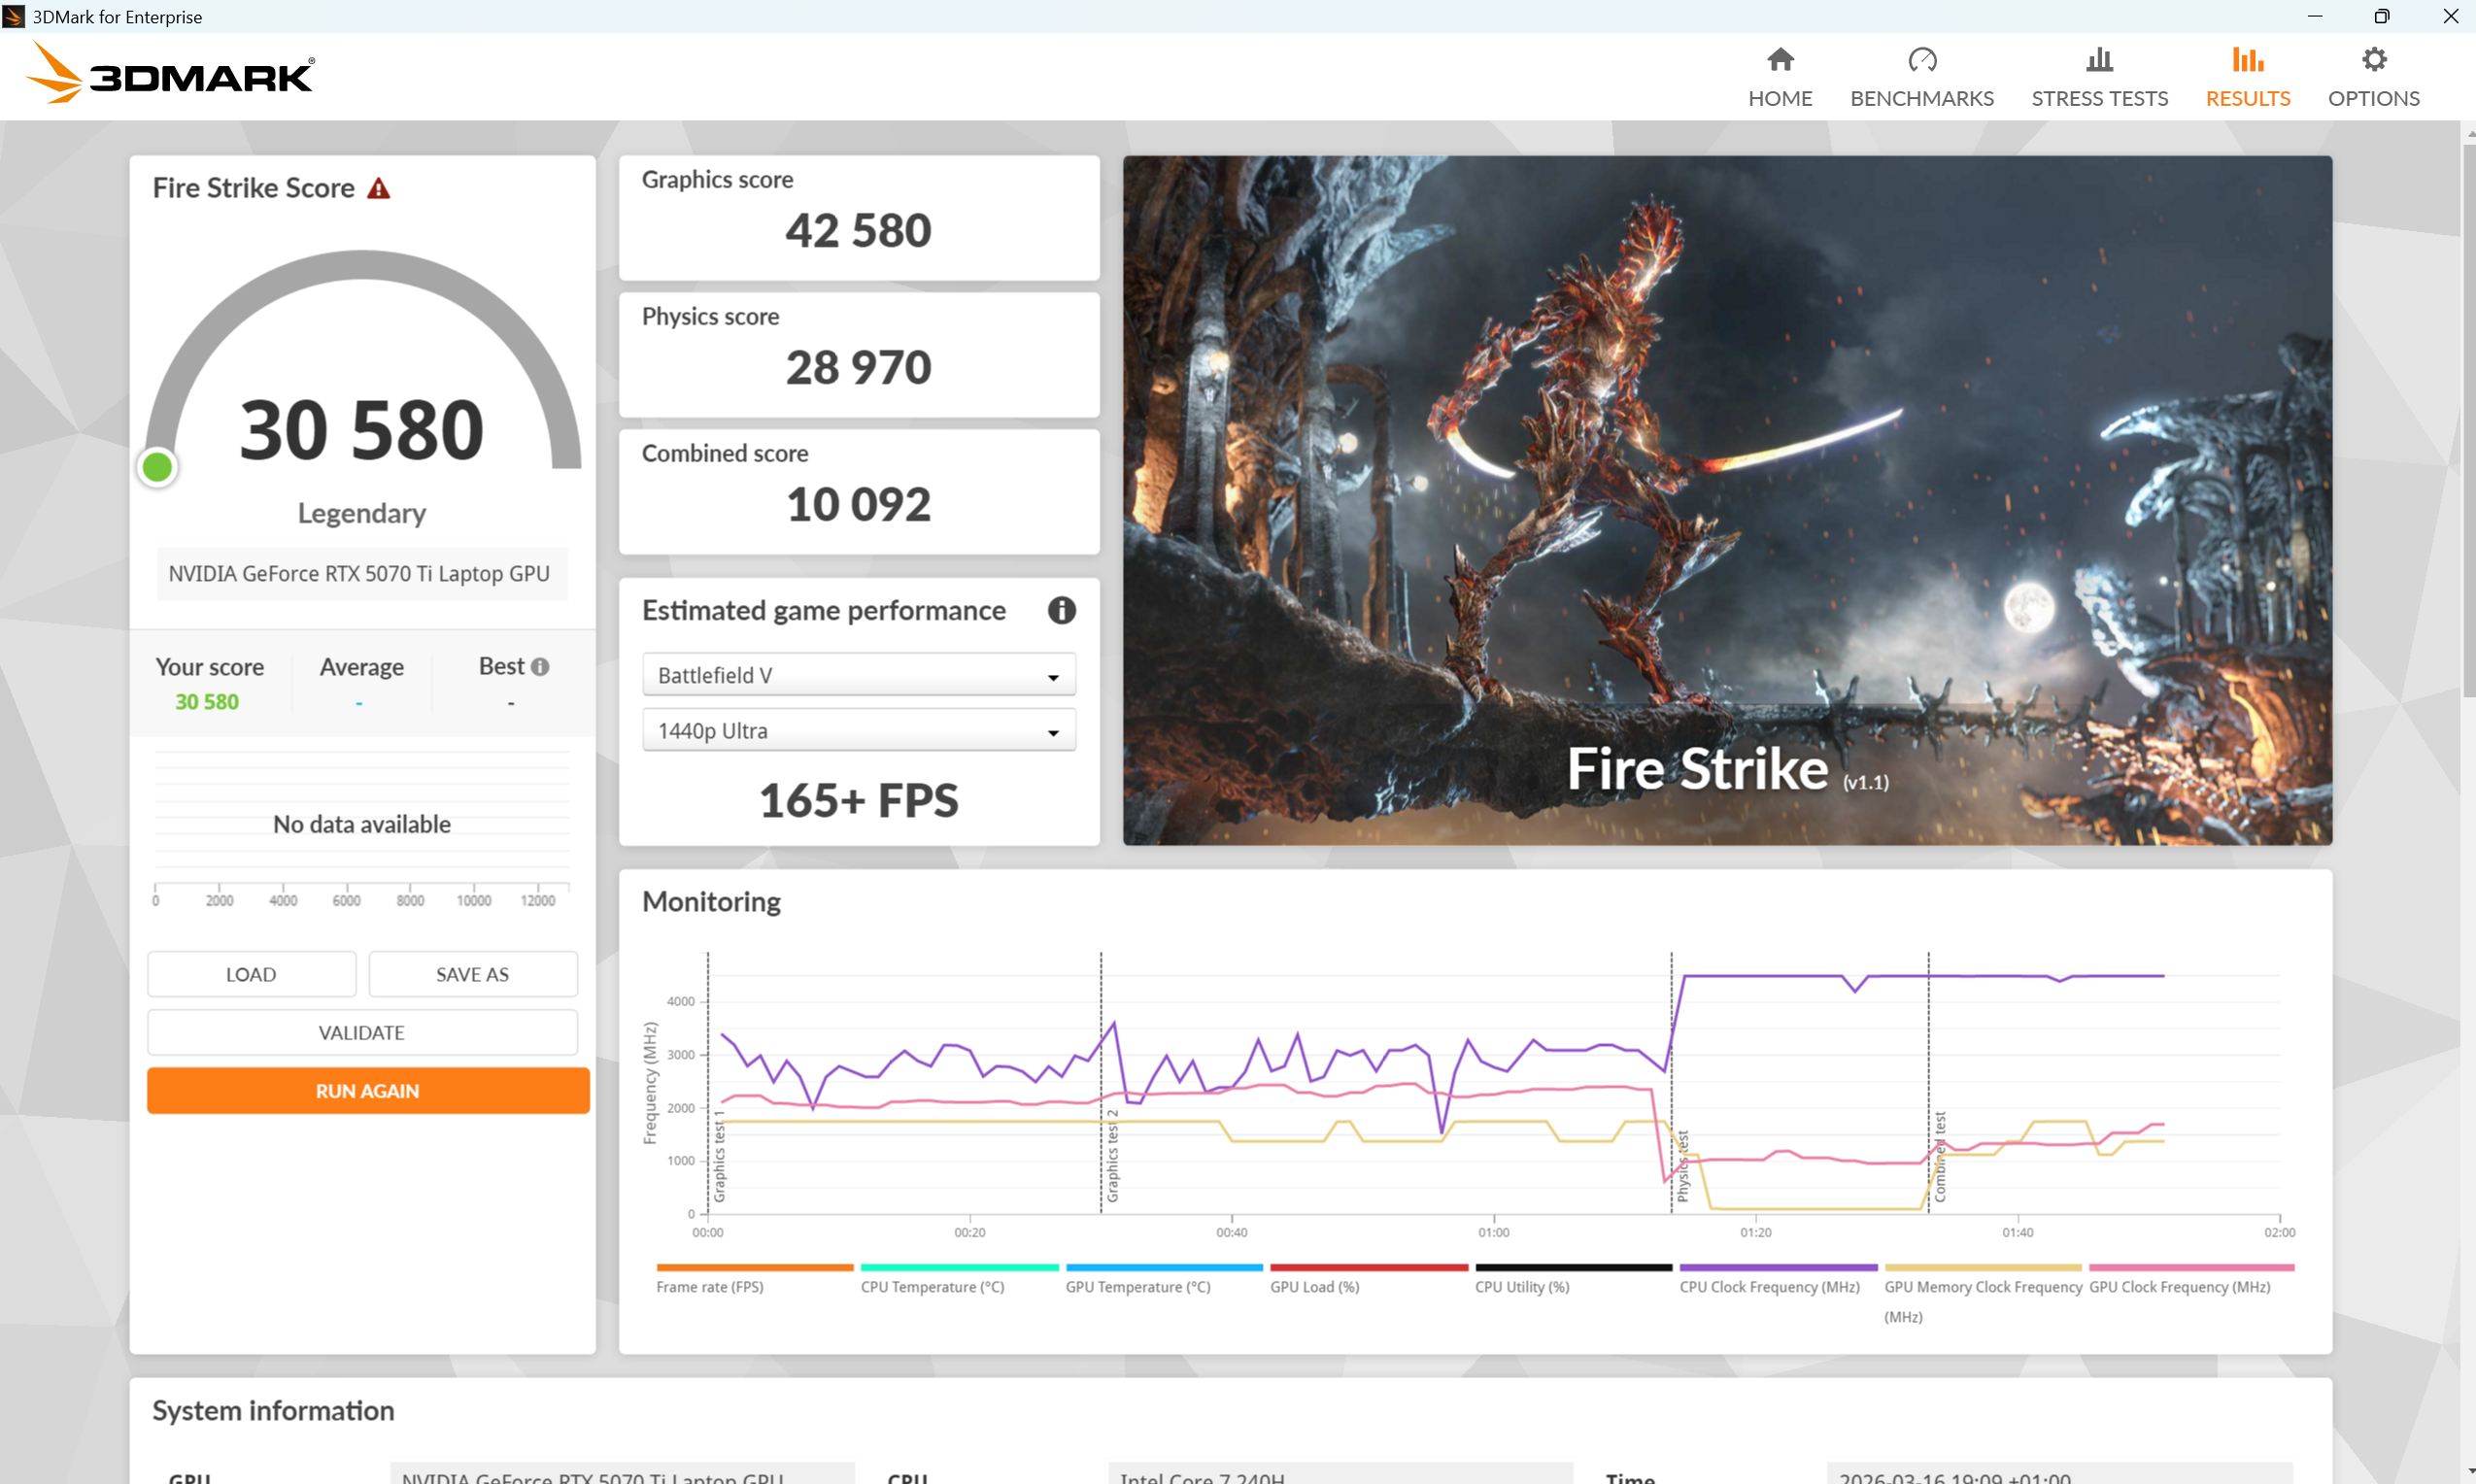
| 3DMark Fire Strike Score | 30580 points | |
| 3DMark Time Spy Score | 14995 points | |
Help | ||
* ... smaller is better
Gaming performance
While it doesn’t quite match competing systems, the A16 Pro handles native resolution comfortably. As long as path tracing isn’t involved (e.g., in F1 25), performance remains solid—and DLSS helps when needed. However, reaching the panel’s 165 Hz refresh rate is rare, even at Full HD.
| Final Fantasy XV Benchmark - 1920x1080 High Quality | |
| Lenovo Legion 5 Pro 16IAX10H | |
| Average of class Gaming (41 - 215, n=104, last 2 years) | |
| Acer Nitro v 17 (ANV17-41-R4CJ) | |
| Samsung Galaxy Book6 Ultra | |
| Gigabyte Gaming A16 Pro GA6DH (Core 7 240H, RTX 5070 Ti) | |
| Gigabyte Gaming A16 GA6H | |
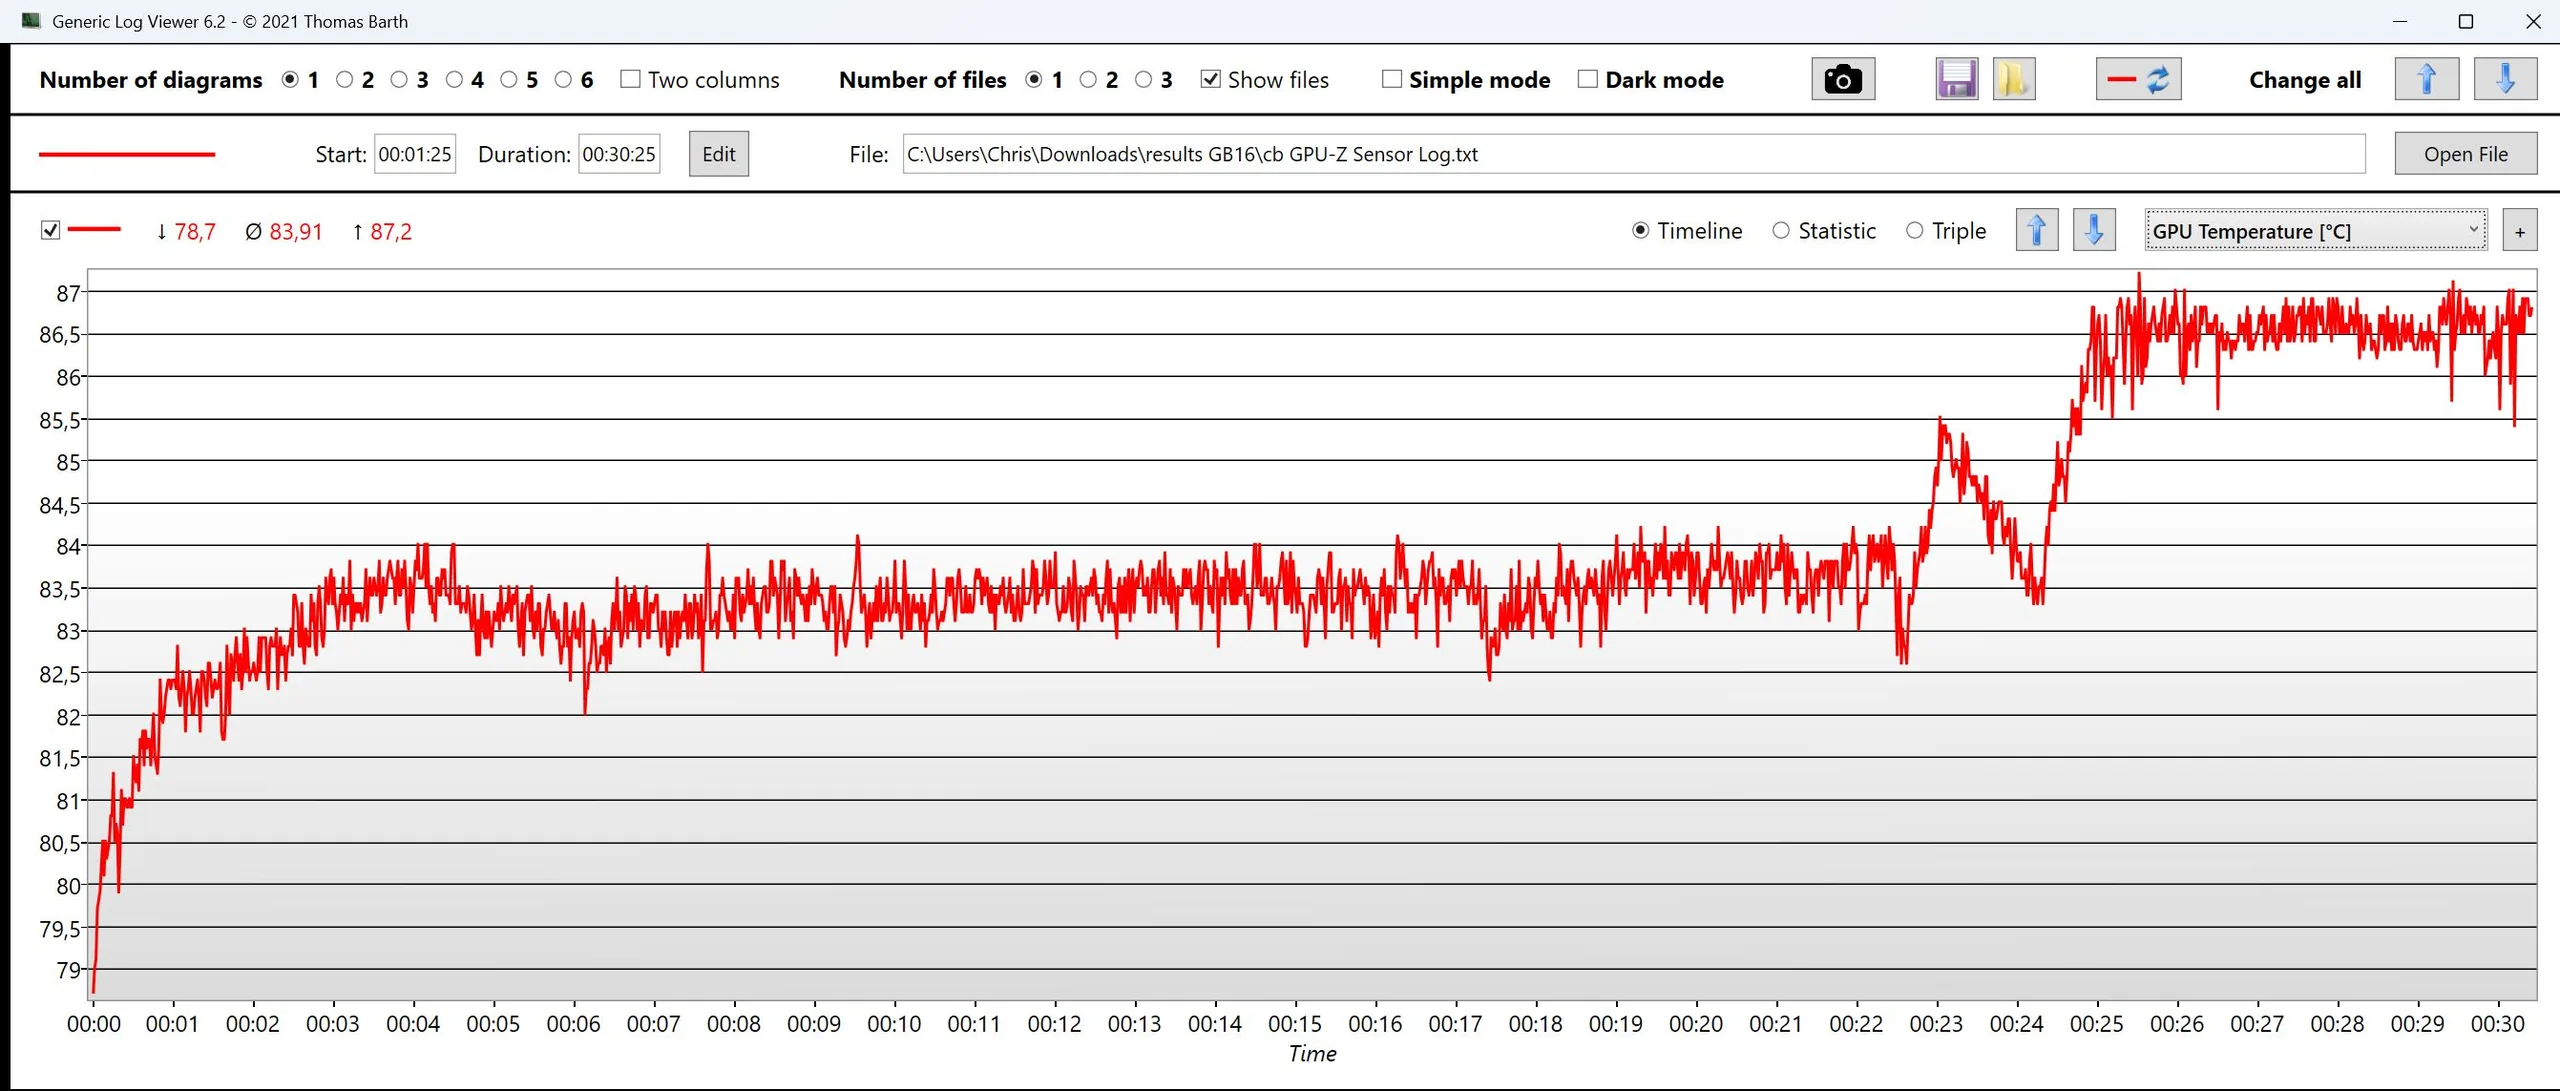
Sustained performance in Cyberpunk 2077 appears fairly stable, but data shows GPU temperatures steadily rising, leading to throttling after about 25 minutes. TGP is limited to 115 W but in games such as Cyberpunk 2077 it barely surpasses 95 W.
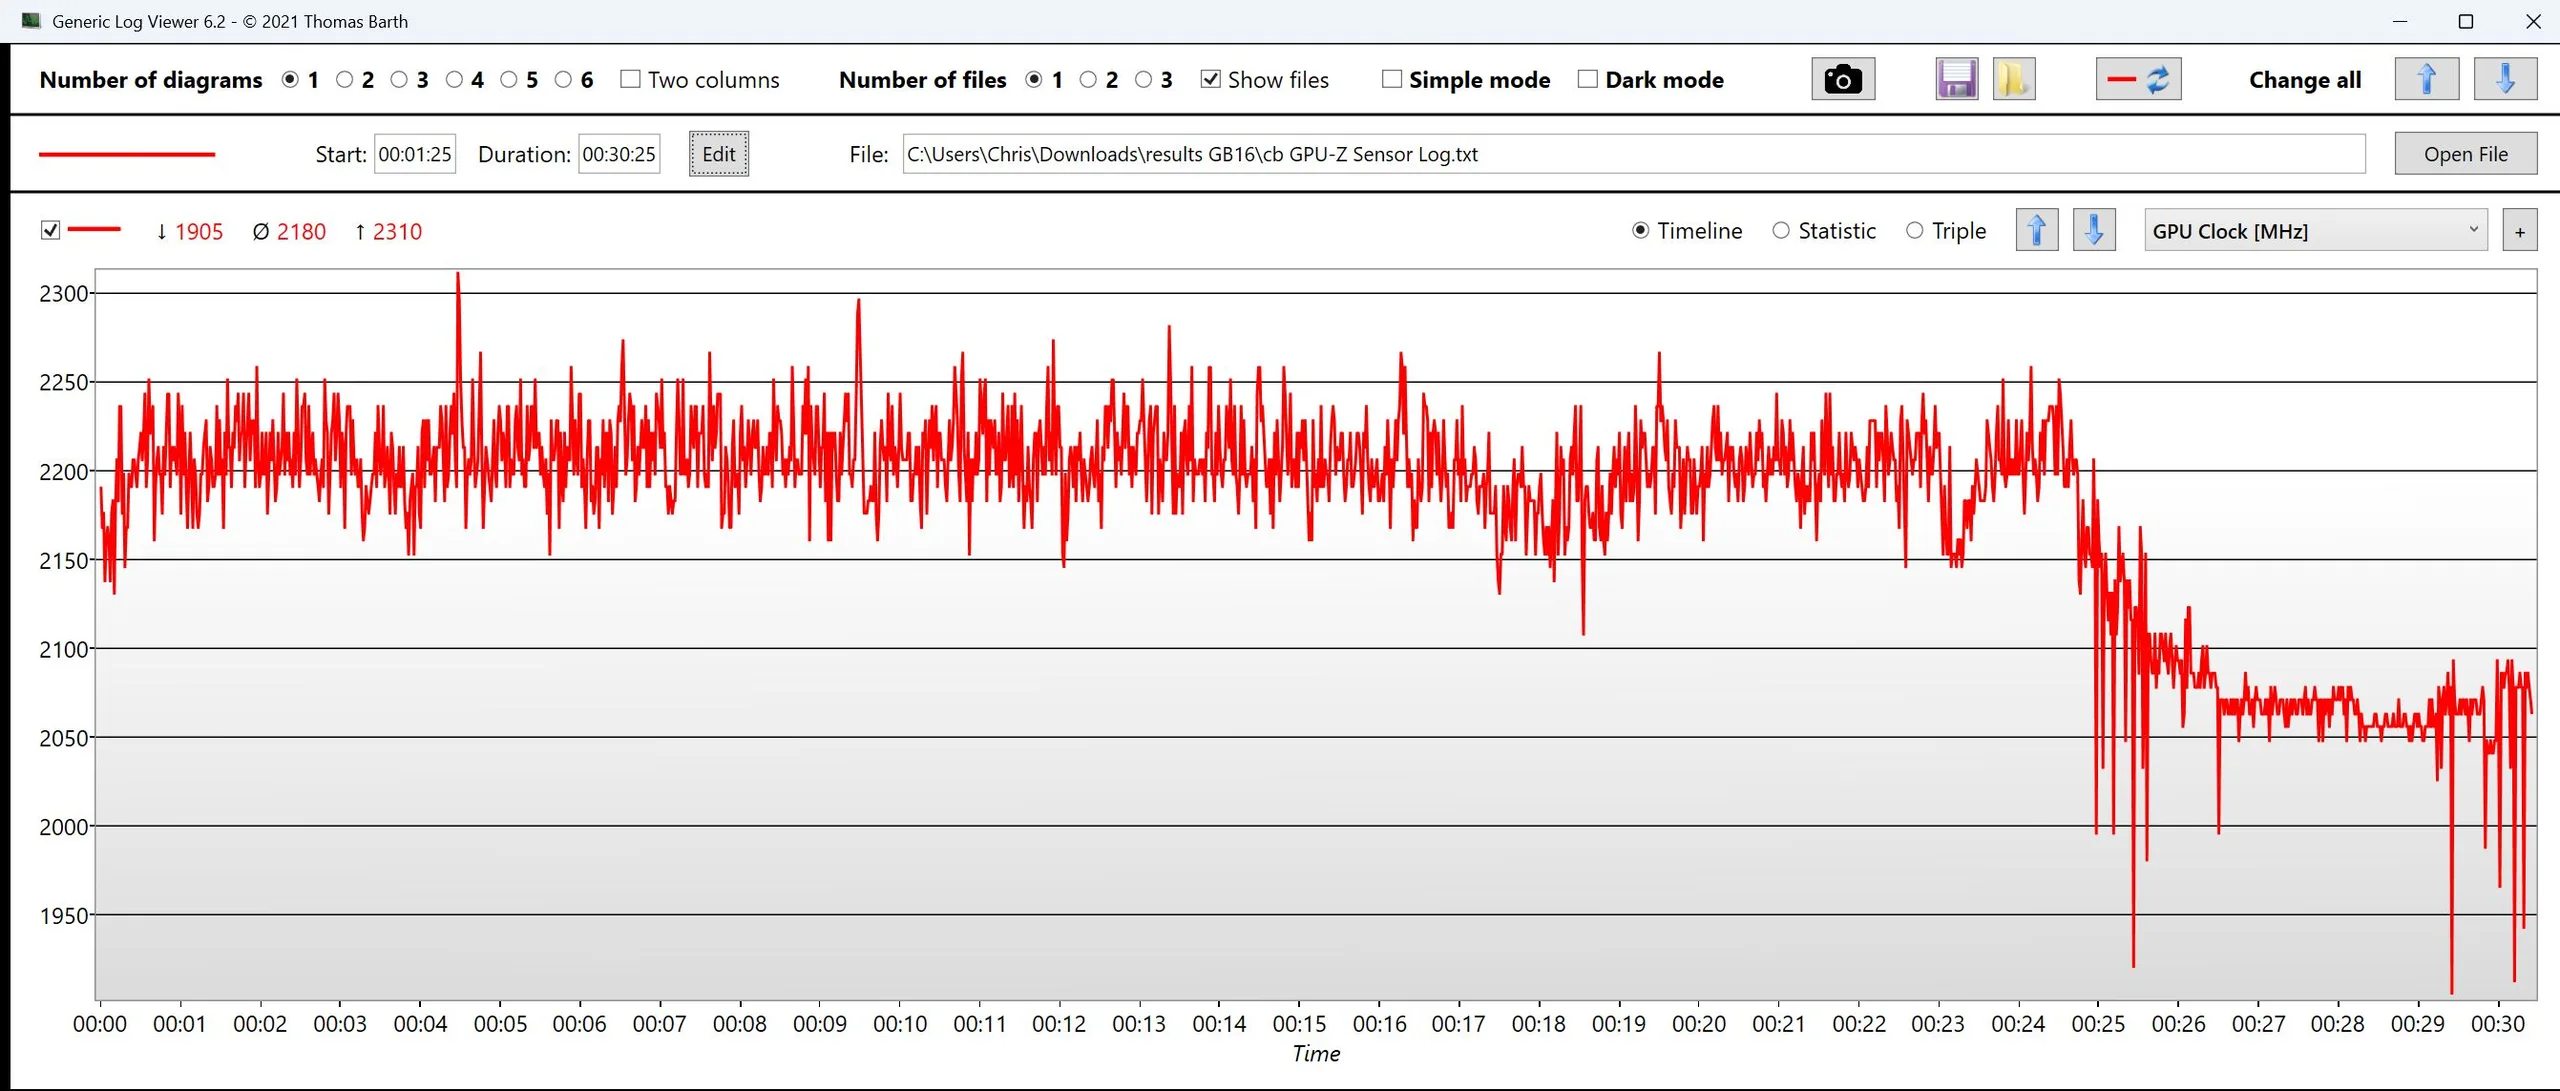
Cyberpunk 2077 ultra FPS-Diagramm
| low | med. | high | ultra | QHD DLSS | QHD | 4K DLSS | 4K | |
|---|---|---|---|---|---|---|---|---|
| GTA V (2015) | 152 | 162.5 | 147.3 | 98 | 98.9 | |||
| Dota 2 Reborn (2015) | 160.8 | 137.5 | 133.1 | 123.6 | 120.1 | |||
| Final Fantasy XV Benchmark (2018) | 117.4 | 115.6 | 108.9 | 103.9 | ||||
| X-Plane 11.11 (2018) | 132.7 | 113.8 | 92.5 | 75.5 | ||||
| Strange Brigade (2018) | 422 | 335 | 305 | 274 | 201 | 113.5 | ||
| Baldur's Gate 3 (2023) | 156 | 144 | 130 | 127 | 128.4 | 91.4 | 86.4 | 52.5 |
| Cyberpunk 2077 (2023) | 130.4 | 126.8 | 114.7 | 105.1 | 84.8 | 72.7 | 127.2 | 128.8 |
| F1 25 (2025) | 127.9 | 123.2 | 117 | 37.6 | 41.1 | 22.6 | 20.4 | 8.92 |
Emissions & energy – High idle power consumption
Fan noise
At idle, the fans are often silent, but after extended periods they spin up to around 24 dB.
Under gaming or heavy workloads, noise levels can reach roughly 56 dB—relatively loud given the moderate performance.
Noise level
| Idle |
| 23 / 24.35 / 24.35 dB(A) |
| Load |
| 34.77 / 56.43 dB(A) |
 | ||
30 dB silent 40 dB(A) audible 50 dB(A) loud |
||
min: | ||
| Gigabyte Gaming A16 Pro GA6DH (Core 7 240H, RTX 5070 Ti) Core 7 240H, GeForce RTX 5070 Ti Laptop | Gigabyte Gaming A16 GA6H i7-13620H, GeForce RTX 5070 Laptop | Schenker XMG APEX 16 MAX R9 9955HX, GeForce RTX 5070 Ti Laptop | Acer Predator Helios Neo 16S AI PHN16S-71-94L9 Ultra 9 275HX, GeForce RTX 5070 Ti Laptop | Medion Erazer Major 16 X1 MD62736 Ultra 7 255HX, GeForce RTX 5070 Ti Laptop | Lenovo Legion 5 Pro 16IAX10H Ultra 9 275HX, GeForce RTX 5070 Ti Laptop | |
|---|---|---|---|---|---|---|
| Noise | -11% | -7% | -17% | -14% | -14% | |
| off / environment * (dB) | 23 | 24 -4% | 25.9 -13% | 24 -4% | 25 -9% | 24 -4% |
| Idle Minimum * (dB) | 23 | 25 -9% | 25.9 -13% | 24 -4% | 26 -13% | 24 -4% |
| Idle Average * (dB) | 24.35 | 26 -7% | 26.5 -9% | 30 -23% | 27 -11% | 24 1% |
| Idle Maximum * (dB) | 24.35 | 27 -11% | 26.5 -9% | 35 -44% | 30 -23% | 30.9 -27% |
| Load Average * (dB) | 34.77 | 54 -55% | 42.1 -21% | 53 -52% | 53 -52% | 55.9 -61% |
| Cyberpunk 2077 ultra * (dB) | 56.18 | 54 4% | 51 9% | 52 7% | 54 4% | 56.72 -1% |
| Load Maximum * (dB) | 56.43 | 55 3% | 51 10% | 54 4% | 54 4% | 56.72 -1% |
* ... smaller is better
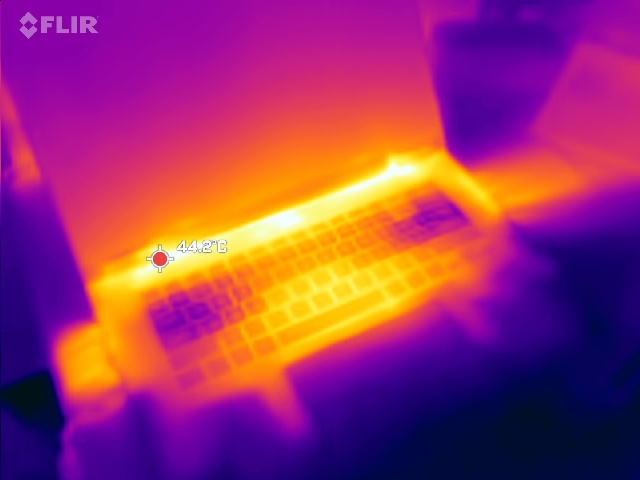
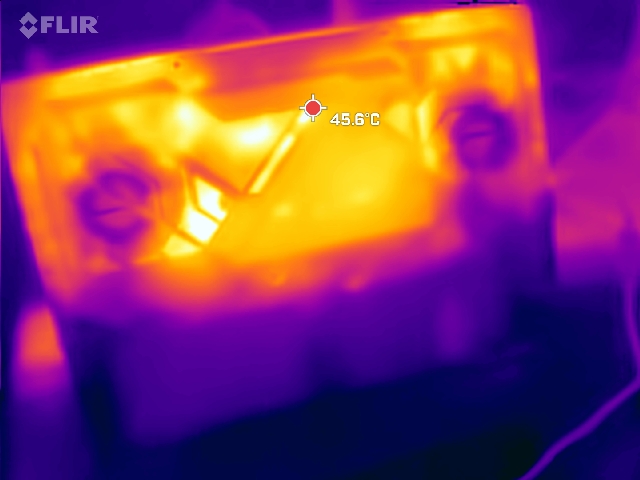
Temperature
Topside temperatures remain moderate, while the underside gets hotter, with hotspots reaching around 50 °C.
(±) The maximum temperature on the upper side is 42 °C / 108 F, compared to the average of 40.4 °C / 105 F, ranging from 21.2 to 68.8 °C for the class Gaming.
(-) The bottom heats up to a maximum of 49 °C / 120 F, compared to the average of 43.2 °C / 110 F
(+) In idle usage, the average temperature for the upper side is 30.1 °C / 86 F, compared to the device average of 33.9 °C / 93 F.
(±) 3: The average temperature for the upper side is 34.9 °C / 95 F, compared to the average of 33.9 °C / 93 F for the class Gaming.
(+) The palmrests and touchpad are cooler than skin temperature with a maximum of 26 °C / 78.8 F and are therefore cool to the touch.
(+) The average temperature of the palmrest area of similar devices was 28.8 °C / 83.8 F (+2.8 °C / 5 F).
| Gigabyte Gaming A16 Pro GA6DH (Core 7 240H, RTX 5070 Ti) Core 7 240H, GeForce RTX 5070 Ti Laptop | Gigabyte Gaming A16 GA6H i7-13620H, GeForce RTX 5070 Laptop | Schenker XMG APEX 16 MAX R9 9955HX, GeForce RTX 5070 Ti Laptop | Acer Predator Helios Neo 16S AI PHN16S-71-94L9 Ultra 9 275HX, GeForce RTX 5070 Ti Laptop | Medion Erazer Major 16 X1 MD62736 Ultra 7 255HX, GeForce RTX 5070 Ti Laptop | Lenovo Legion 5 Pro 16IAX10H Ultra 9 275HX, GeForce RTX 5070 Ti Laptop | |
|---|---|---|---|---|---|---|
| Heat | -4% | 2% | 3% | -7% | -11% | |
| Maximum Upper Side * (°C) | 42 | 50 -19% | 46.5 -11% | 47 -12% | 49 -17% | 48 -14% |
| Maximum Bottom * (°C) | 49 | 49 -0% | 46.4 5% | 55 -12% | 50 -2% | 50 -2% |
| Idle Upper Side * (°C) | 34 | 35 -3% | 32.1 6% | 28 18% | 36 -6% | 38 -12% |
| Idle Bottom * (°C) | 36 | 34 6% | 33.5 7% | 29 19% | 37 -3% | 42 -17% |
* ... smaller is better
| CPU Clock (GHz) | GPU Clock (MHz) | Average CPU Temperature (°C) | Average GPU Temperature (°C) | ||
| Prime95 + FurMark Stress | 1.9 | 1724 | 71 | 86 | |
| Cyberpunk 2077 Stress | 2 | 2180 | 74 | 84 |
Speakers
The dual 2 W speakers lack bass and overall power, although treble is balanced. A headset jack is available for headphones or external audio equipment.
Gigabyte Gaming A16 Pro GA6DH (Core 7 240H, RTX 5070 Ti) audio analysis
(±) | speaker loudness is average but good (78.63 dB)
Bass 100 - 315 Hz
(-) | nearly no bass - on average 26.9% lower than median
(±) | linearity of bass is average (8.4% delta to prev. frequency)
Mids 400 - 2000 Hz
(+) | balanced mids - only 4.2% away from median
(±) | linearity of mids is average (7.8% delta to prev. frequency)
Highs 2 - 16 kHz
(+) | balanced highs - only 3.1% away from median
(+) | highs are linear (6.1% delta to prev. frequency)
Overall 100 - 16.000 Hz
(±) | linearity of overall sound is average (19.8% difference to median)
Compared to same class
» 69% of all tested devices in this class were better, 6% similar, 24% worse
» The best had a delta of 6%, average was 18%, worst was 132%
Compared to all devices tested
» 50% of all tested devices were better, 7% similar, 43% worse
» The best had a delta of 4%, average was 24%, worst was 134%
Acer Predator Helios Neo 16S AI PHN16S-71-94L9 audio analysis
(+) | speakers can play relatively loud (86 dB)
Bass 100 - 315 Hz
(-) | nearly no bass - on average 24.8% lower than median
(±) | linearity of bass is average (12.6% delta to prev. frequency)
Mids 400 - 2000 Hz
(±) | higher mids - on average 5.9% higher than median
(+) | mids are linear (6.4% delta to prev. frequency)
Highs 2 - 16 kHz
(+) | balanced highs - only 2.8% away from median
(+) | highs are linear (5.9% delta to prev. frequency)
Overall 100 - 16.000 Hz
(±) | linearity of overall sound is average (17.3% difference to median)
Compared to same class
» 47% of all tested devices in this class were better, 12% similar, 41% worse
» The best had a delta of 6%, average was 18%, worst was 132%
Compared to all devices tested
» 32% of all tested devices were better, 8% similar, 59% worse
» The best had a delta of 4%, average was 24%, worst was 134%
Power consumption
Under load, the A16 Pro is among the more efficient RTX 5070 Ti laptops. However, idle power consumption remains far too high—even over extended measurement periods (dGPU inactive, no background processes).
In some cases, “Silence” and “Balanced” modes consume more power than “Performance". This is an area where the manufacturer urgently needs to improve.
When connected to an external monitor via HDMI, the dGPU becomes active, further increasing idle power consumption slightly.
| Off / Standby | |
| Idle | |
| Load |
|
Key:
min: | |
| Gigabyte Gaming A16 Pro GA6DH (Core 7 240H, RTX 5070 Ti) Core 7 240H, GeForce RTX 5070 Ti Laptop, Samsung PM9C1b MZVL81T0HFLB-00BTW, IPS, 2560x1600, 16" | Gigabyte Gaming A16 GA6H i7-13620H, GeForce RTX 5070 Laptop, Kingston OM8PGP41024Q-A0, IPS, 2560x1600, 16" | Schenker XMG APEX 16 MAX R9 9955HX, GeForce RTX 5070 Ti Laptop, Samsung 9100 Pro 2 TB, Mini-LED, 2560x1600, 16" | Acer Predator Helios Neo 16S AI PHN16S-71-94L9 Ultra 9 275HX, GeForce RTX 5070 Ti Laptop, Micron 3500 1TB MTFDKBA1T0TGD, OLED, 2560x1600, 16" | Medion Erazer Major 16 X1 MD62736 Ultra 7 255HX, GeForce RTX 5070 Ti Laptop, Phison E31 2 TB, IPS, 2560x1600, 16" | Lenovo Legion 5 Pro 16IAX10H Ultra 9 275HX, GeForce RTX 5070 Ti Laptop, Western Digital PC SN8000S SDEPNRK-1T00, OLED, 2560x1600, 16" | Average NVIDIA GeForce RTX 5070 Ti Laptop | Average of class Gaming | |
|---|---|---|---|---|---|---|---|---|
| Power Consumption | 28% | -26% | 21% | -15% | -21% | 1% | 6% | |
| Idle Minimum * (Watt) | 21.5 | 9 58% | 15.4 28% | 3.9 82% | 17.8 17% | 14 35% | 12.4 ? 42% | 13.3 ? 38% |
| Idle Average * (Watt) | 28.3 | 11 61% | 29.9 -6% | 11 61% | 20.7 27% | 14.3 49% | 19.7 ? 30% | 19 ? 33% |
| Idle Maximum * (Watt) | 26.3 | 23 13% | 30.1 -14% | 16.9 36% | 23.4 11% | 20.1 24% | 24.9 ? 5% | 24.5 ? 7% |
| Load Average * (Watt) | 92.5 | 91 2% | 136.4 -47% | 123 -33% | 110 -19% | 177 -91% | 123.6 ? -34% | 108.1 ? -17% |
| Cyberpunk 2077 ultra * (Watt) | 165 | 132.5 20% | 231 -40% | 152.7 7% | 233 -41% | 255 -55% | ||
| Cyberpunk 2077 ultra external monitor * (Watt) | 158 | 130 18% | 226 -43% | 144.9 8% | 232 -47% | 255 -61% | ||
| Load Maximum * (Watt) | 195 | 155 21% | 315 -62% | 229 -17% | 297 -52% | 294 -51% | 272 ? -39% | 254 ? -30% |
* ... smaller is better
Power consumption Cyberpunk / Stresstest
Power consumption with external monitor
Battery life
At 76 Wh, the battery capacity is on the lower end for this category. Still, the laptop achieves a very good 8.3 hours in the Wi-Fi test.
| Gigabyte Gaming A16 Pro GA6DH (Core 7 240H, RTX 5070 Ti) Core 7 240H, GeForce RTX 5070 Ti Laptop, 76 Wh | Gigabyte Gaming A16 GA6H i7-13620H, GeForce RTX 5070 Laptop, 76 Wh | Schenker XMG APEX 16 MAX R9 9955HX, GeForce RTX 5070 Ti Laptop, 99.8 Wh | Acer Predator Helios Neo 16S AI PHN16S-71-94L9 Ultra 9 275HX, GeForce RTX 5070 Ti Laptop, 76 Wh | Medion Erazer Major 16 X1 MD62736 Ultra 7 255HX, GeForce RTX 5070 Ti Laptop, 80 Wh | Lenovo Legion 5 Pro 16IAX10H Ultra 9 275HX, GeForce RTX 5070 Ti Laptop, 80 Wh | Average of class Gaming | |
|---|---|---|---|---|---|---|---|
| Battery runtime | -7% | -41% | -40% | -24% | -41% | -16% | |
| WiFi v1.3 (h) | 8.3 | 7.7 -7% | 4.9 -41% | 5 -40% | 6.3 -24% | 4.9 -41% | 7.01 ? -16% |
| H.264 (h) | 4.8 | 8.26 ? | |||||
| Load (h) | 1.7 | 1.47 ? |
Gigabyte Gaming A16 Pro GA6DH (Core 7 240H, RTX 5070 Ti)
- 03/19/2026 v8
Christian Hintze
 Total Sustainability Score:
 Possible alternatives
Image | Model / Review | Price | Weight | Height | Display |
|---|---|---|---|---|---|
1. 81%  | Gigabyte Gaming A16 Pro GA6DH (Core 7 240H, RTX 5070 Ti) Intel Core 7 240H ⎘ NVIDIA GeForce RTX 5070 Ti Laptop ⎘ 32 GB Memory, 1000 GB SSD | Amazon: List Price: 2300 Euro | 2.4 kg | 22.99 mm | 16.00" 2560x1600 189 PPI IPS |
2. 80.1%  | Gigabyte Gaming A16 GA6H Intel Core i7-13620H ⎘ NVIDIA GeForce RTX 5070 Laptop ⎘ 16 GB Memory, 1024 GB SSD | Amazon: 1. $1,282.83 GIGABYTE - Gaming A16 Gaming... 2. $1,069.00 GIGABYTE - Gaming A16 Gaming... 3. $1,242.26 GIGABYTE - Gaming A16 Gaming... List Price: 1700 EUR | 2.3 kg | 23 mm | 16.00" 2560x1600 189 PPI IPS |
3. 76.2%  | Alienware 16 Aurora Intel Core 7 240H ⎘ NVIDIA GeForce RTX 5060 Laptop ⎘ 32 GB Memory | Amazon: List Price: 1100 USD | 2.6 kg | 15.2 mm | 16.00" 2560x1600 189 PPI IPS |
4. 85.2%  | Medion Erazer Major 16 X1 MD62736 Intel Core Ultra 7 255HX ⎘ NVIDIA GeForce RTX 5070 Ti Laptop ⎘ 32 GB Memory, SSD | Amazon: List Price: 2600 EUR | 2.5 kg | 22.7 mm | 16.00" 2560x1600 189 PPI IPS |
5. 75.2%  | MSI Cyborg 15 B2RWEKG Intel Core 7 240H ⎘ NVIDIA GeForce RTX 5050 Laptop ⎘ 16 GB Memory, 512 GB SSD | Amazon: List Price: 1099 EUR | 2.2 kg | 23.2 mm | 15.60" 1920x1080 141 PPI IPS |
6. 78.6%  | Medion Erazer Deputy 15 P1 MD62761 Intel Core 7 250H ⎘ NVIDIA GeForce RTX 5060 Laptop ⎘ 16 GB Memory, 1024 GB | Amazon: List Price: 1300 EUR | 2.2 kg | 29 mm | 15.60" 1920x1080 141 PPI IPS |
Transparency
The selection of devices to be reviewed is made by our editorial team. The test sample was provided to the author as a loan by the manufacturer or retailer for the purpose of this review. The lender had no influence on this review, nor did the manufacturer receive a copy of this review before publication. There was no obligation to publish this review. As an independent media company, Notebookcheck is not subjected to the authority of manufacturers, retailers or publishers.
This is how Notebookcheck is testing
Every year, Notebookcheck independently reviews hundreds of laptops and smartphones using standardized procedures to ensure that all results are comparable. We have continuously developed our test methods for around 20 years and set industry standards in the process. In our test labs, high-quality measuring equipment is utilized by experienced technicians and editors. These tests involve a multi-stage validation process. Our complex rating system is based on hundreds of well-founded measurements and benchmarks, which maintains objectivity. Further information on our test methods can be found here.
