Verdict: One step forward, two steps back
The older ThinkPad P16 was bigger and heavier than the competition. The newest model, the Lenovo ThinkPad P16 Gen 3, however, seems like an overcorrection: It is much more mobile, but makes sacrifices in terms of performance, with the 105 W TGP of the GPU and the 180 W charger coming to mind. That is not something we expect from this product line that has performance as its main goal.
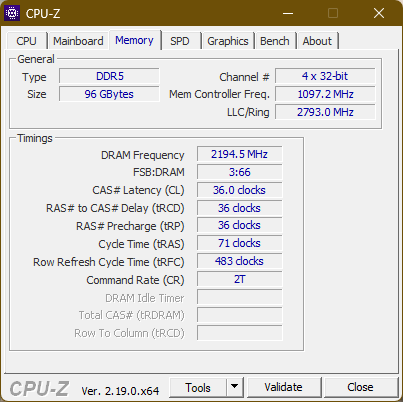
The overall performance is still high, and the ThinkPad P16 G3 has many great qualities that make it a good workhorse. Especially noteworthy is the expandability, as it is possible to put up to 192 GB RAM and three 2280 SSD into this laptop. For CAD or local AI usage, this is a great laptop.
Pros
Cons
Lenovo calls its mobile workstations the ThinkPad P series - with P standing for power or performance. Our review device, the Lenovo ThinkPad P16 Gen 3, stands for this more than any other model of the series. It prioritizes performance over other aspects, like mobility. This is the heaviest, thickest, but also most powerful ThinkPad laptop in the lineup, with the most configuration options and upgradeability potential. If you buy a P16 Gen 3, you need that power - and you have a lot of money. Whether it is CAD or local AI, or even acting as a portable server, the ThinkPad P16 is the model that is supposed to handle it.
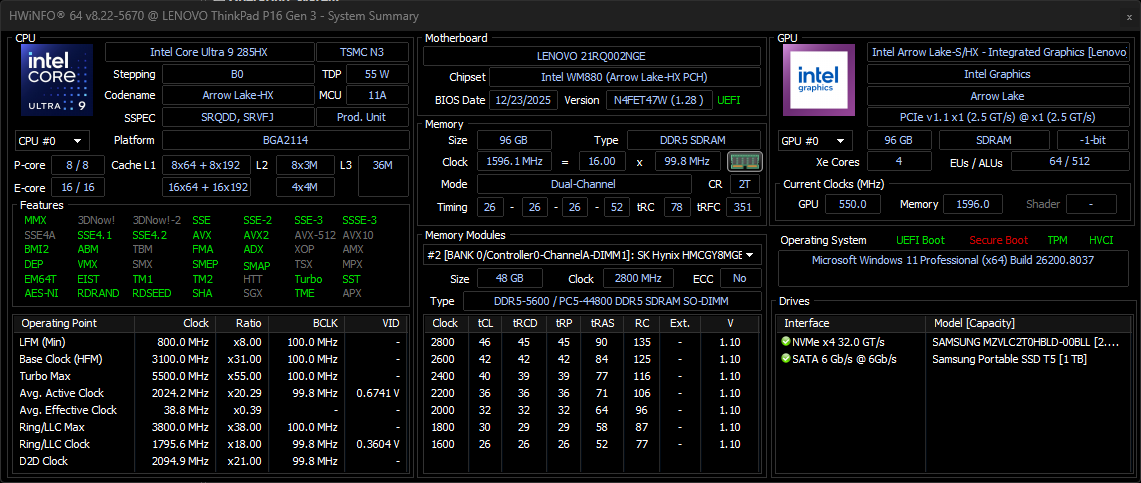
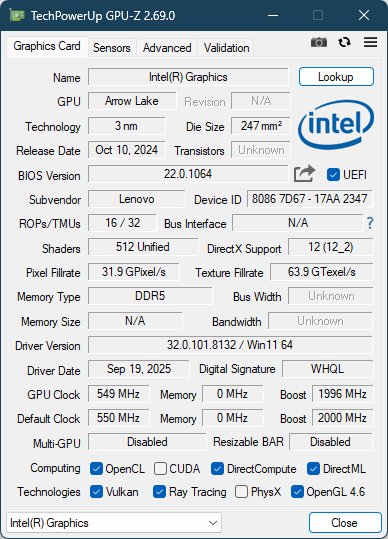
Specifications: Core Ultra 9 & RTX Pro 3000 Blackwell
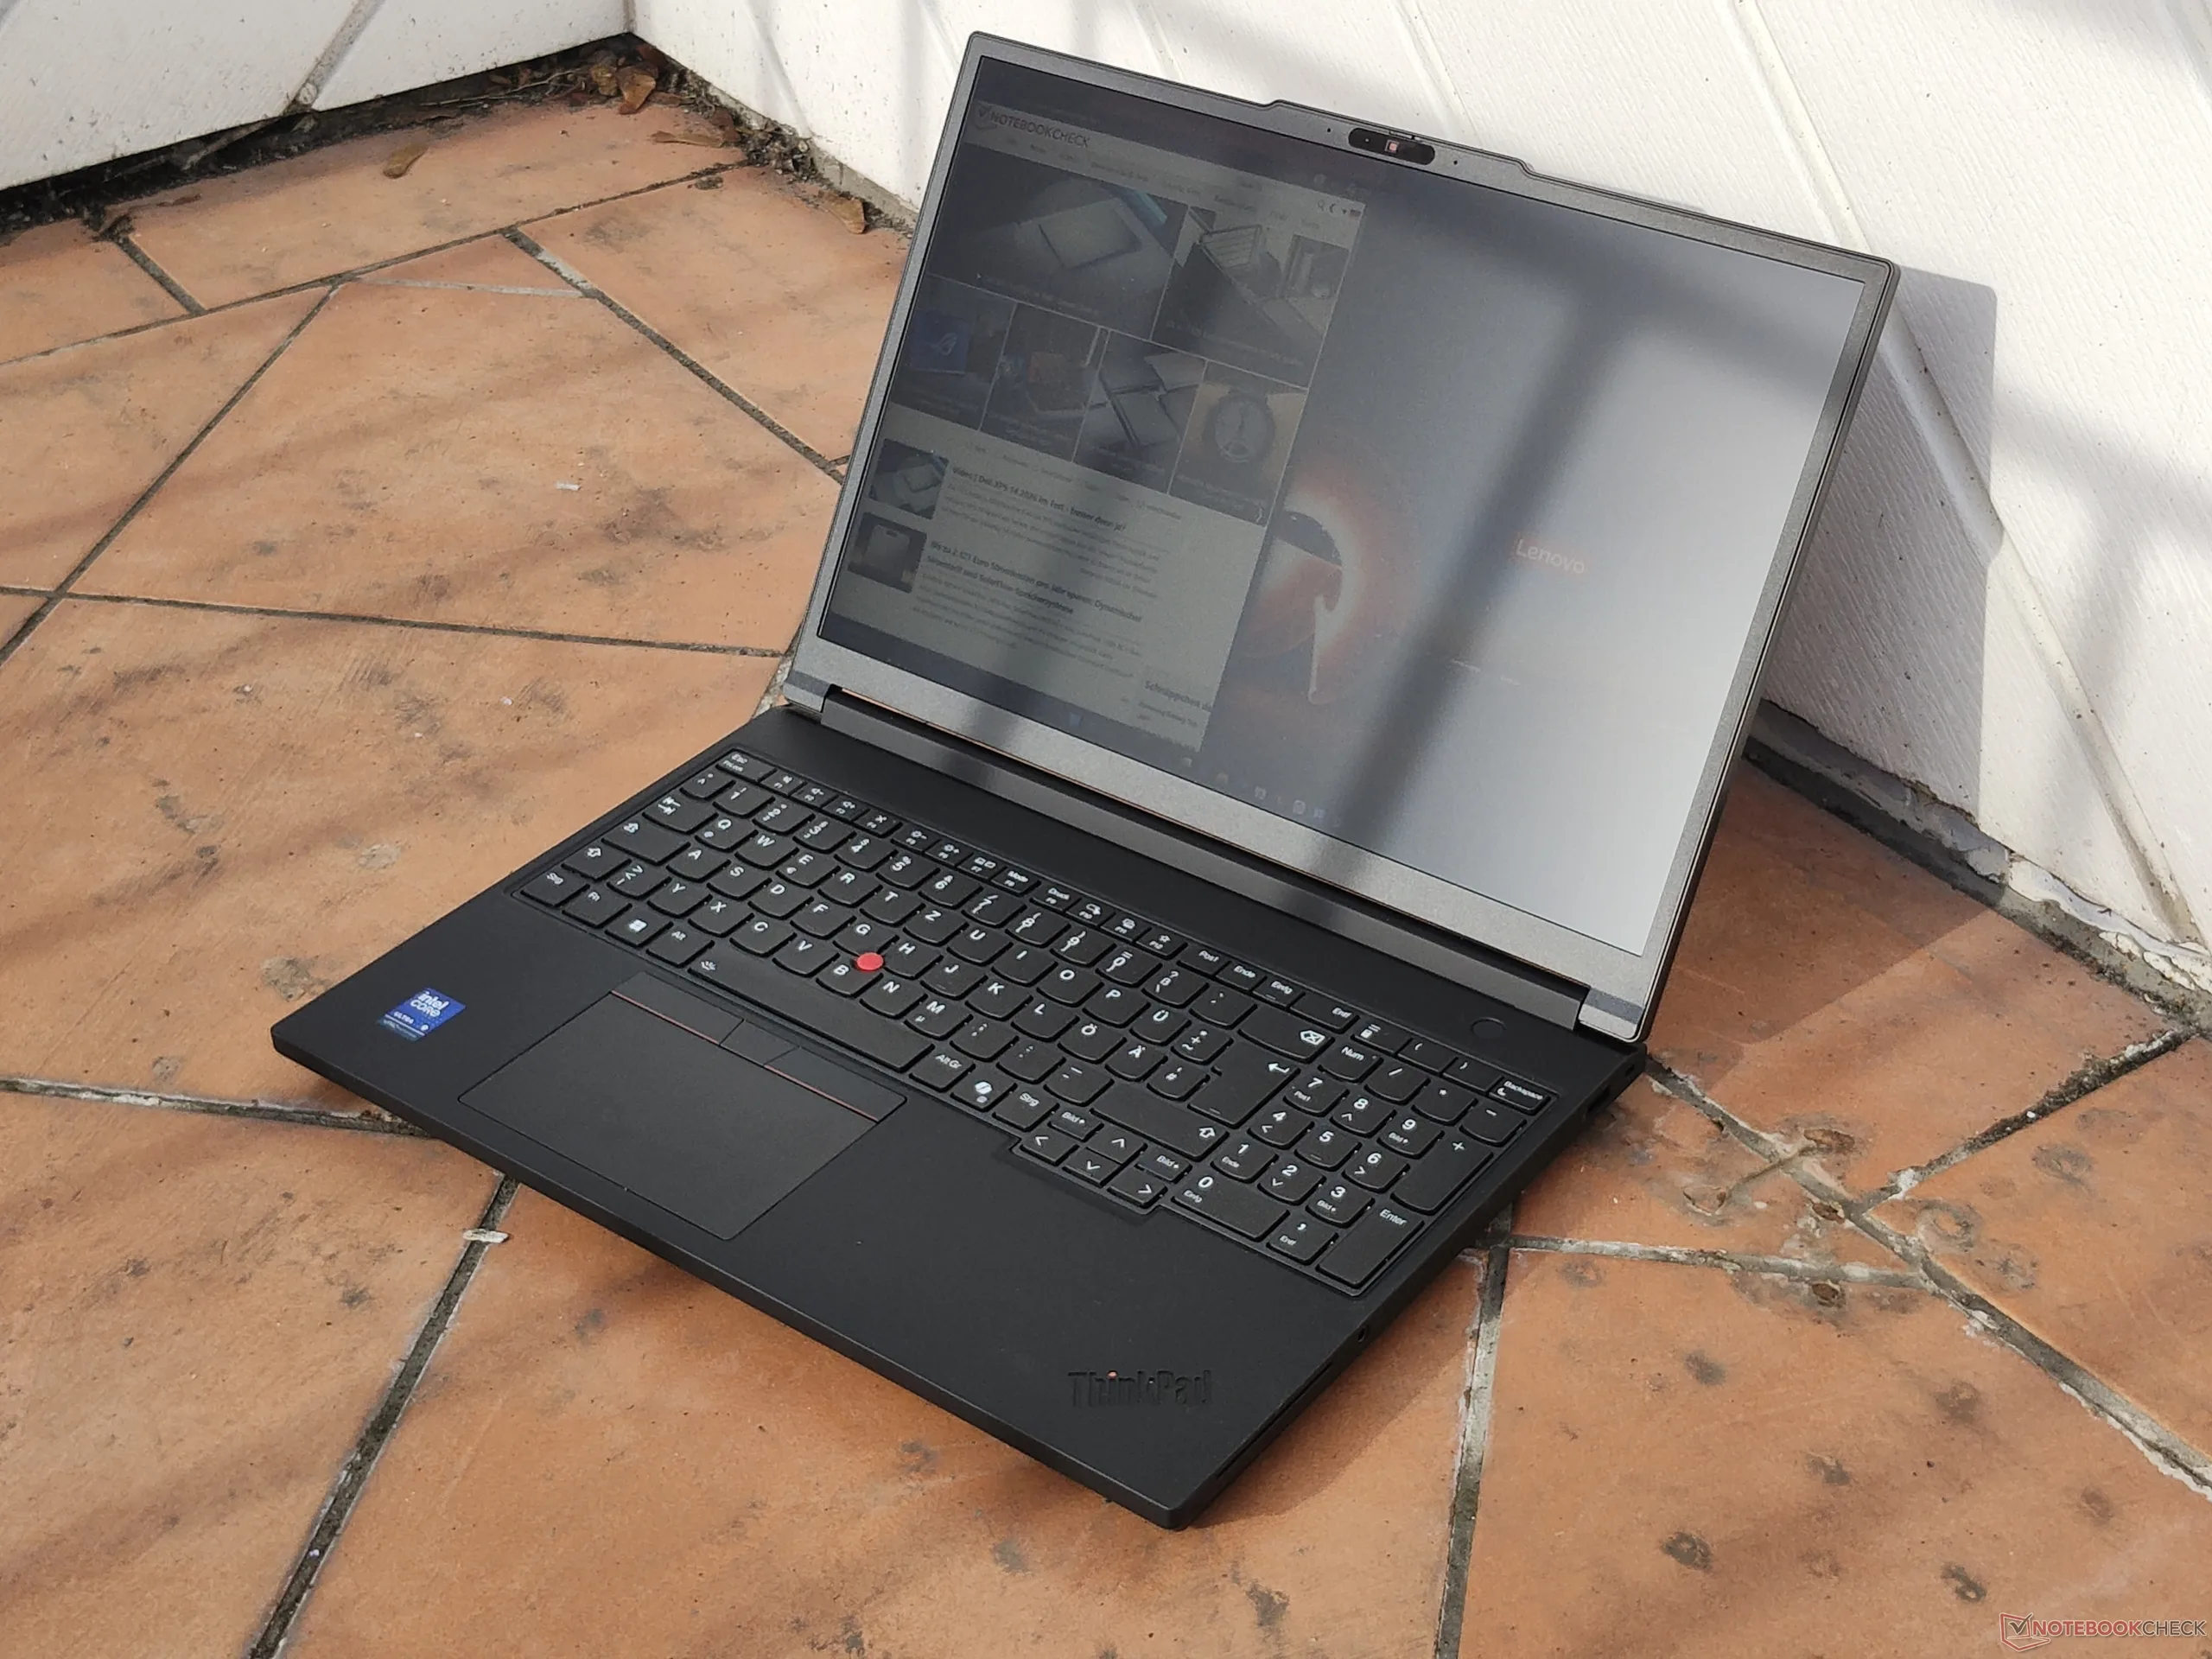
Case: A completely new start for the ThinkPad P16
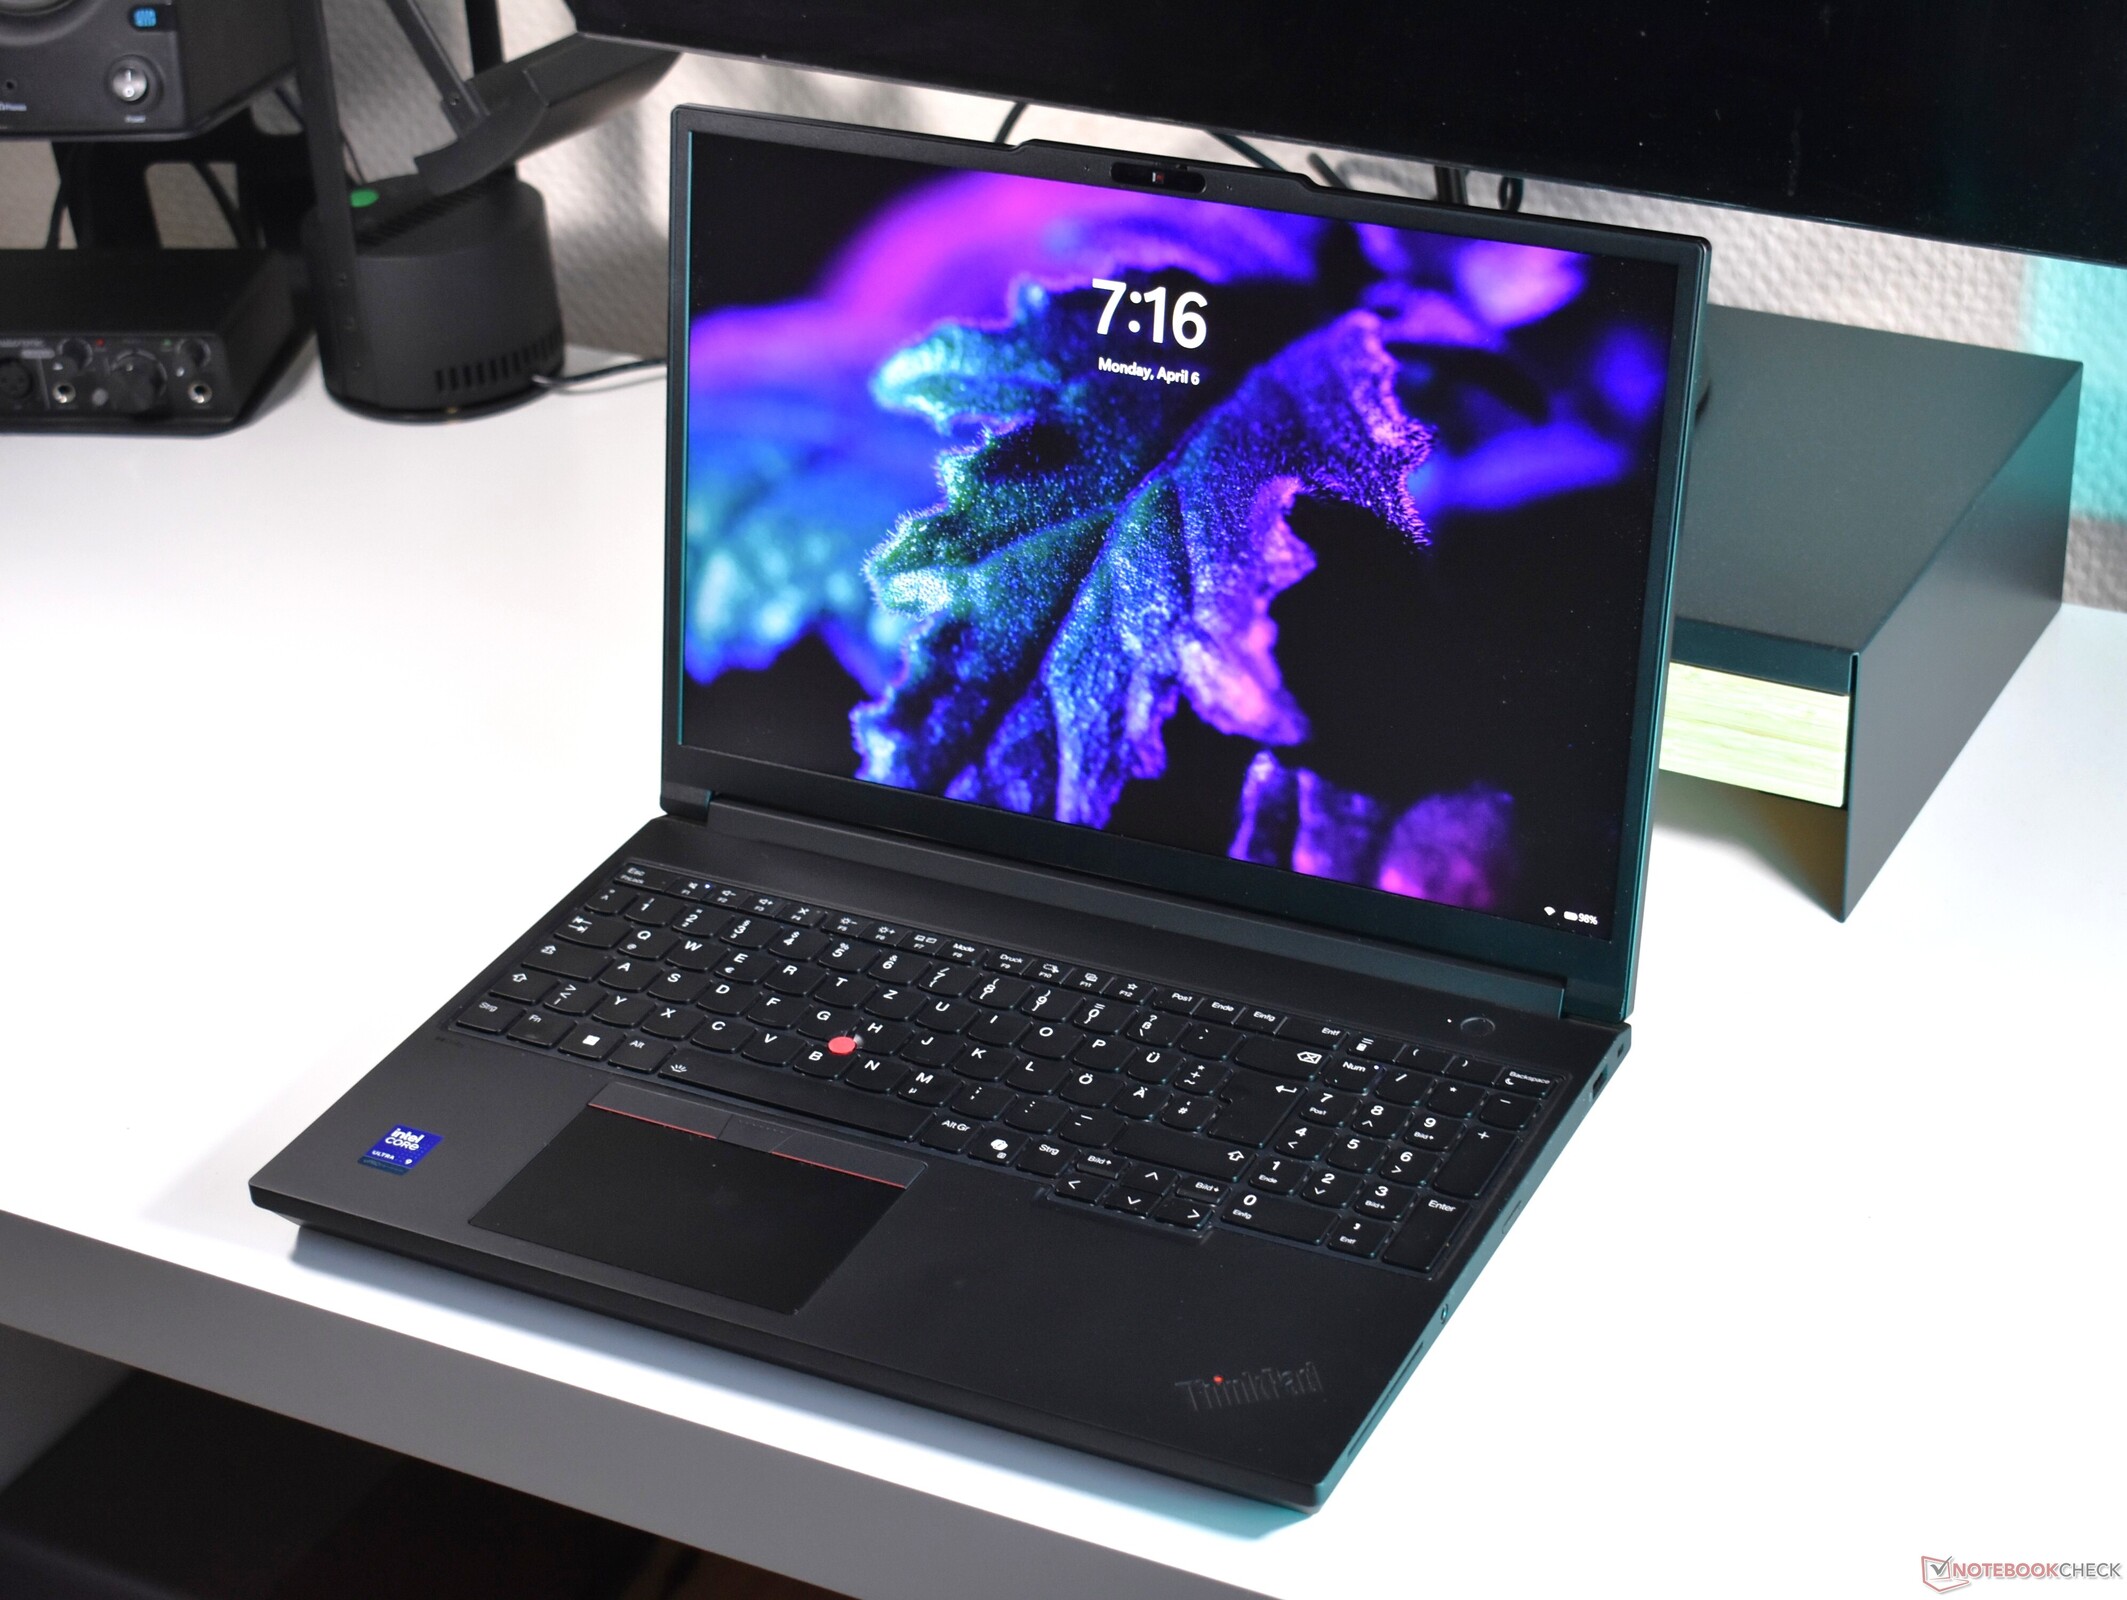
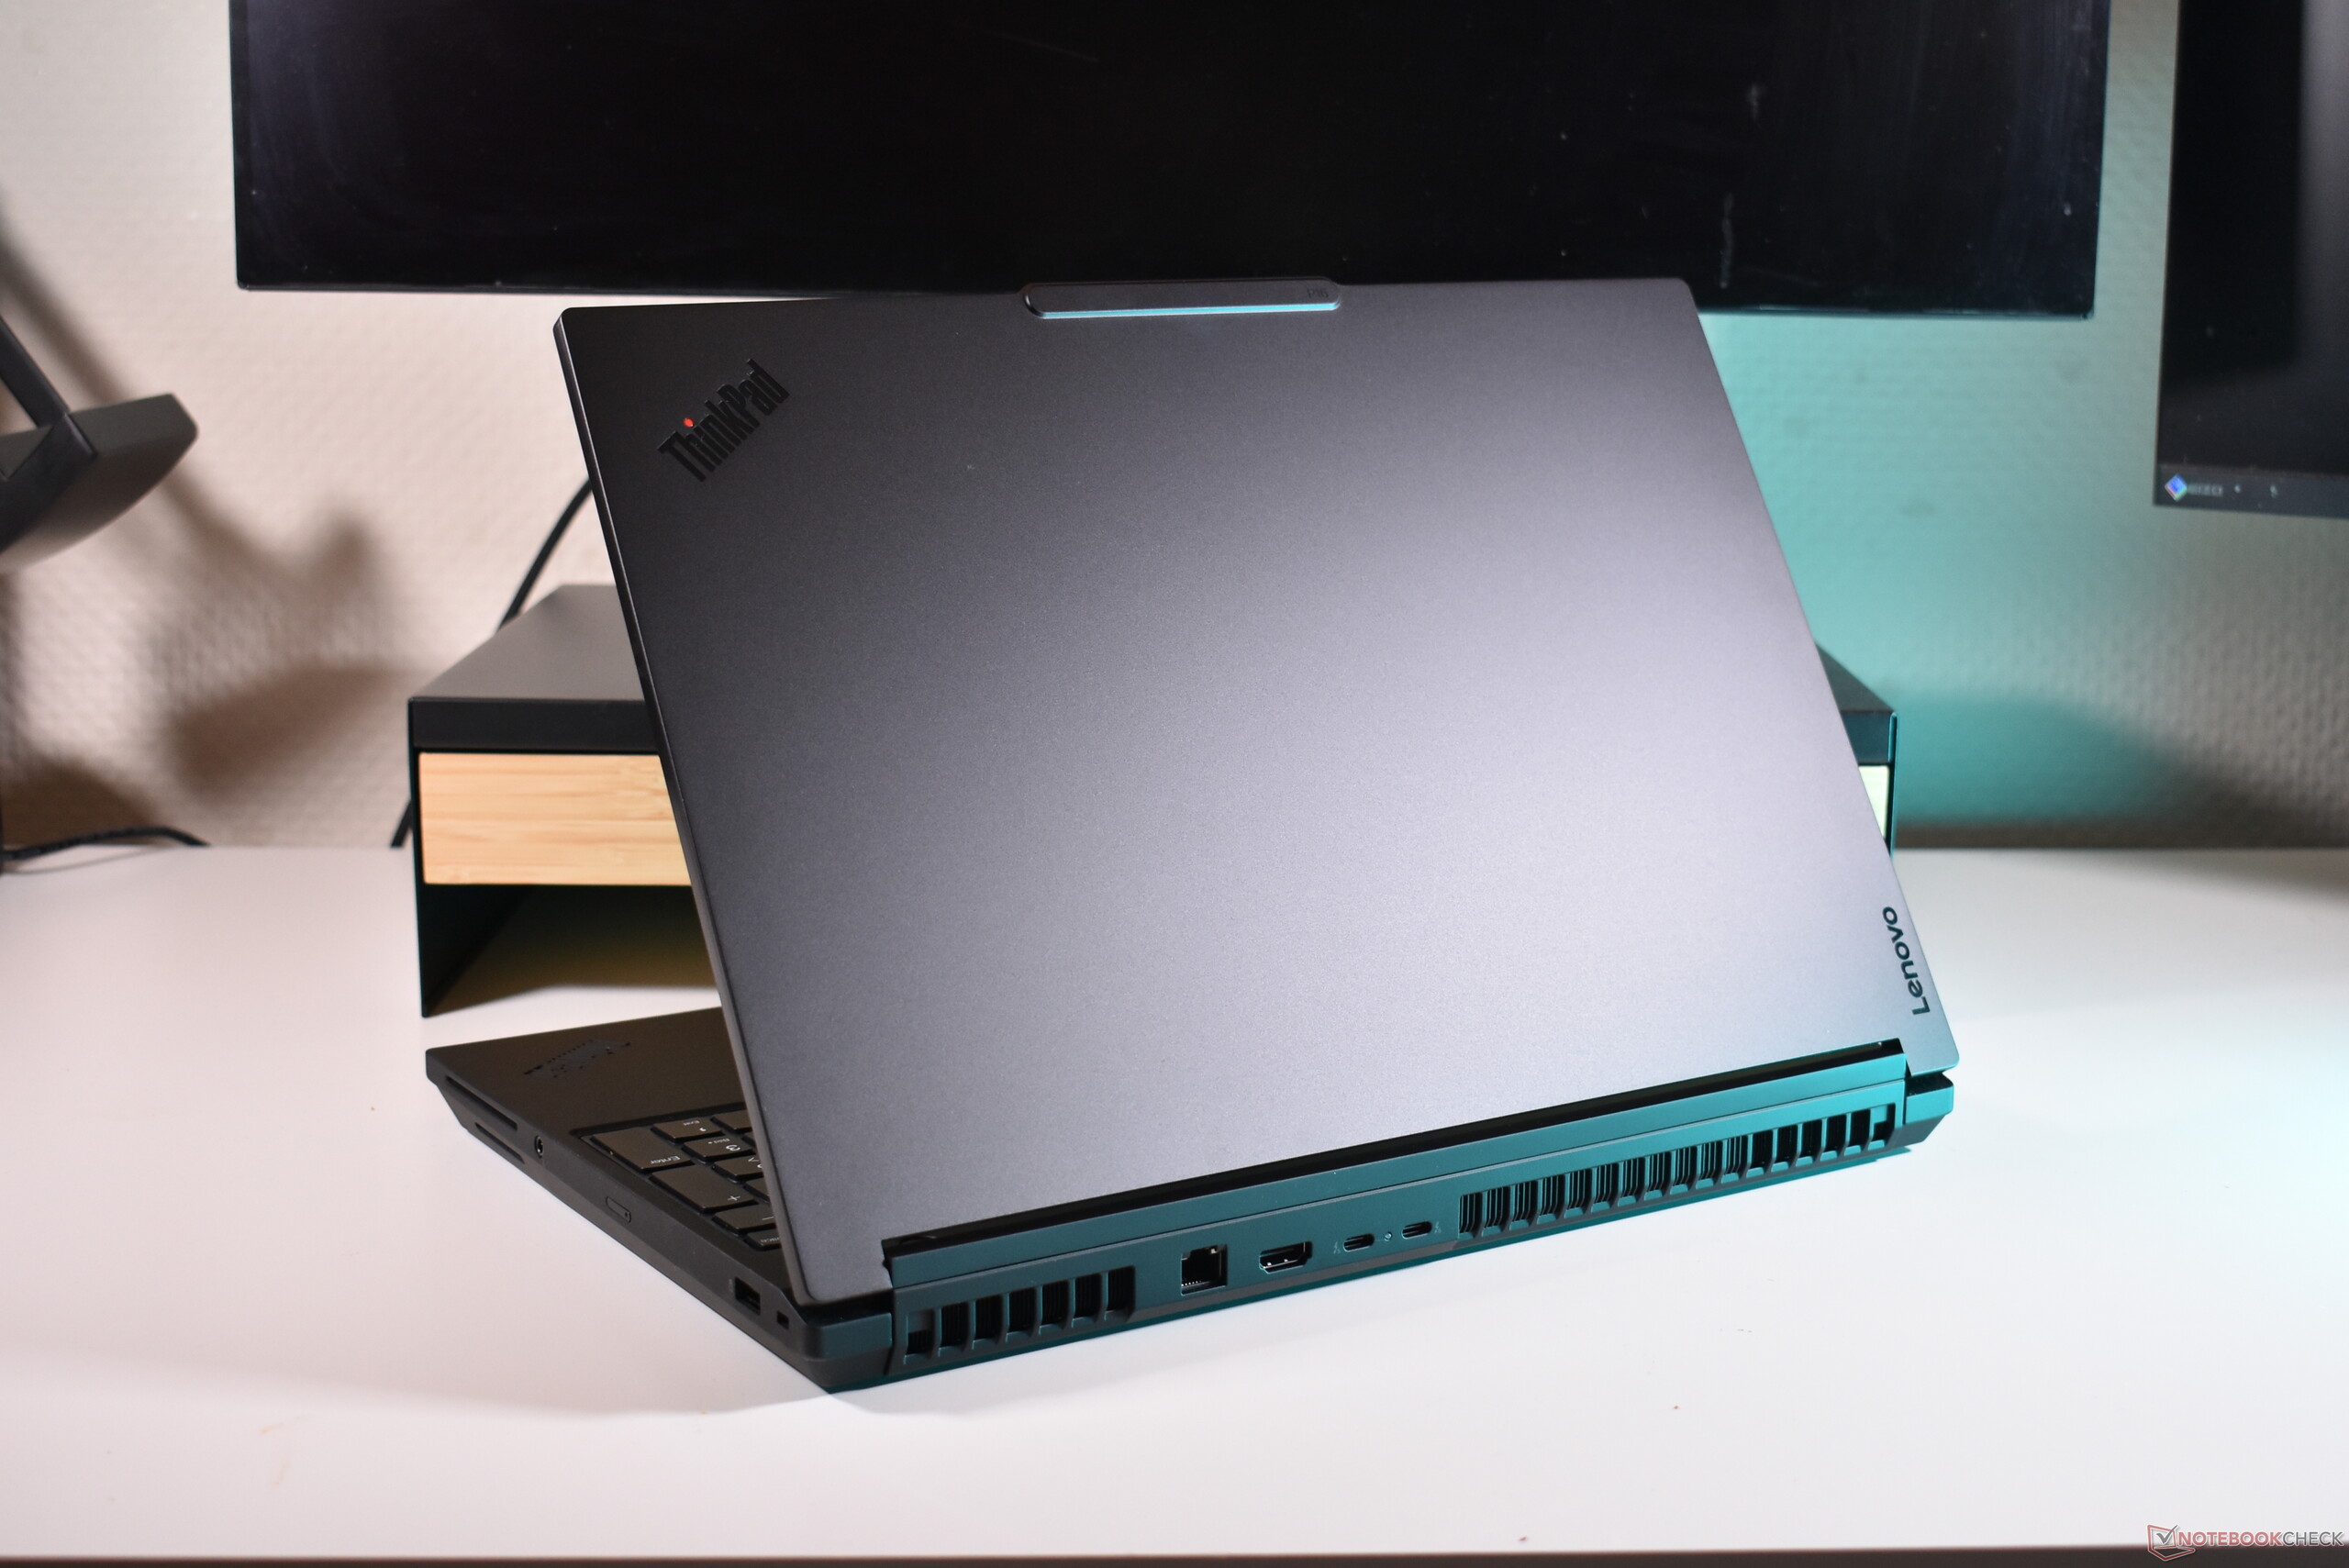
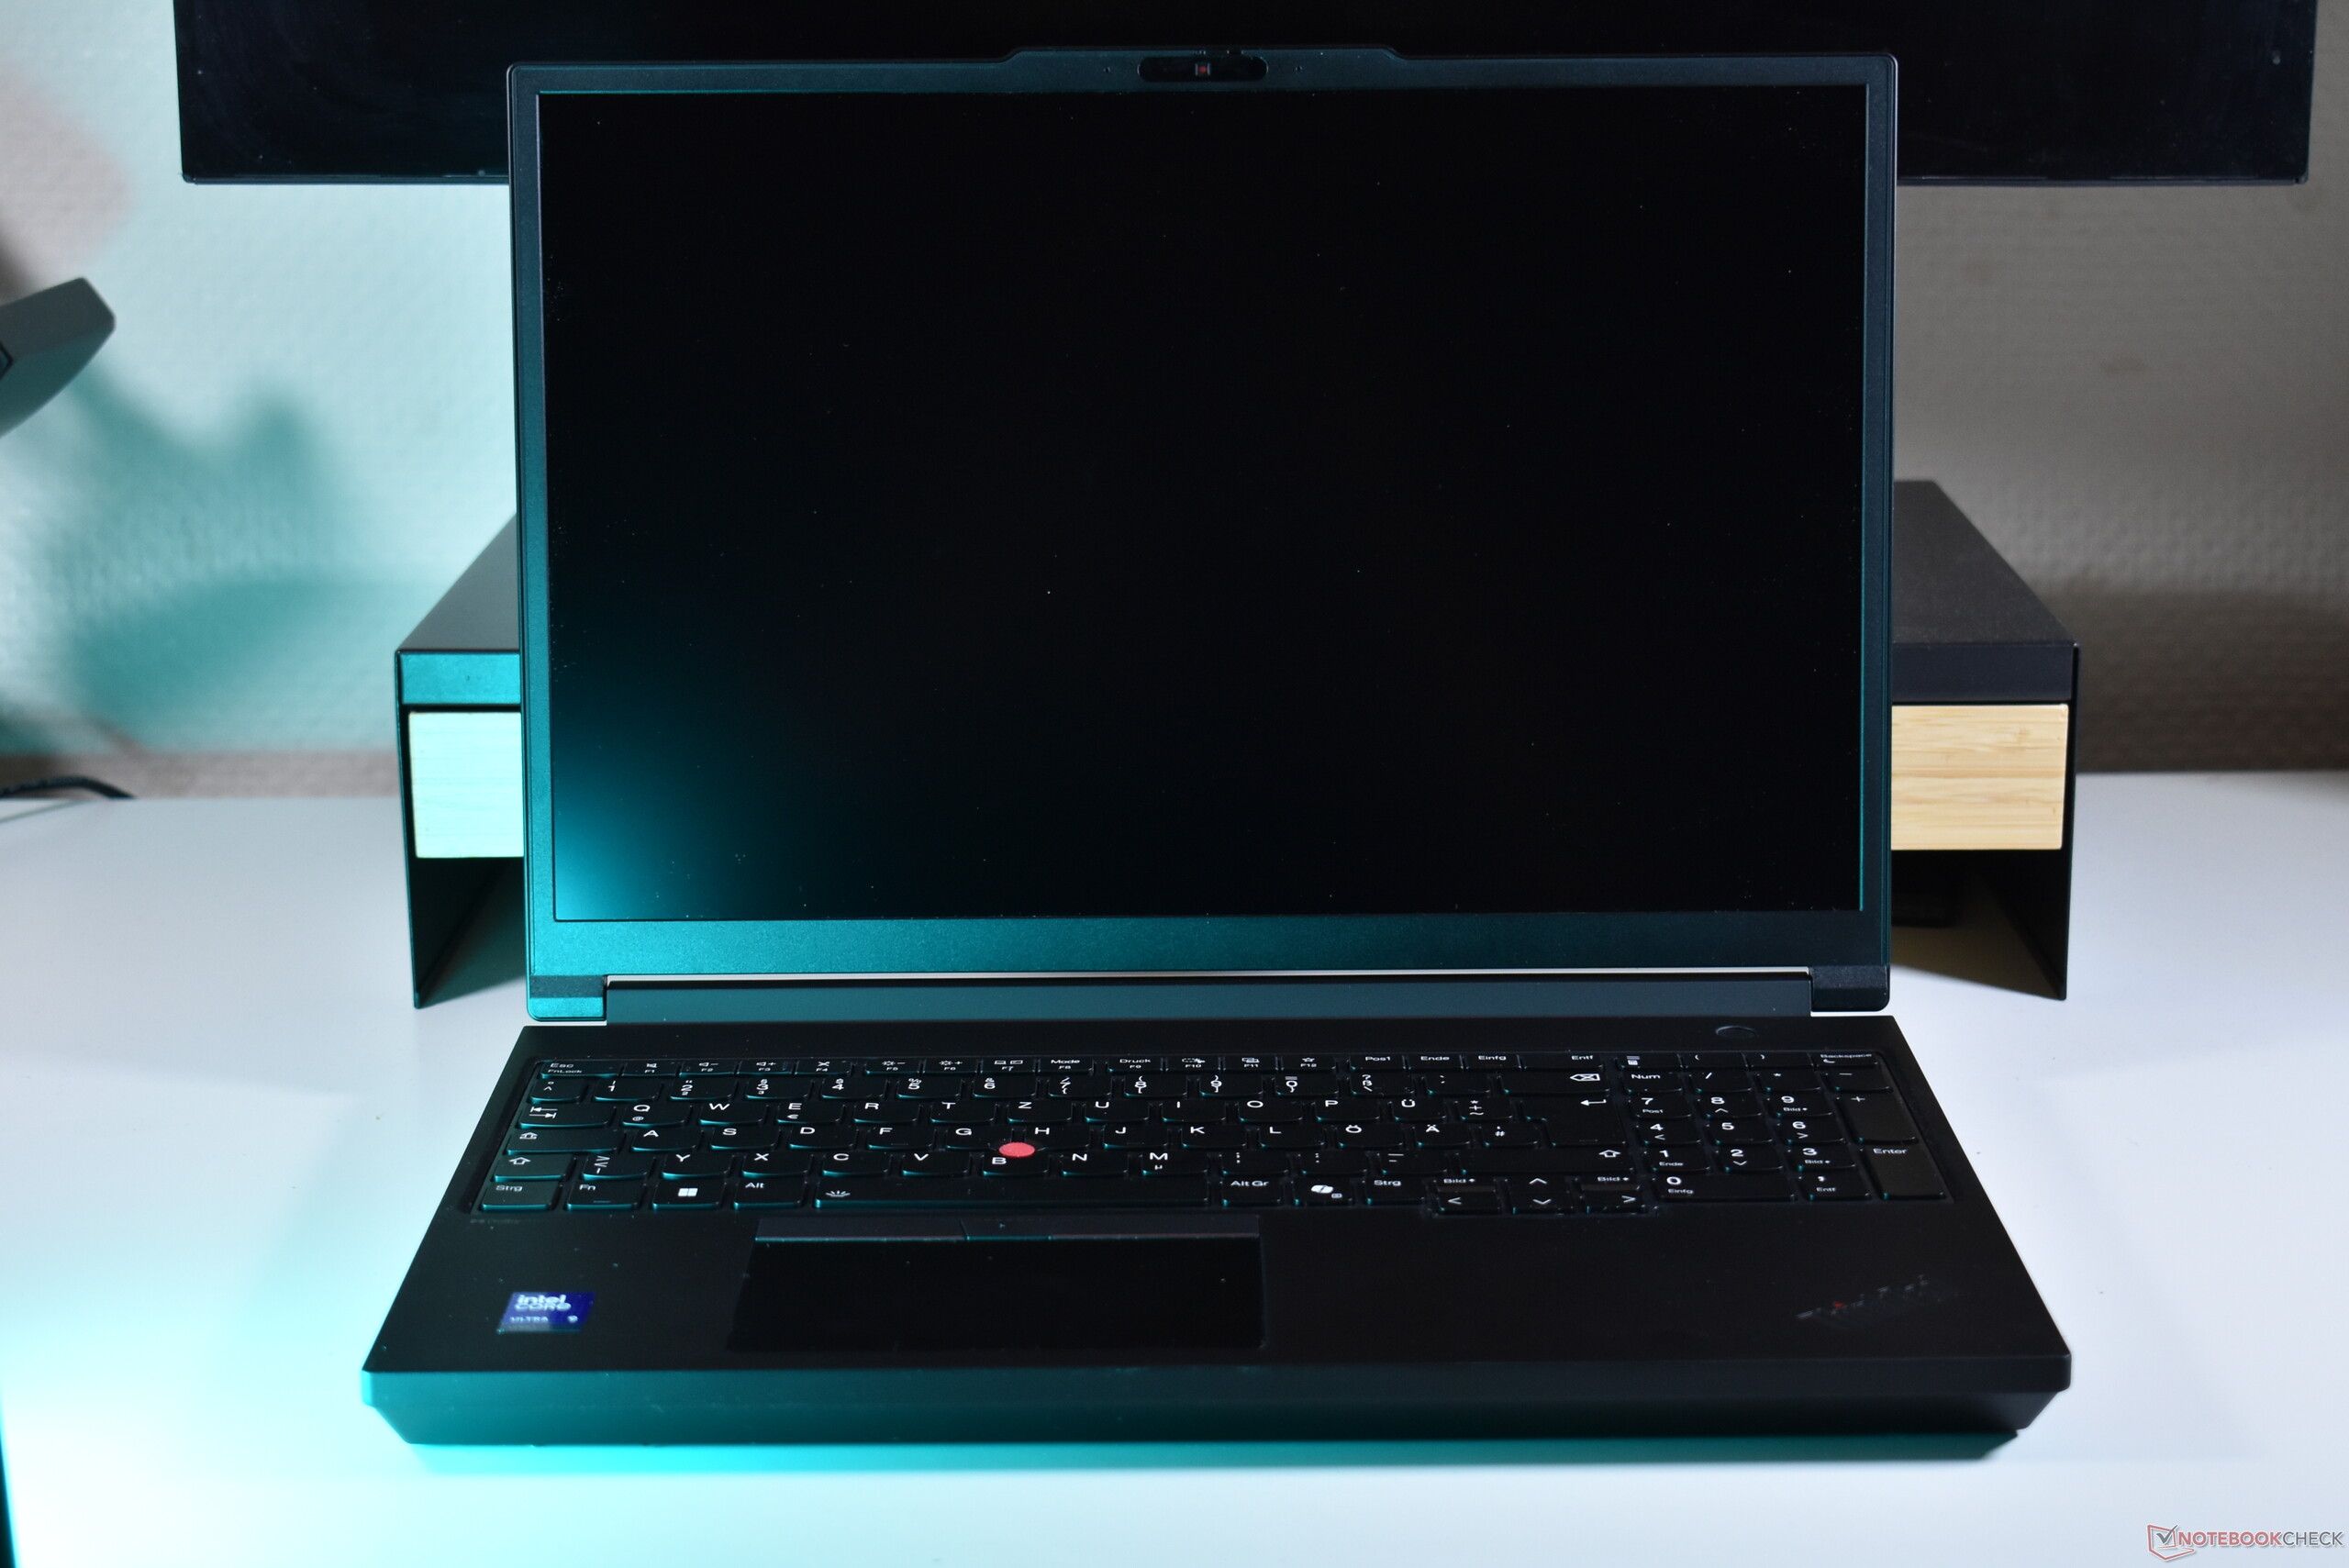
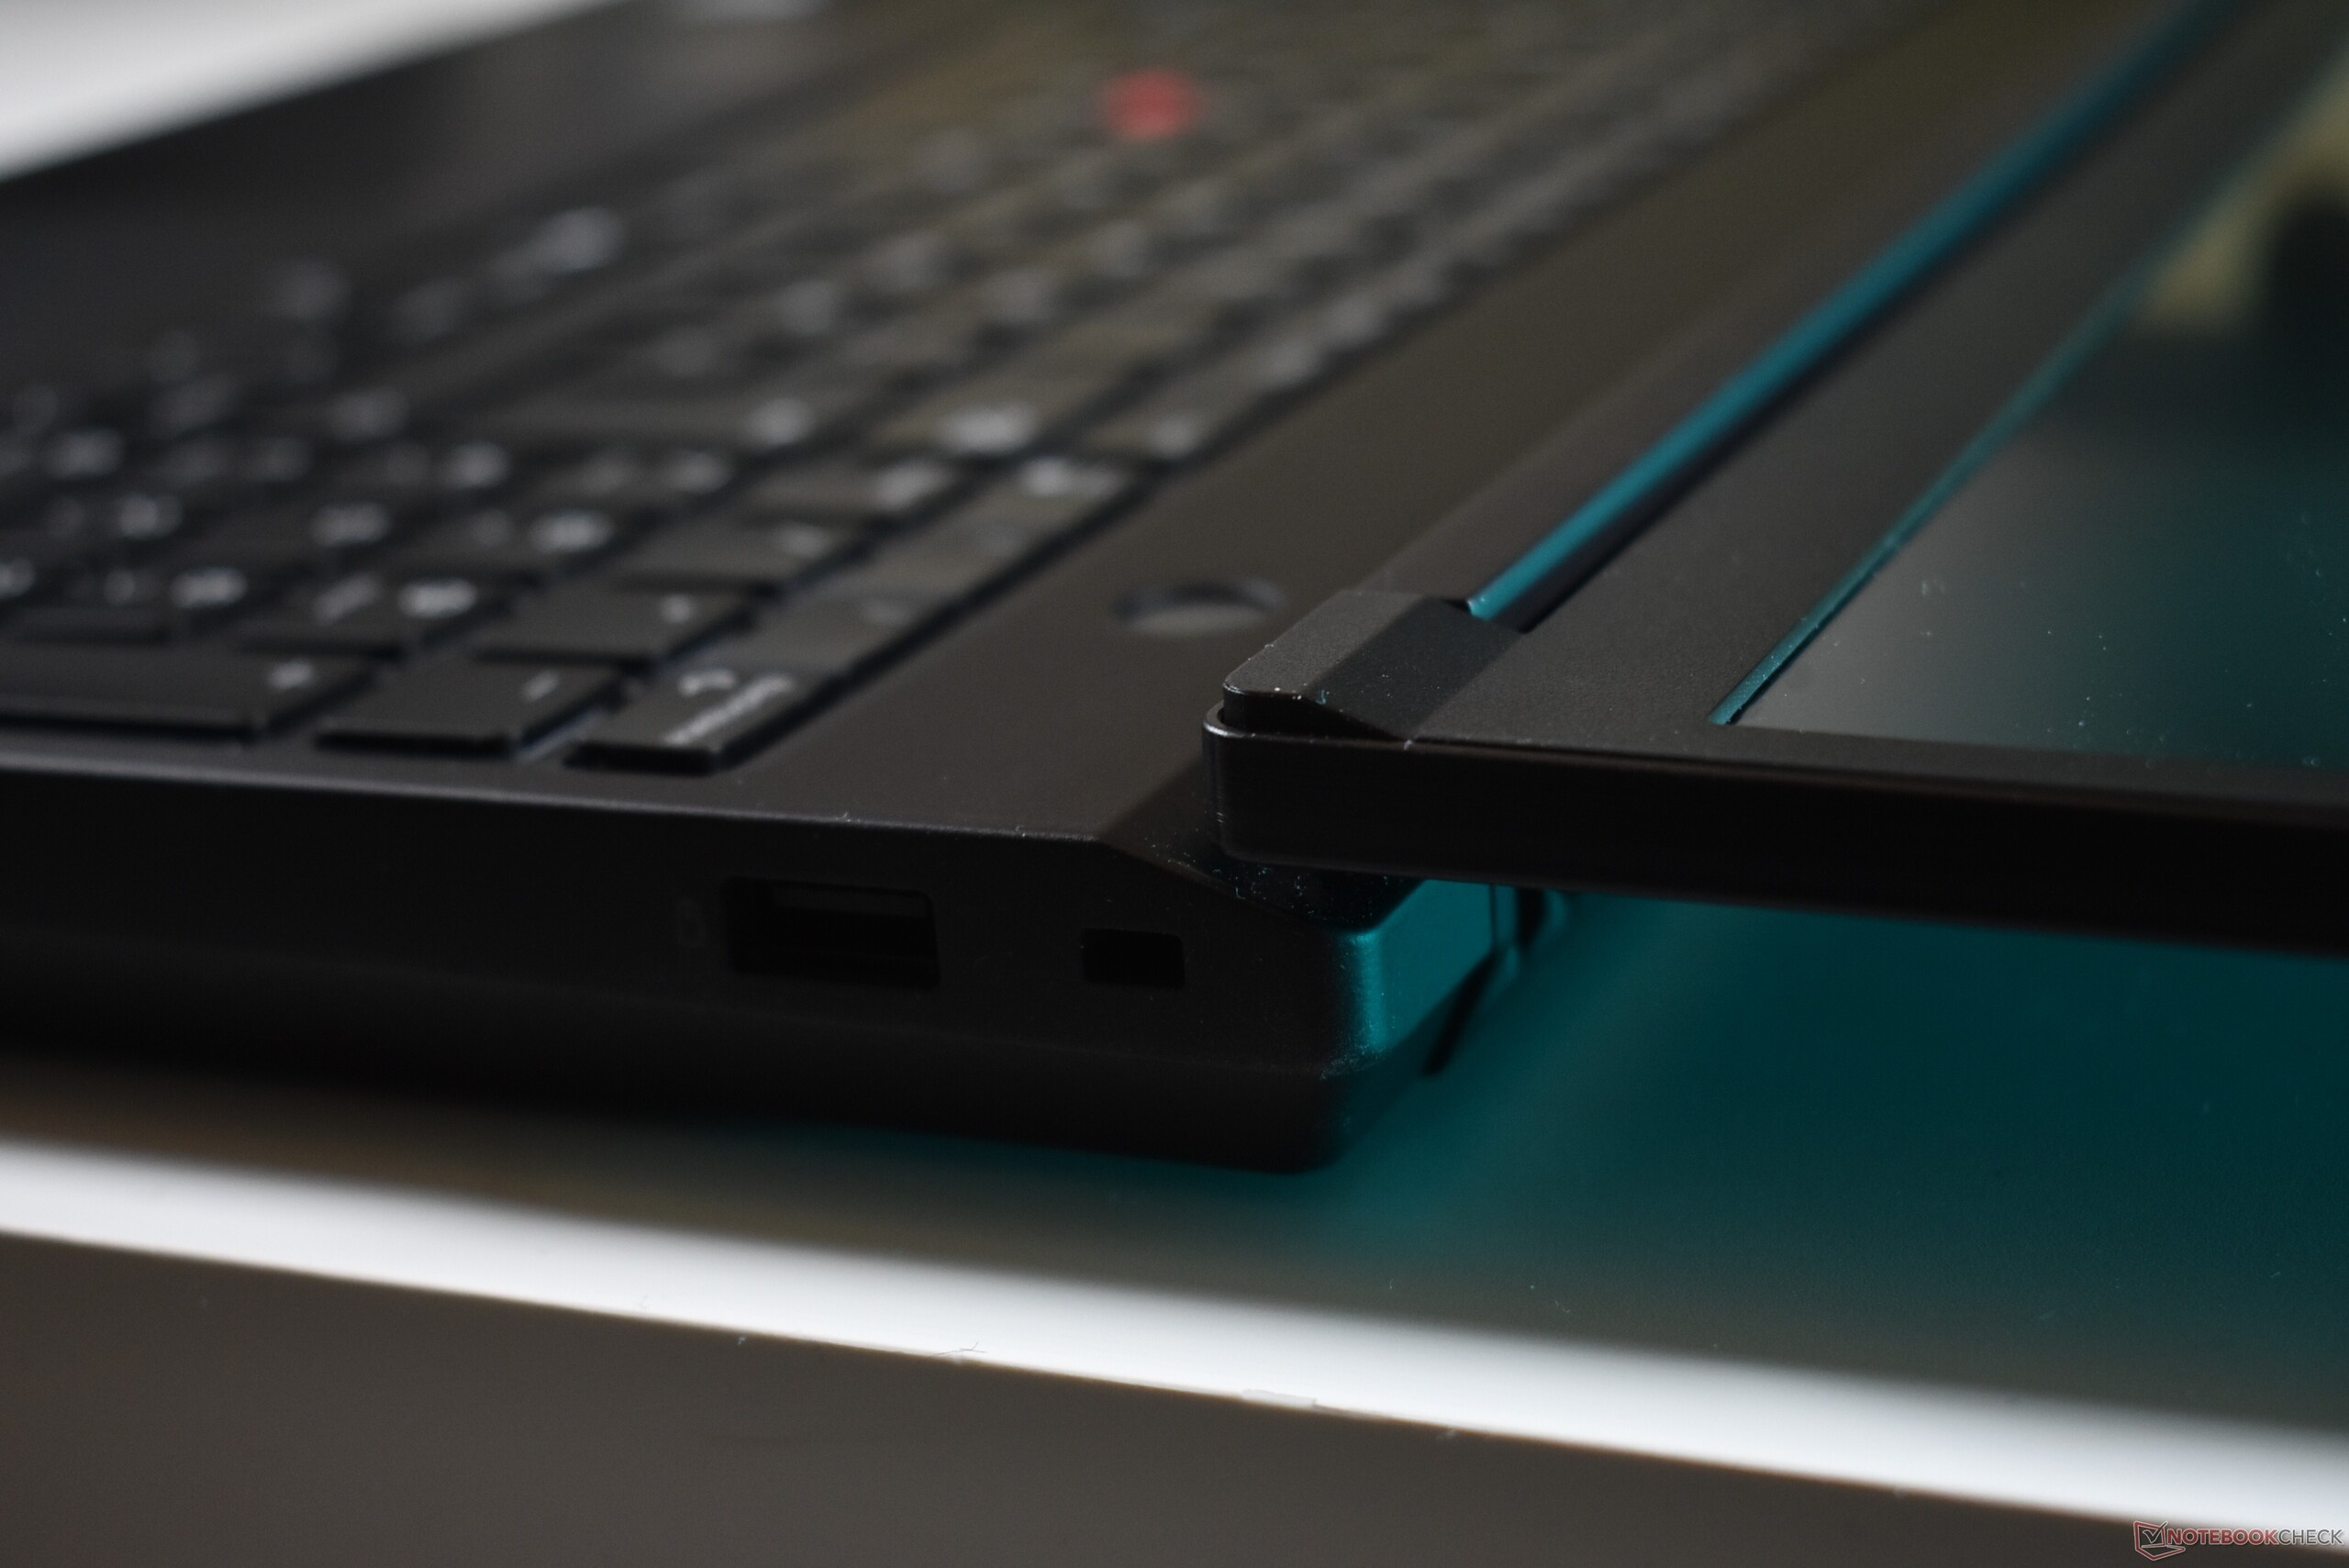
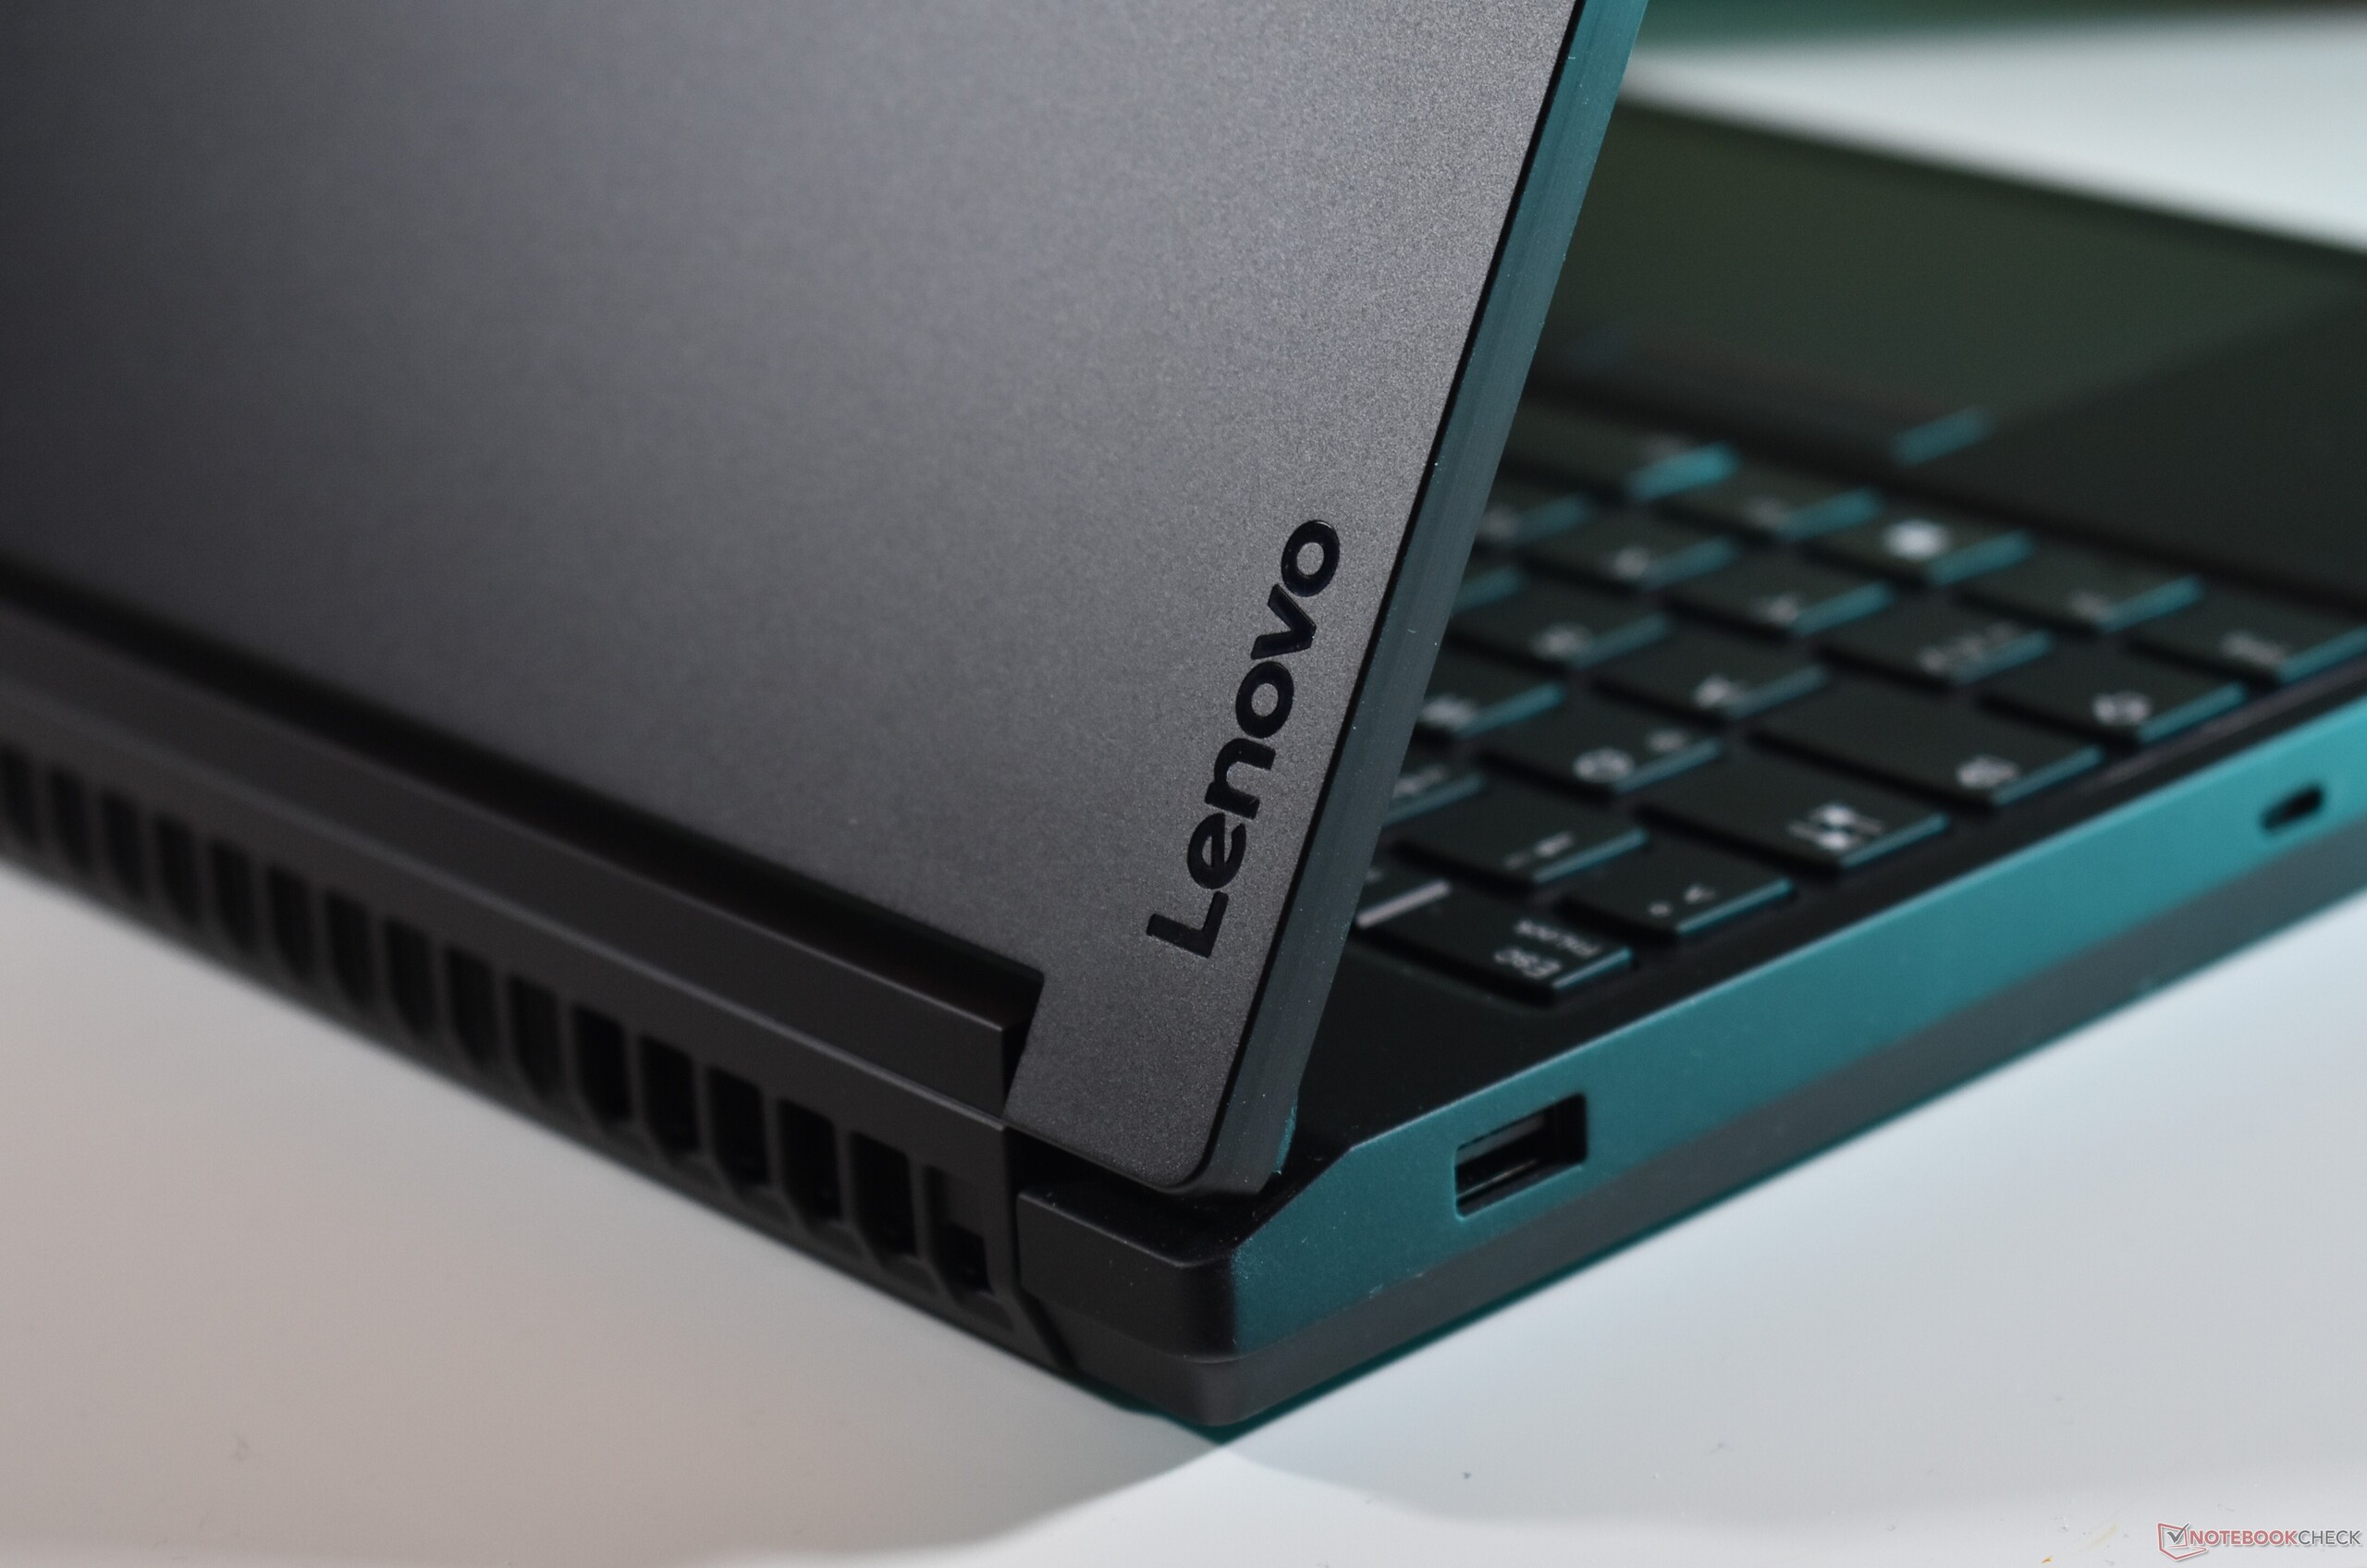
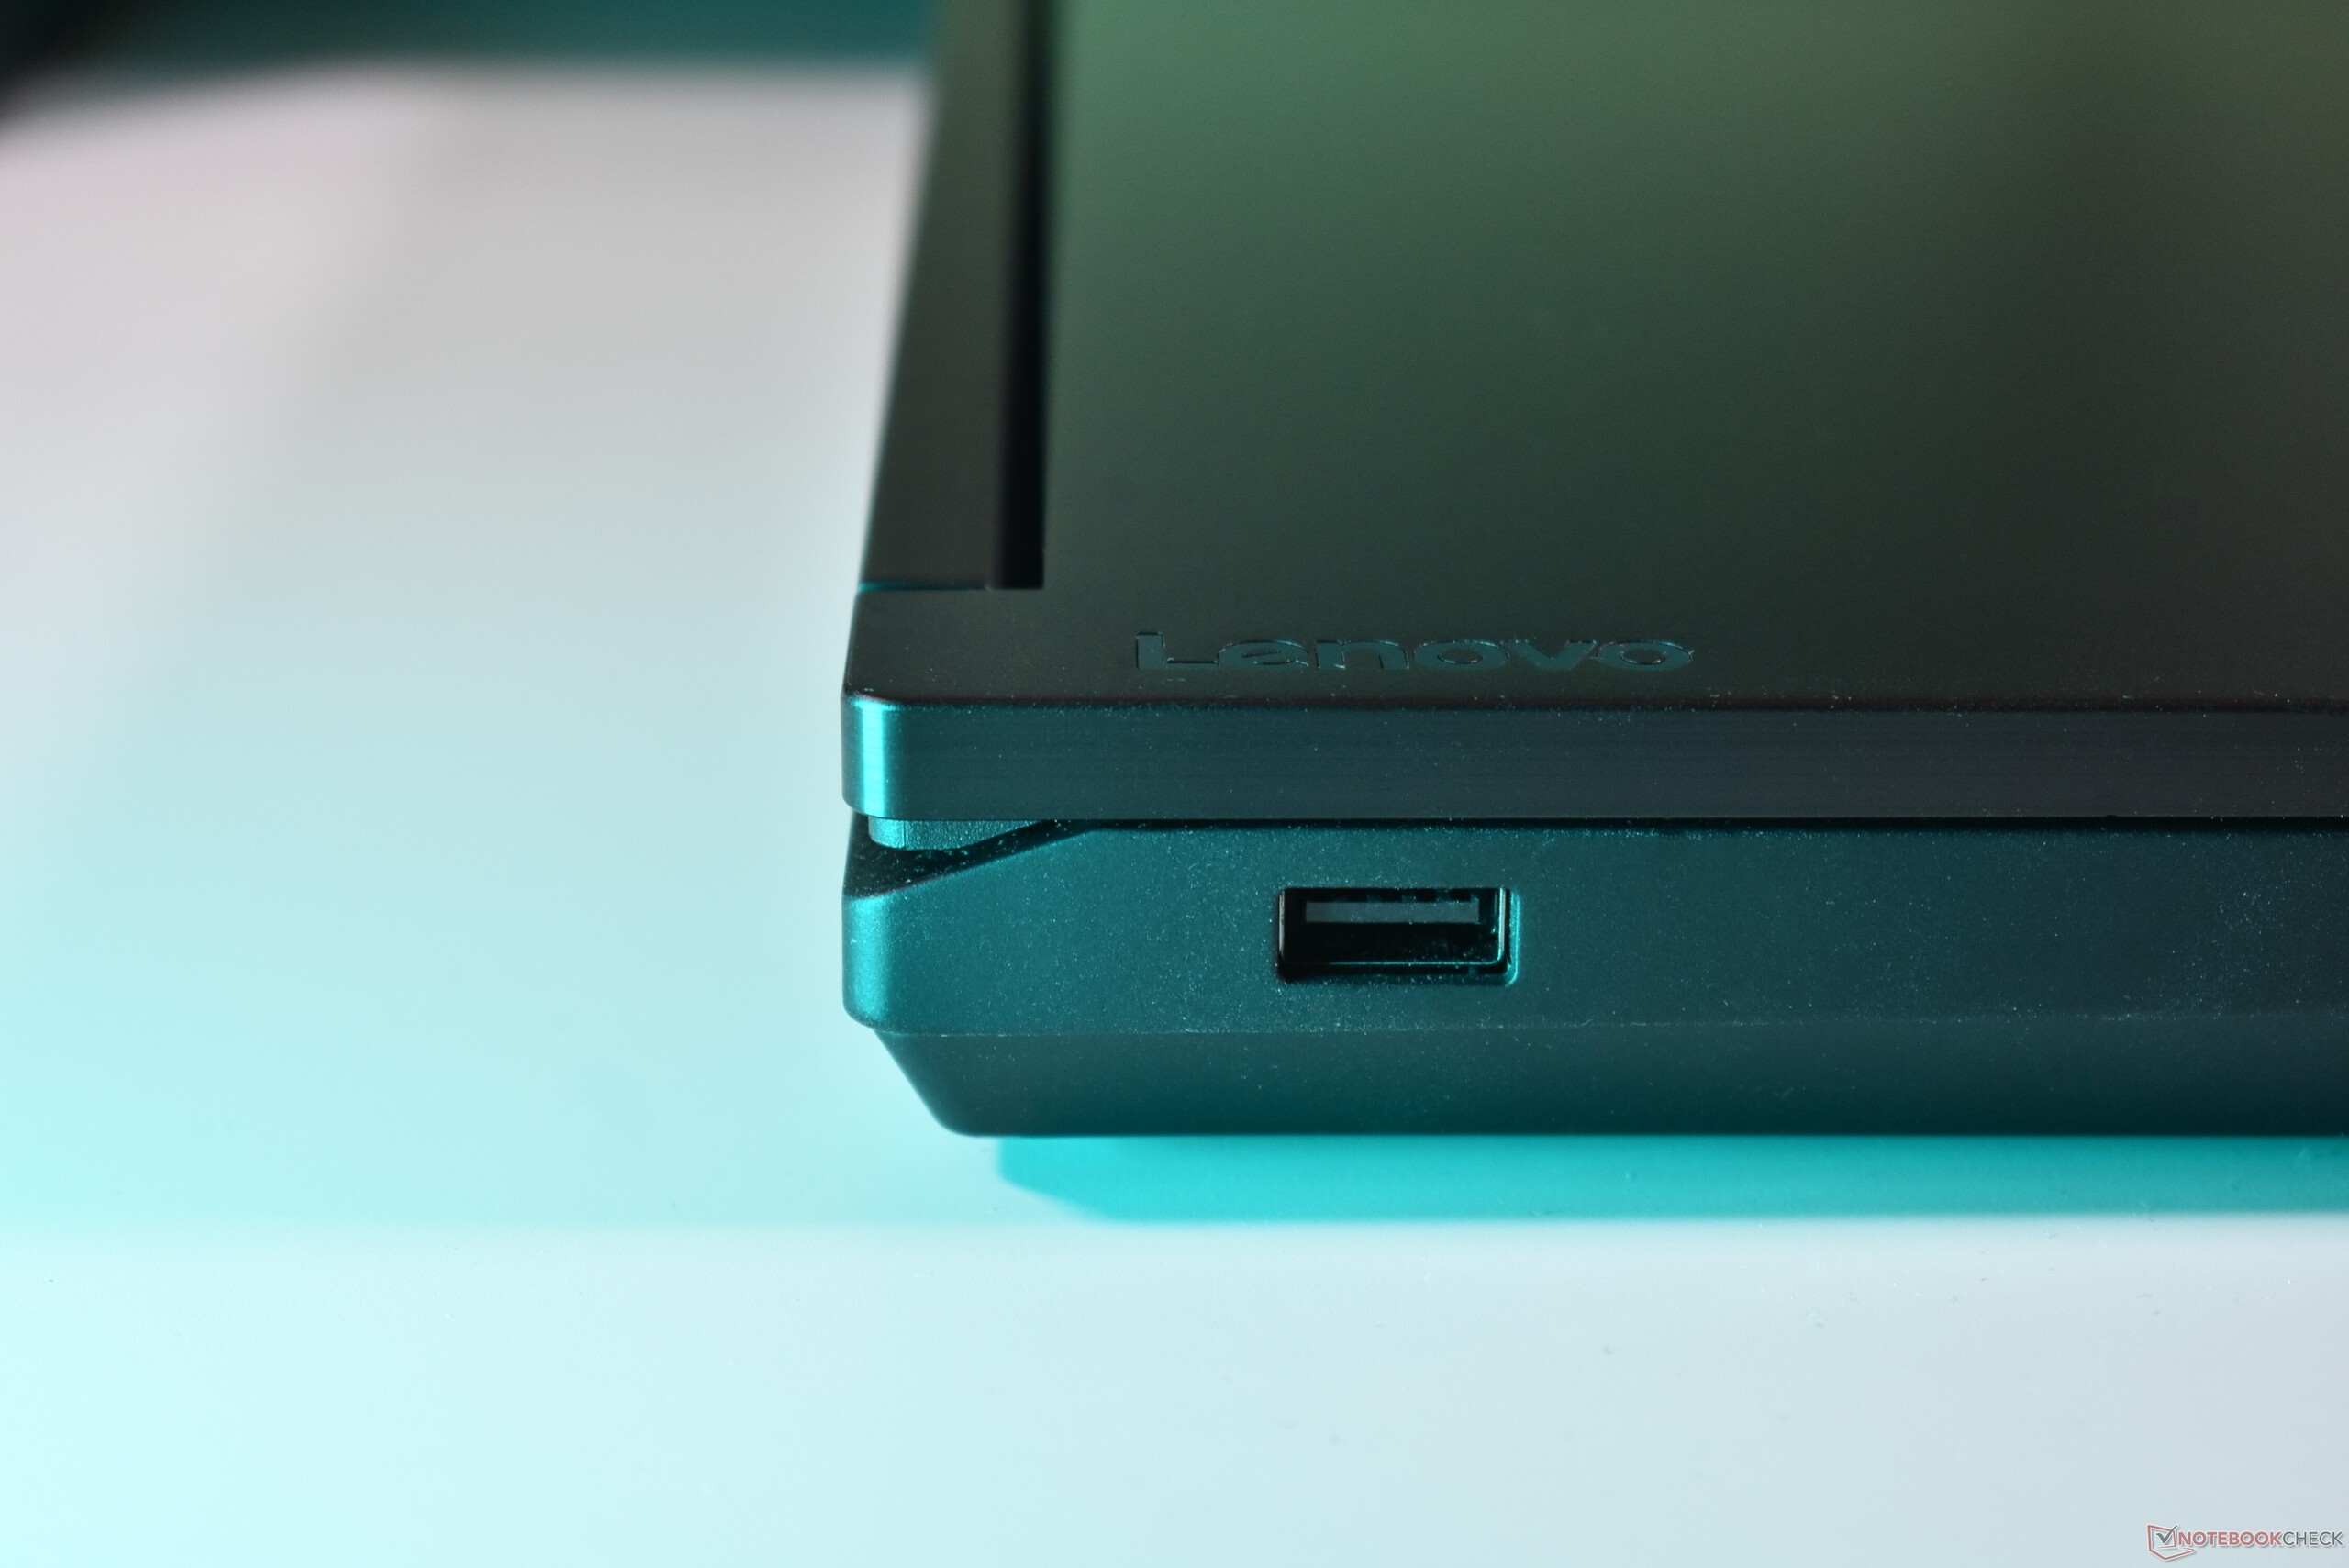
With the original ThinkPad P16 Gen 1 and the ThinkPad P16 Gen 2, Lenovo took a bold new direction with their workstations: Gray instead of black, rounded instead of boxy. All of that is passé on the new Lenovo ThinkPad P16 Gen 3. It is boxy and black like a classic ThinkPad. But it is not a complete rebuke of the old P16 design: Lenovo keeps the aluminum top cover, although now in anodized black. The metal bottom half of the chassis uses the typical black ThinkPad coating, which is smooth and slightly rubberized. New this year is the wider single-piece hinge, which is where Lenovo places the Wi-Fi antennas. The screen barely wobbles, and opens 180 degrees. One-handed opening is possible.
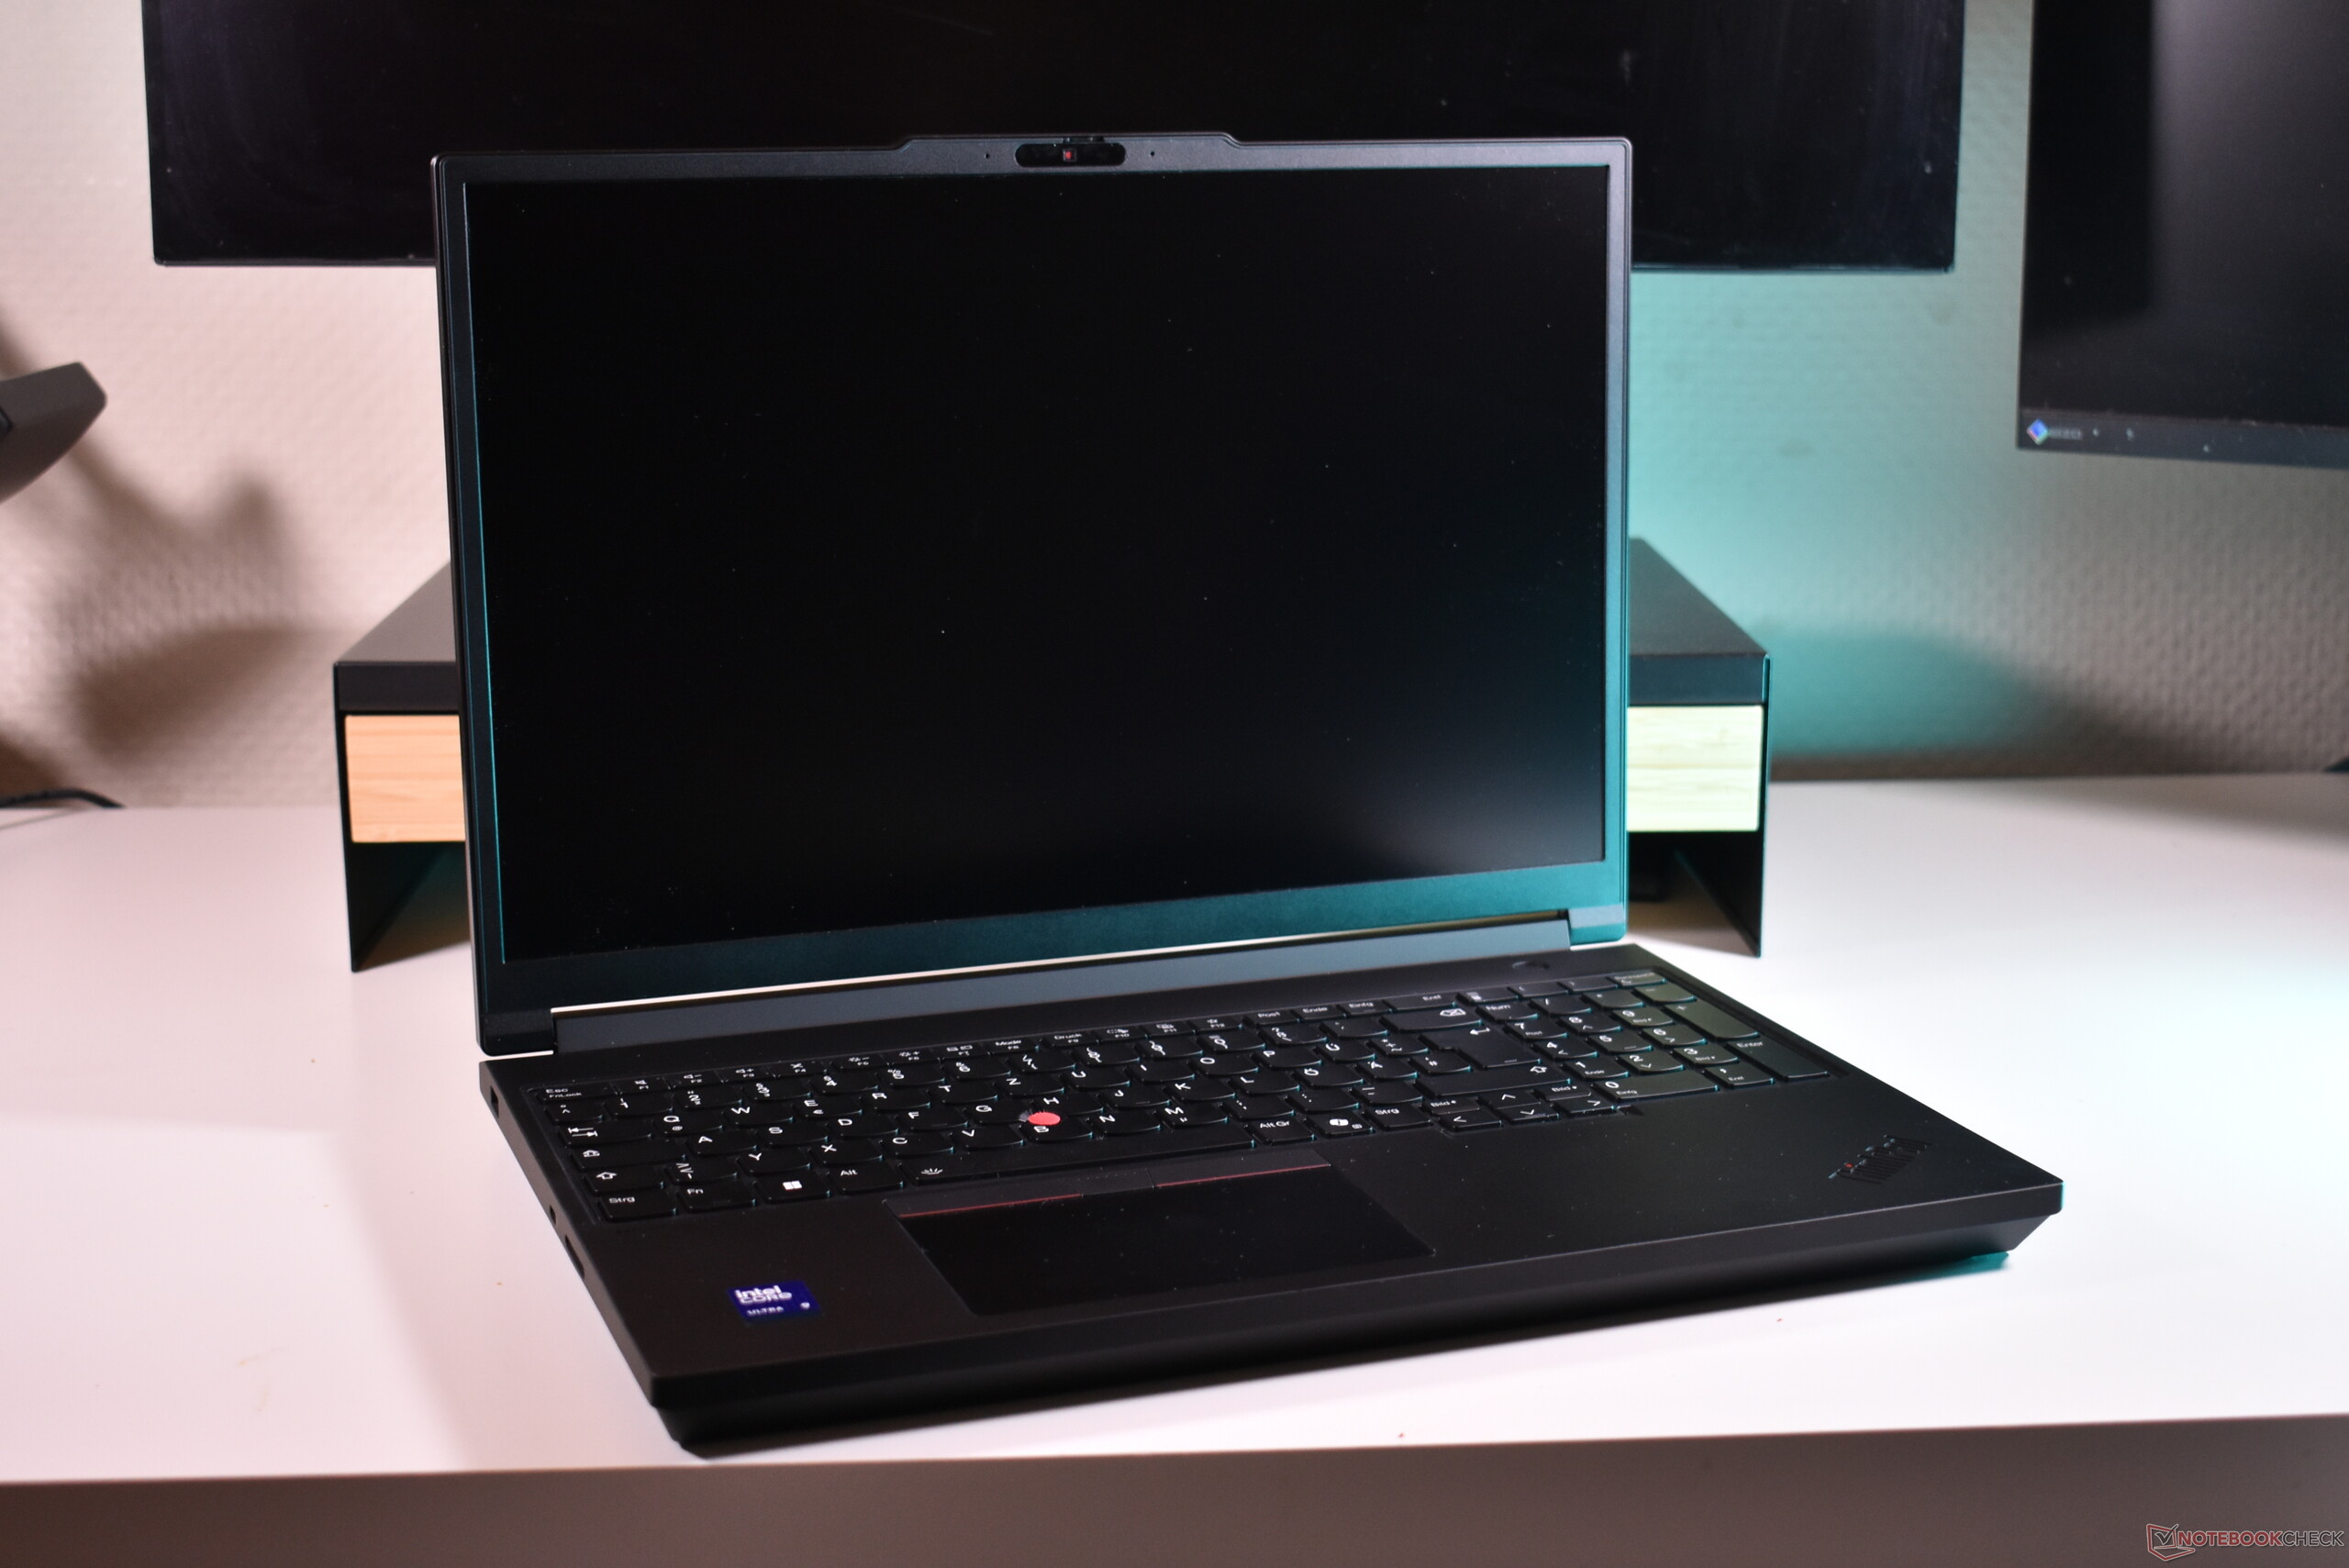

The newer P16 is noticeably more lightweight and compact than the older version. It still is heavy and big, but it is no longer the biggest and heaviest among the full-fat 16-inch workstation laptops. Clearly, optimizing the mobility was one of Lenovo's priorities.
Connectivity
The main news are the Thunderbolt 5 ports on the back. Additionally, the third USB-C now supports Thunderbolt 4. Also, Lenovo chose to bring back the RJ45-Ethernet, which supports 2.5 GBit speeds. The ThinkPad P16 now charges via USB-C.


SD Card Reader
| SD Card Reader | |
| average JPG Copy Test (av. of 3 runs) | |
| Lenovo ThinkPad T16g Gen 3 RTX 5080 (ADATA SD8.0 Express 512 GB) | |
| Lenovo ThinkPad T16g Gen 3 RTX 5080 (Angelbird AV Pro V60) | |
| Average of class Workstation (49.6 - 681, n=14, last 2 years) | |
| HP ZBook Fury 16 G11 (Toshiba Exceria Pro SDXC 64 GB UHS-II) | |
| Lenovo ThinkPad P1 Gen 8 (Toshiba Exceria Pro SDXC 64 GB UHS-II) | |
| Lenovo ThinkPad P16 Gen 3 (AV Pro V60) | |
| Dell Pro Max 16 Plus (Toshiba Exceria Pro SDXC 64 GB UHS-II) | |
| Lenovo ThinkPad P16 G2 21FA000FGE | |
| maximum AS SSD Seq Read Test (1GB) | |
| Lenovo ThinkPad T16g Gen 3 RTX 5080 (ADATA SD8.0 Express 512 GB) | |
| Lenovo ThinkPad T16g Gen 3 RTX 5080 (Angelbird AV Pro V60) | |
| Average of class Workstation (87.6 - 1455, n=14, last 2 years) | |
| Lenovo ThinkPad P16 Gen 3 (AV Pro V60) | |
| HP ZBook Fury 16 G11 (Toshiba Exceria Pro SDXC 64 GB UHS-II) | |
| Dell Pro Max 16 Plus (Toshiba Exceria Pro SDXC 64 GB UHS-II) | |
| Lenovo ThinkPad P1 Gen 8 (Toshiba Exceria Pro SDXC 64 GB UHS-II) | |
| Lenovo ThinkPad P16 G2 21FA000FGE | |
Communication


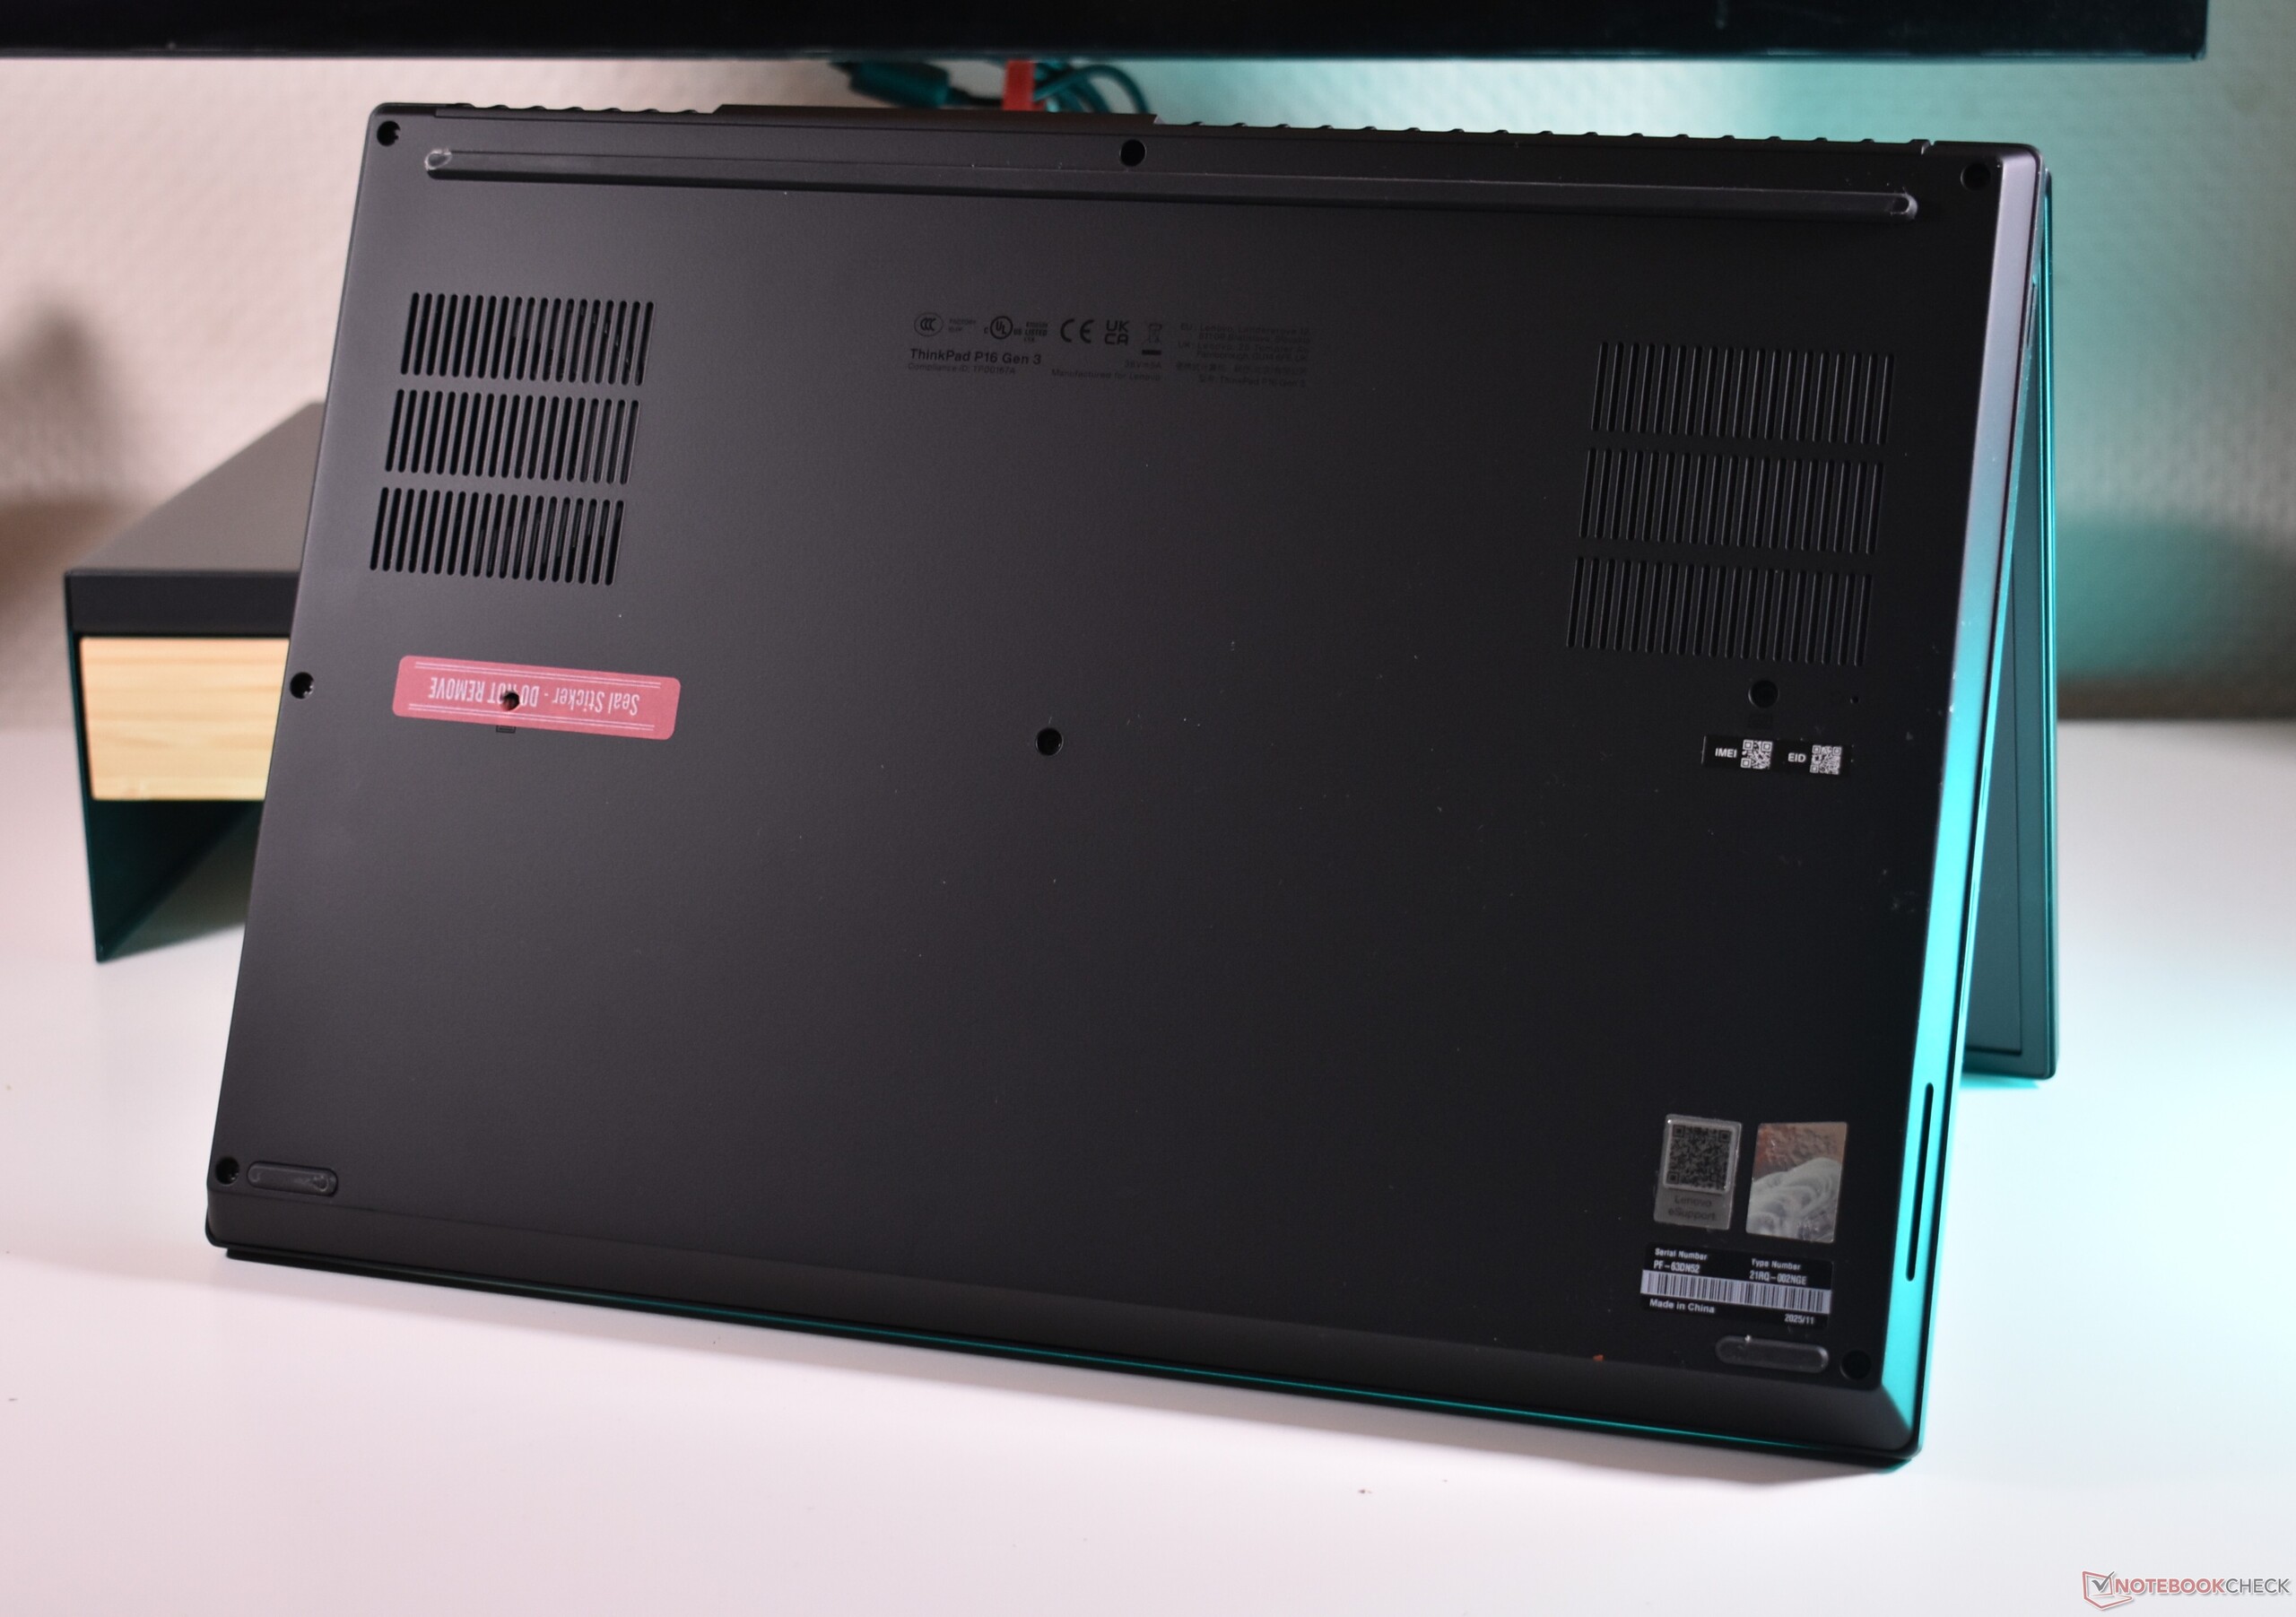
Maintenance


Input Devices
Keyboard
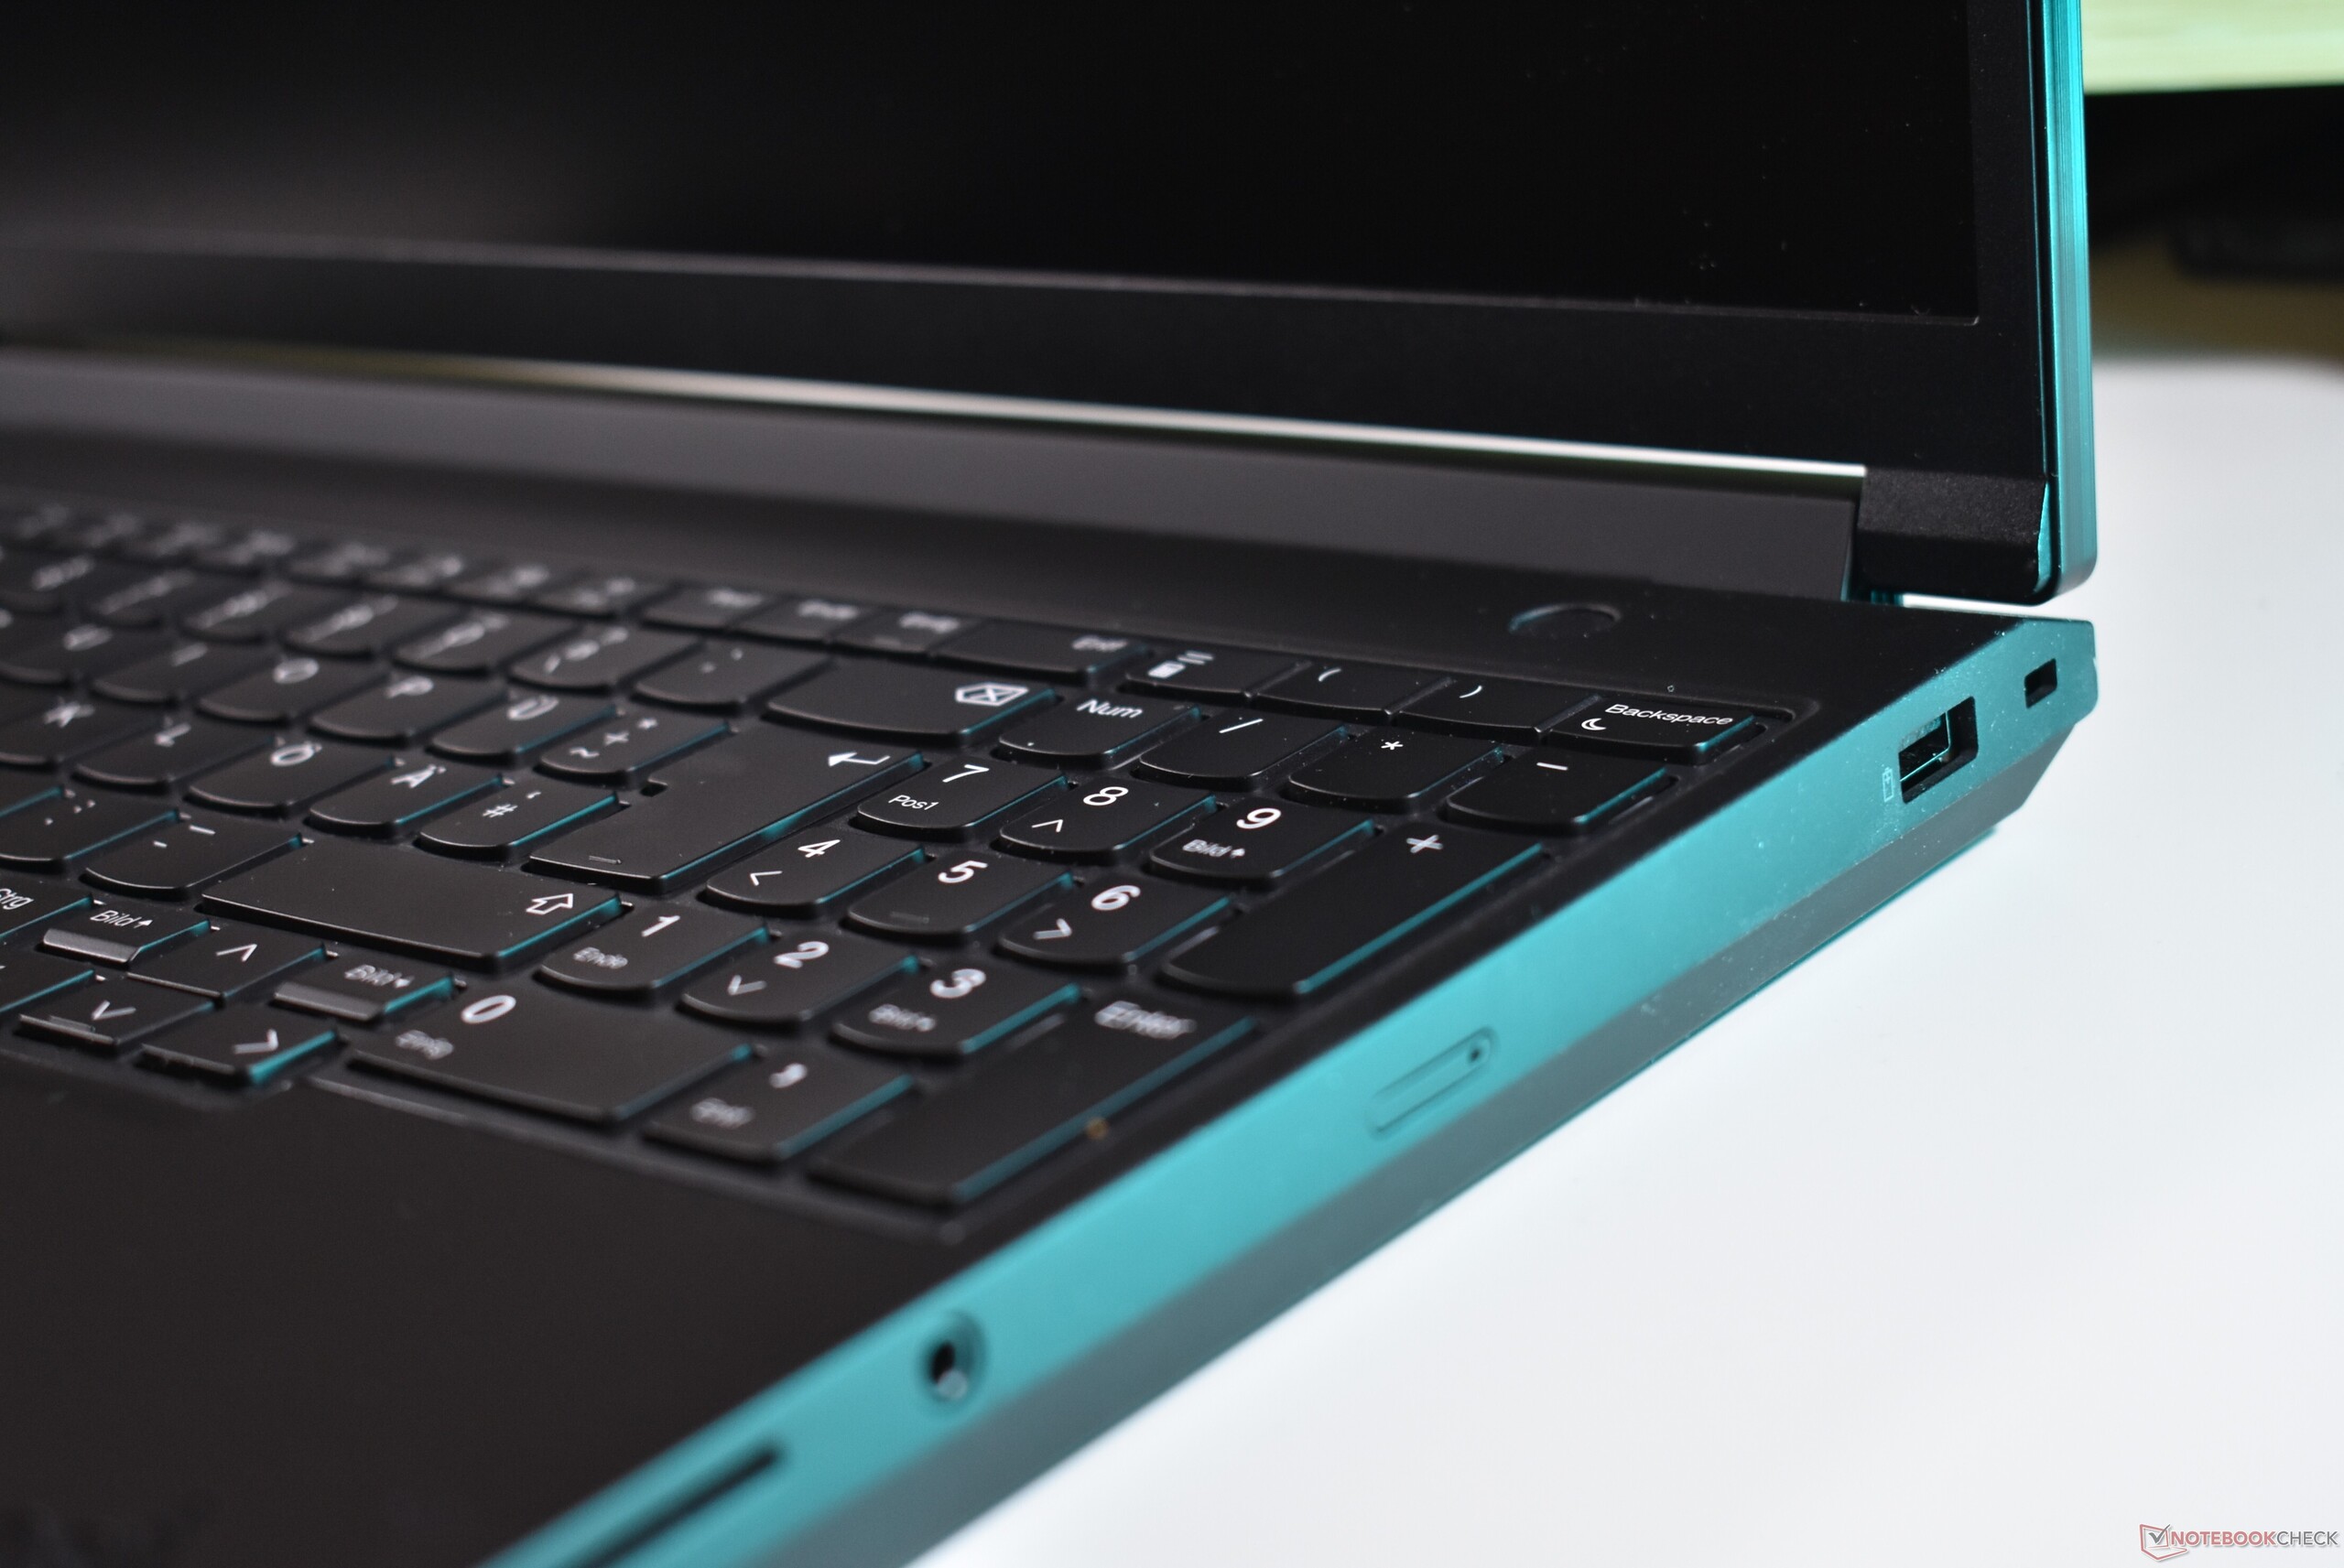
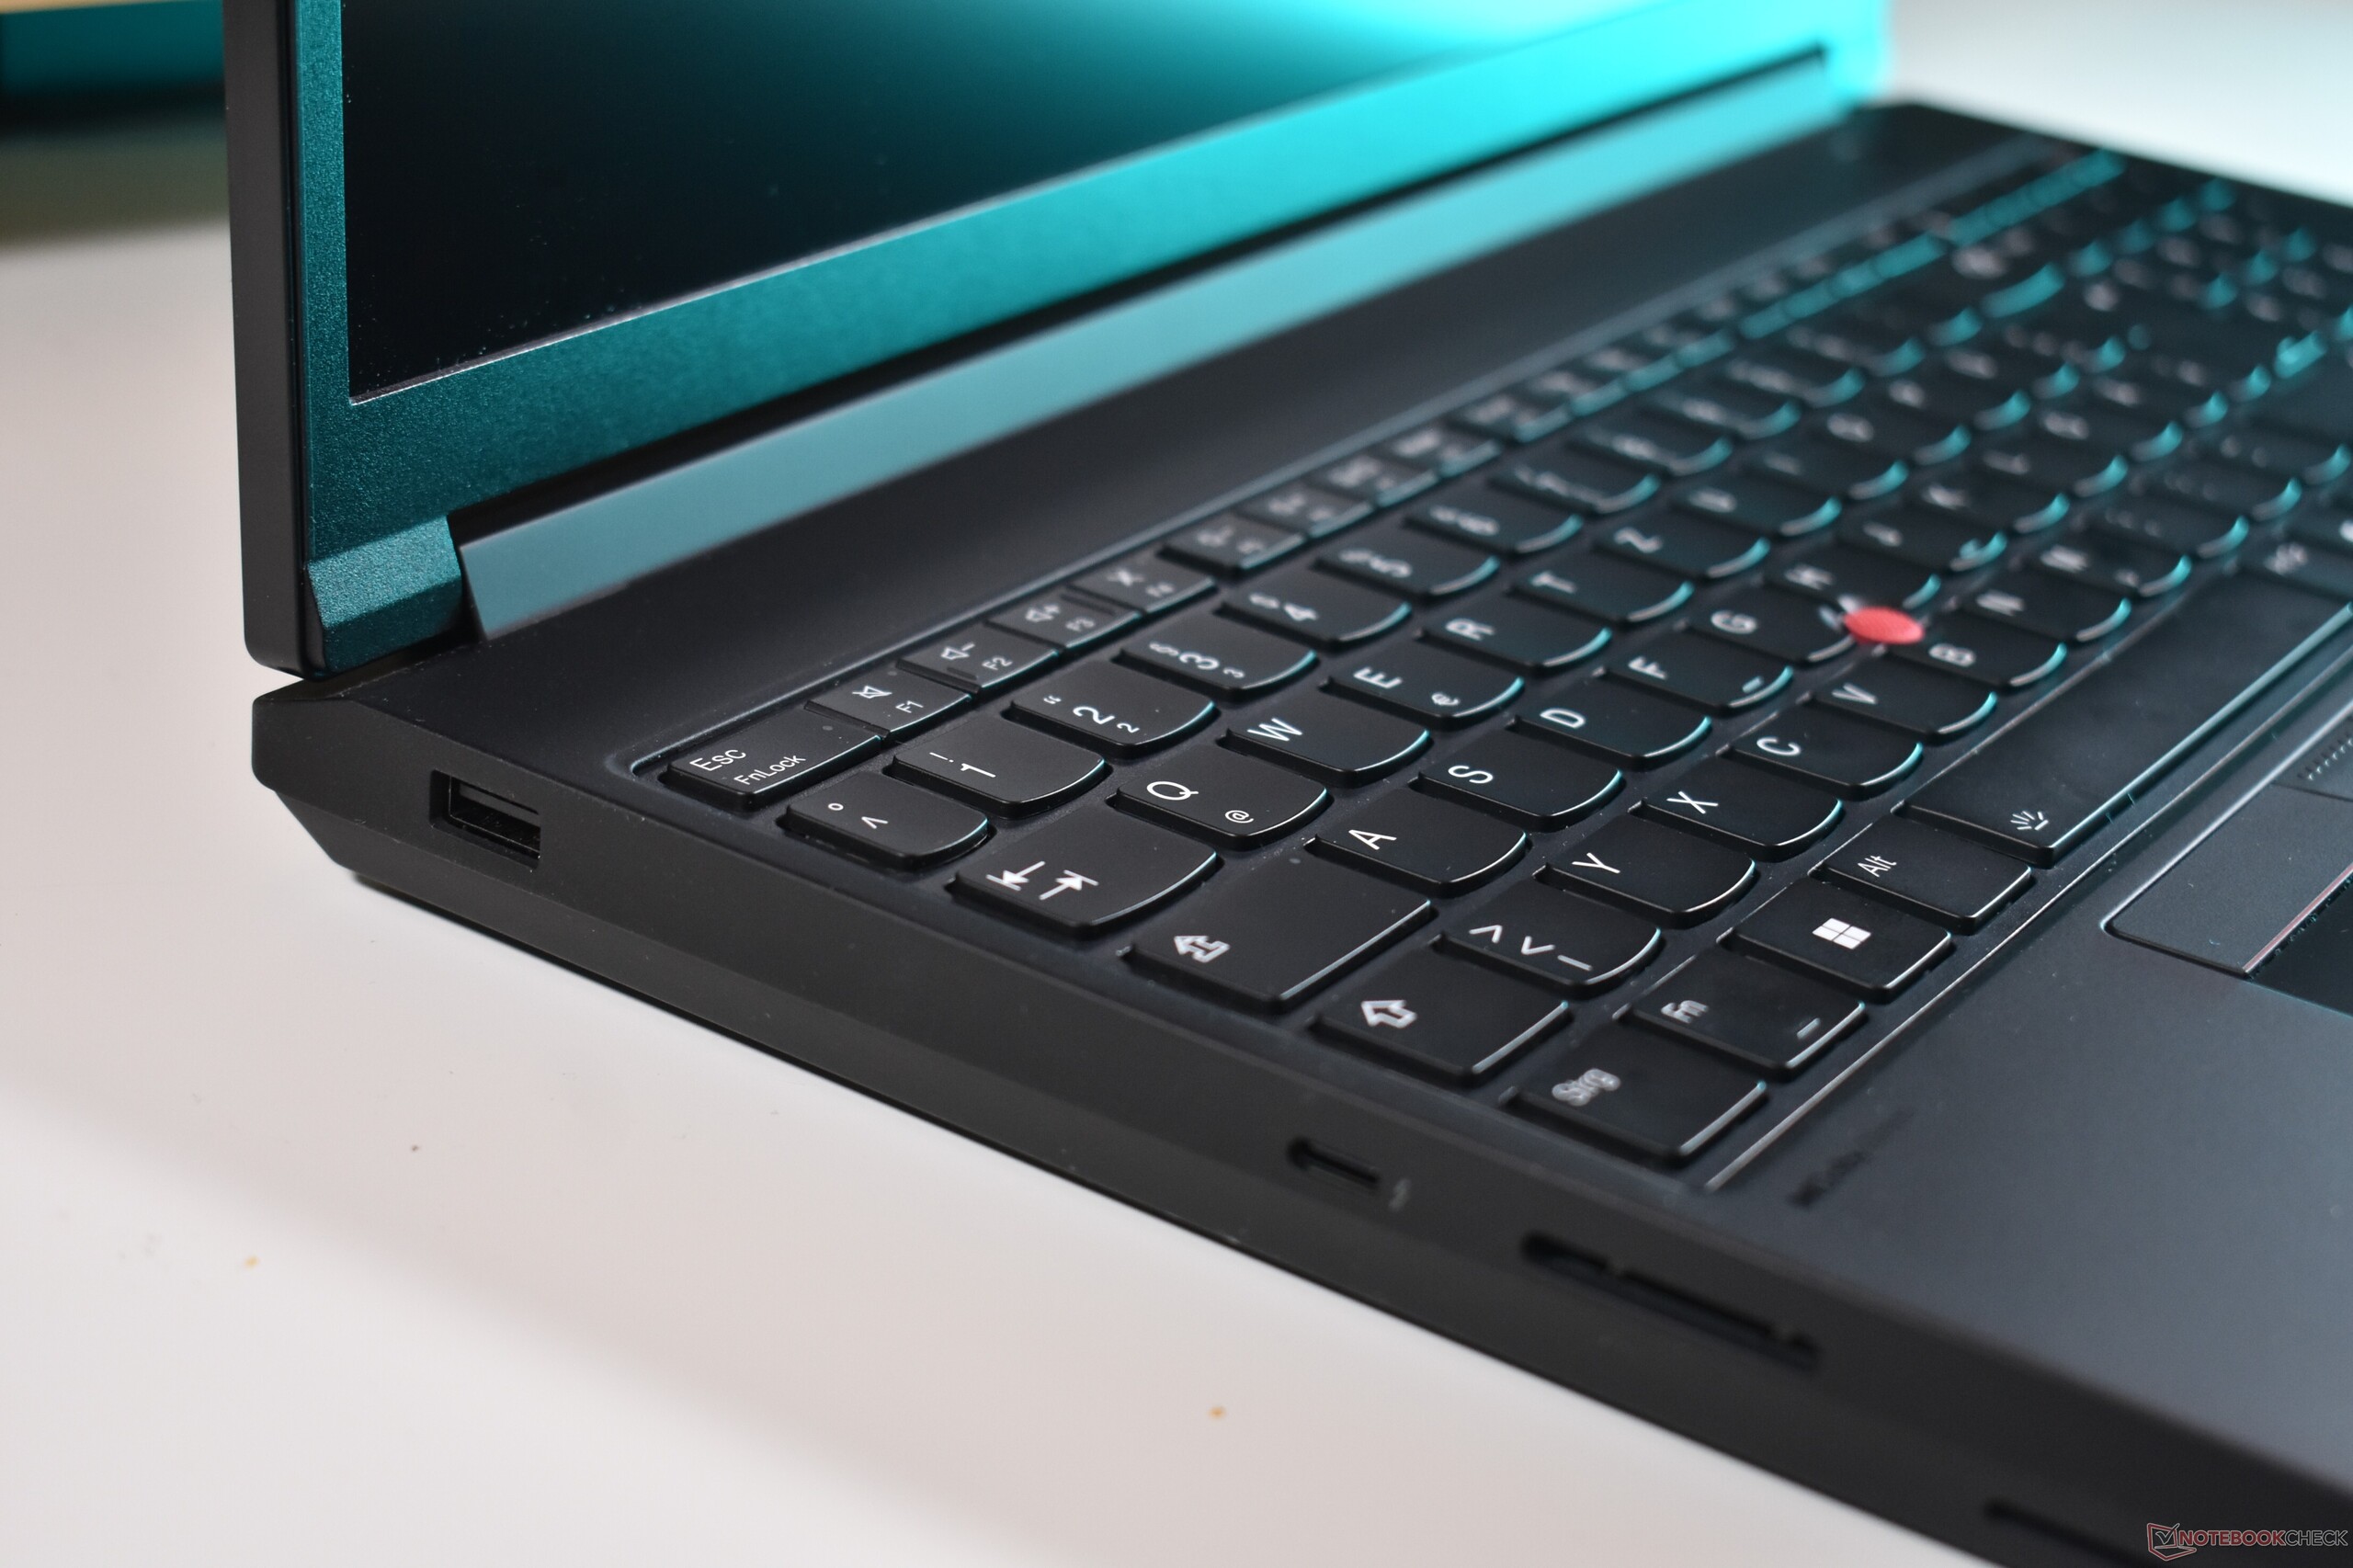
While the rest of the laptop changes, the two-stage wite-LED backlit keyboard remains the same as before. The rounded, slightly concave keys provide a soft yet defined landing with a good travel distance of 1.5 mm. The layout is spaceous and with the dedicated numpad ideal for number crunching. Overall, using the keyboard is a pleasure, and it stands among the best in the current ThinkPad lineup.

Touchpad
Aside from the color change from silver to black, the touchpad remains identical to the previous ThinkPad P16 G2. The mylar surface of the mechanical dive-board clickpad measures 11.5 x 6.5 cm, it has a nice dampened click and while it does not feel quite as nice as glass, the surface is smooth, making it very useable. Equally good, if not even better, is the ThinkPad TrackPoint with its three dedicated buttons.


Display
Buyers of the Lenovo ThinkPad P16 Gen 3 get the choice between three different screen options:
- WUXGA (1,920 x 1,200), IPS, 500 cd/m², 100 % sRGB, matte, 60 Hz
- 3.2K (3,200 x 2,000), Tandem OLED, 600 cd/m² (SDR) / 1500 cd/m² peak (HDR), 100 % DCI P3, semi glossy, 40 - 120 Hz VRR, Dolby Vision
- 4K-WQUXGA (3,840 x 2,400), IPS, 800 cd/m², 100 % DCI P3, matte, Dolby Vision, 60 Hz
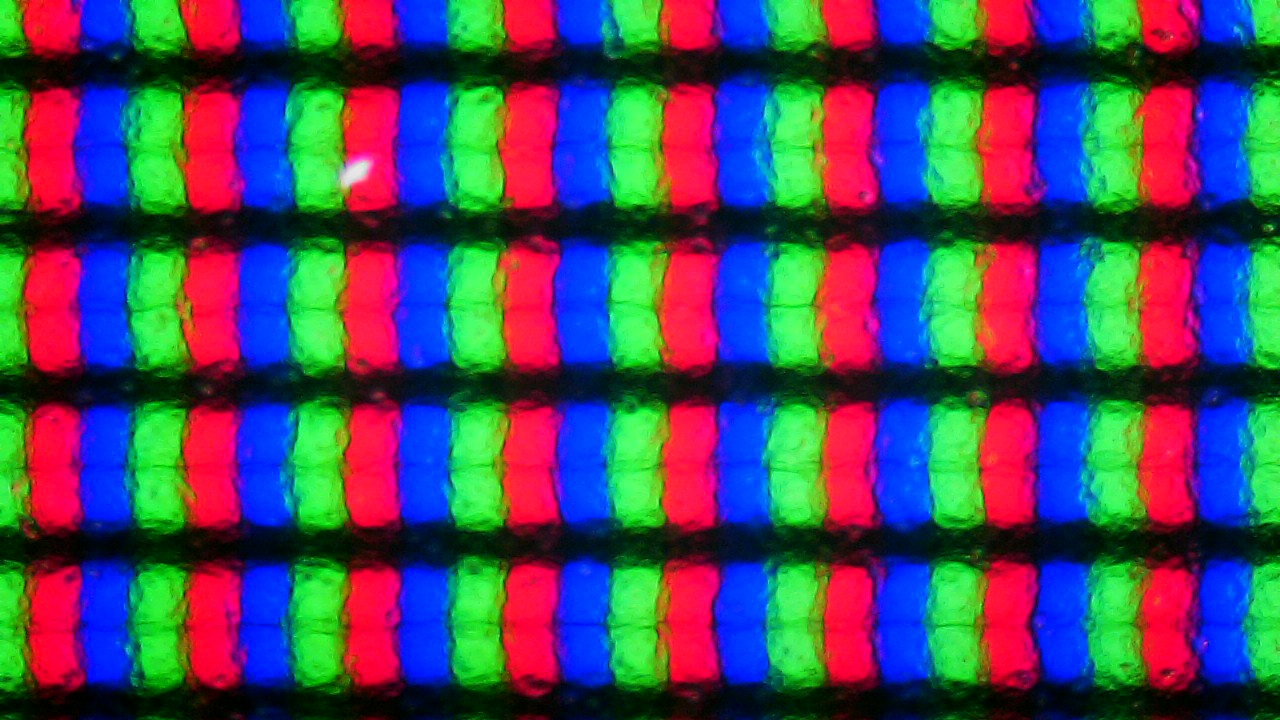
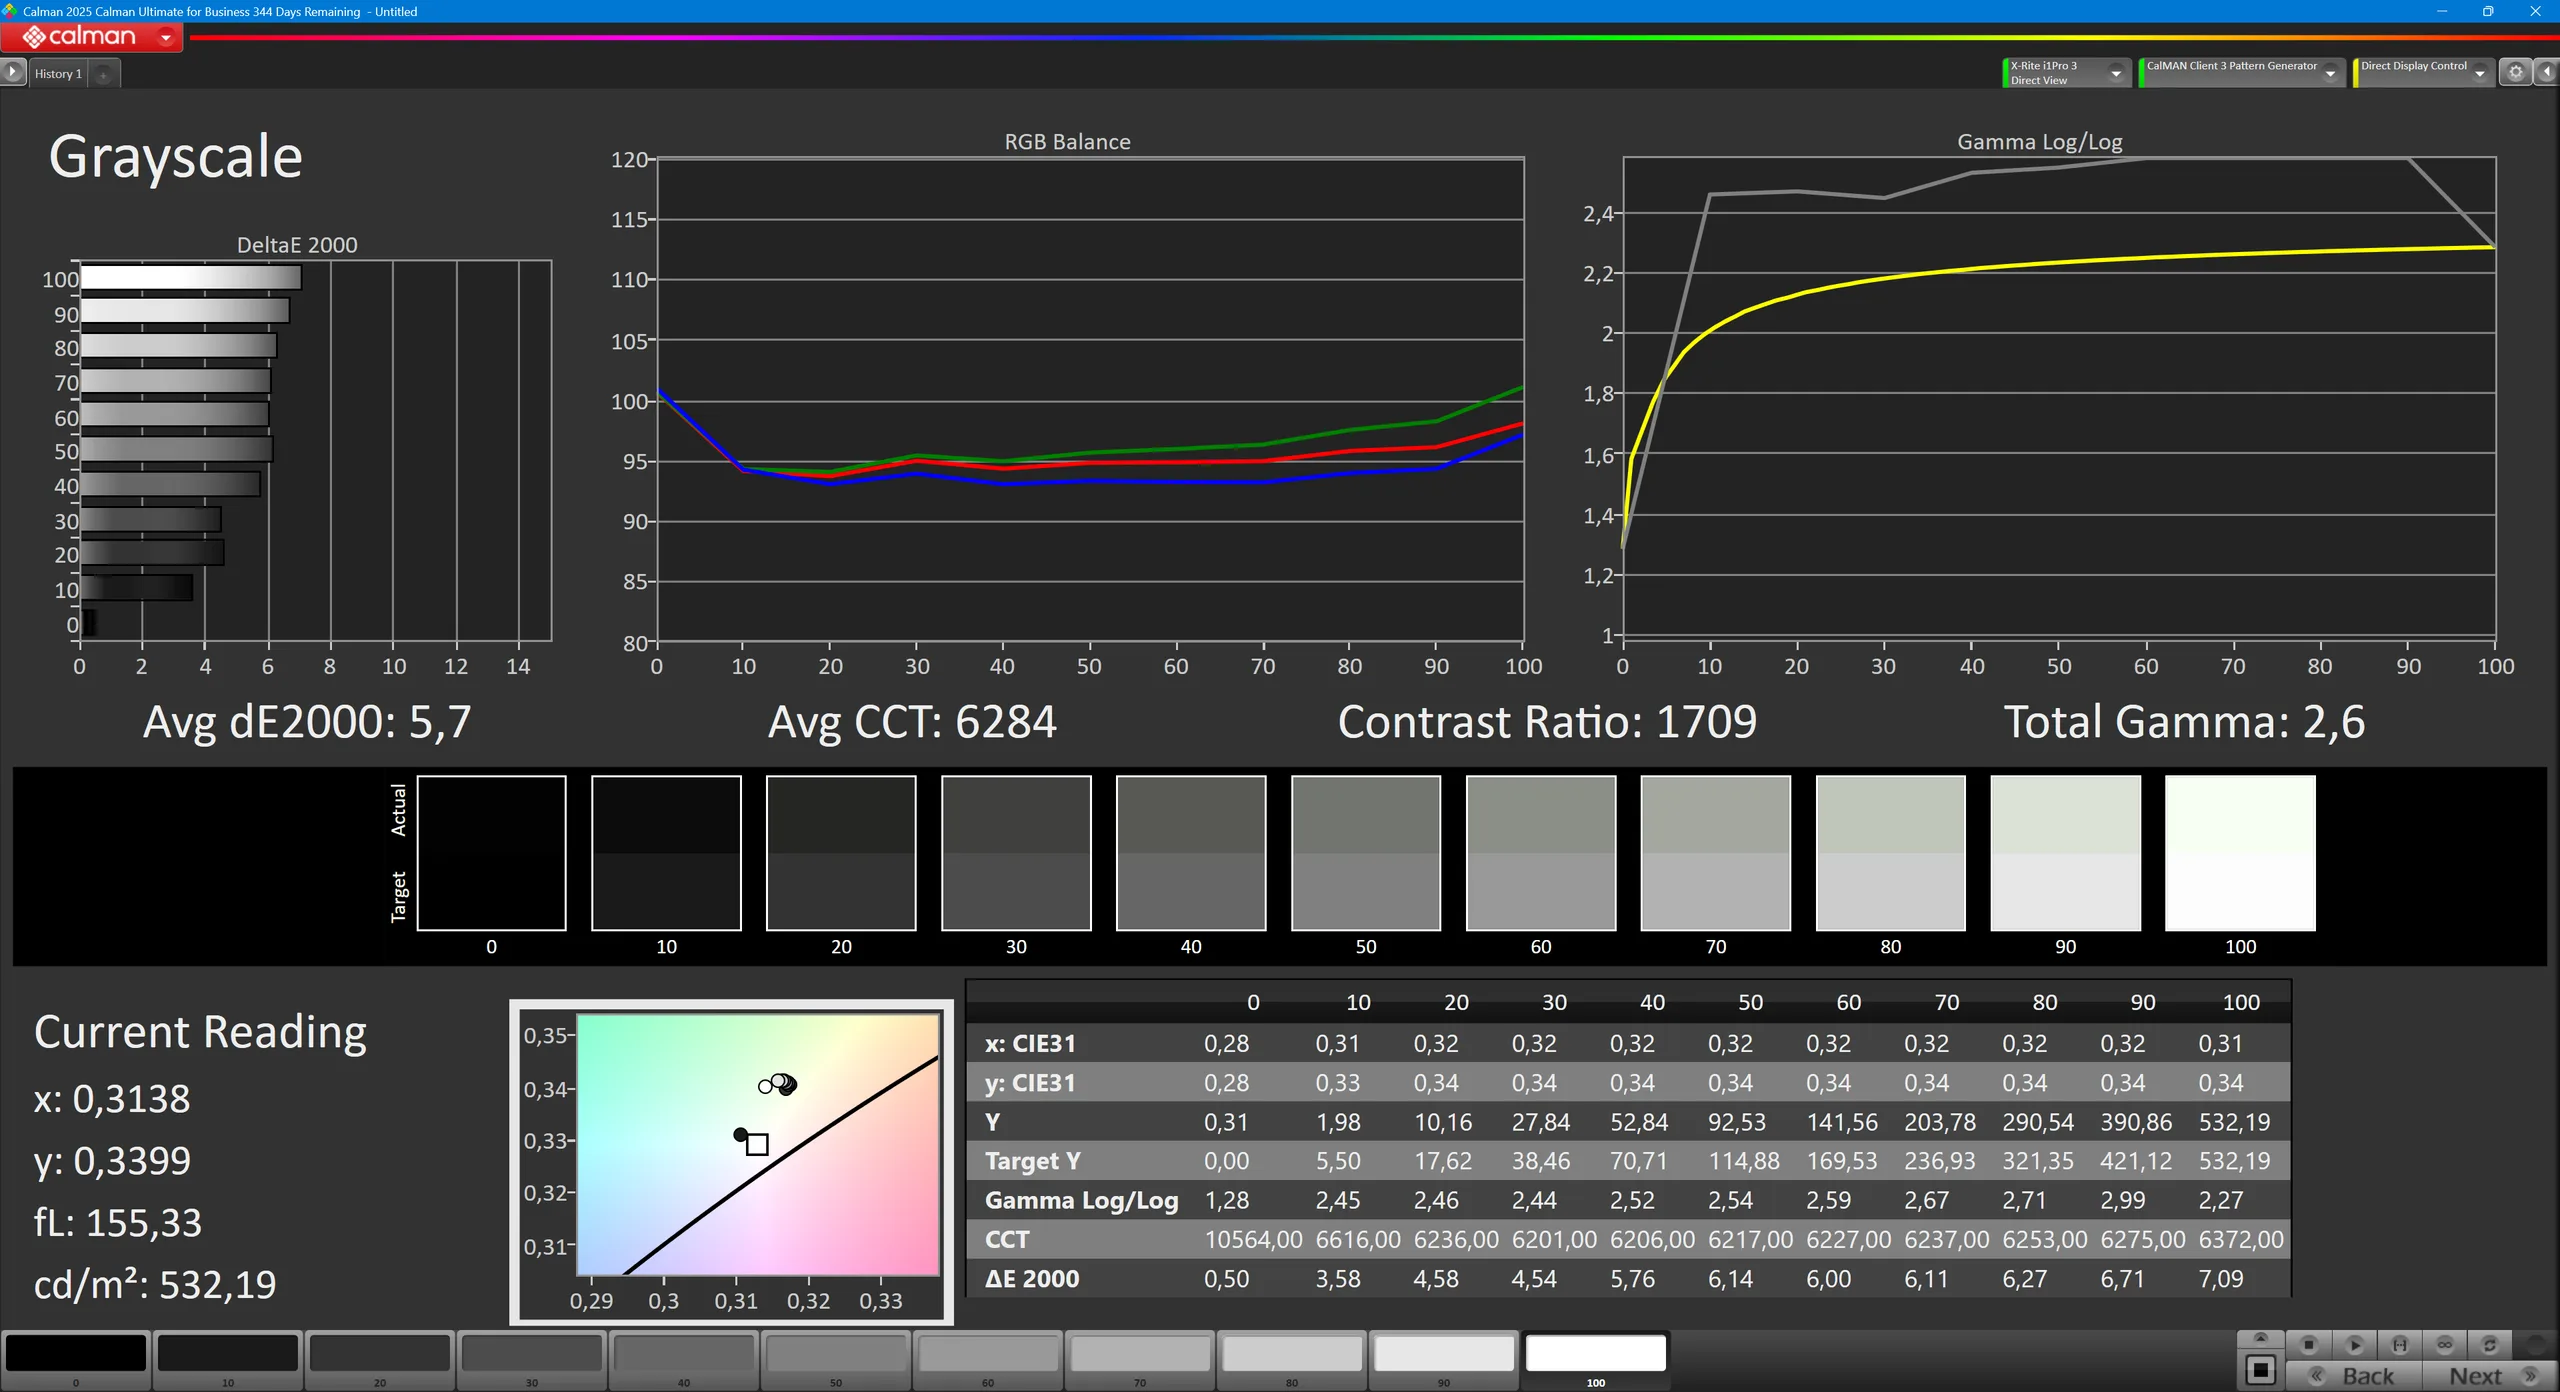
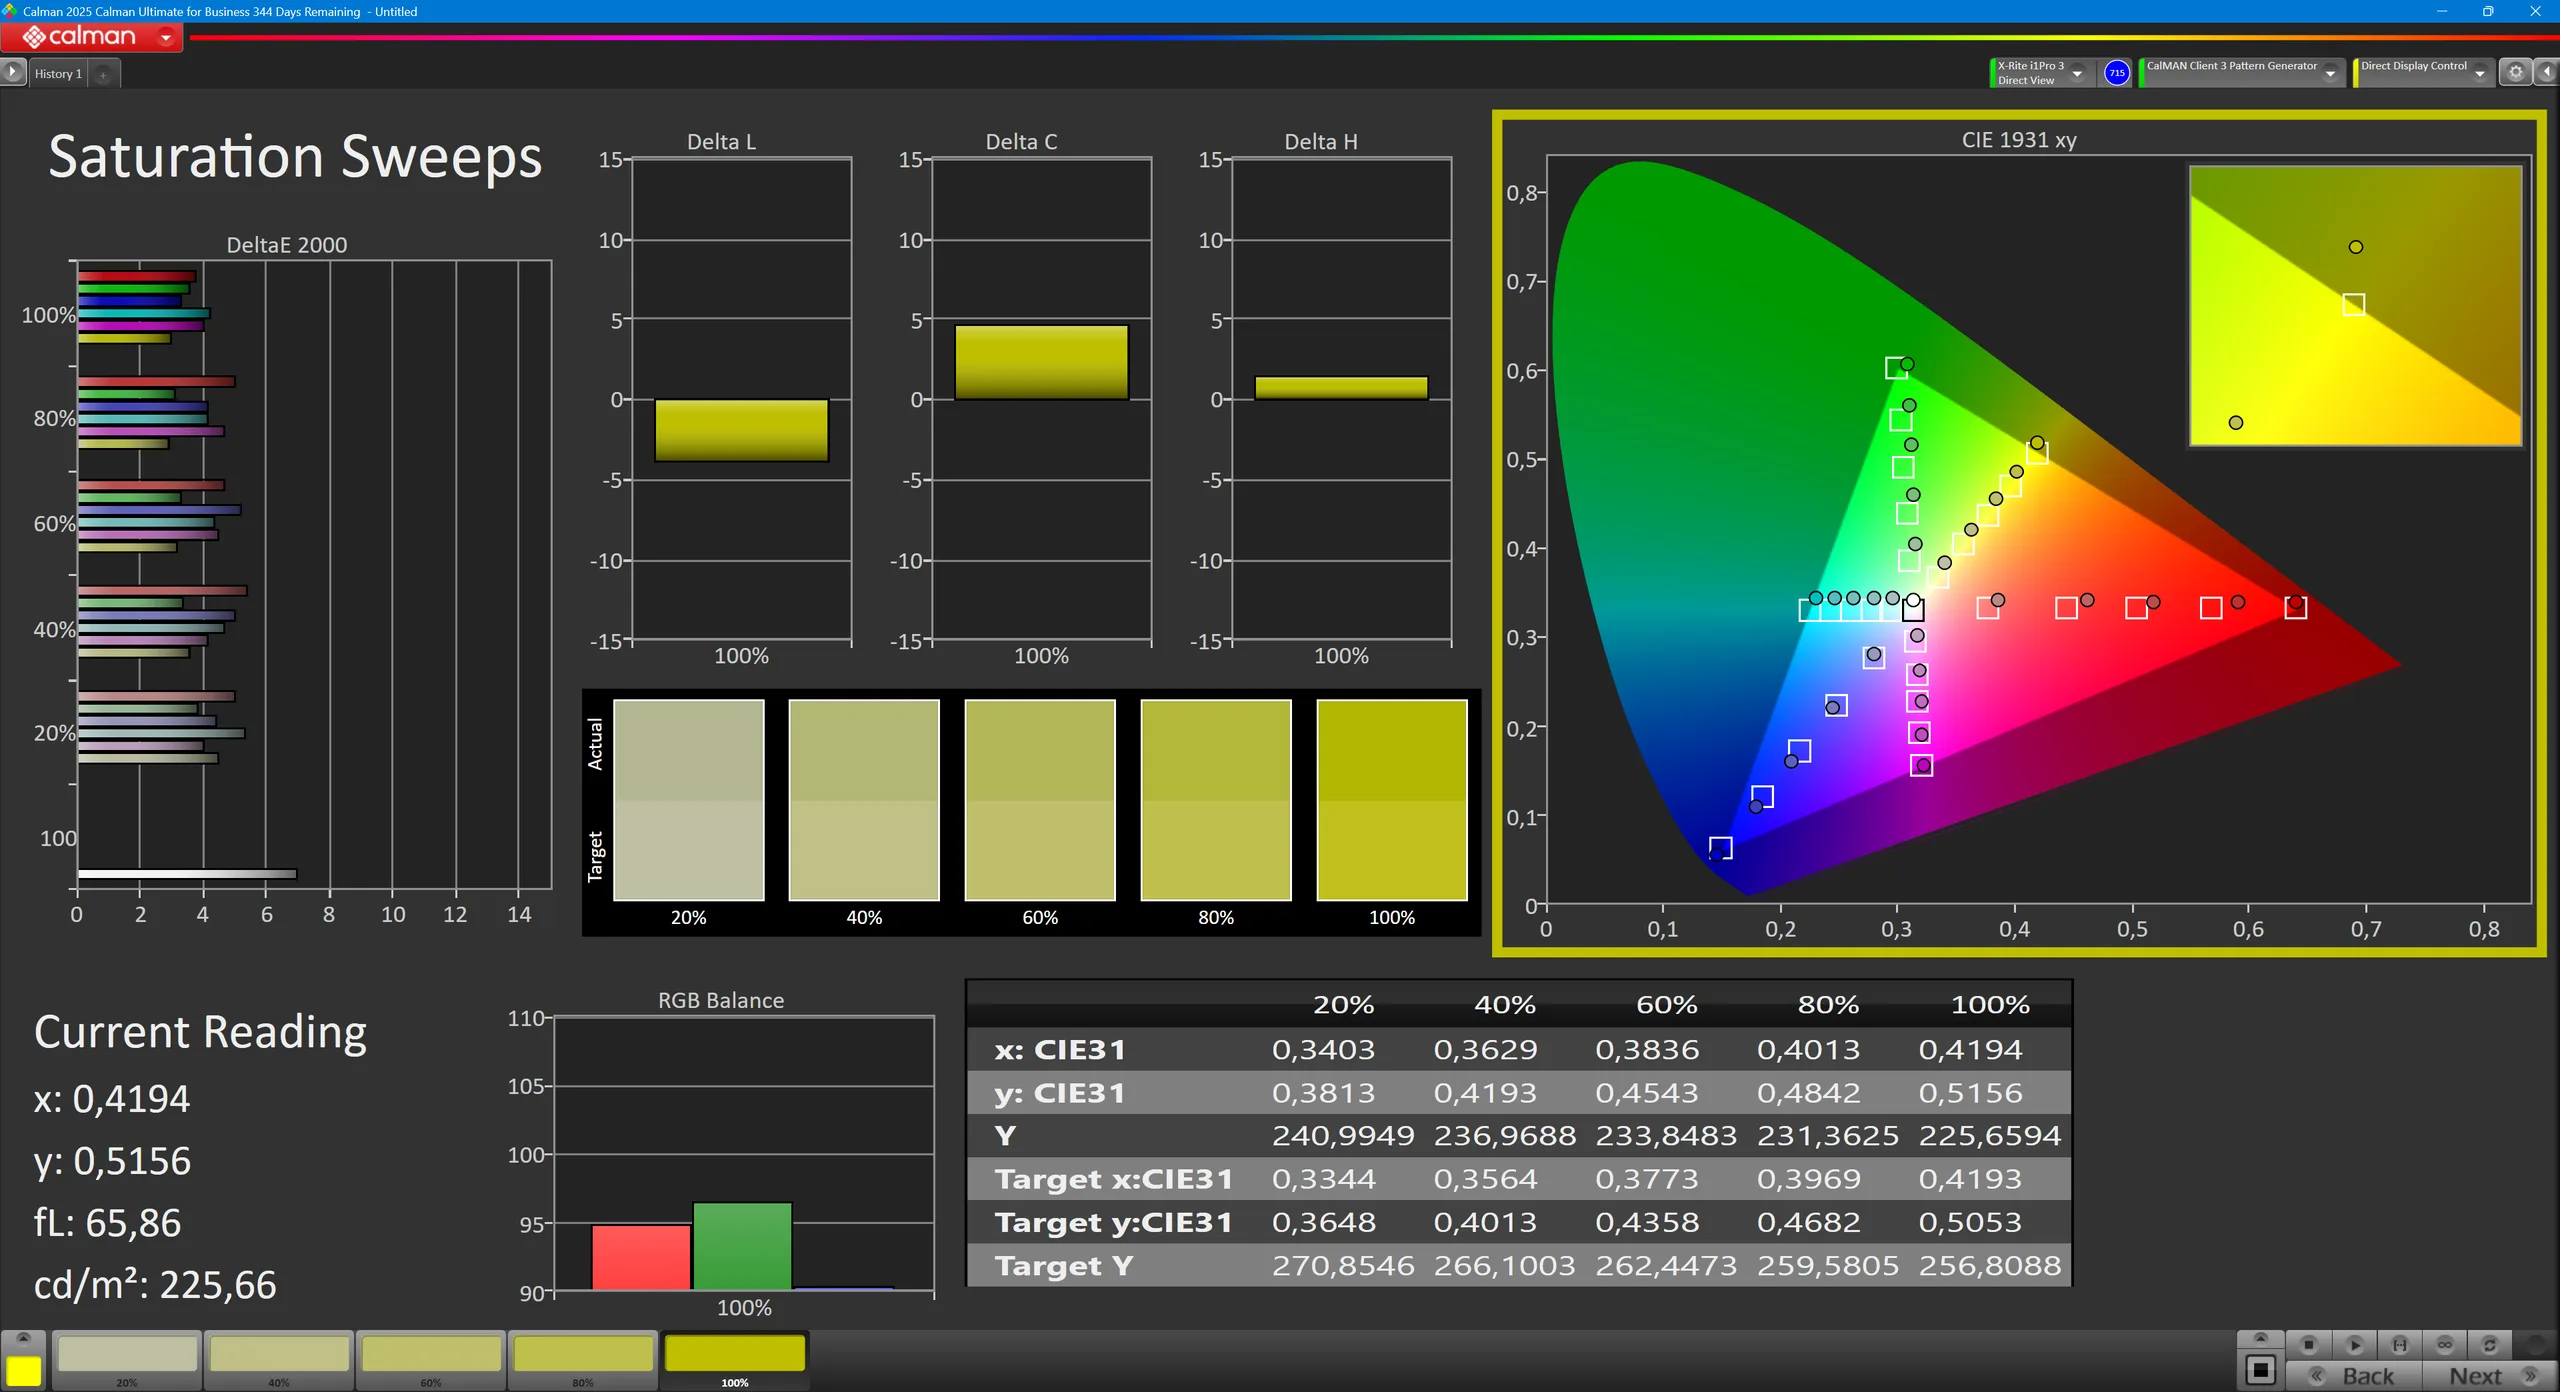
The basic screen option of our review sample is suitable for office work and other tasks where a wide color gamut is not needed. For multimedia usage, it is not the best, also due to the slow refresh rate of 60 Hz. At least there is no PWM. We do wish the resolution were higher, as WUXGA is not that great for such an expensive 16-inch workstation.
| |||||||||||||||||||||||||
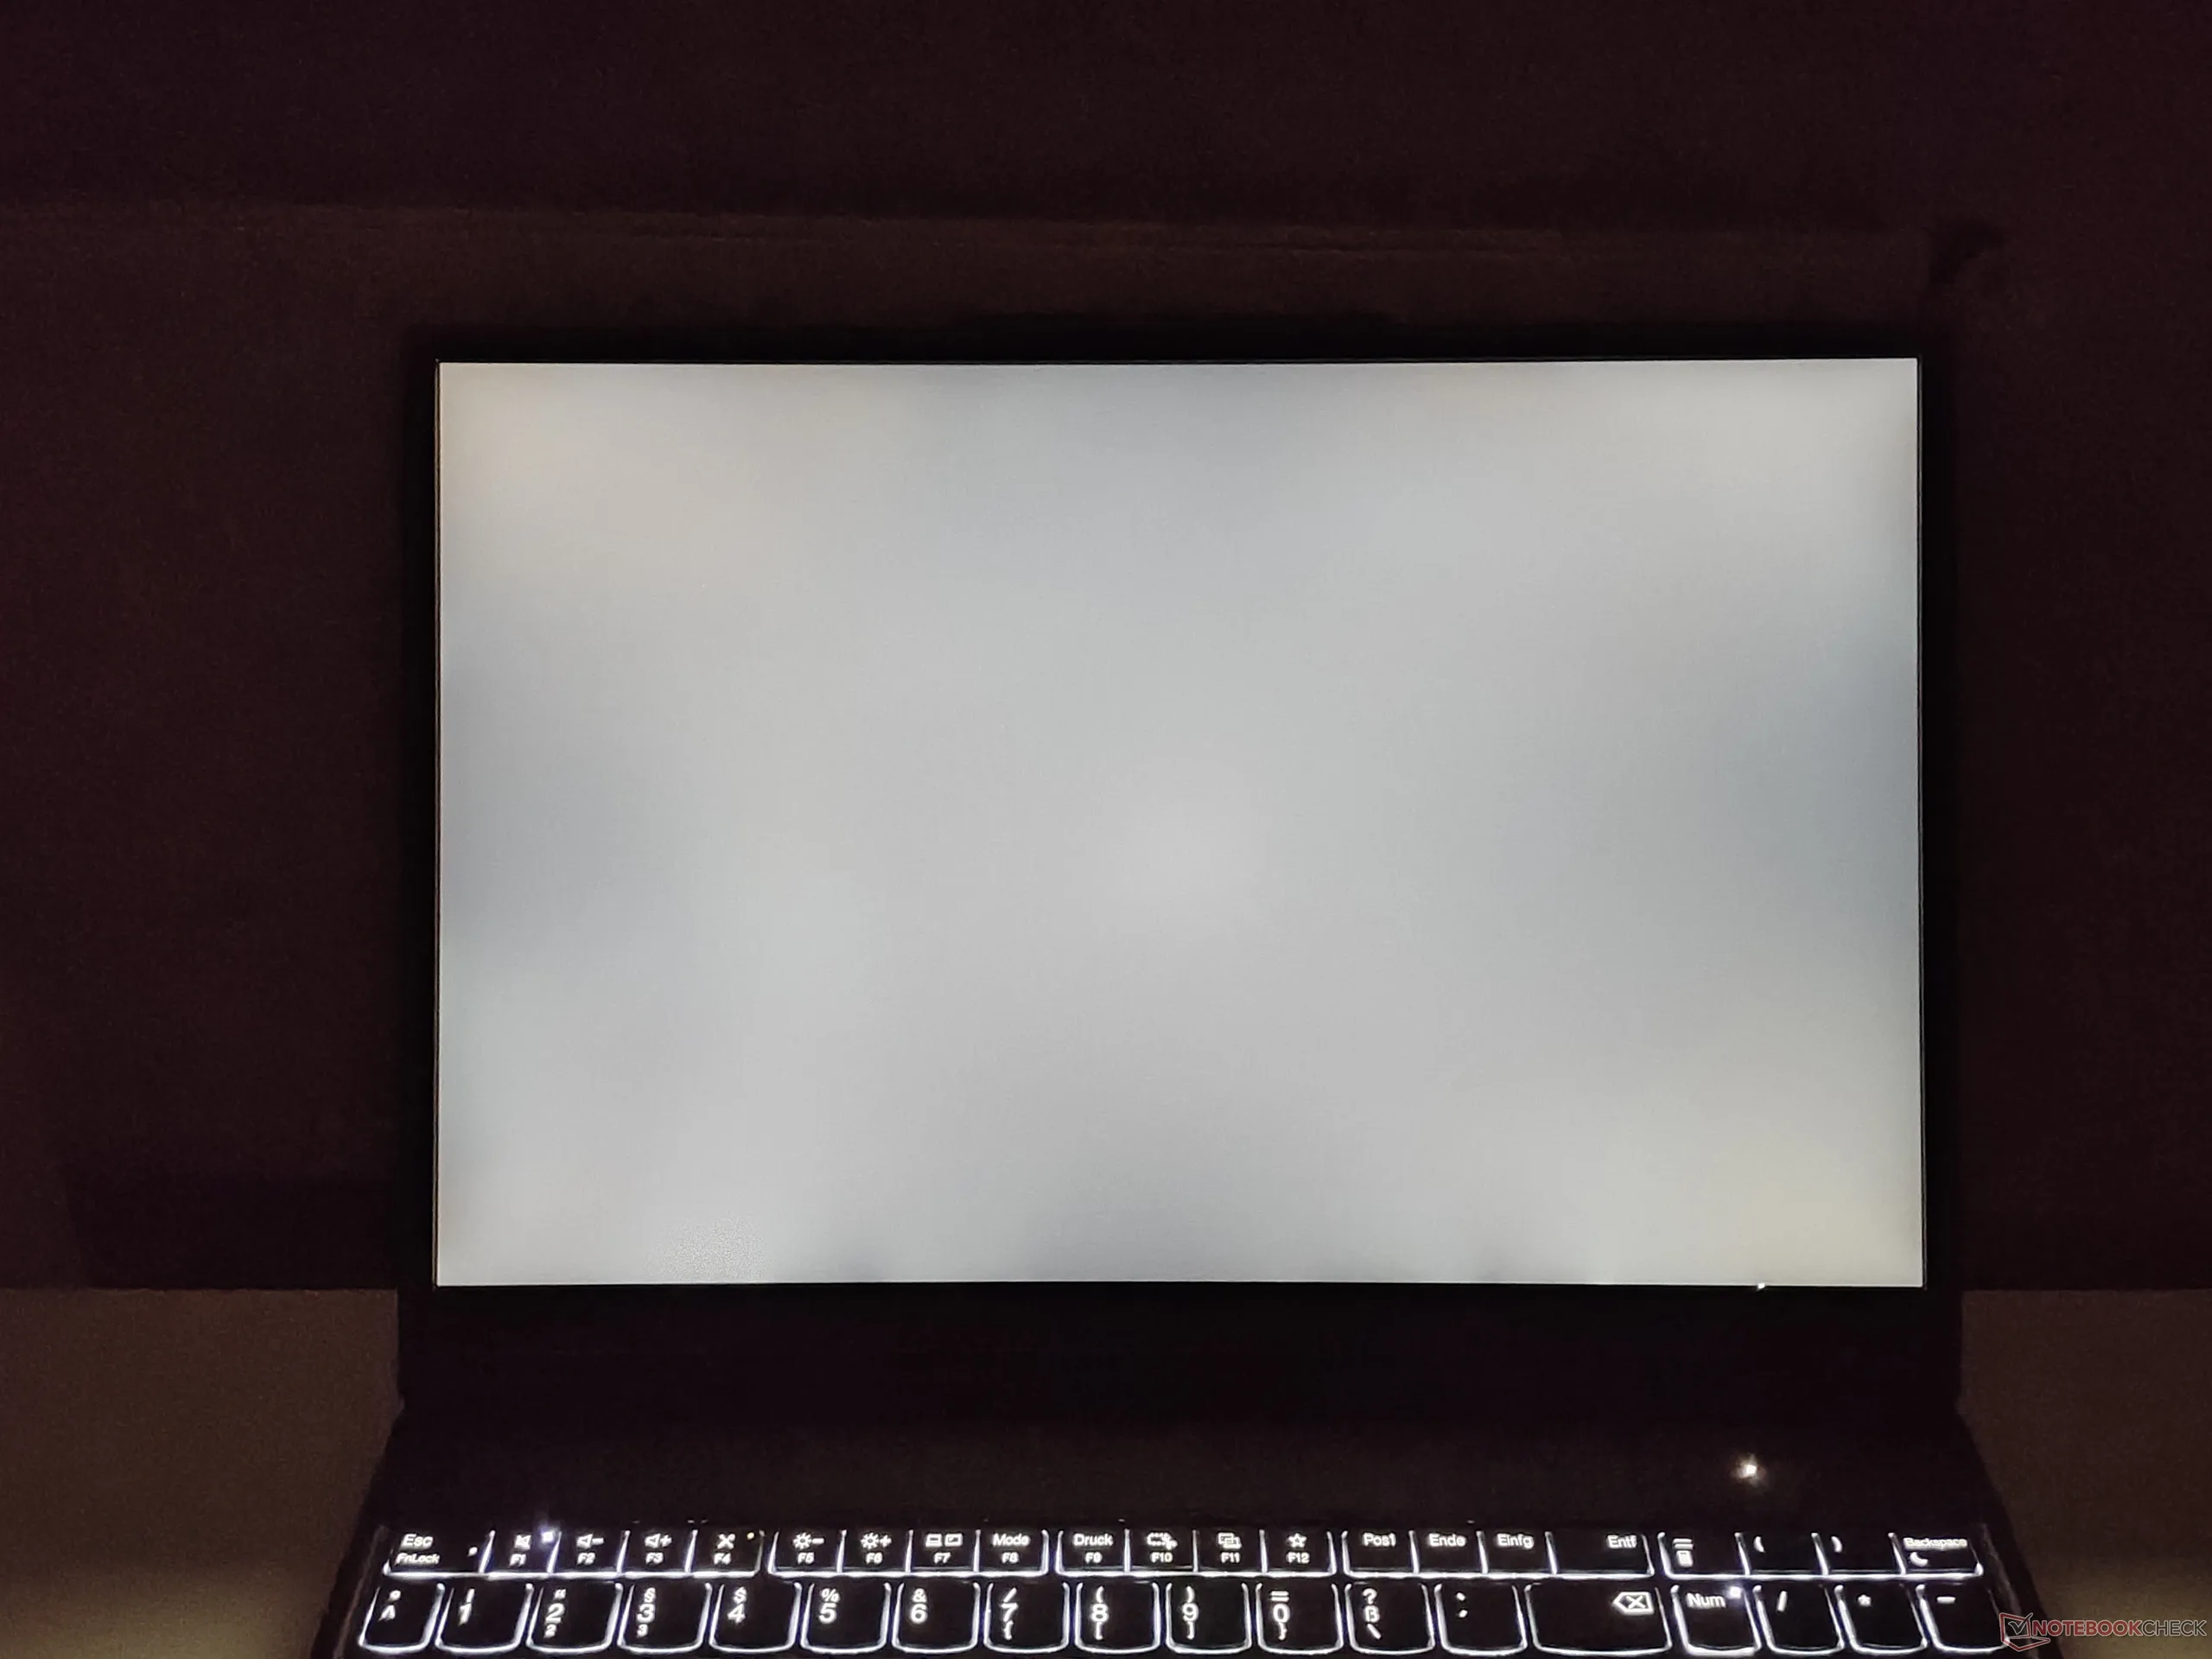
Brightness Distribution: 88 %
Center on Battery: 532 cd/m²
Contrast: 1716:1 (Black: 0.31 cd/m²)
ΔE ColorChecker Calman: 4.4 | ∀{0.5-29.43 Ø4.72}
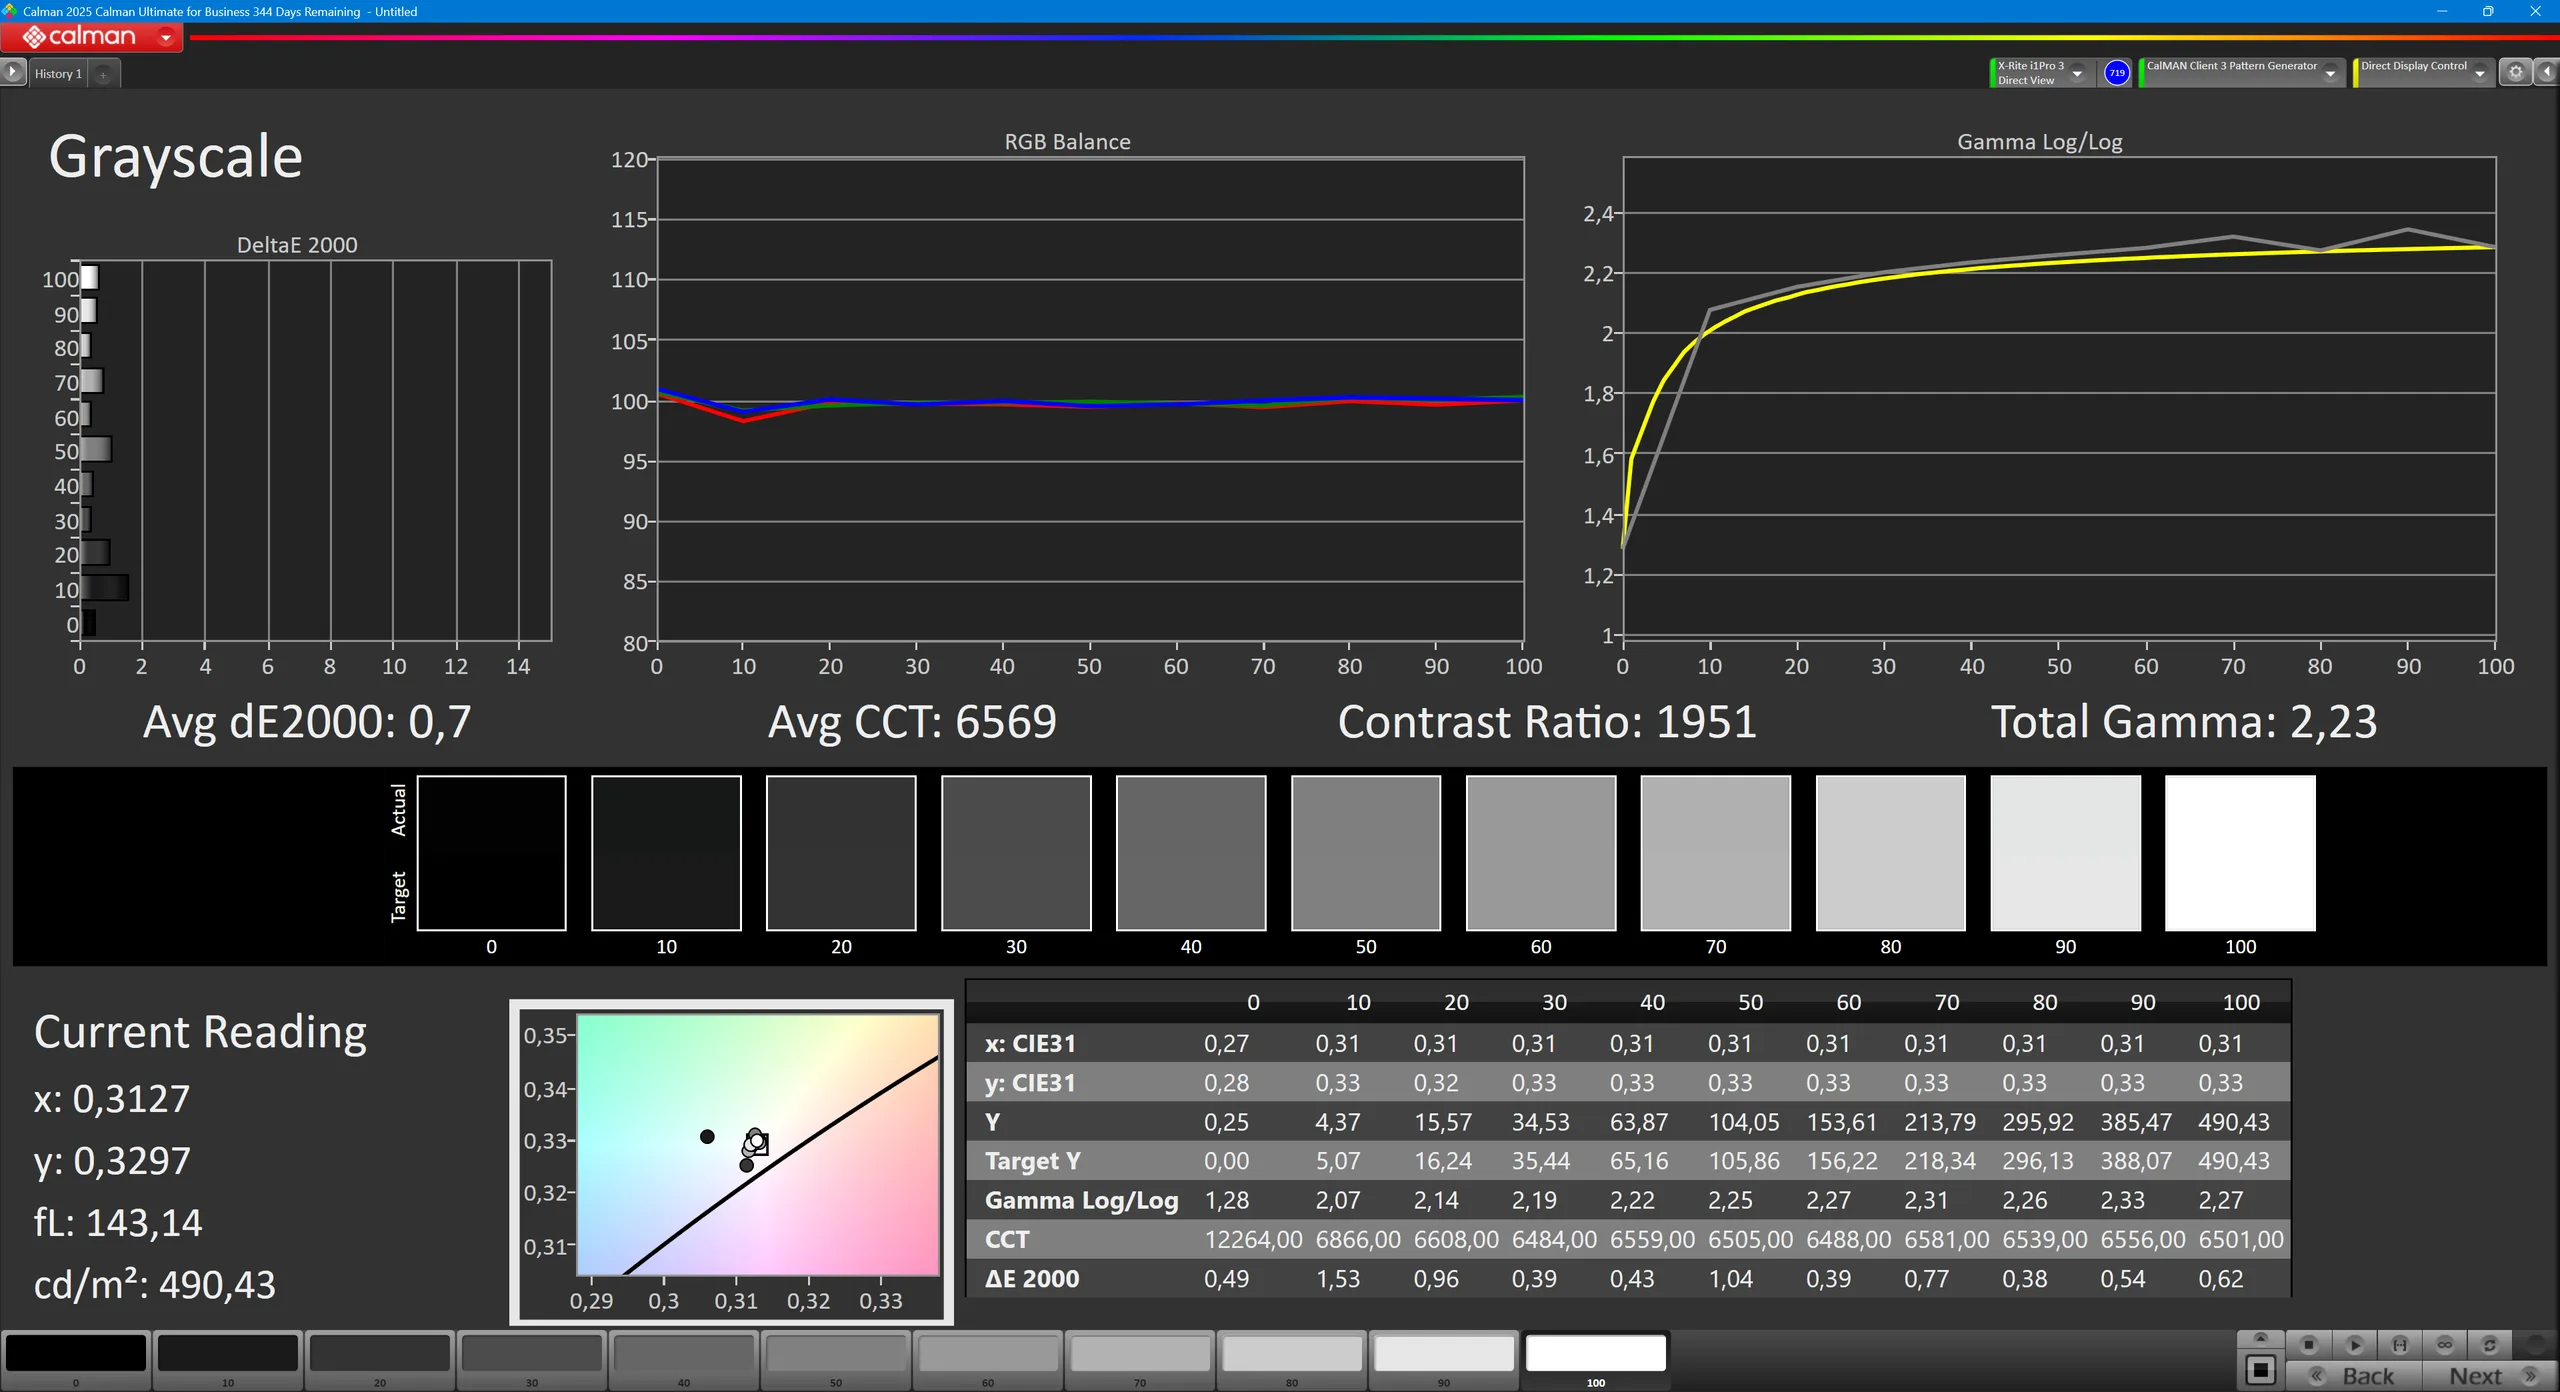
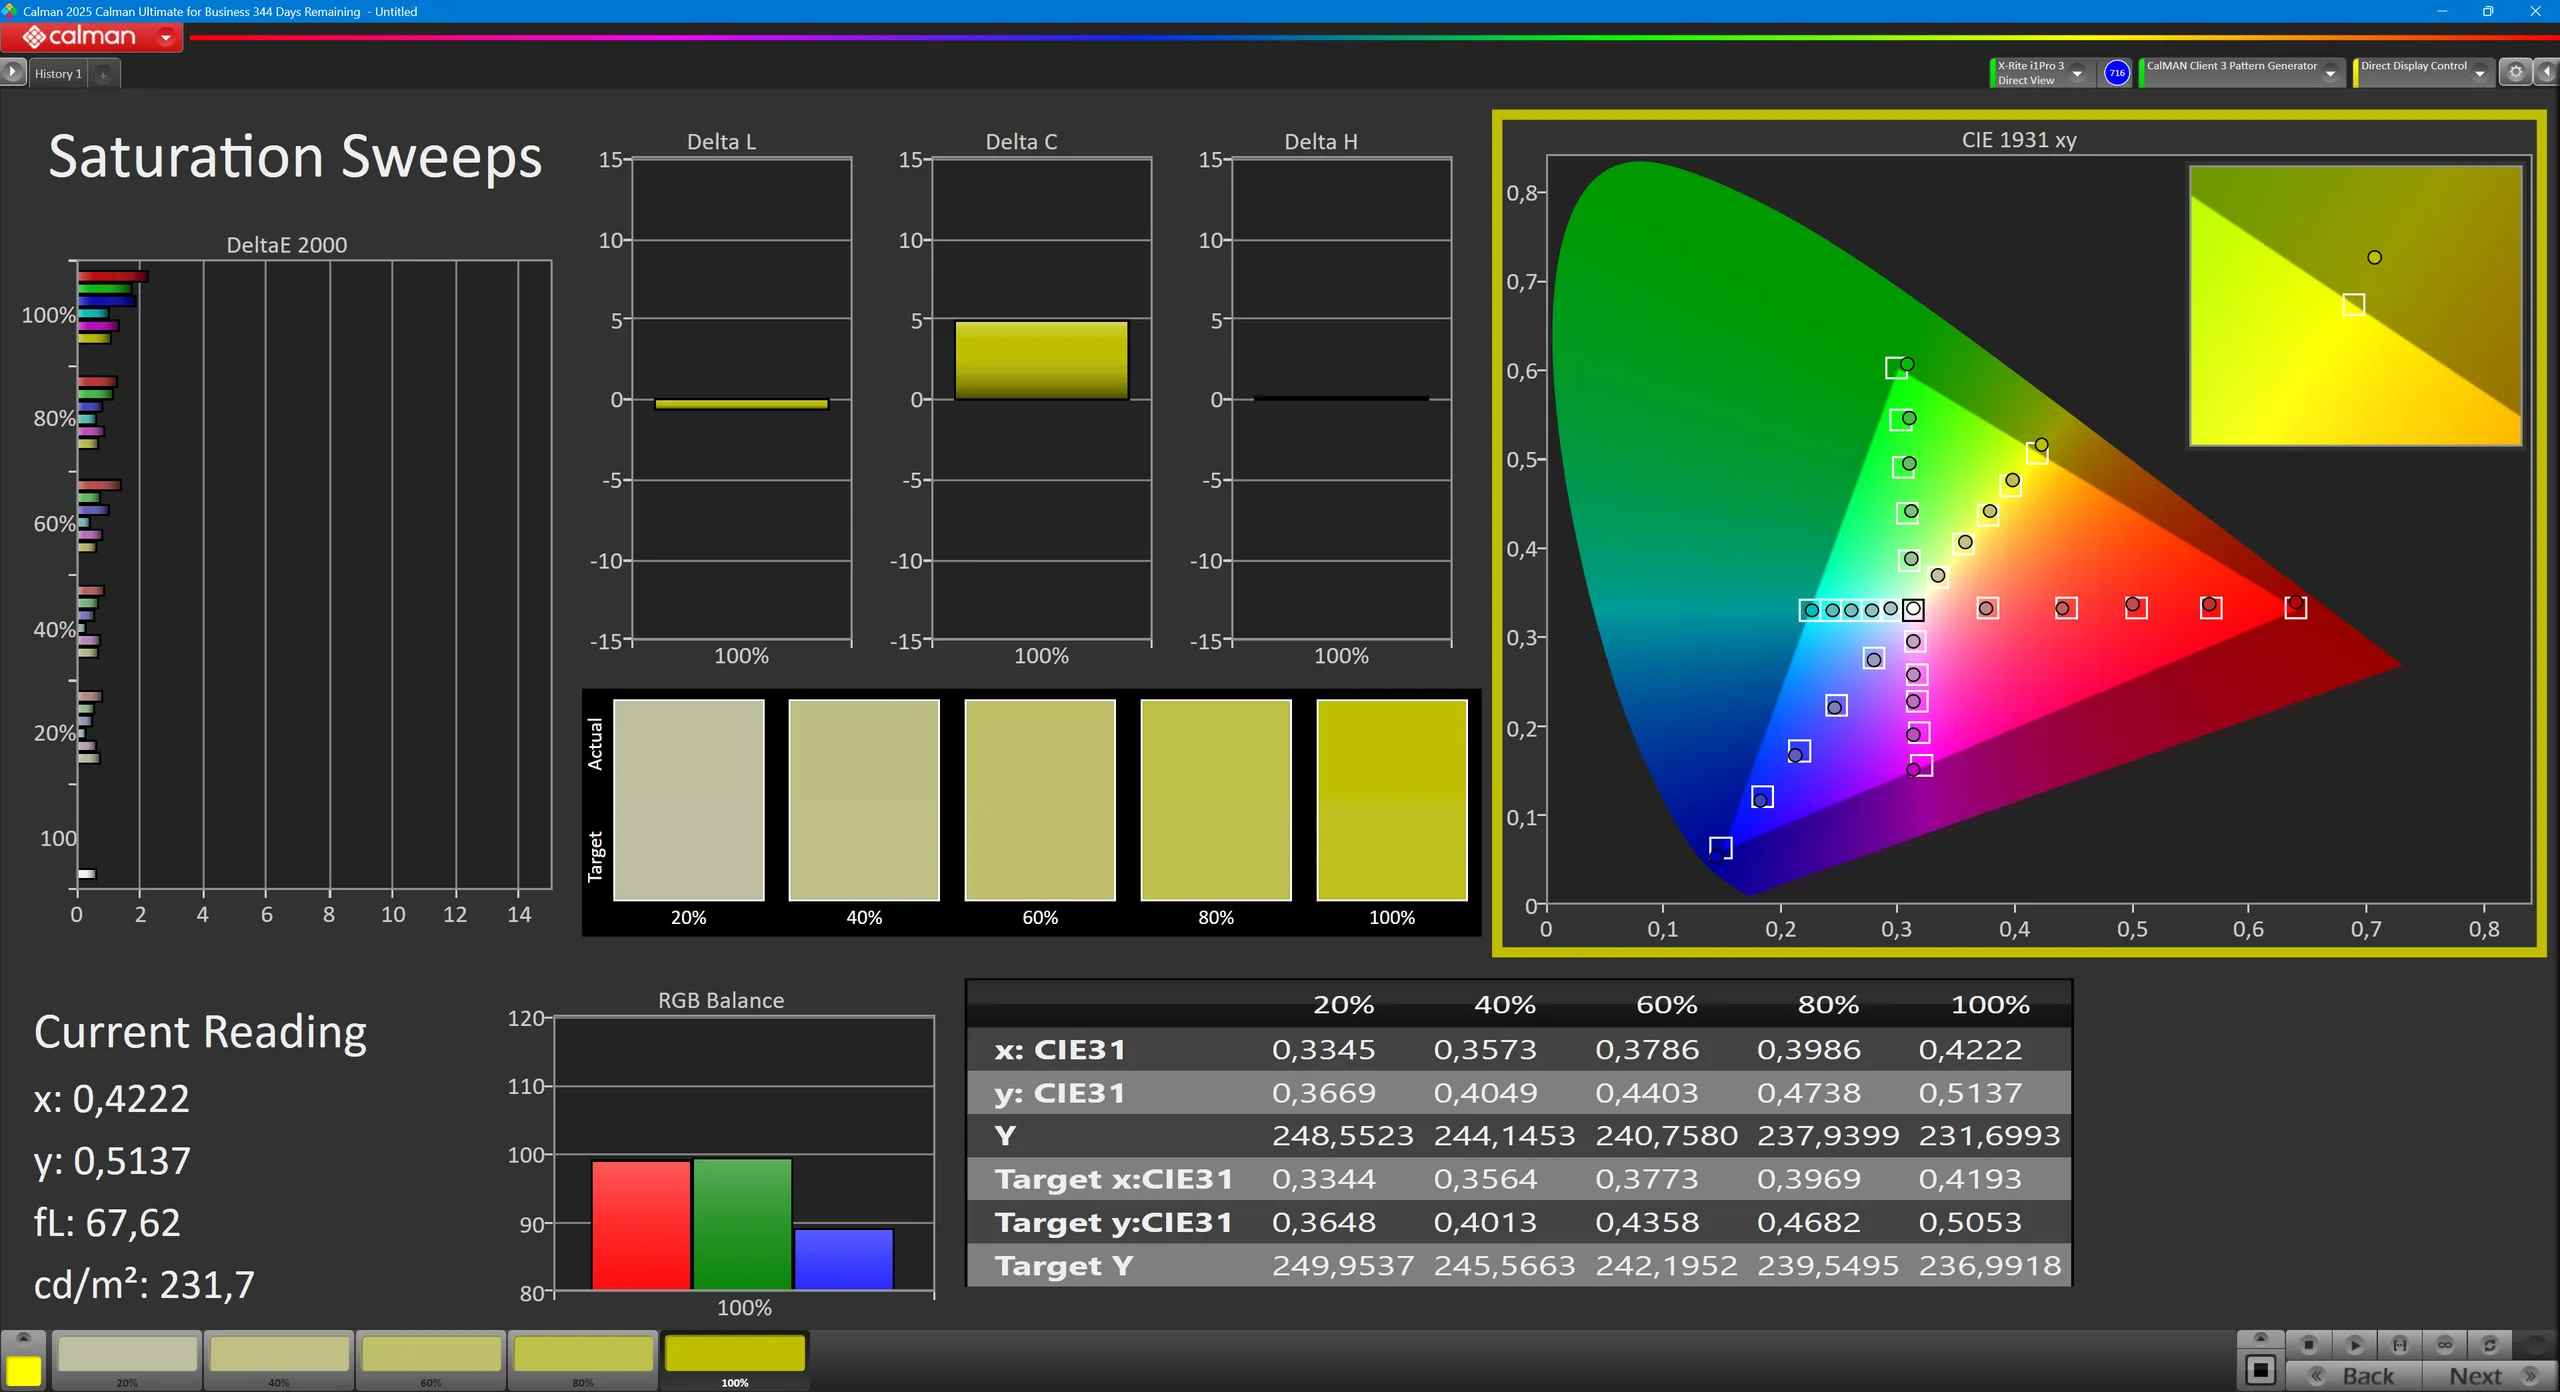
calibrated: 1.1
ΔE Greyscale Calman: 5.7 | ∀{0.09-98 Ø4.97}
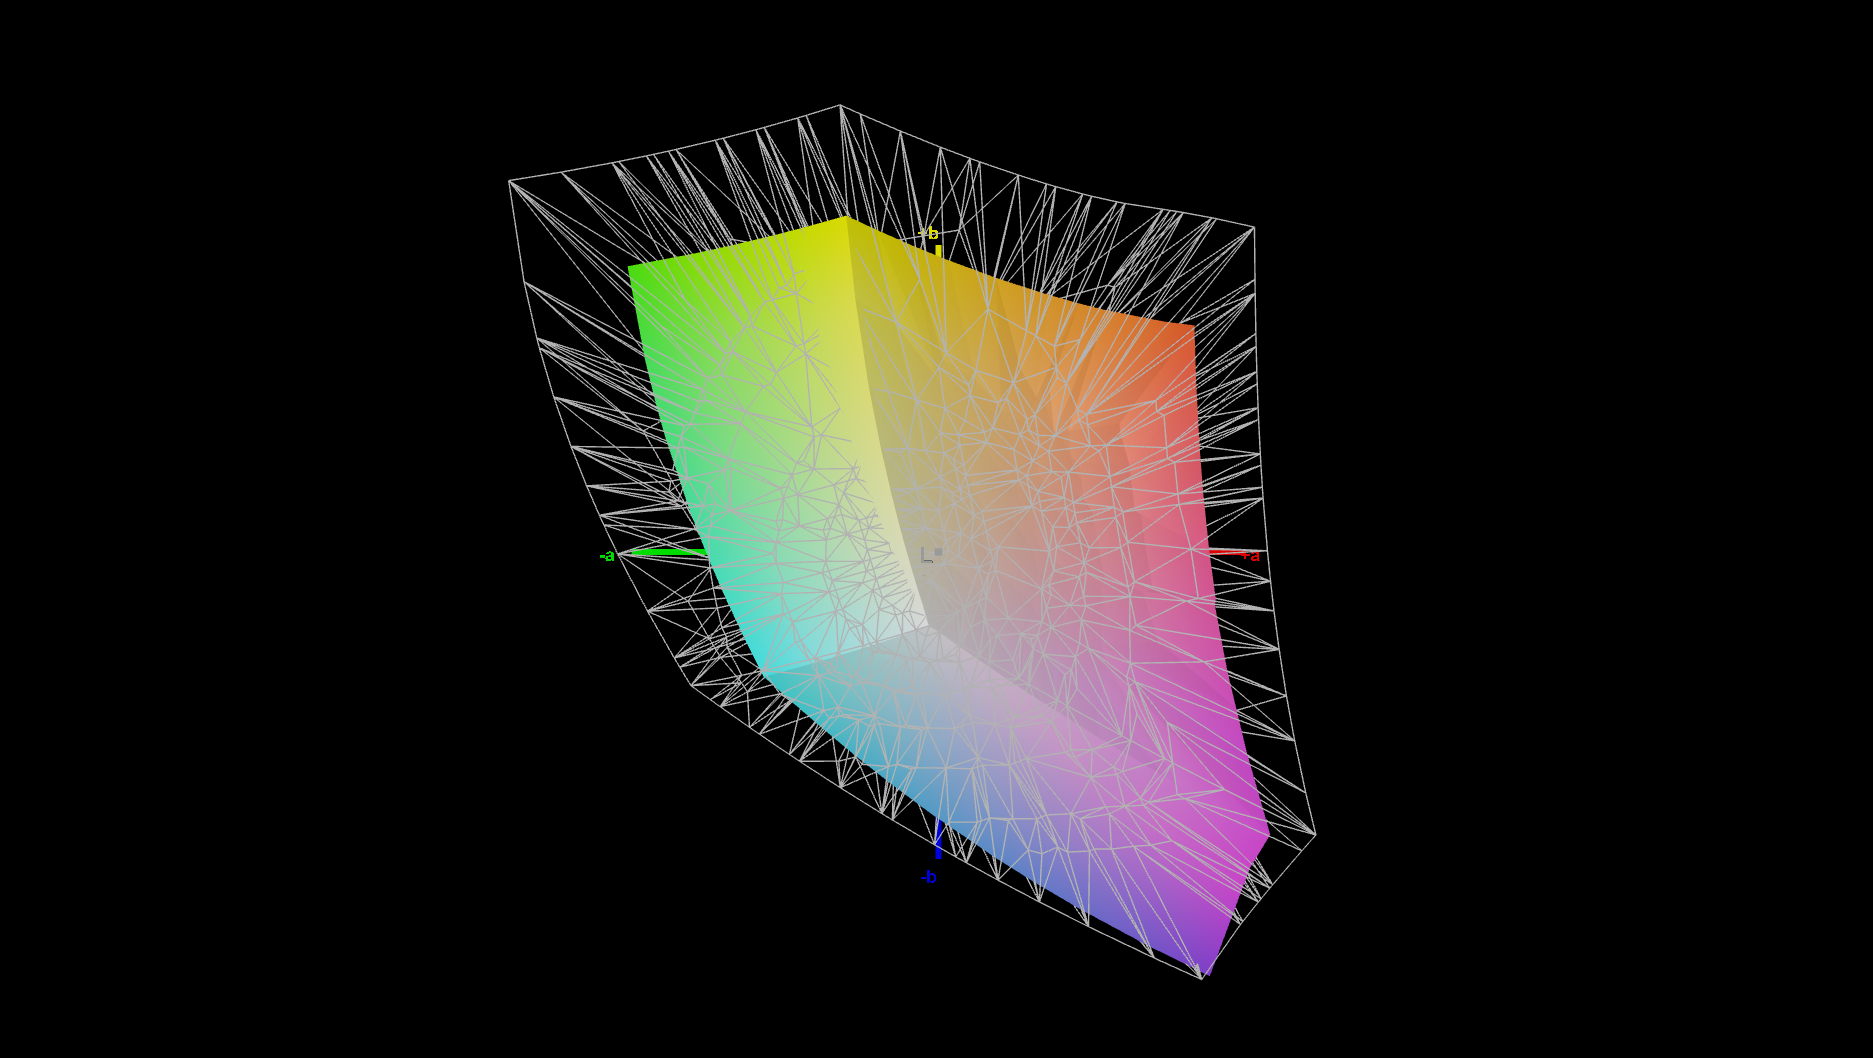
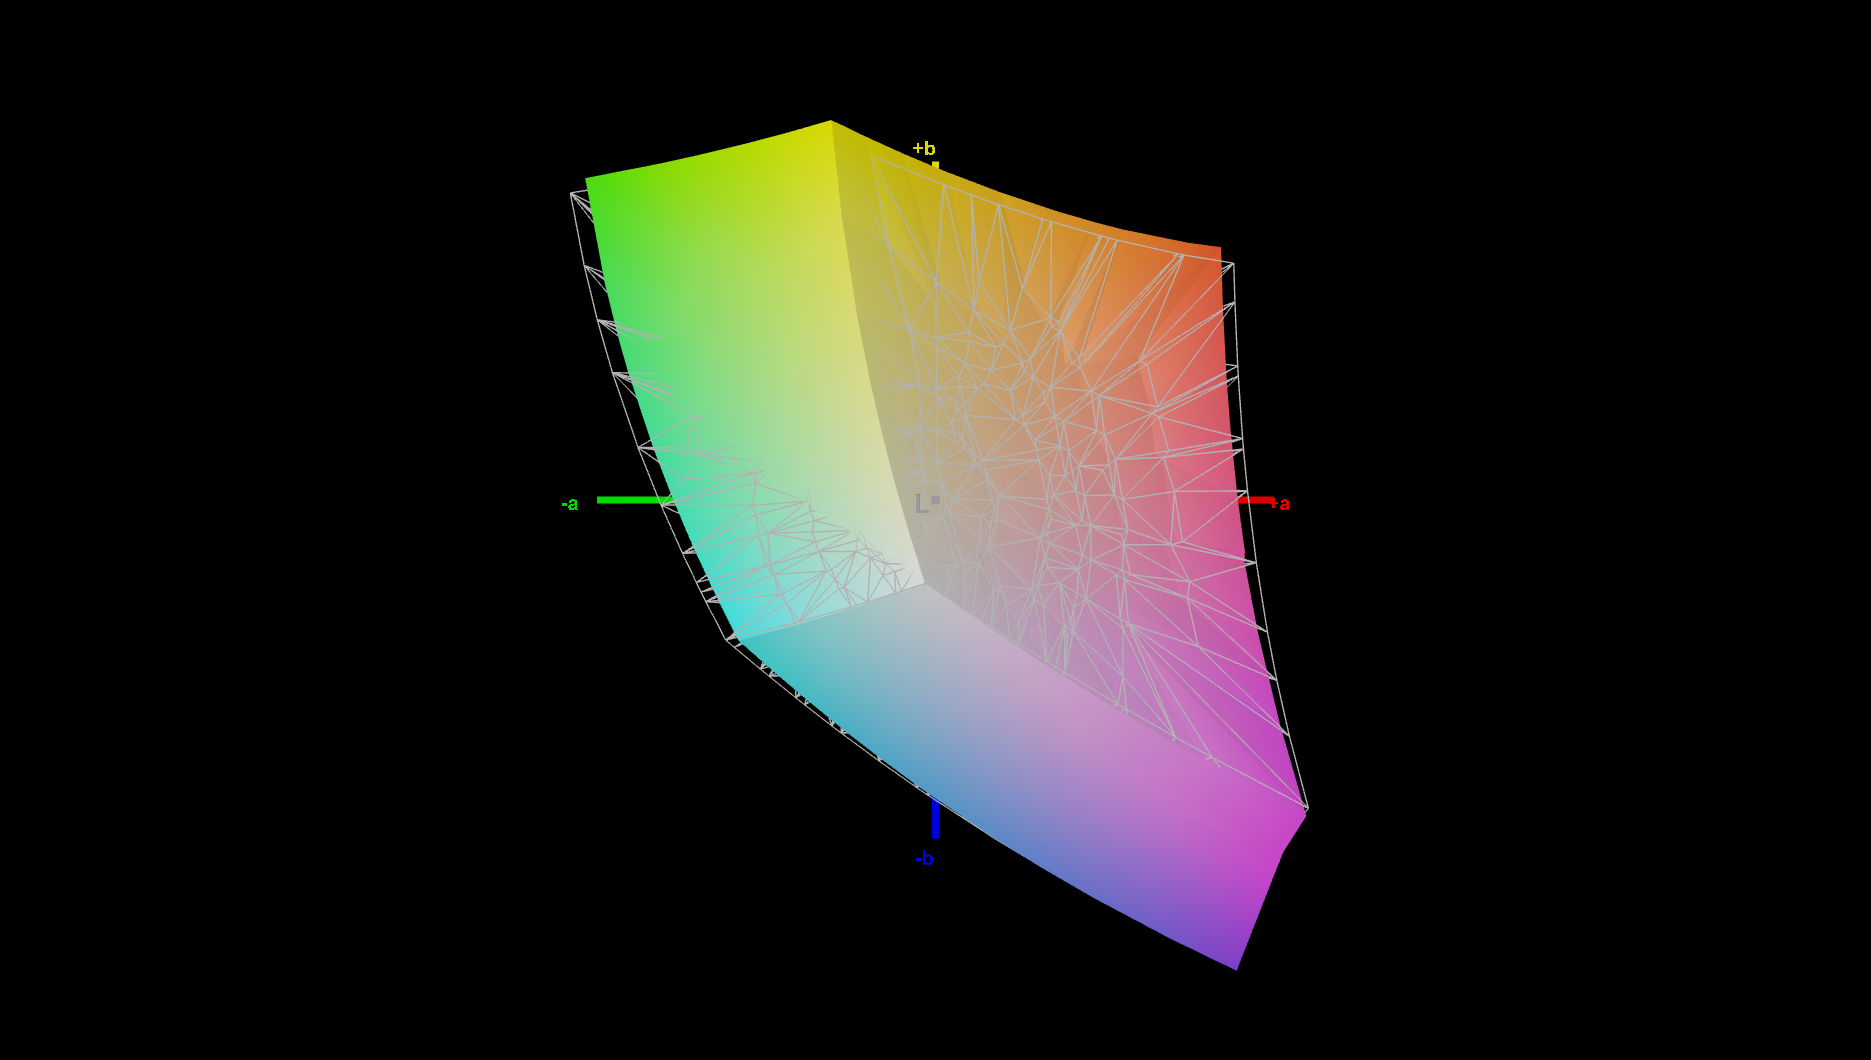
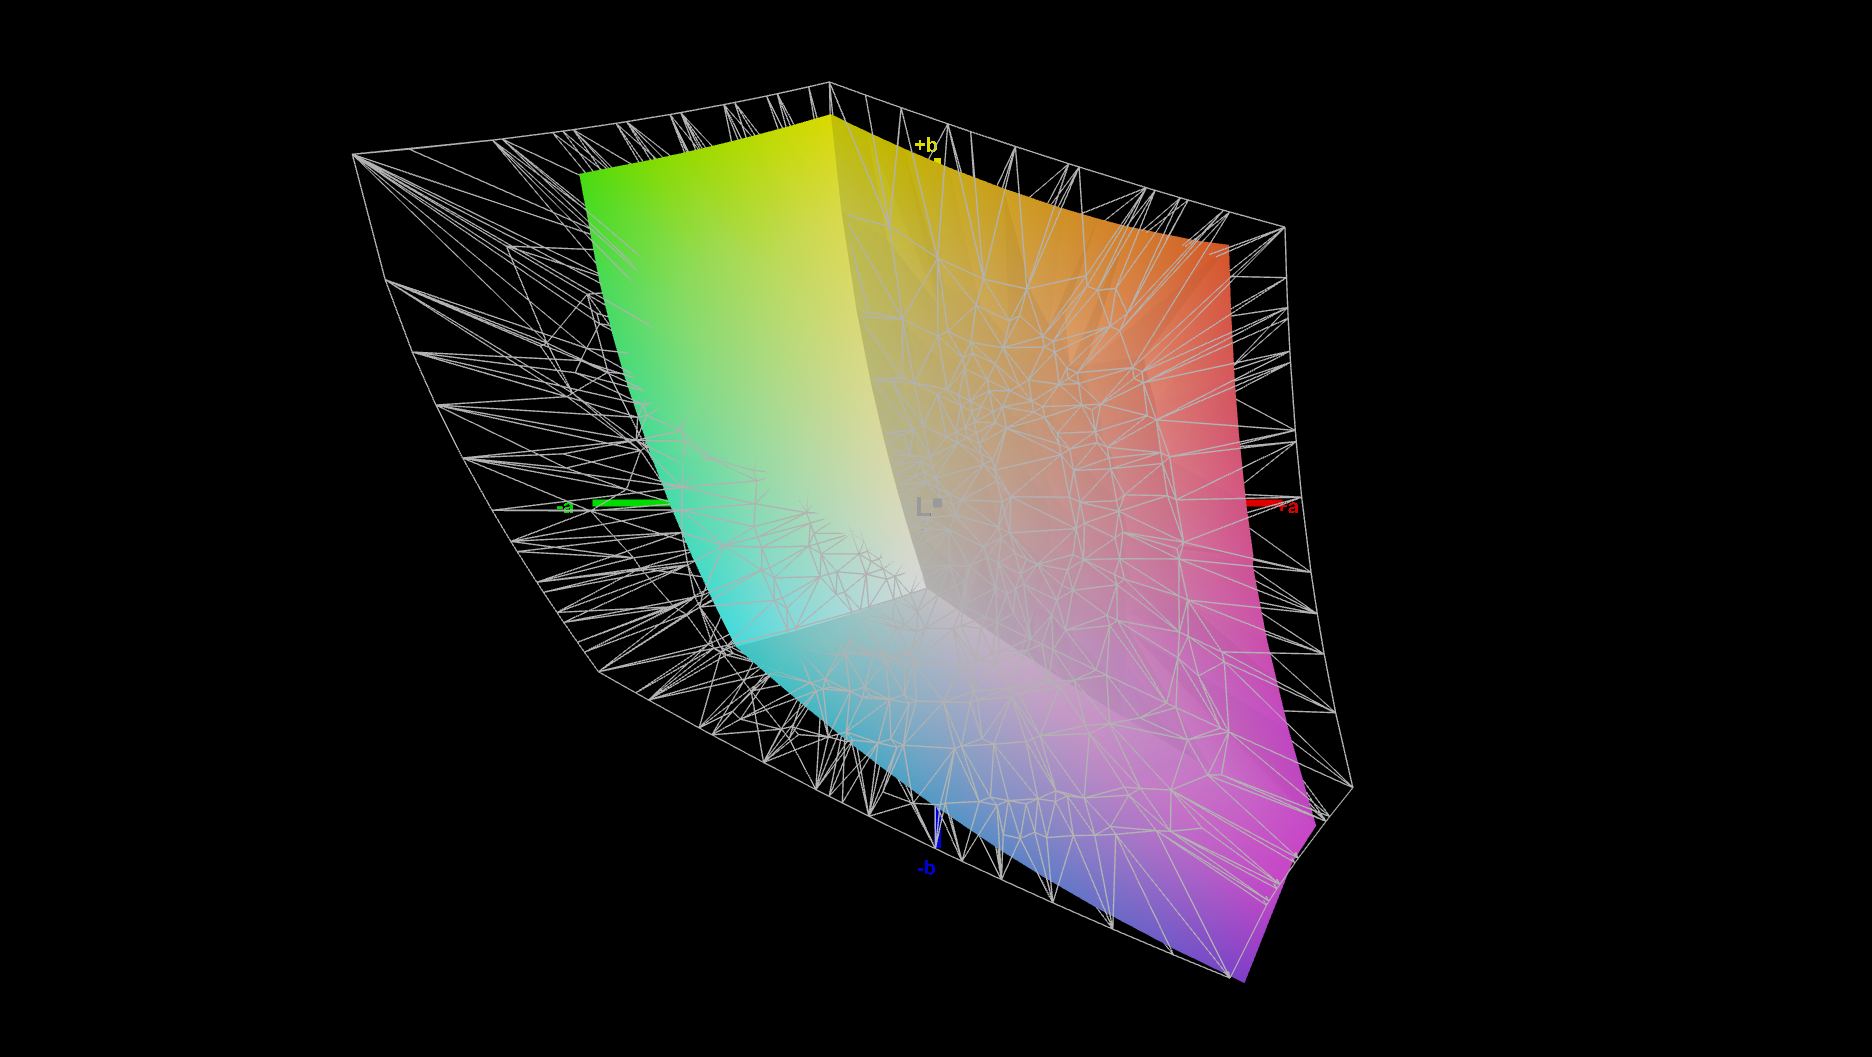
66.6% AdobeRGB 1998 (Argyll 3D)
95.2% sRGB (Argyll 3D)
64.9% Display P3 (Argyll 3D)
Gamma: 2.6
CCT: 6284 K
| Lenovo ThinkPad P16 Gen 3 N160JCA-GT1, IPS LED, 1920x1200, 16", 60 Hz | Lenovo ThinkPad P16 G2 21FA000FGE MNG007DA1-9, IPS LED, 2560x1600, 16", 165 Hz | Dell Pro Max 16 Plus Samsung 160HC01, OLED, 3840x2400, 16", 120 Hz | HP ZBook Fury 16 G11 AUO87A8, IPS, 3840x2400, 16", 120 Hz | Lenovo ThinkPad T16g Gen 3 RTX 5080 ATNA60KA02-0, OLED, 3200x2000, 16", 120 Hz | Lenovo ThinkPad P1 Gen 8 Samsung ATNA60KA02-0, Tandem OLED, 3200x2000, 16", 120 Hz | |
|---|---|---|---|---|---|---|
| Display | 8% | 29% | 29% | 30% | 34% | |
| Display P3 Coverage (%) | 64.9 | 71 9% | 97.3 50% | 98.4 52% | 98.8 52% | 98.8 52% |
| sRGB Coverage (%) | 95.2 | 99.2 4% | 100 5% | 99.9 5% | 100 5% | 100 5% |
| AdobeRGB 1998 Coverage (%) | 66.6 | 73.2 10% | 88.8 33% | 86 29% | 88.9 33% | 97.5 46% |
| Response Times | 52% | 97% | 59% | 97% | 97% | |
| Response Time Grey 50% / Grey 80% * (ms) | 29.8 ? | 12.8 ? 57% | 0.63 ? 98% | 11.4 ? 62% | 1.51 ? 95% | 0.57 ? 98% |
| Response Time Black / White * (ms) | 18.7 ? | 10.1 ? 46% | 0.89 ? 95% | 8.4 ? 55% | 0.44 ? 98% | 0.73 ? 96% |
| PWM Frequency (Hz) | 479.9 ? | 1200 ? | 1199 | |||
| PWM Amplitude * (%) | 28 | 22 | 18 | |||
| Screen | -5% | 29% | -1% | 43% | 37% | |
| Brightness middle (cd/m²) | 532 | 510 -4% | 530.9 0% | 457.6 -14% | 585 10% | 561.8 6% |
| Brightness (cd/m²) | 497 | 517 4% | 540 9% | 466 -6% | 590 19% | 566 14% |
| Brightness Distribution (%) | 88 | 89 1% | 95 8% | 83 -6% | 98 11% | 99 13% |
| Black Level * (cd/m²) | 0.31 | 0.37 -19% | 0.43 -39% | |||
| Contrast (:1) | 1716 | 1378 -20% | 1064 -38% | |||
| Colorchecker dE 2000 * | 4.4 | 2.6 41% | 2.42 45% | 2.78 37% | 0.9 80% | 1.29 71% |
| Colorchecker dE 2000 max. * | 6.9 | 5.2 25% | 5.76 17% | 5.53 20% | 2.7 61% | 2.96 57% |
| Colorchecker dE 2000 calibrated * | 1.1 | 2.3 -109% | 0.7 36% | 1.37 -25% | 0.81 26% | |
| Greyscale dE 2000 * | 5.7 | 3.6 37% | 0.8 86% | 2 65% | 1.4 75% | 1.4 75% |
| Gamma | 2.6 85% | 2.26 97% | 2.23 99% | 2.28 96% | 2.18 101% | 2.23 99% |
| CCT | 6284 103% | 5969 109% | 6488 100% | 6806 96% | 6442 101% | 6319 103% |
| Total Average (Program / Settings) | 18% /
6% | 52% /
40% | 29% /
14% | 57% /
49% | 56% /
47% |
* ... smaller is better


Display Response Times
| ↔ Response Time Black to White | ||
|---|---|---|
| 18.7 ms ... rise ↗ and fall ↘ combined | ↗ 10.4 ms rise | 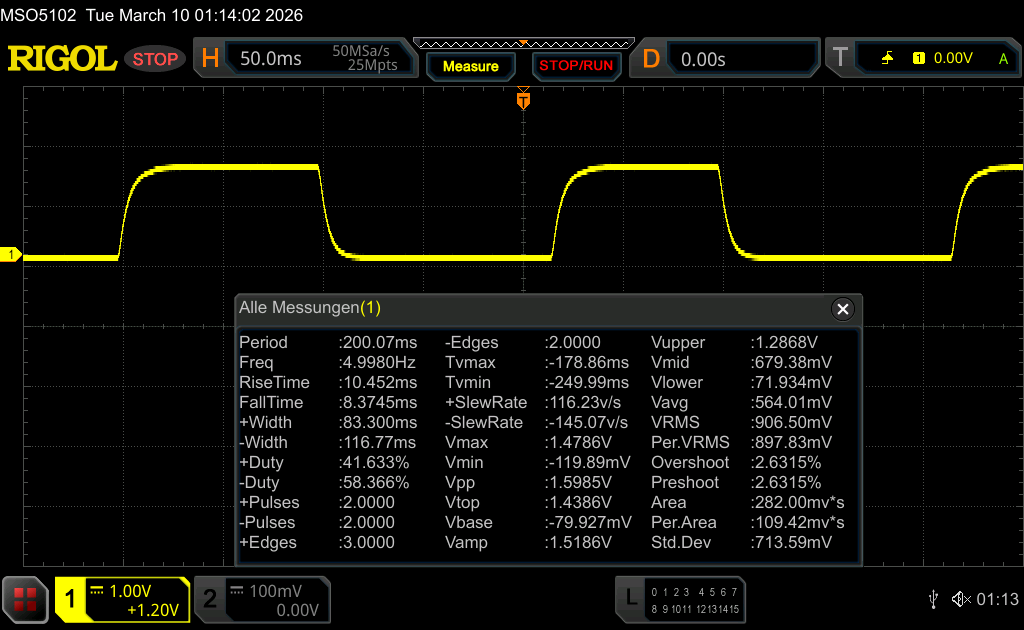 |
| ↘ 8.3 ms fall | ||
| The screen shows good response rates in our tests, but may be too slow for competitive gamers. In comparison, all tested devices range from 0.1 (minimum) to 240 (maximum) ms. » 42 % of all devices are better. This means that the measured response time is similar to the average of all tested devices (19.8 ms). | ||
| ↔ Response Time 50% Grey to 80% Grey | ||
| 29.8 ms ... rise ↗ and fall ↘ combined | ↗ 13.7 ms rise | 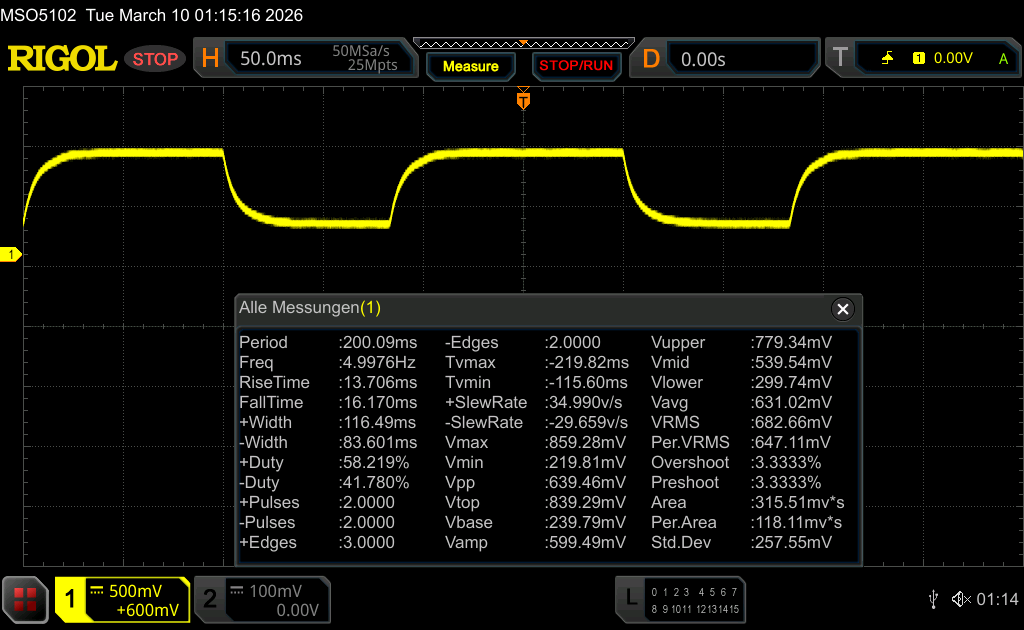 |
| ↘ 16.1 ms fall | ||
| The screen shows relatively slow response rates in our tests and may be too slow for gamers. In comparison, all tested devices range from 0.165 (minimum) to 636 (maximum) ms. » 40 % of all devices are better. This means that the measured response time is similar to the average of all tested devices (31 ms). | ||
Screen Flickering / PWM (Pulse-Width Modulation)
| Screen flickering / PWM not detected |  | ||
In comparison: 52 % of all tested devices do not use PWM to dim the display. If PWM was detected, an average of 7747 (minimum: 5 - maximum: 343500) Hz was measured. | |||


Performance
Testing Conditions
- Best Battery Life: PL1 45 W / PL2 160 W
- Balanced: PL1 100 W / PL2 160 W
- Best Performance: PL1 110 W /PL2 160 W
All our benchmarks were performed in the "Best Performance" mode.
Processor
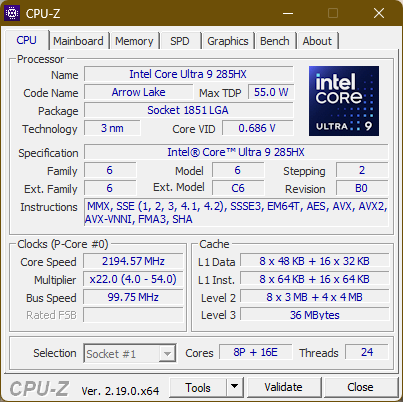
The Intel Core Ultra 285HX is a powerful "Arrow Lake" processor, based on Intel's most recent desktop CPU series. With a total of 24 cores, eight of which can reach up to 5.5 GHz, this is one of the fastest Intel CPUs for laptops. More comparisons with other processors are possible with our CPU list.
On average, the ThinkPad P16 Gen 3 is 43 percent faster than the ThinkPad P16 Gen 2 when it comes to the processor performance. Despite this big advance in performance, the CPU performs slightly below average for this chip.
When the laptop runs on battery power, performance is reduced by 26 percent, to 27728 points in the Cinebench R23 Multicore test.
Cinebench R15 Multi Loop
Cinebench R23: Multi Core | Single Core
Cinebench R20: CPU (Multi Core) | CPU (Single Core)
Cinebench R15: CPU Multi 64Bit | CPU Single 64Bit
Blender: v2.79 BMW27 CPU
7-Zip 18.03: 7z b 4 | 7z b 4 -mmt1
Geekbench 6.7: Multi-Core | Single-Core
Geekbench 5.5: Multi-Core | Single-Core
HWBOT x265 Benchmark v2.2: 4k Preset
LibreOffice : 20 Documents To PDF
R Benchmark 2.5: Overall mean
| CPU Performance rating | |
| Average Intel Core Ultra 9 285HX | |
| Lenovo ThinkPad T16g Gen 3 RTX 5080 | |
| Dell Pro Max 16 Plus | |
| Lenovo ThinkPad P16 Gen 3 | |
| HP ZBook Fury 16 G11 | |
| Average of class Workstation | |
| Lenovo ThinkPad P1 Gen 8 | |
| Lenovo ThinkPad P16 G2 21FA000FGE -2! | |
| Cinebench R23 / Multi Core | |
| Lenovo ThinkPad T16g Gen 3 RTX 5080 | |
| Average Intel Core Ultra 9 285HX (34955 - 40117, n=6) | |
| Dell Pro Max 16 Plus | |
| Lenovo ThinkPad P16 Gen 3 | |
| HP ZBook Fury 16 G11 | |
| Average of class Workstation (14621 - 38520, n=23, last 2 years) | |
| Lenovo ThinkPad P1 Gen 8 | |
| Lenovo ThinkPad P16 G2 21FA000FGE | |
| Cinebench R23 / Single Core | |
| Lenovo ThinkPad P16 Gen 3 | |
| Lenovo ThinkPad T16g Gen 3 RTX 5080 | |
| Average Intel Core Ultra 9 285HX (2057 - 2303, n=6) | |
| HP ZBook Fury 16 G11 | |
| Dell Pro Max 16 Plus | |
| Average of class Workstation (1712 - 2228, n=23, last 2 years) | |
| Lenovo ThinkPad P1 Gen 8 | |
| Lenovo ThinkPad P16 G2 21FA000FGE | |
| Cinebench R20 / CPU (Multi Core) | |
| Lenovo ThinkPad T16g Gen 3 RTX 5080 | |
| Average Intel Core Ultra 9 285HX (13152 - 15751, n=6) | |
| Dell Pro Max 16 Plus | |
| Lenovo ThinkPad P16 Gen 3 | |
| HP ZBook Fury 16 G11 | |
| Average of class Workstation (5760 - 15043, n=23, last 2 years) | |
| Lenovo ThinkPad P1 Gen 8 | |
| Lenovo ThinkPad P16 G2 21FA000FGE | |
| Cinebench R20 / CPU (Single Core) | |
| Lenovo ThinkPad P16 Gen 3 | |
| Lenovo ThinkPad T16g Gen 3 RTX 5080 | |
| Average Intel Core Ultra 9 285HX (799 - 884, n=6) | |
| HP ZBook Fury 16 G11 | |
| Dell Pro Max 16 Plus | |
| Average of class Workstation (671 - 857, n=23, last 2 years) | |
| Lenovo ThinkPad P1 Gen 8 | |
| Lenovo ThinkPad P16 G2 21FA000FGE | |
| Cinebench R15 / CPU Multi 64Bit | |
| Lenovo ThinkPad T16g Gen 3 RTX 5080 | |
| Average Intel Core Ultra 9 285HX (5427 - 6232, n=6) | |
| Lenovo ThinkPad P16 Gen 3 | |
| Dell Pro Max 16 Plus | |
| HP ZBook Fury 16 G11 | |
| Average of class Workstation (2489 - 5810, n=23, last 2 years) | |
| Lenovo ThinkPad P1 Gen 8 | |
| Lenovo ThinkPad P16 G2 21FA000FGE | |
| Cinebench R15 / CPU Single 64Bit | |
| Lenovo ThinkPad T16g Gen 3 RTX 5080 | |
| Average Intel Core Ultra 9 285HX (307 - 340, n=6) | |
| Lenovo ThinkPad P16 Gen 3 | |
| Dell Pro Max 16 Plus | |
| Lenovo ThinkPad P1 Gen 8 | |
| HP ZBook Fury 16 G11 | |
| Average of class Workstation (191.4 - 328, n=23, last 2 years) | |
| Lenovo ThinkPad P16 G2 21FA000FGE | |
| Blender / v2.79 BMW27 CPU | |
| Lenovo ThinkPad P1 Gen 8 | |
| Lenovo ThinkPad P16 G2 21FA000FGE | |
| Average of class Workstation (91 - 222, n=23, last 2 years) | |
| HP ZBook Fury 16 G11 | |
| Lenovo ThinkPad P16 Gen 3 | |
| Dell Pro Max 16 Plus | |
| Lenovo ThinkPad T16g Gen 3 RTX 5080 | |
| Average Intel Core Ultra 9 285HX (83 - 103, n=6) | |
| 7-Zip 18.03 / 7z b 4 | |
| Average Intel Core Ultra 9 285HX (99260 - 128778, n=6) | |
| Dell Pro Max 16 Plus | |
| Lenovo ThinkPad T16g Gen 3 RTX 5080 | |
| HP ZBook Fury 16 G11 | |
| Lenovo ThinkPad P16 Gen 3 | |
| Average of class Workstation (60489 - 116969, n=23, last 2 years) | |
| Lenovo ThinkPad P16 G2 21FA000FGE | |
| Lenovo ThinkPad P1 Gen 8 | |
| 7-Zip 18.03 / 7z b 4 -mmt1 | |
| HP ZBook Fury 16 G11 | |
| Lenovo ThinkPad T16g Gen 3 RTX 5080 | |
| Average Intel Core Ultra 9 285HX (6422 - 6822, n=6) | |
| Dell Pro Max 16 Plus | |
| Lenovo ThinkPad P16 Gen 3 | |
| Lenovo ThinkPad P16 G2 21FA000FGE | |
| Average of class Workstation (5126 - 6960, n=23, last 2 years) | |
| Lenovo ThinkPad P1 Gen 8 | |
| Geekbench 6.7 / Multi-Core | |
| Dell Pro Max 16 Plus | |
| Average Intel Core Ultra 9 285HX (18212 - 22104, n=6) | |
| Lenovo ThinkPad T16g Gen 3 RTX 5080 | |
| Lenovo ThinkPad P16 Gen 3 | |
| Lenovo ThinkPad P1 Gen 8 | |
| Average of class Workstation (12721 - 20887, n=23, last 2 years) | |
| HP ZBook Fury 16 G11 | |
| Geekbench 6.7 / Single-Core | |
| Lenovo ThinkPad T16g Gen 3 RTX 5080 | |
| Average Intel Core Ultra 9 285HX (2907 - 3088, n=6) | |
| Lenovo ThinkPad P16 Gen 3 | |
| HP ZBook Fury 16 G11 | |
| Dell Pro Max 16 Plus | |
| Average of class Workstation (2389 - 3065, n=23, last 2 years) | |
| Lenovo ThinkPad P1 Gen 8 | |
| Geekbench 5.5 / Multi-Core | |
| Dell Pro Max 16 Plus | |
| Average Intel Core Ultra 9 285HX (18992 - 27010, n=6) | |
| Lenovo ThinkPad T16g Gen 3 RTX 5080 | |
| Lenovo ThinkPad P16 Gen 3 | |
| HP ZBook Fury 16 G11 | |
| Average of class Workstation (11542 - 25554, n=23, last 2 years) | |
| Lenovo ThinkPad P1 Gen 8 | |
| Lenovo ThinkPad P16 G2 21FA000FGE | |
| Geekbench 5.5 / Single-Core | |
| Lenovo ThinkPad T16g Gen 3 RTX 5080 | |
| Average Intel Core Ultra 9 285HX (2121 - 2232, n=6) | |
| Lenovo ThinkPad P16 Gen 3 | |
| Dell Pro Max 16 Plus | |
| Average of class Workstation (1783 - 2183, n=23, last 2 years) | |
| HP ZBook Fury 16 G11 | |
| Lenovo ThinkPad P1 Gen 8 | |
| Lenovo ThinkPad P16 G2 21FA000FGE | |
| HWBOT x265 Benchmark v2.2 / 4k Preset | |
| Average Intel Core Ultra 9 285HX (35.3 - 44.3, n=6) | |
| Lenovo ThinkPad T16g Gen 3 RTX 5080 | |
| Dell Pro Max 16 Plus | |
| Lenovo ThinkPad P16 Gen 3 | |
| Average of class Workstation (17.8 - 40.5, n=23, last 2 years) | |
| HP ZBook Fury 16 G11 | |
| Lenovo ThinkPad P1 Gen 8 | |
| Lenovo ThinkPad P16 G2 21FA000FGE | |
| LibreOffice / 20 Documents To PDF | |
| Lenovo ThinkPad P16 G2 21FA000FGE | |
| HP ZBook Fury 16 G11 | |
| Average of class Workstation (37.1 - 74.7, n=23, last 2 years) | |
| Lenovo ThinkPad T16g Gen 3 RTX 5080 | |
| Average Intel Core Ultra 9 285HX (38 - 49.1, n=6) | |
| Dell Pro Max 16 Plus | |
| Lenovo ThinkPad P16 Gen 3 | |
| Lenovo ThinkPad P1 Gen 8 | |
| R Benchmark 2.5 / Overall mean | |
| Lenovo ThinkPad P16 G2 21FA000FGE | |
| Lenovo ThinkPad P1 Gen 8 | |
| Average of class Workstation (0.3825 - 0.603, n=23, last 2 years) | |
| Dell Pro Max 16 Plus | |
| Average Intel Core Ultra 9 285HX (0.4012 - 0.4444, n=6) | |
| Lenovo ThinkPad P16 Gen 3 | |
| Lenovo ThinkPad T16g Gen 3 RTX 5080 | |
| HP ZBook Fury 16 G11 | |
* ... smaller is better
AIDA64: FP32 Ray-Trace | FPU Julia | CPU SHA3 | CPU Queen | FPU SinJulia | FPU Mandel | CPU AES | CPU ZLib | FP64 Ray-Trace | CPU PhotoWorxx
| Performance rating | |
| Average Intel Core Ultra 9 285HX | |
| Lenovo ThinkPad T16g Gen 3 RTX 5080 | |
| Dell Pro Max 16 Plus | |
| Lenovo ThinkPad P16 Gen 3 | |
| Average of class Workstation | |
| HP ZBook Fury 16 G11 | |
| Lenovo ThinkPad P1 Gen 8 | |
| Lenovo ThinkPad P16 G2 21FA000FGE | |
| AIDA64 / FP32 Ray-Trace | |
| Lenovo ThinkPad T16g Gen 3 RTX 5080 (v6.92.6600) | |
| Average Intel Core Ultra 9 285HX (29076 - 42341, n=6) | |
| Dell Pro Max 16 Plus (v6.92.6600) | |
| Lenovo ThinkPad P16 Gen 3 (v6.92.6600) | |
| Average of class Workstation (16730 - 61611, n=23, last 2 years) | |
| Lenovo ThinkPad P1 Gen 8 (v6.92.6600) | |
| HP ZBook Fury 16 G11 (v6.92.6600) | |
| Lenovo ThinkPad P16 G2 21FA000FGE (v6.75.6100) | |
| AIDA64 / FPU Julia | |
| Average Intel Core Ultra 9 285HX (161276 - 210885, n=6) | |
| Lenovo ThinkPad T16g Gen 3 RTX 5080 (v6.92.6600) | |
| Lenovo ThinkPad P16 Gen 3 (v6.92.6600) | |
| Dell Pro Max 16 Plus (v6.92.6600) | |
| Average of class Workstation (89597 - 186971, n=23, last 2 years) | |
| Lenovo ThinkPad P1 Gen 8 (v6.92.6600) | |
| HP ZBook Fury 16 G11 (v6.92.6600) | |
| Lenovo ThinkPad P16 G2 21FA000FGE (v6.75.6100) | |
| AIDA64 / CPU SHA3 | |
| Lenovo ThinkPad T16g Gen 3 RTX 5080 (v6.92.6600) | |
| Average Intel Core Ultra 9 285HX (7757 - 9815, n=6) | |
| Lenovo ThinkPad P16 Gen 3 (v6.92.6600) | |
| Dell Pro Max 16 Plus (v6.92.6600) | |
| Average of class Workstation (4178 - 8975, n=23, last 2 years) | |
| Lenovo ThinkPad P1 Gen 8 (v6.92.6600) | |
| HP ZBook Fury 16 G11 (v6.92.6600) | |
| Lenovo ThinkPad P16 G2 21FA000FGE (v6.75.6100) | |
| AIDA64 / CPU Queen | |
| Lenovo ThinkPad T16g Gen 3 RTX 5080 (v6.92.6600) | |
| HP ZBook Fury 16 G11 (v6.92.6600) | |
| Lenovo ThinkPad P16 Gen 3 (v6.92.6600) | |
| Average Intel Core Ultra 9 285HX (134345 - 141681, n=6) | |
| Dell Pro Max 16 Plus (v6.92.6600) | |
| Lenovo ThinkPad P16 G2 21FA000FGE (v6.75.6100) | |
| Average of class Workstation (60778 - 144411, n=23, last 2 years) | |
| Lenovo ThinkPad P1 Gen 8 (v6.92.6600) | |
| AIDA64 / FPU SinJulia | |
| Average of class Workstation (8165 - 29343, n=23, last 2 years) | |
| Lenovo ThinkPad T16g Gen 3 RTX 5080 (v6.92.6600) | |
| HP ZBook Fury 16 G11 (v6.92.6600) | |
| Average Intel Core Ultra 9 285HX (12559 - 14431, n=6) | |
| Dell Pro Max 16 Plus (v6.92.6600) | |
| Lenovo ThinkPad P16 Gen 3 (v6.92.6600) | |
| Lenovo ThinkPad P16 G2 21FA000FGE (v6.75.6100) | |
| Lenovo ThinkPad P1 Gen 8 (v6.92.6600) | |
| AIDA64 / FPU Mandel | |
| Lenovo ThinkPad T16g Gen 3 RTX 5080 (v6.92.6600) | |
| Average Intel Core Ultra 9 285HX (84053 - 108922, n=6) | |
| Lenovo ThinkPad P16 Gen 3 (v6.92.6600) | |
| Dell Pro Max 16 Plus (v6.92.6600) | |
| Average of class Workstation (44497 - 98153, n=23, last 2 years) | |
| Lenovo ThinkPad P1 Gen 8 (v6.92.6600) | |
| HP ZBook Fury 16 G11 (v6.92.6600) | |
| Lenovo ThinkPad P16 G2 21FA000FGE (v6.75.6100) | |
| AIDA64 / CPU AES | |
| Lenovo ThinkPad T16g Gen 3 RTX 5080 (v6.92.6600) | |
| Average Intel Core Ultra 9 285HX (119553 - 134195, n=6) | |
| Lenovo ThinkPad P16 Gen 3 (v6.92.6600) | |
| Dell Pro Max 16 Plus (v6.92.6600) | |
| Average of class Workstation (73133 - 187841, n=23, last 2 years) | |
| HP ZBook Fury 16 G11 (v6.92.6600) | |
| Lenovo ThinkPad P16 G2 21FA000FGE (v6.75.6100) | |
| Lenovo ThinkPad P1 Gen 8 (v6.92.6600) | |
| AIDA64 / CPU ZLib | |
| Lenovo ThinkPad T16g Gen 3 RTX 5080 (v6.92.6600) | |
| Average Intel Core Ultra 9 285HX (1886 - 2267, n=6) | |
| Lenovo ThinkPad P16 Gen 3 (v6.92.6600) | |
| Dell Pro Max 16 Plus (v6.92.6600) | |
| Average of class Workstation (929 - 2148, n=23, last 2 years) | |
| HP ZBook Fury 16 G11 (v6.92.6600) | |
| Lenovo ThinkPad P1 Gen 8 (v6.92.6600) | |
| Lenovo ThinkPad P16 G2 21FA000FGE (v6.75.6100) | |
| AIDA64 / FP64 Ray-Trace | |
| Lenovo ThinkPad T16g Gen 3 RTX 5080 (v6.92.6600) | |
| Average Intel Core Ultra 9 285HX (15059 - 22312, n=6) | |
| Dell Pro Max 16 Plus (v6.92.6600) | |
| Average of class Workstation (8545 - 32891, n=23, last 2 years) | |
| Lenovo ThinkPad P16 Gen 3 (v6.92.6600) | |
| Lenovo ThinkPad P1 Gen 8 (v6.92.6600) | |
| HP ZBook Fury 16 G11 (v6.92.6600) | |
| Lenovo ThinkPad P16 G2 21FA000FGE (v6.75.6100) | |
| AIDA64 / CPU PhotoWorxx | |
| Dell Pro Max 16 Plus (v6.92.6600) | |
| Lenovo ThinkPad P1 Gen 8 (v6.92.6600) | |
| Average of class Workstation (37151 - 93684, n=23, last 2 years) | |
| Average Intel Core Ultra 9 285HX (39232 - 62611, n=6) | |
| Lenovo ThinkPad T16g Gen 3 RTX 5080 (v6.92.6600) | |
| Lenovo ThinkPad P16 Gen 3 (v6.92.6600) | |
| HP ZBook Fury 16 G11 (v6.92.6600) | |
| Lenovo ThinkPad P16 G2 21FA000FGE (v6.75.6100) | |
System Performance
PCMark 10: Score | Essentials | Productivity | Digital Content Creation
CrossMark: Overall | Productivity | Creativity | Responsiveness
WebXPRT 3: Overall
WebXPRT 4: Overall
Mozilla Kraken 1.1: Total
| Performance rating | |
| Lenovo ThinkPad T16g Gen 3 RTX 5080 | |
| Lenovo ThinkPad P16 Gen 3 | |
| Average Intel Core Ultra 9 285HX, NVIDIA RTX PRO 3000 Blackwell Generation Laptop | |
| Dell Pro Max 16 Plus -4! | |
| Lenovo ThinkPad P1 Gen 8 | |
| HP ZBook Fury 16 G11 | |
| Average of class Workstation | |
| Lenovo ThinkPad P16 G2 21FA000FGE -1! | |
| PCMark 10 / Score | |
| Lenovo ThinkPad T16g Gen 3 RTX 5080 | |
| Lenovo ThinkPad P16 Gen 3 | |
| Average Intel Core Ultra 9 285HX, NVIDIA RTX PRO 3000 Blackwell Generation Laptop (n=1) | |
| Lenovo ThinkPad P1 Gen 8 | |
| Average of class Workstation (6563 - 10409, n=19, last 2 years) | |
| HP ZBook Fury 16 G11 | |
| Lenovo ThinkPad P16 G2 21FA000FGE | |
| PCMark 10 / Essentials | |
| Lenovo ThinkPad P16 G2 21FA000FGE | |
| Lenovo ThinkPad P1 Gen 8 | |
| Average of class Workstation (9622 - 11157, n=19, last 2 years) | |
| Lenovo ThinkPad P16 Gen 3 | |
| Average Intel Core Ultra 9 285HX, NVIDIA RTX PRO 3000 Blackwell Generation Laptop (n=1) | |
| Lenovo ThinkPad T16g Gen 3 RTX 5080 | |
| HP ZBook Fury 16 G11 | |
| PCMark 10 / Productivity | |
| Lenovo ThinkPad T16g Gen 3 RTX 5080 | |
| Lenovo ThinkPad P16 Gen 3 | |
| Average Intel Core Ultra 9 285HX, NVIDIA RTX PRO 3000 Blackwell Generation Laptop (n=1) | |
| Lenovo ThinkPad P1 Gen 8 | |
| Average of class Workstation (8789 - 20616, n=19, last 2 years) | |
| HP ZBook Fury 16 G11 | |
| Lenovo ThinkPad P16 G2 21FA000FGE | |
| PCMark 10 / Digital Content Creation | |
| Lenovo ThinkPad T16g Gen 3 RTX 5080 | |
| Lenovo ThinkPad P16 Gen 3 | |
| Average Intel Core Ultra 9 285HX, NVIDIA RTX PRO 3000 Blackwell Generation Laptop (n=1) | |
| HP ZBook Fury 16 G11 | |
| Average of class Workstation (8108 - 15631, n=19, last 2 years) | |
| Lenovo ThinkPad P1 Gen 8 | |
| Lenovo ThinkPad P16 G2 21FA000FGE | |
| CrossMark / Overall | |
| Lenovo ThinkPad T16g Gen 3 RTX 5080 | |
| Dell Pro Max 16 Plus | |
| Lenovo ThinkPad P16 Gen 3 | |
| Average Intel Core Ultra 9 285HX, NVIDIA RTX PRO 3000 Blackwell Generation Laptop (n=1) | |
| HP ZBook Fury 16 G11 | |
| Lenovo ThinkPad P1 Gen 8 | |
| Average of class Workstation (1307 - 2267, n=22, last 2 years) | |
| Lenovo ThinkPad P16 G2 21FA000FGE | |
| CrossMark / Productivity | |
| Lenovo ThinkPad T16g Gen 3 RTX 5080 | |
| Lenovo ThinkPad P16 Gen 3 | |
| Average Intel Core Ultra 9 285HX, NVIDIA RTX PRO 3000 Blackwell Generation Laptop (n=1) | |
| Dell Pro Max 16 Plus | |
| HP ZBook Fury 16 G11 | |
| Lenovo ThinkPad P1 Gen 8 | |
| Average of class Workstation (1130 - 2122, n=22, last 2 years) | |
| Lenovo ThinkPad P16 G2 21FA000FGE | |
| CrossMark / Creativity | |
| Dell Pro Max 16 Plus | |
| Lenovo ThinkPad T16g Gen 3 RTX 5080 | |
| Lenovo ThinkPad P16 Gen 3 | |
| Average Intel Core Ultra 9 285HX, NVIDIA RTX PRO 3000 Blackwell Generation Laptop (n=1) | |
| HP ZBook Fury 16 G11 | |
| Average of class Workstation (1657 - 2725, n=22, last 2 years) | |
| Lenovo ThinkPad P1 Gen 8 | |
| Lenovo ThinkPad P16 G2 21FA000FGE | |
| CrossMark / Responsiveness | |
| Lenovo ThinkPad T16g Gen 3 RTX 5080 | |
| Lenovo ThinkPad P16 Gen 3 | |
| Average Intel Core Ultra 9 285HX, NVIDIA RTX PRO 3000 Blackwell Generation Laptop (n=1) | |
| Dell Pro Max 16 Plus | |
| HP ZBook Fury 16 G11 | |
| Lenovo ThinkPad P1 Gen 8 | |
| Average of class Workstation (993 - 2096, n=22, last 2 years) | |
| Lenovo ThinkPad P16 G2 21FA000FGE | |
| WebXPRT 3 / Overall | |
| Lenovo ThinkPad T16g Gen 3 RTX 5080 | |
| Lenovo ThinkPad P16 Gen 3 | |
| Average Intel Core Ultra 9 285HX, NVIDIA RTX PRO 3000 Blackwell Generation Laptop (n=1) | |
| Lenovo ThinkPad P1 Gen 8 | |
| Dell Pro Max 16 Plus | |
| Lenovo ThinkPad P16 G2 21FA000FGE | |
| HP ZBook Fury 16 G11 | |
| Average of class Workstation (260 - 360, n=23, last 2 years) | |
| WebXPRT 4 / Overall | |
| Lenovo ThinkPad P16 Gen 3 | |
| Average Intel Core Ultra 9 285HX, NVIDIA RTX PRO 3000 Blackwell Generation Laptop (n=1) | |
| Lenovo ThinkPad T16g Gen 3 RTX 5080 | |
| Dell Pro Max 16 Plus | |
| HP ZBook Fury 16 G11 | |
| Lenovo ThinkPad P1 Gen 8 | |
| Average of class Workstation (189.2 - 326, n=23, last 2 years) | |
| Mozilla Kraken 1.1 / Total | |
| Lenovo ThinkPad P16 G2 21FA000FGE | |
| Lenovo ThinkPad P1 Gen 8 | |
| Average of class Workstation (411 - 538, n=23, last 2 years) | |
| HP ZBook Fury 16 G11 | |
| Dell Pro Max 16 Plus | |
| Lenovo ThinkPad T16g Gen 3 RTX 5080 | |
| Lenovo ThinkPad P16 Gen 3 | |
| Average Intel Core Ultra 9 285HX, NVIDIA RTX PRO 3000 Blackwell Generation Laptop (n=1) | |
* ... smaller is better
| PCMark 10 Score | 10149 points | |
Help | ||
| AIDA64 / Memory Copy | |
| Lenovo ThinkPad P1 Gen 8 | |
| Dell Pro Max 16 Plus | |
| Average of class Workstation (56003 - 164795, n=23, last 2 years) | |
| Average Intel Core Ultra 9 285HX (63431 - 93933, n=6) | |
| Lenovo ThinkPad T16g Gen 3 RTX 5080 | |
| Lenovo ThinkPad P16 Gen 3 | |
| HP ZBook Fury 16 G11 | |
| Lenovo ThinkPad P16 G2 21FA000FGE | |
| AIDA64 / Memory Read | |
| Dell Pro Max 16 Plus | |
| Average Intel Core Ultra 9 285HX (67084 - 97565, n=6) | |
| Average of class Workstation (55795 - 121563, n=23, last 2 years) | |
| Lenovo ThinkPad P1 Gen 8 | |
| Lenovo ThinkPad P16 Gen 3 | |
| Lenovo ThinkPad T16g Gen 3 RTX 5080 | |
| HP ZBook Fury 16 G11 | |
| Lenovo ThinkPad P16 G2 21FA000FGE | |
| AIDA64 / Memory Write | |
| Dell Pro Max 16 Plus | |
| Average of class Workstation (55663 - 214520, n=23, last 2 years) | |
| Average Intel Core Ultra 9 285HX (64112 - 89691, n=6) | |
| Lenovo ThinkPad P16 Gen 3 | |
| Lenovo ThinkPad T16g Gen 3 RTX 5080 | |
| Lenovo ThinkPad P1 Gen 8 | |
| Lenovo ThinkPad P16 G2 21FA000FGE | |
| HP ZBook Fury 16 G11 | |
| AIDA64 / Memory Latency | |
| Lenovo ThinkPad P16 Gen 3 | |
| Lenovo ThinkPad T16g Gen 3 RTX 5080 | |
| Lenovo ThinkPad P1 Gen 8 | |
| Average Intel Core Ultra 9 285HX (104.8 - 151.7, n=6) | |
| Average of class Workstation (84.5 - 165.2, n=23, last 2 years) | |
| Dell Pro Max 16 Plus | |
| Lenovo ThinkPad P16 G2 21FA000FGE | |
| HP ZBook Fury 16 G11 | |
* ... smaller is better
DPC Latency
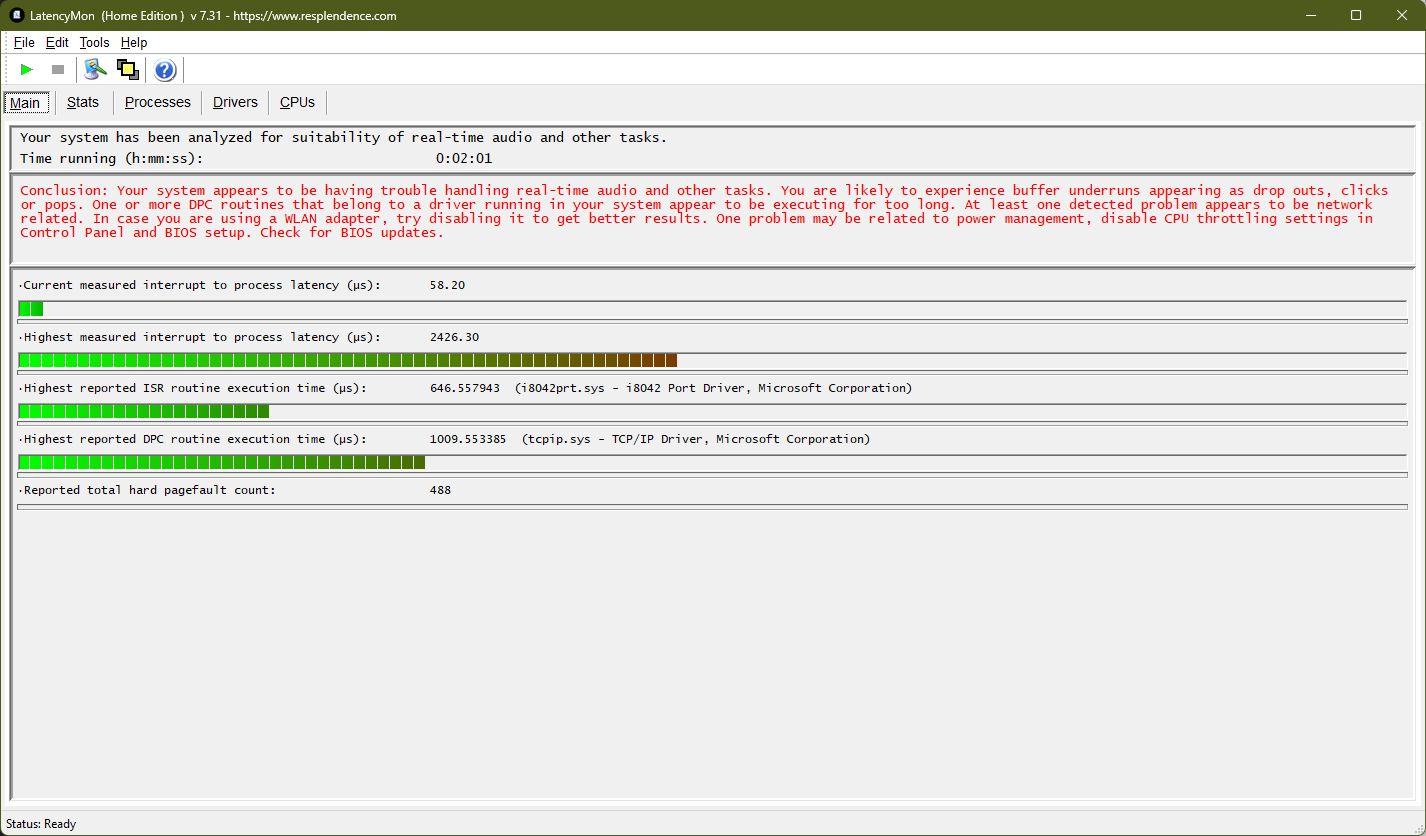
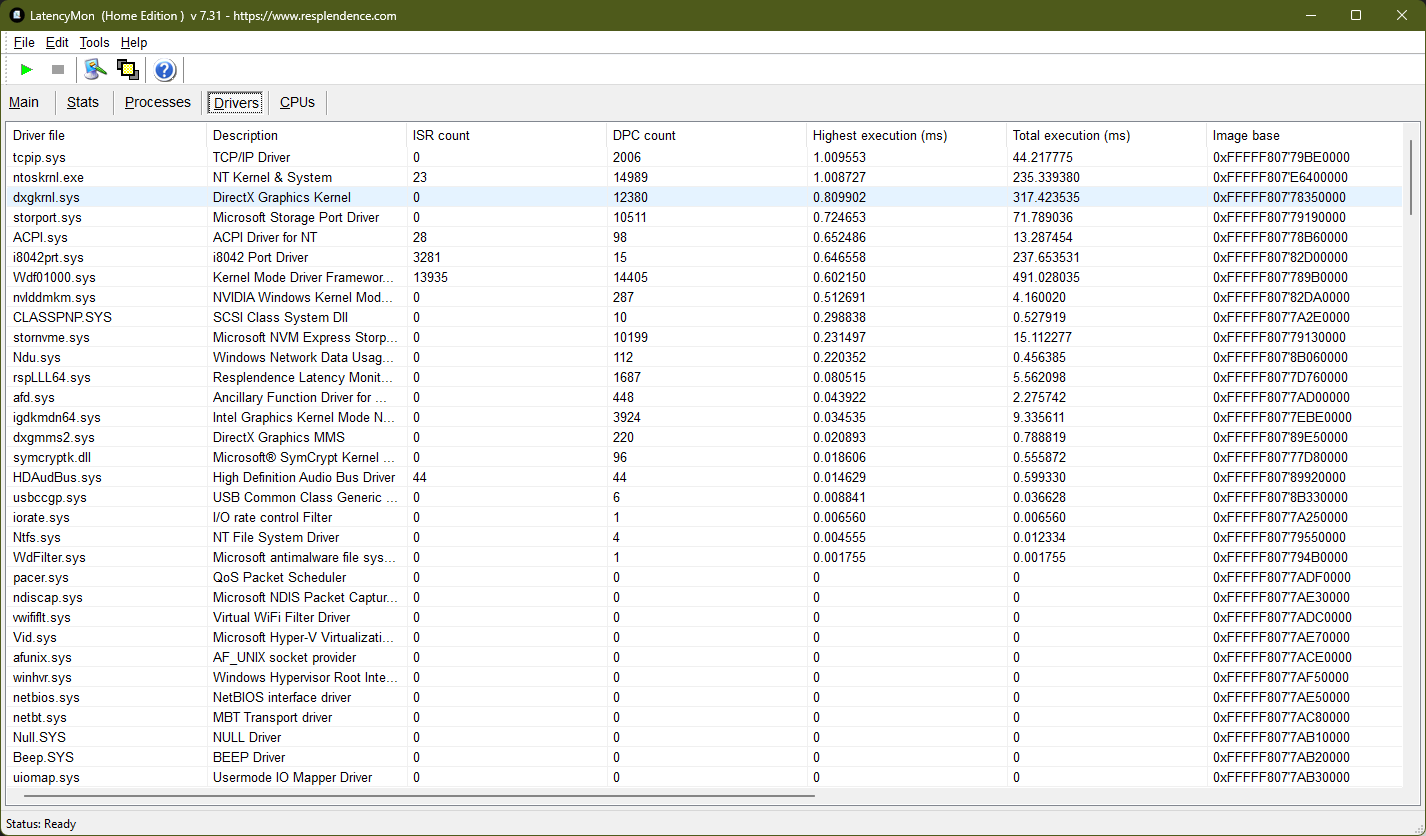
| DPC Latencies / LatencyMon - interrupt to process latency (max), Web, Youtube, Prime95 | |
| HP ZBook Fury 16 G11 | |
| Lenovo ThinkPad P1 Gen 8 | |
| Dell Pro Max 16 Plus | |
| Lenovo ThinkPad P16 Gen 3 | |
| Lenovo ThinkPad T16g Gen 3 RTX 5080 | |
| Lenovo ThinkPad P16 G2 21FA000FGE | |
* ... smaller is better
Storage Devices
Lenovo uses a fast PCIe 5.0 SSD made by Samsung, the PM9E1, which has a capacity of 2 TB. The M.2 2280 SSD does well in our benchmarks, outperforming most other workstations. However, performance does get throttled under load a bit.
The ThinkPad has two additional NVMe 4.0 M.2 2280 bays under the keyboard, which allows for a lot of storage expansion.

* ... smaller is better
Disk Throttling: DiskSpd Read Loop, Queue Depth 8
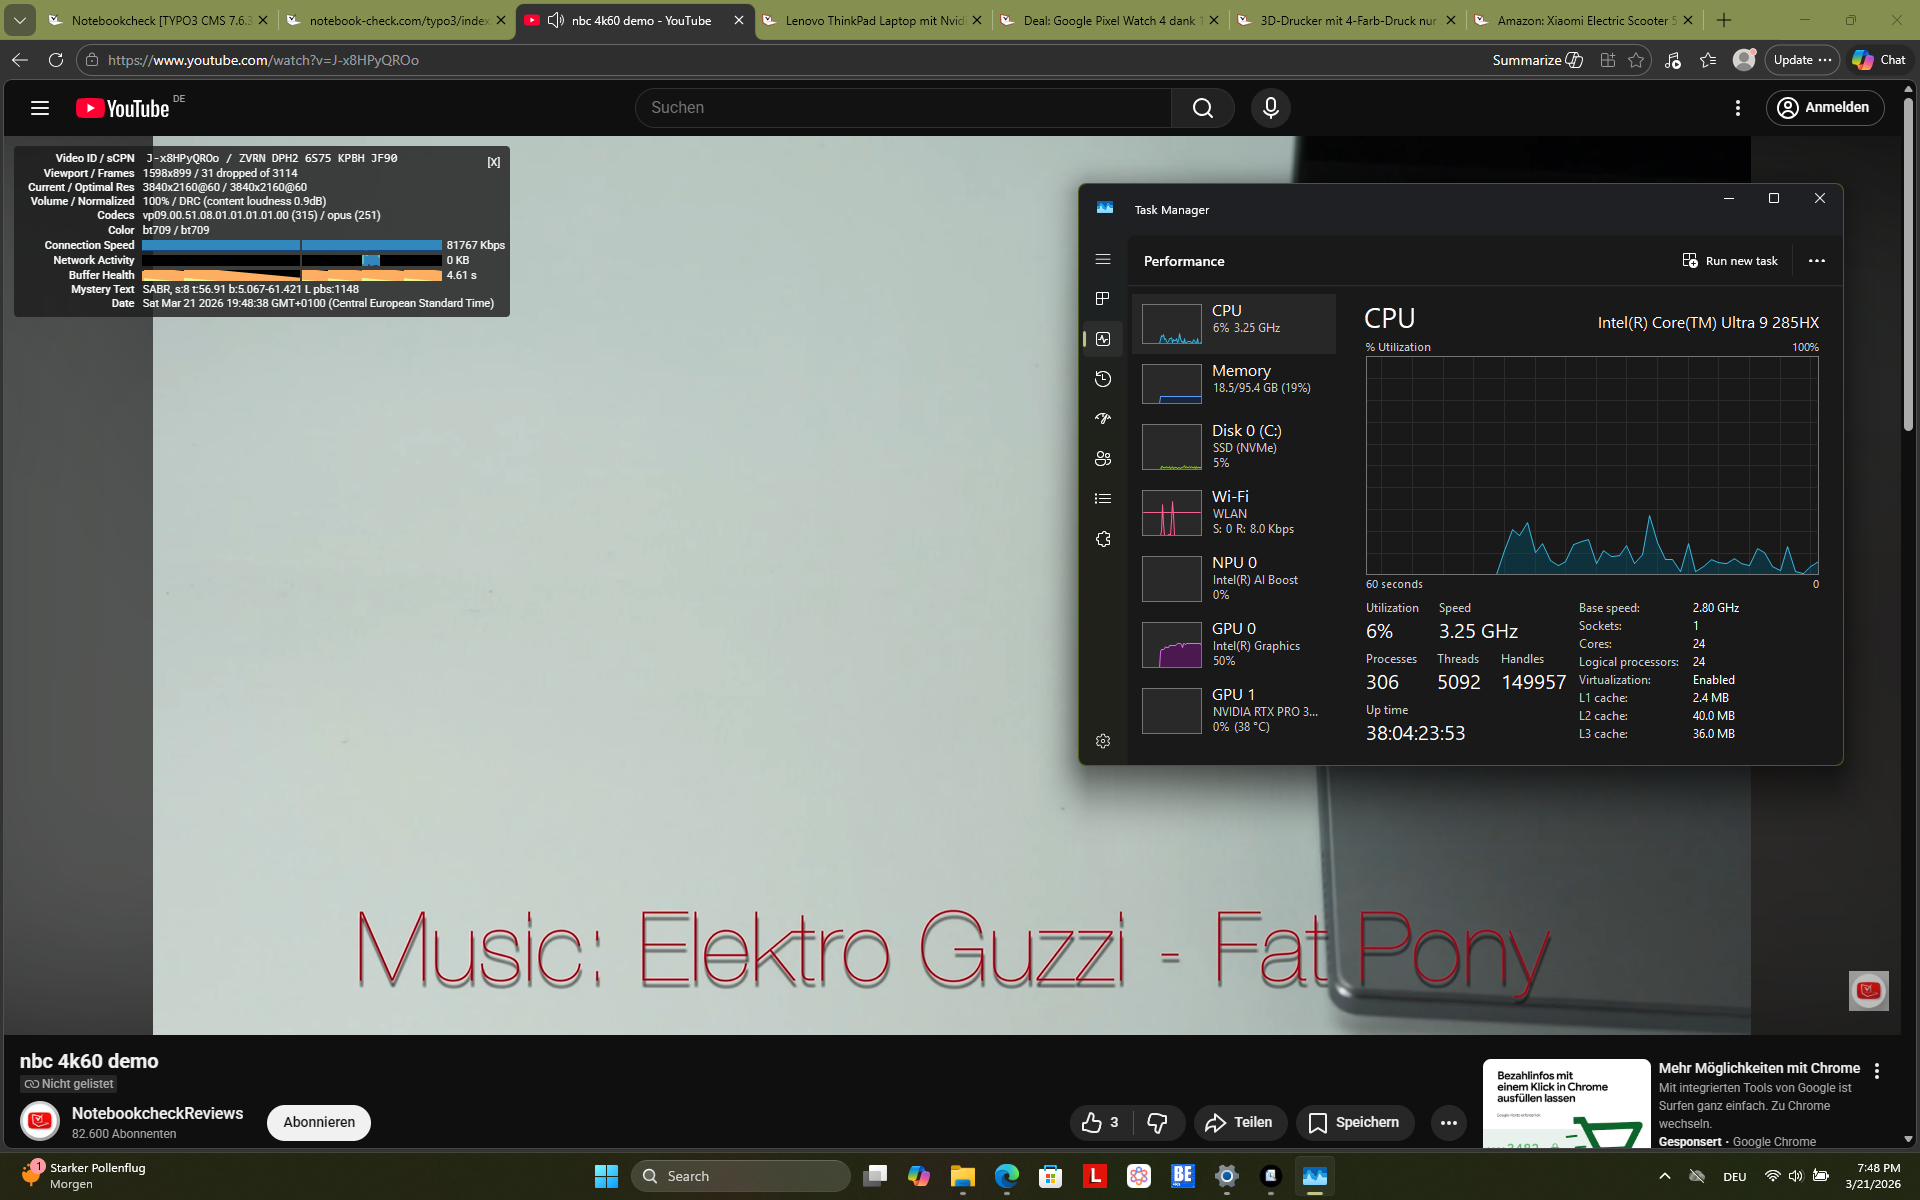
GPU Performance
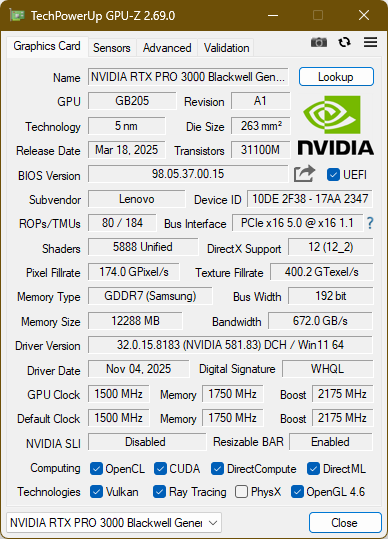
Lenovo uses the Nvidia RTX Pro 3000 Blackwell, a professional, ISV certified GPU from Nvidia. This graphics card is comparable with the Nvidia GeForce RTX 5070 Ti. In the ThinkPad P16 Gen 3, Lenovo limits it to 105 W, a far cry from the 175 W TGP RTX 5000 Pro of the Dell Pro Max 16 Plus. Accordingly, performance suffers, lagging around 24 percent behind the competitor in both professional (SPECviewperf) and consumer (3DMark) testing.
Overall, the GPU performance is reduced when the P16 Gen 3 runs on battery power, with just 37978 points 3DMark 11 GPU test, a reduction by 23 percent.
| 3DMark 06 Standard Score | 63693 points | |
| 3DMark Vantage P Result | 116321 points | |
| 3DMark 11 Performance | 39176 points | |
| 3DMark Cloud Gate Standard Score | 65135 points | |
| 3DMark Fire Strike Score | 31208 points | |
| 3DMark Time Spy Score | 14579 points | |
Help | ||
* ... smaller is better
Gaming Performance
| Cyberpunk 2077 - 1920x1080 Ultra Preset (FSR off) | |
| Dell Pro Max 16 Plus | |
| Lenovo ThinkPad T16g Gen 3 RTX 5080 | |
| Lenovo ThinkPad P16 Gen 3 | |
| HP ZBook Fury 16 G11 | |
| Average of class Workstation (21.5 - 152.4, n=23, last 2 years) | |
| Lenovo ThinkPad P1 Gen 8 | |
| Baldur's Gate 3 - 1920x1080 Ultra Preset AA:T | |
| Dell Pro Max 16 Plus | |
| Lenovo ThinkPad T16g Gen 3 RTX 5080 | |
| Lenovo ThinkPad P16 Gen 3 | |
| HP ZBook Fury 16 G11 | |
| Lenovo ThinkPad P1 Gen 8 | |
| Average of class Workstation (23.7 - 205, n=24, last 2 years) | |
| Final Fantasy XV Benchmark - 1920x1080 High Quality | |
| Dell Pro Max 16 Plus | |
| Lenovo ThinkPad T16g Gen 3 RTX 5080 | |
| Lenovo ThinkPad P16 Gen 3 | |
| HP ZBook Fury 16 G11 | |
| Lenovo ThinkPad P1 Gen 8 | |
| Average of class Workstation (26.4 - 197.6, n=23, last 2 years) | |
| Lenovo ThinkPad P16 G2 21FA000FGE | |
Cyberpunk 2077 ultra FPS Chart
| low | med. | high | ultra | QHD | 4K DLSS | 4K FSR | 4K | |
|---|---|---|---|---|---|---|---|---|
| GTA V (2015) | 183.5 | 182.6 | 176.4 | 131.7 | 116.7 | |||
| Dota 2 Reborn (2015) | 204 | 181.7 | 167.3 | 157 | 128.7 | |||
| Final Fantasy XV Benchmark (2018) | 204 | 164 | 132 | 111 | 63.8 | |||
| X-Plane 11.11 (2018) | 136.1 | 118.7 | 92.1 | 73.5 | ||||
| Strange Brigade (2018) | 524 | 380 | 321 | 290 | 204 | 108.7 | ||
| Baldur's Gate 3 (2023) | 172.4 | 147.8 | 128.9 | 126.8 | 91.9 | 75.8 | 75.4 | 49.4 |
| Cyberpunk 2077 (2023) | 138.7 | 137 | 112.7 | 102.5 | 70.7 | 37.7 | 30.8 | |
| Kingdom Come Deliverance 2 (2025) | 166.7 | 131.2 | 106.4 | 80.2 | 56.3 | 44.8 | 30 | |
| Civilization 7 (2025) | 287 | 183.6 | 163.2 | 116.9 | 88.7 | 62.4 | ||
| Assassin's Creed Shadows (2025) | 79 | 74 | 62 | 47 | 39 | 37 | 26 | |
| The Elder Scrolls IV Oblivion Remastered (2025) | 87.8 | 81.6 | 76.4 | 35.3 | 23.6 | 21.6 | 24.3 | 13.3 |
| Doom: The Dark Ages (2025) | 98.2 | 80.3 | 73.4 | 69.7 | 46.9 | 35.1 | 24.9 | |
| F1 25 (2025) | 189.1 | 176.5 | 165.8 | 33.8 | 20.1 | 17.7 | 9.25 | |
| Borderlands 4 (2025) | 71.5 | 59 | 46.6 | 32.5 | 22 | 64.6 | 11.5 | |
| The Outer Worlds 2 (2025) | 101.1 | 97.1 | 83.4 | 50.3 | 32.6 | 27.2 | 17 | |
| ARC Raiders (2025) | 167.6 | 137 | 121.7 | 84.4 | 57.5 | 55.7 | 31.3 | |
| Anno 117: Pax Romana (2025) | 129 | 103.8 | 78 | 41.5 | 29 | 26 | 15.9 |
Emissions
System Noise
The dual fans of the ThinkPad laptop are mostly quiet during office usage, but can get quite loud under load - over 50 dB(a) are very audible, even from different rooms.
We could not detect coil whine for the ThinkPad P16 Gen 3.
Noise level
| Idle |
| 23.6 / 27.2 / 27.2 dB(A) |
| Load |
| 42.7 / 53.9 dB(A) |
 | ||
30 dB silent 40 dB(A) audible 50 dB(A) loud |
||
min: | ||
| Lenovo ThinkPad P16 Gen 3 Ultra 9 285HX, RTX PRO 3000 Blackwell Generation Laptop | Lenovo ThinkPad P16 G2 21FA000FGE i7-13700HX, RTX 2000 Ada Generation Laptop | Dell Pro Max 16 Plus Ultra 9 285HX, RTX PRO 5000 Blackwell Generation Laptop | HP ZBook Fury 16 G11 i9-14900HX, RTX 3500 Ada Generation Laptop | Lenovo ThinkPad T16g Gen 3 RTX 5080 Ultra 9 275HX, GeForce RTX 5080 Laptop | Lenovo ThinkPad P1 Gen 8 Ultra 7 255H, RTX PRO 2000 Blackwell Generation Laptop | |
|---|---|---|---|---|---|---|
| Noise | 1% | -6% | 5% | -1% | 14% | |
| off / environment * (dB) | 23.6 | 23.5 -0% | 23.2 2% | 23.2 2% | 24.7 -5% | 23.1 2% |
| Idle Minimum * (dB) | 23.6 | 23.5 -0% | 26.7 -13% | 23.2 2% | 24.7 -5% | 23.1 2% |
| Idle Average * (dB) | 27.2 | 29.2 -7% | 30.5 -12% | 23.2 15% | 28.9 -6% | 23.1 15% |
| Idle Maximum * (dB) | 27.2 | 29.5 -8% | 34 -25% | 29.5 -8% | 28.9 -6% | 23.1 15% |
| Load Average * (dB) | 42.7 | 32.7 23% | 39.8 7% | 43 -1% | 30.4 29% | 27.3 36% |
| Cyberpunk 2077 ultra * (dB) | 53.9 | 54.3 -1% | 48.2 11% | 57.7 -7% | ||
| Load Maximum * (dB) | 53.9 | 56.6 -5% | 54.3 -1% | 48.2 11% | 57.7 -7% | 47.9 11% |
| Witcher 3 ultra * (dB) | 50.6 |
* ... smaller is better
Temperature
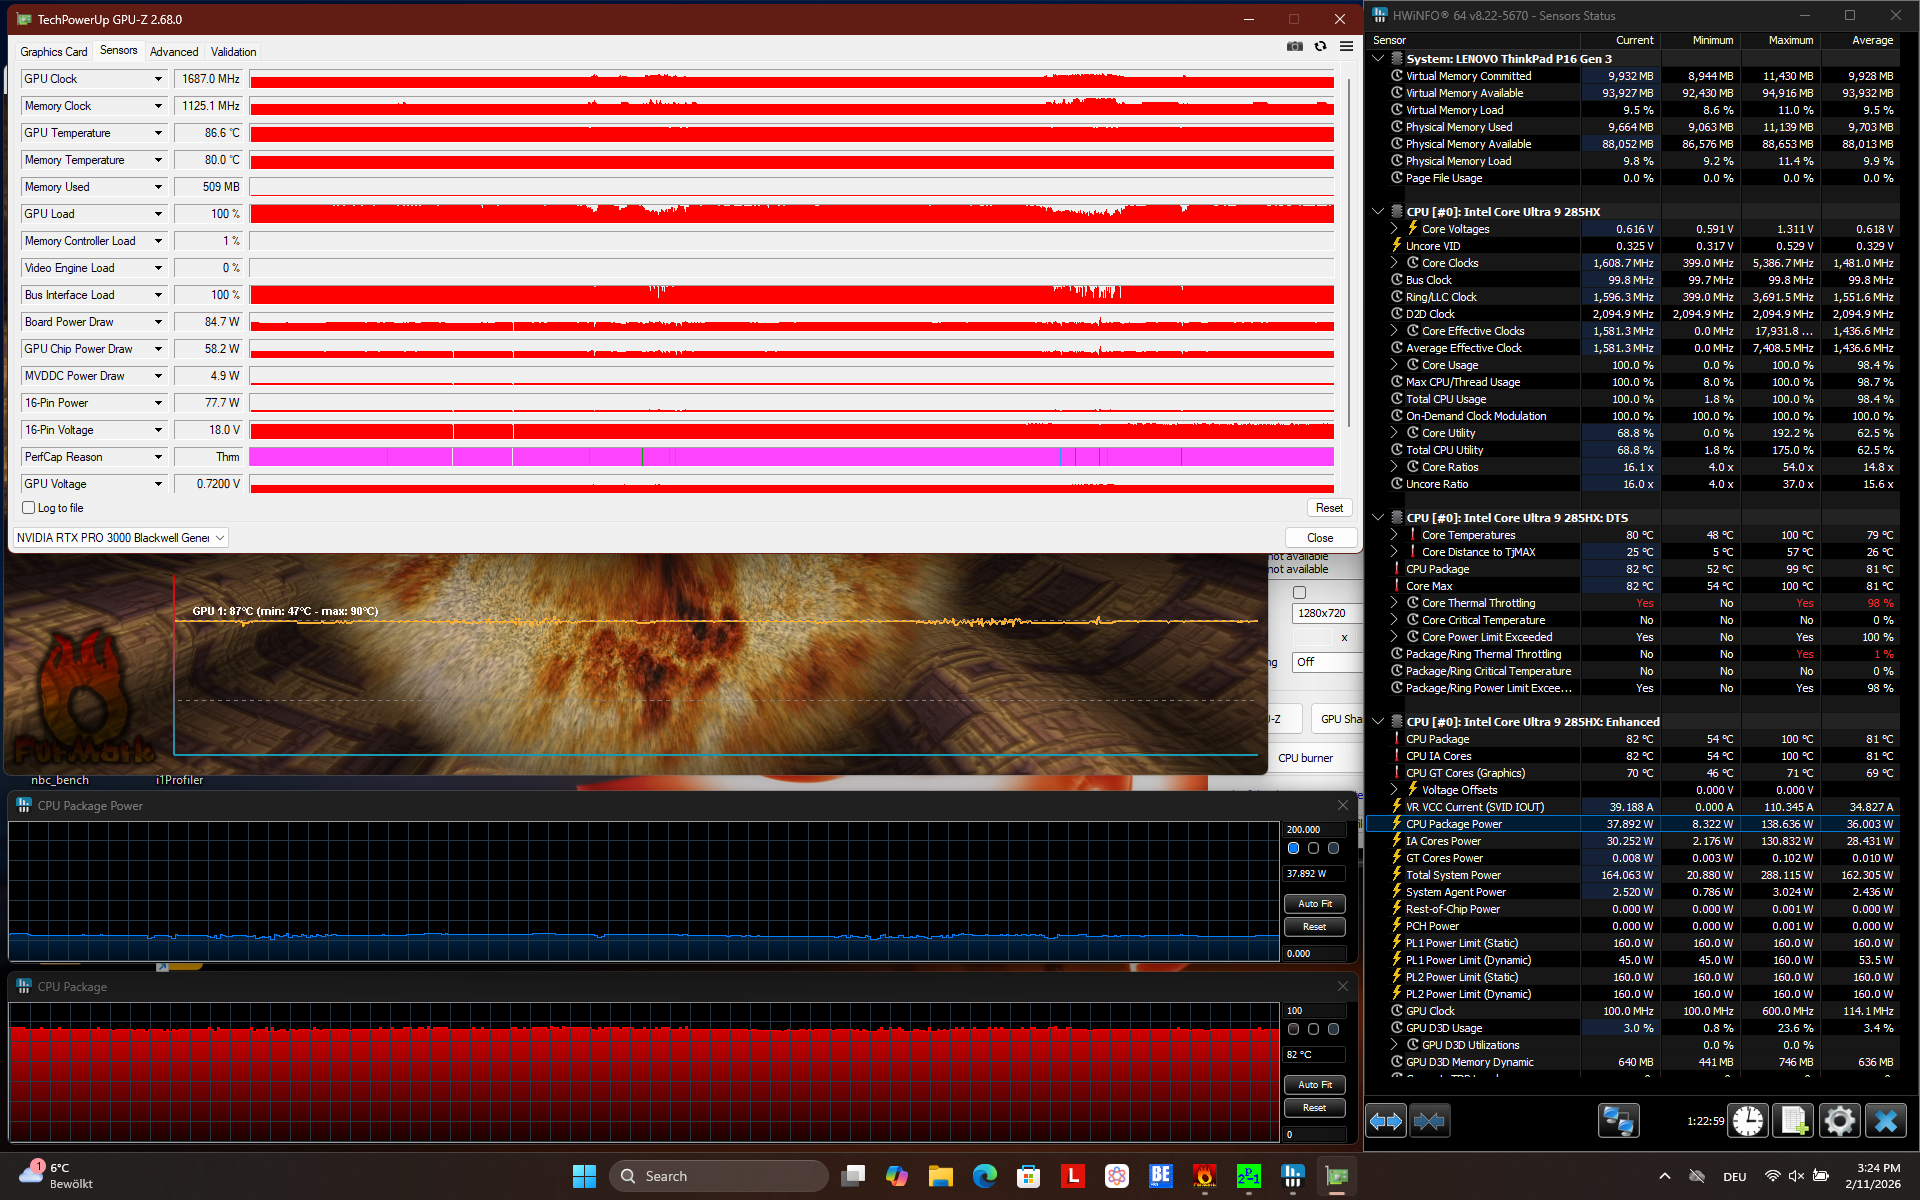
With the ThinkPad P16 Gen 3 being more compact than its predecessor, we are not surprised that runs a bit hotter, too. The overall maximum is 50.8 degrees Celsius or 123 F, with the palmrest also becoming a bit warm to the touch.
Neither GPU nor CPU can keep their maximum power draw under combined load. The CPU gets limited to 37 W and the GPU to 85 W.
(-) The maximum temperature on the upper side is 50.8 °C / 123 F, compared to the average of 38.2 °C / 101 F, ranging from 22.2 to 69.8 °C for the class Workstation.
(-) The bottom heats up to a maximum of 48 °C / 118 F, compared to the average of 41.1 °C / 106 F
(+) In idle usage, the average temperature for the upper side is 26.9 °C / 80 F, compared to the device average of 32 °C / 90 F.
(±) 3: The average temperature for the upper side is 35 °C / 95 F, compared to the average of 32 °C / 90 F for the class Workstation.
(+) The palmrests and touchpad are reaching skin temperature as a maximum (32.4 °C / 90.3 F) and are therefore not hot.
(-) The average temperature of the palmrest area of similar devices was 27.8 °C / 82 F (-4.6 °C / -8.3 F).
| Lenovo ThinkPad P16 Gen 3 Ultra 9 285HX, RTX PRO 3000 Blackwell Generation Laptop | Lenovo ThinkPad P16 G2 21FA000FGE i7-13700HX, RTX 2000 Ada Generation Laptop | Dell Pro Max 16 Plus Ultra 9 285HX, RTX PRO 5000 Blackwell Generation Laptop | HP ZBook Fury 16 G11 i9-14900HX, RTX 3500 Ada Generation Laptop | Lenovo ThinkPad T16g Gen 3 RTX 5080 Ultra 9 275HX, GeForce RTX 5080 Laptop | Lenovo ThinkPad P1 Gen 8 Ultra 7 255H, RTX PRO 2000 Blackwell Generation Laptop | |
|---|---|---|---|---|---|---|
| Heat | 10% | -1% | -10% | 6% | 6% | |
| Maximum Upper Side * (°C) | 50.8 | 47.2 7% | 40.4 20% | 42.2 17% | 43.9 14% | 45 11% |
| Maximum Bottom * (°C) | 48 | 39.5 18% | 45.6 5% | 48 -0% | 45.4 5% | 33 31% |
| Idle Upper Side * (°C) | 30.1 | 28.1 7% | 32.8 -9% | 37 -23% | 27.7 8% | 30.6 -2% |
| Idle Bottom * (°C) | 27.5 | 25.3 8% | 33 -20% | 36.8 -34% | 28.6 -4% | 31.6 -15% |
* ... smaller is better
Speakers
Despite their miniscule size, the speakers of the P16 G3, located on the side of the device, perform well - they are loud and even deliver same bass, making them suitable for listening to music.
Lenovo ThinkPad P16 Gen 3 audio analysis
(+) | speakers can play relatively loud (83.5 dB)
Bass 100 - 315 Hz
(±) | reduced bass - on average 9.9% lower than median
(±) | linearity of bass is average (13% delta to prev. frequency)
Mids 400 - 2000 Hz
(+) | balanced mids - only 4% away from median
(+) | mids are linear (4% delta to prev. frequency)
Highs 2 - 16 kHz
(+) | balanced highs - only 2.2% away from median
(+) | highs are linear (4.8% delta to prev. frequency)
Overall 100 - 16.000 Hz
(+) | overall sound is linear (10% difference to median)
Compared to same class
» 6% of all tested devices in this class were better, 3% similar, 91% worse
» The best had a delta of 7%, average was 17%, worst was 35%
Compared to all devices tested
» 4% of all tested devices were better, 1% similar, 94% worse
» The best had a delta of 4%, average was 23%, worst was 134%
Lenovo ThinkPad P1 Gen 8 audio analysis
(+) | speakers can play relatively loud (87.5 dB)
Bass 100 - 315 Hz
(±) | reduced bass - on average 9.8% lower than median
(±) | linearity of bass is average (11.2% delta to prev. frequency)
Mids 400 - 2000 Hz
(+) | balanced mids - only 2.9% away from median
(+) | mids are linear (2.8% delta to prev. frequency)
Highs 2 - 16 kHz
(+) | balanced highs - only 3% away from median
(+) | highs are linear (4.7% delta to prev. frequency)
Overall 100 - 16.000 Hz
(+) | overall sound is linear (8.3% difference to median)
Compared to same class
» 1% of all tested devices in this class were better, 1% similar, 97% worse
» The best had a delta of 7%, average was 17%, worst was 35%
Compared to all devices tested
» 2% of all tested devices were better, 1% similar, 97% worse
» The best had a delta of 4%, average was 23%, worst was 134%
Energy Management
Power Consumption
Power consumption is lower compared to the previous ThinkPad P16. Power consumption under load exceeded 180 W, indicating that the device may drain its battery, even when conntected to a charger.
| Off / Standby | |
| Idle | |
| Load |
|
Key:
min: | |
| Lenovo ThinkPad P16 Gen 3 Ultra 9 285HX, RTX PRO 3000 Blackwell Generation Laptop, Samsung PM9E1 MZVLC2T0HBLD, IPS LED, 1920x1200, 16" | Lenovo ThinkPad P16 G2 21FA000FGE i7-13700HX, RTX 2000 Ada Generation Laptop, SK hynix PC801 HFS001TEJ9X162N, IPS LED, 2560x1600, 16" | Dell Pro Max 16 Plus Ultra 9 285HX, RTX PRO 5000 Blackwell Generation Laptop, SK hynix PCB01 HFS001TFM9X186N, OLED, 3840x2400, 16" | HP ZBook Fury 16 G11 i9-14900HX, RTX 3500 Ada Generation Laptop, SK hynix PC801 HFS001TEJ9X101N, IPS, 3840x2400, 16" | Lenovo ThinkPad T16g Gen 3 RTX 5080 Ultra 9 275HX, GeForce RTX 5080 Laptop, Samsung PM9E1 MZVLC2T0HBLD, OLED, 3200x2000, 16" | Lenovo ThinkPad P1 Gen 8 Ultra 7 255H, RTX PRO 2000 Blackwell Generation Laptop, Samsung PM9E1 1 TB MZVLC1T0HFLU, Tandem OLED, 3200x2000, 16" | Average NVIDIA RTX PRO 3000 Blackwell Generation Laptop | Average of class Workstation | |
|---|---|---|---|---|---|---|---|---|
| Power Consumption | -7% | -135% | -15% | -12% | -10% | 0% | -3% | |
| Idle Minimum * (Watt) | 7.8 | 9.3 -19% | 35.1 -350% | 8.6 -10% | 9.9 -27% | 15.4 -97% | 7.8 ? -0% | 9.11 ? -17% |
| Idle Average * (Watt) | 12.6 | 14.1 -12% | 39.2 -211% | 14.8 -17% | 17.1 -36% | 16.5 -31% | 12.6 ? -0% | 13.8 ? -10% |
| Idle Maximum * (Watt) | 16.5 | 15.5 6% | 56 -239% | 15.7 5% | 17.7 -7% | 23.1 -40% | 16.5 ? -0% | 17.9 ? -8% |
| Load Average * (Watt) | 118.7 | 133.6 -13% | 130.2 -10% | 129.4 -9% | 125.6 -6% | 86.6 27% | 118.7 ? -0% | 96 ? 19% |
| Cyberpunk 2077 ultra external monitor * (Watt) | 161.3 | 213 -32% | 192.6 -19% | 166.8 -3% | 121.8 24% | |||
| Cyberpunk 2077 ultra * (Watt) | 159.6 | 229 -43% | 199.4 -25% | 160.5 -1% | 123.1 23% | |||
| Load Maximum * (Watt) | 181.4 | 179.6 1% | 285.2 -57% | 236.1 -30% | 182.8 -1% | 143.6 21% | 181.4 ? -0% | 180.3 ? 1% |
| Witcher 3 ultra * (Watt) | 144.9 |
* ... smaller is better
Power Consumption Cyberpunk / Stress Test
Power Consumption external Monitor
Battery Life

With a large 99 Wh battery and energy efficient WUXGA screen, the ThinkPad P16 Gen 3 does well in our battery testing: 11.6 hours in the Wi-Fi websurfing test (150 cd/m²) are better than all the other workstations in the comparison.
| Lenovo ThinkPad P16 Gen 3 Ultra 9 285HX, RTX PRO 3000 Blackwell Generation Laptop, 99 Wh | Lenovo ThinkPad P16 G2 21FA000FGE i7-13700HX, RTX 2000 Ada Generation Laptop, 94 Wh | Dell Pro Max 16 Plus Ultra 9 285HX, RTX PRO 5000 Blackwell Generation Laptop, 96 Wh | HP ZBook Fury 16 G11 i9-14900HX, RTX 3500 Ada Generation Laptop, 95 Wh | Lenovo ThinkPad T16g Gen 3 RTX 5080 Ultra 9 275HX, GeForce RTX 5080 Laptop, 99.9 Wh | Lenovo ThinkPad P1 Gen 8 Ultra 7 255H, RTX PRO 2000 Blackwell Generation Laptop, 90 Wh | Average of class Workstation | |
|---|---|---|---|---|---|---|---|
| Battery runtime | -26% | -69% | -42% | -19% | -53% | -23% | |
| WiFi v1.3 (h) | 11.6 | 8.6 -26% | 3.6 -69% | 6.7 -42% | 9.4 -19% | 5.5 -53% | 8.55 ? -26% |
| Load (h) | 1.8 | 1.441 ? -20% |
Notebookcheck Rating
The ThinkPad P16 Gen 3 is a powerful and highly expandable mobile workstation with great build quality, input devices, port options and a bright, matte screen, as well as good battery life. Oddly enough, the performance is the biggest drawback, as it could be even better.
Lenovo ThinkPad P16 Gen 3
- 04/22/2026 v8
Benjamin Herzig
 Total Sustainability Score:
 Potential Competitors in Comparison
Image | Model / Review | Price | Weight | Height | Display |
|---|---|---|---|---|---|
1. 89%  | Lenovo ThinkPad P16 Gen 3 Intel Core Ultra 9 285HX ⎘ NVIDIA RTX PRO 3000 Blackwell Generation Laptop ⎘ 96 GB Memory, 2048 GB SSD | Amazon: List Price: 4000 Euro | 2.7 kg | 30 mm | 16.00" 1920x1200 142 PPI IPS LED |
2. 90.2% v7 (old)  | Lenovo ThinkPad P16 G2 21FA000FGE Intel Core i7-13700HX ⎘ NVIDIA RTX 2000 Ada Generation Laptop ⎘ 32 GB Memory, 1024 GB SSD | Amazon: List Price: 2750 Euro | 3 kg | 30.23 mm | 16.00" 2560x1600 189 PPI IPS LED |
3. 88.4%  | Dell Pro Max 16 Plus Intel Core Ultra 9 285HX ⎘ NVIDIA RTX PRO 5000 Blackwell Generation Laptop ⎘ 128 GB Memory, SSD | Amazon: List Price: 5000 USD | 2.8 kg | 30.9 mm | 16.00" 3840x2400 283 PPI OLED |
4. 85.9%  | HP ZBook Fury 16 G11 Intel Core i9-14900HX ⎘ NVIDIA RTX 3500 Ada Generation Laptop ⎘ 64 GB Memory, 1024 GB SSD | Amazon: List Price: 3300 USD | 2.6 kg | 28.5 mm | 16.00" 3840x2400 283 PPI IPS |
5. 87.3%  | Lenovo ThinkPad T16g Gen 3 RTX 5080 Intel Core Ultra 9 275HX ⎘ NVIDIA GeForce RTX 5080 Laptop ⎘ 64 GB Memory, 2048 GB SSD | Amazon: 1. $3,599.99 Lenovo ThinkPad P16 Gen 3 La... 2. $1,599.99 Lenovo ThinkPad E16 Gen 3 Bu... 3. $2,200.00 Lenovo ThinkPad P16s Gen 3 2... List Price: 4800€ | 2.6 kg | 29.8 mm | 16.00" 3200x2000 236 PPI OLED |
6. 91.6%  | Lenovo ThinkPad P1 Gen 8 Intel Core Ultra 7 255H ⎘ NVIDIA RTX PRO 2000 Blackwell Generation Laptop ⎘ 32 GB Memory, 1024 GB SSD | Amazon: List Price: 2000 USD | 1.9 kg | 20.6 mm | 16.00" 3200x2000 236 PPI Tandem OLED |
Transparency
The selection of devices to be reviewed is made by our editorial team. The test sample was provided to the author as a loan by the manufacturer or retailer for the purpose of this review. The lender had no influence on this review, nor did the manufacturer receive a copy of this review before publication. There was no obligation to publish this review. As an independent media company, Notebookcheck is not subjected to the authority of manufacturers, retailers or publishers.
This is how Notebookcheck is testing
Every year, Notebookcheck independently reviews hundreds of laptops and smartphones using standardized procedures to ensure that all results are comparable. We have continuously developed our test methods for around 20 years and set industry standards in the process. In our test labs, high-quality measuring equipment is utilized by experienced technicians and editors. These tests involve a multi-stage validation process. Our complex rating system is based on hundreds of well-founded measurements and benchmarks, which maintains objectivity. Further information on our test methods can be found here.
