
Verdict - Intel Arc G3 Extreme is a game changer
Intel's first dedicated gaming handheld chip is a success. The highlight is not only the high performance of the new Arc G3 Extreme and its Arc B390 iGPU, but the performance at lower wattages in combination with features like frame generation. Playing AAA-titles like Cyberpunk 2077 in 1200p with maximum details at ~90 fps with a battery runtime of almost four hours is a huge achievement.
The new MSI Claw 8 EX AI+ is also a good upgrade from its Lunar Lake powered predecessor. The new chassis is much more comfortable to hold and you get very good input devices, good speakers, two Thunderbolt 4 ports as well as a very fast microSD Express card reader. The 8-inch screen with 120 Hz is unchanged and is still great for gaming, but it cannot match the subjective image quality of OLED competitors like Lenovo's Legion Go 2. We also like MSI's software and the improved real-time monitoring options as well as the overhauled quick settings menu, which simply works very well with Xbox integration.
There are two major downsides though. MSI should really improve the fan behavior, because they are running all the time, even while idling. The biggest issue, however, is the price, because the new Claw 8 EX AI+ retails for $1799, which is a lot. You could buy a decent gaming laptop with the RTX 5060 for this money or even a 2025 model with the RTX 5070 if you are lucky. All in all, the new Claw 8 EX AI+ is impressive, we are not sure how many people are willing to spend this kind of money on a gaming handheld.
Pros
Cons
- $999.00msi Claw PC Gaming Handheld: Intel Ultra 7-258V, 8" FHD 120Hz Display, 32GB LPDDR5, 1TB NVMe SSD, MicroSD Card Reader, Thunderbolt 4, Win 11 Home: Black 8 AI+ A2VM-001US
- $15.19Spigen Tempered Glass Screen Protector [GlasTR Slim] designed for MSI Claw 8 Ai/MSI Claw A8 BZ2EM - 2 Pack
- $1,229.99EXCaliberPC [2025] MSI Claw 8 AI+ A2VM Polar Tempest Edition-084US (Intel Core Ultra 7 258V, 32GB LPDDR5X RAM, 1TB NVMe SSD, 8" FHD+ 120Hz, Windows 11) Gaming Handheld
Specifications
Case, Connectivity and Input Devices
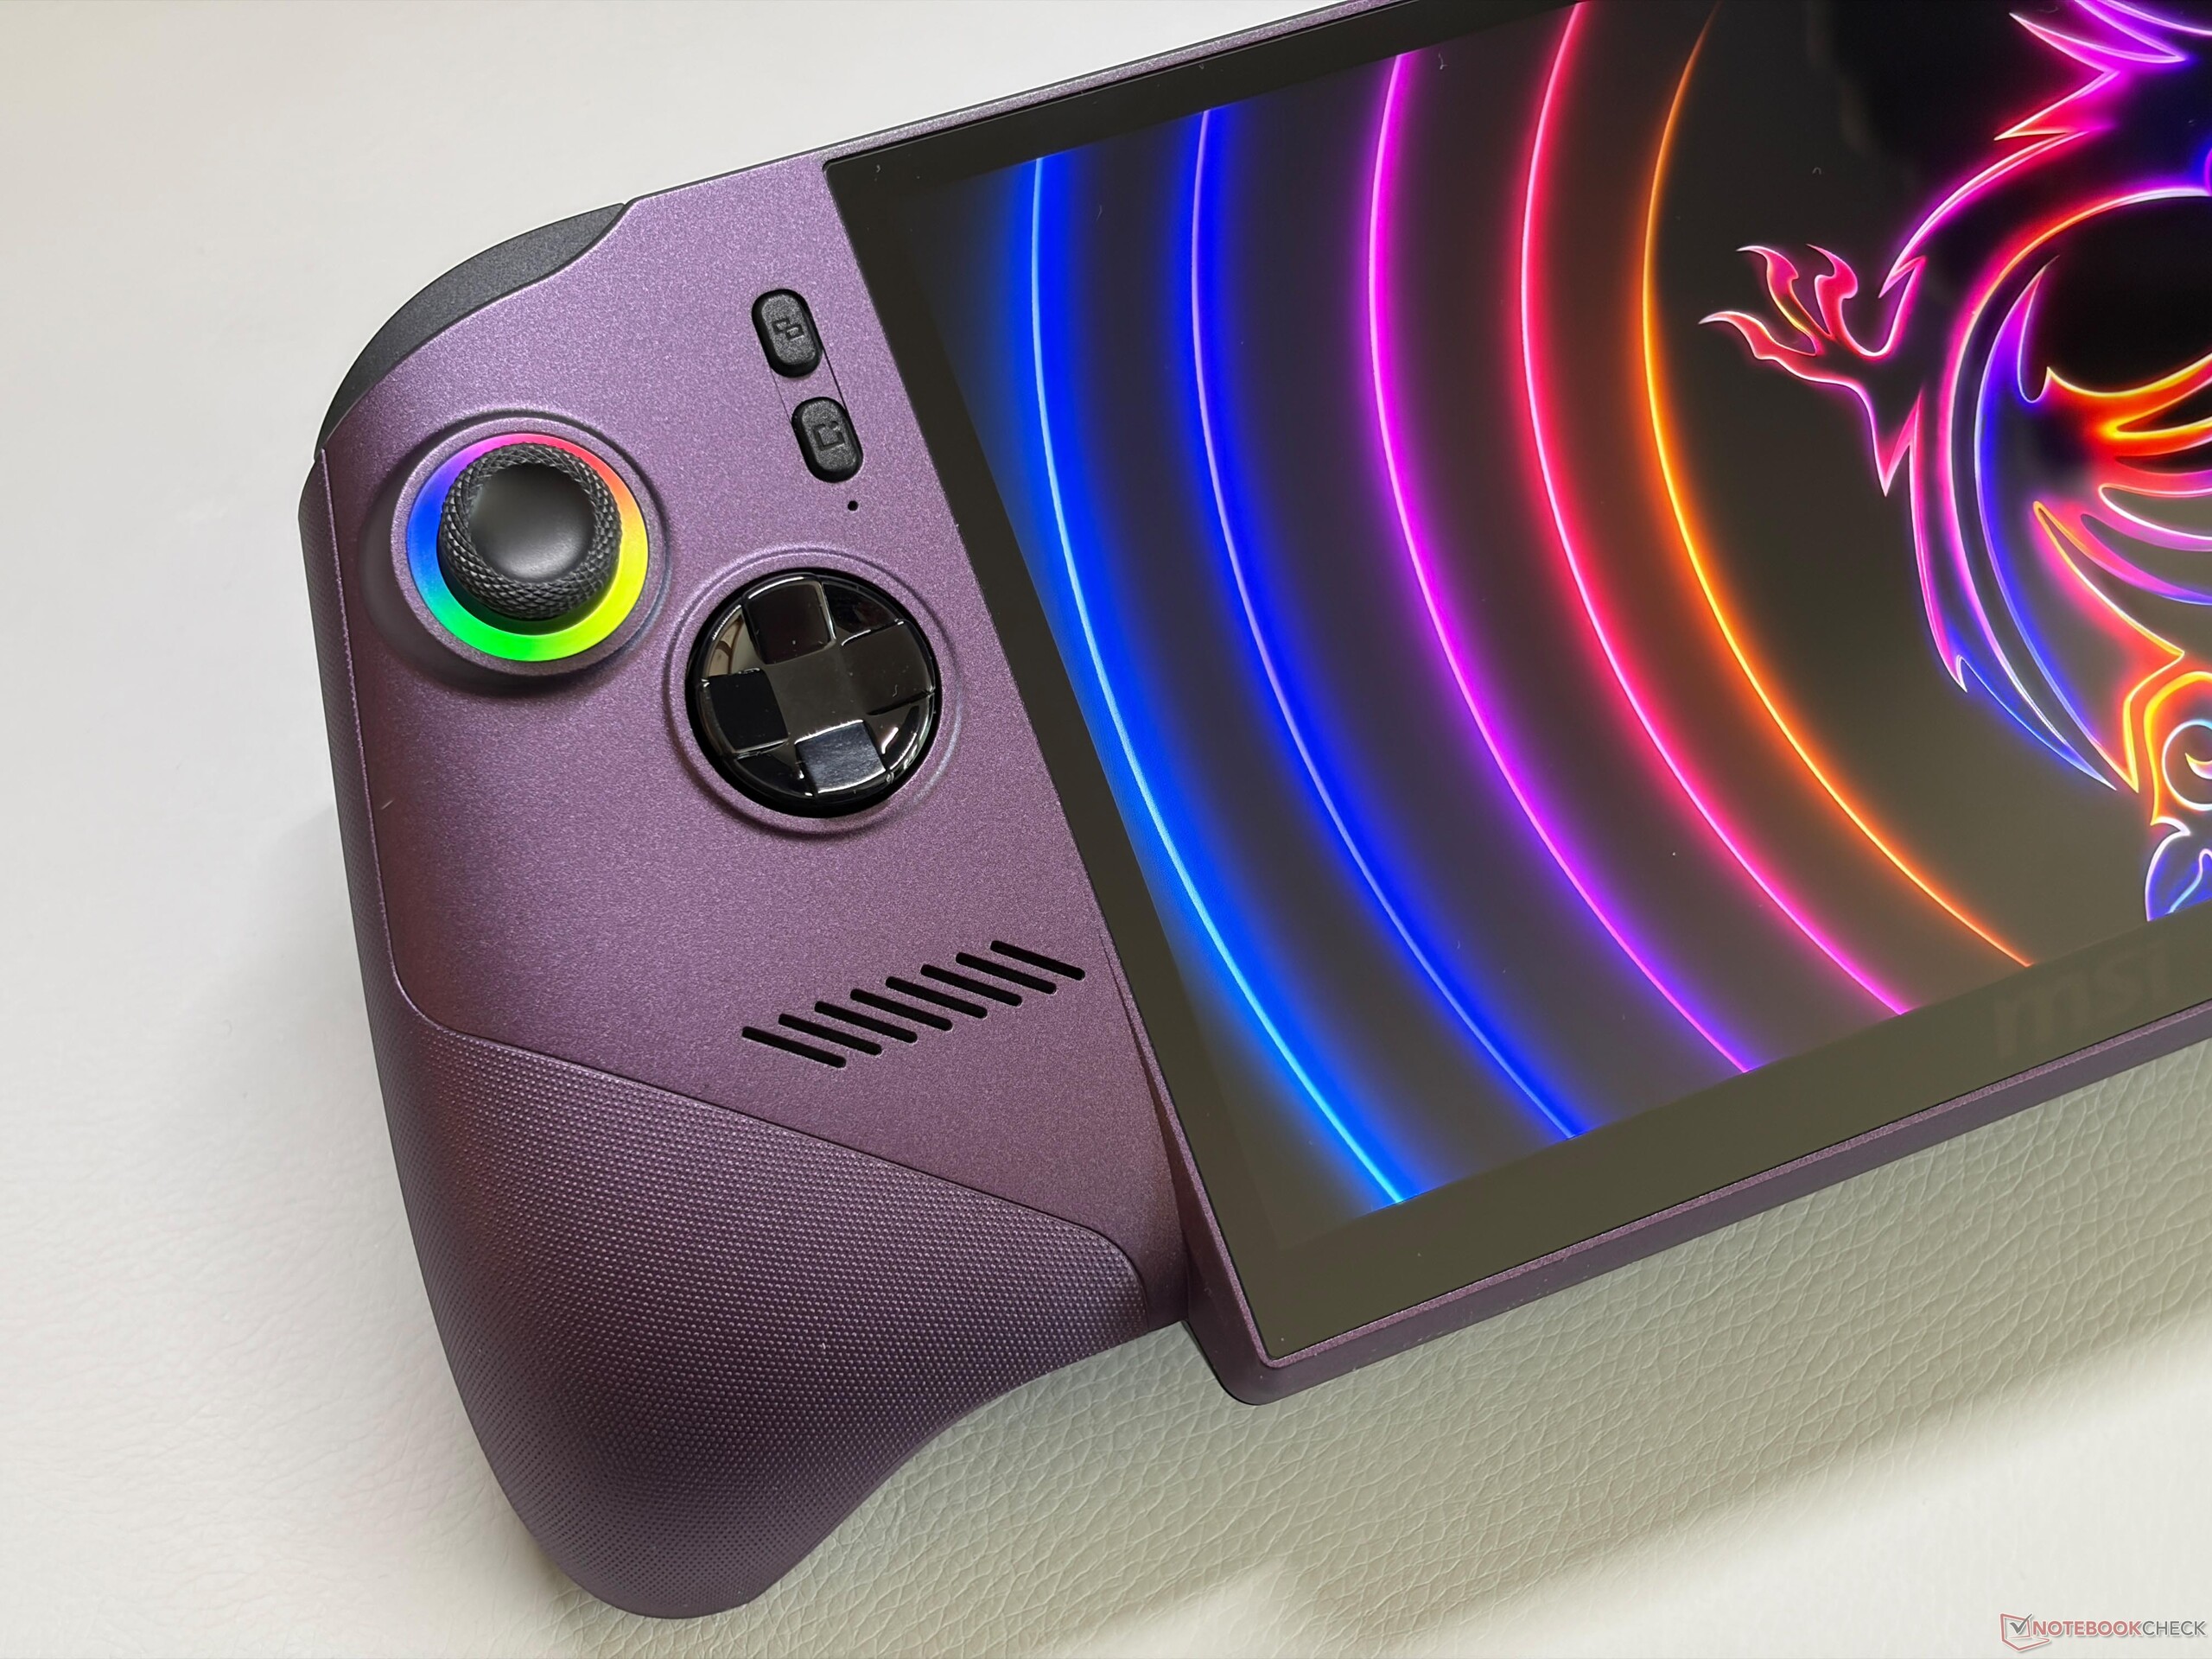
MSI completely redesigned the Claw 8 and now it looks much more like a controller with a large screen in the middle. The controller shape is not as extreme as on the Asus ROG Xbox Ally X, but it is noticeable and improves the comfort while gaming. Both the front of the controller ends as well as the back are also textured for better grip. MSI uses a dark violet color for the front of the new Claw and while it will not meet everybody's taste, we think it looks really good. The new chassis also offers a regular M.2-2280 slot (previously M.2-2230). The joysticks still feature RGB lighting and the buttons, triggers and joysticks once again offer very good feedback. MSI upgraded the vibration motors and the result is a more defined feedback, and you can feel the difference between different surfaces or running into ABS in Forza Horizon 6, for example.
Connectivity is solid with two Thunderbolt 4 ports, a very fast microSD-Express reader with transfer rates of more than 800 MB/s and Wi-Fi 7. However, the Wi-Fi 7 module only supports 160 MHz instead of 320 MHz, so the transfer rates are around 1.8-2.3 Gbps.


| SD Card Reader | |
| average JPG Copy Test (av. of 3 runs) | |
| MSI Claw 8 EX AI+ CG3EM (SanDisk microSD Express 256 GB) | |
| MSI Claw 8 AI+ (Angelbird AV Pro V60) | |
| MSI Claw A8 BZ2EM (Angelbird AV Pro V60) | |
| Lenovo Legion Go 2 (Angelbird AV Pro V60) | |
| Average of class Handheld / UMPC (32.9 - 569, n=11, last 2 years) | |
| Asus ROG Xbox Ally X (Angelbird AV Pro V60) | |
| GPD Pocket 4 (AV Pro SD microSD 128 GB V60) | |
| maximum AS SSD Seq Read Test (1GB) | |
| MSI Claw 8 EX AI+ CG3EM (SanDisk microSD Express 256 GB) | |
| Asus ROG Xbox Ally X (Angelbird AV Pro V60) | |
| Lenovo Legion Go 2 (Angelbird AV Pro V60) | |
| Average of class Handheld / UMPC (74.7 - 817, n=11, last 2 years) | |
| MSI Claw 8 AI+ (Angelbird AV Pro V60) | |
| MSI Claw A8 BZ2EM (Angelbird AV Pro V60) | |
| GPD Pocket 4 (AV Pro SD microSD 128 GB V60) | |
| Networking | |
| MSI Claw 8 EX AI+ CG3EM | |
| iperf3 transmit Wi-Fi6/7 RT-BE96U | |
| iperf3 receive Wi-Fi6/7 RT-BE96U | |
| Lenovo Legion Go 2 | |
| iperf3 receive AXE11000 | |
| iperf3 transmit AXE11000 | |
| Asus ROG Xbox Ally X | |
| iperf3 receive AXE11000 | |
| iperf3 transmit AXE11000 | |
| MSI Claw A8 BZ2EM | |
| iperf3 receive AXE11000 | |
| iperf3 transmit AXE11000 | |
| GPD Pocket 4 | |
| iperf3 receive AXE11000 6GHz | |
| iperf3 transmit AXE11000 6GHz | |
| iperf3 receive AXE11000 | |
| iperf3 transmit AXE11000 | |
| MSI Claw 8 AI+ | |
| iperf3 receive AXE11000 | |
| iperf3 transmit AXE11000 | |
Display - 8" IPS with 120 Hz & VRR

MSI still uses the same 8-inch touchscreen (1920 x 1200 pixels, 16:10) with 120 Hz and VRR support we know from the previous Claw 8 AI+. This means you get a very good image quality without any PWM flickering, but the response times and the overall image quality are not as good as on Lenovo's Legion Go 2 OLED screen. Bright images also reveal a slightly grainy image, but it is hardly noticeable at a normal viewing distance.
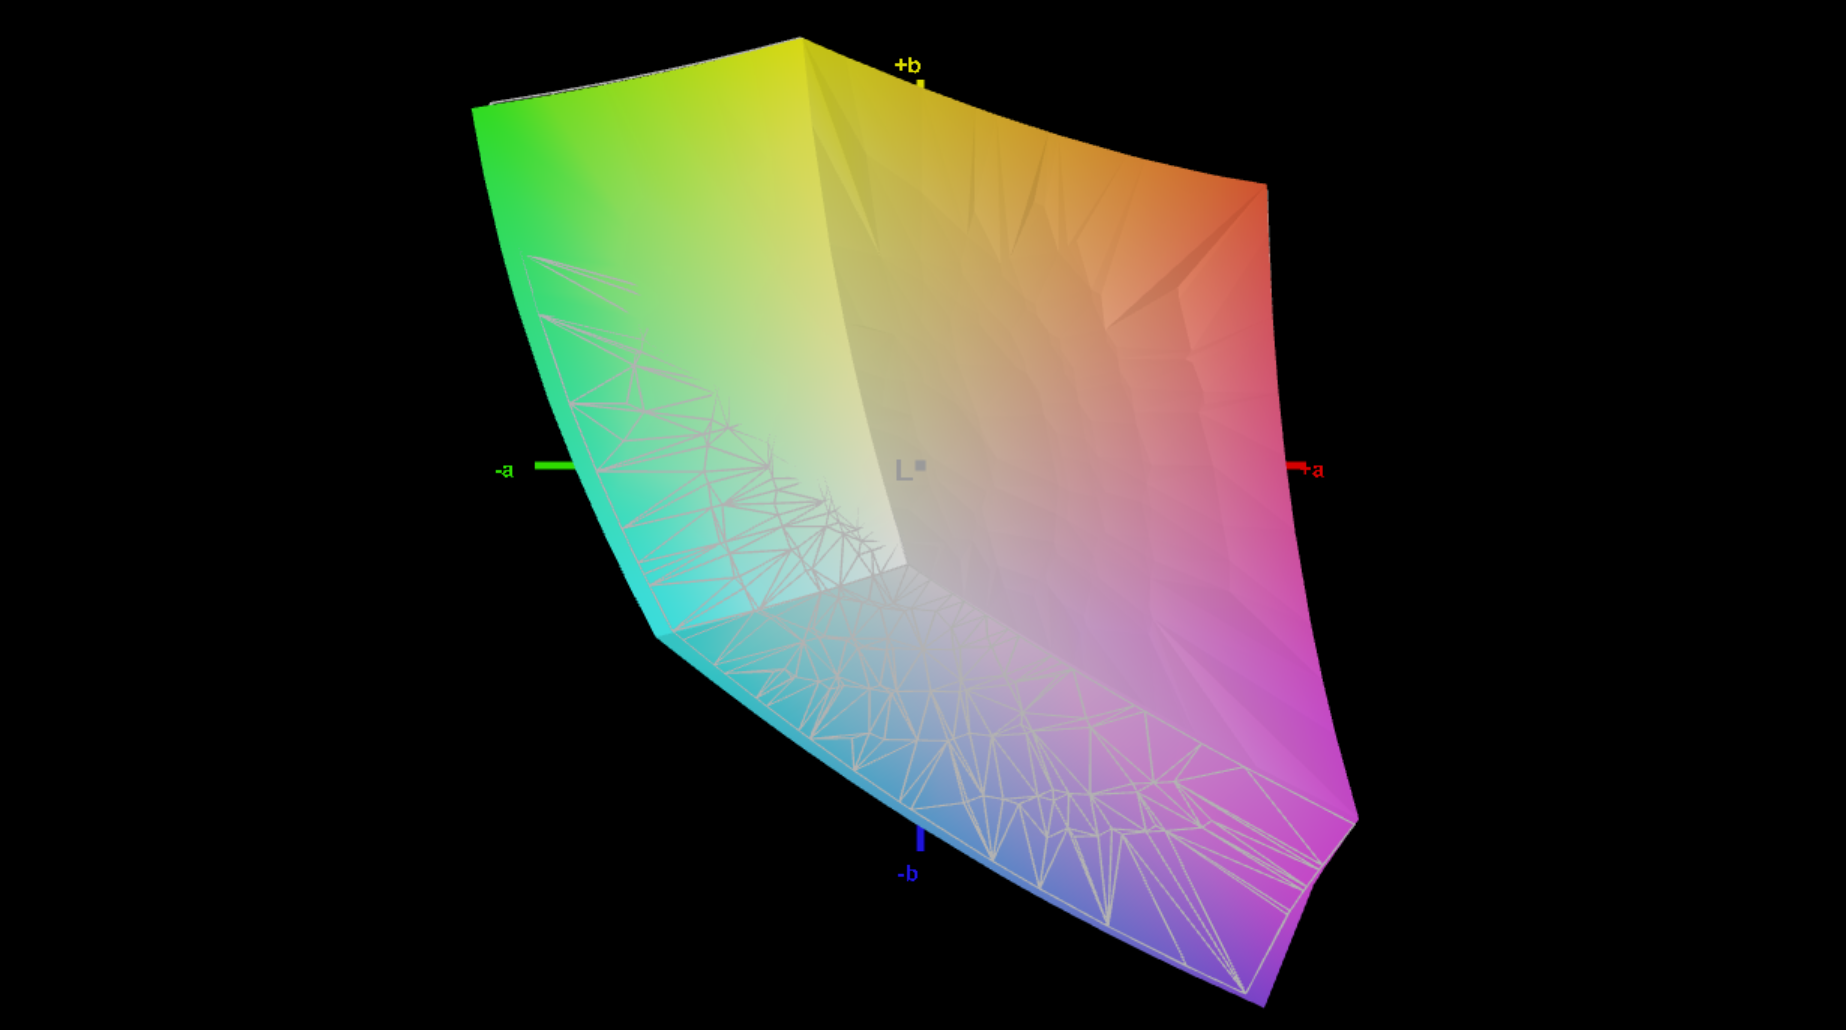
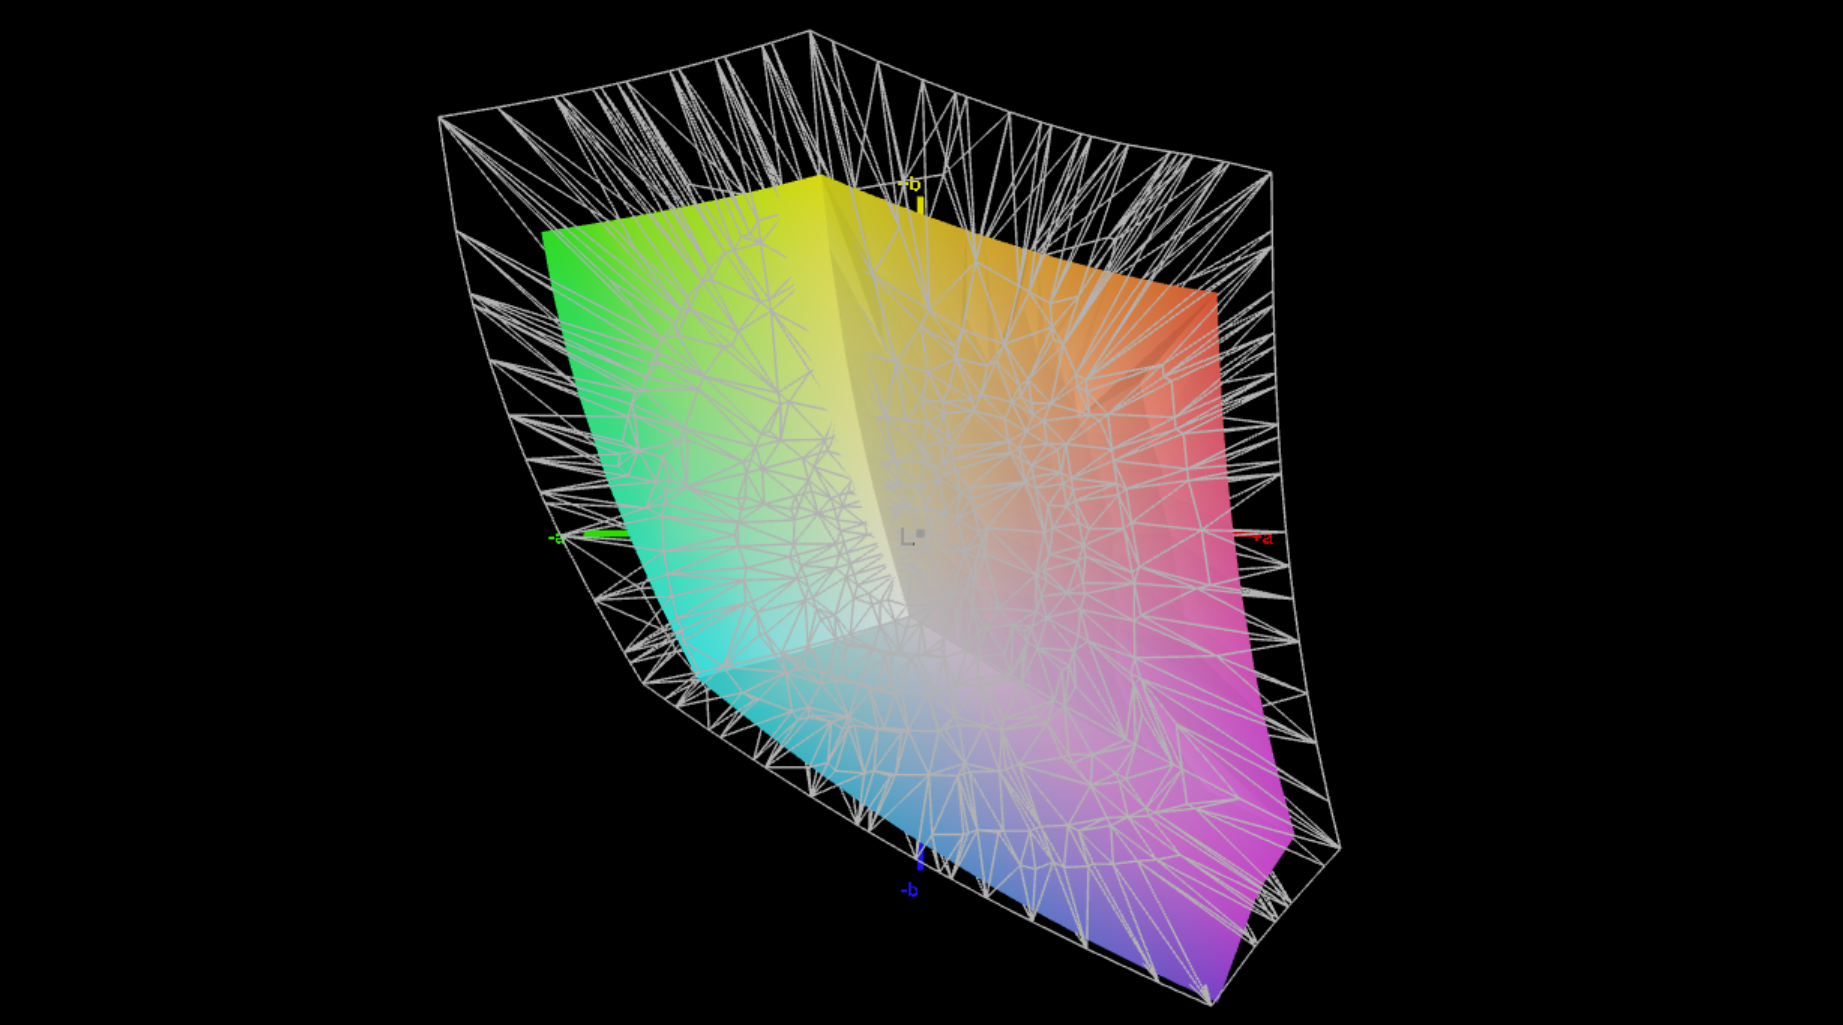
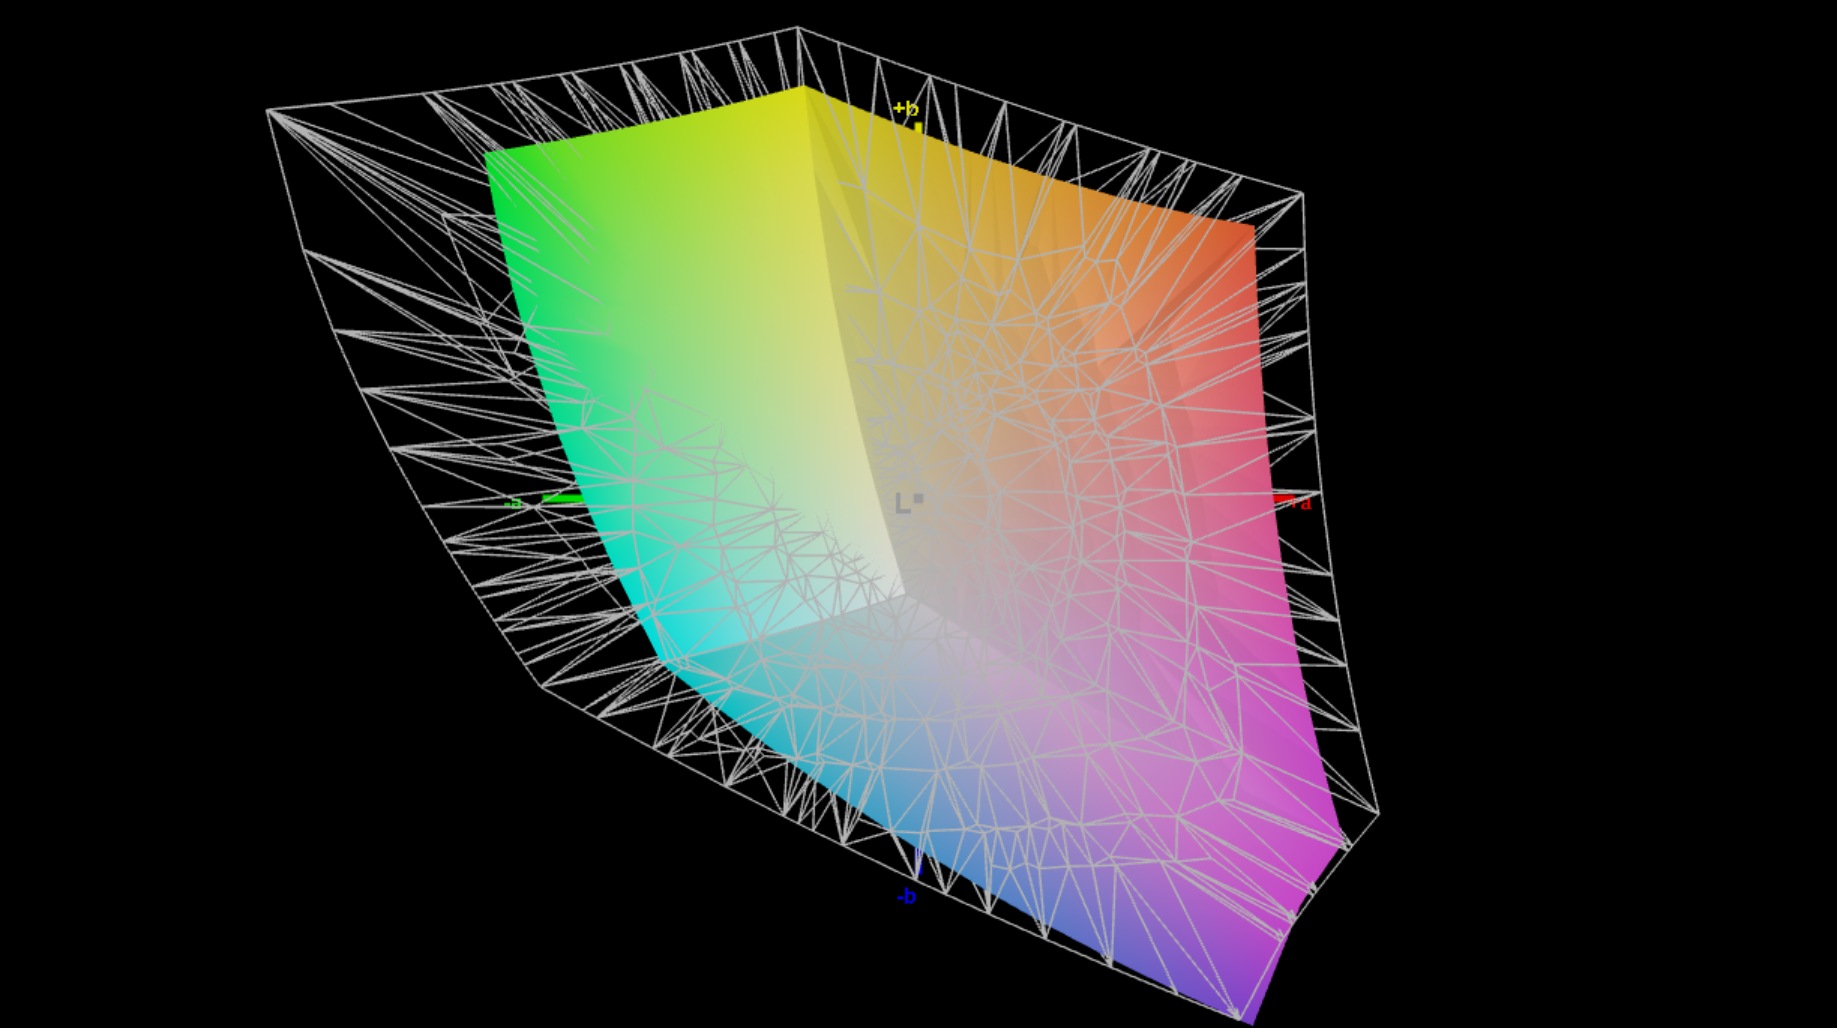
Our analysis with the professional CalMAN software do not reveal any surprises compared to the previous model. The maximum brightness is ~540 nits and the black value is still decent at 0.36, which results in a very good contrast ratio of ~1500:1. The factory calibration, however, reveals a visible blue cast in combination with a cool color temperature, which helps the maximum brightness. Our own calibration (download link in the box below) improves grayscale and color accuracy noticeably, even though it reduces the maximum brightness by around 40 nits.
| |||||||||||||||||||||||||
Brightness Distribution: 91 %
Center on Battery: 539 cd/m²
Contrast: 1497:1 (Black: 0.36 cd/m²)
ΔE ColorChecker Calman: 3.3 | ∀{0.5-29.43 Ø4.73}
calibrated: 1.2
ΔE Greyscale Calman: 5.3 | ∀{0.09-98 Ø4.97}
71.5% AdobeRGB 1998 (Argyll 3D)
99% sRGB (Argyll 3D)
69.4% Display P3 (Argyll 3D)
Gamma: 2.18
CCT: 7724 K
| MSI Claw 8 EX AI+ CG3EM PN8007QB1-2, , 1920x1200, 8", 120 Hz | Lenovo Legion Go 2 AMS881KB01-0, OLED, 1920x1200, 8.8", 144 Hz | Asus ROG Xbox Ally X TL070FVXS01_0, IPS, 1920x1080, 7", 120 Hz | MSI Claw A8 BZ2EM PN8007QB1-2, IPS, 1920x1200, 8", 120 Hz | GPD Pocket 4 YHB03P24, IPS, 2560x1600, 8.8", 144 Hz | MSI Claw 8 AI+ PN8007QB1-2, IPS, 1920x1200, 8", 120 Hz | |
|---|---|---|---|---|---|---|
| Display | 26% | -5% | 2% | 20% | 1% | |
| Display P3 Coverage (%) | 69.4 | 99.7 44% | 66 -5% | 71.1 2% | 92.7 34% | 71.1 2% |
| sRGB Coverage (%) | 99 | 100 1% | 93.1 -6% | 99.8 1% | 99.6 1% | 98.5 -1% |
| AdobeRGB 1998 Coverage (%) | 71.5 | 94.6 32% | 68.3 -4% | 73 2% | 90 26% | 72.9 2% |
| Response Times | 95% | 34% | -31% | -51% | -30% | |
| Response Time Grey 50% / Grey 80% * (ms) | 21 ? | 0.57 ? 97% | 11.4 ? 46% | 28.1 ? -34% | 27.9 ? -33% | 23.7 ? -13% |
| Response Time Black / White * (ms) | 10.2 ? | 0.7 ? 93% | 8 ? 22% | 13 ? -27% | 17.2 ? -69% | 14.9 ? -46% |
| PWM Frequency (Hz) | 720 ? | |||||
| PWM Amplitude * (%) | 30 | |||||
| Screen | 9% | -1% | 4% | -12% | -2% | |
| Brightness middle (cd/m²) | 539 | 488 -9% | 490 -9% | 540 0% | 511.2 -5% | 524 -3% |
| Brightness (cd/m²) | 527 | 493 -6% | 459 -13% | 530 1% | 524 -1% | 514 -2% |
| Brightness Distribution (%) | 91 | 98 8% | 86 -5% | 90 -1% | 84 -8% | 93 2% |
| Black Level * (cd/m²) | 0.36 | 0.33 8% | 0.34 6% | 0.4 -11% | 0.33 8% | |
| Contrast (:1) | 1497 | 1485 -1% | 1588 6% | 1278 -15% | 1588 6% | |
| Colorchecker dE 2000 * | 3.3 | 2.5 24% | 2.8 15% | 2.9 12% | 4.54 -38% | 3.5 -6% |
| Colorchecker dE 2000 max. * | 6.8 | 4.9 28% | 6.5 4% | 6.1 10% | 8.96 -32% | 7.3 -7% |
| Colorchecker dE 2000 calibrated * | 1.2 | 1.4 -17% | 1.5 -25% | 1.3 -8% | 0.95 21% | 1.3 -8% |
| Greyscale dE 2000 * | 5.3 | 3.3 38% | 4.2 21% | 4.7 11% | 6.4 -21% | 5.9 -11% |
| Gamma | 2.18 101% | 2.18 101% | 2.22 99% | 2.18 101% | 2.26 97% | 2.22 99% |
| CCT | 7724 84% | 6459 101% | 7381 88% | 7507 87% | 8125 80% | 7852 83% |
| Total Average (Program / Settings) | 43% /
28% | 9% /
3% | -8% /
-1% | -14% /
-11% | -10% /
-6% |
* ... smaller is better


Display Response Times
| ↔ Response Time Black to White | ||
|---|---|---|
| 10.2 ms ... rise ↗ and fall ↘ combined | ↗ 4.1 ms rise | 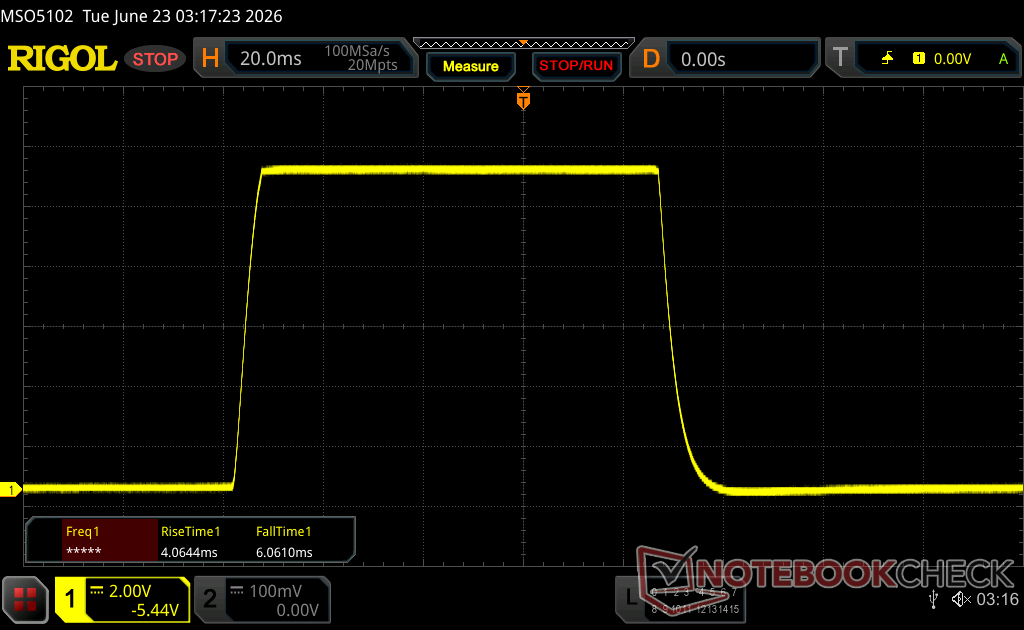 |
| ↘ 6.1 ms fall | ||
| The screen shows good response rates in our tests, but may be too slow for competitive gamers. In comparison, all tested devices range from 0.1 (minimum) to 240 (maximum) ms. » 28 % of all devices are better. This means that the measured response time is better than the average of all tested devices (19.9 ms). | ||
| ↔ Response Time 50% Grey to 80% Grey | ||
| 21 ms ... rise ↗ and fall ↘ combined | ↗ 9.4 ms rise | 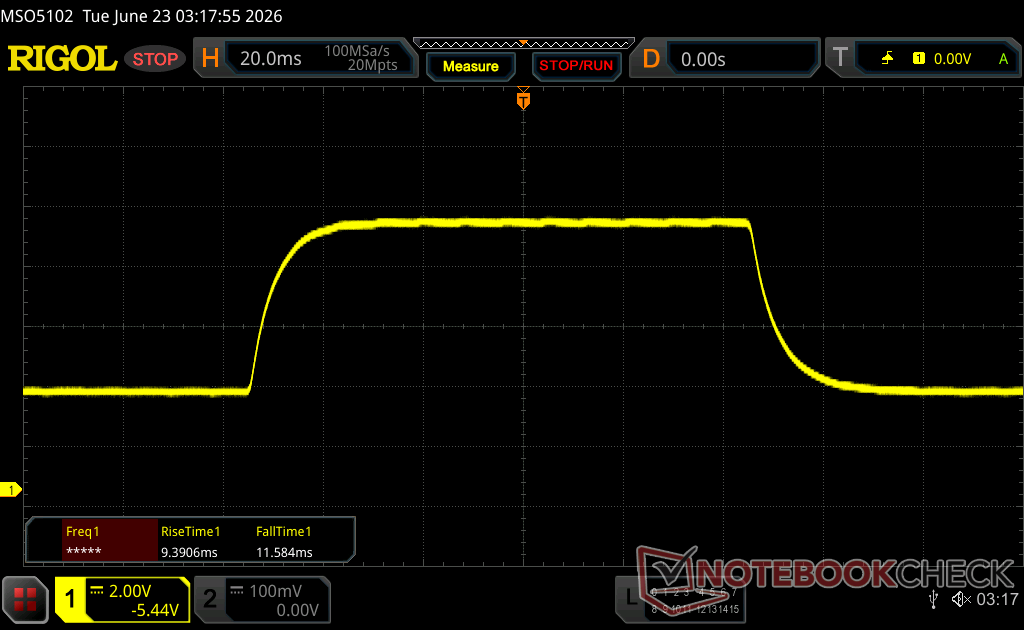 |
| ↘ 11.6 ms fall | ||
| The screen shows good response rates in our tests, but may be too slow for competitive gamers. In comparison, all tested devices range from 0.165 (minimum) to 636 (maximum) ms. » 33 % of all devices are better. This means that the measured response time is better than the average of all tested devices (31.1 ms). | ||
Screen Flickering / PWM (Pulse-Width Modulation)
| Screen flickering / PWM not detected | 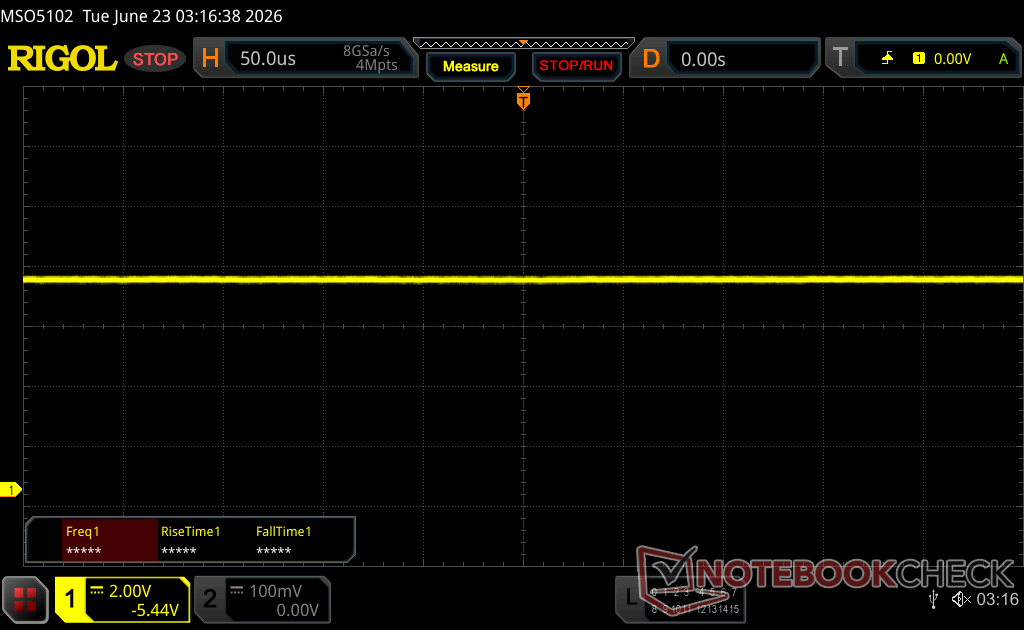 | ||
In comparison: 52 % of all tested devices do not use PWM to dim the display. If PWM was detected, an average of 7794 (minimum: 5 - maximum: 343500) Hz was measured. | |||


Performance - Arc G3 Extreme & Arc B390


Testing Conditions

MSI's Center M software still offers three different power profiles (AI Engine, Endurance, Manual), but the Manual mode now offers configurable TDP values that can also be switched via quick settings (see image on the right). This is very handy and an improvement over the previous unit. We used the AI Engine mode for our benchmarks, which is also the default setting. The TDP is up to 37 Watts and then stabilizes at 25 Watts. The Manual mode can be configured up to 45/35 Watts. The two Intel features Endurance Gaming and Multi Frame Generation (more on that later) currently have to be activated via Intel Graphics software, but they will be accessible via quick settings soon. There are also improved real-time monitoring options.
Processor Performance
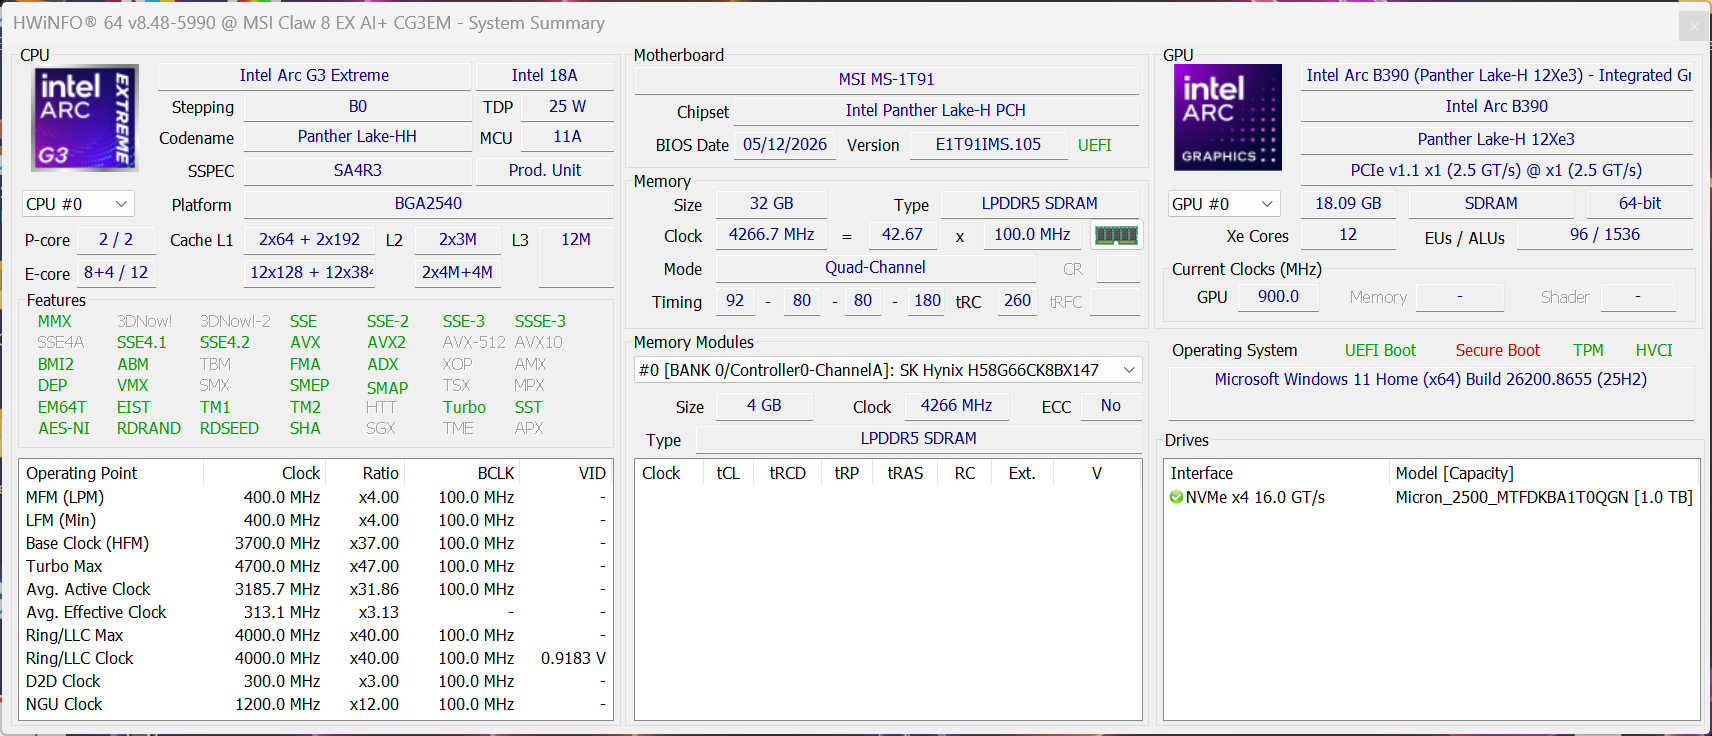
Intel's Arc G3 Extreme is a dedicated handheld processor based on the current Panther Lake architecture. Compared to laptop chips, it only offers two P-cores (total of 14 cores), so the raw CPU performance is a bit lower. There are other changes like a reduced number of display outputs, for example, but this is hardly relevant for a gaming handheld. In terms of raw CPU performance, the results are fine and also completely sufficient if you want to use the Claw as your daily PC connected to a docking station, for example.
Cinebench R15 Multi Loop
Cinebench 2024: CPU Multi Core | CPU Single Core
Cinebench R23: Multi Core | Single Core
Cinebench R20: CPU (Multi Core) | CPU (Single Core)
Cinebench R15: CPU Multi 64Bit | CPU Single 64Bit
Blender: v2.79 BMW27 CPU
7-Zip 18.03: 7z b 4 | 7z b 4 -mmt1
Geekbench 6.7: Multi-Core | Single-Core
Geekbench 5.5: Multi-Core | Single-Core
HWBOT x265 Benchmark v2.2: 4k Preset
LibreOffice : 20 Documents To PDF
R Benchmark 2.5: Overall mean
| CPU Performance rating | |
| GPD Pocket 4 | |
| Asus ROG Xbox Ally X | |
| MSI Claw 8 EX AI+ CG3EM -2! | |
| Average Intel Arc G3 Extreme -2! | |
| Lenovo Legion Go 2 | |
| MSI Claw 8 AI+ | |
| MSI Claw A8 BZ2EM | |
| Average of class Handheld / UMPC | |
| Cinebench 2024 / CPU Multi Core | |
| GPD Pocket 4 | |
| Asus ROG Xbox Ally X | |
| Lenovo Legion Go 2 | |
| Average of class Handheld / UMPC (575 - 956, n=6, last 2 years) | |
| MSI Claw A8 BZ2EM | |
| MSI Claw 8 AI+ | |
| Cinebench 2024 / CPU Single Core | |
| MSI Claw 8 AI+ | |
| GPD Pocket 4 | |
| Lenovo Legion Go 2 | |
| Asus ROG Xbox Ally X | |
| Average of class Handheld / UMPC (99.2 - 120, n=6, last 2 years) | |
| MSI Claw A8 BZ2EM | |
| Cinebench R23 / Multi Core | |
| GPD Pocket 4 | |
| MSI Claw 8 EX AI+ CG3EM | |
| Average Intel Arc G3 Extreme (n=1) | |
| Asus ROG Xbox Ally X | |
| Lenovo Legion Go 2 | |
| Average of class Handheld / UMPC (4953 - 16841, n=15, last 2 years) | |
| MSI Claw A8 BZ2EM | |
| MSI Claw 8 AI+ | |
| Cinebench R23 / Single Core | |
| GPD Pocket 4 | |
| MSI Claw A8 BZ2EM | |
| Lenovo Legion Go 2 | |
| Asus ROG Xbox Ally X | |
| MSI Claw 8 EX AI+ CG3EM | |
| Average Intel Arc G3 Extreme (n=1) | |
| MSI Claw 8 AI+ | |
| Average of class Handheld / UMPC (1071 - 2006, n=15, last 2 years) | |
| Cinebench R20 / CPU (Multi Core) | |
| GPD Pocket 4 | |
| Asus ROG Xbox Ally X | |
| MSI Claw 8 EX AI+ CG3EM | |
| Average Intel Arc G3 Extreme (n=1) | |
| Lenovo Legion Go 2 | |
| Average of class Handheld / UMPC (1904 - 6577, n=13, last 2 years) | |
| MSI Claw A8 BZ2EM | |
| MSI Claw 8 AI+ | |
| Cinebench R20 / CPU (Single Core) | |
| GPD Pocket 4 | |
| MSI Claw A8 BZ2EM | |
| Lenovo Legion Go 2 | |
| Asus ROG Xbox Ally X | |
| MSI Claw 8 EX AI+ CG3EM | |
| Average Intel Arc G3 Extreme (n=1) | |
| MSI Claw 8 AI+ | |
| Average of class Handheld / UMPC (390 - 787, n=13, last 2 years) | |
| Cinebench R15 / CPU Multi 64Bit | |
| GPD Pocket 4 | |
| Asus ROG Xbox Ally X | |
| MSI Claw 8 EX AI+ CG3EM | |
| Average Intel Arc G3 Extreme (n=1) | |
| MSI Claw A8 BZ2EM | |
| Lenovo Legion Go 2 | |
| Average of class Handheld / UMPC (855 - 2533, n=13, last 2 years) | |
| MSI Claw 8 AI+ | |
| Cinebench R15 / CPU Single 64Bit | |
| GPD Pocket 4 | |
| MSI Claw 8 AI+ | |
| Asus ROG Xbox Ally X | |
| MSI Claw 8 EX AI+ CG3EM | |
| Average Intel Arc G3 Extreme (n=1) | |
| Lenovo Legion Go 2 | |
| Average of class Handheld / UMPC (155.1 - 304, n=13, last 2 years) | |
| MSI Claw A8 BZ2EM | |
| Blender / v2.79 BMW27 CPU | |
| MSI Claw 8 AI+ | |
| Average of class Handheld / UMPC (189 - 588, n=13, last 2 years) | |
| MSI Claw A8 BZ2EM | |
| Lenovo Legion Go 2 | |
| MSI Claw 8 EX AI+ CG3EM | |
| Average Intel Arc G3 Extreme (n=1) | |
| Asus ROG Xbox Ally X | |
| GPD Pocket 4 | |
| 7-Zip 18.03 / 7z b 4 | |
| GPD Pocket 4 | |
| Asus ROG Xbox Ally X | |
| MSI Claw 8 EX AI+ CG3EM | |
| Average Intel Arc G3 Extreme (n=1) | |
| Lenovo Legion Go 2 | |
| Average of class Handheld / UMPC (23417 - 66618, n=12, last 2 years) | |
| MSI Claw A8 BZ2EM | |
| MSI Claw 8 AI+ | |
| 7-Zip 18.03 / 7z b 4 -mmt1 | |
| GPD Pocket 4 | |
| MSI Claw 8 EX AI+ CG3EM | |
| Average Intel Arc G3 Extreme (n=1) | |
| MSI Claw 8 AI+ | |
| Lenovo Legion Go 2 | |
| Asus ROG Xbox Ally X | |
| MSI Claw A8 BZ2EM | |
| Average of class Handheld / UMPC (3675 - 6143, n=13, last 2 years) | |
| Geekbench 6.7 / Multi-Core | |
| GPD Pocket 4 | |
| MSI Claw 8 EX AI+ CG3EM | |
| Average Intel Arc G3 Extreme (n=1) | |
| Asus ROG Xbox Ally X | |
| Lenovo Legion Go 2 | |
| MSI Claw A8 BZ2EM | |
| MSI Claw 8 AI+ | |
| Average of class Handheld / UMPC (3950 - 13426, n=14, last 2 years) | |
| Geekbench 6.7 / Single-Core | |
| GPD Pocket 4 | |
| Asus ROG Xbox Ally X | |
| Lenovo Legion Go 2 | |
| MSI Claw 8 AI+ | |
| MSI Claw 8 EX AI+ CG3EM | |
| Average Intel Arc G3 Extreme (n=1) | |
| Average of class Handheld / UMPC (1333 - 2904, n=14, last 2 years) | |
| MSI Claw A8 BZ2EM | |
| Geekbench 5.5 / Multi-Core | |
| MSI Claw 8 EX AI+ CG3EM | |
| Average Intel Arc G3 Extreme (n=1) | |
| GPD Pocket 4 | |
| Asus ROG Xbox Ally X | |
| MSI Claw A8 BZ2EM | |
| Lenovo Legion Go 2 | |
| MSI Claw 8 AI+ | |
| Average of class Handheld / UMPC (3932 - 13086, n=14, last 2 years) | |
| Geekbench 5.5 / Single-Core | |
| GPD Pocket 4 | |
| Asus ROG Xbox Ally X | |
| Lenovo Legion Go 2 | |
| MSI Claw 8 AI+ | |
| MSI Claw 8 EX AI+ CG3EM | |
| Average Intel Arc G3 Extreme (n=1) | |
| Average of class Handheld / UMPC (875 - 2134, n=14, last 2 years) | |
| MSI Claw A8 BZ2EM | |
| HWBOT x265 Benchmark v2.2 / 4k Preset | |
| GPD Pocket 4 | |
| Asus ROG Xbox Ally X | |
| Lenovo Legion Go 2 | |
| MSI Claw 8 EX AI+ CG3EM | |
| Average Intel Arc G3 Extreme (n=1) | |
| Average of class Handheld / UMPC (6.21 - 20.8, n=13, last 2 years) | |
| MSI Claw A8 BZ2EM | |
| MSI Claw 8 AI+ | |
| LibreOffice / 20 Documents To PDF | |
| Asus ROG Xbox Ally X | |
| Average of class Handheld / UMPC (41.1 - 92.8, n=13, last 2 years) | |
| MSI Claw 8 EX AI+ CG3EM | |
| Average Intel Arc G3 Extreme (n=1) | |
| MSI Claw A8 BZ2EM | |
| Lenovo Legion Go 2 | |
| GPD Pocket 4 | |
| MSI Claw 8 AI+ | |
| R Benchmark 2.5 / Overall mean | |
| Average of class Handheld / UMPC (0.4167 - 0.756, n=13, last 2 years) | |
| MSI Claw 8 EX AI+ CG3EM | |
| Average Intel Arc G3 Extreme (n=1) | |
| Asus ROG Xbox Ally X | |
| MSI Claw 8 AI+ | |
| MSI Claw A8 BZ2EM | |
| Lenovo Legion Go 2 | |
| GPD Pocket 4 | |
* ... smaller is better
AIDA64: FP32 Ray-Trace | FPU Julia | CPU SHA3 | CPU Queen | FPU SinJulia | FPU Mandel | CPU AES | CPU ZLib | FP64 Ray-Trace | CPU PhotoWorxx | CPU CheckMate
| Performance rating | |
| GPD Pocket 4 -1! | |
| Asus ROG Xbox Ally X -1! | |
| Lenovo Legion Go 2 -1! | |
| Average of class Handheld / UMPC | |
| MSI Claw A8 BZ2EM -2! | |
| MSI Claw 8 EX AI+ CG3EM -1! | |
| Average Intel Arc G3 Extreme -1! | |
| MSI Claw 8 AI+ -1! | |
| AIDA64 / FP32 Ray-Trace | |
| GPD Pocket 4 (v6.92.6600) | |
| Asus ROG Xbox Ally X (v6.92.6600) | |
| Lenovo Legion Go 2 (v6.92.6600) | |
| MSI Claw A8 BZ2EM (v6.92.6600) | |
| Average of class Handheld / UMPC (6544 - 26450, n=13, last 2 years) | |
| MSI Claw 8 AI+ (v6.92.6600) | |
| MSI Claw 8 EX AI+ CG3EM (v8.20.8100) | |
| Average Intel Arc G3 Extreme (n=1) | |
| AIDA64 / FPU Julia | |
| GPD Pocket 4 (v6.92.6600) | |
| Asus ROG Xbox Ally X (v6.92.6600) | |
| Lenovo Legion Go 2 (v6.92.6600) | |
| Average of class Handheld / UMPC (36464 - 103637, n=13, last 2 years) | |
| MSI Claw A8 BZ2EM (v6.92.6600) | |
| MSI Claw 8 AI+ (v6.92.6600) | |
| MSI Claw 8 EX AI+ CG3EM (v8.20.8100) | |
| Average Intel Arc G3 Extreme (n=1) | |
| AIDA64 / CPU SHA3 | |
| GPD Pocket 4 (v6.92.6600) | |
| Asus ROG Xbox Ally X (v6.92.6600) | |
| Lenovo Legion Go 2 (v6.92.6600) | |
| Average of class Handheld / UMPC (1157 - 4484, n=13, last 2 years) | |
| MSI Claw 8 EX AI+ CG3EM (v8.20.8100) | |
| Average Intel Arc G3 Extreme (n=1) | |
| MSI Claw A8 BZ2EM (v6.92.6600) | |
| MSI Claw 8 AI+ (v6.92.6600) | |
| AIDA64 / CPU Queen | |
| GPD Pocket 4 (v6.92.6600) | |
| MSI Claw A8 BZ2EM (v6.92.6600) | |
| Asus ROG Xbox Ally X (v6.92.6600) | |
| Lenovo Legion Go 2 (v6.92.6600) | |
| Average of class Handheld / UMPC (41744 - 107867, n=12, last 2 years) | |
| MSI Claw 8 AI+ (v6.92.6600) | |
| AIDA64 / FPU SinJulia | |
| GPD Pocket 4 (v6.92.6600) | |
| Asus ROG Xbox Ally X (v6.92.6600) | |
| Lenovo Legion Go 2 (v6.92.6600) | |
| MSI Claw A8 BZ2EM (v6.92.6600) | |
| Average of class Handheld / UMPC (4023 - 16980, n=13, last 2 years) | |
| MSI Claw 8 AI+ (v6.92.6600) | |
| MSI Claw 8 EX AI+ CG3EM (v8.20.8100) | |
| Average Intel Arc G3 Extreme (n=1) | |
| AIDA64 / FPU Mandel | |
| GPD Pocket 4 (v6.92.6600) | |
| Asus ROG Xbox Ally X (v6.92.6600) | |
| Lenovo Legion Go 2 (v6.92.6600) | |
| Average of class Handheld / UMPC (19153 - 55457, n=13, last 2 years) | |
| MSI Claw A8 BZ2EM (v6.92.6600) | |
| MSI Claw 8 AI+ (v6.92.6600) | |
| MSI Claw 8 EX AI+ CG3EM (v8.20.8100) | |
| Average Intel Arc G3 Extreme (n=1) | |
| AIDA64 / CPU AES | |
| Asus ROG Xbox Ally X (v6.92.6600) | |
| Lenovo Legion Go 2 (v6.92.6600) | |
| GPD Pocket 4 (v6.92.6600) | |
| Average of class Handheld / UMPC (18552 - 119040, n=12, last 2 years) | |
| MSI Claw 8 EX AI+ CG3EM (v8.20.8100) | |
| Average Intel Arc G3 Extreme (n=1) | |
| MSI Claw 8 AI+ (v6.92.6600) | |
| AIDA64 / CPU ZLib | |
| GPD Pocket 4 (v6.92.6600) | |
| Asus ROG Xbox Ally X (v6.92.6600) | |
| Lenovo Legion Go 2 (v6.92.6600) | |
| Average of class Handheld / UMPC (356 - 1112, n=13, last 2 years) | |
| MSI Claw 8 EX AI+ CG3EM (v8.20.8100) | |
| Average Intel Arc G3 Extreme (n=1) | |
| MSI Claw A8 BZ2EM (v6.92.6600) | |
| MSI Claw 8 AI+ (v6.92.6600) | |
| AIDA64 / FP64 Ray-Trace | |
| GPD Pocket 4 (v6.92.6600) | |
| Asus ROG Xbox Ally X (v6.92.6600) | |
| Lenovo Legion Go 2 (v6.92.6600) | |
| MSI Claw A8 BZ2EM (v6.92.6600) | |
| Average of class Handheld / UMPC (3585 - 14181, n=13, last 2 years) | |
| MSI Claw 8 AI+ (v6.92.6600) | |
| MSI Claw 8 EX AI+ CG3EM (v8.20.8100) | |
| Average Intel Arc G3 Extreme (n=1) | |
| AIDA64 / CPU PhotoWorxx | |
| MSI Claw 8 EX AI+ CG3EM (v8.20.8100) | |
| Average Intel Arc G3 Extreme (n=1) | |
| MSI Claw 8 AI+ (v6.92.6600) | |
| Asus ROG Xbox Ally X (v6.92.6600) | |
| Lenovo Legion Go 2 (v6.92.6600) | |
| MSI Claw A8 BZ2EM (v6.92.6600) | |
| GPD Pocket 4 (v6.92.6600) | |
| Average of class Handheld / UMPC (19472 - 59897, n=13, last 2 years) | |
| AIDA64 / CPU CheckMate | |
| MSI Claw 8 EX AI+ CG3EM (v8.20.8100) | |
| Average Intel Arc G3 Extreme (n=1) | |
| Average of class Handheld / UMPC (n=1last 2 years) | |
System and Storage Devices
The Claw 8 EX Ai+ is a snappy system and once everything is set up, Windows also works well via touchscreen in the new Xbox mode. We did not experience any stability issues during our tests. The SSD performance (Micron 2500 1 TB, 887 GB free) is very good and stable.
PCMark 10: Score | Essentials | Productivity | Digital Content Creation
CrossMark: Overall | Productivity | Creativity | Responsiveness
WebXPRT 3: Overall
WebXPRT 4: Overall
Mozilla Kraken 1.1: Total
| Performance rating | |
| MSI Claw 8 EX AI+ CG3EM | |
| Average Intel Arc G3 Extreme, Intel Arc B390 12 Xe3 Panther Lake iGPU | |
| GPD Pocket 4 | |
| Lenovo Legion Go 2 | |
| MSI Claw 8 AI+ | |
| Asus ROG Xbox Ally X | |
| MSI Claw A8 BZ2EM | |
| Average of class Handheld / UMPC | |
| PCMark 10 / Score | |
| MSI Claw 8 EX AI+ CG3EM | |
| Average Intel Arc G3 Extreme, Intel Arc B390 12 Xe3 Panther Lake iGPU (n=1) | |
| MSI Claw A8 BZ2EM | |
| Lenovo Legion Go 2 | |
| GPD Pocket 4 | |
| MSI Claw 8 AI+ | |
| Asus ROG Xbox Ally X | |
| Average of class Handheld / UMPC (3592 - 9701, n=13, last 2 years) | |
| PCMark 10 / Essentials | |
| GPD Pocket 4 | |
| MSI Claw 8 AI+ | |
| MSI Claw A8 BZ2EM | |
| Lenovo Legion Go 2 | |
| Asus ROG Xbox Ally X | |
| MSI Claw 8 EX AI+ CG3EM | |
| Average Intel Arc G3 Extreme, Intel Arc B390 12 Xe3 Panther Lake iGPU (n=1) | |
| Average of class Handheld / UMPC (7542 - 11262, n=13, last 2 years) | |
| PCMark 10 / Productivity | |
| MSI Claw 8 EX AI+ CG3EM | |
| Average Intel Arc G3 Extreme, Intel Arc B390 12 Xe3 Panther Lake iGPU (n=1) | |
| MSI Claw A8 BZ2EM | |
| Lenovo Legion Go 2 | |
| Average of class Handheld / UMPC (5015 - 19236, n=13, last 2 years) | |
| GPD Pocket 4 | |
| Asus ROG Xbox Ally X | |
| MSI Claw 8 AI+ | |
| PCMark 10 / Digital Content Creation | |
| MSI Claw 8 EX AI+ CG3EM | |
| Average Intel Arc G3 Extreme, Intel Arc B390 12 Xe3 Panther Lake iGPU (n=1) | |
| MSI Claw 8 AI+ | |
| GPD Pocket 4 | |
| Asus ROG Xbox Ally X | |
| Lenovo Legion Go 2 | |
| MSI Claw A8 BZ2EM | |
| Average of class Handheld / UMPC (3326 - 12612, n=13, last 2 years) | |
| CrossMark / Overall | |
| MSI Claw 8 EX AI+ CG3EM | |
| Average Intel Arc G3 Extreme, Intel Arc B390 12 Xe3 Panther Lake iGPU (n=1) | |
| GPD Pocket 4 | |
| MSI Claw 8 AI+ | |
| Lenovo Legion Go 2 | |
| MSI Claw A8 BZ2EM | |
| Average of class Handheld / UMPC (865 - 1881, n=12, last 2 years) | |
| Asus ROG Xbox Ally X | |
| CrossMark / Productivity | |
| GPD Pocket 4 | |
| MSI Claw 8 EX AI+ CG3EM | |
| Average Intel Arc G3 Extreme, Intel Arc B390 12 Xe3 Panther Lake iGPU (n=1) | |
| MSI Claw 8 AI+ | |
| Lenovo Legion Go 2 | |
| MSI Claw A8 BZ2EM | |
| Average of class Handheld / UMPC (878 - 1719, n=12, last 2 years) | |
| Asus ROG Xbox Ally X | |
| CrossMark / Creativity | |
| MSI Claw 8 EX AI+ CG3EM | |
| Average Intel Arc G3 Extreme, Intel Arc B390 12 Xe3 Panther Lake iGPU (n=1) | |
| GPD Pocket 4 | |
| MSI Claw 8 AI+ | |
| Lenovo Legion Go 2 | |
| MSI Claw A8 BZ2EM | |
| Asus ROG Xbox Ally X | |
| Average of class Handheld / UMPC (891 - 2150, n=12, last 2 years) | |
| CrossMark / Responsiveness | |
| MSI Claw 8 EX AI+ CG3EM | |
| Average Intel Arc G3 Extreme, Intel Arc B390 12 Xe3 Panther Lake iGPU (n=1) | |
| GPD Pocket 4 | |
| Lenovo Legion Go 2 | |
| MSI Claw 8 AI+ | |
| MSI Claw A8 BZ2EM | |
| Average of class Handheld / UMPC (759 - 1677, n=12, last 2 years) | |
| Asus ROG Xbox Ally X | |
| WebXPRT 3 / Overall | |
| GPD Pocket 4 | |
| MSI Claw 8 AI+ | |
| Lenovo Legion Go 2 | |
| Asus ROG Xbox Ally X | |
| MSI Claw 8 EX AI+ CG3EM | |
| Average Intel Arc G3 Extreme, Intel Arc B390 12 Xe3 Panther Lake iGPU (n=1) | |
| Average of class Handheld / UMPC (170.3 - 325, n=14, last 2 years) | |
| MSI Claw A8 BZ2EM | |
| WebXPRT 4 / Overall | |
| MSI Claw 8 AI+ | |
| GPD Pocket 4 | |
| Lenovo Legion Go 2 | |
| MSI Claw 8 EX AI+ CG3EM | |
| Average Intel Arc G3 Extreme, Intel Arc B390 12 Xe3 Panther Lake iGPU (n=1) | |
| MSI Claw A8 BZ2EM | |
| Asus ROG Xbox Ally X | |
| Average of class Handheld / UMPC (134.4 - 291, n=14, last 2 years) | |
| Mozilla Kraken 1.1 / Total | |
| MSI Claw A8 BZ2EM | |
| Average of class Handheld / UMPC (428 - 931, n=13, last 2 years) | |
| Asus ROG Xbox Ally X | |
| MSI Claw 8 EX AI+ CG3EM | |
| Average Intel Arc G3 Extreme, Intel Arc B390 12 Xe3 Panther Lake iGPU (n=1) | |
| MSI Claw 8 AI+ | |
| Lenovo Legion Go 2 | |
| GPD Pocket 4 | |
* ... smaller is better
| PCMark 10 Score | 9701 points | |
Help | ||
| AIDA64 / Memory Copy | |
| MSI Claw 8 AI+ | |
| Lenovo Legion Go 2 | |
| MSI Claw A8 BZ2EM | |
| Asus ROG Xbox Ally X | |
| GPD Pocket 4 | |
| MSI Claw 8 EX AI+ CG3EM | |
| Average Intel Arc G3 Extreme (n=1) | |
| Average of class Handheld / UMPC (33517 - 107929, n=13, last 2 years) | |
| AIDA64 / Memory Read | |
| Lenovo Legion Go 2 | |
| MSI Claw A8 BZ2EM | |
| Asus ROG Xbox Ally X | |
| GPD Pocket 4 | |
| MSI Claw 8 AI+ | |
| MSI Claw 8 EX AI+ CG3EM | |
| Average Intel Arc G3 Extreme (n=1) | |
| Average of class Handheld / UMPC (25476 - 103022, n=13, last 2 years) | |
| AIDA64 / Memory Write | |
| MSI Claw 8 AI+ | |
| Lenovo Legion Go 2 | |
| Asus ROG Xbox Ally X | |
| MSI Claw A8 BZ2EM | |
| GPD Pocket 4 | |
| MSI Claw 8 EX AI+ CG3EM | |
| Average Intel Arc G3 Extreme (n=1) | |
| Average of class Handheld / UMPC (25595 - 117883, n=13, last 2 years) | |
| AIDA64 / Memory Latency | |
| Average of class Handheld / UMPC (99.8 - 147.6, n=13, last 2 years) | |
| MSI Claw 8 EX AI+ CG3EM | |
| Average Intel Arc G3 Extreme (n=1) | |
| Asus ROG Xbox Ally X | |
| Lenovo Legion Go 2 | |
| MSI Claw A8 BZ2EM | |
| GPD Pocket 4 | |
| MSI Claw 8 AI+ | |
* ... smaller is better


| DPC Latencies / LatencyMon - interrupt to process latency (max), Web, Youtube, Prime95 | |
| Average of class Handheld / UMPC (441 - 3021, n=12, last 2 years) | |
| Lenovo Legion Go 2 | |
| MSI Claw 8 EX AI+ CG3EM | |
| MSI Claw 8 AI+ | |
| GPD Pocket 4 | |
| MSI Claw A8 BZ2EM | |
| Asus ROG Xbox Ally X | |
* ... smaller is better

* ... smaller is better
Disk Throttling: DiskSpd Read Loop, Queue Depth 8
GPU and Gaming Performance
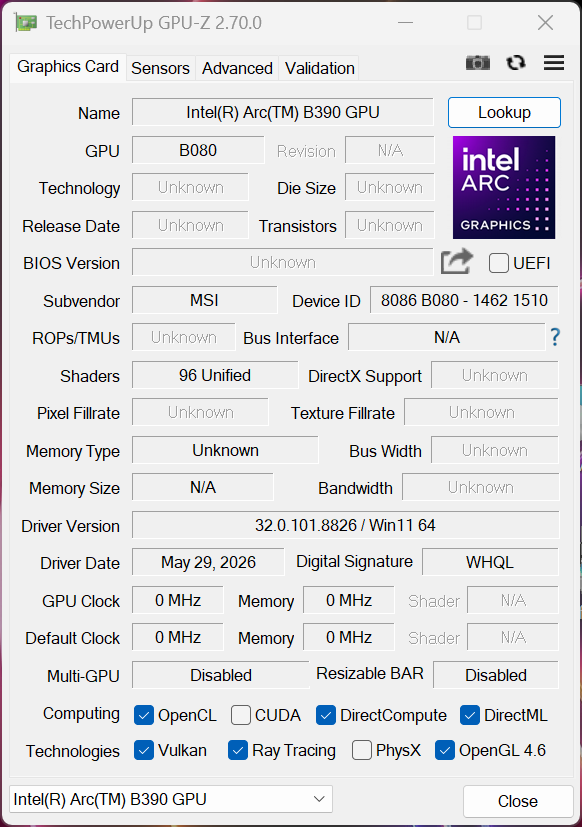
This is obviously the most important aspect and the Arc G3 Extreme features the Arc B390 GPU with 12 Xe cores, but the maximum clock is reduced to 2.3 GHz (vs. 2.5 GHz in laptop chips). Due to the lower clock and the limited TDP, the performance is slightly lower (5% on average) compared to other B390 iGPUs, but it is still excellent and around 50-60 % better compared to the rivals powered by the Ryzen Z2 Extreme or the Lunar Lake MSI Claw 8.
The gaming performance is also very good and stable, but the real highlight is multi frame generation. The combination of the high GPU performance and frame generation allows incredible FPS numbers in supported titles even in the most efficient Endurance power profile. Cyberpunk 2077 is an impressive example, because we managed to play it running at 1200p with Ultra details and 4x Frame Generation at ~90 fps in Endurance mode, where the SoC only consumes 14 Watts (total system consumption ~21 Watts), so you get almost 4 hours of battery runtime with these settings. The gameplay was buttery smooth and we did not notice any stutters.
Intel Endurance Gaming is another interesting aspect, which sets fixed fps limits (30, 40 or 60 fps) and is supposed to reduce the power consumption. Both features cannot be combined though and we will add more comprehensive testing data soon.
| 3DMark Performance rating - Percent | |
| Average Intel Arc B390 12 Xe3 Panther Lake iGPU | |
| MSI Claw 8 EX AI+ CG3EM | |
| Asus ROG Xbox Ally X -1! | |
| Lenovo Legion Go 2 -1! | |
| Average of class Handheld / UMPC | |
| MSI Claw 8 AI+ | |
| MSI Claw A8 BZ2EM | |
| GPD Pocket 4 -1! | |
| 3DMark 11 Performance | 18189 points | |
| 3DMark Fire Strike Score | 13235 points | |
| 3DMark Time Spy Score | 6619 points | |
| 3DMark Steel Nomad Score | 1347 points | |
| 3DMark Steel Nomad Light Score | 5562 points | |
Help | ||
| Blender / v3.3 Classroom CPU | |
| MSI Claw 8 AI+ | |
| Average of class Handheld / UMPC (290 - 1026, n=13, last 2 years) | |
| MSI Claw A8 BZ2EM | |
| MSI Claw 8 EX AI+ CG3EM | |
| Lenovo Legion Go 2 | |
| Asus ROG Xbox Ally X | |
| Average Intel Arc B390 12 Xe3 Panther Lake iGPU (282 - 409, n=11) | |
| GPD Pocket 4 | |
* ... smaller is better
| Performance rating - Percent | |
| MSI Claw 8 EX AI+ CG3EM | |
| GPD Pocket 4 | |
| Asus ROG Xbox Ally X | |
| Lenovo Legion Go 2 -1! | |
| MSI Claw A8 BZ2EM | |
| MSI Claw 8 AI+ -1! | |
| Average of class Handheld / UMPC | |
| Cyberpunk 2077 - 1920x1080 Ultra Preset (FSR off) | |
| MSI Claw 8 EX AI+ CG3EM | |
| MSI Claw 8 AI+ | |
| Asus ROG Xbox Ally X | |
| GPD Pocket 4 | |
| Average of class Handheld / UMPC (11.5 - 91.4, n=21, last 2 years) | |
| Lenovo Legion Go 2 | |
| MSI Claw A8 BZ2EM | |
| Baldur's Gate 3 - 1920x1080 Ultra Preset AA:T | |
| MSI Claw 8 EX AI+ CG3EM | |
| Asus ROG Xbox Ally X | |
| Lenovo Legion Go 2 | |
| Average of class Handheld / UMPC (13.5 - 118.8, n=19, last 2 years) | |
| GPD Pocket 4 | |
| MSI Claw 8 AI+ | |
| MSI Claw A8 BZ2EM | |
| GTA V - 1920x1080 Highest AA:4xMSAA + FX AF:16x | |
| MSI Claw 8 EX AI+ CG3EM | |
| GPD Pocket 4 | |
| MSI Claw A8 BZ2EM | |
| Asus ROG Xbox Ally X | |
| Average of class Handheld / UMPC (14 - 39.1, n=14, last 2 years) | |
| Final Fantasy XV Benchmark - 1920x1080 High Quality | |
| MSI Claw 8 EX AI+ CG3EM | |
| Asus ROG Xbox Ally X | |
| MSI Claw 8 AI+ | |
| GPD Pocket 4 | |
| Lenovo Legion Go 2 | |
| MSI Claw A8 BZ2EM | |
| Average of class Handheld / UMPC (17.9 - 49.2, n=19, last 2 years) | |
| Strange Brigade - 1920x1080 ultra AA:ultra AF:16 | |
| MSI Claw 8 EX AI+ CG3EM | |
| Asus ROG Xbox Ally X | |
| Lenovo Legion Go 2 | |
| MSI Claw 8 AI+ | |
| GPD Pocket 4 | |
| MSI Claw A8 BZ2EM | |
| Average of class Handheld / UMPC (32.8 - 91.9, n=20, last 2 years) | |
| Dota 2 Reborn - 1920x1080 ultra (3/3) best looking | |
| MSI Claw 8 EX AI+ CG3EM | |
| GPD Pocket 4 | |
| MSI Claw 8 AI+ | |
| Asus ROG Xbox Ally X | |
| MSI Claw A8 BZ2EM | |
| Lenovo Legion Go 2 | |
| Average of class Handheld / UMPC (30.8 - 102, n=19, last 2 years) | |
| X-Plane 11.11 - 1920x1080 high (fps_test=3) | |
| GPD Pocket 4 | |
| Lenovo Legion Go 2 | |
| Asus ROG Xbox Ally X | |
| MSI Claw A8 BZ2EM | |
| MSI Claw 8 EX AI+ CG3EM | |
| Average of class Handheld / UMPC (22.7 - 50.5, n=19, last 2 years) | |
| MSI Claw 8 AI+ | |
| low | med. | high | ultra | |
|---|---|---|---|---|
| GTA V (2015) | 170.5 | 165.1 | 88.3 | 39.1 |
| Dota 2 Reborn (2015) | 123.7 | 92.8 | 107.5 | 102 |
| Final Fantasy XV Benchmark (2018) | 114.6 | 69.6 | 49.2 | |
| X-Plane 11.11 (2018) | 50.3 | 45.9 | 37.5 | |
| Strange Brigade (2018) | 318 | 122.5 | 105.5 | 91.9 |
| Baldur's Gate 3 (2023) | 66.2 | 51 | 44.3 | 44.2 |
| Cyberpunk 2077 (2023) | 70.5 | 55 | 46.1 | 39.6 |
Emissions & Power Consumption
System Noise

MSI uses two small fans and they are running all the time at ~3600 rpm, which results in an audible murmur of 33.9 dB(A) in all power profiles. This is a bit unusual and might be fixed via software update. While gaming, the fan noise depends on the power profile and varies between 33.9 dB(A) in Endurance mode, 42.3 dB(A) in AI Engine mode and up to 46.2 dB(A) in Manual mode (45/35W). We did not experience any other electronic noises.
Noise level
| Idle |
| 33.9 / 33.9 / 33.9 dB(A) |
| Load |
| 42.3 / 43.5 dB(A) |
 | ||
30 dB silent 40 dB(A) audible 50 dB(A) loud |
||
min: | ||
| MSI Claw 8 EX AI+ CG3EM Arc G3 Extreme, Arc B390 Panther Lake iGPU | Lenovo Legion Go 2 Ryzen Z2 Extreme, Radeon 890M | Asus ROG Xbox Ally X Ryzen Z2 Extreme, Radeon 890M | MSI Claw A8 BZ2EM Ryzen Z2 Extreme, Radeon 890M | GPD Pocket 4 Ryzen AI 9 HX 370, Radeon 890M | MSI Claw 8 AI+ Core Ultra 7 258V, Arc 140V | |
|---|---|---|---|---|---|---|
| Noise | 14% | 10% | 15% | 7% | 12% | |
| off / environment * (dB) | 24.5 | 24.7 -1% | 24.2 1% | 24 2% | 22.8 7% | 24.7 -1% |
| Idle Minimum * (dB) | 33.9 | 24.7 27% | 24.2 29% | 24 29% | 25.8 24% | 24.7 27% |
| Idle Average * (dB) | 33.9 | 24.7 27% | 24.2 29% | 24 29% | 25.8 24% | 24.7 27% |
| Idle Maximum * (dB) | 33.9 | 24.7 27% | 29 14% | 29 14% | 31 9% | 28.9 15% |
| Load Average * (dB) | 42.3 | 39.7 6% | 41.4 2% | 39.1 8% | 47 -11% | 37.3 12% |
| Cyberpunk 2077 ultra * (dB) | 42.3 | 39.7 6% | 43.4 -3% | 36.6 13% | 43.3 -2% | 41.4 2% |
| Load Maximum * (dB) | 43.5 | 39.7 9% | 43.4 -0% | 39.1 10% | 45.1 -4% | 41.4 5% |
* ... smaller is better
Temperature
The surface temperatures are absolutely no problem because the grips are always very cool and only the center part gets noticeably warm while gaming. The warm exhaust air is dissipated at the top edge, so there are no issues with any skin contact.
(+) The maximum temperature on the upper side is 39.4 °C / 103 F, compared to the average of 37.9 °C / 100 F, ranging from 26.6 to 55 °C for the class Handheld / UMPC.
(+) The bottom heats up to a maximum of 32.9 °C / 91 F, compared to the average of 36.7 °C / 98 F
(+) In idle usage, the average temperature for the upper side is 26 °C / 79 F, compared to the device average of 32.8 °C / 91 F.
(-) 3: The average temperature for the upper side is 38.9 °C / 102 F, compared to the average of 32.8 °C / 91 F for the class Handheld / UMPC.
(-) The palmrests and touchpad can get very hot to the touch with a maximum of 41.1 °C / 106 F.
(-) The average temperature of the palmrest area of similar devices was 32.4 °C / 90.3 F (-8.7 °C / -15.7 F).


| MSI Claw 8 EX AI+ CG3EM Arc G3 Extreme, Arc B390 Panther Lake iGPU | Lenovo Legion Go 2 Ryzen Z2 Extreme, Radeon 890M | Asus ROG Xbox Ally X Ryzen Z2 Extreme, Radeon 890M | MSI Claw A8 BZ2EM Ryzen Z2 Extreme, Radeon 890M | GPD Pocket 4 Ryzen AI 9 HX 370, Radeon 890M | MSI Claw 8 AI+ Core Ultra 7 258V, Arc 140V | |
|---|---|---|---|---|---|---|
| Heat | -23% | -15% | -15% | -1% | -2% | |
| Maximum Upper Side * (°C) | 39.4 | 42.9 -9% | 40.8 -4% | 39.2 1% | 33.8 14% | 36.6 7% |
| Maximum Bottom * (°C) | 32.9 | 35.8 -9% | 40.8 -24% | 37 -12% | 35.2 -7% | 34.8 -6% |
| Idle Upper Side * (°C) | 27.3 | 38.2 -40% | 29.9 -10% | 30 -10% | 26.6 3% | 27.5 -1% |
| Idle Bottom * (°C) | 25.1 | 33.1 -32% | 30.6 -22% | 34.9 -39% | 28.6 -14% | 27.2 -8% |
* ... smaller is better
Speakers
The speaker performance is once again very good and the Claw 8 EX AI+ offers one of the best sound systems on a handheld device.
MSI Claw 8 EX AI+ CG3EM audio analysis
(+) | speakers can play relatively loud (85.2 dB)
Bass 100 - 315 Hz
(±) | reduced bass - on average 7.3% lower than median
(±) | linearity of bass is average (9% delta to prev. frequency)
Mids 400 - 2000 Hz
(±) | higher mids - on average 6.5% higher than median
(+) | mids are linear (3.2% delta to prev. frequency)
Highs 2 - 16 kHz
(+) | balanced highs - only 4.7% away from median
(+) | highs are linear (4.2% delta to prev. frequency)
Overall 100 - 16.000 Hz
(+) | overall sound is linear (12.1% difference to median)
Compared to same class
» 0% of all tested devices in this class were better, 13% similar, 88% worse
» The best had a delta of 12%, average was 17%, worst was 23%
Compared to all devices tested
» 9% of all tested devices were better, 2% similar, 88% worse
» The best had a delta of 4%, average was 24%, worst was 134%
Lenovo Legion Go 2 audio analysis
(+) | speakers can play relatively loud (85.1 dB)
Bass 100 - 315 Hz
(-) | nearly no bass - on average 16.4% lower than median
(±) | linearity of bass is average (10.7% delta to prev. frequency)
Mids 400 - 2000 Hz
(±) | higher mids - on average 6.9% higher than median
(+) | mids are linear (6.8% delta to prev. frequency)
Highs 2 - 16 kHz
(+) | balanced highs - only 2.9% away from median
(+) | highs are linear (3.9% delta to prev. frequency)
Overall 100 - 16.000 Hz
(±) | linearity of overall sound is average (15.6% difference to median)
Compared to same class
» 38% of all tested devices in this class were better, 8% similar, 54% worse
» The best had a delta of 12%, average was 17%, worst was 23%
Compared to all devices tested
» 23% of all tested devices were better, 5% similar, 72% worse
» The best had a delta of 4%, average was 24%, worst was 134%
Asus ROG Xbox Ally X audio analysis
(+) | speakers can play relatively loud (86.6 dB)
Bass 100 - 315 Hz
(±) | reduced bass - on average 14.8% lower than median
(±) | linearity of bass is average (7.7% delta to prev. frequency)
Mids 400 - 2000 Hz
(±) | higher mids - on average 5.4% higher than median
(+) | mids are linear (3.5% delta to prev. frequency)
Highs 2 - 16 kHz
(+) | balanced highs - only 4% away from median
(+) | highs are linear (4.4% delta to prev. frequency)
Overall 100 - 16.000 Hz
(+) | overall sound is linear (12.8% difference to median)
Compared to same class
» 13% of all tested devices in this class were better, 13% similar, 75% worse
» The best had a delta of 12%, average was 17%, worst was 23%
Compared to all devices tested
» 12% of all tested devices were better, 3% similar, 85% worse
» The best had a delta of 4%, average was 24%, worst was 134%
MSI Claw A8 BZ2EM audio analysis
(+) | speakers can play relatively loud (83.6 dB)
Bass 100 - 315 Hz
(±) | reduced bass - on average 12% lower than median
(±) | linearity of bass is average (7.9% delta to prev. frequency)
Mids 400 - 2000 Hz
(+) | balanced mids - only 4.5% away from median
(+) | mids are linear (3.7% delta to prev. frequency)
Highs 2 - 16 kHz
(+) | balanced highs - only 3.1% away from median
(+) | highs are linear (2.9% delta to prev. frequency)
Overall 100 - 16.000 Hz
(+) | overall sound is linear (11.9% difference to median)
Compared to same class
» 0% of all tested devices in this class were better, 13% similar, 88% worse
» The best had a delta of 12%, average was 17%, worst was 23%
Compared to all devices tested
» 9% of all tested devices were better, 2% similar, 89% worse
» The best had a delta of 4%, average was 24%, worst was 134%
GPD Pocket 4 audio analysis
(+) | speakers can play relatively loud (91.9 dB)
Bass 100 - 315 Hz
(-) | nearly no bass - on average 21.5% lower than median
(+) | bass is linear (5.2% delta to prev. frequency)
Mids 400 - 2000 Hz
(+) | balanced mids - only 4.9% away from median
(+) | mids are linear (4.8% delta to prev. frequency)
Highs 2 - 16 kHz
(±) | higher highs - on average 6.1% higher than median
(±) | linearity of highs is average (8.1% delta to prev. frequency)
Overall 100 - 16.000 Hz
(±) | linearity of overall sound is average (17.6% difference to median)
Compared to same class
» 46% of all tested devices in this class were better, 17% similar, 38% worse
» The best had a delta of 12%, average was 17%, worst was 23%
Compared to all devices tested
» 34% of all tested devices were better, 8% similar, 57% worse
» The best had a delta of 4%, average was 24%, worst was 134%
MSI Claw 8 AI+ audio analysis
(+) | speakers can play relatively loud (85 dB)
Bass 100 - 315 Hz
(±) | reduced bass - on average 14.5% lower than median
(±) | linearity of bass is average (8.8% delta to prev. frequency)
Mids 400 - 2000 Hz
(+) | balanced mids - only 2.1% away from median
(+) | mids are linear (2.1% delta to prev. frequency)
Highs 2 - 16 kHz
(+) | balanced highs - only 2.4% away from median
(+) | highs are linear (4.2% delta to prev. frequency)
Overall 100 - 16.000 Hz
(+) | overall sound is linear (11.9% difference to median)
Compared to same class
» 0% of all tested devices in this class were better, 13% similar, 88% worse
» The best had a delta of 12%, average was 17%, worst was 23%
Compared to all devices tested
» 9% of all tested devices were better, 2% similar, 89% worse
» The best had a delta of 4%, average was 24%, worst was 134%
Power Consumption

Our measurements reveal increased consumption values while idling compared to the previous model with up to 9.6 Watts. We recorded a maximum consumption of 55 Watts during our stress test, which quickly leveled off at 45 Watts. During gaming, you can expect between 40 Watts (AI Engine) and 55 Watts (Manual mode), so the 65W PSU is sufficient.
| Off / Standby | |
| Idle | |
| Load |
|
Key:
min: | |
| MSI Claw 8 EX AI+ CG3EM Arc G3 Extreme, Arc B390 Panther Lake iGPU, Micron 2500 1TB MTFDKBA1T0QGN, , 1920x1200, 8" | Lenovo Legion Go 2 Ryzen Z2 Extreme, Radeon 890M, SK hynix PVC10 HFS001TEM4X182N, OLED, 1920x1200, 8.8" | Asus ROG Xbox Ally X Ryzen Z2 Extreme, Radeon 890M, Samsung MZVMA1T0HCLD, IPS, 1920x1080, 7" | MSI Claw A8 BZ2EM Ryzen Z2 Extreme, Radeon 890M, Micron 2500 1TB MTFDKBA1T0QGN, IPS, 1920x1200, 8" | GPD Pocket 4 Ryzen AI 9 HX 370, Radeon 890M, , IPS, 2560x1600, 8.8" | MSI Claw 8 AI+ Core Ultra 7 258V, Arc 140V, Kioxia BG6 KBG60ZNS1T02, IPS, 1920x1200, 8" | Average Intel Arc B390 12 Xe3 Panther Lake iGPU | Average of class Handheld / UMPC | |
|---|---|---|---|---|---|---|---|---|
| Power Consumption | -19% | -3% | 3% | -8% | 10% | 5% | -2% | |
| Idle Minimum * (Watt) | 6.4 | 7.1 -11% | 3.7 42% | 5.3 17% | 6 6% | 3.2 50% | 3.94 ? 38% | 6.04 ? 6% |
| Idle Average * (Watt) | 9.1 | 10.7 -18% | 6.1 33% | 8.7 4% | 8.8 3% | 6.3 31% | 5.94 ? 35% | 8.46 ? 7% |
| Idle Maximum * (Watt) | 9.6 | 11.3 -18% | 6.2 35% | 9.1 5% | 9.2 4% | 6.6 31% | 8.68 ? 10% | 10.2 ? -6% |
| Load Average * (Watt) | 40.2 | 50.2 -25% | 56.1 -40% | 42.2 -5% | 53.1 -32% | 40.6 -1% | 45 ? -12% | 44.1 ? -10% |
| Cyberpunk 2077 ultra external monitor * (Watt) | 40.6 | 51.1 -26% | 55 -35% | 37.6 7% | 45.7 -13% | 46.7 -15% | ||
| Cyberpunk 2077 ultra * (Watt) | 40.1 | 51.4 -28% | 54.5 -36% | 35.5 11% | 50.1 -25% | 47 -17% | ||
| Load Maximum * (Watt) | 55.3 | 58.6 -6% | 66.4 -20% | 64 -16% | 56.4 -2% | 59.3 -7% | 80.8 ? -46% | 58.3 ? -5% |
* ... smaller is better
Power Consumption Cyberpunk / Stress Test
Power Consumption external Monitor
Battery Life

The 80 Wh battery provides good battery runtimes, but the Wi-Fi test at 150 nits (27 % of the maximum brightness) confirms the increased consumption with around 13.5 hours, while the predecessor with Lunar Lake managed almost 24 hours (both running at 60 Hz). We will add more battery tests soon, but you can expect 3.5-4 hours of gaming in Endurance mode, around 2 hours in AI Engine mode and ~1.5 hours in Manual mode at max. TDP settings based on the consumption figures.
Notebookcheck Rating
MSI Claw 8 EX AI+ CG3EM
- 06/23/2026 v8
Andreas Osthoff
 Total Sustainability Score:
 Potential Competitors in Comparison
Image | Model / Review | Price | Weight | Height | Display |
|---|---|---|---|---|---|
1. 85.3%  | MSI Claw 8 EX AI+ CG3EM Intel Arc G3 Extreme ⎘ Intel Arc B390 12 Xe3 Panther Lake iGPU ⎘ 32 GB Memory, 1024 GB SSD | Amazon: 1. $999.00 msi Claw PC Gaming Handheld:... 2. $15.19 Spigen Tempered Glass Screen... 3. $1,229.99 EXCaliberPC [2025] MSI Claw ... List Price: 1649€ | 786 g | 48 mm | 8.00" 1920x1200 283 PPI |
2. 82.8%  | Lenovo Legion Go 2 AMD Ryzen Z2 Extreme ⎘ AMD Radeon 890M ⎘ 32 GB Memory, 1024 GB SSD | Amazon: 1. $549.99 Lenovo Legion Go S - 2025 - ... 2. $984.99 Lenovo Legion Go S 2TB SSD A... 3. $904.99 Lenovo Legion Go S 8APU1 120... List Price: 1500€ | 922 g | 42.25 mm | 8.80" 1920x1200 257 PPI OLED |
3. 85.9%  | Asus ROG Xbox Ally X AMD Ryzen Z2 Extreme ⎘ AMD Radeon 890M ⎘ 24 GB Memory, 1024 GB SSD | Amazon: List Price: 899€ | 718 g | 50.9 mm | 7.00" 1920x1080 315 PPI IPS |
4. 83.1%  | MSI Claw A8 BZ2EM AMD Ryzen Z2 Extreme ⎘ AMD Radeon 890M ⎘ 24 GB Memory, 1024 GB SSD | Amazon: List Price: 999€ | 765 g | 24 mm | 8.00" 1920x1200 283 PPI IPS |
5. 80.2%  | GPD Pocket 4 AMD Ryzen AI 9 HX 370 ⎘ AMD Radeon 890M ⎘ 32 GB Memory | Amazon: $1,475.95 List Price: 1400 USD | 777 g | 22.2 mm | 8.80" 2560x1600 343 PPI IPS |
6. 84.7%  | MSI Claw 8 AI+ Intel Core Ultra 7 258V ⎘ Intel Arc Graphics 140V ⎘ 32 GB Memory, 512 GB SSD | Amazon: List Price: 999€ | 793 g | 30 mm | 8.00" 1920x1200 283 PPI IPS |
Transparency
The selection of devices to be reviewed is made by our editorial team. The test sample was provided to the author as a loan by the manufacturer or retailer for the purpose of this review. The lender had no influence on this review, nor did the manufacturer receive a copy of this review before publication. There was no obligation to publish this review. As an independent media company, Notebookcheck is not subjected to the authority of manufacturers, retailers or publishers.
This is how Notebookcheck is testing
Every year, Notebookcheck independently reviews hundreds of laptops and smartphones using standardized procedures to ensure that all results are comparable. We have continuously developed our test methods for around 20 years and set industry standards in the process. In our test labs, high-quality measuring equipment is utilized by experienced technicians and editors. These tests involve a multi-stage validation process. Our complex rating system is based on hundreds of well-founded measurements and benchmarks, which maintains objectivity. Further information on our test methods can be found here.
