Notebookcheck Logo
Teaser

MSI Cubi NUC AI+ 3MG review: Mini PC with up to an insane 128 GB of RAM

Smaller, faster, and more efficient than before.

The newest MSI mini PC cuts down on size and weight without cutting down on too many important features. There are nonetheless a few compromises and limitations worth mentioning.
Allen Ngo 👁 Published
Mini PC Panther Lake Business MSI

Verdict — Newly Optimized For Offices And Retail

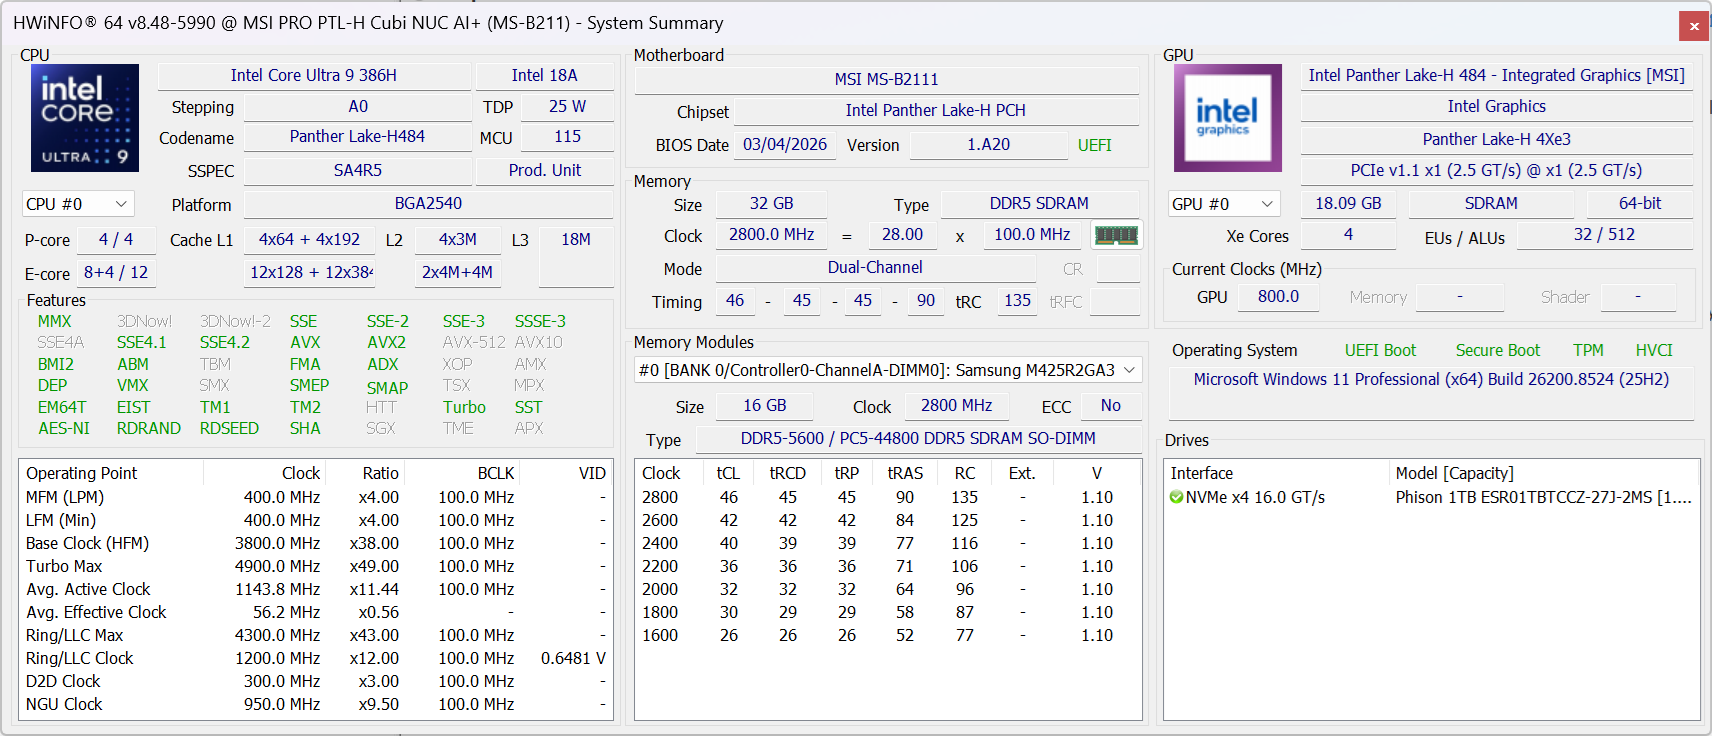
It may not look like so at first glance, but the Cubi NUC AI+ 3MG is a significant leap forward over last year's Cubi NUC AI+ 2MG. There are many changes under the hood including a revised motherboard with removable RAM, an even easier servicing procedure, more useful ports, and a much smaller, inconspicuous design to better blend into more professional environments. In fact, this is one of the smallest Intel mini PCs supporting up to 128 GB of removable memory. The significant CPU performance boost also addresses one of the main concerns about the older Lunar Lake model.

Conversely, the smaller size entails certain compromises. The MicroSD reader from last year's model is now gone and there is no integrated speaker which would have made the system more versatile. Core temperatures are generally warmer and fan noise isn't necessarily better or worse than before. The relatively large power brick, which is almost as heavy as the mini PC itself, can be difficult to tuck away depending on the environment. And finally, while the high RAM capacity is a standout feature, other aspects have taken a backseat including Local storage and GPU performance as competing models like the GMK EVO-X1 or Asus NUC 15 Pro+ are each faster machines with more storage options.

Pros

+ removable SODIMM RAM up to 128 GB
+ three-year warranty standard
+ more HDMI and USB-C ports
+ smaller and lighter design
+ tool-less servicing

Cons

- fewer USB-A ports; dropped SD card reader and 3.5 mm audio jack
- below-average Core Ultra 9 CPU performance
- no secondary SSD support or speakers
- higher core temperatures than before
- no Panther Lake X7 options

Price and Availability

Newegg is currently shipping the barebones MSI Cubi NUC AI+ 3MG with Core Ultra 9 CPU for $830. If configured with 32 GB of RAM, the price jumps up to $1220.

Amazon Logo
$854.94
Cubi NUC AI+ Barebone Desktop, Intel Core 9-386H, 2X DDR5 Slots (up to 64GB), Copilot+ PC, WiFi 7, 3 Year Advance Replacement (3MG-006BUS)

The Cubi NUC AI+ 3MG succeeds last year's Cubi NUC AI+ 2MG by swapping out the Intel Lunar Lake CPU for newer Panther Lake options. The external design has changed as well to be noticeably smaller and lighter than before.

Our test unit is a higher-end configuration with the Core Ultra 9 386H CPU for approximately $1100 if configured with RAM and storage. Thankfully, barebones options are available at lower starting prices. SKUs with entry-level Core Ultra 5 and Core Ultra 7 are also available.

The Cubi NUC AI+ 3MG competes with other business-centric and retail/office mini PCs like the GMK EVO series, Asus NUC 15 Pro+, or the HP EliteBoard G1a AI.

More MSI reviews:

Specifications

MSI Cubi NUC AI+ 3MG
Processor
Intel Core Ultra 9 386H 16c/16t, 4 x 4.9 GHz Intel Cougar Cove P-Core, 8 x 3.9 GHz Intel Darkmont E-Core, 4 x 3.5 GHz Intel Darkmont LP E-Core, 61 W PL2 / Short Burst, 30 W PL1 / Sustained, Panther Lake
Graphics adapter
Intel Graphics 4 Xe3 Panther Lake iGPU, Core: 2500 MHz, DDR5, 32.0.101.8362
Memory
32 GB 
, DDR-5600, Dual-Channel, Samsung,
Mainboard
Intel Panther Lake-H PCH
Storage
Soundcard
Intel Panther Lake-H PCH - High Definition Audio - AVS (Audio, Voice, Speech)
Connections
1 USB 2.0, 1 USB 3.1 Gen2, 2 USB4 40 Gbps, 1 Thunderbolt 4, USB-C Power Delivery (PD), 2 HDMI, 2 DisplayPort, 1 Kensington Lock, 1 Fingerprint Reader
Networking
Intel Ethernet Controller I226-V (10/2500MBit/s), Mediatek Wi-Fi 7 MT7925 Wireless LAN Card (a/b/g/ac = Wi-Fi 5/ax = Wi-Fi 6/ Wi-Fi 6E 6 GHz be = Wi-Fi 7), Bluetooth 5.4
Size
height x width x depth (in mm): 37.5 x 119.6 x 115.2 ( = 1.48 x 4.71 x 4.54 in)
Operating System
Microsoft Windows 11 Pro
Additional features
MSI Center, 36 Months Warranty
Weight
552 g ( = 19.47 oz / 1.22 pounds), Power Supply: 499 g ( = 17.6 oz / 1.1 pounds)
Price
830 USD
Amazon
Note: The manufacturer may use components from different suppliers including display panels, drives or memory sticks with similar specifications.


Case

The chassis utilizes the same black plastic materials for similar impressions as before albeit in a 17 percent lighter and 43 percent smaller volume. Perhaps more impressively, the smaller design doesn't entail more ventilation grilles or any major external revisions.

Size Comparison

154 mm / 6.06 in 151 mm / 5.94 in 73.6 mm / 2.9 in 946 g2.09 lbs144 mm / 5.67 in 112 mm / 4.41 in 42 mm / 1.654 in 690 g1.521 lbs135.6 mm / 5.34 in 132.5 mm / 5.22 in 50.1 mm / 1.972 in 669 g1.475 lbs135.6 mm / 5.34 in 132.6 mm / 5.22 in 50.1 mm / 1.972 in 660 g1.455 lbs111 mm / 4.37 in 107 mm / 4.21 in 63 mm / 2.48 in 567 g1.25 lbs119.6 mm / 4.71 in 115.2 mm / 4.54 in 37.5 mm / 1.476 in 552 g1.217 lbs112 mm / 4.41 in 112 mm / 4.41 in 37 mm / 1.457 in 423 g0.933 lbs297 mm / 11.7 in 210 mm / 8.27 in 1 mm / 0.03937 in 5.7 g0.01257 lbs

Connectivity

The most notable connectivity feature of the Cubi 3MG is its External Power Switch Pin on the side of the unit. The port allows for a cabled Power button to easily turn on or shut off the system should the mini PC be placed somewhere hard to reach like under an office desk or behind a table or monitor.

Port options have been significantly revised when compared to last year's model. There are now fewer USB-A ports and no more SD card reader or audio jack in favor of more HDMI ports and USB-C ports.

Keep in mind that only one of two Thunderbolt 4 ports supports Power Delivery. This port can be used to power the mini PC should you have a compatible USB-C AC adapter in lieu of the included barrel AC adapter.

Front: USB-A 2.0, USB-A (10 Gbps), USB-C (10 Gbps), Fingerprint-enabled Power button
Right: No ports
Right: No ports
Rear: AC adapter, USB-C Thunderbolt 4 w/ DisplayPort 1.4 + Power Delivery, 2x RJ-45 (10 Gbps), USB-C Thunderbolt 4 w/ DisplayPort 1.4, 2x HDMI 2.1
Left: Kensington Lock, External Power Switch Pin

Communication

WLAN module has been upgraded from Wi-Fi 6E to Wi-Fi 7 with Bluetooth 6.0 support.

Networking
iperf3 transmit AXE11000
MSI Cubi NUC AI+ 3MG
Mediatek Wi-Fi 7 MT7925 Wireless LAN Card
1678 (1552min - 1799max) MBit/s
Asus NUC 15 Pro+
Intel BE201 320MHz
1636 (1200min - 1707max) MBit/s -3%
GMK EVO-T1
Intel Wi-Fi 6 AX201
1405 (1297min - 1536max) MBit/s -16%
MSI Cubi NUC AI+ 2MG
Intel Wi-Fi 6E AX211
1282 (1121min - 1470max) MBit/s -24%
GMK NucBox K16
MediaTek Wi-Fi 6E MT7922 160MHz Wireless LAN Card
853 (461min - 916max) MBit/s -49%
Geekom A5 Pro
Realtek RTL8852BE
800 (685min - 845max) MBit/s -52%
MSI Cubi NUC 1M
Intel Wi-Fi 6E AX211
636 (430min - 784max) MBit/s -62%
iperf3 receive AXE11000
Asus NUC 15 Pro+
Intel BE201 320MHz
1671 (1579min - 1738max) MBit/s +11%
GMK EVO-T1
Intel Wi-Fi 6 AX201
1582 (1543min - 1618max) MBit/s +5%
MSI Cubi NUC AI+ 3MG
Mediatek Wi-Fi 7 MT7925 Wireless LAN Card
1505 (1260min - 1666max) MBit/s
MSI Cubi NUC AI+ 2MG
Intel Wi-Fi 6E AX211
1409 (1143min - 1606max) MBit/s -6%
Geekom A5 Pro
Realtek RTL8852BE
890 (451min - 910max) MBit/s -41%
GMK NucBox K16
MediaTek Wi-Fi 6E MT7922 160MHz Wireless LAN Card
765 (650min - 892max) MBit/s -49%
MSI Cubi NUC 1M
Intel Wi-Fi 6E AX211
692 (506min - 872max) MBit/s -54%
iperf3 transmit AXE11000 6GHz
GMK NucBox K16
MediaTek Wi-Fi 6E MT7922 160MHz Wireless LAN Card
1784 (1675min - 1906max) MBit/s +1%
MSI Cubi NUC AI+ 3MG
Mediatek Wi-Fi 7 MT7925 Wireless LAN Card
1759 (1660min - 1875max) MBit/s
Asus NUC 15 Pro+
Intel BE201 320MHz
1605 (1475min - 1665max) MBit/s -9%
MSI Cubi NUC 1M
Intel Wi-Fi 6E AX211
1400 (1199min - 1463max) MBit/s -20%
MSI Cubi NUC AI+ 2MG
Intel Wi-Fi 6E AX211
1101 (868min - 1237max) MBit/s -37%
iperf3 receive AXE11000 6GHz
GMK NucBox K16
MediaTek Wi-Fi 6E MT7922 160MHz Wireless LAN Card
1779 (1759min - 1799max) MBit/s +2%
MSI Cubi NUC AI+ 3MG
Mediatek Wi-Fi 7 MT7925 Wireless LAN Card
1736 (1716min - 1750max) MBit/s
MSI Cubi NUC AI+ 2MG
Intel Wi-Fi 6E AX211
1656 (1581min - 1726max) MBit/s -5%
Asus NUC 15 Pro+
Intel BE201 320MHz
1618 (1586min - 1644max) MBit/s -7%
MSI Cubi NUC 1M
Intel Wi-Fi 6E AX211
1560 (1528min - 1585max) MBit/s -10%
0100200300400500600700800900100011001200130014001500160017001800Tooltip
MSI Cubi NUC AI+ 3MG; iperf3 transmit AXE11000 6GHz; iperf 3.1.3: Ø1759 (1660-1875)
MSI Cubi NUC AI+ 3MG; iperf3 receive AXE11000 6GHz; iperf 3.1.3: Ø1736 (1716-1750)

Maintenance

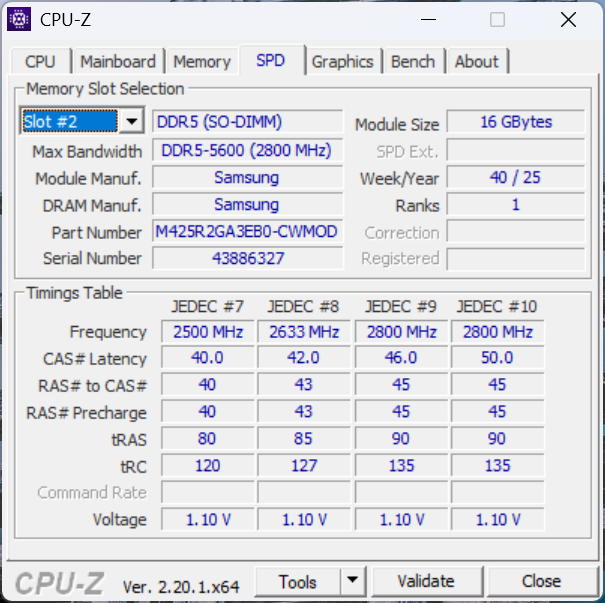
The bottom panel is secured by a simple thumb screw for easy servicing without any tools. Once inside, users have direct access to the M.2 2280 SSD slot, removable M.2 WLAN module, and two DDR5 SODIMM slots.

Cubi NUC AI+ 3MG motherboard

Accessories And Warranty

The retail box includes the external power switch for connecting to the power switch pin mentioned above. The external switch is not very long at just ~47 cm, however.

Performance

Testing Conditions

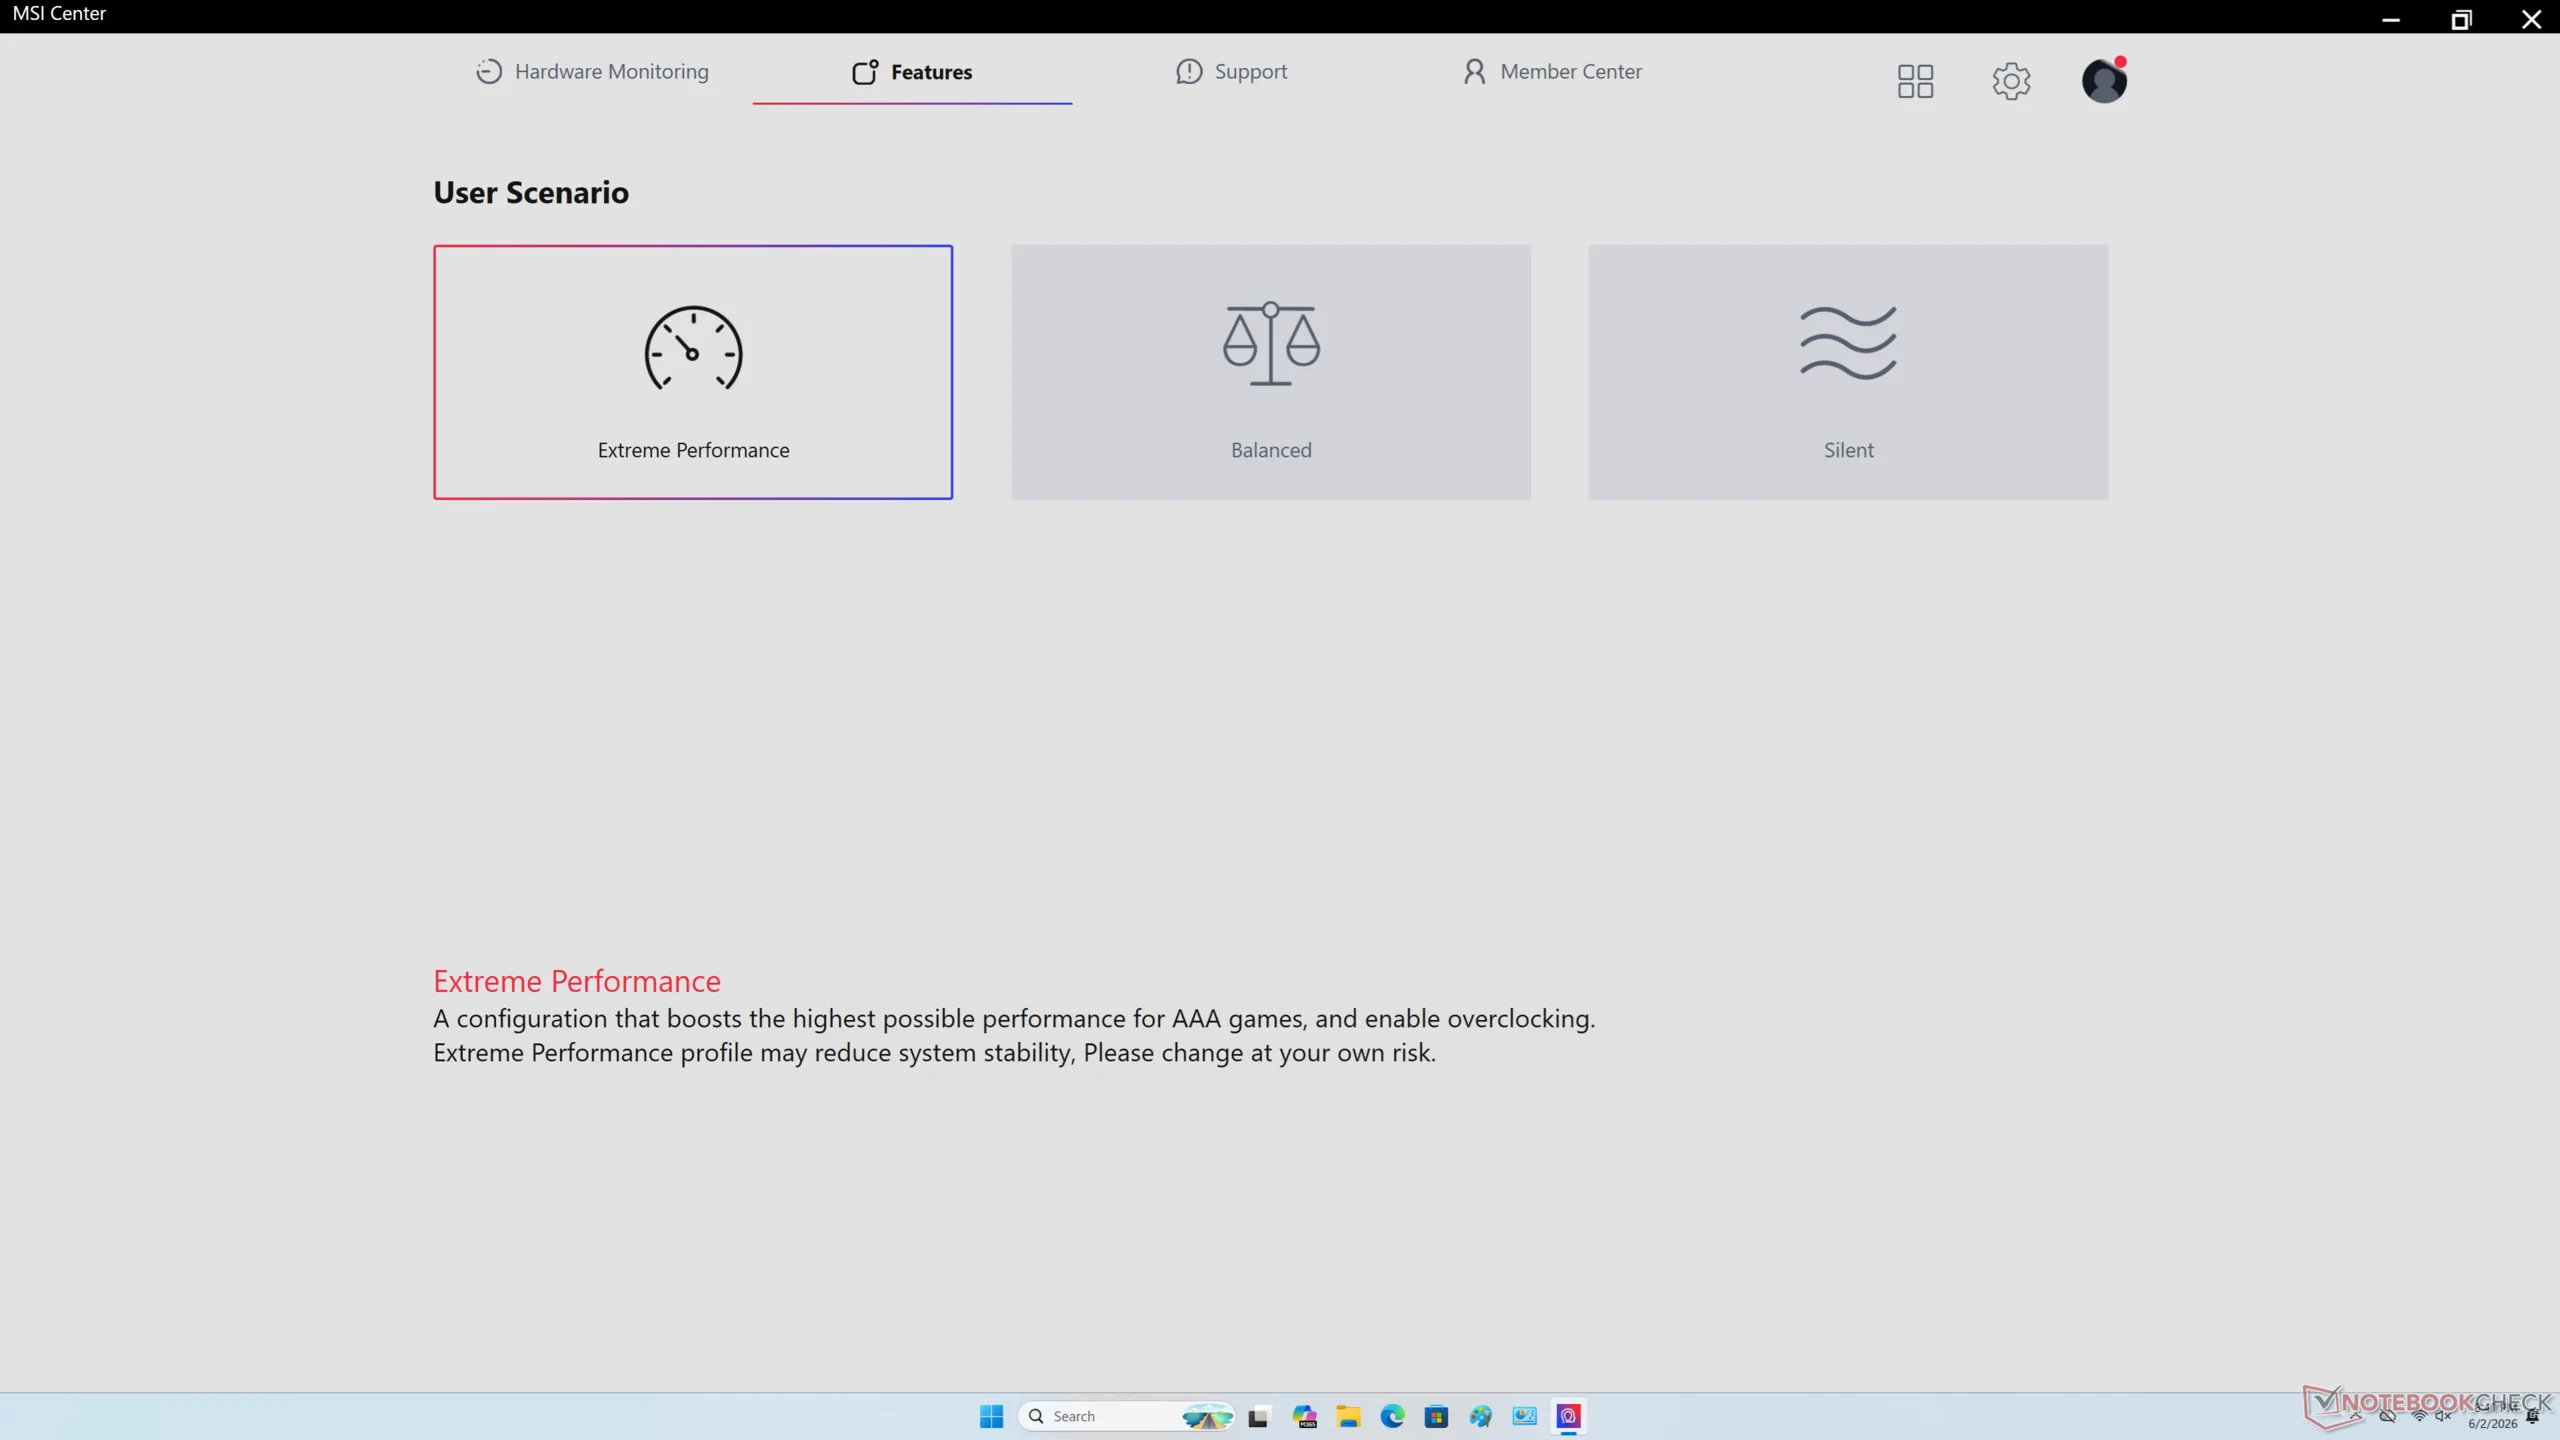
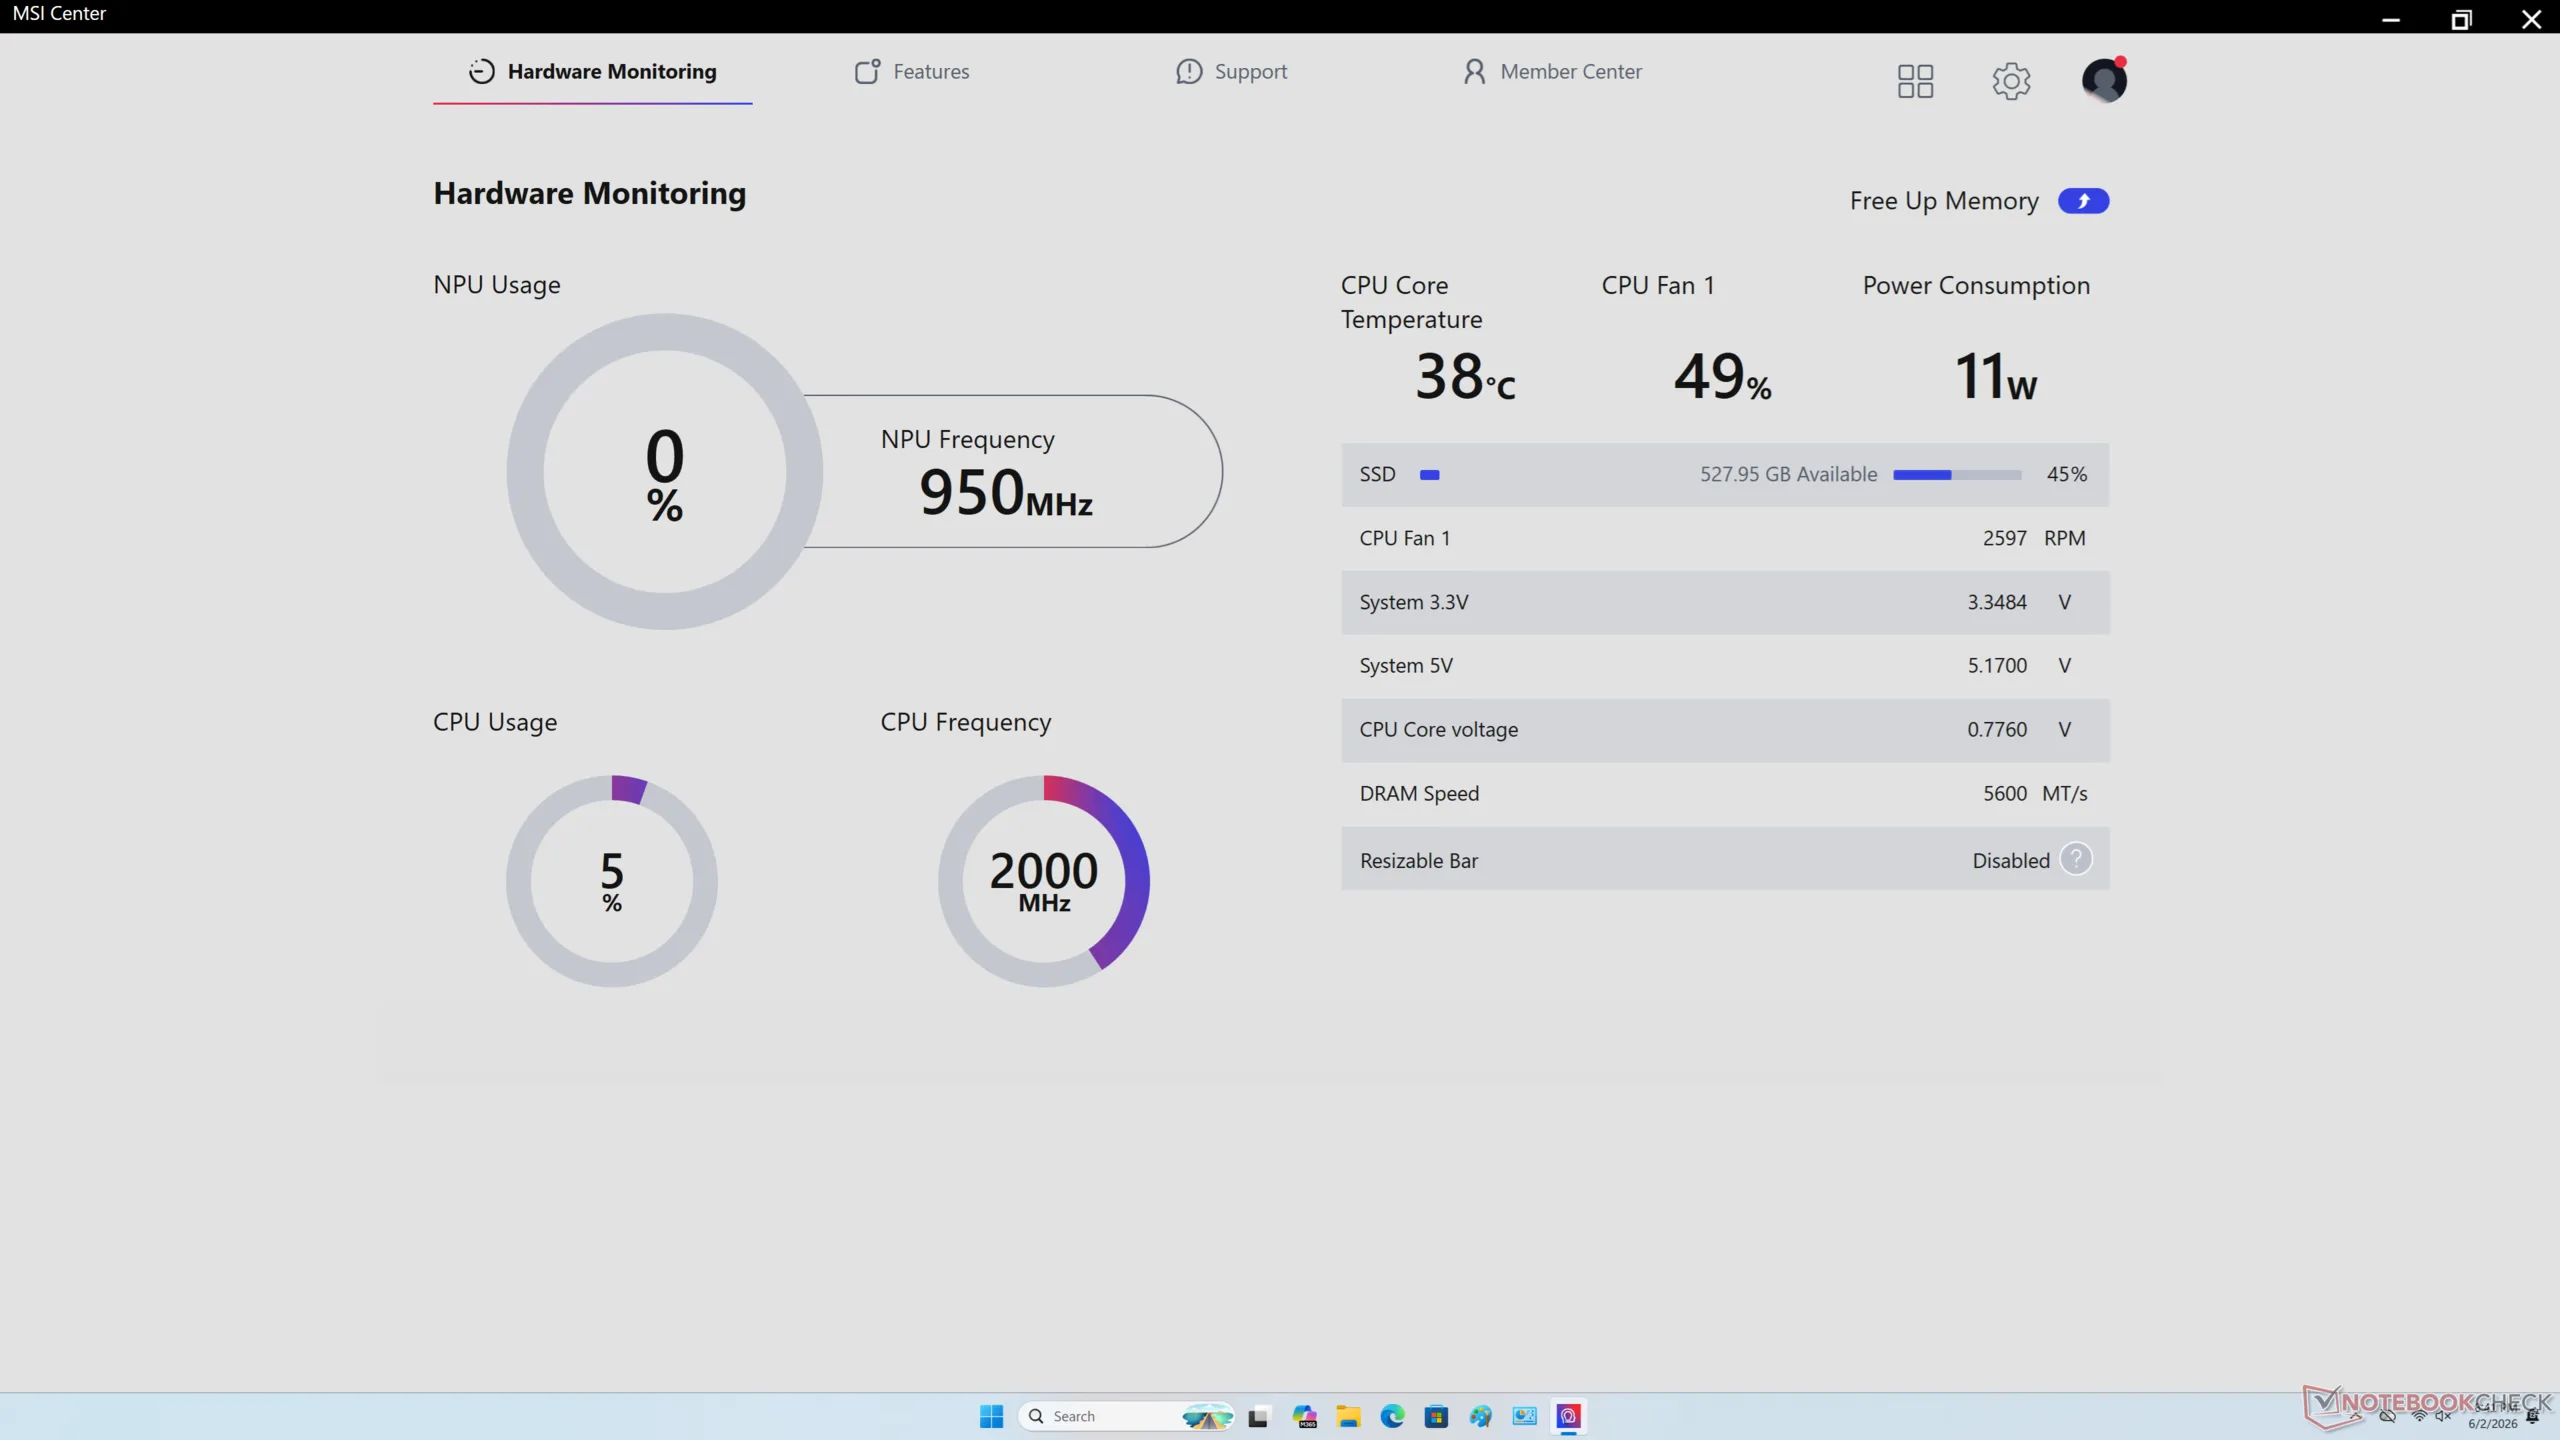
We set MSI Center to Performance mode prior to running the benchmarks below.
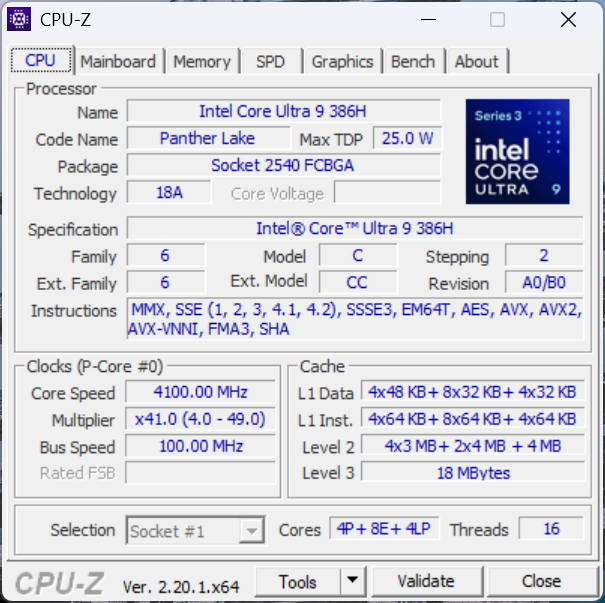
Processor

The Cubi AI 3MG ships with the same Core Ultra 9 386H CPU as found on the latest Razer Blade 16. However, raw multi-thread performance is about 18 percent slower on the MSI due to limited Turbo Boost potential. When running CineBench R15 xT in a loop, for example, the initial score of 2792 points would drop to 2380 points after just a couple of rounds as shown by our comparison graph below.

Raw performance is nevertheless much faster than last year's Cubi AI+ 2MG by 50 to 60 percent even after accounting for any throttling.

Cinebench R15 Multi Loop

065130195260325390455520585650715780845910975104011051170123513001365143014951560162516901755182018851950201520802145221022752340240524702535260026652730279528602925299030553120Tooltip
MSI Cubi NUC AI+ 3MG Intel Core Ultra 9 386H: Ø2385 (2352.8-2791.74)
GMK NucBox K16 AMD Ryzen 7 7735HS: Ø2017 (1972.78-2038.11)
GMK EVO-T1 Intel Core Ultra 9 285H: Ø3047 (3002.55-3112.11)
Geekom A5 Pro AMD Ryzen 5 7530U: Ø1095 (1078.55-1234.53)
Asus NUC 15 Pro+ Intel Core Ultra 9 285H: Ø3009 (2951.59-3148.12)
MSI Cubi NUC AI+ 2MG Intel Core Ultra 7 258V: Ø1475 (1459.06-1488.32)
MSI Cubi NUC 1M Intel Core 7 150U: Ø971 (535.59-1039.66)
Razer Blade 16 Core Ultra 9 386H Intel Core Ultra 9 386H: Ø2941 (2806.23-3172.09)
CPU Performance rating: Percent
Cinebench R23: Multi Core | Single Core
Cinebench R20: CPU (Multi Core) | CPU (Single Core)
Cinebench R15: CPU Multi 64Bit | CPU Single 64Bit
Blender: v2.79 BMW27 CPU
7-Zip 18.03: 7z b 4 | 7z b 4 -mmt1
Geekbench 6.6: Multi-Core | Single-Core
Geekbench 5.5: Multi-Core | Single-Core
HWBOT x265 Benchmark v2.2: 4k Preset
LibreOffice : 20 Documents To PDF
R Benchmark 2.5: Overall mean
CPU Performance rating
Minisforum AI X1 Pro, HX 470
AMD Ryzen AI 9 HX 470
83.4 pt
Asus NUC 15 Pro+
Intel Core Ultra 9 285H
82.8 pt
GMK EVO-T1
Intel Core Ultra 9 285H
82.4 pt
Peladn HO5, AI 9 HX 370
AMD Ryzen AI 9 HX 370
81.8 pt
Average Intel Core Ultra 9 386H
 
81.6 pt
MSI Cubi NUC AI+ 3MG
Intel Core Ultra 9 386H
74.9 pt
GMK NucBox K13
Intel Core Ultra 7 256V
61.7 pt
HP EliteBoard G1a AI
AMD Ryzen AI 5 PRO 340
61.6 pt
MSI Cubi NUC AI+ 2MG
Intel Core Ultra 7 258V
60.4 pt
GMK NucBox K16
AMD Ryzen 7 7735HS
54.3 pt
MSI Cubi NUC 1M
Intel Core 7 150U
53.8 pt
Minix Elite EU512-AI -2!
Intel Core Ultra 5 125H
51 pt
Geekom A5 Pro
AMD Ryzen 5 7530U
44.2 pt
Cinebench R23 / Multi Core
Minisforum AI X1 Pro, HX 470
AMD Ryzen AI 9 HX 470
23208 Points +36%
Asus NUC 15 Pro+
Intel Core Ultra 9 285H
20882 Points +23%
GMK EVO-T1
Intel Core Ultra 9 285H
20681 Points +22%
Peladn HO5, AI 9 HX 370
AMD Ryzen AI 9 HX 370
20354 Points +20%
Average Intel Core Ultra 9 386H
  (12144 - 21100, n=6)
18699 Points +10%
MSI Cubi NUC AI+ 3MG
Intel Core Ultra 9 386H
17015 (15002.4min - 17015.3max) Points
Minix Elite EU512-AI
Intel Core Ultra 5 125H
13747 Points -19%
GMK NucBox K16
AMD Ryzen 7 7735HS
13106 (12766.6min - 13106.2max) Points -23%
HP EliteBoard G1a AI
AMD Ryzen AI 5 PRO 340
11534 (11318.7min - 11534.4max) Points -32%
GMK NucBox K13
Intel Core Ultra 7 256V
10864 (10591.5min - 10864.2max) Points -36%
MSI Cubi NUC AI+ 2MG
Intel Core Ultra 7 258V
10524 (10414.4min - 10524.2max) Points -38%
MSI Cubi NUC 1M
Intel Core 7 150U
7226 (6983.97min - 7226.42max) Points -58%
Geekom A5 Pro
AMD Ryzen 5 7530U
6985 Points -59%
Cinebench R23 / Single Core
Asus NUC 15 Pro+
Intel Core Ultra 9 285H
2166 Points +8%
GMK EVO-T1
Intel Core Ultra 9 285H
2105 Points +5%
Minisforum AI X1 Pro, HX 470
AMD Ryzen AI 9 HX 470
2072 Points +3%
Average Intel Core Ultra 9 386H
  (2010 - 2101, n=6)
2069 Points +3%
MSI Cubi NUC AI+ 3MG
Intel Core Ultra 9 386H
2010 Points
Peladn HO5, AI 9 HX 370
AMD Ryzen AI 9 HX 370
1998 Points -1%
MSI Cubi NUC AI+ 2MG
Intel Core Ultra 7 258V
1957 Points -3%
GMK NucBox K13
Intel Core Ultra 7 256V
1909 Points -5%
MSI Cubi NUC 1M
Intel Core 7 150U
1878 Points -7%
HP EliteBoard G1a AI
AMD Ryzen AI 5 PRO 340
1802 Points -10%
Minix Elite EU512-AI
Intel Core Ultra 5 125H
1620 Points -19%
GMK NucBox K16
AMD Ryzen 7 7735HS
1552 Points -23%
Geekom A5 Pro
AMD Ryzen 5 7530U
1435 Points -29%
Cinebench R20 / CPU (Multi Core)
Minisforum AI X1 Pro, HX 470
AMD Ryzen AI 9 HX 470
9120 Points +36%
Asus NUC 15 Pro+
Intel Core Ultra 9 285H
8172 Points +22%
GMK EVO-T1
Intel Core Ultra 9 285H
8068 Points +20%
Peladn HO5, AI 9 HX 370
AMD Ryzen AI 9 HX 370
8003 Points +19%
Average Intel Core Ultra 9 386H
  (4757 - 8299, n=6)
7350 Points +9%
MSI Cubi NUC AI+ 3MG
Intel Core Ultra 9 386H
6724 Points
Minix Elite EU512-AI
Intel Core Ultra 5 125H
5212 Points -22%
GMK NucBox K16
AMD Ryzen 7 7735HS
4995 Points -26%
HP EliteBoard G1a AI
AMD Ryzen AI 5 PRO 340
4390 Points -35%
GMK NucBox K13
Intel Core Ultra 7 256V
4233 Points -37%
MSI Cubi NUC AI+ 2MG
Intel Core Ultra 7 258V
4121 Points -39%
MSI Cubi NUC 1M
Intel Core 7 150U
2821 Points -58%
Geekom A5 Pro
AMD Ryzen 5 7530U
2780 Points -59%
Cinebench R20 / CPU (Single Core)
Asus NUC 15 Pro+
Intel Core Ultra 9 285H
837 Points +9%
Minisforum AI X1 Pro, HX 470
AMD Ryzen AI 9 HX 470
815 Points +6%
GMK EVO-T1
Intel Core Ultra 9 285H
809 Points +5%
Average Intel Core Ultra 9 386H
  (767 - 796, n=6)
788 Points +3%
MSI Cubi NUC AI+ 3MG
Intel Core Ultra 9 386H
767 Points
MSI Cubi NUC AI+ 2MG
Intel Core Ultra 7 258V
741 Points -3%
Peladn HO5, AI 9 HX 370
AMD Ryzen AI 9 HX 370
737 Points -4%
GMK NucBox K13
Intel Core Ultra 7 256V
733 Points -4%
MSI Cubi NUC 1M
Intel Core 7 150U
718 Points -6%
HP EliteBoard G1a AI
AMD Ryzen AI 5 PRO 340
705 Points -8%
Minix Elite EU512-AI
Intel Core Ultra 5 125H
623 Points -19%
GMK NucBox K16
AMD Ryzen 7 7735HS
593 Points -23%
Geekom A5 Pro
AMD Ryzen 5 7530U
558 Points -27%
Cinebench R15 / CPU Multi 64Bit
Minisforum AI X1 Pro, HX 470
AMD Ryzen AI 9 HX 470
3494 Points +25%
Asus NUC 15 Pro+
Intel Core Ultra 9 285H
3151 Points +13%
GMK EVO-T1
Intel Core Ultra 9 285H
3137 Points +12%
Peladn HO5, AI 9 HX 370
AMD Ryzen AI 9 HX 370
3050 Points +9%
Average Intel Core Ultra 9 386H
  (2197 - 3303, n=6)
3003 Points +8%
MSI Cubi NUC AI+ 3MG
Intel Core Ultra 9 386H
2792 (2352.8min - 2791.74max) Points
Minix Elite EU512-AI
Intel Core Ultra 5 125H
2077 (2026.86min - 2076.52max) Points -26%
GMK NucBox K16
AMD Ryzen 7 7735HS
2038 (1972.78min - 2038.11max) Points -27%
HP EliteBoard G1a AI
AMD Ryzen AI 5 PRO 340
1743 (1653.23min - 1742.69max) Points -38%
GMK NucBox K13
Intel Core Ultra 7 256V
1609 (1564.76min - 1609.27max) Points -42%
MSI Cubi NUC AI+ 2MG
Intel Core Ultra 7 258V
1488 (1459.06min - 1488.32max) Points -47%
Geekom A5 Pro
AMD Ryzen 5 7530U
1101 Points -61%
MSI Cubi NUC 1M
Intel Core 7 150U
1040 (535.59min - 1039.66max) Points -63%
Cinebench R15 / CPU Single 64Bit
Asus NUC 15 Pro+
Intel Core Ultra 9 285H
322 Points +17%
Minisforum AI X1 Pro, HX 470
AMD Ryzen AI 9 HX 470
318 Points +15%
GMK EVO-T1
Intel Core Ultra 9 285H
309 Points +12%
Peladn HO5, AI 9 HX 370
AMD Ryzen AI 9 HX 370
302 Points +9%
MSI Cubi NUC AI+ 2MG
Intel Core Ultra 7 258V
297 Points +8%
Average Intel Core Ultra 9 386H
  (249 - 314, n=6)
293 Points +6%
GMK NucBox K13
Intel Core Ultra 7 256V
289 Points +5%
HP EliteBoard G1a AI
AMD Ryzen AI 5 PRO 340
276 Points 0%
MSI Cubi NUC AI+ 3MG
Intel Core Ultra 9 386H
276 Points
MSI Cubi NUC 1M
Intel Core 7 150U
258 Points -7%
GMK NucBox K16
AMD Ryzen 7 7735HS
244 Points -12%
Minix Elite EU512-AI
Intel Core Ultra 5 125H
235 Points -15%
Geekom A5 Pro
AMD Ryzen 5 7530U
231 Points -16%
Blender / v2.79 BMW27 CPU
MSI Cubi NUC 1M
Intel Core 7 150U
451 Seconds * -115%
Geekom A5 Pro
AMD Ryzen 5 7530U
448 Seconds * -113%
MSI Cubi NUC AI+ 2MG
Intel Core Ultra 7 258V
326 Seconds * -55%
GMK NucBox K13
Intel Core Ultra 7 256V
315 Seconds * -50%
HP EliteBoard G1a AI
AMD Ryzen AI 5 PRO 340
282 Seconds * -34%
GMK NucBox K16
AMD Ryzen 7 7735HS
245 Seconds * -17%
Minix Elite EU512-AI
Intel Core Ultra 5 125H
239 Seconds * -14%
MSI Cubi NUC AI+ 3MG
Intel Core Ultra 9 386H
210 Seconds *
Average Intel Core Ultra 9 386H
  (156 - 299, n=6)
193 Seconds * +8%
GMK EVO-T1
Intel Core Ultra 9 285H
166 Seconds * +21%
Asus NUC 15 Pro+
Intel Core Ultra 9 285H
163 Seconds * +22%
Peladn HO5, AI 9 HX 370
AMD Ryzen AI 9 HX 370
162 Seconds * +23%
Minisforum AI X1 Pro, HX 470
AMD Ryzen AI 9 HX 470
141 Seconds * +33%
7-Zip 18.03 / 7z b 4
Peladn HO5, AI 9 HX 370
AMD Ryzen AI 9 HX 370
77342 MIPS +34%
Minisforum AI X1 Pro, HX 470
AMD Ryzen AI 9 HX 470
73258 MIPS +27%
Asus NUC 15 Pro+
Intel Core Ultra 9 285H
67343 MIPS +17%
GMK EVO-T1
Intel Core Ultra 9 285H
65478 MIPS +14%
Average Intel Core Ultra 9 386H
  (44980 - 72882, n=6)
65192 MIPS +13%
MSI Cubi NUC AI+ 3MG
Intel Core Ultra 9 386H
57560 MIPS
GMK NucBox K16
AMD Ryzen 7 7735HS
48997 MIPS -15%
HP EliteBoard G1a AI
AMD Ryzen AI 5 PRO 340
43667 MIPS -24%
GMK NucBox K13
Intel Core Ultra 7 256V
36572 MIPS -36%
Geekom A5 Pro
AMD Ryzen 5 7530U
35907 MIPS -38%
MSI Cubi NUC AI+ 2MG
Intel Core Ultra 7 258V
34645 MIPS -40%
MSI Cubi NUC 1M
Intel Core 7 150U
31447 MIPS -45%
Minix Elite EU512-AI
Intel Core Ultra 5 125H
0 MIPS -100%
7-Zip 18.03 / 7z b 4 -mmt1
Minisforum AI X1 Pro, HX 470
AMD Ryzen AI 9 HX 470
6368 MIPS +16%
Average Intel Core Ultra 9 386H
  (5488 - 6493, n=6)
6158 MIPS +12%
Asus NUC 15 Pro+
Intel Core Ultra 9 285H
6111 MIPS +11%
GMK EVO-T1
Intel Core Ultra 9 285H
6039 MIPS +10%
Peladn HO5, AI 9 HX 370
AMD Ryzen AI 9 HX 370
6022 MIPS +10%
MSI Cubi NUC 1M
Intel Core 7 150U
5898 MIPS +7%
MSI Cubi NUC AI+ 2MG
Intel Core Ultra 7 258V
5816 MIPS +6%
GMK NucBox K13
Intel Core Ultra 7 256V
5763 MIPS +5%
HP EliteBoard G1a AI
AMD Ryzen AI 5 PRO 340
5584 MIPS +2%
MSI Cubi NUC AI+ 3MG
Intel Core Ultra 9 386H
5488 MIPS
Geekom A5 Pro
AMD Ryzen 5 7530U
5386 MIPS -2%
GMK NucBox K16
AMD Ryzen 7 7735HS
5377 MIPS -2%
Minix Elite EU512-AI
Intel Core Ultra 5 125H
4961 MIPS -10%
Geekbench 6.6 / Multi-Core
Asus NUC 15 Pro+
Intel Core Ultra 9 285H
16207 Points +13%
Average Intel Core Ultra 9 386H
  (13776 - 17405, n=8)
15982 Points +12%
GMK EVO-T1
Intel Core Ultra 9 285H
15339 Points +7%
MSI Cubi NUC AI+ 3MG
Intel Core Ultra 9 386H
14323 Points
Peladn HO5, AI 9 HX 370
AMD Ryzen AI 9 HX 370
14203 Points -1%
Minisforum AI X1 Pro, HX 470
AMD Ryzen AI 9 HX 470
11437 Points -20%
HP EliteBoard G1a AI
AMD Ryzen AI 5 PRO 340
11409 Points -20%
GMK NucBox K13
Intel Core Ultra 7 256V
10784 Points -25%
MSI Cubi NUC AI+ 2MG
Intel Core Ultra 7 258V
8964 Points -37%
MSI Cubi NUC 1M
Intel Core 7 150U
8756 Points -39%
Geekom A5 Pro
AMD Ryzen 5 7530U
7067 Points -51%
GMK NucBox K16
AMD Ryzen 7 7735HS
7046 Points -51%
Geekbench 6.6 / Single-Core
Minisforum AI X1 Pro, HX 470
AMD Ryzen AI 9 HX 470
2881 Points +4%
GMK EVO-T1
Intel Core Ultra 9 285H
2878 Points +4%
Average Intel Core Ultra 9 386H
  (2778 - 2919, n=8)
2873 Points +3%
Peladn HO5, AI 9 HX 370
AMD Ryzen AI 9 HX 370
2845 Points +2%
MSI Cubi NUC AI+ 3MG
Intel Core Ultra 9 386H
2778 Points
GMK NucBox K13
Intel Core Ultra 7 256V
2750 Points -1%
MSI Cubi NUC AI+ 2MG
Intel Core Ultra 7 258V
2748 Points -1%
Asus NUC 15 Pro+
Intel Core Ultra 9 285H
2694 Points -3%
MSI Cubi NUC 1M
Intel Core 7 150U
2646 Points -5%
HP EliteBoard G1a AI
AMD Ryzen AI 5 PRO 340
2640 Points -5%
Geekom A5 Pro
AMD Ryzen 5 7530U
1991 Points -28%
GMK NucBox K16
AMD Ryzen 7 7735HS
1949 Points -30%
Geekbench 5.5 / Multi-Core
Average Intel Core Ultra 9 386H
  (13098 - 17557, n=6)
16061 Points +12%
Asus NUC 15 Pro+
Intel Core Ultra 9 285H
15703 Points +10%
GMK EVO-T1
Intel Core Ultra 9 285H
15175 Points +6%
Peladn HO5, AI 9 HX 370
AMD Ryzen AI 9 HX 370
14888 Points +4%
MSI Cubi NUC AI+ 3MG
Intel Core Ultra 9 386H
14283 Points
Minisforum AI X1 Pro, HX 470
AMD Ryzen AI 9 HX 470
12418 Points -13%
HP EliteBoard G1a AI
AMD Ryzen AI 5 PRO 340
9339 Points -35%
Minix Elite EU512-AI
Intel Core Ultra 5 125H
9069 Points -37%
GMK NucBox K13
Intel Core Ultra 7 256V
9044 Points -37%
MSI Cubi NUC 1M
Intel Core 7 150U
7788 Points -45%
MSI Cubi NUC AI+ 2MG
Intel Core Ultra 7 258V
7574 Points -47%
GMK NucBox K16
AMD Ryzen 7 7735HS
7151 Points -50%
Geekom A5 Pro
AMD Ryzen 5 7530U
6275 Points -56%
Geekbench 5.5 / Single-Core
Average Intel Core Ultra 9 386H
  (1992 - 2162, n=6)
2108 Points +6%
Peladn HO5, AI 9 HX 370
AMD Ryzen AI 9 HX 370
2056 Points +3%
GMK EVO-T1
Intel Core Ultra 9 285H
2024 Points +2%
MSI Cubi NUC AI+ 2MG
Intel Core Ultra 7 258V
2022 Points +2%
GMK NucBox K13
Intel Core Ultra 7 256V
2001 Points 0%
MSI Cubi NUC AI+ 3MG
Intel Core Ultra 9 386H
1992 Points
Minisforum AI X1 Pro, HX 470
AMD Ryzen AI 9 HX 470
1967 Points -1%
HP EliteBoard G1a AI
AMD Ryzen AI 5 PRO 340
1938 Points -3%
MSI Cubi NUC 1M
Intel Core 7 150U
1910 Points -4%
Asus NUC 15 Pro+
Intel Core Ultra 9 285H
1689 Points -15%
Minix Elite EU512-AI
Intel Core Ultra 5 125H
1639 Points -18%
Geekom A5 Pro
AMD Ryzen 5 7530U
1512 Points -24%
GMK NucBox K16
AMD Ryzen 7 7735HS
1476 Points -26%
HWBOT x265 Benchmark v2.2 / 4k Preset
Asus NUC 15 Pro+
Intel Core Ultra 9 285H
24.9 fps +28%
Peladn HO5, AI 9 HX 370
AMD Ryzen AI 9 HX 370
24.9 fps +28%
Minisforum AI X1 Pro, HX 470
AMD Ryzen AI 9 HX 470
24.9 fps +28%
GMK EVO-T1
Intel Core Ultra 9 285H
23.6 fps +21%
Average Intel Core Ultra 9 386H
  (13.2 - 24.8, n=6)
21.9 fps +12%
MSI Cubi NUC AI+ 3MG
Intel Core Ultra 9 386H
19.5 fps
HP EliteBoard G1a AI
AMD Ryzen AI 5 PRO 340
15.4 fps -21%
Minix Elite EU512-AI
Intel Core Ultra 5 125H
14.3 fps -27%
GMK NucBox K13
Intel Core Ultra 7 256V
13.9 fps -29%
MSI Cubi NUC AI+ 2MG
Intel Core Ultra 7 258V
13.3 fps -32%
GMK NucBox K16
AMD Ryzen 7 7735HS
12.3 fps -37%
Geekom A5 Pro
AMD Ryzen 5 7530U
9.07 fps -53%
MSI Cubi NUC 1M
Intel Core 7 150U
8.57 fps -56%
LibreOffice / 20 Documents To PDF
Minix Elite EU512-AI
Intel Core Ultra 5 125H
65.8 s * -21%
HP EliteBoard G1a AI
AMD Ryzen AI 5 PRO 340
60.3 s * -11%
Minisforum AI X1 Pro, HX 470
AMD Ryzen AI 9 HX 470
59.9 s * -10%
GMK NucBox K16
AMD Ryzen 7 7735HS
59.3 s * -9%
Geekom A5 Pro
AMD Ryzen 5 7530U
58.9 s * -8%
Peladn HO5, AI 9 HX 370
AMD Ryzen AI 9 HX 370
58.8 s * -8%
Asus NUC 15 Pro+
Intel Core Ultra 9 285H
56.1 s * -3%
GMK EVO-T1
Intel Core Ultra 9 285H
54.3 s * -0%
MSI Cubi NUC AI+ 3MG
Intel Core Ultra 9 386H
54.3 s *
GMK NucBox K13
Intel Core Ultra 7 256V
50.1 s * +8%
Average Intel Core Ultra 9 386H
  (38.5 - 56.1, n=6)
46.8 s * +14%
MSI Cubi NUC AI+ 2MG
Intel Core Ultra 7 258V
45.1 s * +17%
MSI Cubi NUC 1M
Intel Core 7 150U
37.9 s * +30%
R Benchmark 2.5 / Overall mean
Minix Elite EU512-AI
Intel Core Ultra 5 125H
0.565 sec * -31%
GMK NucBox K16
AMD Ryzen 7 7735HS
0.547 sec * -26%
Geekom A5 Pro
AMD Ryzen 5 7530U
0.519 sec * -20%
MSI Cubi NUC AI+ 2MG
Intel Core Ultra 7 258V
0.4505 sec * -4%
HP EliteBoard G1a AI
AMD Ryzen AI 5 PRO 340
0.4479 sec * -4%
GMK NucBox K13
Intel Core Ultra 7 256V
0.4468 sec * -3%
MSI Cubi NUC 1M
Intel Core 7 150U
0.4438 sec * -3%
GMK EVO-T1
Intel Core Ultra 9 285H
0.4428 sec * -2%
Asus NUC 15 Pro+
Intel Core Ultra 9 285H
0.4413 sec * -2%
MSI Cubi NUC AI+ 3MG
Intel Core Ultra 9 386H
0.4326 sec *
Average Intel Core Ultra 9 386H
  (0.4055 - 0.4384, n=6)
0.4249 sec * +2%
Peladn HO5, AI 9 HX 370
AMD Ryzen AI 9 HX 370
0.4183 sec * +3%
Minisforum AI X1 Pro, HX 470
AMD Ryzen AI 9 HX 470
0.4031 sec * +7%
CPU Performance rating: Percent
Cinebench R23: Multi Core | Single Core
Cinebench R20: CPU (Multi Core) | CPU (Single Core)
Cinebench R15: CPU Multi 64Bit | CPU Single 64Bit
Blender: v2.79 BMW27 CPU
7-Zip 18.03: 7z b 4 | 7z b 4 -mmt1
Geekbench 6.6: Multi-Core | Single-Core
Geekbench 5.5: Multi-Core | Single-Core
HWBOT x265 Benchmark v2.2: 4k Preset
LibreOffice : 20 Documents To PDF
R Benchmark 2.5: Overall mean

* ... smaller is better

Cinebench R15 CPU Multi 64Bit
2792 Points
Cinebench R15 OpenGL 64Bit
191.7 fps
Cinebench R15 Ref. Match 64Bit
97.8 %
Cinebench R15 CPU Single 64Bit
276 Points
Cinebench R20 CPU (Multi Core)
6724 Points
Cinebench R20 CPU (Single Core)
767 Points
Cinebench R23 Single Core
2010 Points
Cinebench R23 Multi Core
17015 Points
Cinebench 2024 CPU Single Core
118.1 Points
Cinebench 2024 CPU Multi Core
940 Points
Help
Performance rating
Asus NUC 15 Pro+ -1!
Intel Core Ultra 9 285H, Arc 140T
93.8 pt
Average Intel Core Ultra 9 386H -1!
 
82.7 pt
GMK EVO-T1
Intel Core Ultra 9 285H, Arc 140T
81.2 pt
MSI Cubi NUC AI+ 3MG -1!
Intel Core Ultra 9 386H, Intel Graphics 4 Xe3 PTL
69.3 pt
GMK NucBox K16 -1!
AMD Ryzen 7 7735HS, Radeon 680M
68.6 pt
MSI Cubi NUC AI+ 2MG -1!
Intel Core Ultra 7 258V, Arc 140V
53.7 pt
Geekom A5 Pro
AMD Ryzen 5 7530U, Vega 7
43.3 pt
MSI Cubi NUC 1M -1!
Intel Core 7 150U, Iris Xe G7 96EUs
39.6 pt
AIDA64 / FP32 Ray-Trace
Asus NUC 15 Pro+
Intel Core Ultra 9 285H, Arc 140T (v6.92.6600)
23948 KRay/s +61%
GMK EVO-T1
Intel Core Ultra 9 285H, Arc 140T (v6.92.6600)
23041 KRay/s +54%
GMK EVO-T1
Intel Core Ultra 9 285H, Arc 140T (v8.20.8100)
16836 KRay/s +13%
Average Intel Core Ultra 9 386H
  (10001 - 21727, n=6)
18120 KRay/s +21%
GMK NucBox K16
AMD Ryzen 7 7735HS, Radeon 680M (v8.20.8100)
15228 KRay/s +2%
MSI Cubi NUC AI+ 3MG
Intel Core Ultra 9 386H, Intel Graphics 4 Xe3 PTL (v8.20.8100)
14919 KRay/s
MSI Cubi NUC AI+ 2MG
Intel Core Ultra 7 258V, Arc 140V (v6.92.6600)
12094 KRay/s -19%
Geekom A5 Pro
AMD Ryzen 5 7530U, Vega 7 (v8.20.8100)
7636 KRay/s -49%
Geekom A5 Pro
AMD Ryzen 5 7530U, Vega 7 (v6.92.6600)
7609 KRay/s -49%
MSI Cubi NUC 1M
Intel Core 7 150U, Iris Xe G7 96EUs (v6.92.6600)
6306 KRay/s -58%
AIDA64 / FPU Julia
Asus NUC 15 Pro+
Intel Core Ultra 9 285H, Arc 140T (v6.92.6600)
115042 Points +49%
GMK EVO-T1
Intel Core Ultra 9 285H, Arc 140T (v6.92.6600)
114534 Points +49%
GMK EVO-T1
Intel Core Ultra 9 285H, Arc 140T (v8.20.8100)
86627 Points +12%
Average Intel Core Ultra 9 386H
  (53370 - 113595, n=6)
95516 Points +24%
GMK NucBox K16
AMD Ryzen 7 7735HS, Radeon 680M (v8.20.8100)
94932 Points +23%
MSI Cubi NUC AI+ 3MG
Intel Core Ultra 9 386H, Intel Graphics 4 Xe3 PTL (v8.20.8100)
77104 Points
MSI Cubi NUC AI+ 2MG
Intel Core Ultra 7 258V, Arc 140V (v6.92.6600)
60874 Points -21%
Geekom A5 Pro
AMD Ryzen 5 7530U, Vega 7 (v8.20.8100)
48663 Points -37%
Geekom A5 Pro
AMD Ryzen 5 7530U, Vega 7 (v6.92.6600)
48473 Points -37%
MSI Cubi NUC 1M
Intel Core 7 150U, Iris Xe G7 96EUs (v6.92.6600)
32582 Points -58%
AIDA64 / CPU SHA3
Asus NUC 15 Pro+
Intel Core Ultra 9 285H, Arc 140T (v6.92.6600)
5482 MB/s +40%
GMK EVO-T1
Intel Core Ultra 9 285H, Arc 140T (v6.92.6600)
5093 MB/s +30%
GMK EVO-T1
Intel Core Ultra 9 285H, Arc 140T (v8.20.8100)
4030 MB/s +3%
Average Intel Core Ultra 9 386H
  (2776 - 5604, n=6)
4764 MB/s +22%
MSI Cubi NUC AI+ 3MG
Intel Core Ultra 9 386H, Intel Graphics 4 Xe3 PTL (v8.20.8100)
3907 MB/s
GMK NucBox K16
AMD Ryzen 7 7735HS, Radeon 680M (v8.20.8100)
3191 MB/s -18%
MSI Cubi NUC AI+ 2MG
Intel Core Ultra 7 258V, Arc 140V (v6.92.6600)
2705 MB/s -31%
MSI Cubi NUC 1M
Intel Core 7 150U, Iris Xe G7 96EUs (v6.92.6600)
1656 MB/s -58%
Geekom A5 Pro
AMD Ryzen 5 7530U, Vega 7 (v6.92.6600)
1620 MB/s -59%
Geekom A5 Pro
AMD Ryzen 5 7530U, Vega 7 (v8.20.8100)
1591 MB/s -59%
AIDA64 / CPU Queen
Asus NUC 15 Pro+
Intel Core Ultra 9 285H, Arc 140T (v6.92.6600)
67363 Points
Geekom A5 Pro
AMD Ryzen 5 7530U, Vega 7 (v6.92.6600)
66646 Points
MSI Cubi NUC 1M
Intel Core 7 150U, Iris Xe G7 96EUs (v6.92.6600)
62280 Points
GMK EVO-T1
Intel Core Ultra 9 285H, Arc 140T (v6.92.6600)
58606 Points
MSI Cubi NUC AI+ 2MG
Intel Core Ultra 7 258V, Arc 140V (v6.92.6600)
49605 Points
AIDA64 / FPU SinJulia
GMK NucBox K16
AMD Ryzen 7 7735HS, Radeon 680M (v8.20.8100)
12842 Points +104%
Asus NUC 15 Pro+
Intel Core Ultra 9 285H, Arc 140T (v6.92.6600)
8550 Points +36%
GMK EVO-T1
Intel Core Ultra 9 285H, Arc 140T (v6.92.6600)
8074 Points +28%
GMK EVO-T1
Intel Core Ultra 9 285H, Arc 140T (v8.20.8100)
7570 Points +20%
Geekom A5 Pro
AMD Ryzen 5 7530U, Vega 7 (v6.92.6600)
7619 Points +21%
Geekom A5 Pro
AMD Ryzen 5 7530U, Vega 7 (v8.20.8100)
7611 Points +21%
Average Intel Core Ultra 9 386H
  (5314 - 7332, n=6)
6812 Points +8%
MSI Cubi NUC AI+ 3MG
Intel Core Ultra 9 386H, Intel Graphics 4 Xe3 PTL (v8.20.8100)
6300 Points
MSI Cubi NUC AI+ 2MG
Intel Core Ultra 7 258V, Arc 140V (v6.92.6600)
4425 Points -30%
MSI Cubi NUC 1M
Intel Core 7 150U, Iris Xe G7 96EUs (v6.92.6600)
4387 Points -30%
AIDA64 / FPU Mandel
GMK EVO-T1
Intel Core Ultra 9 285H, Arc 140T (v6.92.6600)
60511 Points +46%
GMK EVO-T1
Intel Core Ultra 9 285H, Arc 140T (v8.20.8100)
45082 Points +9%
Asus NUC 15 Pro+
Intel Core Ultra 9 285H, Arc 140T (v6.92.6600)
60319 Points +46%
GMK NucBox K16
AMD Ryzen 7 7735HS, Radeon 680M (v8.20.8100)
52490 Points +27%
Average Intel Core Ultra 9 386H
  (28414 - 61578, n=6)
50792 Points +23%
MSI Cubi NUC AI+ 3MG
Intel Core Ultra 9 386H, Intel Graphics 4 Xe3 PTL (v8.20.8100)
41337 Points
MSI Cubi NUC AI+ 2MG
Intel Core Ultra 7 258V, Arc 140V (v6.92.6600)
31593 Points -24%
Geekom A5 Pro
AMD Ryzen 5 7530U, Vega 7 (v6.92.6600)
26914 Points -35%
Geekom A5 Pro
AMD Ryzen 5 7530U, Vega 7 (v8.20.8100)
26912 Points -35%
MSI Cubi NUC 1M
Intel Core 7 150U, Iris Xe G7 96EUs (v6.92.6600)
16042 Points -61%
AIDA64 / CPU AES
Asus NUC 15 Pro+
Intel Core Ultra 9 285H, Arc 140T (v6.92.6600)
78003 MB/s +33%
GMK EVO-T1
Intel Core Ultra 9 285H, Arc 140T (v6.92.6600)
72638 MB/s +24%
GMK EVO-T1
Intel Core Ultra 9 285H, Arc 140T (v8.20.8100)
64197 MB/s +10%
Average Intel Core Ultra 9 386H
  (46362 - 72112, n=6)
64579 MB/s +10%
GMK NucBox K16
AMD Ryzen 7 7735HS, Radeon 680M (v8.20.8100)
62720 MB/s +7%
MSI Cubi NUC AI+ 3MG
Intel Core Ultra 9 386H, Intel Graphics 4 Xe3 PTL (v8.20.8100)
58549 MB/s
MSI Cubi NUC AI+ 2MG
Intel Core Ultra 7 258V, Arc 140V (v6.92.6600)
40408 MB/s -31%
Geekom A5 Pro
AMD Ryzen 5 7530U, Vega 7 (v6.92.6600)
33618 MB/s -43%
Geekom A5 Pro
AMD Ryzen 5 7530U, Vega 7 (v8.20.8100)
33497 MB/s -43%
MSI Cubi NUC 1M
Intel Core 7 150U, Iris Xe G7 96EUs (v6.92.6600)
33007 MB/s -44%
AIDA64 / CPU ZLib
Asus NUC 15 Pro+
Intel Core Ultra 9 285H, Arc 140T (v6.92.6600)
1271 MB/s +23%
GMK EVO-T1
Intel Core Ultra 9 285H, Arc 140T (v6.92.6600)
1167 MB/s +13%
GMK EVO-T1
Intel Core Ultra 9 285H, Arc 140T (v8.20.8100)
882 MB/s -15%
Average Intel Core Ultra 9 386H
  (669 - 1271, n=6)
1122 MB/s +9%
MSI Cubi NUC AI+ 3MG
Intel Core Ultra 9 386H, Intel Graphics 4 Xe3 PTL (v8.20.8100)
1034 MB/s
GMK NucBox K16
AMD Ryzen 7 7735HS, Radeon 680M (v8.20.8100)
821 MB/s -21%
MSI Cubi NUC AI+ 2MG
Intel Core Ultra 7 258V, Arc 140V (v6.92.6600)
596 MB/s -42%
MSI Cubi NUC 1M
Intel Core 7 150U, Iris Xe G7 96EUs (v6.92.6600)
491 MB/s -53%
Geekom A5 Pro
AMD Ryzen 5 7530U, Vega 7 (v6.92.6600)
447 MB/s -57%
Geekom A5 Pro
AMD Ryzen 5 7530U, Vega 7 (v8.20.8100)
443 MB/s -57%
AIDA64 / FP64 Ray-Trace
Asus NUC 15 Pro+
Intel Core Ultra 9 285H, Arc 140T (v6.92.6600)
12696 KRay/s +68%
GMK EVO-T1
Intel Core Ultra 9 285H, Arc 140T (v6.92.6600)
12576 KRay/s +67%
GMK EVO-T1
Intel Core Ultra 9 285H, Arc 140T (v8.20.8100)
9140 KRay/s +21%
Average Intel Core Ultra 9 386H
  (5138 - 11627, n=6)
9329 KRay/s +24%
GMK NucBox K16
AMD Ryzen 7 7735HS, Radeon 680M (v8.20.8100)
8029 KRay/s +6%
MSI Cubi NUC AI+ 3MG
Intel Core Ultra 9 386H, Intel Graphics 4 Xe3 PTL (v8.20.8100)
7552 KRay/s
MSI Cubi NUC AI+ 2MG
Intel Core Ultra 7 258V, Arc 140V (v6.92.6600)
6732 KRay/s -11%
Geekom A5 Pro
AMD Ryzen 5 7530U, Vega 7 (v8.20.8100)
4030 KRay/s -47%
Geekom A5 Pro
AMD Ryzen 5 7530U, Vega 7 (v6.92.6600)
4008 KRay/s -47%
MSI Cubi NUC 1M
Intel Core 7 150U, Iris Xe G7 96EUs (v6.92.6600)
3417 KRay/s -55%
AIDA64 / CPU PhotoWorxx
Average Intel Core Ultra 9 386H
  (54042 - 89891, n=6)
75781 MPixel/s +40%
GMK EVO-T1
Intel Core Ultra 9 285H, Arc 140T (v8.20.8100)
55170 MPixel/s +2%
GMK EVO-T1
Intel Core Ultra 9 285H, Arc 140T (v6.92.6600)
53330 MPixel/s -1%
Asus NUC 15 Pro+
Intel Core Ultra 9 285H, Arc 140T (v6.92.6600)
54590 MPixel/s +1%
MSI Cubi NUC AI+ 2MG
Intel Core Ultra 7 258V, Arc 140V (v6.92.6600)
54395 MPixel/s +1%
MSI Cubi NUC AI+ 3MG
Intel Core Ultra 9 386H, Intel Graphics 4 Xe3 PTL (v8.20.8100)
54042 MPixel/s
MSI Cubi NUC 1M
Intel Core 7 150U, Iris Xe G7 96EUs (v6.92.6600)
37889 MPixel/s -30%
Geekom A5 Pro
AMD Ryzen 5 7530U, Vega 7 (v6.92.6600)
17537 MPixel/s -68%
Geekom A5 Pro
AMD Ryzen 5 7530U, Vega 7 (v8.20.8100)
17431 MPixel/s -68%
GMK NucBox K16
AMD Ryzen 7 7735HS, Radeon 680M (v8.20.8100)
17524 MPixel/s -68%
AIDA64 / CPU CheckMate
Average Intel Core Ultra 9 386H
  (4051 - 4826, n=5)
4624 MP/s +14%
MSI Cubi NUC AI+ 3MG
Intel Core Ultra 9 386H, Intel Graphics 4 Xe3 PTL (v8.20.8100)
4051 MP/s
GMK EVO-T1
Intel Core Ultra 9 285H, Arc 140T (v8.20.8100)
3649 MP/s -10%
GMK NucBox K16
AMD Ryzen 7 7735HS, Radeon 680M (v8.20.8100)
2949 MP/s -27%
Geekom A5 Pro
AMD Ryzen 5 7530U, Vega 7 (v8.20.8100)
1743 MP/s -57%

System Performance

Average PCMark scores are higher than mini PCs running on previous generation hardware especially in the Productivity subtest
Performance rating
GMK EVO-T1
Arc 140T, Ultra 9 285H, Crucial P3 Plus CT1000P3PSSD8
89.3 pt
MSI Cubi NUC AI+ 3MG
Intel Graphics 4 Xe3 PTL, Ultra 9 386H, Phison 1 TB ESR01TBTCCZ-27J
87.4 pt
MSI Cubi NUC AI+ 2MG
Arc 140V, Core Ultra 7 258V, Phison 1 TB ESR01TBTCCZ-27J
81.6 pt
Asus NUC 15 Pro+
Arc 140T, Ultra 9 285H, Micron 3500 1TB MTFDKBA1T0TGD
80.4 pt
MSI Cubi NUC 1M -3!
Iris Xe G7 96EUs, Core 7 150U, WD PC SN560 SDDPNQE-1T00
77.6 pt
GMK NucBox K16 -3!
Radeon 680M, R7 7735HS, TWSC TSC3AN1T0-F6Q10S
63.4 pt
Geekom A5 Pro
Vega 7, R5 7530U, Wodposit WPBSN4M8-1TGP
56.3 pt
Geekbench AI / Quantized GPU 1.7
MSI Cubi NUC AI+ 2MG
Arc 140V, Core Ultra 7 258V, Phison 1 TB ESR01TBTCCZ-27J
5540 Points +31%
Asus NUC 15 Pro+
Arc 140T, Ultra 9 285H, Micron 3500 1TB MTFDKBA1T0TGD
5264 Points +24%
GMK EVO-T1
Arc 140T, Ultra 9 285H, Crucial P3 Plus CT1000P3PSSD8
5244 Points +24%
MSI Cubi NUC AI+ 3MG
Intel Graphics 4 Xe3 PTL, Ultra 9 386H, Phison 1 TB ESR01TBTCCZ-27J
4245 Points
Geekom A5 Pro
Vega 7, R5 7530U, Wodposit WPBSN4M8-1TGP
2167 Points -49%
Geekbench AI / Half Precision GPU 1.7
MSI Cubi NUC AI+ 2MG
Arc 140V, Core Ultra 7 258V, Phison 1 TB ESR01TBTCCZ-27J
16288 Points +32%
MSI Cubi NUC AI+ 3MG
Intel Graphics 4 Xe3 PTL, Ultra 9 386H, Phison 1 TB ESR01TBTCCZ-27J
12303 Points
GMK EVO-T1
Arc 140T, Ultra 9 285H, Crucial P3 Plus CT1000P3PSSD8
11903 Points -3%
Asus NUC 15 Pro+
Arc 140T, Ultra 9 285H, Micron 3500 1TB MTFDKBA1T0TGD
11899 Points -3%
Geekom A5 Pro
Vega 7, R5 7530U, Wodposit WPBSN4M8-1TGP
3796 Points -69%
Geekbench AI / Single Precision GPU 1.7
MSI Cubi NUC AI+ 2MG
Arc 140V, Core Ultra 7 258V, Phison 1 TB ESR01TBTCCZ-27J
8294 Points +34%
Asus NUC 15 Pro+
Arc 140T, Ultra 9 285H, Micron 3500 1TB MTFDKBA1T0TGD
7987 Points +29%
GMK EVO-T1
Arc 140T, Ultra 9 285H, Crucial P3 Plus CT1000P3PSSD8
7892 Points +28%
MSI Cubi NUC AI+ 3MG
Intel Graphics 4 Xe3 PTL, Ultra 9 386H, Phison 1 TB ESR01TBTCCZ-27J
6175 Points
Geekom A5 Pro
Vega 7, R5 7530U, Wodposit WPBSN4M8-1TGP
2848 Points -54%
PCMark 10 / Score
MSI Cubi NUC AI+ 3MG
Intel Graphics 4 Xe3 PTL, Ultra 9 386H, Phison 1 TB ESR01TBTCCZ-27J
8325 Points
GMK EVO-T1
Arc 140T, Ultra 9 285H, Crucial P3 Plus CT1000P3PSSD8
7798 Points -6%
Asus NUC 15 Pro+
Arc 140T, Ultra 9 285H, Micron 3500 1TB MTFDKBA1T0TGD
7196 Points -14%
MSI Cubi NUC AI+ 2MG
Arc 140V, Core Ultra 7 258V, Phison 1 TB ESR01TBTCCZ-27J
6864 Points -18%
GMK NucBox K16
Radeon 680M, R7 7735HS, TWSC TSC3AN1T0-F6Q10S
6774 Points -19%
Geekom A5 Pro
Vega 7, R5 7530U, Wodposit WPBSN4M8-1TGP
6206 Points -25%
MSI Cubi NUC 1M
Iris Xe G7 96EUs, Core 7 150U, WD PC SN560 SDDPNQE-1T00
6080 Points -27%
PCMark 10 / Essentials
MSI Cubi NUC 1M
Iris Xe G7 96EUs, Core 7 150U, WD PC SN560 SDDPNQE-1T00
10856 Points +5%
MSI Cubi NUC AI+ 3MG
Intel Graphics 4 Xe3 PTL, Ultra 9 386H, Phison 1 TB ESR01TBTCCZ-27J
10375 Points
GMK EVO-T1
Arc 140T, Ultra 9 285H, Crucial P3 Plus CT1000P3PSSD8
10307 Points -1%
MSI Cubi NUC AI+ 2MG
Arc 140V, Core Ultra 7 258V, Phison 1 TB ESR01TBTCCZ-27J
10176 Points -2%
Asus NUC 15 Pro+
Arc 140T, Ultra 9 285H, Micron 3500 1TB MTFDKBA1T0TGD
10028 Points -3%
Geekom A5 Pro
Vega 7, R5 7530U, Wodposit WPBSN4M8-1TGP
9183 Points -11%
GMK NucBox K16
Radeon 680M, R7 7735HS, TWSC TSC3AN1T0-F6Q10S
8648 Points -17%
PCMark 10 / Productivity
MSI Cubi NUC AI+ 3MG
Intel Graphics 4 Xe3 PTL, Ultra 9 386H, Phison 1 TB ESR01TBTCCZ-27J
15282 Points
Geekom A5 Pro
Vega 7, R5 7530U, Wodposit WPBSN4M8-1TGP
14037 Points -8%
GMK NucBox K16
Radeon 680M, R7 7735HS, TWSC TSC3AN1T0-F6Q10S
12153 Points -20%
GMK EVO-T1
Arc 140T, Ultra 9 285H, Crucial P3 Plus CT1000P3PSSD8
10667 Points -30%
MSI Cubi NUC AI+ 2MG
Arc 140V, Core Ultra 7 258V, Phison 1 TB ESR01TBTCCZ-27J
8912 Points -42%
Asus NUC 15 Pro+
Arc 140T, Ultra 9 285H, Micron 3500 1TB MTFDKBA1T0TGD
8635 Points -43%
MSI Cubi NUC 1M
Iris Xe G7 96EUs, Core 7 150U, WD PC SN560 SDDPNQE-1T00
8387 Points -45%
PCMark 10 / Digital Content Creation
GMK EVO-T1
Arc 140T, Ultra 9 285H, Crucial P3 Plus CT1000P3PSSD8
11705 Points +19%
Asus NUC 15 Pro+
Arc 140T, Ultra 9 285H, Micron 3500 1TB MTFDKBA1T0TGD
11679 Points +18%
MSI Cubi NUC AI+ 3MG
Intel Graphics 4 Xe3 PTL, Ultra 9 386H, Phison 1 TB ESR01TBTCCZ-27J
9873 Points
MSI Cubi NUC AI+ 2MG
Arc 140V, Core Ultra 7 258V, Phison 1 TB ESR01TBTCCZ-27J
9678 Points -2%
GMK NucBox K16
Radeon 680M, R7 7735HS, TWSC TSC3AN1T0-F6Q10S
8029 Points -19%
MSI Cubi NUC 1M
Iris Xe G7 96EUs, Core 7 150U, WD PC SN560 SDDPNQE-1T00
6701 Points -32%
Geekom A5 Pro
Vega 7, R5 7530U, Wodposit WPBSN4M8-1TGP
5032 Points -49%
CrossMark / Overall
GMK EVO-T1
Arc 140T, Ultra 9 285H, Crucial P3 Plus CT1000P3PSSD8
2000 Points +1%
MSI Cubi NUC AI+ 3MG
Intel Graphics 4 Xe3 PTL, Ultra 9 386H, Phison 1 TB ESR01TBTCCZ-27J
1978 Points
Asus NUC 15 Pro+
Arc 140T, Ultra 9 285H, Micron 3500 1TB MTFDKBA1T0TGD
1771 Points -10%
MSI Cubi NUC 1M
Iris Xe G7 96EUs, Core 7 150U, WD PC SN560 SDDPNQE-1T00
1734 Points -12%
MSI Cubi NUC AI+ 2MG
Arc 140V, Core Ultra 7 258V, Phison 1 TB ESR01TBTCCZ-27J
1551 Points -22%
GMK NucBox K16
Radeon 680M, R7 7735HS, TWSC TSC3AN1T0-F6Q10S
1280 Points -35%
Geekom A5 Pro
Vega 7, R5 7530U, Wodposit WPBSN4M8-1TGP
1230 Points -38%
CrossMark / Productivity
GMK EVO-T1
Arc 140T, Ultra 9 285H, Crucial P3 Plus CT1000P3PSSD8
1927 Points +2%
MSI Cubi NUC AI+ 3MG
Intel Graphics 4 Xe3 PTL, Ultra 9 386H, Phison 1 TB ESR01TBTCCZ-27J
1886 Points
MSI Cubi NUC 1M
Iris Xe G7 96EUs, Core 7 150U, WD PC SN560 SDDPNQE-1T00
1778 Points -6%
Asus NUC 15 Pro+
Arc 140T, Ultra 9 285H, Micron 3500 1TB MTFDKBA1T0TGD
1637 Points -13%
MSI Cubi NUC AI+ 2MG
Arc 140V, Core Ultra 7 258V, Phison 1 TB ESR01TBTCCZ-27J
1479 Points -22%
GMK NucBox K16
Radeon 680M, R7 7735HS, TWSC TSC3AN1T0-F6Q10S
1336 Points -29%
Geekom A5 Pro
Vega 7, R5 7530U, Wodposit WPBSN4M8-1TGP
1281 Points -32%
CrossMark / Creativity
MSI Cubi NUC AI+ 3MG
Intel Graphics 4 Xe3 PTL, Ultra 9 386H, Phison 1 TB ESR01TBTCCZ-27J
2169 Points
GMK EVO-T1
Arc 140T, Ultra 9 285H, Crucial P3 Plus CT1000P3PSSD8
2161 Points 0%
Asus NUC 15 Pro+
Arc 140T, Ultra 9 285H, Micron 3500 1TB MTFDKBA1T0TGD
2115 Points -2%
MSI Cubi NUC AI+ 2MG
Arc 140V, Core Ultra 7 258V, Phison 1 TB ESR01TBTCCZ-27J
1749 Points -19%
MSI Cubi NUC 1M
Iris Xe G7 96EUs, Core 7 150U, WD PC SN560 SDDPNQE-1T00
1708 Points -21%
GMK NucBox K16
Radeon 680M, R7 7735HS, TWSC TSC3AN1T0-F6Q10S
1273 Points -41%
Geekom A5 Pro
Vega 7, R5 7530U, Wodposit WPBSN4M8-1TGP
1270 Points -41%
CrossMark / Responsiveness
GMK EVO-T1
Arc 140T, Ultra 9 285H, Crucial P3 Plus CT1000P3PSSD8
1772 Points +2%
MSI Cubi NUC AI+ 3MG
Intel Graphics 4 Xe3 PTL, Ultra 9 386H, Phison 1 TB ESR01TBTCCZ-27J
1733 Points
MSI Cubi NUC 1M
Iris Xe G7 96EUs, Core 7 150U, WD PC SN560 SDDPNQE-1T00
1685 Points -3%
Asus NUC 15 Pro+
Arc 140T, Ultra 9 285H, Micron 3500 1TB MTFDKBA1T0TGD
1314 Points -24%
MSI Cubi NUC AI+ 2MG
Arc 140V, Core Ultra 7 258V, Phison 1 TB ESR01TBTCCZ-27J
1246 Points -28%
GMK NucBox K16
Radeon 680M, R7 7735HS, TWSC TSC3AN1T0-F6Q10S
1144 Points -34%
Geekom A5 Pro
Vega 7, R5 7530U, Wodposit WPBSN4M8-1TGP
991 Points -43%
WebXPRT 3 / Overall
GMK EVO-T1
Arc 140T, Ultra 9 285H, Crucial P3 Plus CT1000P3PSSD8
324 Points +7%
MSI Cubi NUC AI+ 2MG
Arc 140V, Core Ultra 7 258V, Phison 1 TB ESR01TBTCCZ-27J
317 Points +5%
MSI Cubi NUC 1M
Iris Xe G7 96EUs, Core 7 150U, WD PC SN560 SDDPNQE-1T00
311 Points +3%
MSI Cubi NUC AI+ 3MG
Intel Graphics 4 Xe3 PTL, Ultra 9 386H, Phison 1 TB ESR01TBTCCZ-27J
302 Points
Geekom A5 Pro
Vega 7, R5 7530U, Wodposit WPBSN4M8-1TGP
251 Points -17%
Asus NUC 15 Pro+
Arc 140T, Ultra 9 285H, Micron 3500 1TB MTFDKBA1T0TGD
230 Points -24%
GMK NucBox K16
Radeon 680M, R7 7735HS, TWSC TSC3AN1T0-F6Q10S
228 Points -25%
WebXPRT 4 / Overall
GMK EVO-T1
Arc 140T, Ultra 9 285H, Crucial P3 Plus CT1000P3PSSD8
287 Points +2%
MSI Cubi NUC AI+ 3MG
Intel Graphics 4 Xe3 PTL, Ultra 9 386H, Phison 1 TB ESR01TBTCCZ-27J
282 Points
MSI Cubi NUC AI+ 2MG
Arc 140V, Core Ultra 7 258V, Phison 1 TB ESR01TBTCCZ-27J
276 Points -2%
MSI Cubi NUC 1M
Iris Xe G7 96EUs, Core 7 150U, WD PC SN560 SDDPNQE-1T00
271 Points -4%
Asus NUC 15 Pro+
Arc 140T, Ultra 9 285H, Micron 3500 1TB MTFDKBA1T0TGD
236 Points -16%
Geekom A5 Pro
Vega 7, R5 7530U, Wodposit WPBSN4M8-1TGP
212 Points -25%
GMK NucBox K16
Radeon 680M, R7 7735HS, TWSC TSC3AN1T0-F6Q10S
176 Points -38%
Mozilla Kraken 1.1 / Total
GMK NucBox K16
Radeon 680M, R7 7735HS, TWSC TSC3AN1T0-F6Q10S
655 ms * -44%
Geekom A5 Pro
Vega 7, R5 7530U, Wodposit WPBSN4M8-1TGP
630 ms * -38%
MSI Cubi NUC 1M
Iris Xe G7 96EUs, Core 7 150U, WD PC SN560 SDDPNQE-1T00
489 ms * -7%
MSI Cubi NUC AI+ 2MG
Arc 140V, Core Ultra 7 258V, Phison 1 TB ESR01TBTCCZ-27J
482 ms * -6%
Asus NUC 15 Pro+
Arc 140T, Ultra 9 285H, Micron 3500 1TB MTFDKBA1T0TGD
473 ms * -4%
GMK EVO-T1
Arc 140T, Ultra 9 285H, Crucial P3 Plus CT1000P3PSSD8
465 ms * -2%
MSI Cubi NUC AI+ 3MG
Intel Graphics 4 Xe3 PTL, Ultra 9 386H, Phison 1 TB ESR01TBTCCZ-27J
456 ms *

* ... smaller is better

PCMark 10 Score
8325 points
Help
AIDA64 / Memory Copy
Average Intel Core Ultra 9 386H
  (75437 - 129946, n=6)
109786 MB/s +46%
MSI Cubi NUC AI+ 2MG
Intel Core Ultra 7 258V, Arc 140V
107843 MB/s +43%
Asus NUC 15 Pro+
Intel Core Ultra 9 285H, Arc 140T
84796 MB/s +12%
GMK EVO-T1
Intel Core Ultra 9 285H, Arc 140T
79203 MB/s +5%
GMK EVO-T1
Intel Core Ultra 9 285H, Arc 140T
77284 MB/s +2%
MSI Cubi NUC AI+ 3MG
Intel Core Ultra 9 386H, Intel Graphics 4 Xe3 PTL
75437 MB/s
MSI Cubi NUC 1M
Intel Core 7 150U, Iris Xe G7 96EUs
59609 MB/s -21%
Geekom A5 Pro
AMD Ryzen 5 7530U, Vega 7
38448 MB/s -49%
Geekom A5 Pro
AMD Ryzen 5 7530U, Vega 7
38187 MB/s -49%
GMK NucBox K16
AMD Ryzen 7 7735HS, Radeon 680M
35463 MB/s -53%
AIDA64 / Memory Read
Average Intel Core Ultra 9 386H
  (81021 - 118858, n=6)
103403 MB/s +28%
Asus NUC 15 Pro+
Intel Core Ultra 9 285H, Arc 140T
89837 MB/s +11%
MSI Cubi NUC AI+ 2MG
Intel Core Ultra 7 258V, Arc 140V
87541 MB/s +8%
MSI Cubi NUC AI+ 3MG
Intel Core Ultra 9 386H, Intel Graphics 4 Xe3 PTL
81021 MB/s
GMK EVO-T1
Intel Core Ultra 9 285H, Arc 140T
75428 MB/s -7%
GMK EVO-T1
Intel Core Ultra 9 285H, Arc 140T
74572 MB/s -8%
MSI Cubi NUC 1M
Intel Core 7 150U, Iris Xe G7 96EUs
68780 MB/s -15%
Geekom A5 Pro
AMD Ryzen 5 7530U, Vega 7
40270 MB/s -50%
Geekom A5 Pro
AMD Ryzen 5 7530U, Vega 7
40117 MB/s -50%
GMK NucBox K16
AMD Ryzen 7 7735HS, Radeon 680M
38890 MB/s -52%
AIDA64 / Memory Write
MSI Cubi NUC AI+ 2MG
Intel Core Ultra 7 258V, Arc 140V
117886 MB/s +55%
Average Intel Core Ultra 9 386H
  (75959 - 135096, n=6)
110936 MB/s +46%
Asus NUC 15 Pro+
Intel Core Ultra 9 285H, Arc 140T
84220 MB/s +11%
GMK EVO-T1
Intel Core Ultra 9 285H, Arc 140T
77625 MB/s +2%
GMK EVO-T1
Intel Core Ultra 9 285H, Arc 140T
75629 MB/s 0%
MSI Cubi NUC AI+ 3MG
Intel Core Ultra 9 386H, Intel Graphics 4 Xe3 PTL
75959 MB/s
MSI Cubi NUC 1M
Intel Core 7 150U, Iris Xe G7 96EUs
60626 MB/s -20%
GMK NucBox K16
AMD Ryzen 7 7735HS, Radeon 680M
43887 MB/s -42%
Geekom A5 Pro
AMD Ryzen 5 7530U, Vega 7
40708 MB/s -46%
Geekom A5 Pro
AMD Ryzen 5 7530U, Vega 7
40201 MB/s -47%
AIDA64 / Memory Latency
GMK EVO-T1
Intel Core Ultra 9 285H, Arc 140T
130.7 ns * -12%
GMK EVO-T1
Intel Core Ultra 9 285H, Arc 140T
128.3 ns * -10%
MSI Cubi NUC AI+ 3MG
Intel Core Ultra 9 386H, Intel Graphics 4 Xe3 PTL
116.9 ns *
GMK NucBox K16
AMD Ryzen 7 7735HS, Radeon 680M
108.9 ns * +7%
Asus NUC 15 Pro+
Intel Core Ultra 9 285H, Arc 140T
106.2 ns * +9%
Average Intel Core Ultra 9 386H
  (87.2 - 116.9, n=6)
99 ns * +15%
Geekom A5 Pro
AMD Ryzen 5 7530U, Vega 7
96.3 ns * +18%
Geekom A5 Pro
AMD Ryzen 5 7530U, Vega 7
93.4 ns * +20%
MSI Cubi NUC AI+ 2MG
Intel Core Ultra 7 258V, Arc 140V
95.5 ns * +18%
MSI Cubi NUC 1M
Intel Core 7 150U, Iris Xe G7 96EUs
74.5 ns * +36%

* ... smaller is better

DPC Latency

4K60 video playback with no dropped frames. LatencyMon would not run correctly on the system due to driver signing issues even after disabling the feature

Storage Devices

The system ships with the same Phison 1 TB ESR01TBTCCZ PCIe4 NVMe SSD as found on last year's Cubi 2MG.

CDM 8
CDM 8
AS SSD
AS SSD
Phison 1 TB ESR01TBTCCZ-27J
CDM 5/6 Read Seq Q32T1: 5871 MB/s
CDM 5/6 Write Seq Q32T1: 5006 MB/s
CDM 5/6 Read 4K Q32T1: 503.1 MB/s
CDM 5/6 Write 4K Q32T1: 410.2 MB/s
CDM 5 Read Seq: 2883 MB/s
CDM 5 Write Seq: 3772 MB/s
CDM 5/6 Read 4K: 54.56 MB/s
CDM 5/6 Write 4K: 151.1 MB/s
Drive Performance rating - Percent
GMK EVO-T1
Crucial P3 Plus CT1000P3PSSD8
90.1 pt
Asus NUC 15 Pro+
Micron 3500 1TB MTFDKBA1T0TGD
66.1 pt
MSI Cubi NUC AI+ 3MG
Phison 1 TB ESR01TBTCCZ-27J
65.7 pt
MSI Cubi NUC 1M
WD PC SN560 SDDPNQE-1T00
61.9 pt
Geekom A5 Pro
Wodposit WPBSN4M8-1TGP
56.4 pt
MSI Cubi NUC AI+ 2MG
Phison 1 TB ESR01TBTCCZ-27J
53.9 pt
GMK NucBox K16
TWSC TSC3AN1T0-F6Q10S
45.2 pt
DiskSpd
seq read
MSI Cubi NUC 1M
WD PC SN560 SDDPNQE-1T00
4128 (4092.8min - 4128.38max) MB/s +42%
GMK EVO-T1
Crucial P3 Plus CT1000P3PSSD8
3100 (3048.82min - 3099.89max) MB/s +7%
MSI Cubi NUC AI+ 2MG
Phison 1 TB ESR01TBTCCZ-27J
2932 (2911.11min - 2931.83max) MB/s +1%
MSI Cubi NUC AI+ 3MG
Phison 1 TB ESR01TBTCCZ-27J
2908 (2840.99min - 2907.7max) MB/s
Geekom A5 Pro
Wodposit WPBSN4M8-1TGP
2715 (2702.44min - 2714.55max) MB/s -7%
GMK NucBox K16
TWSC TSC3AN1T0-F6Q10S
2329 (2055.5min - 2329.47max) MB/s -20%
Asus NUC 15 Pro+
Micron 3500 1TB MTFDKBA1T0TGD
1844 (796.16min - 1843.9max) MB/s -37%
seq write
GMK EVO-T1
Crucial P3 Plus CT1000P3PSSD8
4563 (4113.52min - 4563.08max) MB/s +25%
MSI Cubi NUC AI+ 3MG
Phison 1 TB ESR01TBTCCZ-27J
3651 (3431.15min - 3650.55max) MB/s
Asus NUC 15 Pro+
Micron 3500 1TB MTFDKBA1T0TGD
3335 (698.84min - 3334.89max) MB/s -9%
MSI Cubi NUC 1M
WD PC SN560 SDDPNQE-1T00
3215 (3133.8min - 3214.8max) MB/s -12%
Geekom A5 Pro
Wodposit WPBSN4M8-1TGP
2629 (2599.42min - 2628.78max) MB/s -28%
MSI Cubi NUC AI+ 2MG
Phison 1 TB ESR01TBTCCZ-27J
2508 (2473.89min - 2508max) MB/s -31%
GMK NucBox K16
TWSC TSC3AN1T0-F6Q10S
2385 (2302.89min - 2384.93max) MB/s -35%
seq q8 t1 read
Asus NUC 15 Pro+
Micron 3500 1TB MTFDKBA1T0TGD
7106 (6492.57min - 7105.99max) MB/s +21%
MSI Cubi NUC AI+ 3MG
Phison 1 TB ESR01TBTCCZ-27J
5885 (5026.66min - 5885.03max) MB/s
MSI Cubi NUC AI+ 2MG
Phison 1 TB ESR01TBTCCZ-27J
5875 (4751.87min - 5875.38max) MB/s 0%
GMK EVO-T1
Crucial P3 Plus CT1000P3PSSD8
5103 (4471.34min - 5103.21max) MB/s -13%
MSI Cubi NUC 1M
WD PC SN560 SDDPNQE-1T00
4987 (4558.37min - 4987.33max) MB/s -15%
Geekom A5 Pro
Wodposit WPBSN4M8-1TGP
3709 (3283.51min - 3708.95max) MB/s -37%
GMK NucBox K16
TWSC TSC3AN1T0-F6Q10S
3486 (2926.58min - 3485.89max) MB/s -41%
seq q8 t1 write
Asus NUC 15 Pro+
Micron 3500 1TB MTFDKBA1T0TGD
5283 (736.31min - 5283.36max) MB/s +6%
MSI Cubi NUC AI+ 3MG
Phison 1 TB ESR01TBTCCZ-27J
4978 (4946.97min - 4977.91max) MB/s
MSI Cubi NUC AI+ 2MG
Phison 1 TB ESR01TBTCCZ-27J
4973 (4947.14min - 4972.98max) MB/s 0%
GMK EVO-T1
Crucial P3 Plus CT1000P3PSSD8
4599 (4437.99min - 4599.05max) MB/s -8%
MSI Cubi NUC 1M
WD PC SN560 SDDPNQE-1T00
3308 (3211.45min - 3307.84max) MB/s -34%
Geekom A5 Pro
Wodposit WPBSN4M8-1TGP
3256 (3140.69min - 3256.03max) MB/s -35%
GMK NucBox K16
TWSC TSC3AN1T0-F6Q10S
2560 (2485.54min - 2559.78max) MB/s -49%
4k q1 t1 read
GMK EVO-T1
Crucial P3 Plus CT1000P3PSSD8
77 (75.54min - 77.03max) MB/s +24%
MSI Cubi NUC 1M
WD PC SN560 SDDPNQE-1T00
73.3 (72.01min - 73.31max) MB/s +18%
Asus NUC 15 Pro+
Micron 3500 1TB MTFDKBA1T0TGD
63.5 (59.74min - 63.47max) MB/s +2%
MSI Cubi NUC AI+ 3MG
Phison 1 TB ESR01TBTCCZ-27J
62.2 (60.58min - 62.17max) MB/s
MSI Cubi NUC AI+ 2MG
Phison 1 TB ESR01TBTCCZ-27J
57.3 (57.09min - 57.31max) MB/s -8%
GMK NucBox K16
TWSC TSC3AN1T0-F6Q10S
56.7 (40.69min - 56.71max) MB/s -9%
Geekom A5 Pro
Wodposit WPBSN4M8-1TGP
51.1 (46.29min - 51.12max) MB/s -18%
4k q1 t1 write
MSI Cubi NUC 1M
WD PC SN560 SDDPNQE-1T00
282 (265.11min - 281.58max) MB/s +47%
GMK EVO-T1
Crucial P3 Plus CT1000P3PSSD8
242 (231.04min - 241.7max) MB/s +26%
MSI Cubi NUC AI+ 3MG
Phison 1 TB ESR01TBTCCZ-27J
191.4 (187.69min - 191.36max) MB/s
MSI Cubi NUC AI+ 2MG
Phison 1 TB ESR01TBTCCZ-27J
144.3 (142.64min - 144.32max) MB/s -25%
Asus NUC 15 Pro+
Micron 3500 1TB MTFDKBA1T0TGD
130.4 (122.26min - 130.43max) MB/s -32%
Geekom A5 Pro
Wodposit WPBSN4M8-1TGP
111.4 (106.87min - 111.43max) MB/s -42%
GMK NucBox K16
TWSC TSC3AN1T0-F6Q10S
93.9 (77.31min - 93.94max) MB/s -51%
4k q32 t16 read
GMK EVO-T1
Crucial P3 Plus CT1000P3PSSD8
3548 (3523.05min - 3547.64max) MB/s +400%
Geekom A5 Pro
Wodposit WPBSN4M8-1TGP
2768 (2575.18min - 2767.63max) MB/s +290%
MSI Cubi NUC 1M
WD PC SN560 SDDPNQE-1T00
1533 (1419.74min - 1533.25max) MB/s +116%
GMK NucBox K16
TWSC TSC3AN1T0-F6Q10S
928 (920.36min - 927.63max) MB/s +31%
Asus NUC 15 Pro+
Micron 3500 1TB MTFDKBA1T0TGD
781 (686.38min - 780.77max) MB/s +10%
MSI Cubi NUC AI+ 2MG
Phison 1 TB ESR01TBTCCZ-27J
719 (619.26min - 718.65max) MB/s +1%
MSI Cubi NUC AI+ 3MG
Phison 1 TB ESR01TBTCCZ-27J
710 (651.38min - 709.96max) MB/s
4k q32 t16 write
GMK EVO-T1
Crucial P3 Plus CT1000P3PSSD8
3304 (3139.17min - 3304.42max) MB/s +783%
MSI Cubi NUC 1M
WD PC SN560 SDDPNQE-1T00
2010 (1622.95min - 2010.14max) MB/s +437%
GMK NucBox K16
TWSC TSC3AN1T0-F6Q10S
1486 (1281.27min - 1486.27max) MB/s +297%
Geekom A5 Pro
Wodposit WPBSN4M8-1TGP
1365 (1269.15min - 1364.79max) MB/s +265%
Asus NUC 15 Pro+
Micron 3500 1TB MTFDKBA1T0TGD
413 (353.25min - 412.63max) MB/s +10%
MSI Cubi NUC AI+ 2MG
Phison 1 TB ESR01TBTCCZ-27J
412 (409.29min - 411.67max) MB/s +10%
MSI Cubi NUC AI+ 3MG
Phison 1 TB ESR01TBTCCZ-27J
374 (371.04min - 374.36max) MB/s
AS SSD
Score Total
GMK EVO-T1
Crucial P3 Plus CT1000P3PSSD8
8193 Points +75%
Asus NUC 15 Pro+
Micron 3500 1TB MTFDKBA1T0TGD
5647 Points +21%
Geekom A5 Pro
Wodposit WPBSN4M8-1TGP
4774 Points +2%
MSI Cubi NUC AI+ 3MG
Phison 1 TB ESR01TBTCCZ-27J
4673 Points
GMK NucBox K16
TWSC TSC3AN1T0-F6Q10S
3305 Points -29%
MSI Cubi NUC 1M
WD PC SN560 SDDPNQE-1T00
2750 Points -41%
MSI Cubi NUC AI+ 2MG
Phison 1 TB ESR01TBTCCZ-27J
2362 Points -49%
Score Read
GMK EVO-T1
Crucial P3 Plus CT1000P3PSSD8
3001 Points +147%
Geekom A5 Pro
Wodposit WPBSN4M8-1TGP
2069 Points +70%
MSI Cubi NUC 1M
WD PC SN560 SDDPNQE-1T00
1443 Points +19%
Asus NUC 15 Pro+
Micron 3500 1TB MTFDKBA1T0TGD
1396 Points +15%
MSI Cubi NUC AI+ 3MG
Phison 1 TB ESR01TBTCCZ-27J
1217 Points
GMK NucBox K16
TWSC TSC3AN1T0-F6Q10S
1190 Points -2%
MSI Cubi NUC AI+ 2MG
Phison 1 TB ESR01TBTCCZ-27J
1164 Points -4%
Score Write
GMK EVO-T1
Crucial P3 Plus CT1000P3PSSD8
3662 Points +27%
Asus NUC 15 Pro+
Micron 3500 1TB MTFDKBA1T0TGD
3655 Points +27%
MSI Cubi NUC AI+ 3MG
Phison 1 TB ESR01TBTCCZ-27J
2889 Points
Geekom A5 Pro
Wodposit WPBSN4M8-1TGP
1653 Points -43%
GMK NucBox K16
TWSC TSC3AN1T0-F6Q10S
1521 Points -47%
MSI Cubi NUC AI+ 2MG
Phison 1 TB ESR01TBTCCZ-27J
693 Points -76%
MSI Cubi NUC 1M
WD PC SN560 SDDPNQE-1T00
651 Points -77%
Seq Read
Asus NUC 15 Pro+
Micron 3500 1TB MTFDKBA1T0TGD
5114 MB/s +14%
MSI Cubi NUC AI+ 3MG
Phison 1 TB ESR01TBTCCZ-27J
4492.91 MB/s
MSI Cubi NUC AI+ 2MG
Phison 1 TB ESR01TBTCCZ-27J
4428.19 MB/s -1%
MSI Cubi NUC 1M
WD PC SN560 SDDPNQE-1T00
4327.67 MB/s -4%
GMK EVO-T1
Crucial P3 Plus CT1000P3PSSD8
4229 MB/s -6%
Geekom A5 Pro
Wodposit WPBSN4M8-1TGP
3131 MB/s -30%
GMK NucBox K16
TWSC TSC3AN1T0-F6Q10S
2958.68 MB/s -34%
Seq Write
GMK EVO-T1
Crucial P3 Plus CT1000P3PSSD8
3985 MB/s +28%
MSI Cubi NUC AI+ 3MG
Phison 1 TB ESR01TBTCCZ-27J
3123.65 MB/s
Geekom A5 Pro
Wodposit WPBSN4M8-1TGP
2926 MB/s -6%
MSI Cubi NUC 1M
WD PC SN560 SDDPNQE-1T00
2606.84 MB/s -17%
Asus NUC 15 Pro+
Micron 3500 1TB MTFDKBA1T0TGD
2533 MB/s -19%
GMK NucBox K16
TWSC TSC3AN1T0-F6Q10S
2383.27 MB/s -24%
MSI Cubi NUC AI+ 2MG
Phison 1 TB ESR01TBTCCZ-27J
2329.39 MB/s -25%
4K Read
GMK EVO-T1
Crucial P3 Plus CT1000P3PSSD8
84.6 MB/s +56%
MSI Cubi NUC AI+ 2MG
Phison 1 TB ESR01TBTCCZ-27J
56.39 MB/s +4%
Geekom A5 Pro
Wodposit WPBSN4M8-1TGP
56.3 MB/s +4%
MSI Cubi NUC AI+ 3MG
Phison 1 TB ESR01TBTCCZ-27J
54.36 MB/s
GMK NucBox K16
TWSC TSC3AN1T0-F6Q10S
54.1 MB/s 0%
Asus NUC 15 Pro+
Micron 3500 1TB MTFDKBA1T0TGD
53.9 MB/s -1%
MSI Cubi NUC 1M
WD PC SN560 SDDPNQE-1T00
42.24 MB/s -22%
4K Write
MSI Cubi NUC 1M
WD PC SN560 SDDPNQE-1T00
217.48 MB/s +2%
MSI Cubi NUC AI+ 3MG
Phison 1 TB ESR01TBTCCZ-27J
212.46 MB/s
GMK EVO-T1
Crucial P3 Plus CT1000P3PSSD8
211 MB/s -1%
MSI Cubi NUC AI+ 2MG
Phison 1 TB ESR01TBTCCZ-27J
195.18 MB/s -8%
Asus NUC 15 Pro+
Micron 3500 1TB MTFDKBA1T0TGD
152.4 MB/s -28%
GMK NucBox K16
TWSC TSC3AN1T0-F6Q10S
126.59 MB/s -40%
Geekom A5 Pro
Wodposit WPBSN4M8-1TGP
99.6 MB/s -53%
4K-64 Read
GMK EVO-T1
Crucial P3 Plus CT1000P3PSSD8
2493 MB/s +250%
Geekom A5 Pro
Wodposit WPBSN4M8-1TGP
1699 MB/s +138%
MSI Cubi NUC 1M
WD PC SN560 SDDPNQE-1T00
967.82 MB/s +36%
GMK NucBox K16
TWSC TSC3AN1T0-F6Q10S
840.39 MB/s +18%
Asus NUC 15 Pro+
Micron 3500 1TB MTFDKBA1T0TGD
831 MB/s +17%
MSI Cubi NUC AI+ 3MG
Phison 1 TB ESR01TBTCCZ-27J
713 MB/s
MSI Cubi NUC AI+ 2MG
Phison 1 TB ESR01TBTCCZ-27J
664.75 MB/s -7%
4K-64 Write
Asus NUC 15 Pro+
Micron 3500 1TB MTFDKBA1T0TGD
3249 MB/s +37%
GMK EVO-T1
Crucial P3 Plus CT1000P3PSSD8
3052 MB/s +29%
MSI Cubi NUC AI+ 3MG
Phison 1 TB ESR01TBTCCZ-27J
2364.44 MB/s
Geekom A5 Pro
Wodposit WPBSN4M8-1TGP
1261 MB/s -47%
GMK NucBox K16
TWSC TSC3AN1T0-F6Q10S
1156.52 MB/s -51%
MSI Cubi NUC AI+ 2MG
Phison 1 TB ESR01TBTCCZ-27J
264.78 MB/s -89%
MSI Cubi NUC 1M
WD PC SN560 SDDPNQE-1T00
172.85 MB/s -93%
Access Time Read
Geekom A5 Pro
Wodposit WPBSN4M8-1TGP
0.164 ms * -100%
GMK EVO-T1
Crucial P3 Plus CT1000P3PSSD8
0.125 ms * -52%
Asus NUC 15 Pro+
Micron 3500 1TB MTFDKBA1T0TGD
0.105 ms * -28%
GMK NucBox K16
TWSC TSC3AN1T0-F6Q10S
0.093 ms * -13%
MSI Cubi NUC AI+ 3MG
Phison 1 TB ESR01TBTCCZ-27J
0.082 ms *
MSI Cubi NUC 1M
WD PC SN560 SDDPNQE-1T00
0.072 ms * +12%
MSI Cubi NUC AI+ 2MG
Phison 1 TB ESR01TBTCCZ-27J
0.069 ms * +16%
Access Time Write
GMK NucBox K16
TWSC TSC3AN1T0-F6Q10S
0.331 ms * -525%
MSI Cubi NUC 1M
WD PC SN560 SDDPNQE-1T00
0.088 ms * -66%
Geekom A5 Pro
Wodposit WPBSN4M8-1TGP
0.057 ms * -8%
MSI Cubi NUC AI+ 2MG
Phison 1 TB ESR01TBTCCZ-27J
0.056 ms * -6%
MSI Cubi NUC AI+ 3MG
Phison 1 TB ESR01TBTCCZ-27J
0.053 ms *
Asus NUC 15 Pro+
Micron 3500 1TB MTFDKBA1T0TGD
0.024 ms * +55%
GMK EVO-T1
Crucial P3 Plus CT1000P3PSSD8
0.019 ms * +64%

* ... smaller is better

Disk Throttling: DiskSpd Read Loop, Queue Depth 8

012024036048060072084096010801200132014401560168018001920204021602280240025202640276028803000312032403360348036003720384039604080420043204440456046804800492050405160528054005520564057605880Tooltip
MSI Cubi NUC AI+ 3MG Phison 1 TB ESR01TBTCCZ-27J; diskspd 2.0.17 f: Ø5871 (5421.98-5884.58)
MSI Cubi NUC AI+ 2MG Phison 1 TB ESR01TBTCCZ-27J; diskspd 2.0.17 f: Ø5848 (4659.57-5878.32)
MSI Cubi NUC 1M WD PC SN560 SDDPNQE-1T00; diskspd 2.0.17 f: Ø4962 (4554.8-4986.07)

GPU Performance

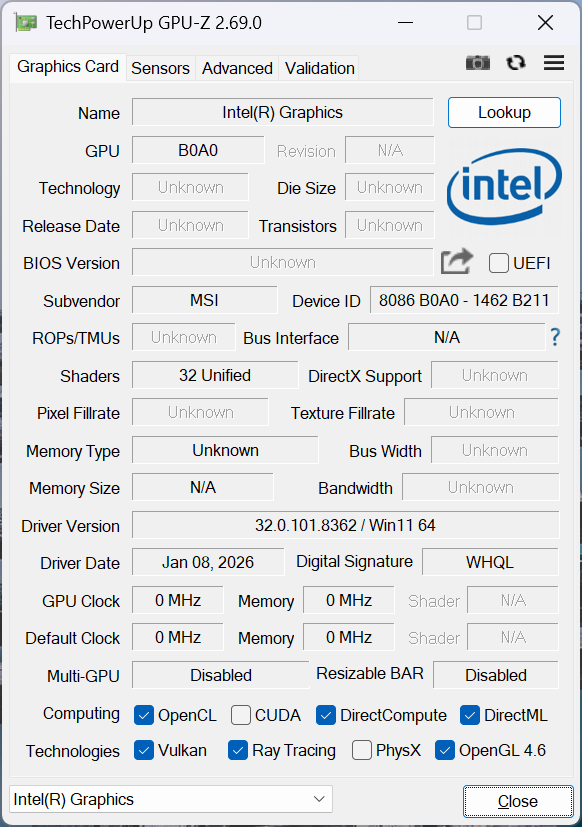
The integrated Graphics 4 Xe3 performs most similarly to last year's Arc 140V if not slightly faster by a few percentage points on average. The Core Ultra 9 386H does not feature the elite Arc B390 of the Panther Lake X7 series and so graphics performance is not a primary feature of the MSI Cubi.

3DMark 11
3DMark 11
Fire Strike
Fire Strike
Speed Way
Speed Way
Time Spy
Time Spy
3DMark Performance rating - Percent
Asus NUC 15 Pro+
Intel Arc Graphics 140T, Intel Core Ultra 9 285H
93.8 pt
GMK EVO-T1
Intel Arc Graphics 140T, Intel Core Ultra 9 285H
91.1 pt
Peladn HO5, AI 9 HX 370
AMD Radeon 890M, AMD Ryzen AI 9 HX 370
91 pt
GMK NucBox K13
Intel Arc Graphics 140V, Intel Core Ultra 7 256V
70.7 pt
MSI Cubi NUC AI+ 2MG
Intel Arc Graphics 140V, Intel Core Ultra 7 258V
67.8 pt
MSI Cubi NUC AI+ 3MG
Intel Graphics 4 Xe3 Panther Lake iGPU, Intel Core Ultra 9 386H
65.5 pt
Average Intel Graphics 4 Xe3 Panther Lake iGPU
 
64.4 pt
Minisforum AI X1 Pro, HX 470
AMD Radeon 890M, AMD Ryzen AI 9 HX 470
52.2 pt
HP EliteBoard G1a AI
AMD Radeon 840M, AMD Ryzen AI 5 PRO 340
49 pt
Minix Elite EU512-AI
Intel Arc 7-Core iGPU, Intel Core Ultra 5 125H
47.7 pt
GMK NucBox K16
AMD Radeon 680M, AMD Ryzen 7 7735HS
43.9 pt
MSI Cubi NUC 1M
Intel Iris Xe Graphics G7 96EUs, Intel Core 7 150U
42.8 pt
Geekom A5 Pro
AMD Radeon RX Vega 7, AMD Ryzen 5 7530U
33.4 pt
3DMark 11 - 1280x720 Performance GPU
Peladn HO5, AI 9 HX 370
AMD Radeon 890M, AMD Ryzen AI 9 HX 370
16539 Points +139%
Asus NUC 15 Pro+
Intel Arc Graphics 140T, Intel Core Ultra 9 285H
13067 Points +89%
GMK EVO-T1
Intel Arc Graphics 140T, Intel Core Ultra 9 285H
12626 Points +83%
GMK NucBox K13
Intel Arc Graphics 140V, Intel Core Ultra 7 256V
9619 Points +39%
Minisforum AI X1 Pro, HX 470
AMD Radeon 890M, AMD Ryzen AI 9 HX 470
8947 Points +29%
HP EliteBoard G1a AI
AMD Radeon 840M, AMD Ryzen AI 5 PRO 340
8099 Points +17%
GMK NucBox K16
AMD Radeon 680M, AMD Ryzen 7 7735HS
7583 Points +10%
MSI Cubi NUC AI+ 2MG
Intel Arc Graphics 140V, Intel Core Ultra 7 258V
7351 Points +6%
Average Intel Graphics 4 Xe3 Panther Lake iGPU
  (6268 - 7317, n=7)
6951 Points 0%
MSI Cubi NUC AI+ 3MG
Intel Graphics 4 Xe3 Panther Lake iGPU, Intel Core Ultra 9 386H
6917 Points
MSI Cubi NUC 1M
Intel Iris Xe Graphics G7 96EUs, Intel Core 7 150U
6282 Points -9%
Geekom A5 Pro
AMD Radeon RX Vega 7, AMD Ryzen 5 7530U
5584 Points -19%
Minix Elite EU512-AI
Intel Arc 7-Core iGPU, Intel Core Ultra 5 125H
5549 Points -20%
3DMark
1280x720 Cloud Gate Standard Graphics
Peladn HO5, AI 9 HX 370
AMD Radeon 890M, AMD Ryzen AI 9 HX 370
56516 Points +44%
Asus NUC 15 Pro+
Intel Arc Graphics 140T, Intel Core Ultra 9 285H
55397 Points +41%
GMK EVO-T1
Intel Arc Graphics 140T, Intel Core Ultra 9 285H
52236 Points +33%
MSI Cubi NUC AI+ 2MG
Intel Arc Graphics 140V, Intel Core Ultra 7 258V
51042 Points +30%
MSI Cubi NUC AI+ 3MG
Intel Graphics 4 Xe3 Panther Lake iGPU, Intel Core Ultra 9 386H
39380 Points
GMK NucBox K13
Intel Arc Graphics 140V, Intel Core Ultra 7 256V
38019 Points -3%
Average Intel Graphics 4 Xe3 Panther Lake iGPU
  (30345 - 41422, n=5)
37519 Points -5%
HP EliteBoard G1a AI
AMD Radeon 840M, AMD Ryzen AI 5 PRO 340
33355 Points -15%
Minisforum AI X1 Pro, HX 470
AMD Radeon 890M, AMD Ryzen AI 9 HX 470
29973 Points -24%
MSI Cubi NUC 1M
Intel Iris Xe Graphics G7 96EUs, Intel Core 7 150U
29301 Points -26%
Minix Elite EU512-AI
Intel Arc 7-Core iGPU, Intel Core Ultra 5 125H
28658 Points -27%
GMK NucBox K16
AMD Radeon 680M, AMD Ryzen 7 7735HS
26575 Points -33%
Geekom A5 Pro
AMD Radeon RX Vega 7, AMD Ryzen 5 7530U
25000 Points -37%
1920x1080 Fire Strike Graphics
Peladn HO5, AI 9 HX 370
AMD Radeon 890M, AMD Ryzen AI 9 HX 370
9561 Points +43%
Asus NUC 15 Pro+
Intel Arc Graphics 140T, Intel Core Ultra 9 285H
8773 Points +32%
GMK EVO-T1
Intel Arc Graphics 140T, Intel Core Ultra 9 285H
8630 Points +29%
GMK NucBox K13
Intel Arc Graphics 140V, Intel Core Ultra 7 256V
7601 Points +14%
Average Intel Graphics 4 Xe3 Panther Lake iGPU
  (5688 - 7118, n=7)
6705 Points +1%
MSI Cubi NUC AI+ 3MG
Intel Graphics 4 Xe3 Panther Lake iGPU, Intel Core Ultra 9 386H
6665 Points
MSI Cubi NUC AI+ 2MG
Intel Arc Graphics 140V, Intel Core Ultra 7 258V
6209 Points -7%
HP EliteBoard G1a AI
AMD Radeon 840M, AMD Ryzen AI 5 PRO 340
5488 Points -18%
Minisforum AI X1 Pro, HX 470
AMD Radeon 890M, AMD Ryzen AI 9 HX 470
5173 Points -22%
MSI Cubi NUC 1M
Intel Iris Xe Graphics G7 96EUs, Intel Core 7 150U
4899 Points -26%
GMK NucBox K16
AMD Radeon 680M, AMD Ryzen 7 7735HS
4704 Points -29%
Minix Elite EU512-AI
Intel Arc 7-Core iGPU, Intel Core Ultra 5 125H
4575 Points -31%
Geekom A5 Pro
AMD Radeon RX Vega 7, AMD Ryzen 5 7530U
3528 Points -47%
2560x1440 Time Spy Graphics
Asus NUC 15 Pro+
Intel Arc Graphics 140T, Intel Core Ultra 9 285H
3940 Points +38%
GMK EVO-T1
Intel Arc Graphics 140T, Intel Core Ultra 9 285H
3872 Points +35%
Peladn HO5, AI 9 HX 370
AMD Radeon 890M, AMD Ryzen AI 9 HX 370
3048 Points +6%
GMK NucBox K13
Intel Arc Graphics 140V, Intel Core Ultra 7 256V
2943 Points +3%
MSI Cubi NUC AI+ 3MG
Intel Graphics 4 Xe3 Panther Lake iGPU, Intel Core Ultra 9 386H
2865 Points
Average Intel Graphics 4 Xe3 Panther Lake iGPU
  (2391 - 3003, n=7)
2825 Points -1%
MSI Cubi NUC AI+ 2MG
Intel Arc Graphics 140V, Intel Core Ultra 7 258V
2754 Points -4%
Minix Elite EU512-AI
Intel Arc 7-Core iGPU, Intel Core Ultra 5 125H
2090 Points -27%
Minisforum AI X1 Pro, HX 470
AMD Radeon 890M, AMD Ryzen AI 9 HX 470
1950 Points -32%
HP EliteBoard G1a AI
AMD Radeon 840M, AMD Ryzen AI 5 PRO 340
1559 Points -46%
GMK NucBox K16
AMD Radeon 680M, AMD Ryzen 7 7735HS
1518 Points -47%
MSI Cubi NUC 1M
Intel Iris Xe Graphics G7 96EUs, Intel Core 7 150U
1428 Points -50%
Geekom A5 Pro
AMD Radeon RX Vega 7, AMD Ryzen 5 7530U
1014 Points -65%
2560x1440 Time Spy Score
Asus NUC 15 Pro+
Intel Arc Graphics 140T, Intel Core Ultra 9 285H
4390 Points +36%
GMK EVO-T1
Intel Arc Graphics 140T, Intel Core Ultra 9 285H
4301 Points +33%
Peladn HO5, AI 9 HX 370
AMD Radeon 890M, AMD Ryzen AI 9 HX 370
3412 Points +5%
GMK NucBox K13
Intel Arc Graphics 140V, Intel Core Ultra 7 256V
3249 Points 0%
MSI Cubi NUC AI+ 3MG
Intel Graphics 4 Xe3 Panther Lake iGPU, Intel Core Ultra 9 386H
3237 Points
Average Intel Graphics 4 Xe3 Panther Lake iGPU
  (2672 - 3395, n=7)
3141 Points -3%
MSI Cubi NUC AI+ 2MG
Intel Arc Graphics 140V, Intel Core Ultra 7 258V
3053 Points -6%
Minix Elite EU512-AI
Intel Arc 7-Core iGPU, Intel Core Ultra 5 125H
2351 Points -27%
Minisforum AI X1 Pro, HX 470
AMD Radeon 890M, AMD Ryzen AI 9 HX 470
2203 Points -32%
HP EliteBoard G1a AI
AMD Radeon 840M, AMD Ryzen AI 5 PRO 340
1762 Points -46%
GMK NucBox K16
AMD Radeon 680M, AMD Ryzen 7 7735HS
1717 Points -47%
MSI Cubi NUC 1M
Intel Iris Xe Graphics G7 96EUs, Intel Core 7 150U
1602 Points -51%
Geekom A5 Pro
AMD Radeon RX Vega 7, AMD Ryzen 5 7530U
1150 Points -64%
3DMark 11 Performance
7599 points
3DMark Cloud Gate Standard Score
30367 points
3DMark Fire Strike Score
6190 points
3DMark Time Spy Score
3237 points
Help
Blender
v3.3 Classroom CPU
MSI Cubi NUC 1M
Intel Iris Xe Graphics G7 96EUs, Intel Core 7 150U
829 Seconds * -140%
Geekom A5 Pro
AMD Radeon RX Vega 7, AMD Ryzen 5 7530U
792 Seconds * -130%
GMK NucBox K13
Intel Arc Graphics 140V, Intel Core Ultra 7 256V
513 Seconds * -49%
Average Intel Graphics 4 Xe3 Panther Lake iGPU
  (332 - 569, n=7)
470 Seconds * -36%
HP EliteBoard G1a AI
AMD Radeon 840M, AMD Ryzen AI 5 PRO 340
445 Seconds * -29%
Minix Elite EU512-AI
Intel Arc 7-Core iGPU, Intel Core Ultra 5 125H
417 Seconds * -21%
GMK NucBox K16
AMD Radeon 680M, AMD Ryzen 7 7735HS
408 Seconds * -18%
MSI Cubi NUC AI+ 3MG
Intel Graphics 4 Xe3 Panther Lake iGPU, Intel Core Ultra 9 386H
345 Seconds *
GMK EVO-T1
Intel Arc Graphics 140T, Intel Core Ultra 9 285H
268 Seconds * +22%
Asus NUC 15 Pro+
Intel Arc Graphics 140T, Intel Core Ultra 9 285H
266 Seconds * +23%
Peladn HO5, AI 9 HX 370
AMD Radeon 890M, AMD Ryzen AI 9 HX 370
250 Seconds * +28%
Minisforum AI X1 Pro, HX 470
AMD Radeon 890M, AMD Ryzen AI 9 HX 470
214 Seconds * +38%
v3.3 Classroom oneAPI/Intel
MSI Cubi NUC AI+ 2MG
Intel Arc Graphics 140V, Intel Core Ultra 7 258V
278 Seconds * -10%
GMK NucBox K13
Intel Arc Graphics 140V, Intel Core Ultra 7 256V
255 Seconds * -1%
MSI Cubi NUC AI+ 3MG
Intel Graphics 4 Xe3 Panther Lake iGPU, Intel Core Ultra 9 386H
252 Seconds *
Average Intel Graphics 4 Xe3 Panther Lake iGPU
  (237 - 257, n=4)
247 Seconds * +2%
v4.3 Barbershop CPU
Geekom A5 Pro
AMD Radeon RX Vega 7, AMD Ryzen 5 7530U
3879 Seconds * -127%
MSI Cubi NUC AI+ 2MG
Intel Arc Graphics 140V, Intel Core Ultra 7 258V
2741 Seconds * -60%
GMK NucBox K13
Intel Arc Graphics 140V, Intel Core Ultra 7 256V
2657 Seconds * -55%
Average Intel Graphics 4 Xe3 Panther Lake iGPU
  (1709 - 2737, n=4)
2420 Seconds * -42%
HP EliteBoard G1a AI
AMD Radeon 840M, AMD Ryzen AI 5 PRO 340
2280 Seconds * -33%
GMK NucBox K16
AMD Radeon 680M, AMD Ryzen 7 7735HS
2257 Seconds * -32%
MSI Cubi NUC AI+ 3MG
Intel Graphics 4 Xe3 Panther Lake iGPU, Intel Core Ultra 9 386H
1709 Seconds *
GMK EVO-T1
Intel Arc Graphics 140T, Intel Core Ultra 9 285H
1355 Seconds * +21%
Asus NUC 15 Pro+
Intel Arc Graphics 140T, Intel Core Ultra 9 285H
1349 Seconds * +21%
Peladn HO5, AI 9 HX 370
AMD Radeon 890M, AMD Ryzen AI 9 HX 370
1307 Seconds * +24%
Minisforum AI X1 Pro, HX 470
AMD Radeon 890M, AMD Ryzen AI 9 HX 470
1119 Seconds * +35%
v4.3 Barbershop oneAPI
GMK NucBox K13
Intel Arc Graphics 140V, Intel Core Ultra 7 256V
975 Seconds * -7%
Average Intel Graphics 4 Xe3 Panther Lake iGPU
  (869 - 1015, n=4)
933 Seconds * -3%
MSI Cubi NUC AI+ 2MG
Intel Arc Graphics 140V, Intel Core Ultra 7 258V
914 Seconds * -1%
MSI Cubi NUC AI+ 3MG
Intel Graphics 4 Xe3 Panther Lake iGPU, Intel Core Ultra 9 386H
909 Seconds *

* ... smaller is better

Performance rating - Percent
Asus NUC 15 Pro+
Intel Core Ultra 9 285H, Intel Arc Graphics 140T
94.6 pt
GMK EVO-T1 -1!
Intel Core Ultra 9 285H, Intel Arc Graphics 140T
89.5 pt
MSI Cubi NUC AI+ 2MG
Intel Core Ultra 7 258V, Intel Arc Graphics 140V
87.5 pt
MSI Cubi NUC AI+ 3MG
Intel Core Ultra 9 386H, Intel Graphics 4 Xe3 Panther Lake iGPU
79.2 pt
GMK NucBox K16
AMD Ryzen 7 7735HS, AMD Radeon 680M
53.3 pt
MSI Cubi NUC 1M -2!
Intel Core 7 150U, Intel Iris Xe Graphics G7 96EUs
46.7 pt
Geekom A5 Pro -2!
AMD Ryzen 5 7530U, AMD Radeon RX Vega 7
39.7 pt
Cyberpunk 2077 - 1920x1080 Ultra Preset (FSR off)
Asus NUC 15 Pro+
Intel Core Ultra 9 285H, Intel Arc Graphics 140T
25.6 (22min, 21.1P1) fps +21%
GMK EVO-T1
Intel Core Ultra 9 285H, Intel Arc Graphics 140T
24.8 (21.5min) fps +18%
MSI Cubi NUC AI+ 3MG
Intel Core Ultra 9 386H, Intel Graphics 4 Xe3 Panther Lake iGPU
21.1 (18.1min, 17.5P1) fps
MSI Cubi NUC AI+ 2MG
Intel Core Ultra 7 258V, Intel Arc Graphics 140V
19.4 (11min, 10.1P1) fps -8%
GMK NucBox K16
AMD Ryzen 7 7735HS, AMD Radeon 680M
12.6 (10.8min, 10.2P1) fps -40%
MSI Cubi NUC 1M
Intel Core 7 150U, Intel Iris Xe Graphics G7 96EUs
9.46 (7.99min) fps -55%
Geekom A5 Pro
AMD Ryzen 5 7530U, AMD Radeon RX Vega 7
7 (5.89min) fps -67%
Baldur's Gate 3 - 1920x1080 Ultra Preset AA:T
MSI Cubi NUC AI+ 2MG
Intel Core Ultra 7 258V, Intel Arc Graphics 140V
26.7 fps +17%
Asus NUC 15 Pro+
Intel Core Ultra 9 285H, Intel Arc Graphics 140T
26 (19.7min, 19.8P0.1, 23.2P1) fps +14%
GMK EVO-T1
Intel Core Ultra 9 285H, Intel Arc Graphics 140T
25.3 (21.5min, 22.2P0.1, 22.8P1) fps +11%
MSI Cubi NUC AI+ 3MG
Intel Core Ultra 9 386H, Intel Graphics 4 Xe3 Panther Lake iGPU
22.8 (21.2min, 21.2P0.1, 21.3P1) fps
GMK NucBox K16
AMD Ryzen 7 7735HS, AMD Radeon 680M
16.5 (11.1min, 11.3P0.1, 12.8P1) fps -28%
GTA V - 1920x1080 Highest AA:4xMSAA + FX AF:16x
MSI Cubi NUC AI+ 2MG
Intel Core Ultra 7 258V, Intel Arc Graphics 140V
26.6 (9.34min, 11.4P1) fps +30%
MSI Cubi NUC AI+ 3MG
Intel Core Ultra 9 386H, Intel Graphics 4 Xe3 Panther Lake iGPU
20.4 (5.58min, 15.9P1) fps
Asus NUC 15 Pro+
Intel Core Ultra 9 285H, Intel Arc Graphics 140T
18.5 (8.68min, 14.9P1) fps -9%
GMK EVO-T1
Intel Core Ultra 9 285H, Intel Arc Graphics 140T
18.1 (7.49min, 14.1P1) fps -11%
GMK NucBox K16
AMD Ryzen 7 7735HS, AMD Radeon 680M
13.1 (4.12min, 9.26P1) fps -36%
MSI Cubi NUC 1M
Intel Core 7 150U, Intel Iris Xe Graphics G7 96EUs
9.98 (4.2min, 6.21P1) fps -51%
Geekom A5 Pro
AMD Ryzen 5 7530U, AMD Radeon RX Vega 7
9.2 (1.853min, 6.49P1) fps -55%
Final Fantasy XV Benchmark - 1920x1080 High Quality
GMK EVO-T1
Intel Core Ultra 9 285H, Intel Arc Graphics 140T
31.7 fps +26%
Asus NUC 15 Pro+
Intel Core Ultra 9 285H, Intel Arc Graphics 140T
30.9 fps +23%
MSI Cubi NUC AI+ 2MG
Intel Core Ultra 7 258V, Intel Arc Graphics 140V
28.7 fps +14%
MSI Cubi NUC AI+ 3MG
Intel Core Ultra 9 386H, Intel Graphics 4 Xe3 Panther Lake iGPU
25.1 fps
MSI Cubi NUC 1M
Intel Core 7 150U, Intel Iris Xe Graphics G7 96EUs
16.6 fps -34%
GMK NucBox K16
AMD Ryzen 7 7735HS, AMD Radeon 680M
15.8 fps -37%
Geekom A5 Pro
AMD Ryzen 5 7530U, AMD Radeon RX Vega 7
11.8 fps -53%
Strange Brigade - 1920x1080 ultra AA:ultra AF:16
MSI Cubi NUC AI+ 2MG
Intel Core Ultra 7 258V, Intel Arc Graphics 140V
57.3 (18min, 27.8P1) fps +18%
Asus NUC 15 Pro+
Intel Core Ultra 9 285H, Intel Arc Graphics 140T
56.2 (40.6min, 46.2P1) fps +16%
MSI Cubi NUC AI+ 3MG
Intel Core Ultra 9 386H, Intel Graphics 4 Xe3 Panther Lake iGPU
48.5 (33.7min, 37.6P1) fps
GMK NucBox K16
AMD Ryzen 7 7735HS, AMD Radeon 680M
25.3 (17.7min, 19.6P1) fps -48%
MSI Cubi NUC 1M
Intel Core 7 150U, Intel Iris Xe Graphics G7 96EUs
25.2 (5.3min, 6.89P1) fps -48%
Dota 2 Reborn - 1920x1080 ultra (3/3) best looking
Asus NUC 15 Pro+
Intel Core Ultra 9 285H, Intel Arc Graphics 140T
92.2 (50.4min) fps +15%
GMK EVO-T1
Intel Core Ultra 9 285H, Intel Arc Graphics 140T
81.4 (52.3min) fps +2%
MSI Cubi NUC AI+ 3MG
Intel Core Ultra 9 386H, Intel Graphics 4 Xe3 Panther Lake iGPU
79.9 (53.3min) fps
MSI Cubi NUC AI+ 2MG
Intel Core Ultra 7 258V, Intel Arc Graphics 140V
65.8 (32.9min) fps -18%
MSI Cubi NUC 1M
Intel Core 7 150U, Intel Iris Xe Graphics G7 96EUs
57.8 (39.9min) fps -28%
GMK NucBox K16
AMD Ryzen 7 7735HS, AMD Radeon 680M
52.2 (44min) fps -35%
Geekom A5 Pro
AMD Ryzen 5 7530U, AMD Radeon RX Vega 7
47.1 (41.6min) fps -41%
X-Plane 11.11 - 1920x1080 high (fps_test=3)
Asus NUC 15 Pro+
Intel Core Ultra 9 285H, Intel Arc Graphics 140T
48.3 fps +69%
GMK EVO-T1
Intel Core Ultra 9 285H, Intel Arc Graphics 140T
42.9 fps +50%
MSI Cubi NUC AI+ 2MG
Intel Core Ultra 7 258V, Intel Arc Graphics 140V
36 fps +26%
GMK NucBox K16
AMD Ryzen 7 7735HS, AMD Radeon 680M
30 fps +5%
MSI Cubi NUC AI+ 3MG
Intel Core Ultra 9 386H, Intel Graphics 4 Xe3 Panther Lake iGPU
28.6 fps
Geekom A5 Pro
AMD Ryzen 5 7530U, AMD Radeon RX Vega 7
23.3 fps -19%
Cyberpunk 2077
1280x720 Low Preset (FSR off)
Asus NUC 15 Pro+
Intel Core Ultra 9 285H, Intel Arc Graphics 140T
62.8 (53.8min, 50.6P1) fps +1%
MSI Cubi NUC AI+ 2MG
Intel Core Ultra 7 258V, Intel Arc Graphics 140V
62.5 (32.9min, 26.7P1) fps +1%
MSI Cubi NUC AI+ 3MG
Intel Core Ultra 9 386H, Intel Graphics 4 Xe3 Panther Lake iGPU
62 (50.9min, 48.7P1) fps
Average Intel Graphics 4 Xe3 Panther Lake iGPU
  (58.7 - 65, n=4)
61.3 fps -1%
GMK EVO-T1
Intel Core Ultra 9 285H, Intel Arc Graphics 140T
57.2 (48.1min) fps -8%
GMK NucBox K16
AMD Ryzen 7 7735HS, AMD Radeon 680M
38.6 (32.5min, 30.8P1) fps -38%
MSI Cubi NUC 1M
Intel Core 7 150U, Intel Iris Xe Graphics G7 96EUs
25.5 (19.8min) fps -59%
Geekom A5 Pro
AMD Ryzen 5 7530U, AMD Radeon RX Vega 7
23.6 (18.7min) fps -62%
1920x1080 Low Preset (FSR off)
Asus NUC 15 Pro+
Intel Core Ultra 9 285H, Intel Arc Graphics 140T
40.5 (35.6min, 34.1P1) fps +9%
GMK EVO-T1
Intel Core Ultra 9 285H, Intel Arc Graphics 140T
38.8 (34.1min) fps +5%
MSI Cubi NUC AI+ 3MG
Intel Core Ultra 9 386H, Intel Graphics 4 Xe3 Panther Lake iGPU
37.1 (31.7min, 30.4P1) fps
Average Intel Graphics 4 Xe3 Panther Lake iGPU
  (32.7 - 38.6, n=7)
36.1 fps -3%
MSI Cubi NUC AI+ 2MG
Intel Core Ultra 7 258V, Intel Arc Graphics 140V
33.9 (19.2min, 16.7P1) fps -9%
GMK NucBox K16
AMD Ryzen 7 7735HS, AMD Radeon 680M
23.3 (20.1min, 19.1P1) fps -37%
MSI Cubi NUC 1M
Intel Core 7 150U, Intel Iris Xe Graphics G7 96EUs
15.4 (12.1min) fps -58%
Geekom A5 Pro
AMD Ryzen 5 7530U, AMD Radeon RX Vega 7
13.2 (10.6min) fps -64%
1920x1080 Medium Preset (FSR off)
Asus NUC 15 Pro+
Intel Core Ultra 9 285H, Intel Arc Graphics 140T
33.7 (29.8min, 29P1) fps +19%
GMK EVO-T1
Intel Core Ultra 9 285H, Intel Arc Graphics 140T
31.4 (27.4min) fps +11%
MSI Cubi NUC AI+ 3MG
Intel Core Ultra 9 386H, Intel Graphics 4 Xe3 Panther Lake iGPU
28.4 (24.9min, 23.9P1) fps
Average Intel Graphics 4 Xe3 Panther Lake iGPU
  (26.9 - 29.5, n=7)
28.1 fps -1%
MSI Cubi NUC AI+ 2MG
Intel Core Ultra 7 258V, Intel Arc Graphics 140V
26.6 (15.5min, 13.9P1) fps -6%
GMK NucBox K16
AMD Ryzen 7 7735HS, AMD Radeon 680M
18.6 (16.1min, 15.7P1) fps -35%
MSI Cubi NUC 1M
Intel Core 7 150U, Intel Iris Xe Graphics G7 96EUs
12.4 (10.3min) fps -56%
Geekom A5 Pro
AMD Ryzen 5 7530U, AMD Radeon RX Vega 7
9.9 (8.48min) fps -65%
1920x1080 High Preset (FSR off)
Asus NUC 15 Pro+
Intel Core Ultra 9 285H, Intel Arc Graphics 140T
29 (25.5min, 24.8P1) fps +18%
GMK EVO-T1
Intel Core Ultra 9 285H, Intel Arc Graphics 140T
26.7 (23.2min) fps +9%
MSI Cubi NUC AI+ 3MG
Intel Core Ultra 9 386H, Intel Graphics 4 Xe3 Panther Lake iGPU
24.5 (21.2min, 20.5P1) fps
Average Intel Graphics 4 Xe3 Panther Lake iGPU
  (20.7 - 25.5, n=7)
23.5 fps -4%
MSI Cubi NUC AI+ 2MG
Intel Core Ultra 7 258V, Intel Arc Graphics 140V
23.2 (12.6min, 11.3P1) fps -5%
GMK NucBox K16
AMD Ryzen 7 7735HS, AMD Radeon 680M
14.3 (12.5min, 12P1) fps -42%
MSI Cubi NUC 1M
Intel Core 7 150U, Intel Iris Xe Graphics G7 96EUs
10.8 (8.83min) fps -56%
Geekom A5 Pro
AMD Ryzen 5 7530U, AMD Radeon RX Vega 7
8.37 (7.07min) fps -66%
1920x1080 Ultra Preset (FSR off)
Asus NUC 15 Pro+
Intel Core Ultra 9 285H, Intel Arc Graphics 140T
25.6 (22min, 21.1P1) fps +21%
GMK EVO-T1
Intel Core Ultra 9 285H, Intel Arc Graphics 140T
24.8 (21.5min) fps +18%
MSI Cubi NUC AI+ 3MG
Intel Core Ultra 9 386H, Intel Graphics 4 Xe3 Panther Lake iGPU
21.1 (18.1min, 17.5P1) fps
Average Intel Graphics 4 Xe3 Panther Lake iGPU
  (17.7 - 21.5, n=7)
20 fps -5%
MSI Cubi NUC AI+ 2MG
Intel Core Ultra 7 258V, Intel Arc Graphics 140V
19.4 (11min, 10.1P1) fps -8%
GMK NucBox K16
AMD Ryzen 7 7735HS, AMD Radeon 680M
12.6 (10.8min, 10.2P1) fps -40%
MSI Cubi NUC 1M
Intel Core 7 150U, Intel Iris Xe Graphics G7 96EUs
9.46 (7.99min) fps -55%
Geekom A5 Pro
AMD Ryzen 5 7530U, AMD Radeon RX Vega 7
7 (5.89min) fps -67%
Final Fantasy XV Benchmark
1280x720 Lite Quality
GMK EVO-T1
Intel Core Ultra 9 285H, Intel Arc Graphics 140T
81.8 fps +27%
Asus NUC 15 Pro+
Intel Core Ultra 9 285H, Intel Arc Graphics 140T
77.9 fps +21%
MSI Cubi NUC AI+ 2MG
Intel Core Ultra 7 258V, Intel Arc Graphics 140V
71.3 fps +11%
Average Intel Graphics 4 Xe3 Panther Lake iGPU
  (58 - 72.3, n=6)
66.1 fps +3%
MSI Cubi NUC AI+ 3MG
Intel Core Ultra 9 386H, Intel Graphics 4 Xe3 Panther Lake iGPU
64.3 fps
GMK NucBox K16
AMD Ryzen 7 7735HS, AMD Radeon 680M
41.2 fps -36%
MSI Cubi NUC 1M
Intel Core 7 150U, Intel Iris Xe Graphics G7 96EUs
40.9 fps -36%
Geekom A5 Pro
AMD Ryzen 5 7530U, AMD Radeon RX Vega 7
32.7 fps -49%
1920x1080 Standard Quality
GMK EVO-T1
Intel Core Ultra 9 285H, Intel Arc Graphics 140T
44.3 fps +28%
Asus NUC 15 Pro+
Intel Core Ultra 9 285H, Intel Arc Graphics 140T
43.6 fps +26%
MSI Cubi NUC AI+ 2MG
Intel Core Ultra 7 258V, Intel Arc Graphics 140V
39.1 fps +13%
Average Intel Graphics 4 Xe3 Panther Lake iGPU
  (34.5 - 36.7, n=6)
35.4 fps +2%
MSI Cubi NUC AI+ 3MG
Intel Core Ultra 9 386H, Intel Graphics 4 Xe3 Panther Lake iGPU
34.6 fps
MSI Cubi NUC 1M
Intel Core 7 150U, Intel Iris Xe Graphics G7 96EUs
23 fps -34%
GMK NucBox K16
AMD Ryzen 7 7735HS, AMD Radeon 680M
22.1 fps -36%
Geekom A5 Pro
AMD Ryzen 5 7530U, AMD Radeon RX Vega 7
17.2 fps -50%
1920x1080 High Quality
GMK EVO-T1
Intel Core Ultra 9 285H, Intel Arc Graphics 140T
31.7 fps +26%
Asus NUC 15 Pro+
Intel Core Ultra 9 285H, Intel Arc Graphics 140T
30.9 fps +23%
MSI Cubi NUC AI+ 2MG
Intel Core Ultra 7 258V, Intel Arc Graphics 140V
28.7 fps +14%
Average Intel Graphics 4 Xe3 Panther Lake iGPU
  (24.8 - 26.2, n=6)
25.5 fps +2%
MSI Cubi NUC AI+ 3MG
Intel Core Ultra 9 386H, Intel Graphics 4 Xe3 Panther Lake iGPU
25.1 fps
MSI Cubi NUC 1M
Intel Core 7 150U, Intel Iris Xe Graphics G7 96EUs
16.6 fps -34%
GMK NucBox K16
AMD Ryzen 7 7735HS, AMD Radeon 680M
15.8 fps -37%
Geekom A5 Pro
AMD Ryzen 5 7530U, AMD Radeon RX Vega 7
11.8 fps -53%
Dota 2 Reborn
1280x720 min (0/3) fastest
Geekom A5 Pro
AMD Ryzen 5 7530U, AMD Radeon RX Vega 7
111 (91.4min) fps +7%
Average Intel Graphics 4 Xe3 Panther Lake iGPU
  (101.7 - 139.2, n=7)
109.5 fps +5%
Asus NUC 15 Pro+
Intel Core Ultra 9 285H, Intel Arc Graphics 140T
107.9 (57.9min) fps +4%
GMK EVO-T1
Intel Core Ultra 9 285H, Intel Arc Graphics 140T
107.3 (62.5min) fps +3%
MSI Cubi NUC AI+ 3MG
Intel Core Ultra 9 386H, Intel Graphics 4 Xe3 Panther Lake iGPU
104.1 (69.1min) fps
GMK NucBox K16
AMD Ryzen 7 7735HS, AMD Radeon 680M
101.2 (86.7min) fps -3%
MSI Cubi NUC AI+ 2MG
Intel Core Ultra 7 258V, Intel Arc Graphics 140V
98.1 (63.6min) fps -6%
MSI Cubi NUC 1M
Intel Core 7 150U, Intel Iris Xe Graphics G7 96EUs
97.7 (57.3min) fps -6%
1366x768 med (1/3)
Asus NUC 15 Pro+
Intel Core Ultra 9 285H, Intel Arc Graphics 140T
94.5 (55.6min) fps +18%
GMK EVO-T1
Intel Core Ultra 9 285H, Intel Arc Graphics 140T
91.1 (54.2min) fps +13%
Geekom A5 Pro
AMD Ryzen 5 7530U, AMD Radeon RX Vega 7
86.1 (63.9min) fps +7%
GMK NucBox K16
AMD Ryzen 7 7735HS, AMD Radeon 680M
82.8 (70.9min) fps +3%
Average Intel Graphics 4 Xe3 Panther Lake iGPU
  (67.5 - 91.5, n=7)
81.4 fps +1%
MSI Cubi NUC AI+ 2MG
Intel Core Ultra 7 258V, Intel Arc Graphics 140V
80.4 (44.8min) fps 0%
MSI Cubi NUC AI+ 3MG
Intel Core Ultra 9 386H, Intel Graphics 4 Xe3 Panther Lake iGPU
80.3 (57.7min) fps
MSI Cubi NUC 1M
Intel Core 7 150U, Intel Iris Xe Graphics G7 96EUs
61.9 (45.9min) fps -23%
1920x1080 high (2/3)
Asus NUC 15 Pro+
Intel Core Ultra 9 285H, Intel Arc Graphics 140T
87.6 (52.1min) fps +8%
GMK EVO-T1
Intel Core Ultra 9 285H, Intel Arc Graphics 140T
84.8 (52.1min) fps +4%
MSI Cubi NUC AI+ 3MG
Intel Core Ultra 9 386H, Intel Graphics 4 Xe3 Panther Lake iGPU
81.2 (53.8min) fps
Average Intel Graphics 4 Xe3 Panther Lake iGPU
  (72.6 - 81.8, n=7)
77.1 fps -5%
MSI Cubi NUC 1M
Intel Core 7 150U, Intel Iris Xe Graphics G7 96EUs
62.5 (42.1min) fps -23%
MSI Cubi NUC AI+ 2MG
Intel Core Ultra 7 258V, Intel Arc Graphics 140V
59.9 (22.6min) fps -26%
GMK NucBox K16
AMD Ryzen 7 7735HS, AMD Radeon 680M
59.8 (52.1min) fps -26%
Geekom A5 Pro
AMD Ryzen 5 7530U, AMD Radeon RX Vega 7
50.7 (44min) fps -38%
1920x1080 ultra (3/3) best looking
Asus NUC 15 Pro+
Intel Core Ultra 9 285H, Intel Arc Graphics 140T
92.2 (50.4min) fps +15%
GMK EVO-T1
Intel Core Ultra 9 285H, Intel Arc Graphics 140T
81.4 (52.3min) fps +2%
MSI Cubi NUC AI+ 3MG
Intel Core Ultra 9 386H, Intel Graphics 4 Xe3 Panther Lake iGPU
79.9 (53.3min) fps
Average Intel Graphics 4 Xe3 Panther Lake iGPU
  (68.4 - 79.9, n=7)
73.3 fps -8%
MSI Cubi NUC AI+ 2MG
Intel Core Ultra 7 258V, Intel Arc Graphics 140V
65.8 (32.9min) fps -18%
MSI Cubi NUC 1M
Intel Core 7 150U, Intel Iris Xe Graphics G7 96EUs
57.8 (39.9min) fps -28%
GMK NucBox K16
AMD Ryzen 7 7735HS, AMD Radeon 680M
52.2 (44min) fps -35%
Geekom A5 Pro
AMD Ryzen 5 7530U, AMD Radeon RX Vega 7
47.1 (41.6min) fps -41%
X-Plane 11.11
1280x720 low (fps_test=1)
Asus NUC 15 Pro+
Intel Core Ultra 9 285H, Intel Arc Graphics 140T
71.4 fps +71%
GMK EVO-T1
Intel Core Ultra 9 285H, Intel Arc Graphics 140T
63.5 fps +52%
MSI Cubi NUC AI+ 2MG
Intel Core Ultra 7 258V, Intel Arc Graphics 140V
51.8 fps +24%
GMK NucBox K16
AMD Ryzen 7 7735HS, AMD Radeon 680M
42.3 fps +1%
MSI Cubi NUC AI+ 3MG
Intel Core Ultra 9 386H, Intel Graphics 4 Xe3 Panther Lake iGPU
41.7 fps
Average Intel Graphics 4 Xe3 Panther Lake iGPU
  (37 - 45.1, n=7)
41.5 fps 0%
Geekom A5 Pro
AMD Ryzen 5 7530U, AMD Radeon RX Vega 7
35.1 fps -16%
1920x1080 med (fps_test=2)
Asus NUC 15 Pro+
Intel Core Ultra 9 285H, Intel Arc Graphics 140T
55.7 fps +68%
GMK EVO-T1
Intel Core Ultra 9 285H, Intel Arc Graphics 140T
53.1 fps +60%
MSI Cubi NUC AI+ 2MG
Intel Core Ultra 7 258V, Intel Arc Graphics 140V
41.7 fps +26%
GMK NucBox K16
AMD Ryzen 7 7735HS, AMD Radeon 680M
34.2 fps +3%
MSI Cubi NUC AI+ 3MG
Intel Core Ultra 9 386H, Intel Graphics 4 Xe3 Panther Lake iGPU
33.2 fps
Average Intel Graphics 4 Xe3 Panther Lake iGPU
  (29.6 - 33.5, n=7)
31.7 fps -5%
Geekom A5 Pro
AMD Ryzen 5 7530U, AMD Radeon RX Vega 7
25.7 fps -23%
1920x1080 high (fps_test=3)
Asus NUC 15 Pro+
Intel Core Ultra 9 285H, Intel Arc Graphics 140T
48.3 fps +69%
GMK EVO-T1
Intel Core Ultra 9 285H, Intel Arc Graphics 140T
42.9 fps +50%
MSI Cubi NUC AI+ 2MG
Intel Core Ultra 7 258V, Intel Arc Graphics 140V
36 fps +26%
GMK NucBox K16
AMD Ryzen 7 7735HS, AMD Radeon 680M
30 fps +5%
Average Intel Graphics 4 Xe3 Panther Lake iGPU
  (22.9 - 32.4, n=7)
28.9 fps +1%
MSI Cubi NUC AI+ 3MG
Intel Core Ultra 9 386H, Intel Graphics 4 Xe3 Panther Lake iGPU
28.6 fps
Geekom A5 Pro
AMD Ryzen 5 7530U, AMD Radeon RX Vega 7
23.3 fps -19%
GTA V
1024x768 Lowest Settings possible
Asus NUC 15 Pro+
Intel Core Ultra 9 285H, Intel Arc Graphics 140T
176.4 (3.08min, 125P1) fps +12%
Average Intel Graphics 4 Xe3 Panther Lake iGPU
  (153.6 - 180.8, n=6)
164.9 fps +4%
GMK EVO-T1
Intel Core Ultra 9 285H, Intel Arc Graphics 140T
164 (3.82min, 100P1) fps +4%
MSI Cubi NUC AI+ 2MG
Intel Core Ultra 7 258V, Intel Arc Graphics 140V
160.4 (4.6min, 100P1) fps +2%
MSI Cubi NUC AI+ 3MG
Intel Core Ultra 9 386H, Intel Graphics 4 Xe3 Panther Lake iGPU
157.9 (4.38min, 100P1) fps
Geekom A5 Pro
AMD Ryzen 5 7530U, AMD Radeon RX Vega 7
102.9 (11.2min, 66.7P1) fps -35%
MSI Cubi NUC 1M
Intel Core 7 150U, Intel Iris Xe Graphics G7 96EUs
100.3 (39.9min, 62.5P1) fps -36%
GMK NucBox K16
AMD Ryzen 7 7735HS, AMD Radeon 680M
88.3 (10.4min, 55.6P1) fps -44%
1920x1080 Lowest Settings possible
Asus NUC 15 Pro+
Intel Core Ultra 9 285H, Intel Arc Graphics 140T
152.6 (4.38min, 100P1) fps +6%
MSI Cubi NUC AI+ 2MG
Intel Core Ultra 7 258V, Intel Arc Graphics 140V
151 (4.26min, 58.8P1) fps +4%
Average Intel Graphics 4 Xe3 Panther Lake iGPU
  (133.2 - 160.9, n=5)
149.3 fps +3%
MSI Cubi NUC AI+ 3MG
Intel Core Ultra 9 386H, Intel Graphics 4 Xe3 Panther Lake iGPU
144.6 (4.58min, 90.9P1) fps
GMK EVO-T1
Intel Core Ultra 9 285H, Intel Arc Graphics 140T
143 (4.4min, 90.9P1) fps -1%
MSI Cubi NUC 1M
Intel Core 7 150U, Intel Iris Xe Graphics G7 96EUs
78.6 (26min, 50P1) fps -46%
Geekom A5 Pro
AMD Ryzen 5 7530U, AMD Radeon RX Vega 7
64.2 (12.6min, 45.5P1) fps -56%
GMK NucBox K16
AMD Ryzen 7 7735HS, AMD Radeon 680M
63.6 (18.5min, 41.7P1) fps -56%
1366x768 Normal/Off AF:4x
Asus NUC 15 Pro+
Intel Core Ultra 9 285H, Intel Arc Graphics 140T
168.9 (3.98min, 125P1) fps +13%
Average Intel Graphics 4 Xe3 Panther Lake iGPU
  (149.5 - 174.7, n=6)
160.7 fps +7%
GMK EVO-T1
Intel Core Ultra 9 285H, Intel Arc Graphics 140T
155 (4.38min, 90.9P1) fps +4%
MSI Cubi NUC AI+ 2MG
Intel Core Ultra 7 258V, Intel Arc Graphics 140V
152.4 (3.6min, 90.9P1) fps +2%
MSI Cubi NUC AI+ 3MG
Intel Core Ultra 9 386H, Intel Graphics 4 Xe3 Panther Lake iGPU
149.5 (4.51min, 90.9P1) fps
Geekom A5 Pro
AMD Ryzen 5 7530U, AMD Radeon RX Vega 7
90.3 (14.3min, 58.8P1) fps -40%
MSI Cubi NUC 1M
Intel Core 7 150U, Intel Iris Xe Graphics G7 96EUs
86.1 (7.7min, 50P1) fps -42%
GMK NucBox K16
AMD Ryzen 7 7735HS, AMD Radeon 680M
82.2 (15.2min, 50P1) fps -45%
1920x1080 Normal/Off AF:4x
MSI Cubi NUC AI+ 2MG
Intel Core Ultra 7 258V, Intel Arc Graphics 140V
145 (4.16min, 58.8P1) fps +4%
Average Intel Graphics 4 Xe3 Panther Lake iGPU
  (133.4 - 153.6, n=5)
143.4 fps +3%
Asus NUC 15 Pro+
Intel Core Ultra 9 285H, Intel Arc Graphics 140T
140 (5.75min, 100P1) fps +1%
MSI Cubi NUC AI+ 3MG
Intel Core Ultra 9 386H, Intel Graphics 4 Xe3 Panther Lake iGPU
139.2 (6.59min, 83.3P1) fps
GMK EVO-T1
Intel Core Ultra 9 285H, Intel Arc Graphics 140T
130 (26min, 83.3P1) fps -7%
MSI Cubi NUC 1M
Intel Core 7 150U, Intel Iris Xe Graphics G7 96EUs
71 (6.44min, 40P1) fps -49%
GMK NucBox K16
AMD Ryzen 7 7735HS, AMD Radeon 680M
65.2 (19.6min, 40P1) fps -53%
Geekom A5 Pro
AMD Ryzen 5 7530U, AMD Radeon RX Vega 7
63.3 (12.2min, 45.5P1) fps -55%
1920x1080 High/On (Advanced Graphics Off) AA:2xMSAA + FX AF:8x
MSI Cubi NUC AI+ 2MG
Intel Core Ultra 7 258V, Intel Arc Graphics 140V
63.6 (8.99min, 25.6P1) fps +24%
Average Intel Graphics 4 Xe3 Panther Lake iGPU
  (48.3 - 58.2, n=6)
52.7 fps +3%
MSI Cubi NUC AI+ 3MG
Intel Core Ultra 9 386H, Intel Graphics 4 Xe3 Panther Lake iGPU
51.1 (6.55min, 40P1) fps
Asus NUC 15 Pro+
Intel Core Ultra 9 285H, Intel Arc Graphics 140T
45.3 (15.1min, 35.7P1) fps -11%
GMK EVO-T1
Intel Core Ultra 9 285H, Intel Arc Graphics 140T
44.2 (13.2min, 33.3P1) fps -14%
GMK NucBox K16
AMD Ryzen 7 7735HS, AMD Radeon 680M
29.4 (4.37min, 20P1) fps -42%
MSI Cubi NUC 1M
Intel Core 7 150U, Intel Iris Xe Graphics G7 96EUs
23.6 (8.96min, 17.2P1) fps -54%
Geekom A5 Pro
AMD Ryzen 5 7530U, AMD Radeon RX Vega 7
20.6 (4.68min, 14.7P1) fps -60%
1920x1080 Highest AA:4xMSAA + FX AF:16x
MSI Cubi NUC AI+ 2MG
Intel Core Ultra 7 258V, Intel Arc Graphics 140V
26.6 (9.34min, 11.4P1) fps +30%
Average Intel Graphics 4 Xe3 Panther Lake iGPU
  (19.8 - 23.8, n=6)
21.2 fps +4%
MSI Cubi NUC AI+ 3MG
Intel Core Ultra 9 386H, Intel Graphics 4 Xe3 Panther Lake iGPU
20.4 (5.58min, 15.9P1) fps
Asus NUC 15 Pro+
Intel Core Ultra 9 285H, Intel Arc Graphics 140T
18.5 (8.68min, 14.9P1) fps -9%
GMK EVO-T1
Intel Core Ultra 9 285H, Intel Arc Graphics 140T
18.1 (7.49min, 14.1P1) fps -11%
GMK NucBox K16
AMD Ryzen 7 7735HS, AMD Radeon 680M
13.1 (4.12min, 9.26P1) fps -36%
MSI Cubi NUC 1M
Intel Core 7 150U, Intel Iris Xe Graphics G7 96EUs
9.98 (4.2min, 6.21P1) fps -51%
Geekom A5 Pro
AMD Ryzen 5 7530U, AMD Radeon RX Vega 7
9.2 (1.853min, 6.49P1) fps -55%
F1 24
1920x1080 Low Preset AA:T AF:16x
GMK EVO-T1
Intel Core Ultra 9 285H, Intel Arc Graphics 140T
86.4 (75min, 67P1) fps +29%
Asus NUC 15 Pro+
Intel Core Ultra 9 285H, Intel Arc Graphics 140T
83 (71min, 67P1) fps +24%
MSI Cubi NUC AI+ 2MG
Intel Core Ultra 7 258V, Intel Arc Graphics 140V
72 (52min, 30P1) fps +8%
MSI Cubi NUC AI+ 3MG
Intel Core Ultra 9 386H, Intel Graphics 4 Xe3 Panther Lake iGPU
66.9 (57min, 55P1) fps
Average Intel Graphics 4 Xe3 Panther Lake iGPU
  (55.6 - 67.2, n=5)
64.5 fps -4%
GMK NucBox K16
AMD Ryzen 7 7735HS, AMD Radeon 680M
42.8 (33min, 27P1) fps -36%
Geekom A5 Pro
AMD Ryzen 5 7530U, AMD Radeon RX Vega 7
26.4 (12min, 17P1) fps -61%
1920x1080 Medium Preset AA:T AF:16x
GMK EVO-T1
Intel Core Ultra 9 285H, Intel Arc Graphics 140T
79 (69min, 63P1) fps +28%
Asus NUC 15 Pro+
Intel Core Ultra 9 285H, Intel Arc Graphics 140T
74.9 (65min, 61P1) fps +22%
MSI Cubi NUC AI+ 3MG
Intel Core Ultra 9 386H, Intel Graphics 4 Xe3 Panther Lake iGPU
61.5 (53min, 52P1) fps
Average Intel Graphics 4 Xe3 Panther Lake iGPU
  (52.7 - 64.3, n=5)
59.8 fps -3%
GMK NucBox K16
AMD Ryzen 7 7735HS, AMD Radeon 680M
35.8 (14min, 22P1) fps -42%
Geekom A5 Pro
AMD Ryzen 5 7530U, AMD Radeon RX Vega 7
23.1 (17min, 15P1) fps -62%
1920x1080 High Preset AA:T AF:16x
GMK EVO-T1
Intel Core Ultra 9 285H, Intel Arc Graphics 140T
59.6 (53min, 51P1) fps +30%
Asus NUC 15 Pro+
Intel Core Ultra 9 285H, Intel Arc Graphics 140T
57.7 (51min, 49P1) fps +26%
MSI Cubi NUC AI+ 2MG
Intel Core Ultra 7 258V, Intel Arc Graphics 140V
53.8 (38min, 22P1) fps +17%
MSI Cubi NUC AI+ 3MG
Intel Core Ultra 9 386H, Intel Graphics 4 Xe3 Panther Lake iGPU
45.8 (39min, 38P1) fps
Average Intel Graphics 4 Xe3 Panther Lake iGPU
  (40.8 - 46.5, n=5)
44.2 fps -3%
GMK NucBox K16
AMD Ryzen 7 7735HS, AMD Radeon 680M
23.7 (9P1) fps -48%
Geekom A5 Pro
AMD Ryzen 5 7530U, AMD Radeon RX Vega 7
16.8 (11min, 11P1) fps -63%
1920x1080 Ultra High Preset AA:T AF:16x
GMK EVO-T1
Intel Core Ultra 9 285H, Intel Arc Graphics 140T
19.5 (16min, 16P1) fps +37%
Asus NUC 15 Pro+
Intel Core Ultra 9 285H, Intel Arc Graphics 140T
19.2 (16min, 16P1) fps +35%
MSI Cubi NUC AI+ 2MG
Intel Core Ultra 7 258V, Intel Arc Graphics 140V
16.6 (10min, 7P1) fps +17%
MSI Cubi NUC AI+ 3MG
Intel Core Ultra 9 386H, Intel Graphics 4 Xe3 Panther Lake iGPU
14.2 (11min, 11P1) fps
Average Intel Graphics 4 Xe3 Panther Lake iGPU
  (13.2 - 14.8, n=5)
14.1 fps -1%
GMK NucBox K16
AMD Ryzen 7 7735HS, AMD Radeon 680M
7.62 (2min, 4P1) fps -46%
Baldur's Gate 3
1280x720 Low Preset AA:SM
MSI Cubi NUC AI+ 2MG
Intel Core Ultra 7 258V, Intel Arc Graphics 140V
57.6 fps +27%
GMK EVO-T1
Intel Core Ultra 9 285H, Intel Arc Graphics 140T
57.4 (40.9min, 41.5P0.1, 46.6P1) fps +27%
Asus NUC 15 Pro+
Intel Core Ultra 9 285H, Intel Arc Graphics 140T
57.3 (43.1min, 43.6P0.1, 47.5P1) fps +26%
MSI Cubi NUC AI+ 3MG
Intel Core Ultra 9 386H, Intel Graphics 4 Xe3 Panther Lake iGPU
45.3 (38min, 38.7P0.1, 41.3P1) fps
Average Intel Graphics 4 Xe3 Panther Lake iGPU
  (39.7 - 47.1, n=4)
43.2 fps -5%
GMK NucBox K16
AMD Ryzen 7 7735HS, AMD Radeon 680M
32.1 (20min, 20.2P0.1, 22.9P1) fps -29%
MSI Cubi NUC 1M
Intel Core 7 150U, Intel Iris Xe Graphics G7 96EUs
22.9 fps -49%
Geekom A5 Pro
AMD Ryzen 5 7530U, AMD Radeon RX Vega 7
19.3 (11.6min, 11.6P0.1, 12.5P1) fps -57%
1920x1080 Low Preset AA:SM
GMK EVO-T1
Intel Core Ultra 9 285H, Intel Arc Graphics 140T
39.8 (32.3min, 33P0.1, 34.1P1) fps +26%
Asus NUC 15 Pro+
Intel Core Ultra 9 285H, Intel Arc Graphics 140T
39.5 (32.2min, 32.3P0.1, 34P1) fps +25%
MSI Cubi NUC AI+ 2MG
Intel Core Ultra 7 258V, Intel Arc Graphics 140V
36.1 fps +14%
MSI Cubi NUC AI+ 3MG
Intel Core Ultra 9 386H, Intel Graphics 4 Xe3 Panther Lake iGPU
31.6 (27.2min, 27.9P0.1, 29.2P1) fps
Average Intel Graphics 4 Xe3 Panther Lake iGPU
  (27.4 - 33, n=6)
30.1 fps -5%
GMK NucBox K16
AMD Ryzen 7 7735HS, AMD Radeon 680M
24.8 (16.1min, 16.3P0.1, 17.2P1) fps -22%
MSI Cubi NUC 1M
Intel Core 7 150U, Intel Iris Xe Graphics G7 96EUs
15.3 fps -52%
Geekom A5 Pro
AMD Ryzen 5 7530U, AMD Radeon RX Vega 7
12.7 (9.44min, 9.54P0.1, 9.87P1) fps -60%
1920x1080 Medium Preset AA:T
Asus NUC 15 Pro+
Intel Core Ultra 9 285H, Intel Arc Graphics 140T
31.2 (25.4min, 26P0.1, 27.3P1) fps +19%
GMK EVO-T1
Intel Core Ultra 9 285H, Intel Arc Graphics 140T
30.5 (25.8min, 26P0.1, 27P1) fps +16%
MSI Cubi NUC AI+ 2MG
Intel Core Ultra 7 258V, Intel Arc Graphics 140V
29.5 fps +12%
MSI Cubi NUC AI+ 3MG
Intel Core Ultra 9 386H, Intel Graphics 4 Xe3 Panther Lake iGPU
26.3 (24.1min, 24.2P0.1, 24.4P1) fps
Average Intel Graphics 4 Xe3 Panther Lake iGPU
  (21 - 27.1, n=6)
23.9 fps -9%
GMK NucBox K16
AMD Ryzen 7 7735HS, AMD Radeon 680M
20.7 (14min, 14.1P0.1, 14.6P1) fps -21%
Geekom A5 Pro
AMD Ryzen 5 7530U, AMD Radeon RX Vega 7
9.73 (7.36min, 7.56P0.1, 8.12P1) fps -63%
1920x1080 High Preset AA:T
MSI Cubi NUC AI+ 2MG
Intel Core Ultra 7 258V, Intel Arc Graphics 140V
29 fps +26%
Asus NUC 15 Pro+
Intel Core Ultra 9 285H, Intel Arc Graphics 140T
26.2 (21.4min, 21.4P0.1, 23.3P1) fps +13%
GMK EVO-T1
Intel Core Ultra 9 285H, Intel Arc Graphics 140T
26.1 (22.3min, 22.3P0.1, 23.4P1) fps +13%
MSI Cubi NUC AI+ 3MG
Intel Core Ultra 9 386H, Intel Graphics 4 Xe3 Panther Lake iGPU
23.1 (21.2min, 21.2P0.1, 21.3P1) fps
Average Intel Graphics 4 Xe3 Panther Lake iGPU
  (18 - 23.5, n=6)
20.7 fps -10%
GMK NucBox K16
AMD Ryzen 7 7735HS, AMD Radeon 680M
16.6 (11min, 11P0.1, 12.5P1) fps -28%
Geekom A5 Pro
AMD Ryzen 5 7530U, AMD Radeon RX Vega 7
8.18 (1.909min, 2.43P0.1, 6.14P1) fps -65%
1920x1080 Ultra Preset AA:T
MSI Cubi NUC AI+ 2MG
Intel Core Ultra 7 258V, Intel Arc Graphics 140V
26.7 fps +17%
Asus NUC 15 Pro+
Intel Core Ultra 9 285H, Intel Arc Graphics 140T
26 (19.7min, 19.8P0.1, 23.2P1) fps +14%
GMK EVO-T1
Intel Core Ultra 9 285H, Intel Arc Graphics 140T
25.3 (21.5min, 22.2P0.1, 22.8P1) fps +11%
MSI Cubi NUC AI+ 3MG
Intel Core Ultra 9 386H, Intel Graphics 4 Xe3 Panther Lake iGPU
22.8 (21.2min, 21.2P0.1, 21.3P1) fps
Average Intel Graphics 4 Xe3 Panther Lake iGPU
  (17.7 - 23, n=6)
20.3 fps -11%
GMK NucBox K16
AMD Ryzen 7 7735HS, AMD Radeon 680M
16.5 (11.1min, 11.3P0.1, 12.8P1) fps -28%
Strange Brigade
1280x720 lowest AF:1
MSI Cubi NUC AI+ 2MG
Intel Core Ultra 7 258V, Intel Arc Graphics 140V
240 (45.1min, 113.4P1) fps +39%
Asus NUC 15 Pro+
Intel Core Ultra 9 285H, Intel Arc Graphics 140T
198.3 (71.2min, 167.4P1) fps +15%
MSI Cubi NUC AI+ 3MG
Intel Core Ultra 9 386H, Intel Graphics 4 Xe3 Panther Lake iGPU
172.6 (94.2min, 143.1P1) fps
Average Intel Graphics 4 Xe3 Panther Lake iGPU
  (107.3 - 197, n=5)
170.5 fps -1%
MSI Cubi NUC 1M
Intel Core 7 150U, Intel Iris Xe Graphics G7 96EUs
88.2 (20min, 29.9P1) fps -49%
GMK NucBox K16
AMD Ryzen 7 7735HS, AMD Radeon 680M
85.7 (64.2min, 73.4P1) fps -50%
1920x1080 medium AA:medium AF:4
Asus NUC 15 Pro+
Intel Core Ultra 9 285H, Intel Arc Graphics 140T
79.4 (59.8min, 69.1P1) fps +17%
MSI Cubi NUC AI+ 2MG
Intel Core Ultra 7 258V, Intel Arc Graphics 140V
71.8 (20.2min, 27P1) fps +6%
MSI Cubi NUC AI+ 3MG
Intel Core Ultra 9 386H, Intel Graphics 4 Xe3 Panther Lake iGPU
68 (37min, 59.1P1) fps
Average Intel Graphics 4 Xe3 Panther Lake iGPU
  (38.2 - 70.5, n=5)
62.2 fps -9%
MSI Cubi NUC 1M
Intel Core 7 150U, Intel Iris Xe Graphics G7 96EUs
38.9 (14.7min, 28.5P1) fps -43%
GMK NucBox K16
AMD Ryzen 7 7735HS, AMD Radeon 680M
35.5 (30.1min, 30.9P1) fps -48%
1920x1080 high AA:high AF:8
Asus NUC 15 Pro+
Intel Core Ultra 9 285H, Intel Arc Graphics 140T
67 (48.2min, 55P1) fps +18%
MSI Cubi NUC AI+ 2MG
Intel Core Ultra 7 258V, Intel Arc Graphics 140V
59.7 (18.9min, 25.9P1) fps +5%
MSI Cubi NUC AI+ 3MG
Intel Core Ultra 9 386H, Intel Graphics 4 Xe3 Panther Lake iGPU
56.9 (38.5min, 45.8P1) fps
Average Intel Graphics 4 Xe3 Panther Lake iGPU
  (35.9 - 60, n=5)
54.2 fps -5%
MSI Cubi NUC 1M
Intel Core 7 150U, Intel Iris Xe Graphics G7 96EUs
31.1 (8.7min, 16.3P1) fps -45%
GMK NucBox K16
AMD Ryzen 7 7735HS, AMD Radeon 680M
30.4 (22.8min, 24.2P1) fps -47%
1920x1080 ultra AA:ultra AF:16
MSI Cubi NUC AI+ 2MG
Intel Core Ultra 7 258V, Intel Arc Graphics 140V
57.3 (18min, 27.8P1) fps +18%
Asus NUC 15 Pro+
Intel Core Ultra 9 285H, Intel Arc Graphics 140T
56.2 (40.6min, 46.2P1) fps +16%
Average Intel Graphics 4 Xe3 Panther Lake iGPU
  (43.3 - 52.1, n=5)
49.1 fps +1%
MSI Cubi NUC AI+ 3MG
Intel Core Ultra 9 386H, Intel Graphics 4 Xe3 Panther Lake iGPU
48.5 (33.7min, 37.6P1) fps
GMK NucBox K16
AMD Ryzen 7 7735HS, AMD Radeon 680M
25.3 (17.7min, 19.6P1) fps -48%
MSI Cubi NUC 1M
Intel Core 7 150U, Intel Iris Xe Graphics G7 96EUs
25.2 (5.3min, 6.89P1) fps -48%

Cyberpunk 2077 ultra FPS Chart

05101520Tooltip
MSI Cubi NUC AI+ 3MG Ultra 9 386H, Intel Graphics 4 Xe3 PTL: Ø20 (18.7-20.3)
lowmed.highultra
GTA V (2015) 157.9 149.5 51.1 20.4
Dota 2 Reborn (2015) 104.1 80.3 81.2 79.9
Final Fantasy XV Benchmark (2018) 64.3 34.6 25.1
X-Plane 11.11 (2018) 41.7 33.2 28.6
Strange Brigade (2018) 172.6 68 56.9 48.5
Baldur's Gate 3 (2023) 31.6 26.3 23.1 22.8
Cyberpunk 2077 (2023) 37.1 28.4 24.5 21.1
F1 24 (2024) 66.9 61.5 45.8 14.2

Emissions

System Noise

The internal fan is always active no matter the onscreen load much like what we observed on older Cubi models. It's quiet enough with no major throttling issues to be unnoticeable in an office or retail setting, but it can ramp up to the mid 40 dB(A) range when running more demanding loads for extended periods to be as loud as some gaming laptops.

Fan noise profile (White: Background, Red: System idle, Blue: 3DMark 06, Orange: Cyberpunk 2077, Green: Prime95+FurMark stress)

Noise level

Idle
28 / 33.2 / 33.5 dB(A)
Load
39.1 / 45.2 dB(A)
  red to green bar
 
 
30 dB
silent
40 dB(A)
audible
50 dB(A)
loud
 
min: dark, med: mid, max: light   Earthworks M23R, Arta (15 cm distance)   environment noise: 23.6 dB(A)
dB(A) 0102030405060708090Deep BassMiddle BassHigh BassLower RangeMidsHigher MidsLower HighsMid HighsUpper HighsSuper Highs2038.639.935.537.739.22528.827.225.326.531.13128.727.424.824.432.94025.126.326.123.128.85033.635.23729.327.26328.533.332.725.634.38027.12726.324.327.810025.323.822.922.324.812525.321.920.615.724.316024.323.622.418.526.320026.828.825.823.926.425025.423.819.815.427.231526.323.32216.430.94002723.420.112.528.150028.326.423.210.729.463032.427.723.110.632.680036.231.426.410.636.9100031.126.825.19.631.8125031.329.521.29.431.9160037.130.123.69.93820003528.922.510.135.8250034.329.220.510.435315032.125.318.610.732.8400031.225.119.31132500027.121.815.811.327.9630024.718.713.611.525.380002016.41411.720.41000016.61614.611.716.11250014.414.413.311.4141600013.715.614.711.312.2SPL44.439.133.523.645.2N4.431.80.54.7median 27median 23.8median 20.6median 11.3median 28.1Delta4.34.83.22.43.9hearing rangehide median Fan NoiseMSI Cubi NUC AI+ 3MG
MSI Cubi NUC AI+ 3MG
Ultra 9 386H, Intel Graphics 4 Xe3 PTL
GMK NucBox K16
R7 7735HS, Radeon 680M
GMK EVO-T1
Ultra 9 285H, Arc 140T
Geekom A5 Pro
R5 7530U, Vega 7
Asus NUC 15 Pro+
Ultra 9 285H, Arc 140T
MSI Cubi NUC AI+ 2MG
Core Ultra 7 258V, Arc 140V
MSI Cubi NUC 1M
Core 7 150U, Iris Xe G7 96EUs
Noise
-6%
-20%
15%
-3%
-2%
6%
off / environment * (dB)
23.6
23.6
-0%
24.7
-5%
25
-6%
25.3
-7%
24.8
-5%
23.5
-0%
Idle Minimum * (dB)
28
30.9
-10%
38.7
-38%
26.6
5%
25.4
9%
28
-0%
29.9
-7%
Idle Average * (dB)
33.2
31.6
5%
38.8
-17%
26.6
20%
25.5
23%
36.1
-9%
29.9
10%
Idle Maximum * (dB)
33.5
31.6
6%
38.9
-16%
26.7
20%
37.3
-11%
36.1
-8%
32
4%
Load Average * (dB)
39.1
45.3
-16%
51.6
-32%
33.5
14%
44.4
-14%
38.9
1%
33.5
14%
Cyberpunk 2077 ultra * (dB)
44.4
49.2
-11%
52
-17%
31.2
30%
46.2
-4%
37
17%
39.1
12%
Load Maximum * (dB)
45.2
51.7
-14%
51.6
-14%
33.8
25%
52.7
-17%
49.2
-9%
40.5
10%
Witcher 3 ultra * (dB)
38.7
31.2
47.7

* ... smaller is better

Temperature

AC adapter reaches over 35 C when running demanding loads

Surface temperatures are relatively cool partly due to the plastic chassis and efficient CPU. The rear becomes slightly warmer than the front as to be expected. 

Ventilation grilles are kept to a minimum unlike on some alternatives like the GMK EVO series.

Max. Load
 35.2 °C
95 F
36.2 °C
97 F
35.2 °C
95 F
 
 32.8 °C
91 F
34.4 °C
94 F
32.2 °C
90 F
 
 32.2 °C
90 F
32.8 °C
91 F
31.2 °C
88 F
 
Maximum: 36.2 °C = 97 F
Average: 29.7 °C = 85 F
30.6 °C
87 F
29.4 °C
85 F
29.4 °C
85 F
29.2 °C
85 F
34.6 °C
94 F
29.4 °C
85 F
26 °C
79 F
27.6 °C
82 F
28.4 °C
83 F
Maximum: 34.6 °C = 94 F
Average: 29.4 °C = 85 F
Power Supply (max.)  39 °C = 102 F | Room Temperature 20 °C = 68 F | Fluke 62 Mini IR Thermometer
(+) The average temperature for the upper side under maximal load is 29.7 °C / 85 F, compared to the average of 32.1 °C / 90 F for the devices in the class Mini PC.
(+) The maximum temperature on the upper side is 36.2 °C / 97 F, compared to the average of 35.4 °C / 96 F, ranging from 20.6 to 69.5 °C for the class Mini PC.
(+) The bottom heats up to a maximum of 34.6 °C / 94 F, compared to the average of 36.1 °C / 97 F
(+) In idle usage, the average temperature for the upper side is 22.8 °C / 73 F, compared to the device average of 32.1 °C / 90 F.
System idle (front)
System idle (front)
System idle (rear)
System idle (rear)
Prime95+FurMark stress (front)
Prime95+FurMark stress (rear)
MSI Cubi NUC AI+ 3MG
Ultra 9 386H, Intel Graphics 4 Xe3 PTL
GMK NucBox K16
R7 7735HS, Radeon 680M
GMK EVO-T1
Ultra 9 285H, Arc 140T
Geekom A5 Pro
R5 7530U, Vega 7
Asus NUC 15 Pro+
Ultra 9 285H, Arc 140T
MSI Cubi NUC AI+ 2MG
Core Ultra 7 258V, Arc 140V
Heat
8%
-26%
-8%
-25%
3%
Maximum Upper Side * (°C)
36.2
28.4
22%
36.4
-1%
36.7
-1%
42.2
-17%
30.8
15%
Maximum Bottom * (°C)
34.6
29.4
15%
48.5
-40%
40.5
-17%
31.3
10%
26.4
24%
Idle Upper Side * (°C)
23.2
23.4
-1%
29.6
-28%
23.1
-0%
34.9
-50%
26.4
-14%
Idle Bottom * (°C)
22.4
23.6
-5%
30
-34%
25.1
-12%
32.2
-44%
25.4
-13%

* ... smaller is better

Stress Test

The CPU would boost to 3 GHz, 61 W, and 92 C when initiating Prime95 stress. After 20 seconds, however, it would dip down to just 2.1 GHz and 30 W in order to maintain a core temperature of 88 C. The limited Turbo Boost potential supports our power consumption and CineBench R15 observations.

Core temperature would stabilize at 80 C when running Cyberpunk 2077 compared to only 63 C on last year's NUC 2MG.

System idle
System idle
Cyberpunk 2077 stress
Prime95 stress
Prime95 stress
Prime95+FurMark stress
Average CPU Clock (GHz) GPU Clock (MHz) Average CPU Temperature (°C)
System Idle -- -- 37
Prime95 Stress 2.1 -- 88
Prime95 + FurMark Stress 1.4 2000 79
Cyberpunk 2077 Stress 0.7 2500 ~80

Energy Management

Power Consumption

The Cubi AI+ 3MG is noticeably more efficient than last year's Cubi AI+ 2MG especially in terms of performance-per-watt. When running Prime95, for example, consumption would stabilize at around 52 W compared to 49 W on the older model despite the massive 60 to 65 percent increase in multi-thread performance. Graphics performance-per-watt has increased as well albeit by a much smaller degree.

Note that consumption can temporarily spike to as high as 98 W before falling back down due to CPU Turbo Boost limitations. The 120 W AC adapter (~13 x 6.9 x 2.5 cm) is more than sufficient in this regard as the mini PC itself barely averages more than 50 W to 60 W when under load.

3DMark 06 consumption
Cyberpunk 2077 1080p Ultra consumption
Consumption would spike to 98 W when initiating Prime95 stress before falling and stabilizing at 53 W about 20 seconds later
Prime95+FurMark stress initiated at 10s mark
Power Consumption
Off / Standbydarklight 0.4 / 3.6 Watt
Idledarkmidlight 6.2 / 7.9 / 8.5 Watt
Load midlight 41.4 / 98 Watt
 color bar
Key: min: dark, med: mid, max: light        Metrahit Energy
MSI Cubi NUC AI+ 3MG
Ultra 9 386H, Intel Graphics 4 Xe3 PTL, Phison 1 TB ESR01TBTCCZ-27J, , x,
GMK NucBox K16
R7 7735HS, Radeon 680M, TWSC TSC3AN1T0-F6Q10S, , x,
GMK EVO-T1
Ultra 9 285H, Arc 140T, Crucial P3 Plus CT1000P3PSSD8, , x,
Geekom A5 Pro
R5 7530U, Vega 7, Wodposit WPBSN4M8-1TGP, , x,
Asus NUC 15 Pro+
Ultra 9 285H, Arc 140T, Micron 3500 1TB MTFDKBA1T0TGD, , x,
MSI Cubi NUC AI+ 2MG
Core Ultra 7 258V, Arc 140V, Phison 1 TB ESR01TBTCCZ-27J, , x,
MSI Cubi NUC 1M
Core 7 150U, Iris Xe G7 96EUs, WD PC SN560 SDDPNQE-1T00, , x,
Power Consumption
-10%
-27%
42%
-12%
20%
8%
Idle Minimum * (Watt)
6.2
7.4
-19%
6.1
2%
3.2
48%
3.9
37%
2.9
53%
6.4
-3%
Idle Average * (Watt)
7.9
7.7
3%
7.9
-0%
4.3
46%
6.1
23%
5.7
28%
8.3
-5%
Idle Maximum * (Watt)
8.5
7.7
9%
13.2
-55%
5.1
40%
8.2
4%
10.2
-20%
10.4
-22%
Load Average * (Watt)
41.4
52
-26%
60.7
-47%
32.1
22%
56.1
-36%
38.7
7%
38.5
7%
Cyberpunk 2077 ultra external monitor * (Watt)
47.6
68
-43%
67.4
-42%
29.4
38%
63.9
-34%
41.1
14%
36.1
24%
Load Maximum * (Watt)
98
80.1
18%
117.1
-19%
43.5
56%
160.6
-64%
60
39%
52.5
46%

* ... smaller is better

Power Consumption Cyberpunk / Stress Test

05101520253035404550556065707580Tooltip
MSI Cubi NUC AI+ 3MG Ultra 9 386H, Intel Graphics 4 Xe3 PTL: Ø56.7 (49.1-81.2)
MSI Cubi NUC AI+ 2MG Core Ultra 7 258V, Arc 140V: Ø52.6 (47.9-57.4)

Power Consumption external Monitor

05101520253035404550556065707580859095Tooltip
MSI Cubi NUC AI+ 3MG Ultra 9 386H, Intel Graphics 4 Xe3 PTL; Prime95 V2810 Stress (external Monitor): Ø56.3 (51-98.4)
MSI Cubi NUC AI+ 2MG Core Ultra 7 258V, Arc 140V; Prime95 V2810 Stress (external Monitor): Ø49.7 (36.7-60)
MSI Cubi NUC AI+ 3MG Ultra 9 386H, Intel Graphics 4 Xe3 PTL; Cinebench R15 Multi (external Monitor): Ø72.1 (70.9-73.6)
MSI Cubi NUC AI+ 2MG Core Ultra 7 258V, Arc 140V; Cinebench R15 Multi (external Monitor): Ø54 (32.3-58)
MSI Cubi NUC AI+ 3MG Ultra 9 386H, Intel Graphics 4 Xe3 PTL; Cinebench R23 Multi (external Monitor): Ø58.8 (46.9-68.2)
MSI Cubi NUC AI+ 3MG Ultra 9 386H, Intel Graphics 4 Xe3 PTL; 1280x720 FurMark 1.19 GPU Stress Test (external Monitor): Ø51.1 (48.8-53.7)
MSI Cubi NUC AI+ 2MG Core Ultra 7 258V, Arc 140V; 1280x720 FurMark 1.19 GPU Stress Test (external Monitor): Ø34 (20.7-43)
MSI Cubi NUC AI+ 3MG Ultra 9 386H, Intel Graphics 4 Xe3 PTL; Idle 1min (external Monitor): Ø8.25 (6.42-11.1)
MSI Cubi NUC AI+ 2MG Core Ultra 7 258V, Arc 140V; Idle 1min (external Monitor): Ø5.74 (2.88-10.2)
MSI Cubi NUC AI+ 3MG Ultra 9 386H, Intel Graphics 4 Xe3 PTL; Cyberpunk 2077 FHD ultra no FSR (external Monitor): Ø47.6 (46.4-51.5)
MSI Cubi NUC AI+ 2MG Core Ultra 7 258V, Arc 140V; Cyberpunk 2077 FHD ultra no FSR (external Monitor): Ø41.1 (26.8-58.9)

Notebookcheck Rating

The MSI Cubi NUC AI+ 3MG is one of the smallest mini PCs you can find with a Panther Lake Core Ultra 9 CPU. However, a couple of missing features prevent it from being the ultimate retail or office solution.

MSI Cubi NUC AI+ 3MG - 06/03/2026 v8
Allen Ngo

Chassis
79 / 98 → 80%
Connectivity
70 / 81 → 86%
Weight
82%
Games Performance
49 / 80 → 62%
Application Performance
85 / 92 → 93%
AI Performance
89%
Temperature
95%
Noise
71%
Average
56%
77%
Mini PC - Weighted Average
CO2 Emissions
No Data
Materials
0%
Packaging
100%
Power Use
70.8%
Repairability
0%
Software Updates
22.3%
Recycle Logo Total Sustainability Score: 32.2%

Potential Competitors in Comparison

Image
Model / Review
Price
Weight
Height
Display
1.
76.9%
MSI Cubi NUC AI+ 3MG
Intel Core Ultra 9 386H ⎘
Intel Graphics 4 Xe3 Panther Lake iGPU ⎘
32 GB Memory, 1000 GB SSD
Amazon:
List Price: 830 USD
552 g37.5 mmx
2.
64.8%
GMK NucBox K16
GMK NucBox K16
AMD Ryzen 7 7735HS ⎘
AMD Radeon 680M ⎘
32 GB Memory, 1024 GB SSD
Amazon:
List Price: 650 USD
567 g63 mmx
3.
75.4%
GMK EVO-T1
GMK EVO-T1
Intel Core Ultra 9 285H ⎘
Intel Arc Graphics 140T ⎘
64 GB Memory, 1024 GB SSD
Amazon:
List Price: 999€
946 g73.6 mmx
4.
72.6%
Geekom A5 Pro
Geekom A5 Pro
AMD Ryzen 5 7530U ⎘
AMD Radeon RX Vega 7 ⎘
16 GB Memory, 1024 GB SSD
Amazon: List Price: 619€423 g37 mmx
5.
77.5%
Asus NUC 15 Pro+
Asus NUC 15 Pro+
Intel Core Ultra 9 285H ⎘
Intel Arc Graphics 140T ⎘
32 GB Memory, 1024 GB SSD
Amazon: $1,698.96
List Price: 991€
690 g42 mmx
6.
75.2%
MSI Cubi NUC AI+ 2MG
Intel Core Ultra 7 258V ⎘
Intel Arc Graphics 140V ⎘
32 GB Memory, 1000 GB SSD
Amazon: List Price: 900 USD669 g50.1 mmx
7.
66.1%
MSI Cubi NUC 1M
MSI Cubi NUC 1M
Intel Core 7 150U ⎘
Intel Iris Xe Graphics G7 96EUs ⎘
16 GB Memory, 1024 GB SSD
Amazon: List Price: 950 USD660 g50.1 mmx

Transparency

The selection of devices to be reviewed is made by our editorial team. The test sample was provided to the author as a loan by the manufacturer or retailer for the purpose of this review. The lender had no influence on this review, nor did the manufacturer receive a copy of this review before publication. There was no obligation to publish this review. As an independent media company, Notebookcheck is not subjected to the authority of manufacturers, retailers or publishers.

This is how Notebookcheck is testing

Every year, Notebookcheck independently reviews hundreds of laptops and smartphones using standardized procedures to ensure that all results are comparable. We have continuously developed our test methods for around 20 years and set industry standards in the process. In our test labs, high-quality measuring equipment is utilized by experienced technicians and editors. These tests involve a multi-stage validation process. Our complex rating system is based on hundreds of well-founded measurements and benchmarks, which maintains objectivity. Further information on our test methods can be found here.

Google LogoAdd as a preferred source on Google
Mail Logo
static version load dynamic
Loading Comments
Comment on this article
> Expert Reviews and News on Laptops, Smartphones and Tech Innovations > Reviews > MSI Cubi NUC AI+ 3MG review: Mini PC with up to an insane 128 GB of RAM
Allen Ngo, 2026-06- 3 (Update: 2026-06- 3)