
Verdict - Prestige 14 Flip AI+ is unbalanced
The spec sheet of the new MSI Prestige 14 Flip AI+ reads well, but the test reveals some weaknesses. The fast processor is offset by high-frequency fans and an underpowered power supply unit, while the OLED panel with 60 Hz and a brightness of less than 300 cd/m² is also disappointing. HDR content is also not supported. On the other hand, there are also very accurate color profiles.
The metal case cuts a fine figure, and the integrated nano-stylus is practical for quick notes. The long battery life is definitely a highlight, as we measured almost 20 hours in the WLAN test. Overall, the Prestige 14 Flip AI+ is a good convertible with plenty of performance and modern features, but the dark OLED screen without HDR can be a deal-breaker.
Pros
Cons
- $1,397.87MSI Prestige 14 AI+ EVO PRE14EVOC2032 - Professional Notebook - 14" FHD+ 144Hz Display - Intel® Core™ Ultra 7-258V - 32GB DDR5-1TB NVMe SSD - Windows 11-1 Year Warranty
- $1,479.00MSI Prestige 16 AI+ Evo 16" UHD+ OLED Laptop: Intel Ultra 7-256V, Intel Arc Graphics, 16GB DDR5, 1TB NVMe SSD, HDMI, Wi-Fi 7, Win 11 Home: Stellar Gray B2VMG-059US
- $1,470.00msi Prestige A16 AI+ (2025) 16” UHD+ OLED Business Laptop: AMD Ryzen 9-365, Radeon Graphics, 32GB LPDDR5x, 1TB NVMe SSD, Type-C, WiFi 7, Win 11 Home: Urban Silver A3HMG-207US
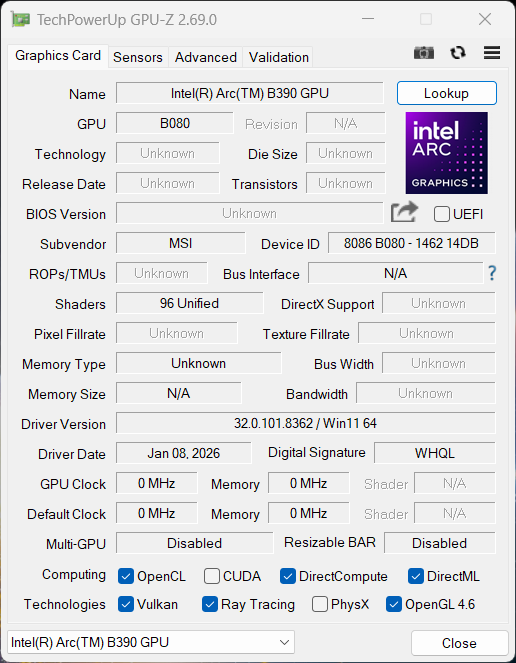
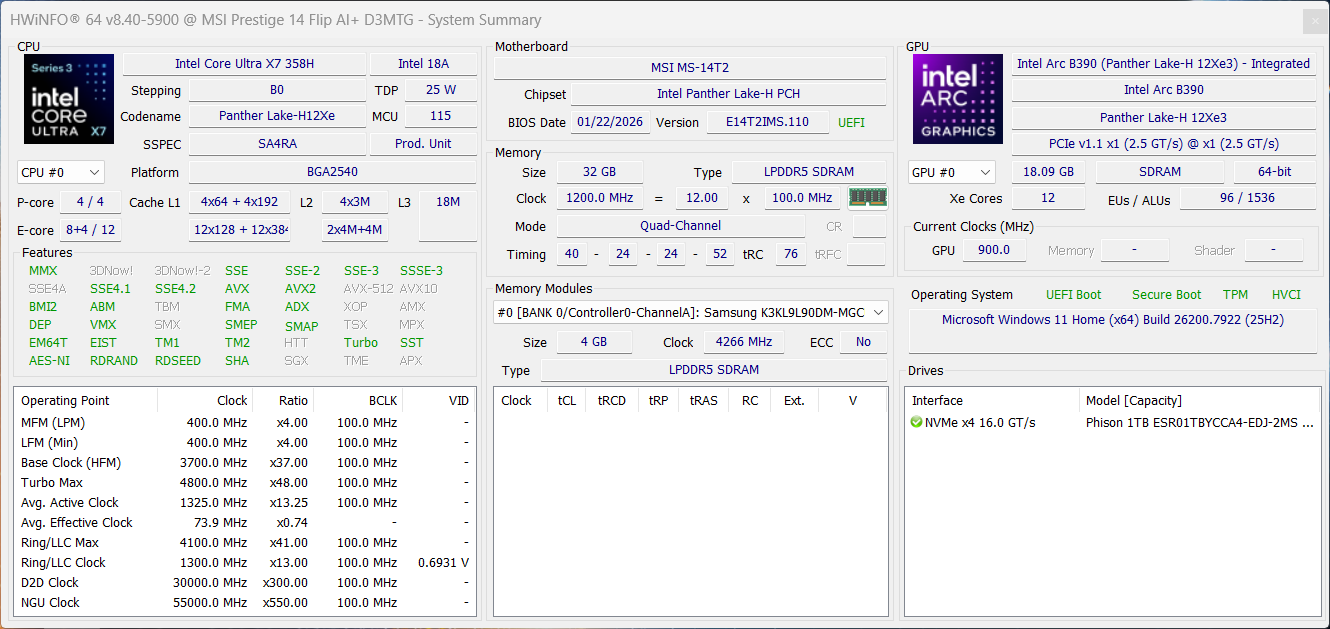
With the Prestige 14 Flip AI+, MSI is launching a compact 14-inch convertible based on a modern Intel Panther Lake processor (Core Ultra X7 358H with the fast Arc B390 iGPU), featuring 32 GB of RAM, a 1 TB SSD, and an OLED touchscreen with Full HD resolution.
Specifications
Case & equipment
The gray aluminum case cuts a good figure overall, and at just under 1.4 kg and 13.9 mm height, the Flip is very mobile. The base unit can only be pressed in minimally, but there are no creaking noises and the surfaces are not overly sensitive to fingerprints. However, the hinges are too loose for us and there is a clearly visible bouncing. Maintenance work is limited to the fans, the battery, and the SSD.
In terms of equipment, there is actually nothing left to be desired (Thunderbolt 4, USB-A, HDMI); the only thing you have to do without is a card reader. Wi-Fi 7 is available and the transfer rates are very high, but the Full HD webcam (incl. IR and mechanical shutter) only takes average pictures.


| Networking | |
| MSI Prestige 14 Flip AI+ 2026 | |
| iperf3 transmit AXE11000 | |
| iperf3 receive AXE11000 | |
| Honor MagicBook Pro 14 2026 | |
| iperf3 transmit AXE11000 | |
| iperf3 receive AXE11000 | |
| Asus ZenBook Duo UX8407AA | |
| iperf3 transmit AXE11000 | |
| iperf3 receive AXE11000 | |
| Dell 14 Plus 2-in-1 | |
| iperf3 transmit AXE11000 | |
| iperf3 receive AXE11000 | |
| iperf3 transmit AXE11000 6GHz | |
| iperf3 receive AXE11000 6GHz | |
| Lenovo Yoga 7 2-in-1 14AKP10 | |
| iperf3 transmit AXE11000 | |
| iperf3 receive AXE11000 | |


Input devices
The backlit keyboard offers a decent typing experience. The power button is integrated into the top right of the layout and also houses the fingerprint scanner. The ClickPad worked smoothly in the test, but the mechanical clicks are a little loud. The pad also offers additional edge gestures that can be customized.


The capacitive touchscreen also works smoothly and a compact stylus is included in the scope of delivery, which can be stored and charged on the underside of the device. However, due to its compact size, it is only suitable for occasional entries or notes.


Display
MSI relies on an OLED touchscreen from Samsung (1,920 x 1,200 pixels, 16:10). The subjective picture impression is basically good (deep blacks, strong colors, fast response times), but the frequency is only 60 Hz, and bright areas appear slightly grainy. PWM flickering is also present at 480 Hz, but the amplitude is relatively low.
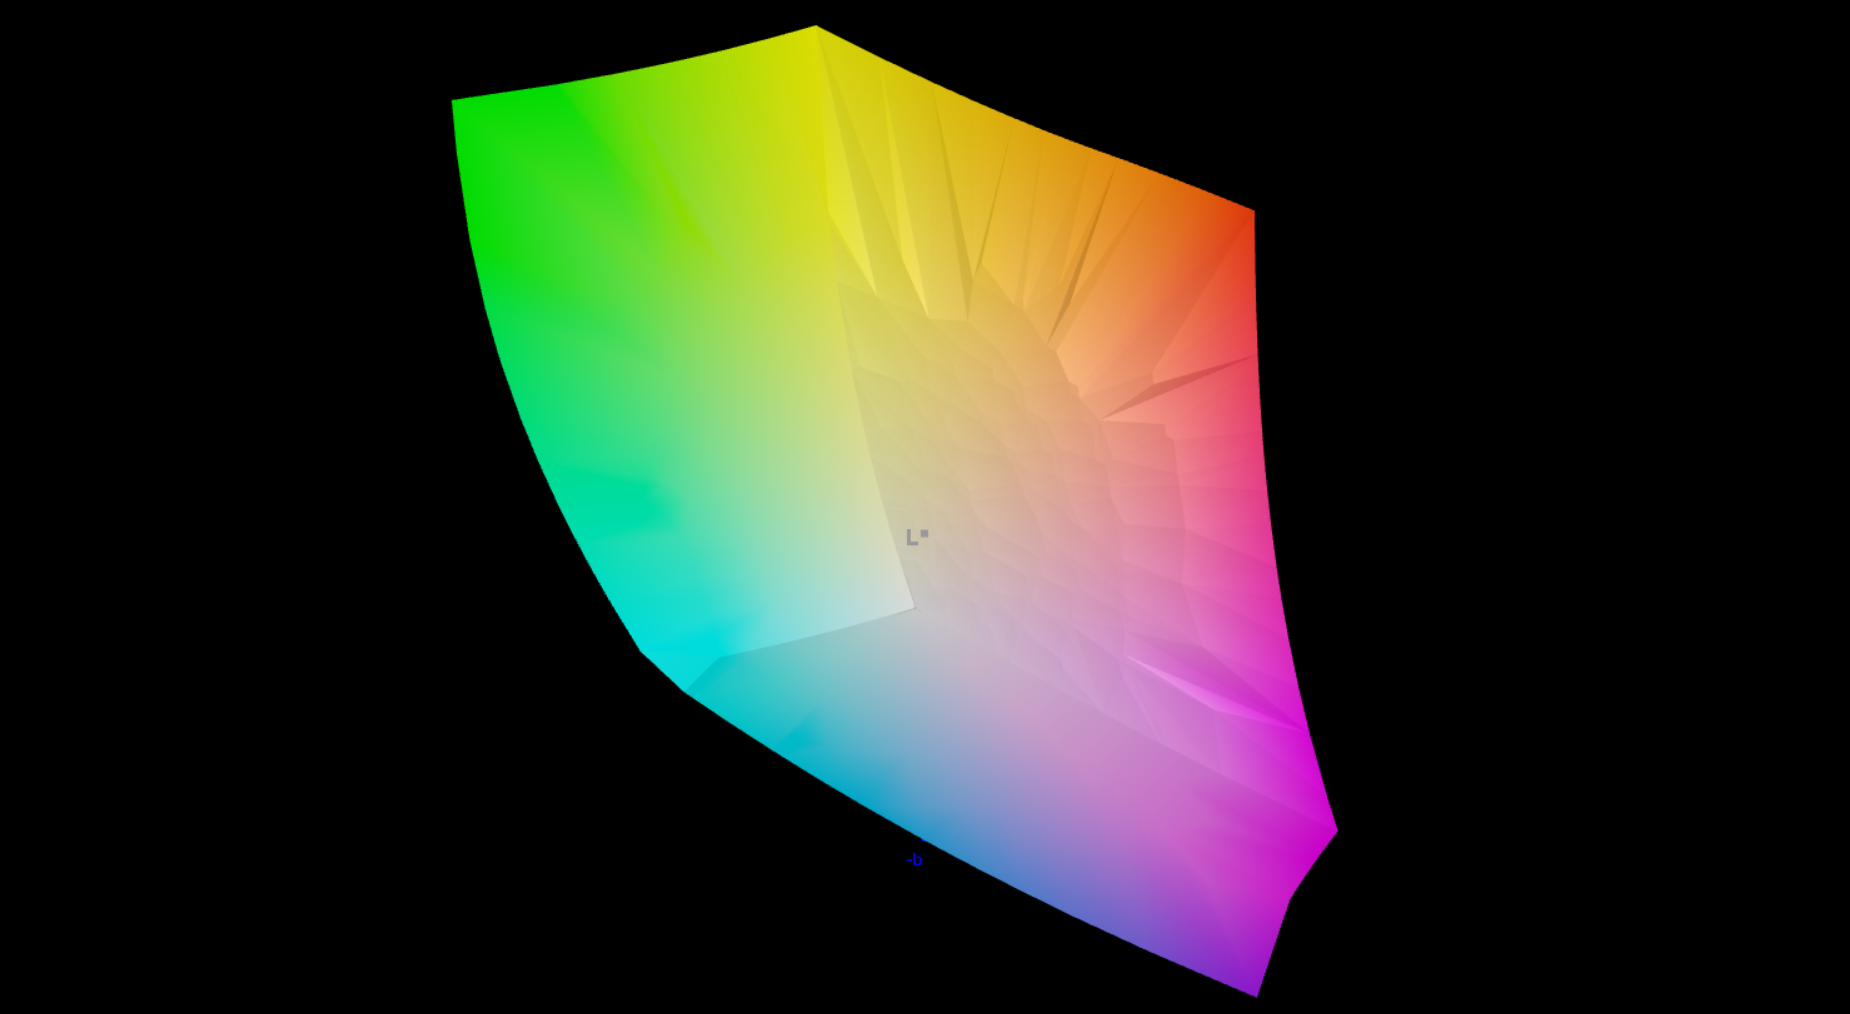
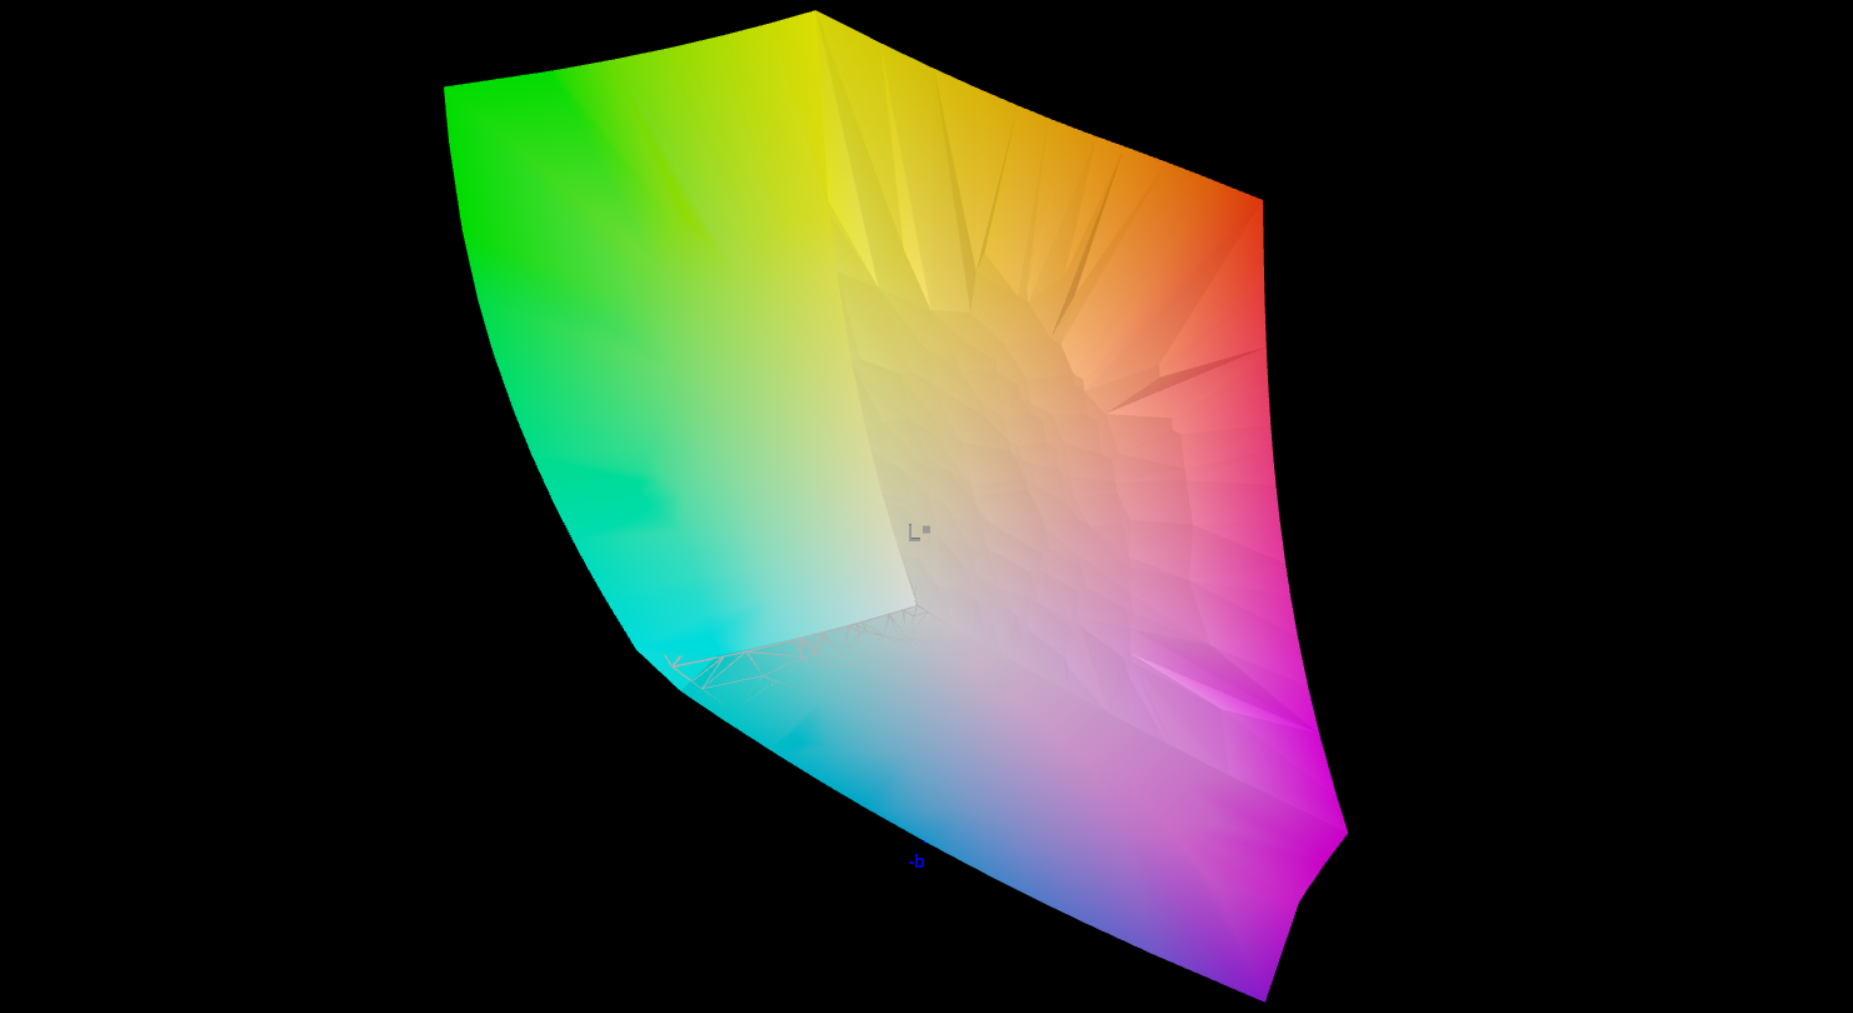
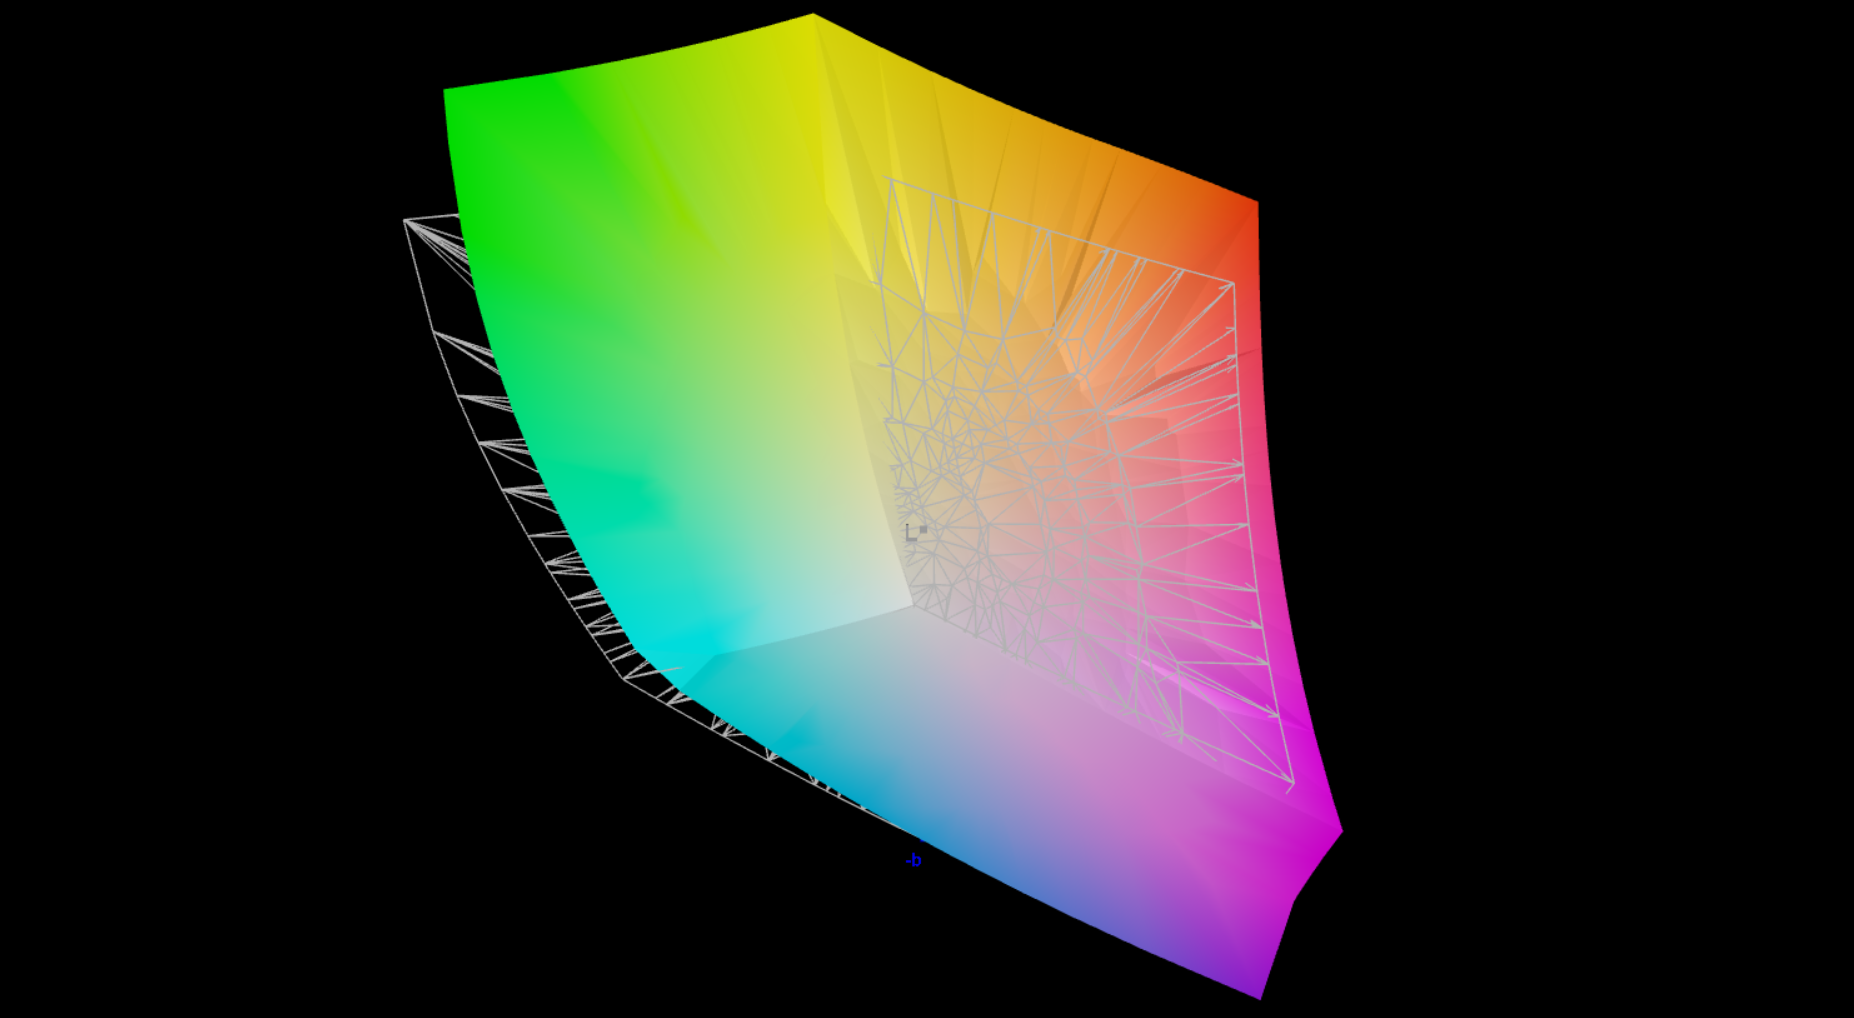
However, there are two major problems. Firstly, the screen is very dark at less than 300 cd/m², which also makes outdoor use quite difficult. Secondly, the panel does not support HDR content, which we have, of course, checked several times. On the other hand, there are also very accurate color profiles for P3 and sRGB, which is why you can also edit images without any problems.
| |||||||||||||||||||||||||
Brightness Distribution: 98 %
Center on Battery: 292 cd/m²
Contrast: 29200:1 (Black: 0.01 cd/m²)
ΔE ColorChecker Calman: 1.4 | ∀{0.5-29.43 Ø4.73}
ΔE Greyscale Calman: 1.7 | ∀{0.09-98 Ø4.98}
91.8% AdobeRGB 1998 (Argyll 3D)
100% sRGB (Argyll 3D)
100% Display P3 (Argyll 3D)
Gamma: 2.12
CCT: 6510 K
| MSI Prestige 14 Flip AI+ 2026 ATNA40KW05-0, OLED, 1920x1200, 14", 60 Hz | Honor MagicBook Pro 14 2026 EDO14.55, OLED, 3120x2080, 14.6", 120 Hz | Asus ZenBook Duo UX8407AA NB140B9M-T01, OLED, 2880x1800, 14", 144 Hz | Dell 14 Plus 2-in-1 BOE NV14A16, IPS, 1920x1200, 14", 60 Hz | Lenovo Yoga 7 2-in-1 14AKP10 Lenovo LEN140WUXGA, OLED, 1920x1200, 14", 60 Hz | |
|---|---|---|---|---|---|
| Display | -4% | -1% | -50% | 3% | |
| Display P3 Coverage (%) | 100 | 96.3 -4% | 99.5 0% | 41.9 -58% | 98.5 -1% |
| sRGB Coverage (%) | 100 | 99.9 0% | 100 0% | 59.8 -40% | 100 0% |
| AdobeRGB 1998 Coverage (%) | 91.8 | 85 -7% | 88.7 -3% | 43.3 -53% | 99.9 9% |
| Response Times | 63% | -19% | -826% | 12% | |
| Response Time Grey 50% / Grey 80% * (ms) | 1.87 ? | 0.55 ? 71% | 0.26 ? 86% | 24.1 ? -1189% | 1.5 ? 20% |
| Response Time Black / White * (ms) | 1.53 ? | 0.51 ? 67% | 0.4 ? 74% | 15.8 ? -933% | 1.4 ? 8% |
| PWM Frequency (Hz) | 480 ? | 120 ? | 720 ? | 240 ? | |
| PWM Amplitude * (%) | 22 | 11 50% | 70 -218% | 100 -355% | 20 9% |
| Screen | 30% | -5% | -496% | 141% | |
| Brightness middle (cd/m²) | 292 | 519 78% | 497 70% | 317.2 9% | 360 23% |
| Brightness (cd/m²) | 292 | 526 80% | 495 70% | 314 8% | 357 22% |
| Brightness Distribution (%) | 98 | 89 -9% | 96 -2% | 93 -5% | 97 -1% |
| Black Level * (cd/m²) | 0.01 | 0.01 -0% | 0.25 -2400% | 0.001 90% | |
| Contrast (:1) | 29200 | 51900 78% | 1269 -96% | 360000 1133% | |
| Colorchecker dE 2000 * | 1.4 | 1.1 21% | 1.6 -14% | 7.26 -419% | 2.12 -51% |
| Colorchecker dE 2000 max. * | 2.2 | 2.2 -0% | 4.5 -105% | 19.93 -806% | 4.59 -109% |
| Greyscale dE 2000 * | 1.7 | 1.8 -6% | 2.5 -47% | 6.1 -259% | 1.4 18% |
| Gamma | 2.12 104% | 2.23 99% | 2.19 100% | 2.04 108% | 2.187 101% |
| CCT | 6510 100% | 6496 100% | 6567 99% | 6161 106% | 6366 102% |
| Colorchecker dE 2000 calibrated * | 0.7 | 1.5 | 2.67 | 1.9 | |
| Total Average (Program / Settings) | 30% /
30% | -8% /
-7% | -457% /
-471% | 52% /
84% |
* ... smaller is better


Display Response Times
| ↔ Response Time Black to White | ||
|---|---|---|
| 1.53 ms ... rise ↗ and fall ↘ combined | ↗ 0.79 ms rise | 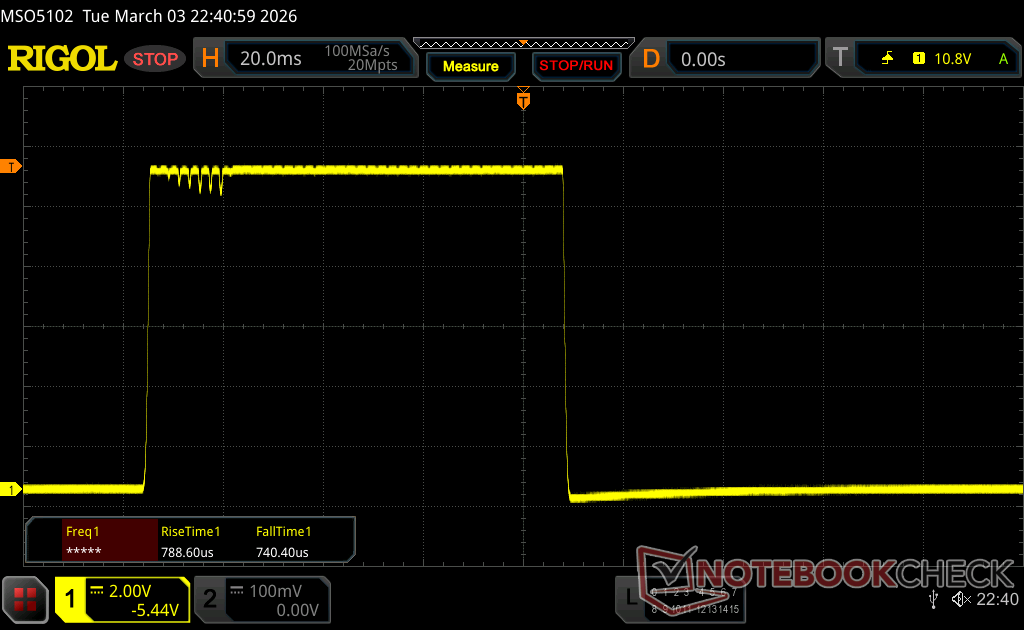 |
| ↘ 0.74 ms fall | ||
| The screen shows very fast response rates in our tests and should be very well suited for fast-paced gaming. In comparison, all tested devices range from 0.1 (minimum) to 240 (maximum) ms. » 9 % of all devices are better. This means that the measured response time is better than the average of all tested devices (19.9 ms). | ||
| ↔ Response Time 50% Grey to 80% Grey | ||
| 1.87 ms ... rise ↗ and fall ↘ combined | ↗ 1 ms rise | 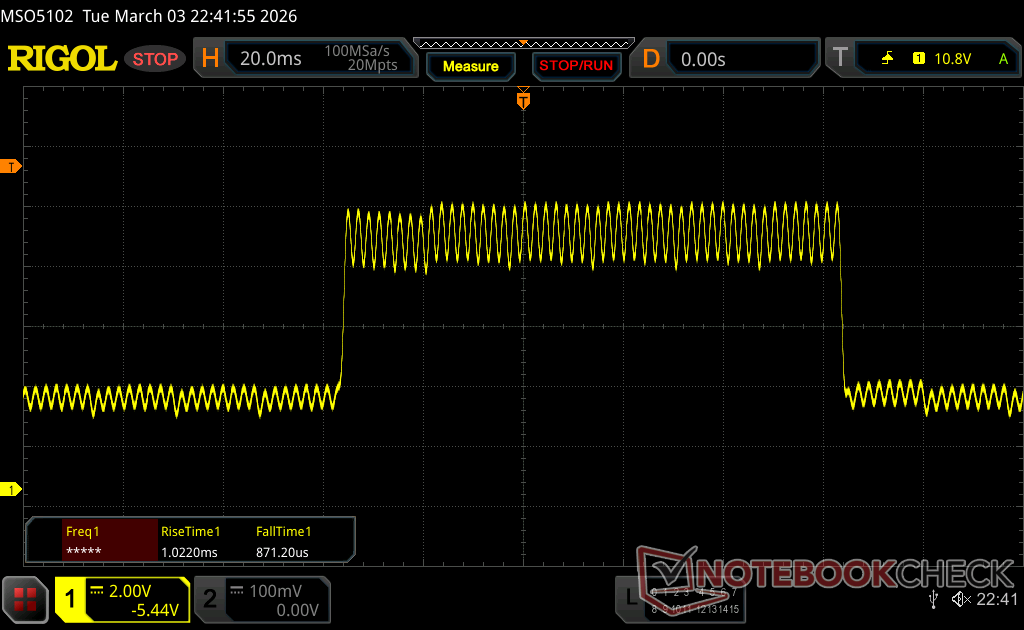 |
| ↘ 0.87 ms fall | ||
| The screen shows very fast response rates in our tests and should be very well suited for fast-paced gaming. In comparison, all tested devices range from 0.165 (minimum) to 636 (maximum) ms. » 9 % of all devices are better. This means that the measured response time is better than the average of all tested devices (31.1 ms). | ||
Screen Flickering / PWM (Pulse-Width Modulation)
| Screen flickering / PWM detected | 480 Hz Amplitude: 22 % | ≤ 100 % brightness setting |  |
The display backlight flickers at 480 Hz (worst case, e.g., utilizing PWM) Flickering detected at a brightness setting of 100 % and below. There should be no flickering or PWM above this brightness setting. The frequency of 480 Hz is relatively high, so most users sensitive to PWM should not notice any flickering. However, there are reports that some users are still sensitive to PWM at 500 Hz and above, so be aware. In comparison: 52 % of all tested devices do not use PWM to dim the display. If PWM was detected, an average of 7822 (minimum: 1.31 - maximum: 343500) Hz was measured. | |||


Performance - Panther Lake X7


Test conditions
We used the performance mode for our tests.
| Profile | TDP (watts) | CB R24 Multi (points) | Time Sy Graphics (points) | Cyberpunk 2077 1080p Ultra (FPS) | max. fan volume (dB(A)) |
|---|---|---|---|---|---|
| Eco - Silent | 20/14 | 564 | 4,256 | 25.2 | 27.6 |
| Balanced | 60/28/19 | 817 | 6,056 | 33.5 | 32.2 |
| Performance | 64/45/35 | 996 | 6,982 | 45.5 | 46.5 |
| battery (Performance) | 64/30 | 901 | 6,954 | 45.1 | 46.5 |
Processor
The CPU multi-core performance of the Core Ultra X7 358H is very good during short load phases due to the high power limit, but it does not remain stable for long. The single-core performance is not affected by this, and the performance is therefore also convincing in everyday use.
Cinebench R15 Multi loop
Cinebench 2024: CPU Multi Core | CPU Single Core
Cinebench R23: Multi Core | Single Core
Cinebench R20: CPU (Multi Core) | CPU (Single Core)
Cinebench R15: CPU Multi 64Bit | CPU Single 64Bit
Blender: v2.79 BMW27 CPU
7-Zip 18.03: 7z b 4 | 7z b 4 -mmt1
Geekbench 6.6: Multi-Core | Single-Core
Geekbench 5.5: Multi-Core | Single-Core
HWBOT x265 Benchmark v2.2: 4k Preset
LibreOffice : 20 Documents To PDF
R Benchmark 2.5: Overall mean
| CPU Performance rating | |
| Asus ZenBook Duo UX8407AA | |
| Average Intel Core Ultra X7 358H | |
| MSI Prestige 14 Flip AI+ 2026 | |
| Honor MagicBook Pro 14 2026 | |
| Dell 14 Plus 2-in-1 | |
| Lenovo Yoga 7 2-in-1 14AKP10 | |
| Average of class Convertible | |
| Cinebench 2024 / CPU Multi Core | |
| Asus ZenBook Duo UX8407AA | |
| Average Intel Core Ultra X7 358H (974 - 1125, n=6) | |
| MSI Prestige 14 Flip AI+ 2026 | |
| Honor MagicBook Pro 14 2026 | |
| Dell 14 Plus 2-in-1 | |
| Average of class Convertible (271 - 1673, n=47, last 2 years) | |
| Lenovo Yoga 7 2-in-1 14AKP10 | |
| Cinebench 2024 / CPU Single Core | |
| Asus ZenBook Duo UX8407AA | |
| Average Intel Core Ultra X7 358H (123.4 - 125.5, n=6) | |
| MSI Prestige 14 Flip AI+ 2026 | |
| Honor MagicBook Pro 14 2026 | |
| Dell 14 Plus 2-in-1 | |
| Lenovo Yoga 7 2-in-1 14AKP10 | |
| Average of class Convertible (88 - 129.8, n=41, last 2 years) | |
| Cinebench R23 / Multi Core | |
| Asus ZenBook Duo UX8407AA | |
| Average Intel Core Ultra X7 358H (13187 - 19841, n=10) | |
| MSI Prestige 14 Flip AI+ 2026 | |
| Honor MagicBook Pro 14 2026 | |
| Dell 14 Plus 2-in-1 | |
| Lenovo Yoga 7 2-in-1 14AKP10 | |
| Average of class Convertible (1317 - 30959, n=50, last 2 years) | |
| Cinebench R23 / Single Core | |
| Asus ZenBook Duo UX8407AA | |
| MSI Prestige 14 Flip AI+ 2026 | |
| Average Intel Core Ultra X7 358H (2037 - 2087, n=9) | |
| Honor MagicBook Pro 14 2026 | |
| Dell 14 Plus 2-in-1 | |
| Lenovo Yoga 7 2-in-1 14AKP10 | |
| Average of class Convertible (740 - 2188, n=50, last 2 years) | |
| Cinebench R20 / CPU (Multi Core) | |
| Asus ZenBook Duo UX8407AA | |
| Average Intel Core Ultra X7 358H (6848 - 7749, n=8) | |
| MSI Prestige 14 Flip AI+ 2026 | |
| Honor MagicBook Pro 14 2026 | |
| Dell 14 Plus 2-in-1 | |
| Lenovo Yoga 7 2-in-1 14AKP10 | |
| Average of class Convertible (595 - 12102, n=50, last 2 years) | |
| Cinebench R20 / CPU (Single Core) | |
| Asus ZenBook Duo UX8407AA | |
| MSI Prestige 14 Flip AI+ 2026 | |
| Average Intel Core Ultra X7 358H (767 - 792, n=8) | |
| Honor MagicBook Pro 14 2026 | |
| Dell 14 Plus 2-in-1 | |
| Lenovo Yoga 7 2-in-1 14AKP10 | |
| Average of class Convertible (273 - 834, n=50, last 2 years) | |
| Cinebench R15 / CPU Multi 64Bit | |
| Asus ZenBook Duo UX8407AA | |
| MSI Prestige 14 Flip AI+ 2026 | |
| Average Intel Core Ultra X7 358H (2937 - 3135, n=8) | |
| Honor MagicBook Pro 14 2026 | |
| Dell 14 Plus 2-in-1 | |
| Average of class Convertible (478 - 4940, n=49, last 2 years) | |
| Lenovo Yoga 7 2-in-1 14AKP10 | |
| Cinebench R15 / CPU Single 64Bit | |
| Asus ZenBook Duo UX8407AA | |
| Honor MagicBook Pro 14 2026 | |
| Average Intel Core Ultra X7 358H (286 - 312, n=8) | |
| Lenovo Yoga 7 2-in-1 14AKP10 | |
| MSI Prestige 14 Flip AI+ 2026 | |
| Average of class Convertible (149.8 - 317, n=49, last 2 years) | |
| Dell 14 Plus 2-in-1 | |
| Blender / v2.79 BMW27 CPU | |
| Average of class Convertible (105 - 1051, n=49, last 2 years) | |
| Lenovo Yoga 7 2-in-1 14AKP10 | |
| Dell 14 Plus 2-in-1 | |
| MSI Prestige 14 Flip AI+ 2026 | |
| Honor MagicBook Pro 14 2026 | |
| Average Intel Core Ultra X7 358H (171 - 218, n=8) | |
| Asus ZenBook Duo UX8407AA | |
| 7-Zip 18.03 / 7z b 4 | |
| Asus ZenBook Duo UX8407AA | |
| Average Intel Core Ultra X7 358H (58746 - 68533, n=8) | |
| MSI Prestige 14 Flip AI+ 2026 | |
| Honor MagicBook Pro 14 2026 | |
| Dell 14 Plus 2-in-1 | |
| Lenovo Yoga 7 2-in-1 14AKP10 | |
| Average of class Convertible (12977 - 121368, n=49, last 2 years) | |
| 7-Zip 18.03 / 7z b 4 -mmt1 | |
| Asus ZenBook Duo UX8407AA | |
| MSI Prestige 14 Flip AI+ 2026 | |
| Honor MagicBook Pro 14 2026 | |
| Average Intel Core Ultra X7 358H (6091 - 6526, n=8) | |
| Dell 14 Plus 2-in-1 | |
| Lenovo Yoga 7 2-in-1 14AKP10 | |
| Average of class Convertible (3672 - 6655, n=49, last 2 years) | |
| Geekbench 6.6 / Multi-Core | |
| Asus ZenBook Duo UX8407AA | |
| MSI Prestige 14 Flip AI+ 2026 | |
| Average Intel Core Ultra X7 358H (15698 - 17121, n=9) | |
| Honor MagicBook Pro 14 2026 | |
| Dell 14 Plus 2-in-1 | |
| Average of class Convertible (2291 - 21269, n=51, last 2 years) | |
| Lenovo Yoga 7 2-in-1 14AKP10 | |
| Geekbench 6.6 / Single-Core | |
| Asus ZenBook Duo UX8407AA | |
| MSI Prestige 14 Flip AI+ 2026 | |
| Average Intel Core Ultra X7 358H (2818 - 2927, n=9) | |
| Dell 14 Plus 2-in-1 | |
| Honor MagicBook Pro 14 2026 | |
| Lenovo Yoga 7 2-in-1 14AKP10 | |
| Average of class Convertible (1003 - 3020, n=52, last 2 years) | |
| Geekbench 5.5 / Multi-Core | |
| Asus ZenBook Duo UX8407AA | |
| MSI Prestige 14 Flip AI+ 2026 | |
| Average Intel Core Ultra X7 358H (16012 - 17028, n=8) | |
| Honor MagicBook Pro 14 2026 | |
| Dell 14 Plus 2-in-1 | |
| Average of class Convertible (1608 - 22023, n=49, last 2 years) | |
| Lenovo Yoga 7 2-in-1 14AKP10 | |
| Geekbench 5.5 / Single-Core | |
| Asus ZenBook Duo UX8407AA | |
| MSI Prestige 14 Flip AI+ 2026 | |
| Average Intel Core Ultra X7 358H (2030 - 2142, n=8) | |
| Honor MagicBook Pro 14 2026 | |
| Dell 14 Plus 2-in-1 | |
| Lenovo Yoga 7 2-in-1 14AKP10 | |
| Average of class Convertible (806 - 2275, n=49, last 2 years) | |
| HWBOT x265 Benchmark v2.2 / 4k Preset | |
| Asus ZenBook Duo UX8407AA | |
| Average Intel Core Ultra X7 358H (19.5 - 23.1, n=8) | |
| Honor MagicBook Pro 14 2026 | |
| MSI Prestige 14 Flip AI+ 2026 | |
| Dell 14 Plus 2-in-1 | |
| Average of class Convertible (3.43 - 36.2, n=49, last 2 years) | |
| Lenovo Yoga 7 2-in-1 14AKP10 | |
| LibreOffice / 20 Documents To PDF | |
| Dell 14 Plus 2-in-1 | |
| Lenovo Yoga 7 2-in-1 14AKP10 | |
| Average of class Convertible (42.5 - 84.3, n=49, last 2 years) | |
| Average Intel Core Ultra X7 358H (38.5 - 56.9, n=8) | |
| Honor MagicBook Pro 14 2026 | |
| MSI Prestige 14 Flip AI+ 2026 | |
| Asus ZenBook Duo UX8407AA | |
| R Benchmark 2.5 / Overall mean | |
| Average of class Convertible (0.3915 - 0.84, n=49, last 2 years) | |
| MSI Prestige 14 Flip AI+ 2026 | |
| Dell 14 Plus 2-in-1 | |
| Lenovo Yoga 7 2-in-1 14AKP10 | |
| Average Intel Core Ultra X7 358H (0.4127 - 0.4483, n=9) | |
| Honor MagicBook Pro 14 2026 | |
| Asus ZenBook Duo UX8407AA | |
* ... smaller is better
AIDA64: FP32 Ray-Trace | FPU Julia | CPU SHA3 | CPU Queen | FPU SinJulia | FPU Mandel | CPU AES | CPU ZLib | FP64 Ray-Trace | CPU PhotoWorxx | CPU CheckMate
| Performance rating | |
| Dell 14 Plus 2-in-1 -1! | |
| Average Intel Core Ultra X7 358H | |
| Honor MagicBook Pro 14 2026 -1! | |
| MSI Prestige 14 Flip AI+ 2026 -1! | |
| Lenovo Yoga 7 2-in-1 14AKP10 -1! | |
| Average of class Convertible | |
| Asus ZenBook Duo UX8407AA -1! | |
| AIDA64 / FP32 Ray-Trace | |
| Dell 14 Plus 2-in-1 (v6.92.6600) | |
| Lenovo Yoga 7 2-in-1 14AKP10 (v6.92.6600) | |
| Honor MagicBook Pro 14 2026 (v8.20.8100) | |
| Average Intel Core Ultra X7 358H (12221 - 17932, n=8) | |
| MSI Prestige 14 Flip AI+ 2026 (v8.20.8100) | |
| Average of class Convertible (1480 - 64158, n=49, last 2 years) | |
| Asus ZenBook Duo UX8407AA (v6.92.6600) | |
| AIDA64 / FPU Julia | |
| Honor MagicBook Pro 14 2026 (v8.20.8100) | |
| MSI Prestige 14 Flip AI+ 2026 (v8.20.8100) | |
| Average Intel Core Ultra X7 358H (29930 - 95525, n=8) | |
| Dell 14 Plus 2-in-1 (v6.92.6600) | |
| Lenovo Yoga 7 2-in-1 14AKP10 (v6.92.6600) | |
| Average of class Convertible (11392 - 184800, n=49, last 2 years) | |
| Asus ZenBook Duo UX8407AA (v6.92.6600) | |
| AIDA64 / CPU SHA3 | |
| Asus ZenBook Duo UX8407AA (v6.92.6600) | |
| Average Intel Core Ultra X7 358H (3910 - 4911, n=8) | |
| Honor MagicBook Pro 14 2026 (v8.20.8100) | |
| MSI Prestige 14 Flip AI+ 2026 (v8.20.8100) | |
| Dell 14 Plus 2-in-1 (v6.92.6600) | |
| Lenovo Yoga 7 2-in-1 14AKP10 (v6.92.6600) | |
| Average of class Convertible (797 - 8291, n=49, last 2 years) | |
| AIDA64 / CPU Queen | |
| Dell 14 Plus 2-in-1 (v6.92.6600) | |
| Asus ZenBook Duo UX8407AA (v6.92.6600) | |
| Average Intel Core Ultra X7 358H (63425 - 63827, n=2) | |
| Average of class Convertible (14686 - 148874, n=42, last 2 years) | |
| Lenovo Yoga 7 2-in-1 14AKP10 (v6.92.6600) | |
| AIDA64 / FPU SinJulia | |
| Dell 14 Plus 2-in-1 (v6.92.6600) | |
| Lenovo Yoga 7 2-in-1 14AKP10 (v6.92.6600) | |
| Average of class Convertible (1120 - 29155, n=49, last 2 years) | |
| Average Intel Core Ultra X7 358H (4735 - 7038, n=8) | |
| MSI Prestige 14 Flip AI+ 2026 (v8.20.8100) | |
| Honor MagicBook Pro 14 2026 (v8.20.8100) | |
| Asus ZenBook Duo UX8407AA (v6.92.6600) | |
| AIDA64 / FPU Mandel | |
| Honor MagicBook Pro 14 2026 (v8.20.8100) | |
| MSI Prestige 14 Flip AI+ 2026 (v8.20.8100) | |
| Average Intel Core Ultra X7 358H (14716 - 50734, n=8) | |
| Dell 14 Plus 2-in-1 (v6.92.6600) | |
| Lenovo Yoga 7 2-in-1 14AKP10 (v6.92.6600) | |
| Average of class Convertible (4929 - 97193, n=49, last 2 years) | |
| Asus ZenBook Duo UX8407AA (v6.92.6600) | |
| AIDA64 / CPU AES | |
| Dell 14 Plus 2-in-1 (v6.92.6600) | |
| Lenovo Yoga 7 2-in-1 14AKP10 (v6.92.6600) | |
| MSI Prestige 14 Flip AI+ 2026 (v8.20.8100) | |
| Average Intel Core Ultra X7 358H (5127 - 67510, n=8) | |
| Honor MagicBook Pro 14 2026 (v8.20.8100) | |
| Average of class Convertible (5271 - 190280, n=49, last 2 years) | |
| Asus ZenBook Duo UX8407AA (v6.92.6600) | |
| AIDA64 / CPU ZLib | |
| Asus ZenBook Duo UX8407AA (v6.92.6600) | |
| Average Intel Core Ultra X7 358H (932 - 1179, n=8) | |
| Honor MagicBook Pro 14 2026 (v8.20.8100) | |
| MSI Prestige 14 Flip AI+ 2026 (v8.20.8100) | |
| Dell 14 Plus 2-in-1 (v6.92.6600) | |
| Lenovo Yoga 7 2-in-1 14AKP10 (v6.92.6600) | |
| Average of class Convertible (218 - 2017, n=49, last 2 years) | |
| AIDA64 / FP64 Ray-Trace | |
| Dell 14 Plus 2-in-1 (v6.92.6600) | |
| Lenovo Yoga 7 2-in-1 14AKP10 (v6.92.6600) | |
| Honor MagicBook Pro 14 2026 (v8.20.8100) | |
| Average Intel Core Ultra X7 358H (6506 - 9447, n=8) | |
| MSI Prestige 14 Flip AI+ 2026 (v8.20.8100) | |
| Average of class Convertible (1169 - 34297, n=49, last 2 years) | |
| Asus ZenBook Duo UX8407AA (v6.92.6600) | |
| AIDA64 / CPU PhotoWorxx | |
| MSI Prestige 14 Flip AI+ 2026 (v8.20.8100) | |
| Honor MagicBook Pro 14 2026 (v8.20.8100) | |
| Average Intel Core Ultra X7 358H (30538 - 88154, n=8) | |
| Average of class Convertible (14193 - 85327, n=49, last 2 years) | |
| Lenovo Yoga 7 2-in-1 14AKP10 (v6.92.6600) | |
| Dell 14 Plus 2-in-1 (v6.92.6600) | |
| Asus ZenBook Duo UX8407AA (v6.92.6600) | |
| AIDA64 / CPU CheckMate | |
| MSI Prestige 14 Flip AI+ 2026 (v8.20.8100) | |
| Average Intel Core Ultra X7 358H (4187 - 4475, n=7) | |
| Honor MagicBook Pro 14 2026 (v8.20.8100) | |
| Average of class Convertible (1413 - 4402, n=7, last 2 years) | |
System performance
The subjective performance impression of the MSI is very high and there were no stability problems.
PCMark 10: Score | Essentials | Productivity | Digital Content Creation
CrossMark: Overall | Productivity | Creativity | Responsiveness
WebXPRT 3: Overall
WebXPRT 4: Overall
Mozilla Kraken 1.1: Total
| Performance rating | |
| Asus ZenBook Duo UX8407AA | |
| MSI Prestige 14 Flip AI+ 2026 | |
| Average Intel Core Ultra X7 358H, Intel Arc B390 12 Xe3 Panther Lake iGPU | |
| Honor MagicBook Pro 14 2026 | |
| Dell 14 Plus 2-in-1 | |
| Average of class Convertible | |
| Lenovo Yoga 7 2-in-1 14AKP10 -2! | |
| PCMark 10 / Score | |
| Asus ZenBook Duo UX8407AA | |
| MSI Prestige 14 Flip AI+ 2026 | |
| Average Intel Core Ultra X7 358H, Intel Arc B390 12 Xe3 Panther Lake iGPU (8834 - 9880, n=8) | |
| Honor MagicBook Pro 14 2026 | |
| Dell 14 Plus 2-in-1 | |
| Average of class Convertible (3229 - 10123, n=46, last 2 years) | |
| Lenovo Yoga 7 2-in-1 14AKP10 | |
| PCMark 10 / Essentials | |
| Lenovo Yoga 7 2-in-1 14AKP10 | |
| Dell 14 Plus 2-in-1 | |
| MSI Prestige 14 Flip AI+ 2026 | |
| Asus ZenBook Duo UX8407AA | |
| Average Intel Core Ultra X7 358H, Intel Arc B390 12 Xe3 Panther Lake iGPU (10282 - 11263, n=7) | |
| Honor MagicBook Pro 14 2026 | |
| Average of class Convertible (7233 - 12222, n=46, last 2 years) | |
| PCMark 10 / Productivity | |
| Asus ZenBook Duo UX8407AA | |
| MSI Prestige 14 Flip AI+ 2026 | |
| Honor MagicBook Pro 14 2026 | |
| Average Intel Core Ultra X7 358H, Intel Arc B390 12 Xe3 Panther Lake iGPU (13908 - 16780, n=7) | |
| Dell 14 Plus 2-in-1 | |
| Lenovo Yoga 7 2-in-1 14AKP10 | |
| Average of class Convertible (5062 - 17914, n=46, last 2 years) | |
| PCMark 10 / Digital Content Creation | |
| Asus ZenBook Duo UX8407AA | |
| MSI Prestige 14 Flip AI+ 2026 | |
| Average Intel Core Ultra X7 358H, Intel Arc B390 12 Xe3 Panther Lake iGPU (13082 - 13893, n=7) | |
| Honor MagicBook Pro 14 2026 | |
| Dell 14 Plus 2-in-1 | |
| Average of class Convertible (2496 - 16551, n=46, last 2 years) | |
| Lenovo Yoga 7 2-in-1 14AKP10 | |
| CrossMark / Overall | |
| Asus ZenBook Duo UX8407AA | |
| MSI Prestige 14 Flip AI+ 2026 | |
| Average Intel Core Ultra X7 358H, Intel Arc B390 12 Xe3 Panther Lake iGPU (1884 - 2119, n=8) | |
| Honor MagicBook Pro 14 2026 | |
| Dell 14 Plus 2-in-1 | |
| Lenovo Yoga 7 2-in-1 14AKP10 | |
| Average of class Convertible (524 - 2274, n=50, last 2 years) | |
| CrossMark / Productivity | |
| Asus ZenBook Duo UX8407AA | |
| MSI Prestige 14 Flip AI+ 2026 | |
| Average Intel Core Ultra X7 358H, Intel Arc B390 12 Xe3 Panther Lake iGPU (1678 - 1928, n=8) | |
| Honor MagicBook Pro 14 2026 | |
| Dell 14 Plus 2-in-1 | |
| Lenovo Yoga 7 2-in-1 14AKP10 | |
| Average of class Convertible (554 - 1942, n=50, last 2 years) | |
| CrossMark / Creativity | |
| Asus ZenBook Duo UX8407AA | |
| MSI Prestige 14 Flip AI+ 2026 | |
| Average Intel Core Ultra X7 358H, Intel Arc B390 12 Xe3 Panther Lake iGPU (2241 - 2529, n=8) | |
| Honor MagicBook Pro 14 2026 | |
| Dell 14 Plus 2-in-1 | |
| Lenovo Yoga 7 2-in-1 14AKP10 | |
| Average of class Convertible (550 - 2949, n=50, last 2 years) | |
| CrossMark / Responsiveness | |
| MSI Prestige 14 Flip AI+ 2026 | |
| Honor MagicBook Pro 14 2026 | |
| Average Intel Core Ultra X7 358H, Intel Arc B390 12 Xe3 Panther Lake iGPU (1560 - 1837, n=8) | |
| Asus ZenBook Duo UX8407AA | |
| Dell 14 Plus 2-in-1 | |
| Lenovo Yoga 7 2-in-1 14AKP10 | |
| Average of class Convertible (381 - 1719, n=50, last 2 years) | |
| WebXPRT 3 / Overall | |
| Asus ZenBook Duo UX8407AA | |
| MSI Prestige 14 Flip AI+ 2026 | |
| Average Intel Core Ultra X7 358H, Intel Arc B390 12 Xe3 Panther Lake iGPU (293 - 338, n=8) | |
| Average of class Convertible (171 - 426, n=50, last 2 years) | |
| Honor MagicBook Pro 14 2026 | |
| Dell 14 Plus 2-in-1 | |
| WebXPRT 4 / Overall | |
| Asus ZenBook Duo UX8407AA | |
| MSI Prestige 14 Flip AI+ 2026 | |
| Average Intel Core Ultra X7 358H, Intel Arc B390 12 Xe3 Panther Lake iGPU (278 - 305, n=7) | |
| Honor MagicBook Pro 14 2026 | |
| Dell 14 Plus 2-in-1 | |
| Average of class Convertible (91.2 - 317, n=49, last 2 years) | |
| Mozilla Kraken 1.1 / Total | |
| Dell 14 Plus 2-in-1 | |
| Average of class Convertible (386 - 1089, n=53, last 2 years) | |
| Lenovo Yoga 7 2-in-1 14AKP10 | |
| Honor MagicBook Pro 14 2026 | |
| Average Intel Core Ultra X7 358H, Intel Arc B390 12 Xe3 Panther Lake iGPU (445 - 460, n=8) | |
| MSI Prestige 14 Flip AI+ 2026 | |
| Asus ZenBook Duo UX8407AA | |
* ... smaller is better
| PCMark 10 Score | 9794 points | |
Help | ||
| AIDA64 / Memory Copy | |
| Asus ZenBook Duo UX8407AA | |
| Average Intel Core Ultra X7 358H (102745 - 132135, n=7) | |
| MSI Prestige 14 Flip AI+ 2026 | |
| Honor MagicBook Pro 14 2026 | |
| Lenovo Yoga 7 2-in-1 14AKP10 | |
| Dell 14 Plus 2-in-1 | |
| Average of class Convertible (23880 - 161475, n=49, last 2 years) | |
| AIDA64 / Memory Read | |
| Asus ZenBook Duo UX8407AA | |
| MSI Prestige 14 Flip AI+ 2026 | |
| Average Intel Core Ultra X7 358H (97755 - 118888, n=8) | |
| Honor MagicBook Pro 14 2026 | |
| Average of class Convertible (19931 - 131960, n=49, last 2 years) | |
| Dell 14 Plus 2-in-1 | |
| Lenovo Yoga 7 2-in-1 14AKP10 | |
| AIDA64 / Memory Write | |
| Asus ZenBook Duo UX8407AA | |
| Average Intel Core Ultra X7 358H (105984 - 134998, n=8) | |
| Honor MagicBook Pro 14 2026 | |
| MSI Prestige 14 Flip AI+ 2026 | |
| Dell 14 Plus 2-in-1 | |
| Lenovo Yoga 7 2-in-1 14AKP10 | |
| Average of class Convertible (17473 - 216896, n=49, last 2 years) | |
| AIDA64 / Memory Latency | |
| Average of class Convertible (6.9 - 536, n=48, last 2 years) | |
| Dell 14 Plus 2-in-1 | |
| Lenovo Yoga 7 2-in-1 14AKP10 | |
| Honor MagicBook Pro 14 2026 | |
| MSI Prestige 14 Flip AI+ 2026 | |
| Asus ZenBook Duo UX8407AA | |
| Average Intel Core Ultra X7 358H (84.6 - 101.9, n=8) | |
* ... smaller is better
DPC latencies
Our latency test shows clear limitations for the use of real-time audio applications.


| DPC Latencies / LatencyMon - interrupt to process latency (max), Web, Youtube, Prime95 | |
| Lenovo Yoga 7 2-in-1 14AKP10 | |
| MSI Prestige 14 Flip AI+ 2026 | |
| Dell 14 Plus 2-in-1 | |
| Honor MagicBook Pro 14 2026 | |
| Asus ZenBook Duo UX8407AA | |
* ... smaller is better
Storage
A 1 TB SSD (PCIe 4.0) from Phison is installed in the test device, which offers very good and, above all, stable transfer rates.

* ... smaller is better
Continuous read: DiskSpd Read Loop, Queue Depth 8
GPU performance
The integrated Arc B390 is a very fast graphics card and offers a significant improvement over the last generation. The benchmark results are very good, but performance is not completely stable either, and you can expect a deficit of around 10 percent during longer gaming sessions.
| 3DMark 11 Performance | 18677 points | |
| 3DMark Fire Strike Score | 14120 points | |
| 3DMark Time Spy Score | 7478 points | |
| 3DMark Steel Nomad Score | 1460 points | |
| 3DMark Steel Nomad Light Score | 6102 points | |
Help | ||
| Blender / v3.3 Classroom CPU | |
| Average of class Convertible (159 - 2067, n=50, last 2 years) | |
| Lenovo Yoga 7 2-in-1 14AKP10 | |
| Dell 14 Plus 2-in-1 | |
| MSI Prestige 14 Flip AI+ 2026 | |
| Honor MagicBook Pro 14 2026 | |
| Average Intel Arc B390 12 Xe3 Panther Lake iGPU (282 - 389, n=9) | |
| Asus ZenBook Duo UX8407AA | |
* ... smaller is better
| Performance rating - Percent | |
| Asus ZenBook Duo UX8407AA | |
| Honor MagicBook Pro 14 2026 | |
| MSI Prestige 14 Flip AI+ 2026 | |
| Average of class Convertible | |
| Dell 14 Plus 2-in-1 | |
| Lenovo Yoga 7 2-in-1 14AKP10 | |
| Cyberpunk 2077 - 1920x1080 Ultra Preset (FSR off) | |
| Asus ZenBook Duo UX8407AA | |
| MSI Prestige 14 Flip AI+ 2026 | |
| Honor MagicBook Pro 14 2026 | |
| Average of class Convertible (8.2 - 79.5, n=48, last 2 years) | |
| Lenovo Yoga 7 2-in-1 14AKP10 | |
| Dell 14 Plus 2-in-1 | |
| Baldur's Gate 3 - 1920x1080 Ultra Preset AA:T | |
| Asus ZenBook Duo UX8407AA | |
| MSI Prestige 14 Flip AI+ 2026 | |
| Honor MagicBook Pro 14 2026 | |
| Average of class Convertible (9.18 - 90.5, n=43, last 2 years) | |
| Dell 14 Plus 2-in-1 | |
| Lenovo Yoga 7 2-in-1 14AKP10 | |
| GTA V - 1920x1080 Highest AA:4xMSAA + FX AF:16x | |
| Asus ZenBook Duo UX8407AA | |
| MSI Prestige 14 Flip AI+ 2026 | |
| Honor MagicBook Pro 14 2026 | |
| Average of class Convertible (7.14 - 90.6, n=40, last 2 years) | |
| Dell 14 Plus 2-in-1 | |
| Lenovo Yoga 7 2-in-1 14AKP10 | |
| Final Fantasy XV Benchmark - 1920x1080 High Quality | |
| Asus ZenBook Duo UX8407AA | |
| Honor MagicBook Pro 14 2026 | |
| MSI Prestige 14 Flip AI+ 2026 | |
| Average of class Convertible (4.48 - 86.6, n=46, last 2 years) | |
| Dell 14 Plus 2-in-1 | |
| Lenovo Yoga 7 2-in-1 14AKP10 | |
| Strange Brigade - 1920x1080 ultra AA:ultra AF:16 | |
| Asus ZenBook Duo UX8407AA | |
| Honor MagicBook Pro 14 2026 | |
| MSI Prestige 14 Flip AI+ 2026 | |
| Average of class Convertible (10.8 - 176.8, n=45, last 2 years) | |
| Dell 14 Plus 2-in-1 | |
| Lenovo Yoga 7 2-in-1 14AKP10 | |
| Dota 2 Reborn - 1920x1080 ultra (3/3) best looking | |
| Asus ZenBook Duo UX8407AA | |
| Honor MagicBook Pro 14 2026 | |
| MSI Prestige 14 Flip AI+ 2026 | |
| Dell 14 Plus 2-in-1 | |
| Lenovo Yoga 7 2-in-1 14AKP10 | |
| Average of class Convertible (18.8 - 142, n=50, last 2 years) | |
| X-Plane 11.11 - 1920x1080 high (fps_test=3) | |
| Honor MagicBook Pro 14 2026 | |
| MSI Prestige 14 Flip AI+ 2026 | |
| Asus ZenBook Duo UX8407AA | |
| Dell 14 Plus 2-in-1 | |
| Lenovo Yoga 7 2-in-1 14AKP10 | |
| Average of class Convertible (12.8 - 76.7, n=48, last 2 years) | |
Cyberpunk 2077 ultra FPS chart
| low | med. | high | ultra | QHD | |
|---|---|---|---|---|---|
| GTA V (2015) | 99.7 | 43.4 | |||
| Dota 2 Reborn (2015) | 108.3 | 79.5 | 100.3 | 86.8 | |
| Final Fantasy XV Benchmark (2018) | 107.2 | 60.7 | 37.8 | 33.8 | |
| X-Plane 11.11 (2018) | 58.4 | 46.4 | 41.8 | ||
| Strange Brigade (2018) | 334 | 121.9 | 103.3 | 80 | |
| Baldur's Gate 3 (2023) | 69.2 | 52.2 | 47 | 44.6 | |
| Cyberpunk 2077 (2023) | 75 | 59.7 | 49.7 | 45.5 | |
| F1 24 (2024) | 136.5 | 130.3 | 100 | 36.2 |
Emissions & Energy
Noise emissions

MSI uses vapor-chamber cooling with two small fans. The fan speed is generally low in everyday use, but the fan noise is quite high-pitched, which quickly becomes annoying. We measured up to 46.5 dB(A) in performance mode, but the other laptops remain significantly quieter. Сoil whine was not found on the test device.
Noise level
| Idle |
| 25.4 / 25.4 / 25.4 dB(A) |
| Load |
| 33.1 / 46.5 dB(A) |
 | ||
30 dB silent 40 dB(A) audible 50 dB(A) loud |
||
min: | ||
| MSI Prestige 14 Flip AI+ 2026 Ultra X7 358H, Arc B390 Panther Lake iGPU | Honor MagicBook Pro 14 2026 Ultra 5 338H, Arc B370 Panther Lake iGPU | Asus ZenBook Duo UX8407AA Ultra X9 388H, Arc B390 Panther Lake iGPU | Dell 14 Plus 2-in-1 Ryzen AI 7 350, Radeon 860M | Lenovo Yoga 7 2-in-1 14AKP10 Ryzen AI 5 340, Radeon 840M | |
|---|---|---|---|---|---|
| Noise | 4% | 0% | -9% | -5% | |
| off / environment * (dB) | 25.4 | 25.7 -1% | 25 2% | 23.1 9% | 25 2% |
| Idle Minimum * (dB) | 25.4 | 25.7 -1% | 25 2% | 29.7 -17% | 25 2% |
| Idle Average * (dB) | 25.4 | 25.7 -1% | 25 2% | 33.1 -30% | 27 -6% |
| Idle Maximum * (dB) | 25.4 | 25.7 -1% | 25 2% | 33.1 -30% | 30 -18% |
| Load Average * (dB) | 33.1 | 30.2 9% | 36.4 -10% | 33.4 -1% | 43 -30% |
| Cyberpunk 2077 ultra * (dB) | 46.5 | 39.4 15% | 45.9 1% | 43.2 7% | 42 10% |
| Load Maximum * (dB) | 46.5 | 42.9 8% | 45.9 1% | 48.5 -4% | 44 5% |
* ... smaller is better
Temperature
There are no temperature problems in everyday use; we measured more than 45 °C in several places under high load, but there are no limitations. In the stress test, the processor stabilizes at around 30 watts and occasionally fluctuates a little.

(-) The maximum temperature on the upper side is 47.1 °C / 117 F, compared to the average of 35.4 °C / 96 F, ranging from 19.6 to 60 °C for the class Convertible.
(-) The bottom heats up to a maximum of 46.2 °C / 115 F, compared to the average of 36.9 °C / 98 F
(+) In idle usage, the average temperature for the upper side is 23.6 °C / 74 F, compared to the device average of 30.3 °C / 87 F.
(±) 3: The average temperature for the upper side is 37.9 °C / 100 F, compared to the average of 30.3 °C / 87 F for the class Convertible.
(+) The palmrests and touchpad are cooler than skin temperature with a maximum of 31.6 °C / 88.9 F and are therefore cool to the touch.
(-) The average temperature of the palmrest area of similar devices was 28 °C / 82.4 F (-3.6 °C / -6.5 F).


| MSI Prestige 14 Flip AI+ 2026 Ultra X7 358H, Arc B390 Panther Lake iGPU | Honor MagicBook Pro 14 2026 Ultra 5 338H, Arc B370 Panther Lake iGPU | Asus ZenBook Duo UX8407AA Ultra X9 388H, Arc B390 Panther Lake iGPU | Dell 14 Plus 2-in-1 Ryzen AI 7 350, Radeon 860M | Lenovo Yoga 7 2-in-1 14AKP10 Ryzen AI 5 340, Radeon 840M | |
|---|---|---|---|---|---|
| Heat | 9% | 4% | -12% | -10% | |
| Maximum Upper Side * (°C) | 47.1 | 39.1 17% | 35.3 25% | 43.2 8% | 47 -0% |
| Maximum Bottom * (°C) | 46.2 | 35.7 23% | 44.3 4% | 42.8 7% | 49 -6% |
| Idle Upper Side * (°C) | 24.3 | 25.2 -4% | 25.5 -5% | 32.2 -33% | 28 -15% |
| Idle Bottom * (°C) | 24.5 | 24.9 -2% | 26.7 -9% | 31.6 -29% | 29 -18% |
* ... smaller is better
Speaker
The two stereo speakers offer a good sound and can also get very loud.
MSI Prestige 14 Flip AI+ 2026 audio analysis
(+) | speakers can play relatively loud (84.8 dB)
Bass 100 - 315 Hz
(±) | reduced bass - on average 12.4% lower than median
(±) | linearity of bass is average (12.2% delta to prev. frequency)
Mids 400 - 2000 Hz
(+) | balanced mids - only 3.4% away from median
(+) | mids are linear (2.8% delta to prev. frequency)
Highs 2 - 16 kHz
(+) | balanced highs - only 2.8% away from median
(+) | highs are linear (5% delta to prev. frequency)
Overall 100 - 16.000 Hz
(+) | overall sound is linear (10.4% difference to median)
Compared to same class
» 6% of all tested devices in this class were better, 2% similar, 92% worse
» The best had a delta of 6%, average was 20%, worst was 57%
Compared to all devices tested
» 5% of all tested devices were better, 1% similar, 93% worse
» The best had a delta of 4%, average was 24%, worst was 134%
Honor MagicBook Pro 14 2026 audio analysis
(±) | speaker loudness is average but good (81.2 dB)
Bass 100 - 315 Hz
(±) | reduced bass - on average 12.8% lower than median
(±) | linearity of bass is average (8.9% delta to prev. frequency)
Mids 400 - 2000 Hz
(+) | balanced mids - only 4.5% away from median
(+) | mids are linear (5.2% delta to prev. frequency)
Highs 2 - 16 kHz
(+) | balanced highs - only 1.1% away from median
(+) | highs are linear (3.9% delta to prev. frequency)
Overall 100 - 16.000 Hz
(+) | overall sound is linear (12.1% difference to median)
Compared to same class
» 22% of all tested devices in this class were better, 3% similar, 76% worse
» The best had a delta of 5%, average was 17%, worst was 45%
Compared to all devices tested
» 9% of all tested devices were better, 2% similar, 88% worse
» The best had a delta of 4%, average was 24%, worst was 134%
Asus ZenBook Duo UX8407AA audio analysis
(+) | speakers can play relatively loud (83.7 dB)
Bass 100 - 315 Hz
(±) | reduced bass - on average 6.6% lower than median
(±) | linearity of bass is average (8.3% delta to prev. frequency)
Mids 400 - 2000 Hz
(+) | balanced mids - only 4.4% away from median
(+) | mids are linear (5% delta to prev. frequency)
Highs 2 - 16 kHz
(+) | balanced highs - only 3% away from median
(+) | highs are linear (3.8% delta to prev. frequency)
Overall 100 - 16.000 Hz
(+) | overall sound is linear (9.8% difference to median)
Compared to same class
» 5% of all tested devices in this class were better, 1% similar, 94% worse
» The best had a delta of 6%, average was 20%, worst was 57%
Compared to all devices tested
» 4% of all tested devices were better, 1% similar, 95% worse
» The best had a delta of 4%, average was 24%, worst was 134%
Dell 14 Plus 2-in-1 audio analysis
(-) | not very loud speakers (70.1 dB)
Bass 100 - 315 Hz
(±) | reduced bass - on average 13.4% lower than median
(-) | bass is not linear (15.1% delta to prev. frequency)
Mids 400 - 2000 Hz
(+) | balanced mids - only 4% away from median
(±) | linearity of mids is average (8.4% delta to prev. frequency)
Highs 2 - 16 kHz
(+) | balanced highs - only 2.5% away from median
(+) | highs are linear (5.6% delta to prev. frequency)
Overall 100 - 16.000 Hz
(±) | linearity of overall sound is average (19.4% difference to median)
Compared to same class
» 47% of all tested devices in this class were better, 6% similar, 47% worse
» The best had a delta of 6%, average was 20%, worst was 57%
Compared to all devices tested
» 47% of all tested devices were better, 7% similar, 45% worse
» The best had a delta of 4%, average was 24%, worst was 134%
Lenovo Yoga 7 2-in-1 14AKP10 audio analysis
(±) | speaker loudness is average but good (80 dB)
Bass 100 - 315 Hz
(±) | reduced bass - on average 14.2% lower than median
(±) | linearity of bass is average (9.2% delta to prev. frequency)
Mids 400 - 2000 Hz
(+) | balanced mids - only 2.9% away from median
(+) | mids are linear (3.8% delta to prev. frequency)
Highs 2 - 16 kHz
(+) | balanced highs - only 2.9% away from median
(±) | linearity of highs is average (7.7% delta to prev. frequency)
Overall 100 - 16.000 Hz
(+) | overall sound is linear (13.1% difference to median)
Compared to same class
» 17% of all tested devices in this class were better, 3% similar, 80% worse
» The best had a delta of 6%, average was 20%, worst was 57%
Compared to all devices tested
» 13% of all tested devices were better, 3% similar, 84% worse
» The best had a delta of 4%, average was 24%, worst was 134%
Power consumption

The Prestige is very economical in idle mode, but the 65-watt power supply is not sufficient under load, which is why the battery has to be tapped again and again. With a more powerful power supply unit, we were able to determine a maximum peak consumption of just over 80 watts.
| Off / Standby | |
| Idle | |
| Load |
|
Key:
min: | |
| MSI Prestige 14 Flip AI+ 2026 Ultra X7 358H, Arc B390 Panther Lake iGPU, Phison 1 TB ESR01TBTCCZ-27J, OLED, 1920x1200, 14" | Honor MagicBook Pro 14 2026 Ultra 5 338H, Arc B370 Panther Lake iGPU, YMTC PC411-1TB, OLED, 3120x2080, 14.6" | Asus ZenBook Duo UX8407AA Ultra X9 388H, Arc B390 Panther Lake iGPU, Samsung PM9C1b MZVL82T0HBL1, OLED, 2880x1800, 14" | Dell 14 Plus 2-in-1 Ryzen AI 7 350, Radeon 860M, , IPS, 1920x1200, 14" | Lenovo Yoga 7 2-in-1 14AKP10 Ryzen AI 5 340, Radeon 840M, WD PC SN7100S SDFPMSL-512G-1101, OLED, 1920x1200, 14" | Average Intel Arc B390 12 Xe3 Panther Lake iGPU | Average of class Convertible | |
|---|---|---|---|---|---|---|---|
| Power Consumption | -58% | -62% | -5% | -16% | -39% | -42% | |
| Idle Minimum * (Watt) | 2.8 | 6.8 -143% | 4.8 -71% | 3.5 -25% | 4 -43% | 3.82 ? -36% | 4.29 ? -53% |
| Idle Average * (Watt) | 4.2 | 8.2 -95% | 9.8 -133% | 6.8 -62% | 5 -19% | 5.66 ? -35% | 7.1 ? -69% |
| Idle Maximum * (Watt) | 4.5 | 9.1 -102% | 10.2 -127% | 6.9 -53% | 7 -56% | 8.93 ? -98% | 8.68 ? -93% |
| Load Average * (Watt) | 48.9 | 40.4 17% | 47.3 3% | 40.8 17% | 52 -6% | 44.9 ? 8% | 44.1 ? 10% |
| Cyberpunk 2077 ultra external monitor * (Watt) | 58.6 | 66 -13% | 75.3 -28% | 32.8 44% | 52.6 10% | ||
| Cyberpunk 2077 ultra * (Watt) | 59.9 | 66.1 -10% | 76.3 -27% | 36.2 40% | 54.8 9% | ||
| Load Maximum * (Watt) | 64 | 100.2 -57% | 96 -50% | 59.3 7% | 68 -6% | 85.6 ? -34% | 67.2 ? -5% |
* ... smaller is better
Power consumption Cyberpunk / Stress test
Power consumption with external monitor
Battery life
The 81 Wh battery enables very long runtimes of almost 20 hours in our WLAN test (150 cd/m²) and still 14.5 hours at full screen brightness (although the low maximum brightness naturally helps here).
Notebookcheck overall rating
MSI Prestige 14 Flip AI+ 2026
- 03/04/2026 v8
Andreas Osthoff
 Total Sustainability Score:
 Possible alternatives in comparison
Image | Model / Review | Price | Weight | Height | Display |
|---|---|---|---|---|---|
1. 84.2% 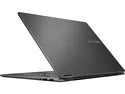 | MSI Prestige 14 Flip AI+ 2026 Intel Core Ultra X7 358H ⎘ Intel Arc B390 12 Xe3 Panther Lake iGPU ⎘ 32 GB Memory, 1000 GB SSD | Amazon: 1. $1,397.87 MSI Prestige 14 AI+ EVO PRE1... 2. $1,479.00 MSI Prestige 16 AI+ Evo 16" ... 3. $1,470.00 msi Prestige A16 AI+ (2025) ... List Price: 1549€ | 1.4 kg | 13.9 mm | 14.00" 1920x1200 162 PPI OLED |
2. 88.9%  | Honor MagicBook Pro 14 2026 Intel Core Ultra 5 338H ⎘ Intel Arc B370 10 Xe3 Panther Lake iGPU ⎘ 32 GB Memory, 1024 GB SSD | Amazon: | 1.4 kg | 15.9 mm | 14.60" 3120x2080 257 PPI OLED |
3. 88.5% 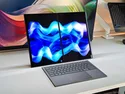 | Asus ZenBook Duo UX8407AA Intel Core Ultra X9 388H ⎘ Intel Arc B390 12 Xe3 Panther Lake iGPU ⎘ 32 GB Memory, 2048 GB SSD | Amazon: $2,499.99 List Price: 2599€ | 1.7 kg | 23.4 mm | 14.00" 2880x1800 243 PPI OLED |
4. 78.8% 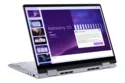 | Dell 14 Plus 2-in-1 AMD Ryzen AI 7 350 ⎘ AMD Radeon 860M ⎘ 16 GB Memory | Amazon: 1. Dell Inspiron 14 Plus 2-in-1... 2. $1,529.00 Dell Plus 14" FHD+ 2-in-1 To... 3. $929.00 Dell Plus 14" 2K 2-in-1 Touc... List Price: 1050 USD | 1.6 kg | 16.39 mm | 14.00" 1920x1200 162 PPI IPS |
5. 84.8%  | Lenovo Yoga 7 2-in-1 14AKP10 AMD Ryzen AI 5 340 ⎘ AMD Radeon 840M ⎘ 16 GB Memory, 512 GB SSD | Amazon: List Price: 1000 EUR | 1.4 kg | 16.5 mm | 14.00" 1920x1200 162 PPI OLED |
Transparency
The selection of devices to be reviewed is made by our editorial team. The test sample was provided to the author as a loan by the manufacturer or retailer for the purpose of this review. The lender had no influence on this review, nor did the manufacturer receive a copy of this review before publication. There was no obligation to publish this review. As an independent media company, Notebookcheck is not subjected to the authority of manufacturers, retailers or publishers.
This is how Notebookcheck is testing
Every year, Notebookcheck independently reviews hundreds of laptops and smartphones using standardized procedures to ensure that all results are comparable. We have continuously developed our test methods for around 20 years and set industry standards in the process. In our test labs, high-quality measuring equipment is utilized by experienced technicians and editors. These tests involve a multi-stage validation process. Our complex rating system is based on hundreds of well-founded measurements and benchmarks, which maintains objectivity. Further information on our test methods can be found here.

