Xplore Technologies XSLATE L10 (Pentium N4200, FHD) Tablet Review
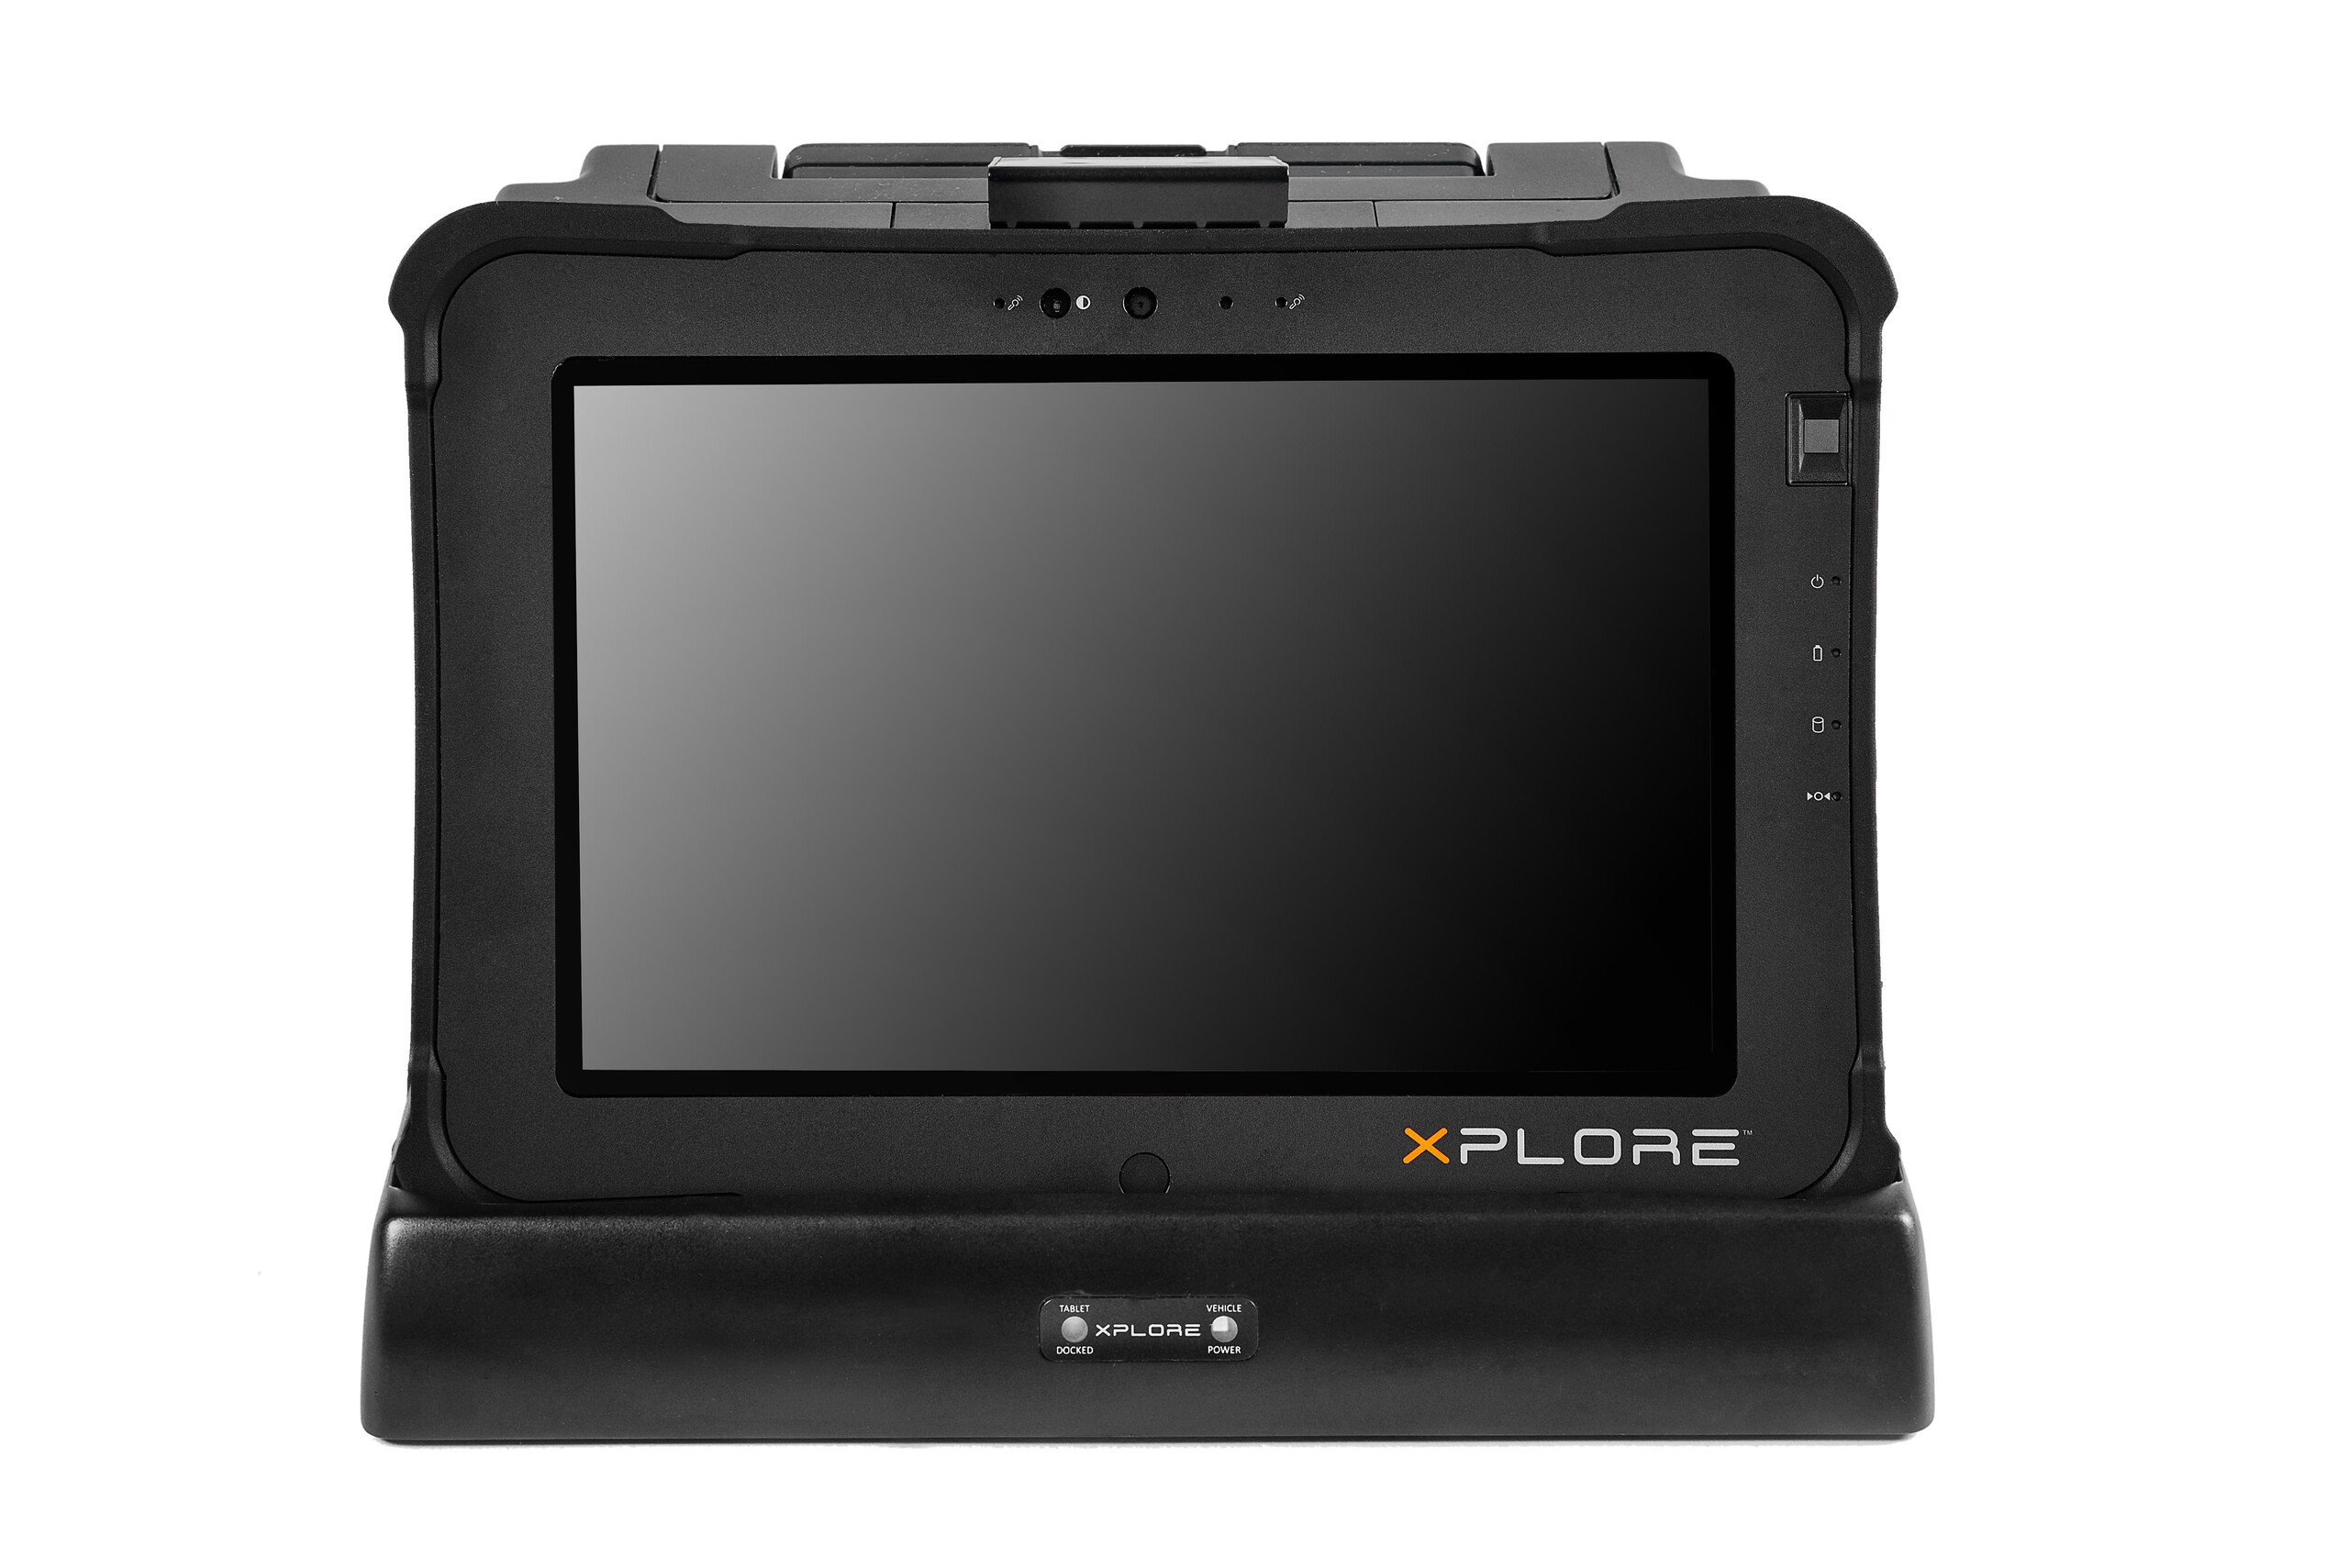
Xplore Technologies specializes in rugged tablets and PCs designed for outdoor and professional use. Its latest product is the L10 tablet complete with detachable keyboard, carrying cases, straps, removable battery, and other accessories catered to maximizing productivity in a variety of demanding industrial conditions. The L10 competes directly with other rugged tablets including the Dell Latitude Rugged series, Fujitsu Stylistic series, Panasonic Toughbook series, and the Durabook series.
We recommend checking out the official Xplore L10 brochure, specifications list, and product website for a concise rundown of all of its features. The L10 tablet is just one device as part of Xplore's new L10 platform. Our review below will focus on the core hardware and performance of the tablet.
Case
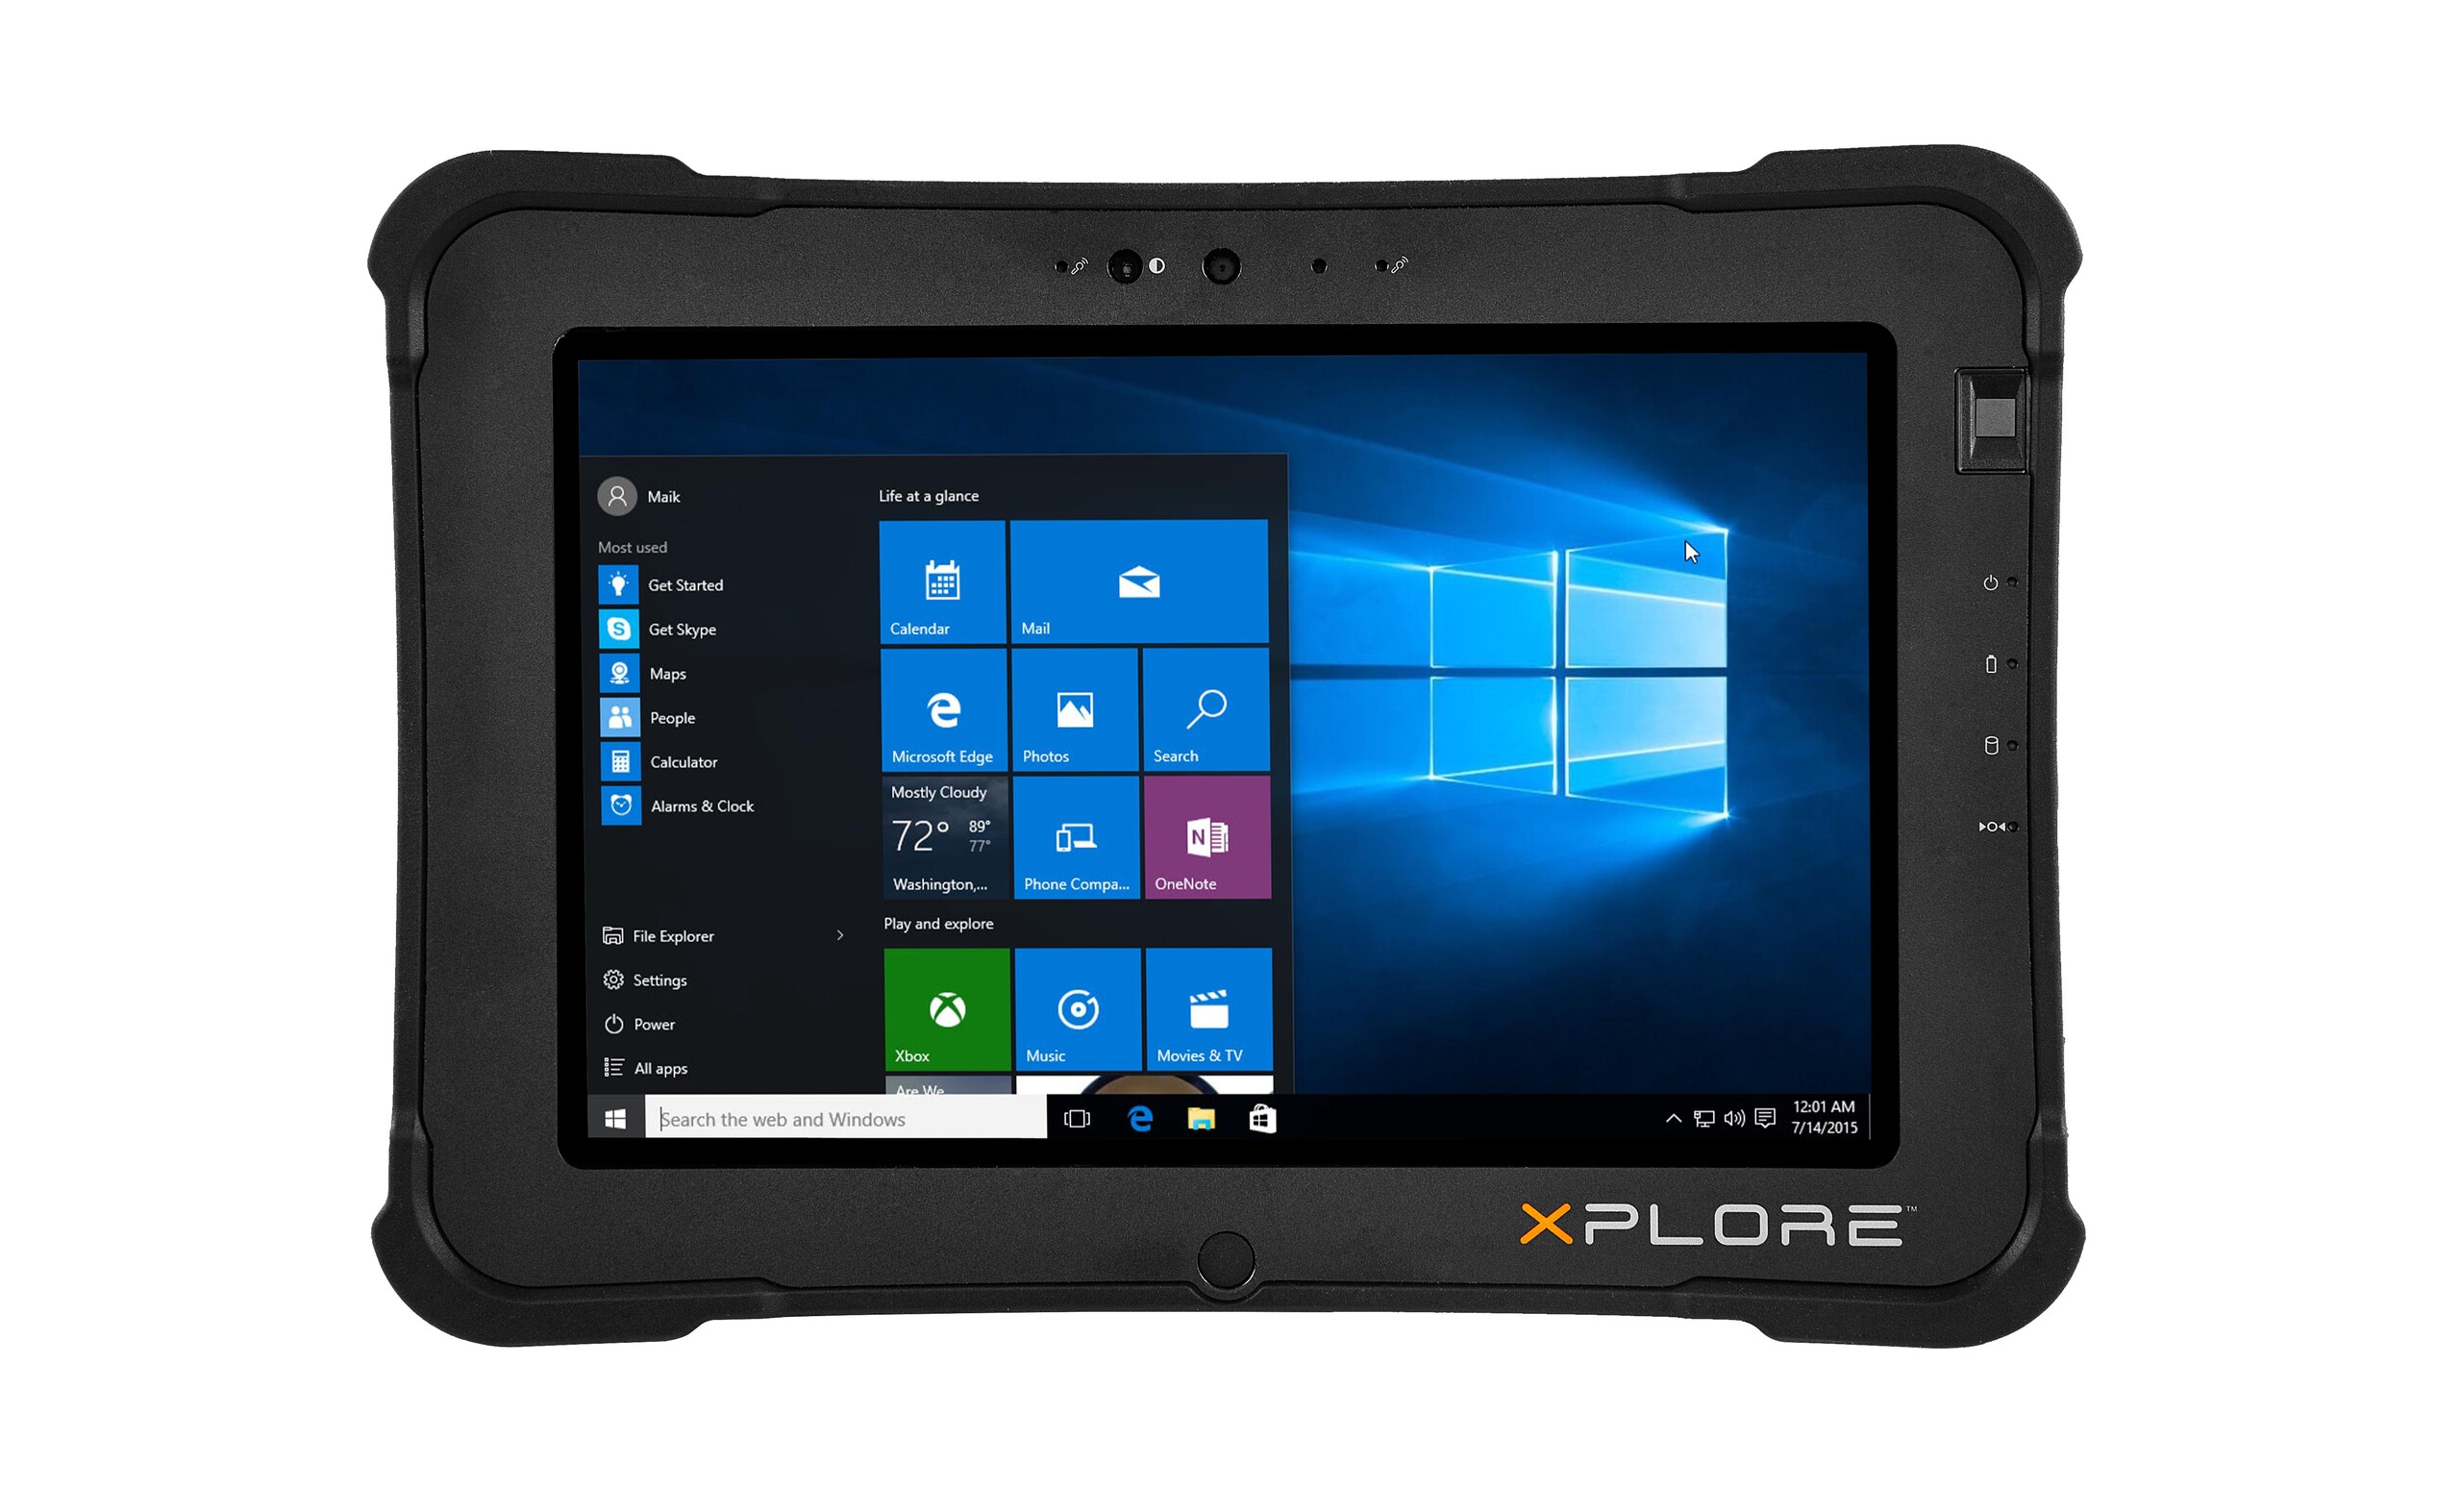
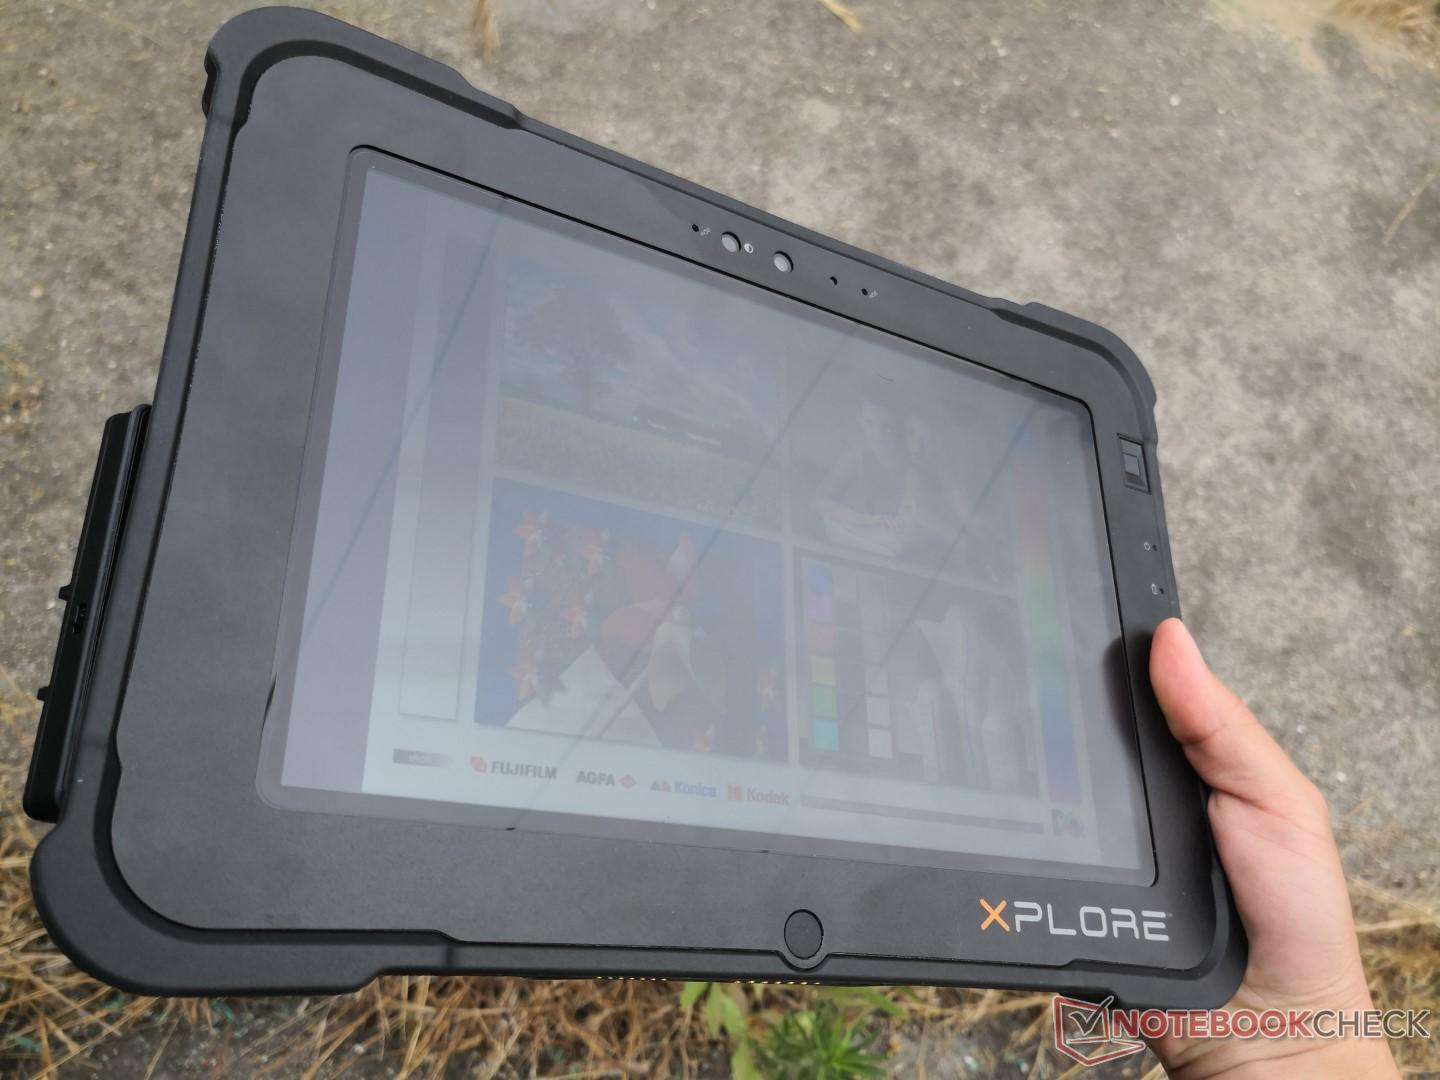
The L10 may be three times heavier than the iPad Pro 10.5, but all that extra girth makes it significantly more robust and resistant to damage. Attempting to twist the unit from its corners or apply pressure on its Gorilla Glass display results in no creaking only minimal warping. Our biggest gripe is that some of its buttons are difficult to depress. The Home and Up-Down buttons, for example, have firm feedback but they are almost flush against the tablet surface.
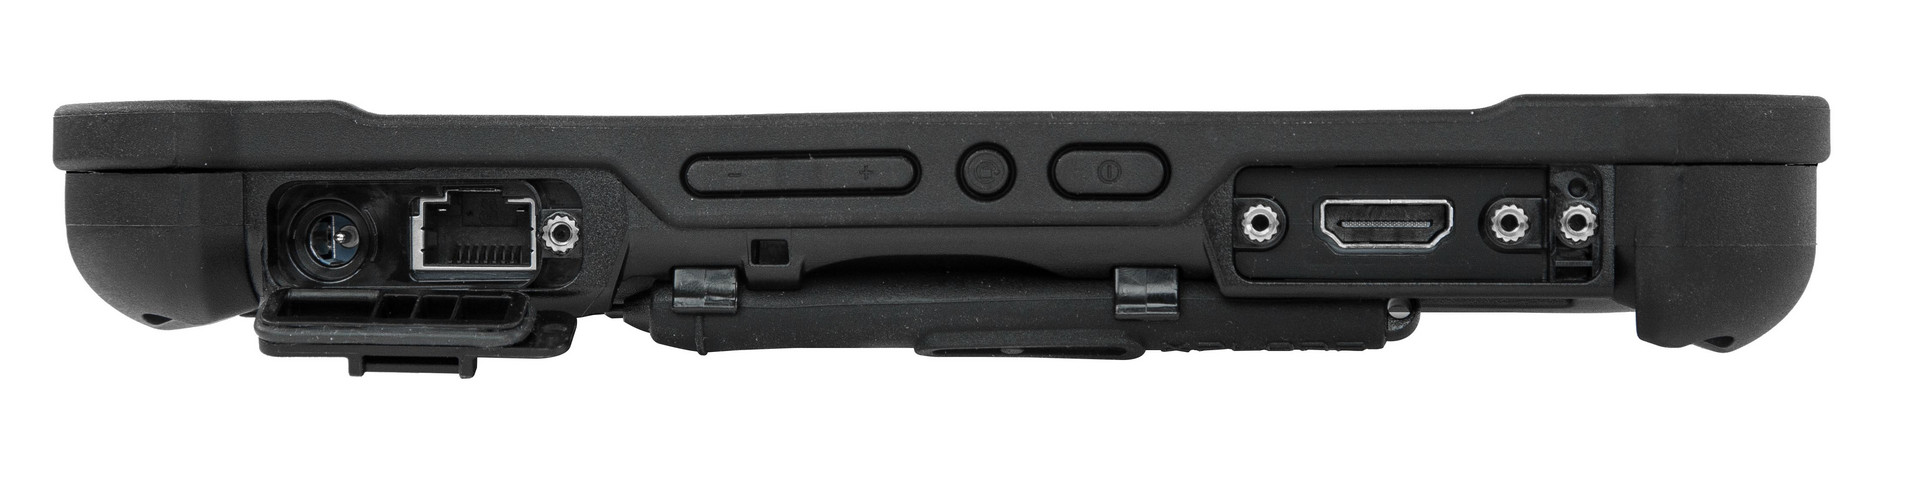
Connectivity
Available ports include everything one would expect from a consumer tablet like USB Type-A ports, USB Type-C, MicroSD, 3.5 mm headphones, and even HDMI. Perhaps annoyingly, the latter is behind a set of Philips screws which can be inconvenient in situations where a screwdriver may be unavailable.
Charging via USB Type-C is not possible as the tablet uses a proprietary AC adapter. We're hopeful that future models will be compatible with USB Type-C charging for convenience.
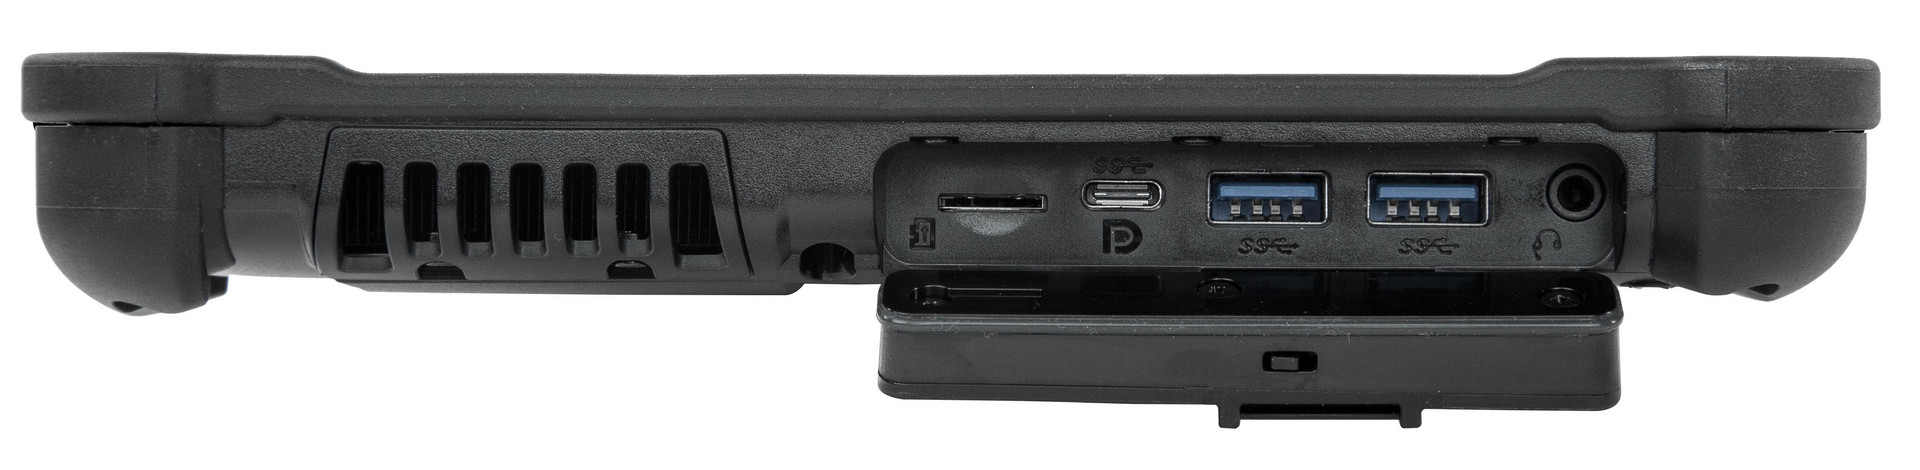
SD Card Reader
The spring-loaded MicroSD reader is able to transfer 1 GB worth of images from card to desktop in about 16 seconds. Competing models like the Latitude 14 or Panasonic Toughbook CF-XZ6 have faster SD readers that are able to transfer files in half the time.
| SD Card Reader | |
| average JPG Copy Test (av. of 3 runs) | |
| Panasonic Toughbook CF-XZ6 (Toshiba Exceria Pro SDXC 64 GB UHS-II) | |
| Dell Latitude 14 7414 Rugged Extreme (Toshiba Exceria Pro SDXC 64 GB UHS-II) | |
| Xploretech XSLATE L10 (Toshiba Exceria Pro SDXC 64 GB UHS-II) | |
| Dell Latitude 3490 (Toshiba Exceria Pro SDXC 64 GB UHS-II) | |
| maximum AS SSD Seq Read Test (1GB) | |
| Panasonic Toughbook CF-XZ6 (Toshiba Exceria Pro SDXC 64 GB UHS-II) | |
| Dell Latitude 14 7414 Rugged Extreme (Toshiba Exceria Pro SDXC 64 GB UHS-II) | |
| Xploretech XSLATE L10 (Toshiba Exceria Pro SDXC 64 GB UHS-II) | |
| Dell Latitude 3490 (Toshiba Exceria Pro SDXC 64 GB UHS-II) | |
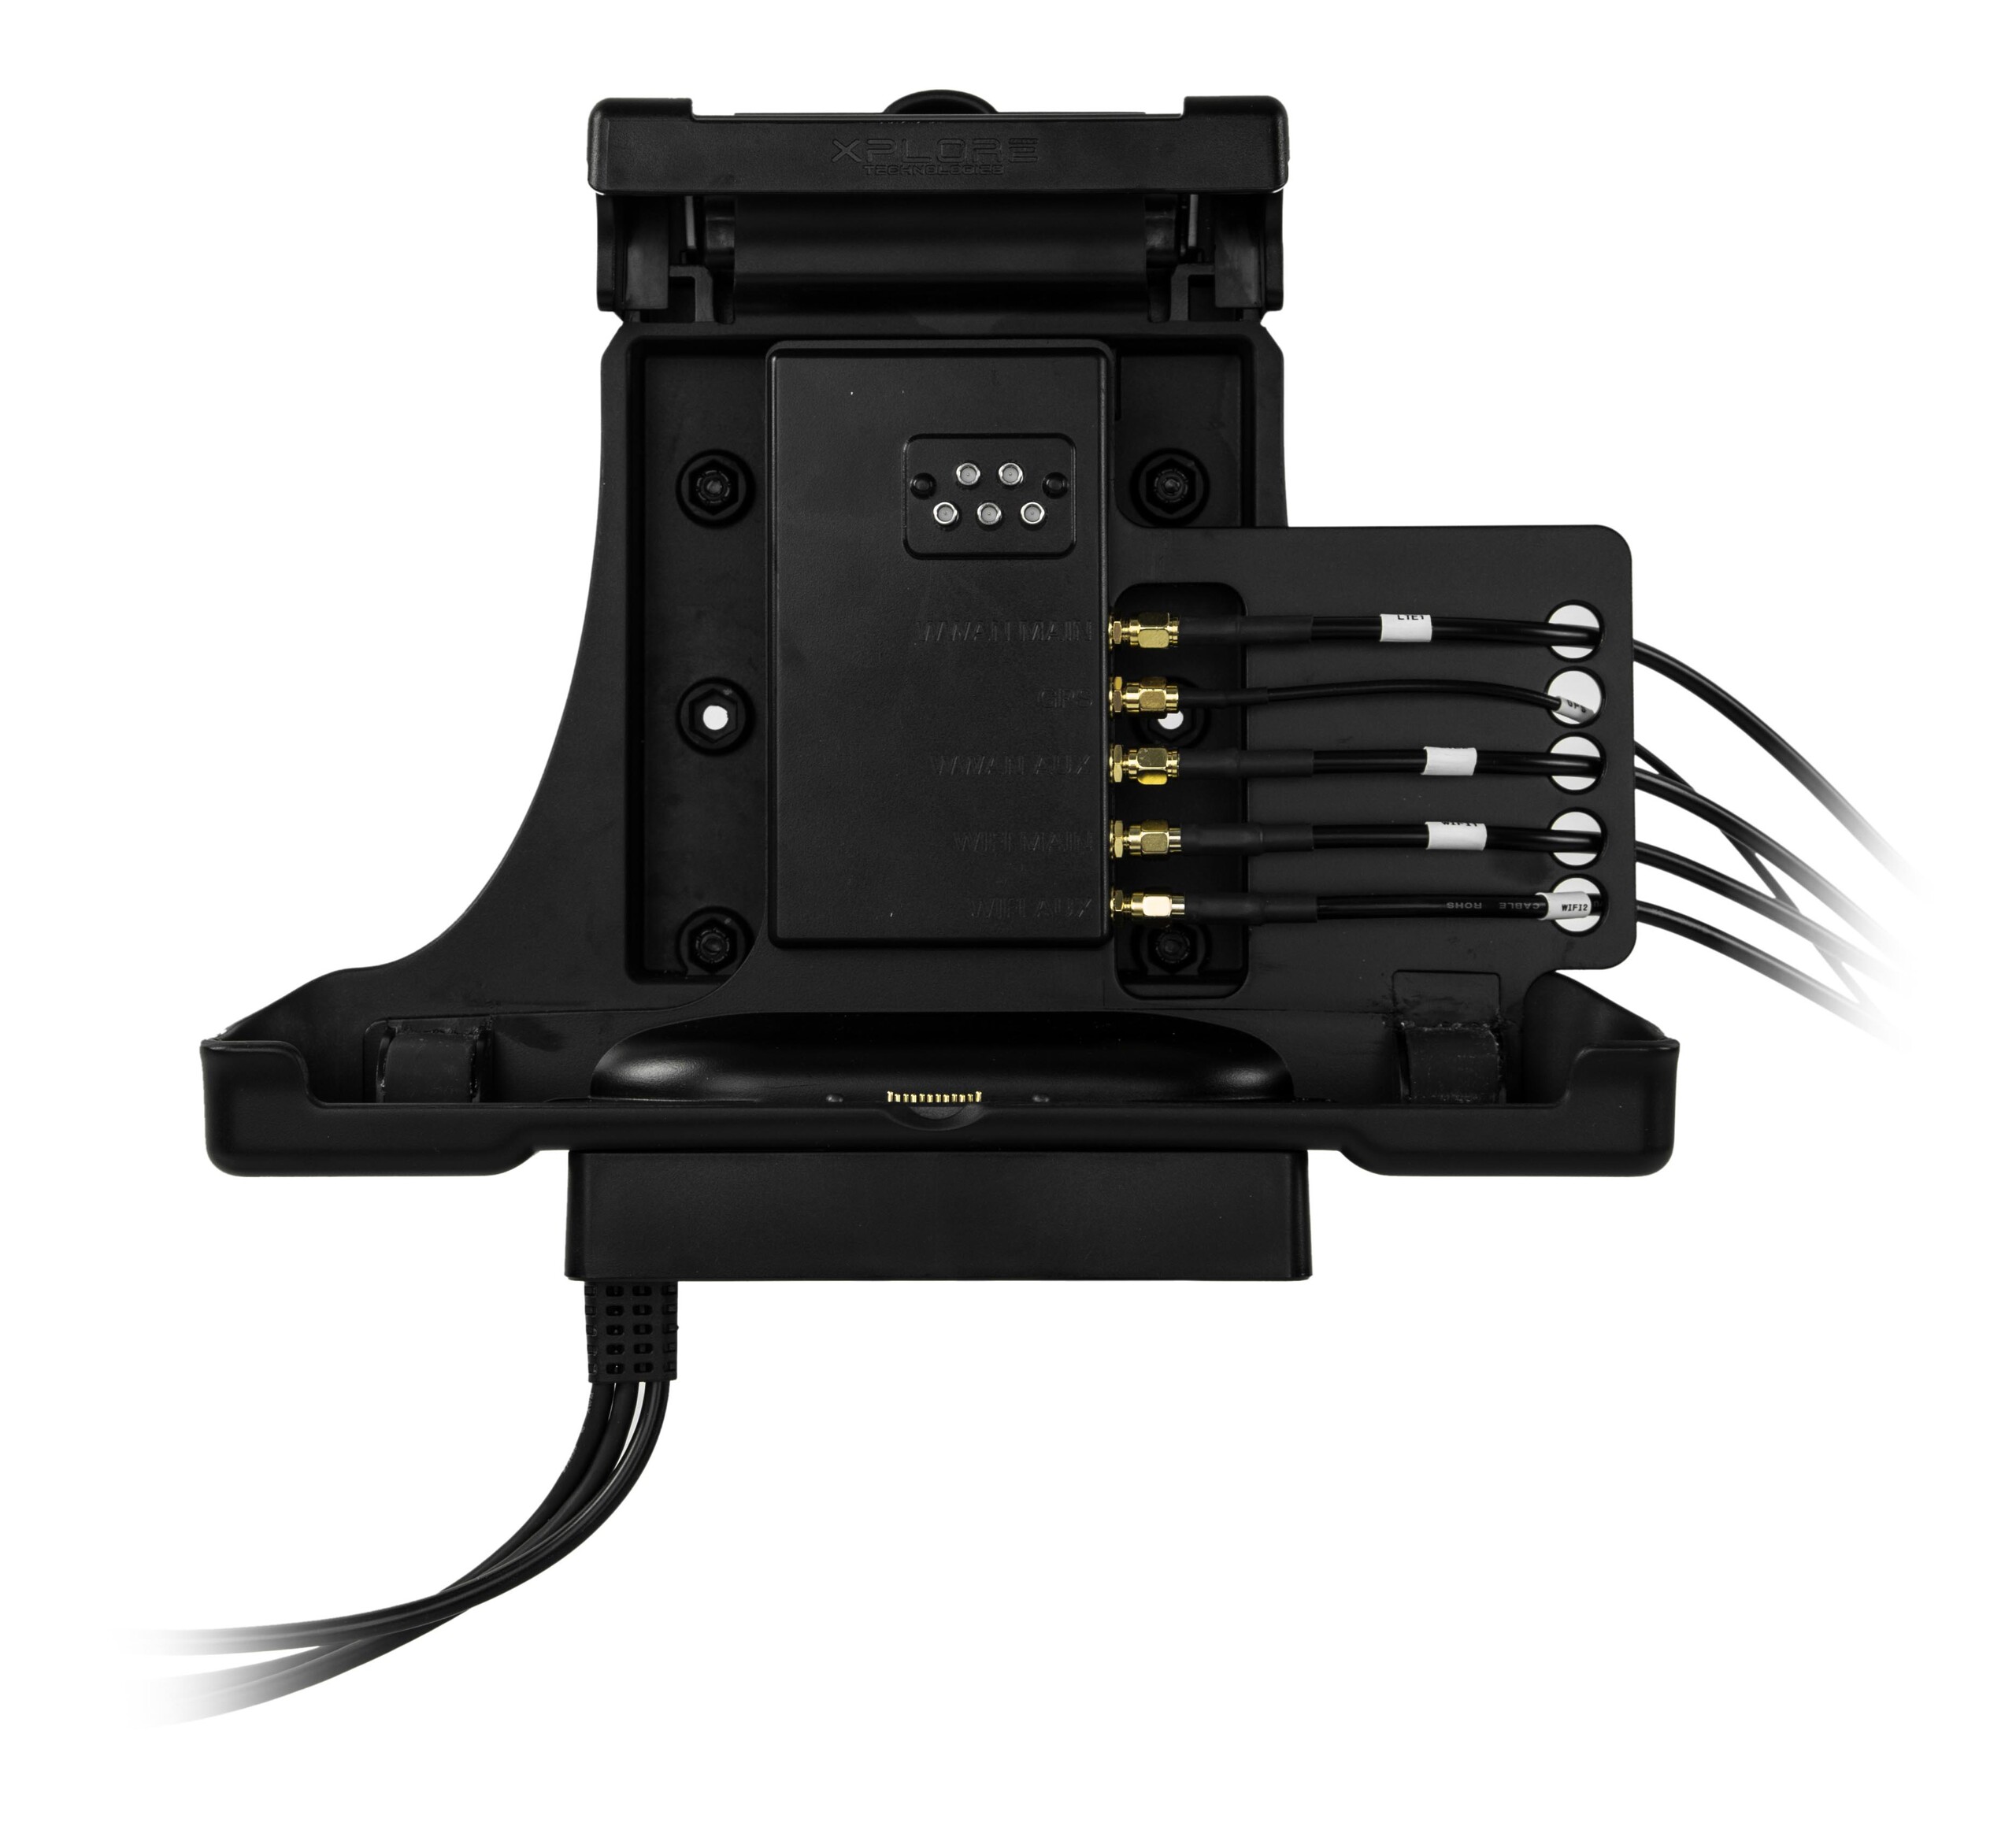
Communication
The 2x2 Intel 8265 is capable of theoretical transfer rates of up to 867 Mbps. For the L10, however, transmit is unsteady at an average of only 325 Mbps compared to 670 Mbps on the Panasonic Toughbook equipped with the very same Intel WLAN module. Even more strange is that the Intel 8265 in the L10 exhibits steady receive rates of 664 Mbps. The wide discrepancy between its transmit and receive performances suggests that the software may not be up to date or that our unit has a faulty antennae in one direction.
Security
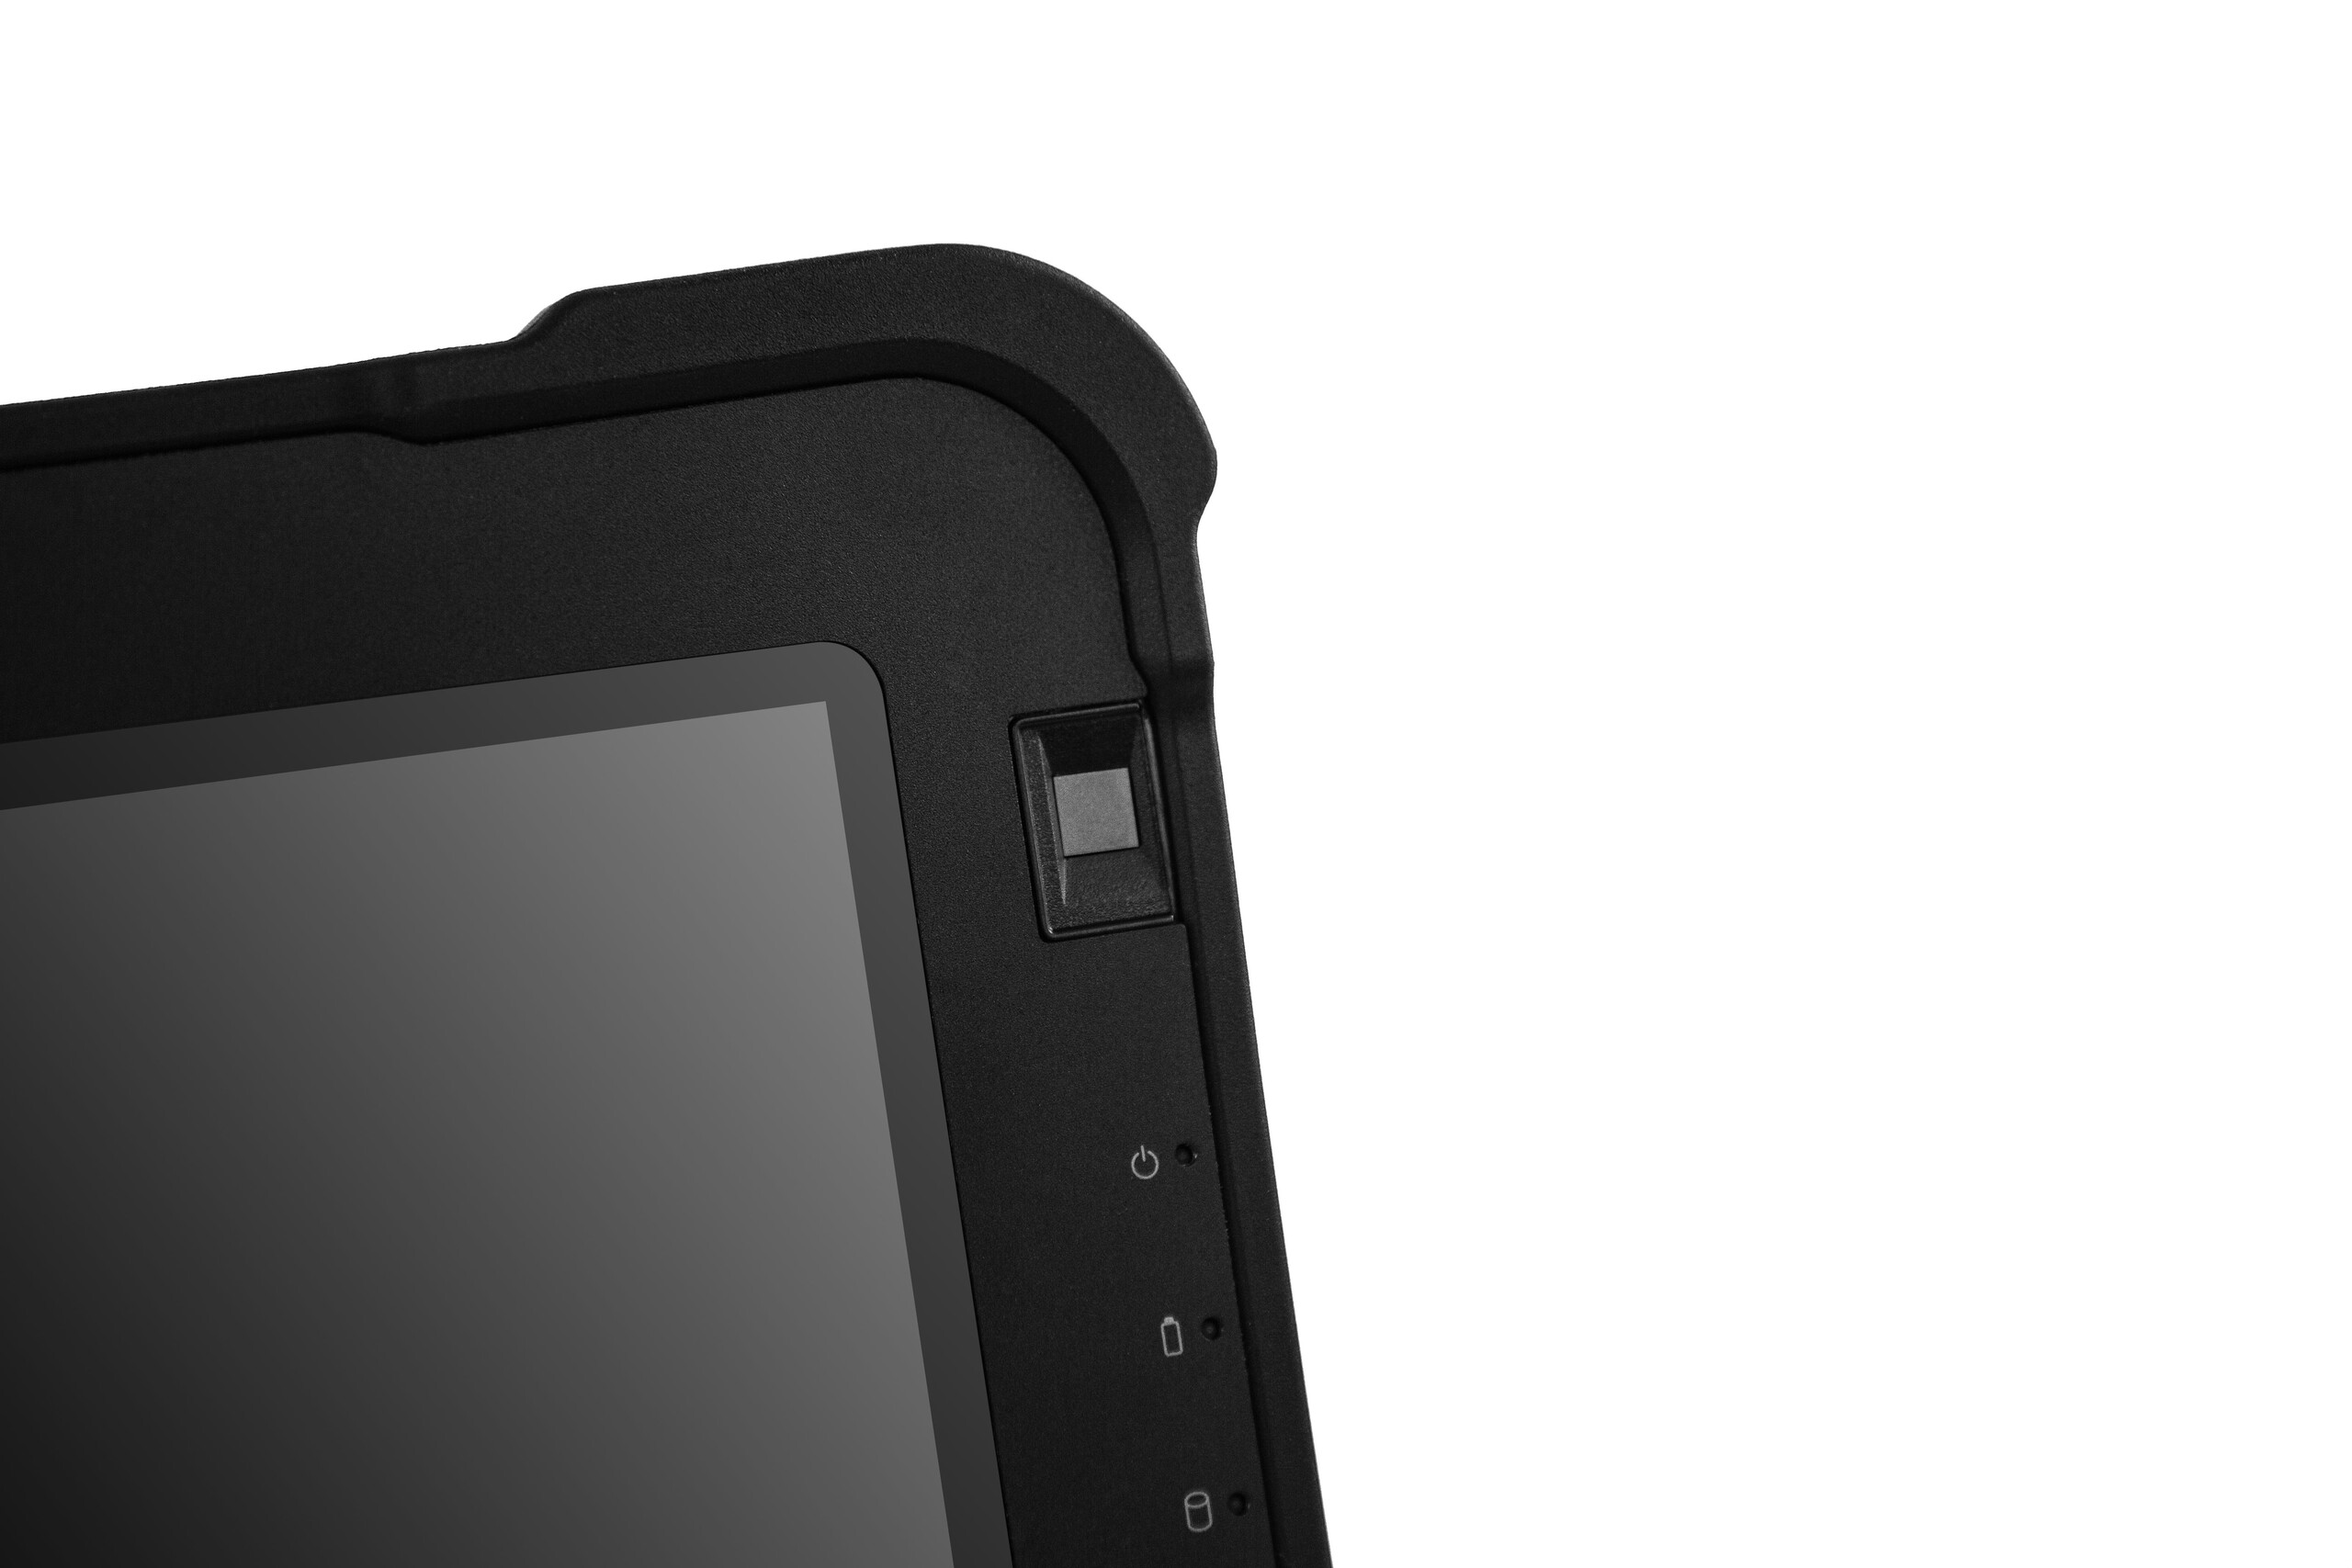
A fingerprint reader is provided albeit very smaller than the fingerprint readers on many commercial laptops. Fortunately, recognition and speed do not appear to be affected in practice.
Accessories
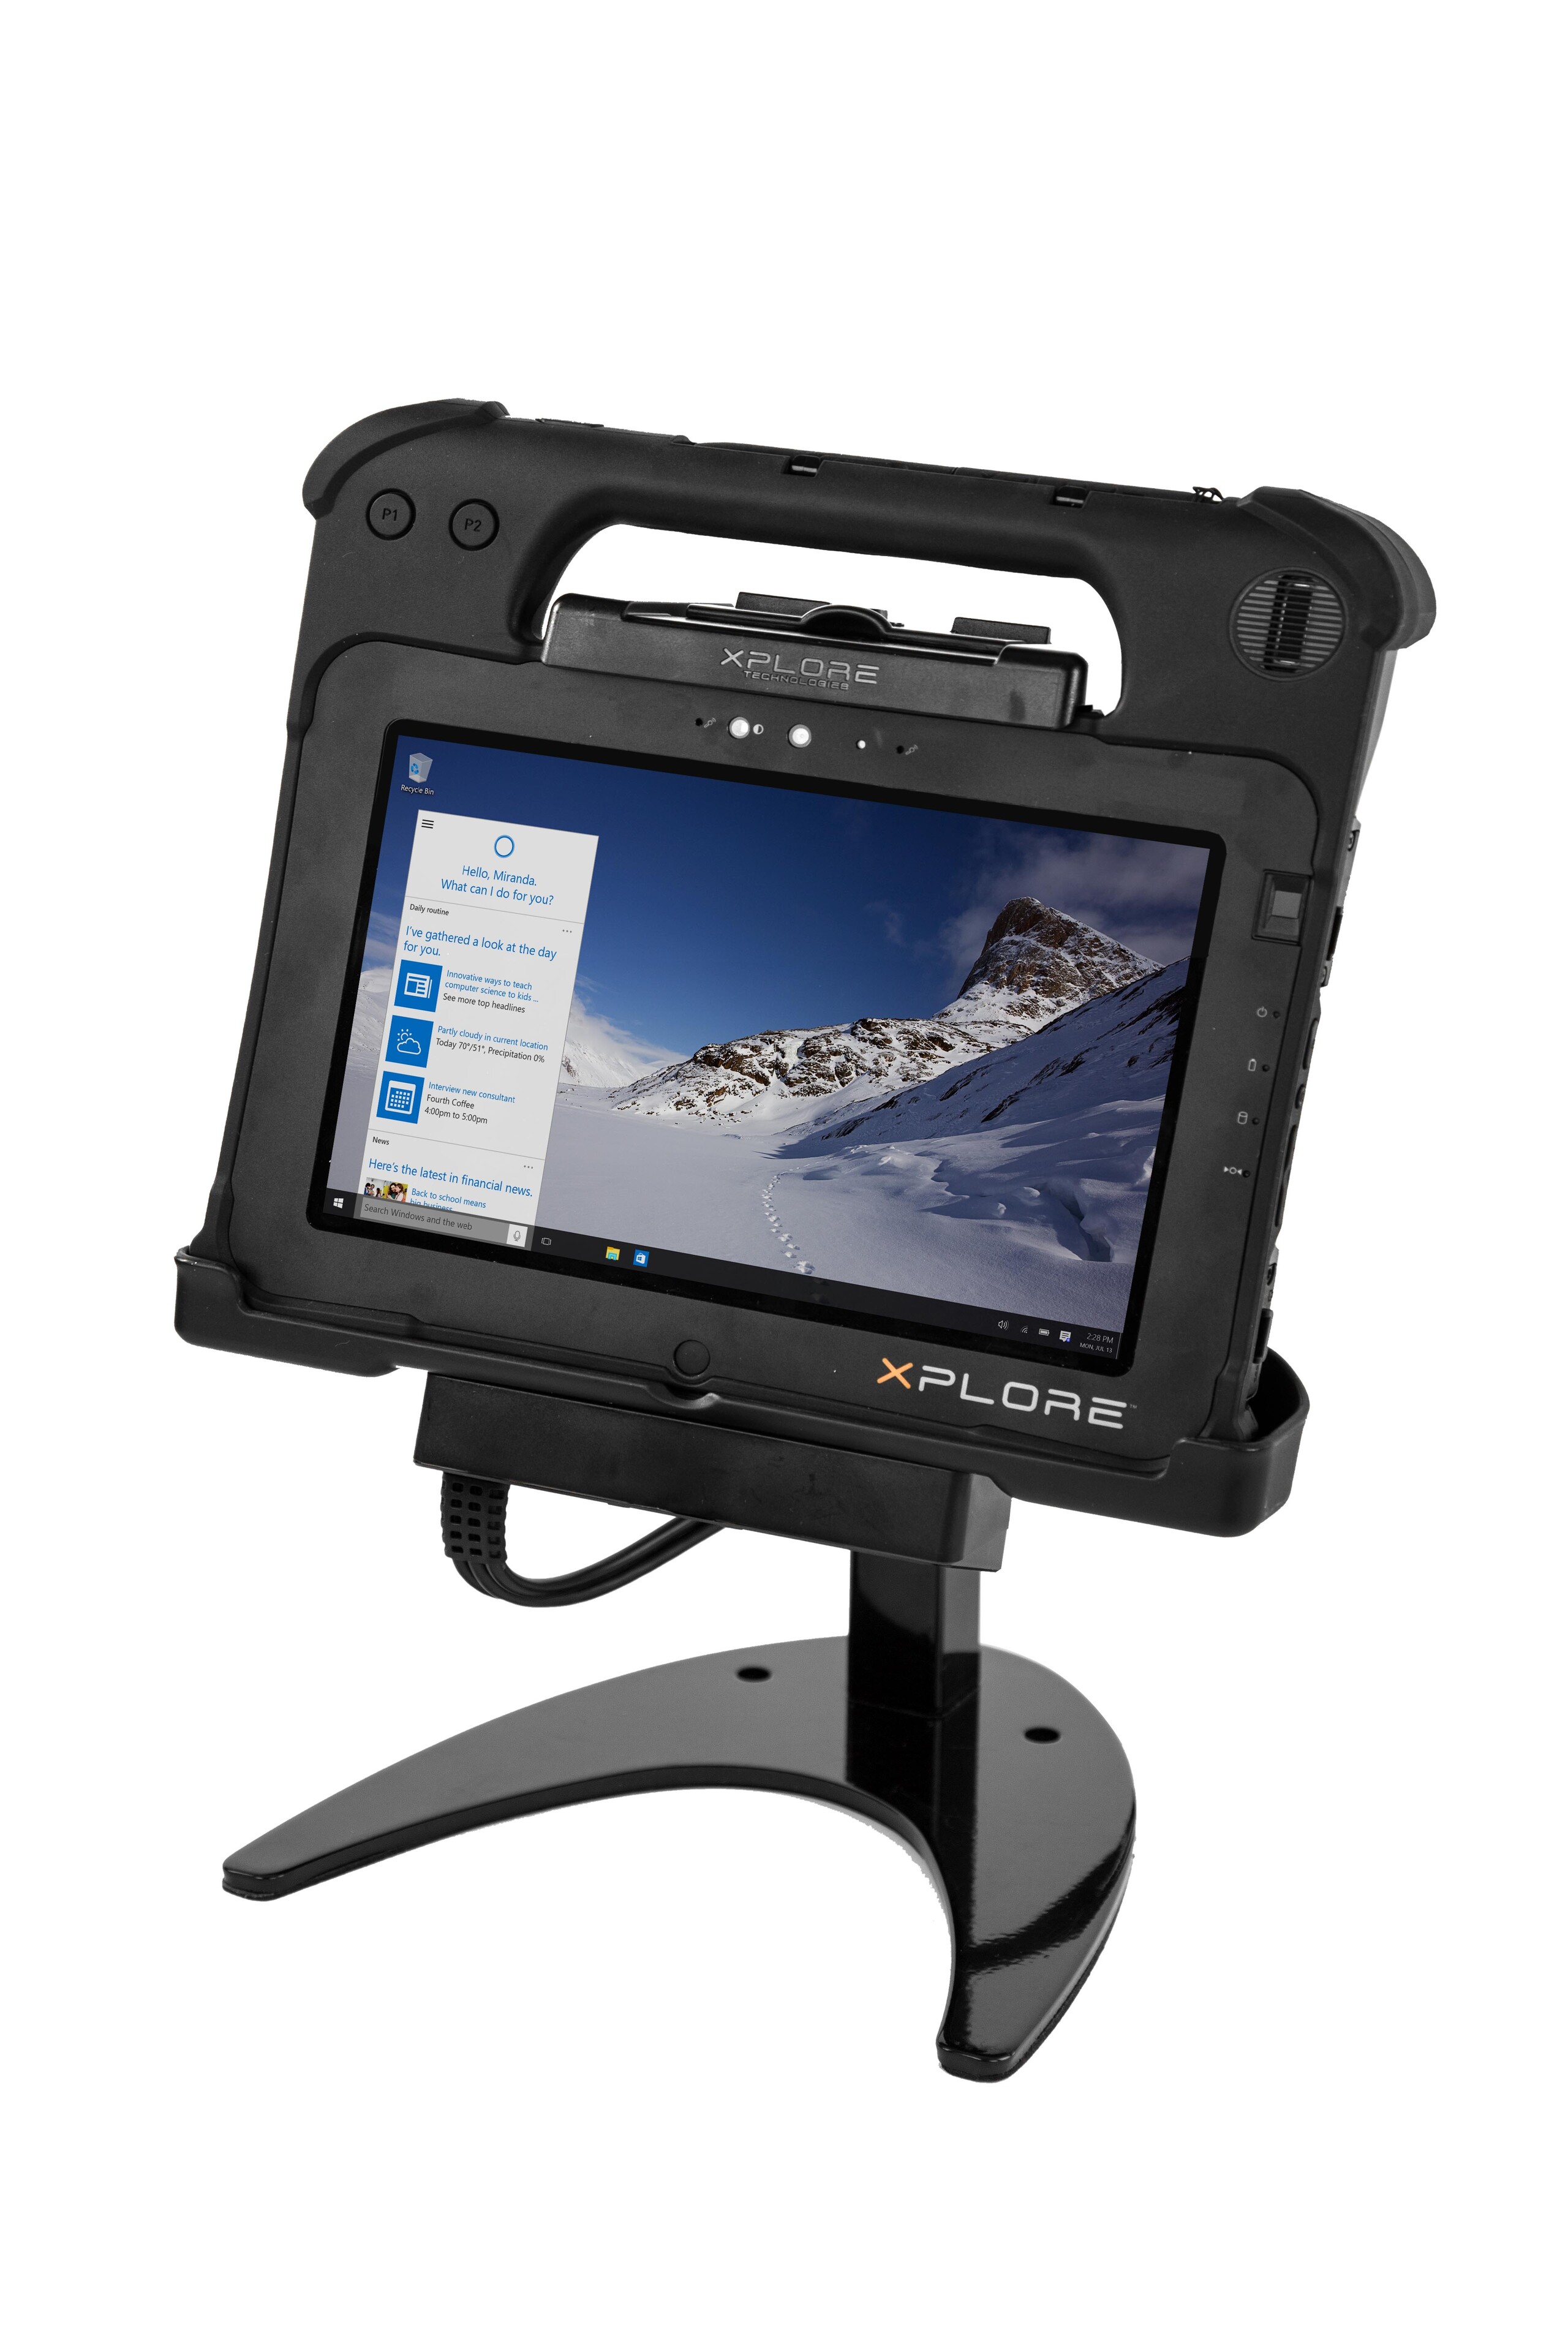
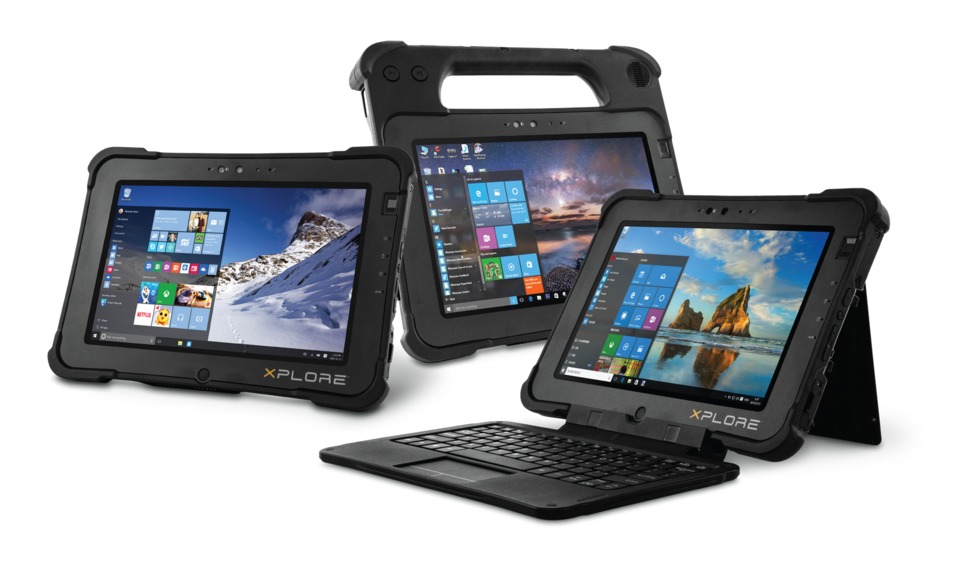
A wide variety of accessories are available in the L10 lineup including the XBook L10, XPad L10, and XSLATE L10. Xplore has a brief rundown on these devices through the official website.
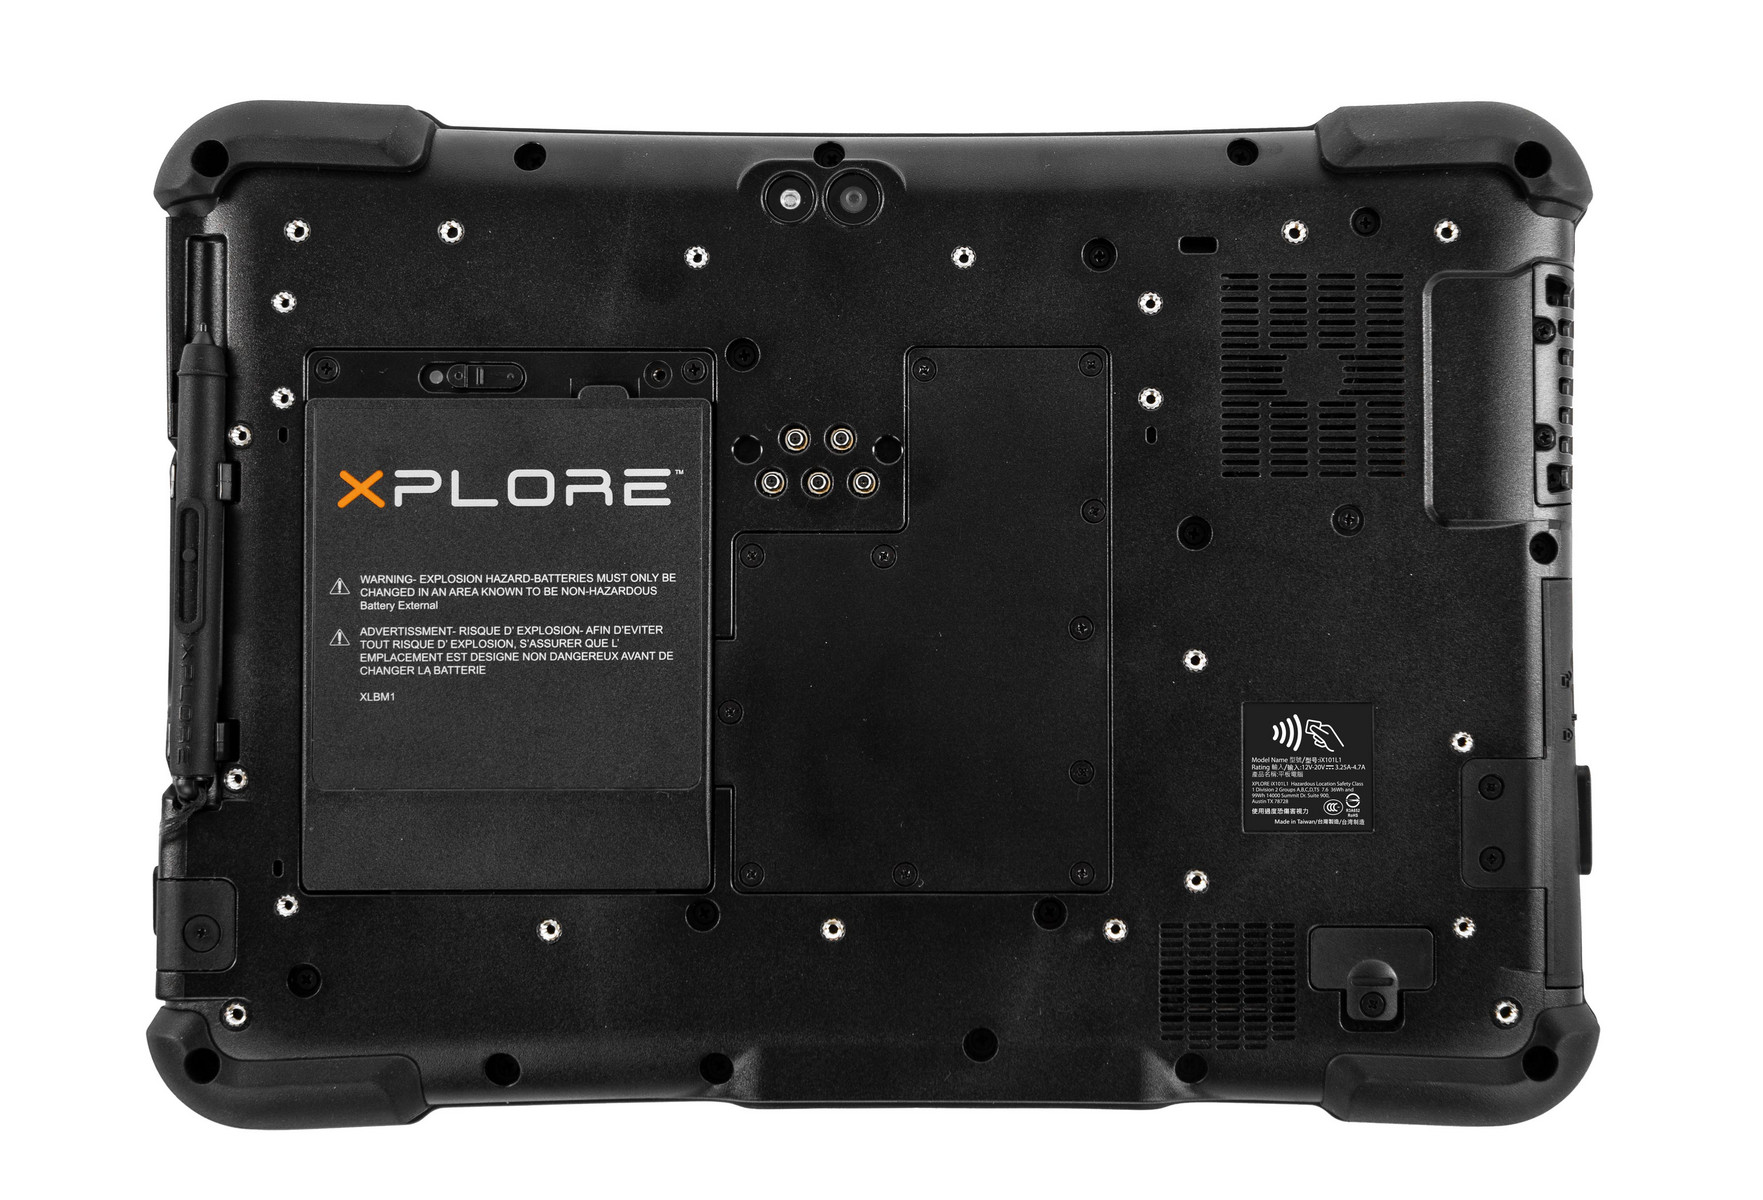
Maintenance
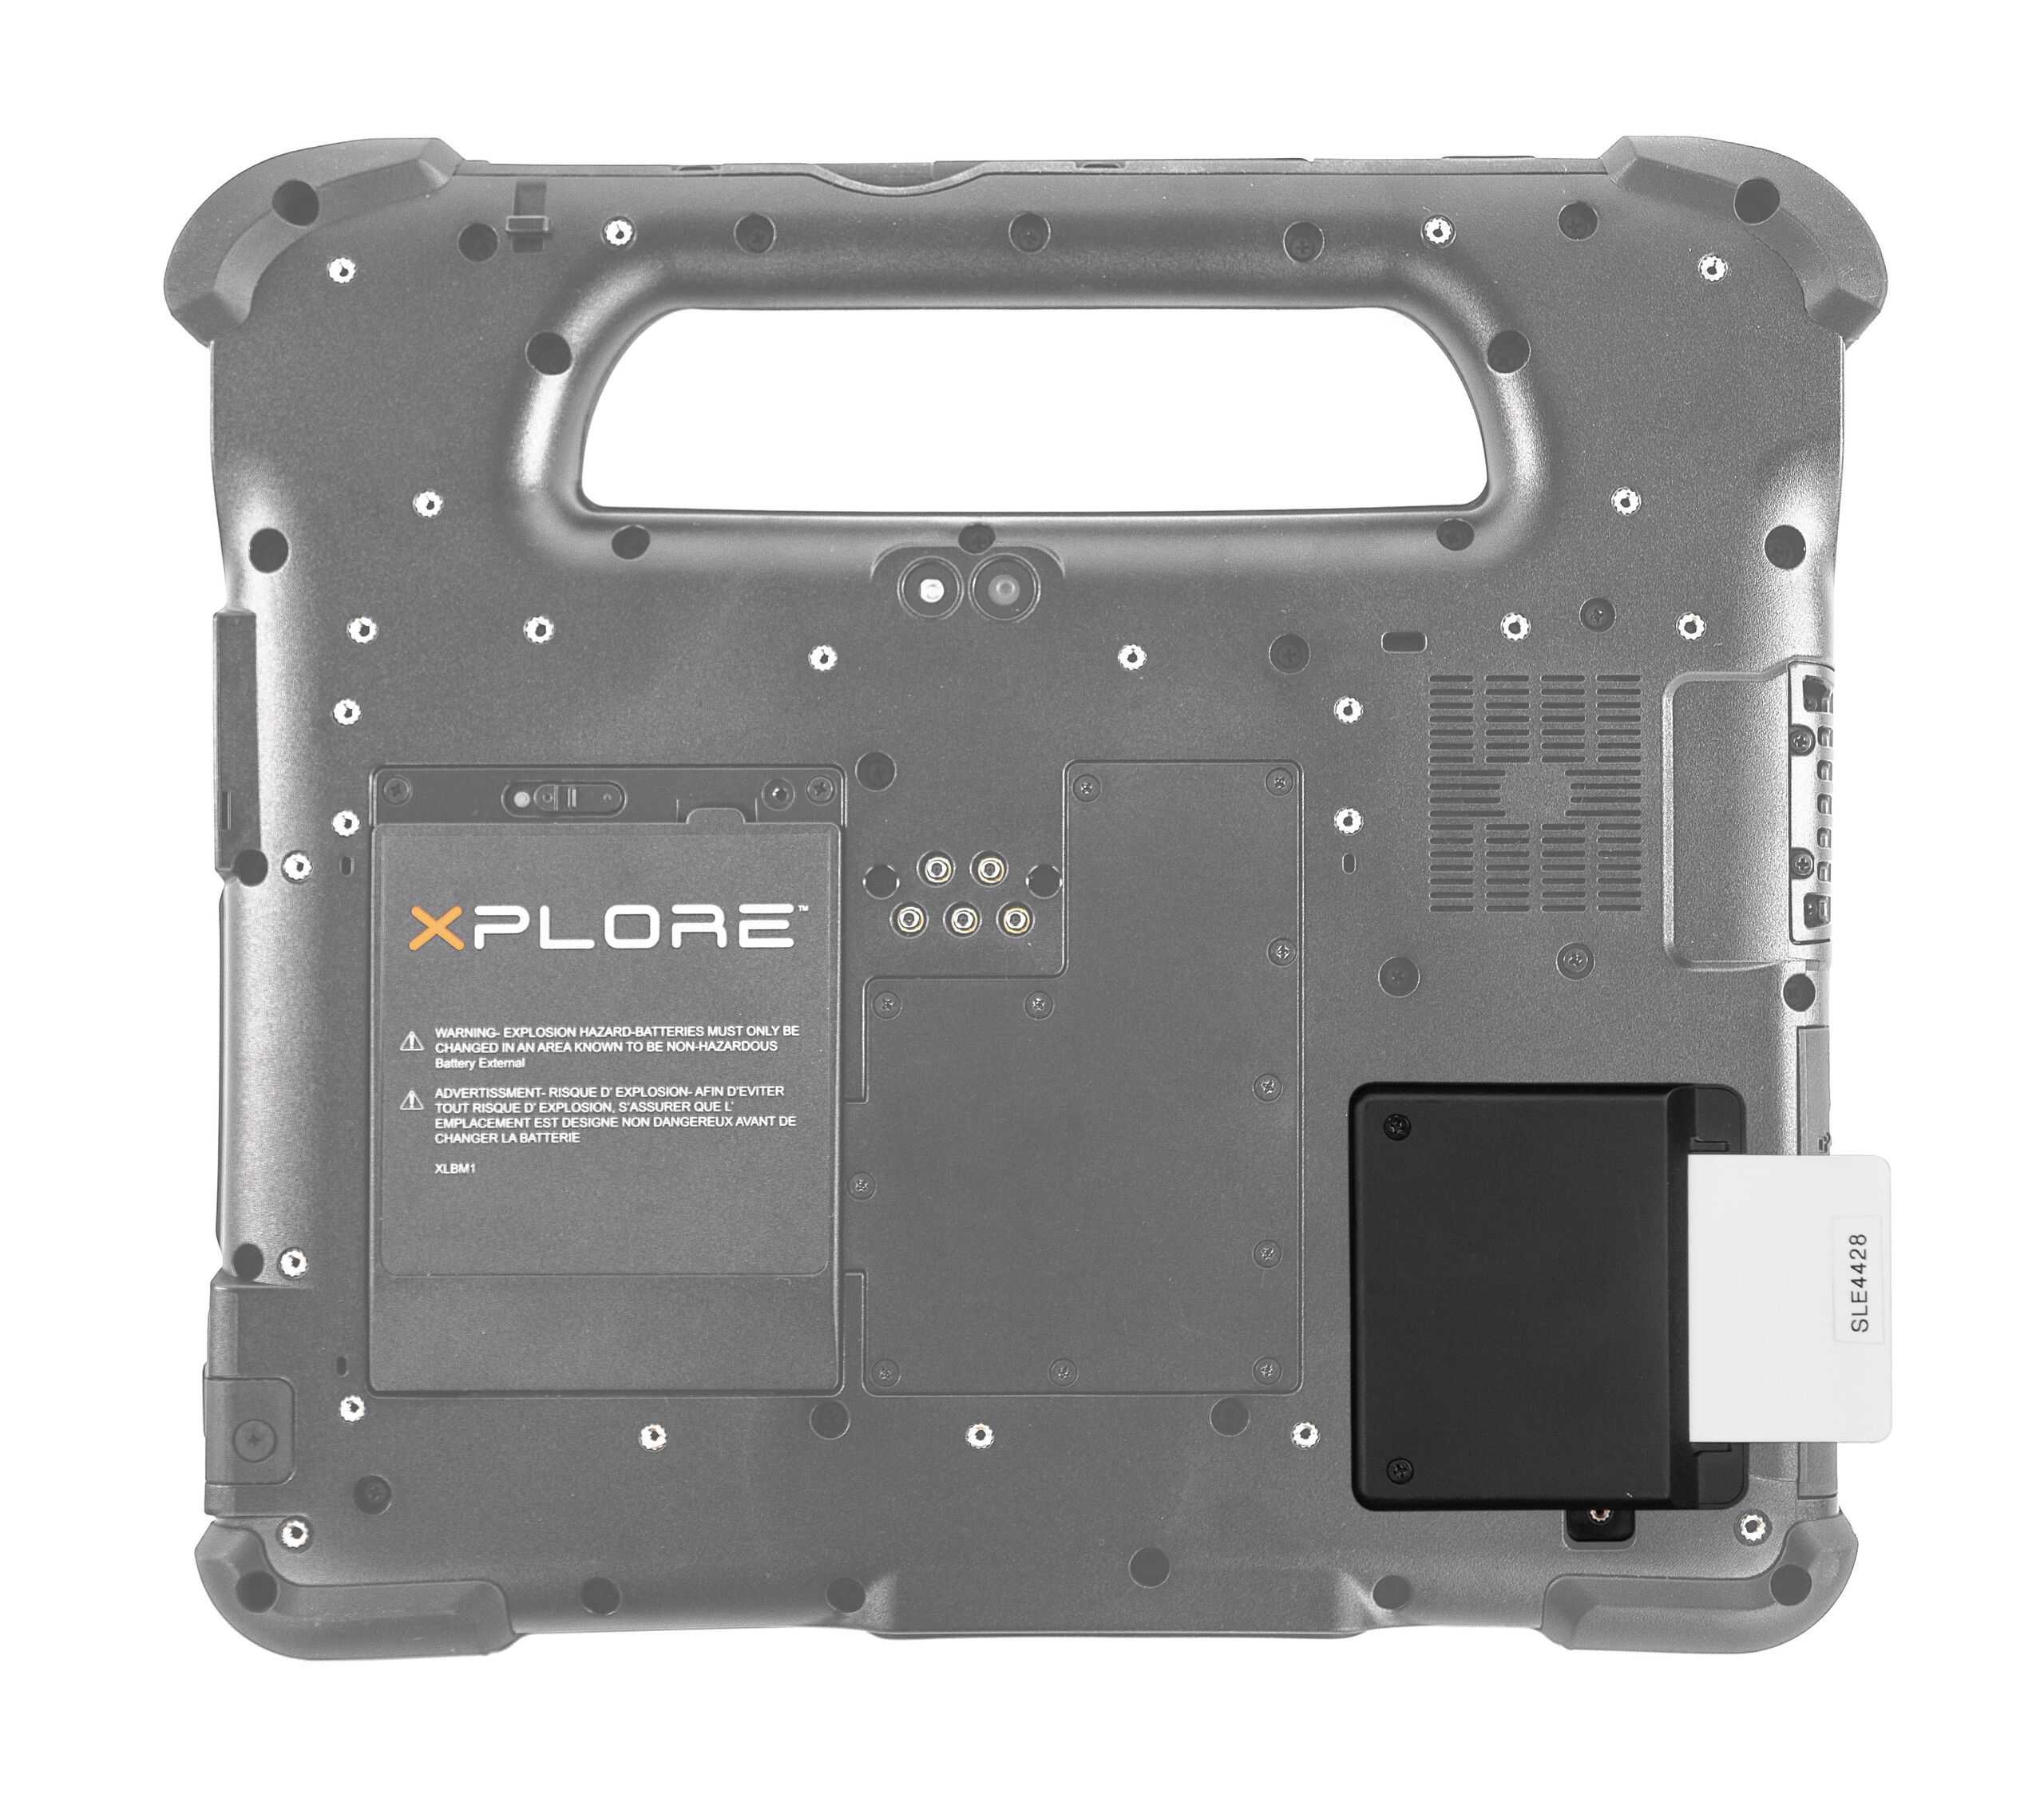
The bottom panel is secured by well over two dozen Philips screws. Smaller panels make SSD upgrades and cleaning easier if needed.
Warranty
The manufacturer includes a three-year limited warranty as standard whereas many other consumer devices top out at two years when no extensions are applied.
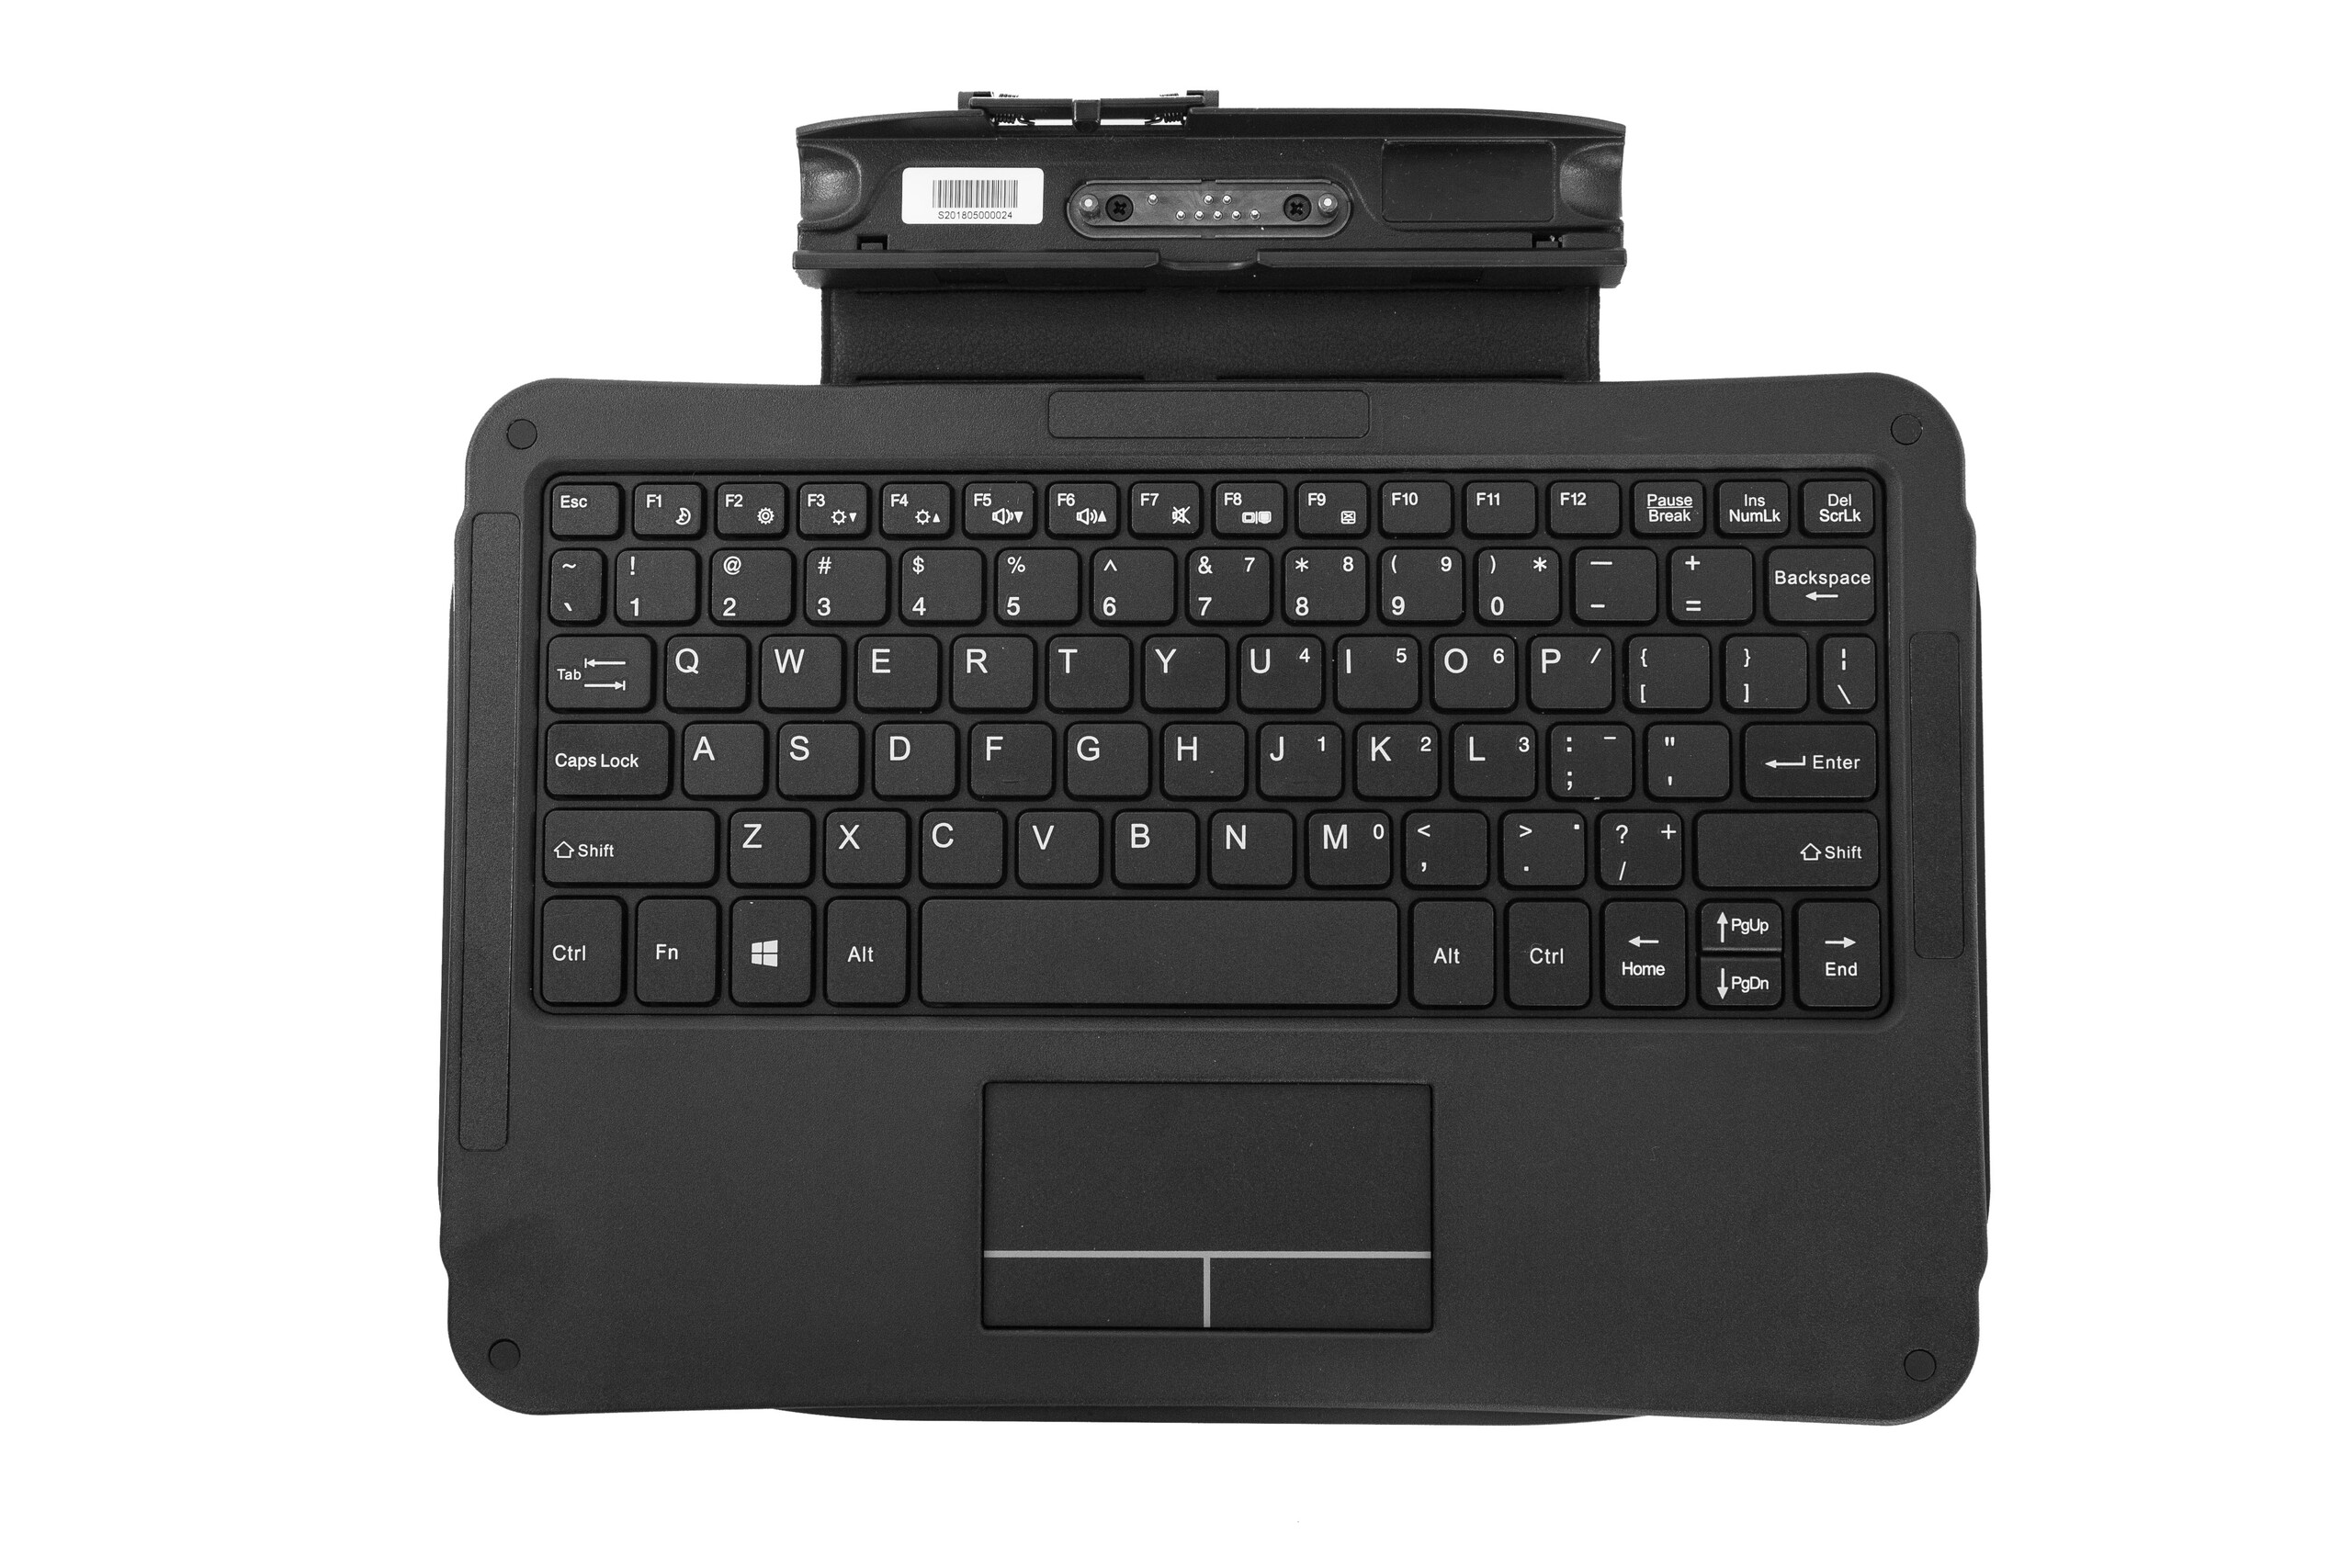
Input Devices
Touchscreen
The multi-touch touchscreen responds uniformly from one corner to the next as one would expect. The active WACOM stylus, however, could have been thicker and longer to better emulate a traditional ink pen. Even the WACOM digitizers for the Microsoft Surface or HP Spectre x360 series are thicker for easier gripping. Its coiled string attachment could have also been longer for more freedom of movement, but this is thankfully easy to replace if needed.
Icons and text are too small to tap accurately because of the dense PPI. We recommend enabling Windows scaling to increase the size of the UI and to boost visibility.
Display
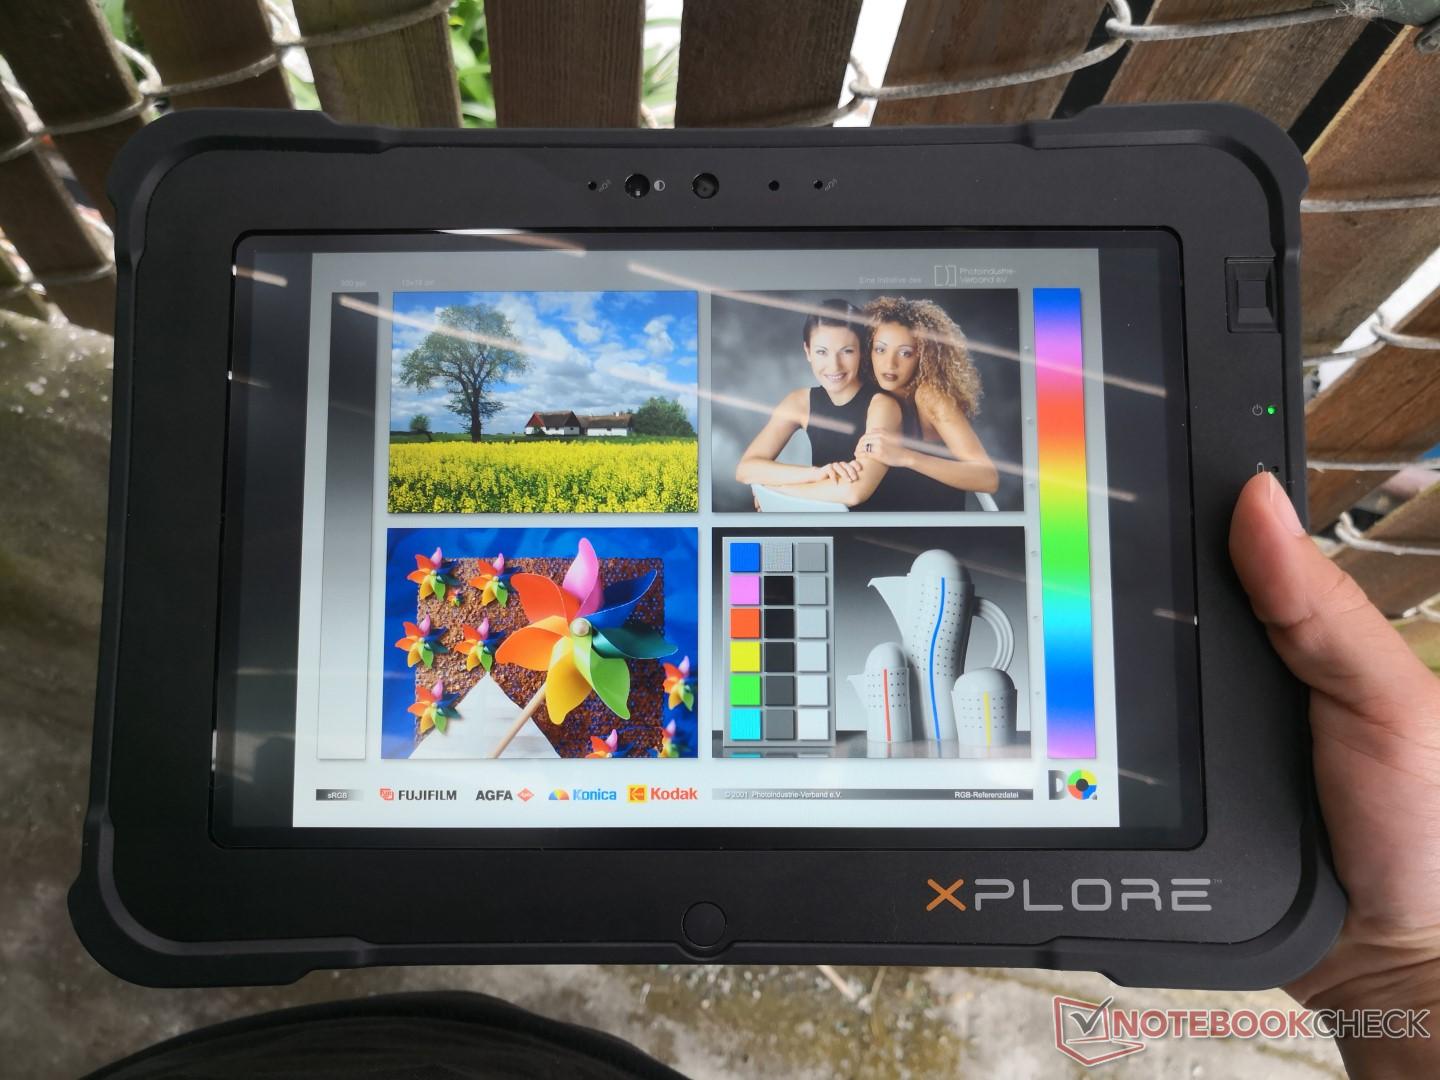
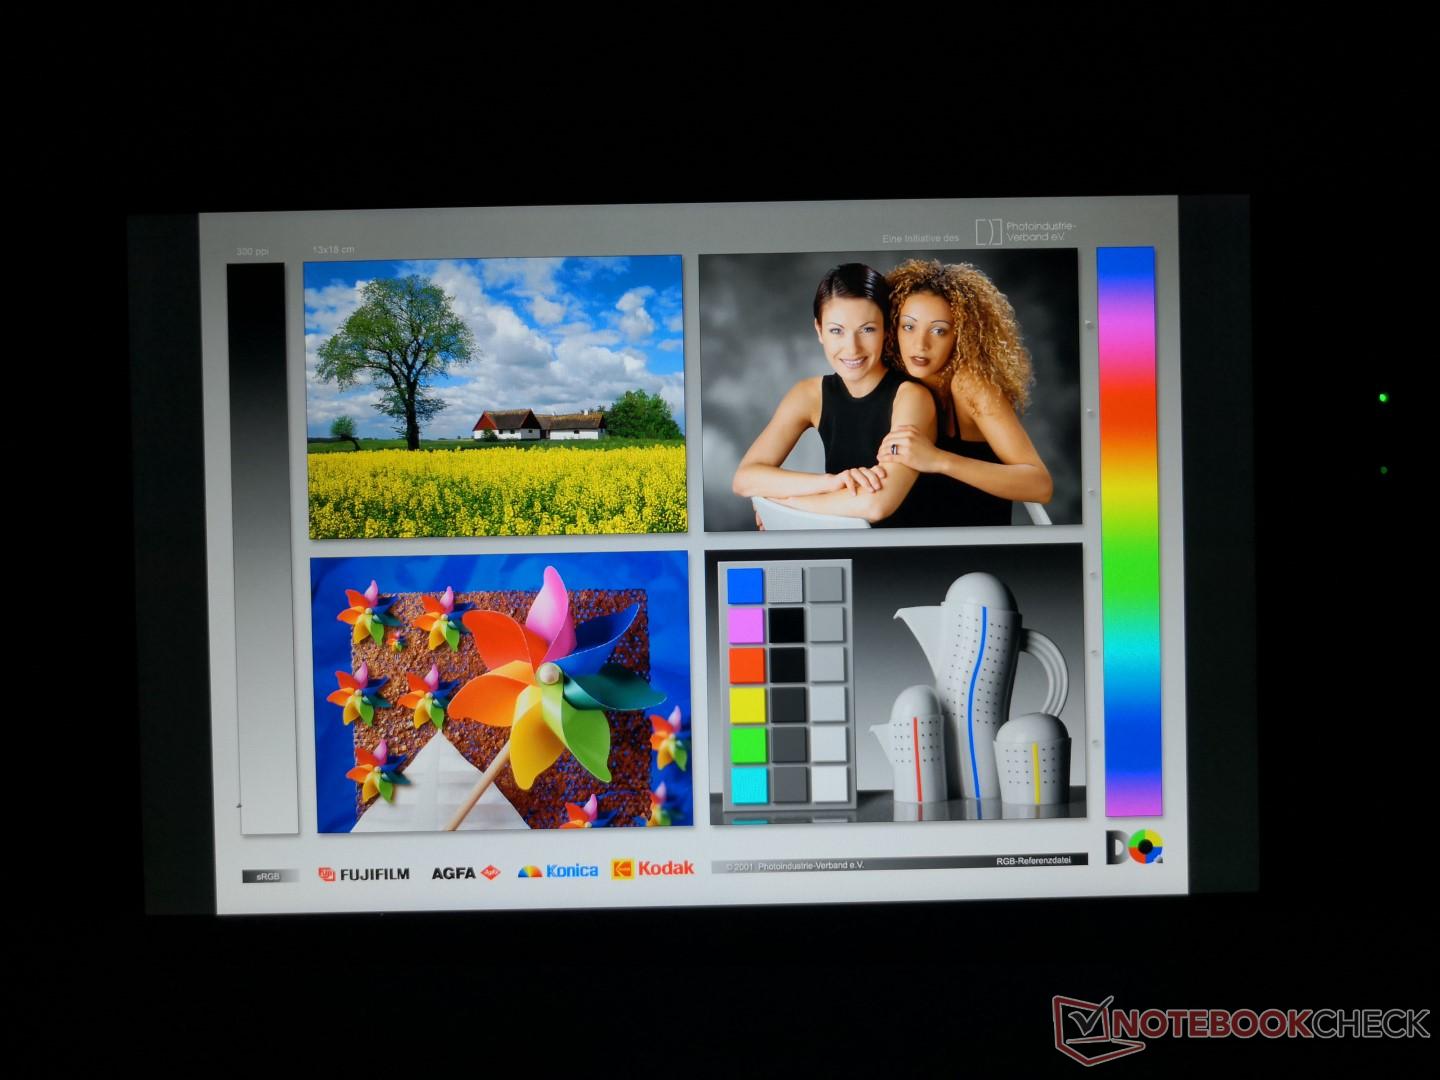
The 10.5-inch matte 1200p 16:10 display is a key attribute of the L10. The manufacturer is promising a very bright 1000-nit backlight in order to provide easy readability when outdoors. Our independent measurements reveal an average brightness of 1090 nits to be one of the brightest tablets we've ever tested. In comparison, the Apple iPad Pro 10.5, Dell Latitude 12 Rugged, and Panasonic Toughbook CF-XZ6 are each only about half as bright when set to their respective maximums. Contrast is also very good at just over 1000:1 and onscreen content is sharp with only light-moderate grains because of the thick matte overlay. Consumer tablets from Apple and Samsung have crisper and more colorful displays because of their glossy overlays and thinner Gorilla Glass protection.
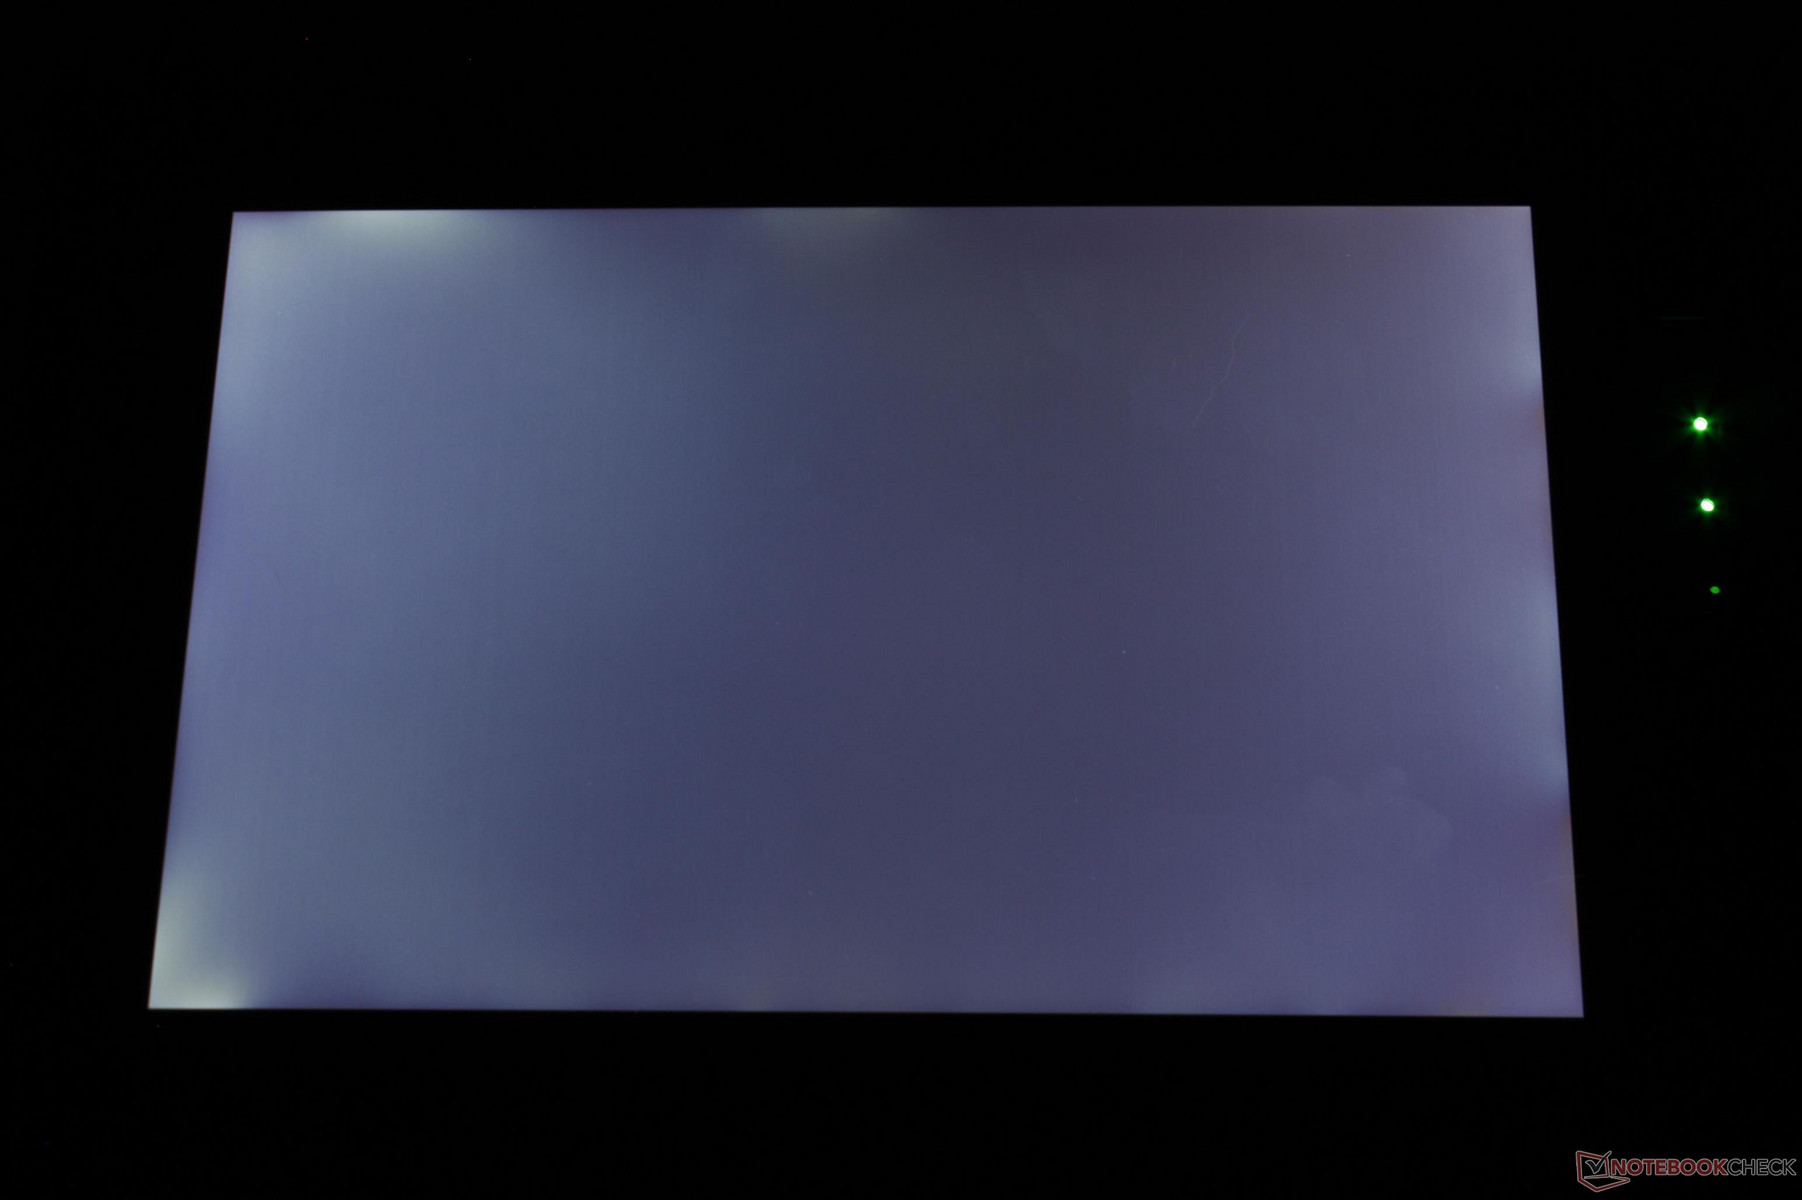
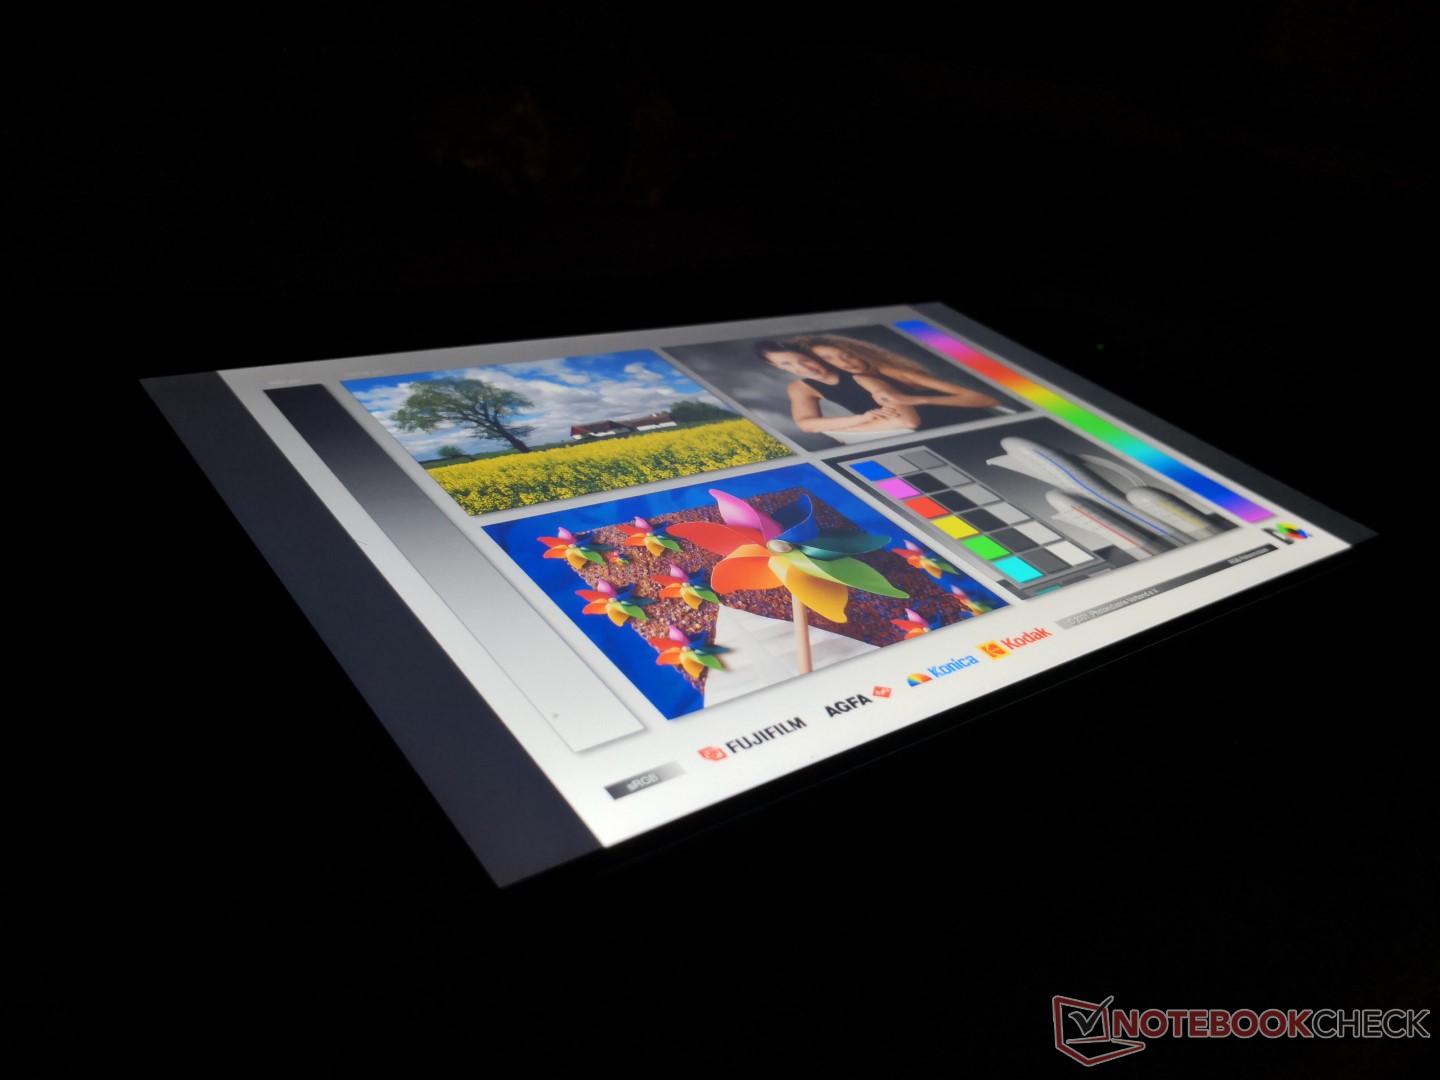
The very high brightness accentuates a couple of issues. First, there is heavy backlight bleeding around the edges and corners as shown by our snapshot below. It's generally unnoticeable unless if the application has darkened borders such as DOS or during movie playback. Secondly, the panel backlight exhibits pulse-width modulation at all brightness levels up to 99 percent. Users who may be sensitive to onscreen flickering may want to be wary of using the L10 for an extended duration.
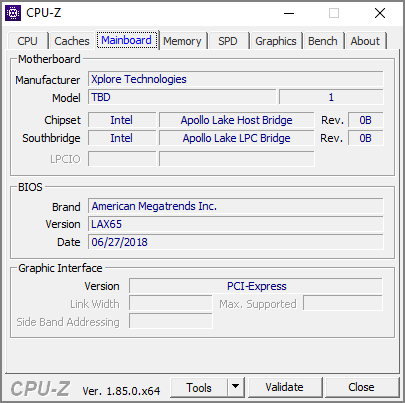
Hardware statistics software like HWiNFO are unable to identify the panel name or source.

| |||||||||||||||||||||||||
Brightness Distribution: 88 %
Center on Battery: 1145.9 cd/m²
Contrast: 1014:1 (Black: 1.13 cd/m²)
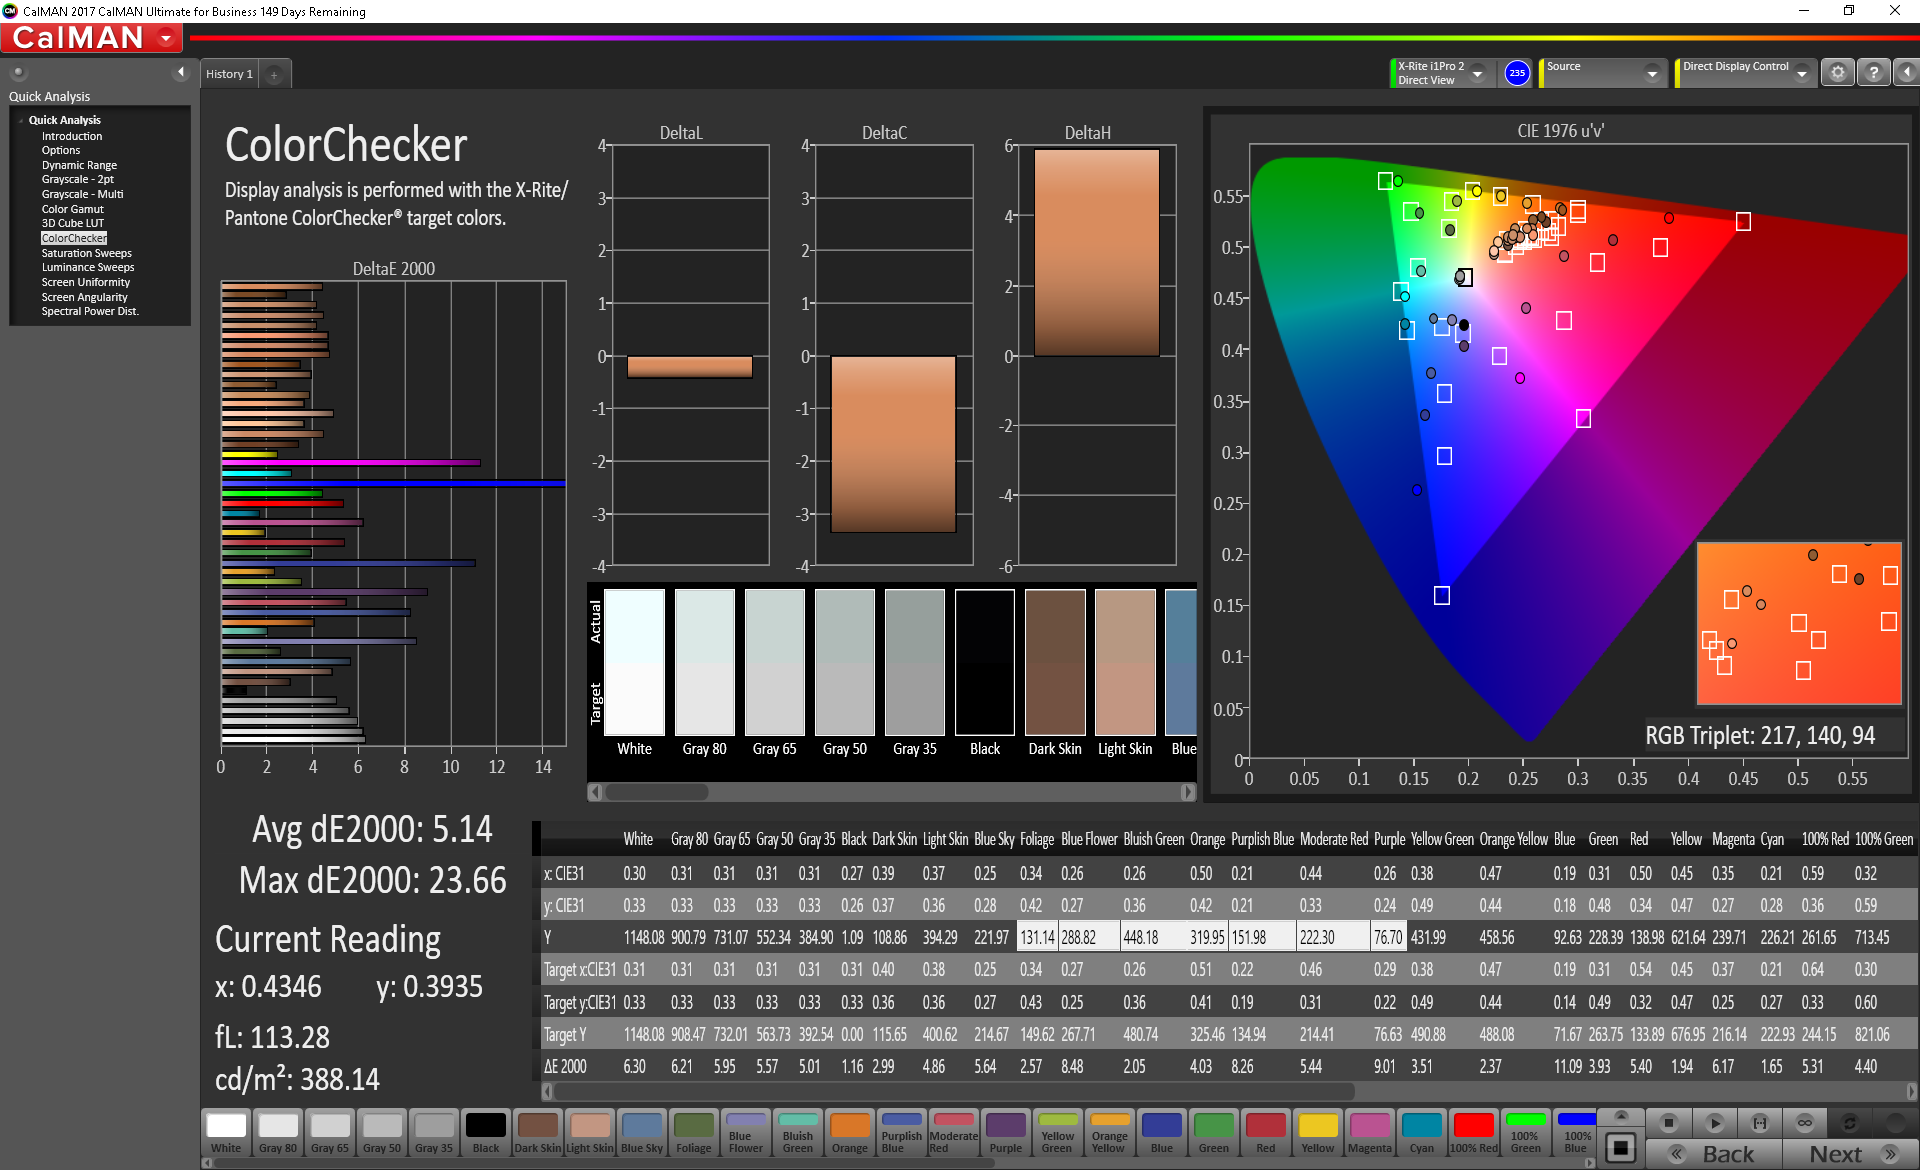
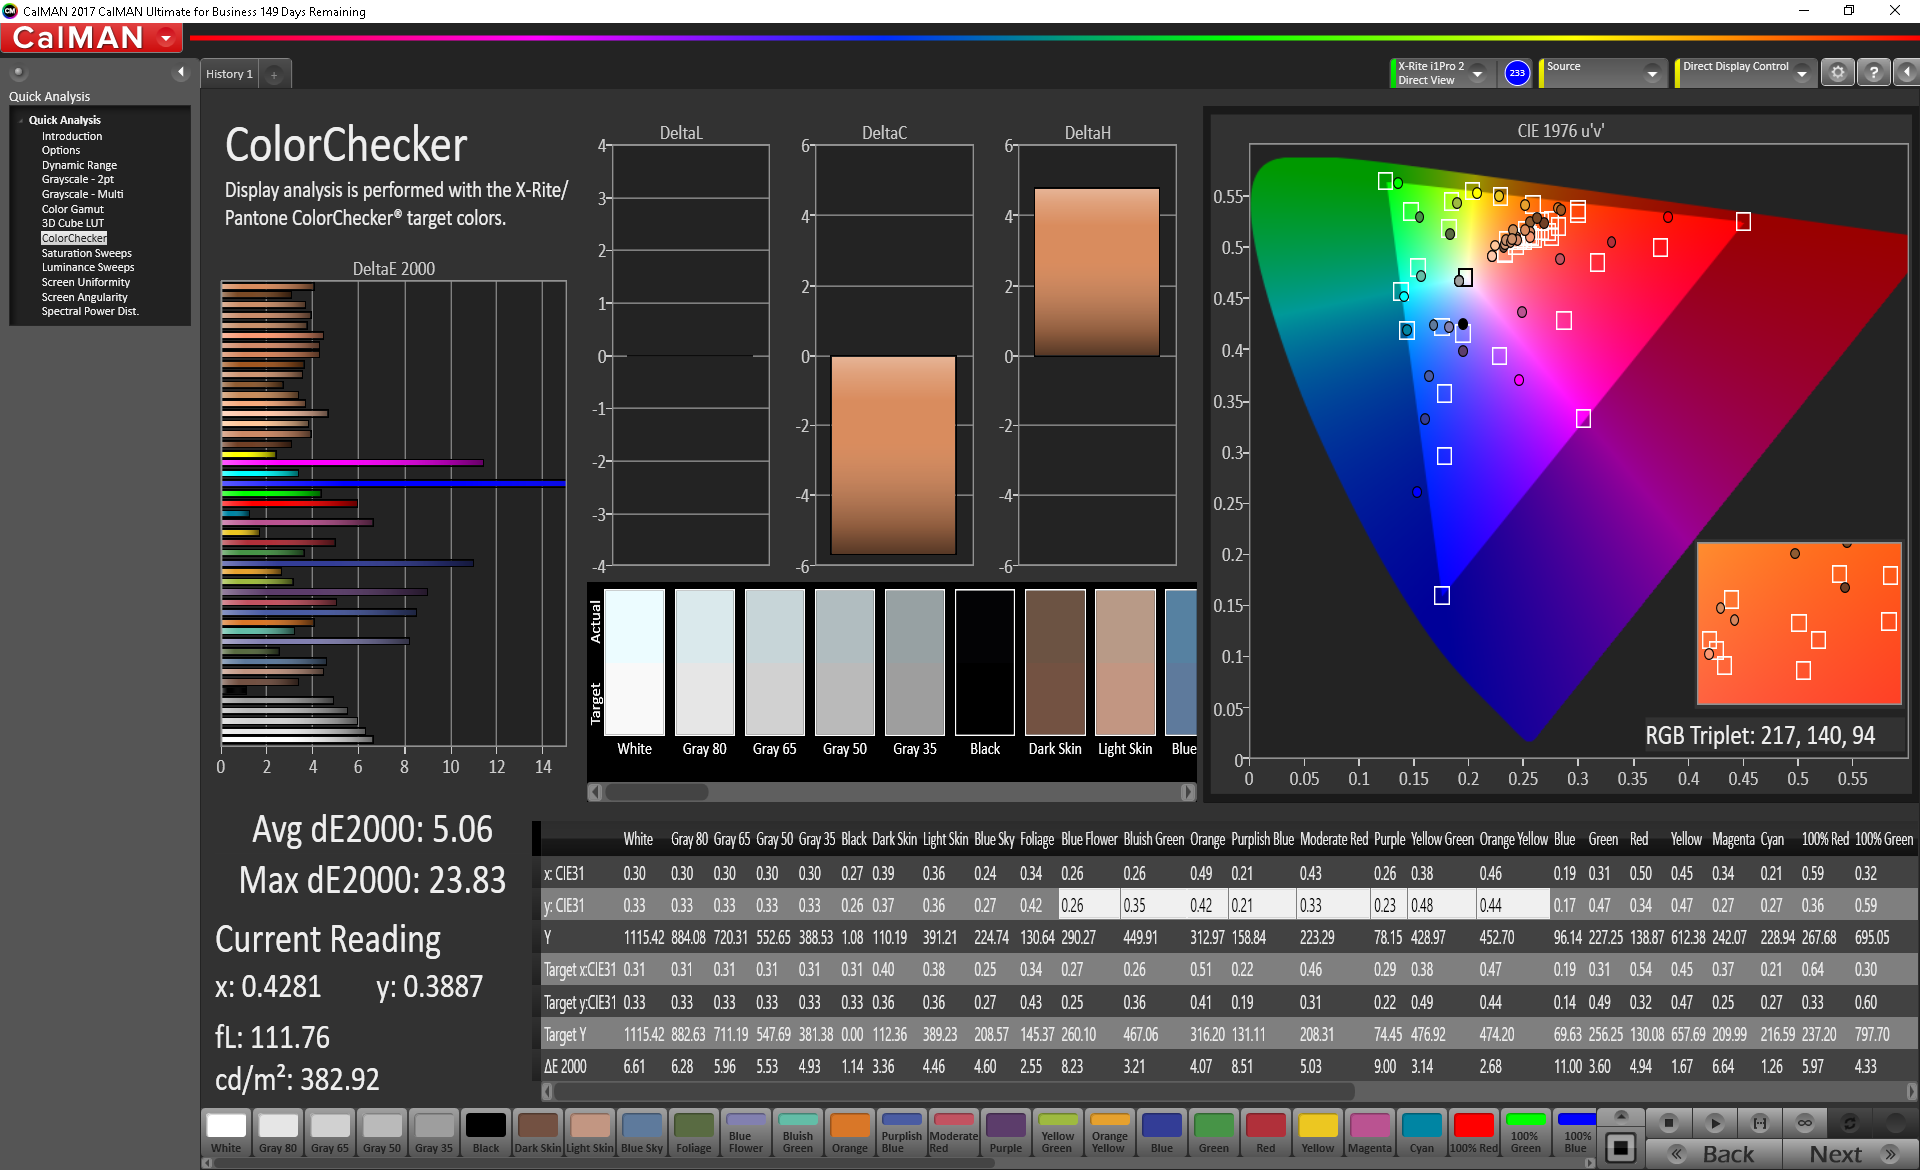
ΔE ColorChecker Calman: 5.14 | ∀{0.5-29.43 Ø4.71}
calibrated: 5.06
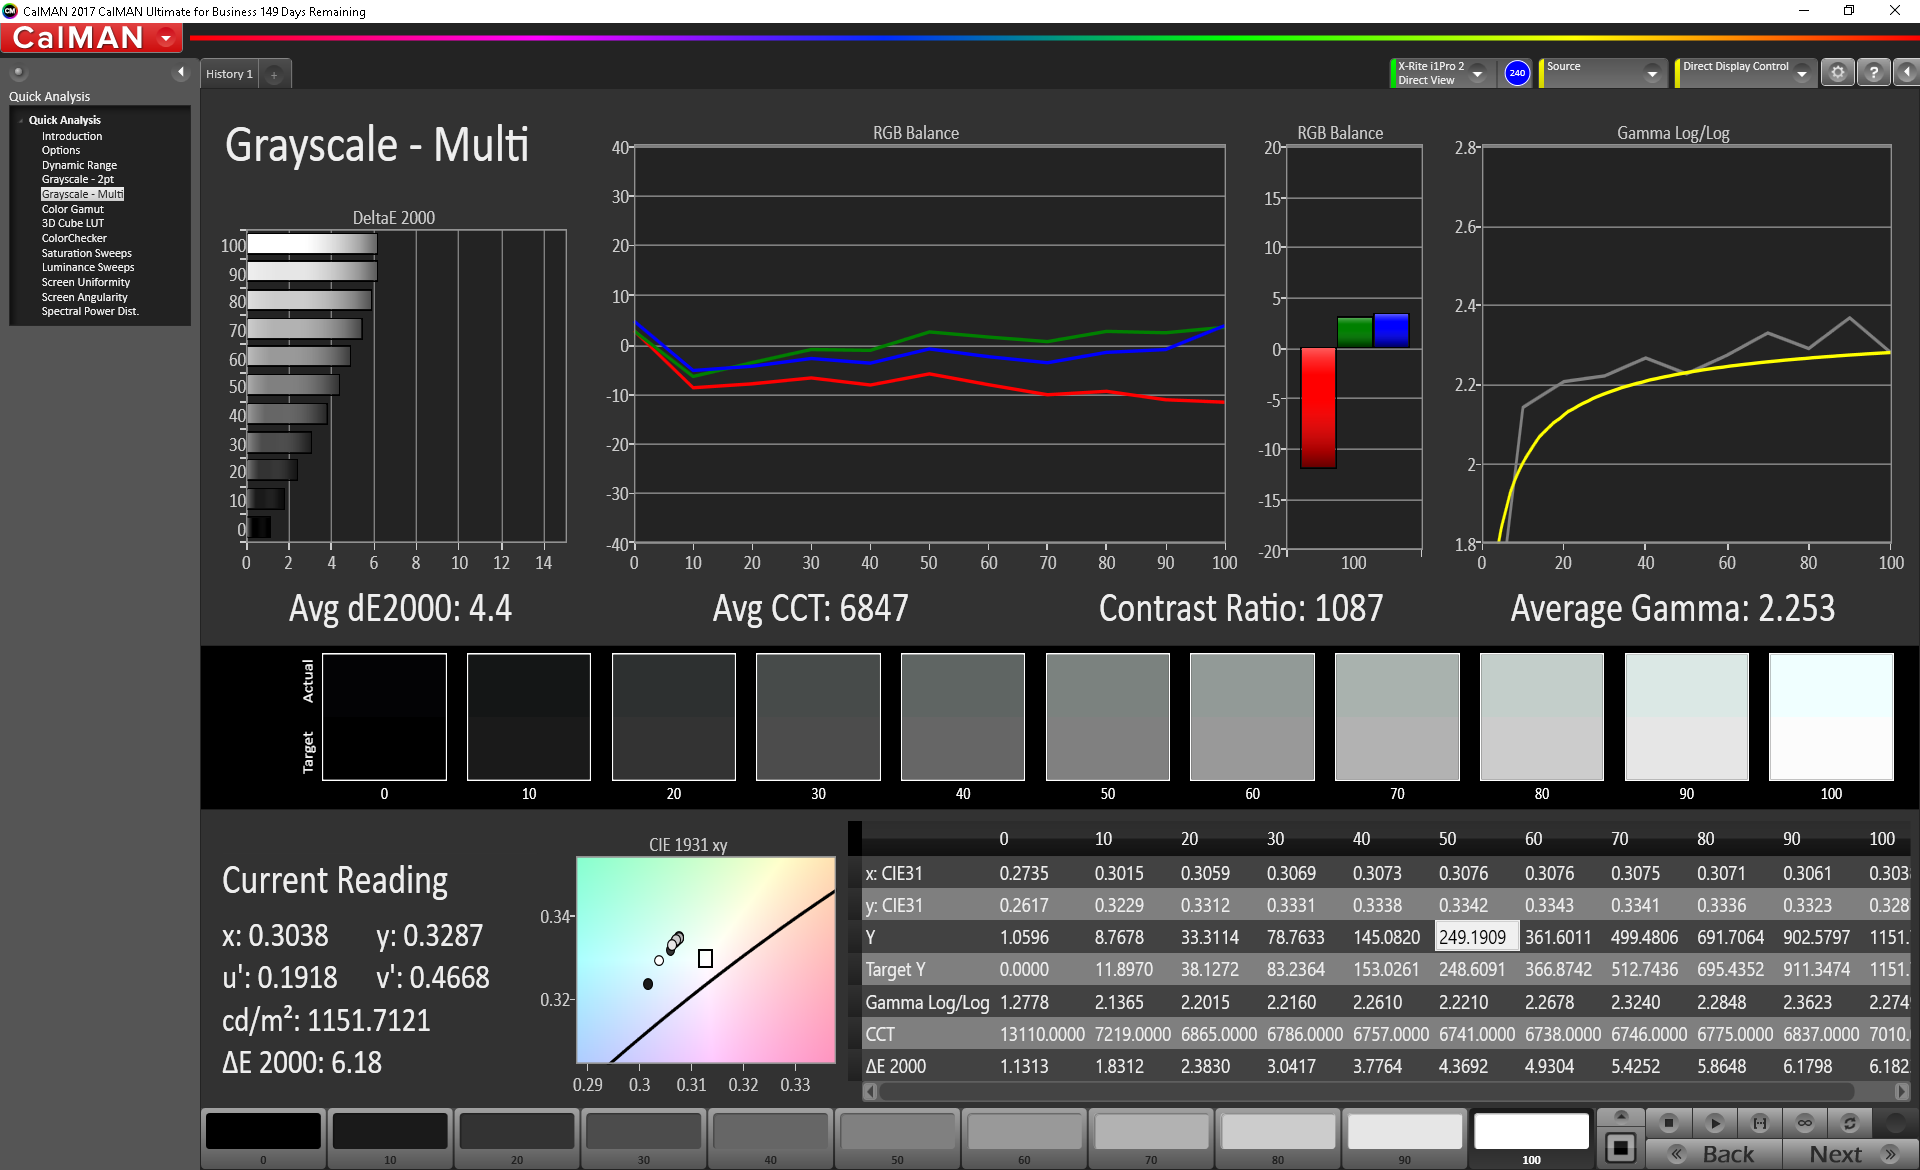
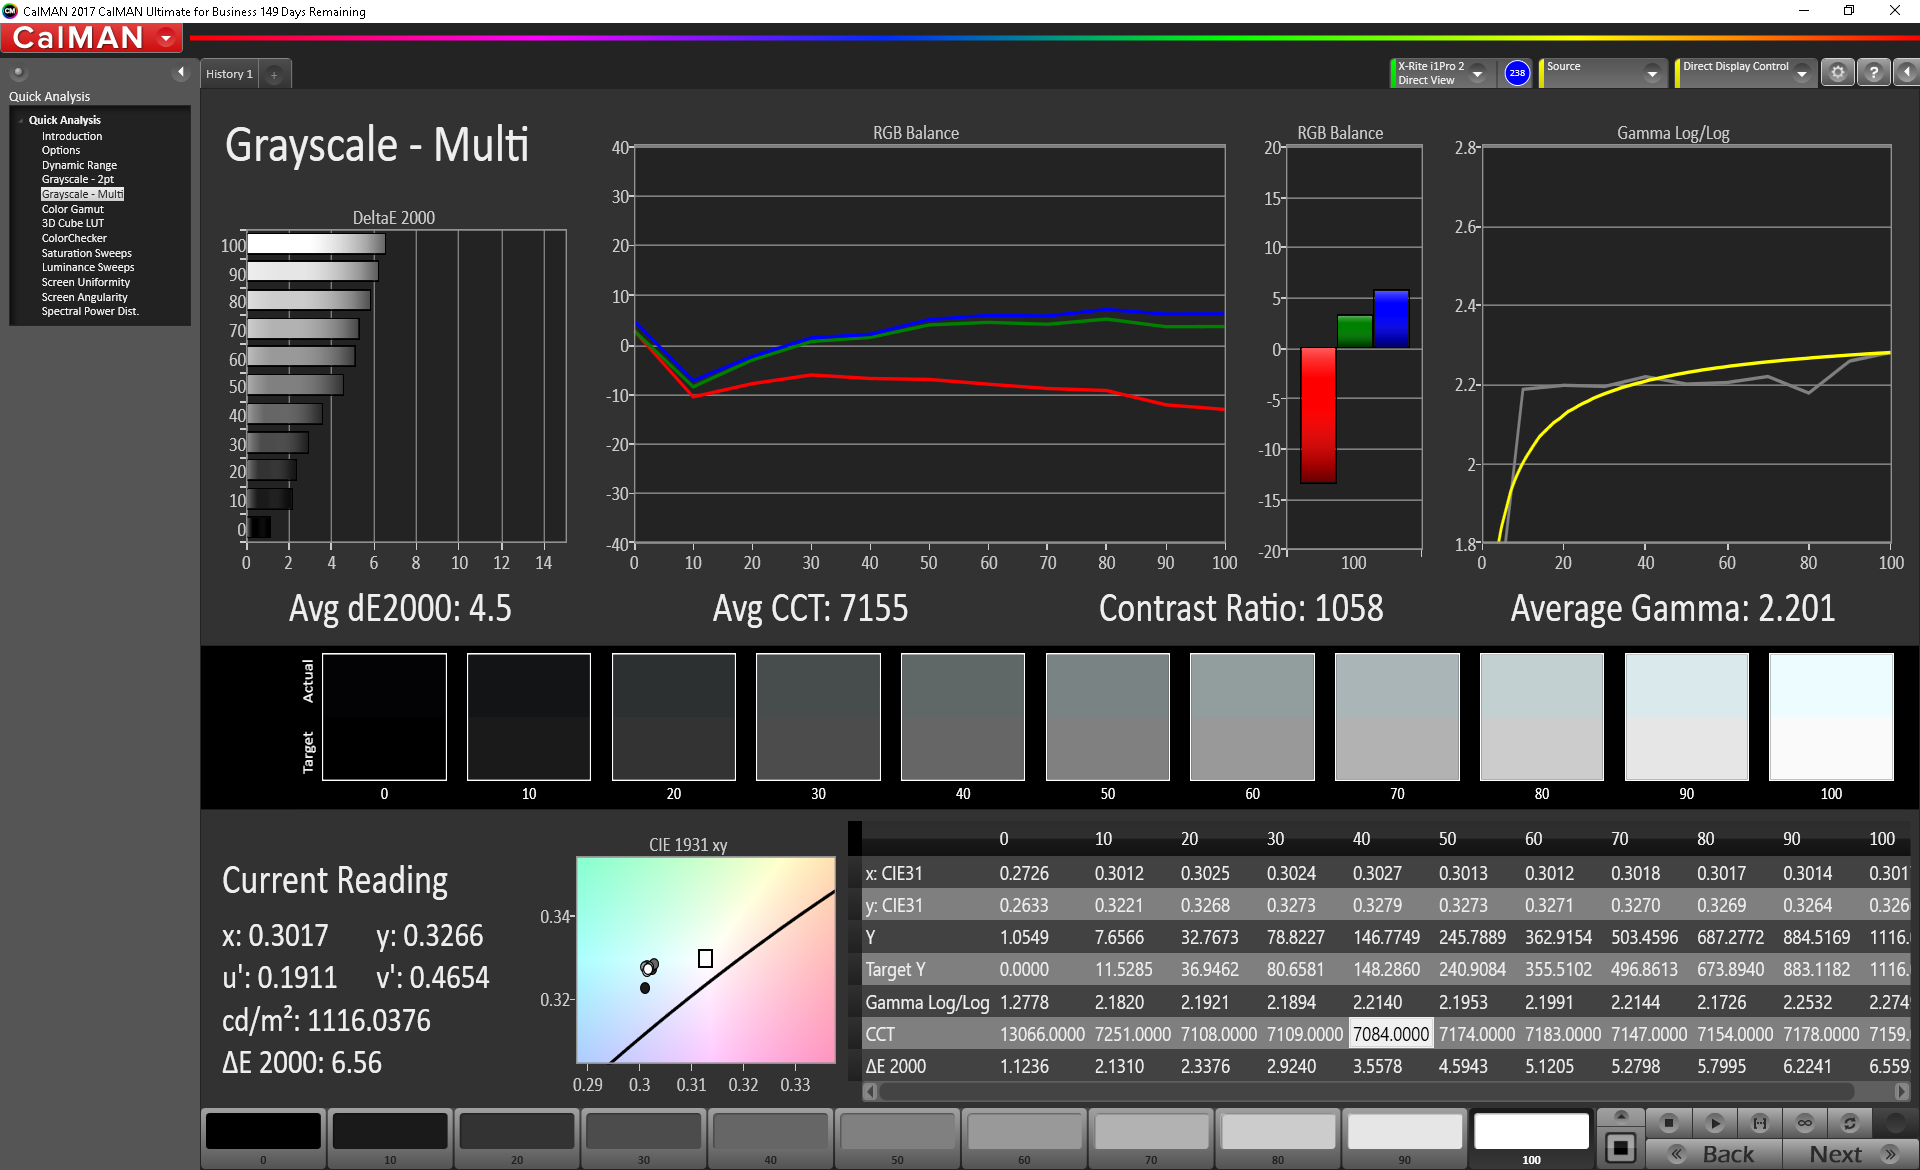
ΔE Greyscale Calman: 4.4 | ∀{0.09-98 Ø4.96}
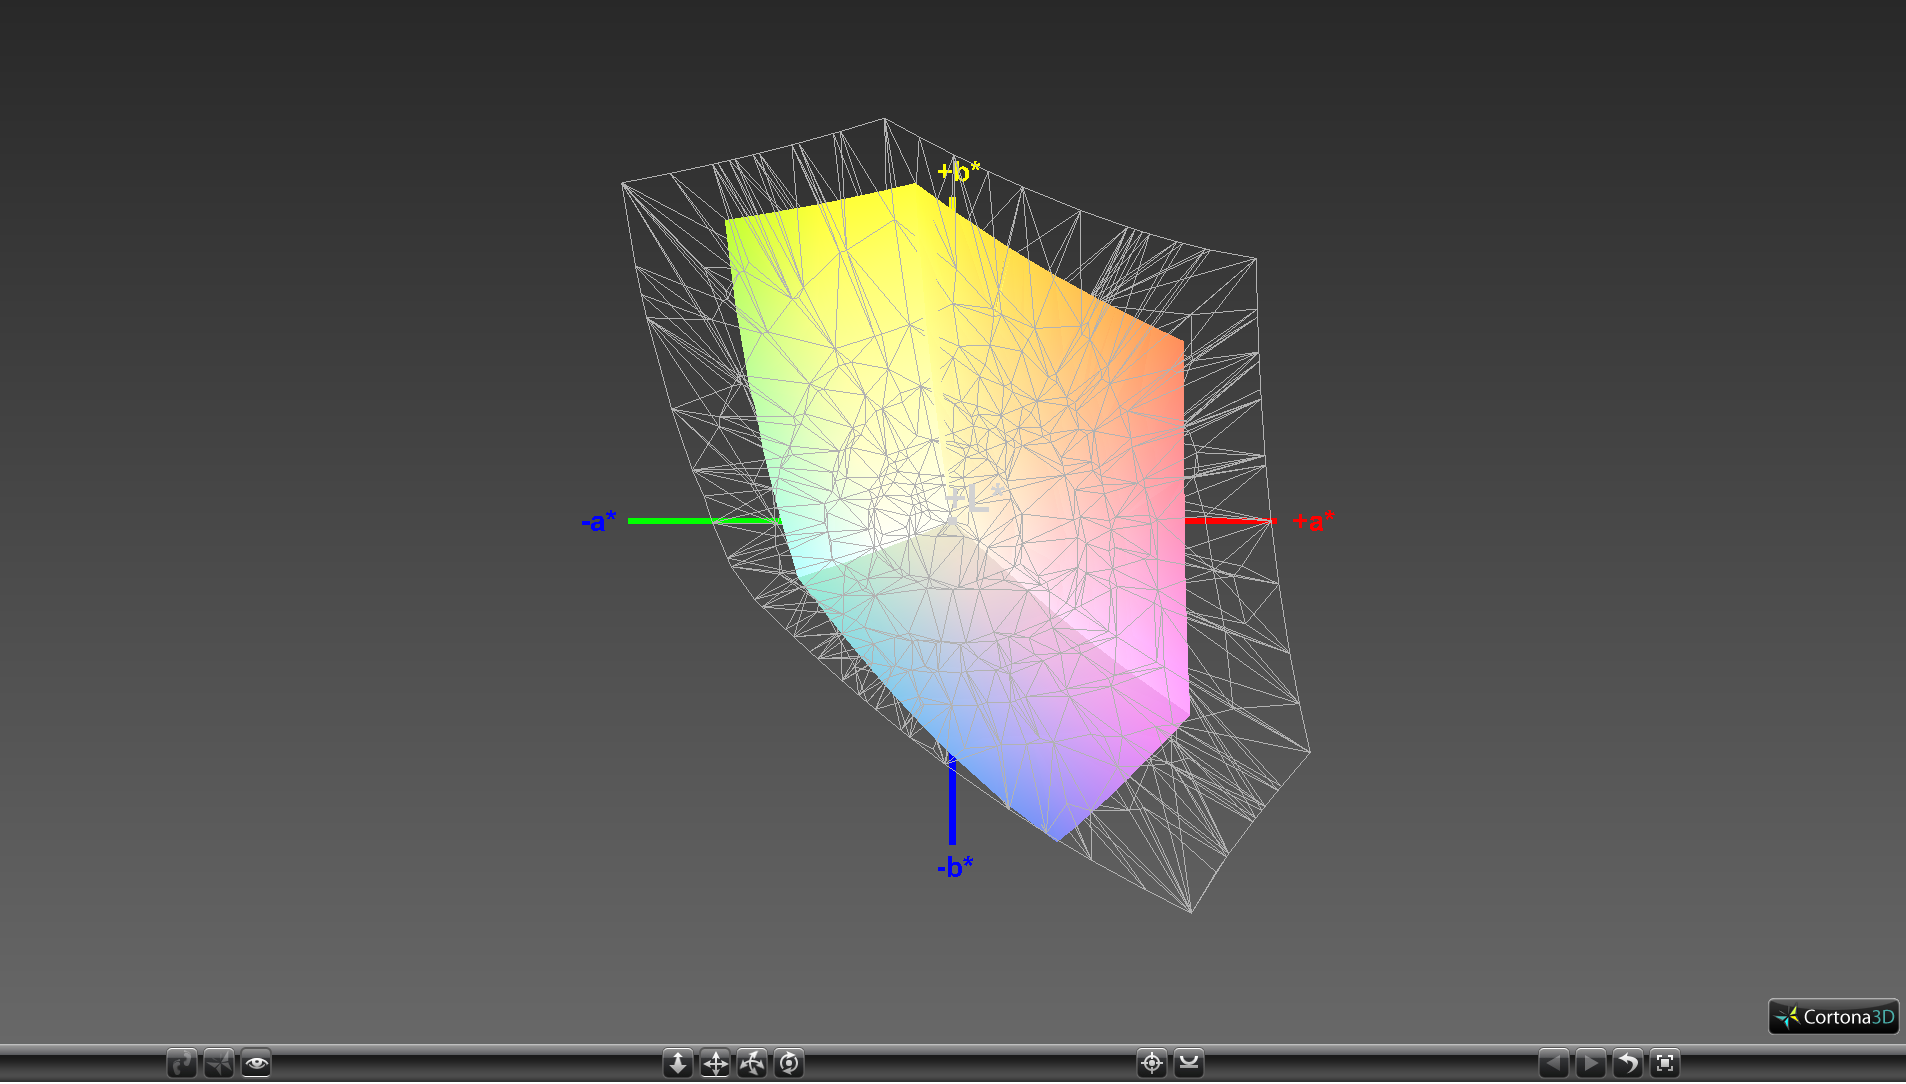
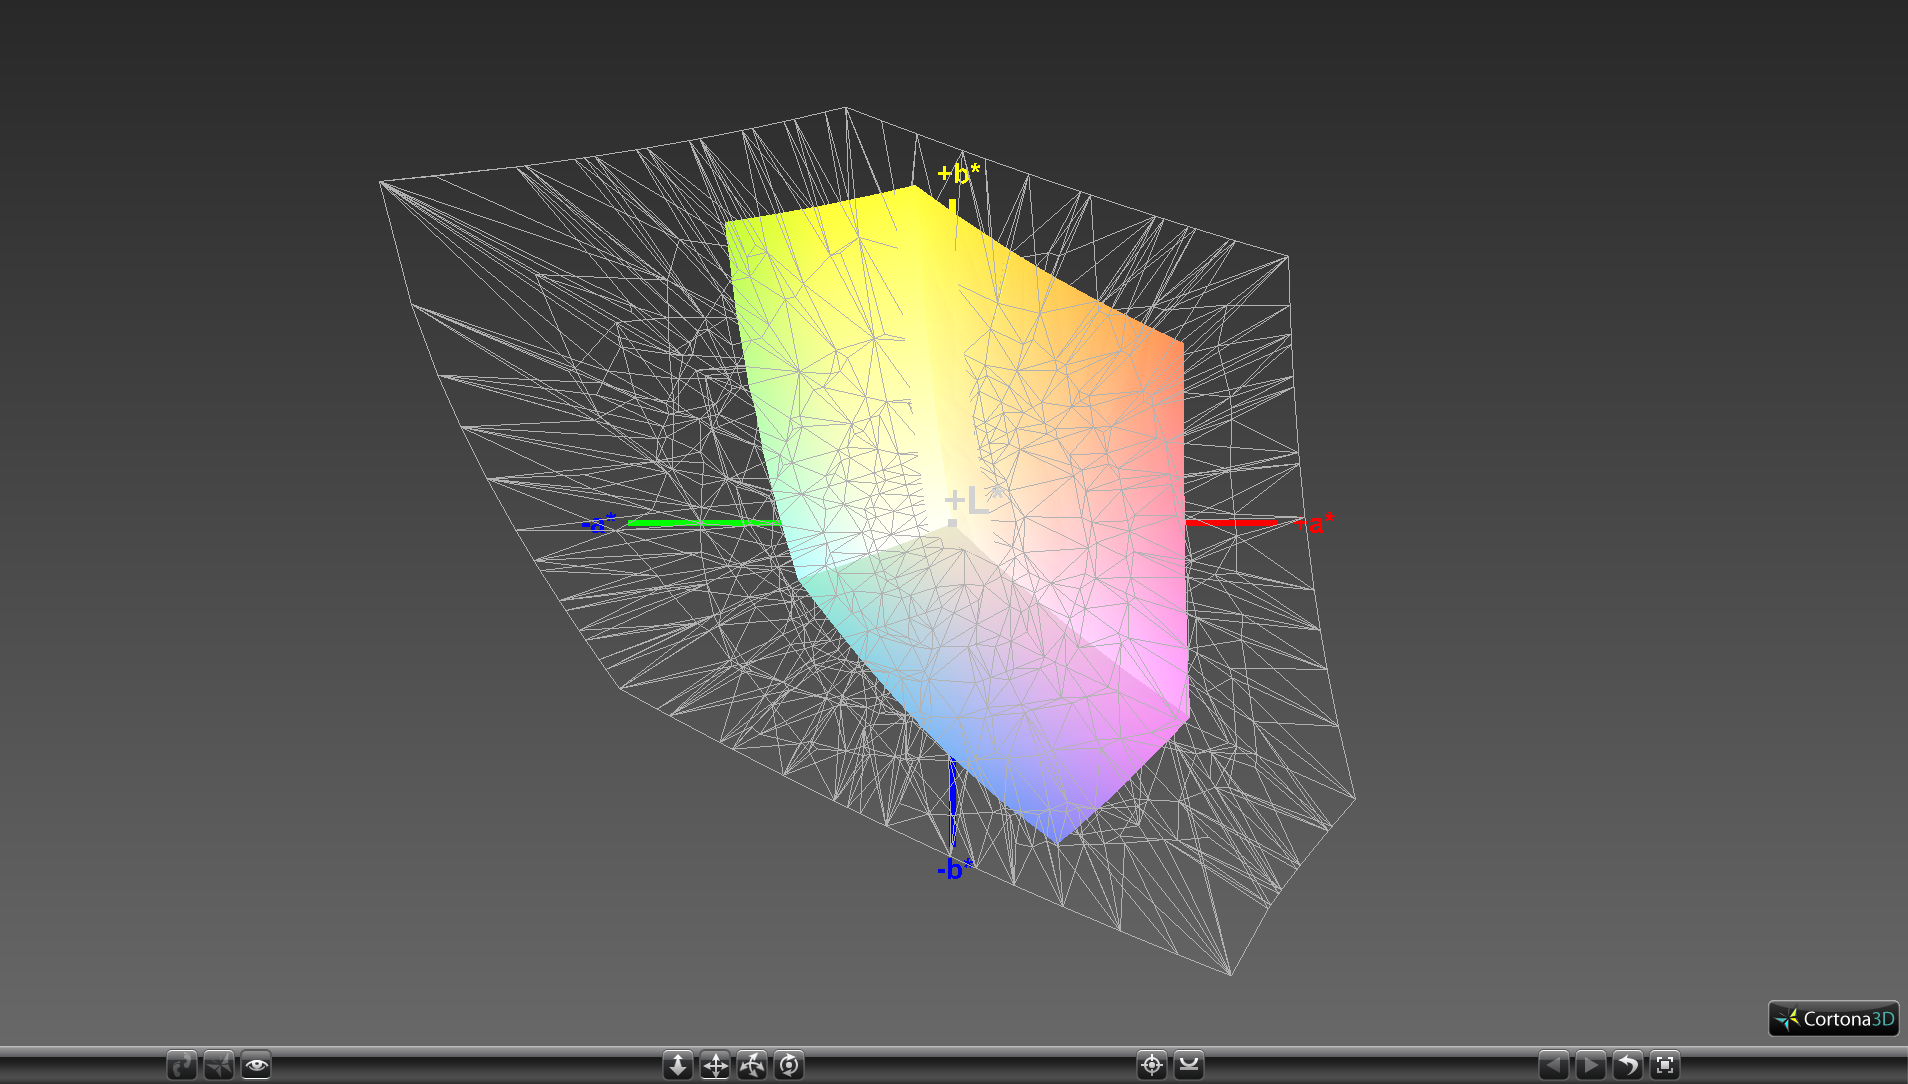
67.2% sRGB (Argyll 1.6.3 3D)
42.8% AdobeRGB 1998 (Argyll 1.6.3 3D)
47.29% AdobeRGB 1998 (Argyll 3D)
68.1% sRGB (Argyll 3D)
45.72% Display P3 (Argyll 3D)
Gamma: 2.25
CCT: 6847 K
| Xploretech XSLATE L10 IPS, 10.1", 1920x1200 | Apple iPad Pro 10.5 2017 IPS, 10.5", 2224x1668 | Dell Latitude 12 Rugged Tablet Sharp SHP1417 LQ116K1, TN, 11.6", 1366x768 | Dell Latitude 14 7414 Rugged Extreme Sharp LQ140K1, IPS, 14", 1366x768 | Panasonic Toughbook CF-XZ6 Semi-Matte Beschichtung, IPS LED, 12", 2160x1440 | Dell Latitude 3490 LP140WF6 / LGD059D, IPS LED, 14", 1920x1080 | |
|---|---|---|---|---|---|---|
| Display | -21% | -19% | 2% | -13% | ||
| Display P3 Coverage (%) | 45.72 | 36.06 -21% | 37.22 -19% | 46.47 2% | 39.81 -13% | |
| sRGB Coverage (%) | 68.1 | 54 -21% | 55.8 -18% | 70 3% | 59.6 -12% | |
| AdobeRGB 1998 Coverage (%) | 47.29 | 37.29 -21% | 38.49 -19% | 48.01 2% | 41.16 -13% | |
| Response Times | -5% | -33% | -35% | -16% | ||
| Response Time Grey 50% / Grey 80% * (ms) | 32.8 ? | 39.6 ? -21% | 43 ? -31% | 39 ? -19% | 36.4 ? -11% | |
| Response Time Black / White * (ms) | 20 ? | 17.6 ? 12% | 27 ? -35% | 30 ? -50% | 24 ? -20% | |
| PWM Frequency (Hz) | 200 ? | 200 ? | 694 ? | |||
| Screen | 27% | -37% | -36% | 3% | -8% | |
| Brightness middle (cd/m²) | 1145.9 | 634 -45% | 632 -45% | 493 -57% | 565 -51% | 250 -78% |
| Brightness (cd/m²) | 1090 | 625 -43% | 613 -44% | 456 -58% | 538 -51% | 241 -78% |
| Brightness Distribution (%) | 88 | 87 -1% | 90 2% | 81 -8% | 82 -7% | 81 -8% |
| Black Level * (cd/m²) | 1.13 | 0.39 65% | 0.47 58% | 0.53 53% | 0.4 65% | 0.25 78% |
| Contrast (:1) | 1014 | 1626 60% | 1345 33% | 930 -8% | 1413 39% | 1000 -1% |
| Colorchecker dE 2000 * | 5.14 | 1.9 63% | 11.22 -118% | 11.08 -116% | 5.06 2% | 5.5 -7% |
| Colorchecker dE 2000 max. * | 23.66 | 3.9 84% | 15.11 36% | 8.1 66% | 23.5 1% | |
| Colorchecker dE 2000 calibrated * | 5.06 | 4.8 5% | ||||
| Greyscale dE 2000 * | 4.4 | 2.8 36% | 12.19 -177% | 11.99 -172% | 6.4 -45% | 3.5 20% |
| Gamma | 2.25 98% | 2.26 97% | 3.4 65% | 4.03 55% | 2.25 98% | 2.27 97% |
| CCT | 6847 95% | 7027 93% | 1256 518% | 10872 60% | 5794 112% | 7049 92% |
| Color Space (Percent of AdobeRGB 1998) (%) | 42.8 | 35 -18% | 36 -16% | 44 3% | 37.9 -11% | |
| Color Space (Percent of sRGB) (%) | 67.2 | 54 -20% | 56 -17% | 70 4% | 59.4 -12% | |
| Total Average (Program / Settings) | 11% /
21% | -29% /
-33% | -29% /
-32% | -10% /
-2% | -12% /
-10% |
* ... smaller is better
The panel is capable of reproducing approximately 43 percent and 67 percent of the AdobeRGB and sRGB standards, respectively, to be comparable to most budget laptops. Flagship Ultrabooks and Android tablets commonly cover over 90 percent of sRGB for deeper and more accurate colors.
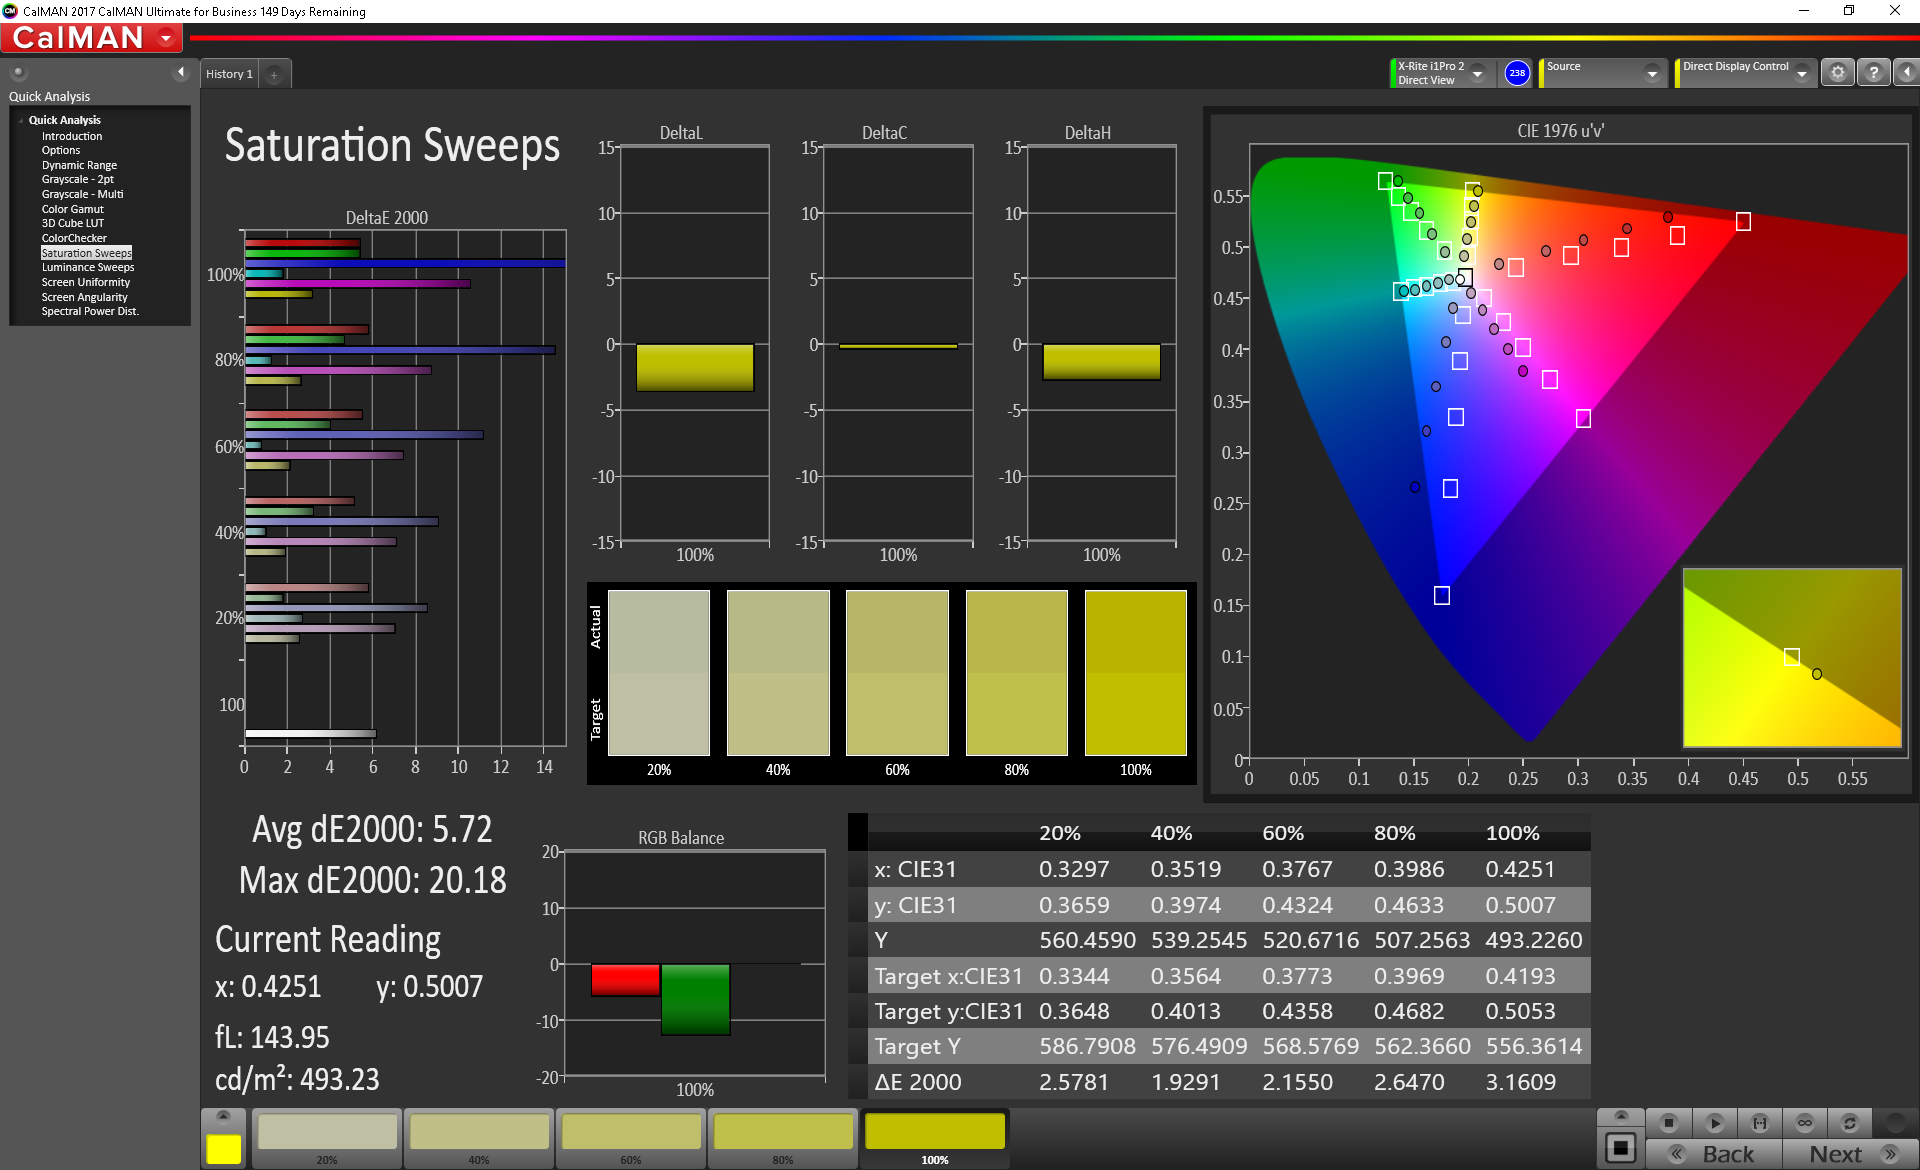
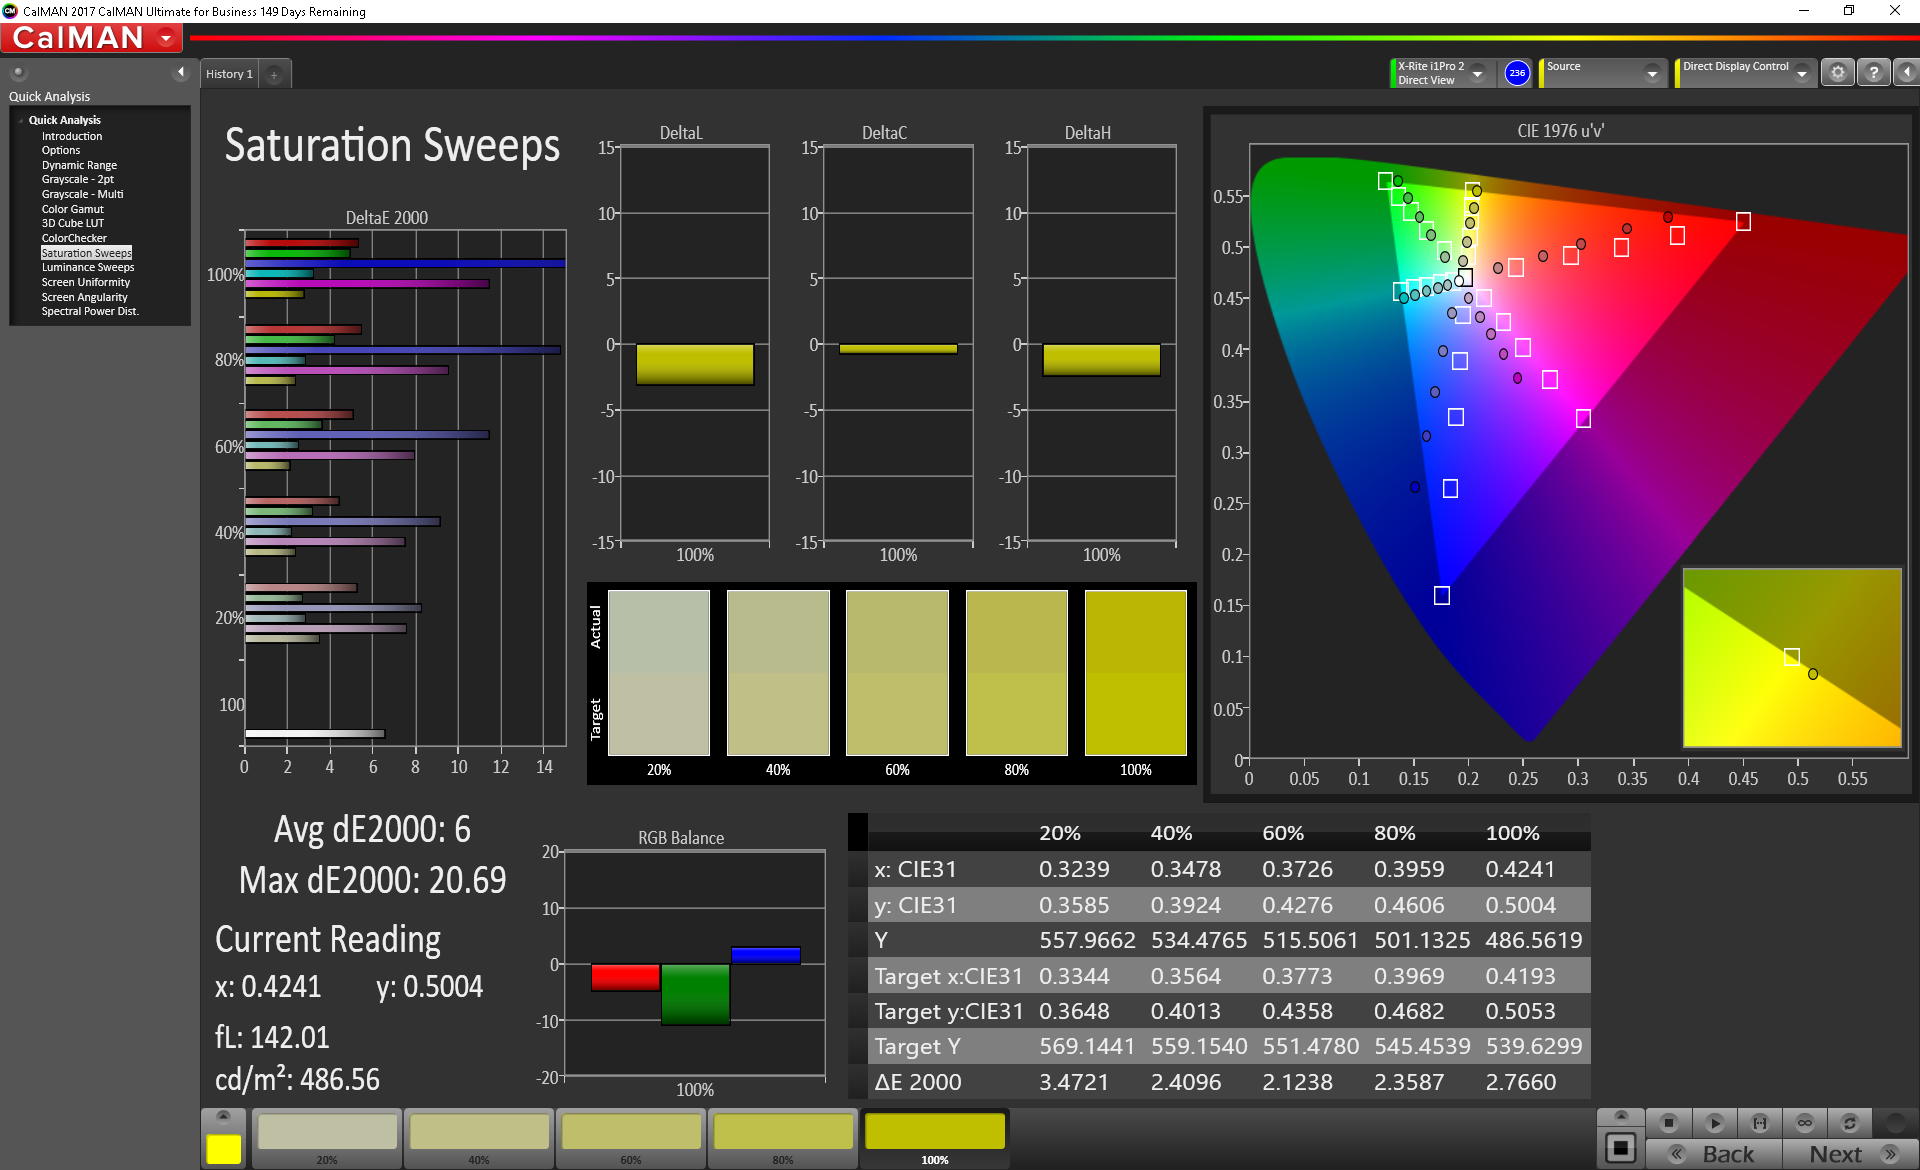
Further measurements with a X-Rite spectrophotometer reveal generally inaccurate grayscale and colors. Color temperature is slightly cooler than it needs to be and both Magenta and Blue are more inaccurate than others. Interestingly, attempting to calibrate the panel results in no improvements.
Display Response Times
| ↔ Response Time Black to White | ||
|---|---|---|
| 20 ms ... rise ↗ and fall ↘ combined | ↗ 10.8 ms rise | 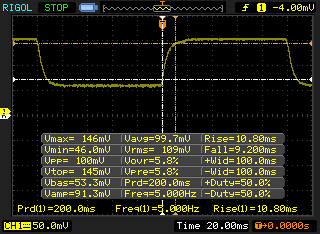 |
| ↘ 9.2 ms fall | ||
| The screen shows good response rates in our tests, but may be too slow for competitive gamers. In comparison, all tested devices range from 0.1 (minimum) to 240 (maximum) ms. » 44 % of all devices are better. This means that the measured response time is similar to the average of all tested devices (19.8 ms). | ||
| ↔ Response Time 50% Grey to 80% Grey | ||
| 32.8 ms ... rise ↗ and fall ↘ combined | ↗ 17.6 ms rise | 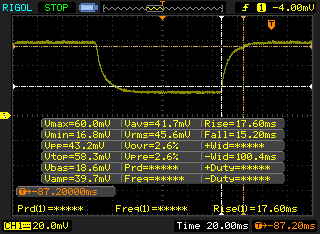 |
| ↘ 15.2 ms fall | ||
| The screen shows slow response rates in our tests and will be unsatisfactory for gamers. In comparison, all tested devices range from 0.165 (minimum) to 636 (maximum) ms. » 45 % of all devices are better. This means that the measured response time is similar to the average of all tested devices (30.9 ms). | ||
Screen Flickering / PWM (Pulse-Width Modulation)
| Screen flickering / PWM detected | 200 Hz | ≤ 99 % brightness setting | 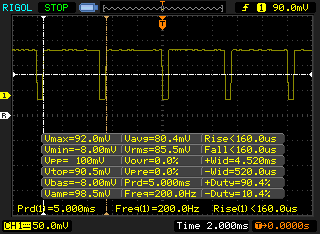 |
The display backlight flickers at 200 Hz (worst case, e.g., utilizing PWM) Flickering detected at a brightness setting of 99 % and below. There should be no flickering or PWM above this brightness setting. The frequency of 200 Hz is relatively low, so sensitive users will likely notice flickering and experience eyestrain at the stated brightness setting and below. In comparison: 52 % of all tested devices do not use PWM to dim the display. If PWM was detected, an average of 7741 (minimum: 5 - maximum: 343500) Hz was measured. | |||
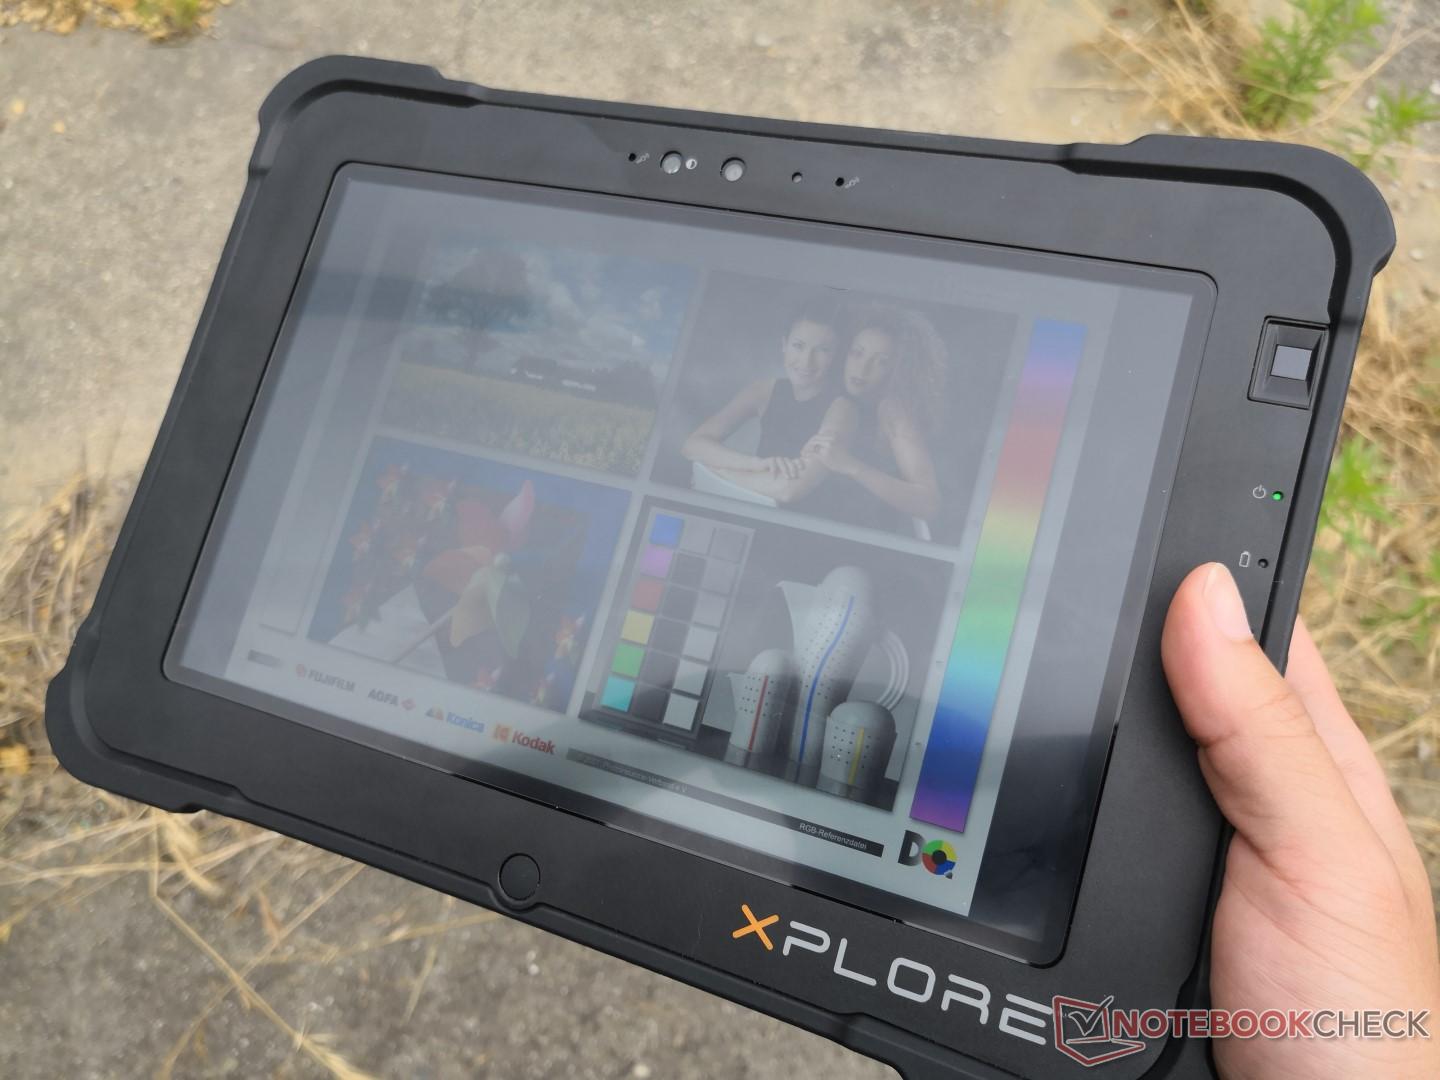
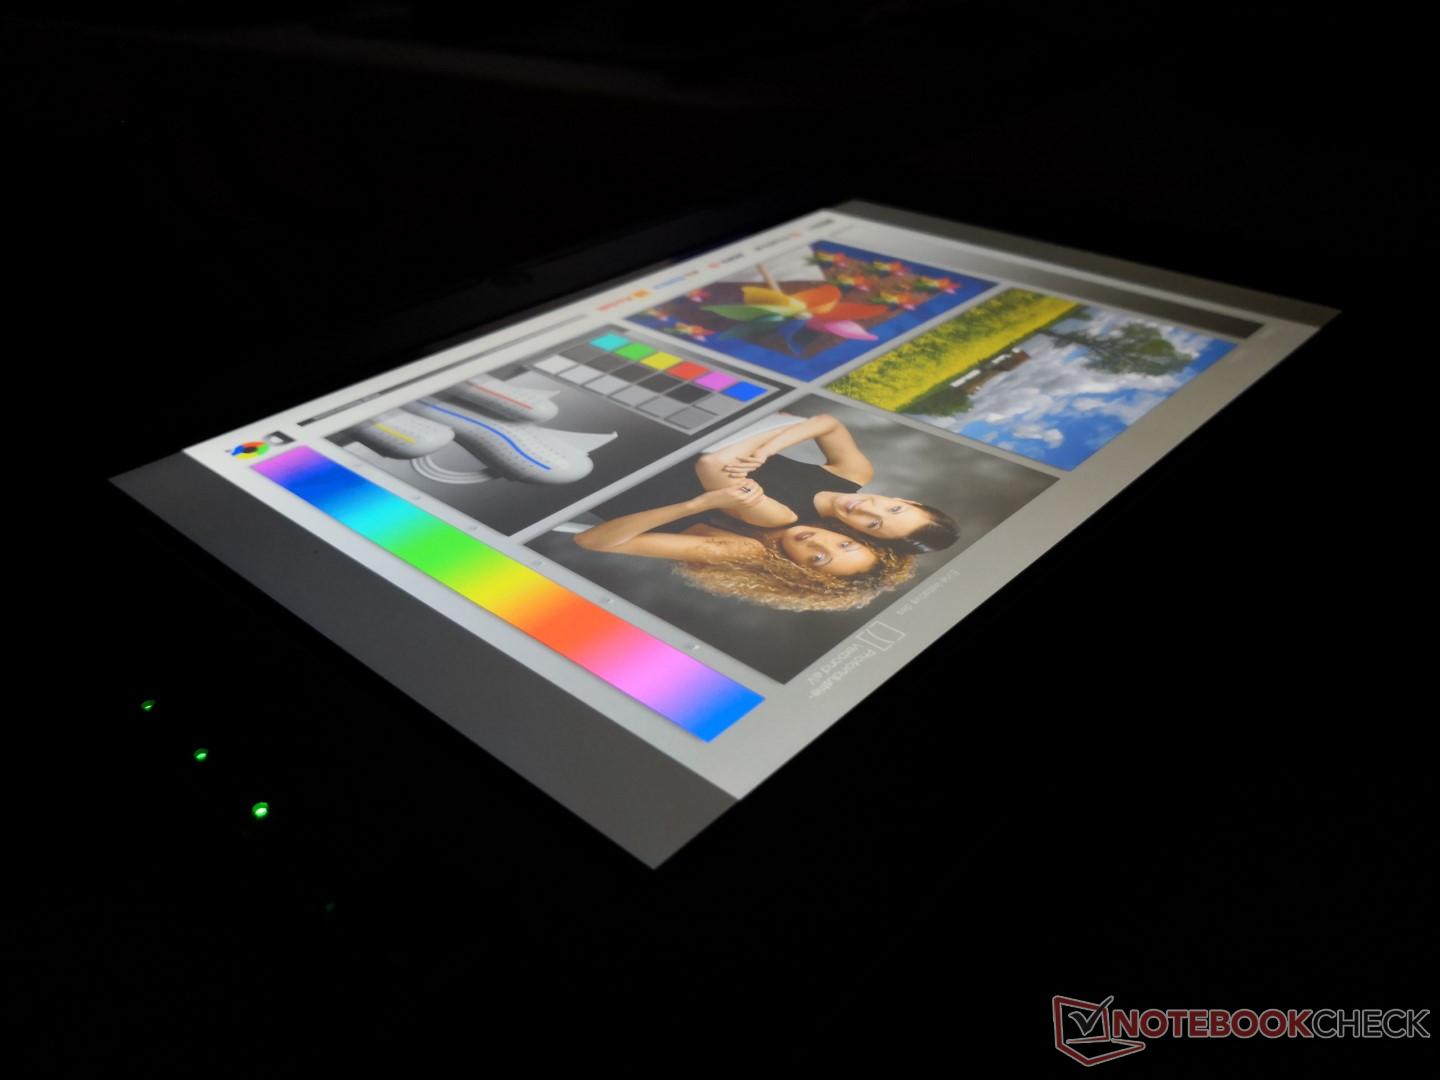
Outdoor visibility is excellent when under shade. There is still some glare when under sunlight or bright overcast as shown by the images below and so direct exposure should still be avoided for optimal visibility. Viewing angles are wide from the IPS panel to allow for comfortable use in both landscape and portrait orientations. Viewing from extreme angles will result in slight apparent contrast changes.
Performance
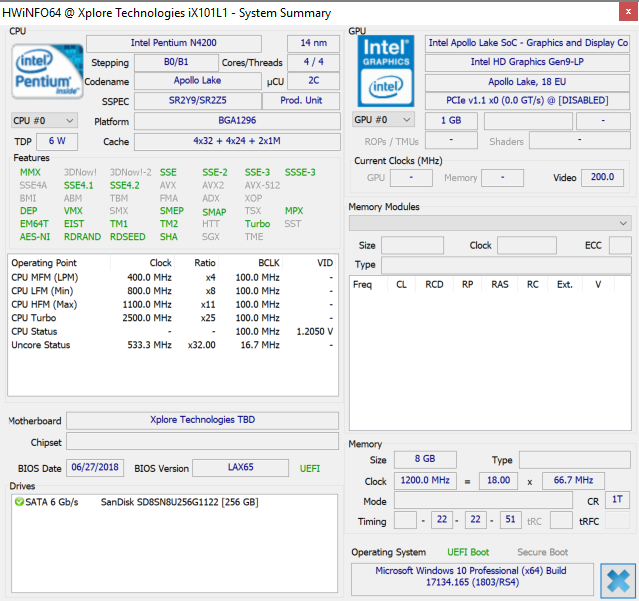
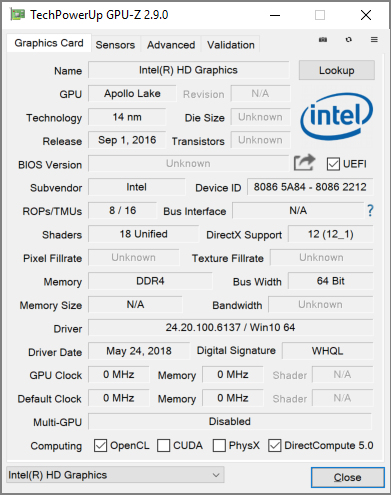
A total of four processors are available to choose from including the Pentium N4200 up to the Intel Core i7-8650U. Multiple RAM options (LPDDR3 and LPDDR4) are available as well. The Kaby Lake-R CPU options are very commonly found on newer consumer Ultrabooks while being relatively rare in the consumer tablet space.
No discrete GPU options are available.
Processor
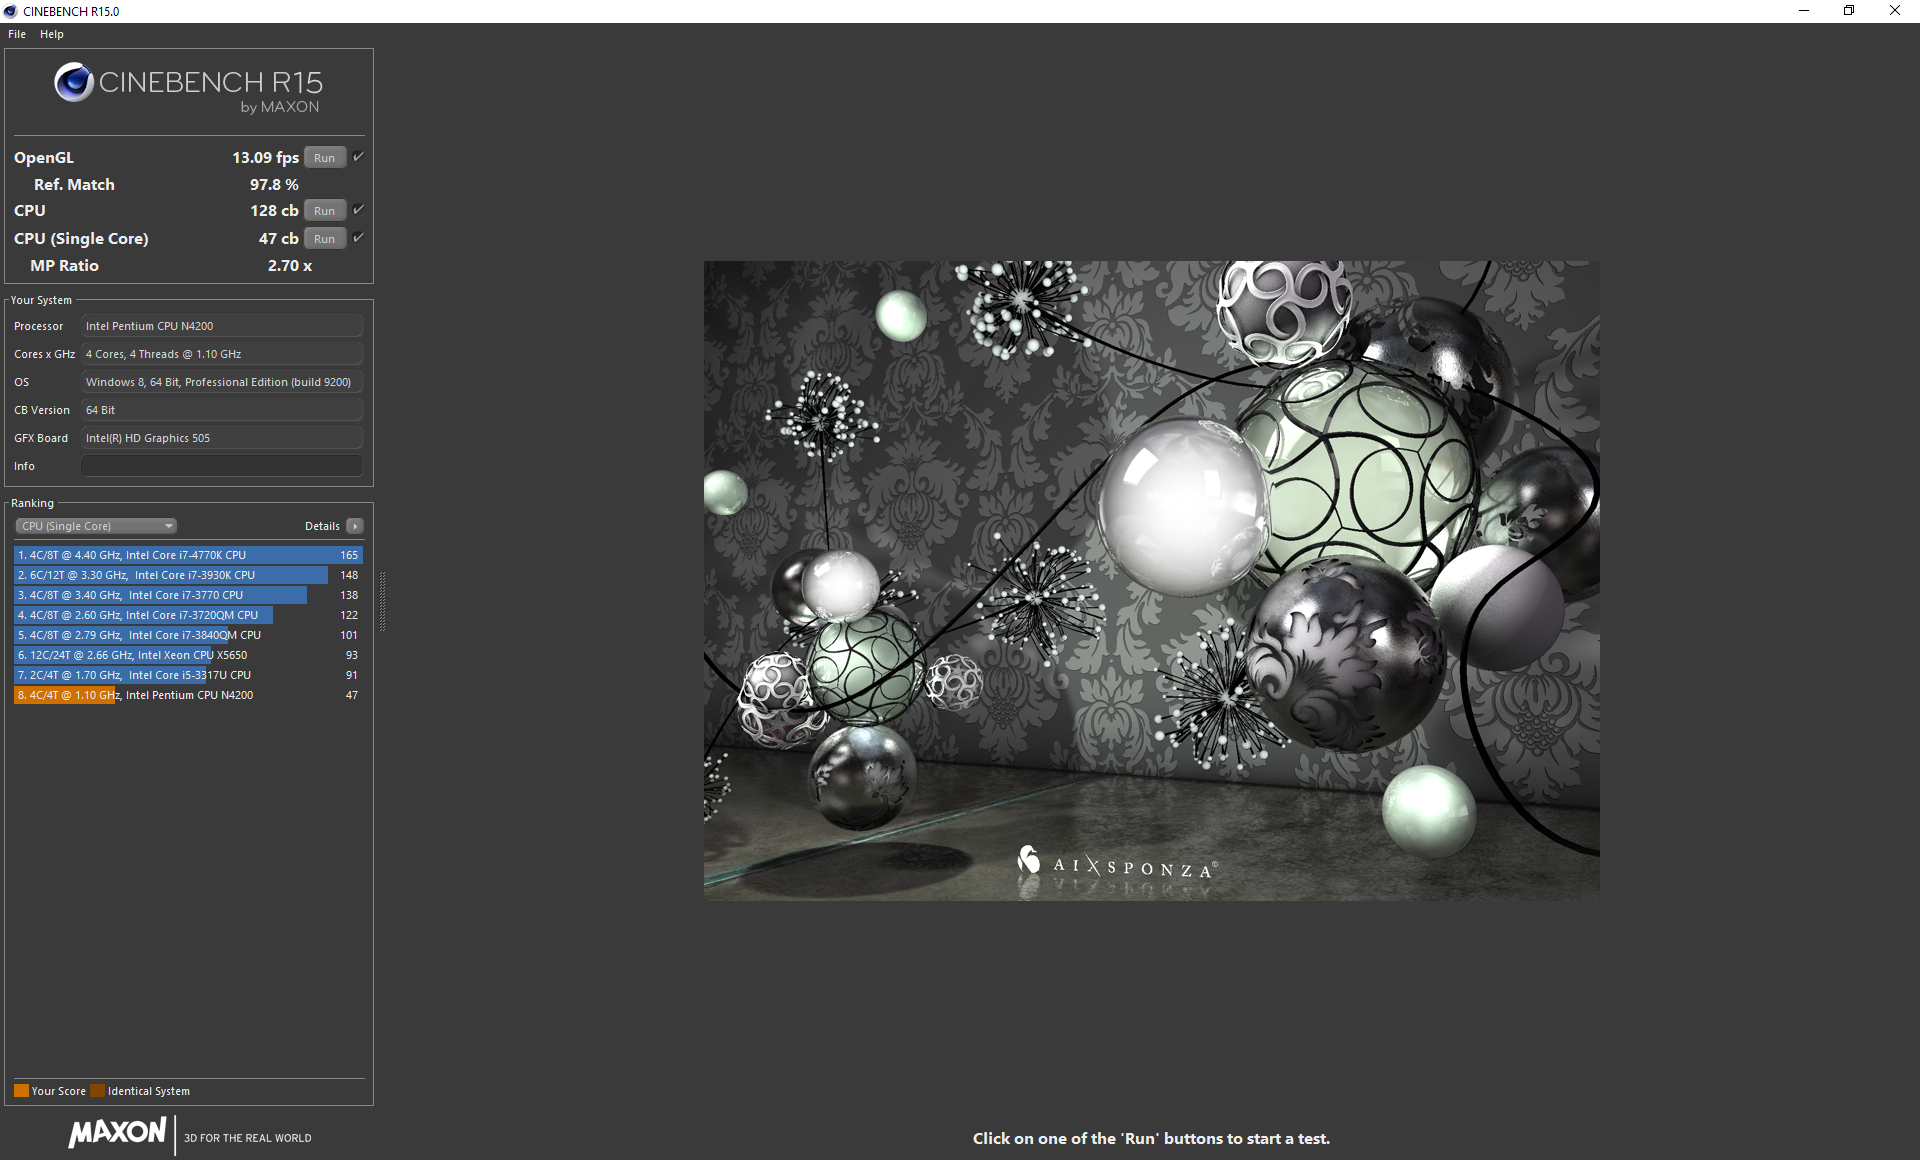
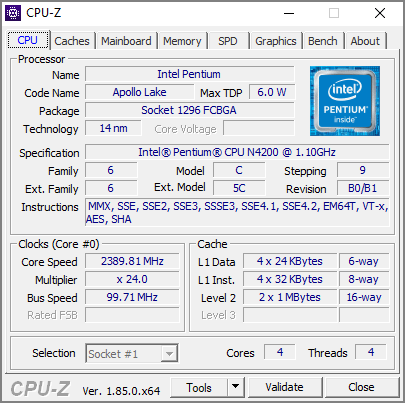
The Pentium N4200 is the L10 is performing about 10 to 15 percent slower than the average N4200 in our database. While performance is generally consistent with no major throttling behavior, the processor is only marginally faster than the passively cooled Core M-5Y71 in the Dell Latitude 12 Rugged tablet. Even the years-old Core i5-4200U can run up to 100 percent faster than our Pentium configuration. Users who opt in for the higher-end SKU with the i5-8250U, i7-8550U, or i7-8650U will get a significant boost in raw CPU power by over 300 or 400 percent.
Check our our dedicated page on the Pentium N4200 for more technical details and benchmark comparisons.
| wPrime 2.10 - 1024m | |
| Intel NUC7CJYH | |
| Average Intel Pentium N4200 (704 - 724, n=2) | |
| Acer Swift 1 SF114-32-P8GG | |
| Dell Latitude 5490 | |
* ... smaller is better
System Performance
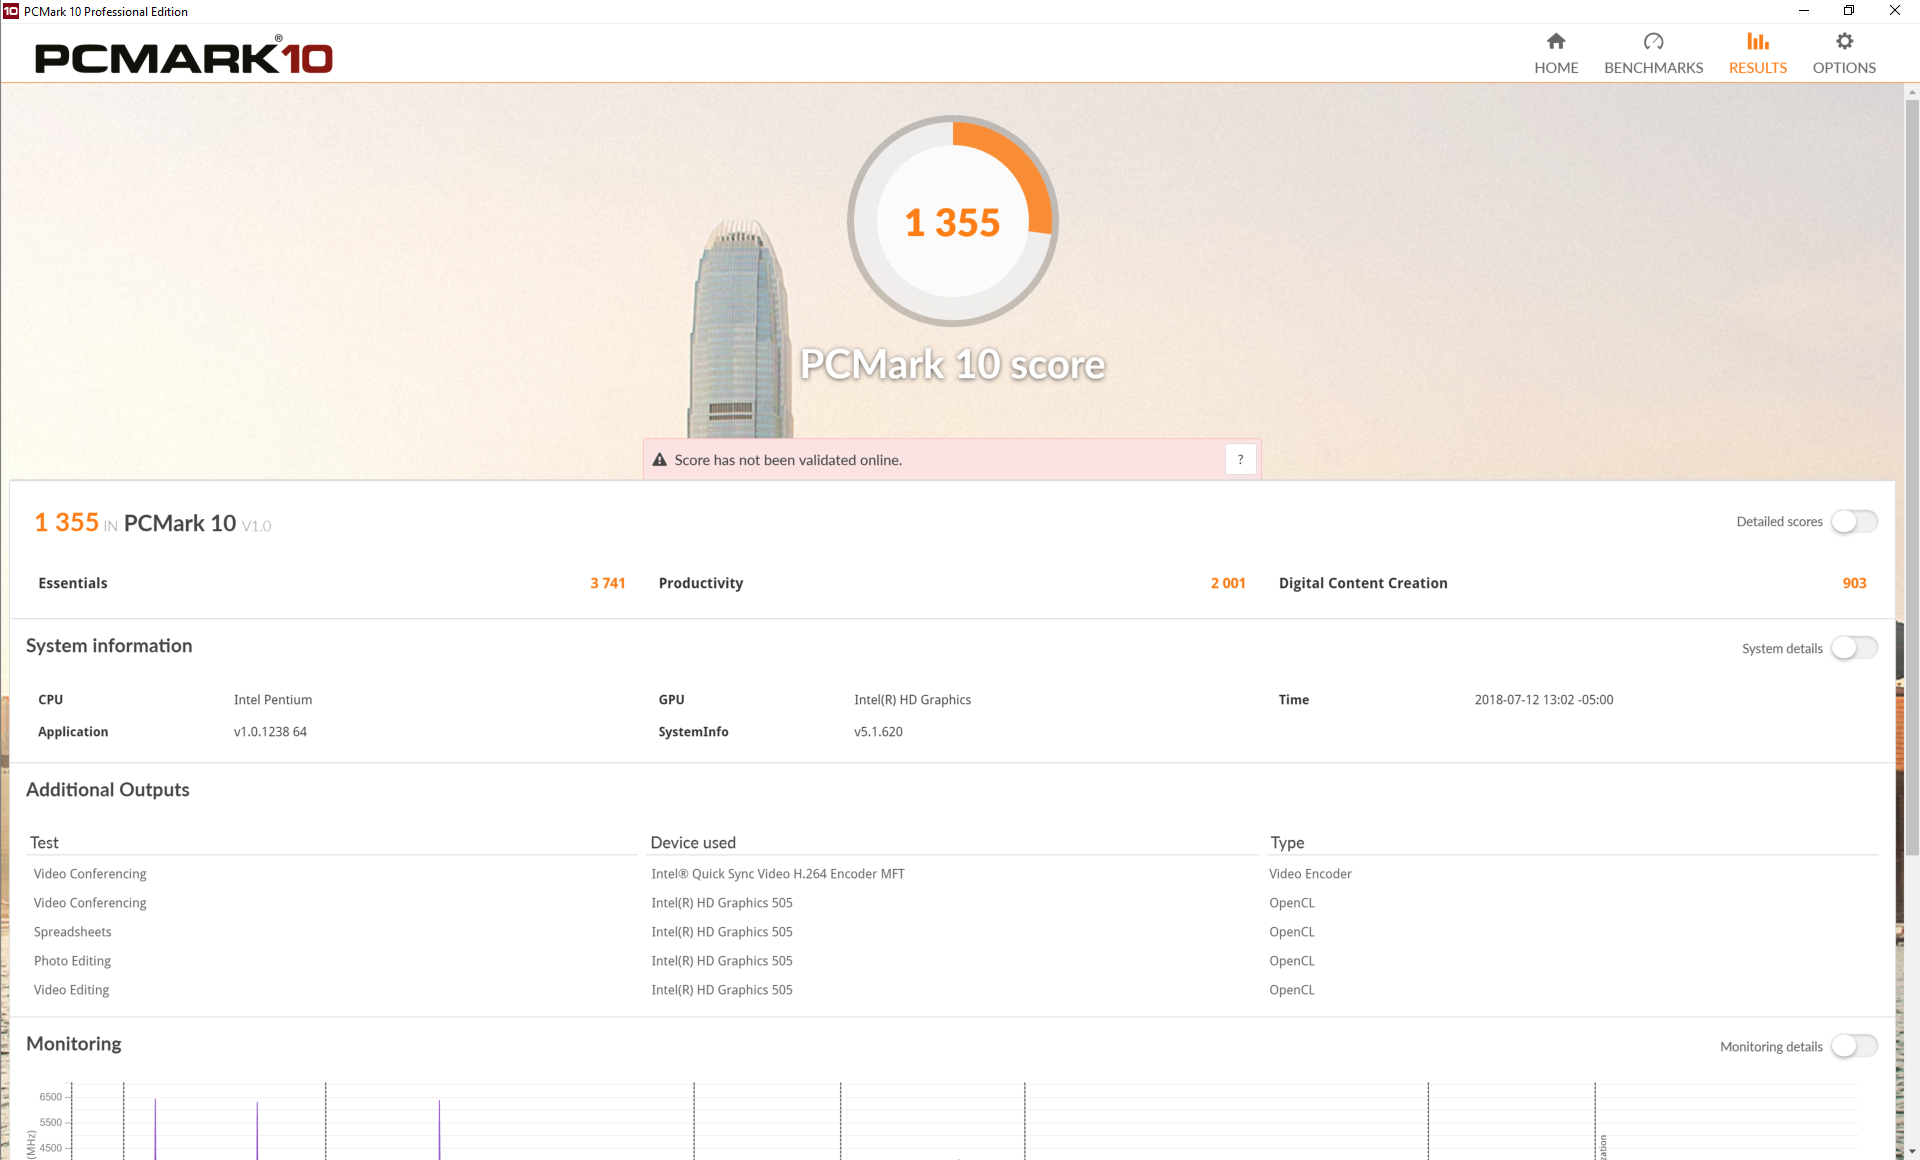
PCMark benchmarks are just slightly above the Atom-powered Fujitsu V535 while being significantly below the Core i5 and i7-powered Dell Latitude 14 and Panasonic Toughbook. Even from a subjective standpoint, apps and navigation are a bit slower than your average Ultrabook.

| PCMark 8 - Home Score Accelerated v2 | |
| Dell Latitude 3490 | |
| Dell Latitude 14 7414 Rugged Extreme | |
| Panasonic Toughbook CF-XZ6 | |
| Intel NUC7CJYH | |
| Xploretech XSLATE L10 | |
| Fujitsu Stylistic V535 | |
| PCMark 10 - Score | |
| Dell Latitude 3490 | |
| Panasonic Toughbook CF-XZ6 | |
| Xploretech XSLATE L10 | |
| Intel NUC7CJYH | |
| PCMark 8 Home Score Accelerated v2 | 1337 points | |
| PCMark 10 Score | 1355 points | |
Help | ||
Storage Devices
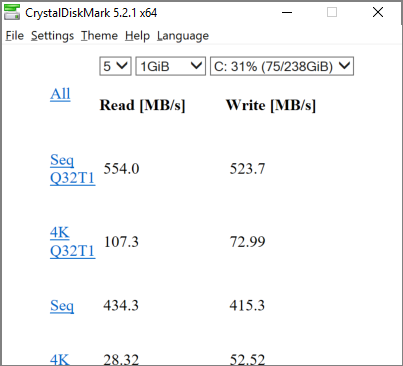
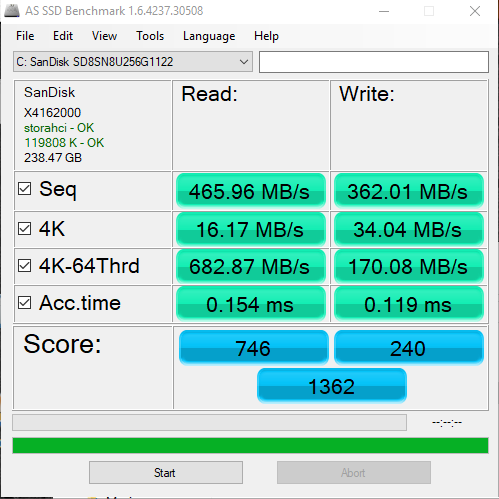
Removable M.2 SSDs of up to 1 TB are supported to save on space and weight. The 256 GB SanDisk in our unit performs exactly where we expect it to be for a SATA-limited drive. Sequential read and write rates top out at around 500 MB/s each.
See our table of HDDs and SSDs for more benchmark comparisons.
| Xploretech XSLATE L10 SanDisk SD8SN8U256G1122 | Dell Latitude 12 Rugged Tablet Liteon L8H-128V2G M.2 2280 | Dell Latitude 14 7414 Rugged Extreme Liteonit CV3-8D128 | Dell Latitude 3490 SK hynix SC311 M.2 | Intel NUC7CJYH SanDisk Ultra II | |
|---|---|---|---|---|---|
| AS SSD | -8% | 9% | 53% | 9% | |
| Copy Game MB/s (MB/s) | 151.1 | 158.6 5% | 168.6 12% | 306.2 103% | 175.5 16% |
| Copy Program MB/s (MB/s) | 80.2 | 101.7 27% | 115.4 44% | 315.9 294% | 102 27% |
| Copy ISO MB/s (MB/s) | 275.9 | 164.8 -40% | 302.4 10% | 476.7 73% | 197 -29% |
| Score Total (Points) | 1362 | 643 -53% | 762 -44% | 1006 -26% | 1025 -25% |
| Score Write (Points) | 240 | 164 -32% | 226 -6% | 387 61% | 268 12% |
| Score Read (Points) | 746 | 323 -57% | 349 -53% | 409 -45% | 498 -33% |
| Access Time Write * (ms) | 0.119 | 0.095 20% | 0.069 42% | 0.052 56% | 0.089 25% |
| Access Time Read * (ms) | 0.154 | 0.091 41% | 0.121 21% | 0.097 37% | 0.115 25% |
| 4K-64 Write (MB/s) | 170.1 | 85.8 -50% | 124.7 -27% | 286.1 68% | 174.6 3% |
| 4K-64 Read (MB/s) | 683 | 246.6 -64% | 267.5 -61% | 332.7 -51% | 420.5 -38% |
| 4K Write (MB/s) | 34.04 | 64.5 89% | 54.7 61% | 68.9 102% | 47.43 39% |
| 4K Read (MB/s) | 16.17 | 25.41 57% | 29.92 85% | 27.67 71% | 26.98 67% |
| Seq Write (MB/s) | 362 | 139.3 -62% | 464.4 28% | 318.8 -12% | 464.8 28% |
| Seq Read (MB/s) | 466 | 513 10% | 516 11% | 484.7 4% | 480 3% |
* ... smaller is better

GPU Performance
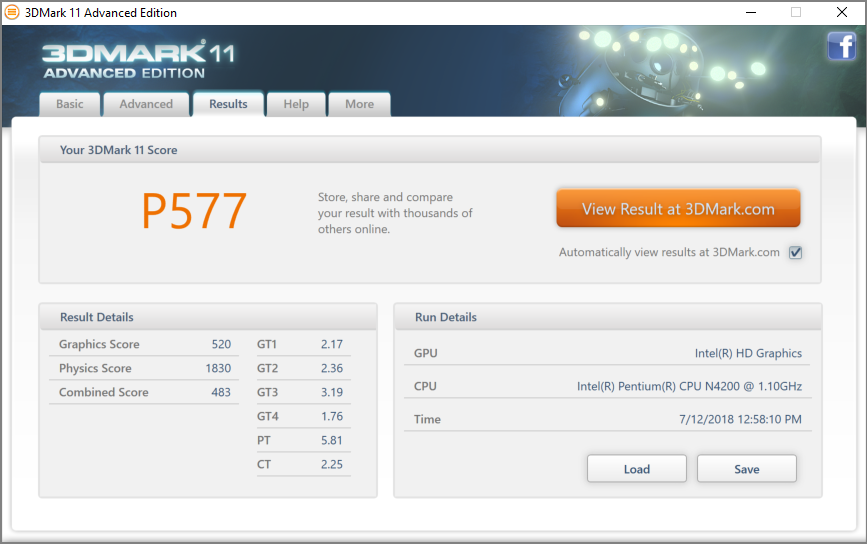
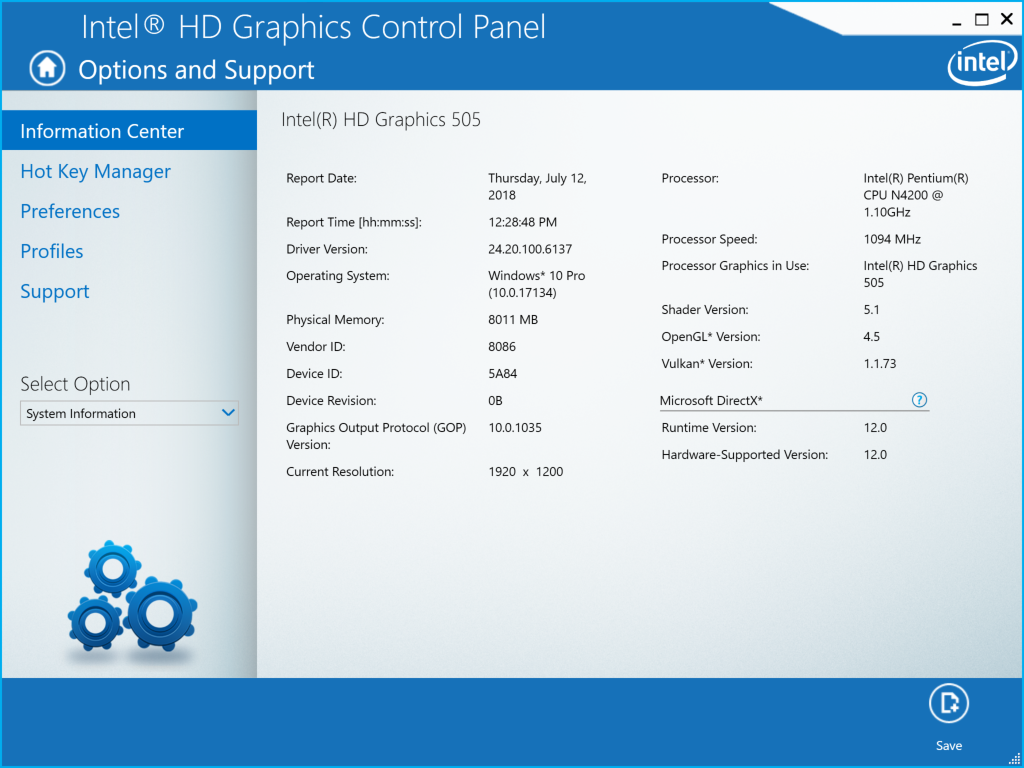
The Intel HD Graphics 505 is only marginally better that the already slow HD Graphics GPUs found on Cherry Trail and Bay Trail Atom SoCs. In other words, the tablet is not designed for any sort of gaming or even light editing. 1080p streaming or playback is still smooth for multimedia purposes.
See our dedicated page on the HD Graphics 505 for more technical information and benchmark comparisons.
| 3DMark 11 Performance | 577 points | |
Help | ||
| low | med. | high | ultra | |
|---|---|---|---|---|
| BioShock Infinite (2013) | 21.3 | 10.2 |
Stress Test
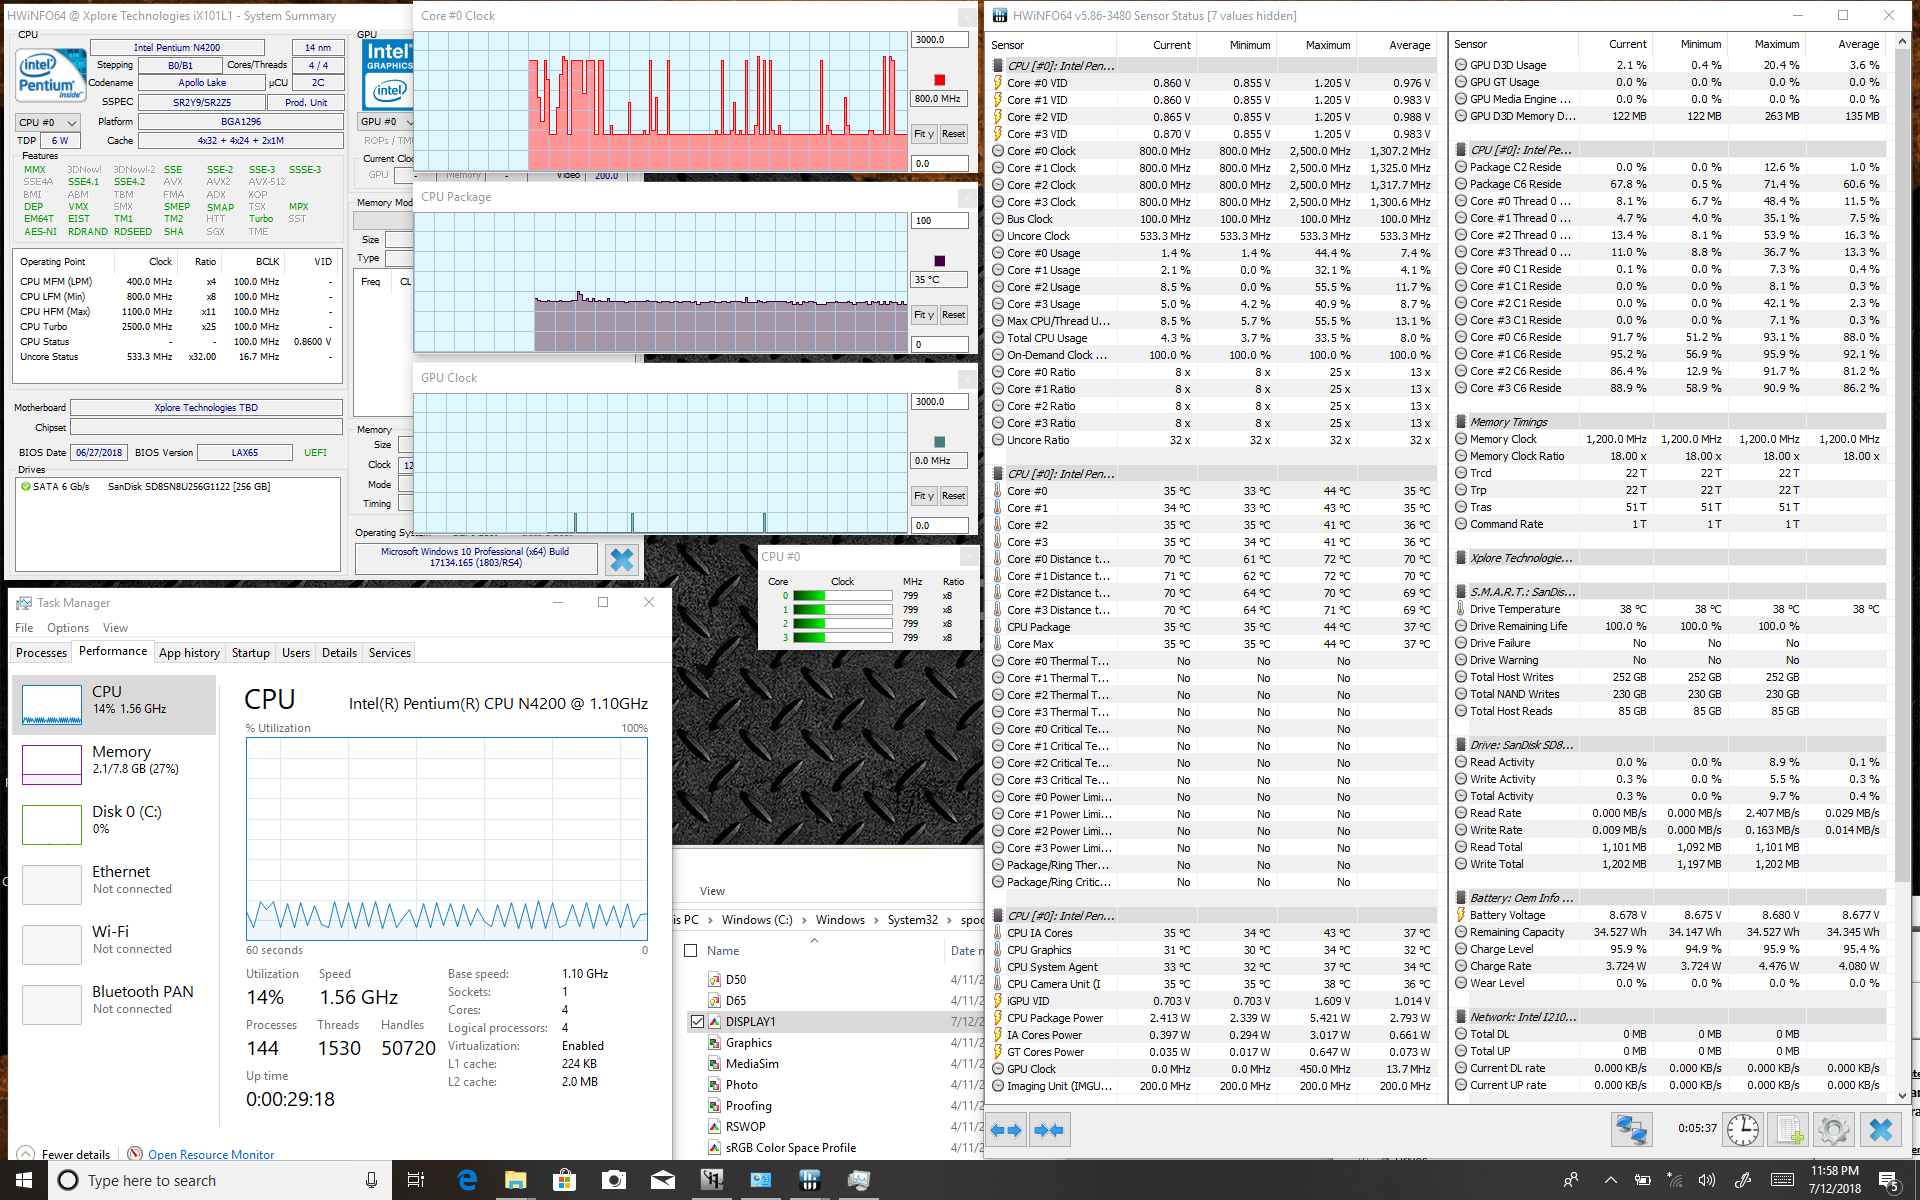
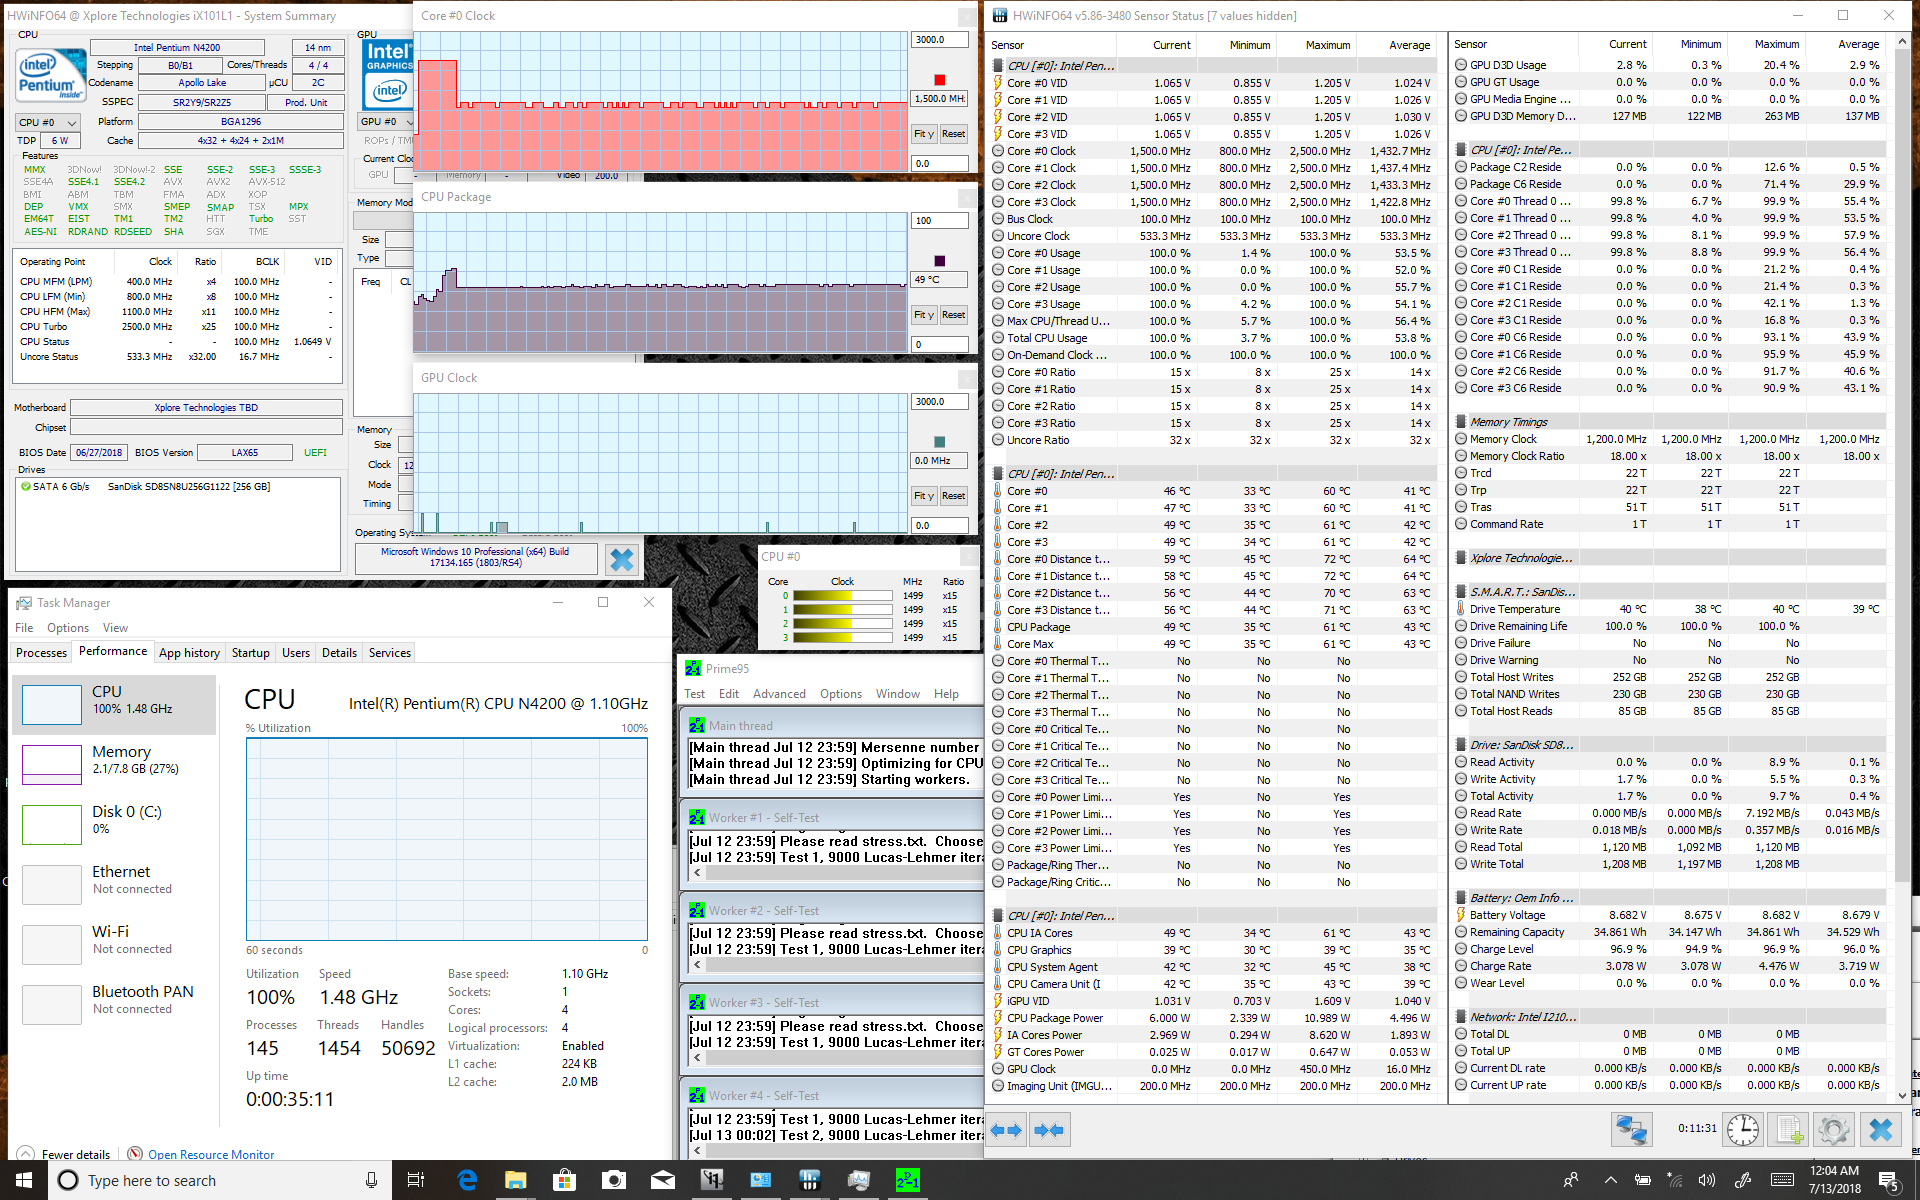
We stress the tablet with benchmarks to identify for any potential throttling or stability issues. When subjected to Prime95 stress, the CPU can be observed running at 2.4 GHz for the first few seconds before reaching 61 C and dropping to a stable 1.6 GHz and 49 C. Thus, Turbo Boost is very short-lived despite the thickness and active cooling solution of the tablet.
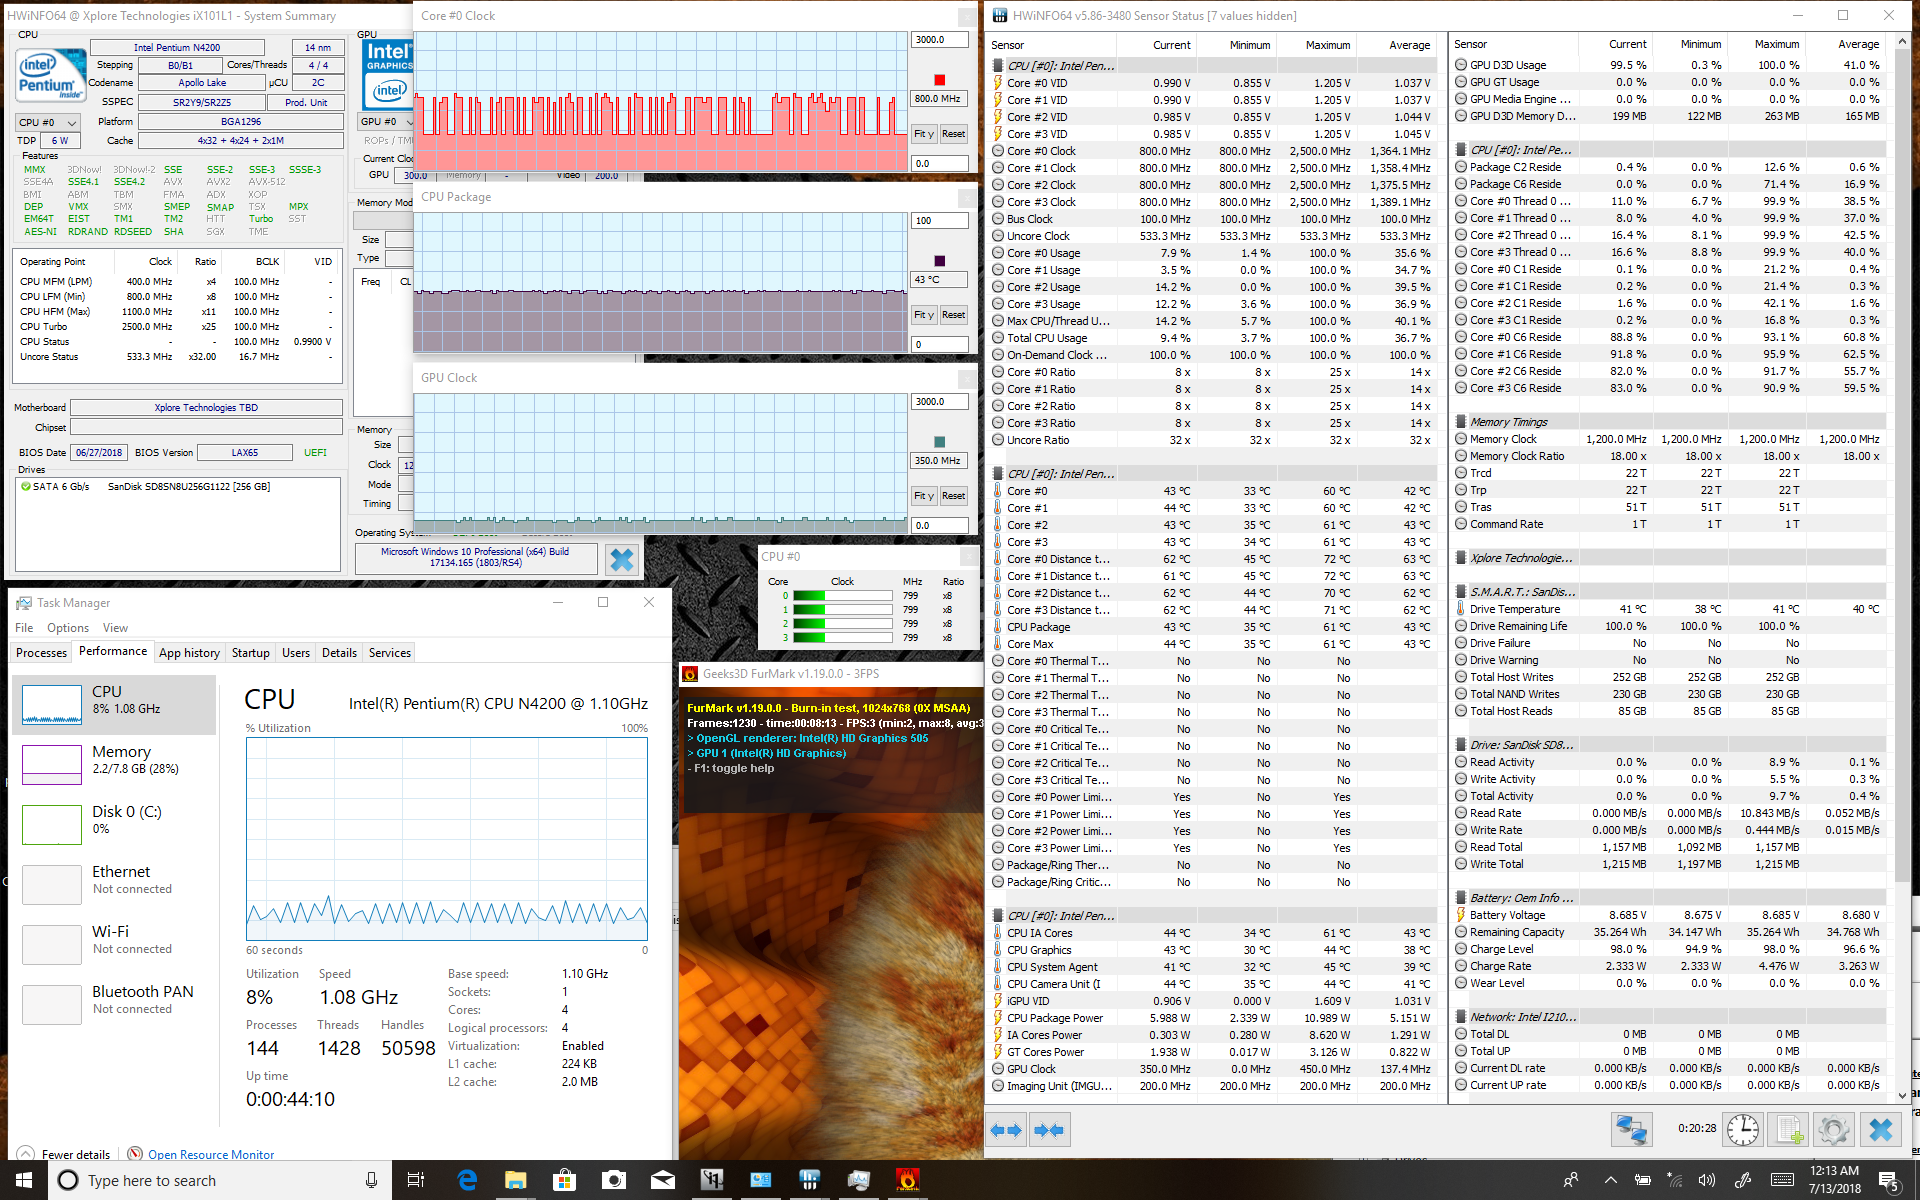
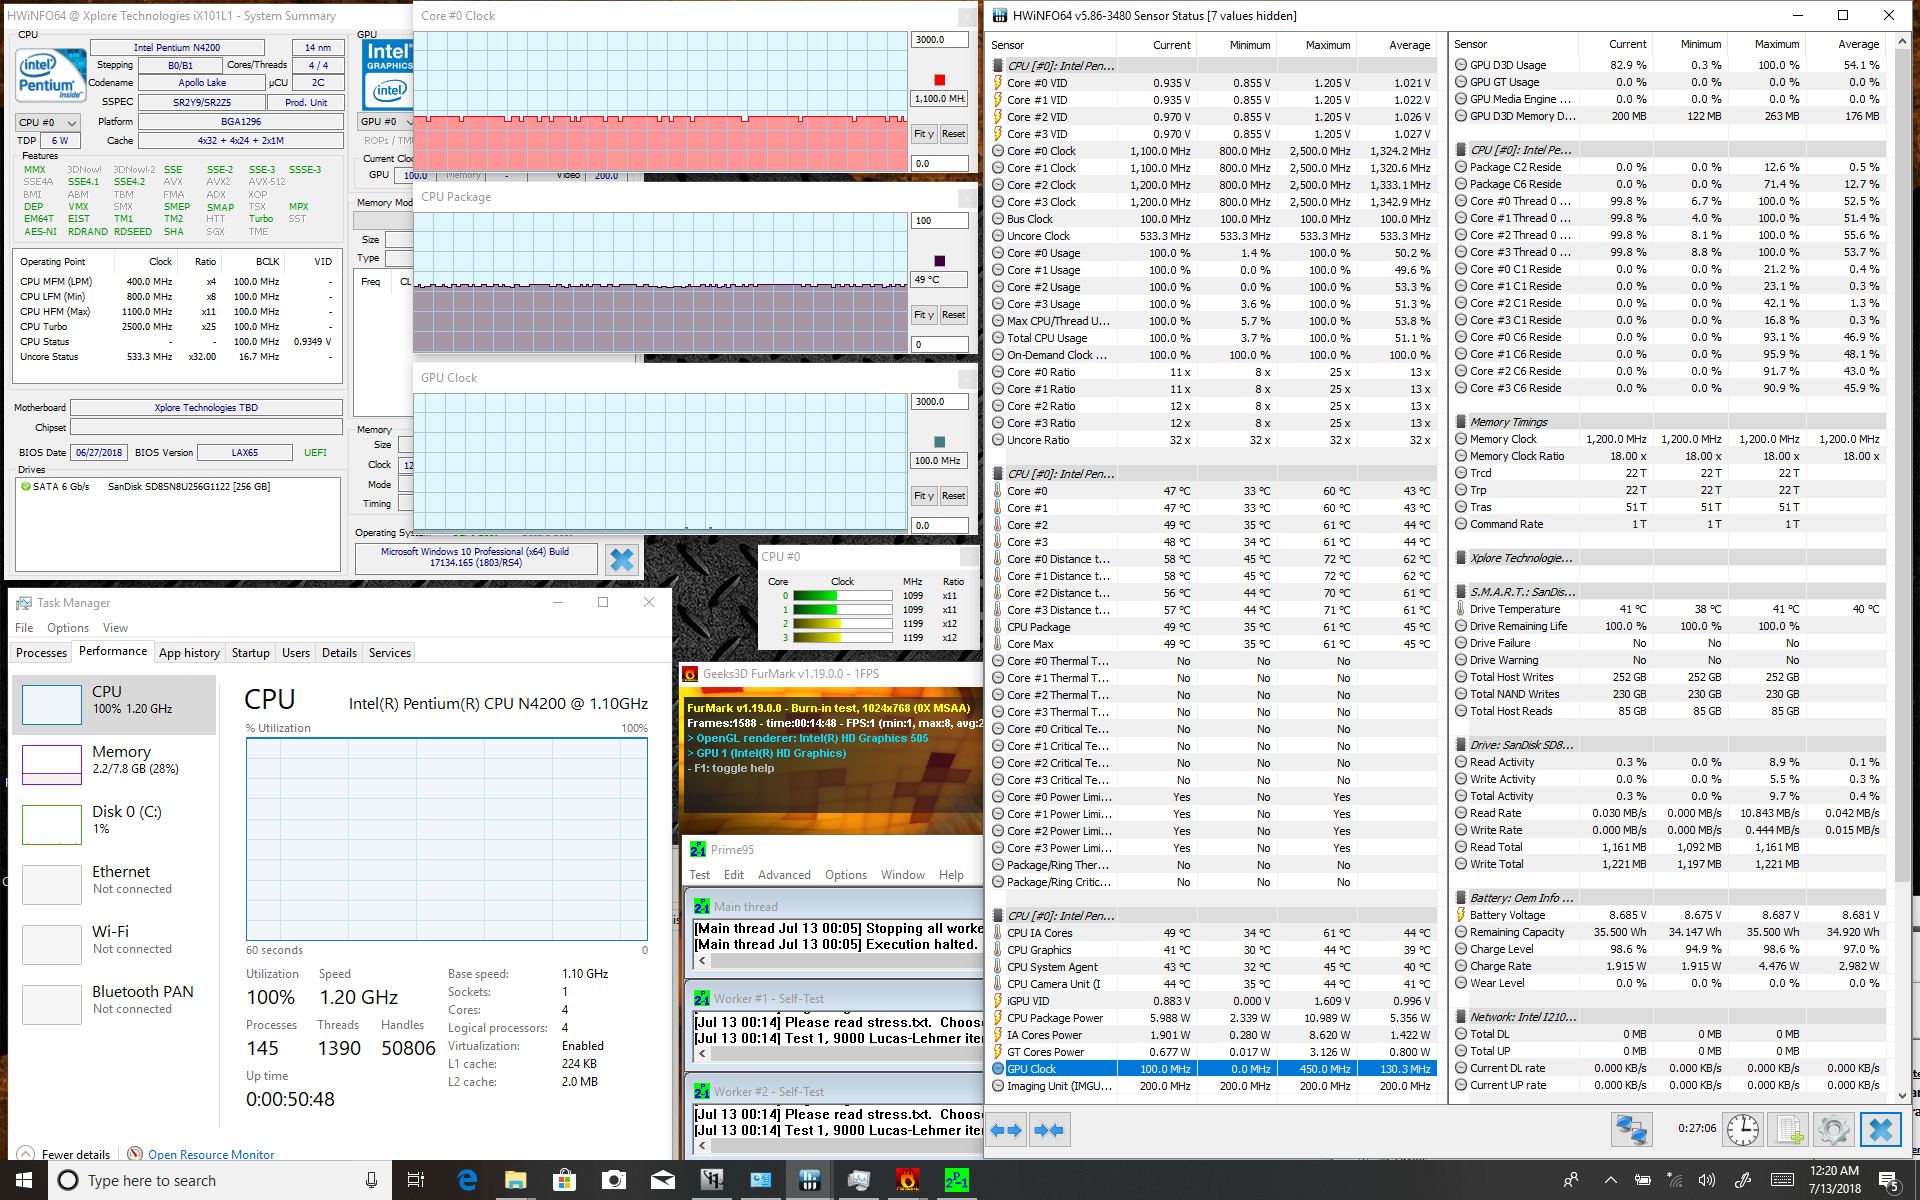
| CPU Clock (GHz) | GPU Clock (MHz) | Average CPU Temperature (°C) | |
| Prime95 Stress | 1.6 | -- | 49 |
| FurMark Stress | -- | 350 | 43 |
| Prime95 + FurMark Stress | 1.1 | 100 | 49 |
Emissions
System Noise
The tablet is silent when idling and even during medium loads as represented by the first benchmark scene of 3DMark 06. Extreme load will bump fan noise to 38 dB(A) for just a short period before falling to a steady 29.9 dB(A). In practice, the idling fan will eventually become active when web browsing but only up to a quiet 29.9 dB(A). We suspect that the faster Core i5 and i7 SKUs of the L10 may have different fan noise behavior than our N4200 SKU.
Our test unit exhibits no coil whine or high-pitched electronic noise.
Noise level
| Idle |
| 27.8 / 27.8 / 27.8 dB(A) |
| Load |
| 27.8 / 29.9 dB(A) |
 | ||
30 dB silent 40 dB(A) audible 50 dB(A) loud |
||
min: | ||
| Xploretech XSLATE L10 HD Graphics 505, Pentium N4200, SanDisk SD8SN8U256G1122 | Dell Latitude 12 Rugged Tablet HD Graphics 5300, 5Y71, Liteon L8H-128V2G M.2 2280 | Dell Latitude 14 7414 Rugged Extreme HD Graphics 520, 6300U, Liteonit CV3-8D128 | Panasonic Toughbook CF-XZ6 HD Graphics 620, i5-7300U, Samsung SSD PM871a MZNLN256HMHQ | Dell Latitude 3490 UHD Graphics 620, i5-8250U, SK hynix SC311 M.2 | Fujitsu Stylistic V535 HD Graphics (Bay Trail), Z3795, 128 GB eMMC Flash | |
|---|---|---|---|---|---|---|
| Noise | -22% | -9% | -11% | -20% | ||
| off / environment * (dB) | 27.8 | 30.2 -9% | 30.5 -10% | 29.8 -7% | ||
| Idle Minimum * (dB) | 27.8 | 31 -12% | 30.2 -9% | 30.5 -10% | 29.8 -7% | |
| Idle Average * (dB) | 27.8 | 31 -12% | 30.2 -9% | 30.5 -10% | 29.8 -7% | |
| Idle Maximum * (dB) | 27.8 | 31 -12% | 30.2 -9% | 30.5 -10% | 29.8 -7% | |
| Load Average * (dB) | 27.8 | 39.6 -42% | 30.2 -9% | 31.9 -15% | 39.1 -41% | |
| Load Maximum * (dB) | 29.9 | 39.9 -33% | 31.7 -6% | 32.6 -9% | 44.3 -48% |
* ... smaller is better
Temperature
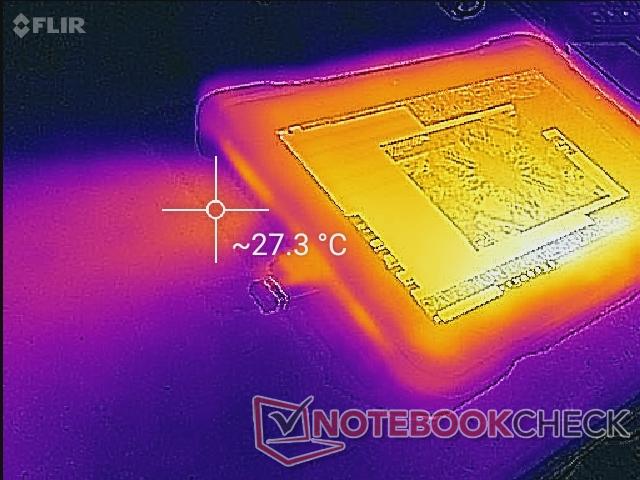
Surface temperatures are slightly warmer on the bottom left quadrants of the tablet when idling. When under heavy stress, the hot spots can become as warm as 42 C. The rubberized surfaces around the edges and corners never become uncomfortable to hold for long periods.
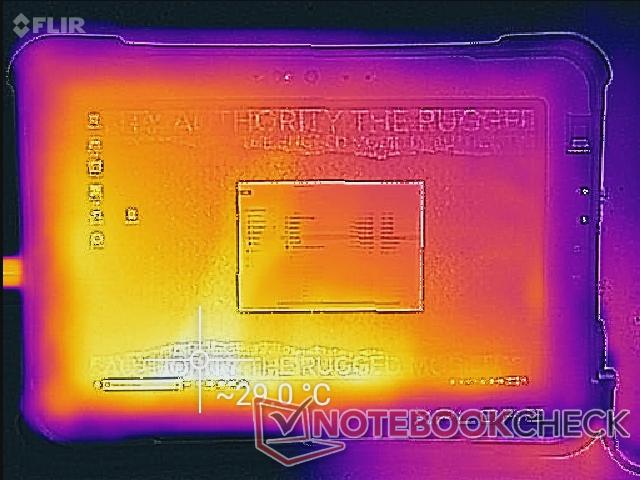
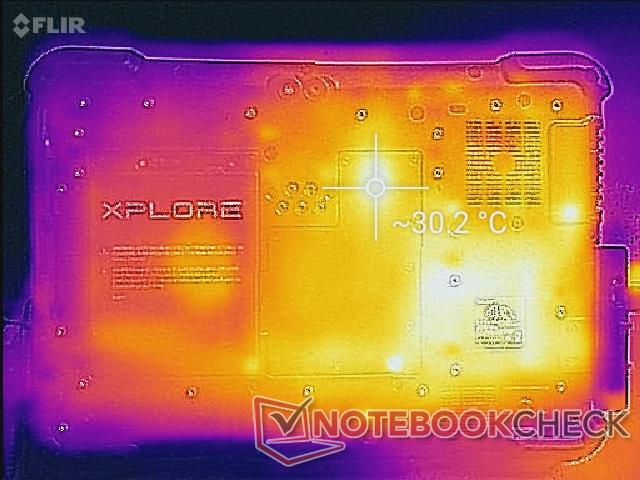
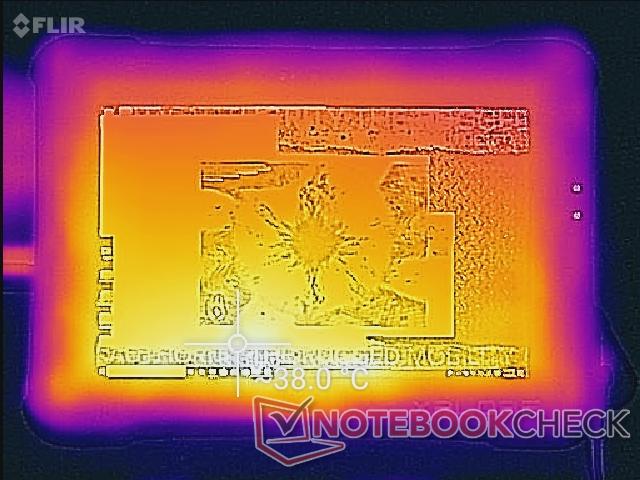
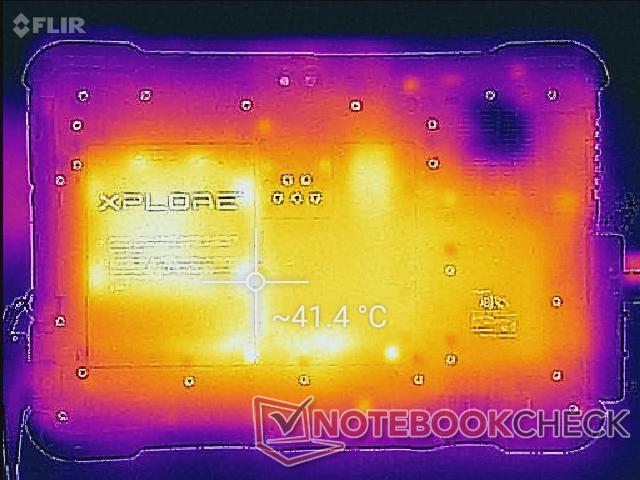
(+) The maximum temperature on the upper side is 38.8 °C / 102 F, compared to the average of 33.7 °C / 93 F, ranging from 20.7 to 53.2 °C for the class Tablet.
(±) The bottom heats up to a maximum of 41.2 °C / 106 F, compared to the average of 33.2 °C / 92 F
(+) In idle usage, the average temperature for the upper side is 26.2 °C / 79 F, compared to the device average of 30 °C / 86 F.
Speakers

The rear-facing speaker has poor bass reproduction as shown by our pink noise measurement screenshot. Maximum volume is sufficient for indoor use, but it could have been louder for industrial outdoor conditions for which the system is catered towards.
Energy Management
Power Consumption
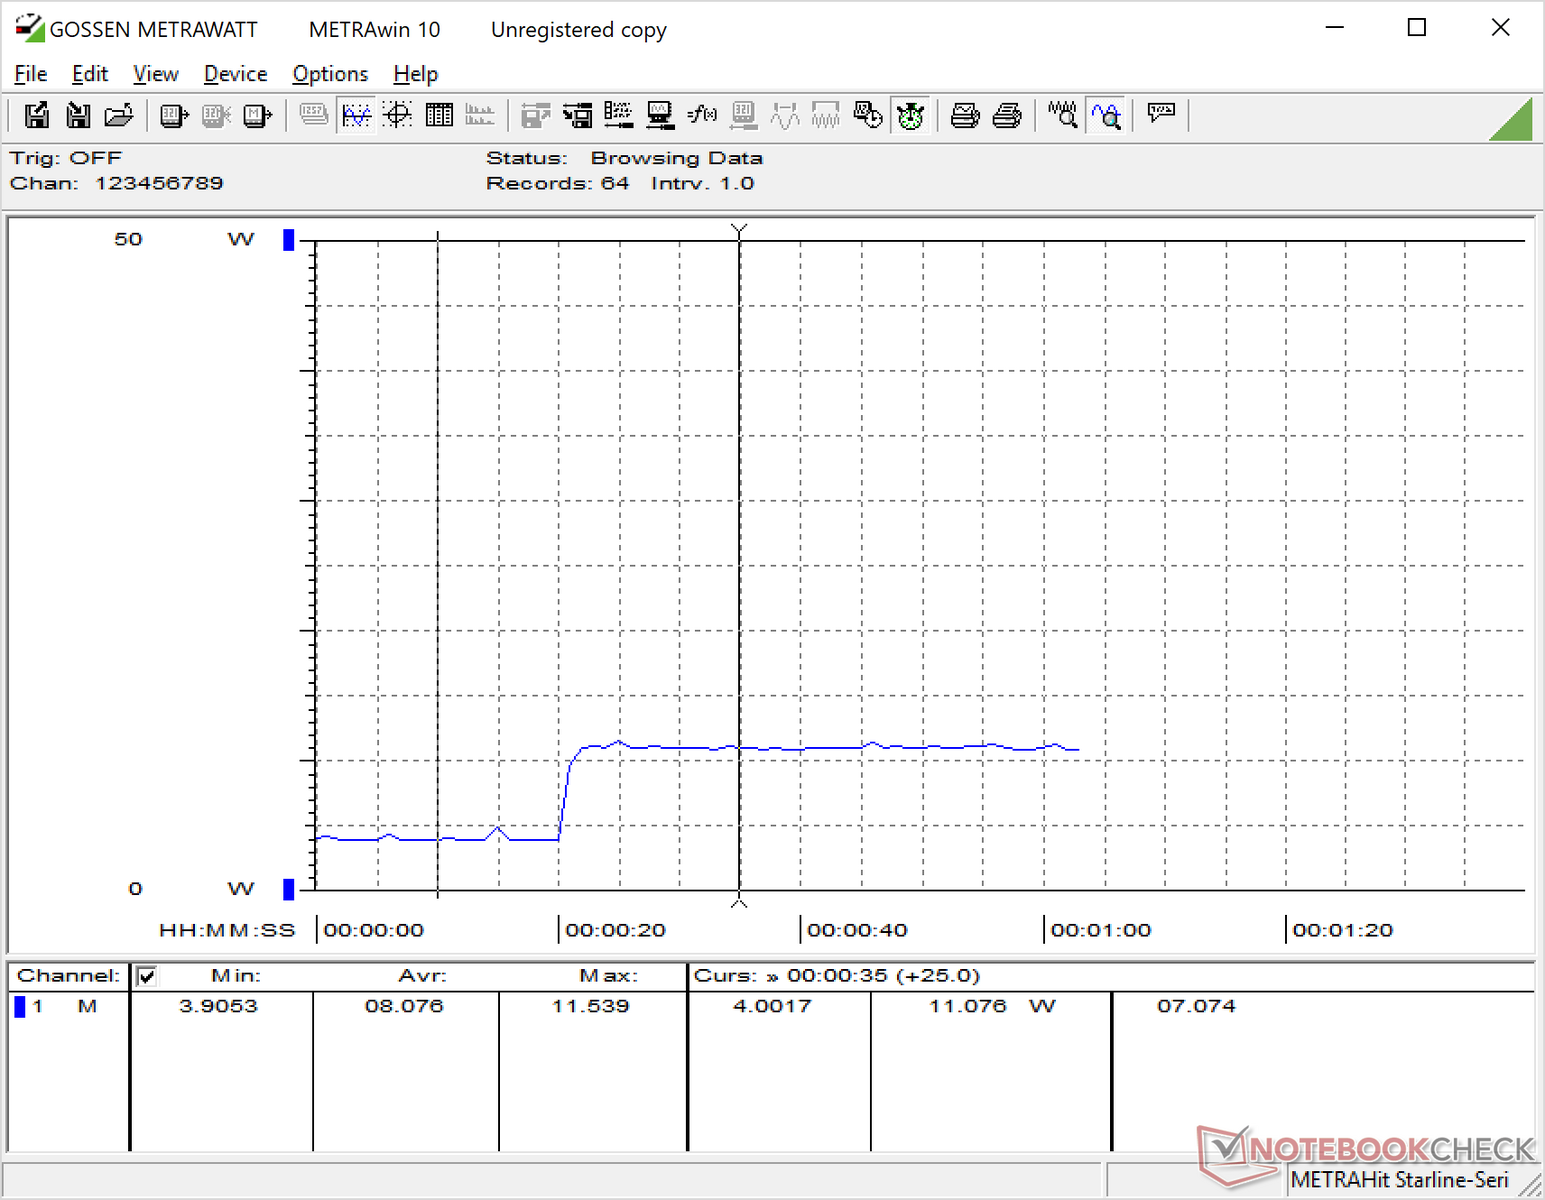
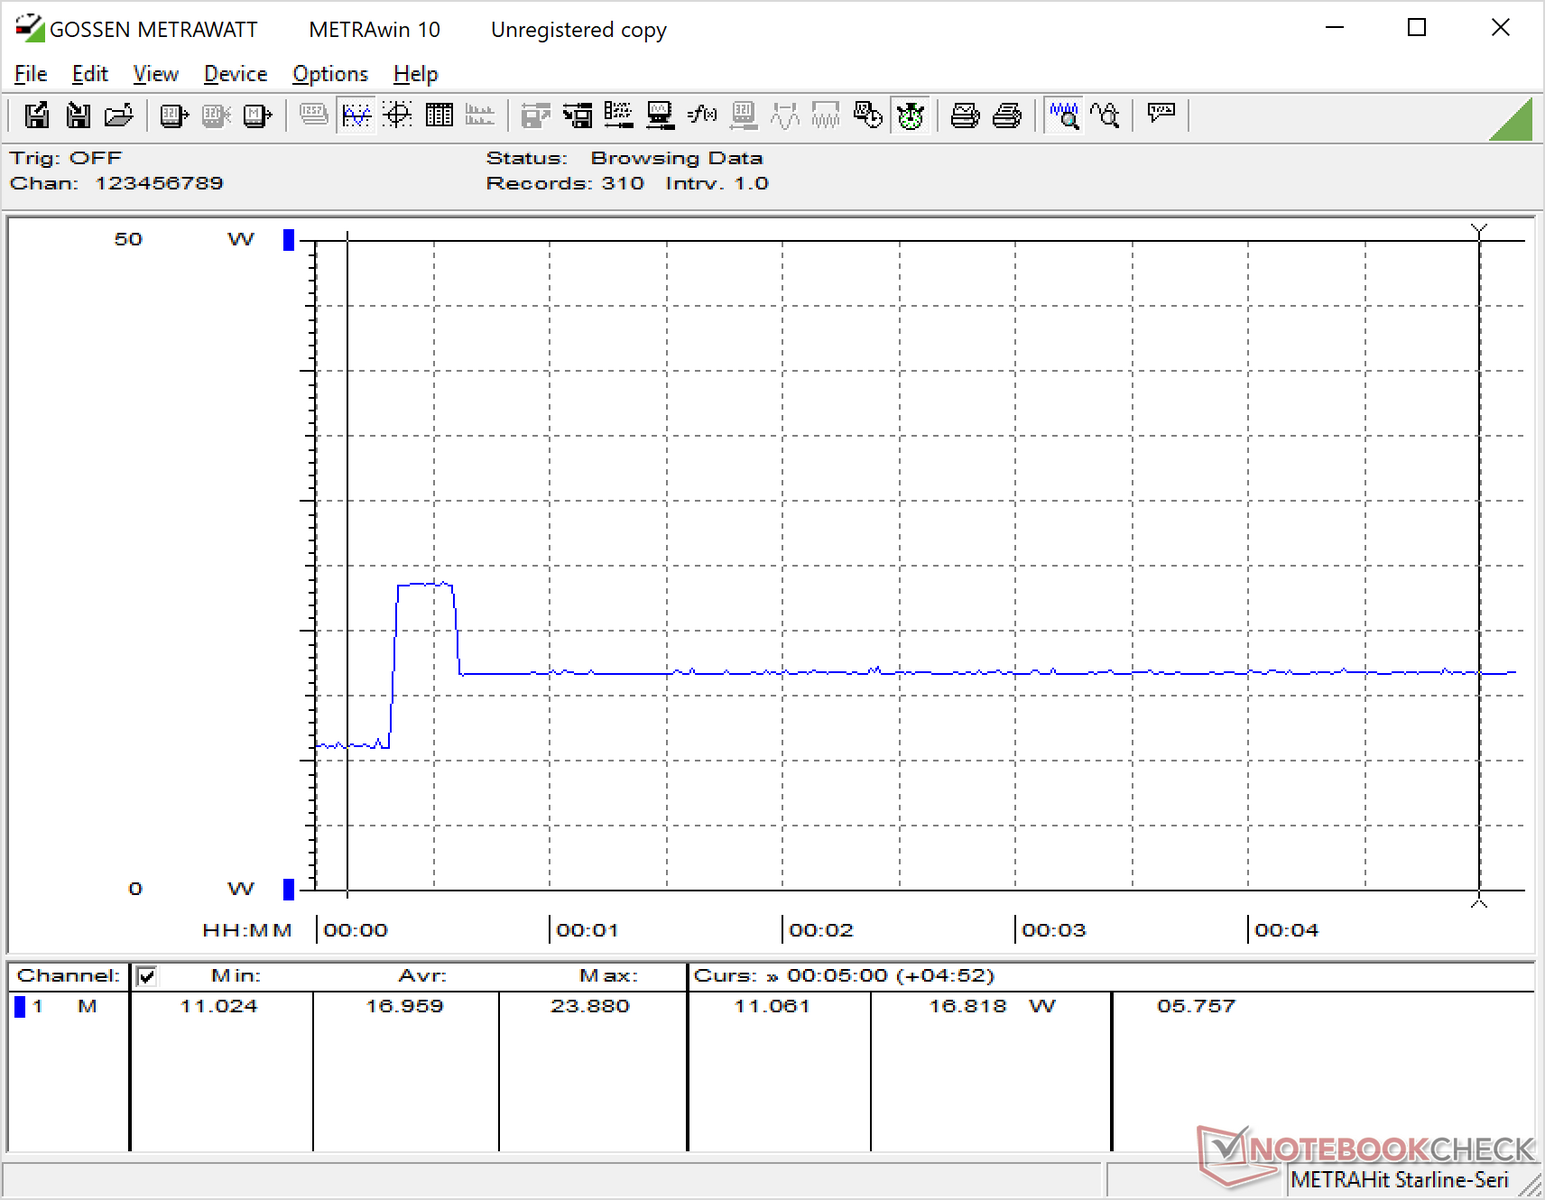
Idling on desktop draws anywhere between 3 W and 11 W depending on the brightness setting. Since the backlight is so powerful, the maximum brightness setting can bump consumption up by 7 W or 8 W when compared to the dimmest setting.
Medium to maximum loads will demand about 18 W to be very comparable to the Apple MacBook 12. The small (10.5 x 4.5 x 3.0 cm) 65 W AC adapter provides more than enough juice for the low-power tablet.
| Off / Standby | |
| Idle | |
| Load |
|
Key:
min: | |
| Xploretech XSLATE L10 Pentium N4200, HD Graphics 505, SanDisk SD8SN8U256G1122, IPS, 1920x1200, 10.1" | Apple iPad Pro 10.5 2017 A10X Fusion, A10X Fusion GPU, Toshiba THGBX669D4LLDXG 64 GB NAND , IPS, 2224x1668, 10.5" | Dell Latitude 12 Rugged Tablet 5Y71, HD Graphics 5300, Liteon L8H-128V2G M.2 2280, TN, 1366x768, 11.6" | Panasonic Toughbook CF-XZ6 i5-7300U, HD Graphics 620, Samsung SSD PM871a MZNLN256HMHQ, IPS LED, 2160x1440, 12" | Dell Latitude 3490 i5-8250U, UHD Graphics 620, SK hynix SC311 M.2, IPS LED, 1920x1080, 14" | Apple MacBook 12 2017 m3-7Y32, HD Graphics 615, Apple SSD AP0256, LED IPS, 2304x1440, 12" | |
|---|---|---|---|---|---|---|
| Power Consumption | 48% | 8% | 11% | -64% | 20% | |
| Idle Minimum * (Watt) | 3.7 | 1.44 61% | 3.8 -3% | 3.15 15% | 3.2 14% | 2 46% |
| Idle Average * (Watt) | 10.7 | 6.12 43% | 9.3 13% | 6 44% | 5.5 49% | 5.4 50% |
| Idle Maximum * (Watt) | 11 | 6.14 44% | 9.7 12% | 6.3 43% | 8.1 26% | 6.6 40% |
| Load Average * (Watt) | 17.8 | 8.55 52% | 16.3 8% | 21 -18% | 40.8 -129% | 22 -24% |
| Load Maximum * (Watt) | 17.9 | 10.62 41% | 15.9 11% | 23 -28% | 68.1 -280% | 20 -12% |
* ... smaller is better
Battery Life
A removable 36 Wh battery is included in addition to a non-removable integrated battery. If utilizing both batteries, users can expect around 7 hours of real-world WiFi usage before needing to recharge. It's worth noting that the brightness was set to 150 nits (or 15 percent) for our WiFi test and so battery life will likely be shorter if on brighter settings.
Charging from near empty to full capacity takes a little under two hours.
| Xploretech XSLATE L10 Pentium N4200, HD Graphics 505, 36 Wh | Apple iPad Pro 10.5 2017 A10X Fusion, A10X Fusion GPU, 30.8 Wh | Dell Latitude 12 Rugged Tablet 5Y71, HD Graphics 5300, 56 Wh | Dell Latitude 3490 i5-8250U, UHD Graphics 620, 56 Wh | Fujitsu Stylistic V535 Z3795, HD Graphics (Bay Trail), 17.7 Wh | Dell Latitude 14 7414 Rugged Extreme 6300U, HD Graphics 520, 97 Wh | |
|---|---|---|---|---|---|---|
| Battery runtime | 44% | 10% | 61% | -42% | 46% | |
| WiFi v1.3 (h) | 7.2 | 11.6 61% | 7.9 10% | 11.6 61% | 4.2 -42% | 10.5 46% |
| Load (h) | 2.6 | 3.3 27% | ||||
| Reader / Idle (h) | 33.9 |
Pros
Cons
Verdict
The L10 is laser-focused on providing the best experience for industrial users and it mostly hits the mark. Color accuracy, bass reproduction, backlight bleeding, and graphics performance are all poor or average at best. Fortunately for the target audience, these drawbacks will likely have minimal impact on day-to-day workloads and are not likely to be deal breakers. Instead, it's the rigidity, connectivity, and display brightness that matter and the L10 definitely delivers on that front.
There are some details we hope Xplore can address on future revisions. First, the proprietary AC adapter is inconvenient when universal USB Type-C charging is now available on most laptops and tablets. Second, the WACOM digitizer is too small and narrow to hold comfortably when compared to those from competitors. Third, maximum volume could have been louder if working outdoors or in industrial environments. We can only hope that our inconsistent WiFi results are specific to our unit only and not widespread.
A very bright and versatile industrial tablet with nearly all the features of a mainstream consumer tablet. If outdoor visibility is of utmost concern, then this is the tablet to get. Some minor design annoyances mean plenty of room for improvement on future revisions.
Xploretech XSLATE L10
- 07/15/2018 v6 (old)
Allen Ngo
Price comparison
