Verdict — Extra Size With Extra Features
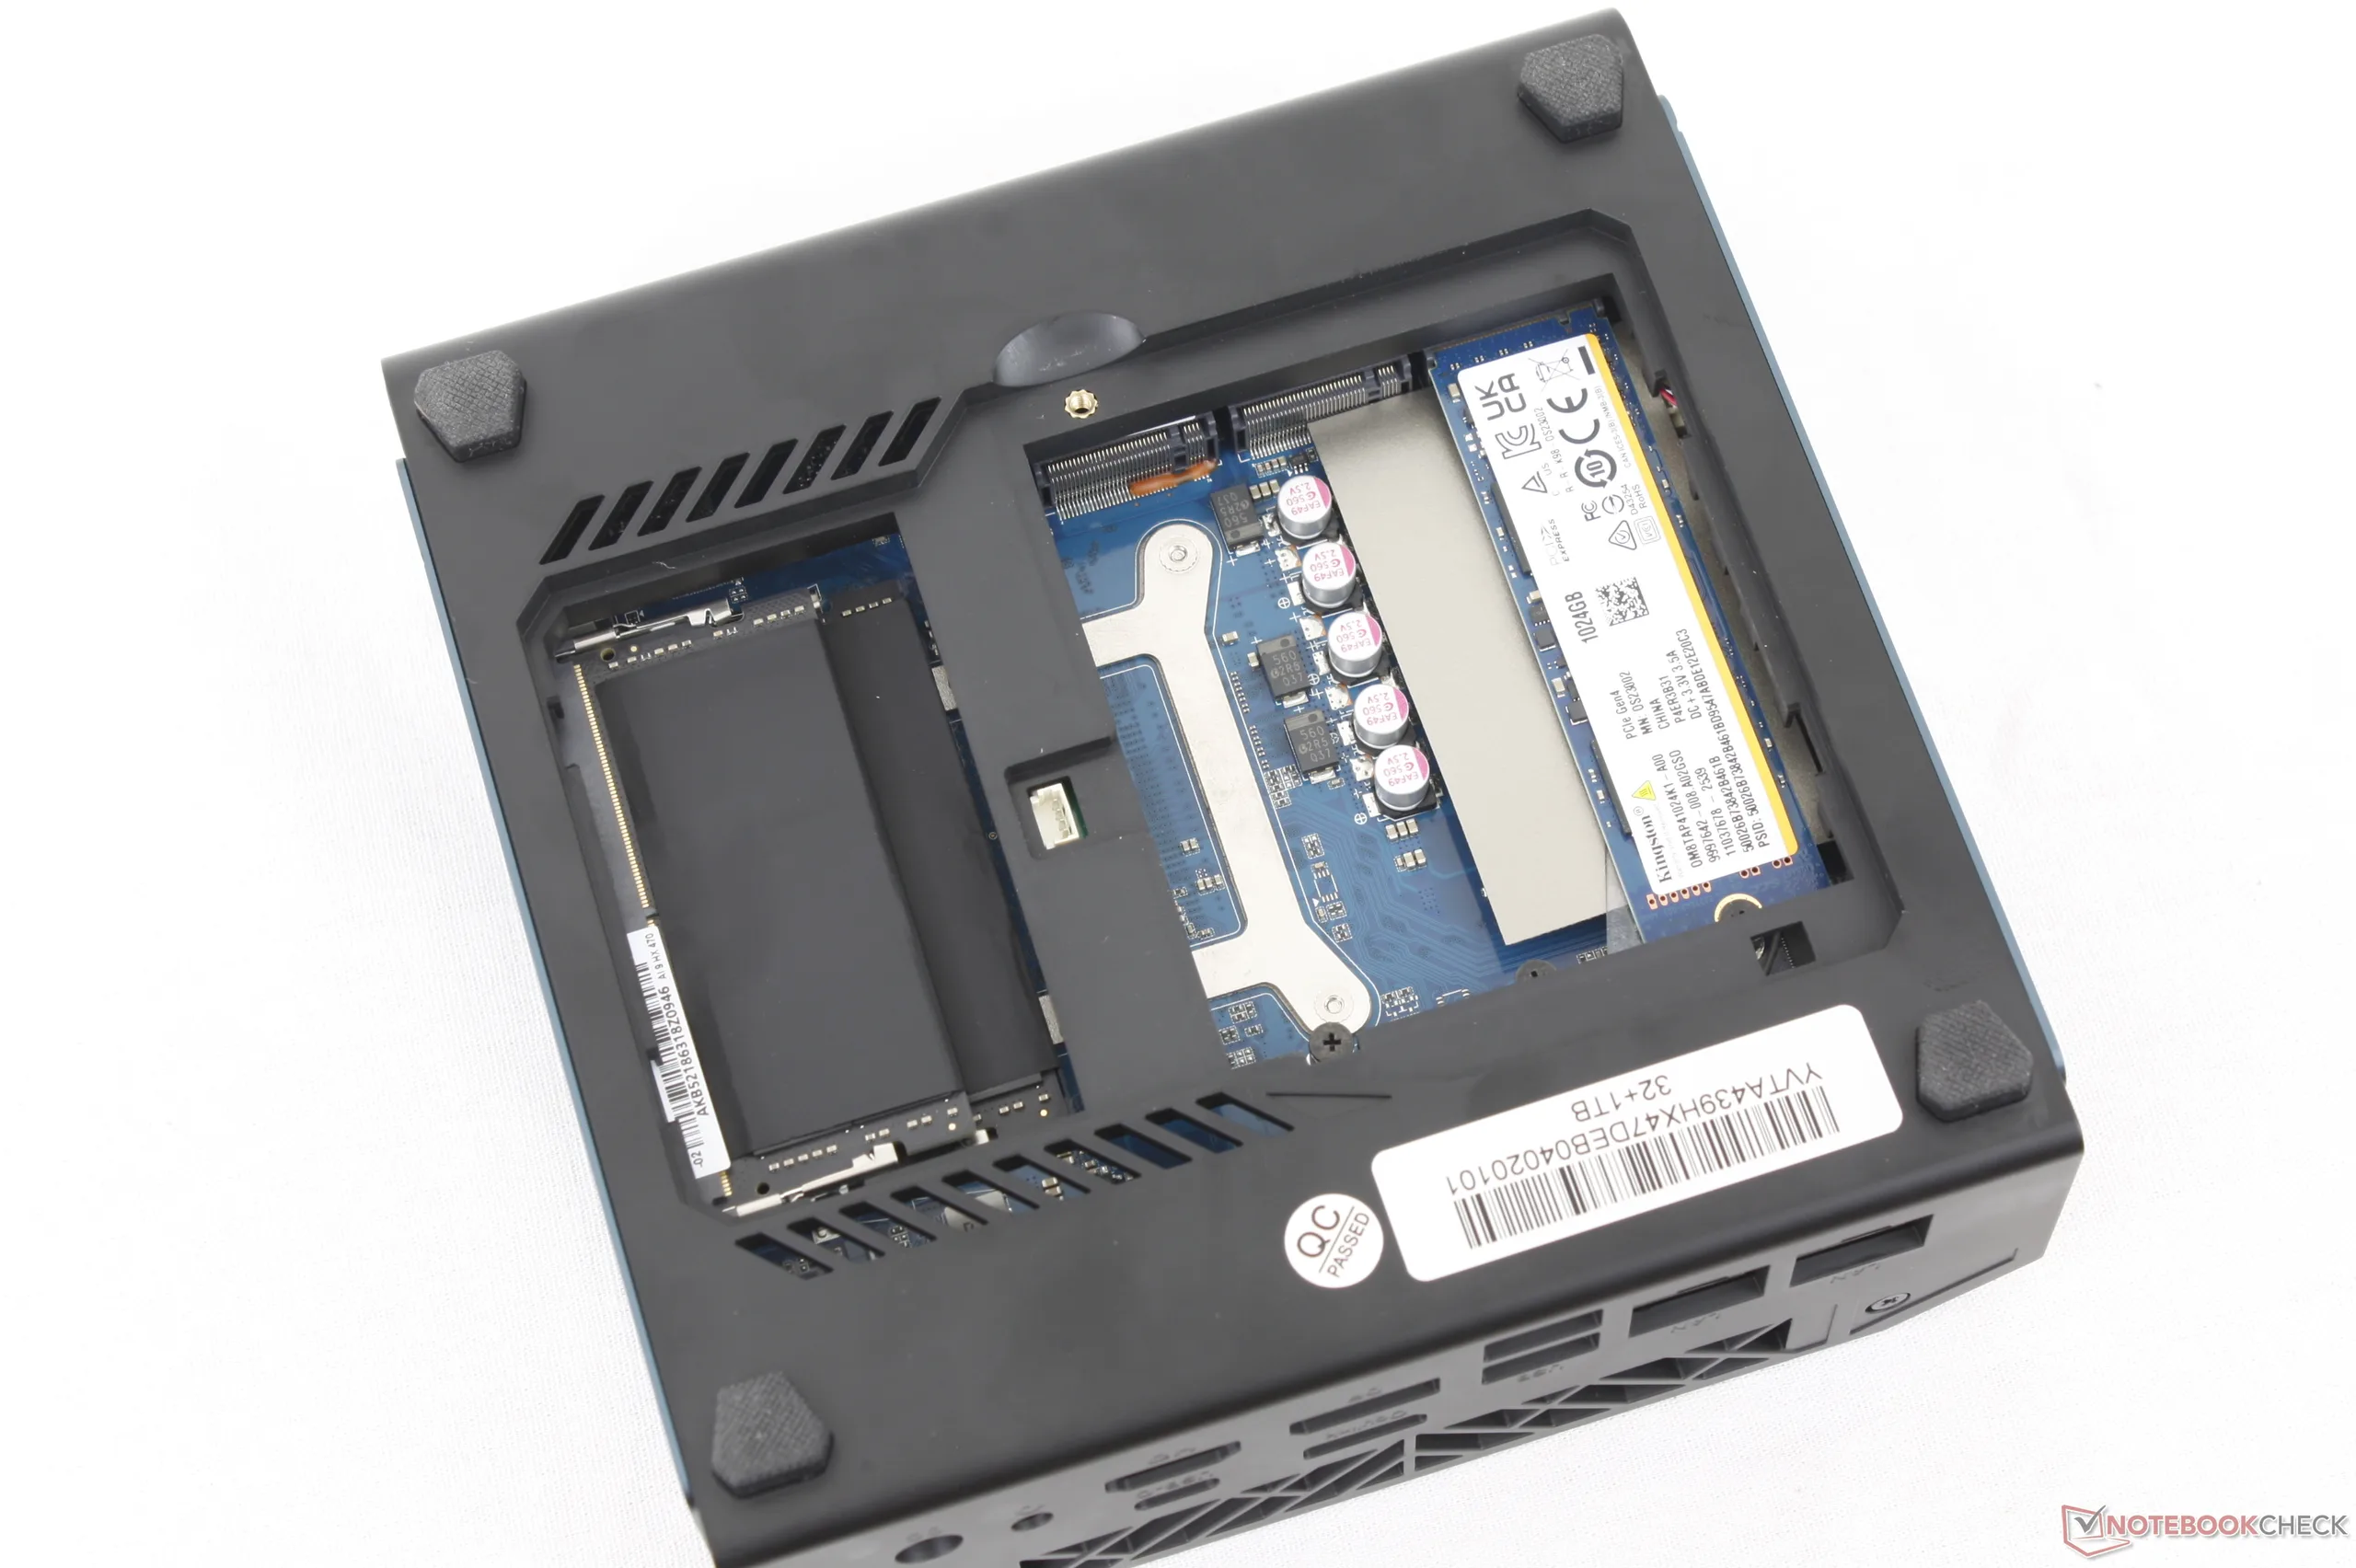
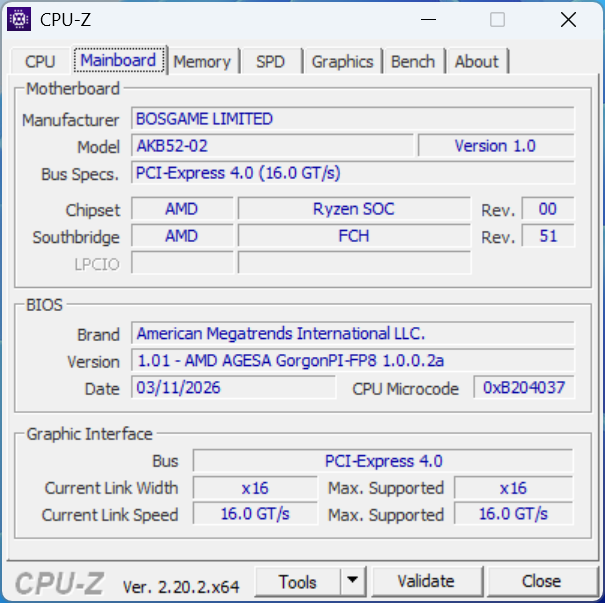
The strongest aspects of the Bosgame VTA-439 are its support for up to three full-size M.2 SSDs, removable RAM, and OcuLink whereas most other mini PCs lack many of these features. The Bosgame is therefore at its best when users can exploit these unique aspects otherwise smaller options are available with processors that are just as fast or even more powerful.
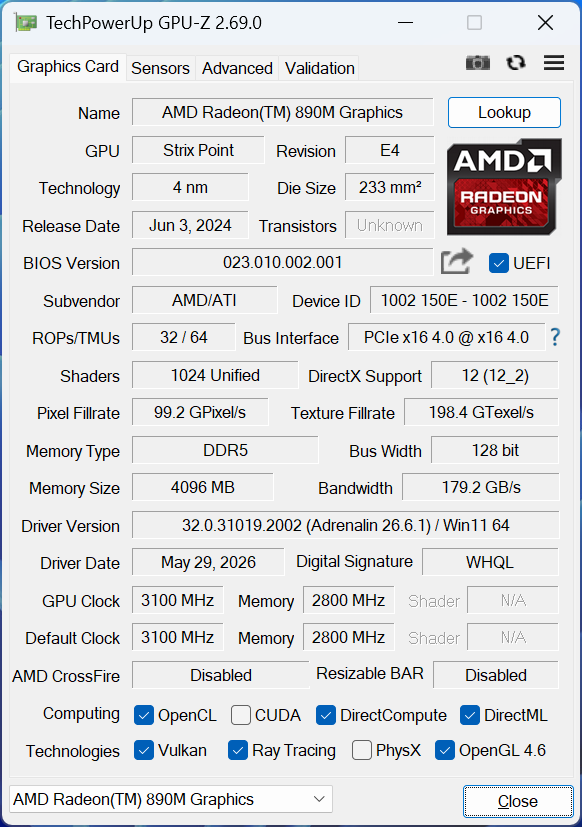
As for the new Ryzen AI 9 HX 470, the Zen 5c CPU can perform up to 15 percent faster than the outgoing Ryzen AI 9 HX 370 which, while welcomed, isn't going to move the needle very much for performance users. Mini PCs with the competing Intel Panther Lake platform can offer much faster graphics performance than the Radeon 890M series for users looking to prioritize iGPU performance.
Notable drawbacks to the VTA-439 include its lack of VESA support, relatively large size, and no integrated microphones or speakers. More HTPC-oriented models like the Beelink SER or GTi series tend to offer such features for better home and voice integration.
Pros
Cons
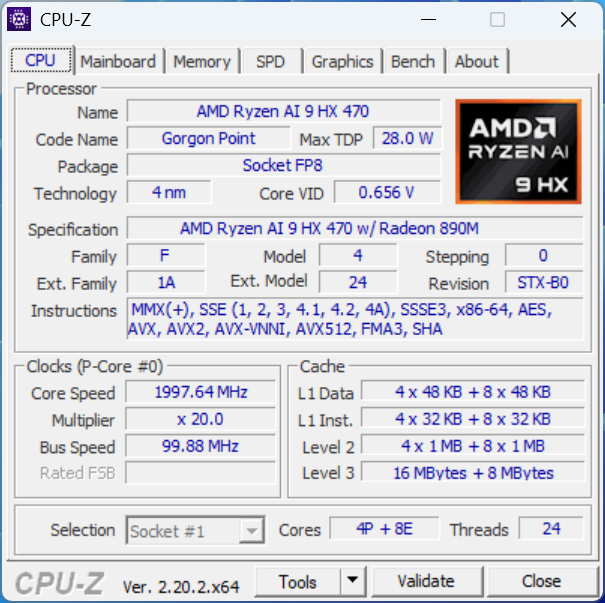
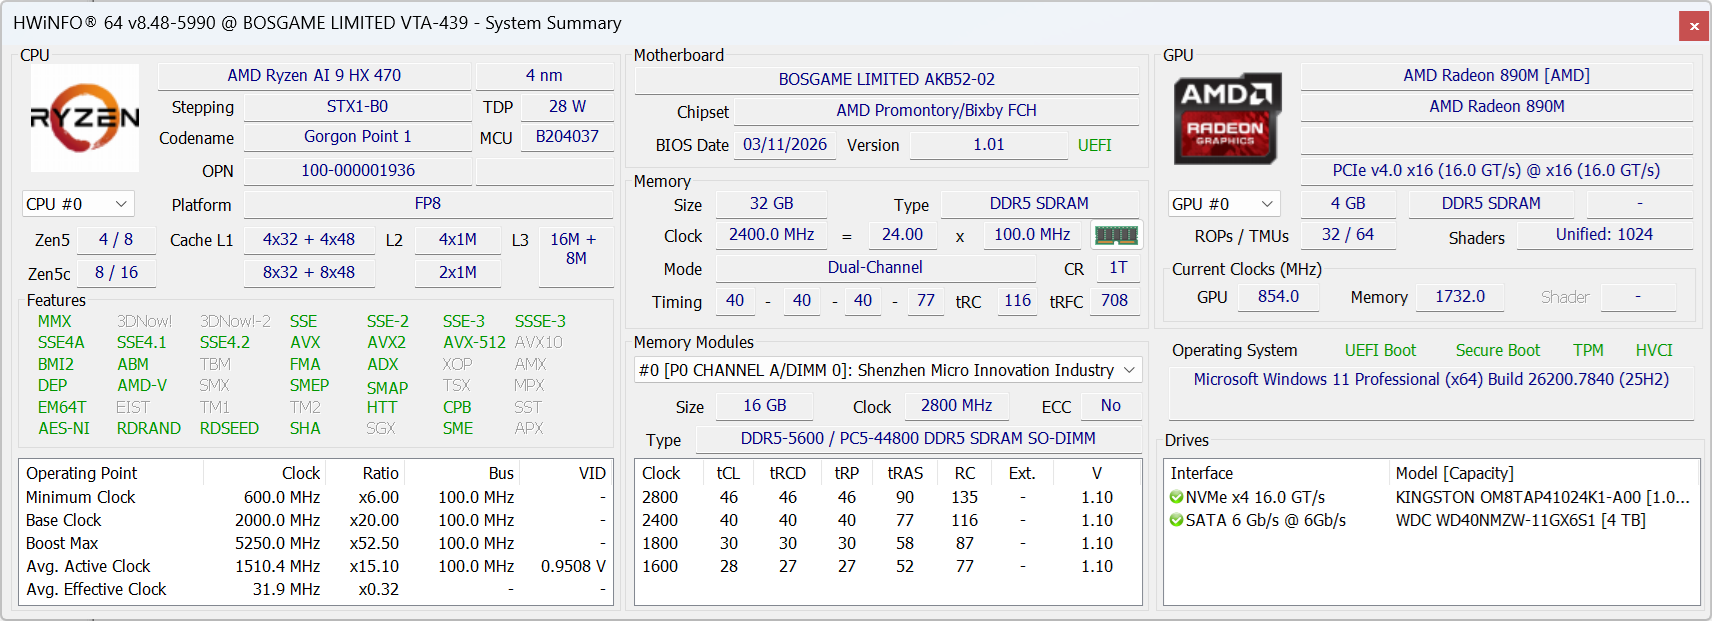
Bosgame is a maker of professional-oriented mini PCs designed with features not typically available on consumer-oriented alternatives. The VTA-439 is the latest professional model equipped with AMD's newest Ryzen AI 9 470 CPU to succeeds last year's Ryzen AI 9 370.
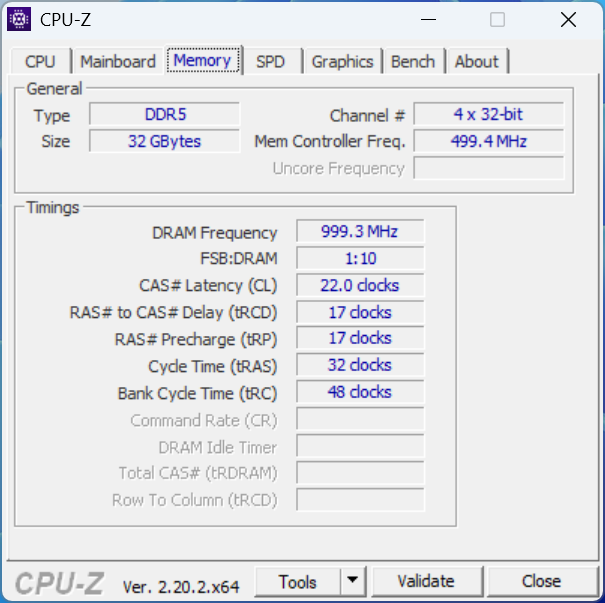
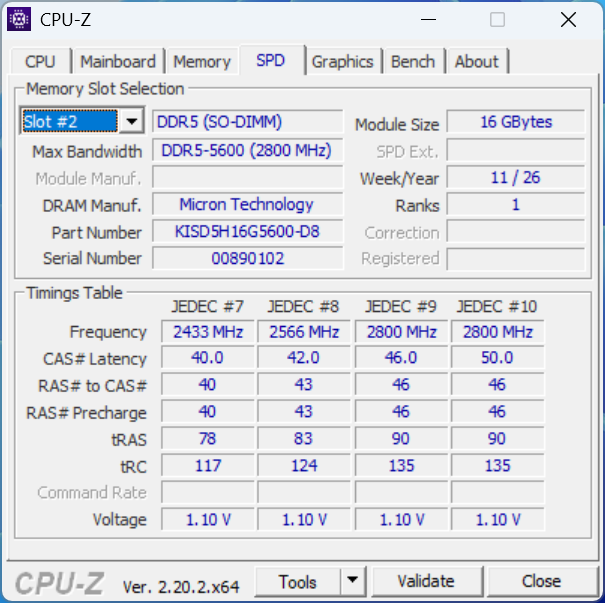
Our test unit comes equipped with the aforementioned Zen 5c CPU alongside 32 GB of RAM and 1 TB SSD for approximately $1050. Barebone options are unfortunately not available at the time of writing.
Competitors to the VTA-439 include other office-oriented mini PCs like the GMK EVO series or the Asus NUC series.
More Bosgame reviews:
Specifications
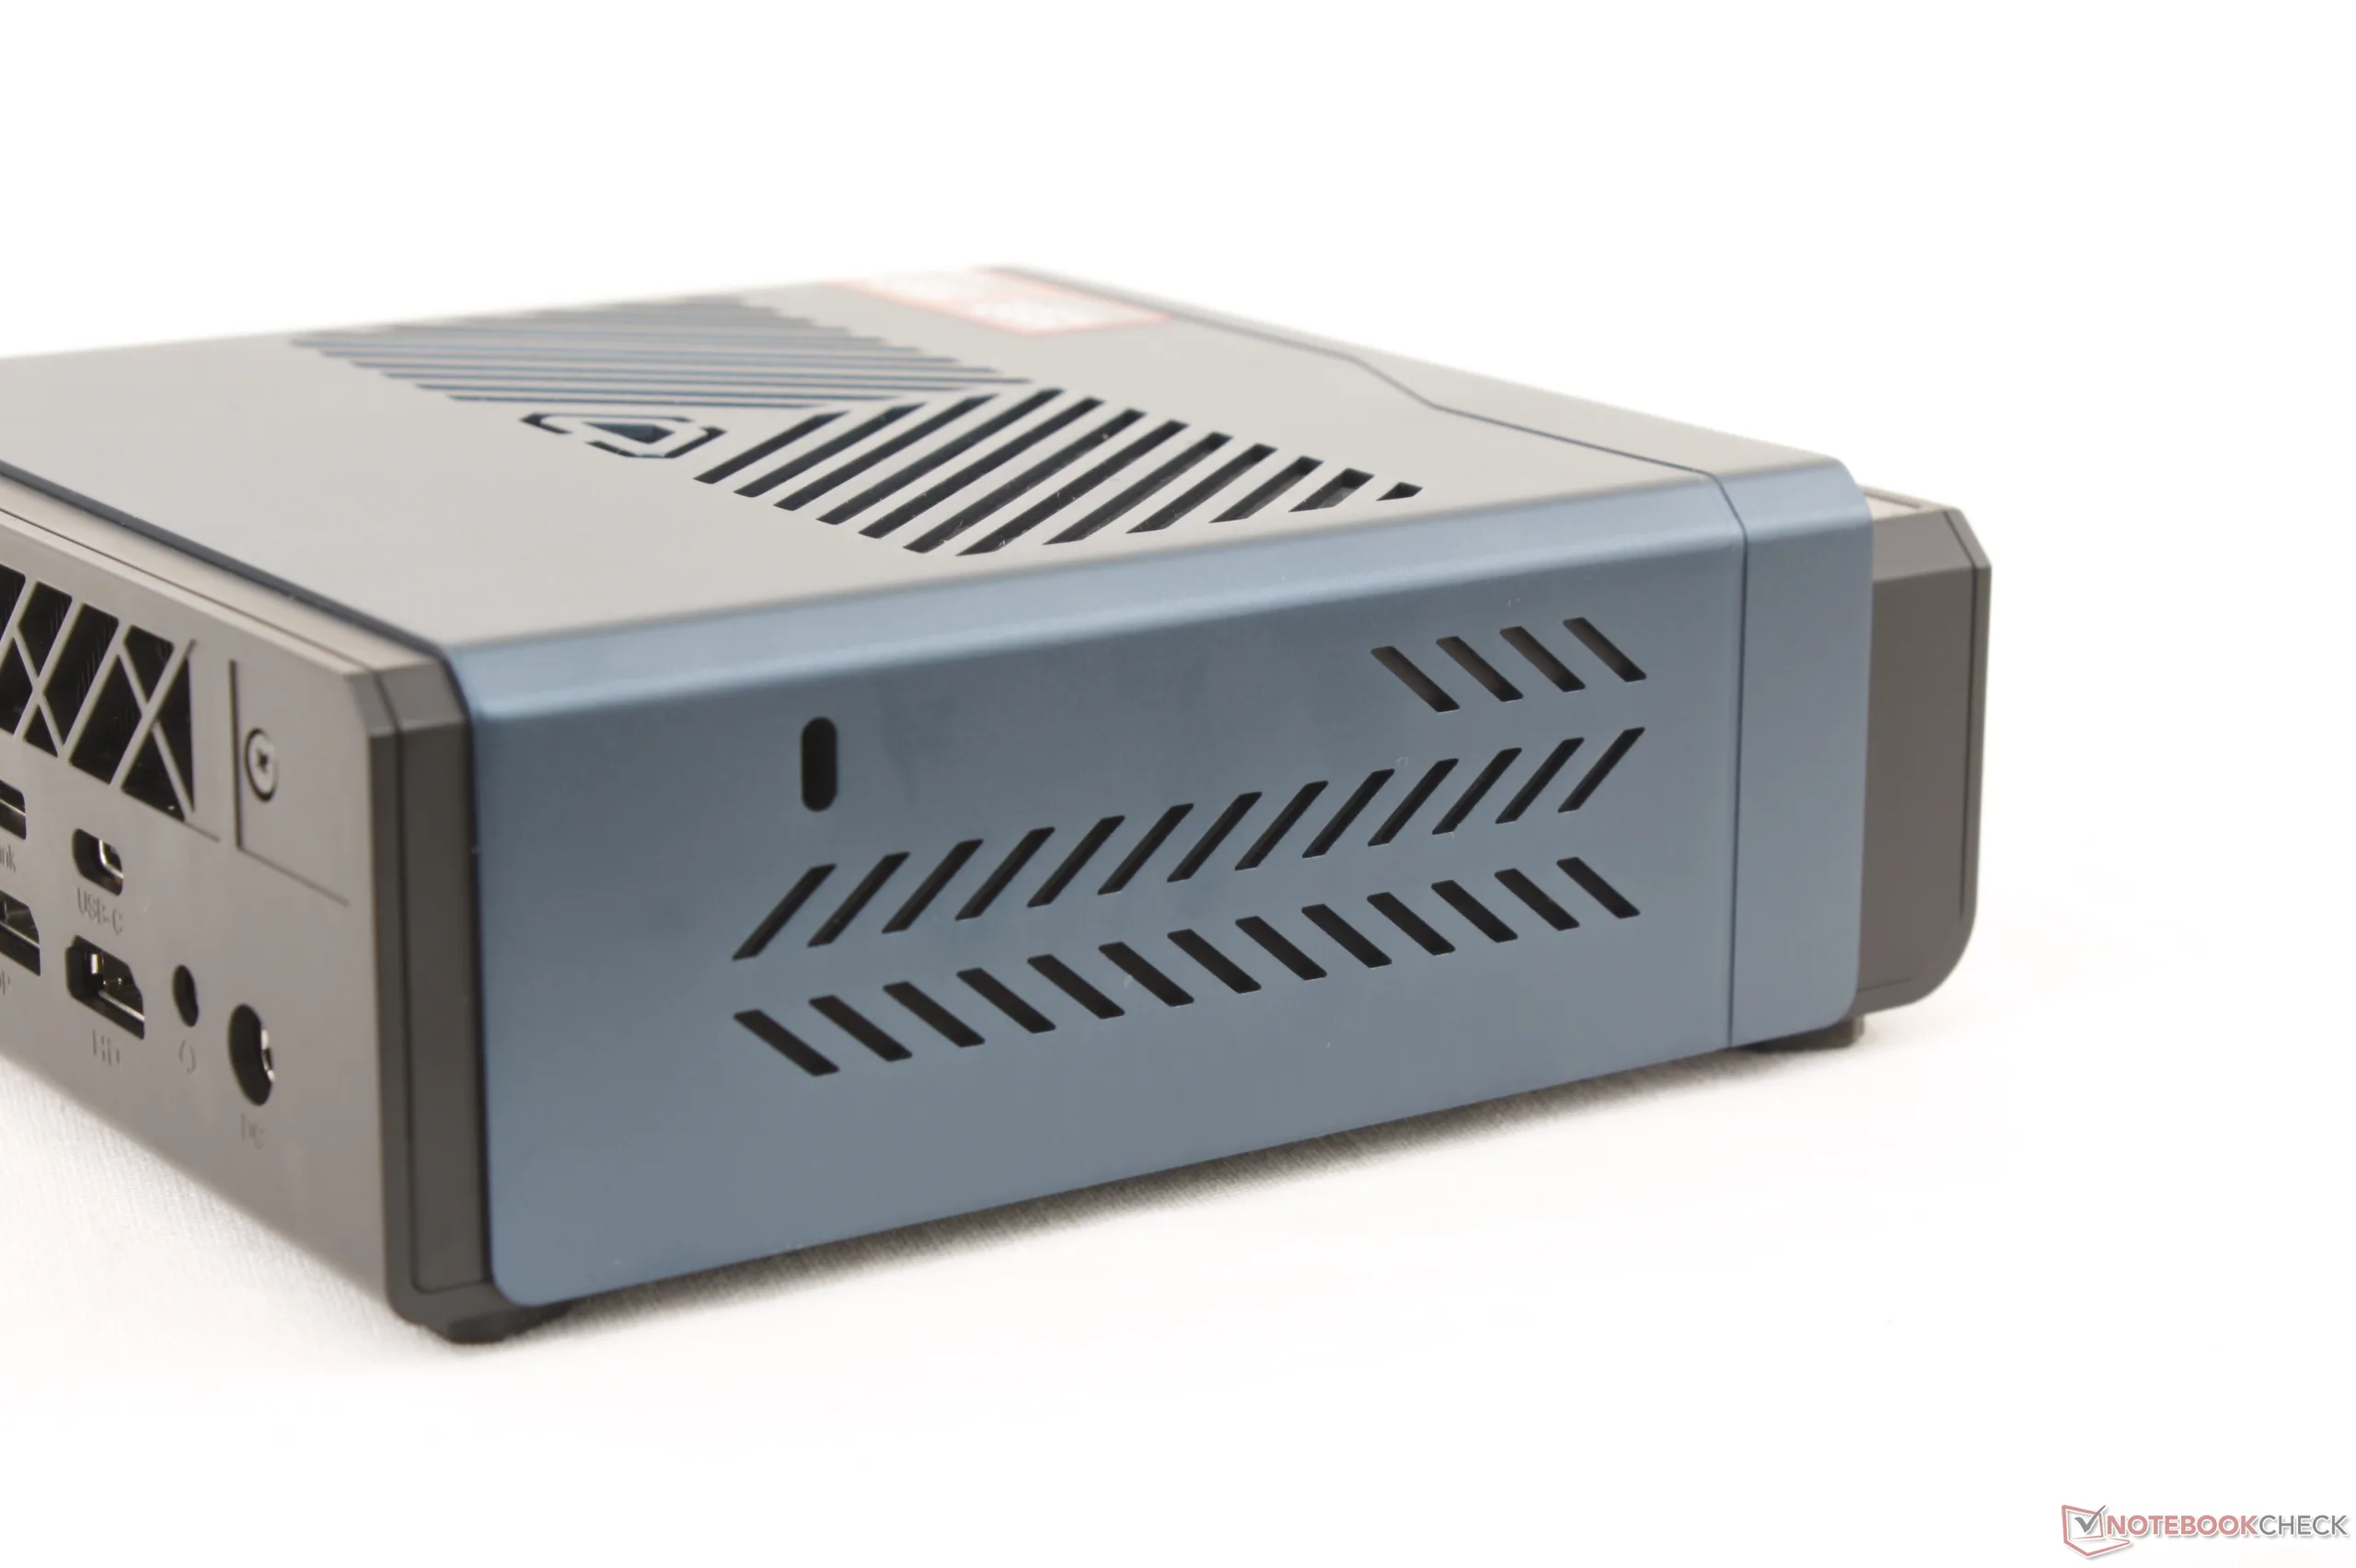
Case
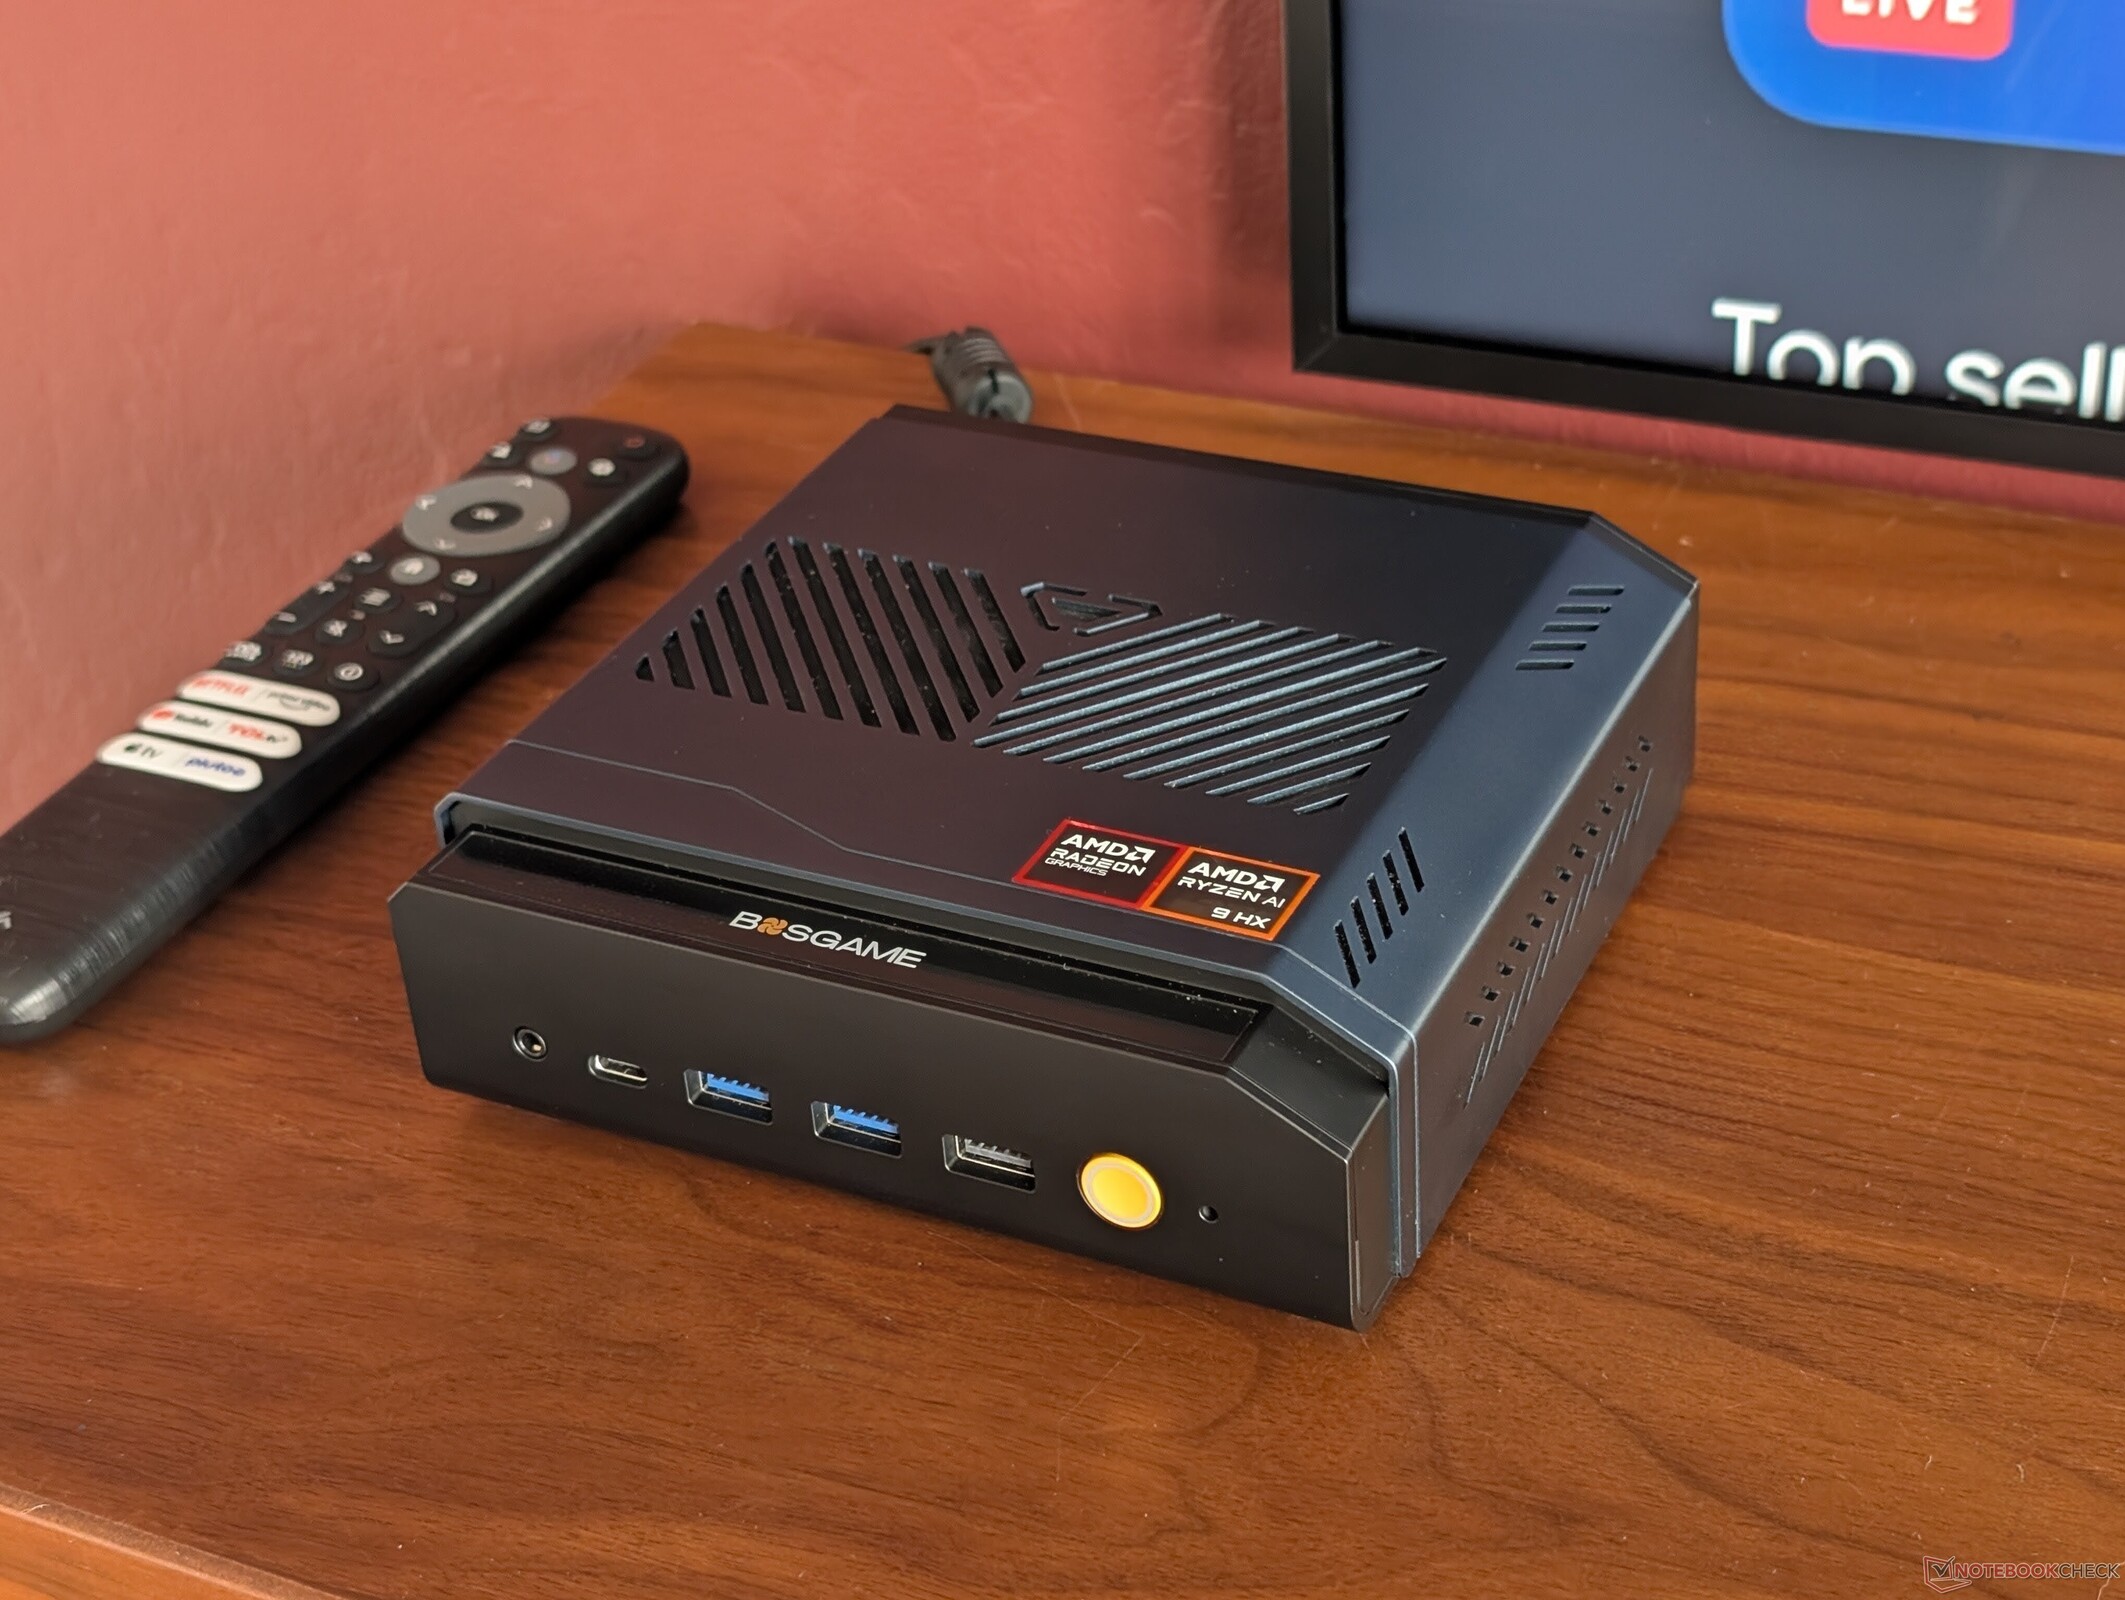
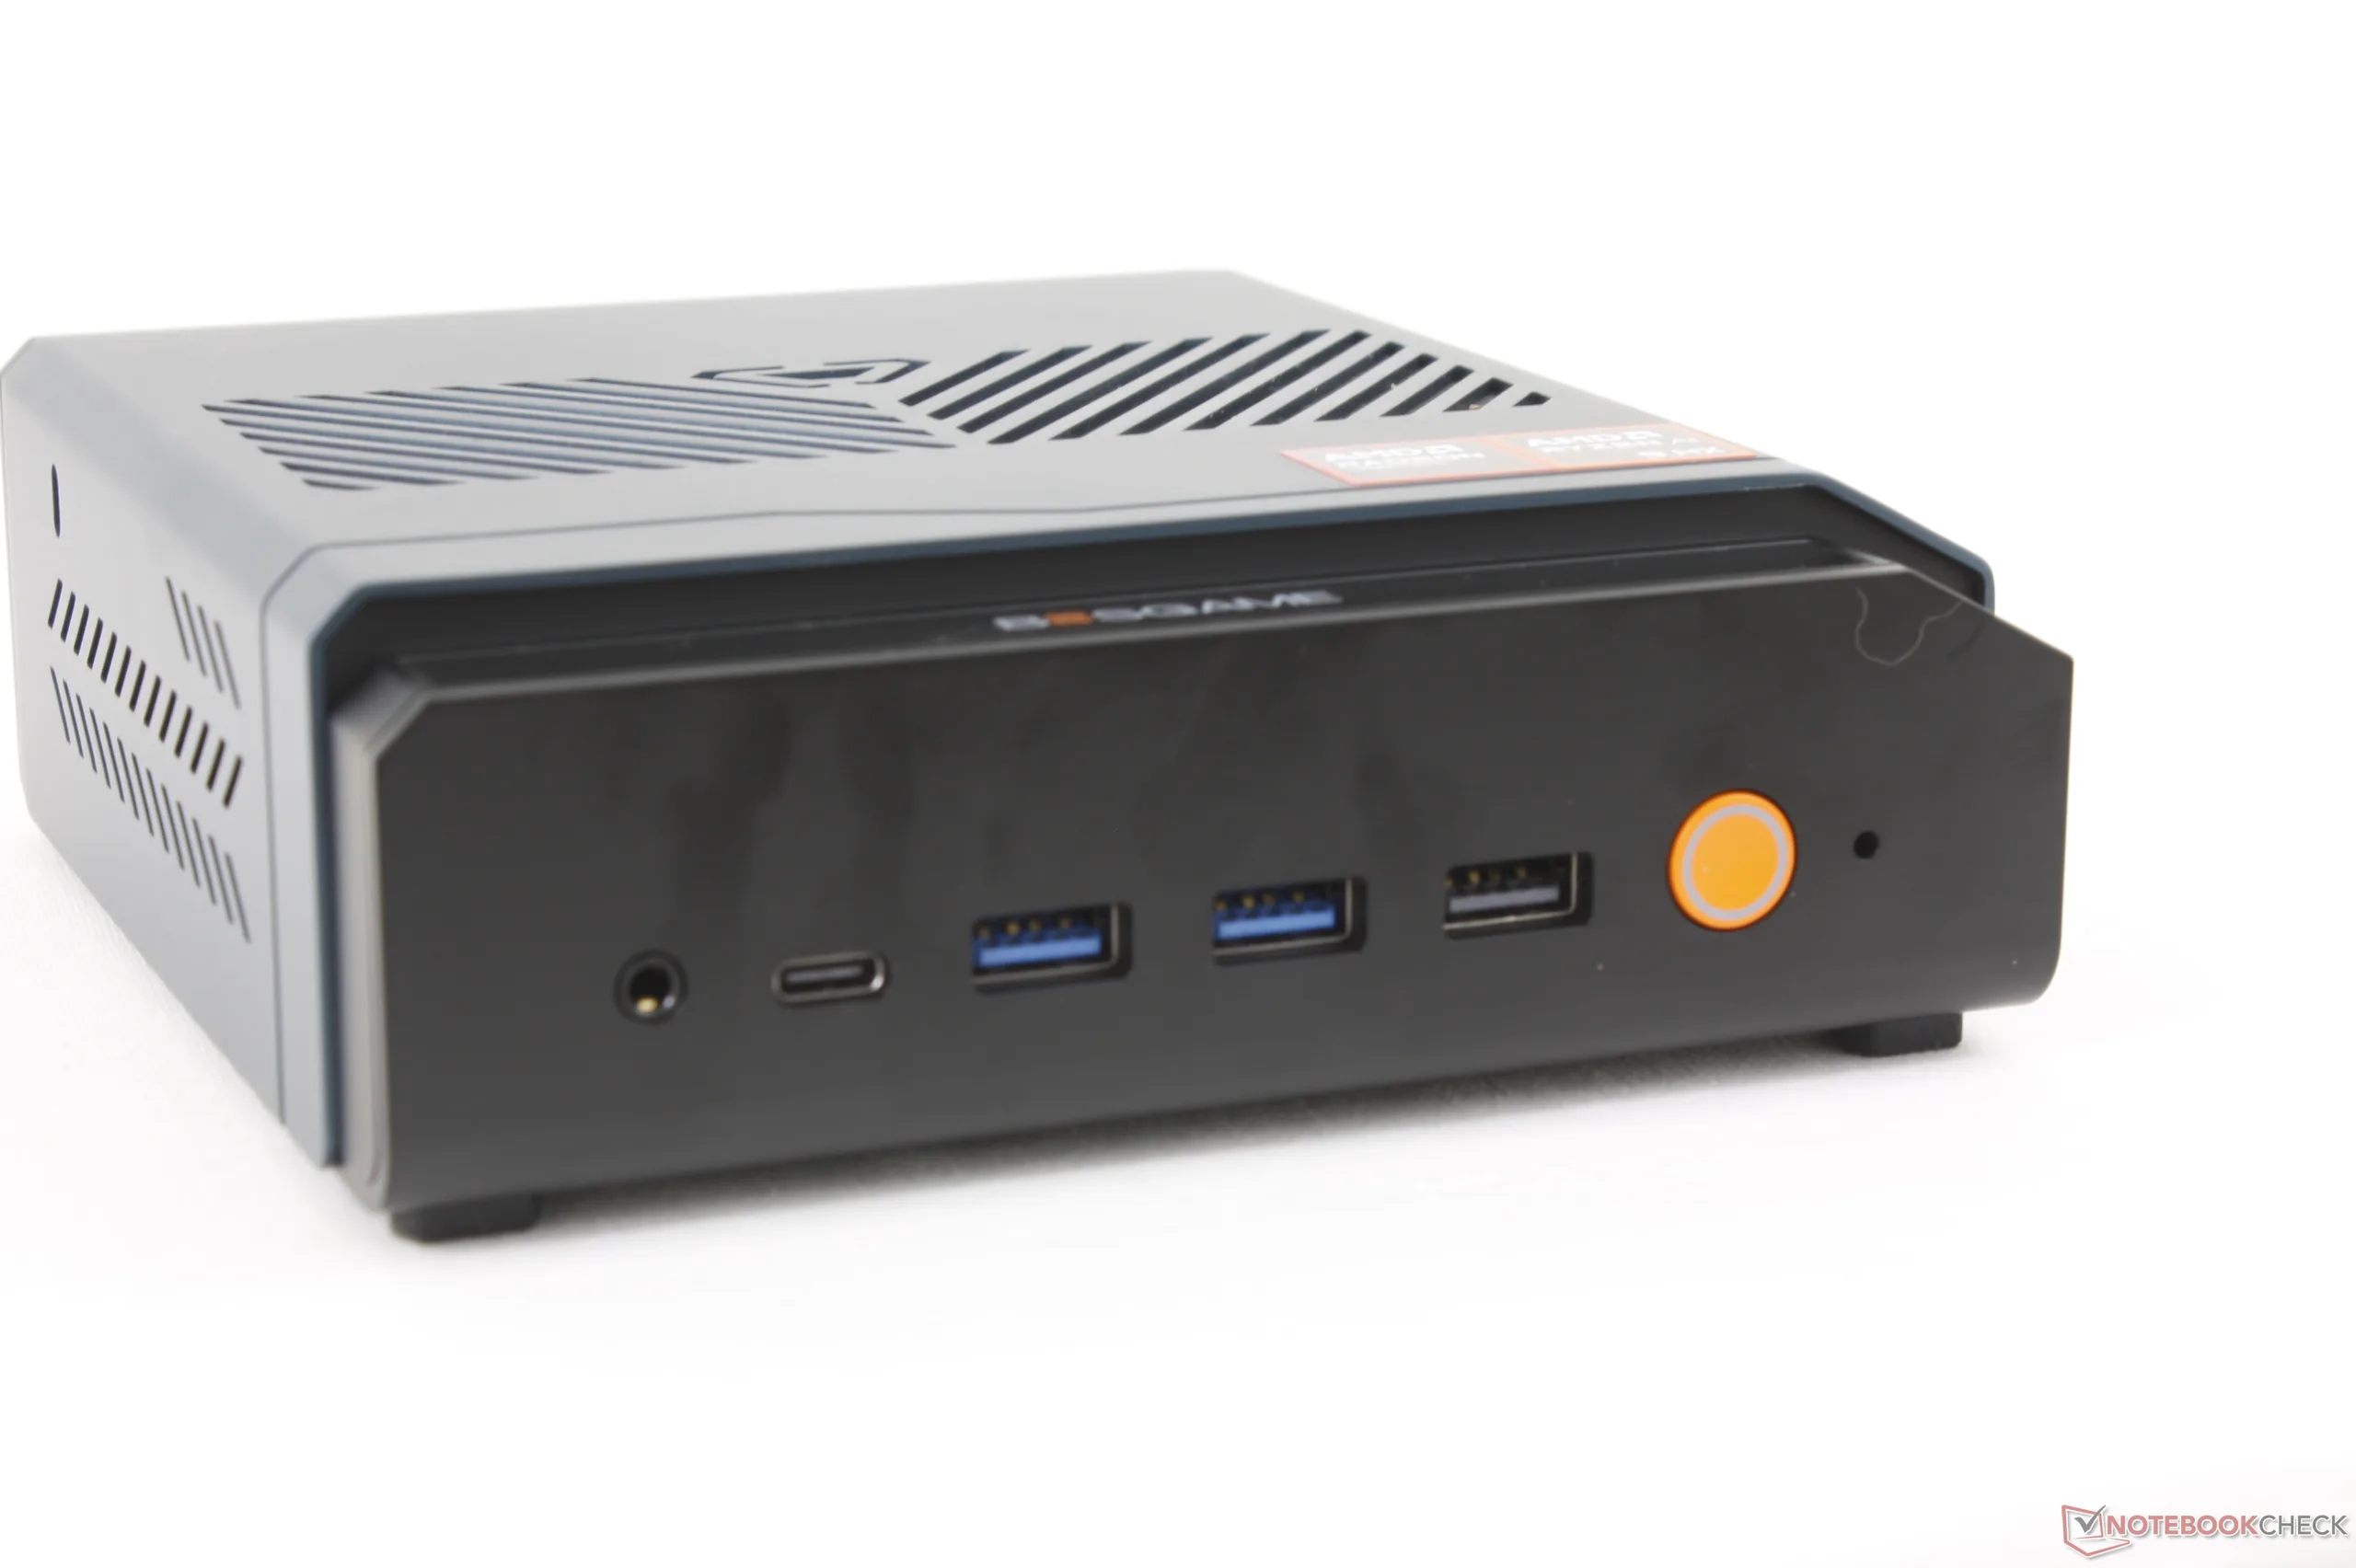
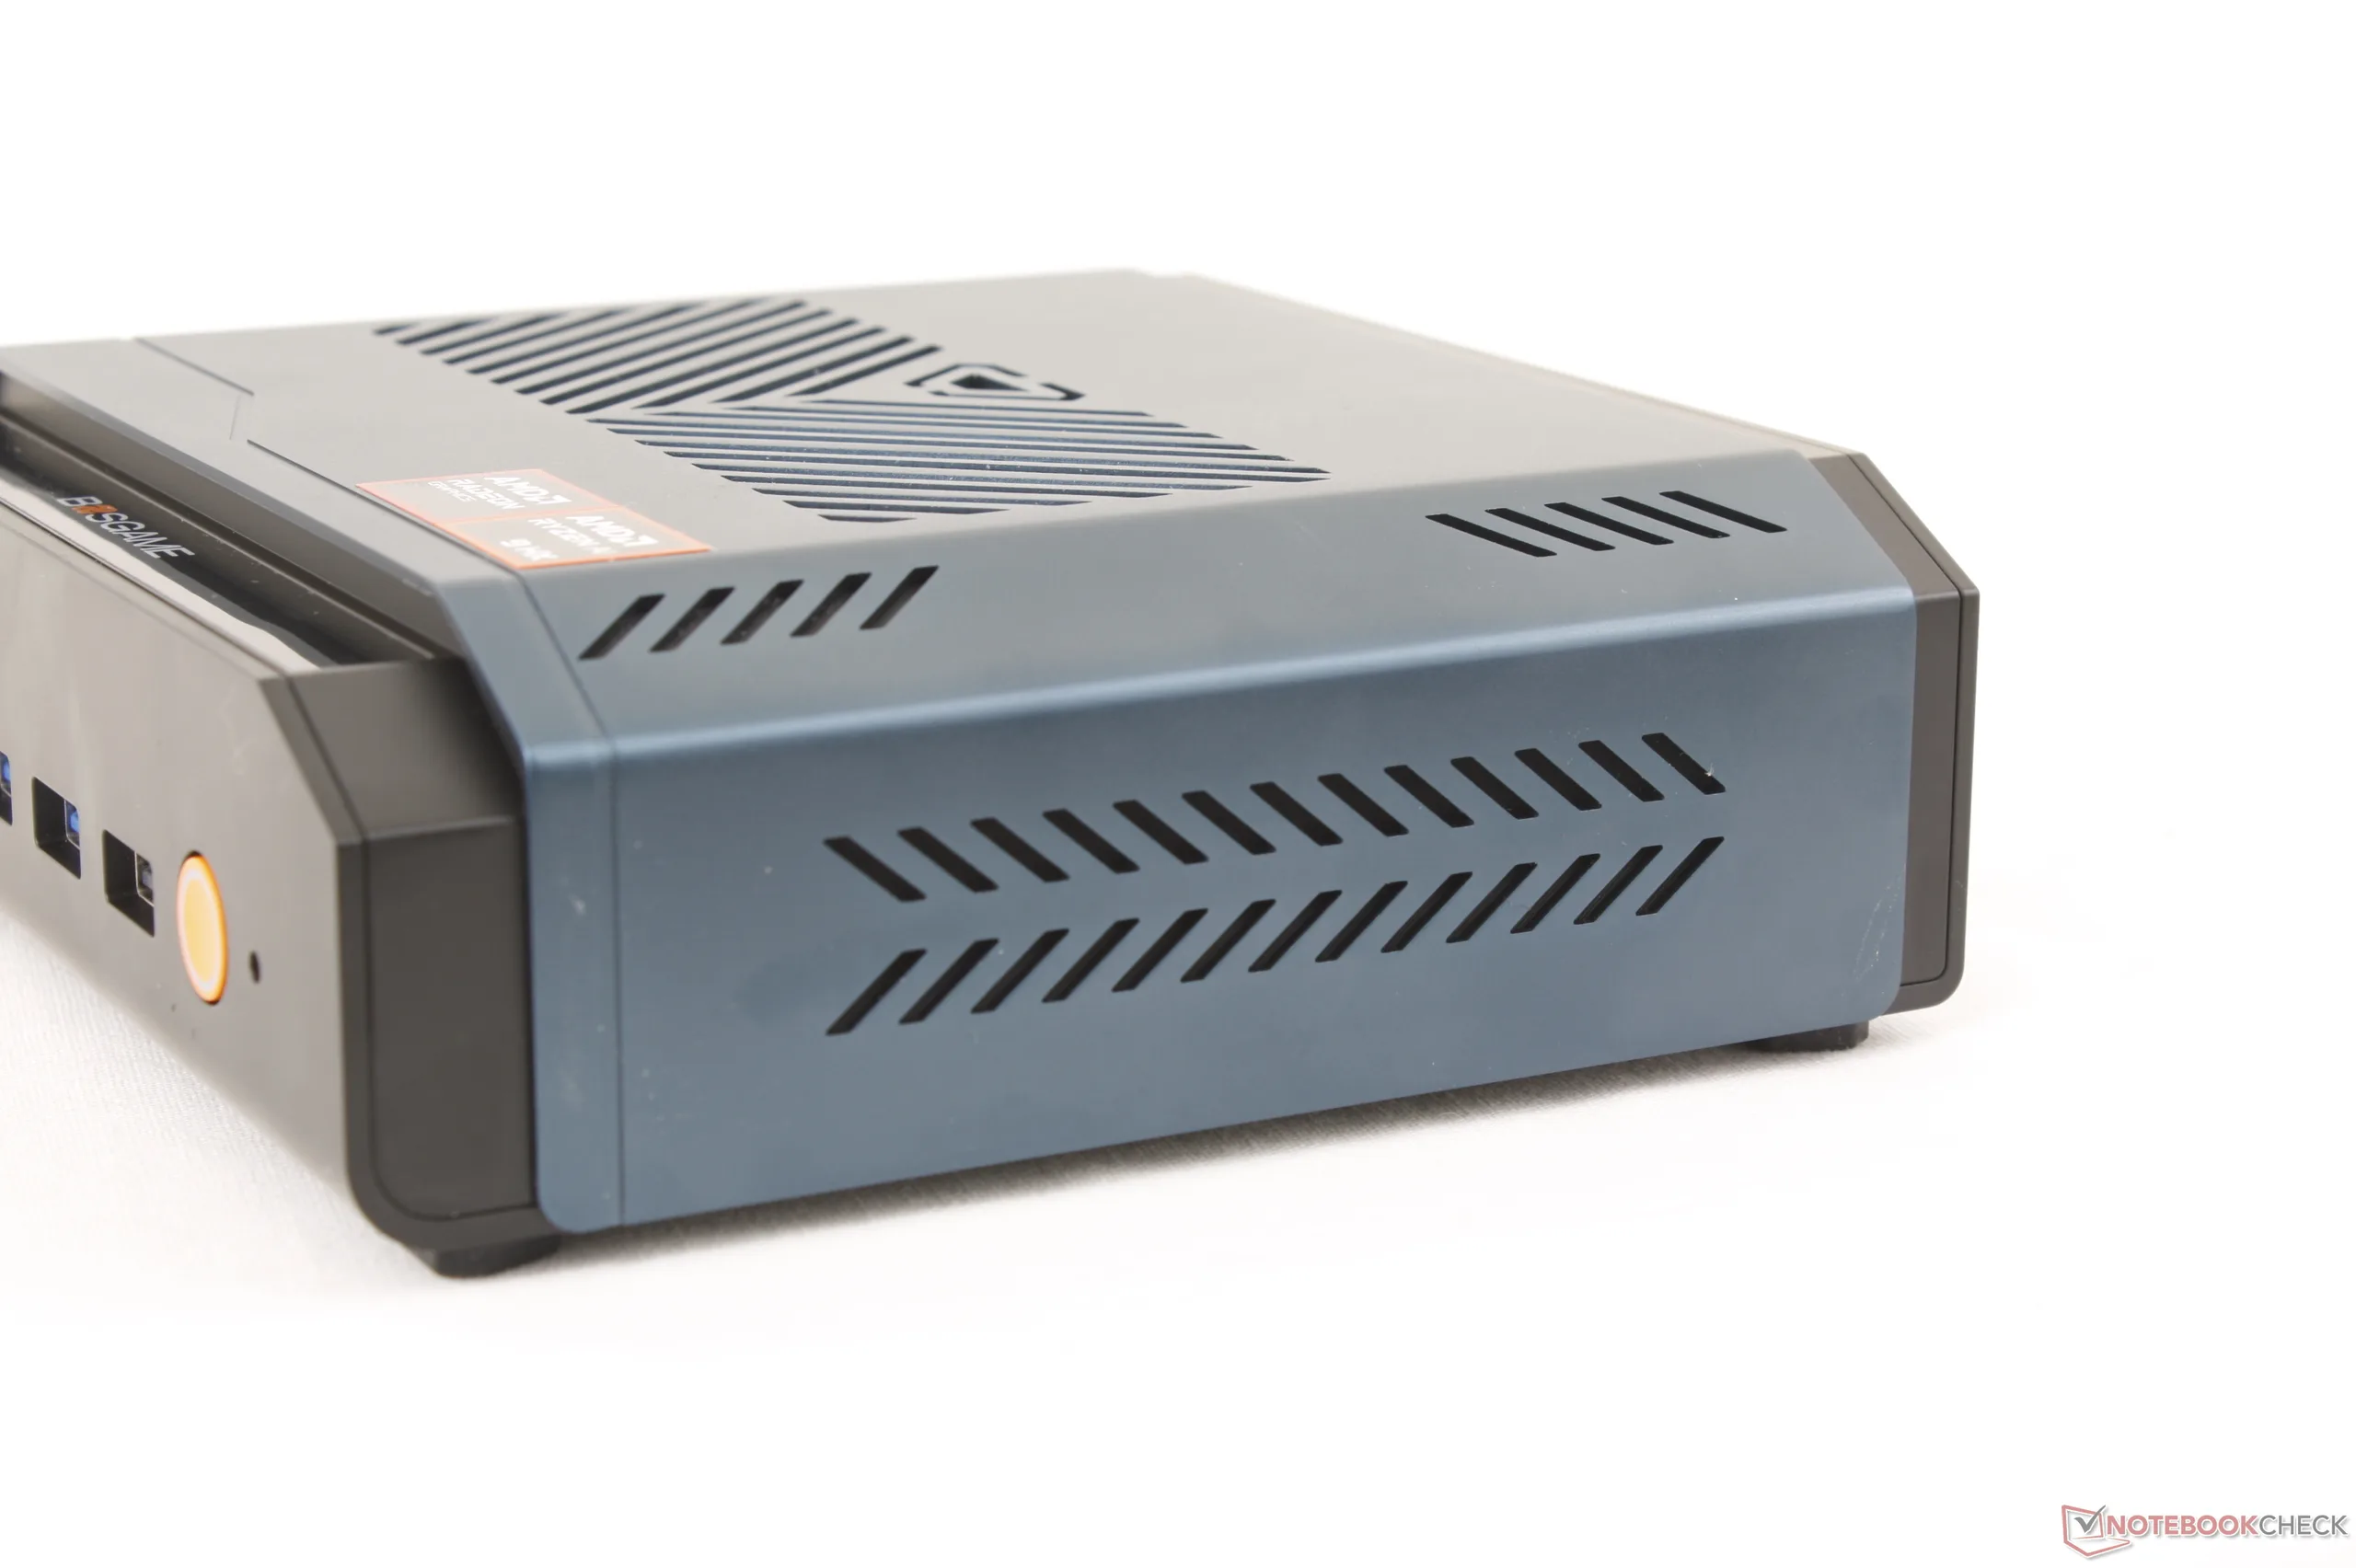
The industrial chassis design is a breath of fresh air to contrast the minimalist look of the Mac Mini or Beelink GTi. We particularly appreciate how the overt vents complement the visual design whereas they are usually hidden or minimized on other mini PCs. Surfaces are firm with minimal yield, but the black front and rear are easily susceptible to fingerprints.
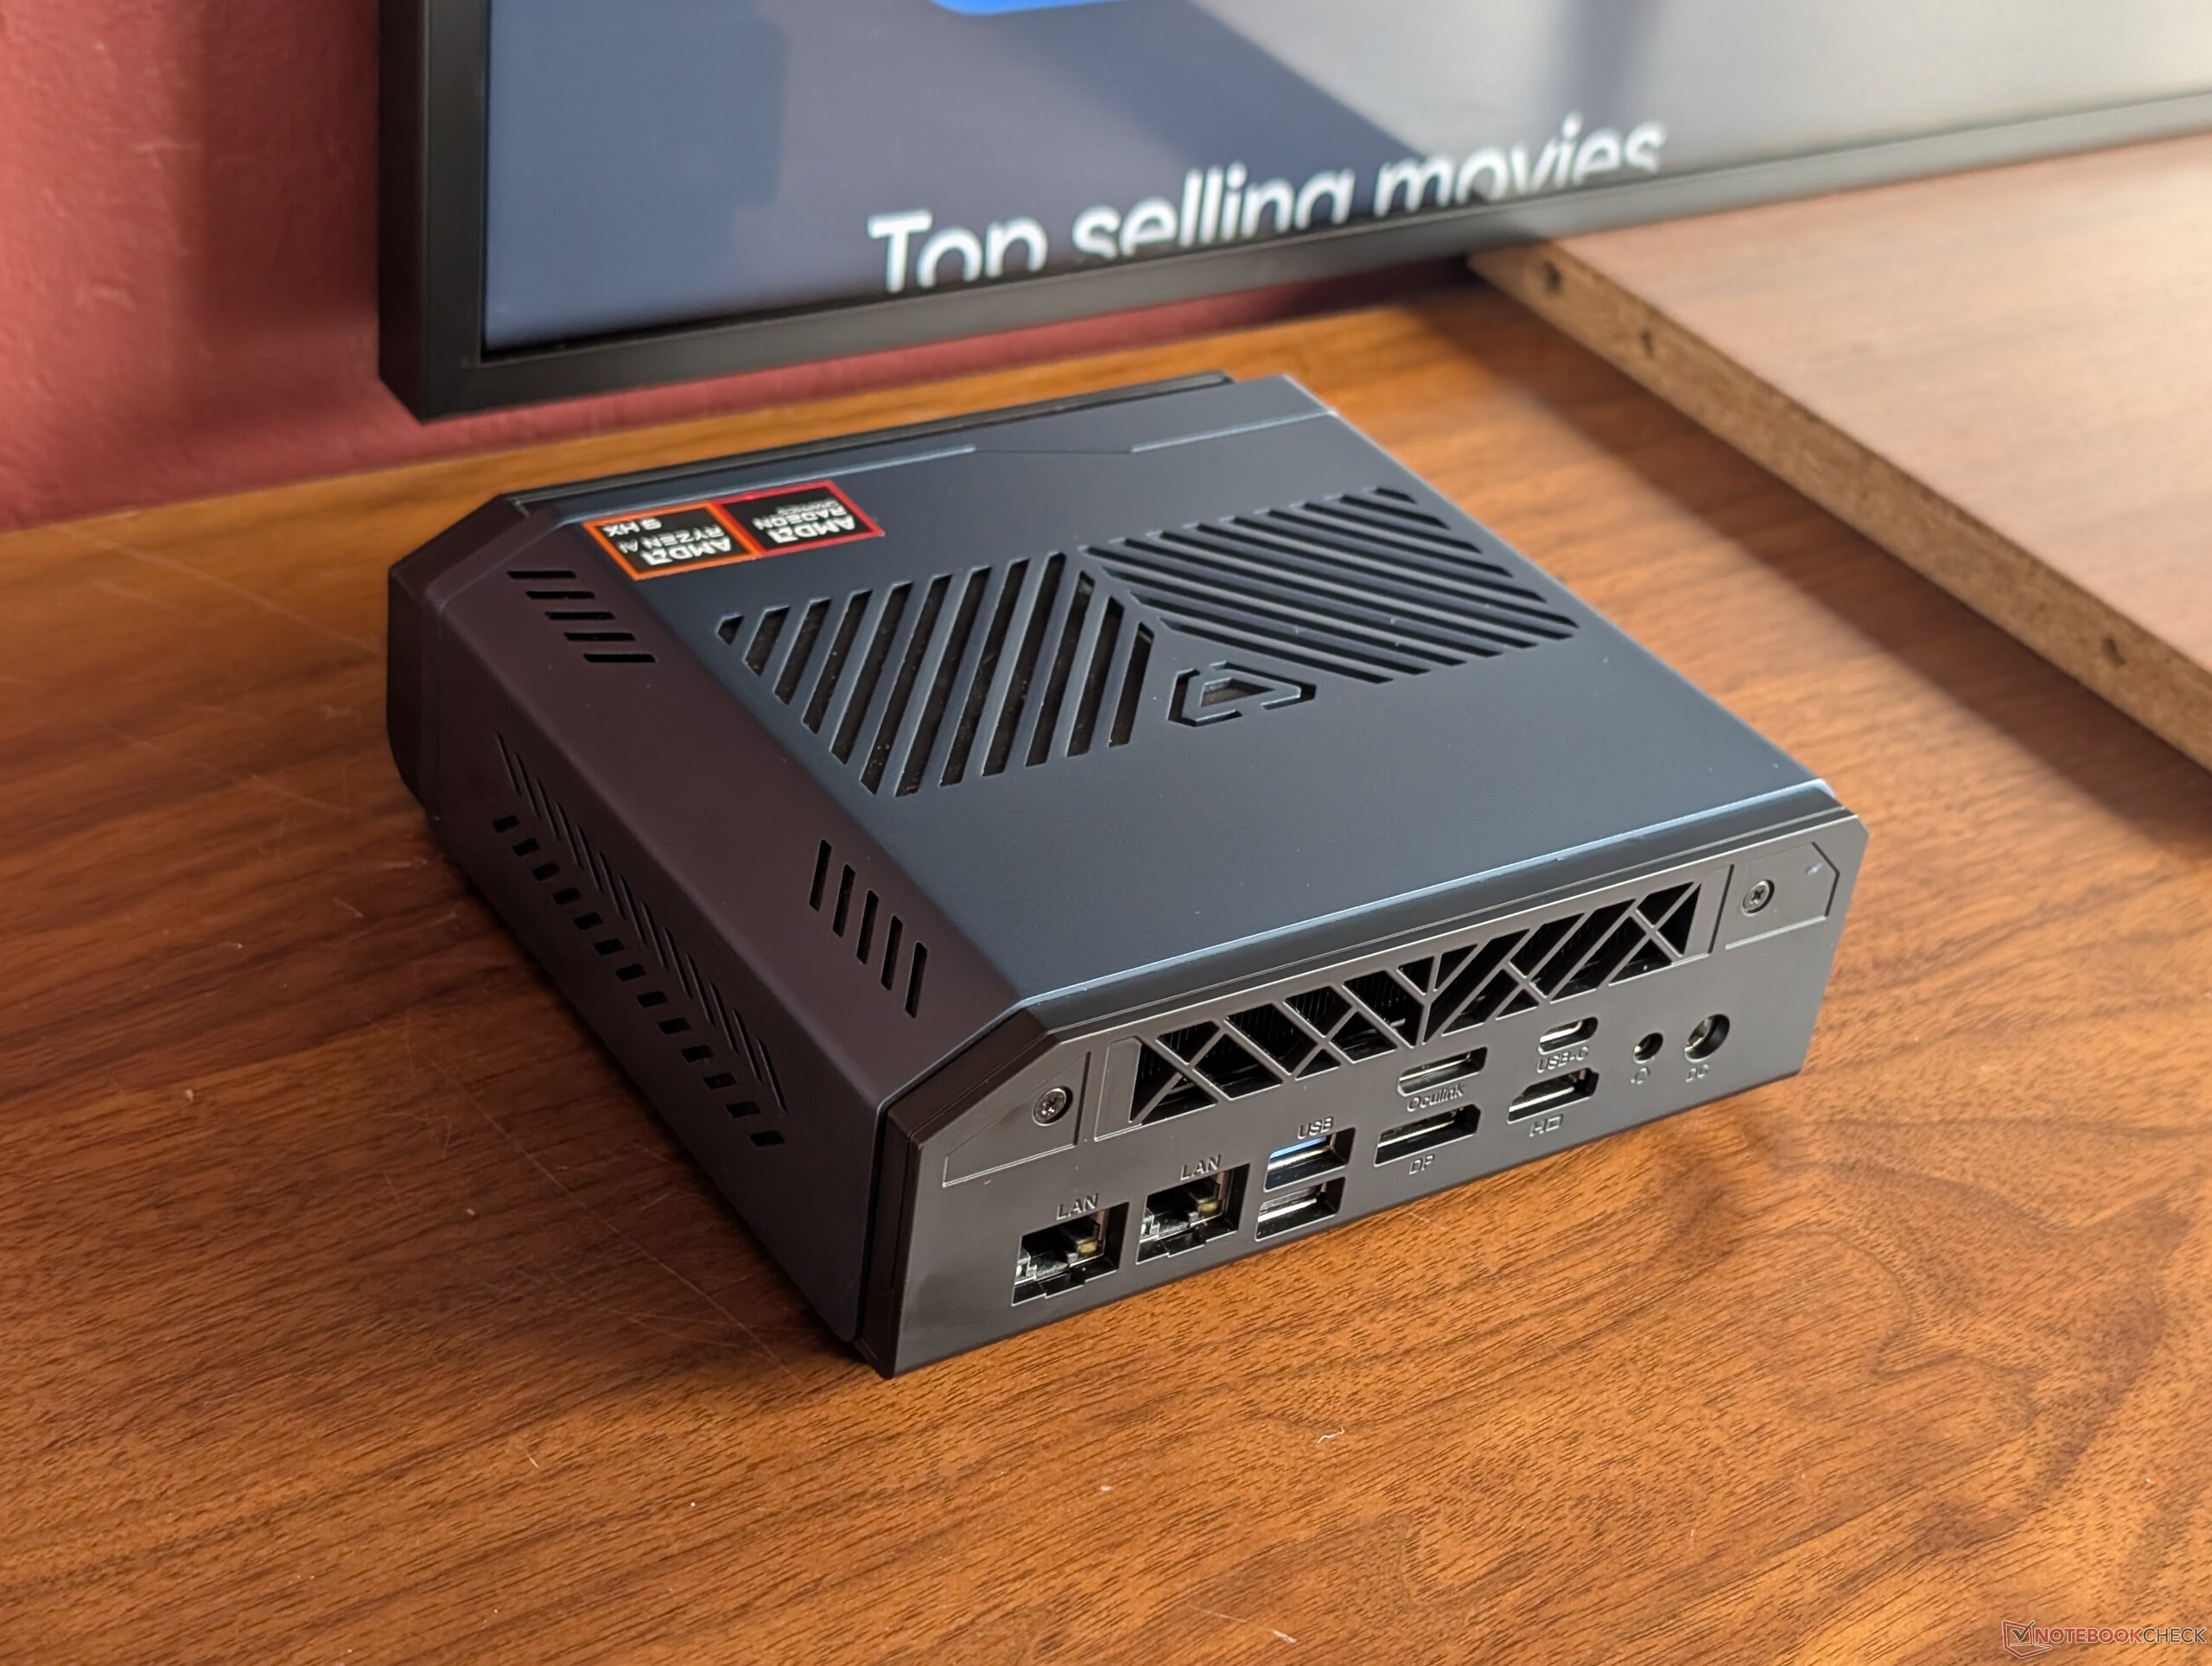
Connectivity
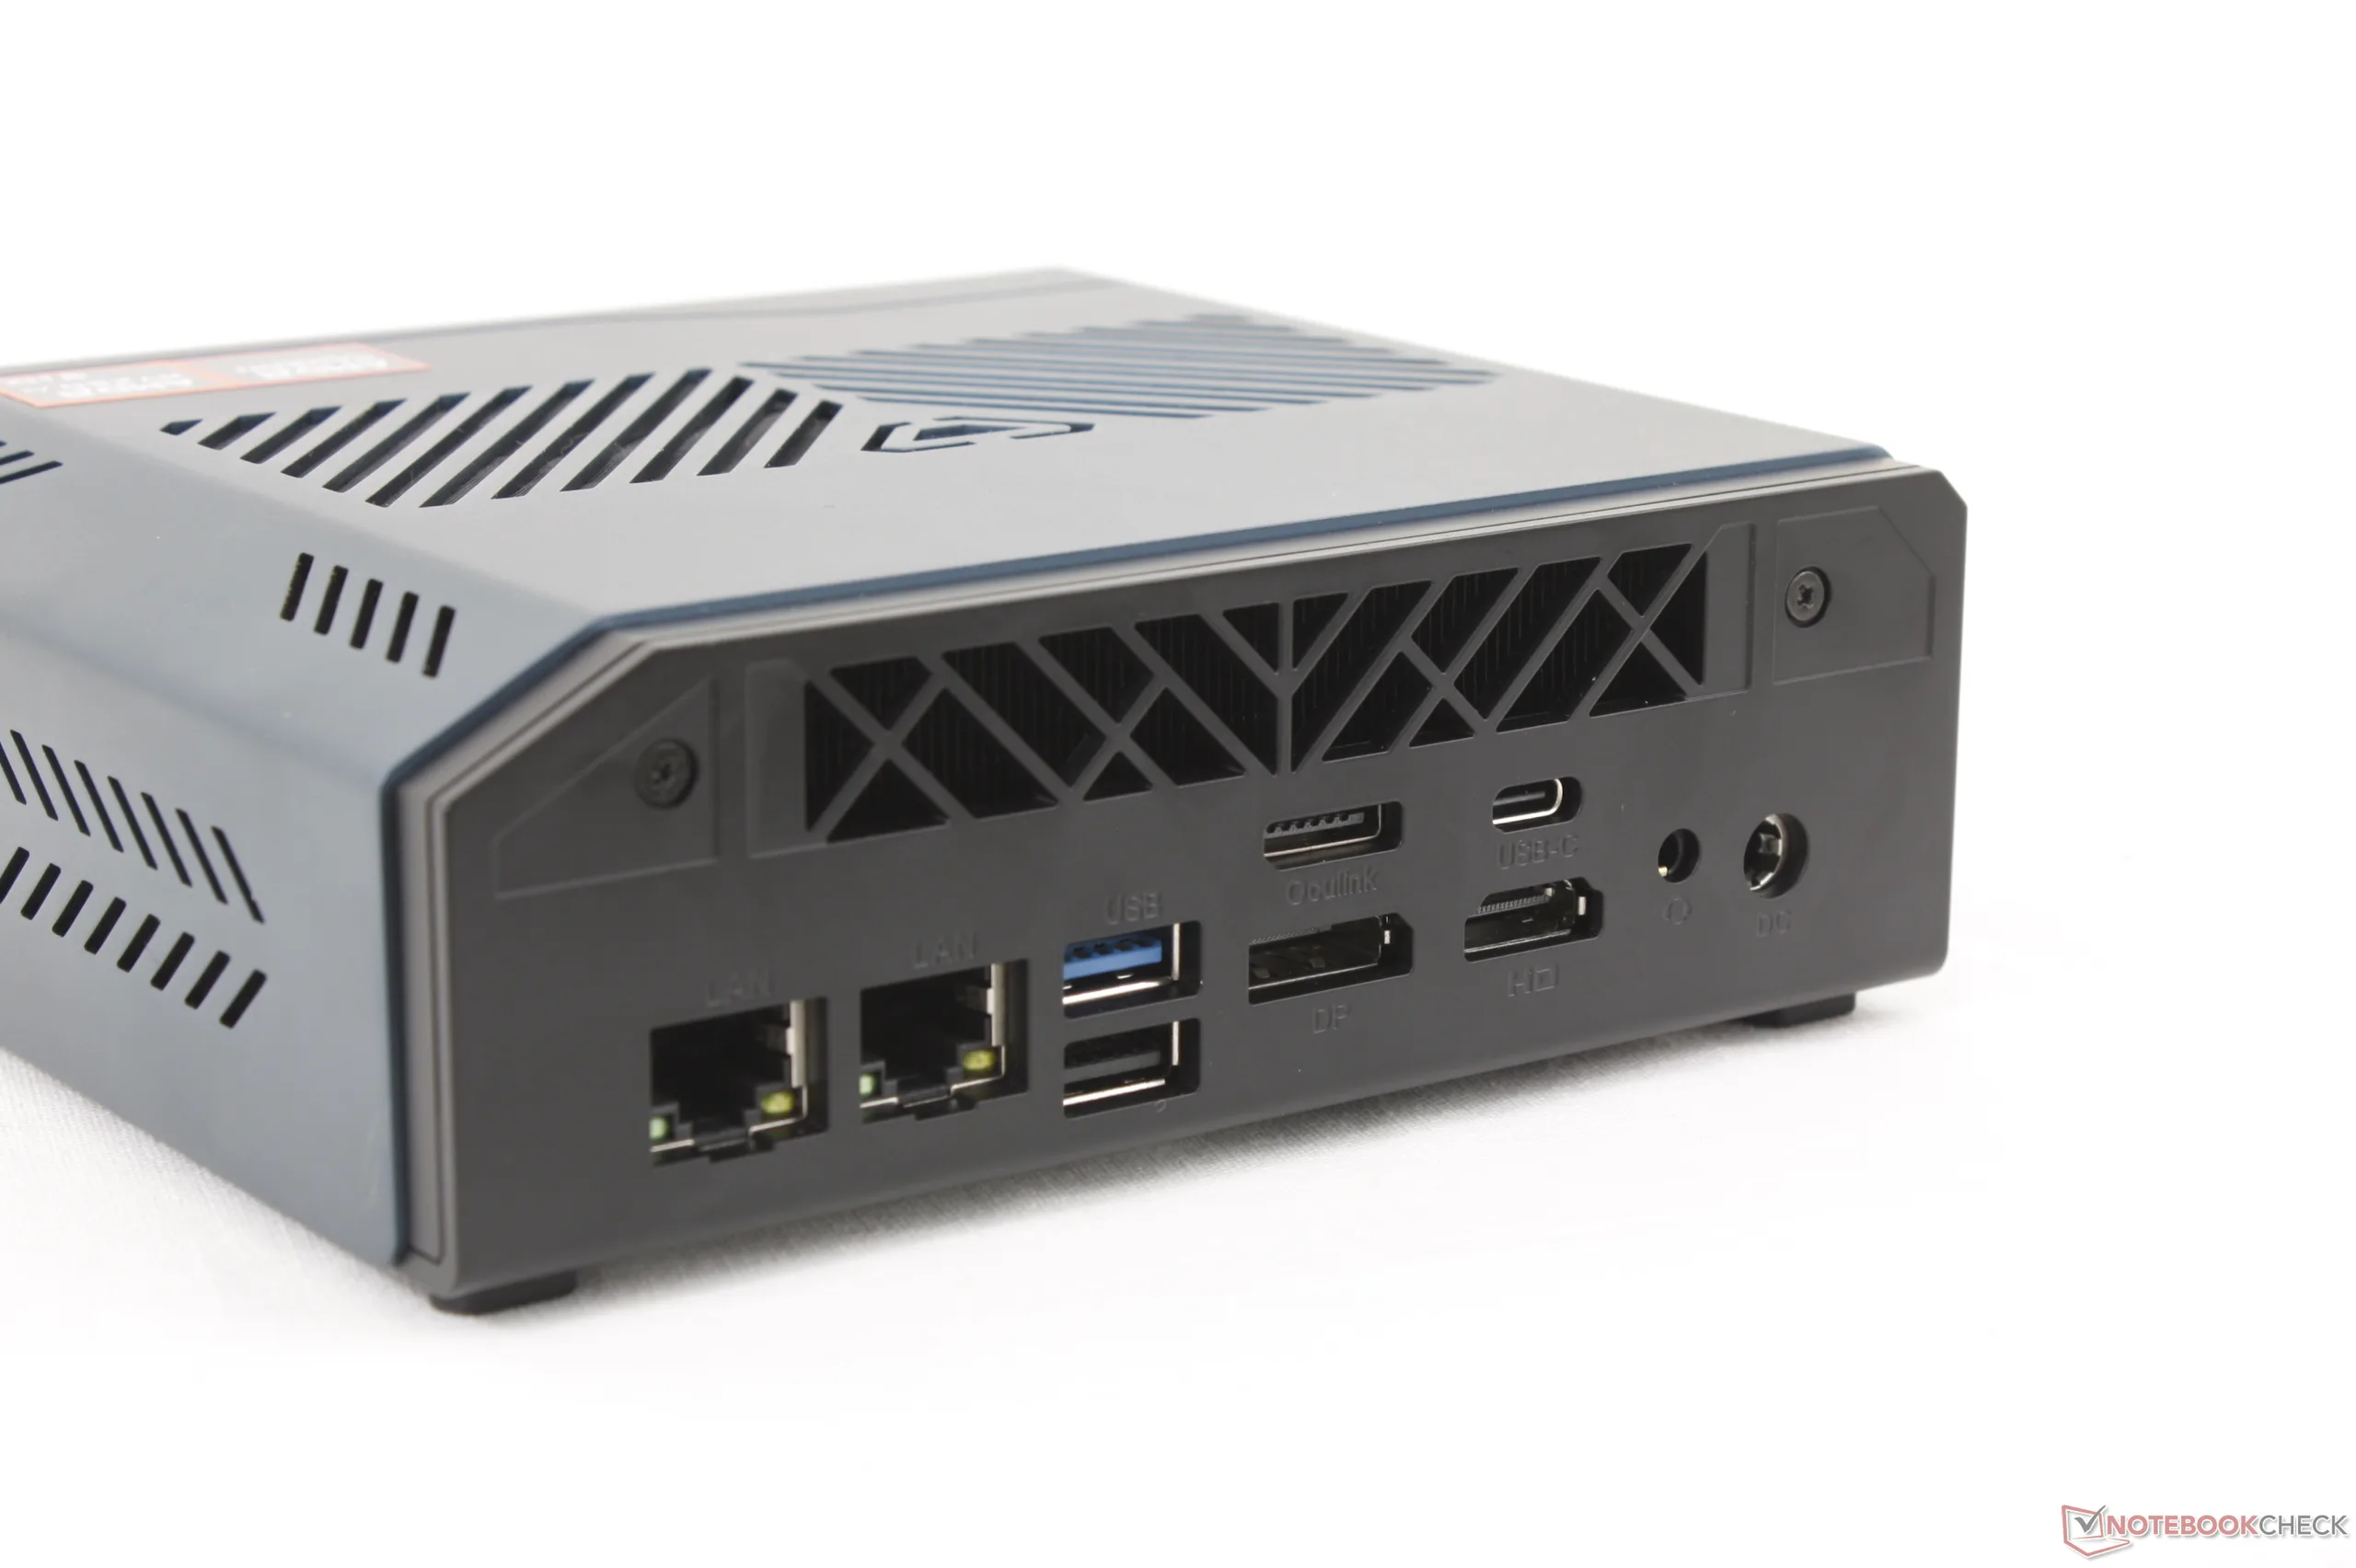
Communication
| Networking | |
| iperf3 receive AXE11000 6GHz | |
| MSI Cubi NUC AI+ 3MG | |
| BOSGAME VTA-439 | |
| Asus NUC 15 Pro+ | |
| Beelink GTI15 Ultra | |
| iperf3 transmit AXE11000 6GHz | |
| BOSGAME VTA-439 | |
| MSI Cubi NUC AI+ 3MG | |
| Asus NUC 15 Pro+ | |
| Beelink GTI15 Ultra | |
Maintenance
Performance
Testing Conditions
We set Windows and BIOS to Performance mode prior to running the benchmarks below.
Processor Performance
Cinebench R15 Multi Loop
Cinebench R23: Multi Core | Single Core
Cinebench R20: CPU (Multi Core) | CPU (Single Core)
Cinebench R15: CPU Multi 64Bit | CPU Single 64Bit
Blender: v2.79 BMW27 CPU
7-Zip 18.03: 7z b 4 | 7z b 4 -mmt1
Geekbench 6.7: Multi-Core | Single-Core
Geekbench 5.5: Multi-Core | Single-Core
HWBOT x265 Benchmark v2.2: 4k Preset
LibreOffice : 20 Documents To PDF
R Benchmark 2.5: Overall mean
| Cinebench R20 / CPU (Multi Core) | |
| BOSGAME VTA-439 | |
| Average AMD Ryzen AI 9 HX 470 (8746 - 9354, n=5) | |
| Asus NUC 15 Pro+ | |
| GMK EVO-X1 | |
| Khadas Mind Pro | |
| Beelink GTI15 Ultra | |
| MSI Cubi NUC AI+ 3MG | |
| Asus ExpertCenter PN54-S70012NN | |
| Beelink SER9 Pro | |
| Beelink SER8 | |
| GMK NucBox K6 | |
| Peladn HA-4, R7 7840HS | |
| GMK NucBox K13 | |
| GMK NucBox M3 | |
| Geekom A5 Pro | |
| Cinebench R20 / CPU (Single Core) | |
| Asus NUC 15 Pro+ | |
| BOSGAME VTA-439 | |
| Average AMD Ryzen AI 9 HX 470 (806 - 822, n=5) | |
| GMK EVO-X1 | |
| Beelink GTI15 Ultra | |
| Khadas Mind Pro | |
| Asus ExpertCenter PN54-S70012NN | |
| MSI Cubi NUC AI+ 3MG | |
| GMK NucBox K13 | |
| Beelink SER8 | |
| Peladn HA-4, R7 7840HS | |
| GMK NucBox K6 | |
| Beelink SER9 Pro | |
| GMK NucBox M3 | |
| Geekom A5 Pro | |
| Cinebench R15 / CPU Multi 64Bit | |
| BOSGAME VTA-439 | |
| Average AMD Ryzen AI 9 HX 470 (3372 - 3607, n=5) | |
| Asus NUC 15 Pro+ | |
| GMK EVO-X1 | |
| Khadas Mind Pro | |
| MSI Cubi NUC AI+ 3MG | |
| Asus ExpertCenter PN54-S70012NN | |
| Beelink SER8 | |
| Beelink GTI15 Ultra | |
| Beelink SER9 Pro | |
| GMK NucBox K6 | |
| Peladn HA-4, R7 7840HS | |
| GMK NucBox K13 | |
| GMK NucBox M3 | |
| Geekom A5 Pro | |
| Cinebench R15 / CPU Single 64Bit | |
| Asus NUC 15 Pro+ | |
| BOSGAME VTA-439 | |
| Khadas Mind Pro | |
| Beelink GTI15 Ultra | |
| GMK EVO-X1 | |
| Asus ExpertCenter PN54-S70012NN | |
| Average AMD Ryzen AI 9 HX 470 (192.7 - 322, n=5) | |
| GMK NucBox K13 | |
| Peladn HA-4, R7 7840HS | |
| Beelink SER8 | |
| GMK NucBox K6 | |
| Beelink SER9 Pro | |
| MSI Cubi NUC AI+ 3MG | |
| GMK NucBox M3 | |
| Geekom A5 Pro | |
| HWBOT x265 Benchmark v2.2 / 4k Preset | |
| BOSGAME VTA-439 | |
| Average AMD Ryzen AI 9 HX 470 (24.9 - 28.5, n=5) | |
| GMK EVO-X1 | |
| Asus NUC 15 Pro+ | |
| Khadas Mind Pro | |
| Beelink GTI15 Ultra | |
| Asus ExpertCenter PN54-S70012NN | |
| Beelink SER8 | |
| GMK NucBox K6 | |
| Beelink SER9 Pro | |
| MSI Cubi NUC AI+ 3MG | |
| Peladn HA-4, R7 7840HS | |
| GMK NucBox K13 | |
| Geekom A5 Pro | |
| GMK NucBox M3 | |
| LibreOffice / 20 Documents To PDF | |
| BOSGAME VTA-439 | |
| Geekom A5 Pro | |
| Average AMD Ryzen AI 9 HX 470 (53.8 - 59.9, n=5) | |
| Asus NUC 15 Pro+ | |
| GMK EVO-X1 | |
| MSI Cubi NUC AI+ 3MG | |
| Beelink SER9 Pro | |
| GMK NucBox K13 | |
| Peladn HA-4, R7 7840HS | |
| Asus ExpertCenter PN54-S70012NN | |
| Khadas Mind Pro | |
| Beelink SER8 | |
| GMK NucBox K6 | |
| GMK NucBox M3 | |
| Beelink GTI15 Ultra | |
Cinebench R23: Multi Core | Single Core
Cinebench R20: CPU (Multi Core) | CPU (Single Core)
Cinebench R15: CPU Multi 64Bit | CPU Single 64Bit
Blender: v2.79 BMW27 CPU
7-Zip 18.03: 7z b 4 | 7z b 4 -mmt1
Geekbench 6.7: Multi-Core | Single-Core
Geekbench 5.5: Multi-Core | Single-Core
HWBOT x265 Benchmark v2.2: 4k Preset
LibreOffice : 20 Documents To PDF
R Benchmark 2.5: Overall mean
* ... smaller is better
AIDA64: FP32 Ray-Trace | FPU Julia | CPU SHA3 | CPU Queen | FPU SinJulia | FPU Mandel | CPU AES | CPU ZLib | FP64 Ray-Trace | CPU PhotoWorxx | CPU CheckMate
| Performance rating | |
| BOSGAME VTA-439 -1! | |
| Average AMD Ryzen AI 9 HX 470 | |
| GMK EVO-X1 -1! | |
| Beelink SER9 Pro -1! | |
| Asus NUC 15 Pro+ -1! | |
| Beelink GTI15 Ultra -1! | |
| MSI Cubi NUC AI+ 3MG -1! | |
| AIDA64 / FP32 Ray-Trace | |
| Average AMD Ryzen AI 9 HX 470 (31969 - 38491, n=8) | |
| BOSGAME VTA-439 (v8.20.8100) | |
| GMK EVO-X1 (v6.92.6600) | |
| Beelink SER9 Pro (v6.92.6600) | |
| Asus NUC 15 Pro+ (v6.92.6600) | |
| Beelink GTI15 Ultra (v6.92.6600) | |
| MSI Cubi NUC AI+ 3MG (v8.20.8100) | |
| AIDA64 / FPU Julia | |
| Average AMD Ryzen AI 9 HX 470 (117908 - 152422, n=8) | |
| BOSGAME VTA-439 (v8.20.8100) | |
| GMK EVO-X1 (v6.92.6600) | |
| Asus NUC 15 Pro+ (v6.92.6600) | |
| Beelink SER9 Pro (v6.92.6600) | |
| Beelink GTI15 Ultra (v6.92.6600) | |
| MSI Cubi NUC AI+ 3MG (v8.20.8100) | |
| AIDA64 / CPU SHA3 | |
| Average AMD Ryzen AI 9 HX 470 (5074 - 5821, n=8) | |
| Asus NUC 15 Pro+ (v6.92.6600) | |
| BOSGAME VTA-439 (v8.20.8100) | |
| GMK EVO-X1 (v6.92.6600) | |
| Beelink SER9 Pro (v6.92.6600) | |
| Beelink GTI15 Ultra (v6.92.6600) | |
| MSI Cubi NUC AI+ 3MG (v8.20.8100) | |
| AIDA64 / CPU Queen | |
| Beelink SER9 Pro (v6.92.6600) | |
| Average AMD Ryzen AI 9 HX 470 (89114 - 100242, n=3) | |
| Asus NUC 15 Pro+ (v6.92.6600) | |
| Beelink GTI15 Ultra (v6.92.6600) | |
| GMK EVO-X1 (v6.92.6600) | |
| AIDA64 / FPU SinJulia | |
| Average AMD Ryzen AI 9 HX 470 (17747 - 19320, n=8) | |
| BOSGAME VTA-439 (v8.20.8100) | |
| GMK EVO-X1 (v6.92.6600) | |
| Beelink SER9 Pro (v6.92.6600) | |
| Asus NUC 15 Pro+ (v6.92.6600) | |
| Beelink GTI15 Ultra (v6.92.6600) | |
| MSI Cubi NUC AI+ 3MG (v8.20.8100) | |
| AIDA64 / FPU Mandel | |
| Average AMD Ryzen AI 9 HX 470 (66324 - 78045, n=8) | |
| BOSGAME VTA-439 (v8.20.8100) | |
| GMK EVO-X1 (v6.92.6600) | |
| Asus NUC 15 Pro+ (v6.92.6600) | |
| Beelink SER9 Pro (v6.92.6600) | |
| Beelink GTI15 Ultra (v6.92.6600) | |
| MSI Cubi NUC AI+ 3MG (v8.20.8100) | |
| AIDA64 / CPU AES | |
| Beelink SER9 Pro (v6.92.6600) | |
| Average AMD Ryzen AI 9 HX 470 (78626 - 117375, n=8) | |
| BOSGAME VTA-439 (v8.20.8100) | |
| Asus NUC 15 Pro+ (v6.92.6600) | |
| GMK EVO-X1 (v6.92.6600) | |
| Beelink GTI15 Ultra (v6.92.6600) | |
| MSI Cubi NUC AI+ 3MG (v8.20.8100) | |
| AIDA64 / CPU ZLib | |
| Average AMD Ryzen AI 9 HX 470 (1434 - 1549, n=8) | |
| BOSGAME VTA-439 (v8.20.8100) | |
| GMK EVO-X1 (v6.92.6600) | |
| Asus NUC 15 Pro+ (v6.92.6600) | |
| Beelink SER9 Pro (v6.92.6600) | |
| Beelink GTI15 Ultra (v6.92.6600) | |
| MSI Cubi NUC AI+ 3MG (v8.20.8100) | |
| AIDA64 / FP64 Ray-Trace | |
| Average AMD Ryzen AI 9 HX 470 (16687 - 20313, n=8) | |
| BOSGAME VTA-439 (v8.20.8100) | |
| GMK EVO-X1 (v6.92.6600) | |
| Beelink SER9 Pro (v6.92.6600) | |
| Asus NUC 15 Pro+ (v6.92.6600) | |
| Beelink GTI15 Ultra (v6.92.6600) | |
| MSI Cubi NUC AI+ 3MG (v8.20.8100) | |
| AIDA64 / CPU PhotoWorxx | |
| Beelink GTI15 Ultra (v6.92.6600) | |
| Asus NUC 15 Pro+ (v6.92.6600) | |
| MSI Cubi NUC AI+ 3MG (v8.20.8100) | |
| BOSGAME VTA-439 (v8.20.8100) | |
| GMK EVO-X1 (v6.92.6600) | |
| Beelink SER9 Pro (v6.92.6600) | |
| Average AMD Ryzen AI 9 HX 470 (23851 - 54302, n=8) | |
| AIDA64 / CPU CheckMate | |
| Average AMD Ryzen AI 9 HX 470 (7688 - 8080, n=5) | |
| BOSGAME VTA-439 (v8.20.8100) | |
| MSI Cubi NUC AI+ 3MG (v8.20.8100) | |
System Performance
PCMark 10: Score | Essentials | Productivity | Digital Content Creation
CrossMark: Overall | Productivity | Creativity | Responsiveness
WebXPRT 3: Overall
WebXPRT 4: Overall
Mozilla Kraken 1.1: Total
Geekbench AI: Quantized GPU 1.7 | Half Precision GPU 1.7 | Single Precision GPU 1.7
| Performance rating | |
| Beelink GTI15 Ultra | |
| MSI Cubi NUC AI+ 3MG | |
| BOSGAME VTA-439 | |
| Average AMD Ryzen AI 9 HX 470, AMD Radeon 890M | |
| Beelink SER9 Pro | |
| GMK EVO-X1 -3! | |
| Asus NUC 15 Pro+ | |
| PCMark 10 / Score | |
| BOSGAME VTA-439 | |
| Average AMD Ryzen AI 9 HX 470, AMD Radeon 890M (7221 - 8791, n=4) | |
| MSI Cubi NUC AI+ 3MG | |
| Beelink GTI15 Ultra | |
| GMK EVO-X1 | |
| Asus NUC 15 Pro+ | |
| Beelink SER9 Pro | |
| PCMark 10 / Essentials | |
| Beelink GTI15 Ultra | |
| GMK EVO-X1 | |
| BOSGAME VTA-439 | |
| Beelink SER9 Pro | |
| MSI Cubi NUC AI+ 3MG | |
| Average AMD Ryzen AI 9 HX 470, AMD Radeon 890M (10035 - 10491, n=4) | |
| Asus NUC 15 Pro+ | |
| PCMark 10 / Productivity | |
| MSI Cubi NUC AI+ 3MG | |
| BOSGAME VTA-439 | |
| Average AMD Ryzen AI 9 HX 470, AMD Radeon 890M (9899 - 16098, n=4) | |
| Beelink GTI15 Ultra | |
| Beelink SER9 Pro | |
| GMK EVO-X1 | |
| Asus NUC 15 Pro+ | |
| PCMark 10 / Digital Content Creation | |
| BOSGAME VTA-439 | |
| Asus NUC 15 Pro+ | |
| Average AMD Ryzen AI 9 HX 470, AMD Radeon 890M (9999 - 12005, n=4) | |
| Beelink GTI15 Ultra | |
| GMK EVO-X1 | |
| MSI Cubi NUC AI+ 3MG | |
| Beelink SER9 Pro | |
| CrossMark / Overall | |
| Beelink GTI15 Ultra | |
| MSI Cubi NUC AI+ 3MG | |
| Beelink SER9 Pro | |
| Asus NUC 15 Pro+ | |
| Average AMD Ryzen AI 9 HX 470, AMD Radeon 890M (1611 - 1869, n=4) | |
| GMK EVO-X1 | |
| BOSGAME VTA-439 | |
| CrossMark / Productivity | |
| Beelink GTI15 Ultra | |
| MSI Cubi NUC AI+ 3MG | |
| Beelink SER9 Pro | |
| Asus NUC 15 Pro+ | |
| GMK EVO-X1 | |
| Average AMD Ryzen AI 9 HX 470, AMD Radeon 890M (1449 - 1703, n=4) | |
| BOSGAME VTA-439 | |
| CrossMark / Creativity | |
| Beelink GTI15 Ultra | |
| MSI Cubi NUC AI+ 3MG | |
| BOSGAME VTA-439 | |
| Asus NUC 15 Pro+ | |
| Average AMD Ryzen AI 9 HX 470, AMD Radeon 890M (1938 - 2211, n=4) | |
| Beelink SER9 Pro | |
| GMK EVO-X1 | |
| CrossMark / Responsiveness | |
| Beelink GTI15 Ultra | |
| MSI Cubi NUC AI+ 3MG | |
| Beelink SER9 Pro | |
| GMK EVO-X1 | |
| Average AMD Ryzen AI 9 HX 470, AMD Radeon 890M (942 - 1500, n=4) | |
| Asus NUC 15 Pro+ | |
| BOSGAME VTA-439 | |
| WebXPRT 3 / Overall | |
| Beelink GTI15 Ultra | |
| GMK EVO-X1 | |
| Average AMD Ryzen AI 9 HX 470, AMD Radeon 890M (285 - 331, n=4) | |
| BOSGAME VTA-439 | |
| MSI Cubi NUC AI+ 3MG | |
| Beelink SER9 Pro | |
| Asus NUC 15 Pro+ | |
| WebXPRT 4 / Overall | |
| Beelink GTI15 Ultra | |
| MSI Cubi NUC AI+ 3MG | |
| GMK EVO-X1 | |
| Average AMD Ryzen AI 9 HX 470, AMD Radeon 890M (241 - 275, n=3) | |
| Beelink SER9 Pro | |
| BOSGAME VTA-439 | |
| Asus NUC 15 Pro+ | |
| Mozilla Kraken 1.1 / Total | |
| Beelink SER9 Pro | |
| Asus NUC 15 Pro+ | |
| MSI Cubi NUC AI+ 3MG | |
| Beelink GTI15 Ultra | |
| GMK EVO-X1 | |
| Average AMD Ryzen AI 9 HX 470, AMD Radeon 890M (414 - 442, n=4) | |
| BOSGAME VTA-439 | |
| Geekbench AI / Quantized GPU 1.7 | |
| BOSGAME VTA-439 | |
| Beelink SER9 Pro | |
| Asus NUC 15 Pro+ | |
| Beelink GTI15 Ultra | |
| Average AMD Ryzen AI 9 HX 470, AMD Radeon 890M (3669 - 6037, n=4) | |
| MSI Cubi NUC AI+ 3MG | |
| Geekbench AI / Half Precision GPU 1.7 | |
| BOSGAME VTA-439 | |
| MSI Cubi NUC AI+ 3MG | |
| Asus NUC 15 Pro+ | |
| Average AMD Ryzen AI 9 HX 470, AMD Radeon 890M (9482 - 13854, n=4) | |
| Beelink SER9 Pro | |
| Beelink GTI15 Ultra | |
| Geekbench AI / Single Precision GPU 1.7 | |
| BOSGAME VTA-439 | |
| Asus NUC 15 Pro+ | |
| Beelink SER9 Pro | |
| Beelink GTI15 Ultra | |
| Average AMD Ryzen AI 9 HX 470, AMD Radeon 890M (4877 - 8277, n=4) | |
| MSI Cubi NUC AI+ 3MG | |
* ... smaller is better
| PCMark 10 Score | 8791 points | |
Help | ||
| AIDA64 / Memory Copy | |
| GMK EVO-X1 | |
| Asus NUC 15 Pro+ | |
| Beelink GTI15 Ultra | |
| MSI Cubi NUC AI+ 3MG | |
| BOSGAME VTA-439 | |
| Beelink SER9 Pro | |
| Average AMD Ryzen AI 9 HX 470 (38489 - 86767, n=8) | |
| AIDA64 / Memory Read | |
| GMK EVO-X1 | |
| Asus NUC 15 Pro+ | |
| MSI Cubi NUC AI+ 3MG | |
| Beelink GTI15 Ultra | |
| BOSGAME VTA-439 | |
| Average AMD Ryzen AI 9 HX 470 (39901 - 93860, n=8) | |
| Beelink SER9 Pro | |
| AIDA64 / Memory Write | |
| Beelink SER9 Pro | |
| GMK EVO-X1 | |
| Asus NUC 15 Pro+ | |
| BOSGAME VTA-439 | |
| Beelink GTI15 Ultra | |
| MSI Cubi NUC AI+ 3MG | |
| Average AMD Ryzen AI 9 HX 470 (40283 - 118364, n=8) | |
| AIDA64 / Memory Latency | |
| MSI Cubi NUC AI+ 3MG | |
| GMK EVO-X1 | |
| Beelink GTI15 Ultra | |
| Asus NUC 15 Pro+ | |
| BOSGAME VTA-439 | |
| Beelink SER9 Pro | |
| Average AMD Ryzen AI 9 HX 470 (88.1 - 104.5, n=8) | |
* ... smaller is better
DPC Latency
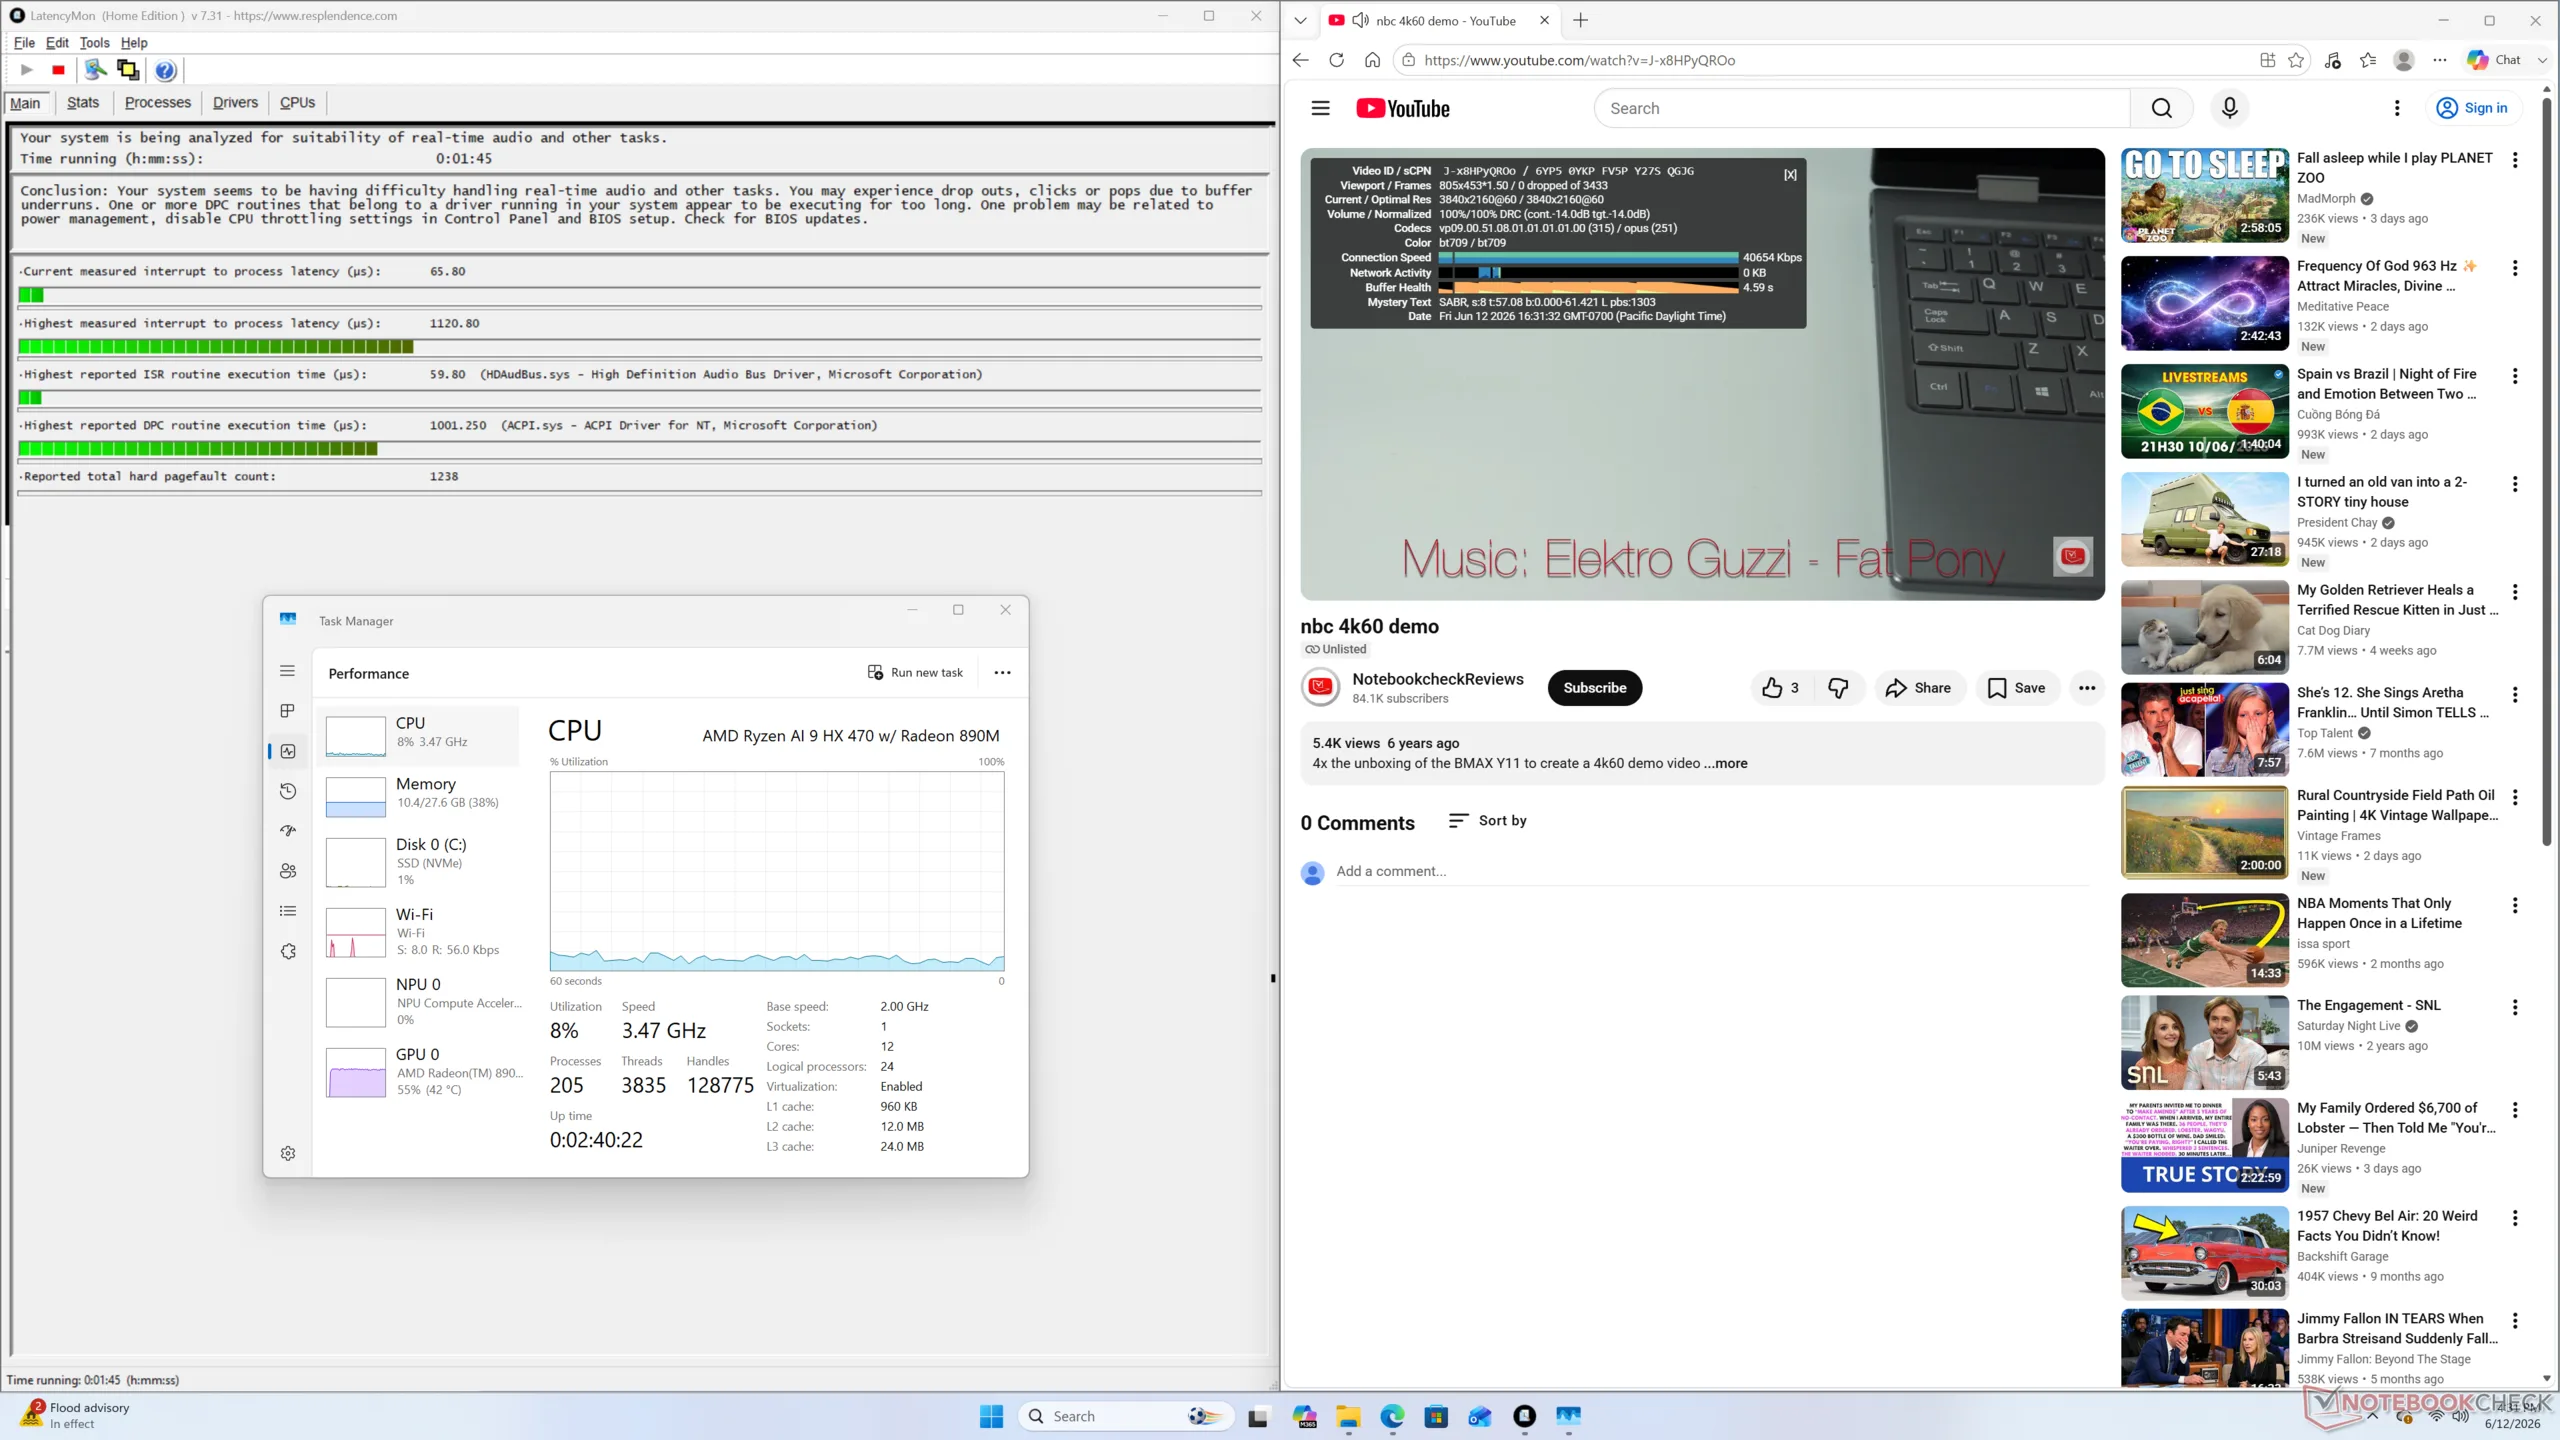
| DPC Latencies / LatencyMon - interrupt to process latency (max), Web, Youtube, Prime95 | |
| Beelink GTI15 Ultra | |
| BOSGAME VTA-439 | |
| Asus NUC 15 Pro+ | |
| GMK EVO-X1 | |
| Beelink SER9 Pro | |
* ... smaller is better
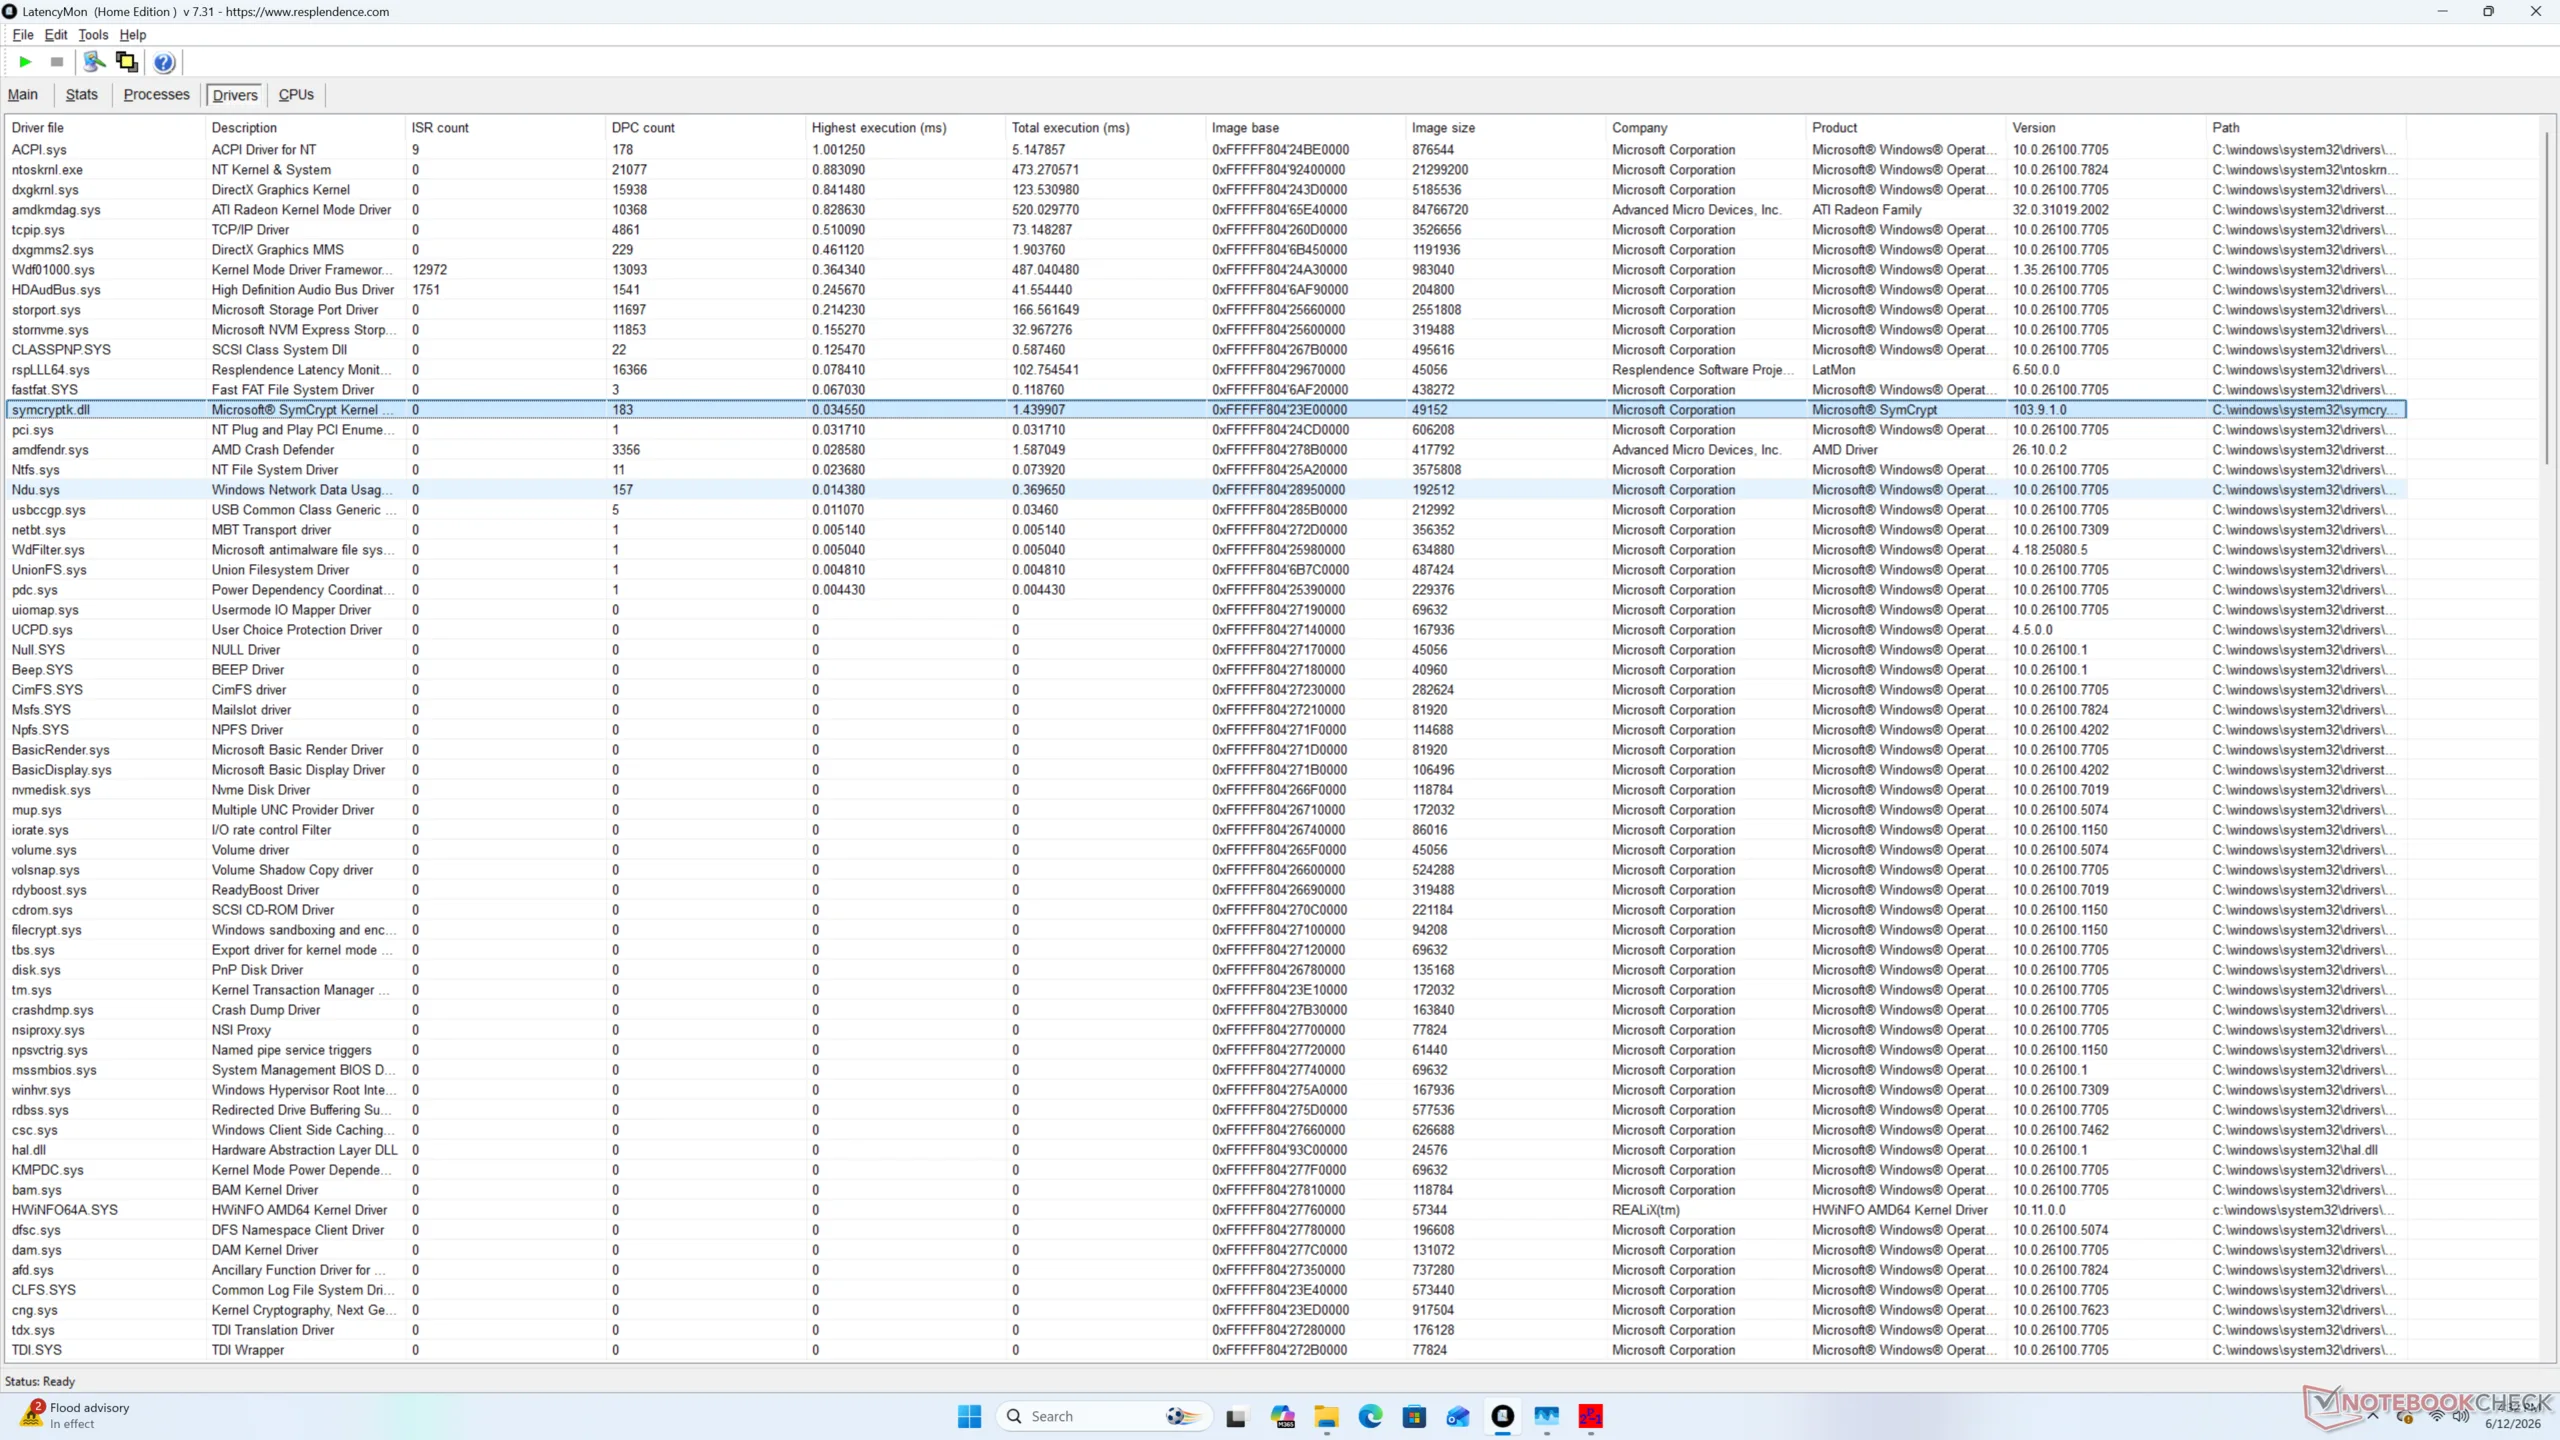
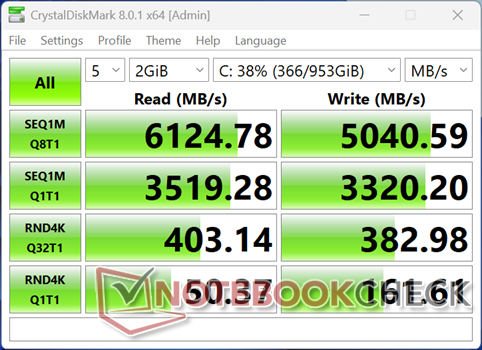
Storage Devices
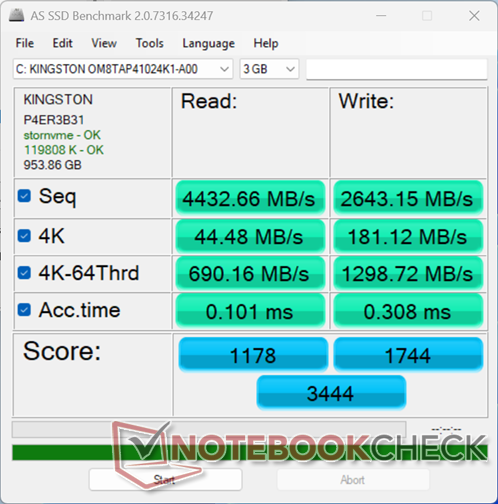

| Drive Performance rating - Percent | |
| Beelink GTI15 Ultra | |
| Asus NUC 15 Pro+ | |
| MSI Cubi NUC AI+ 3MG | |
| GMK EVO-X1 | |
| Beelink SER9 Pro | |
| BOSGAME VTA-439 | |
* ... smaller is better
Disk Throttling: DiskSpd Read Loop, Queue Depth 8
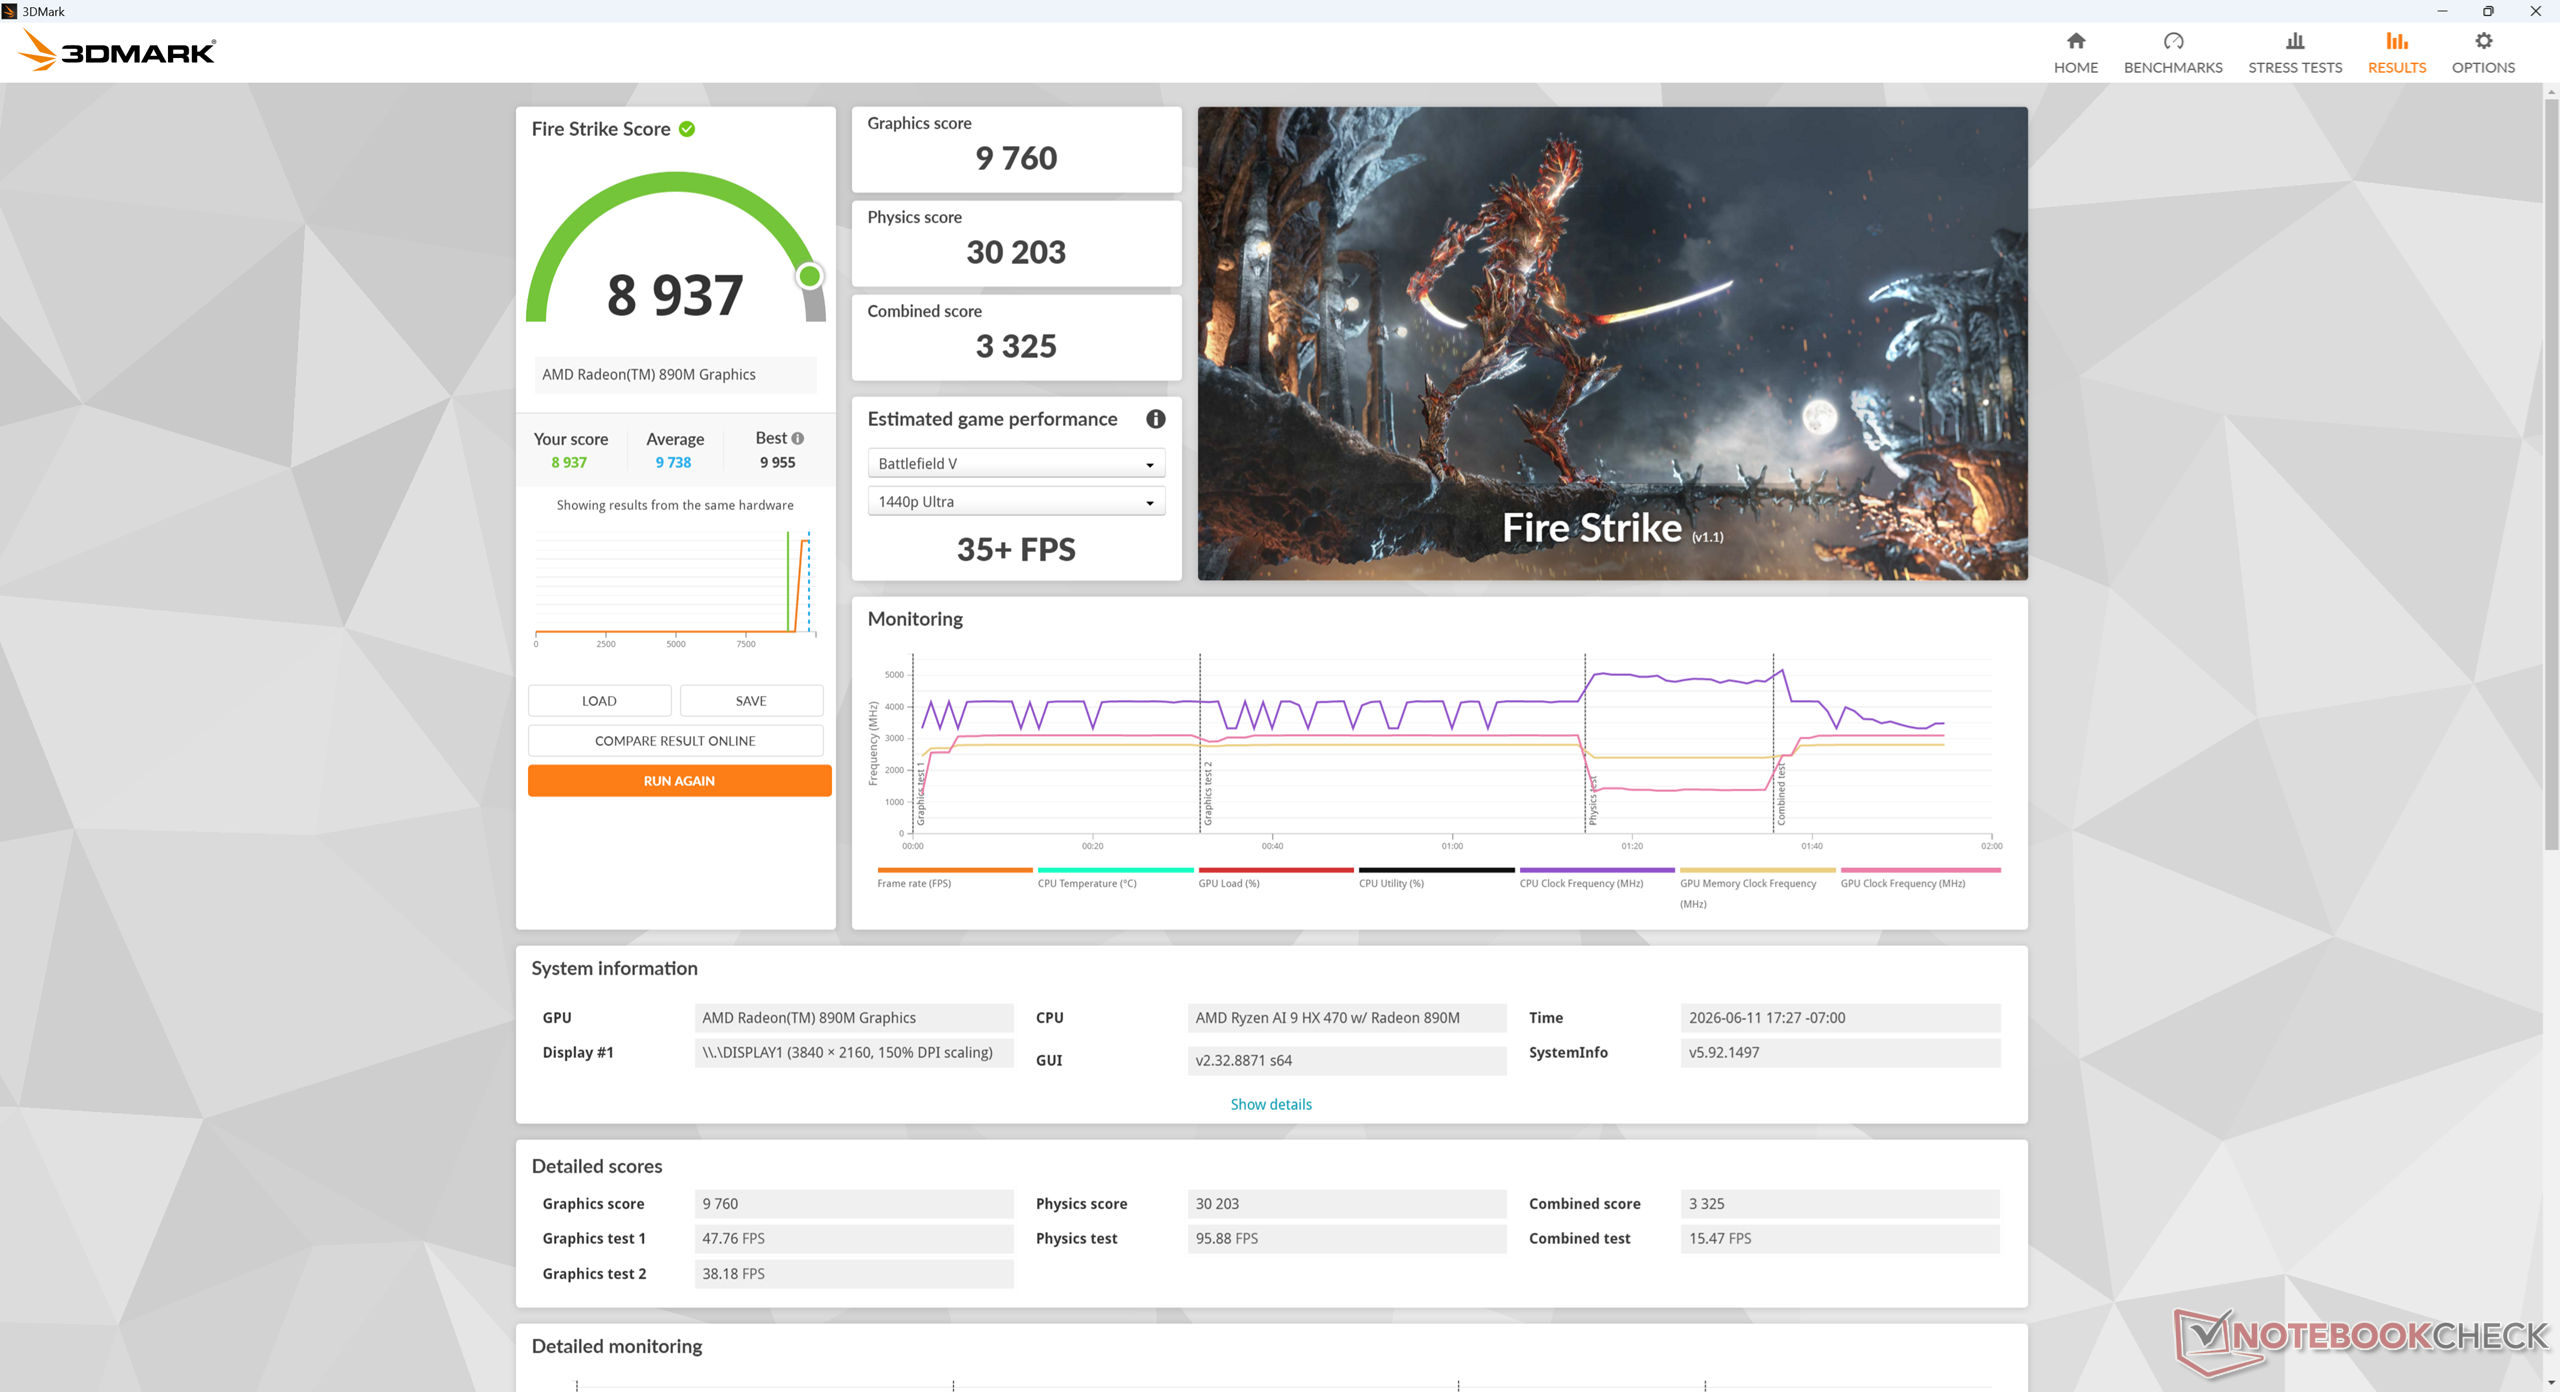
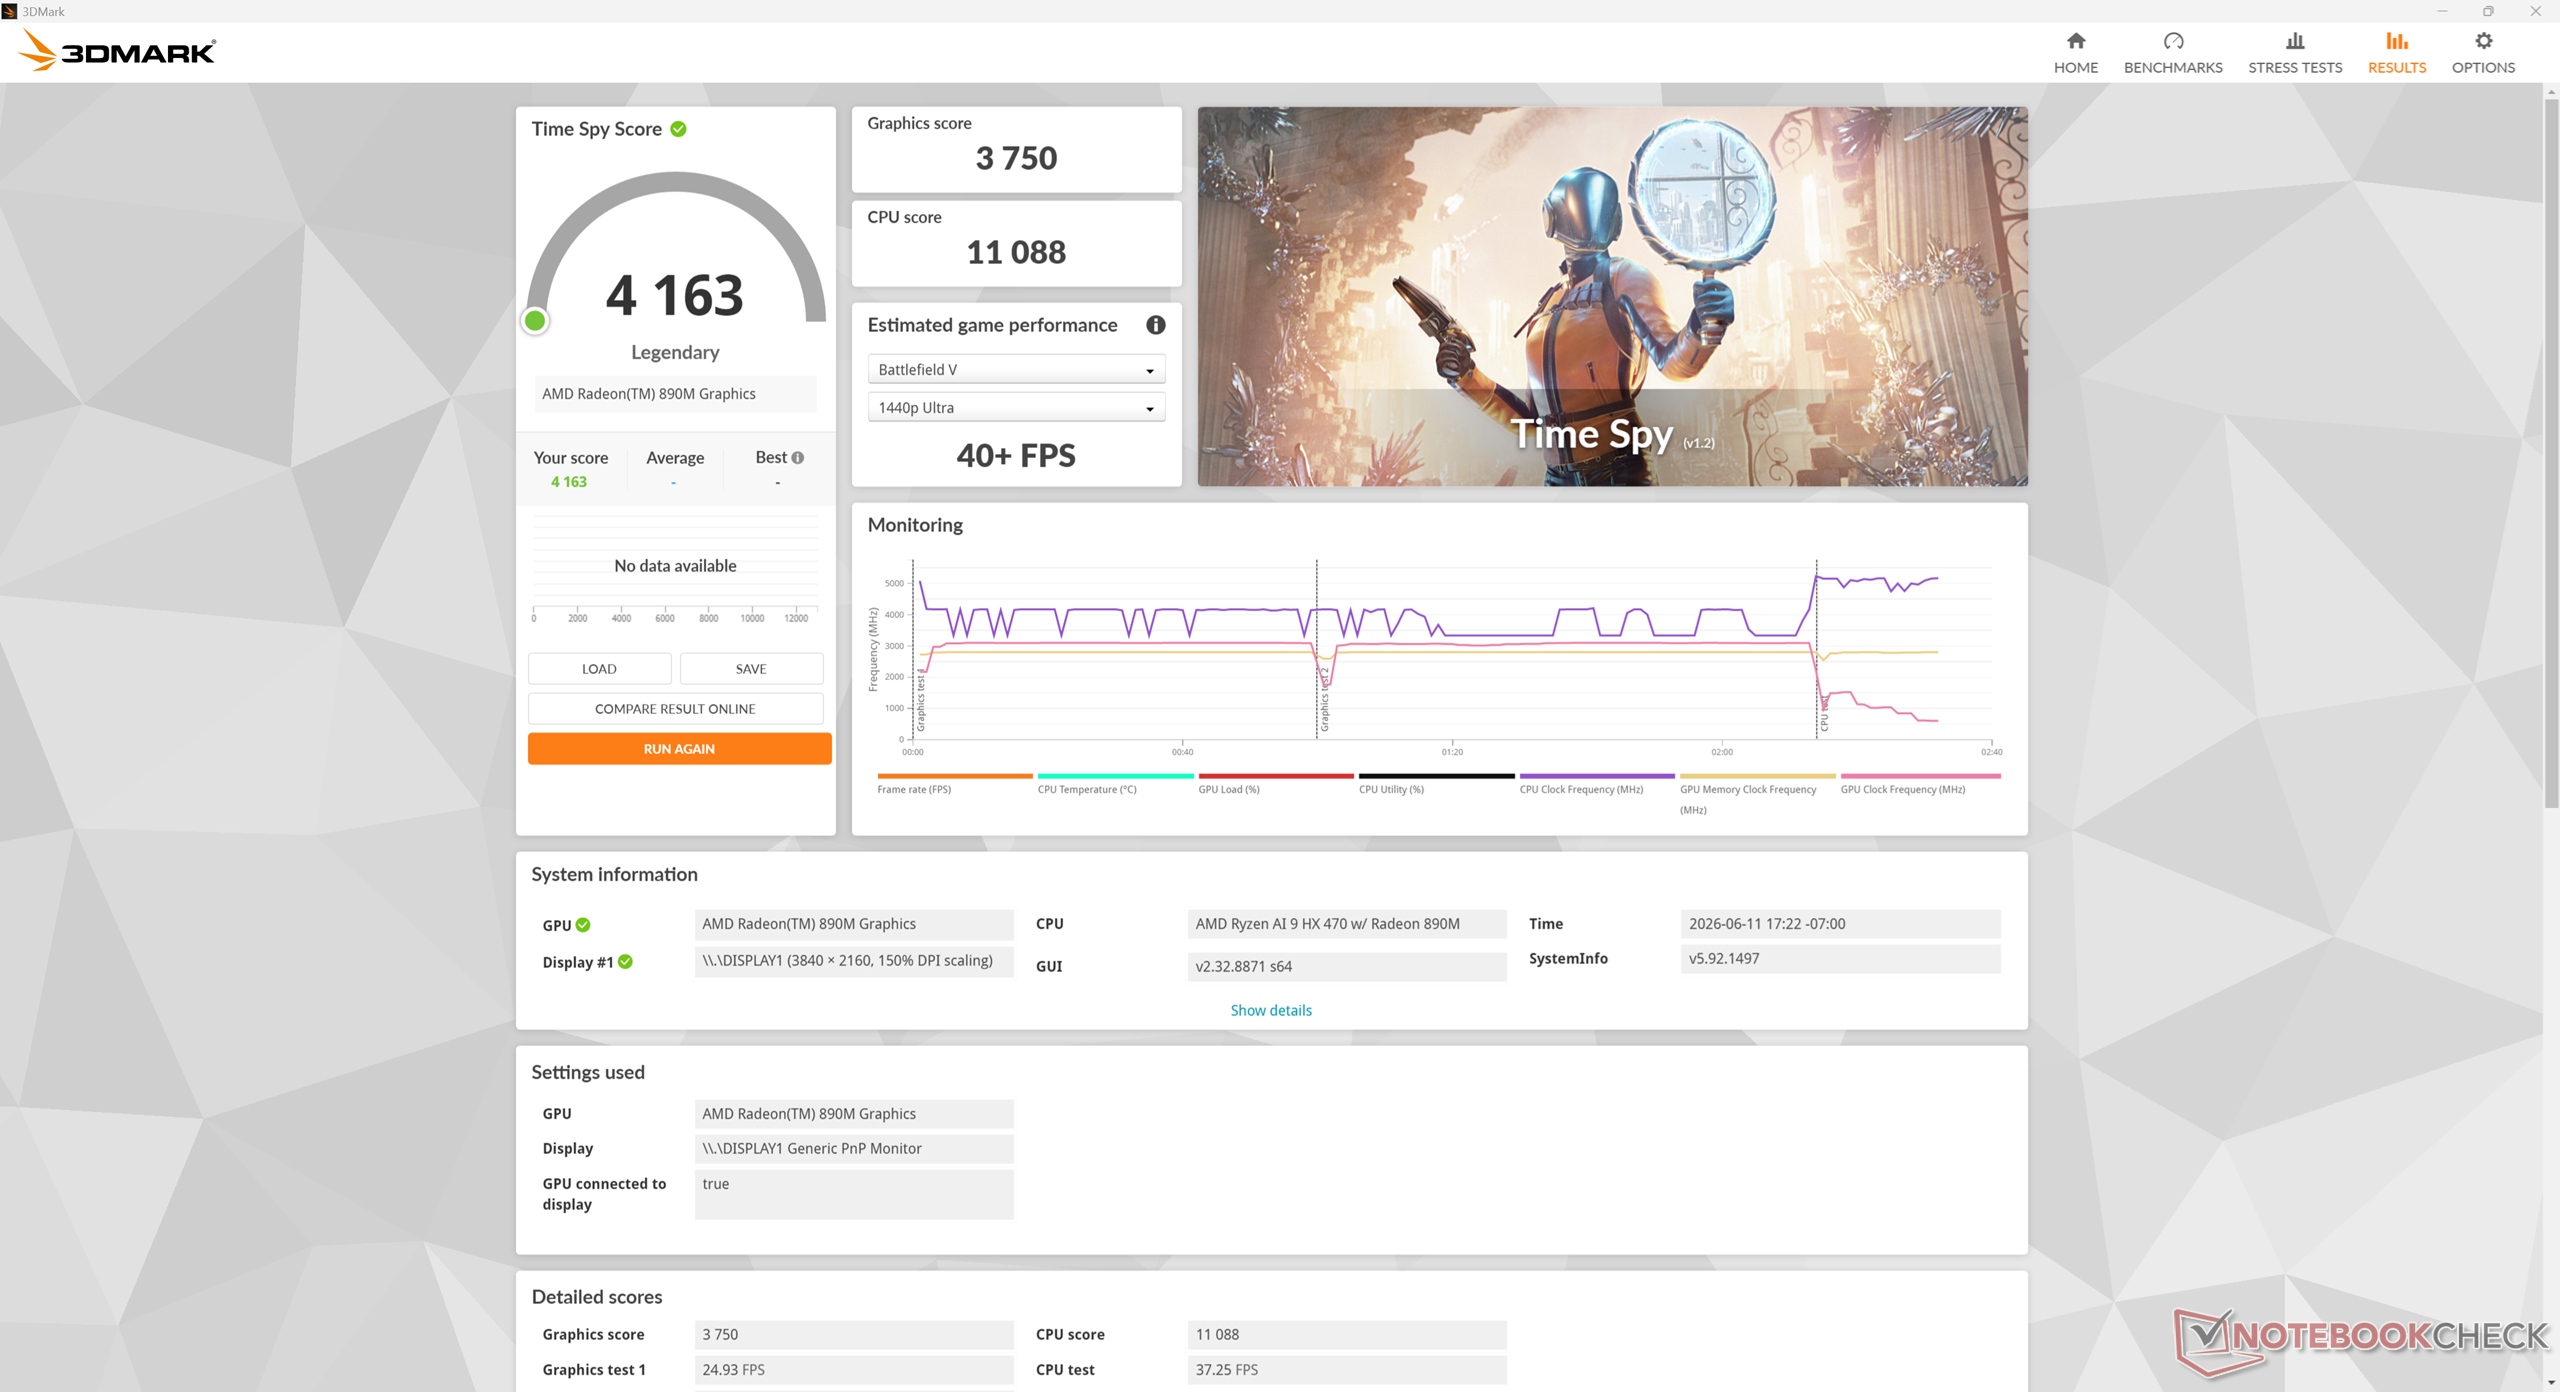
GPU Performance
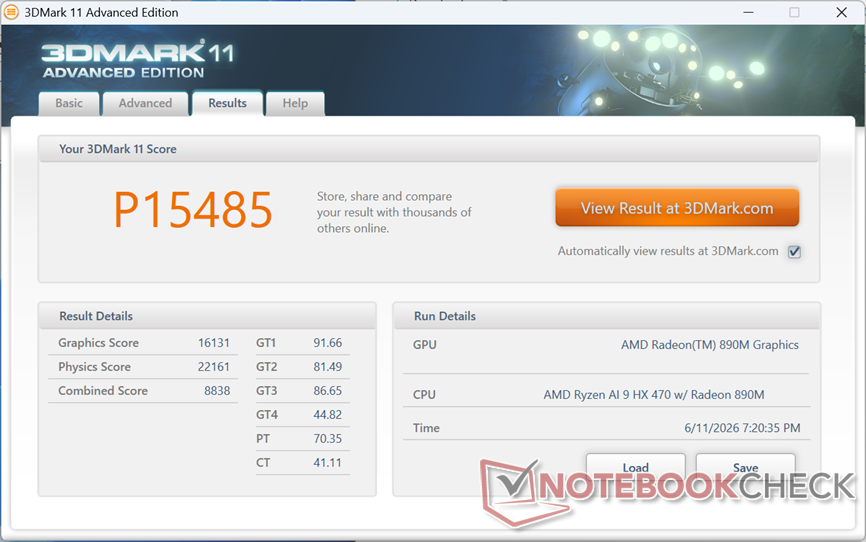
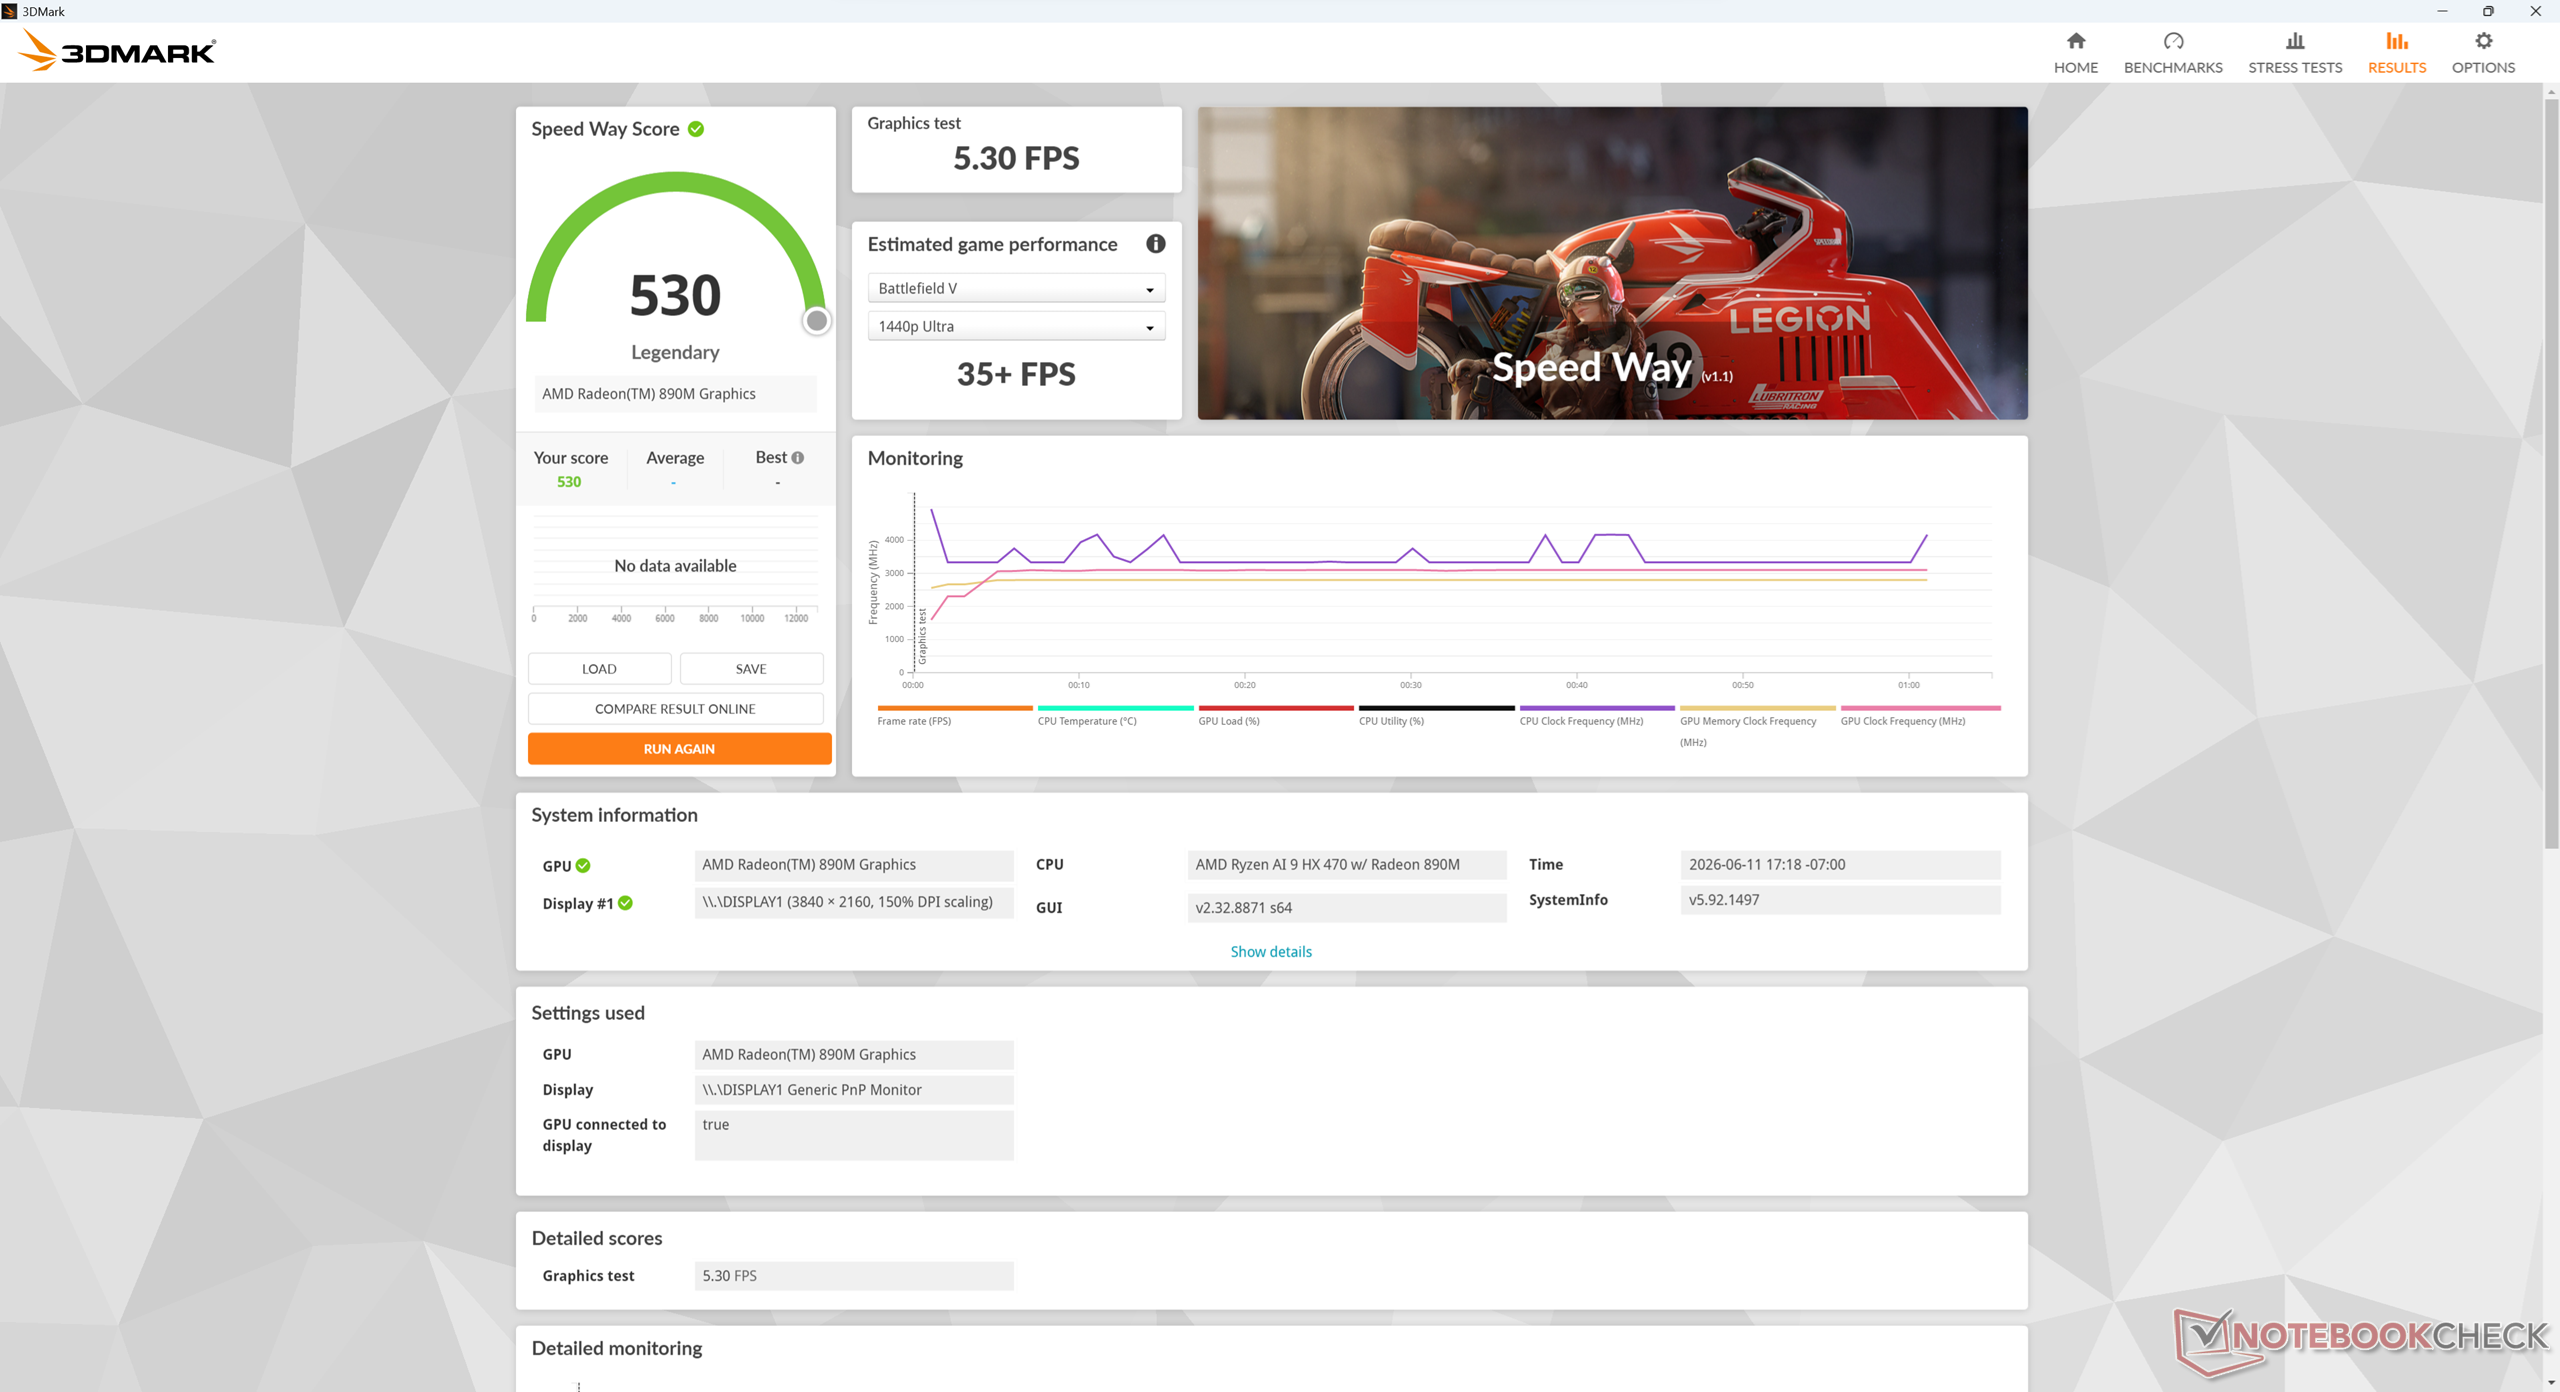
| 3DMark 11 Performance | 15485 points | |
| 3DMark Cloud Gate Standard Score | 40585 points | |
| 3DMark Fire Strike Score | 8937 points | |
| 3DMark Time Spy Score | 4163 points | |
Help | ||
* ... smaller is better
| Performance rating - Percent | |
| BOSGAME VTA-439 | |
| GMK EVO-X1 | |
| Asus NUC 15 Pro+ | |
| Beelink SER9 Pro | |
| Beelink GTI15 Ultra | |
| MSI Cubi NUC AI+ 3MG | |
| Cyberpunk 2077 - 1920x1080 Ultra Preset (FSR off) | |
| BOSGAME VTA-439 | |
| Asus NUC 15 Pro+ | |
| GMK EVO-X1 | |
| Beelink SER9 Pro | |
| Beelink GTI15 Ultra | |
| MSI Cubi NUC AI+ 3MG | |
| Baldur's Gate 3 - 1920x1080 Ultra Preset AA:T | |
| BOSGAME VTA-439 | |
| GMK EVO-X1 | |
| Beelink SER9 Pro | |
| Asus NUC 15 Pro+ | |
| Beelink GTI15 Ultra | |
| MSI Cubi NUC AI+ 3MG | |
| GTA V - 1920x1080 Highest AA:4xMSAA + FX AF:16x | |
| GMK EVO-X1 | |
| BOSGAME VTA-439 | |
| Beelink SER9 Pro | |
| MSI Cubi NUC AI+ 3MG | |
| Asus NUC 15 Pro+ | |
| Beelink GTI15 Ultra | |
| Final Fantasy XV Benchmark - 1920x1080 High Quality | |
| BOSGAME VTA-439 | |
| GMK EVO-X1 | |
| Asus NUC 15 Pro+ | |
| Beelink SER9 Pro | |
| Beelink GTI15 Ultra | |
| MSI Cubi NUC AI+ 3MG | |
| Strange Brigade - 1920x1080 ultra AA:ultra AF:16 | |
| GMK EVO-X1 | |
| Asus NUC 15 Pro+ | |
| BOSGAME VTA-439 | |
| Beelink SER9 Pro | |
| Beelink GTI15 Ultra | |
| MSI Cubi NUC AI+ 3MG | |
| Dota 2 Reborn - 1920x1080 ultra (3/3) best looking | |
| Asus NUC 15 Pro+ | |
| BOSGAME VTA-439 | |
| GMK EVO-X1 | |
| MSI Cubi NUC AI+ 3MG | |
| Beelink SER9 Pro | |
| Beelink GTI15 Ultra | |
| X-Plane 11.11 - 1920x1080 high (fps_test=3) | |
| BOSGAME VTA-439 | |
| Asus NUC 15 Pro+ | |
| GMK EVO-X1 | |
| Beelink SER9 Pro | |
| Beelink GTI15 Ultra | |
| MSI Cubi NUC AI+ 3MG | |
Cyberpunk 2077 ultra FPS Chart
| low | med. | high | ultra | |
|---|---|---|---|---|
| GTA V (2015) | 174.4 | 168.3 | 77 | 31.8 |
| Dota 2 Reborn (2015) | 182.3 | 142.7 | 103 | 90.6 |
| Final Fantasy XV Benchmark (2018) | 90.4 | 44.9 | 32.6 | |
| X-Plane 11.11 (2018) | 92.6 | 71.1 | 58.3 | |
| Strange Brigade (2018) | 190.8 | 76.8 | 65.3 | 56.1 |
| Baldur's Gate 3 (2023) | 48.4 | 40.2 | 32.2 | 32.1 |
| Cyberpunk 2077 (2023) | 52.6 | 41.9 | 31.6 | 28.2 |
| F1 24 (2024) | 98.5 | 87.8 | 65.1 | 15.4 |
Emissions
System Noise
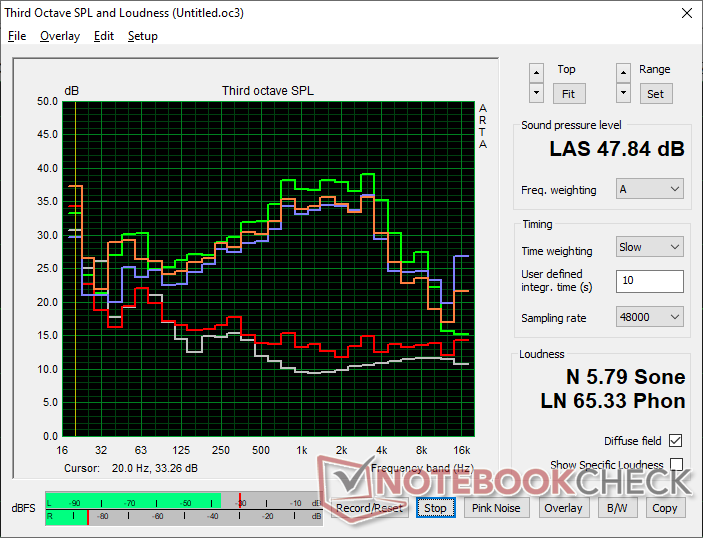
Noise level
| Idle |
| 25.7 / 25.8 / 25.8 dB(A) |
| Load |
| 44.4 / 47.8 dB(A) |
 | ||
30 dB silent 40 dB(A) audible 50 dB(A) loud |
||
min: | ||
| BOSGAME VTA-439 Ryzen AI 9 HX 470, Radeon 890M | Beelink GTI15 Ultra Ultra 9 285H, Arc 140T | Beelink SER9 Pro Ryzen 7 H 255, Radeon 780M | GMK EVO-X1 Ryzen AI 9 HX 370, Radeon 890M | MSI Cubi NUC AI+ 3MG Ultra 9 386H, Intel Graphics 4 Xe3 PTL | Asus NUC 15 Pro+ Ultra 9 285H, Arc 140T | |
|---|---|---|---|---|---|---|
| Noise | 8% | 3% | -6% | -7% | -9% | |
| off / environment * (dB) | 23.1 | 22.4 3% | 23 -0% | 23.3 -1% | 23.6 -2% | 25.3 -10% |
| Idle Minimum * (dB) | 25.7 | 27.9 -9% | 29.1 -13% | 27.8 -8% | 28 -9% | 25.4 1% |
| Idle Average * (dB) | 25.8 | 27.9 -8% | 30.1 -17% | 30.3 -17% | 33.2 -29% | 25.5 1% |
| Idle Maximum * (dB) | 25.8 | 30.2 -17% | 31.7 -23% | 30.4 -18% | 33.5 -30% | 37.3 -45% |
| Load Average * (dB) | 44.4 | 31.3 30% | 33.7 24% | 44.6 -0% | 39.1 12% | 44.4 -0% |
| Cyberpunk 2077 ultra * (dB) | 44.8 | 32.1 28% | 33.8 25% | 44.2 1% | 44.4 1% | 46.2 -3% |
| Load Maximum * (dB) | 47.8 | 32.5 32% | 35.2 26% | 46.1 4% | 45.2 5% | 52.7 -10% |
| Witcher 3 ultra * (dB) | 47.7 |
* ... smaller is better
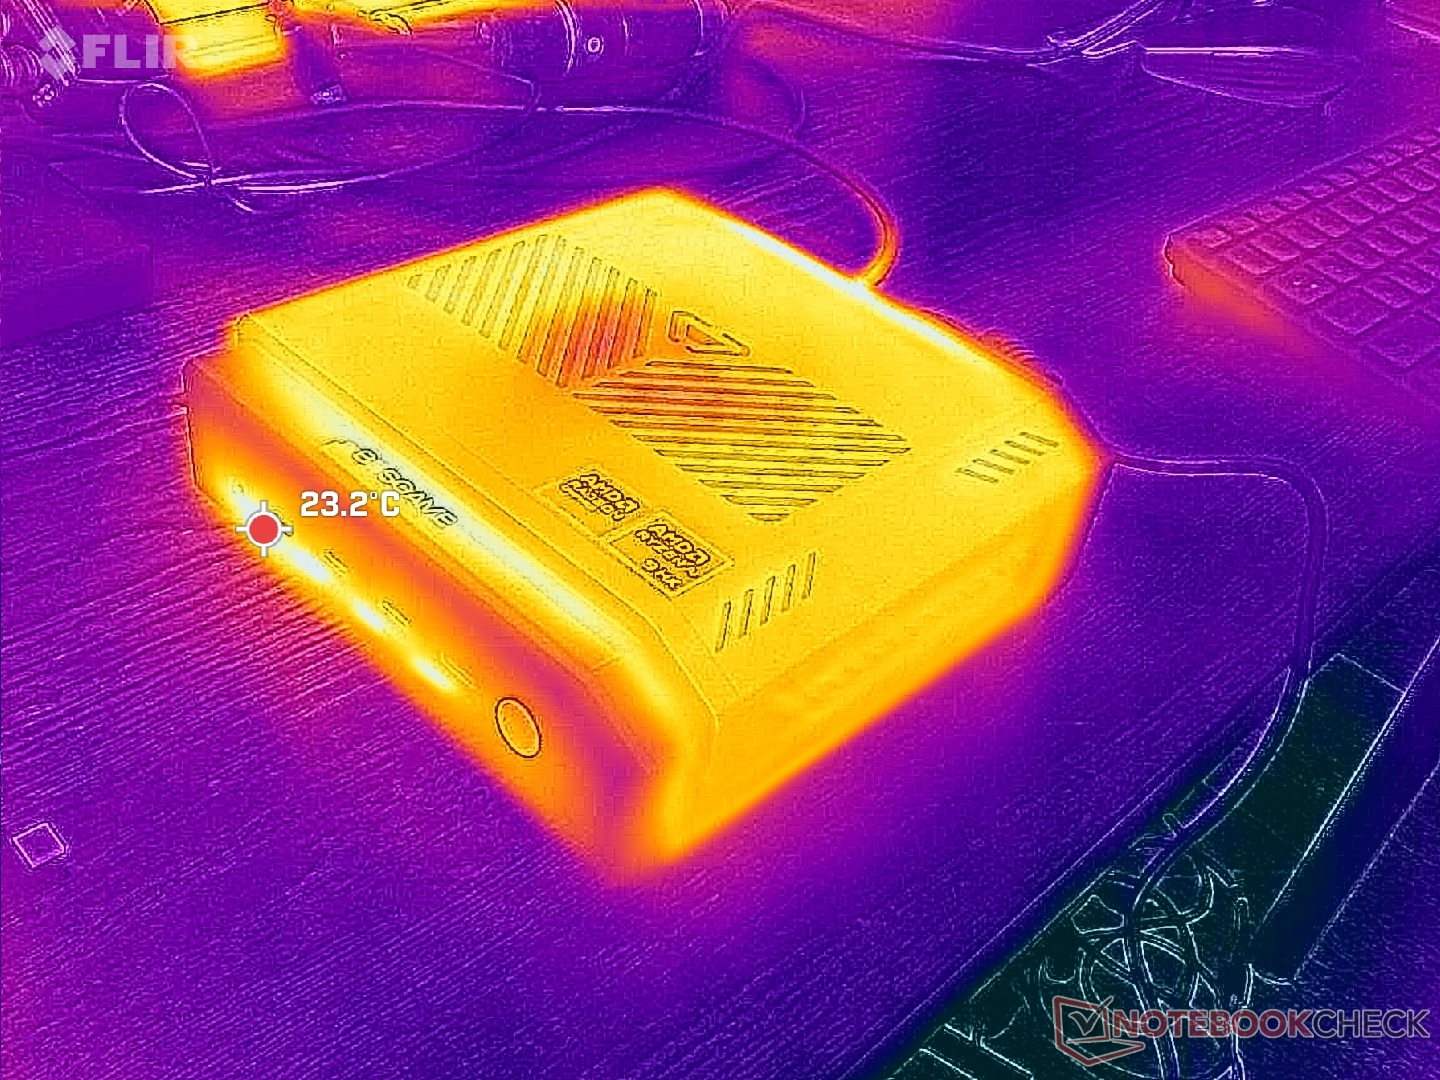
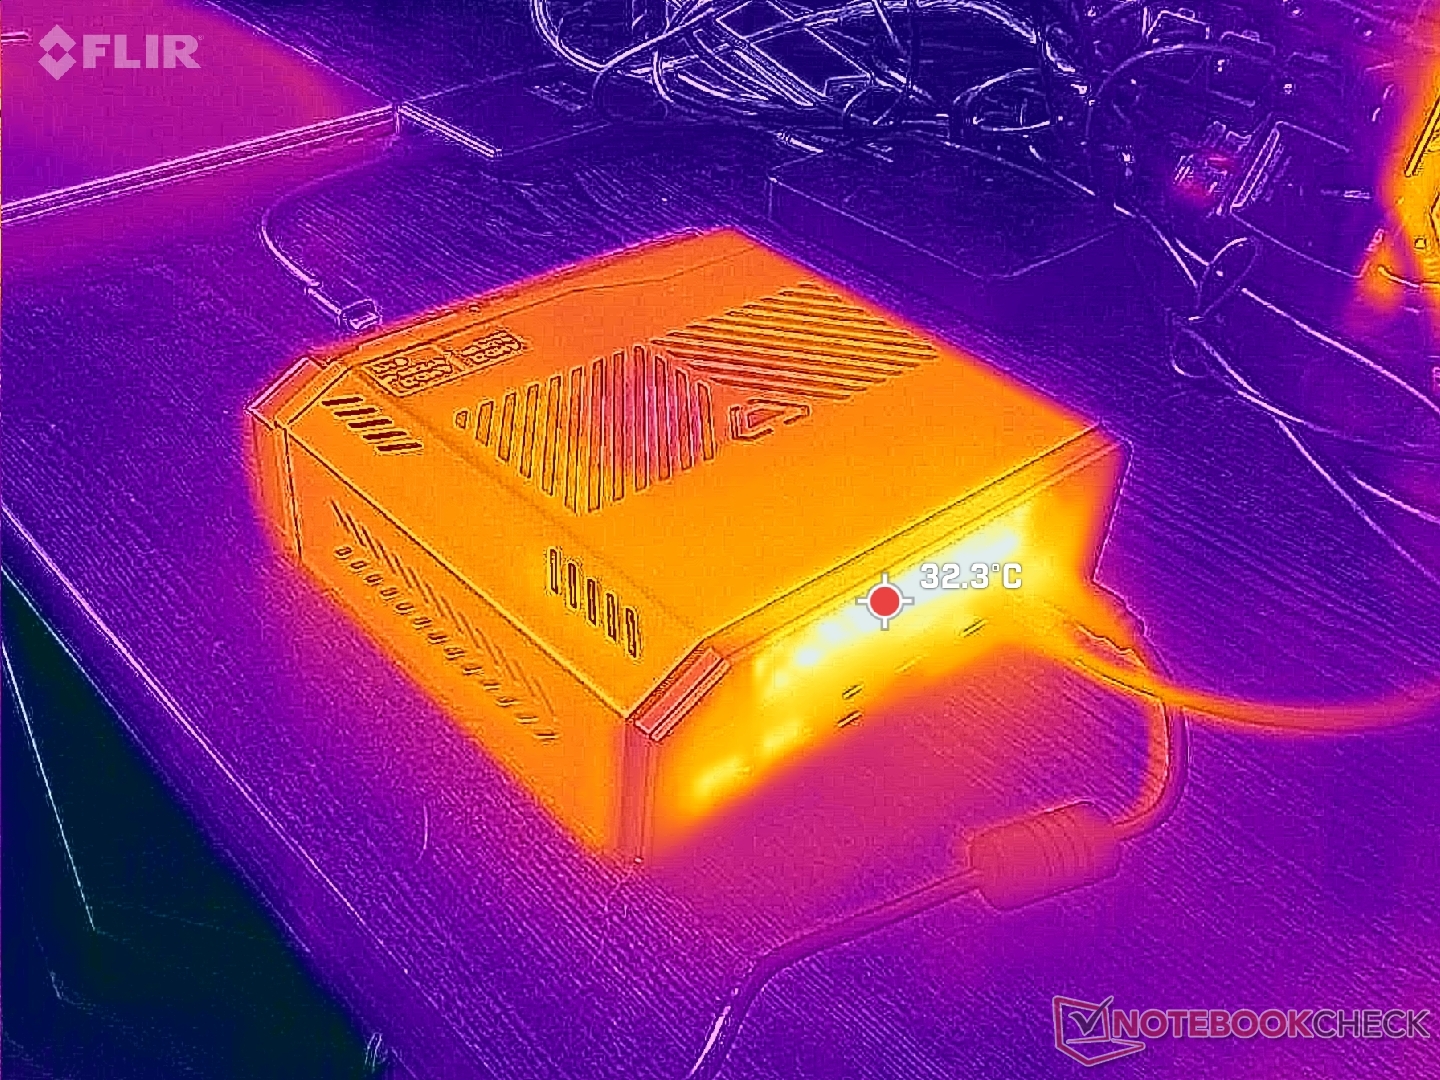
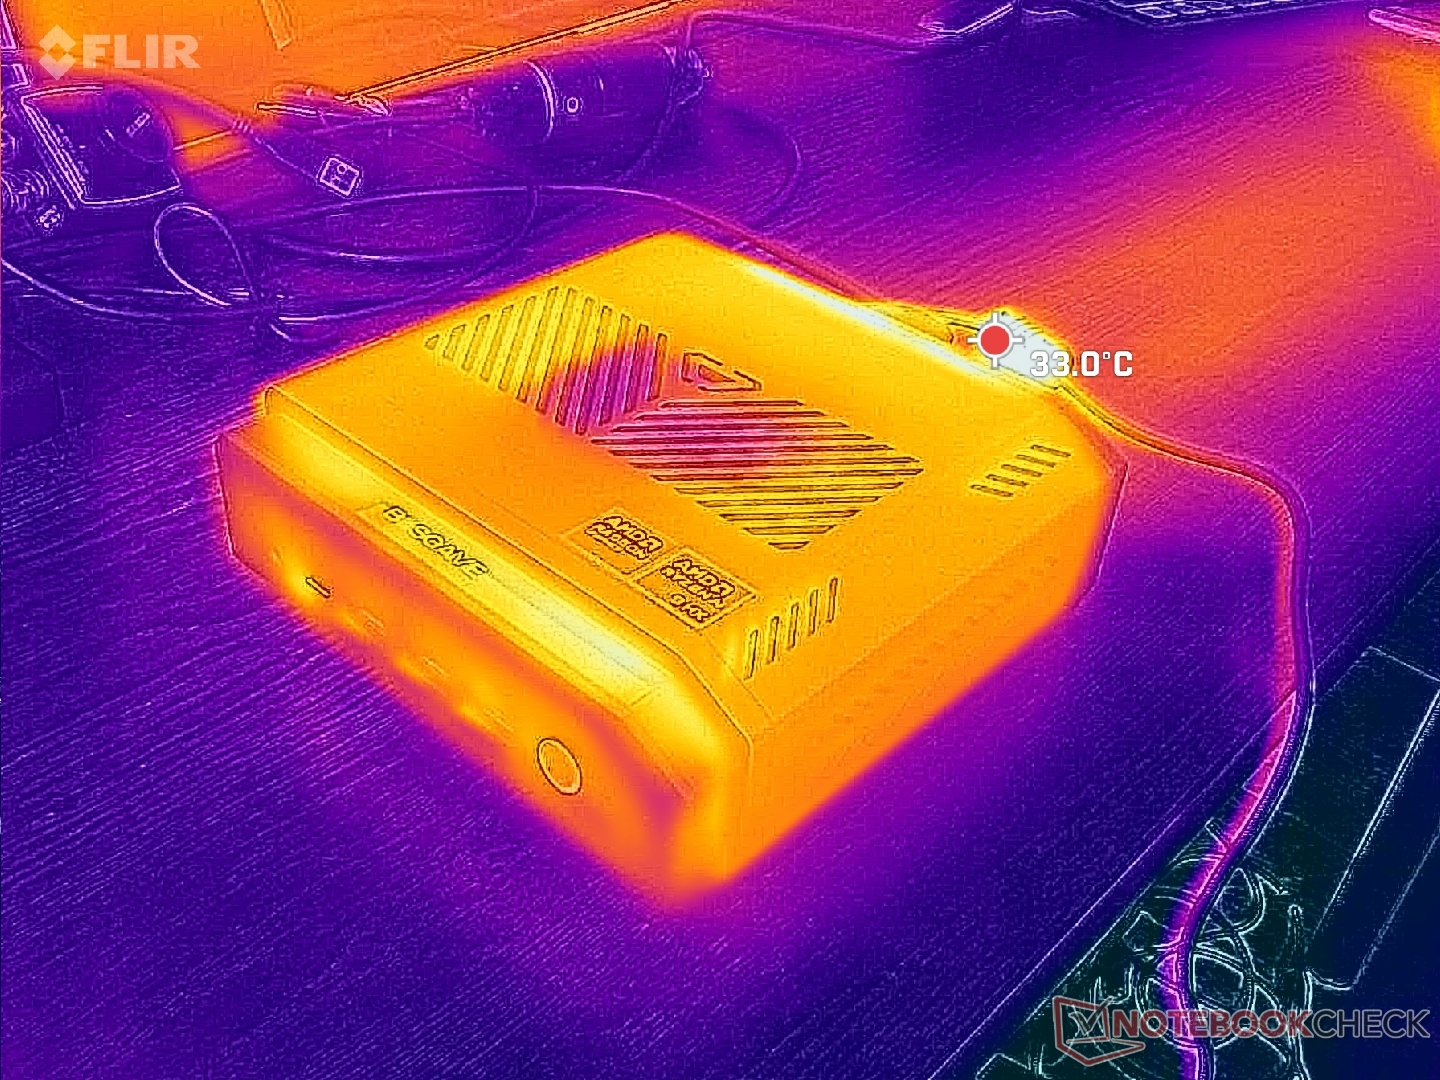
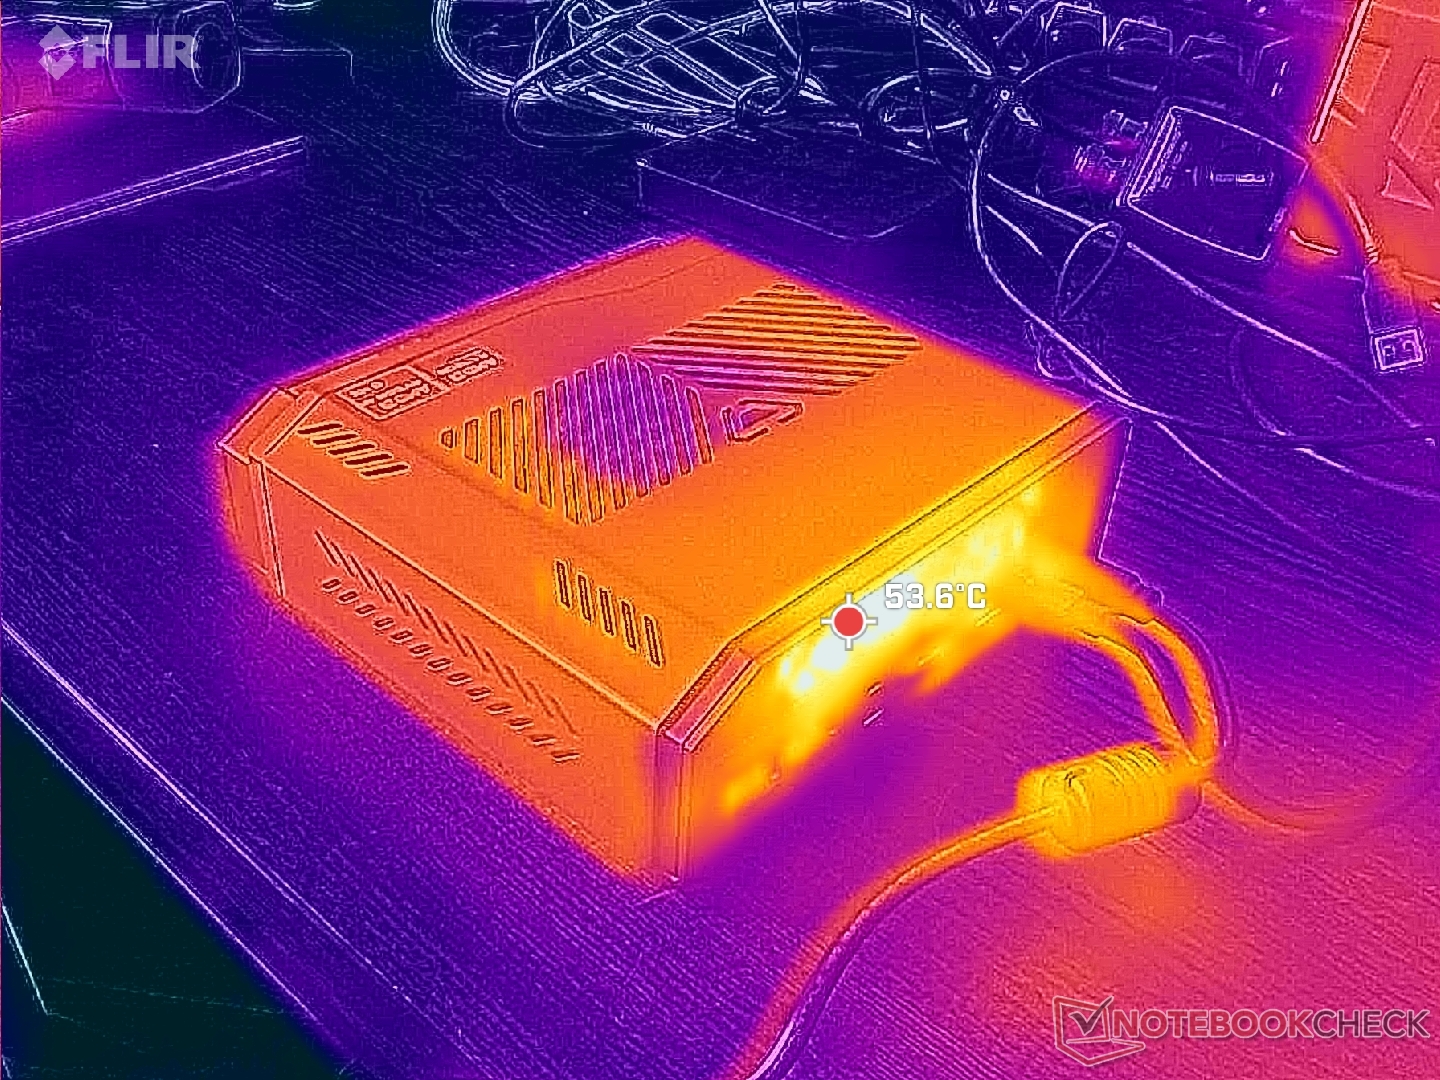
Temperature
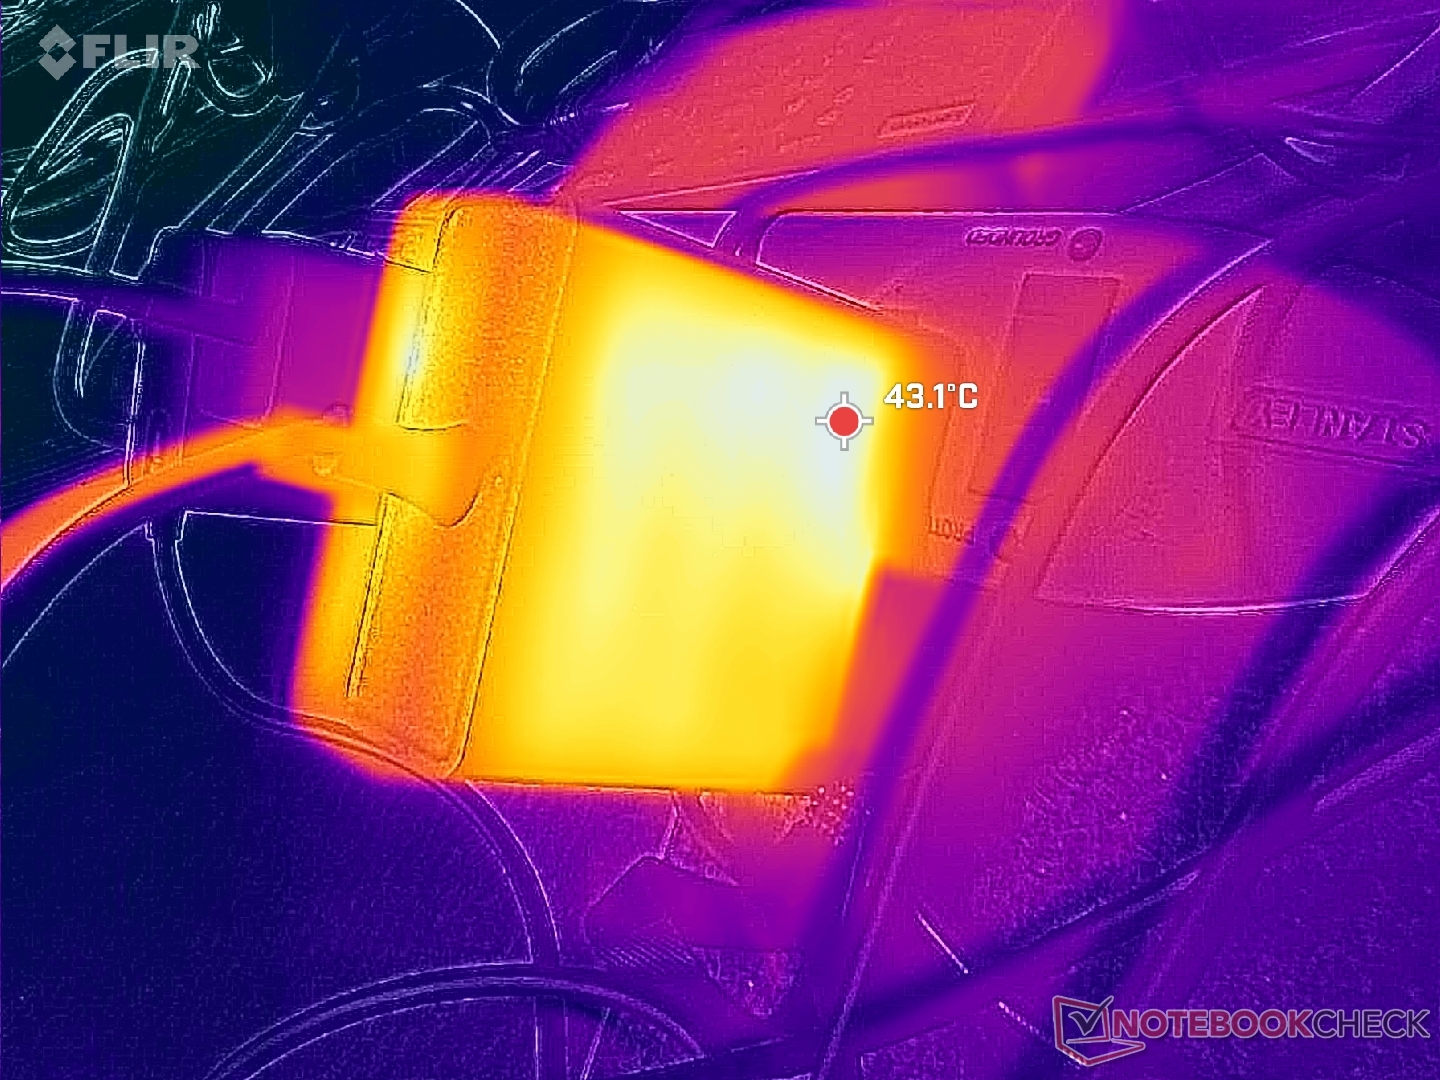
Fresh air enters from the top while waste heat expels from the rear. The relatively small 120 W AC adapter (~7 x 7 x 3.1 cm) reaches over 43 C when running demanding loads.
(+) The maximum temperature on the upper side is 31.6 °C / 89 F, compared to the average of 35.4 °C / 96 F, ranging from 20.6 to 69.5 °C for the class Mini PC.
(+) The bottom heats up to a maximum of 33.4 °C / 92 F, compared to the average of 36.1 °C / 97 F
(+) In idle usage, the average temperature for the upper side is 28.4 °C / 83 F, compared to the device average of 32.1 °C / 90 F.
Stress Test
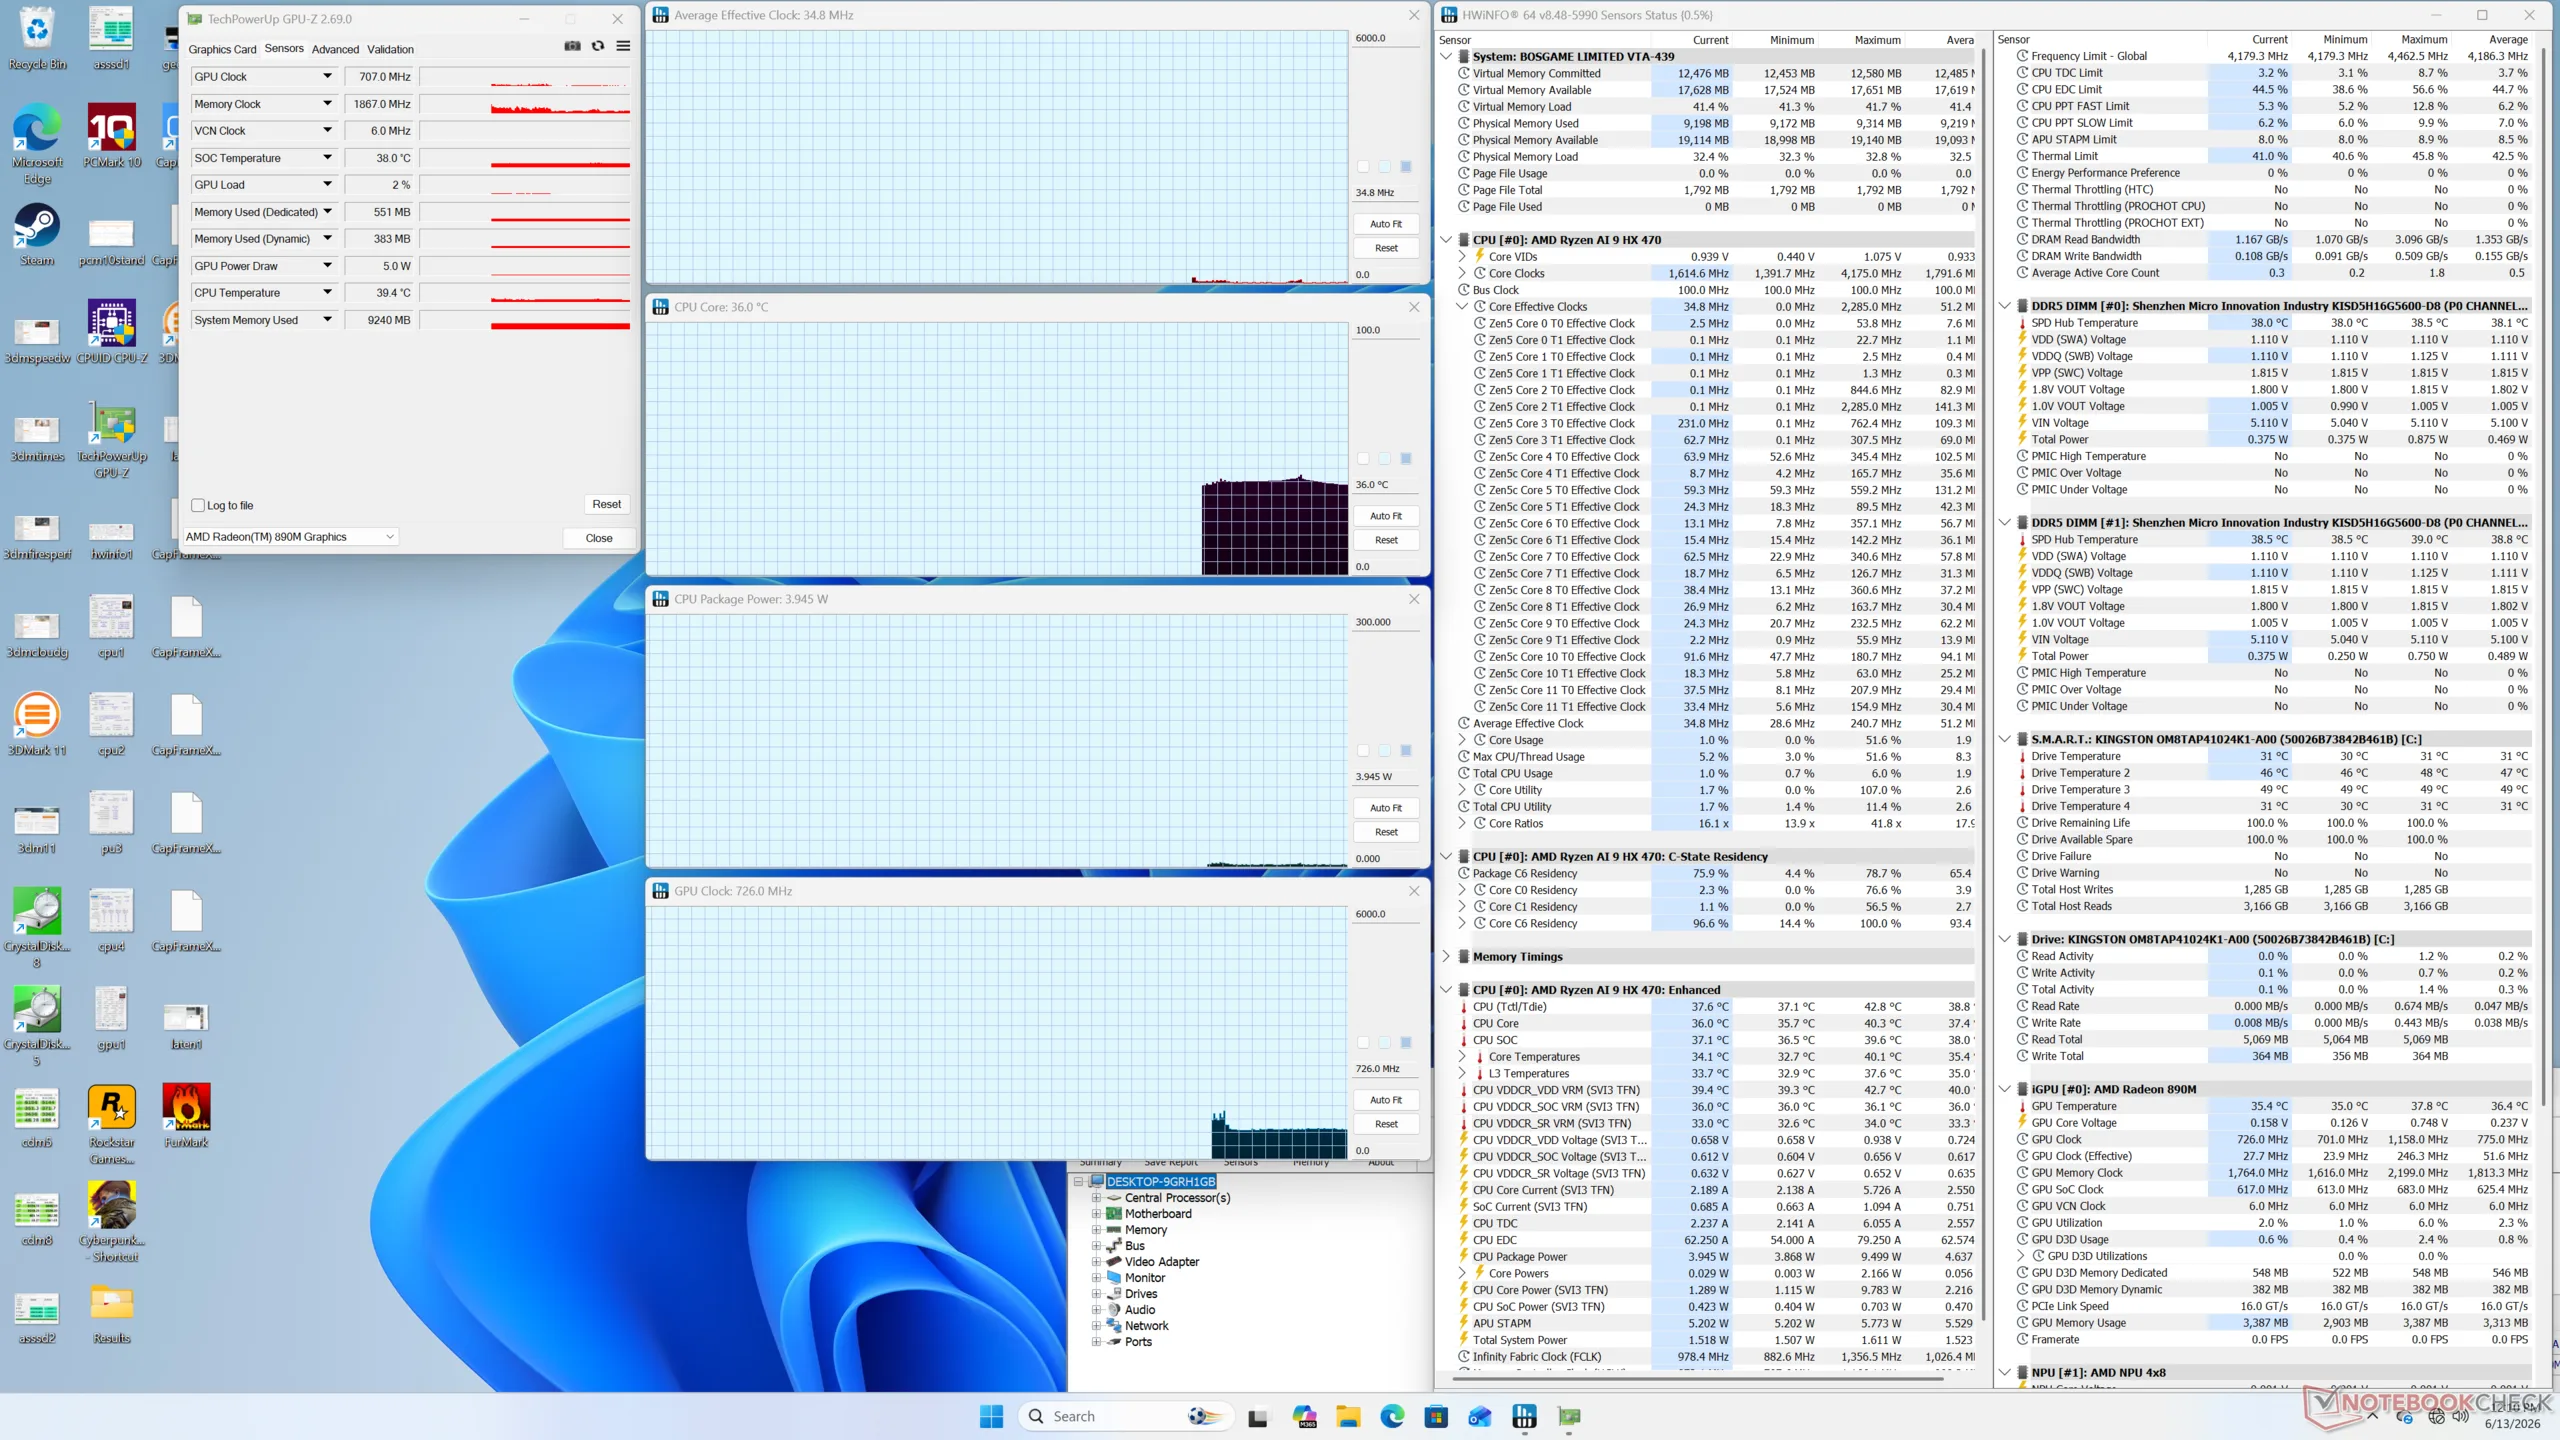
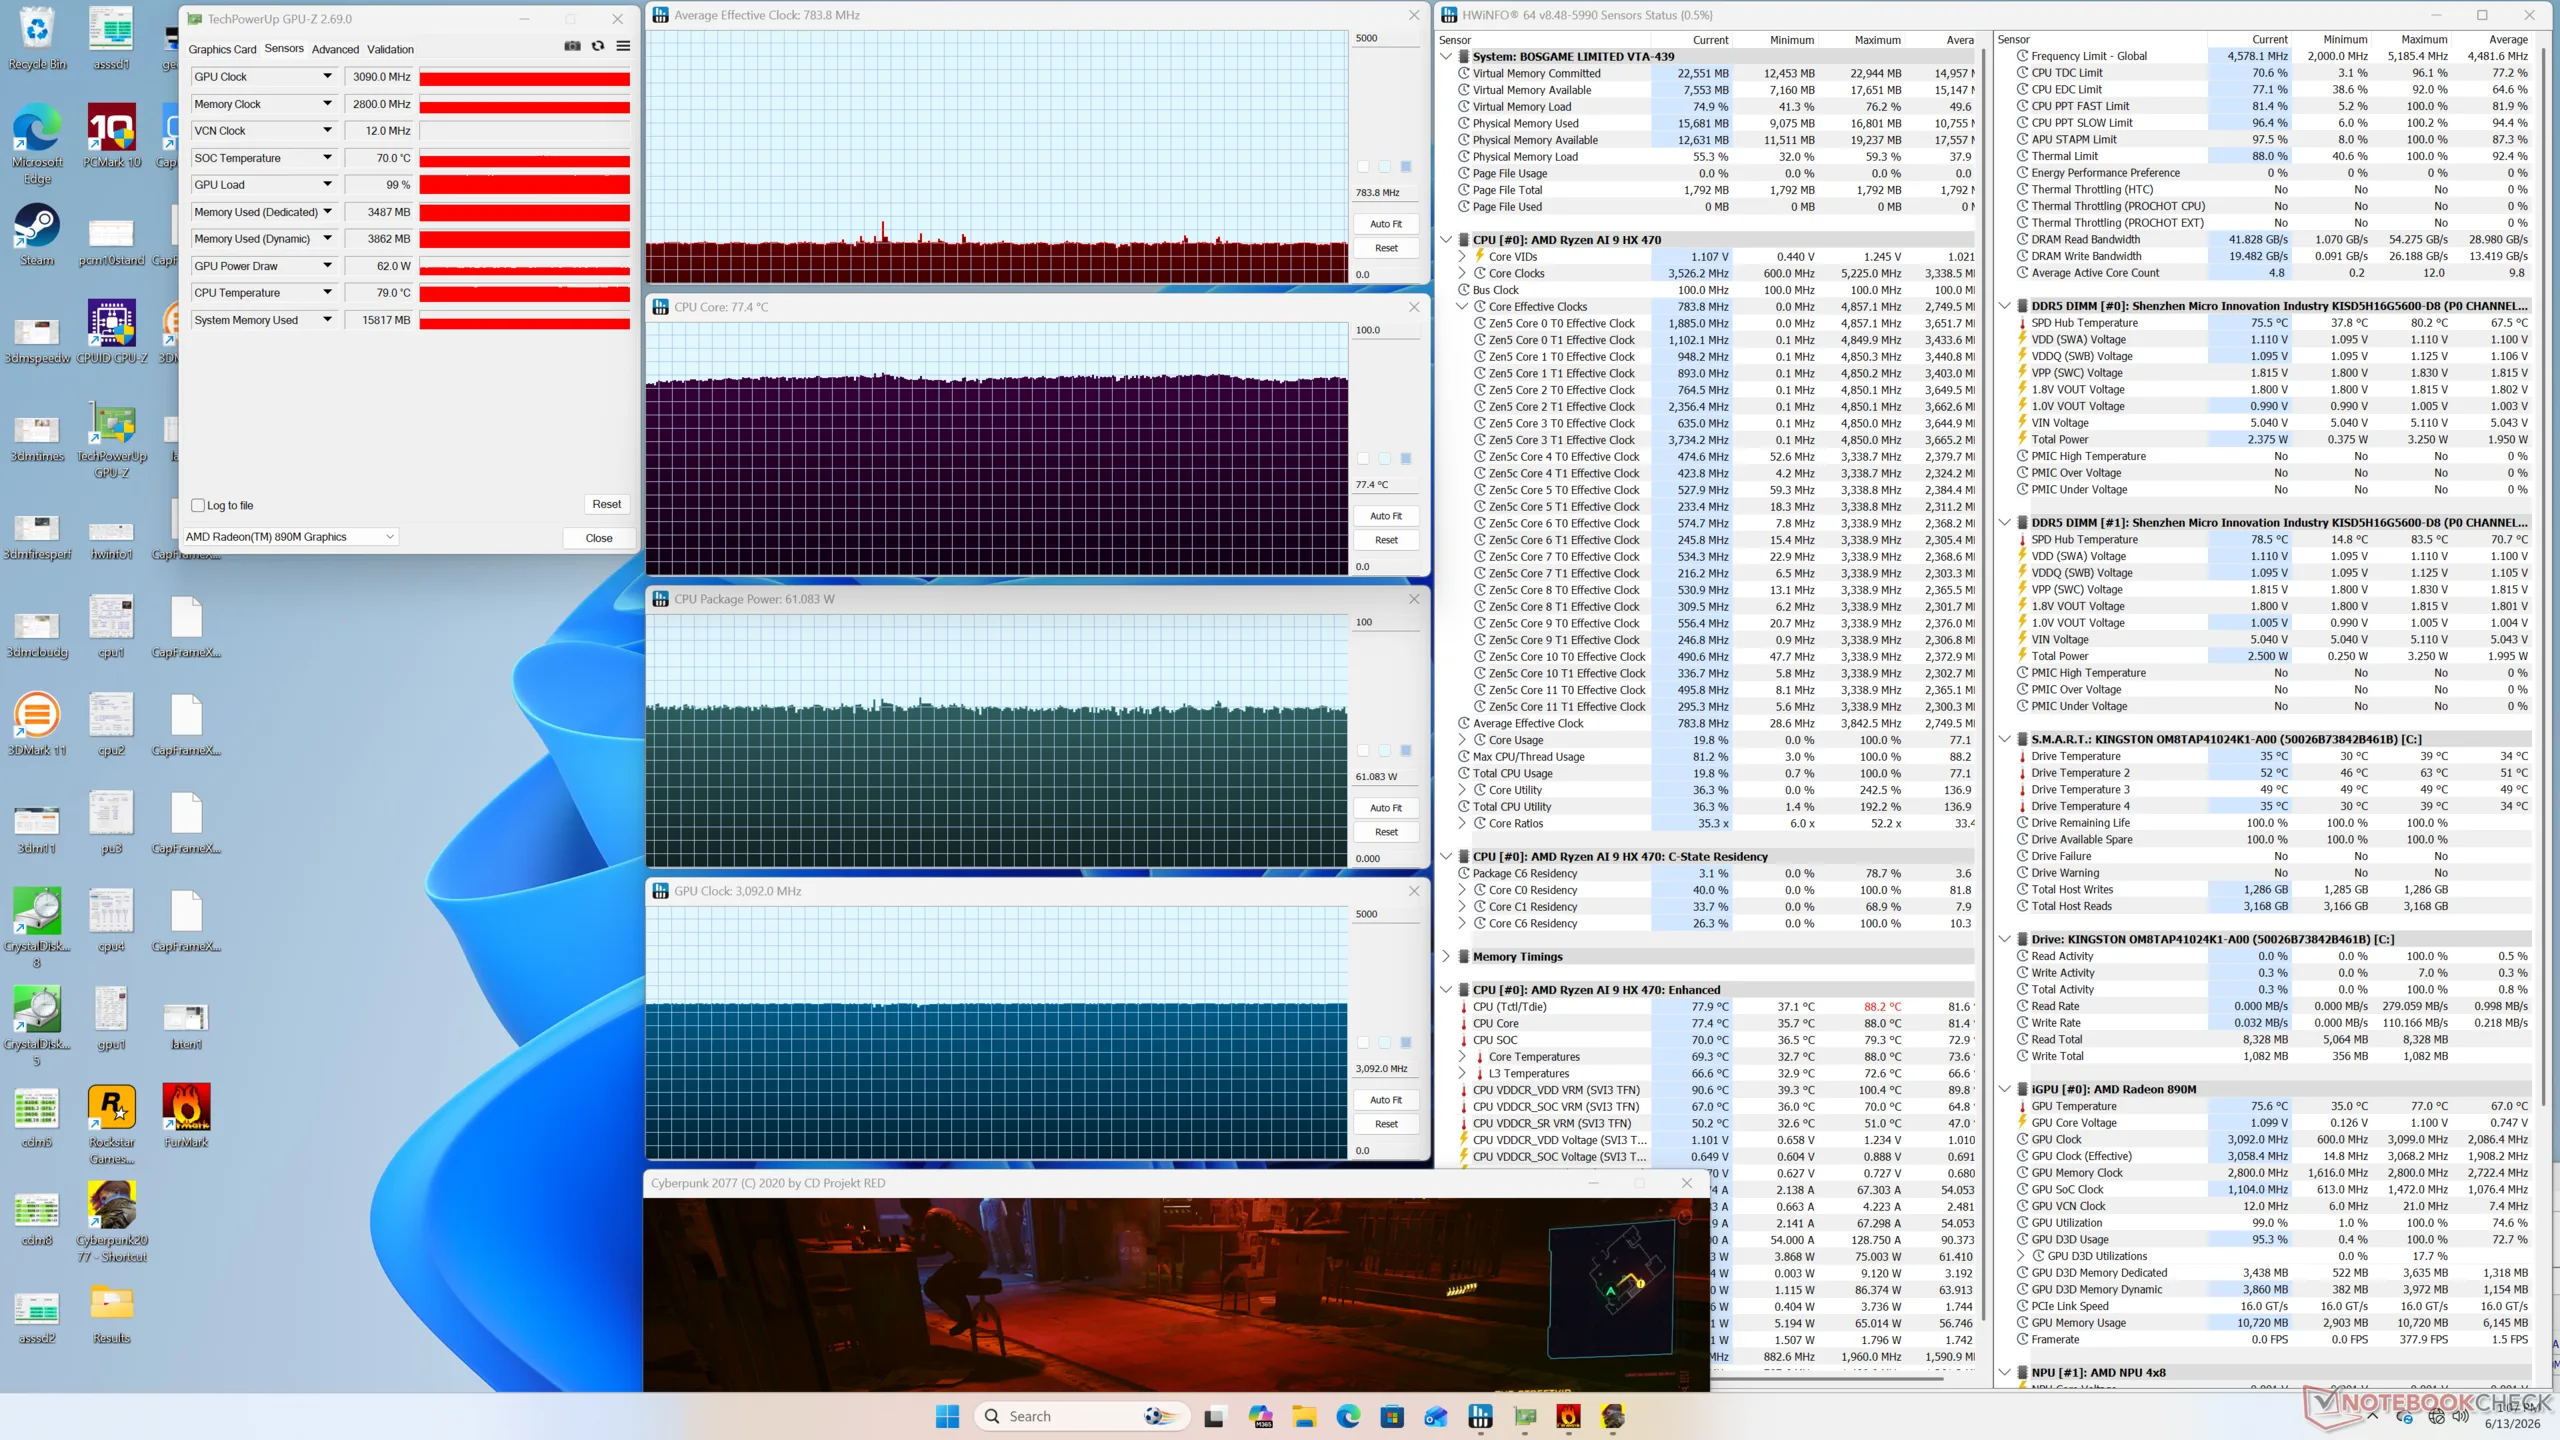
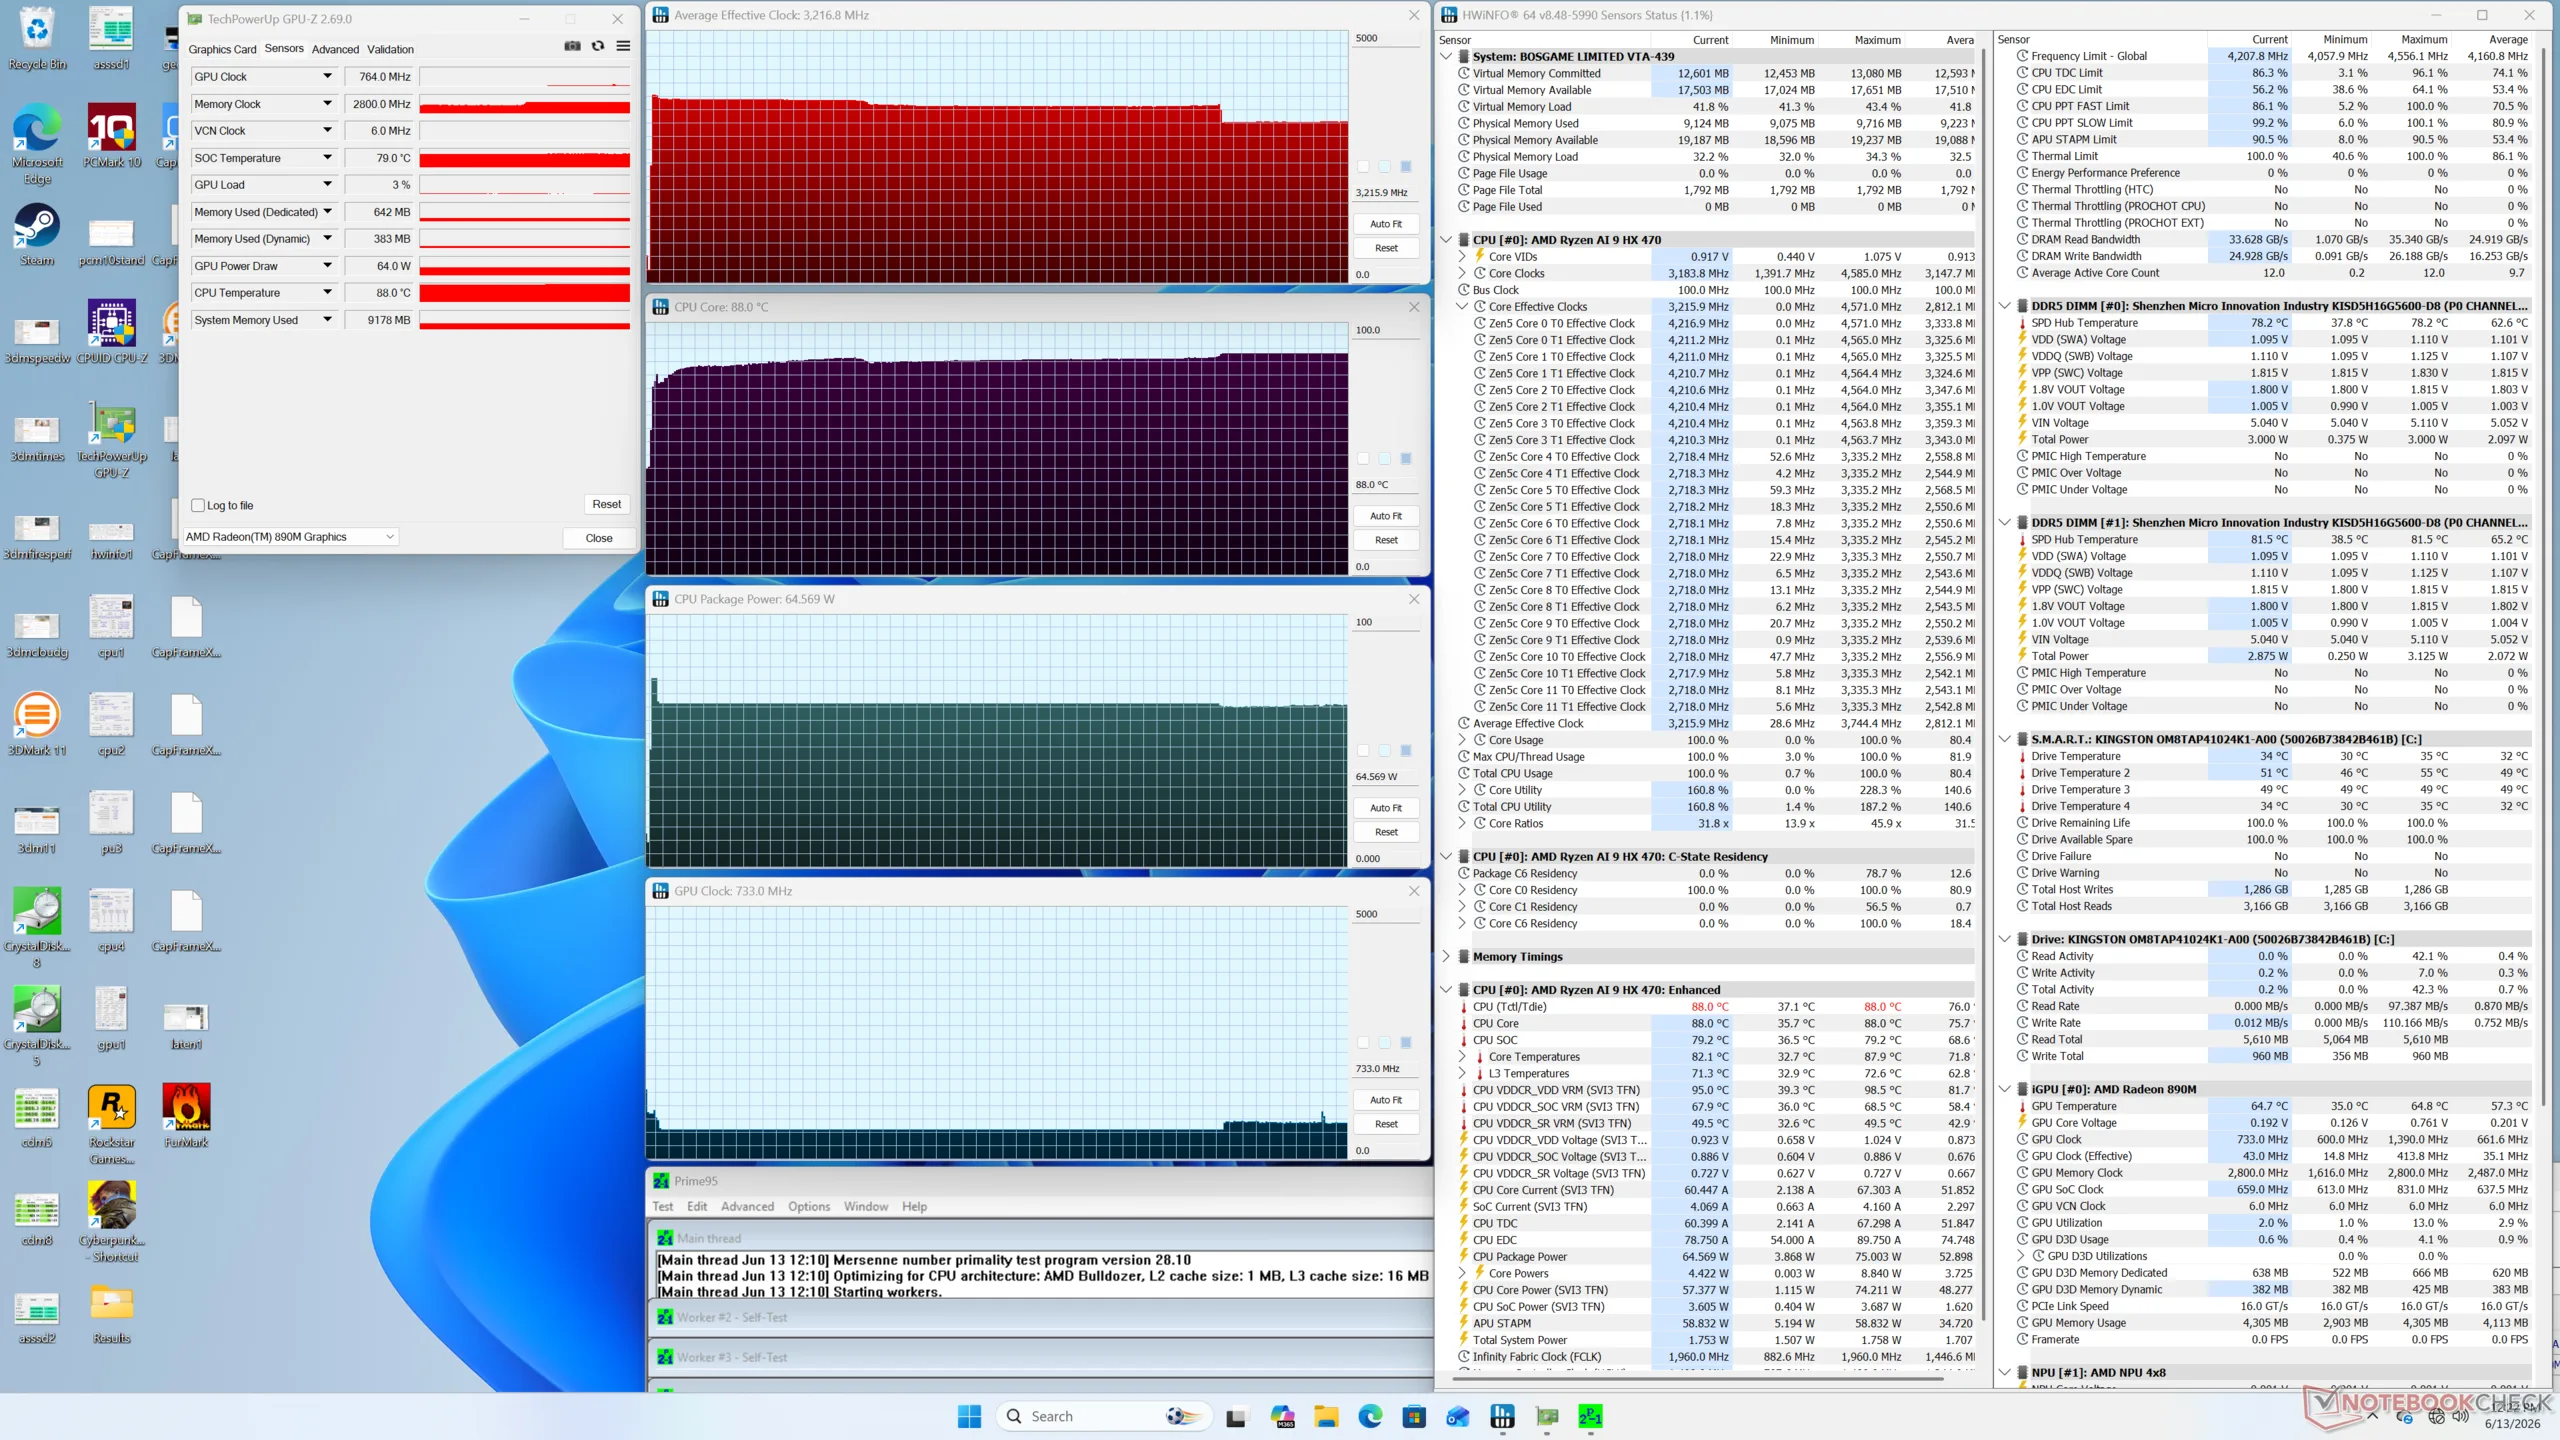
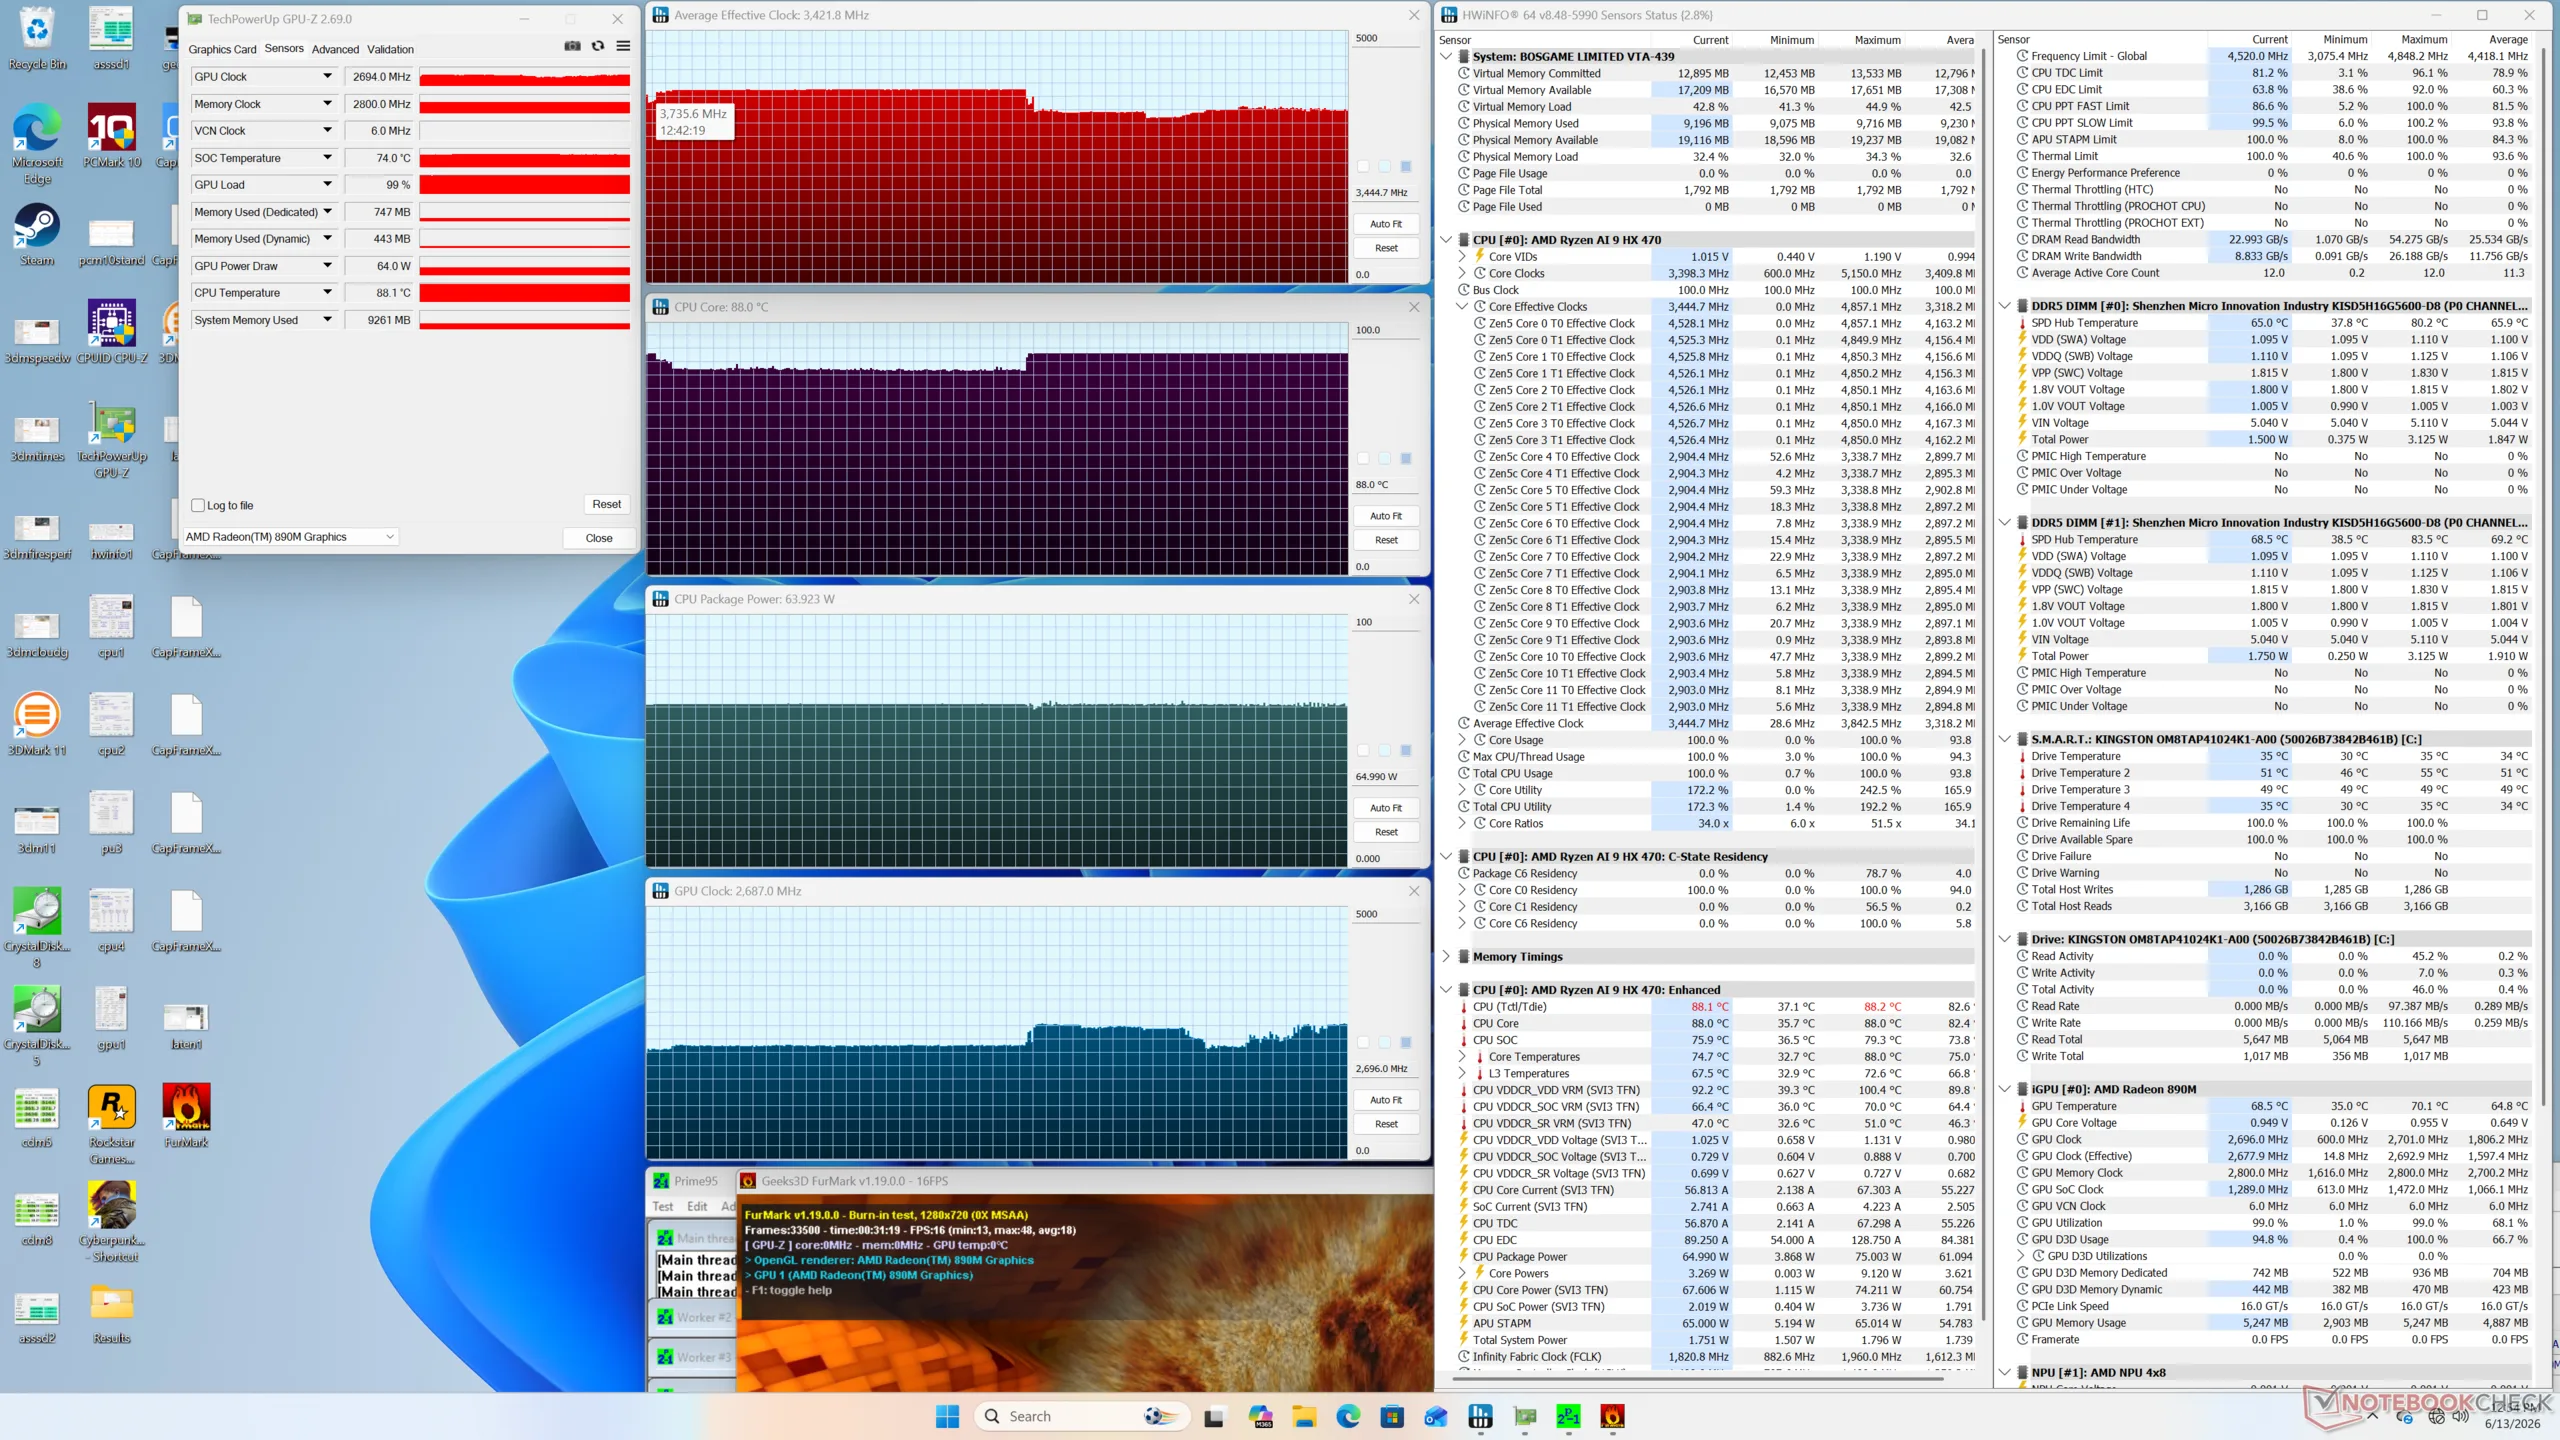
| Average CPU Clock (GHz) | GPU Clock (MHz) | Average CPU Temperature (°C) | |
| System Idle | -- | -- | 36 |
| Prime95 Stress | 3.2 | 733 | 88 |
| Prime95 + FurMark Stress | 3.5 | 2696 | 88 |
| Cyberpunk 2077 Stress | 0.8 | 3092 | 78 |
Energy Management
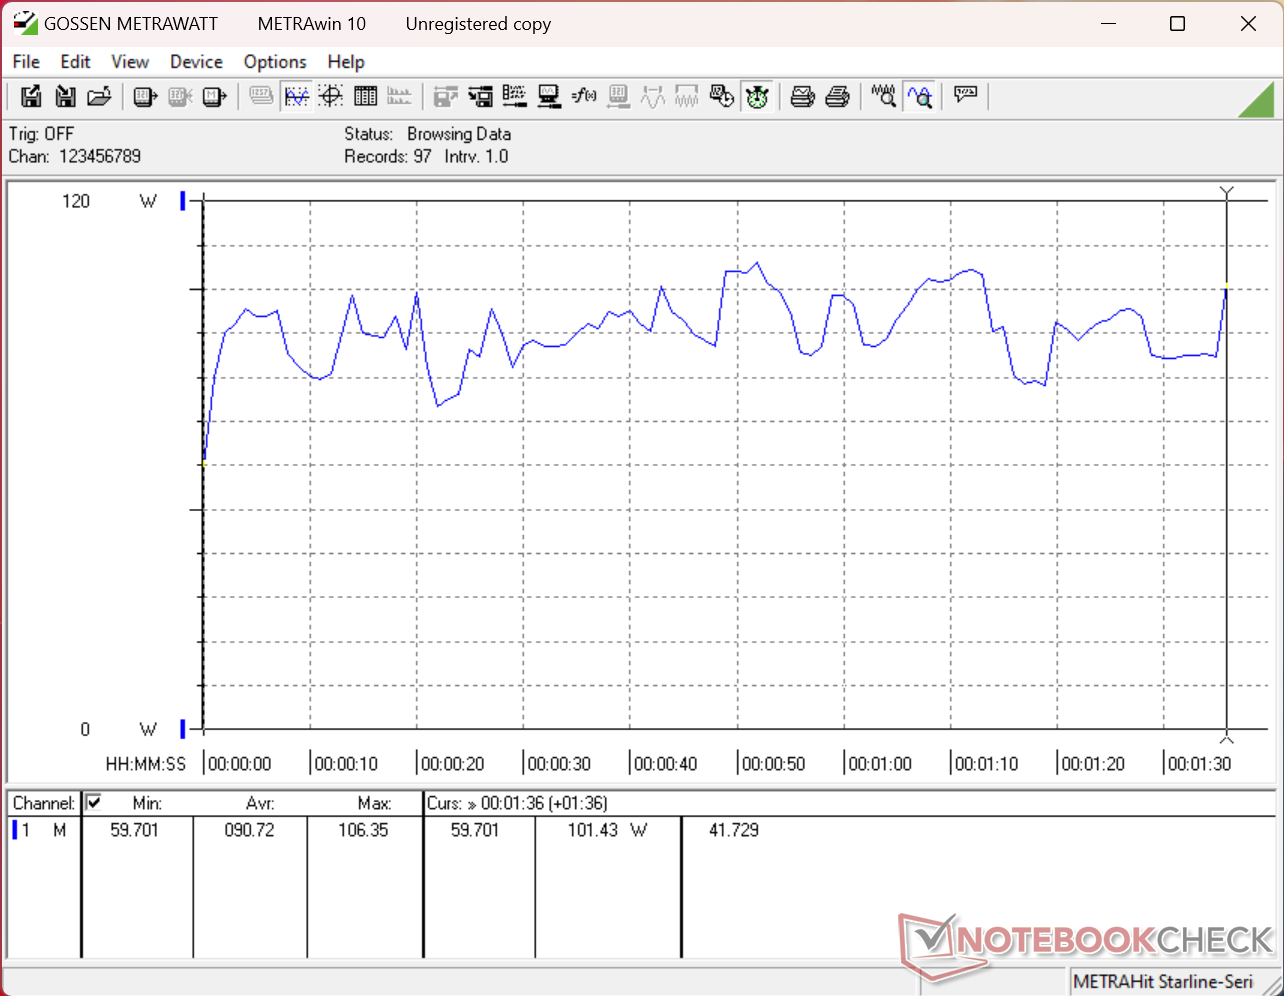
Power Consumption
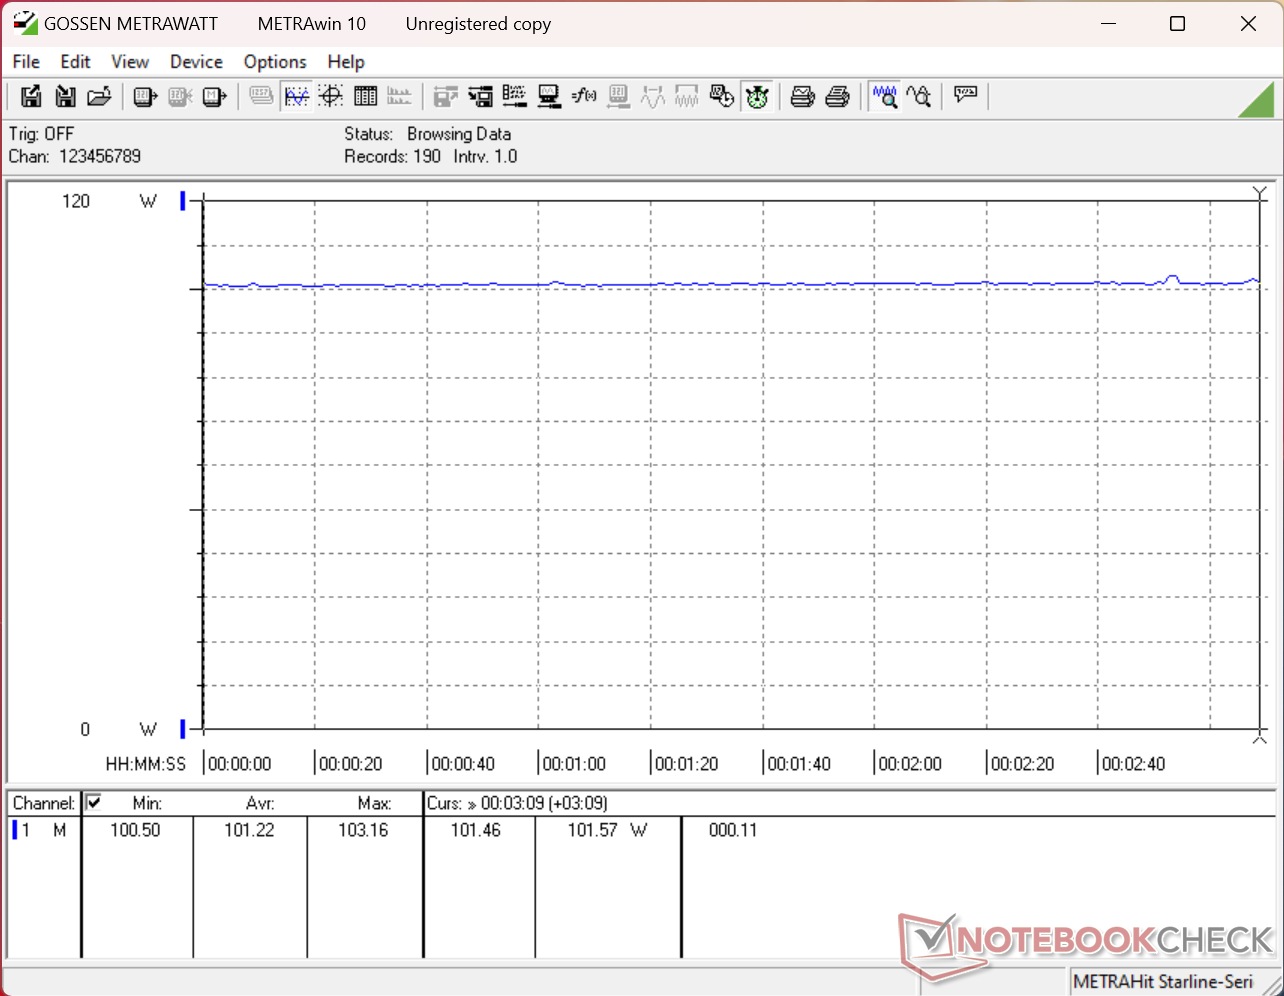
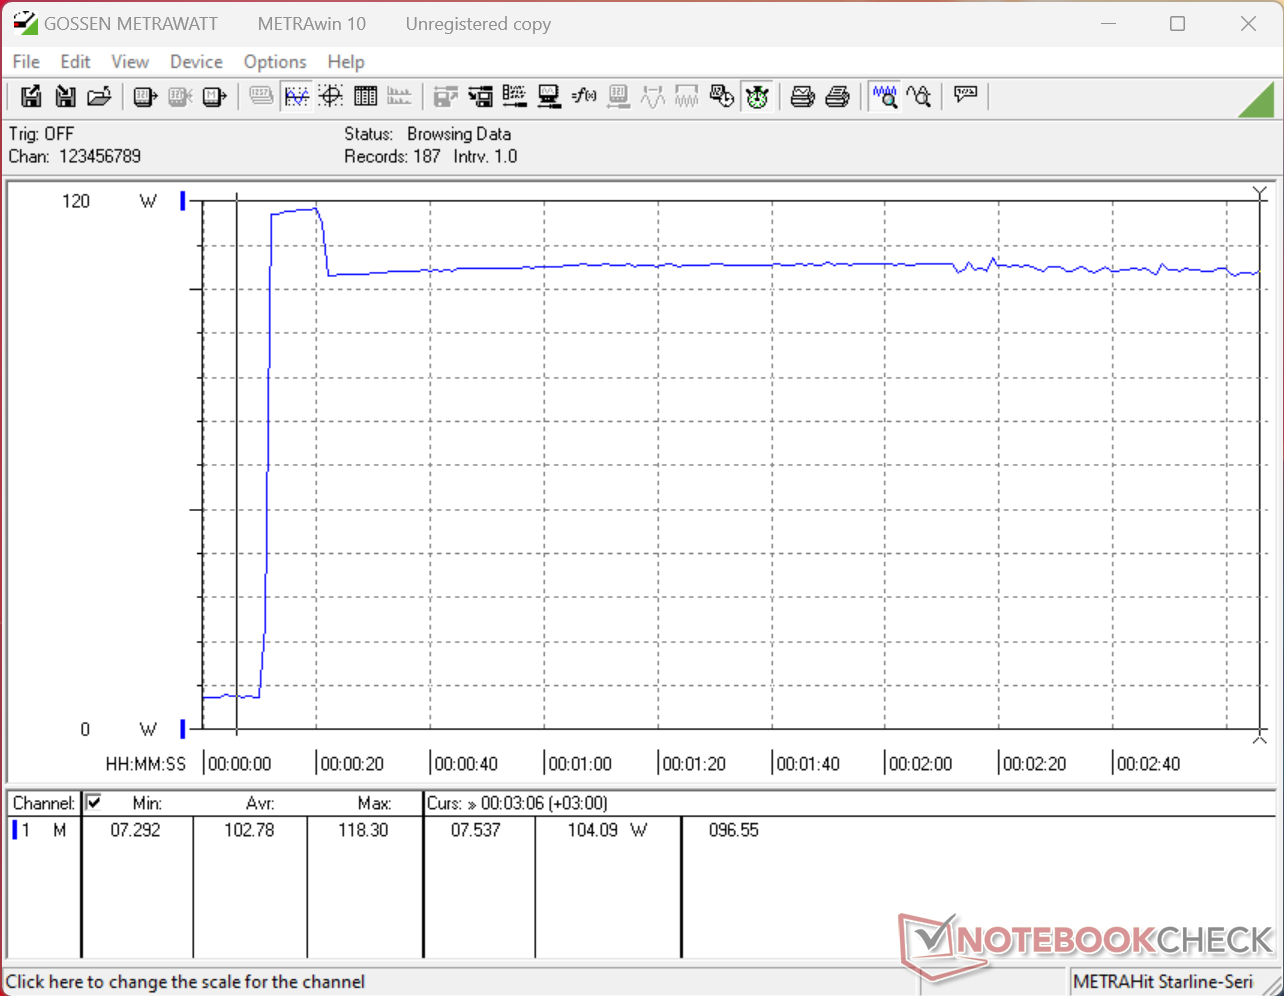
| Off / Standby | |
| Idle | |
| Load |
|
Key:
min: | |
| BOSGAME VTA-439 Ryzen AI 9 HX 470, Radeon 890M, Kingston OM8TAP41024K1-A00, , x, | Beelink GTI15 Ultra Ultra 9 285H, Arc 140T, , , x, | Beelink SER9 Pro Ryzen 7 H 255, Radeon 780M, Crucial P3 Plus CT1000P3PSSD8, , x, | GMK EVO-X1 Ryzen AI 9 HX 370, Radeon 890M, Crucial P3 Plus CT1000P3PSSD8, , x, | MSI Cubi NUC AI+ 3MG Ultra 9 386H, Intel Graphics 4 Xe3 PTL, Phison 1 TB ESR01TBTCCZ-27J, , x, | Asus NUC 15 Pro+ Ultra 9 285H, Arc 140T, Micron 3500 1TB MTFDKBA1T0TGD, , x, | |
|---|---|---|---|---|---|---|
| Power Consumption | -99% | 18% | 28% | 23% | 19% | |
| Idle Minimum * (Watt) | 7 | 18.8 -169% | 7 -0% | 5.4 23% | 6.2 11% | 3.9 44% |
| Idle Average * (Watt) | 7.5 | 20.1 -168% | 7.1 5% | 5.8 23% | 7.9 -5% | 6.1 19% |
| Idle Maximum * (Watt) | 9 | 40.1 -346% | 7.5 17% | 5.8 36% | 8.5 6% | 8.2 9% |
| Load Average * (Watt) | 90.7 | 66.2 27% | 62.3 31% | 72.1 21% | 41.4 54% | 56.1 38% |
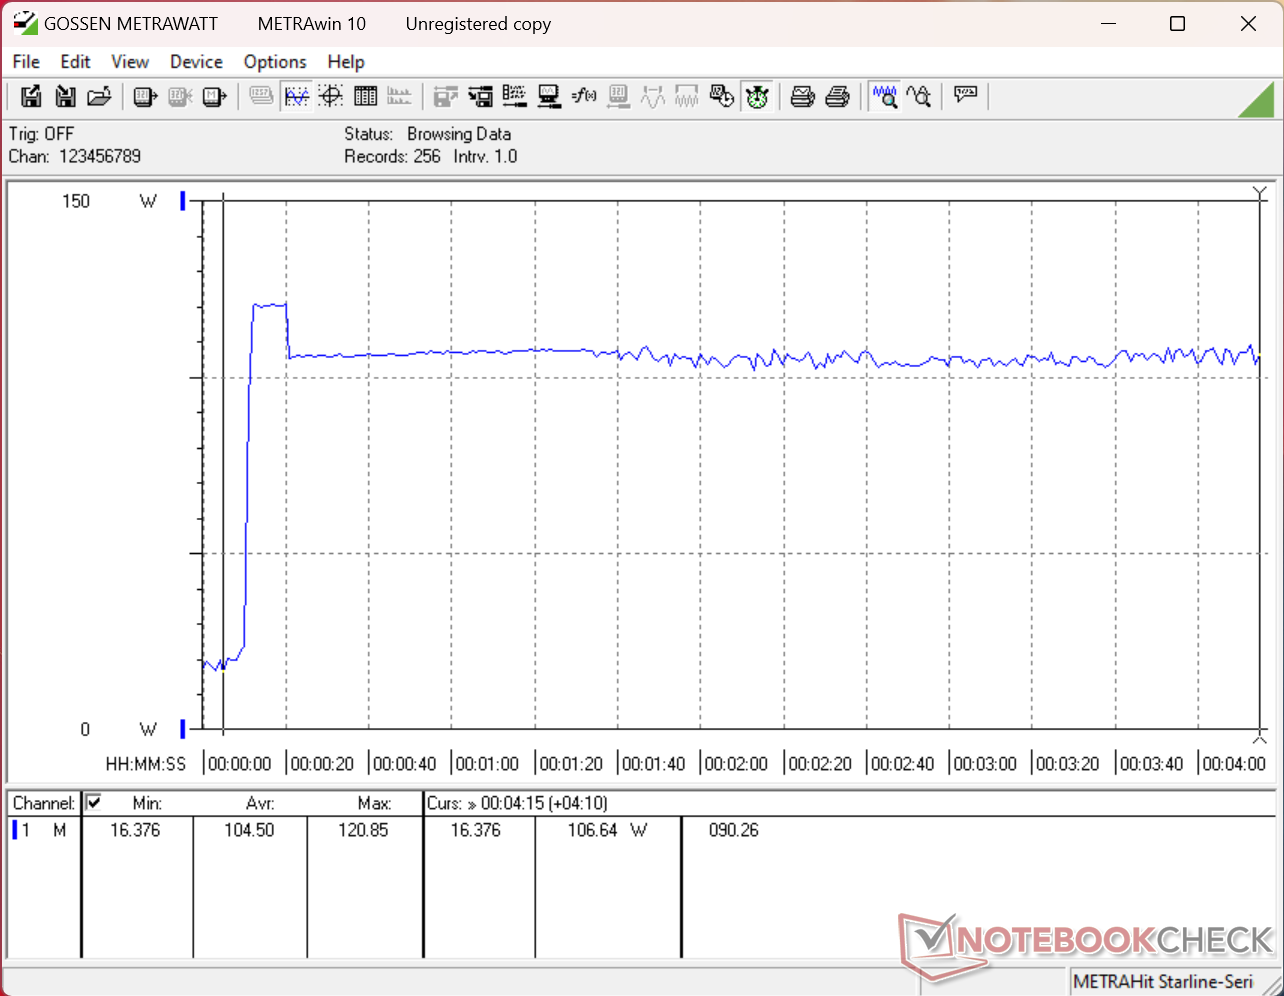
| Cyberpunk 2077 ultra external monitor * (Watt) | 101.2 | 72.4 28% | 80.1 21% | 72.5 28% | 47.6 53% | 63.9 37% |
| Load Maximum * (Watt) | 120.9 | 82.4 32% | 82.9 31% | 76.1 37% | 98 19% | 160.6 -33% |
* ... smaller is better
Power Consumption Cyberpunk / Stress Test
Power Consumption external Monitor
Notebookcheck Rating
A professional mini PC optimized for SSD and RAM upgrades at the expense of common HTPC features like speakers and microphones.
BOSGAME VTA-439
- 06/23/2026 v8
Allen Ngo
 Total Sustainability Score:
 Potential Competitors in Comparison
Image | Model / Review | Price | Weight | Height | Display |
|---|---|---|---|---|---|
1. 81.1%  | BOSGAME VTA-439 AMD Ryzen AI 9 HX 470 ⎘ AMD Radeon 890M ⎘ 32 GB Memory, 1024 GB SSD | Amazon: 1. $559.00 BOSGAME P3 Mix Mini PC, Mini... List Price: 1050 USD | 764 g | 50 mm | x |
2. 83.7%  | Beelink GTI15 Ultra Intel Core Ultra 9 285H ⎘ Intel Arc Graphics 140T ⎘ 64 GB Memory | Amazon: 1. $1,499.00 Beelink GTI15 Ultra Mini PC ... 2. $1,499.00 Beelink GTi15 Mini PC, Intel... 3. $1,949.00 Beelink GTi15 Mini PC, Intel... List Price: 1200 USD | 1.3 kg | 55.8 mm | x |
3. 80.2% 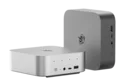 | Beelink SER9 Pro AMD Ryzen 7 H 255 ⎘ AMD Radeon 780M ⎘ 32 GB Memory, 1024 GB SSD | Amazon: List Price: 520 USD | 812 g | 44.7 mm | x |
4. 72% 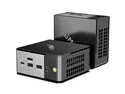 | GMK EVO-X1 AMD Ryzen AI 9 HX 370 ⎘ AMD Radeon 890M ⎘ 32 GB Memory, 1024 GB SSD | Amazon: List Price: 900 USD | 595 g | 63.2 mm | x |
5. 76.9%  | MSI Cubi NUC AI+ 3MG Intel Core Ultra 9 386H ⎘ Intel Graphics 4 Xe3 Panther Lake iGPU ⎘ 32 GB Memory, 1000 GB SSD | Amazon: List Price: 830 USD | 552 g | 37.5 mm | x |
6. 77.5%  | Asus NUC 15 Pro+ Intel Core Ultra 9 285H ⎘ Intel Arc Graphics 140T ⎘ 32 GB Memory, 1024 GB SSD | Amazon: $1,642.00 List Price: 991€ | 690 g | 42 mm | x |
Transparency
The selection of devices to be reviewed is made by our editorial team. The test sample was provided to the author as a loan by the manufacturer or retailer for the purpose of this review. The lender had no influence on this review, nor did the manufacturer receive a copy of this review before publication. There was no obligation to publish this review. As an independent media company, Notebookcheck is not subjected to the authority of manufacturers, retailers or publishers.
This is how Notebookcheck is testing
Every year, Notebookcheck independently reviews hundreds of laptops and smartphones using standardized procedures to ensure that all results are comparable. We have continuously developed our test methods for around 20 years and set industry standards in the process. In our test labs, high-quality measuring equipment is utilized by experienced technicians and editors. These tests involve a multi-stage validation process. Our complex rating system is based on hundreds of well-founded measurements and benchmarks, which maintains objectivity. Further information on our test methods can be found here.
