
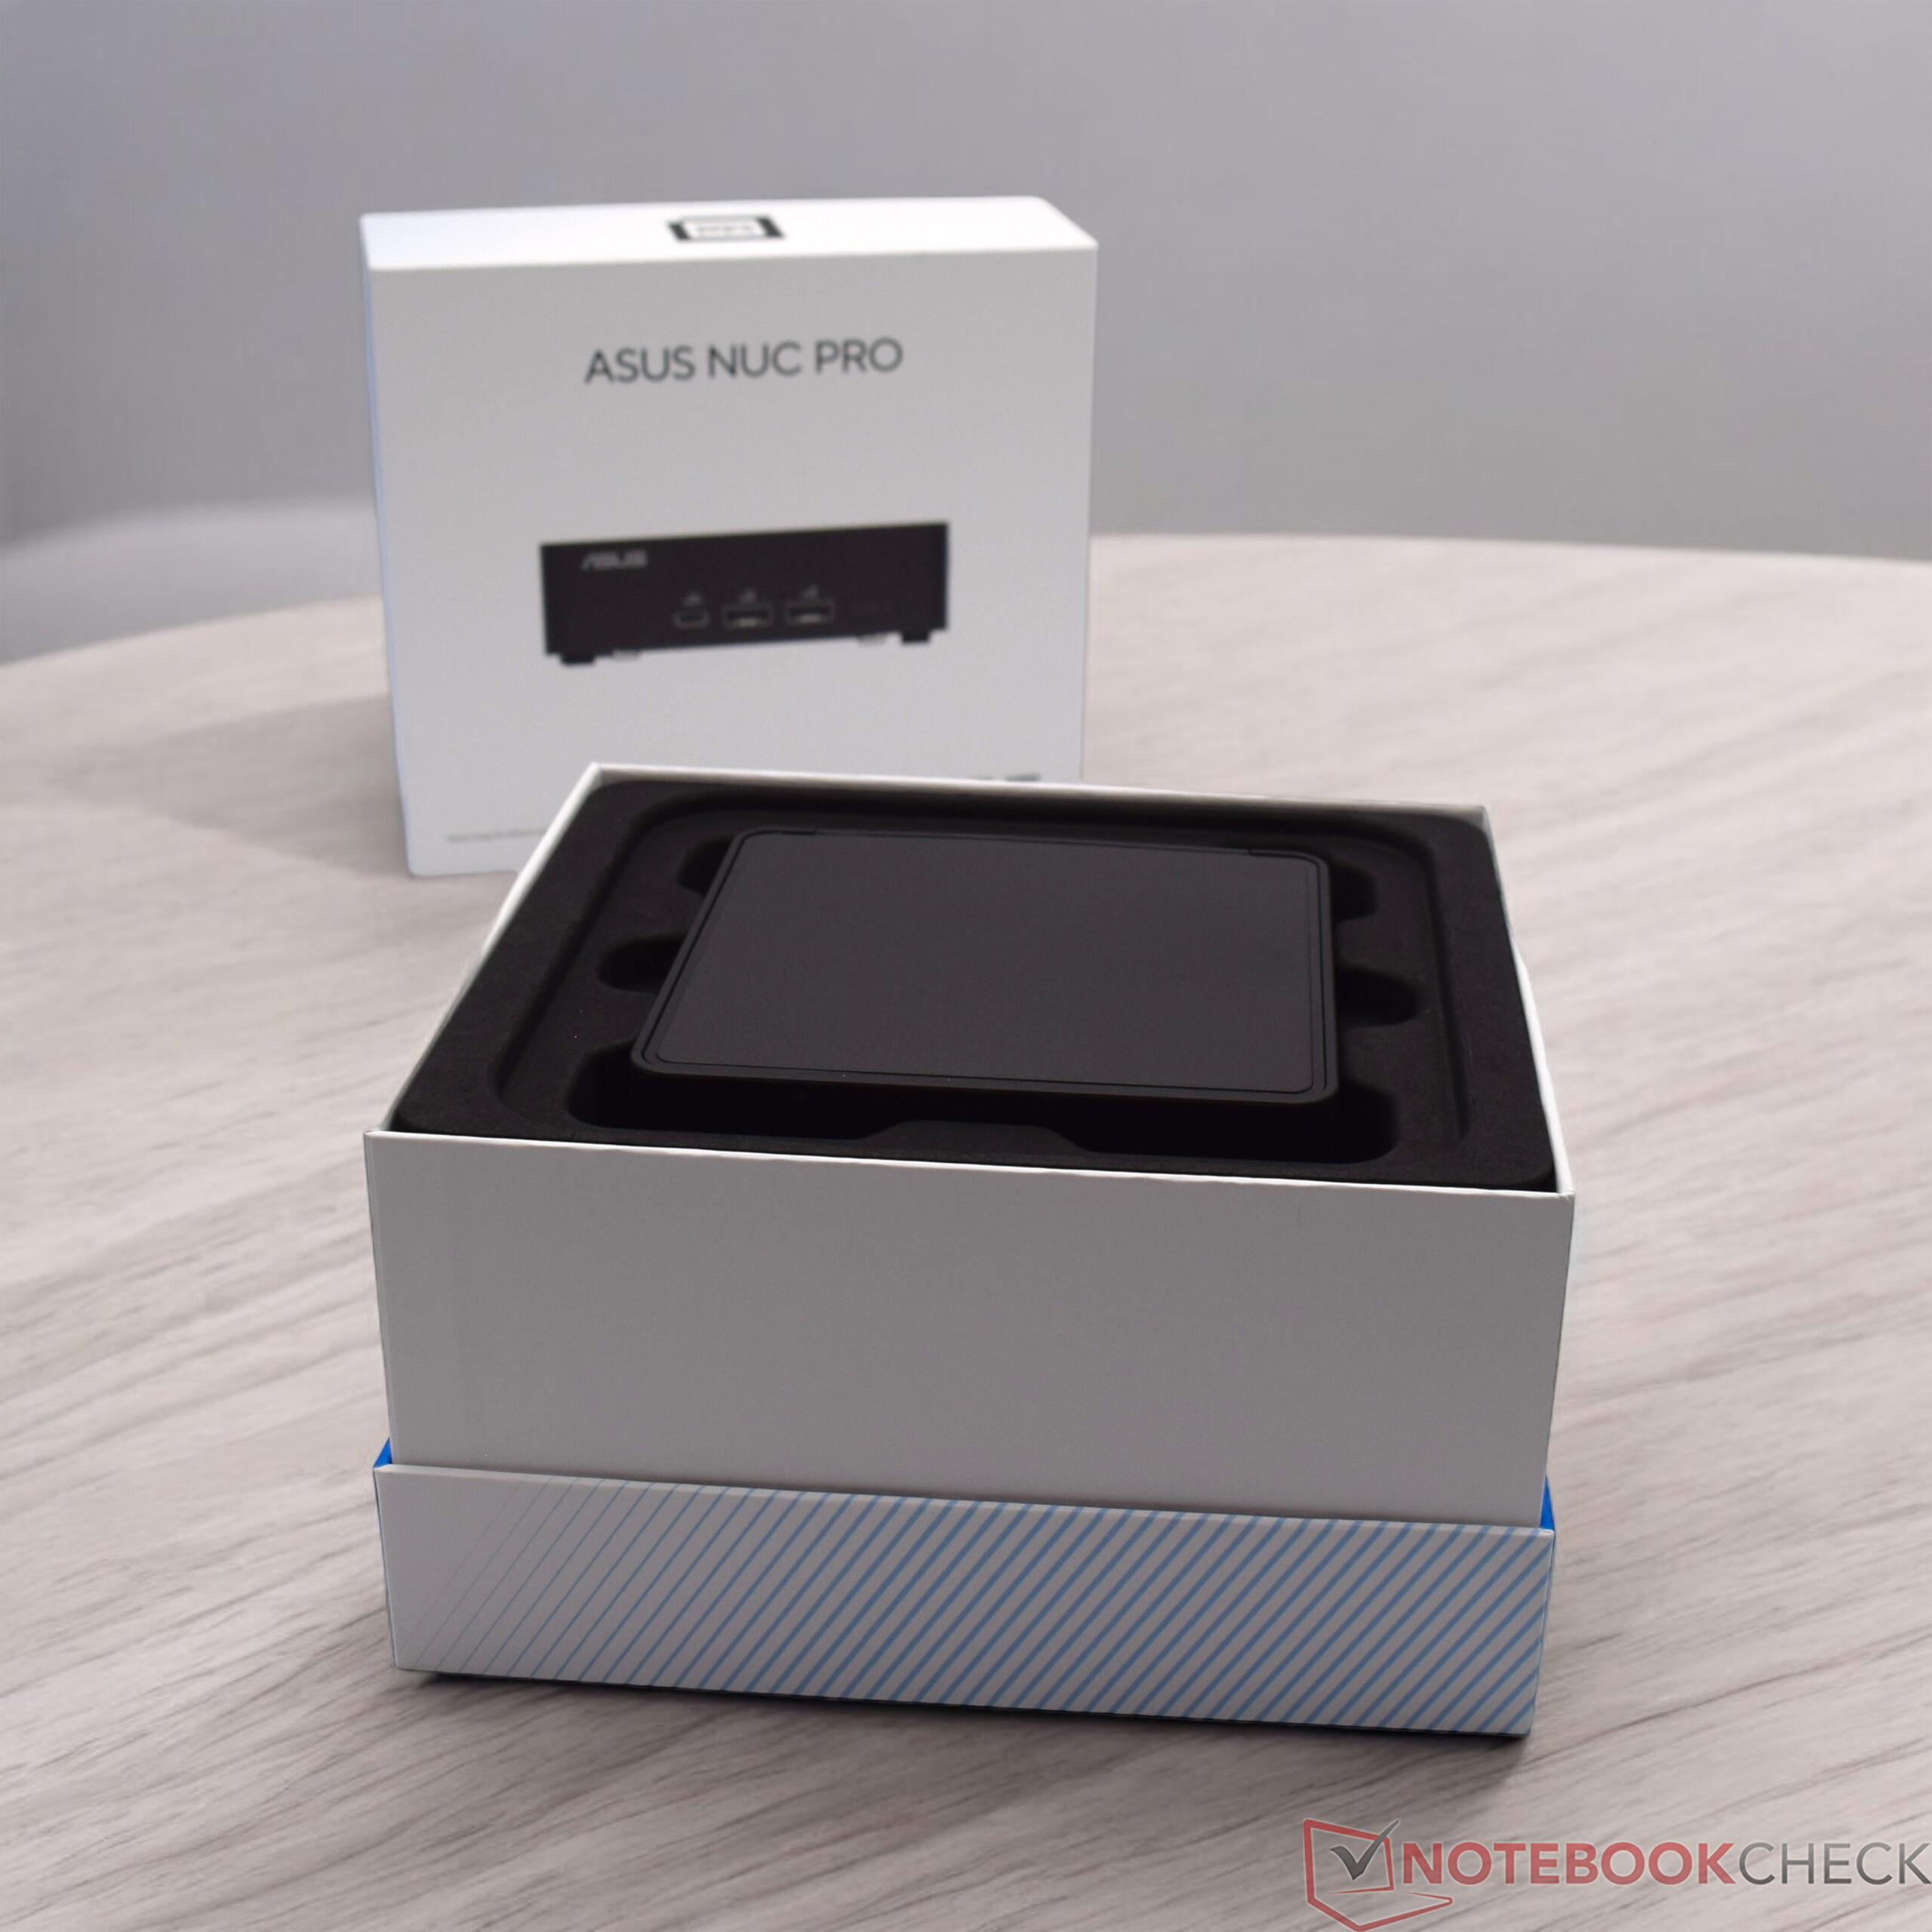
The NUC series (Next Unit of Computing), once launched by Intel, has been taken over by Asus. Asus is now offering the familiar models in the same style, although newer devices are also being introduced. Based on Intel Meteor Lake, the compact computing machines receive more power and, above all, benefit from the revised iGPU with Arc architecture. The Asus NUC 14 Pro is available with different processors and, as usual, in a flat and slightly thicker version, which offers additional space for a 2.5-inch drive. We tested the Asus NUC 14 Pro in the slim option with an Intel Core Ultra 5 125H. The device reached us as a barebone, which meant that we had to install RAM and SSD before testing. The operating system is also not included in the scope of delivery. You have to put a little more than 500 euros on the table for our test sample. Compared to its competitors, this is a lot when you consider that there are additional costs due to the barebone option. Compared to the other brands, Asus is better known and offers better support.
The competitors we pitted the Asus NUC 14 Pro against are listed in the following table.
Possible competitors in comparison
Rating | Version | Date | Model | Weight | Height | Price |
|---|---|---|---|---|---|---|
| 74.7 % | v8 | 08 / 2024 | Asus NUC 14 Pro Ultra 5 125H, Arc 7-Core | 525 g | 37 mm | |
| 78 % | v8 | 07 / 2024 | Geekom AE7 R9 7940HS, Radeon 780M | 578 g | 49.2 mm | |
| 74.5 % | v8 | 07 / 2024 | Minisforum UH125 Pro Ultra 5 125H, Arc 7-Core | 797 g | 49 mm | |
| 73.7 % | v8 | Aoostar GEM10 R7 6800H, Radeon 680M | 525 g | 60 mm | ||
| 83.4 % v7 (old) | v7 (old) | 04 / 2024 | Acemagic F2A Ultra 7 155H, Arc 8-Core | 768 g | 57 mm | |
| 81.2 % v7 (old) | v7 (old) | 10 / 2023 | Geekom A5 R7 5800H, Vega 8 | 555 g | 49.2 mm |
Note: We have updated our rating system and the results of version 8 are not comparable with the results of version 7 available here.
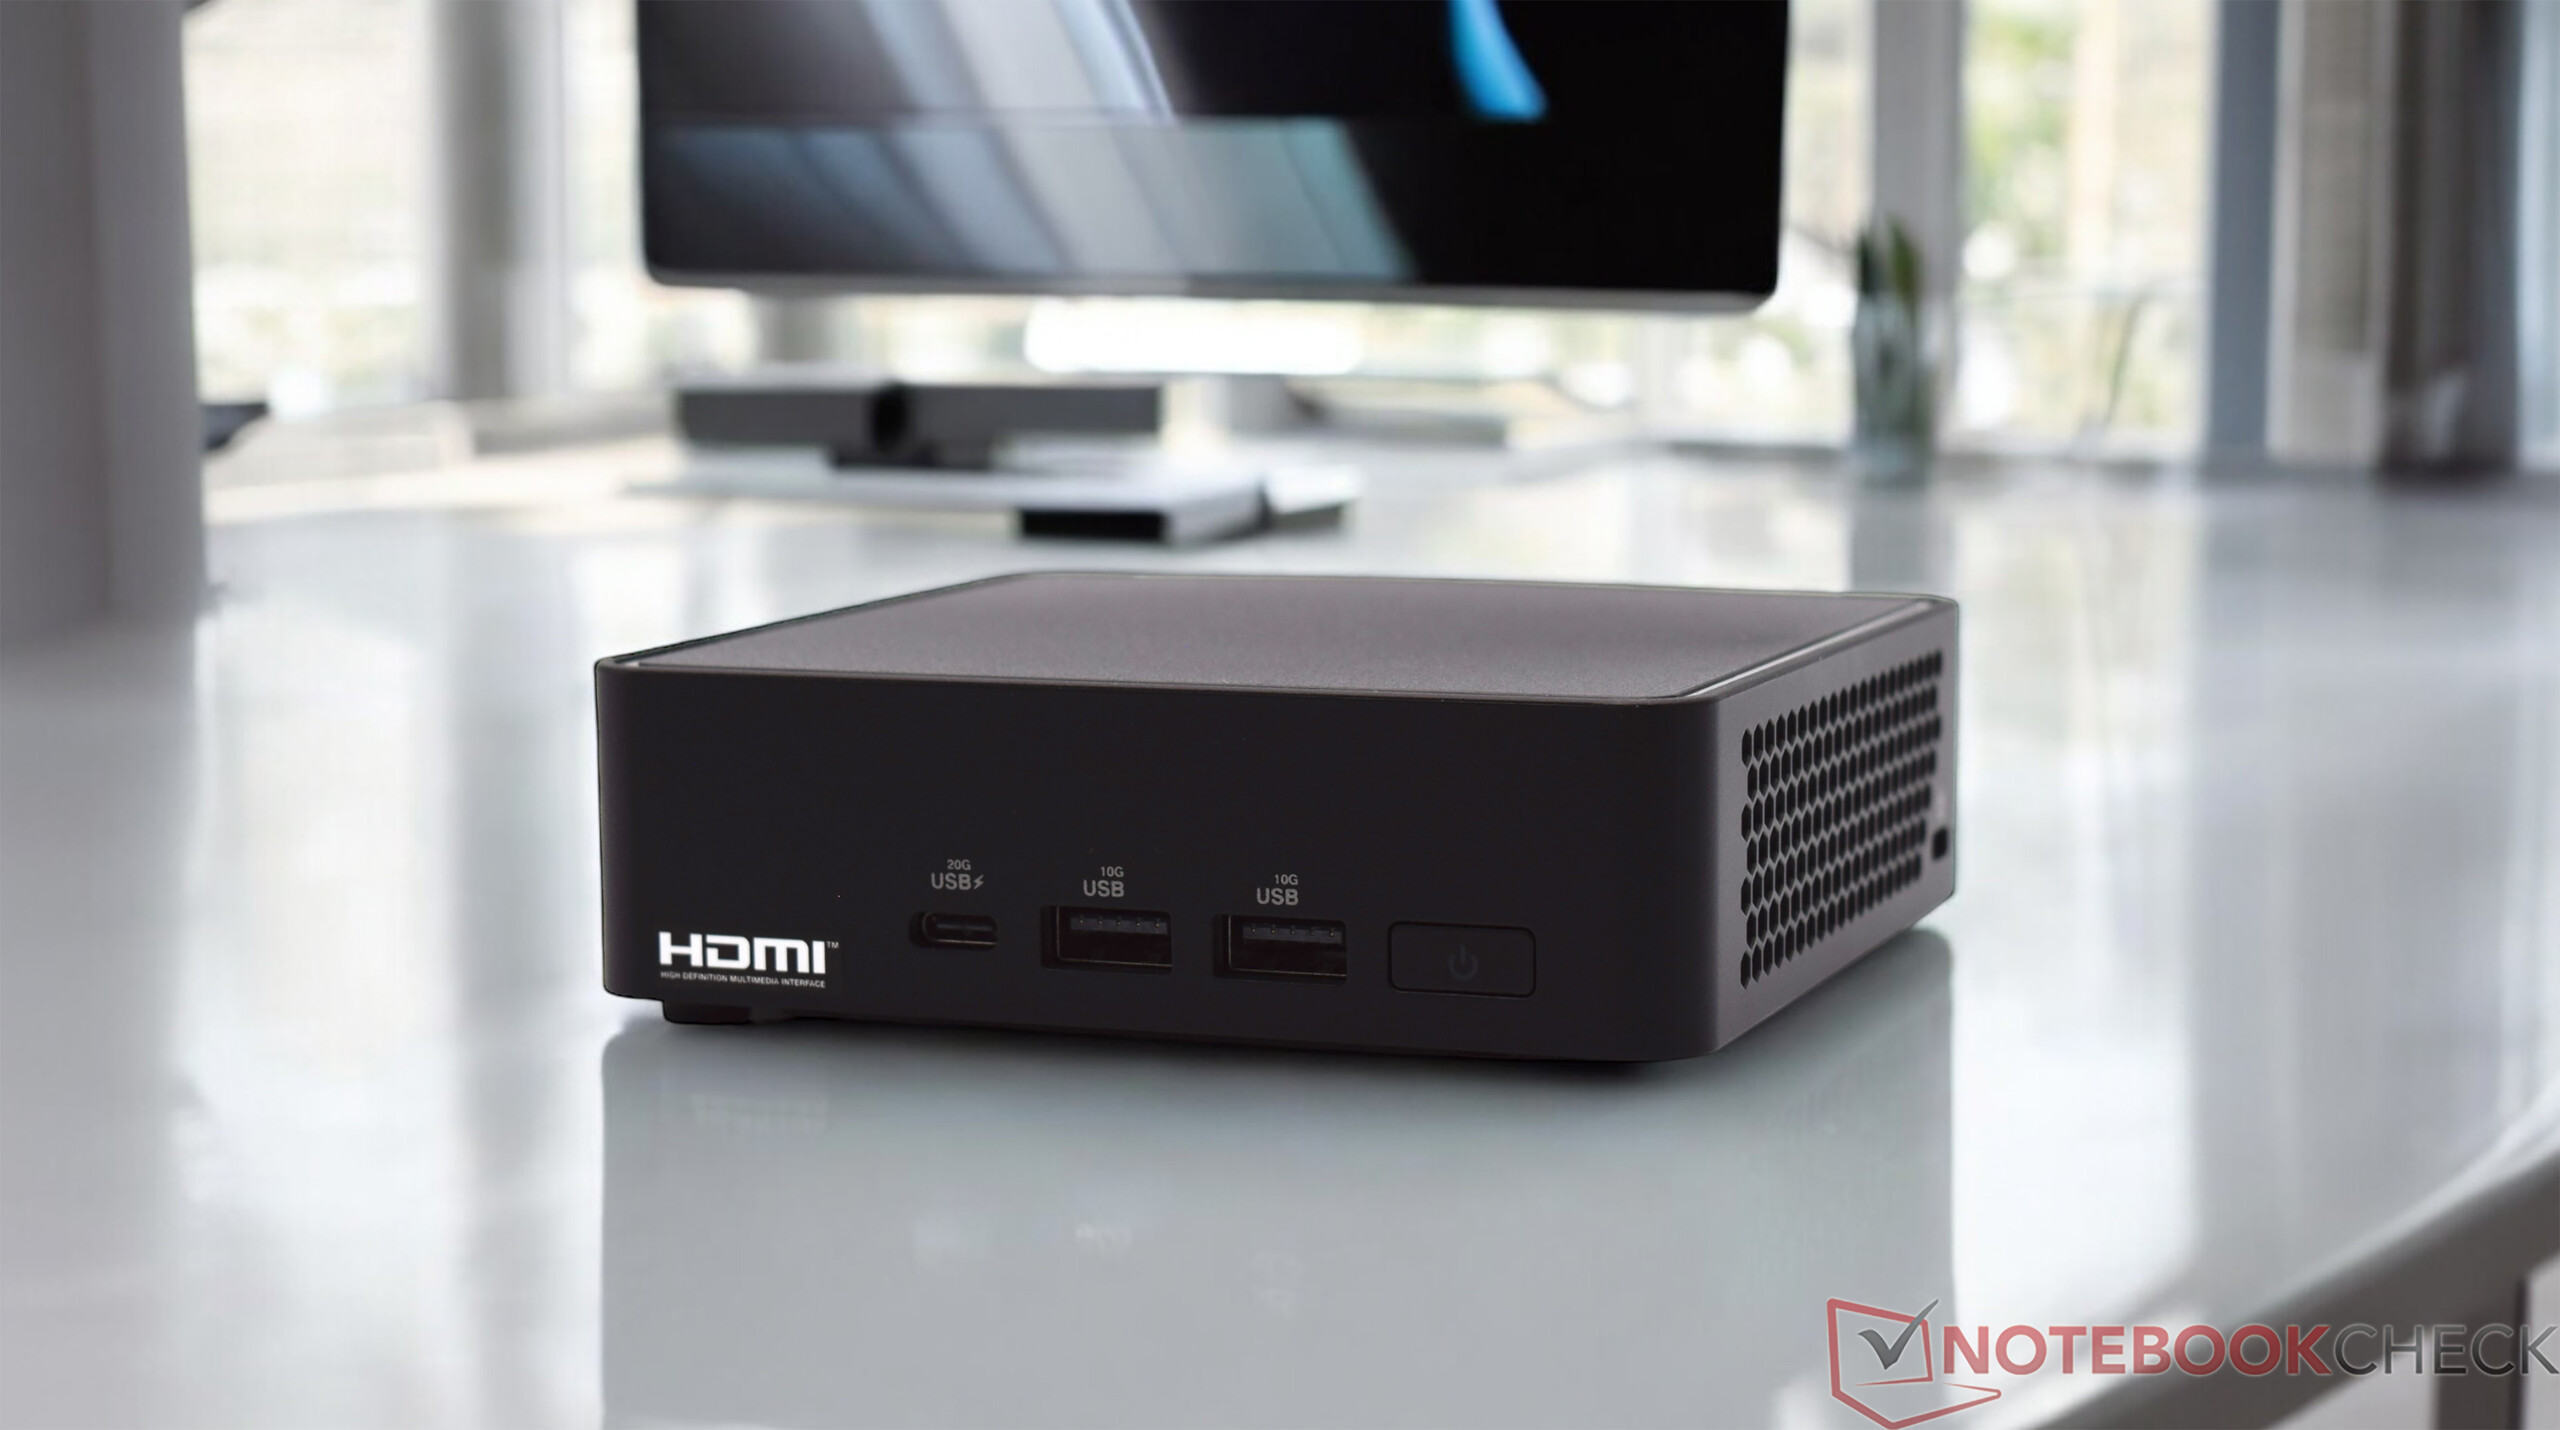


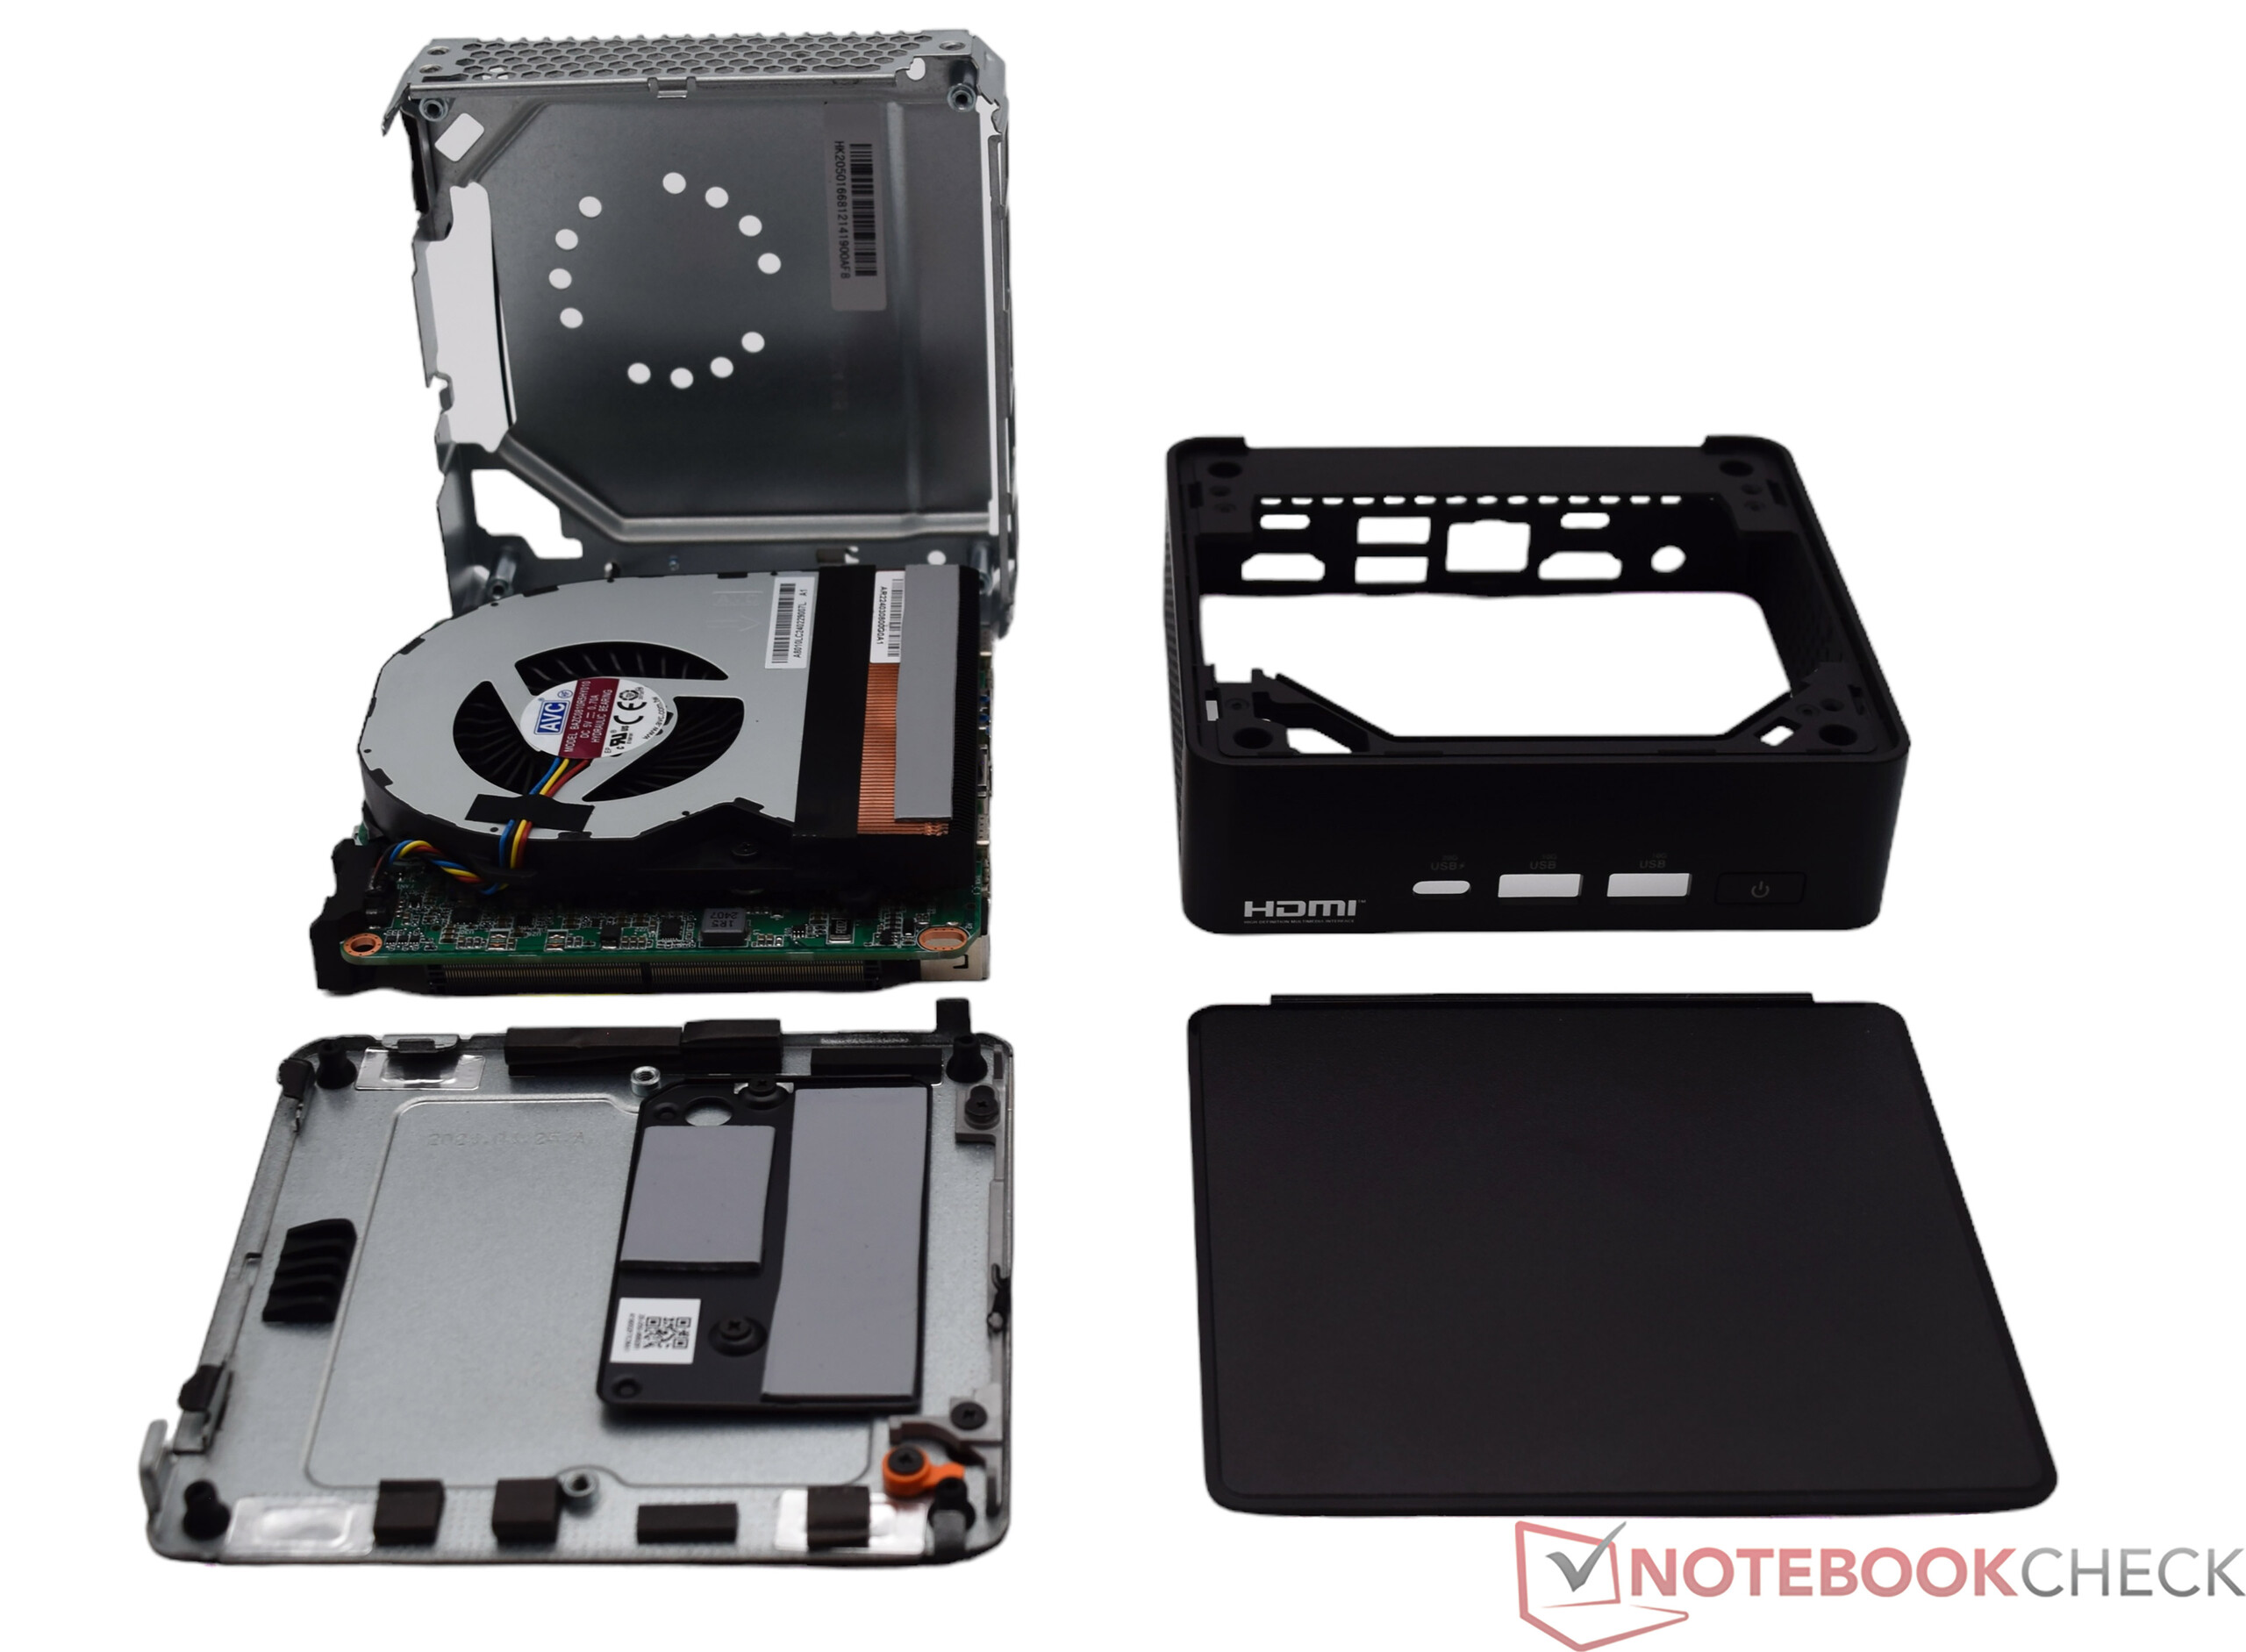
Case - Black plastic casing covers the metal cage
Visually, the Asus NUC 14 Pro is reminiscent of the Intel NUC 12 Pro Kit although the design has been slightly revised. However, the choice of materials is the same. The basic concept is also unchanged, as the black plastic conceals a sturdy metal frame. Haptically, the Asus NUC 14 Pro is inferior to the Mini PCs, which rely on an aluminum housing. As a visual eye-catcher, the Asus device is also not convincing if this is important to you. However, the workmanship offers no cause for criticism. The underside, on the other hand, has been redesigned and includes a mechanical lock to open the device without tools. The slim version, which we tested here, has a very flat design with a height of 37 millimeters. With an almost square footprint of 11.7 x 11.2 centimeters, the device takes up little space on the desk. The VESA bracket supplied also allows it to be mounted on a monitor.
Equipment
The Asus NUC 14 Pro Mini PC offers many interfaces despite its compact design. There are a total of six USB ports, four of which are widely used Type-A sockets, and two others are Type-C sockets. The latter also offer full Thunderbolt support. This sets the Asus NUC 14 Pro apart from other mini PCs, which often only offer simple USB 4 ports or conventional Type-C ports. There are also two HDMI ports and a 2.5G network connection.


Communication

Asus equips the NUC 14 Pro with the Intel Wi-Fi 6E AX211 module, which delivers excellent results in the test. In combination with the ASUS ROG Rapture GT-AXE11000 router, we documented consistently better results than with the comparison devices.
| Networking | |
| iperf3 receive AXE11000 6GHz | |
| Acemagic F2A | |
| Minisforum UH125 Pro | |
| Asus NUC 14 Pro | |
| Average of class Mini PC (729 - 1814, n=56, last 2 years) | |
| Geekom AE7 | |
| Average Intel Wi-Fi 6E AX211 (700 - 1857, n=226) | |
| iperf3 transmit AXE11000 6GHz | |
| Geekom AE7 | |
| Acemagic F2A | |
| Minisforum UH125 Pro | |
| Average of class Mini PC (504 - 1887, n=56, last 2 years) | |
| Asus NUC 14 Pro | |
| Average Intel Wi-Fi 6E AX211 (385 - 1851, n=226) | |
| iperf3 receive AXE11000 | |
| Average Intel Wi-Fi 6E AX211 (582 - 1890, n=276) | |
| Asus NUC 14 Pro | |
| Average of class Mini PC (267 - 1776, n=75, last 2 years) | |
| Geekom A5 | |
| Minisforum UH125 Pro | |
| Acemagic F2A | |
| Geekom AE7 | |
| Aoostar GEM10 | |
| iperf3 transmit AXE11000 | |
| Asus NUC 14 Pro | |
| Average Intel Wi-Fi 6E AX211 (64 - 1921, n=276) | |
| Average of class Mini PC (251 - 1811, n=75, last 2 years) | |
| Geekom A5 | |
| Minisforum UH125 Pro | |
| Acemagic F2A | |
| Geekom AE7 | |
| Aoostar GEM10 | |
Accessories
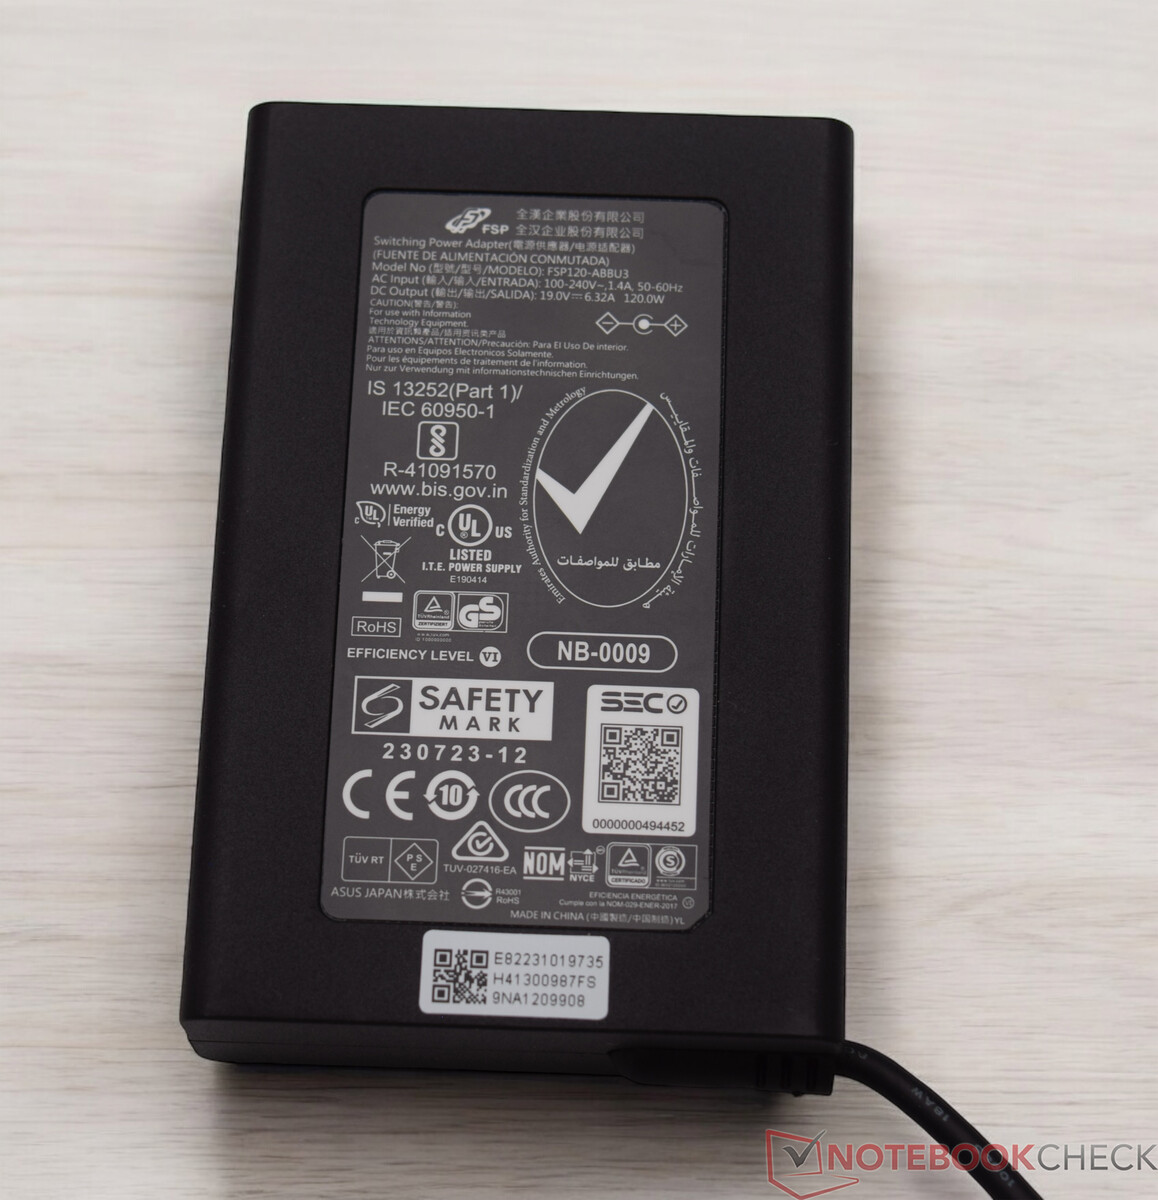
The Asus NUC 14 Pro comes with a 120-watt power supply unit and a VESA mount with mounting material. The manufacturer does not include any other accessories such as a keyboard or mouse.

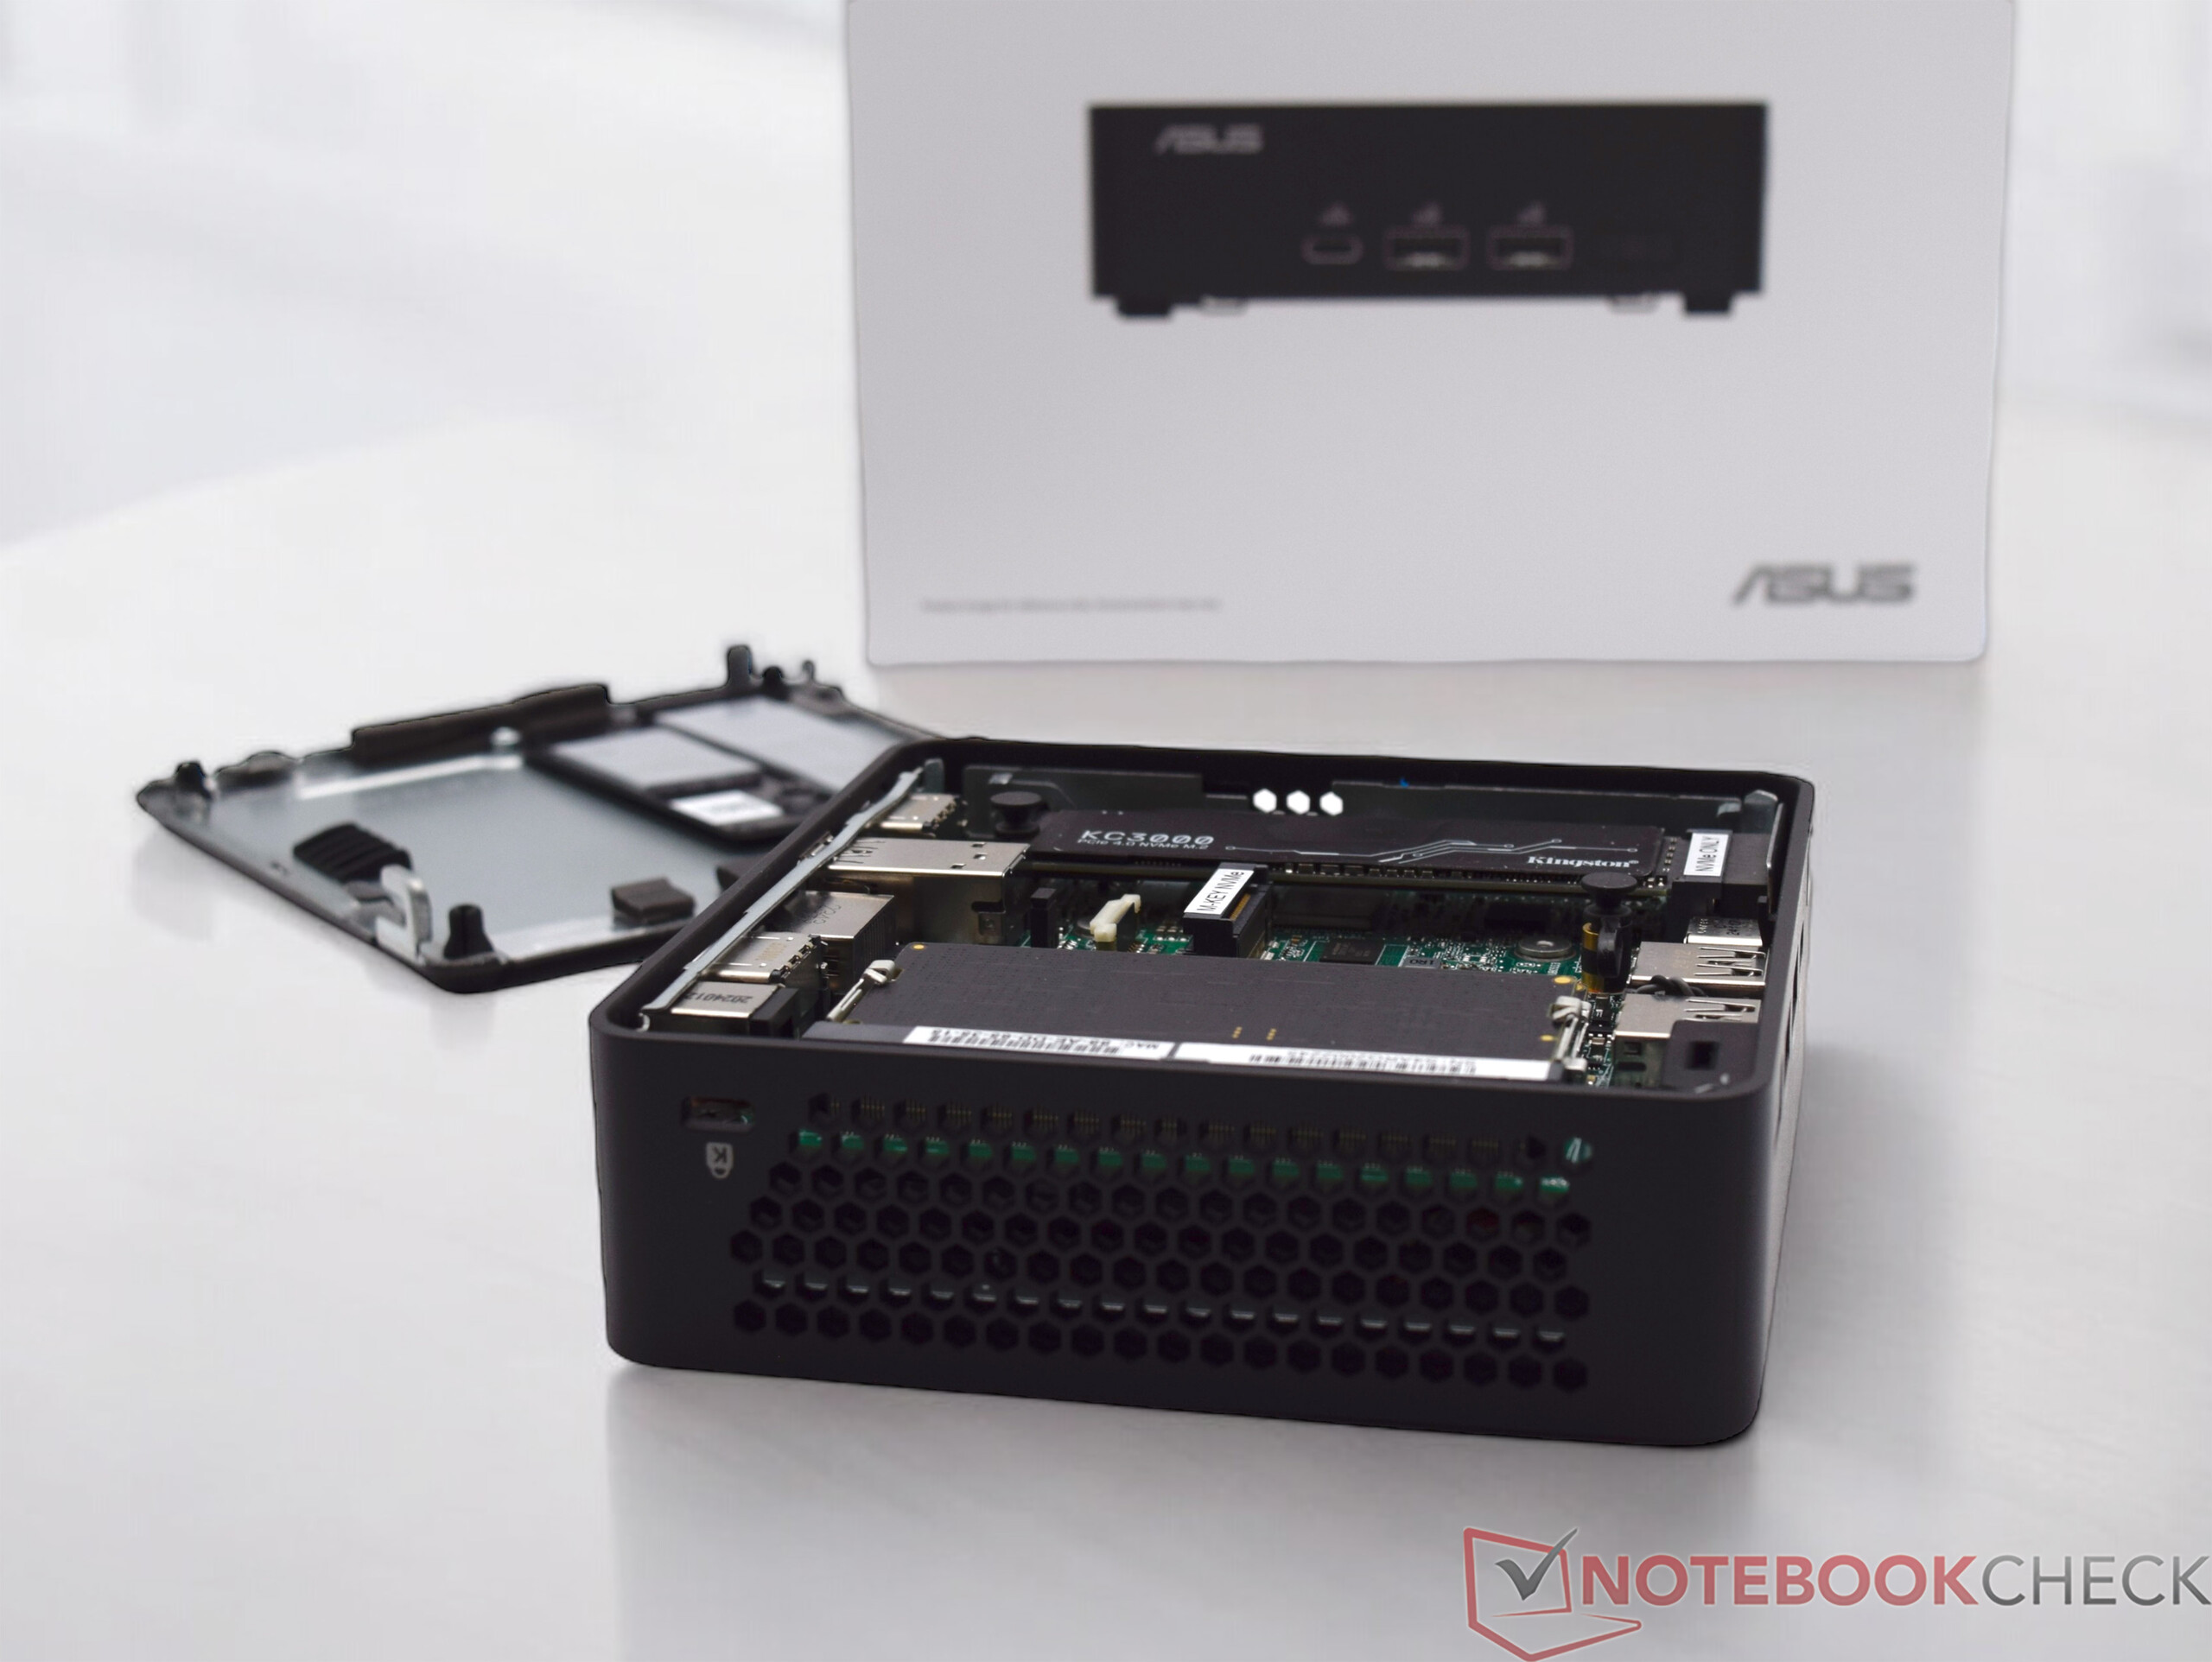
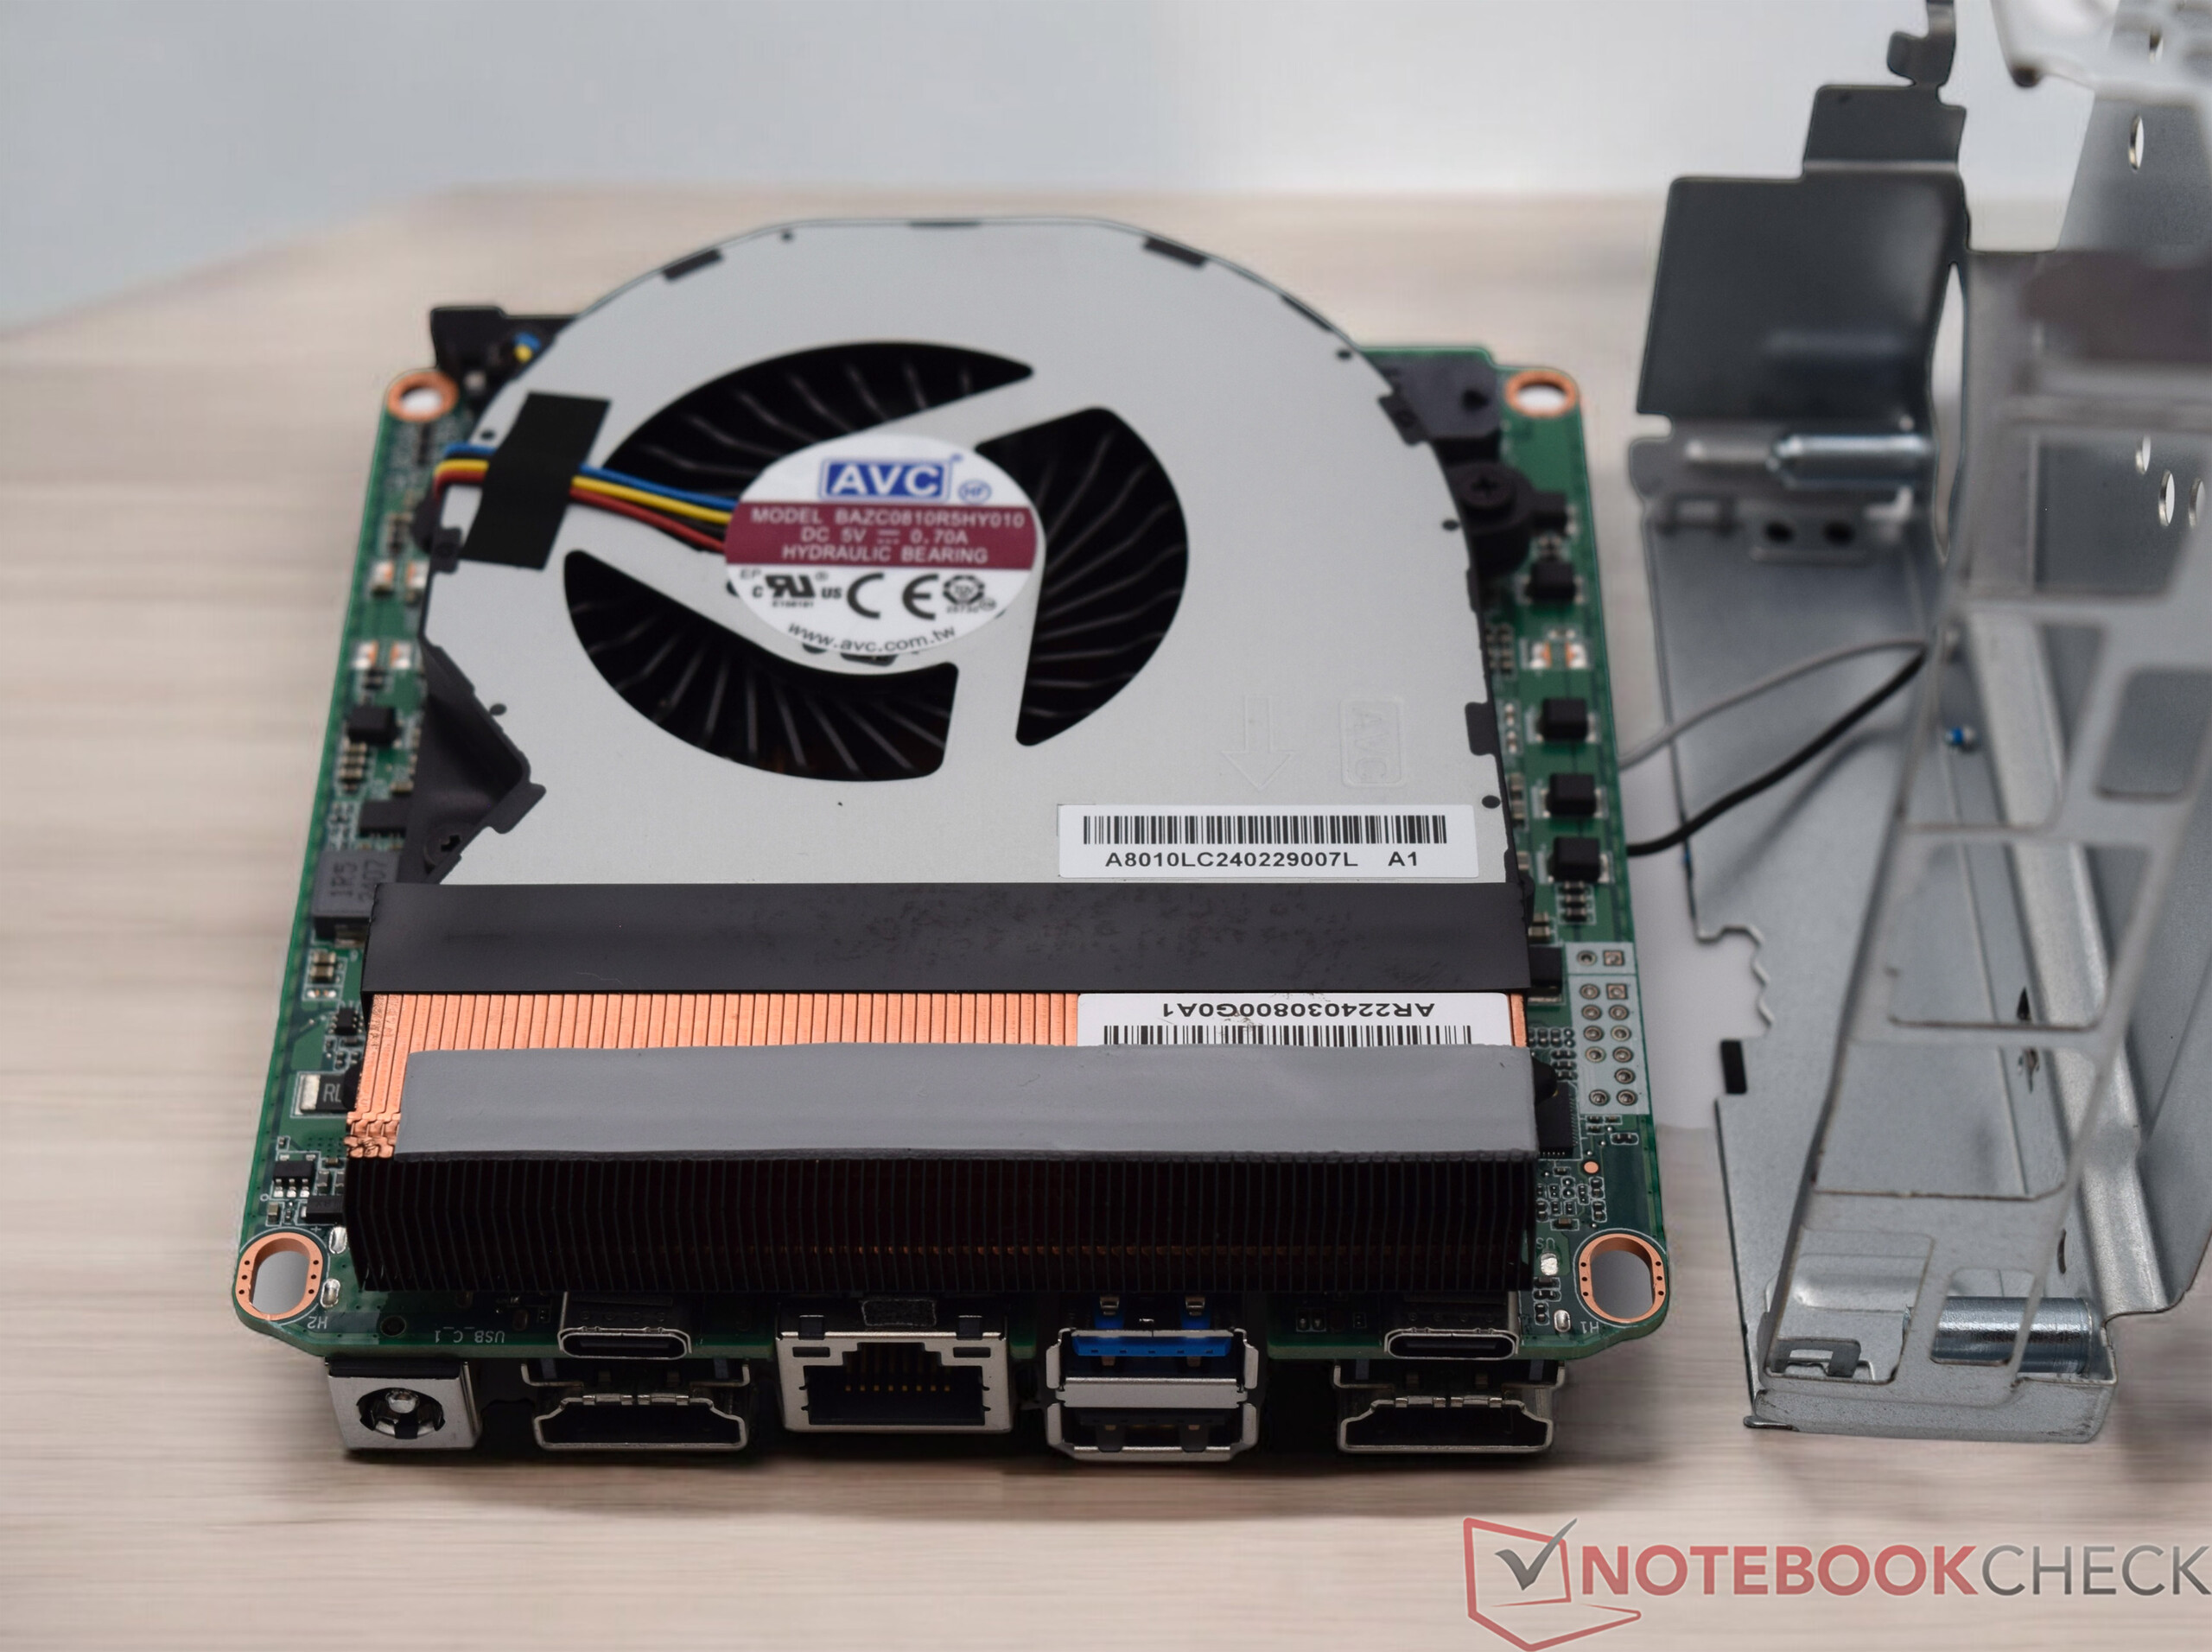
Maintenance
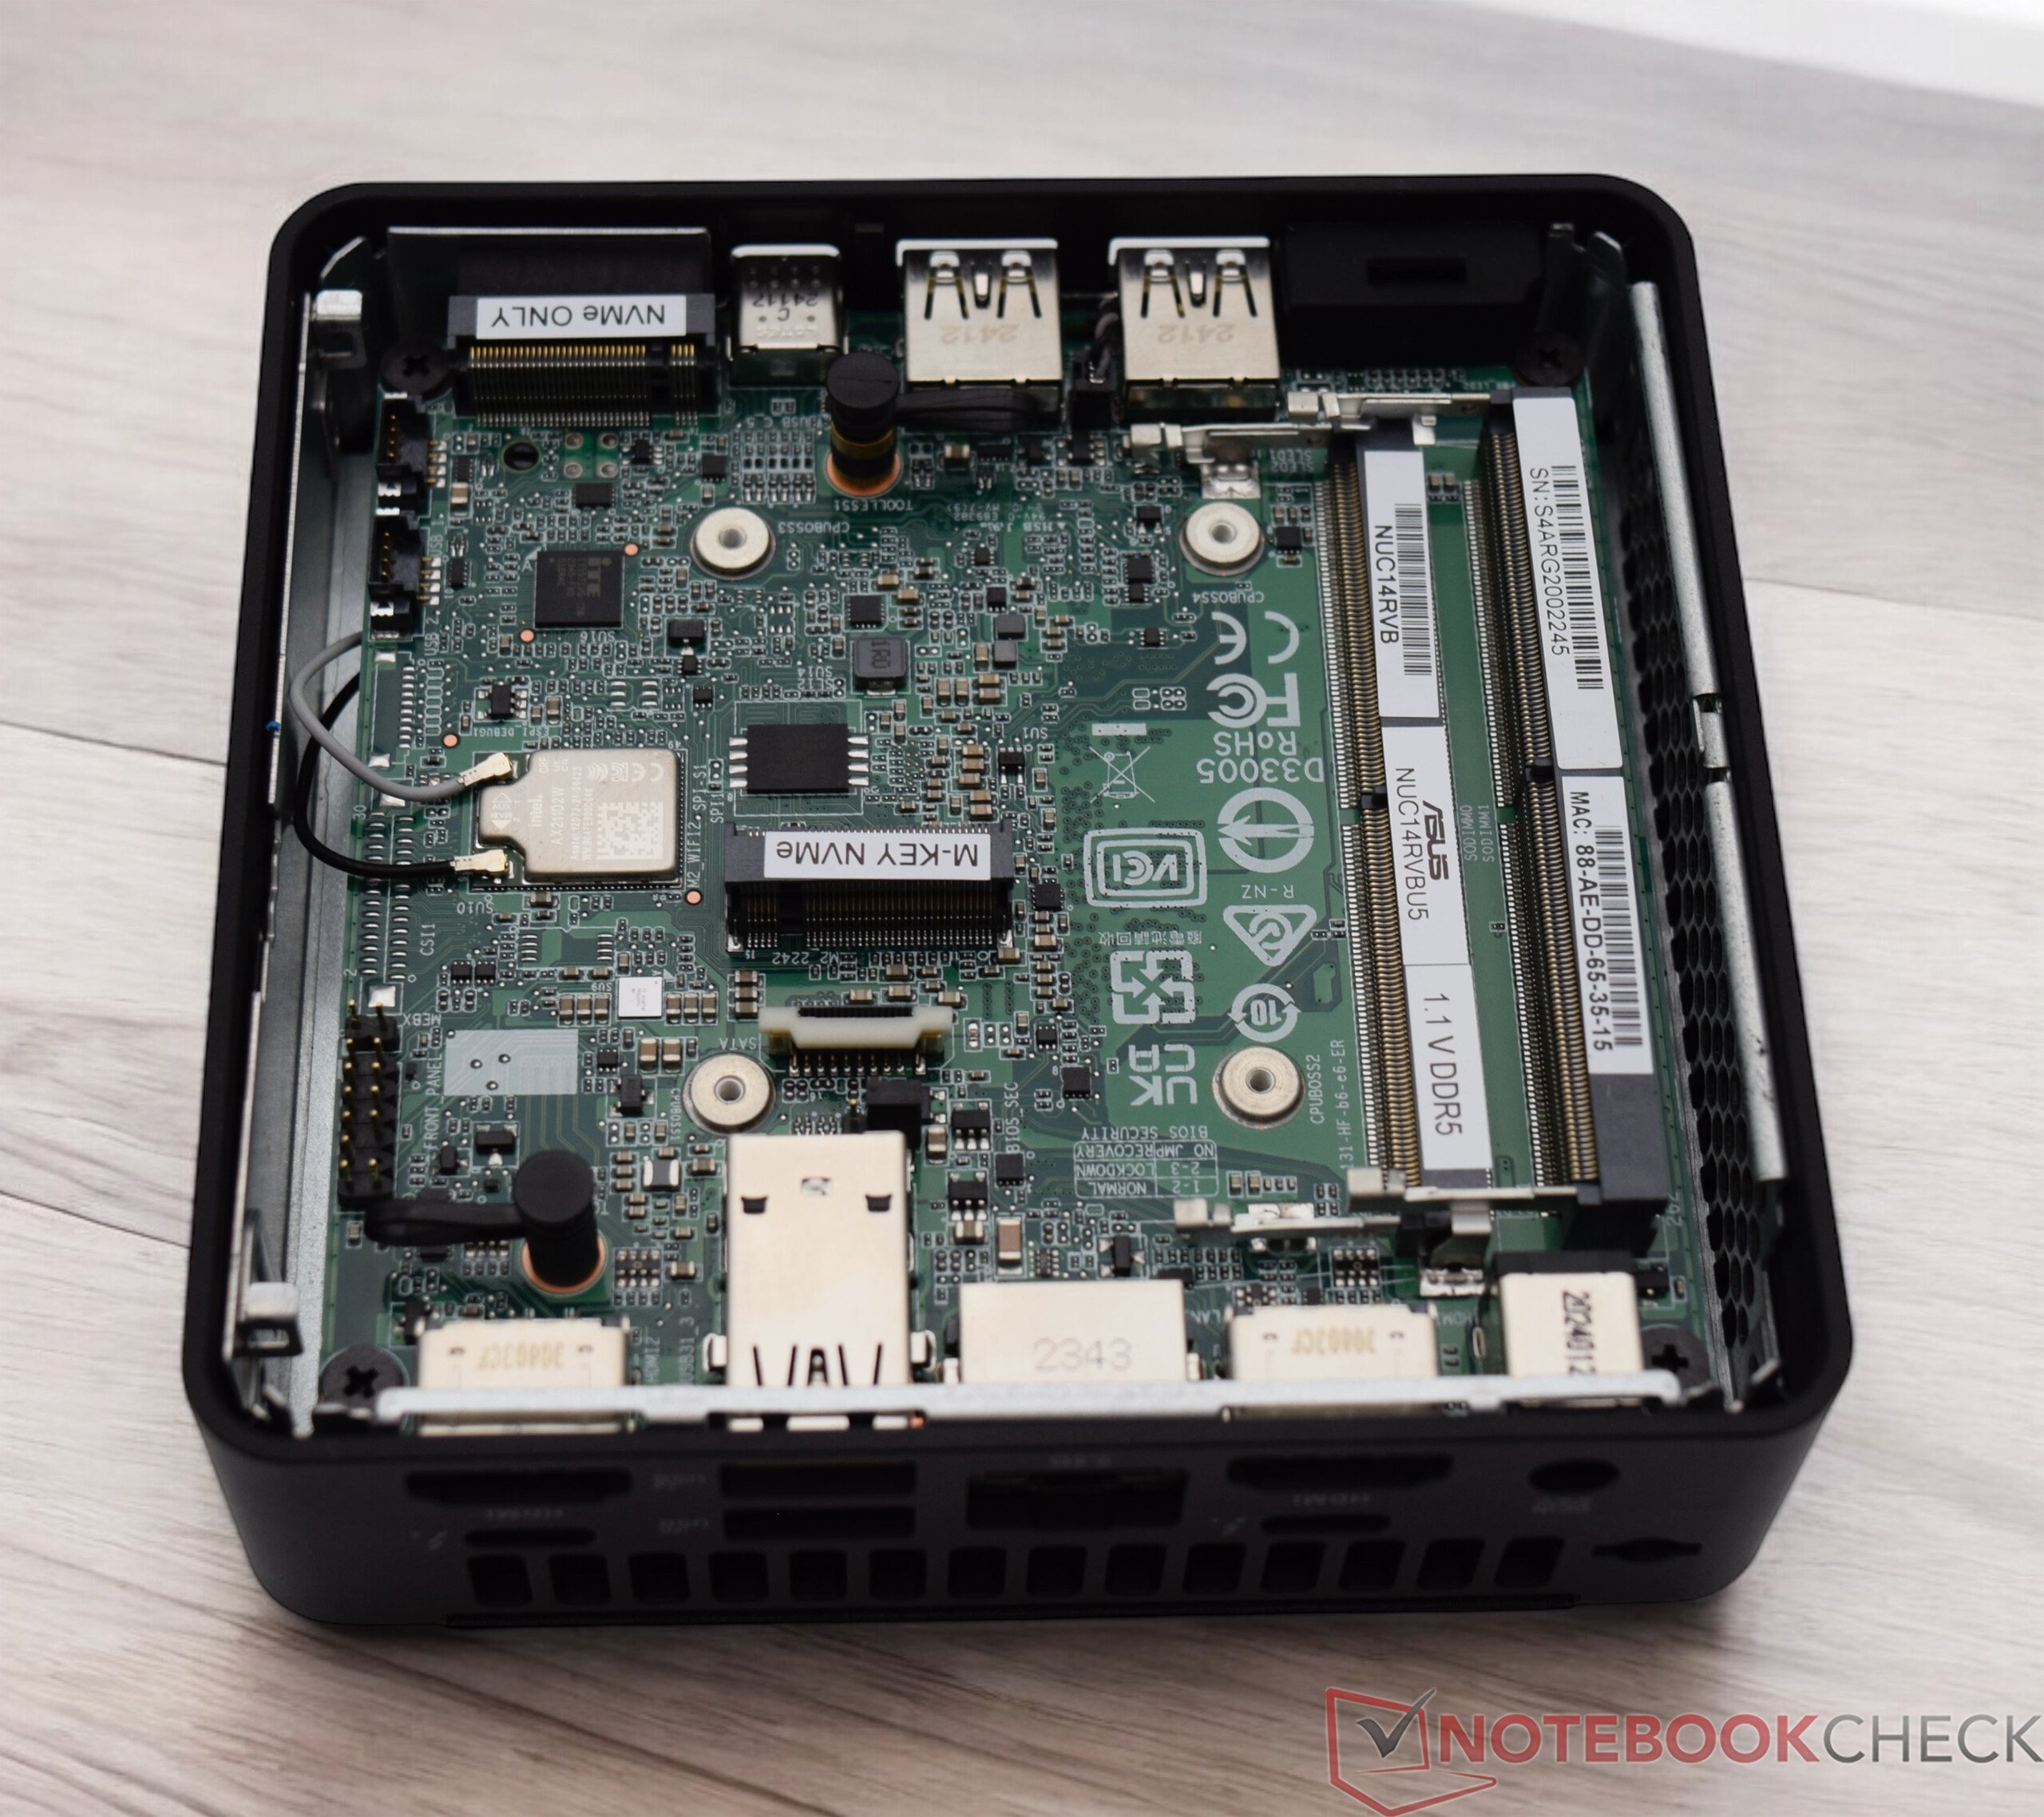
We received the Asus NUC 14 Pro in the barebone version, which means that RAM, SSD, and the operating system are not included in the scope of delivery. As a result, it is important that the user can easily open the device to install the missing components themselves. With the Asus NUC 14 Pro, the base plate can be removed easily and without tools. The manufacturer has integrated a small mechanical latch that makes this possible: RAM and SSD can be installed quickly and then the mini PC is ready for the first start. Two SSDs can be installed in the device and two SO-DIMM slots are provided for the RAM. For optimum operation, both SO-DIMM slots should be occupied.


Sustainability
The Asus NUC 14 Pro is a very compact mini PC, which has significant advantages in terms of energy consumption compared to a conventional desktop PC. The device is delivered in a small box, which is not excessively large. The mini PC itself is mainly made of metal and plastic. We do not know whether specially recycled materials are used in the production process. Asus receives praise for the warranty period of three years.
Performance
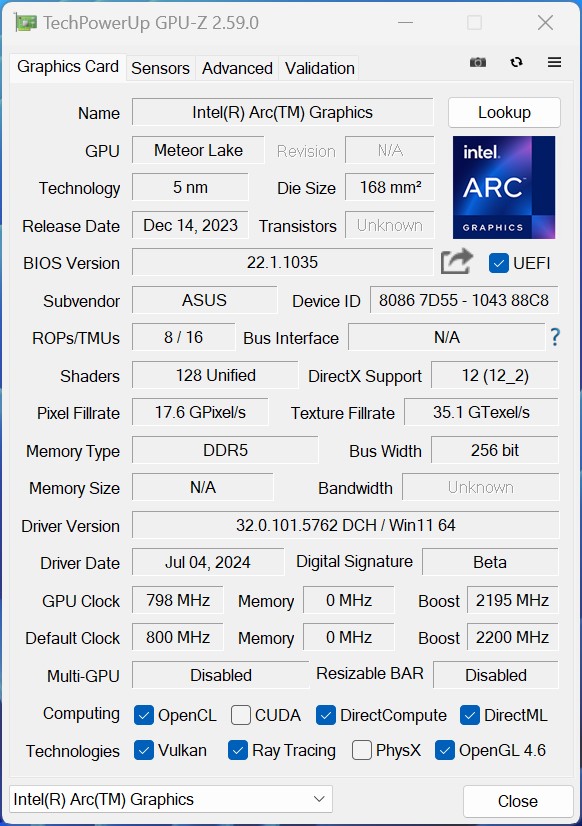
The Intel Core Ultra 5 125H is a solid yet powerful mid-range SoC from Intel's Meteor Lake series. The large number of physical computing cores that the SoC brings with it ultimately ensure good multi-thread performance. The Meteor Lake SoC also has a revised iGPU, which offers noticeably more performance than the outdated Intel Iris Xe iGPUs of the predecessor series based on the Arc architecture. The Asus NUC 14 Pro is also available with a slightly weaker Intel Core 3 100U as well as a slightly more powerful variant with Intel Core Ultra 7 SoC.


Test conditions
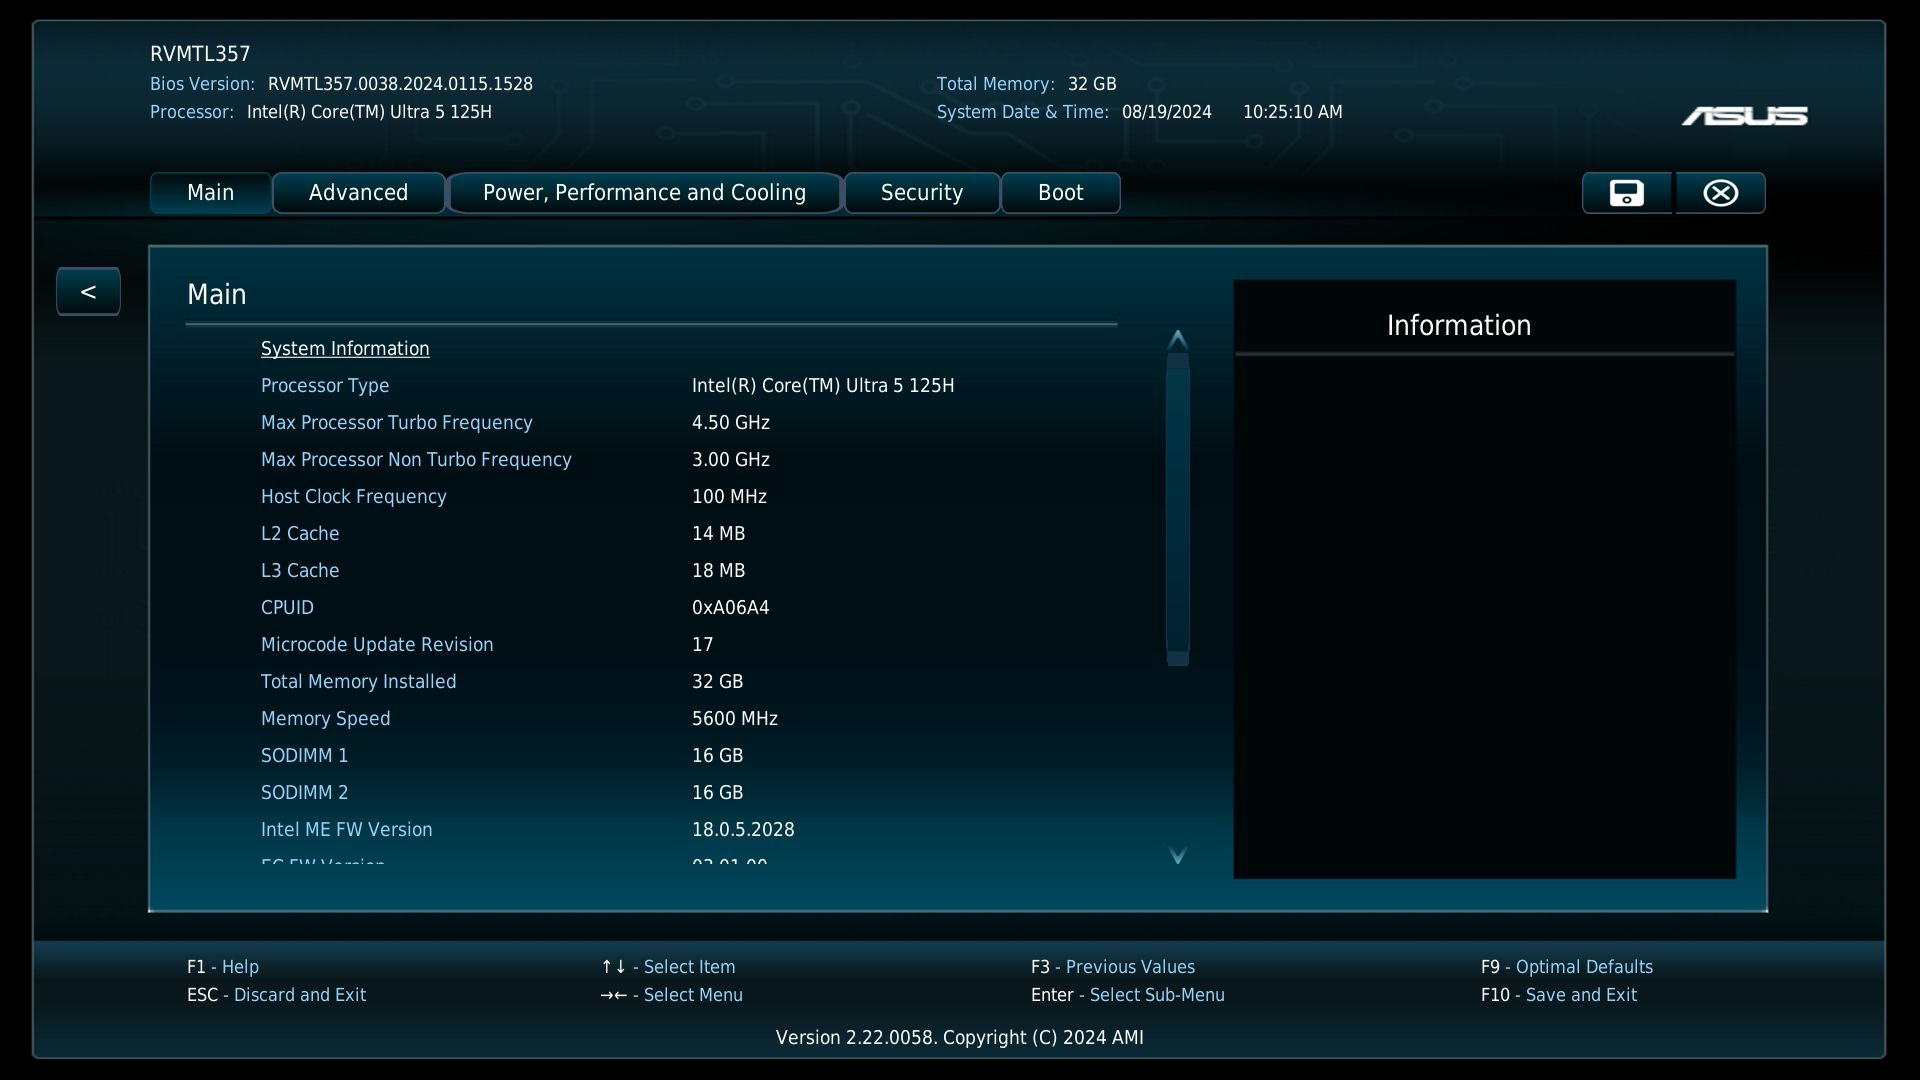
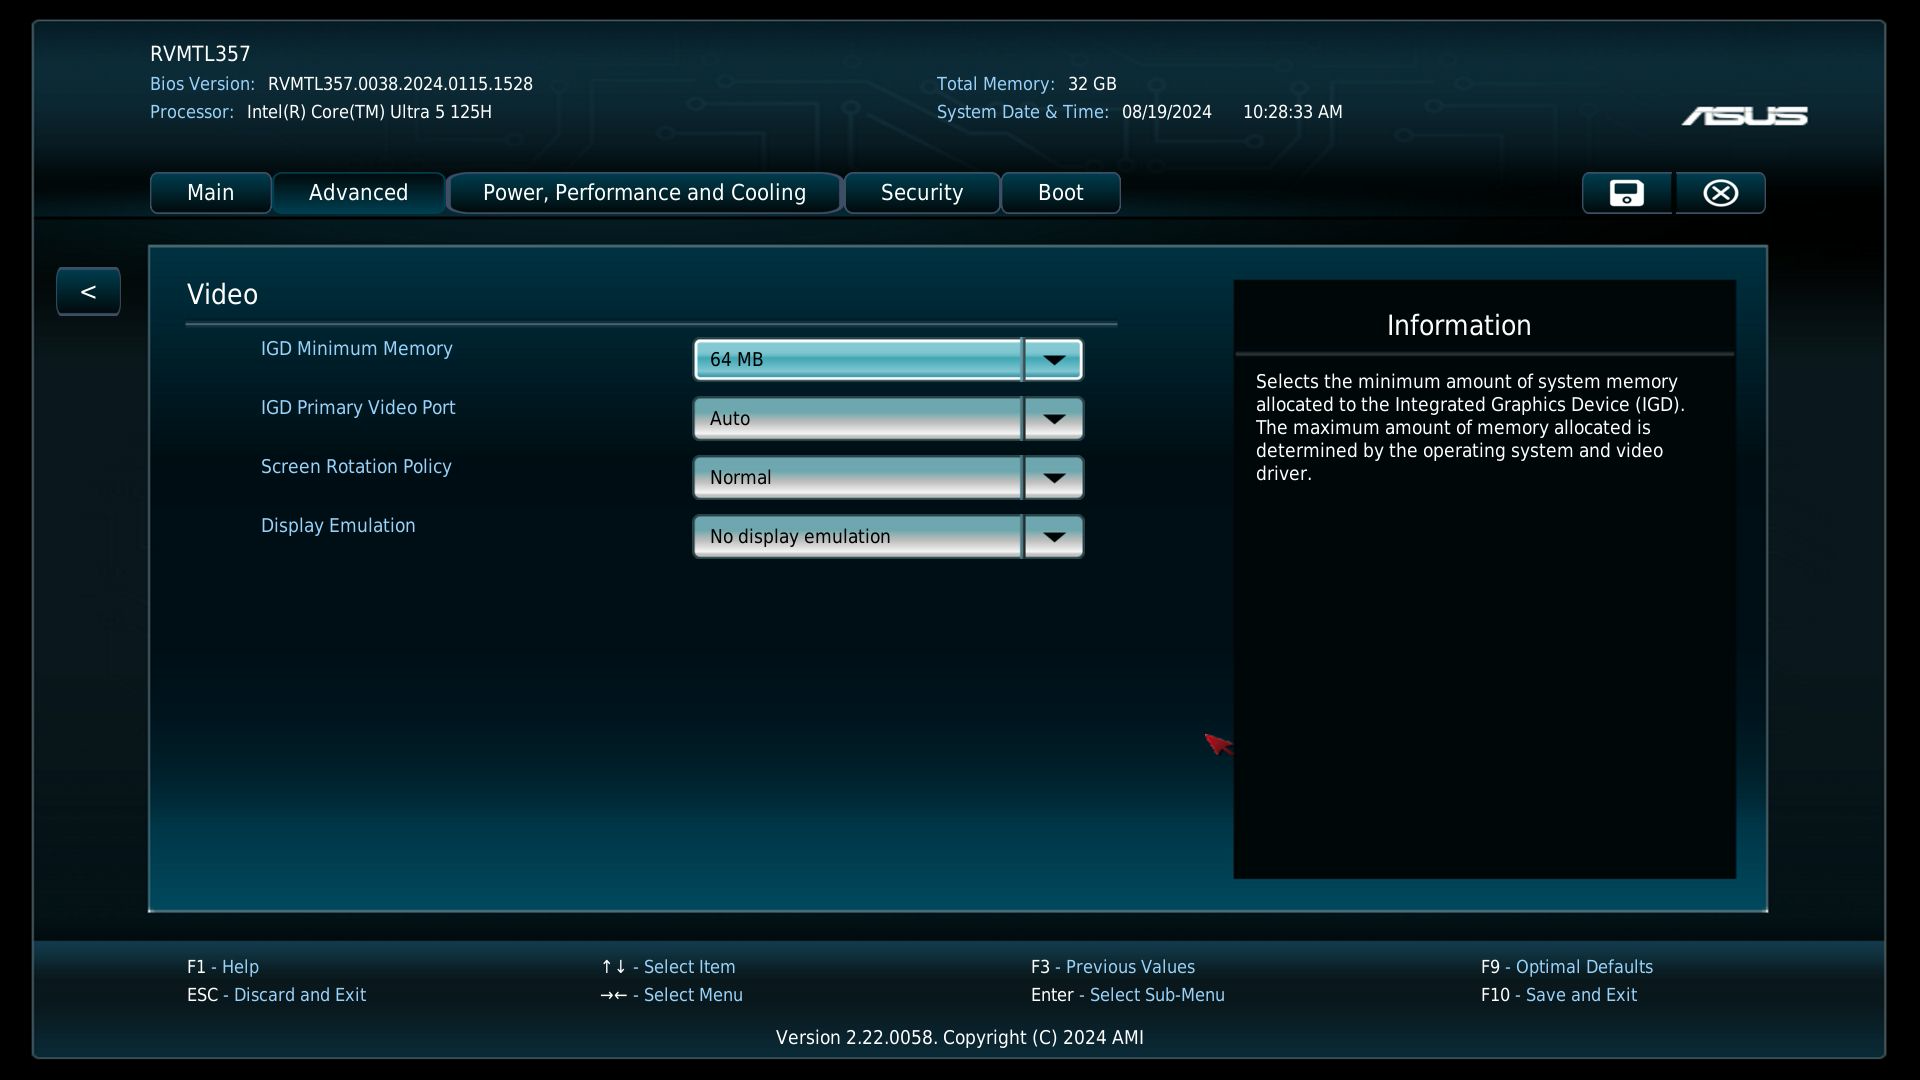
We carried out all performance tests with the Balanced
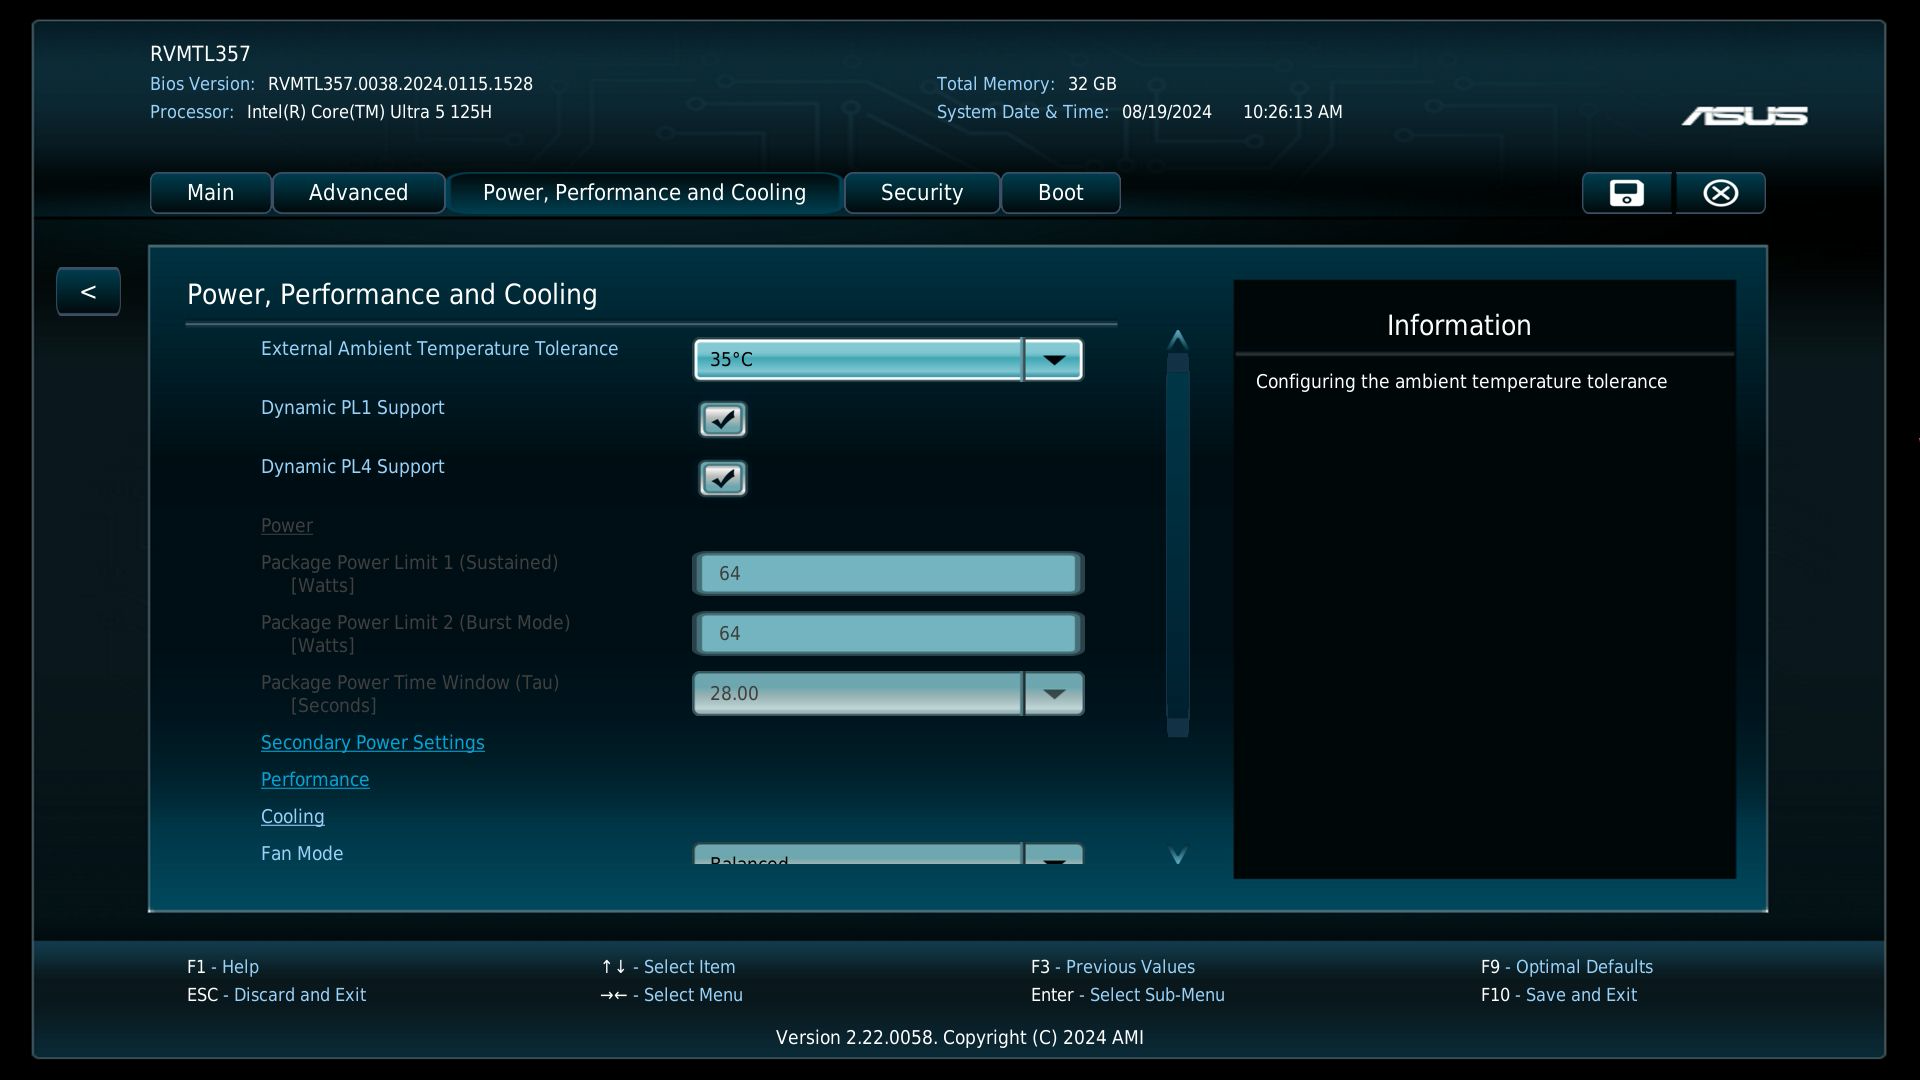
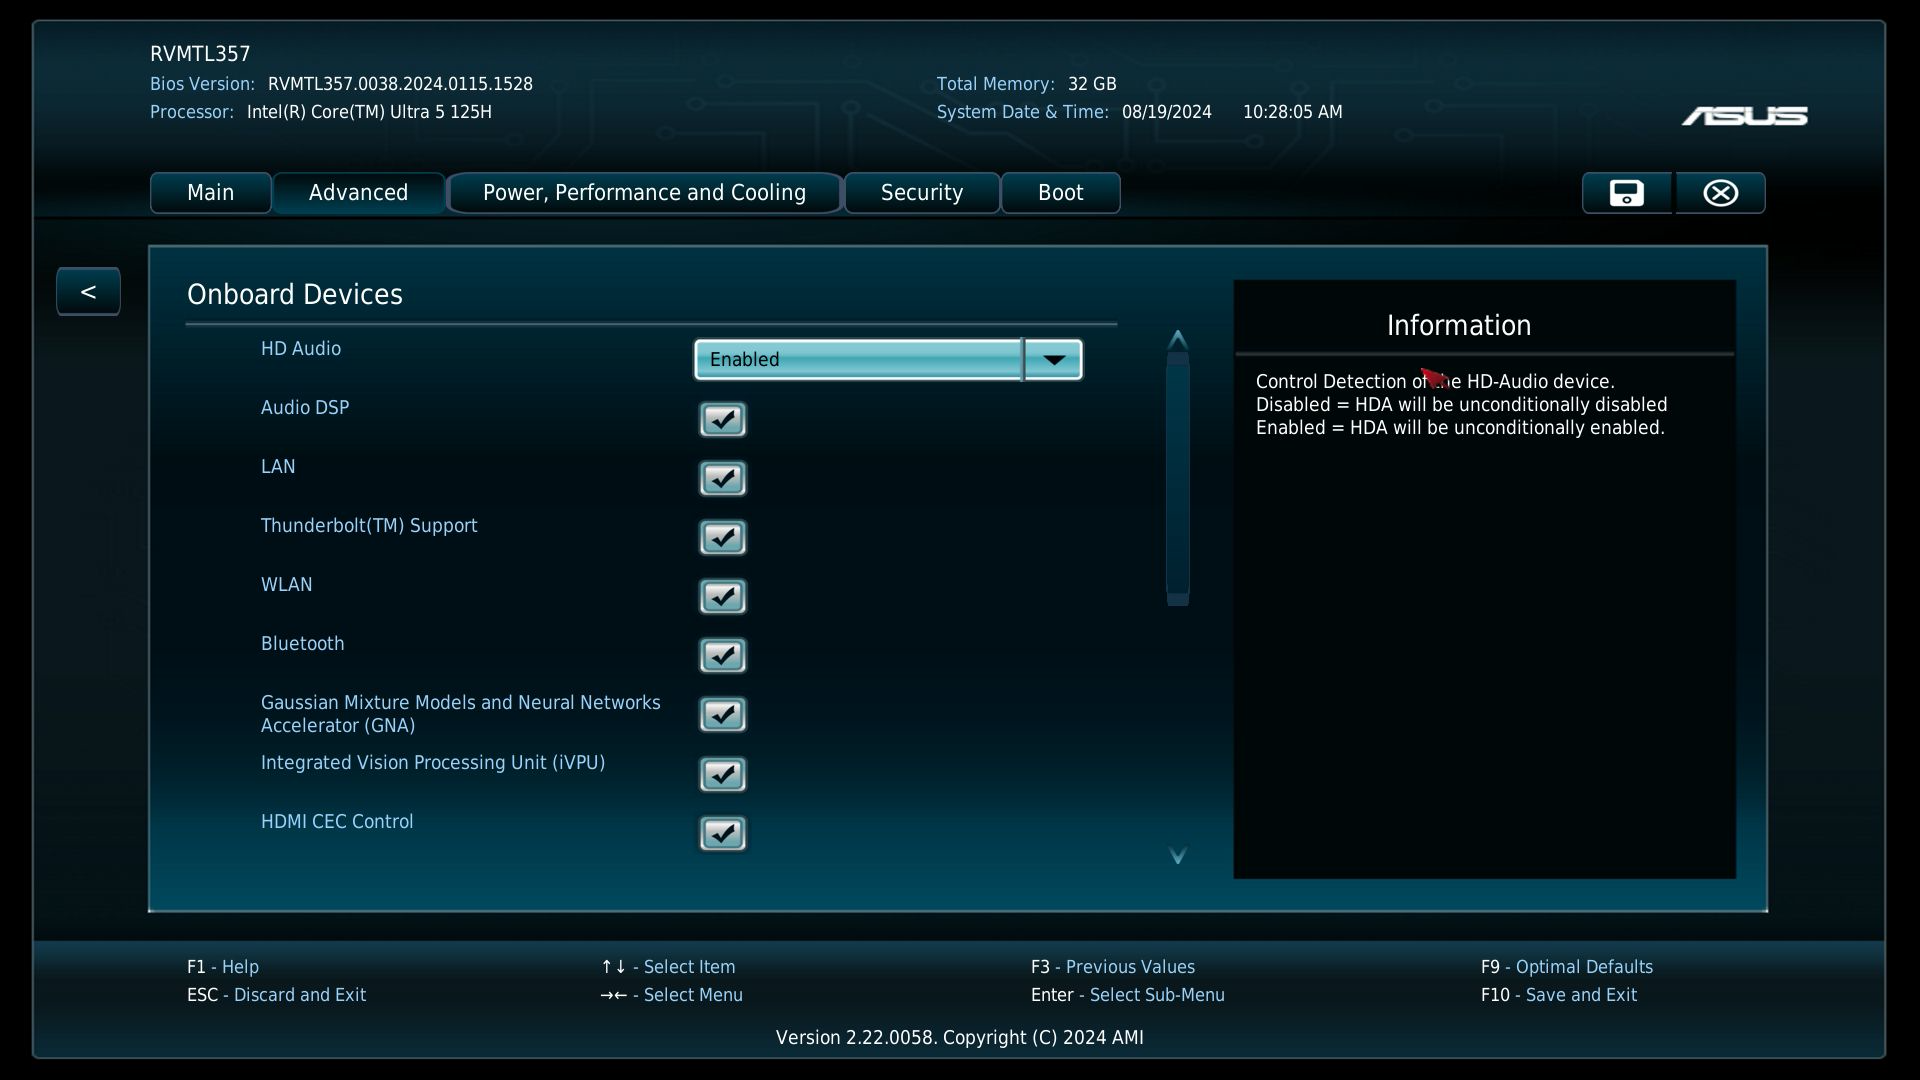
energy profile. We did not change the performance of the SoC and left it in its default state according to the BIOS settings (Balanced). The BIOS settings are very extensive. Compared to the Mini-PCs from Geekom, Minisforum, or Acemagic, Asus is clearly ahead here. In addition to the CPU power consumption, individual USB ports can even be deactivated.


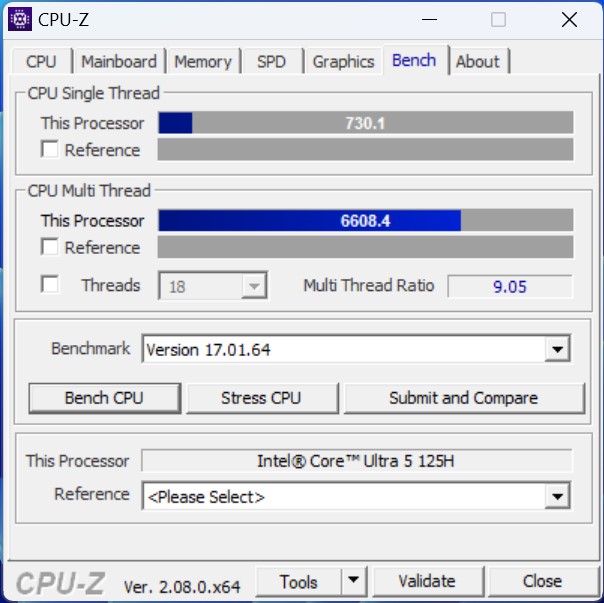
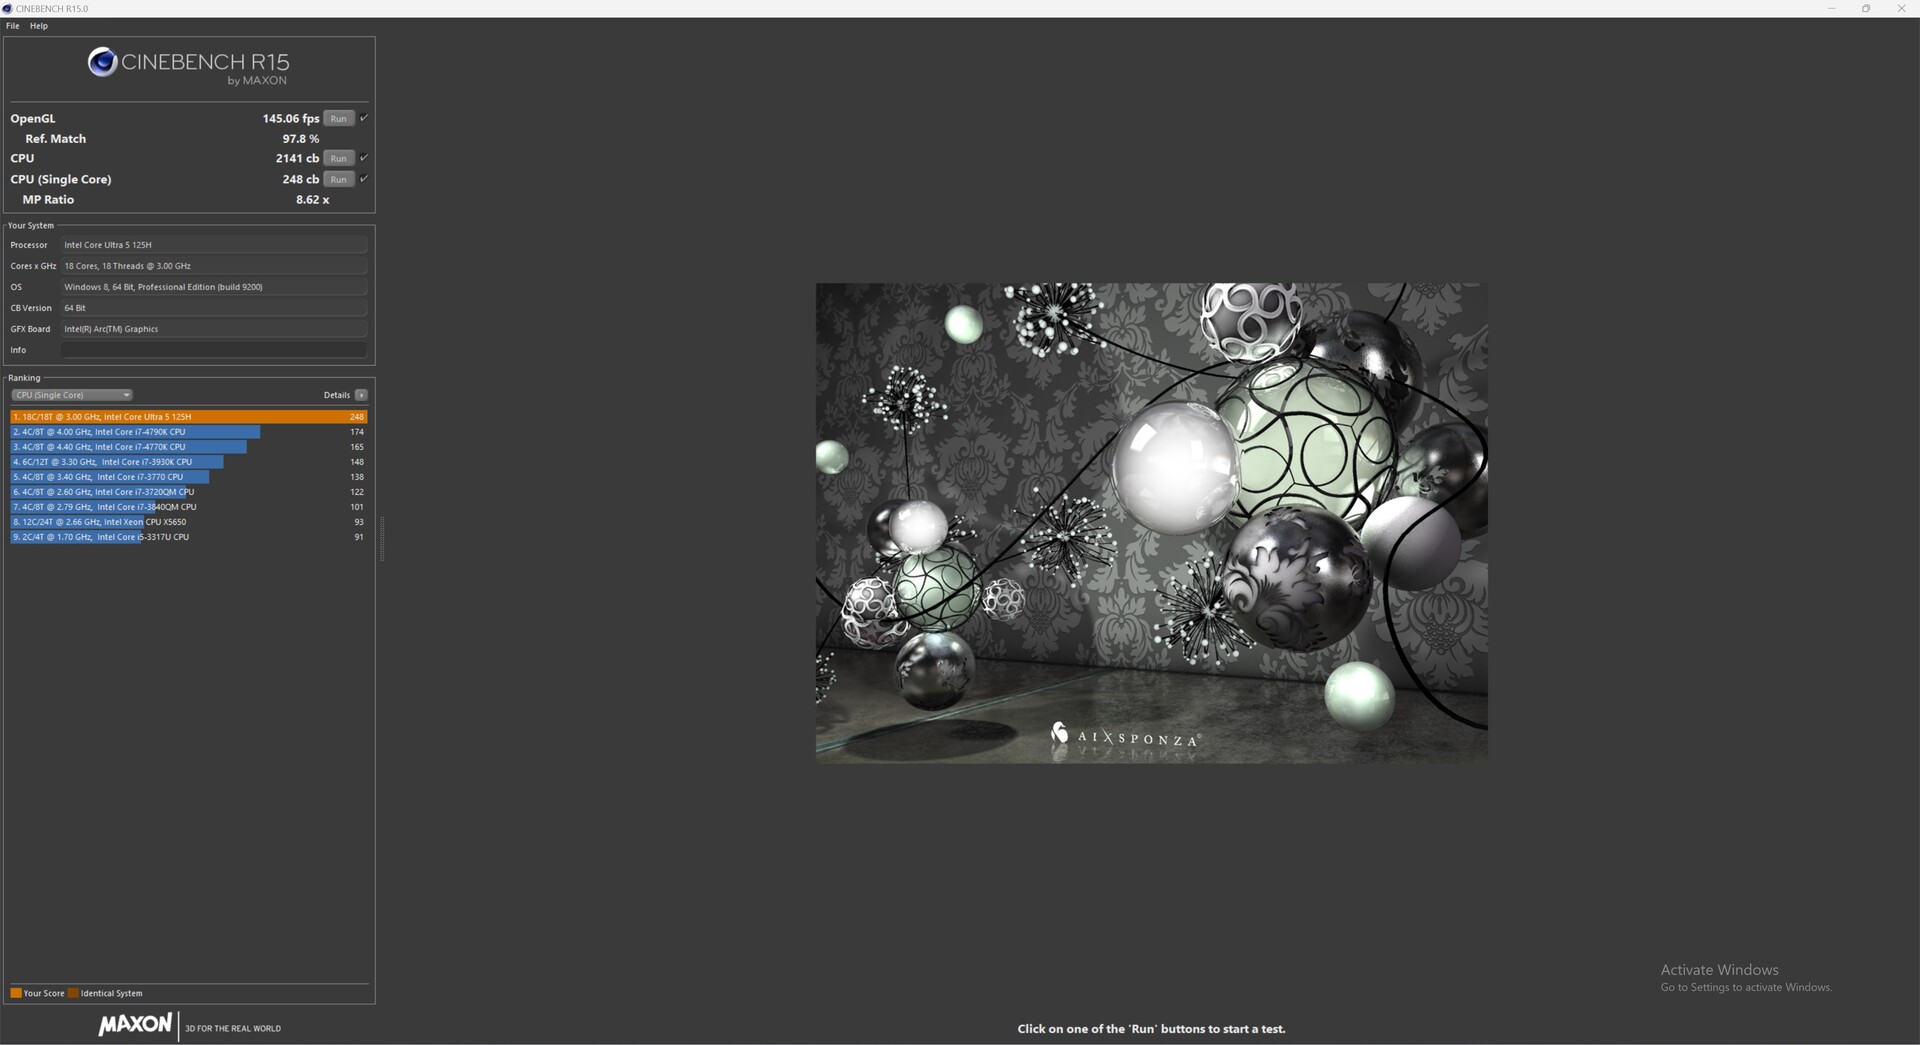
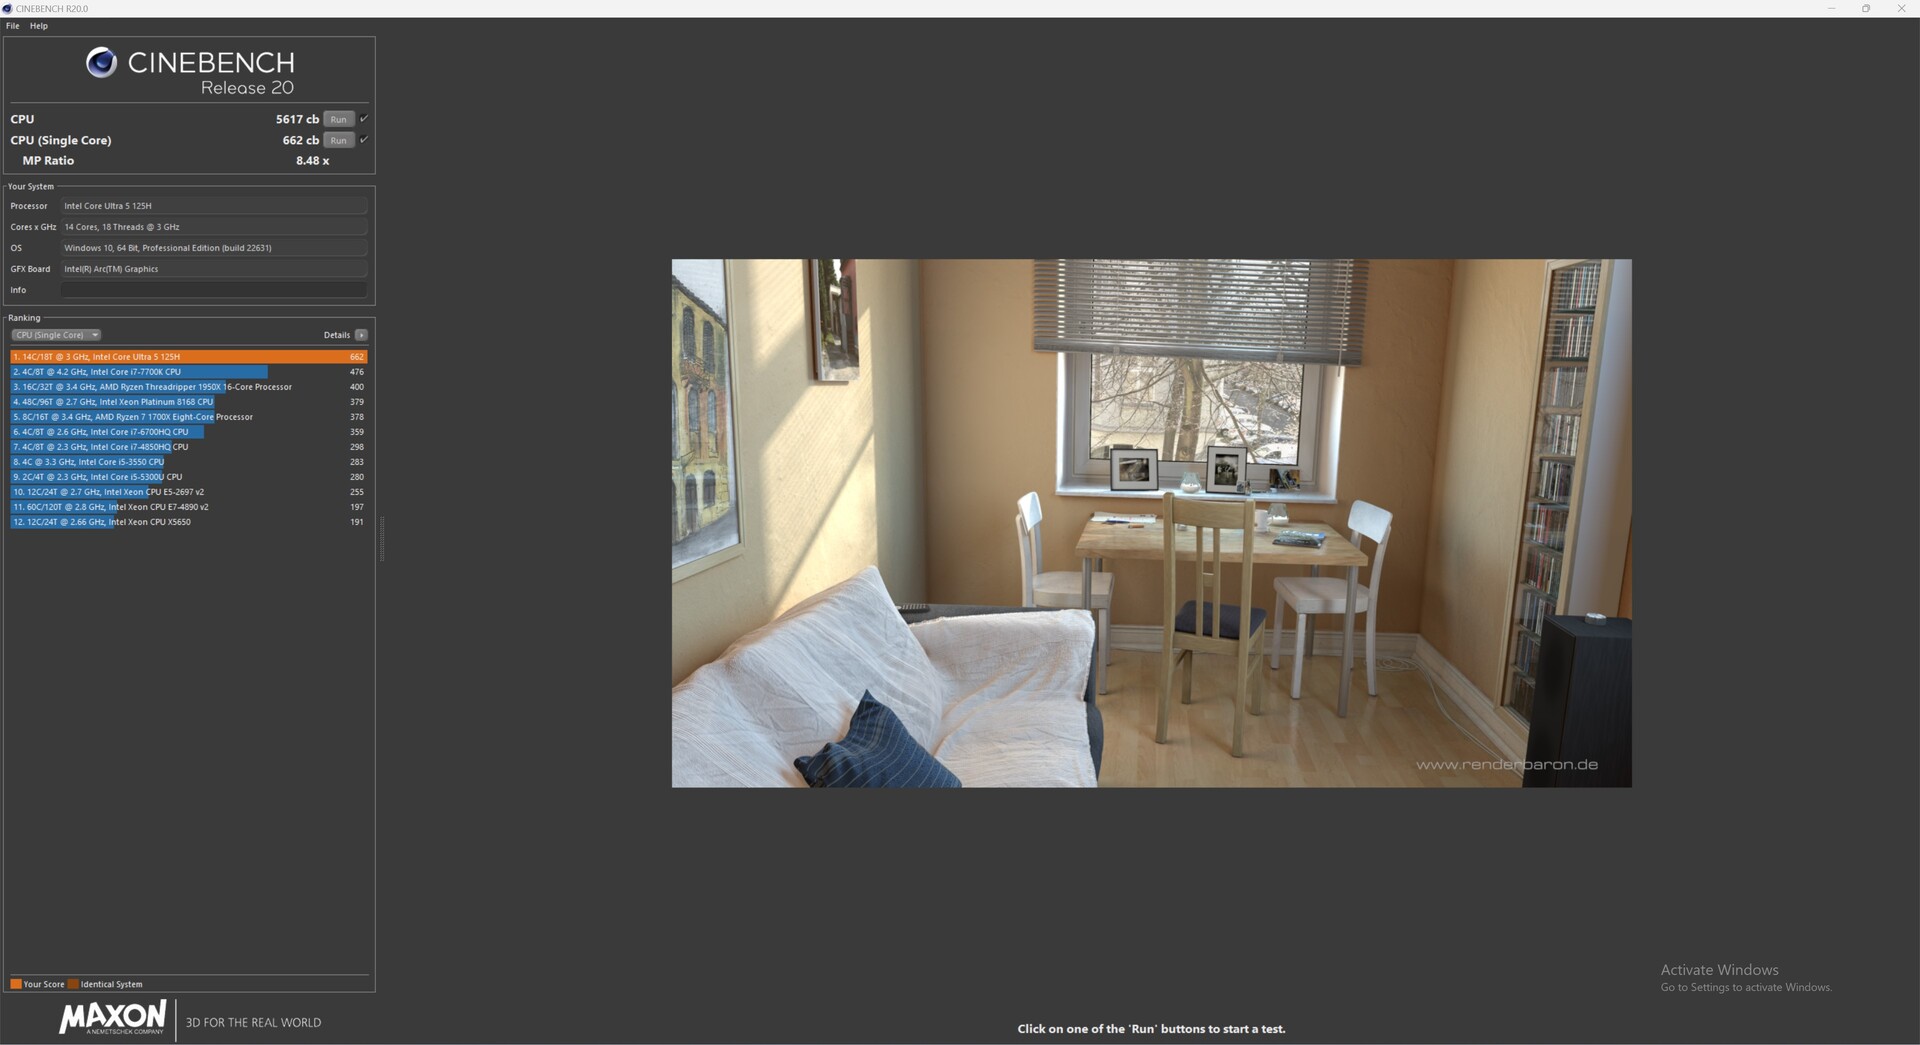
Processor
In our case, the Asus NUC 14 Pro is powered by an Intel Core Ultra 5 125H. 14 cores with a total of 18 threads ensure a high working speed, which puts our test sample in a good third place. The processor's power limit is 64 watts and is repeatedly reached for short periods. In longer load scenarios, the SoC only throttles due to excessive temperatures. These are then over 100 °C under load and are not uncommon. Asus does not appear to be slowing down the Intel SoC any further here, as the SoC is specified with a maximum operating temperature of 110 °C according to the specifications. A direct comparison with the Minisforum UH125 Pro is won by our test sample from Asus. In the individual tests, the Asus NUC 14 Pro has a slight advantage with consistently better single-core performance.
For further comparisons and benchmarks, please refer to our CPU comparison table.


| Performance rating - Percent | |
| Geekom AE7 | |
| Acemagic F2A | |
| Aoostar GEM10 | |
| Asus NUC 14 Pro | |
| Minisforum UH125 Pro | |
| Geekom A5 | |
| Cinebench 2024 | |
| CPU Multi Core | |
| Acemagic F2A | |
| Geekom AE7 | |
| Asus NUC 14 Pro | |
| Minisforum UH125 Pro | |
| Aoostar GEM10 | |
| Geekom A5 | |
| CPU Single Core | |
| Geekom AE7 | |
| Acemagic F2A | |
| Asus NUC 14 Pro | |
| Minisforum UH125 Pro | |
| Aoostar GEM10 | |
| Geekom A5 | |
| Cinebench R23 | |
| Multi Core | |
| Acemagic F2A | |
| Geekom AE7 | |
| Minisforum UH125 Pro | |
| Asus NUC 14 Pro | |
| Aoostar GEM10 | |
| Geekom A5 | |
| Single Core | |
| Geekom AE7 | |
| Acemagic F2A | |
| Asus NUC 14 Pro | |
| Minisforum UH125 Pro | |
| Aoostar GEM10 | |
| Geekom A5 | |
| Cinebench R20 | |
| CPU (Single Core) | |
| Geekom AE7 | |
| Acemagic F2A | |
| Minisforum UH125 Pro | |
| Asus NUC 14 Pro | |
| Aoostar GEM10 | |
| Geekom A5 | |
| CPU (Multi Core) | |
| Acemagic F2A | |
| Geekom AE7 | |
| Minisforum UH125 Pro | |
| Asus NUC 14 Pro | |
| Aoostar GEM10 | |
| Geekom A5 | |
| Cinebench R15 | |
| CPU Single 64Bit | |
| Geekom AE7 | |
| Acemagic F2A | |
| Asus NUC 14 Pro | |
| Aoostar GEM10 | |
| Minisforum UH125 Pro | |
| Geekom A5 | |
| CPU Multi 64Bit | |
| Acemagic F2A | |
| Geekom AE7 | |
| Minisforum UH125 Pro | |
| Asus NUC 14 Pro | |
| Aoostar GEM10 | |
| Geekom A5 | |
| Cinebench R11.5 | |
| CPU Single 64Bit | |
| Geekom AE7 | |
| Acemagic F2A | |
| Asus NUC 14 Pro | |
| Aoostar GEM10 | |
| Minisforum UH125 Pro | |
| Geekom A5 | |
| CPU Multi 64Bit | |
| Acemagic F2A | |
| Geekom AE7 | |
| Minisforum UH125 Pro | |
| Asus NUC 14 Pro | |
| Aoostar GEM10 | |
| Geekom A5 | |
| Cinebench R10 | |
| Rendering Single CPUs 64Bit | |
| Geekom AE7 | |
| Acemagic F2A | |
| Asus NUC 14 Pro | |
| Minisforum UH125 Pro | |
| Aoostar GEM10 | |
| Geekom A5 | |
| Rendering Multiple CPUs 64Bit | |
| Acemagic F2A | |
| Geekom AE7 | |
| Minisforum UH125 Pro | |
| Asus NUC 14 Pro | |
| Aoostar GEM10 | |
| Geekom A5 | |
| Blender - v2.79 BMW27 CPU | |
| Geekom A5 | |
| Aoostar GEM10 | |
| Minisforum UH125 Pro | |
| Asus NUC 14 Pro | |
| Geekom AE7 | |
| Acemagic F2A | |
| wPrime 2.10 | |
| 32m | |
| Minisforum UH125 Pro | |
| Asus NUC 14 Pro | |
| Geekom A5 | |
| Aoostar GEM10 | |
| Acemagic F2A | |
| Geekom AE7 | |
| 1024m | |
| Minisforum UH125 Pro | |
| Asus NUC 14 Pro | |
| Acemagic F2A | |
| Geekom A5 | |
| Aoostar GEM10 | |
| Geekom AE7 | |
| X264 HD Benchmark 4.0 | |
| Pass 1 | |
| Acemagic F2A | |
| Asus NUC 14 Pro | |
| Minisforum UH125 Pro | |
| Geekom AE7 | |
| Aoostar GEM10 | |
| Geekom A5 | |
| Pass 2 | |
| Acemagic F2A | |
| Geekom AE7 | |
| Minisforum UH125 Pro | |
| Asus NUC 14 Pro | |
| Aoostar GEM10 | |
| Geekom A5 | |
| WinRAR - Result | |
| Acemagic F2A | |
| Geekom AE7 | |
| Geekom A5 | |
| Asus NUC 14 Pro | |
| Aoostar GEM10 | |
| Minisforum UH125 Pro | |
| TrueCrypt | |
| AES Mean 100MB | |
| Geekom AE7 | |
| Aoostar GEM10 | |
| Geekom A5 | |
| Acemagic F2A | |
| Minisforum UH125 Pro | |
| Asus NUC 14 Pro | |
| Twofish Mean 100MB | |
| Geekom AE7 | |
| Aoostar GEM10 | |
| Acemagic F2A | |
| Geekom A5 | |
| Minisforum UH125 Pro | |
| Asus NUC 14 Pro | |
| Serpent Mean 100MB | |
| Geekom AE7 | |
| Aoostar GEM10 | |
| Geekom A5 | |
| Acemagic F2A | |
| Asus NUC 14 Pro | |
| Minisforum UH125 Pro | |
| Geekbench 5.5 | |
| Multi-Core | |
| Acemagic F2A | |
| Geekom AE7 | |
| Asus NUC 14 Pro | |
| Minisforum UH125 Pro | |
| Aoostar GEM10 | |
| Geekom A5 | |
| Single-Core | |
| Geekom AE7 | |
| Acemagic F2A | |
| Asus NUC 14 Pro | |
| Minisforum UH125 Pro | |
| Aoostar GEM10 | |
| Geekom A5 | |
| Geekbench 5.0 | |
| 5.0 Multi-Core | |
| Acemagic F2A | |
| Geekom AE7 | |
| Asus NUC 14 Pro | |
| Minisforum UH125 Pro | |
| Aoostar GEM10 | |
| Geekom A5 | |
| 5.0 Single-Core | |
| Geekom AE7 | |
| Acemagic F2A | |
| Asus NUC 14 Pro | |
| Minisforum UH125 Pro | |
| Aoostar GEM10 | |
| Geekom A5 | |
| Geekbench 4.4 | |
| 64 Bit Single-Core Score | |
| Geekom AE7 | |
| Asus NUC 14 Pro | |
| Acemagic F2A | |
| Minisforum UH125 Pro | |
| Aoostar GEM10 | |
| Geekom A5 | |
| 64 Bit Multi-Core Score | |
| Geekom AE7 | |
| Acemagic F2A | |
| Asus NUC 14 Pro | |
| Minisforum UH125 Pro | |
| Aoostar GEM10 | |
| Geekom A5 | |
| 3DMark 11 - 1280x720 Performance Physics | |
| Geekom AE7 | |
| Acemagic F2A | |
| Asus NUC 14 Pro | |
| Minisforum UH125 Pro | |
| Geekom A5 | |
| Aoostar GEM10 | |
| 7-Zip 18.03 | |
| 7z b 4 | |
| Geekom AE7 | |
| Acemagic F2A | |
| Aoostar GEM10 | |
| Geekom A5 | |
| Minisforum UH125 Pro | |
| Asus NUC 14 Pro | |
| 7z b 4 -mmt1 | |
| Geekom AE7 | |
| Aoostar GEM10 | |
| Geekom A5 | |
| Acemagic F2A | |
| Asus NUC 14 Pro | |
| Minisforum UH125 Pro | |
| HWBOT x265 Benchmark v2.2 - 4k Preset | |
| Geekom AE7 | |
| Acemagic F2A | |
| Minisforum UH125 Pro | |
| Asus NUC 14 Pro | |
| Aoostar GEM10 | |
| Geekom A5 | |
| R Benchmark 2.5 - Overall mean | |
| Geekom A5 | |
| Aoostar GEM10 | |
| Minisforum UH125 Pro | |
| Asus NUC 14 Pro | |
| Acemagic F2A | |
| Geekom AE7 | |
| LibreOffice - 20 Documents To PDF | |
| Minisforum UH125 Pro | |
| Asus NUC 14 Pro | |
| Geekom A5 | |
| Geekom AE7 | |
| Aoostar GEM10 | |
| Acemagic F2A | |
| WebXPRT 3 - Overall | |
| Geekom AE7 | |
| Acemagic F2A | |
| Aoostar GEM10 | |
| Geekom A5 | |
| Minisforum UH125 Pro | |
| Asus NUC 14 Pro | |
| Mozilla Kraken 1.1 - Total | |
| Geekom A5 | |
| Minisforum UH125 Pro | |
| Aoostar GEM10 | |
| Asus NUC 14 Pro | |
| Acemagic F2A | |
| Geekom AE7 | |
| 3DMark | |
| 1920x1080 Fire Strike Physics | |
| Geekom AE7 | |
| Acemagic F2A | |
| Aoostar GEM10 | |
| Asus NUC 14 Pro | |
| Geekom A5 | |
| Minisforum UH125 Pro | |
| 2560x1440 Time Spy CPU | |
| Geekom AE7 | |
| Acemagic F2A | |
| Minisforum UH125 Pro | |
| Asus NUC 14 Pro | |
| Geekom A5 | |
| Aoostar GEM10 | |
| Super Pi mod 1.5 XS 1M - 1M | |
| Geekom A5 | |
| Aoostar GEM10 | |
| Minisforum UH125 Pro | |
| Asus NUC 14 Pro | |
| Acemagic F2A | |
| Geekom AE7 | |
| Super Pi mod 1.5 XS 2M - 2M | |
| Geekom A5 | |
| Aoostar GEM10 | |
| Geekom AE7 | |
| Minisforum UH125 Pro | |
| Asus NUC 14 Pro | |
| Acemagic F2A | |
| Super Pi Mod 1.5 XS 32M - 32M | |
| Aoostar GEM10 | |
| Geekom AE7 | |
| Geekom A5 | |
| Minisforum UH125 Pro | |
| Acemagic F2A | |
| Asus NUC 14 Pro | |
| Affinity Photo 2 - Combined (Multi CPU) | |
| Acemagic F2A | |
| Geekom AE7 | |
| Minisforum UH125 Pro | |
| Asus NUC 14 Pro | |
| Aoostar GEM10 | |
| Geekom A5 | |
* ... smaller is better
AIDA64: FP32 Ray-Trace | FPU Julia | CPU SHA3 | CPU Queen | FPU SinJulia | FPU Mandel | CPU AES | CPU ZLib | FP64 Ray-Trace | CPU PhotoWorxx
| Performance rating | |
| Geekom AE7 | |
| Average of class Mini PC | |
| Acemagic F2A | |
| Aoostar GEM10 | |
| Minisforum UH125 Pro | |
| Asus NUC 14 Pro | |
| Geekom A5 | |
| AIDA64 / FP32 Ray-Trace | |
| Geekom AE7 | |
| Average of class Mini PC (974 - 82725, n=98, last 2 years) | |
| Acemagic F2A | |
| Aoostar GEM10 | |
| Minisforum UH125 Pro | |
| Asus NUC 14 Pro | |
| Geekom A5 | |
| AIDA64 / FPU Julia | |
| Geekom AE7 | |
| Average of class Mini PC (6115 - 363782, n=98, last 2 years) | |
| Acemagic F2A | |
| Aoostar GEM10 | |
| Geekom A5 | |
| Minisforum UH125 Pro | |
| Asus NUC 14 Pro | |
| AIDA64 / CPU SHA3 | |
| Geekom AE7 | |
| Average of class Mini PC (385 - 9475, n=98, last 2 years) | |
| Acemagic F2A | |
| Minisforum UH125 Pro | |
| Asus NUC 14 Pro | |
| Aoostar GEM10 | |
| Geekom A5 | |
| AIDA64 / CPU Queen | |
| Geekom AE7 | |
| Aoostar GEM10 | |
| Average of class Mini PC (20501 - 154404, n=81, last 2 years) | |
| Geekom A5 | |
| Acemagic F2A | |
| Asus NUC 14 Pro | |
| Minisforum UH125 Pro | |
| AIDA64 / FPU SinJulia | |
| Geekom AE7 | |
| Average of class Mini PC (1116 - 31931, n=98, last 2 years) | |
| Aoostar GEM10 | |
| Geekom A5 | |
| Acemagic F2A | |
| Asus NUC 14 Pro | |
| Minisforum UH125 Pro | |
| AIDA64 / FPU Mandel | |
| Geekom AE7 | |
| Average of class Mini PC (3322 - 192994, n=98, last 2 years) | |
| Aoostar GEM10 | |
| Acemagic F2A | |
| Geekom A5 | |
| Minisforum UH125 Pro | |
| Asus NUC 14 Pro | |
| AIDA64 / CPU AES | |
| Geekom AE7 | |
| Acemagic F2A | |
| Aoostar GEM10 | |
| Geekom A5 | |
| Average of class Mini PC (9915 - 204742, n=97, last 2 years) | |
| Minisforum UH125 Pro | |
| Asus NUC 14 Pro | |
| AIDA64 / CPU ZLib | |
| Acemagic F2A | |
| Average of class Mini PC (127.2 - 2431, n=98, last 2 years) | |
| Geekom AE7 | |
| Minisforum UH125 Pro | |
| Asus NUC 14 Pro | |
| Aoostar GEM10 | |
| Geekom A5 | |
| AIDA64 / FP64 Ray-Trace | |
| Geekom AE7 | |
| Average of class Mini PC (537 - 43587, n=98, last 2 years) | |
| Acemagic F2A | |
| Aoostar GEM10 | |
| Minisforum UH125 Pro | |
| Asus NUC 14 Pro | |
| Geekom A5 | |
| AIDA64 / CPU PhotoWorxx | |
| Asus NUC 14 Pro | |
| Minisforum UH125 Pro | |
| Average of class Mini PC (8069 - 96843, n=98, last 2 years) | |
| Geekom AE7 | |
| Acemagic F2A | |
| Aoostar GEM10 | |
| Geekom A5 | |
Cinebench R15 Multi loop
Unfortunately the Asus NUC 14 Pro cannot maintain its slightly better CPU performance in the Cinebench R15 continuous loop compared to the Minisforum UH125 Pro. The increased CPU temperatures repeatedly cause short-term performance drops, which is why the results are not very consistent. With an average of 2,021 points, the Asus NUC 14 Pro cannot beat the Minisforum UH125 Pro.

System performance
The system performance reflects exactly what is possible with the Intel Core Ultra 5 125H. Based on the same SoC, the Minisforum UH125 Pro is the main competitor and delivers a similar performance to the Asus NUC 14 Pro. Subjectively, the Asus NUC 14 Pro delivers excellent everyday performance and our test sample can secure second place in the RAM tests.
| PCMark 10 / Score | |
| Geekom AE7, AMD Ryzen 9 7940HS | |
| Acemagic F2A, Intel Core Ultra 7 155H | |
| Aoostar GEM10, AMD Ryzen 7 6800H | |
| Asus NUC 14 Pro, Intel Core Ultra 5 125H | |
| Minisforum UH125 Pro, Intel Core Ultra 5 125H | |
| Geekom A5, AMD Ryzen 7 5800H | |
| PCMark 10 / Essentials | |
| Acemagic F2A, Intel Core Ultra 7 155H | |
| Geekom AE7, AMD Ryzen 9 7940HS | |
| Aoostar GEM10, AMD Ryzen 7 6800H | |
| Geekom A5, AMD Ryzen 7 5800H | |
| Asus NUC 14 Pro, Intel Core Ultra 5 125H | |
| Minisforum UH125 Pro, Intel Core Ultra 5 125H | |
| PCMark 10 / Productivity | |
| Geekom AE7, AMD Ryzen 9 7940HS | |
| Aoostar GEM10, AMD Ryzen 7 6800H | |
| Geekom A5, AMD Ryzen 7 5800H | |
| Acemagic F2A, Intel Core Ultra 7 155H | |
| Minisforum UH125 Pro, Intel Core Ultra 5 125H | |
| Asus NUC 14 Pro, Intel Core Ultra 5 125H | |
| CrossMark / Overall | |
| Geekom AE7, AMD Ryzen 9 7940HS | |
| Acemagic F2A, Intel Core Ultra 7 155H | |
| Aoostar GEM10, AMD Ryzen 7 6800H | |
| Minisforum UH125 Pro, Intel Core Ultra 5 125H | |
| Asus NUC 14 Pro, Intel Core Ultra 5 125H | |
| Geekom A5, AMD Ryzen 7 5800H | |
| CrossMark / Responsiveness | |
| Acemagic F2A, Intel Core Ultra 7 155H | |
| Aoostar GEM10, AMD Ryzen 7 6800H | |
| Geekom AE7, AMD Ryzen 9 7940HS | |
| Minisforum UH125 Pro, Intel Core Ultra 5 125H | |
| Geekom A5, AMD Ryzen 7 5800H | |
| Asus NUC 14 Pro, Intel Core Ultra 5 125H | |
| CrossMark / Creativity | |
| Geekom AE7, AMD Ryzen 9 7940HS | |
| Acemagic F2A, Intel Core Ultra 7 155H | |
| Asus NUC 14 Pro, Intel Core Ultra 5 125H | |
| Aoostar GEM10, AMD Ryzen 7 6800H | |
| Minisforum UH125 Pro, Intel Core Ultra 5 125H | |
| Geekom A5, AMD Ryzen 7 5800H | |
| CrossMark / Productivity | |
| Geekom AE7, AMD Ryzen 9 7940HS | |
| Acemagic F2A, Intel Core Ultra 7 155H | |
| Aoostar GEM10, AMD Ryzen 7 6800H | |
| Minisforum UH125 Pro, Intel Core Ultra 5 125H | |
| Asus NUC 14 Pro, Intel Core Ultra 5 125H | |
| Geekom A5, AMD Ryzen 7 5800H | |
| AIDA64 / Memory Copy | |
| Minisforum UH125 Pro | |
| Asus NUC 14 Pro | |
| Geekom AE7 | |
| Average of class Mini PC (15933 - 163031, n=98, last 2 years) | |
| Acemagic F2A | |
| Aoostar GEM10 | |
| Geekom A5 | |
| AIDA64 / Memory Read | |
| Asus NUC 14 Pro | |
| Minisforum UH125 Pro | |
| Average of class Mini PC (14143 - 123769, n=98, last 2 years) | |
| Acemagic F2A | |
| Geekom AE7 | |
| Geekom A5 | |
| Aoostar GEM10 | |
| AIDA64 / Memory Write | |
| Geekom AE7 | |
| Average of class Mini PC (10630 - 216693, n=98, last 2 years) | |
| Asus NUC 14 Pro | |
| Minisforum UH125 Pro | |
| Acemagic F2A | |
| Aoostar GEM10 | |
| Geekom A5 | |
| AIDA64 / Memory Latency | |
| Minisforum UH125 Pro | |
| Acemagic F2A | |
| Asus NUC 14 Pro | |
| Aoostar GEM10 | |
| Average of class Mini PC (88.1 - 170, n=99, last 2 years) | |
| Geekom AE7 | |
| Geekom A5 | |
* ... smaller is better
| UL Procyon for Windows | |
| Overall Score Integer NPU | |
| Asus NUC 14 Pro | |
| Minisforum UH125 Pro | |
| Acemagic F2A | |
| Overall Score Integer GPU | |
| Asus NUC 14 Pro | |
| Acemagic F2A | |
| Minisforum UH125 Pro | |
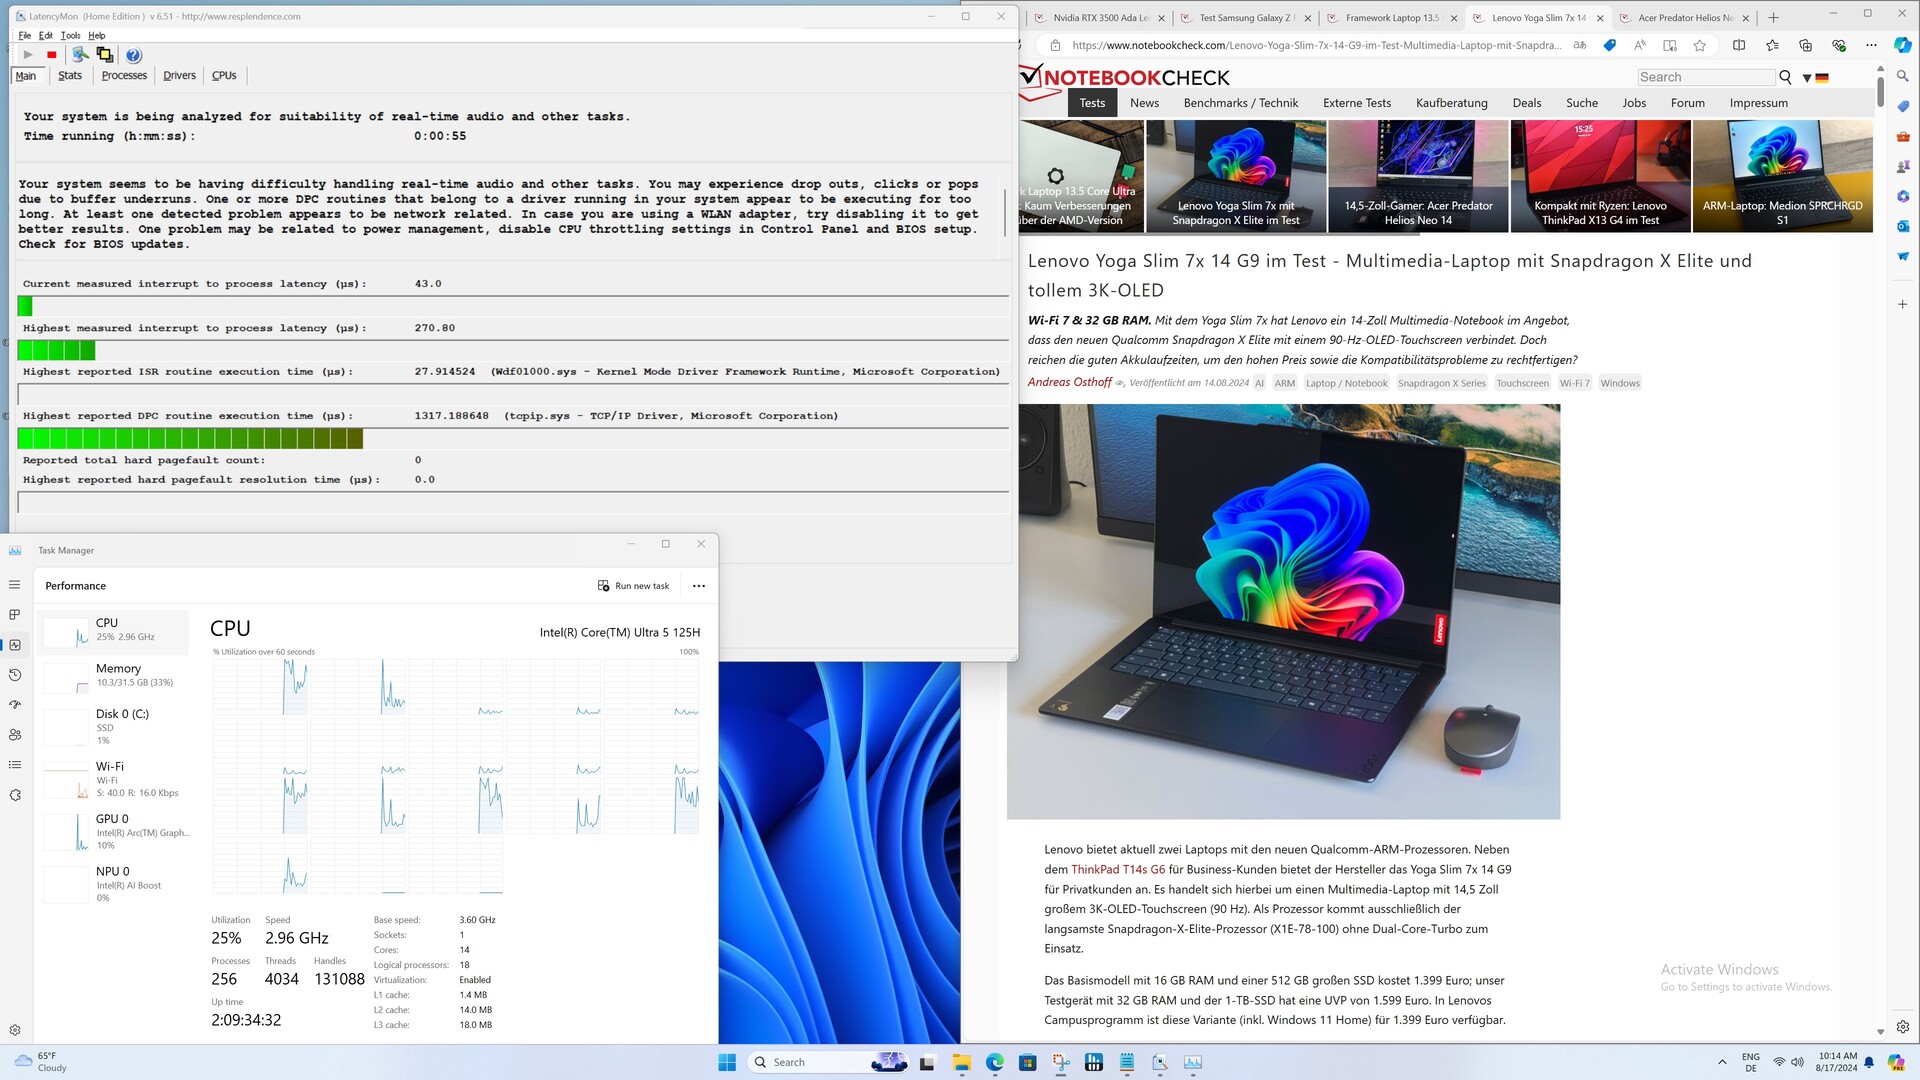
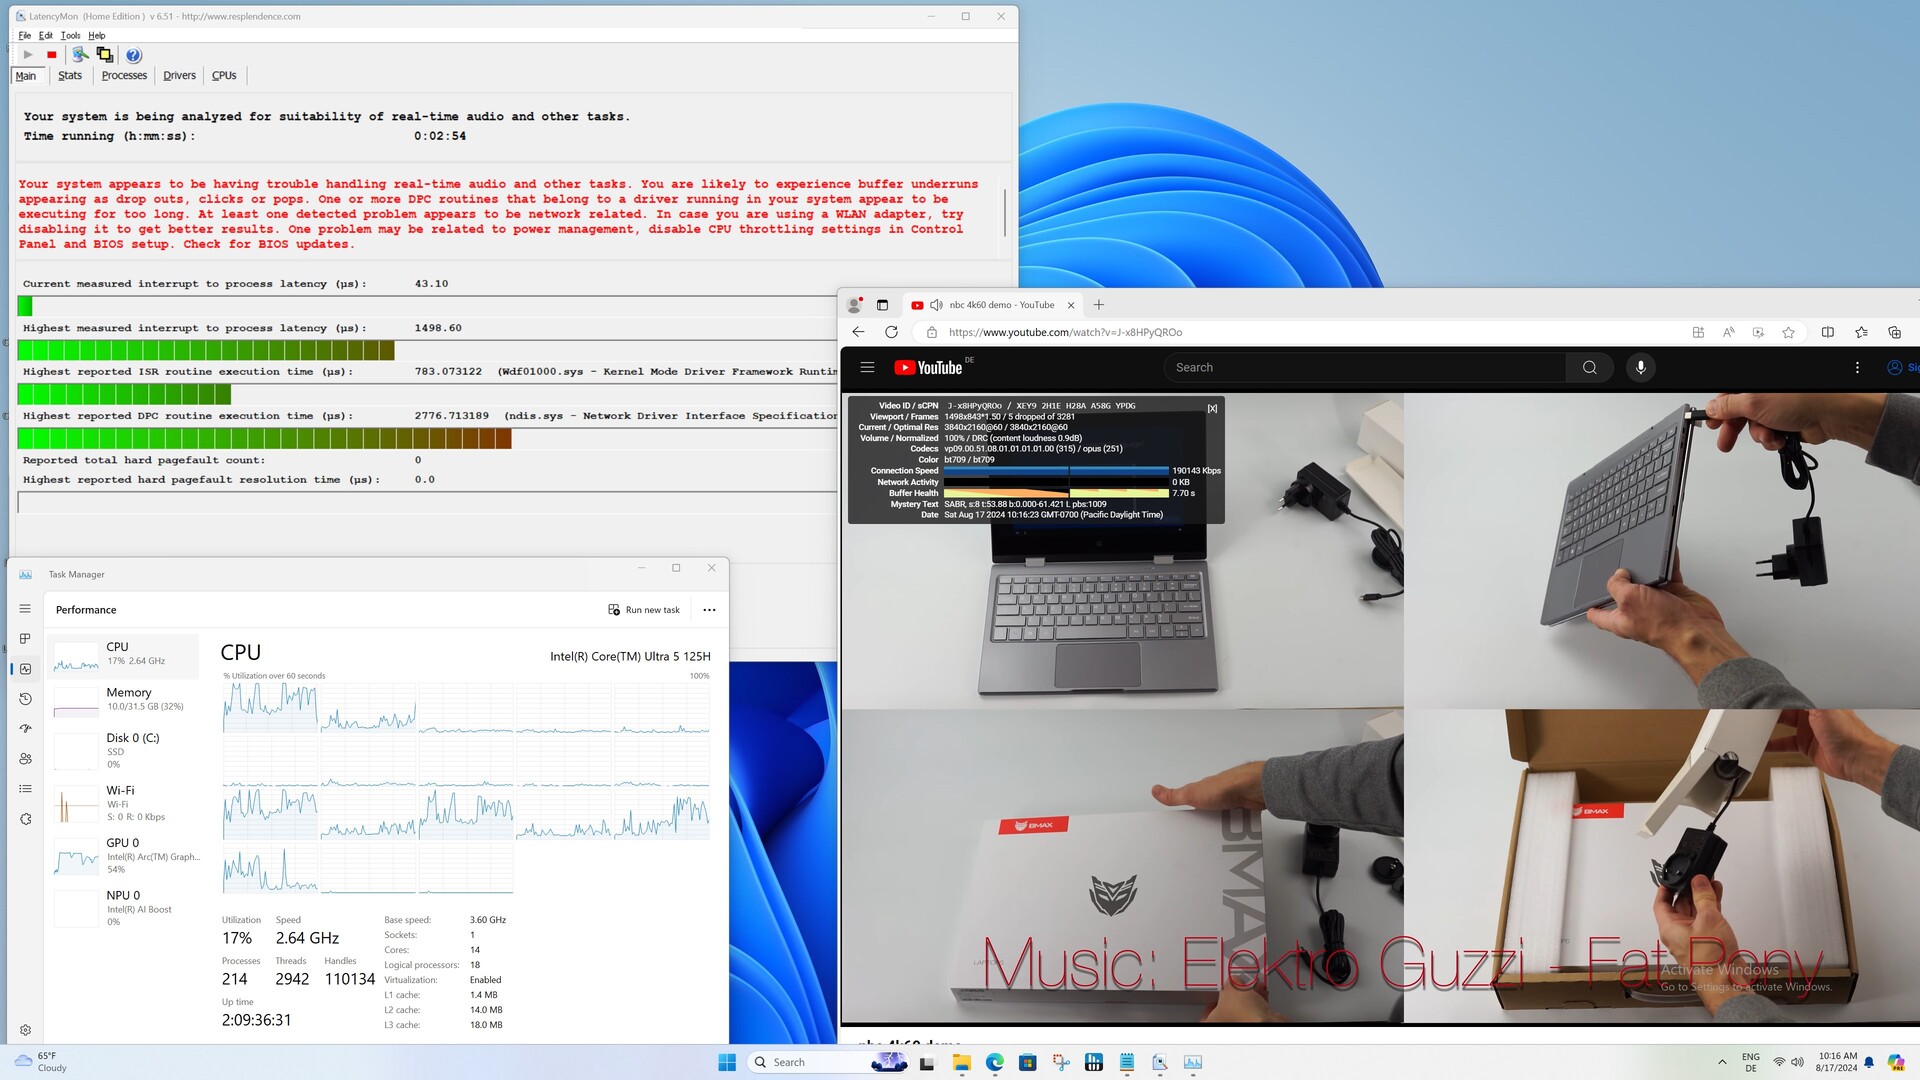
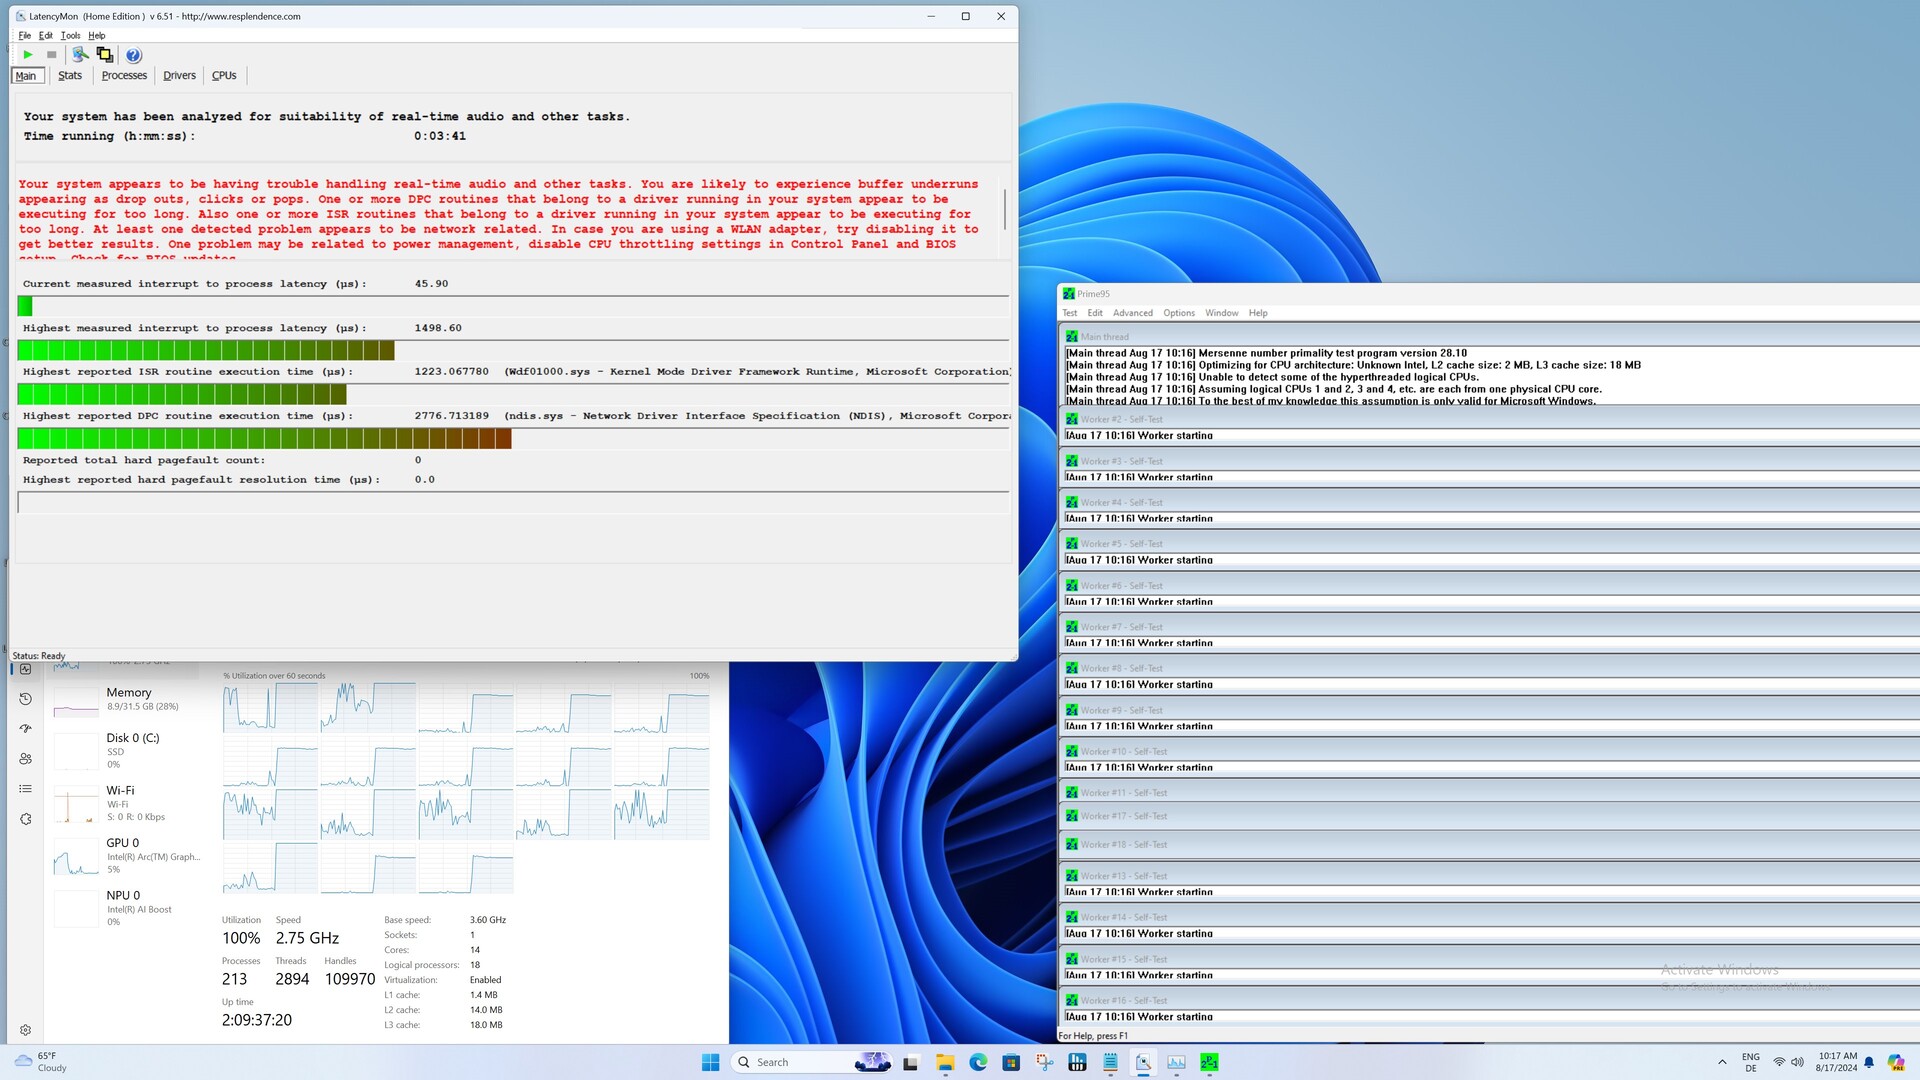
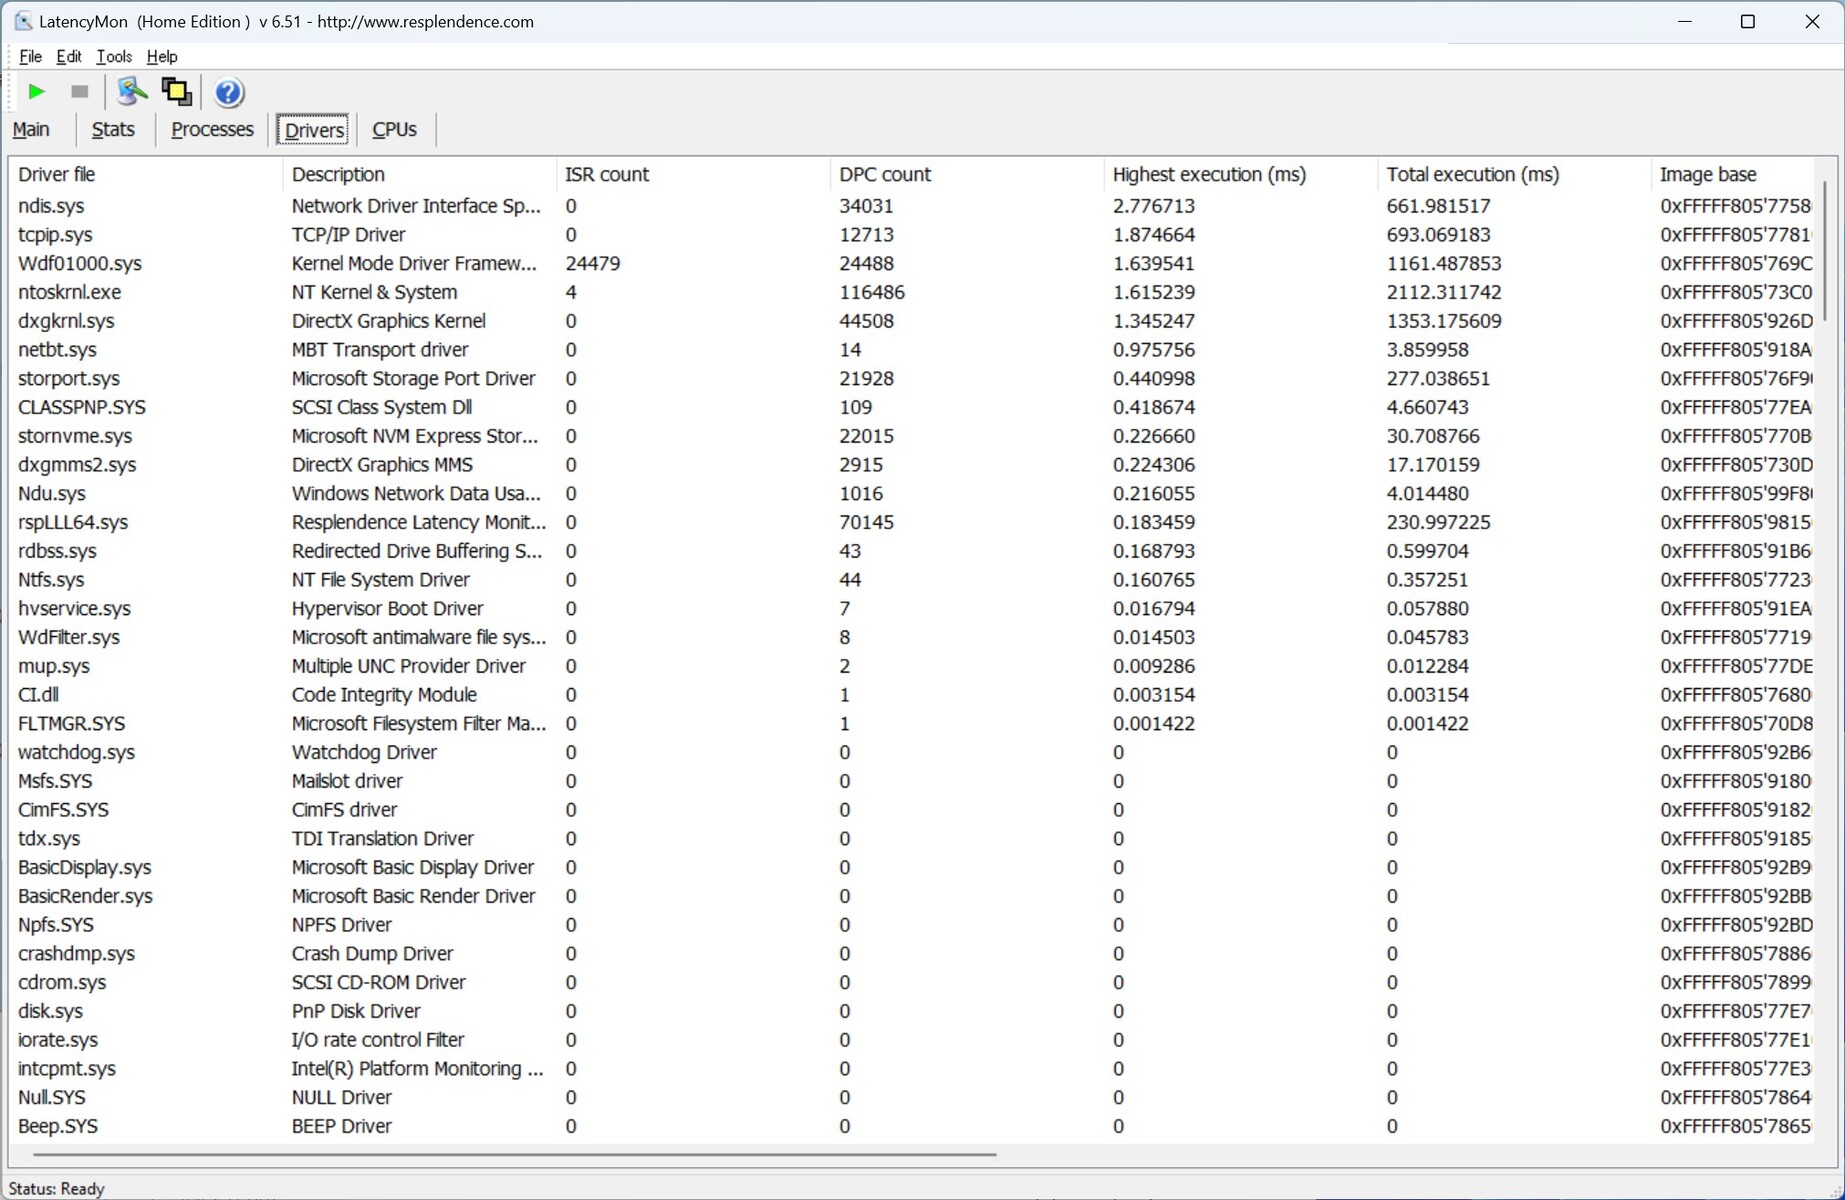
DPC latencies
The DPC latencies of the Asus NUC 14 Pro are not convincing. Even when simply surfing the Internet, we see high values, which deteriorate even further when playing the 4K test video. Future BIOS or driver updates could ensure improvements here in the future.
| DPC Latencies / LatencyMon - interrupt to process latency (max), Web, Youtube, Prime95 | |
| Asus NUC 14 Pro | |
| Acemagic F2A | |
| Geekom AE7 | |
| Minisforum UH125 Pro | |
| Geekom A5 | |
| Aoostar GEM10 | |
* ... smaller is better
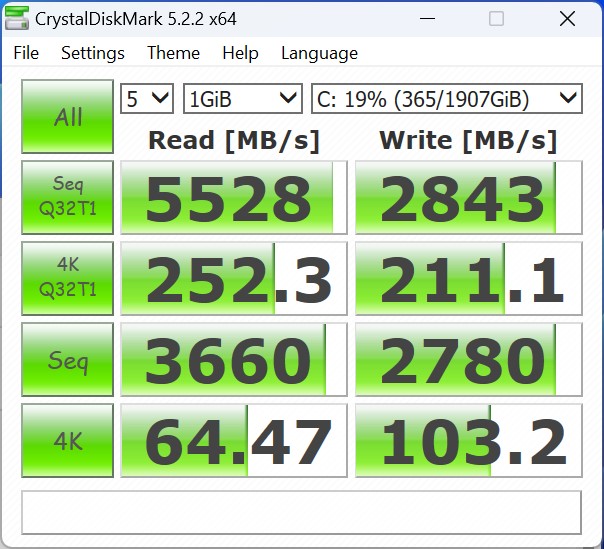
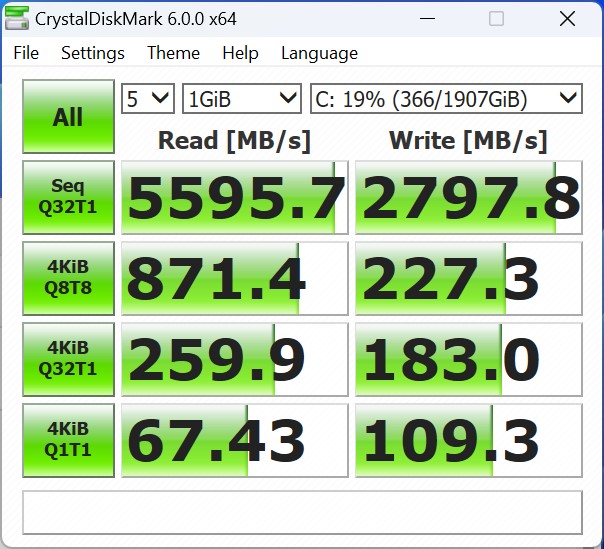
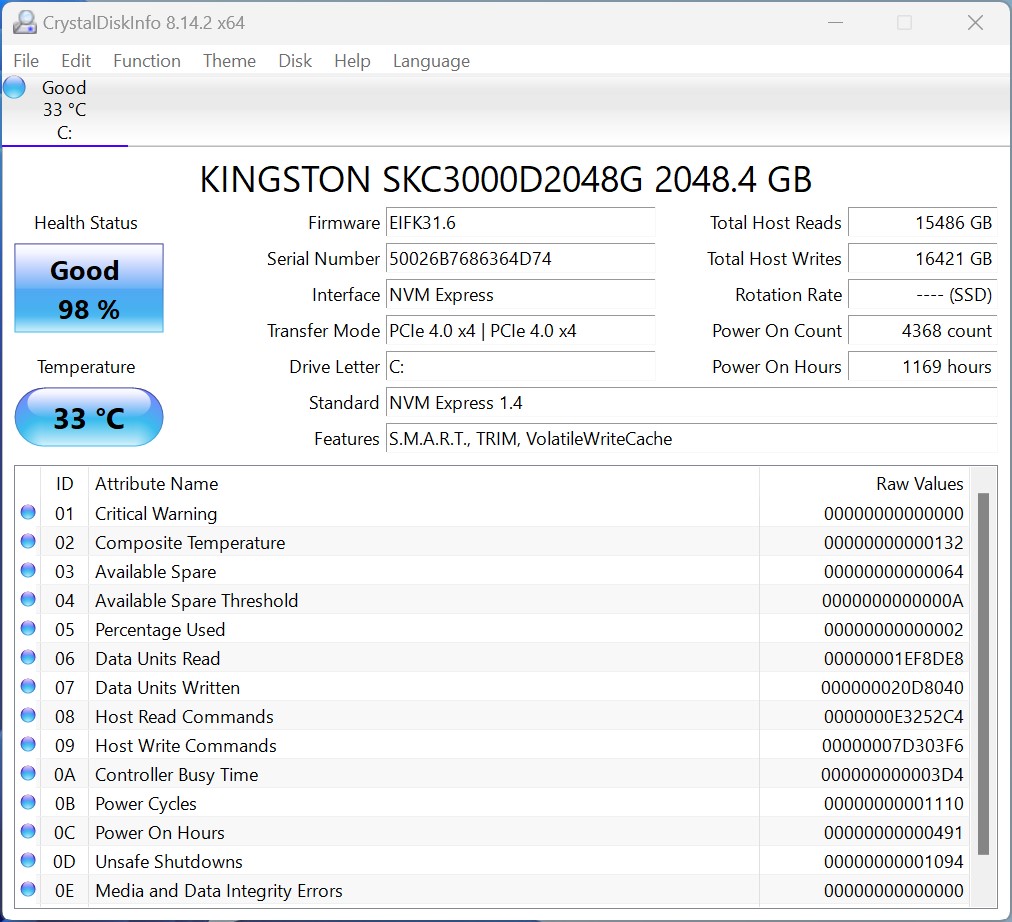
Mass storage

We equipped the test device with a Kingston KC3000 SSD. The theoretical performance of the SSD cannot be achieved in practice. Nevertheless, we recorded comparatively good results, which meant a good third place overall. Slight problems can be seen in the stress test: In combination with the Kingston SC3000 used, the read performance cannot be permanently maintained at the same level.
For further comparisons and benchmarks, please take a look at our comparison table.


| Drive Performance rating - Percent | |
| Aoostar GEM10 | |
| Geekom AE7 | |
| Asus NUC 14 Pro | |
| Average of class Mini PC | |
| Minisforum UH125 Pro | |
| Acemagic F2A | |
| Geekom A5 | |
* ... smaller is better
Continuous read: DiskSpd Read Loop, Queue Depth 8
Graphics card
The 3D performance of the Asus NUC 14 Pro is noticeably better than the older Intel Iris Xe G7 with 96 EUs due to the revised Intel Arc architecture. However, the Intel Arc 7-core iGPU cannot keep up with the AMD Radeon 780M. Nevertheless, the Asus NUC 14 Pro delivers outstanding performance, as our test sample wins the comparison with the Acemagic F2A in several tests.
Further comparisons and benchmarks can be found in our GPU comparison table.
| 3DMark Performance rating - Percent | |
| Geekom AE7 | |
| Asus NUC 14 Pro | |
| Acemagic F2A | |
| Aoostar GEM10 | |
| Minisforum UH125 Pro | |
| Geekom A5 | |
| 3DMark 11 - 1280x720 Performance GPU | |
| Geekom AE7 | |
| Acemagic F2A | |
| Asus NUC 14 Pro | |
| Aoostar GEM10 | |
| Minisforum UH125 Pro | |
| Geekom A5 | |
| 3DMark | |
| 2560x1440 Time Spy Graphics | |
| Acemagic F2A | |
| Asus NUC 14 Pro | |
| Geekom AE7 | |
| Minisforum UH125 Pro | |
| Aoostar GEM10 | |
| Geekom A5 | |
| 1920x1080 Fire Strike Graphics | |
| Geekom AE7 | |
| Asus NUC 14 Pro | |
| Acemagic F2A | |
| Aoostar GEM10 | |
| Minisforum UH125 Pro | |
| Geekom A5 | |
| Unigine Heaven 4.0 | |
| Extreme Preset OpenGL | |
| Aoostar GEM10 | |
| Asus NUC 14 Pro | |
| Geekom AE7 | |
| Acemagic F2A | |
| Minisforum UH125 Pro | |
| Geekom A5 | |
| Extreme Preset DX11 | |
| Geekom AE7 | |
| Aoostar GEM10 | |
| Asus NUC 14 Pro | |
| Acemagic F2A | |
| Minisforum UH125 Pro | |
| Geekom A5 | |
| Unigine Valley 1.0 | |
| 1920x1080 Extreme HD DirectX AA:x8 | |
| Geekom AE7 | |
| Aoostar GEM10 | |
| Asus NUC 14 Pro | |
| Acemagic F2A | |
| Minisforum UH125 Pro | |
| Geekom A5 | |
| 1920x1080 Extreme HD Preset OpenGL AA:x8 | |
| Aoostar GEM10 | |
| Asus NUC 14 Pro | |
| Geekom AE7 | |
| Acemagic F2A | |
| Minisforum UH125 Pro | |
| Geekom A5 | |
| Unigine Superposition | |
| 1280x720 720p Low | |
| Geekom AE7 | |
| Aoostar GEM10 | |
| Asus NUC 14 Pro | |
| Acemagic F2A | |
| Minisforum UH125 Pro | |
| Geekom A5 | |
| 1920x1080 1080p High | |
| Geekom AE7 | |
| Asus NUC 14 Pro | |
| Acemagic F2A | |
| Aoostar GEM10 | |
| Minisforum UH125 Pro | |
| Geekom A5 | |
| 1920x1080 1080p Extreme | |
| Asus NUC 14 Pro | |
| Acemagic F2A | |
| Geekom AE7 | |
| Minisforum UH125 Pro | |
| Aoostar GEM10 | |
| Geekom A5 | |
| ComputeMark v2.1 | |
| 1024x600 Normal, Score | |
| Geekom AE7 | |
| Acemagic F2A | |
| Aoostar GEM10 | |
| Asus NUC 14 Pro | |
| Minisforum UH125 Pro | |
| Geekom A5 | |
| 1024x600 Normal, Fluid 3DTex | |
| Asus NUC 14 Pro | |
| Geekom AE7 | |
| Minisforum UH125 Pro | |
| Acemagic F2A | |
| Aoostar GEM10 | |
| Geekom A5 | |
| 1024x600 Normal, Fluid 2DTexArr | |
| Geekom AE7 | |
| Asus NUC 14 Pro | |
| Aoostar GEM10 | |
| Minisforum UH125 Pro | |
| Acemagic F2A | |
| Geekom A5 | |
| 1024x600 Normal, Mandel Vector | |
| Geekom AE7 | |
| Acemagic F2A | |
| Aoostar GEM10 | |
| Asus NUC 14 Pro | |
| Minisforum UH125 Pro | |
| Geekom A5 | |
| 1024x600 Normal, Mandel Scalar | |
| Geekom AE7 | |
| Aoostar GEM10 | |
| Acemagic F2A | |
| Asus NUC 14 Pro | |
| Minisforum UH125 Pro | |
| Geekom A5 | |
| 1024x600 Normal, QJuliaRayTrace | |
| Geekom AE7 | |
| Acemagic F2A | |
| Asus NUC 14 Pro | |
| Aoostar GEM10 | |
| Minisforum UH125 Pro | |
| Geekom A5 | |
| LuxMark v2.0 64Bit | |
| Room GPUs-only | |
| Geekom AE7 | |
| Asus NUC 14 Pro | |
| Minisforum UH125 Pro | |
| Geekom A5 | |
| Aoostar GEM10 | |
| Acemagic F2A | |
| Sala GPUs-only | |
| Asus NUC 14 Pro | |
| Minisforum UH125 Pro | |
| Acemagic F2A | |
| Geekom AE7 | |
| Geekom A5 | |
| Aoostar GEM10 | |
| Affinity Photo 2 - Combined (Single / Multi GPU) | |
| Minisforum UH125 Pro | |
| Asus NUC 14 Pro | |
| Acemagic F2A | |
| Aoostar GEM10 | |
| Geekom AE7 | |
| Geekom A5 | |
| Asus NUC 14 Pro, Intel Arc 7-Core iGPU Ultra 5 125H | Geekom AE7, AMD Radeon 780M R9 7940HS | Minisforum UH125 Pro, Intel Arc 7-Core iGPU Ultra 5 125H | Aoostar GEM10, AMD Radeon 680M R7 6800H | Acemagic F2A, Intel Arc 8-Core iGPU Ultra 7 155H | Geekom A5, AMD Radeon RX Vega 8 (Ryzen 4000/5000) R7 5800H | Average of class Mini PC | |
|---|---|---|---|---|---|---|---|
| SPECviewperf 2020 | 236% | -8% | 217% | 1% | 83% | 435% | |
| 3840x2160 Medical (medical-03) (fps) | 5.87 | 12.7 116% | 4.8 -18% | 10.7 82% | 5.05 -14% | 4.82 -18% | 23.9 ? 307% |
| 3840x2160 Energy (energy-03) (fps) | 3.81 | 14.4 278% | 3.38 -11% | 10.6 178% | 4.61 21% | 5.33 40% | 35.7 ? 837% |
| 3840x2160 Creo (creo-03) (fps) | 15.3 | 30.2 97% | 15.4 1% | 32 109% | 17.9 17% | 19.1 25% | 51.4 ? 236% |
| 3840x2160 CATIA (catia-06) (fps) | 10.4 | 23.7 128% | 9.7 -7% | 22.8 119% | 10 -4% | 13.1 26% | 36.2 ? 248% |
| 3840x2160 3ds Max (3dsmax-07) (fps) | 14.5 | 20.7 43% | 13.2 -9% | 18.9 30% | 12.9 -11% | 11.3 -22% | 58.2 ? 301% |
| 3840x2160 Siemens NX (snx-04) (fps) | 5.82 | 61.3 953% | 5.54 -5% | 61.4 955% | 5.7 -2% | 38 553% | 51.8 ? 790% |
| 3840x2160 Maya (maya-06) (fps) | 34.7 | 47.4 37% | 32.8 -5% | 49.7 43% | 35.4 2% | 25.8 -26% | 148.2 ? 327% |
| 3DMark 05 Standard | 48550 points | |
| 3DMark 06 Standard Score | 40475 points | |
| 3DMark Vantage P Result | 39395 points | |
| 3DMark 11 Performance | 11870 points | |
| 3DMark Ice Storm Standard Score | 126152 points | |
| 3DMark Cloud Gate Standard Score | 29960 points | |
| 3DMark Fire Strike Score | 7302 points | |
| 3DMark Fire Strike Extreme Score | 3819 points | |
| 3DMark Time Spy Score | 3540 points | |
| 3DMark Steel Nomad Score | 699 points | |
| 3DMark Steel Nomad Light Score | 2798 points | |
Help | ||
Gaming performance
The Asus NUC 14 Pro is only suitable for modern games to a limited extent. Compared to the older Intel Iris Xe G7 with 96 EUs, however, the gaming performance can improve noticeably. Intel loses the duel with AMD's iGPU more clearly than in the synthetic tests in terms of 3D performance. In order to better classify the performance of the iGPU, we refer to our GPU game list.
| GTA V | |
| 1024x768 Lowest Settings possible | |
| Geekom AE7 | |
| Acemagic F2A | |
| Asus NUC 14 Pro | |
| Aoostar GEM10 | |
| Geekom A5 | |
| Minisforum UH125 Pro | |
| 1920x1080 High/On (Advanced Graphics Off) AA:2xMSAA + FX AF:8x | |
| Geekom AE7 | |
| Aoostar GEM10 | |
| Asus NUC 14 Pro | |
| Minisforum UH125 Pro | |
| Geekom A5 | |
| Acemagic F2A | |
| Dota 2 Reborn | |
| 1280x720 min (0/3) fastest | |
| Geekom AE7 | |
| Geekom A5 | |
| Aoostar GEM10 | |
| Acemagic F2A | |
| Asus NUC 14 Pro | |
| Minisforum UH125 Pro | |
| 1920x1080 high (2/3) | |
| Geekom AE7 | |
| Aoostar GEM10 | |
| Acemagic F2A | |
| Asus NUC 14 Pro | |
| Minisforum UH125 Pro | |
| Geekom A5 | |
| Cyberpunk 2077 | |
| 1920x1080 Low Preset (FSR off) | |
| Geekom AE7 | |
| Aoostar GEM10 | |
| Asus NUC 14 Pro | |
| Acemagic F2A | |
| Minisforum UH125 Pro | |
| Geekom A5 | |
| 1920x1080 High Preset (FSR off) | |
| Geekom AE7 | |
| Asus NUC 14 Pro | |
| Aoostar GEM10 | |
| Minisforum UH125 Pro | |
| Acemagic F2A | |
| Geekom A5 | |
| Baldur's Gate 3 | |
| 1280x720 Low Preset AA:SM | |
| Geekom AE7 | |
| Asus NUC 14 Pro | |
| Aoostar GEM10 | |
| Minisforum UH125 Pro | |
| Geekom A5 | |
| 1920x1080 High Preset AA:T | |
| Geekom AE7 | |
| Aoostar GEM10 | |
| Asus NUC 14 Pro | |
| Minisforum UH125 Pro | |
| Geekom A5 | |
| F1 24 | |
| 1920x1080 Low Preset AA:T AF:16x | |
| Geekom AE7 | |
| Aoostar GEM10 | |
| Acemagic F2A | |
| Asus NUC 14 Pro | |
| Minisforum UH125 Pro | |
| Geekom A5 | |
| 1920x1080 High Preset AA:T AF:16x | |
| Geekom AE7 | |
| Acemagic F2A | |
| Aoostar GEM10 | |
| Asus NUC 14 Pro | |
| Minisforum UH125 Pro | |
| Geekom A5 | |
FPS chart
| low | med. | high | ultra | |
|---|---|---|---|---|
| GTA V (2015) | 156.3 | 148.8 | 39.9 | 16.6 |
| Dota 2 Reborn (2015) | 97.1 | 79.2 | 75.9 | 72.9 |
| Final Fantasy XV Benchmark (2018) | 60.6 | 35.4 | 25.3 | |
| X-Plane 11.11 (2018) | 47.5 | 38.5 | 32.9 | |
| Baldur's Gate 3 (2023) | 33.5 | 25.9 | 22.4 | 21.5 |
| Cyberpunk 2077 (2023) | 30.1 | 25.2 | 21.7 | 19.6 |
| F1 24 (2024) | 66.2 | 57.6 | 43.4 |
Asus NUC 14 Pro performance check with an Nvidia GeForce RTX 3060 Ti
The 3D performance can be noticeably improved with an external graphics card. However, external 3D accelerators can only be connected via USB-C. Without influencing the overall rating, we conducted some tests in combination with the Razer Core X and an Nvidia GeForce RTX 3060 Ti. We consistently see an improvement in 3D performance, and even modern games can now be played without any problems. In comparison with the Minisforum UH125 Pro, the Asus NUC 14 Pro delivers an identical performance.
| Performance rating - Percent | |
| Geekom XT13 Pro (Nvidia GeForce RTX 3060 Ti FE) | |
| Geekom AX8 Pro (Nvidia GeForce RTX 3060 Ti FE) | |
| Asus NUC 14 Pro (Nvidia GeForce RTX 3060 Ti FE) | |
| Minisforum UH125 Pro (Nvidia GeForce RTX 3060 Ti FE) | |
| 3DMark 11 - 1280x720 Performance GPU | |
| Geekom AX8 Pro (Nvidia GeForce RTX 3060 Ti FE) | |
| Geekom XT13 Pro (Nvidia GeForce RTX 3060 Ti FE) | |
| Minisforum UH125 Pro (Nvidia GeForce RTX 3060 Ti FE) | |
| Asus NUC 14 Pro (Nvidia GeForce RTX 3060 Ti FE) | |
| 3DMark | |
| 2560x1440 Time Spy Graphics | |
| Geekom AX8 Pro (Nvidia GeForce RTX 3060 Ti FE) | |
| Geekom XT13 Pro (Nvidia GeForce RTX 3060 Ti FE) | |
| Minisforum UH125 Pro (Nvidia GeForce RTX 3060 Ti FE) | |
| Asus NUC 14 Pro (Nvidia GeForce RTX 3060 Ti FE) | |
| 1920x1080 Fire Strike Graphics | |
| Geekom AX8 Pro (Nvidia GeForce RTX 3060 Ti FE) | |
| Geekom XT13 Pro (Nvidia GeForce RTX 3060 Ti FE) | |
| Minisforum UH125 Pro (Nvidia GeForce RTX 3060 Ti FE) | |
| Asus NUC 14 Pro (Nvidia GeForce RTX 3060 Ti FE) | |
| 3840x2160 Fire Strike Ultra Graphics | |
| Geekom AX8 Pro (Nvidia GeForce RTX 3060 Ti FE) | |
| Geekom XT13 Pro (Nvidia GeForce RTX 3060 Ti FE) | |
| Asus NUC 14 Pro (Nvidia GeForce RTX 3060 Ti FE) | |
| Minisforum UH125 Pro (Nvidia GeForce RTX 3060 Ti FE) | |
| Unigine Superposition | |
| 1280x720 720p Low | |
| Geekom AX8 Pro (Nvidia GeForce RTX 3060 Ti FE) | |
| Geekom XT13 Pro (Nvidia GeForce RTX 3060 Ti FE) | |
| Asus NUC 14 Pro (Nvidia GeForce RTX 3060 Ti FE) | |
| Minisforum UH125 Pro (Nvidia GeForce RTX 3060 Ti FE) | |
| 1920x1080 1080p High | |
| Geekom AX8 Pro (Nvidia GeForce RTX 3060 Ti FE) | |
| Geekom XT13 Pro (Nvidia GeForce RTX 3060 Ti FE) | |
| Asus NUC 14 Pro (Nvidia GeForce RTX 3060 Ti FE) | |
| Minisforum UH125 Pro (Nvidia GeForce RTX 3060 Ti FE) | |
| 1920x1080 1080p Extreme | |
| Geekom AX8 Pro (Nvidia GeForce RTX 3060 Ti FE) | |
| Asus NUC 14 Pro (Nvidia GeForce RTX 3060 Ti FE) | |
| Geekom XT13 Pro (Nvidia GeForce RTX 3060 Ti FE) | |
| Minisforum UH125 Pro (Nvidia GeForce RTX 3060 Ti FE) | |
| 3840x2160 4k Optimized | |
| Geekom XT13 Pro (Nvidia GeForce RTX 3060 Ti FE) | |
| Asus NUC 14 Pro (Nvidia GeForce RTX 3060 Ti FE) | |
| Geekom AX8 Pro (Nvidia GeForce RTX 3060 Ti FE) | |
| Minisforum UH125 Pro (Nvidia GeForce RTX 3060 Ti FE) | |
| 7680x4320 8k Optimized | |
| Geekom XT13 Pro (Nvidia GeForce RTX 3060 Ti FE) | |
| Geekom AX8 Pro (Nvidia GeForce RTX 3060 Ti FE) | |
| Minisforum UH125 Pro (Nvidia GeForce RTX 3060 Ti FE) | |
| Asus NUC 14 Pro (Nvidia GeForce RTX 3060 Ti FE) | |
| Unigine Valley 1.0 | |
| 1920x1080 Extreme HD DirectX AA:x8 | |
| Geekom XT13 Pro (Nvidia GeForce RTX 3060 Ti FE) | |
| Geekom AX8 Pro (Nvidia GeForce RTX 3060 Ti FE) | |
| Asus NUC 14 Pro (Nvidia GeForce RTX 3060 Ti FE) | |
| Minisforum UH125 Pro (Nvidia GeForce RTX 3060 Ti FE) | |
| 1920x1080 Extreme HD Preset OpenGL AA:x8 | |
| Geekom XT13 Pro (Nvidia GeForce RTX 3060 Ti FE) | |
| Geekom AX8 Pro (Nvidia GeForce RTX 3060 Ti FE) | |
| Asus NUC 14 Pro (Nvidia GeForce RTX 3060 Ti FE) | |
| Minisforum UH125 Pro (Nvidia GeForce RTX 3060 Ti FE) | |
| Unigine Heaven 4.0 | |
| Extreme Preset OpenGL | |
| Geekom AX8 Pro (Nvidia GeForce RTX 3060 Ti FE) | |
| Geekom XT13 Pro (Nvidia GeForce RTX 3060 Ti FE) | |
| Asus NUC 14 Pro (Nvidia GeForce RTX 3060 Ti FE) | |
| Minisforum UH125 Pro (Nvidia GeForce RTX 3060 Ti FE) | |
| Extreme Preset DX11 | |
| Geekom XT13 Pro (Nvidia GeForce RTX 3060 Ti FE) | |
| Geekom AX8 Pro (Nvidia GeForce RTX 3060 Ti FE) | |
| Minisforum UH125 Pro (Nvidia GeForce RTX 3060 Ti FE) | |
| Asus NUC 14 Pro (Nvidia GeForce RTX 3060 Ti FE) | |
| ComputeMark v2.1 | |
| 1024x600 Normal, Score | |
| Geekom XT13 Pro (Nvidia GeForce RTX 3060 Ti FE) | |
| Asus NUC 14 Pro (Nvidia GeForce RTX 3060 Ti FE) | |
| Minisforum UH125 Pro (Nvidia GeForce RTX 3060 Ti FE) | |
| Geekom AX8 Pro (Nvidia GeForce RTX 3060 Ti FE) | |
| 1024x600 Normal, Fluid 3DTex | |
| Minisforum UH125 Pro (Nvidia GeForce RTX 3060 Ti FE) | |
| Geekom AX8 Pro (Nvidia GeForce RTX 3060 Ti FE) | |
| Geekom XT13 Pro (Nvidia GeForce RTX 3060 Ti FE) | |
| Asus NUC 14 Pro (Nvidia GeForce RTX 3060 Ti FE) | |
| 1024x600 Normal, Fluid 2DTexArr | |
| Minisforum UH125 Pro (Nvidia GeForce RTX 3060 Ti FE) | |
| Geekom AX8 Pro (Nvidia GeForce RTX 3060 Ti FE) | |
| Geekom XT13 Pro (Nvidia GeForce RTX 3060 Ti FE) | |
| Asus NUC 14 Pro (Nvidia GeForce RTX 3060 Ti FE) | |
| 1024x600 Normal, Mandel Vector | |
| Geekom XT13 Pro (Nvidia GeForce RTX 3060 Ti FE) | |
| Asus NUC 14 Pro (Nvidia GeForce RTX 3060 Ti FE) | |
| Minisforum UH125 Pro (Nvidia GeForce RTX 3060 Ti FE) | |
| Geekom AX8 Pro (Nvidia GeForce RTX 3060 Ti FE) | |
| 1024x600 Normal, Mandel Scalar | |
| Geekom XT13 Pro (Nvidia GeForce RTX 3060 Ti FE) | |
| Asus NUC 14 Pro (Nvidia GeForce RTX 3060 Ti FE) | |
| Minisforum UH125 Pro (Nvidia GeForce RTX 3060 Ti FE) | |
| Geekom AX8 Pro (Nvidia GeForce RTX 3060 Ti FE) | |
| 1024x600 Normal, QJuliaRayTrace | |
| Geekom XT13 Pro (Nvidia GeForce RTX 3060 Ti FE) | |
| Asus NUC 14 Pro (Nvidia GeForce RTX 3060 Ti FE) | |
| Minisforum UH125 Pro (Nvidia GeForce RTX 3060 Ti FE) | |
| Geekom AX8 Pro (Nvidia GeForce RTX 3060 Ti FE) | |
| Performance rating - Percent | |
| Geekom AX8 Pro (Nvidia GeForce RTX 3060 Ti FE) | |
| Geekom XT13 Pro (Nvidia GeForce RTX 3060 Ti FE) | |
| Minisforum UH125 Pro (Nvidia GeForce RTX 3060 Ti FE) | |
| Asus NUC 14 Pro (Nvidia GeForce RTX 3060 Ti FE) | |
| Cyberpunk 2077 | |
| 1280x720 Low Preset (FSR off) | |
| Geekom AX8 Pro (Nvidia GeForce RTX 3060 Ti FE) | |
| Geekom XT13 Pro (Nvidia GeForce RTX 3060 Ti FE) | |
| Asus NUC 14 Pro (Nvidia GeForce RTX 3060 Ti FE) | |
| Minisforum UH125 Pro (Nvidia GeForce RTX 3060 Ti FE) | |
| 1920x1080 Medium Preset (FSR off) | |
| Geekom AX8 Pro (Nvidia GeForce RTX 3060 Ti FE) | |
| Geekom XT13 Pro (Nvidia GeForce RTX 3060 Ti FE) | |
| Minisforum UH125 Pro (Nvidia GeForce RTX 3060 Ti FE) | |
| Asus NUC 14 Pro (Nvidia GeForce RTX 3060 Ti FE) | |
| 1920x1080 Ultra Preset (FSR off) | |
| Geekom XT13 Pro (Nvidia GeForce RTX 3060 Ti FE) | |
| Geekom AX8 Pro (Nvidia GeForce RTX 3060 Ti FE) | |
| Minisforum UH125 Pro (Nvidia GeForce RTX 3060 Ti FE) | |
| Asus NUC 14 Pro (Nvidia GeForce RTX 3060 Ti FE) | |
| Baldur's Gate 3 | |
| 1920x1080 Low Preset AA:SM | |
| Geekom XT13 Pro (Nvidia GeForce RTX 3060 Ti FE) | |
| Asus NUC 14 Pro (Nvidia GeForce RTX 3060 Ti FE) | |
| Geekom AX8 Pro (Nvidia GeForce RTX 3060 Ti FE) | |
| Minisforum UH125 Pro (Nvidia GeForce RTX 3060 Ti FE) | |
| 1920x1080 Medium Preset AA:T | |
| Geekom XT13 Pro (Nvidia GeForce RTX 3060 Ti FE) | |
| Geekom AX8 Pro (Nvidia GeForce RTX 3060 Ti FE) | |
| Minisforum UH125 Pro (Nvidia GeForce RTX 3060 Ti FE) | |
| Asus NUC 14 Pro (Nvidia GeForce RTX 3060 Ti FE) | |
| 1920x1080 Ultra Preset AA:T | |
| Geekom XT13 Pro (Nvidia GeForce RTX 3060 Ti FE) | |
| Geekom AX8 Pro (Nvidia GeForce RTX 3060 Ti FE) | |
| Minisforum UH125 Pro (Nvidia GeForce RTX 3060 Ti FE) | |
| Asus NUC 14 Pro (Nvidia GeForce RTX 3060 Ti FE) | |
| F1 24 | |
| 1920x1080 Low Preset AA:T AF:16x | |
| Geekom AX8 Pro (Nvidia GeForce RTX 3060 Ti FE) | |
| Geekom XT13 Pro (Nvidia GeForce RTX 3060 Ti FE) | |
| Asus NUC 14 Pro (Nvidia GeForce RTX 3060 Ti FE) | |
| Minisforum UH125 Pro (Nvidia GeForce RTX 3060 Ti FE) | |
| 1920x1080 Medium Preset AA:T AF:16x | |
| Geekom AX8 Pro (Nvidia GeForce RTX 3060 Ti FE) | |
| Geekom XT13 Pro (Nvidia GeForce RTX 3060 Ti FE) | |
| Asus NUC 14 Pro (Nvidia GeForce RTX 3060 Ti FE) | |
| Minisforum UH125 Pro (Nvidia GeForce RTX 3060 Ti FE) | |
| 1920x1080 High Preset AA:T AF:16x | |
| Geekom AX8 Pro (Nvidia GeForce RTX 3060 Ti FE) | |
| Geekom XT13 Pro (Nvidia GeForce RTX 3060 Ti FE) | |
| Asus NUC 14 Pro (Nvidia GeForce RTX 3060 Ti FE) | |
| Minisforum UH125 Pro (Nvidia GeForce RTX 3060 Ti FE) | |
| Asus NUC 14 Pro (Nvidia GeForce RTX 3060 Ti FE), Ultra 5 125H | Minisforum UH125 Pro (Nvidia GeForce RTX 3060 Ti FE), Ultra 5 125H | Geekom AX8 Pro (Nvidia GeForce RTX 3060 Ti FE), R9 8945HS | Geekom XT13 Pro (Nvidia GeForce RTX 3060 Ti FE), i9-13900H | Average of class Mini PC | |
|---|---|---|---|---|---|
| SPECviewperf 2020 | 290% | 126% | 304% | 300% | 435% |
| 3840x2160 Medical (medical-03) (fps) | 13 121% | 10.9 86% | 13 121% | 13 121% | 23.9 ? 307% |
| 3840x2160 Energy (energy-03) (fps) | 20.9 449% | 17.8 367% | 21 451% | 20.9 449% | 35.7 ? 837% |
| 3840x2160 Creo (creo-03) (fps) | 68.3 346% | 26.6 74% | 77.2 405% | 74.2 385% | 51.4 ? 236% |
| 3840x2160 CATIA (catia-06) (fps) | 37.3 259% | 23.6 127% | 39.2 277% | 39.4 279% | 36.2 ? 248% |
| 3840x2160 3ds Max (3dsmax-07) (fps) | 46.5 221% | 28.7 98% | 46.1 218% | 47.2 226% | 58.2 ? 301% |
| 3840x2160 Siemens NX (snx-04) (fps) | 16.2 178% | 11.4 96% | 16.7 187% | 16.5 184% | 51.8 ? 790% |
| 3840x2160 Maya (maya-06) (fps) | 193 456% | 47.5 37% | 198 471% | 194 459% | 148.2 ? 327% |
| low | med. | high | ultra | QHD | 4K | |
|---|---|---|---|---|---|---|
| GTA V (2015) | 178.7 | 174 | 162.9 | 100.6 | 90 | 102.6 |
| Dota 2 Reborn (2015) | 159 | 138.8 | 131 | 122.6 | 104.3 | |
| Final Fantasy XV Benchmark (2018) | 163.8 | 141 | 97.3 | 75.6 | 47.4 | |
| X-Plane 11.11 (2018) | 119.6 | 107.5 | 83.7 | 71.7 | ||
| Baldur's Gate 3 (2023) | 111.6 | 86 | 72.8 | 72.1 | 57.5 | 36.4 |
| Cyberpunk 2077 (2023) | 72.4 | 69.8 | 63.7 | 58.3 | 43.5 | 22.2 |
| F1 24 (2024) | 75.3 | 71.7 | 59.5 | 41.1 | 35.7 | 16.9 |
Emissions
Noise emissions
The Asus NUC 14 Pro is very quiet most of the time. However, the fan also works in idle mode, so operation is not silent. Under average load, we recorded a sound pressure level of 42.4 dB(A). The Minisforum UH125 Pro and the Aoostar GEM10 are at roughly the same level. At maximum load, our test sample reaches 47.8 dB(A). This means that the Asus NUC 14 Pro is clearly audible, although the subjective perception of the noise level is somewhat lower.
Noise level
| Idle |
| 26 / 26.2 / 26.2 dB(A) |
| Load |
| 42.4 / 47.8 dB(A) |
 | ||
30 dB silent 40 dB(A) audible 50 dB(A) loud |
||
min: | ||
| Asus NUC 14 Pro Ultra 5 125H, Arc 7-Core | Geekom AE7 R9 7940HS, Radeon 780M | Minisforum UH125 Pro Ultra 5 125H, Arc 7-Core | Aoostar GEM10 R7 6800H, Radeon 680M | Acemagic F2A Ultra 7 155H, Arc 8-Core | Geekom A5 R7 5800H, Vega 8 | |
|---|---|---|---|---|---|---|
| Noise | -4% | -12% | -13% | -2% | -7% | |
| off / environment * (dB) | 24 | 24.4 -2% | 24.8 -3% | 24.3 -1% | 24.9 -4% | 25 -4% |
| Idle Minimum * (dB) | 26 | 24.9 4% | 35 -35% | 36.5 -40% | 25.4 2% | 28.2 -8% |
| Idle Average * (dB) | 26.2 | 25 5% | 35 -34% | 36.6 -40% | 25.7 2% | 28.2 -8% |
| Idle Maximum * (dB) | 26.2 | 25 5% | 35 -34% | 36.6 -40% | 25.7 2% | 28.2 -8% |
| Load Average * (dB) | 42.4 | 52 -23% | 42.2 -0% | 41.7 2% | 47.8 -13% | 47.8 -13% |
| Cyberpunk 2077 ultra * (dB) | 47.7 | 52 -9% | 40.8 14% | 40.3 16% | ||
| Load Maximum * (dB) | 47.8 | 51.4 -8% | 43.9 8% | 40.8 15% | 49 -3% | 47.4 1% |
| Witcher 3 ultra * (dB) | 40.18 | 45.23 |
* ... smaller is better
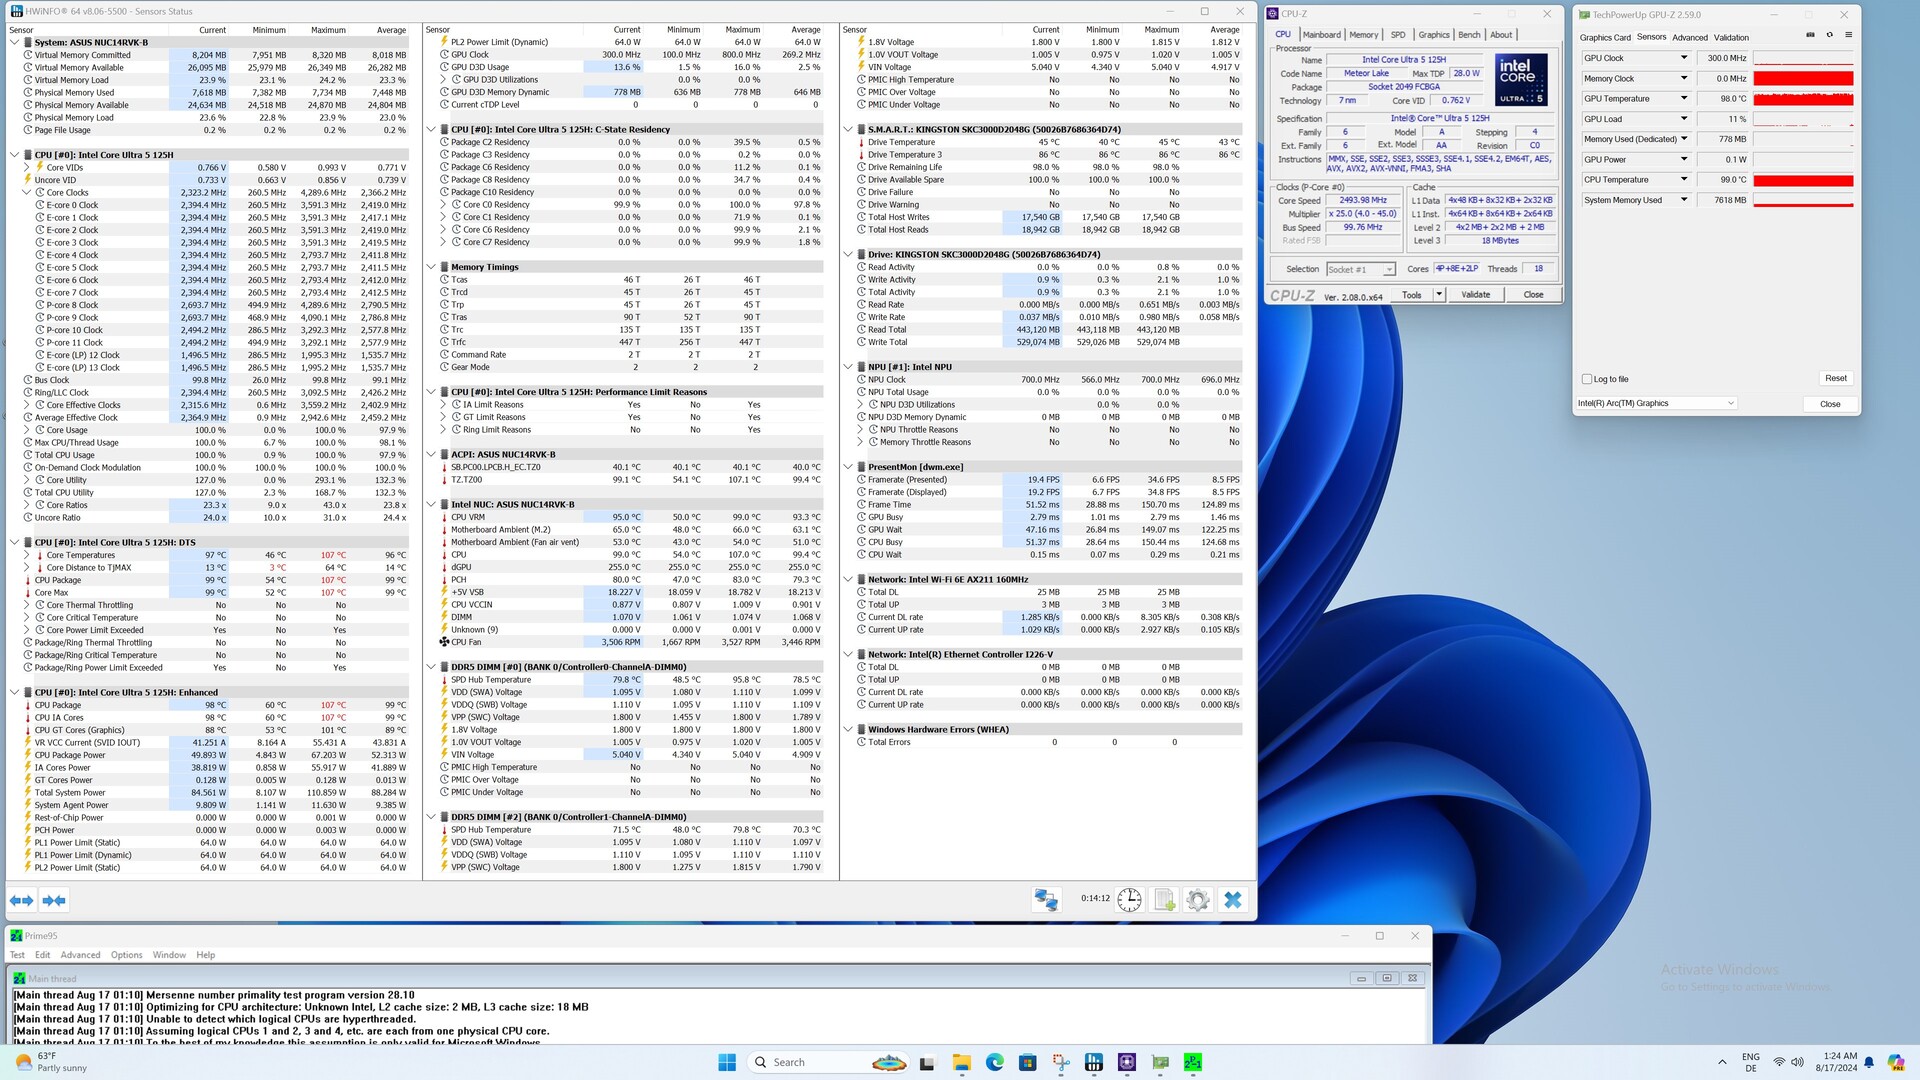
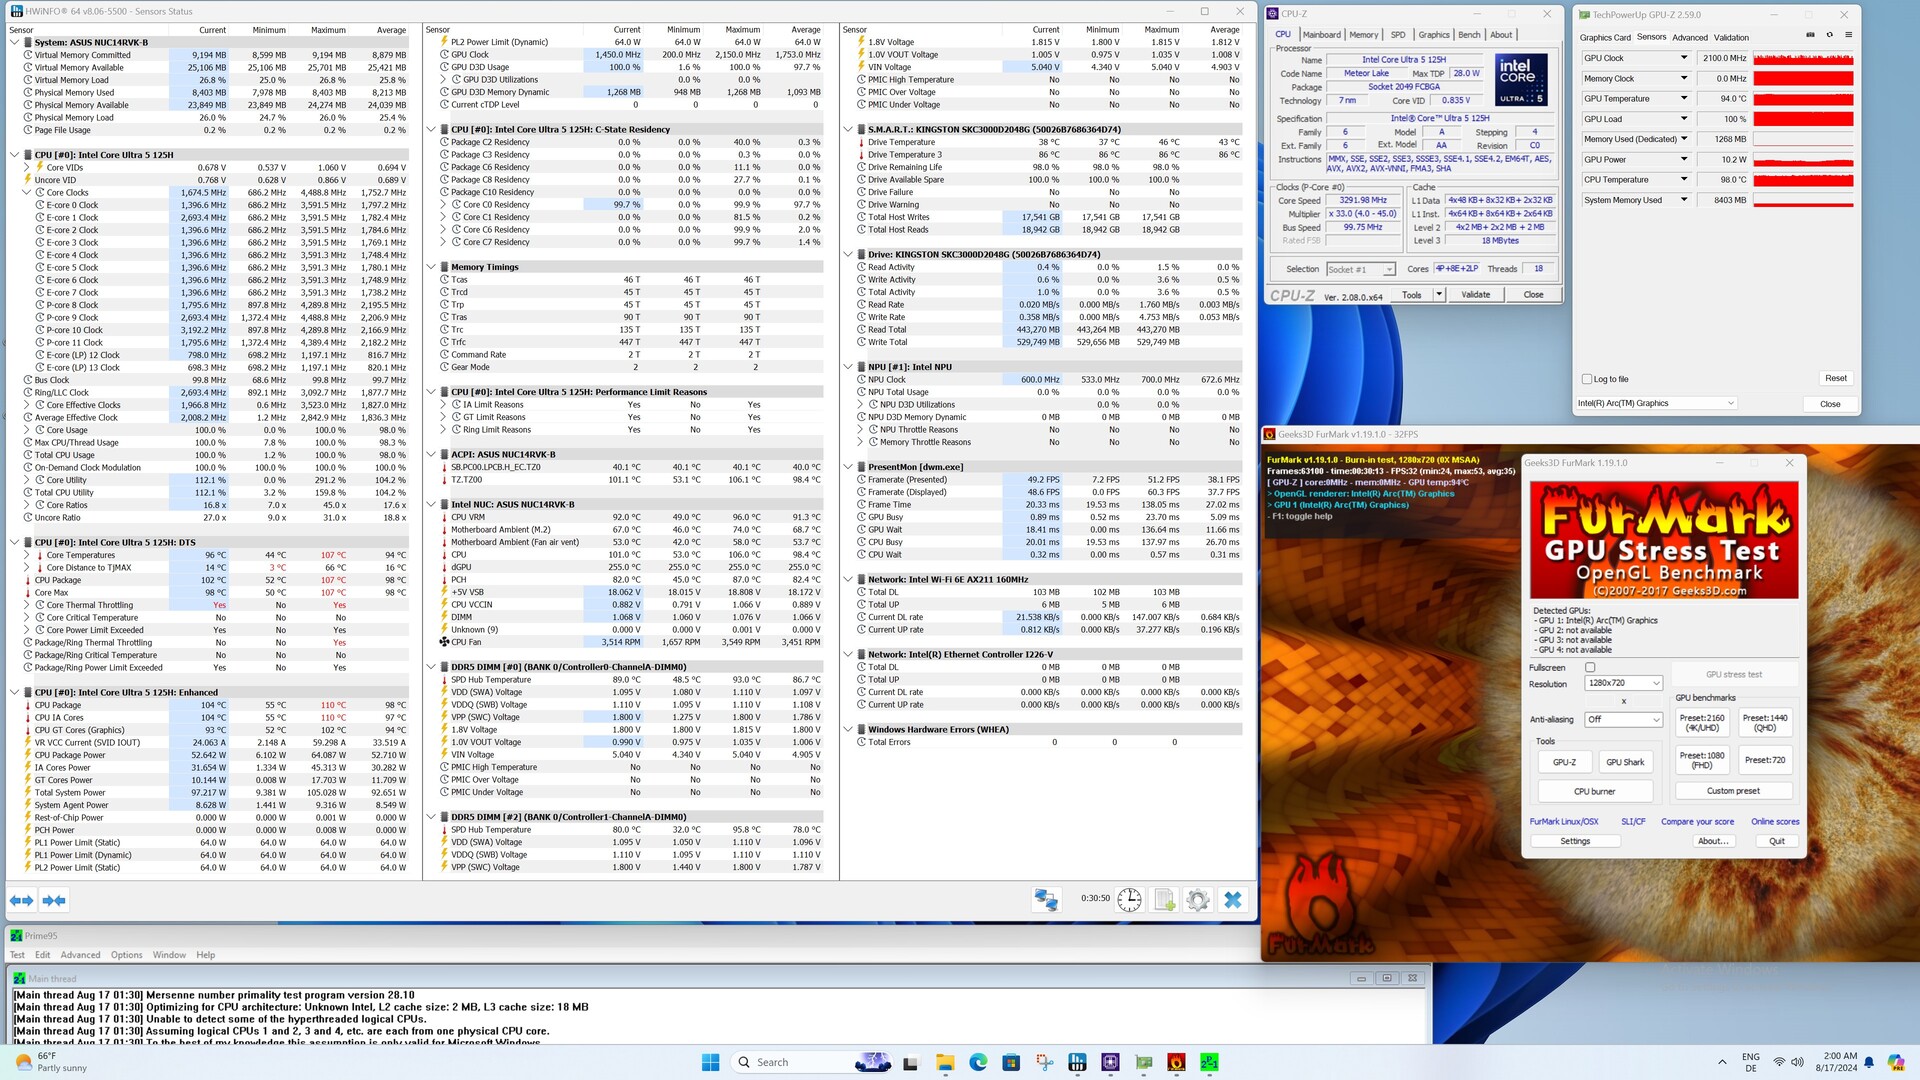
Temperature
The case of the Asus NUC 14 Pro heats up considerably in places under load. We recorded a maximum of 55.1 °C on the top. There are no noticeable abnormalities in idle mode. We easily reached values above the 100 °C mark for the SoC in the stress test. According to Intel, the Intel Core Ultra 5 125H is designed for an operating temperature of up to 110 °C. We achieved this in the stress test, although the power consumption was reduced to around 50 watts as a result. The cooling system is not capable of permanently dissipating the 64 watts defined as PL1 and PL2.


(-) The maximum temperature on the upper side is 55.1 °C / 131 F, compared to the average of 35.4 °C / 96 F, ranging from 20.6 to 69.5 °C for the class Mini PC.
(+) The bottom heats up to a maximum of 39.3 °C / 103 F, compared to the average of 36.1 °C / 97 F
(+) In idle usage, the average temperature for the upper side is 30.8 °C / 87 F, compared to the device average of 32.1 °C / 90 F.
Power consumtion
Asus has the power consumption of the NUC 14 Pro relatively well under control. Under average load, our test sample only requires 55.5 watts, which is a little more than the Miniforum UH125 Pro. The reason for this is the slightly higher power limit that Asus imposes on the SoC. We briefly recorded 103.3 watts, which the 120-watt power supply easily copes with.

| Off / Standby | |
| Idle | |
| Load |
|
Key:
min: | |
| Asus NUC 14 Pro Ultra 5 125H, Arc 7-Core | Geekom AE7 R9 7940HS, Radeon 780M | Minisforum UH125 Pro Ultra 5 125H, Arc 7-Core | Aoostar GEM10 R7 6800H, Radeon 680M | Acemagic F2A Ultra 7 155H, Arc 8-Core | Geekom A5 R7 5800H, Vega 8 | Average Intel Arc 7-Core iGPU | Average of class Mini PC | |
|---|---|---|---|---|---|---|---|---|
| Power Consumption | 3% | -38% | -11% | -29% | -3% | -5% | -30% | |
| Idle Minimum * (Watt) | 5.1 | 4.5 12% | 11.9 -133% | 7.3 -43% | 9.1 -78% | 6.9 -35% | 6.79 ? -33% | 8.6 ? -69% |
| Idle Average * (Watt) | 6.4 | 4.7 27% | 14.6 -128% | 8.7 -36% | 10.3 -61% | 7.9 -23% | 9.15 ? -43% | 10.7 ? -67% |
| Idle Maximum * (Watt) | 14.7 | 8.1 45% | 15.4 -5% | 10.4 29% | 14.4 2% | 8.9 39% | 12.4 ? 16% | 13.5 ? 8% |
| Load Average * (Watt) | 55.5 | 81.8 -47% | 48.3 13% | 67.2 -21% | 54.9 1% | 60.8 -10% | 49.9 ? 10% | 63.5 ? -14% |
| Cyberpunk 2077 ultra external monitor * (Watt) | 59.1 | 71.2 -20% | 52.7 11% | 58.8 1% | ||||
| Load Maximum * (Watt) | 103.3 | 100.3 3% | 89.8 13% | 101.6 2% | 110.4 -7% | 89.7 13% | 75.7 ? 27% | 110.7 ? -7% |
* ... smaller is better
Efficiency
| Performance rating - Percent | |
| Geekom AE7 | |
| Minisforum UH125 Pro | |
| Asus NUC 14 Pro | |
| Acemagic F2A | |
| Power Consumption | |
| Cinebench R23 Multi Power Efficiency - external Monitor | |
| Geekom AE7 | |
| Acemagic F2A | |
| Minisforum UH125 Pro | |
| Asus NUC 14 Pro | |
| Cinebench R23 Single Power Efficiency - external Monitor | |
| Asus NUC 14 Pro | |
| Geekom AE7 | |
| Minisforum UH125 Pro | |
| Acemagic F2A | |
| Cinebench R15 Multi Efficiency (external Monitor) | |
| Geekom AE7 | |
| Minisforum UH125 Pro | |
| Acemagic F2A | |
| Asus NUC 14 Pro | |
Power consumtion with the external monitor
Power consumtion with the external monitor
Pros
Cons
Verdict - Business mini PC with extensive BIOS options

The well-known NUC mini PCs, which were once marketed directly by Intel, are now being continued by Asus in the same way. Based on the Meteor Lake processors, the compact PCs get a noticeable performance boost in terms of 3D performance.
Not much has changed in terms of design compared to the familiar NUC mini PCs. An all-metal casing would be desirable, as the Asus NUC 14 Pro is inferior to some of its competitors in this respect. In terms of dimensions, the mini PC is smaller than many other devices. Unfortunately, this design leads to a compromise that all manufacturers have to make. The performance of the SoC must be reliably dissipated. The Asus NUC 14 Pro actually manages this quite well if there are no continuous loads. Asus pushes the temperature limit of the Intel Core Ultra 5 125H which will certainly make some users break out in a sweat. In principle, the processors are designed for these temperature ranges. Meanwhile, the BIOS offers many options which also influence the temperature limit of the processor. A limit can be set manually here. However, slightly lower performance must then be expected. The excellent connectivity should be emphasized positively: many USB ports and two Thunderbolt 4 ports are on board. Fast Wi-Fi and 2.5G LAN are also included.
The Asus NUC 14 Pro is a powerful NUC mini PC. The connectivity is better than most competitors and the extensive BIOS options are also a real selling point.
The price of the Asus NUC 14 Pro is not completely out of the ordinary. At 510 euros, the barebone device is certainly no bargain. However, its competitors can easily cost more than 700 euros including SSD, RAM, and operating system. As a price-performance tip, the Aoostar GEM10 is already available for 459 US dollars.
Note: We have recently updated our rating system and the results of version 8 are not comparable with the results of version 7. Further information can be found here.
Price and availability
The Asus NUC 14 Pro is available in various configurations. The mini PC with Intel Core Ultra 5 125H is currently available for 500 euros. Our test device is listed at Alternate and Notebooksbilliger. The Tall option with the same SoC offers additional space for a 2.5-inch data carrier and can also be ordered from Alternate or Notebooksbilliger. The price here is around 520 euros.
Asus NUC 14 Pro
- 08/26/2024 v8
Sebastian Bade
 Total Sustainability Score:
 Transparency
The selection of devices to be reviewed is made by our editorial team. The test sample was provided to the author as a loan by the manufacturer or retailer for the purpose of this review. The lender had no influence on this review, nor did the manufacturer receive a copy of this review before publication. There was no obligation to publish this review. As an independent media company, Notebookcheck is not subjected to the authority of manufacturers, retailers or publishers.
This is how Notebookcheck is testing
Every year, Notebookcheck independently reviews hundreds of laptops and smartphones using standardized procedures to ensure that all results are comparable. We have continuously developed our test methods for around 20 years and set industry standards in the process. In our test labs, high-quality measuring equipment is utilized by experienced technicians and editors. These tests involve a multi-stage validation process. Our complex rating system is based on hundreds of well-founded measurements and benchmarks, which maintains objectivity. Further information on our test methods can be found here.
Price comparison

