Predator Helios Neo 16 laptop review: Acer has created a gaming chimera
In principle, Acer's Predator Helios Neo 16, a mid-range gaming laptop, is a slimmed-down version of the Predator Helios 16 (Non-Neo). A few of the classic Helio model's features have been kept, meaning it can set itself apart from Acer's entry-level Nitro series.
Even so, a few of its aspects can be classed as entry-level features, such as its installed RTX 4050 — at a price of US$1,069, this is a little questionable. However, the laptop's Intel Core i5-13500HX is a powerful desktop-class CPU which consumes 55 watts. This and a few of its other features wouldn't normally be found in true budget laptops. Furthermore, there are variants with an RTX 4060 or an RTX 4070.
During the course of this review, we will analyze whether this is all enough to make the laptop worth the price. Its main competition comes in the shape of Lenovo's Legion Pro 5, but further competitors include the HP Victus 16, XMG Apex 15 and the Dell G15.
Possible competitors compared
Rating | Date | Model | Weight | Height | Size | Resolution | Price |
|---|---|---|---|---|---|---|---|
| 86.6 % v7 (old) | 11 / 2023 | Acer Predator Helios Neo 16 NH.QLTEG.002 i5-13500HX, GeForce RTX 4050 Laptop GPU | 2.6 kg | 28.25 mm | 16.00" | 1920x1200 | |
| 89 % v7 (old) | 08 / 2023 | Lenovo Legion Pro 5 16ARX8 (R5 7645HX, RTX 4050) R5 7645HX, GeForce RTX 4050 Laptop GPU | 2.5 kg | 27.3 mm | 16.00" | 2560x1600 | |
| 87.3 % v7 (old) | 09 / 2023 | Lenovo LOQ 16IRH8 i7-13620H, GeForce RTX 4060 Laptop GPU | 2.7 kg | 25.9 mm | 16.00" | 2560x1600 | |
| 86.2 % v7 (old) | 10 / 2023 | Schenker XMG Apex 15 (Late 23) R7 7840HS, GeForce RTX 4050 Laptop GPU | 2.2 kg | 26.7 mm | 15.60" | 2560x1440 | |
| 85.6 % v7 (old) | 09 / 2023 | HP Victus 16-r0076TX i5-13500HX, GeForce RTX 4050 Laptop GPU | 2.3 kg | 22.9 mm | 16.10" | 1920x1080 | |
| 84.2 % v7 (old) | 06 / 2023 | Dell G15 5530 i7-13650HX, GeForce RTX 4060 Laptop GPU | 3 kg | 26.95 mm | 15.60" | 1920x1080 |
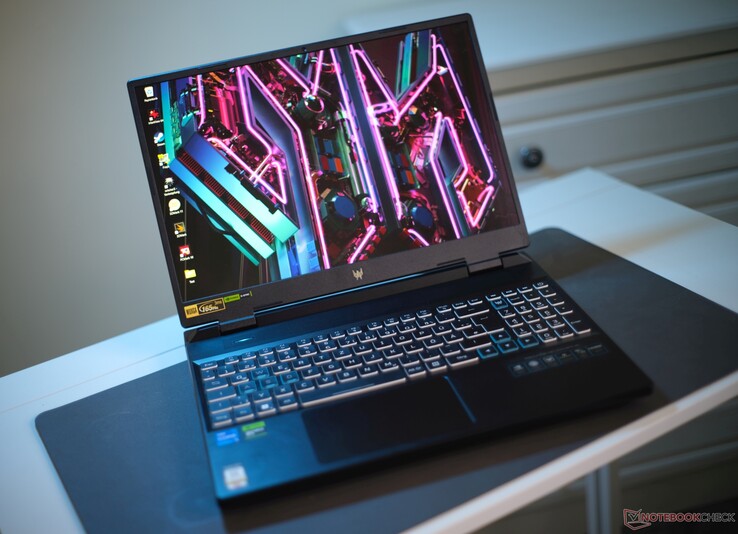
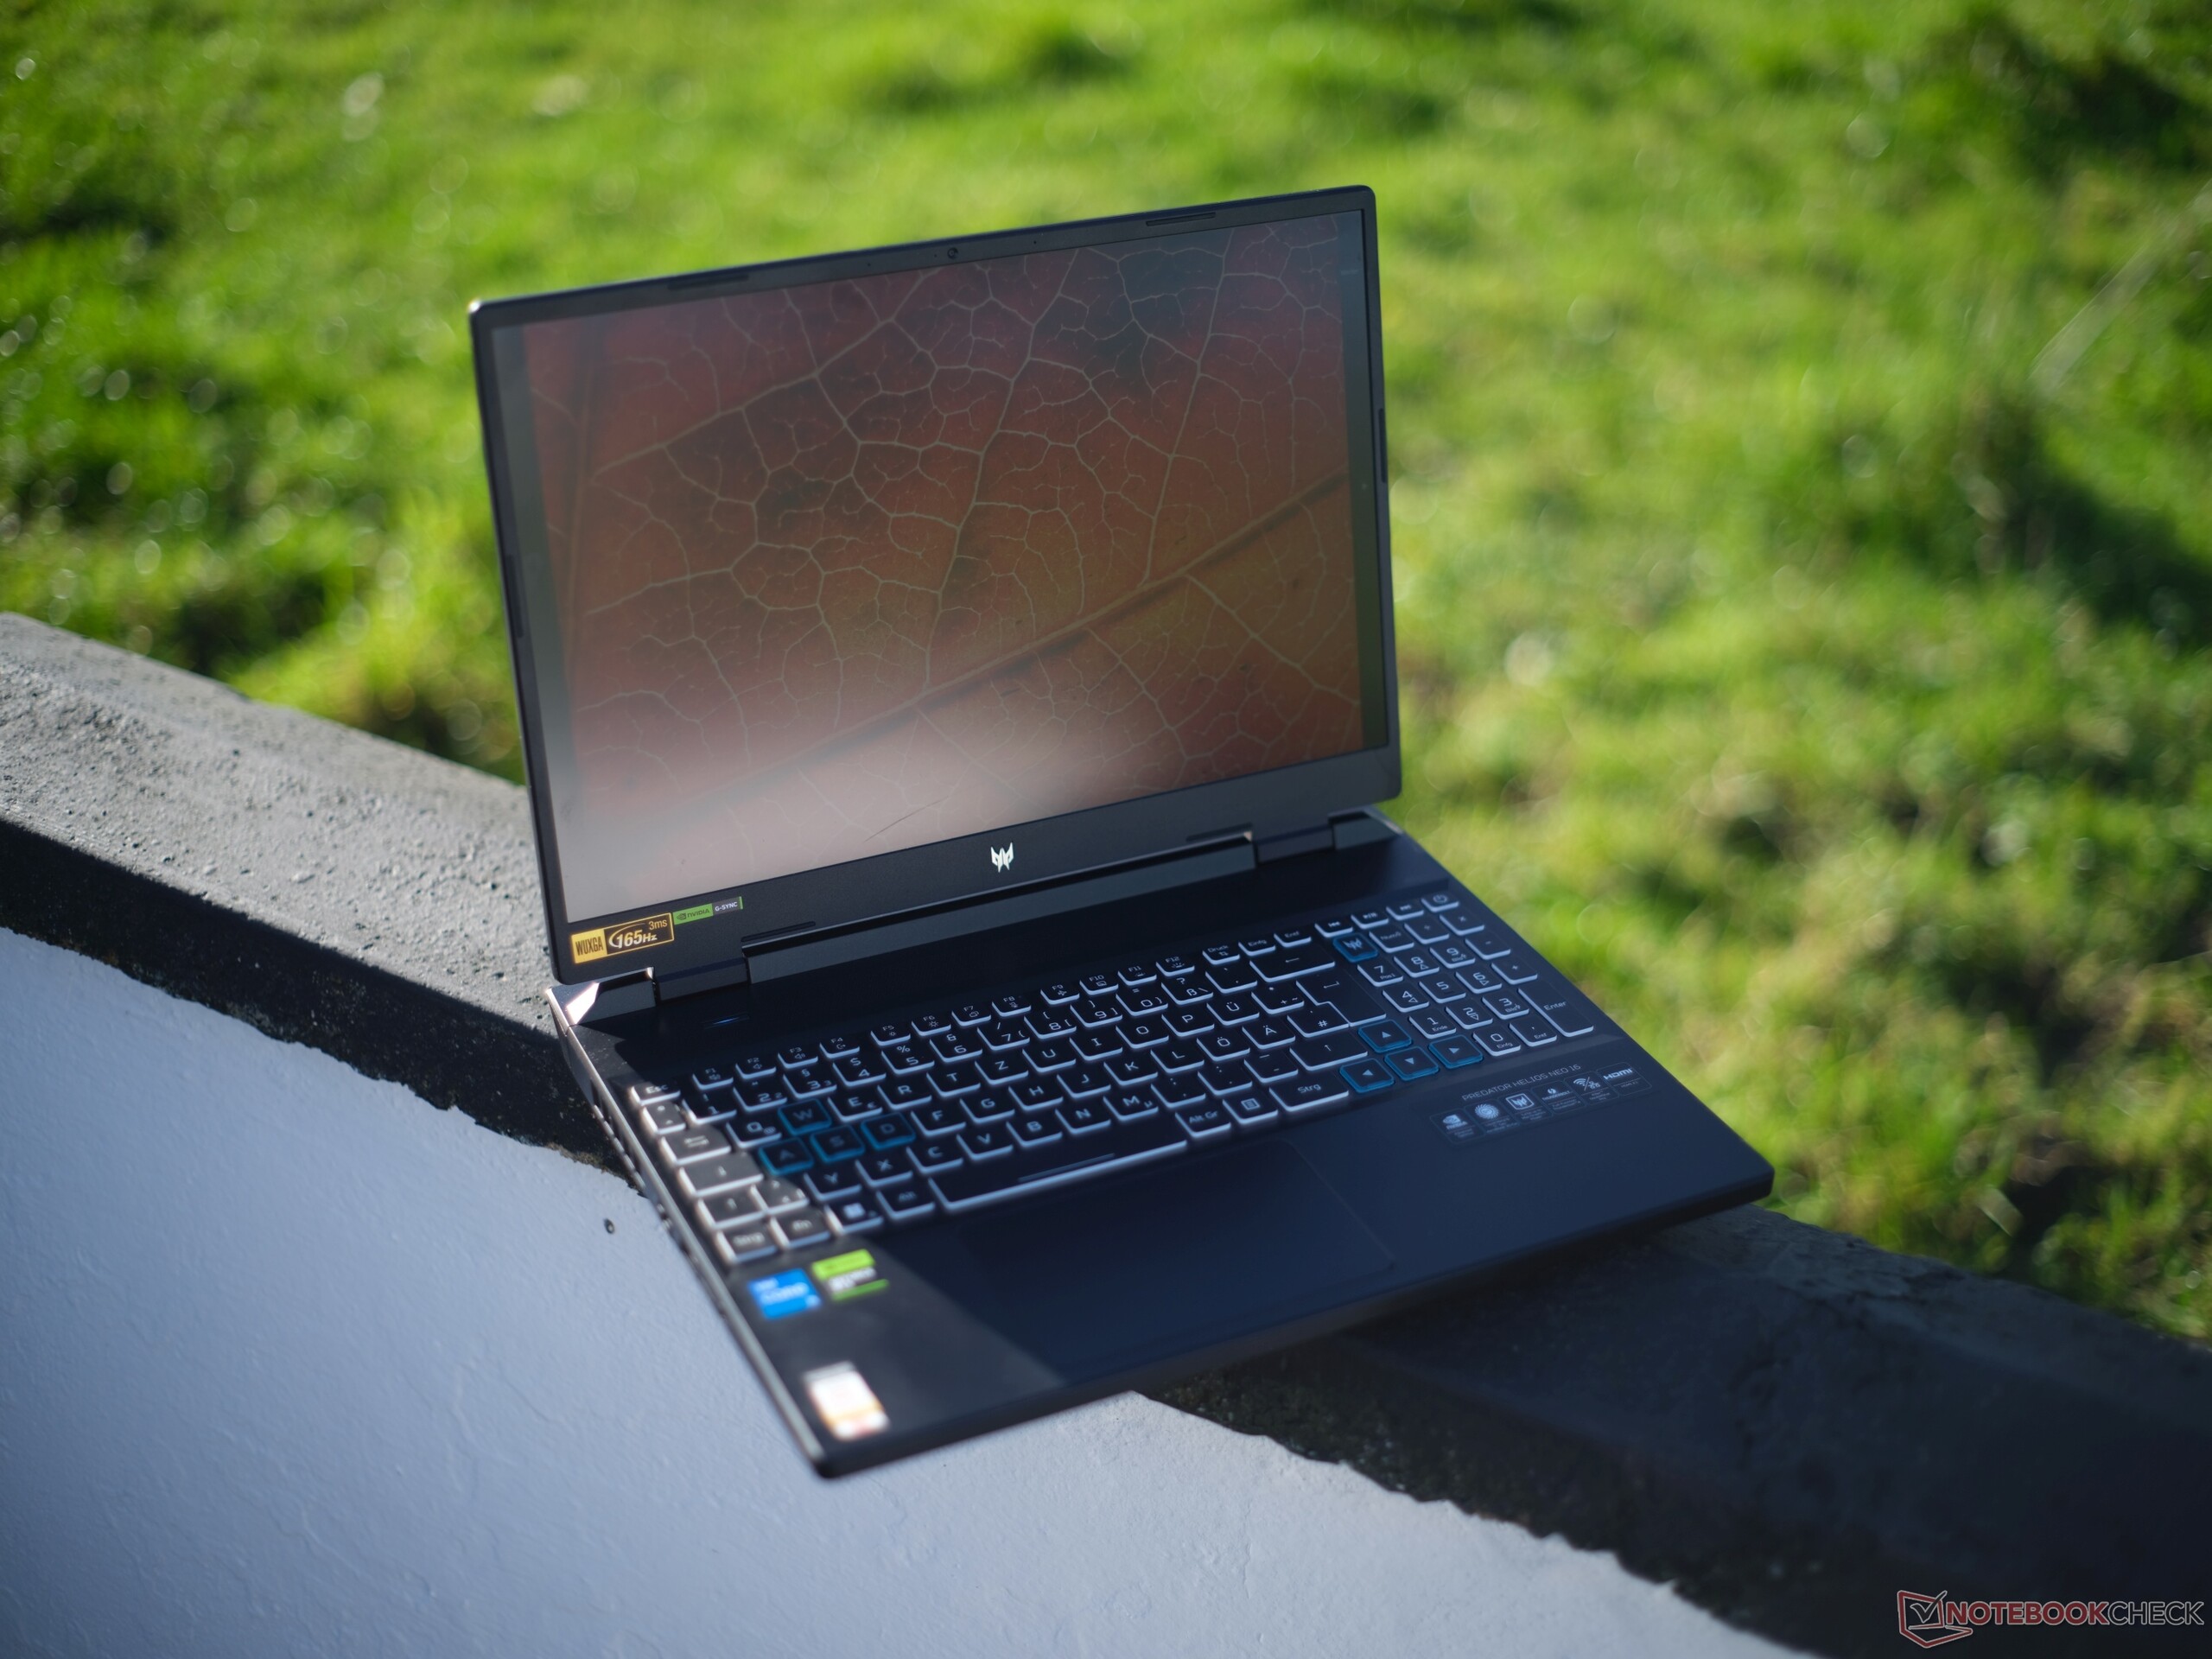
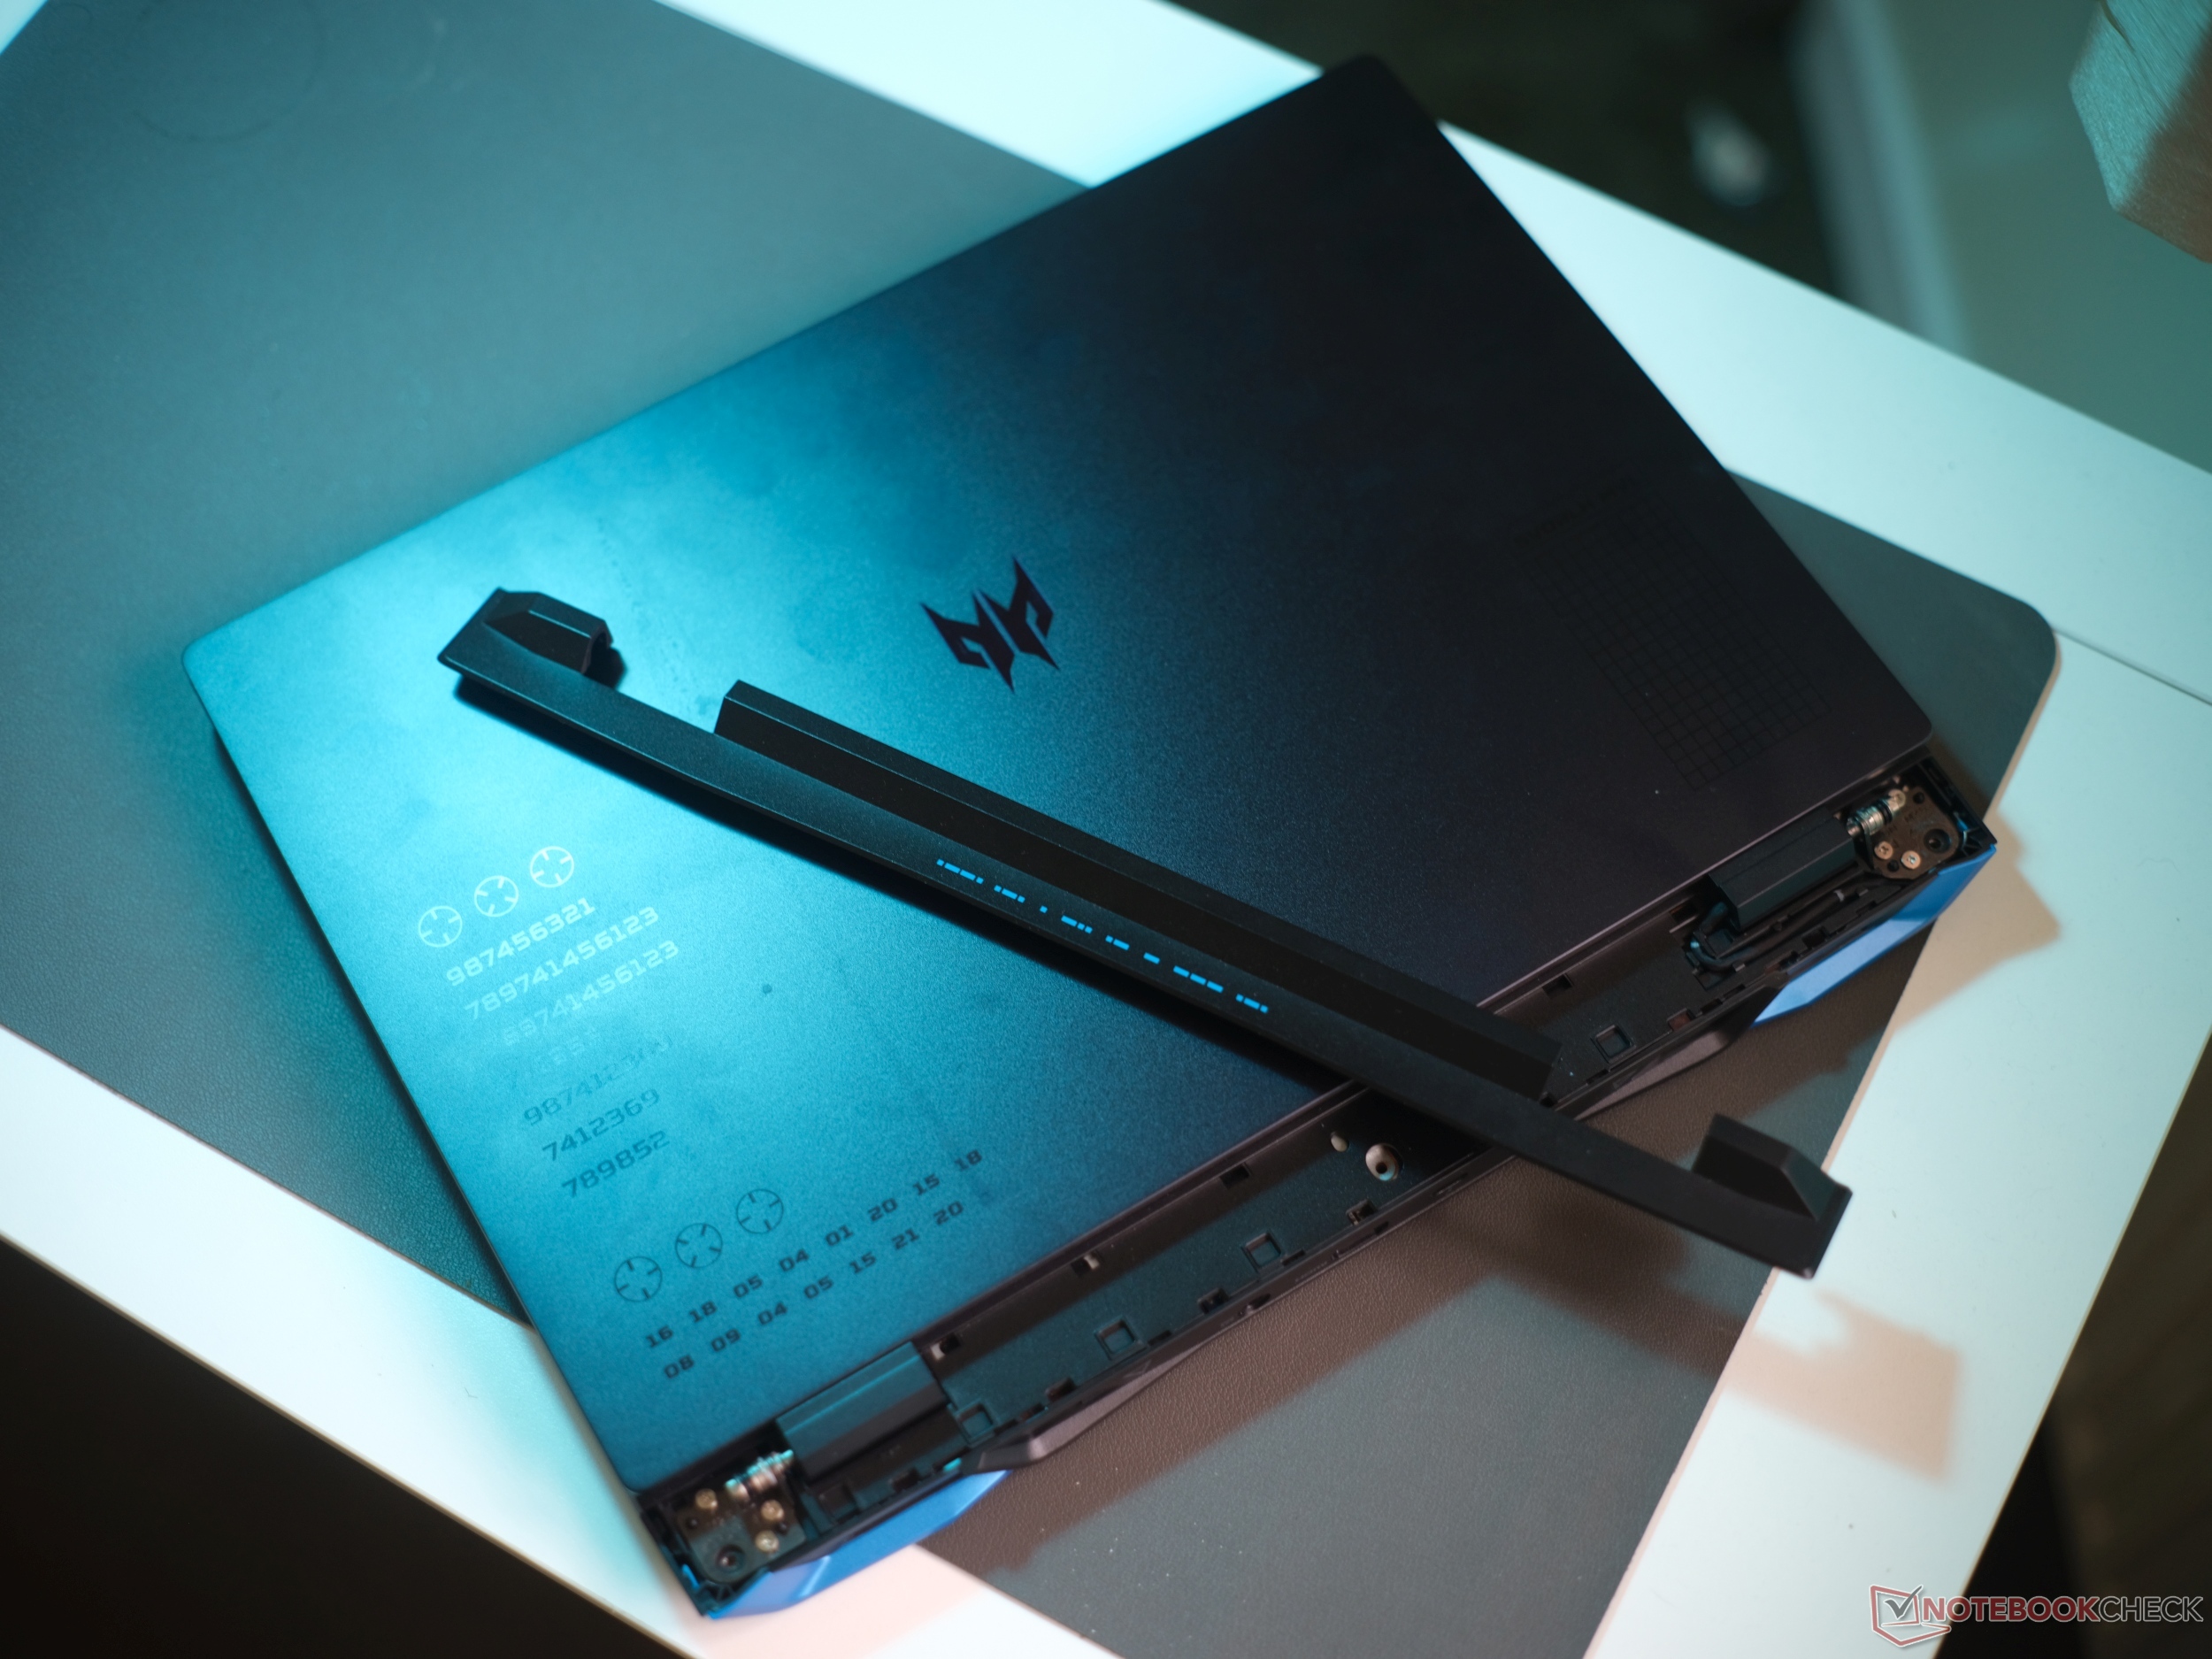
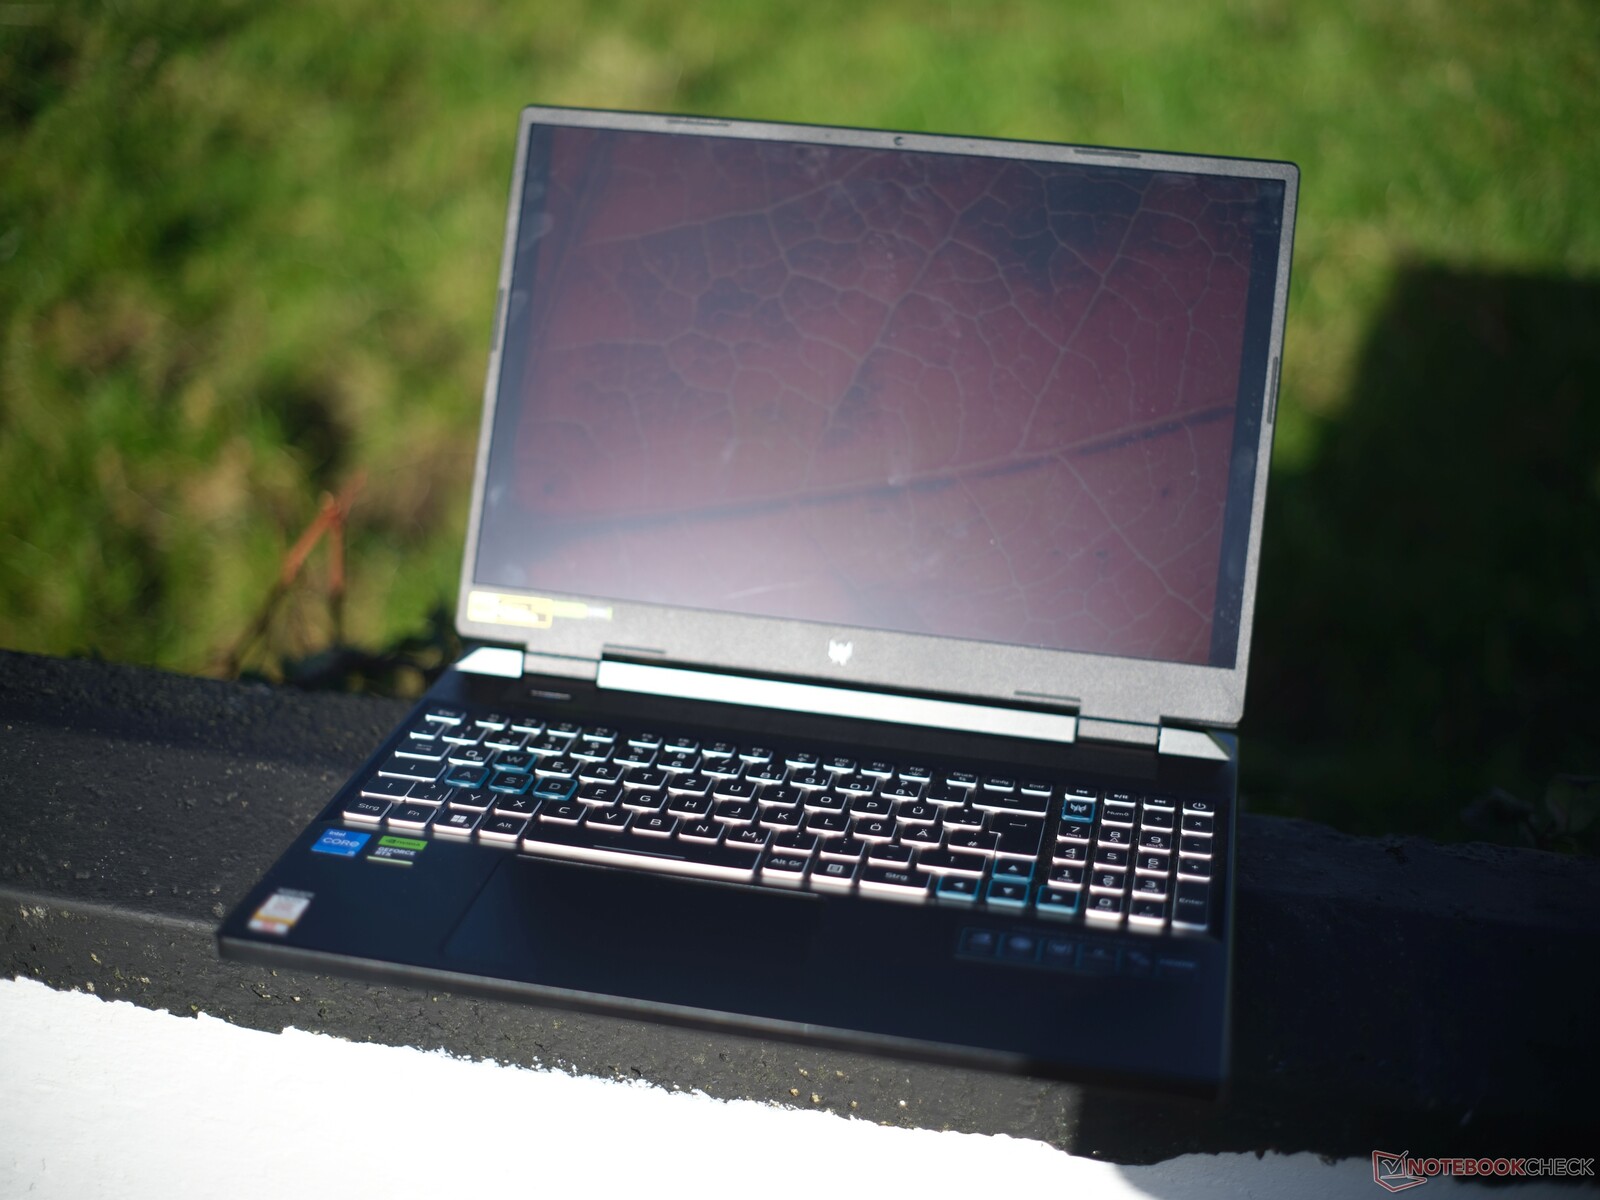
Case: The Helios Neo 16 stands out with its robustness and appearance
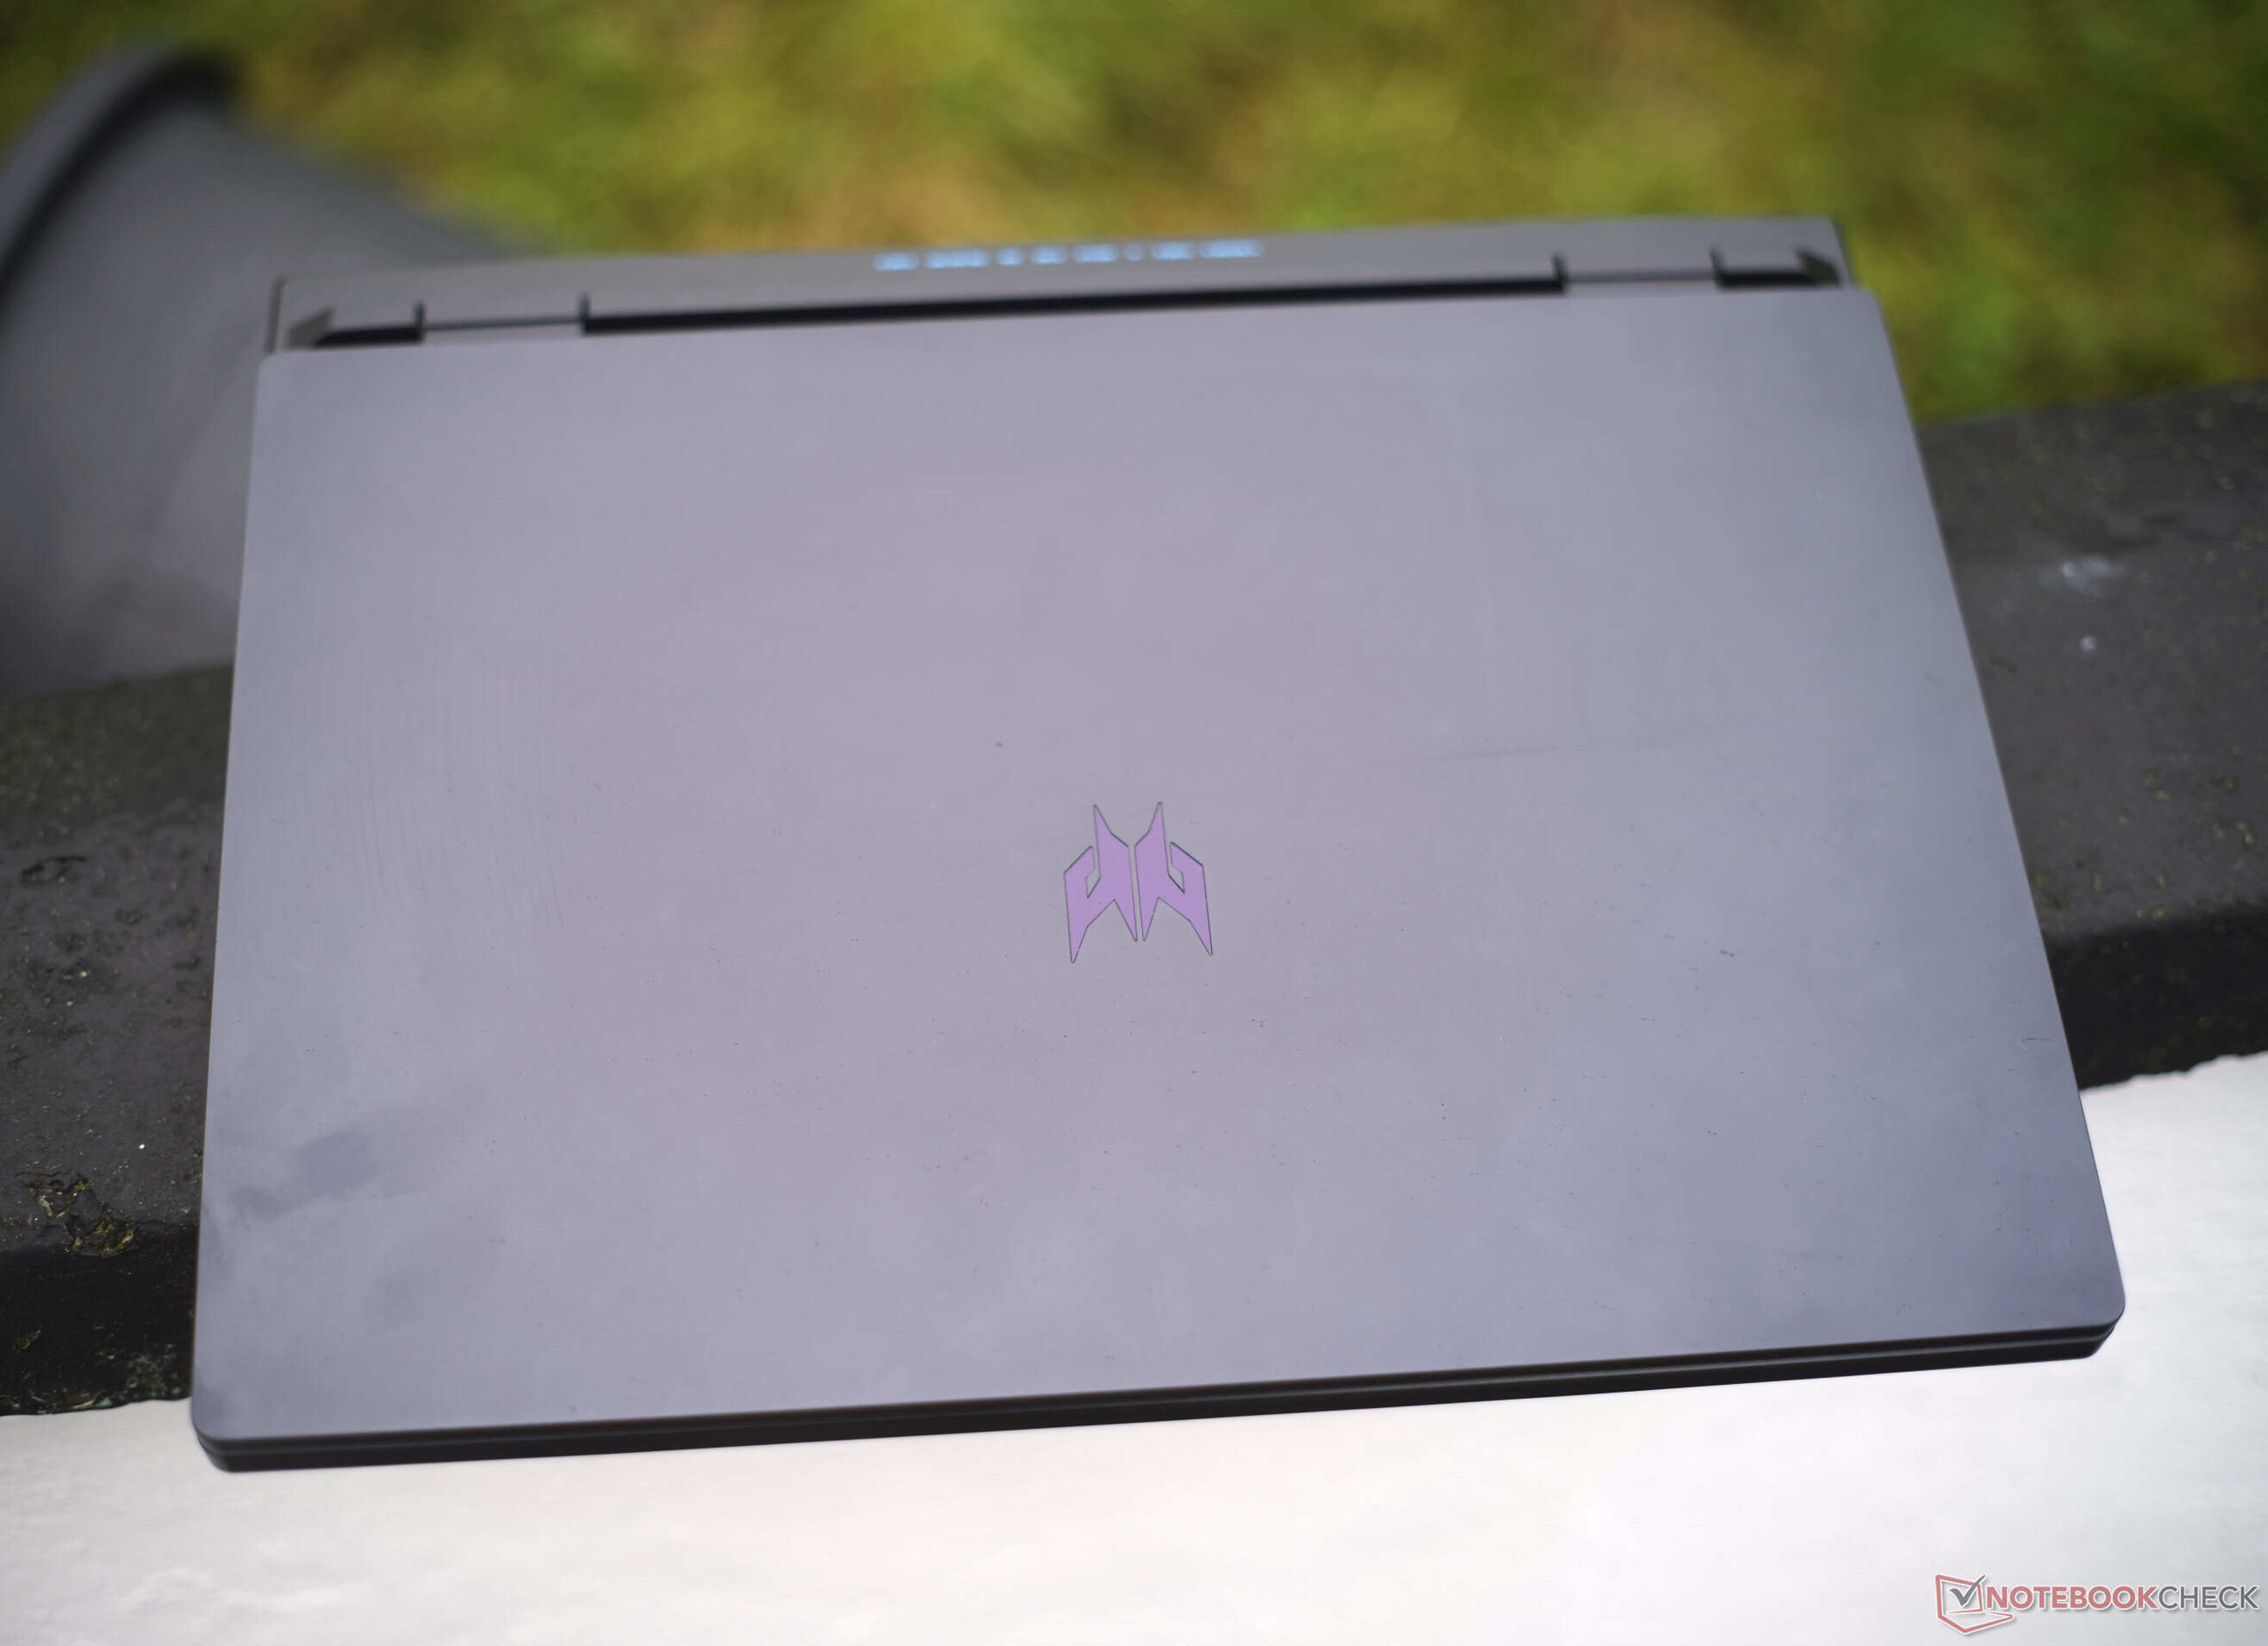
The Predator Helios Neo's case stability is great, which sets it apart from a lot of budget gamers. The aluminum lid and plastic base unit are a deep black (Obsidian Black) with a subtle dark blue shimmer.
There are a few engraved elements on the lid which, together with the blue fan grills on the back, give the device an interesting appearance, but also a lower "stealth effect". One clear disadvantage is how much its surfaces attract fingerprints.
The lid can be opened with one hand and up to a maximum of ~150° — at the same time, the hinges are quite stiff, which means it hardly wobbles when you position it. Unfortunately, it can be twisted quite easily (even if this doesn't lead to any image errors) but in turn, the base unit is very stable. All-in-all, the Helios Neo 16 left quite a good to very good impression on us, the same as the non-Neo variant did. The only difference is that this model doesn't feature an illuminated back or a swappable cooling grill.


With a weight of 2.6 kg and a thickness of 28.25 mm, the Helios Neo is bang on average for a 16-inch gaming laptop. In our comparison field, only the HP Victus 16 has lower values, weighing 2.3 kg with a thickness of 22.9 mm. The 15.6-inch XMG Apex 15 is also a little lighter.
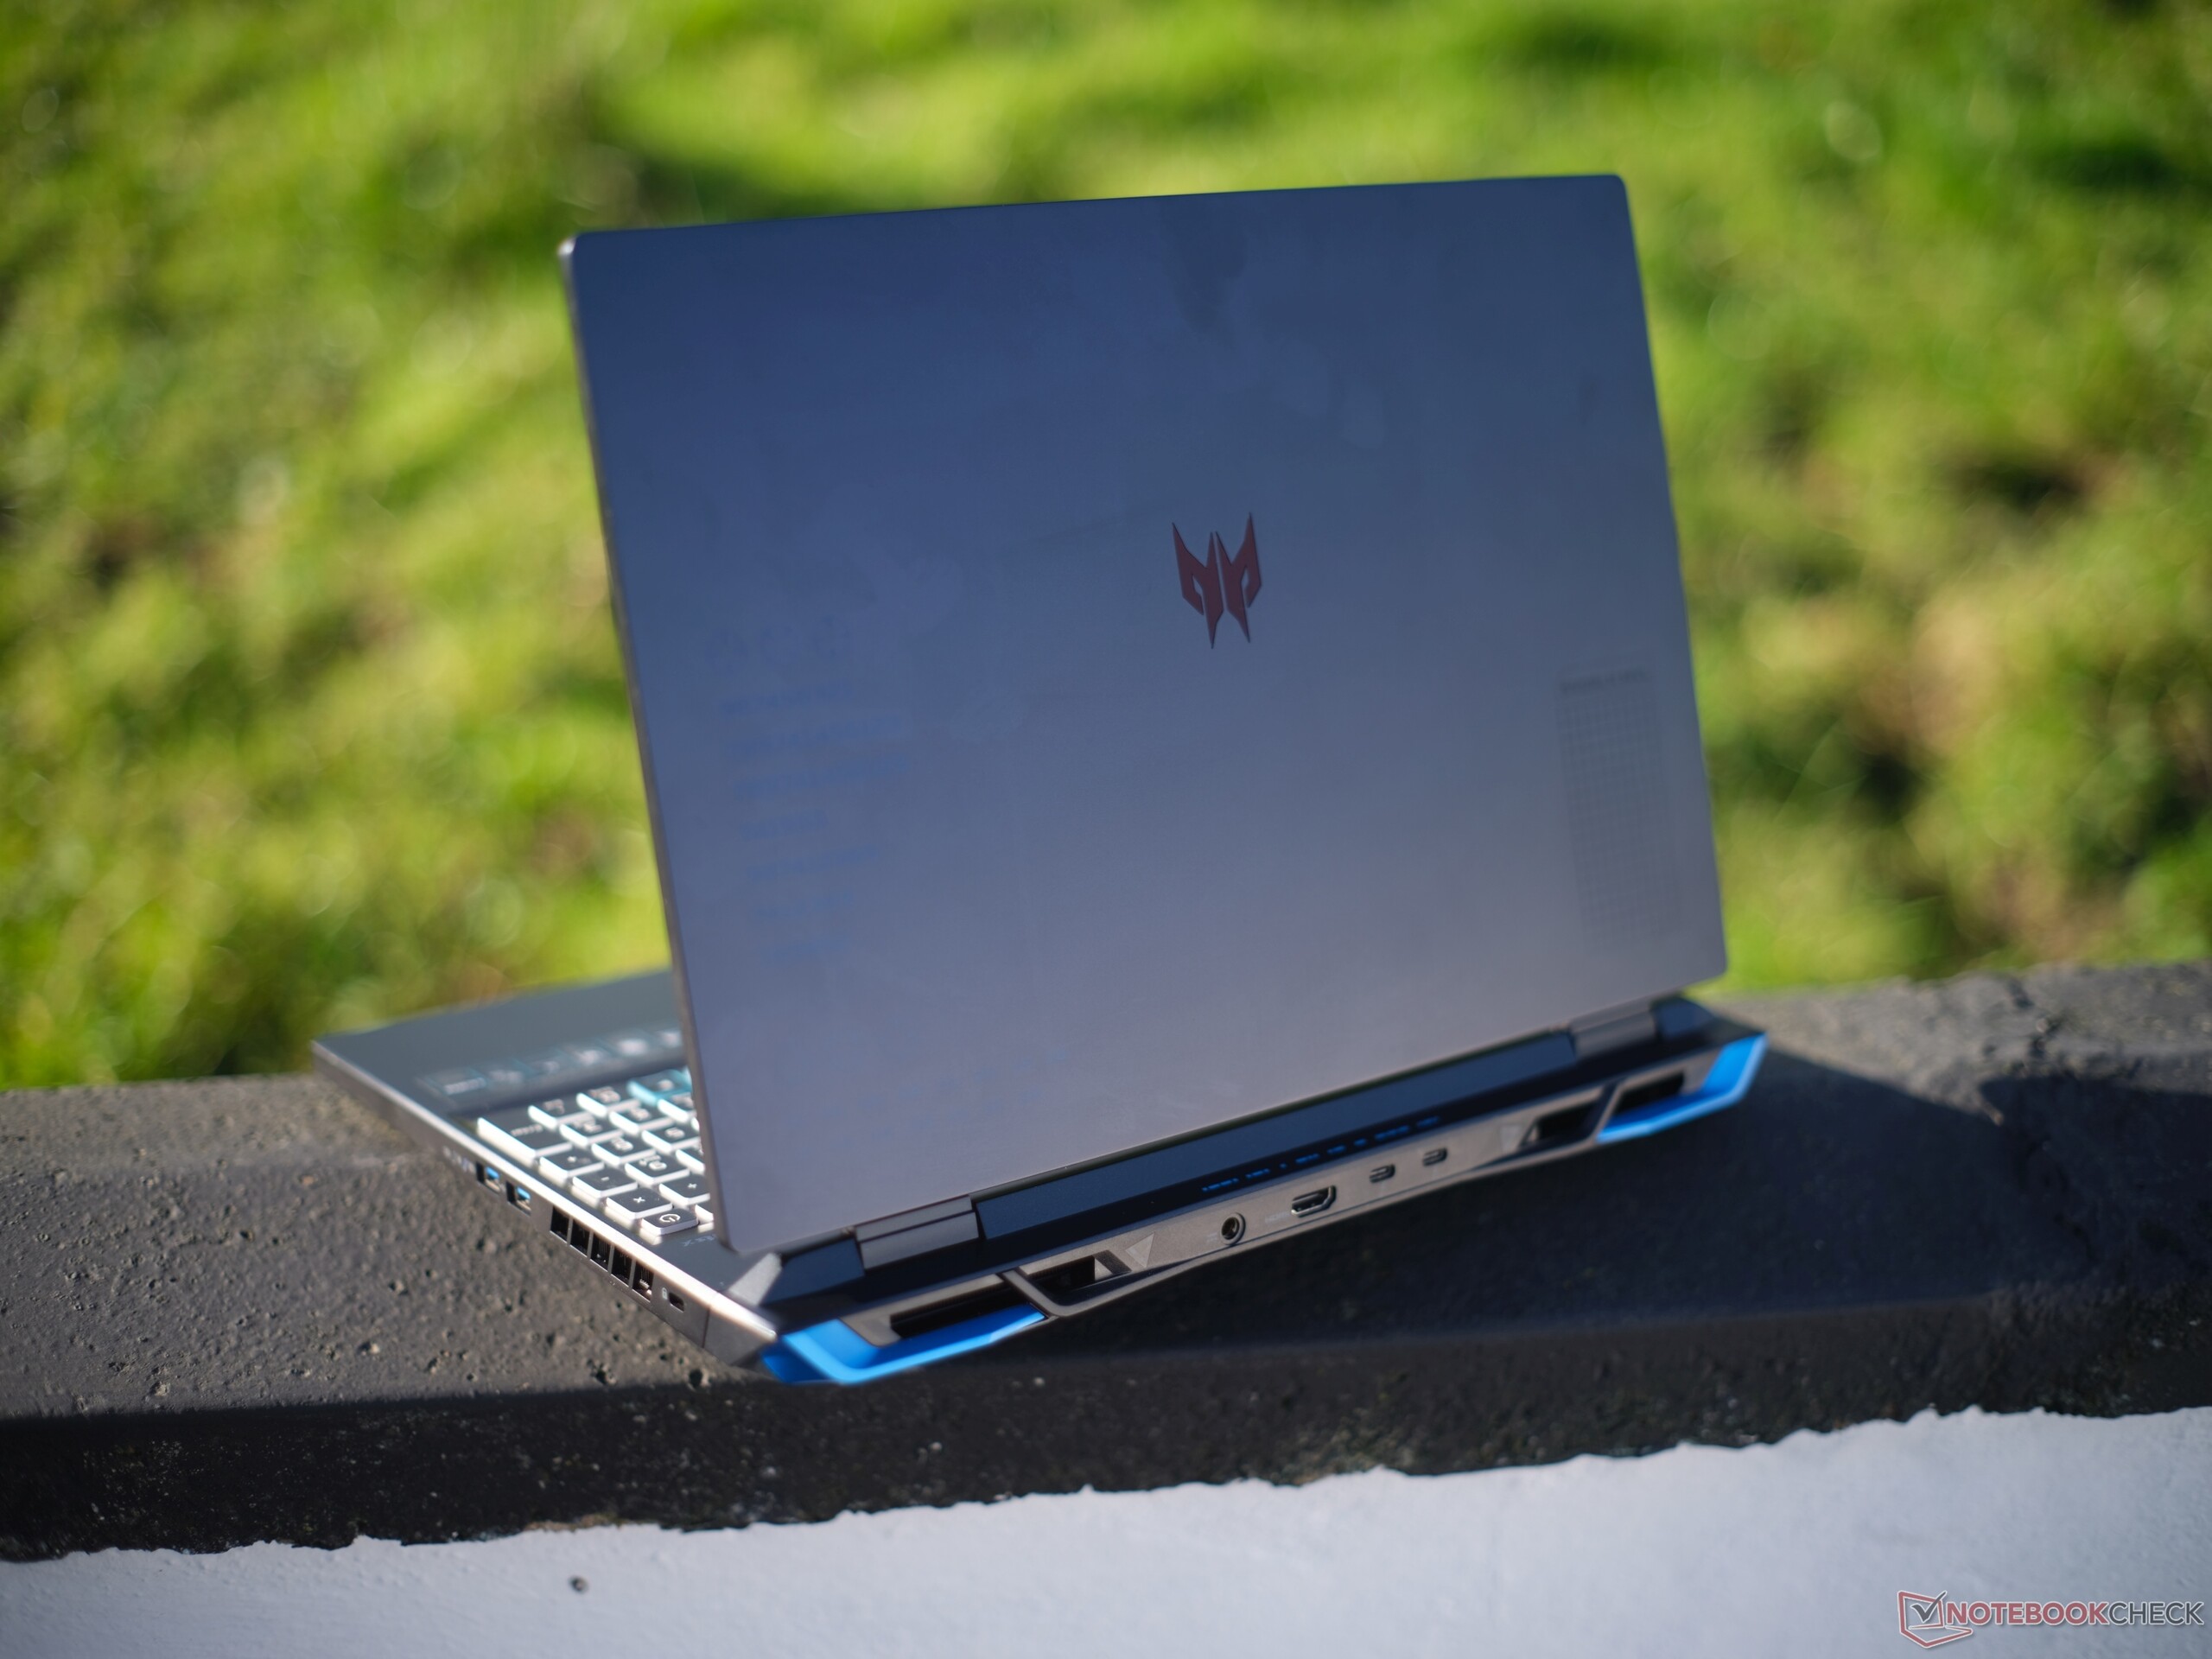
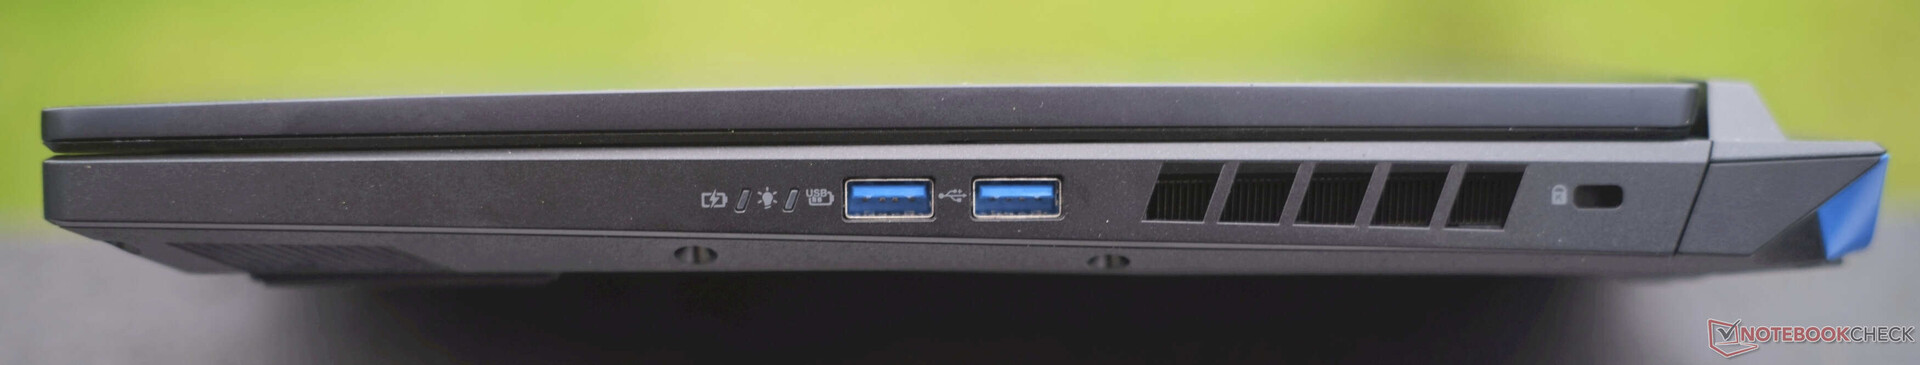
Connectivity: Lots of connections, but slow WiFi and Power Delivery
Acer's gaming laptop features 1x USB-A 3.1 (5 GBit/s), 2x USB-A 3.2 (10 GBit/s), as well as 2x Thunderbolt 4 incl. DisplayPort 1.4 and Power Delivery (65 watts) on the back. Adding to the back is a Gigabit-RJ45, microSD card reader, 3.5-mm audio jack, Kensington lock, power connection as well as an HDMI 2.1 port that is connected directly to the dGPU and that supports 4K at 120 Hz with simultaneous G-Sync.
At the end of the day, the Predator Helios Neo is at no disadvantage compared to its more expensive sibling, with the exception of its lower PD performance.


SD card reader
The microSD card reader's transfer rates are average when used with our AV PRO microSD 128 GB V60 reference card. The Legion Slim 5, Acer Nitro 16, XMG Focus 15 and Gigabyte G5 all read and copy data with similar transfer rates. However, XMG's Apex 15 is more than twice as slow, while Alienware's m16 R1 is twice as fast.
| SD Card Reader | |
| average JPG Copy Test (av. of 3 runs) | |
| Alienware m16 R1 Intel (AV PRO microSD 128 GB V60) | |
| Average of class Gaming (20.9 - 210, n=55, last 2 years) | |
| Lenovo Legion Slim 5 14APH8 (Toshiba Exceria Pro SDXC 64 GB UHS-II) | |
| Acer Nitro 16 AN16-41-R7YE (AV PRO microSD 128 GB V60) | |
| Acer Predator Helios Neo 16 NH.QLTEG.002 | |
| Gigabyte G5 KF | |
| Schenker XMG Apex 15 (Late 23) (AV PRO microSD 128 GB V60) | |
| maximum AS SSD Seq Read Test (1GB) | |
| Alienware m16 R1 Intel (AV PRO microSD 128 GB V60) | |
| Average of class Gaming (25.5 - 261, n=52, last 2 years) | |
| Schenker XMG Focus 15 (E23) | |
| Gigabyte G5 KF | |
| Acer Predator Helios Neo 16 NH.QLTEG.002 | |
| Acer Nitro 16 AN16-41-R7YE (AV PRO microSD 128 GB V60) | |
| Lenovo Legion Slim 5 14APH8 (Toshiba Exceria Pro SDXC 64 GB UHS-II) | |
| Schenker XMG Apex 15 (Late 23) (AV PRO microSD 128 GB V60) | |
Communication
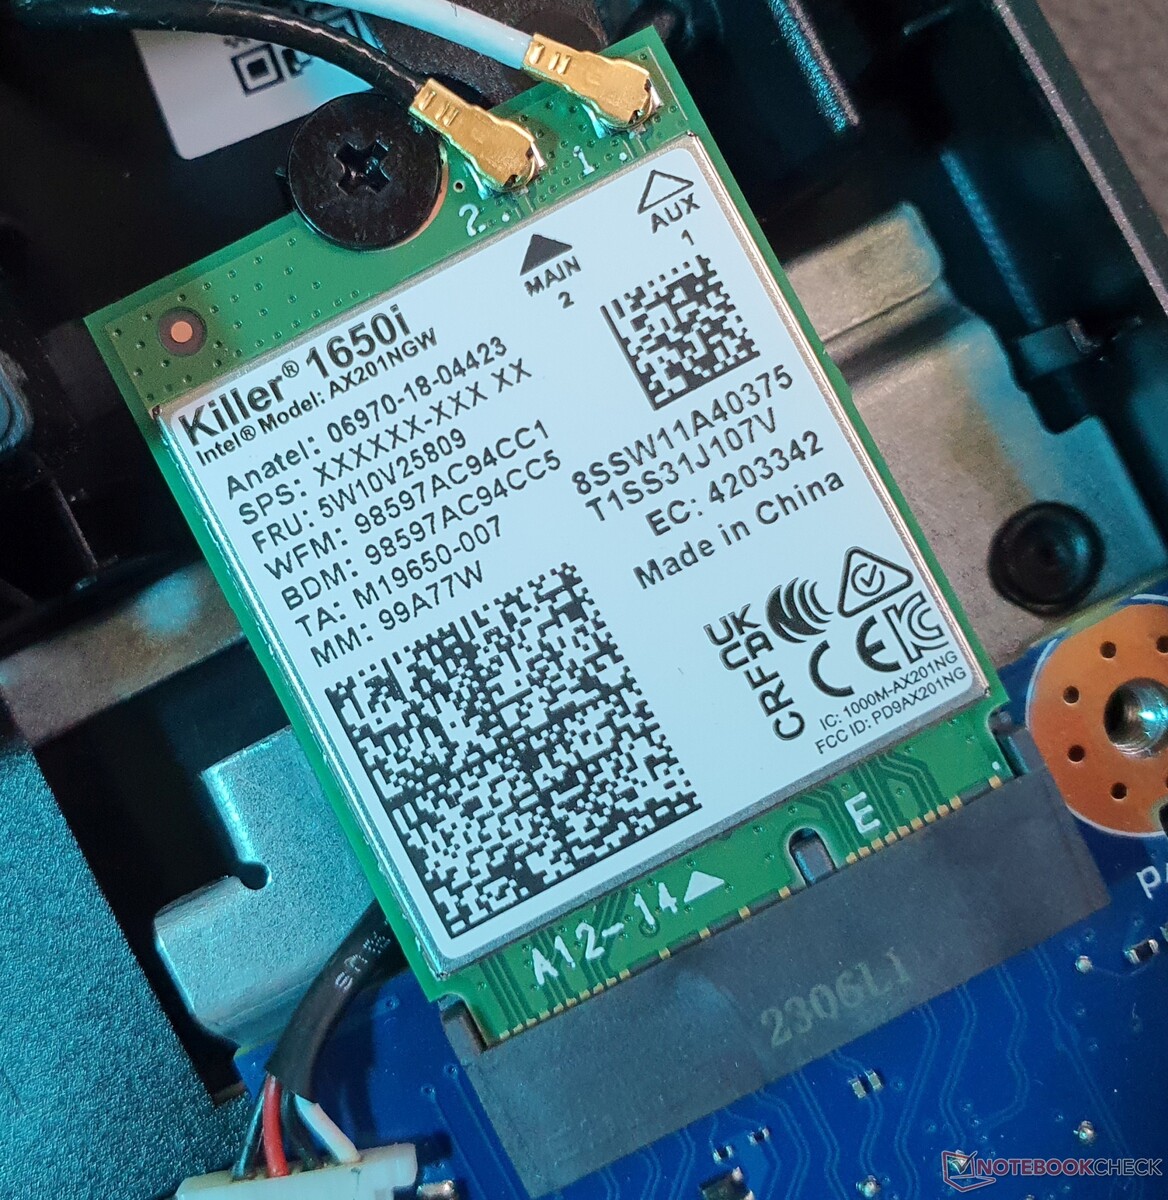
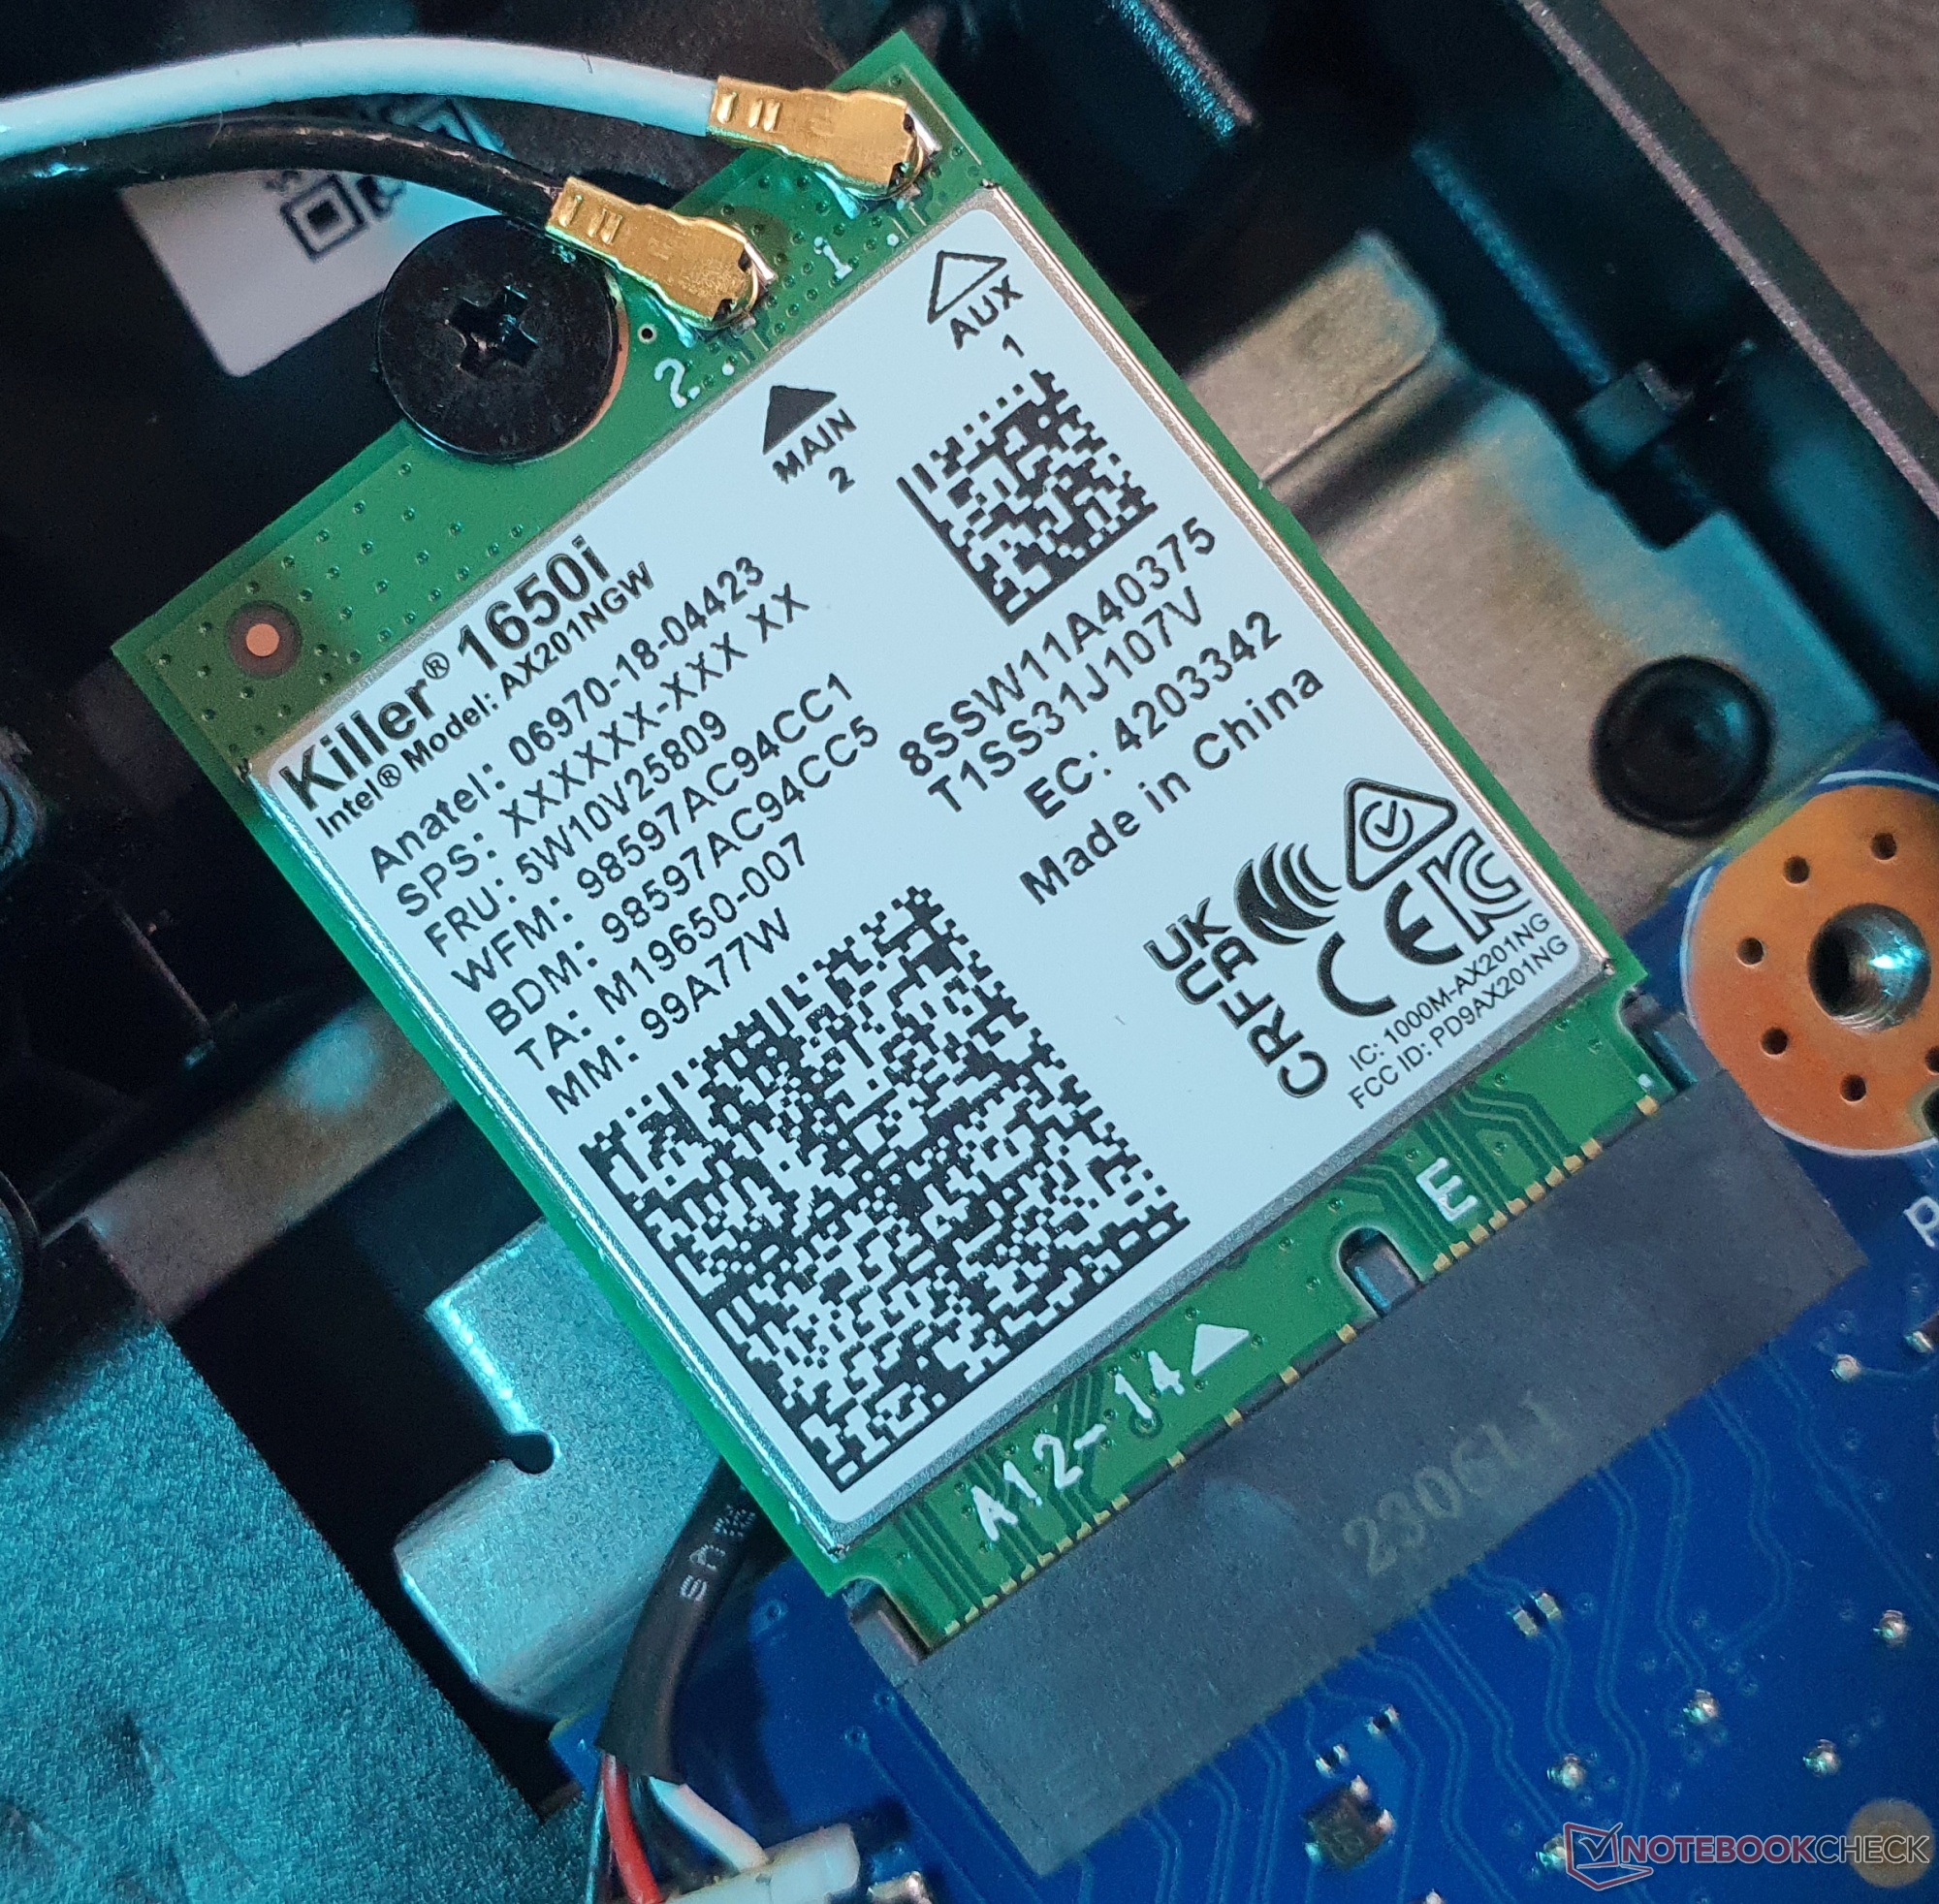
The laptop's installed Intel Killer AX1650i WLAN module corresponds to the older WiFi 6 standard and, with transfer rates of ~900 MBit/s, is on a similarly slow level as the Realtek chip within the Lenovo LOQ 16.
The Helios 16, on the other hand, achieves up to 1.6 GBit/s using the Intel Killer AX1675i (WiFi 6E), while the Legion Pro 5 16 narrowly came out on top of our comparison field. Intel's Killer E2600 Gigabit controller takes care of wired connections, while Bluetooth 5.2 is also on board.
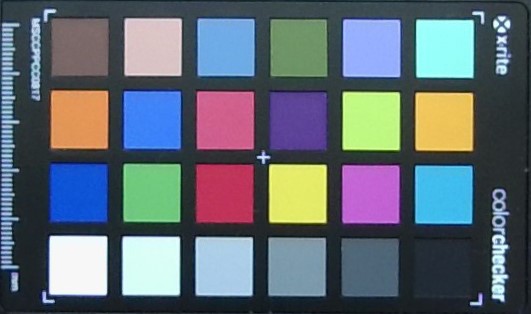
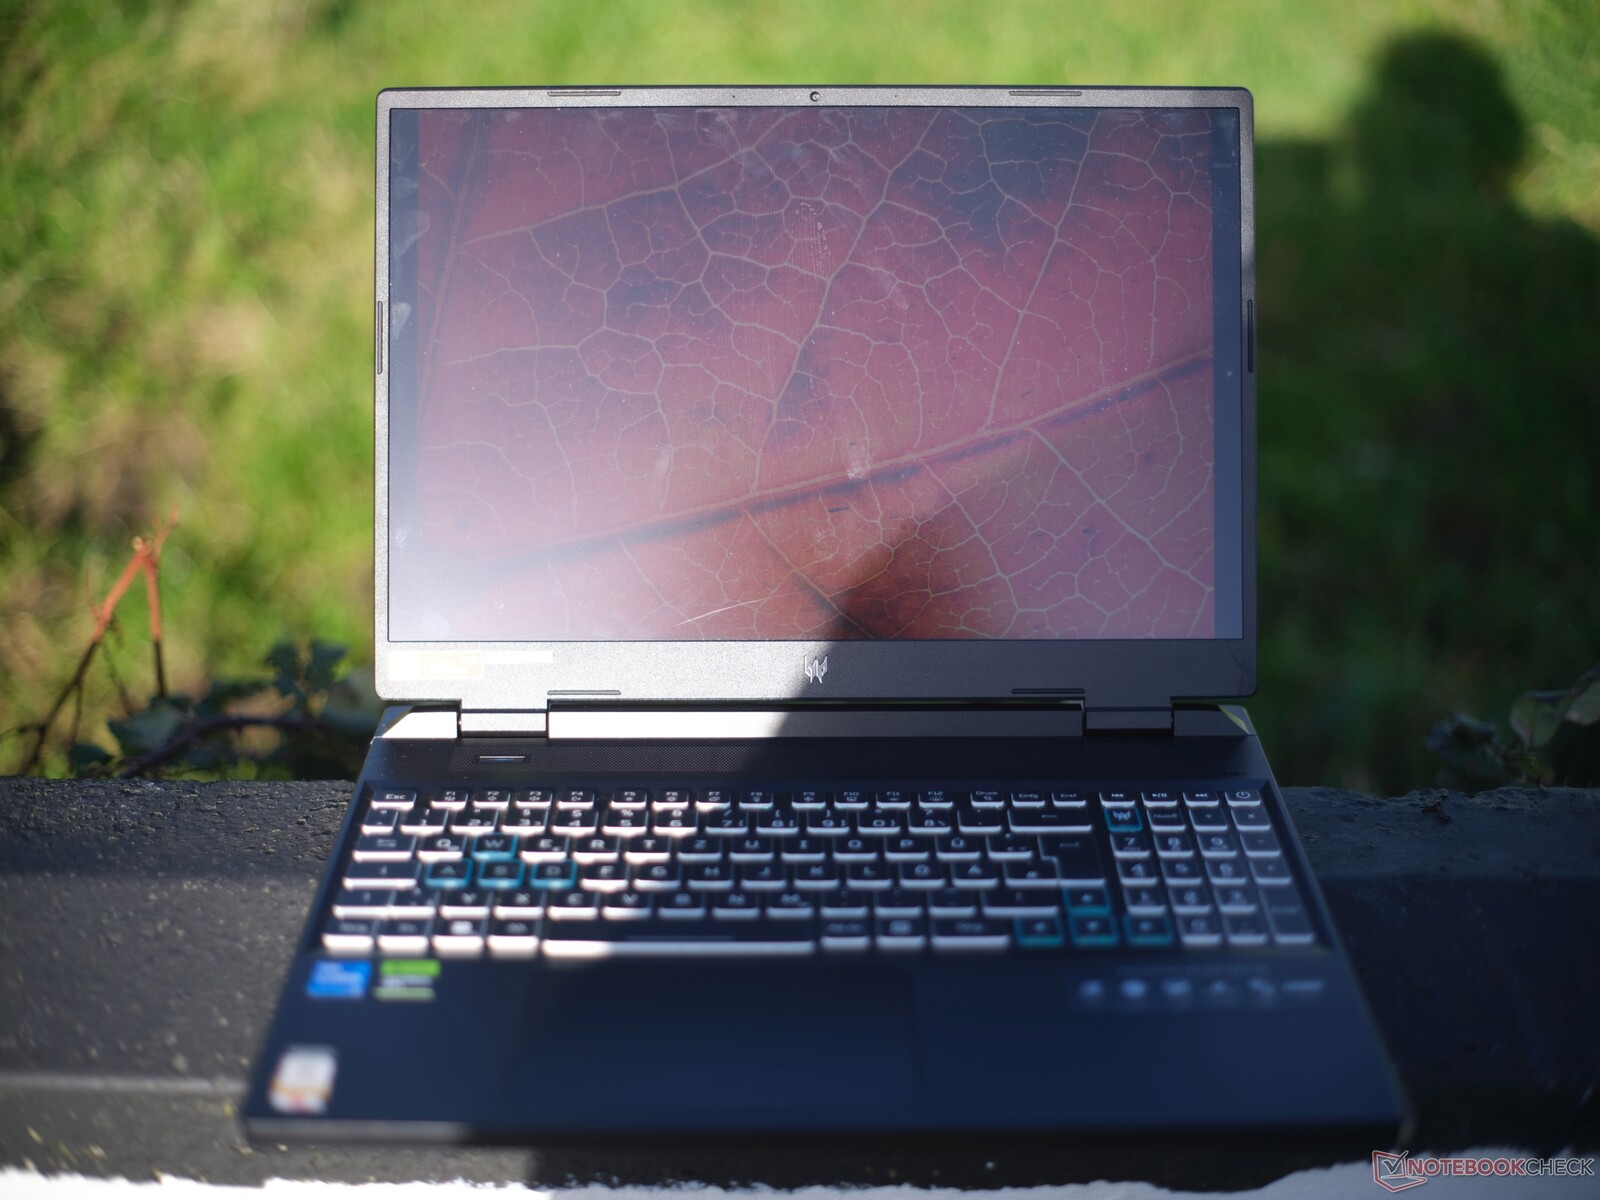
Webcam


In contrast to the Predator Helios 16, Acer has only installed a 720p webcam into the Neo, which we find a real shame considering its price. Accordingly, the image quality leaves a lot to be desired even under optimal conditions. Windows Hello is also not included. However, the dual-array microphones deliver decent sound quality.


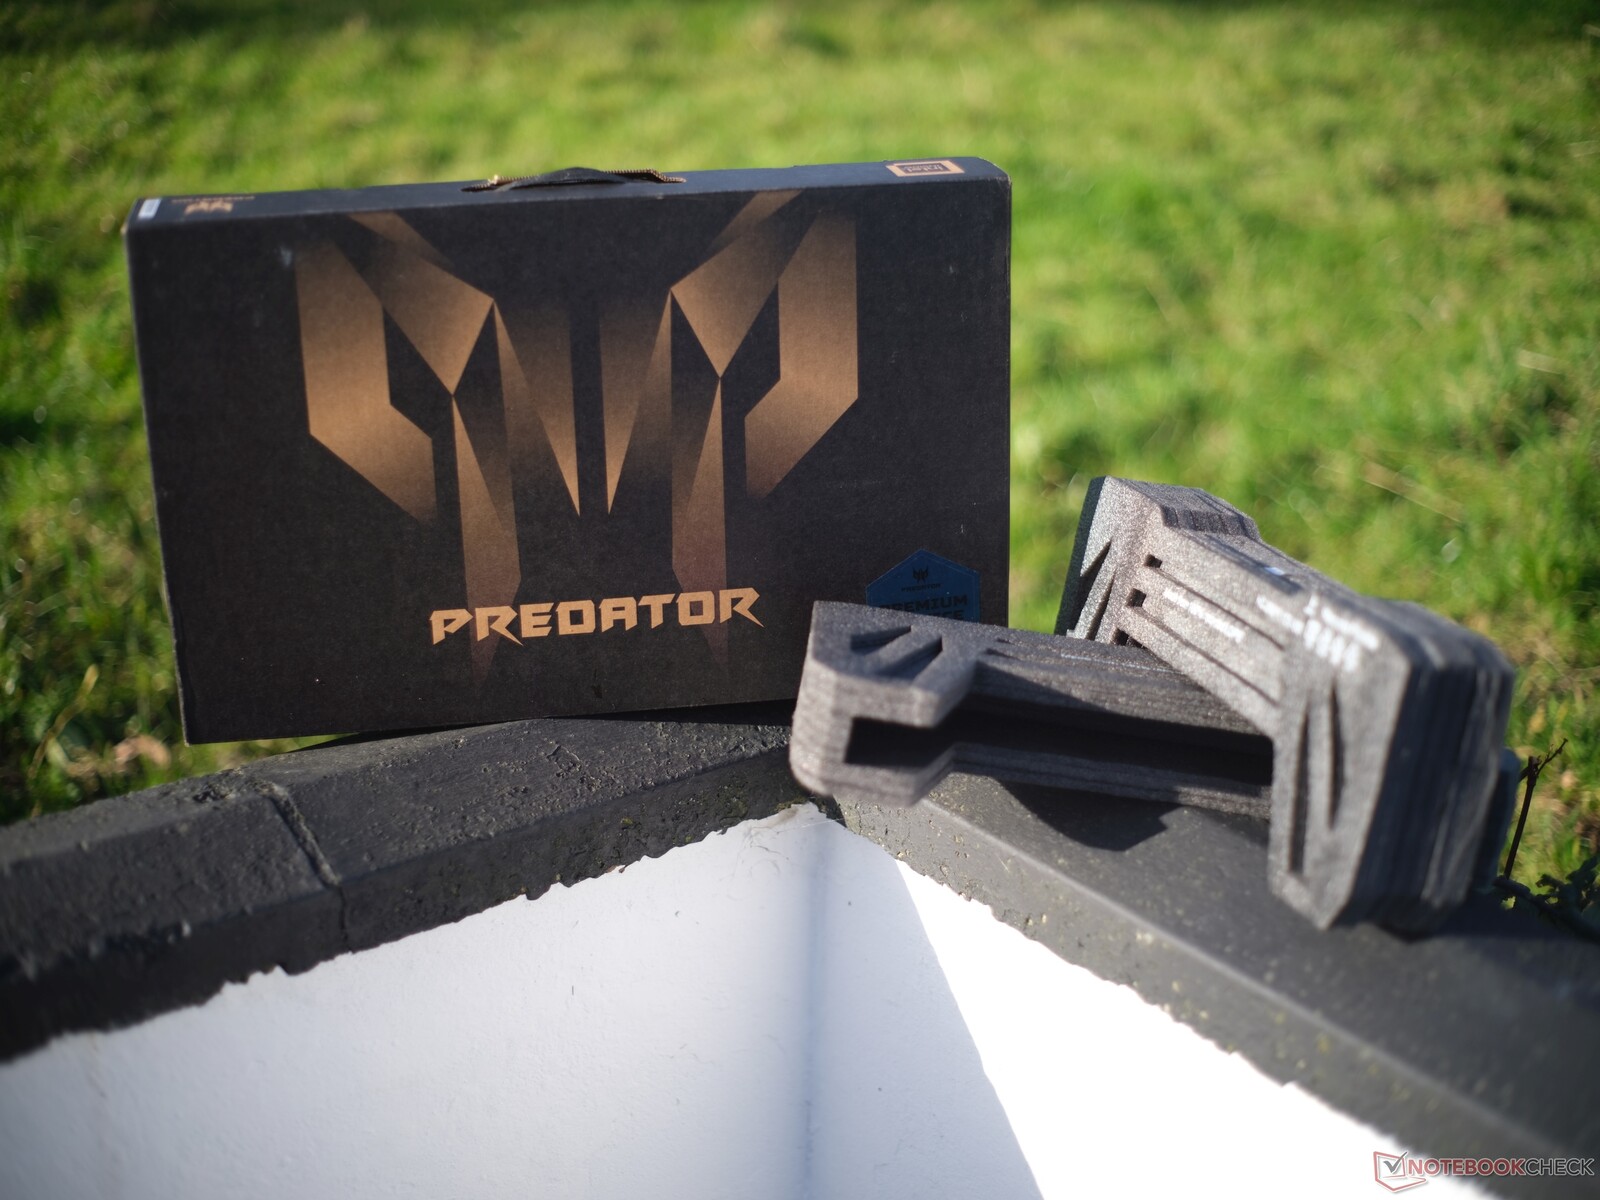
Accessories
Aside from the device itself, the laptop's scope of delivery only includes a 230-watt power supply. In general, we would have liked to see more environmentally friendly packaging used without any plastic — although, the materials used are at least recycled.
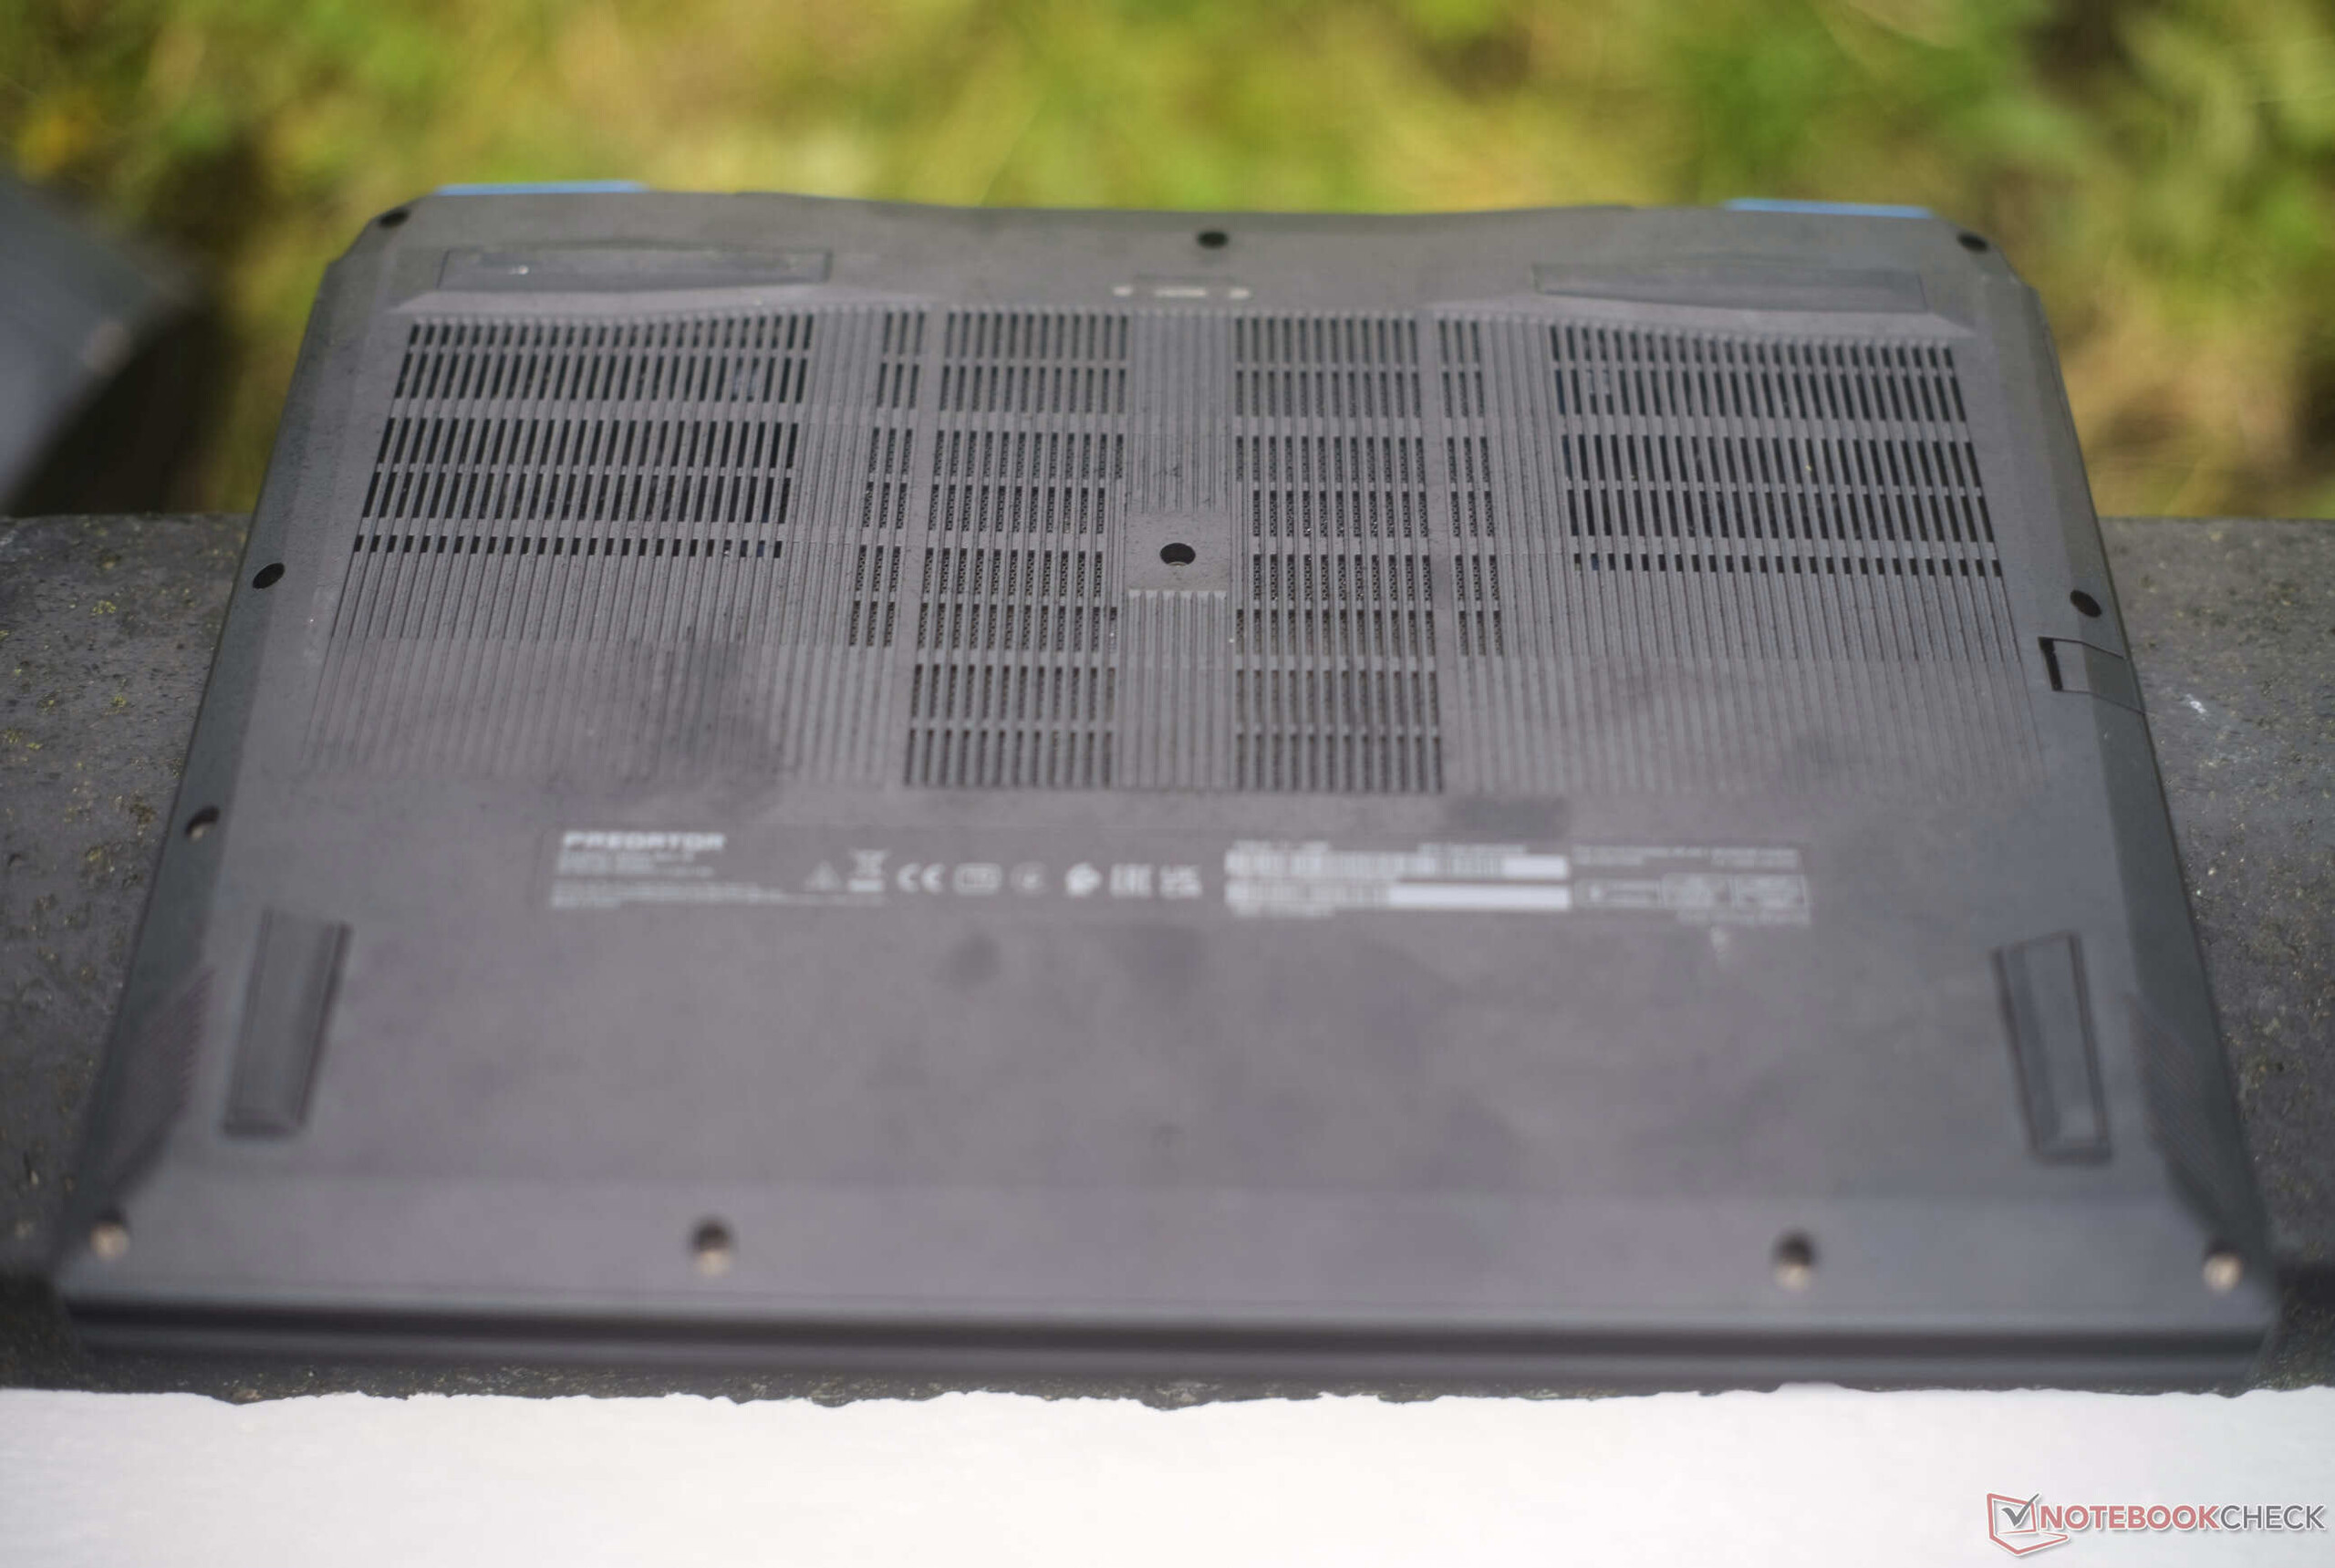
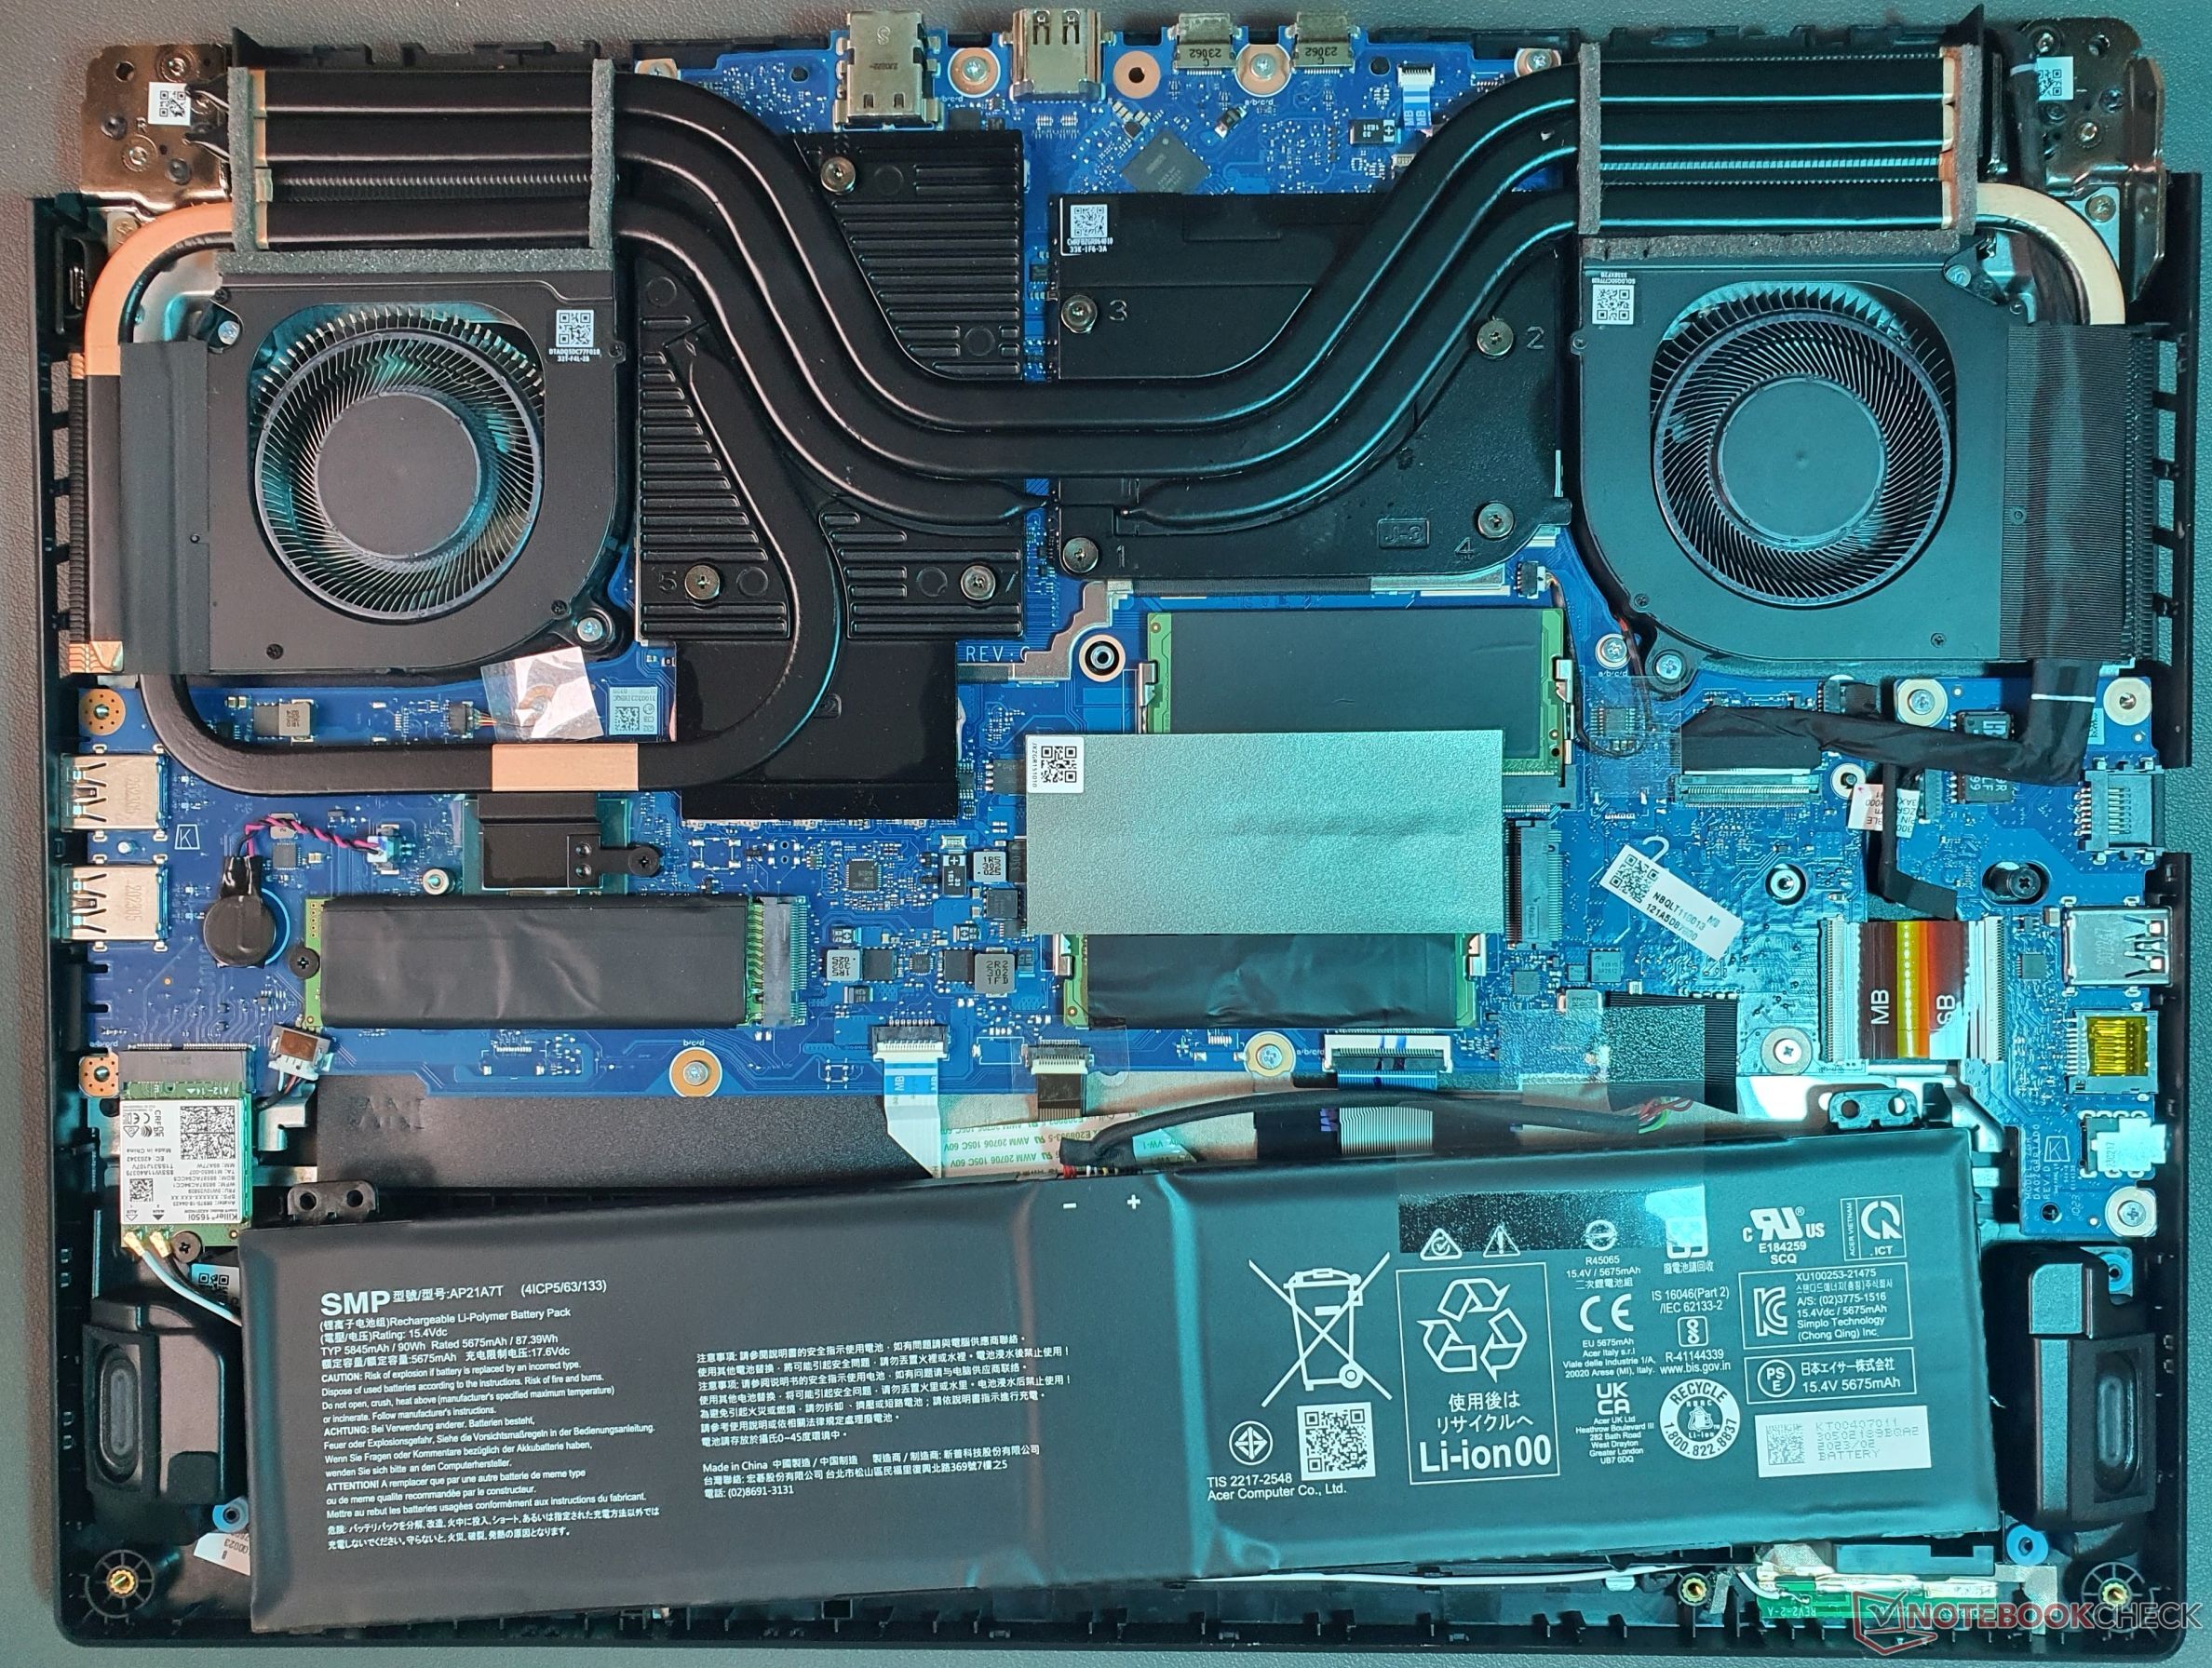
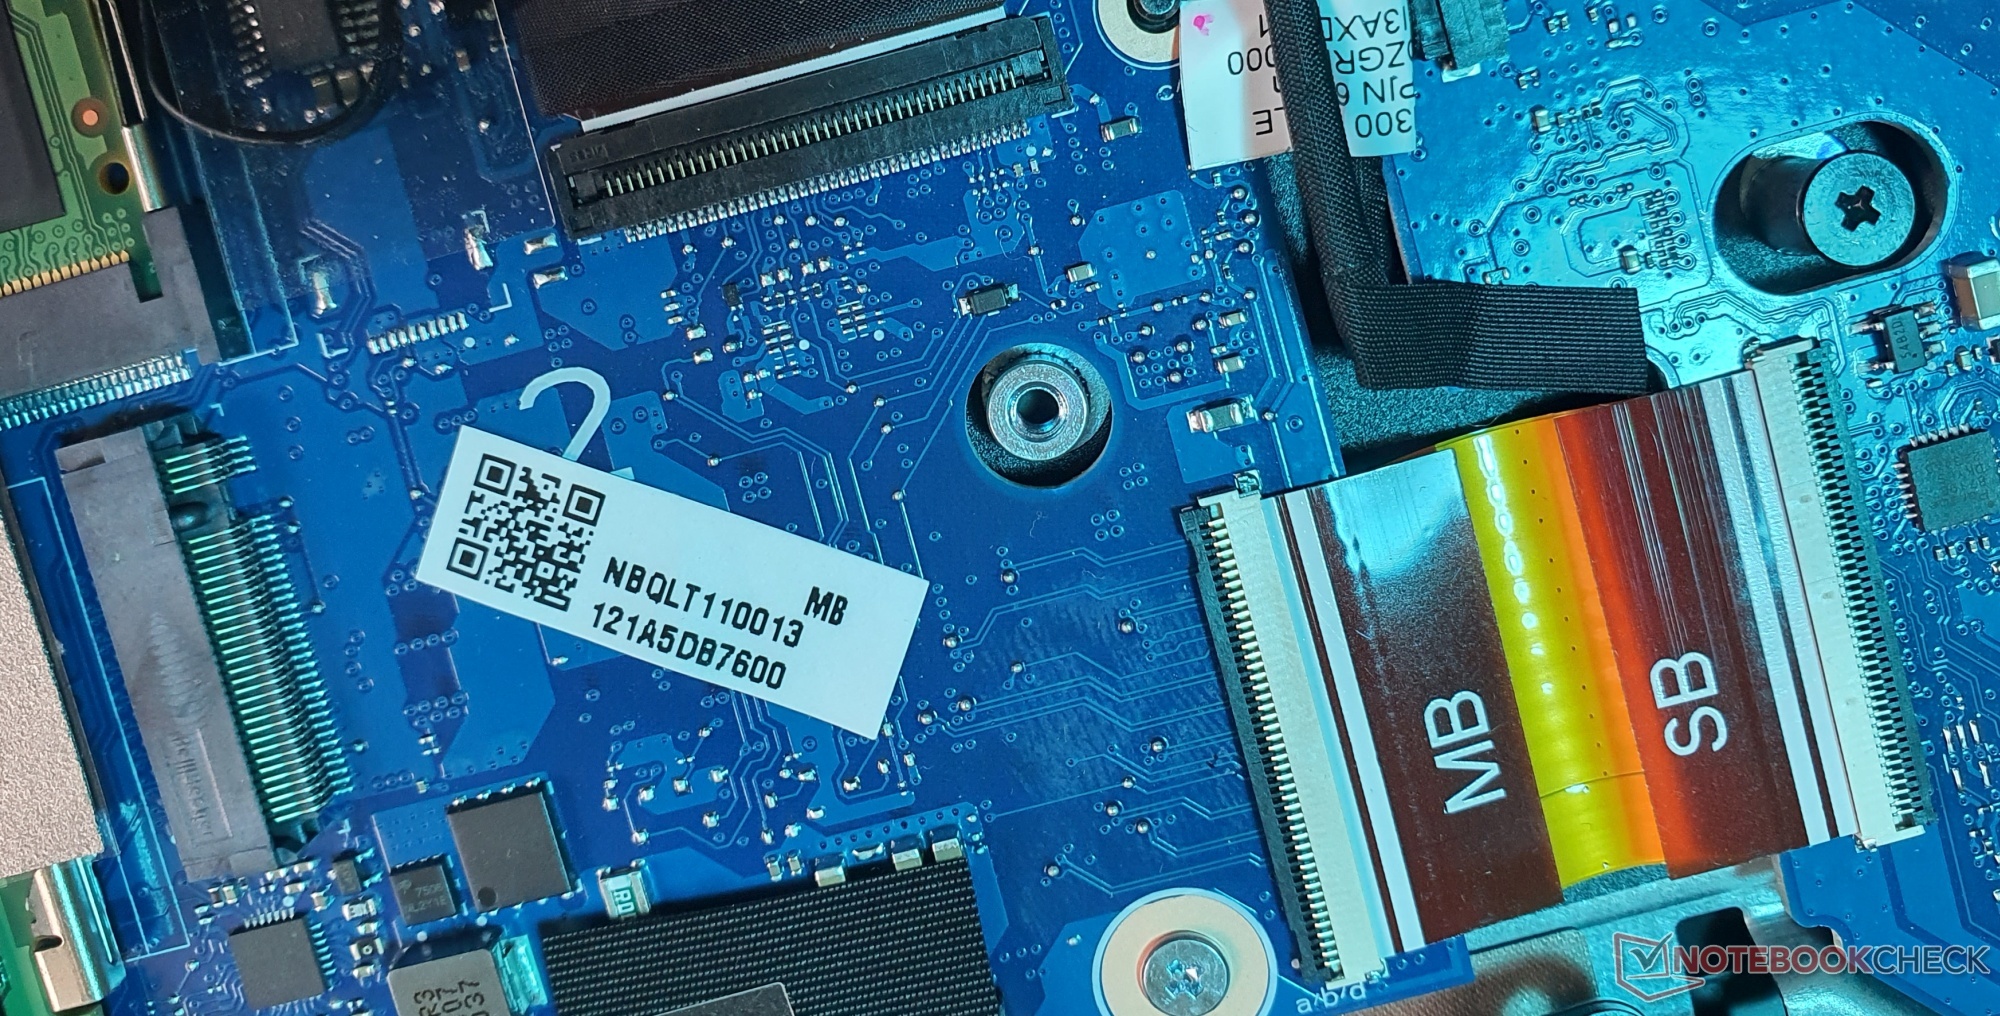
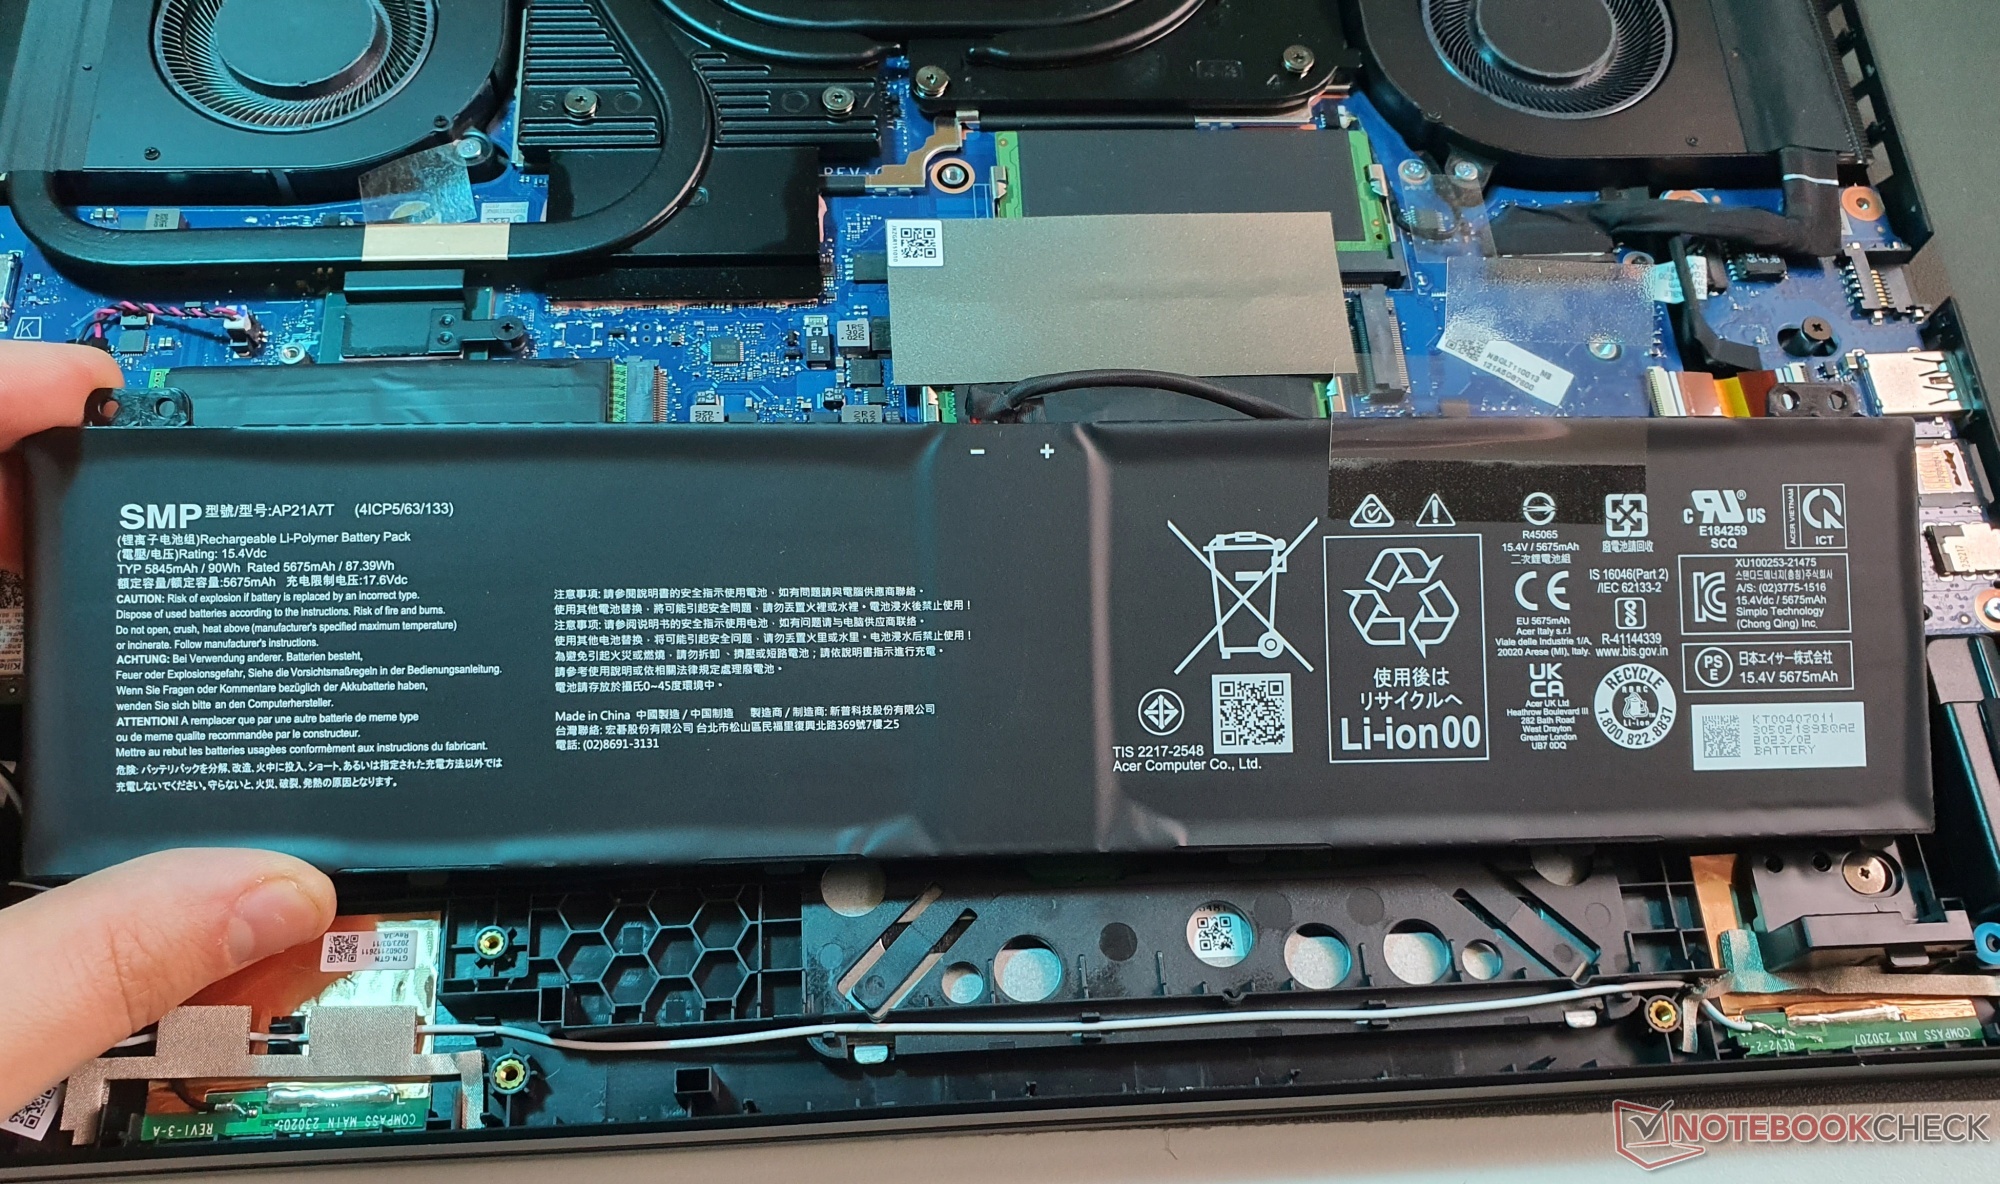
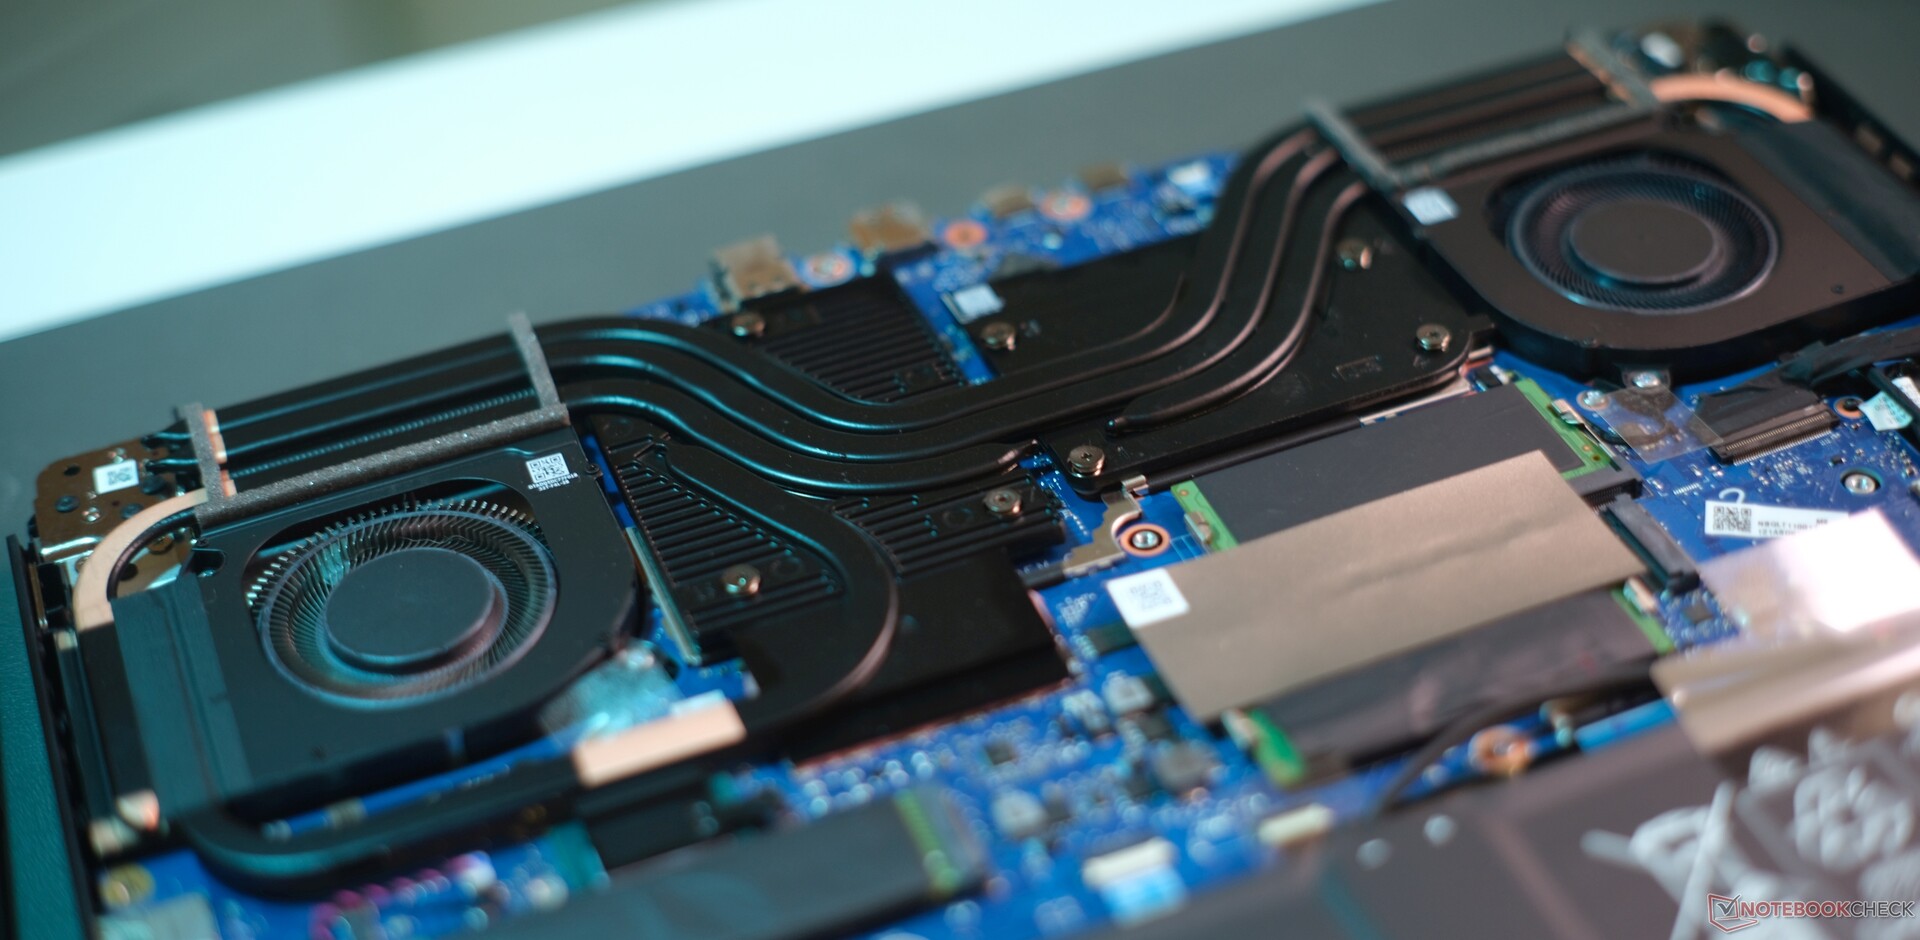
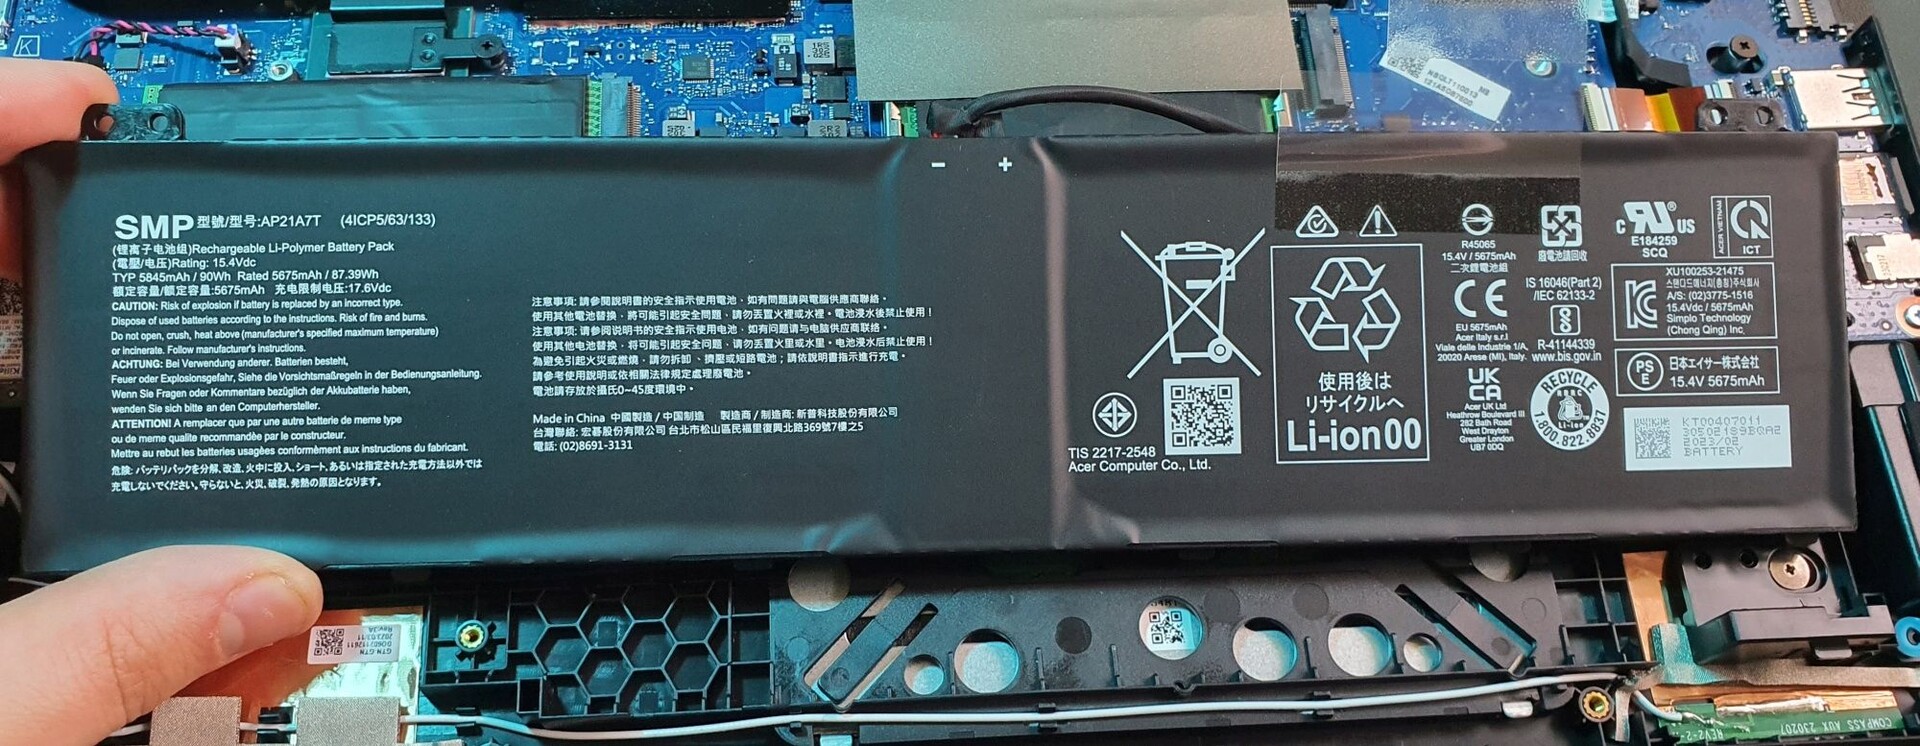
Maintenance
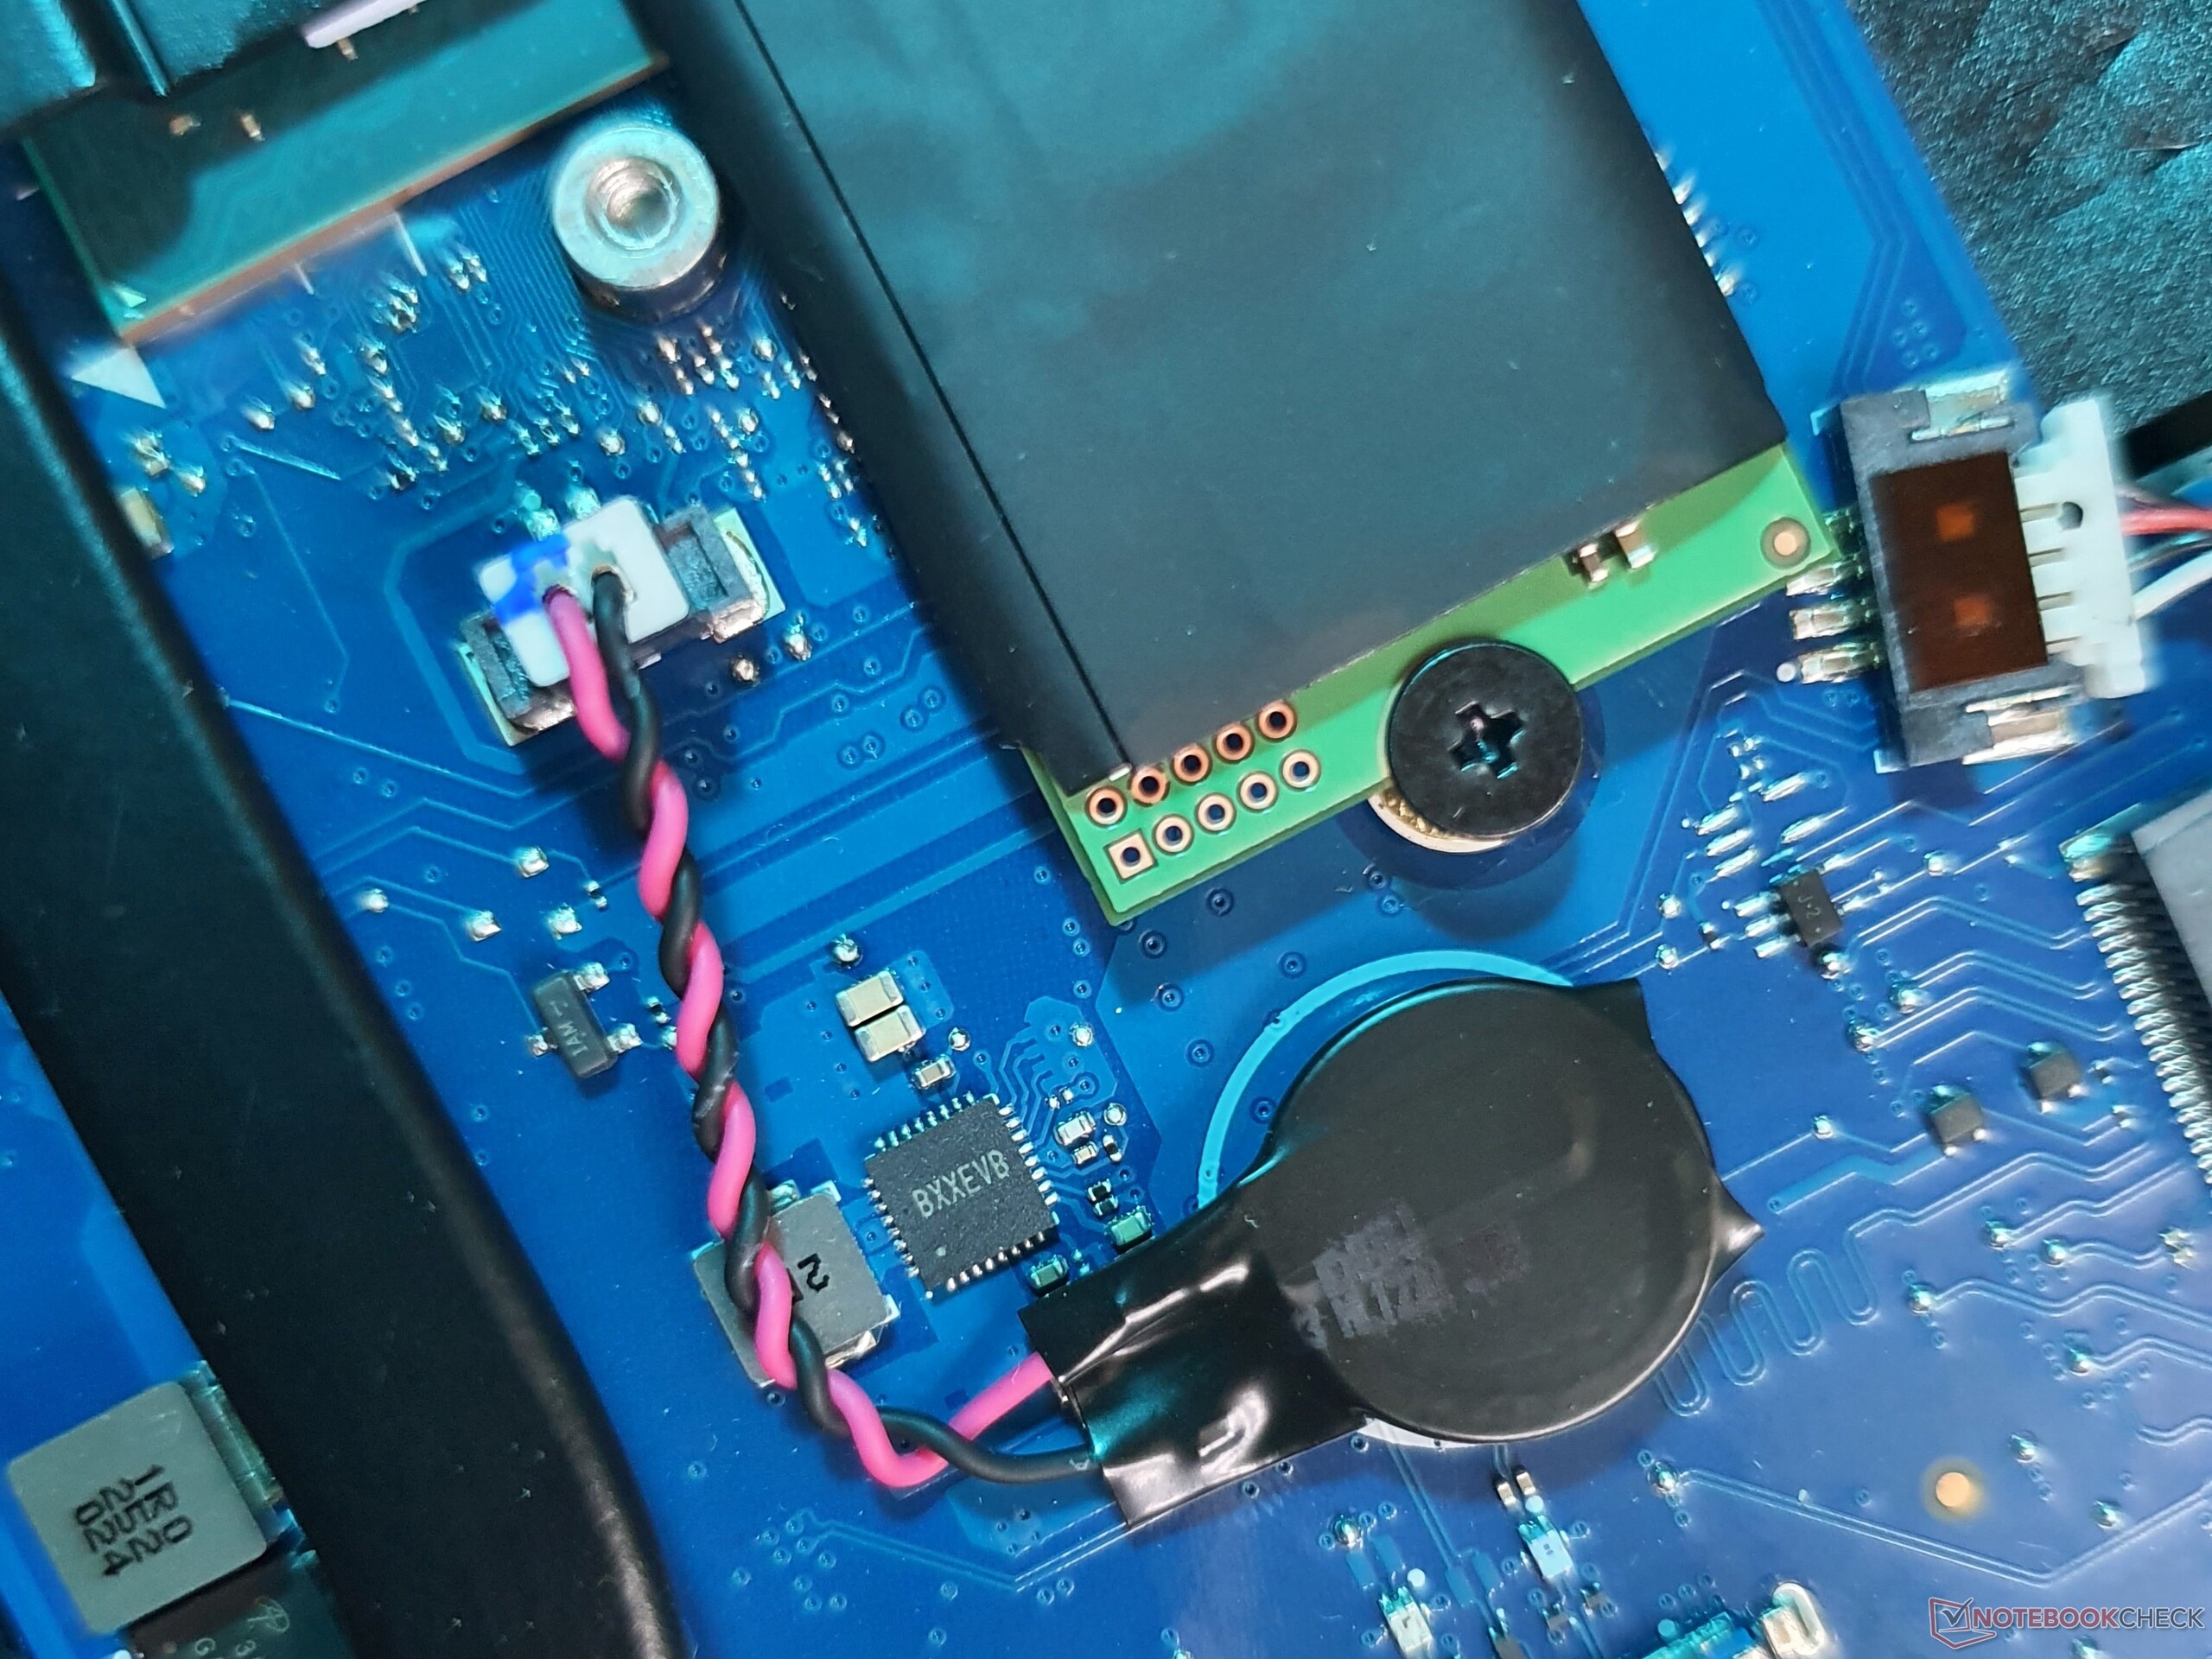
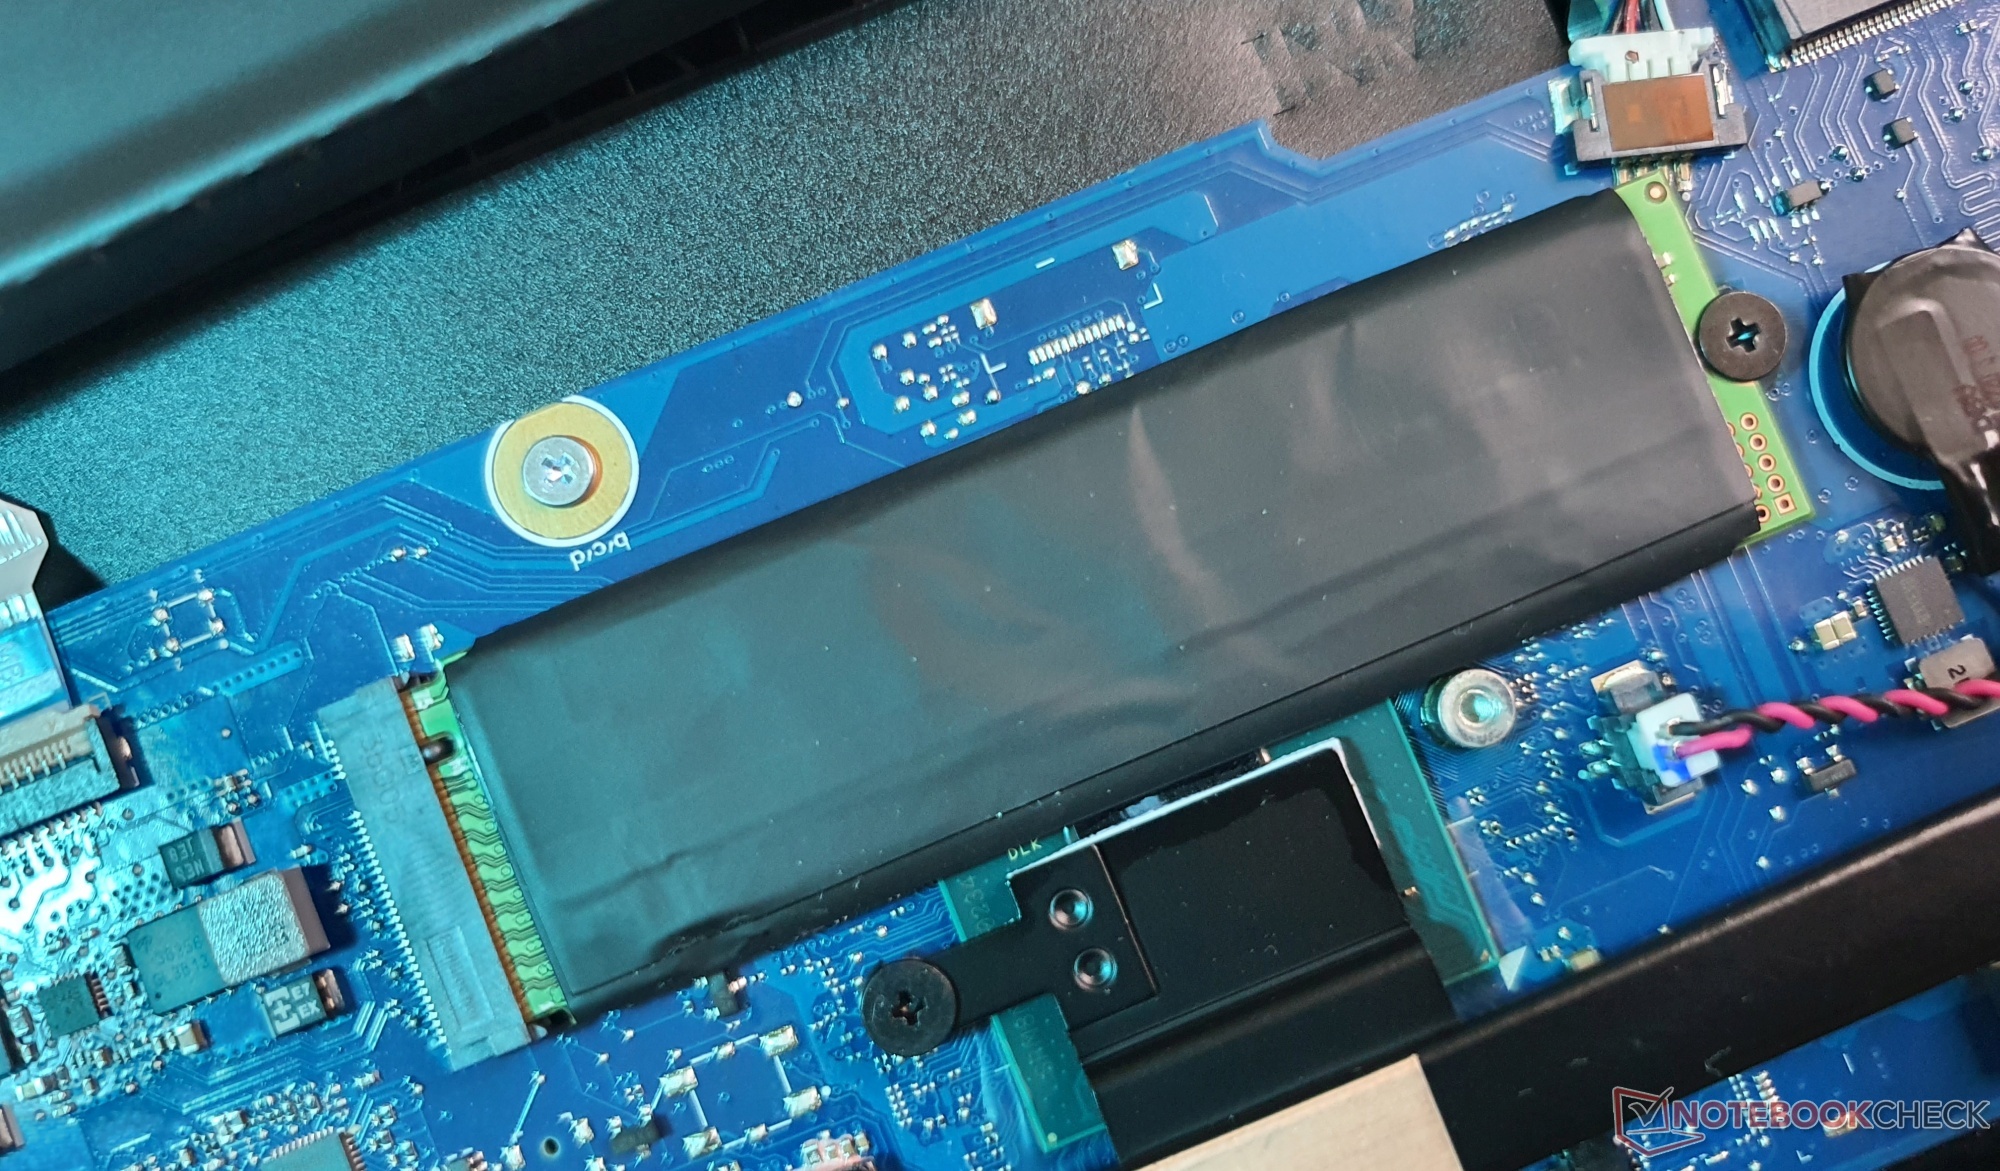
After removing eleven Phillips screws, you can easily access the inside of the case. There are two memory banks and two M.2-2280 slots, which also support SSDs fitted on both sides. The WiFi chip and BIOS battery can also be replaced. The battery is held in place by the case screws and the bottom shell, so that it initially looks as if it is lying loose in the case.
Warranty
Acer gives the laptop a one-year limited warranty, with extended service plans available via Acer Care Plus.
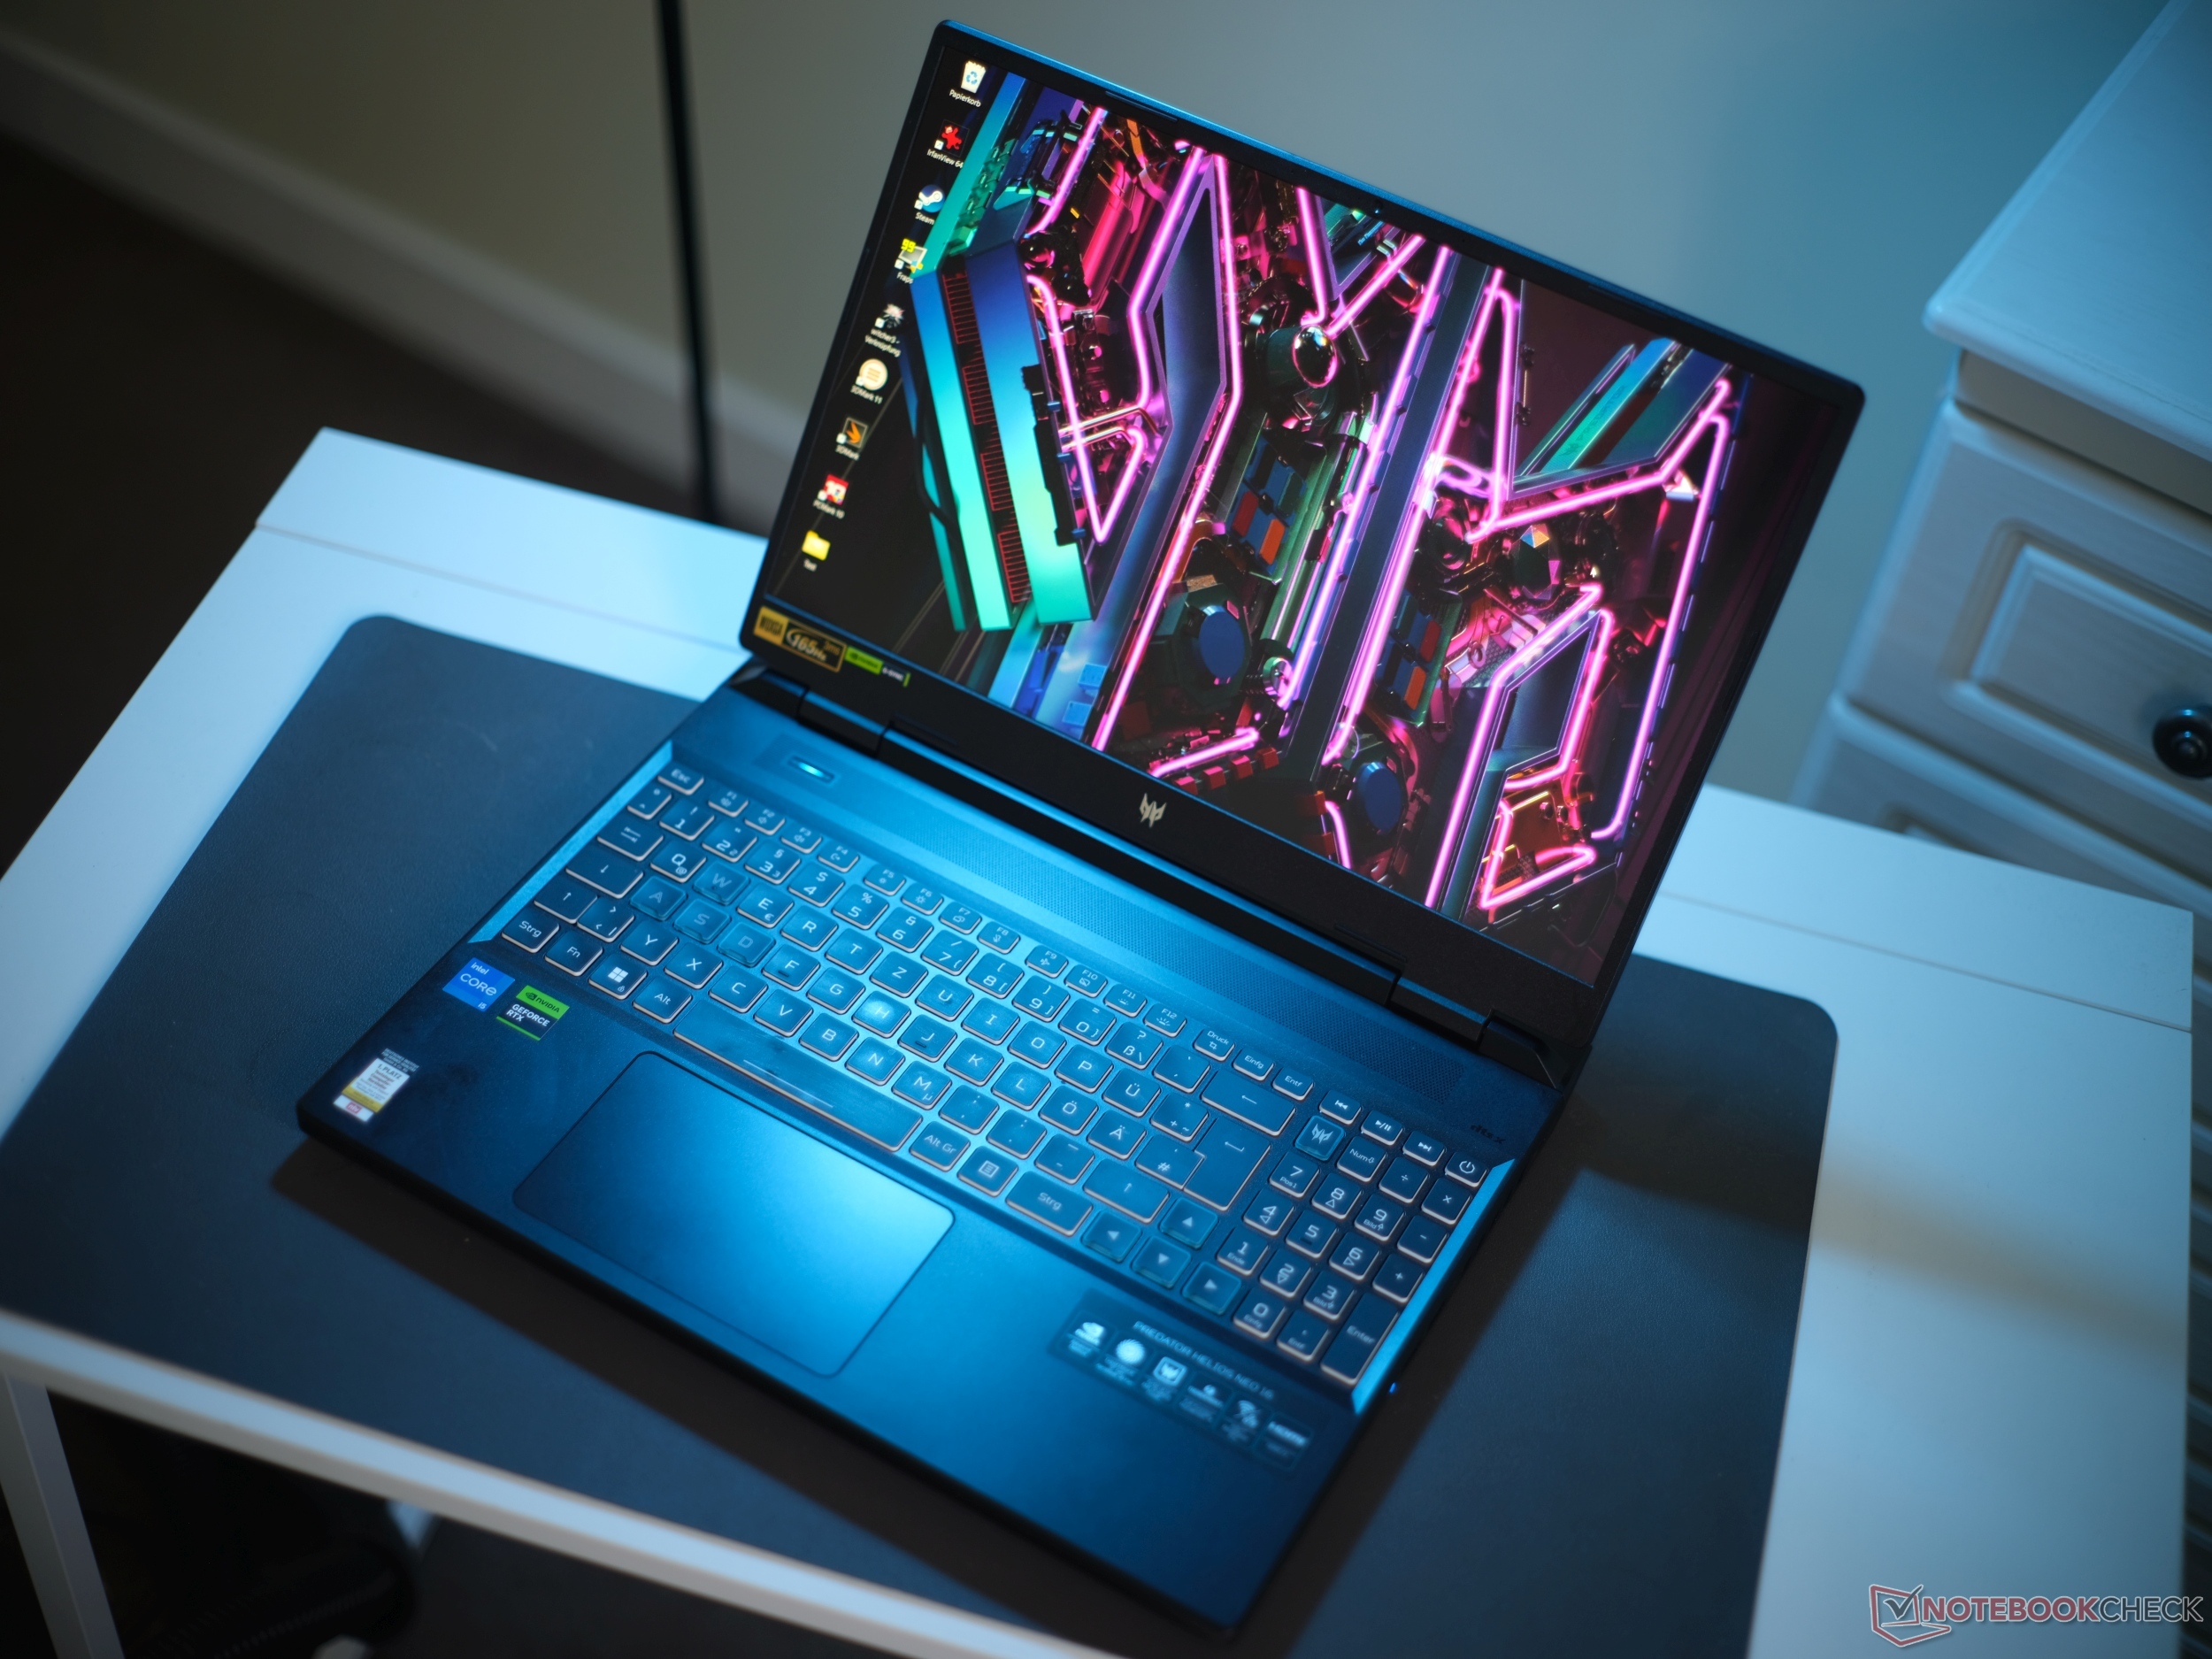
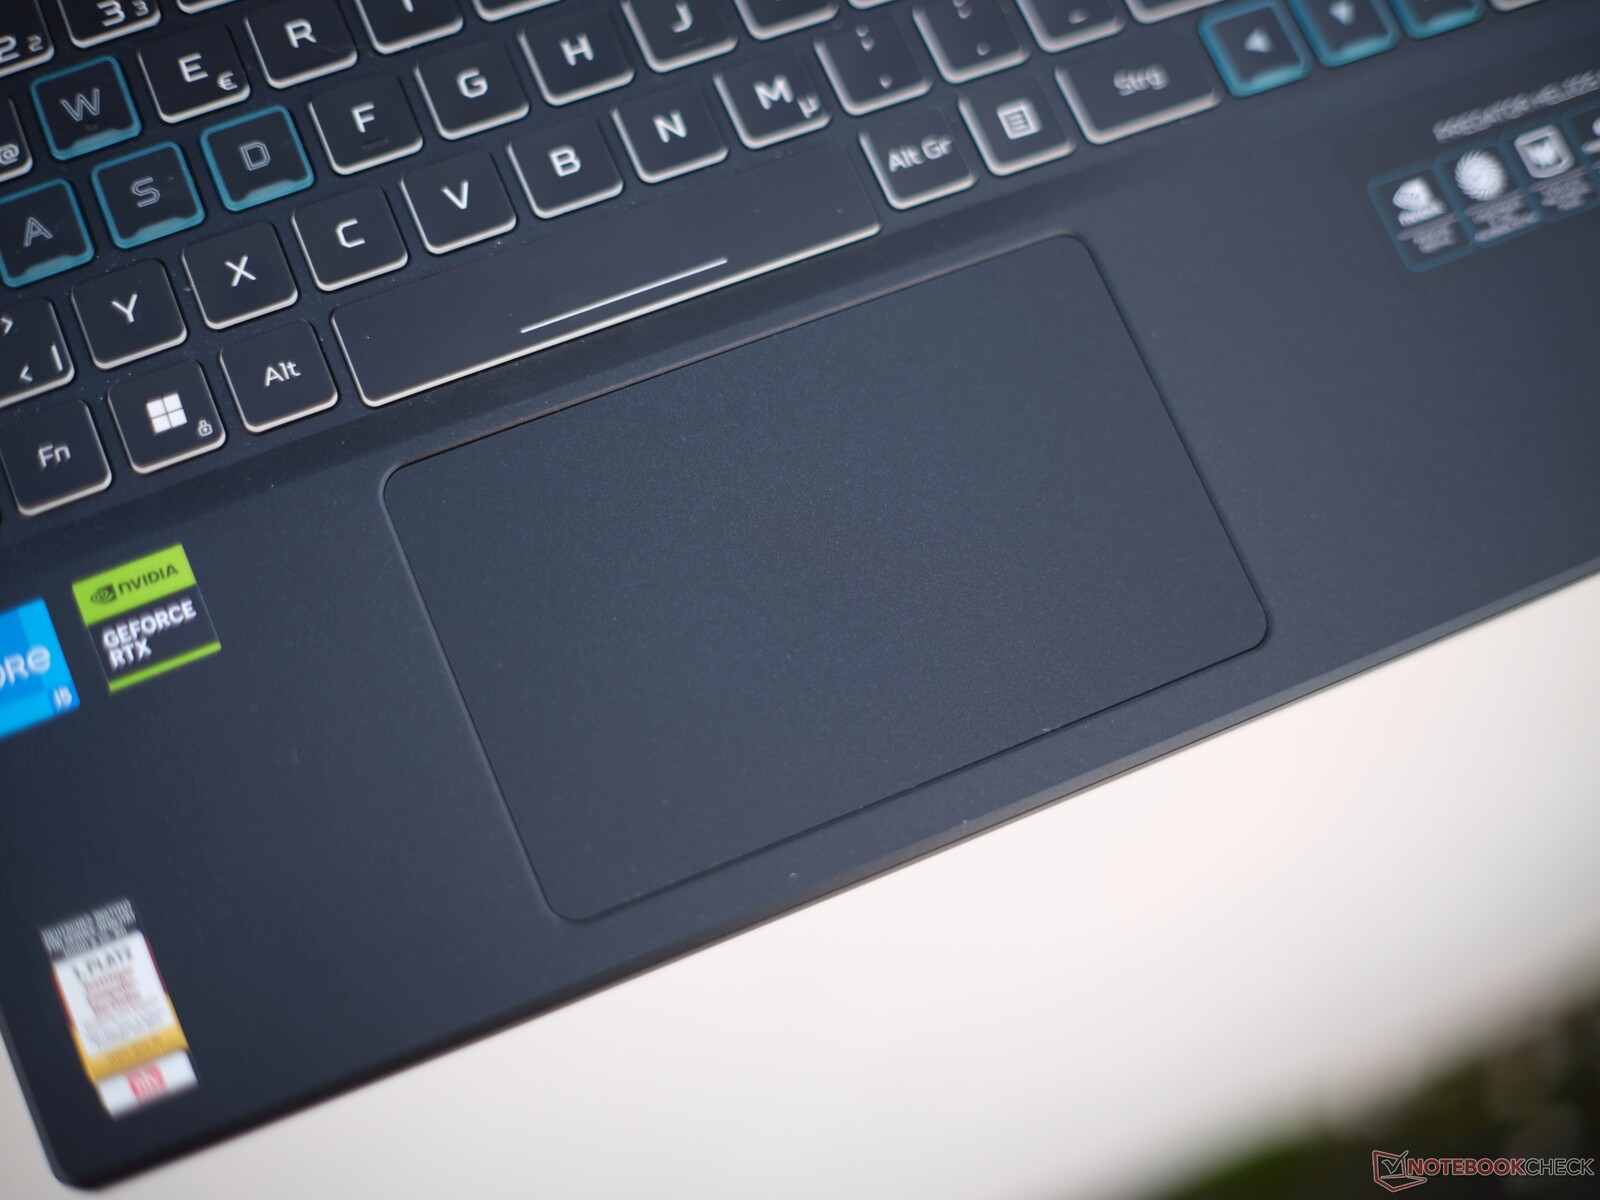
Input devices: Solid standard features with four-zone RGB lighting
Keyboard
Acer has installed a 6-row chiclet keyboard with sufficiently large keys and spacing into this device. This has almost nothing in common with the keyboard of the Helios 16, but it is similar in mechanics and appearance to the keyboards of many inexpensive gaming laptops, such as the XMG Apex 15, Gigabyte G5 or Captiva Advanced gaming laptops. It is the exact same as on the Acer Nitro 16.
Its generous key lift of 1.5 mm is accompanied by a clearly noticeable pressure point. However, the keys' resistance could have been a little clearer. The keyboard warps ever so slightly when typing (which, by the way, is very quiet), but this is not a problem in everyday use. The layout is actually pretty nice, but the right shift key is a little too small due to the arrow keys being regular-sized, while the left shift key is even smaller.
Acer has given this keyboard a four-zone RGB illumination with four intensity levels, while the non-Neo version has a particularly even micro-LED illumination. While the logo button on the numeric keypad launches the Predator Sense app, the permanently lit button at the top left is used to switch between the performance modes.

Touchpad
The 12.6 x 8.3 mm touchpad works very precisely and is nice and smooth, although it is made from plastic and not glass like the Helios 16's is. It is easy to scroll and perform multi-touch gestures. The integrated click buttons have a short lift and a satisfying click.
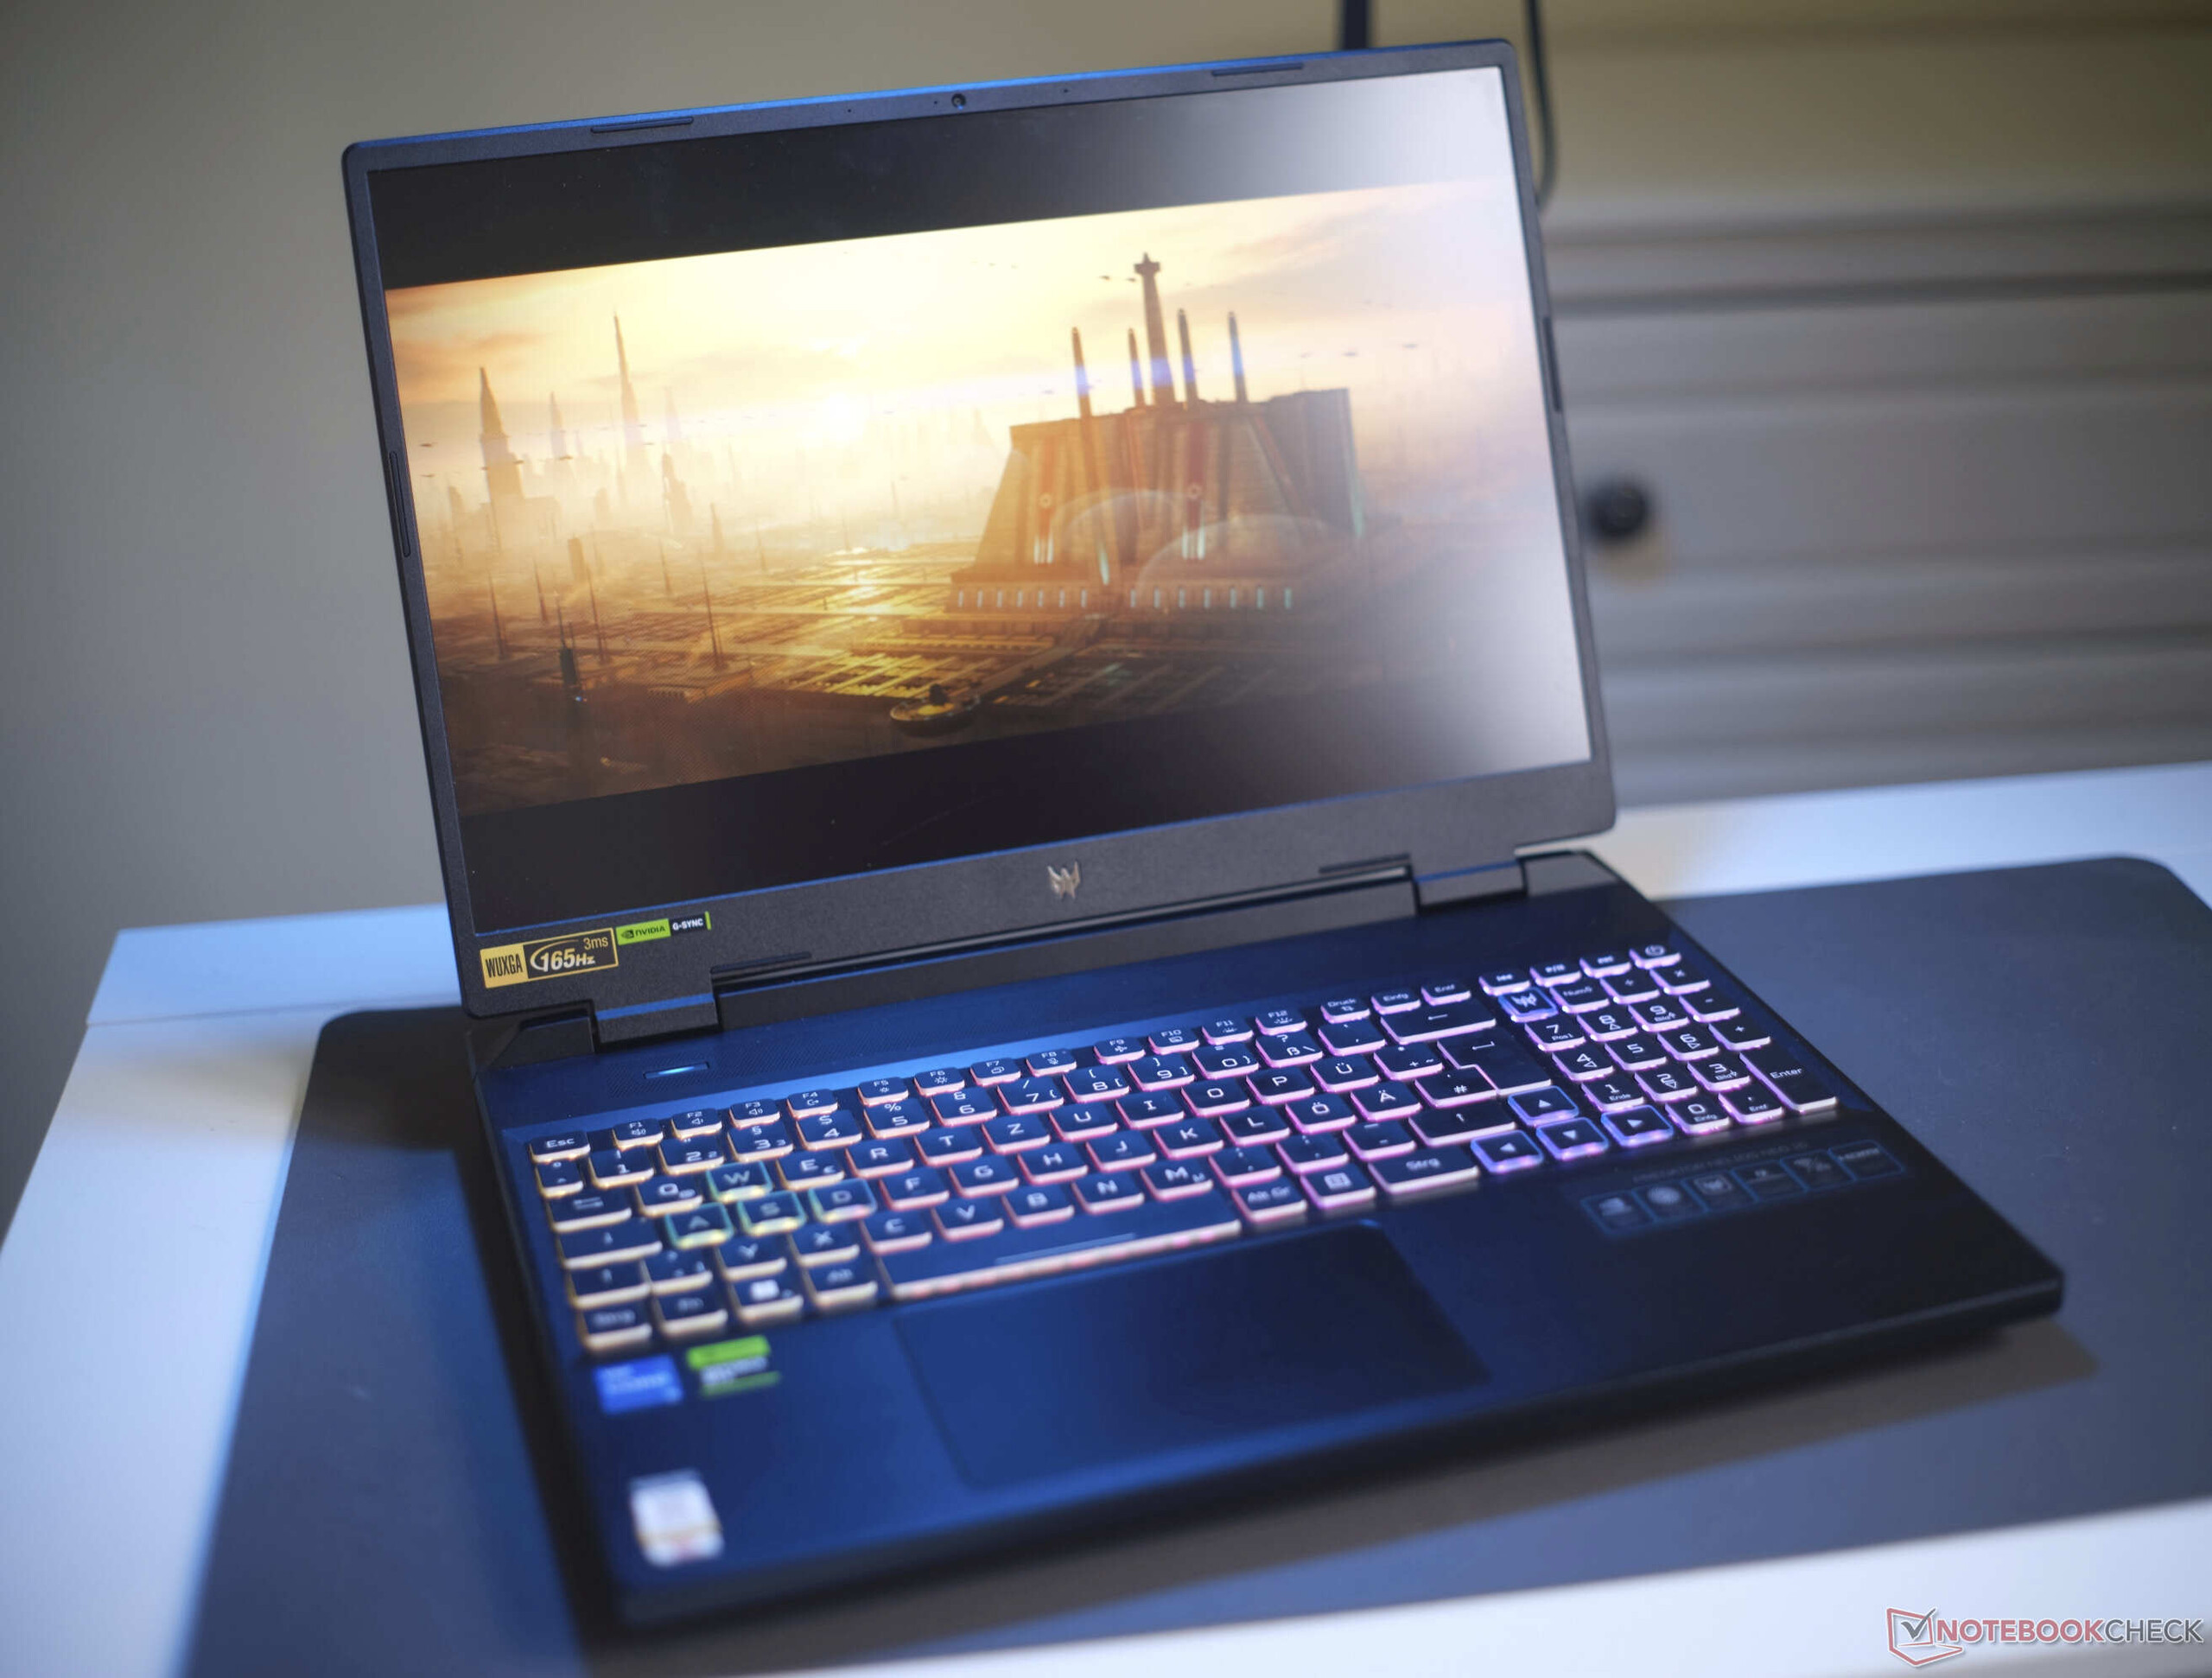
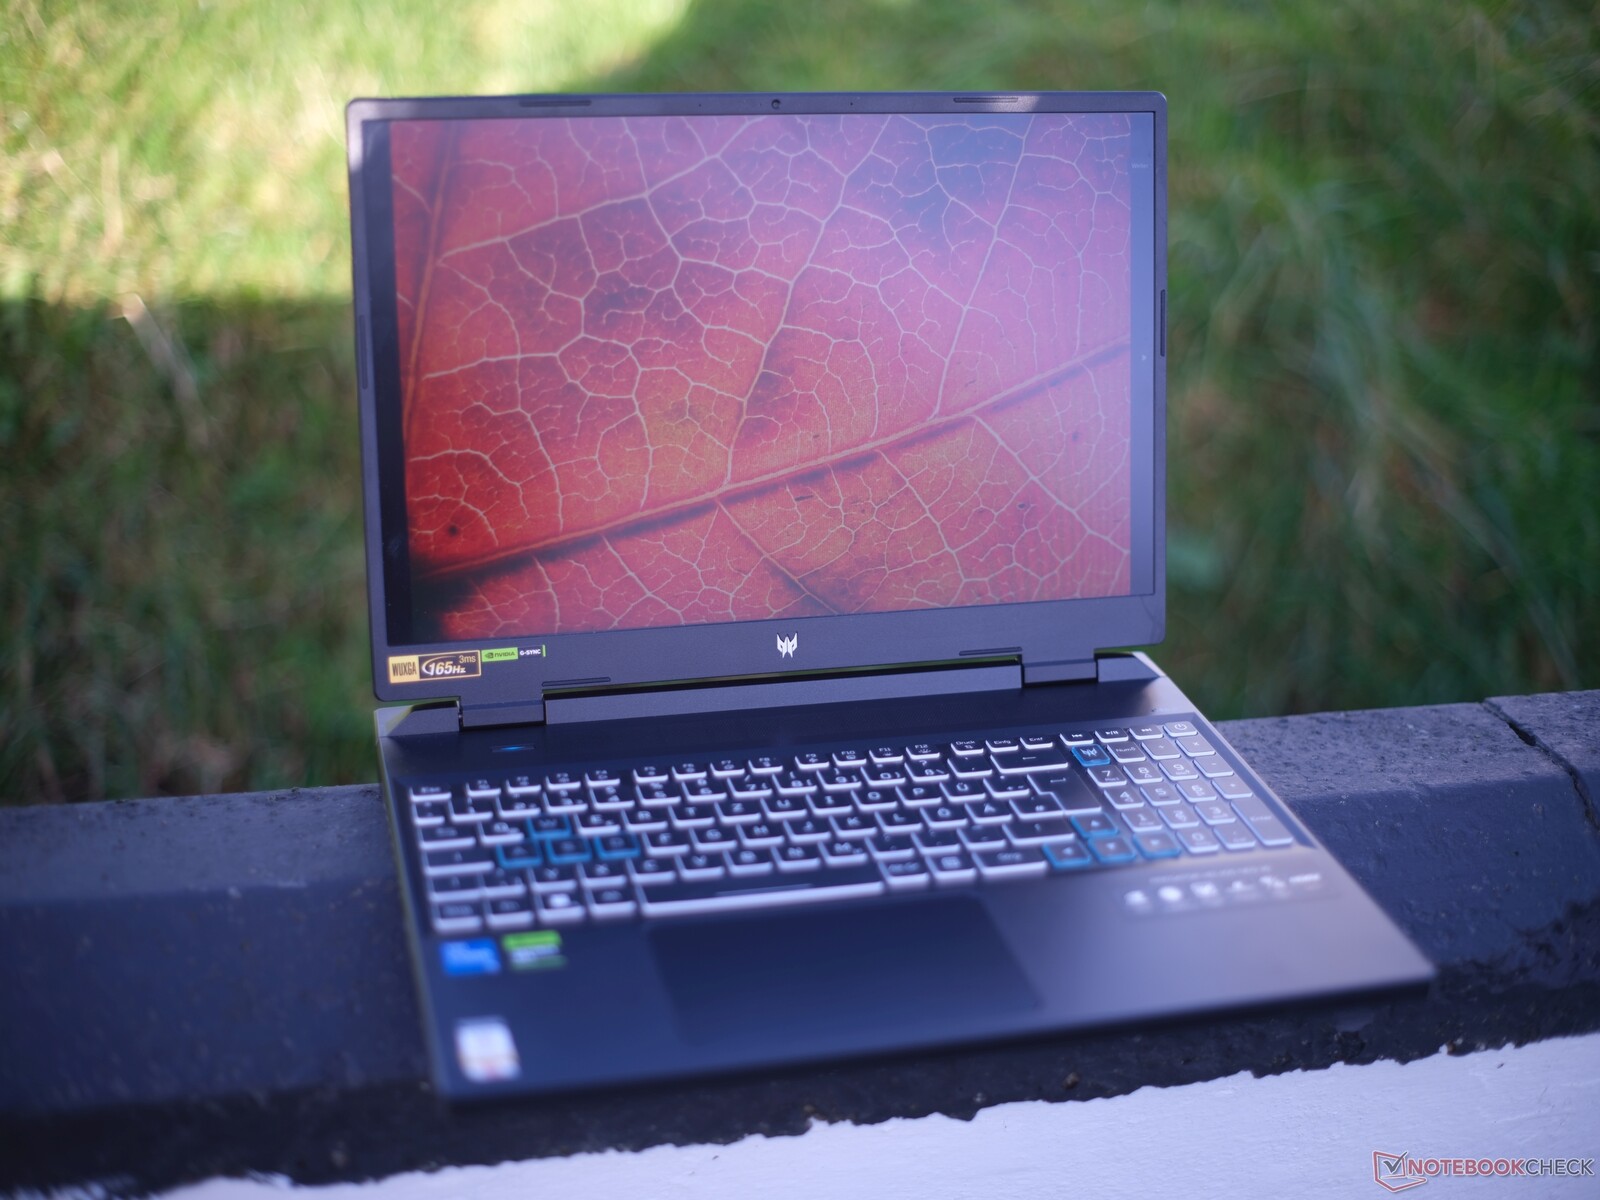
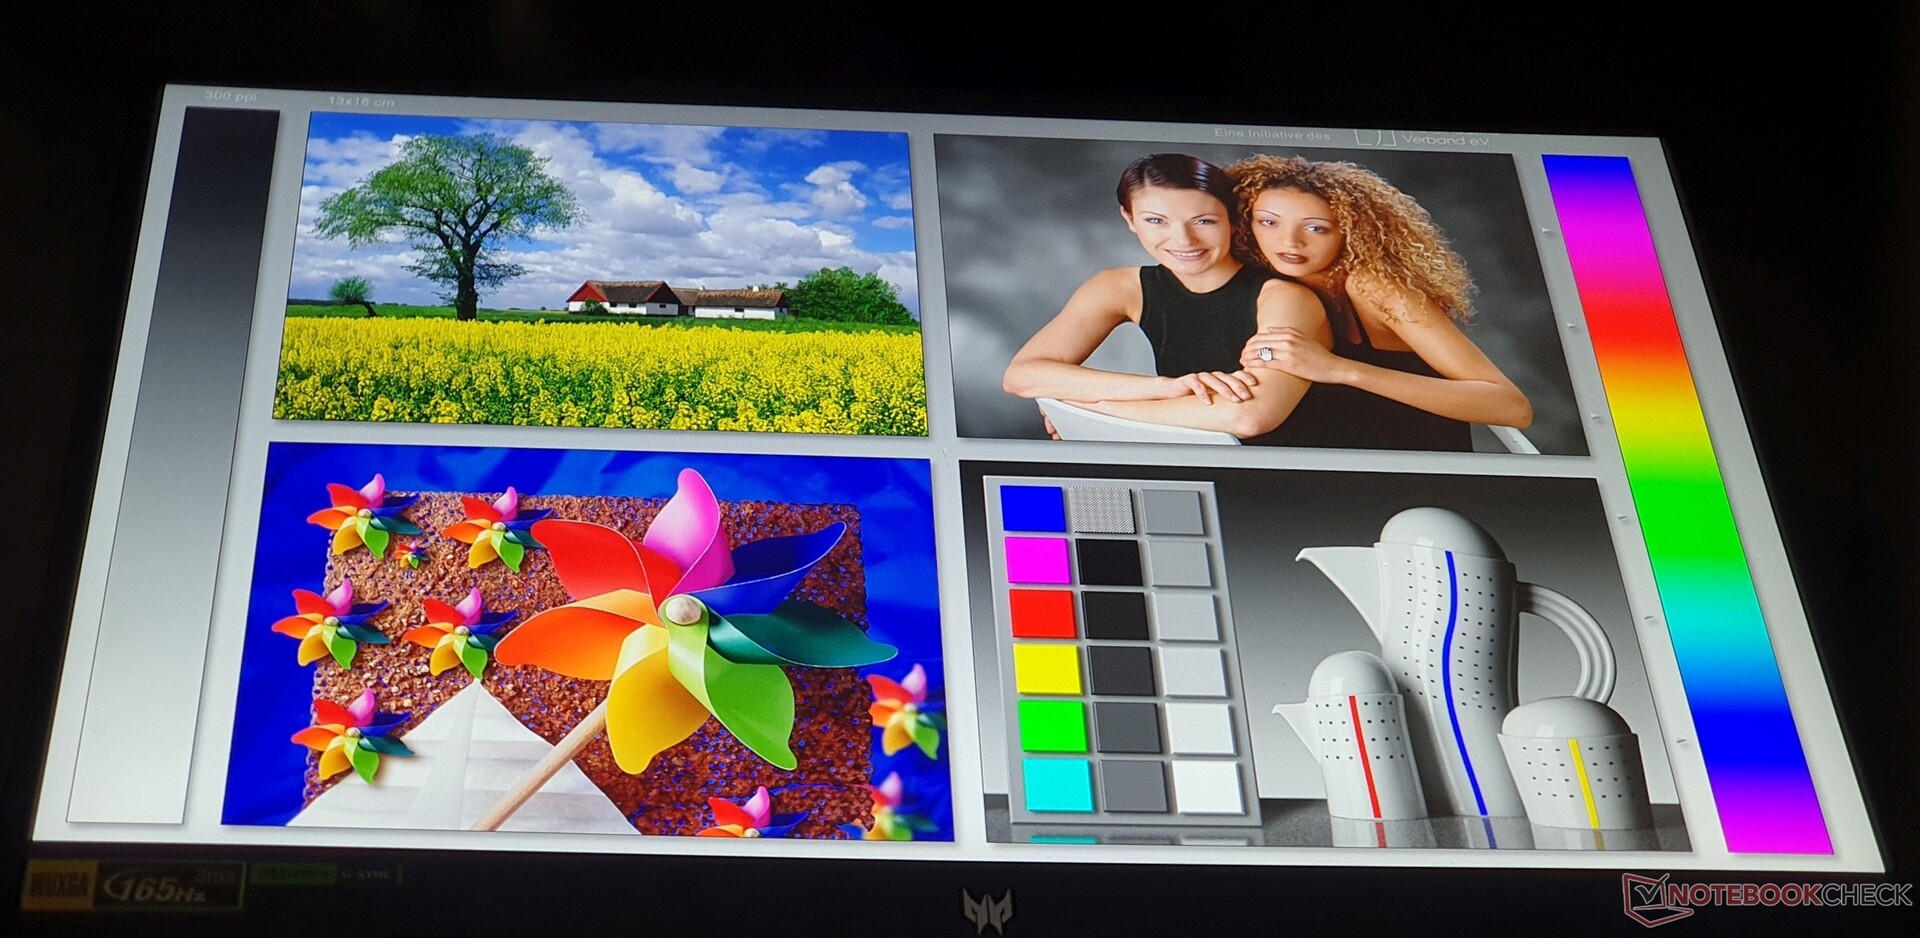
Display: The Helios Neo 16 is well-equipped for Full HD gaming


Our test device is fitted with a matte WUXGA IPS display (FHD+) with an aspect ratio of 16:10, while other variants offer a QHD option. Both panels have a refresh rate of 165 Hz.
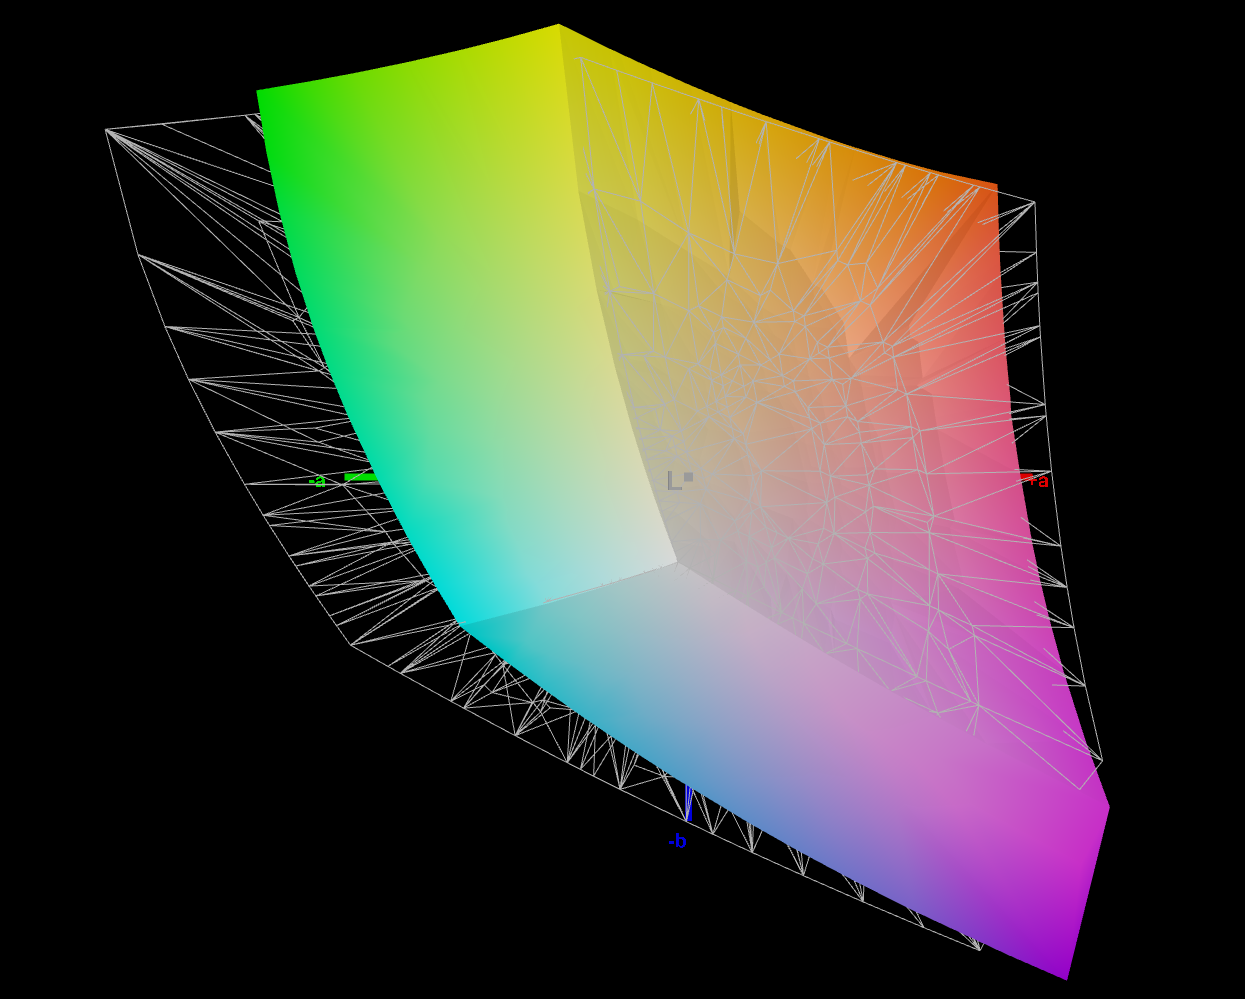
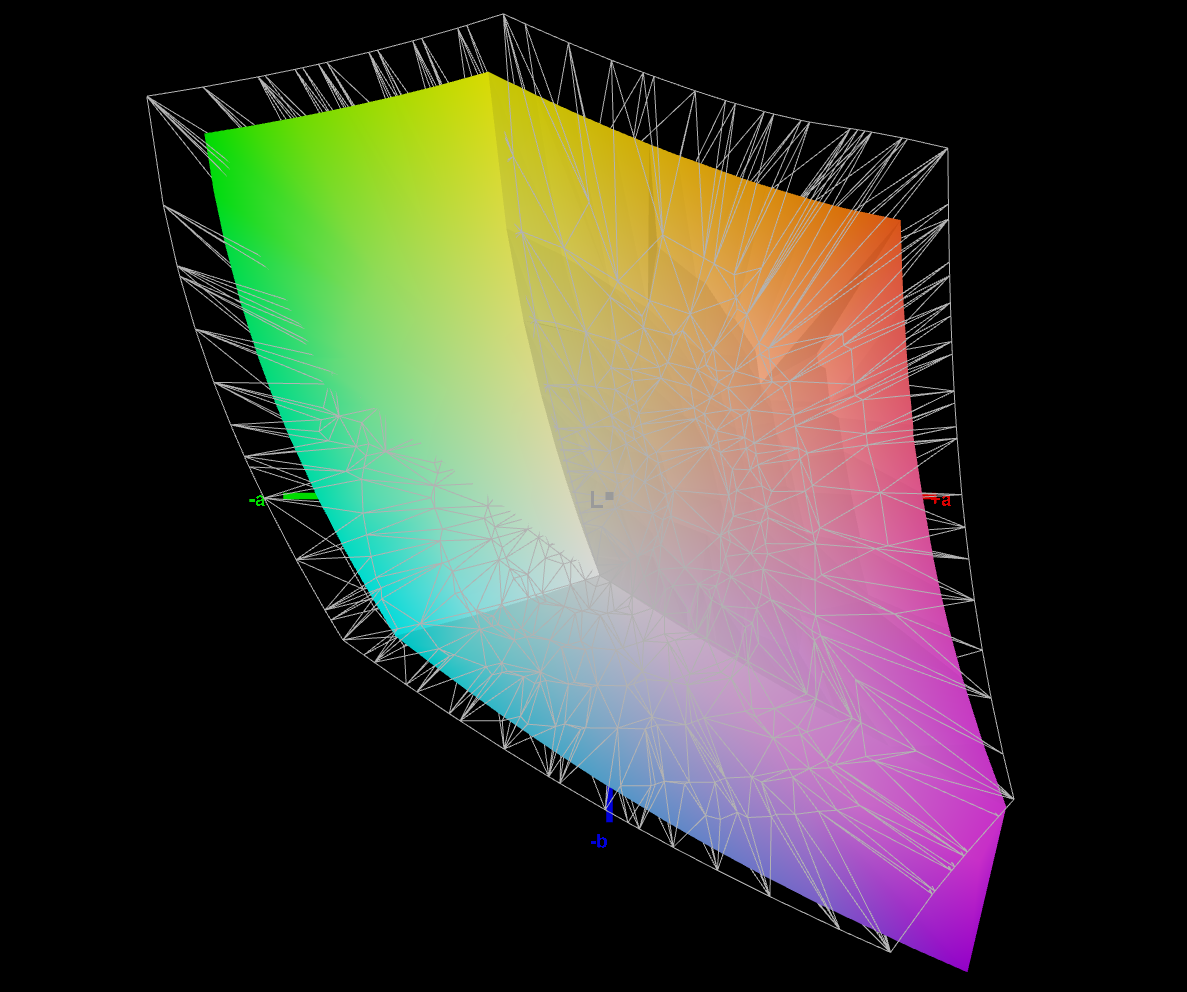
In contrast to the Predator Helios 16, the QHD option does not cover the DCI-P3 color space but is instead limited to 100% sRGB like the FHD+ variant we tested. 373 cd/m² is sufficiently bright — in our comparison field, only the Legion Pro 5 shines brighter at 516 cd/m², plus, it also offers a higher resolution at a similar price (as do the LOQ 16 and the XMG Apex 15).
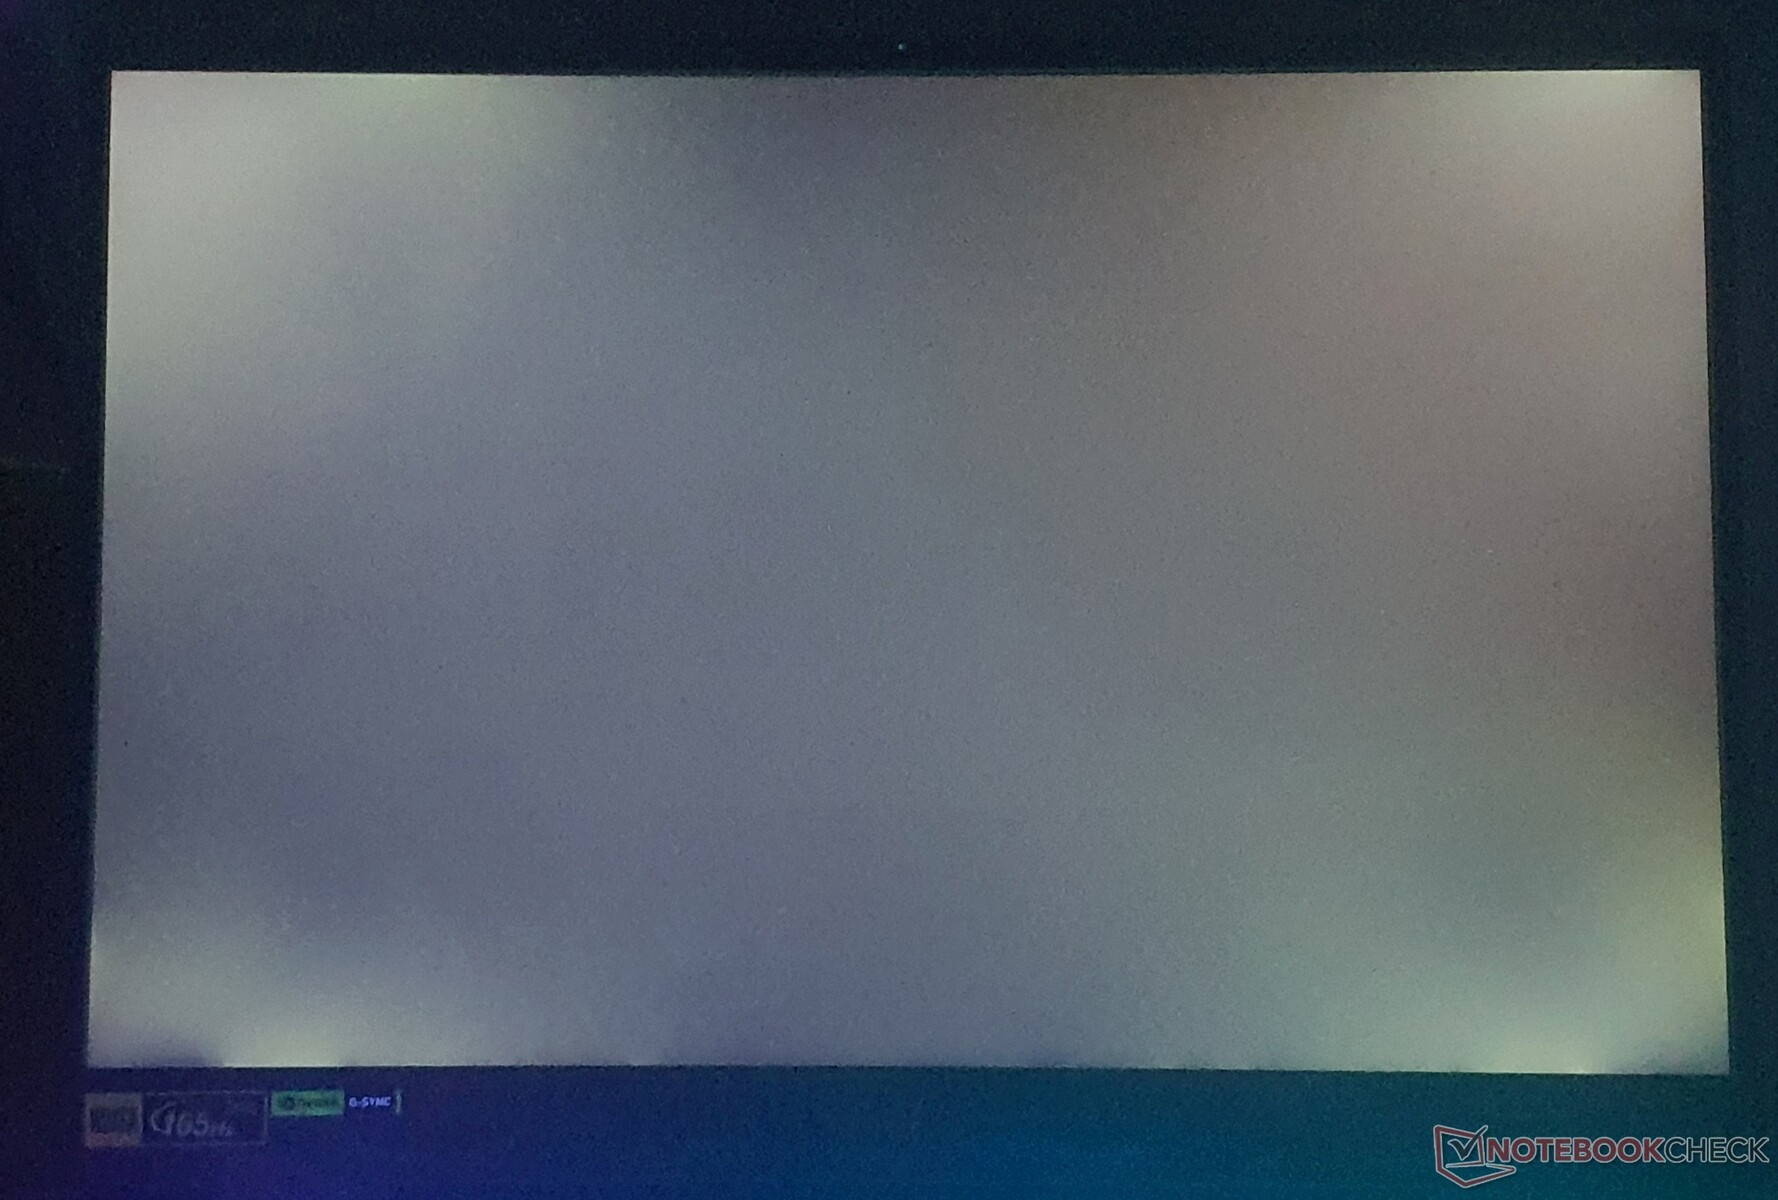
It achieved average contrast levels of 1,025:1, while its illumination of 86% isn't terribly even and we noted some clearly visible halos. PWM, which can potentially lead to eye discomfort or headaches, is at least not used on this device.
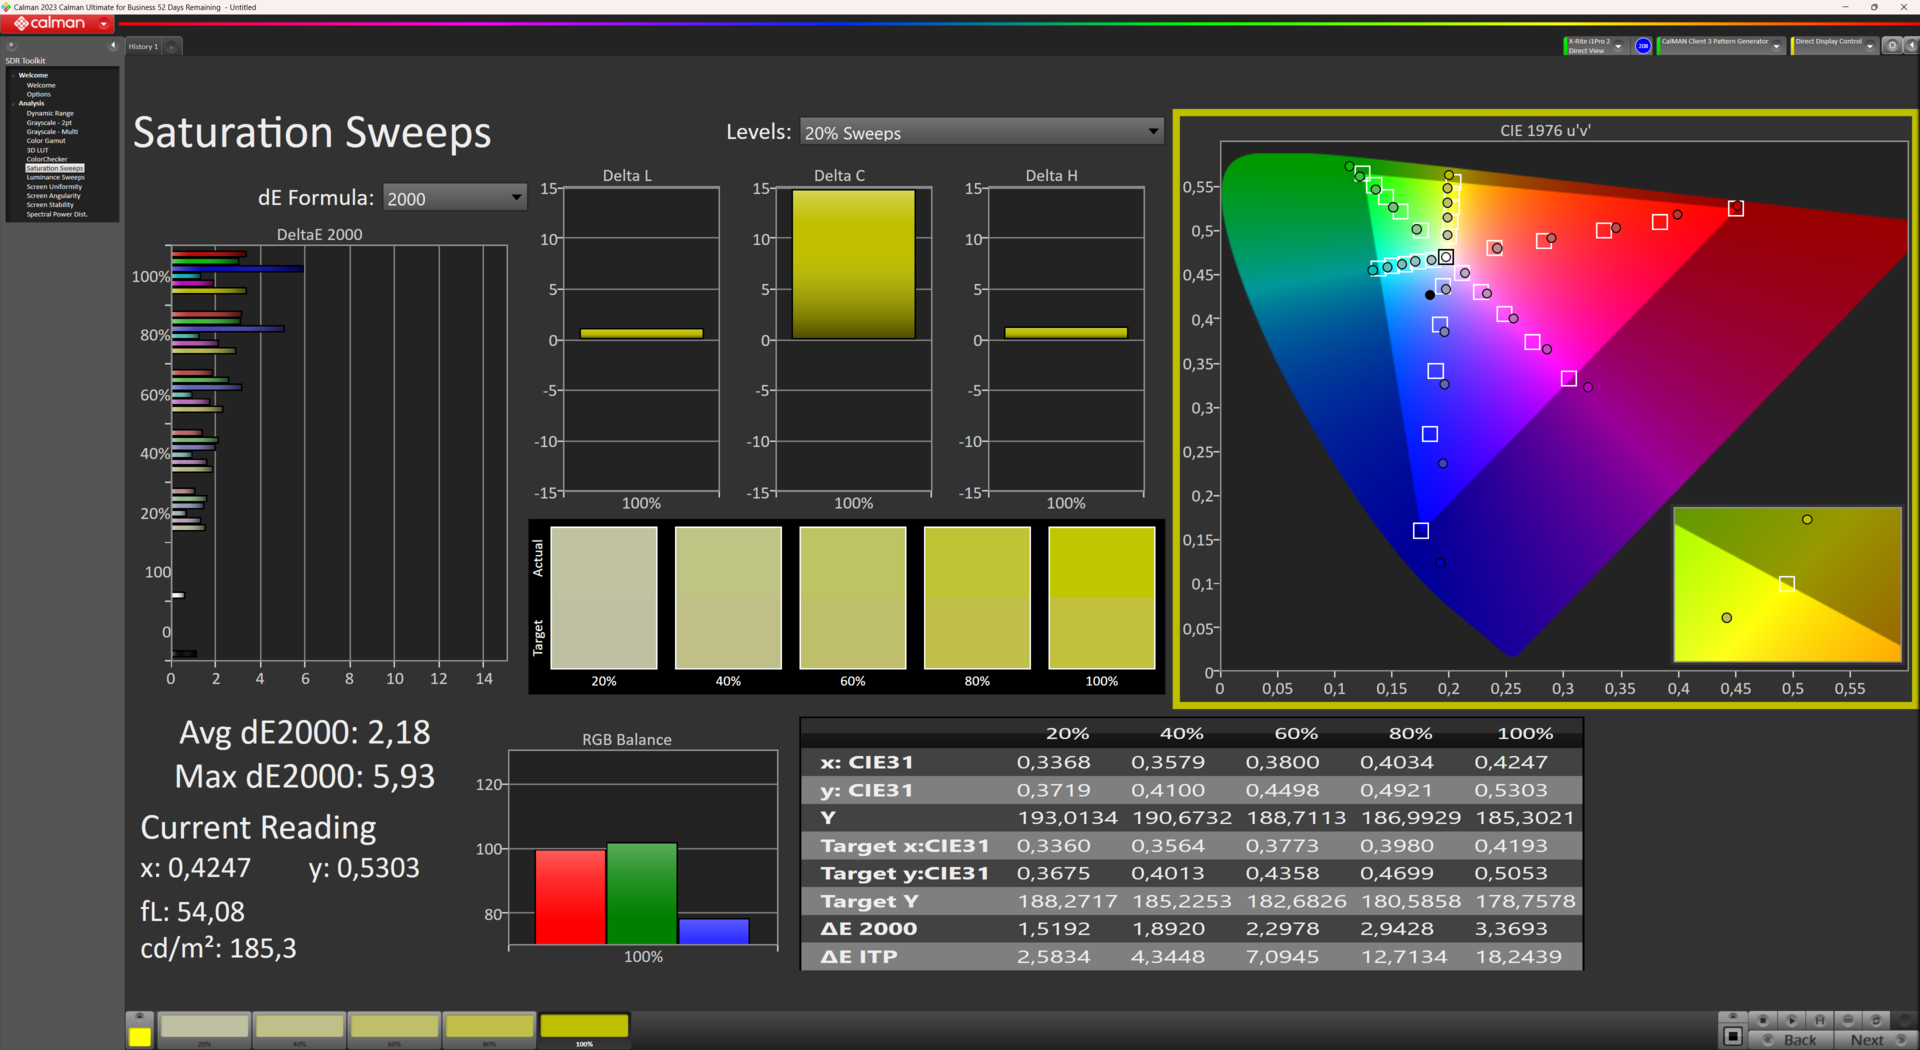
The screen's response times of 8 ms (gray-to-gray) and 8 ms (black-to-white) are short — only the Dell G15 5530 stands out with response times of only 3.4 ms (gray-to-gray). Nvidia G-Sync is also supported. Overall, the display looks nice and colorful, which is probably due to its DCI-P3 color space coverage of at least 80%.
| |||||||||||||||||||||||||
Brightness Distribution: 86 %
Center on Battery: 422.2 cd/m²
Contrast: 1025:1 (Black: 0.41 cd/m²)
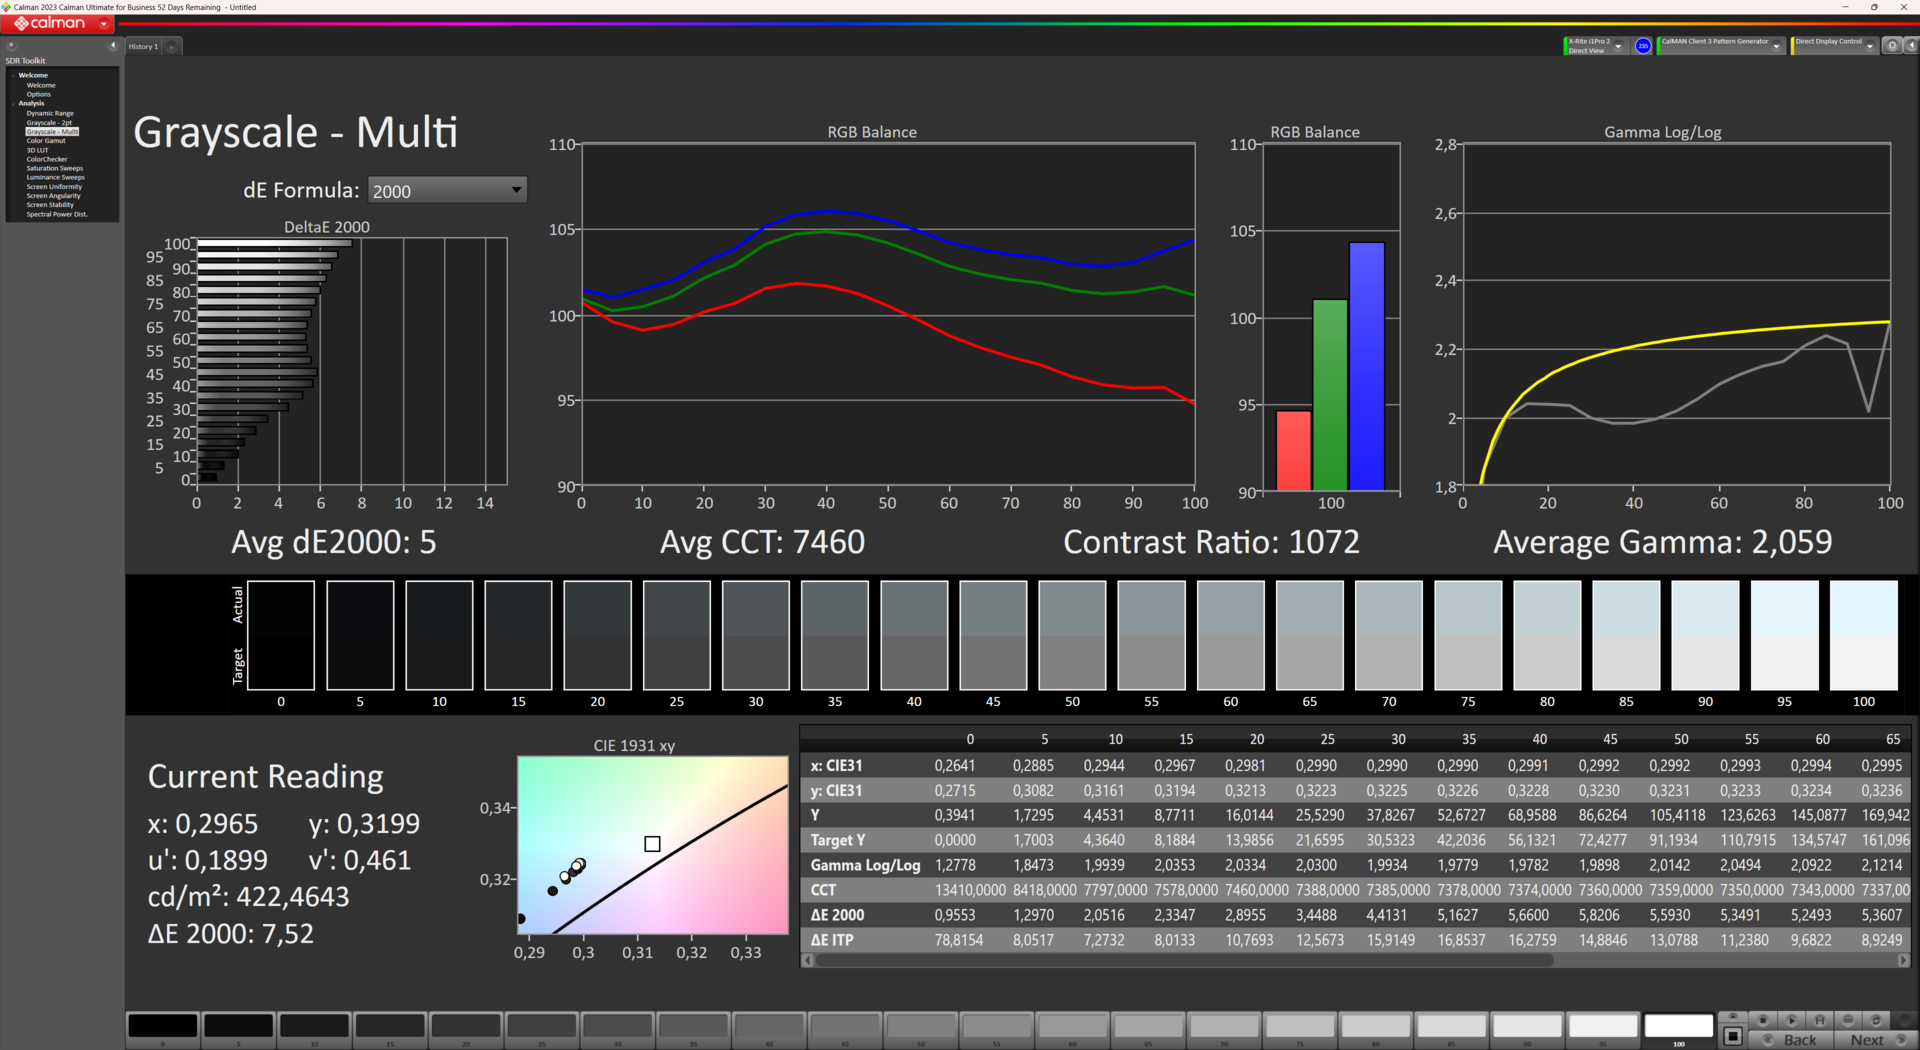
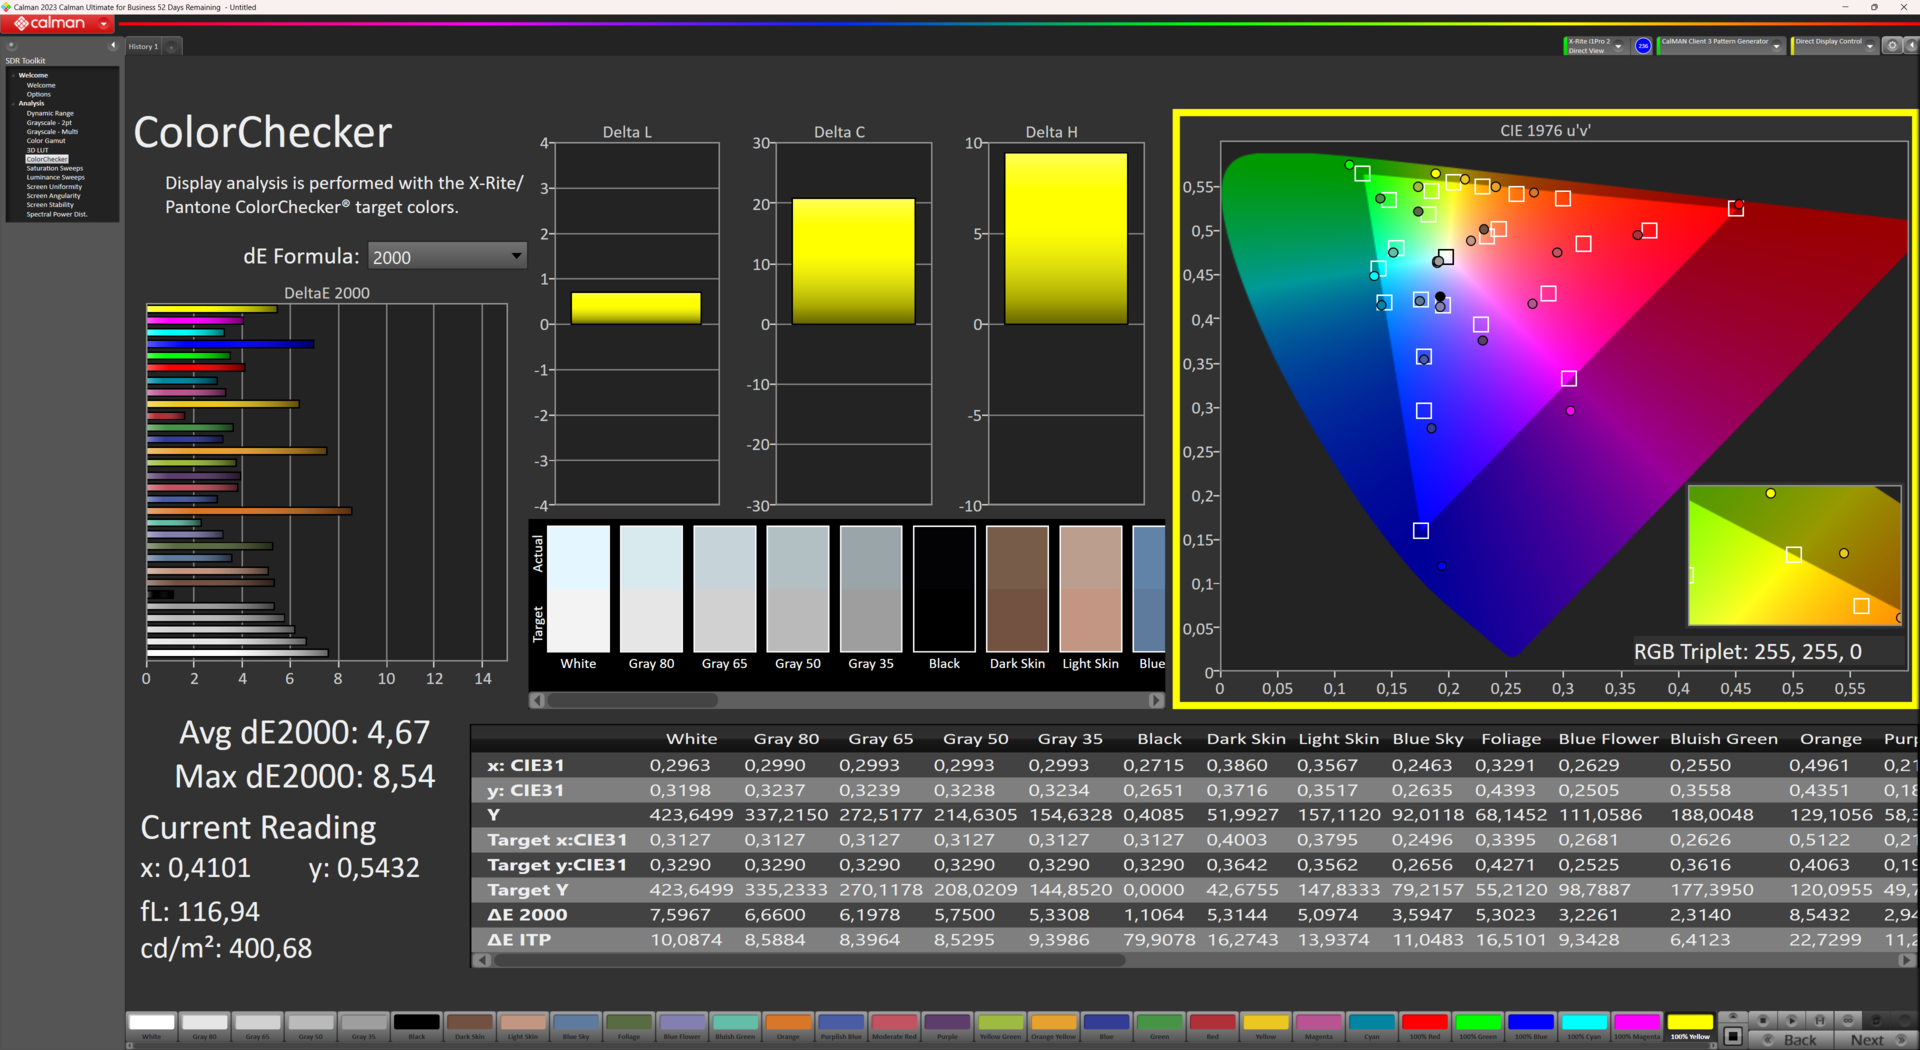
ΔE ColorChecker Calman: 4.67 | ∀{0.5-29.43 Ø4.73}
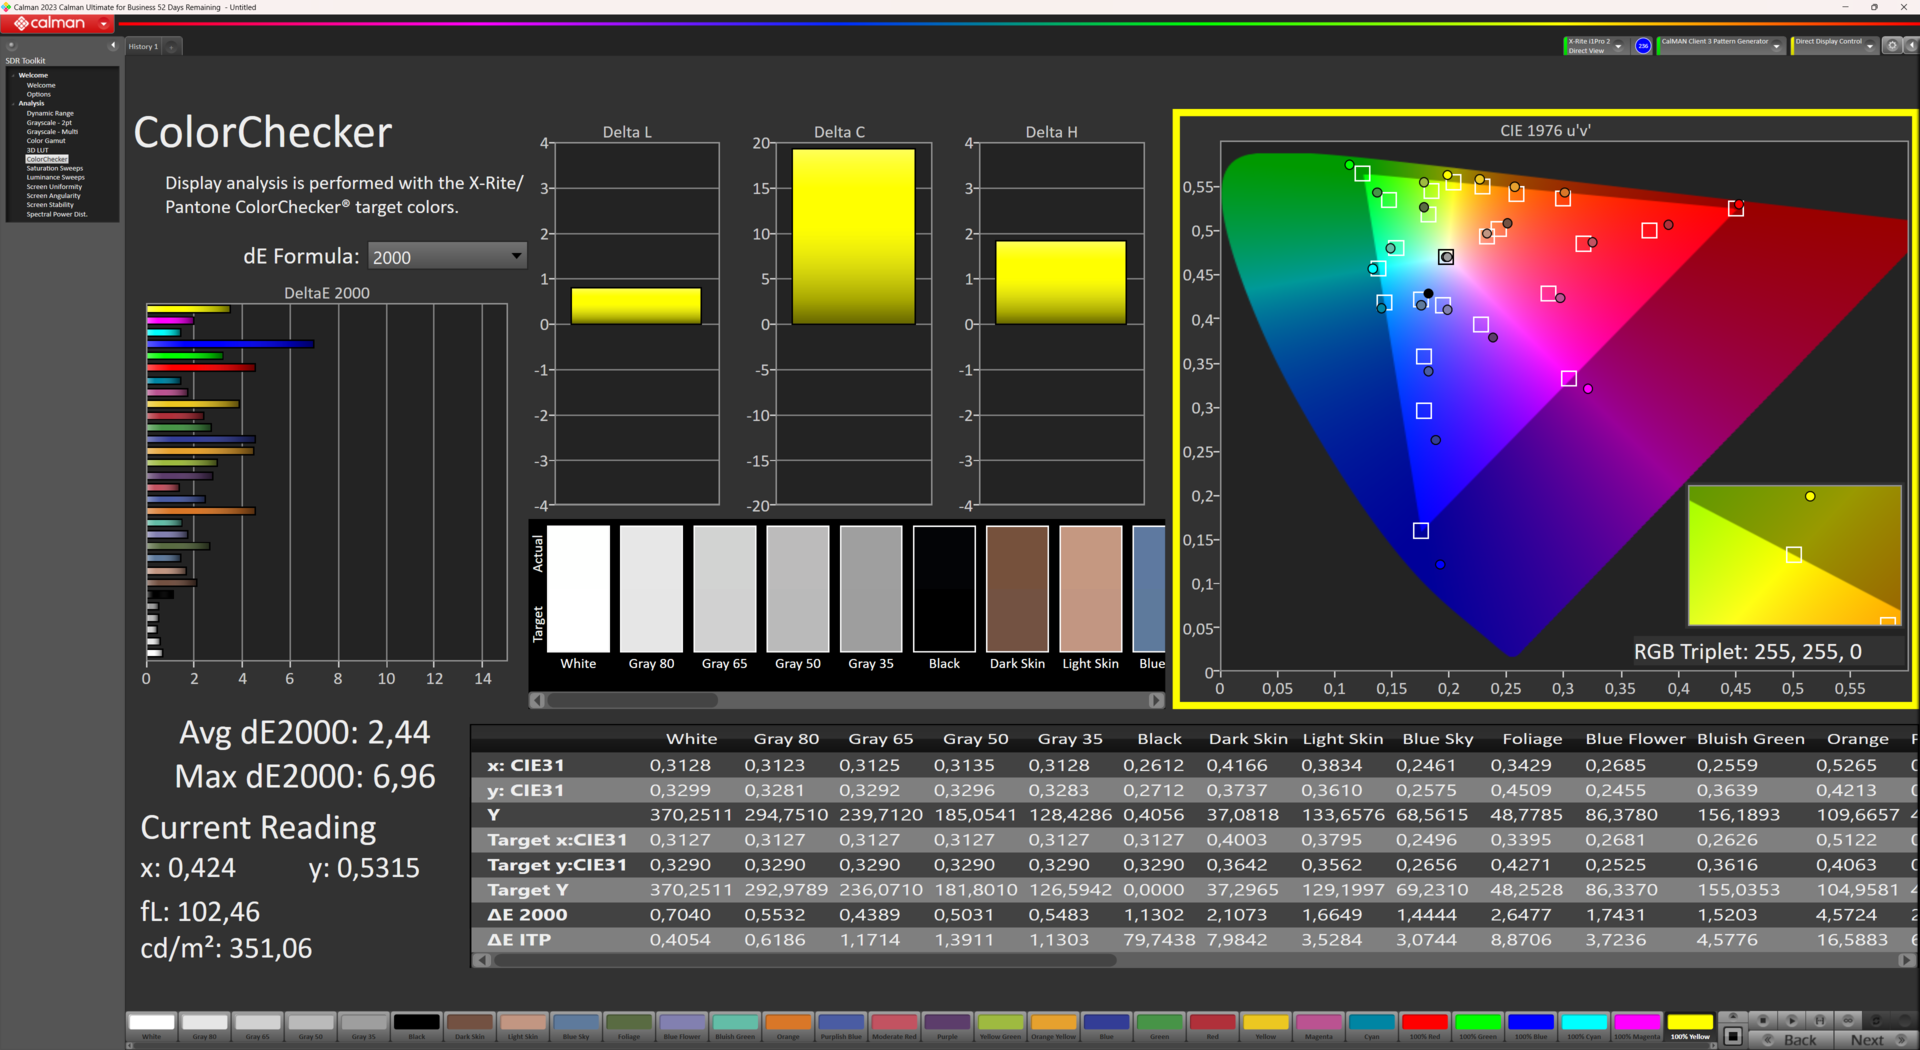
calibrated: 2.44
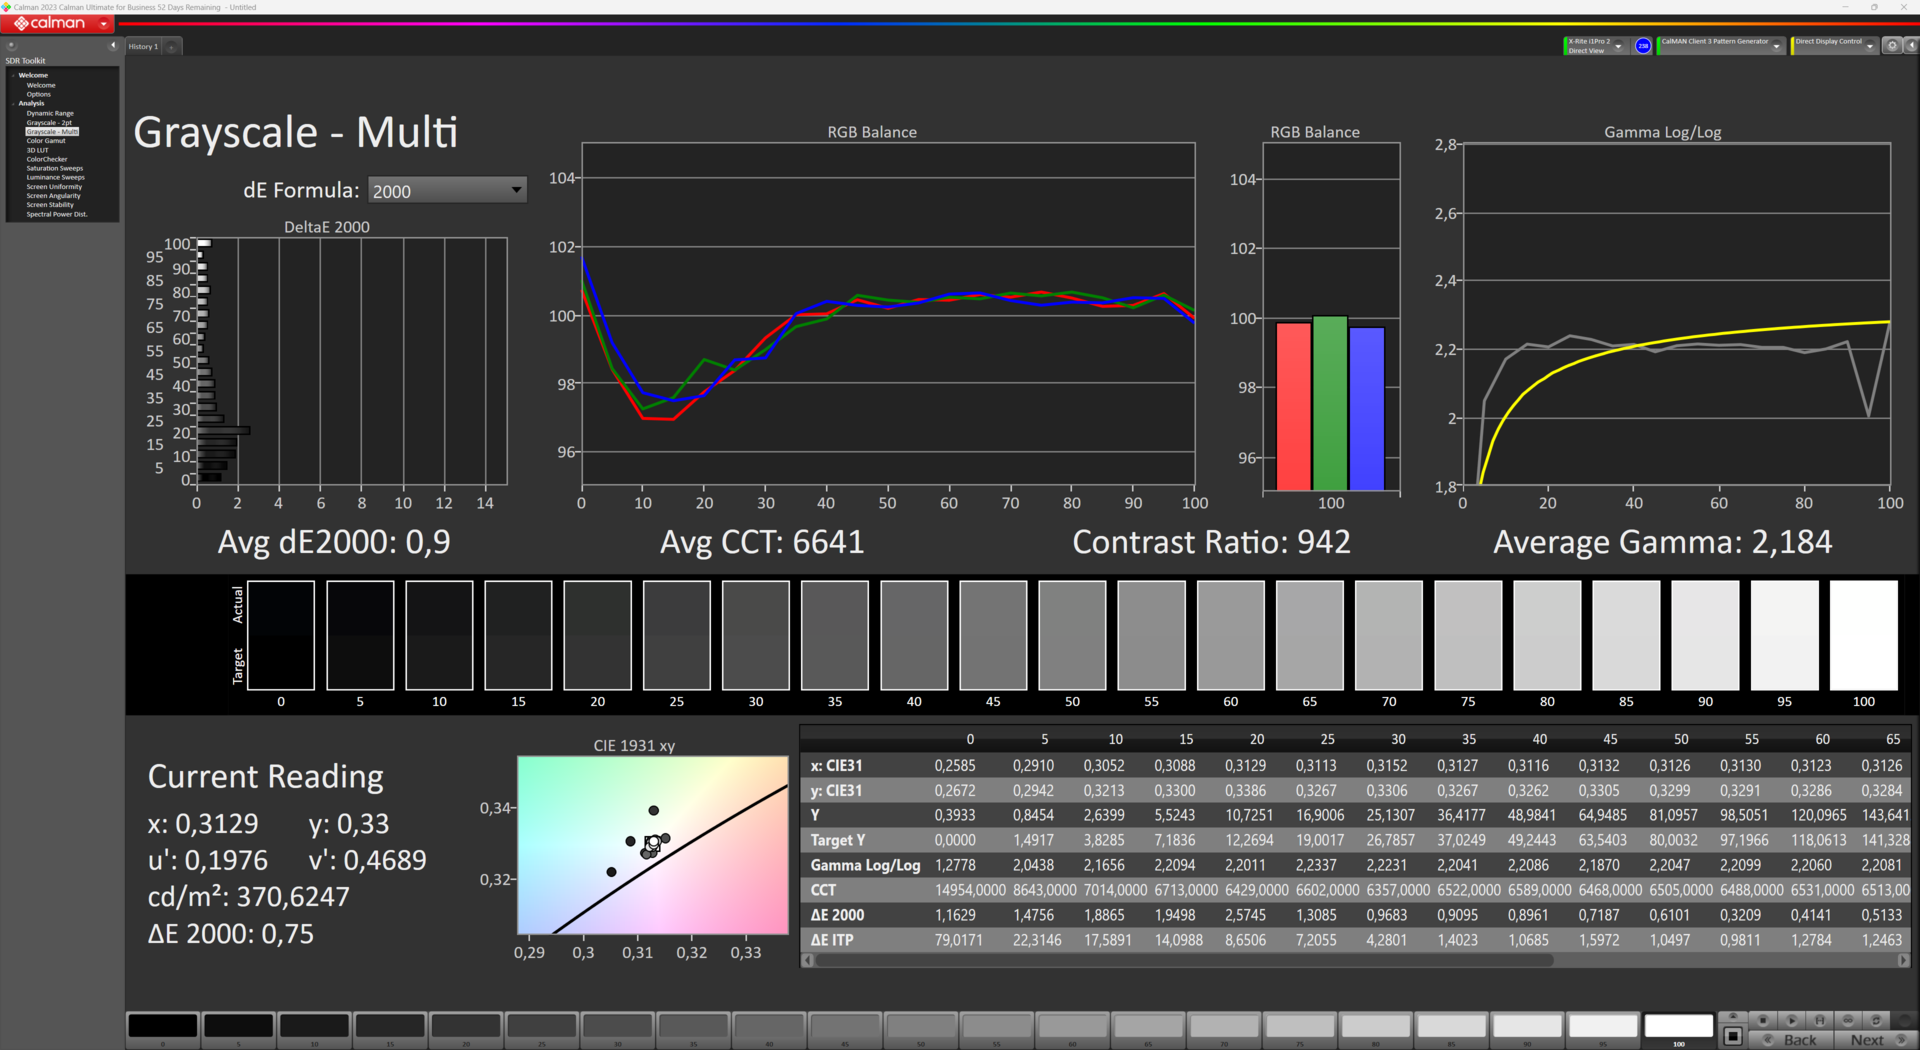
ΔE Greyscale Calman: 7.52 | ∀{0.09-98 Ø4.97}
71.36% AdobeRGB 1998 (Argyll 3D)
99.16% sRGB (Argyll 3D)
79.56% Display P3 (Argyll 3D)
Gamma: 2.184
CCT: 6641 K
| Acer Predator Helios Neo 16 NH.QLTEG.002 B160UAN01.Q, IPS, 1920x1200, 16" | Lenovo Legion Pro 5 16ARX8 (R5 7645HX, RTX 4050) CSOT T3 MNG007DA2-2, IPS, 2560x1600, 16" | Lenovo LOQ 16IRH8 AUOC1A5 (B160QAN03.L), IPS, 2560x1600, 16" | Schenker XMG Apex 15 (Late 23) BOE CQ NE156QHM-NY2, IPS, 2560x1440, 15.6" | HP Victus 16-r0076TX Chi Mei CMN1629, IPS, 1920x1080, 16.1" | Dell G15 5530 AUO B156HAN, IPS, 1920x1080, 15.6" | |
|---|---|---|---|---|---|---|
| Display | -2% | -3% | -7% | -6% | -2% | |
| Display P3 Coverage (%) | 79.56 | 71.6 -10% | 70.5 -11% | 67.5 -15% | 67.5 -15% | 73.1 -8% |
| sRGB Coverage (%) | 99.16 | 99.8 1% | 98.9 0% | 97.6 -2% | 97.5 -2% | 98.4 -1% |
| AdobeRGB 1998 Coverage (%) | 71.36 | 72.9 2% | 72.6 2% | 68.9 -3% | 69.7 -2% | 74.4 4% |
| Response Times | -8% | 9% | -38% | 14% | 46% | |
| Response Time Grey 50% / Grey 80% * (ms) | 8 ? | 12 ? -50% | 7.2 ? 10% | 13.2 ? -65% | 6.18 ? 23% | 3.39 ? 58% |
| Response Time Black / White * (ms) | 8 ? | 5.2 ? 35% | 7.4 ? 7% | 8.8 ? -10% | 7.62 ? 5% | 5.35 ? 33% |
| PWM Frequency (Hz) | 21620 ? | |||||
| Screen | 31% | 27% | 18% | 32% | 12% | |
| Brightness middle (cd/m²) | 420.2 | 543 29% | 407 -3% | 336 -20% | 290 -31% | 320 -24% |
| Brightness (cd/m²) | 373 | 516 38% | 369 -1% | 307 -18% | 275 -26% | 316 -15% |
| Brightness Distribution (%) | 86 | 87 1% | 85 -1% | 77 -10% | 82 -5% | 94 9% |
| Black Level * (cd/m²) | 0.41 | 0.58 -41% | 0.45 -10% | 0.38 7% | 0.21 49% | 0.21 49% |
| Contrast (:1) | 1025 | 936 -9% | 904 -12% | 884 -14% | 1381 35% | 1524 49% |
| Colorchecker dE 2000 * | 4.67 | 1.35 71% | 1.43 69% | 1.96 58% | 1.7 64% | 4.55 3% |
| Colorchecker dE 2000 max. * | 8.54 | 3.22 62% | 3.58 58% | 5.07 41% | 3.57 58% | 9.83 -15% |
| Colorchecker dE 2000 calibrated * | 2.44 | 1.31 46% | 1.07 56% | 1.27 48% | 0.93 62% | 1.51 38% |
| Greyscale dE 2000 * | 7.52 | 1.03 86% | 1.13 85% | 2.3 69% | 1.5 80% | 6.2 18% |
| Gamma | 2.184 101% | 2.38 92% | 2.5 88% | 2.017 109% | 2.1 105% | 2.07 106% |
| CCT | 6641 98% | 6452 101% | 6526 100% | 6644 98% | 6538 99% | 6479 100% |
| Total Average (Program / Settings) | 7% /
19% | 11% /
18% | -9% /
5% | 13% /
21% | 19% /
14% |
* ... smaller is better
Since the sRGB color space is fully covered, professional image and video editing which relies on accurate colors is certainly possible — provided its rather low FHD+ resolution does not interfere with these uses.

Within our comparison field, the Helios Neo 16 is the only laptop beside the Dell G15 5530 to exceed the critical DeltaE 3 limit (up to which the human eye can perceive color deviations) with a value of 4.67 straight out of the box.
Fortunately, its DeltaE value was reduced to only 2.44 after our calibration, although blue tones still deviate significantly with a value of 7. The cyan tint could also do with being corrected. Our calibrated color profile can be downloaded here.

Display Response Times
| ↔ Response Time Black to White | ||
|---|---|---|
| 8 ms ... rise ↗ and fall ↘ combined | ↗ 4.5 ms rise |  |
| ↘ 3.5 ms fall | ||
| The screen shows fast response rates in our tests and should be suited for gaming. In comparison, all tested devices range from 0.1 (minimum) to 240 (maximum) ms. » 22 % of all devices are better. This means that the measured response time is better than the average of all tested devices (19.9 ms). | ||
| ↔ Response Time 50% Grey to 80% Grey | ||
| 8 ms ... rise ↗ and fall ↘ combined | ↗ 4.5 ms rise |  |
| ↘ 3.5 ms fall | ||
| The screen shows fast response rates in our tests and should be suited for gaming. In comparison, all tested devices range from 0.165 (minimum) to 636 (maximum) ms. » 20 % of all devices are better. This means that the measured response time is better than the average of all tested devices (31.1 ms). | ||
Screen Flickering / PWM (Pulse-Width Modulation)
| Screen flickering / PWM not detected |  | ||
In comparison: 52 % of all tested devices do not use PWM to dim the display. If PWM was detected, an average of 7804 (minimum: 5 - maximum: 343500) Hz was measured. | |||
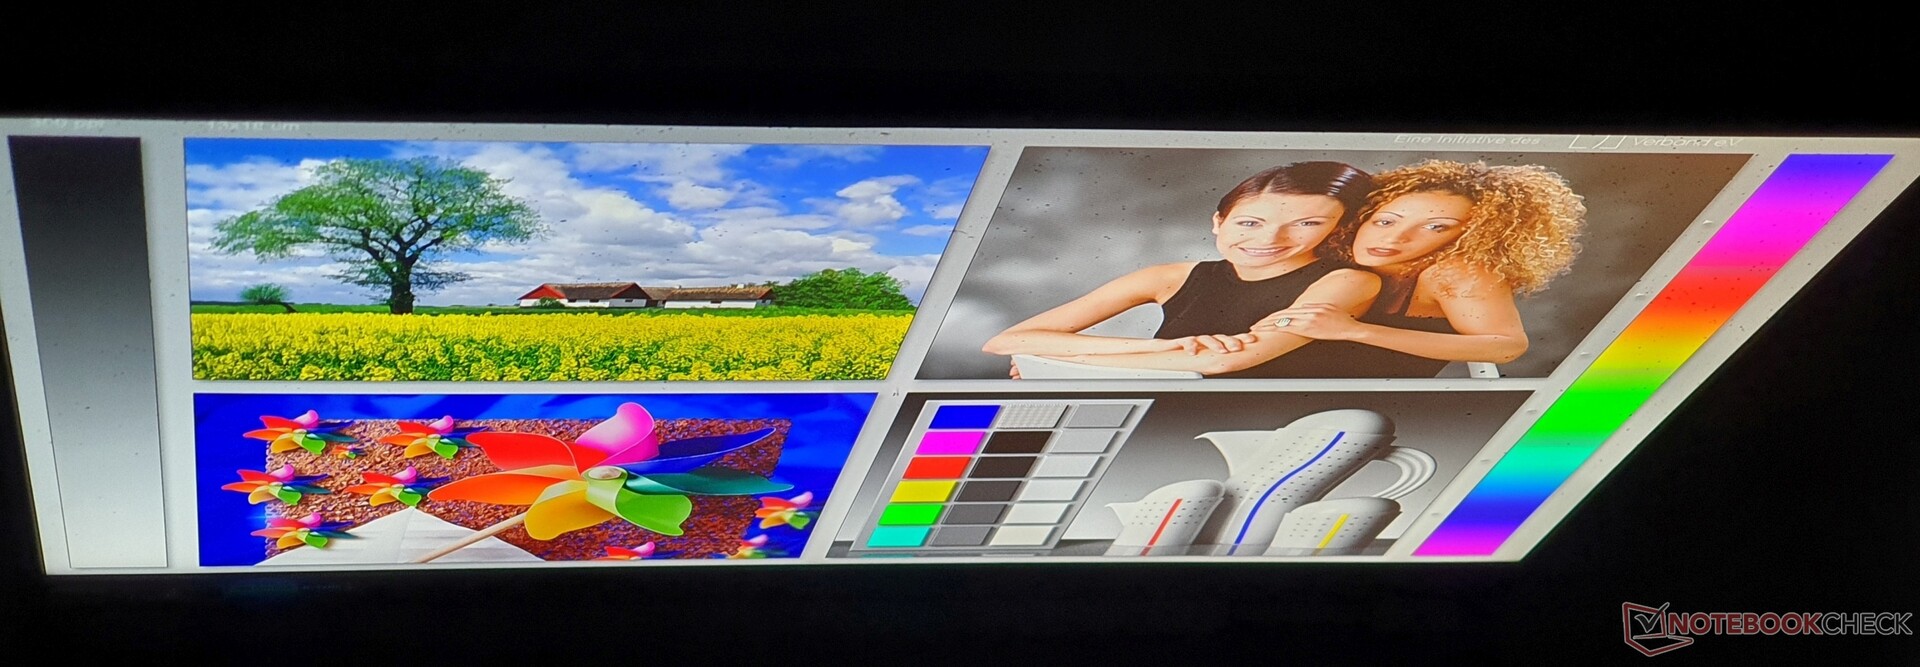
Thanks to the device's matte display surface and its brightness of 373 cd/m², the screen remains legible outside — as long as you don't sit in direct sunlight.

As is typical for IPS screens, it remains legible even from extreme viewing angles.


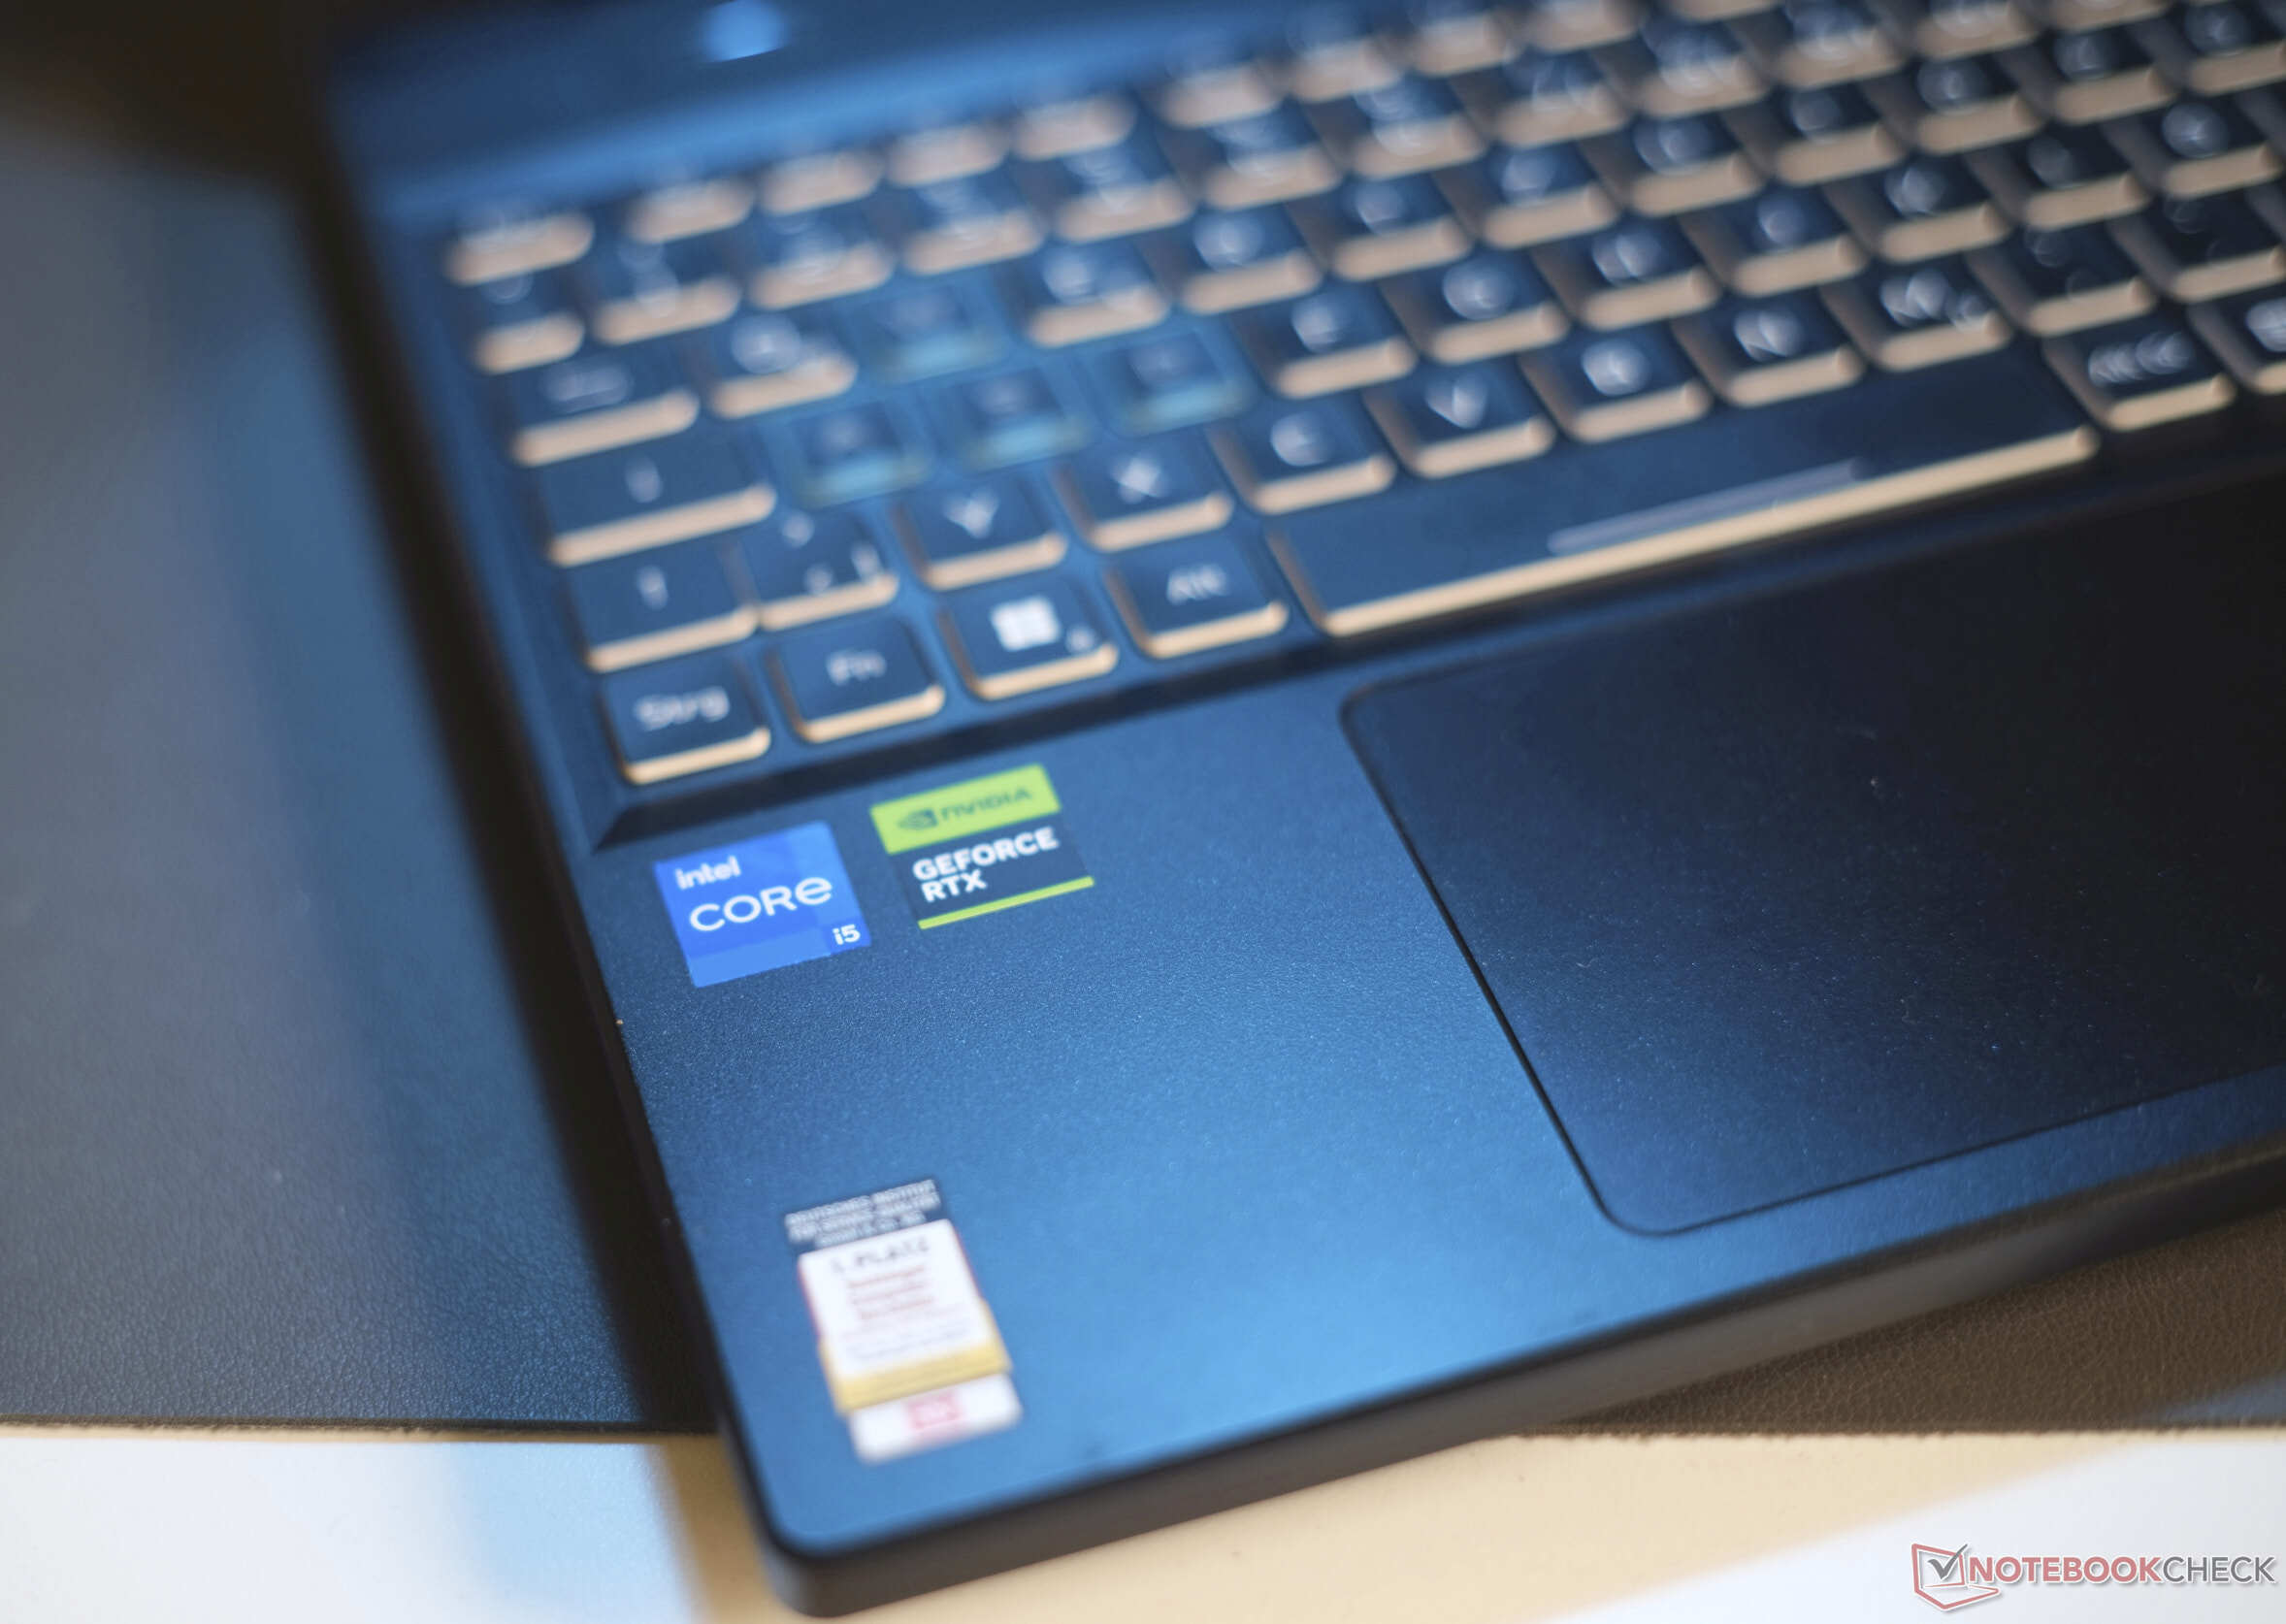
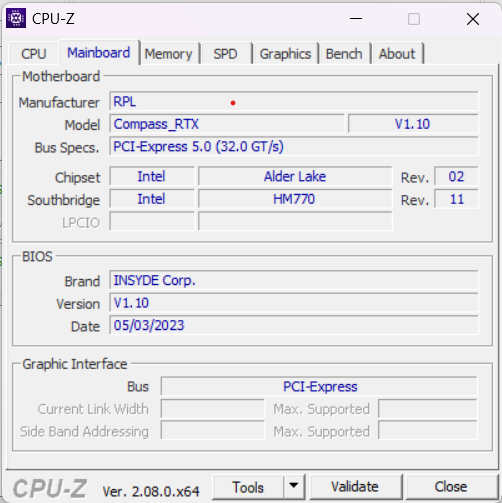
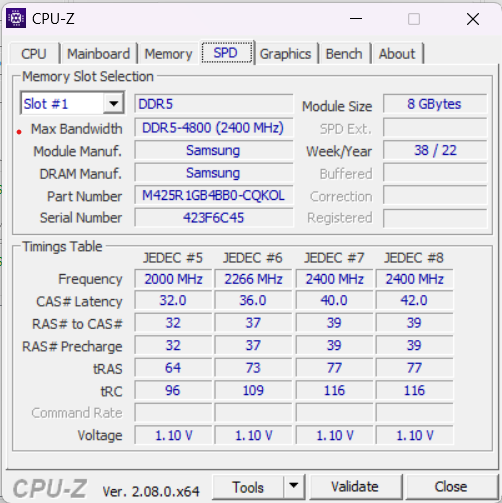
Performance: Desktop-class CPU in a mid-range gaming laptop
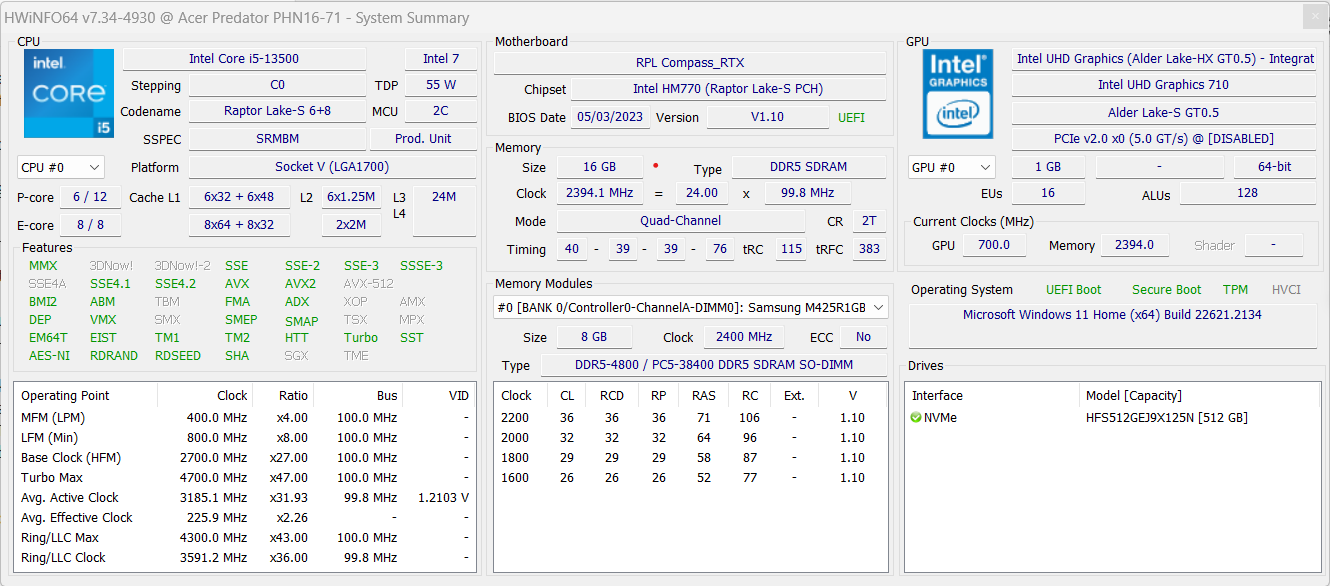
We are testing the Acer Predator Helios Neo 16 with an Intel Core i5-13500HX (6 P cores + 8 E cores), 16 GB DDR5-4800 RAM, a 512-GB SSD and an Nvidia GeForce RTX 4050 with a 130-watt TGP. Further variants can be found, which have up to a Core i9-13900HX (8 P cores + 16 E cores) and up to an Nvidia GeForce RTX 4070.
The target market of the version we tested includes gamers who wish to play new games in native FHD+ resolution, but who will also be happy with double-digit FPS rates. Other graphics tasks are also possible with this entry-level model of the Helios Neo 16, although 8 instead of 6 GB VRAM would be ideal for 4K video editing in particular.


Testing conditions
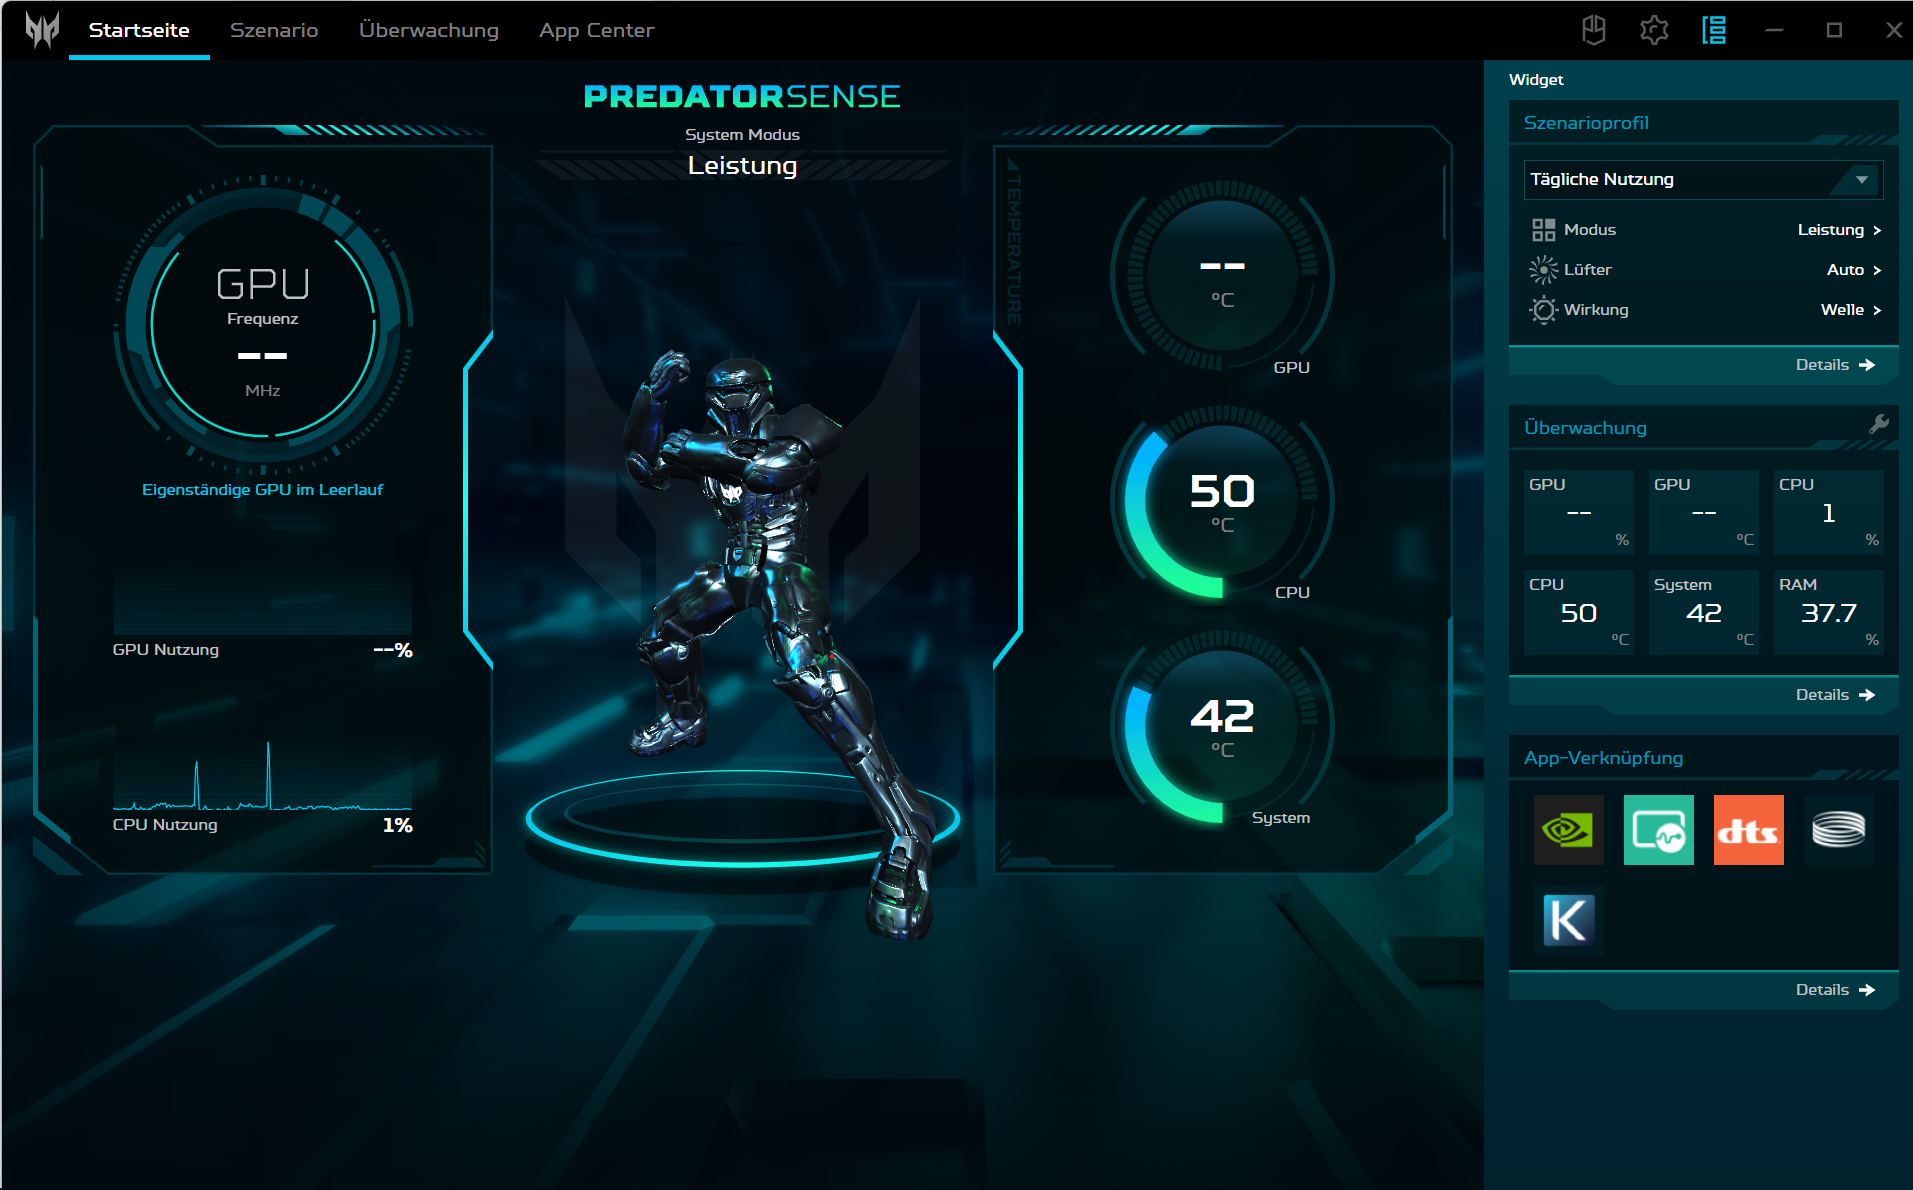
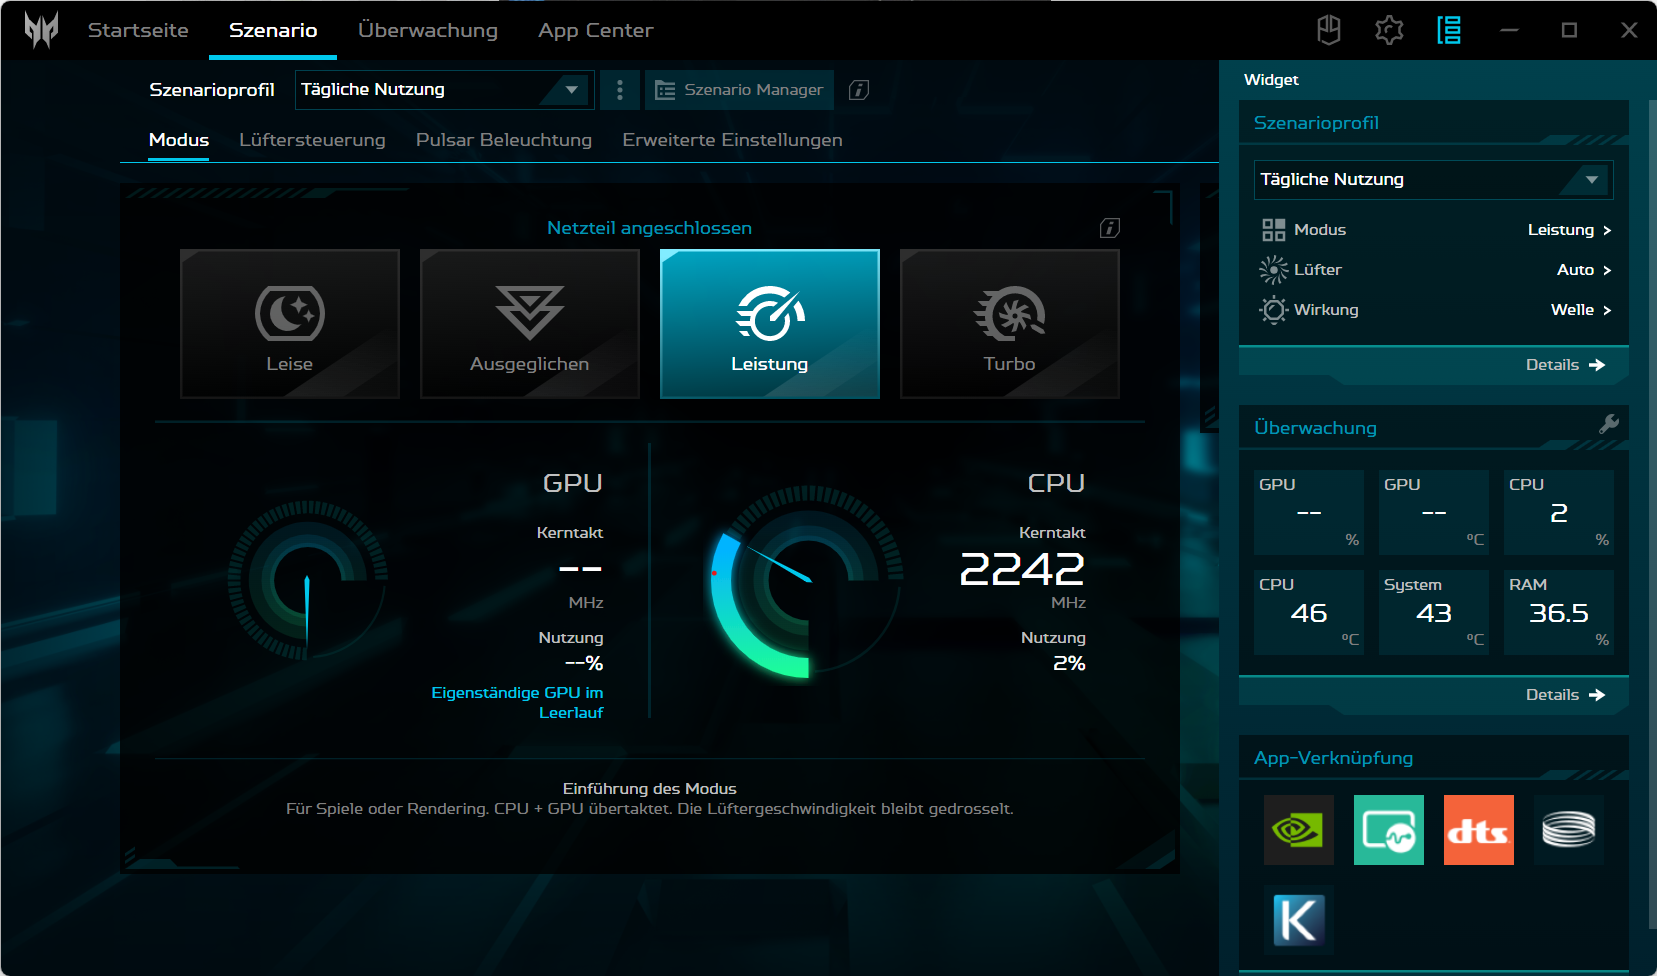
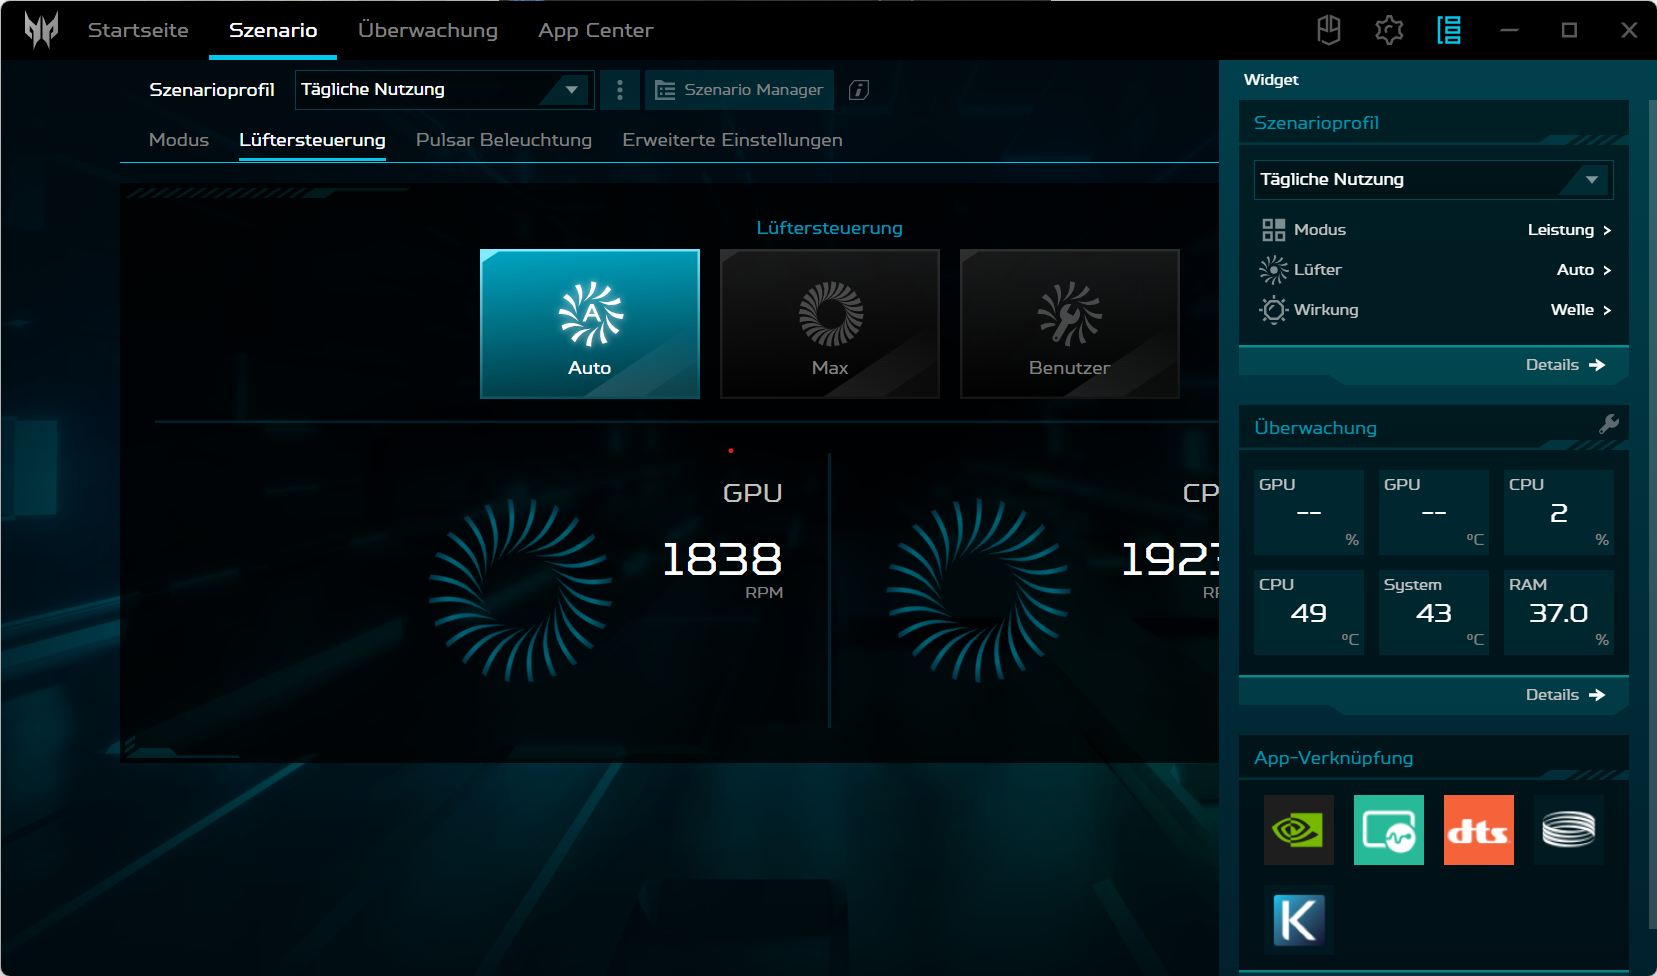
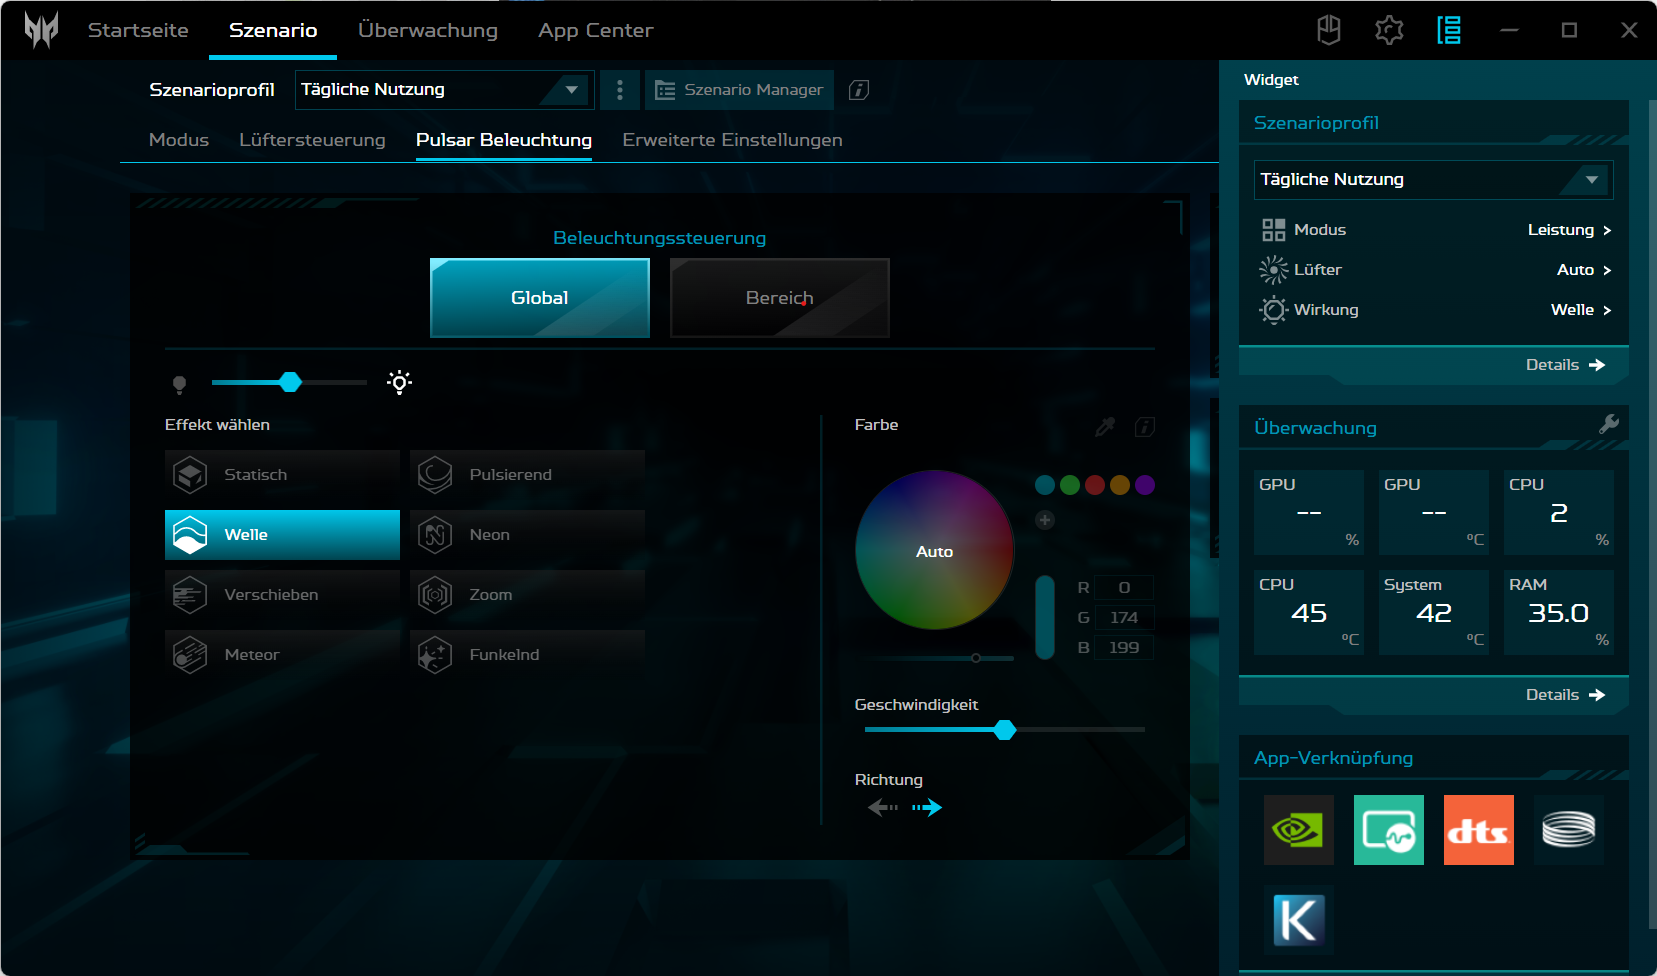
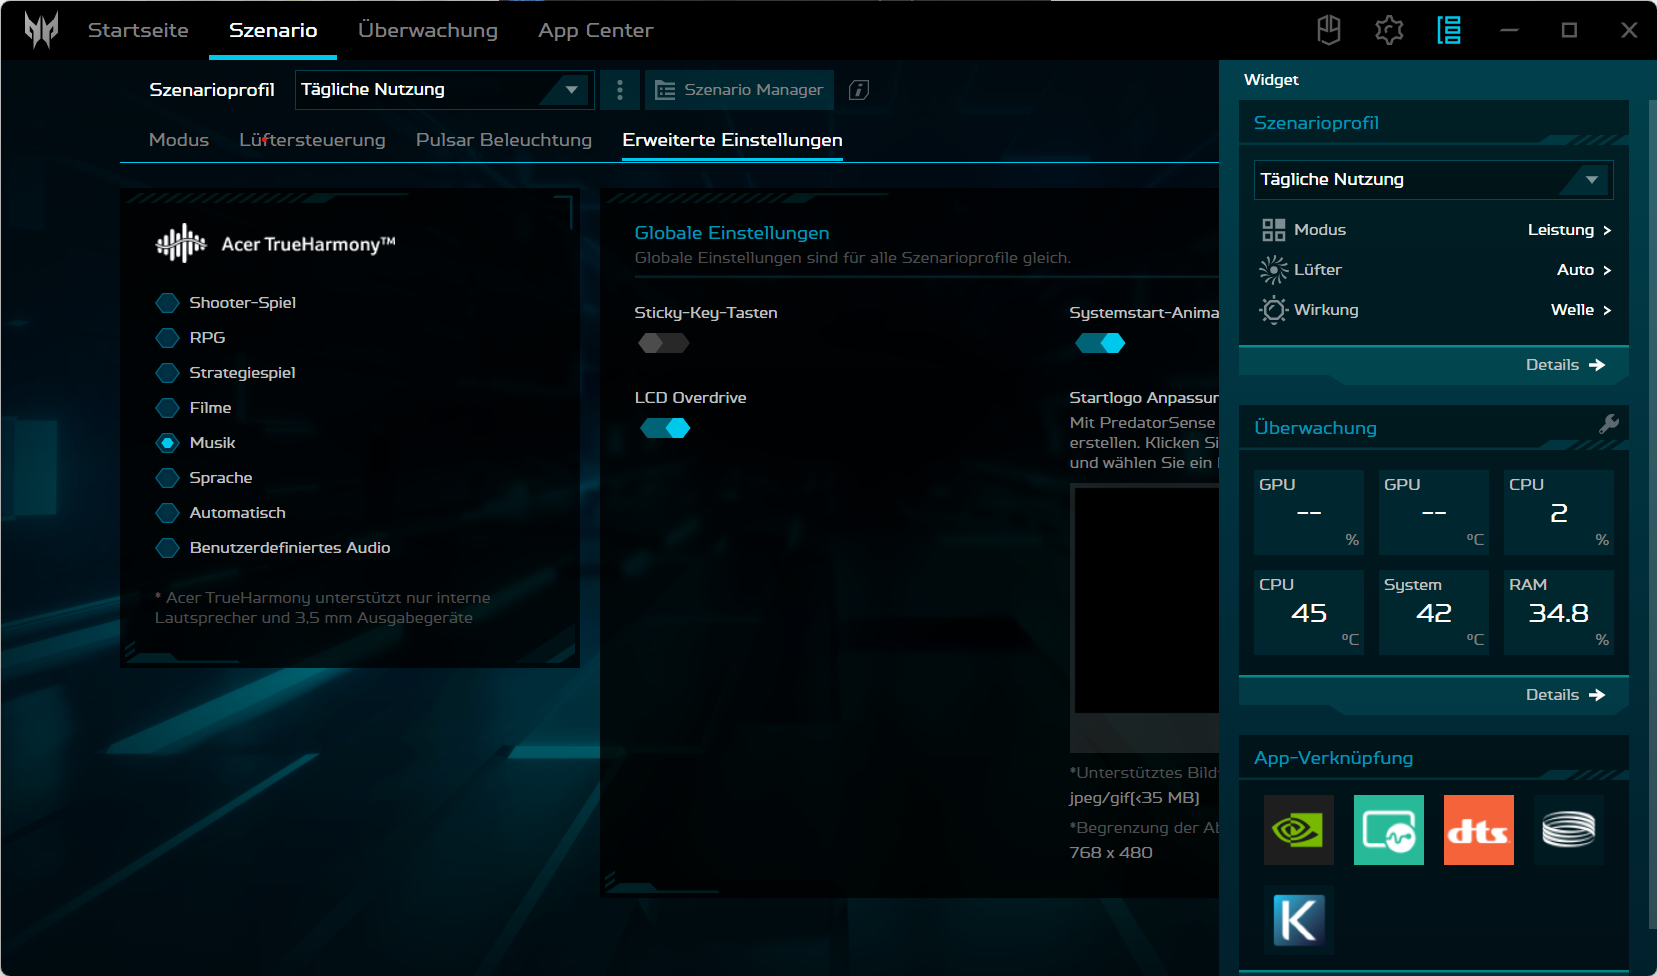
Four performance modes are available within the Acer control center software "Predator Sense", which can alternatively be switched between via the button on the left above the keyboard. We performed our performance-related benchmarks in "performance" mode, while the system automatically switched to "balanced" mode in battery mode. The Predator Helios Neo 16 must also have a charge level of at least 40% in order for the performance modes to be controlled.
The following table shows that very little GPU performance is lost in balanced mode, while the fans remain almost pleasantly quiet. Turbo mode, on the other hand, is unbearably loud and is therefore only useful for long video rendering sessions or similar.
| Scenario | Turbo | Performance | Balanced | Silent | Battery |
|---|---|---|---|---|---|
| CPU PL2 | 147 W | 147 W | 147 W | 147 W | 27 W |
| CPU PL1 | 100 W | 80 W | 70 W | 45 W | 27 W |
| GPU @The Witcher 3 | 88 W | 86 W | 86 W | 56 W | 43 W |
| GPU @FurMark | 130 W | 130 W | 105 W | 80 W | 13 W |
| Performance (The Witcher 3 @FHD/Ultra) | 81 FPS | 79 FPS | 79 FPS | 46 FPS | 30 FPS |
Processor
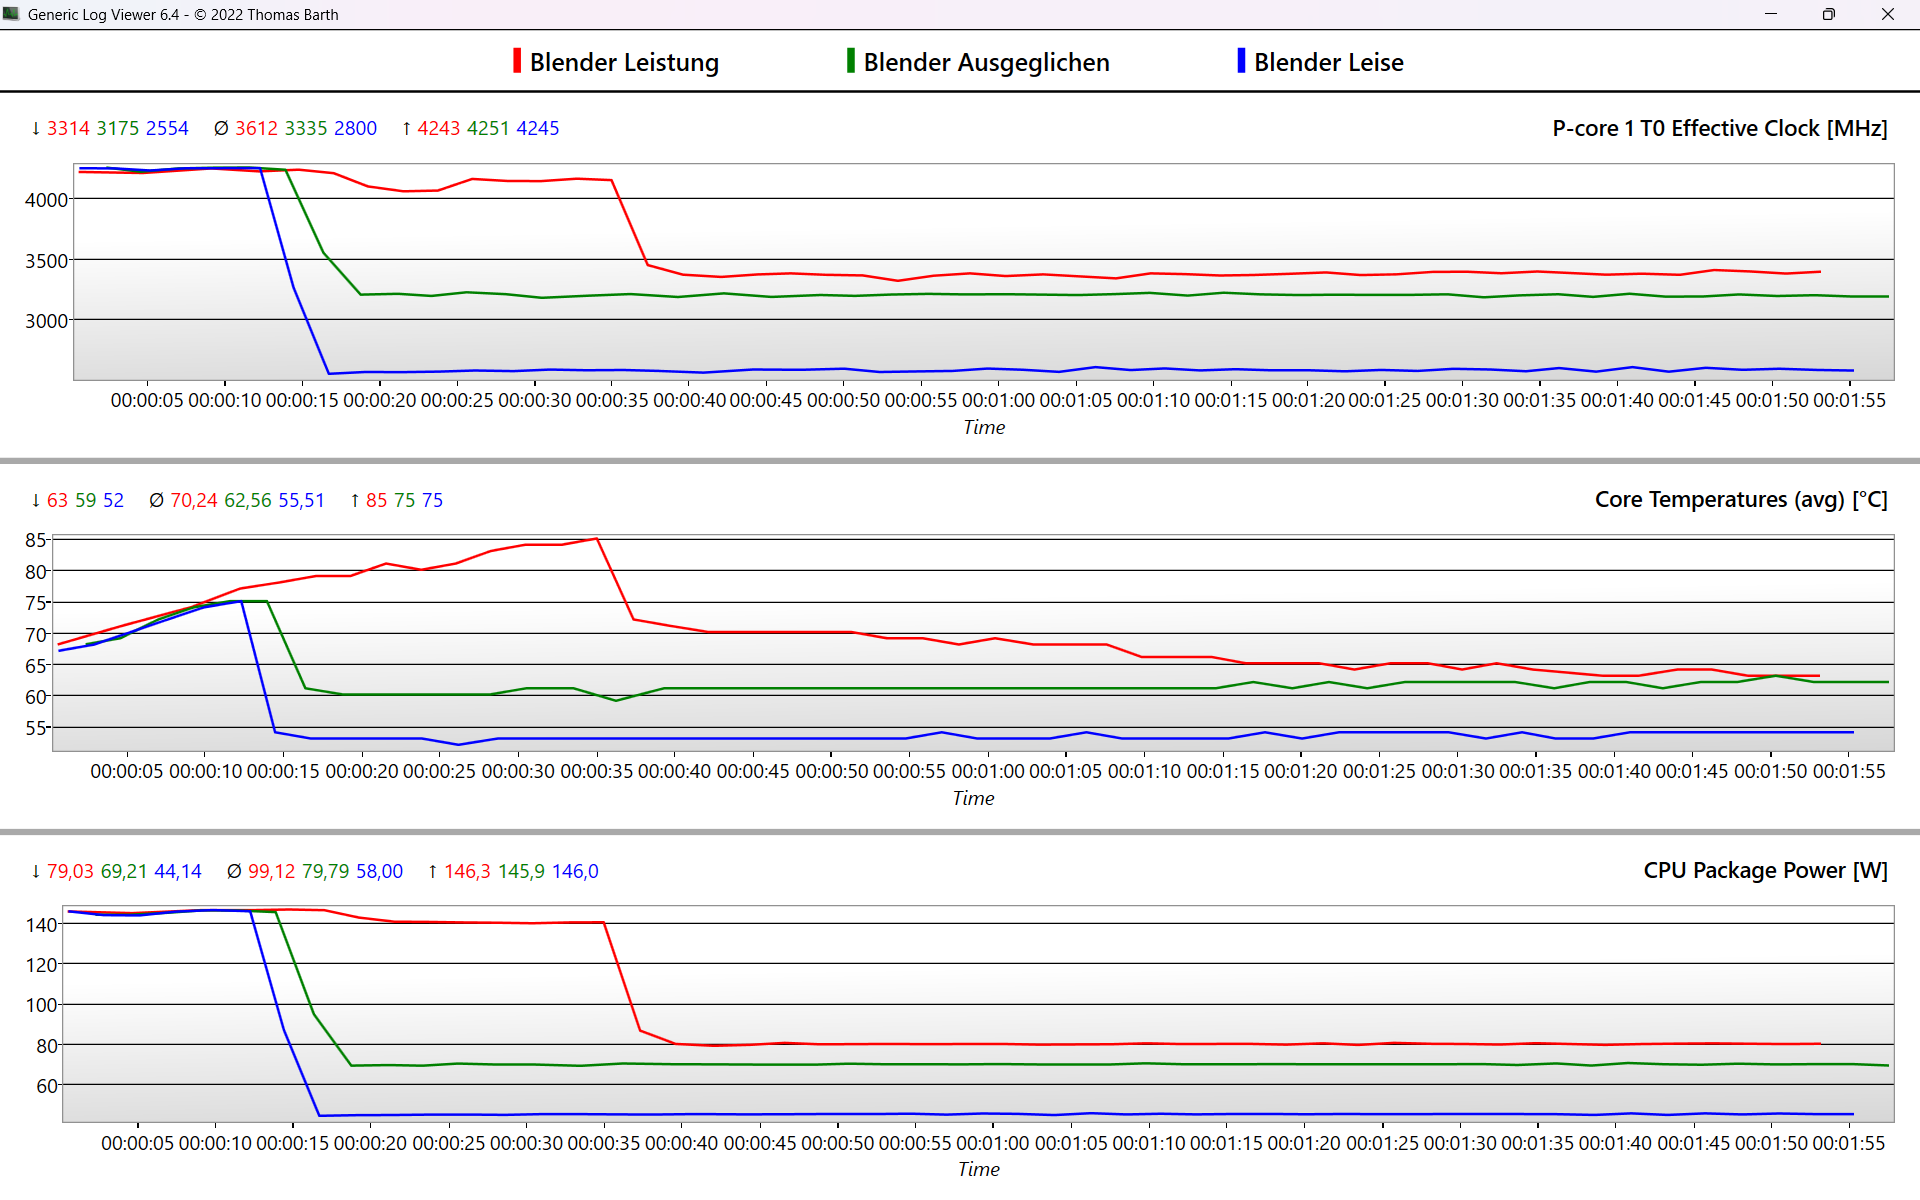
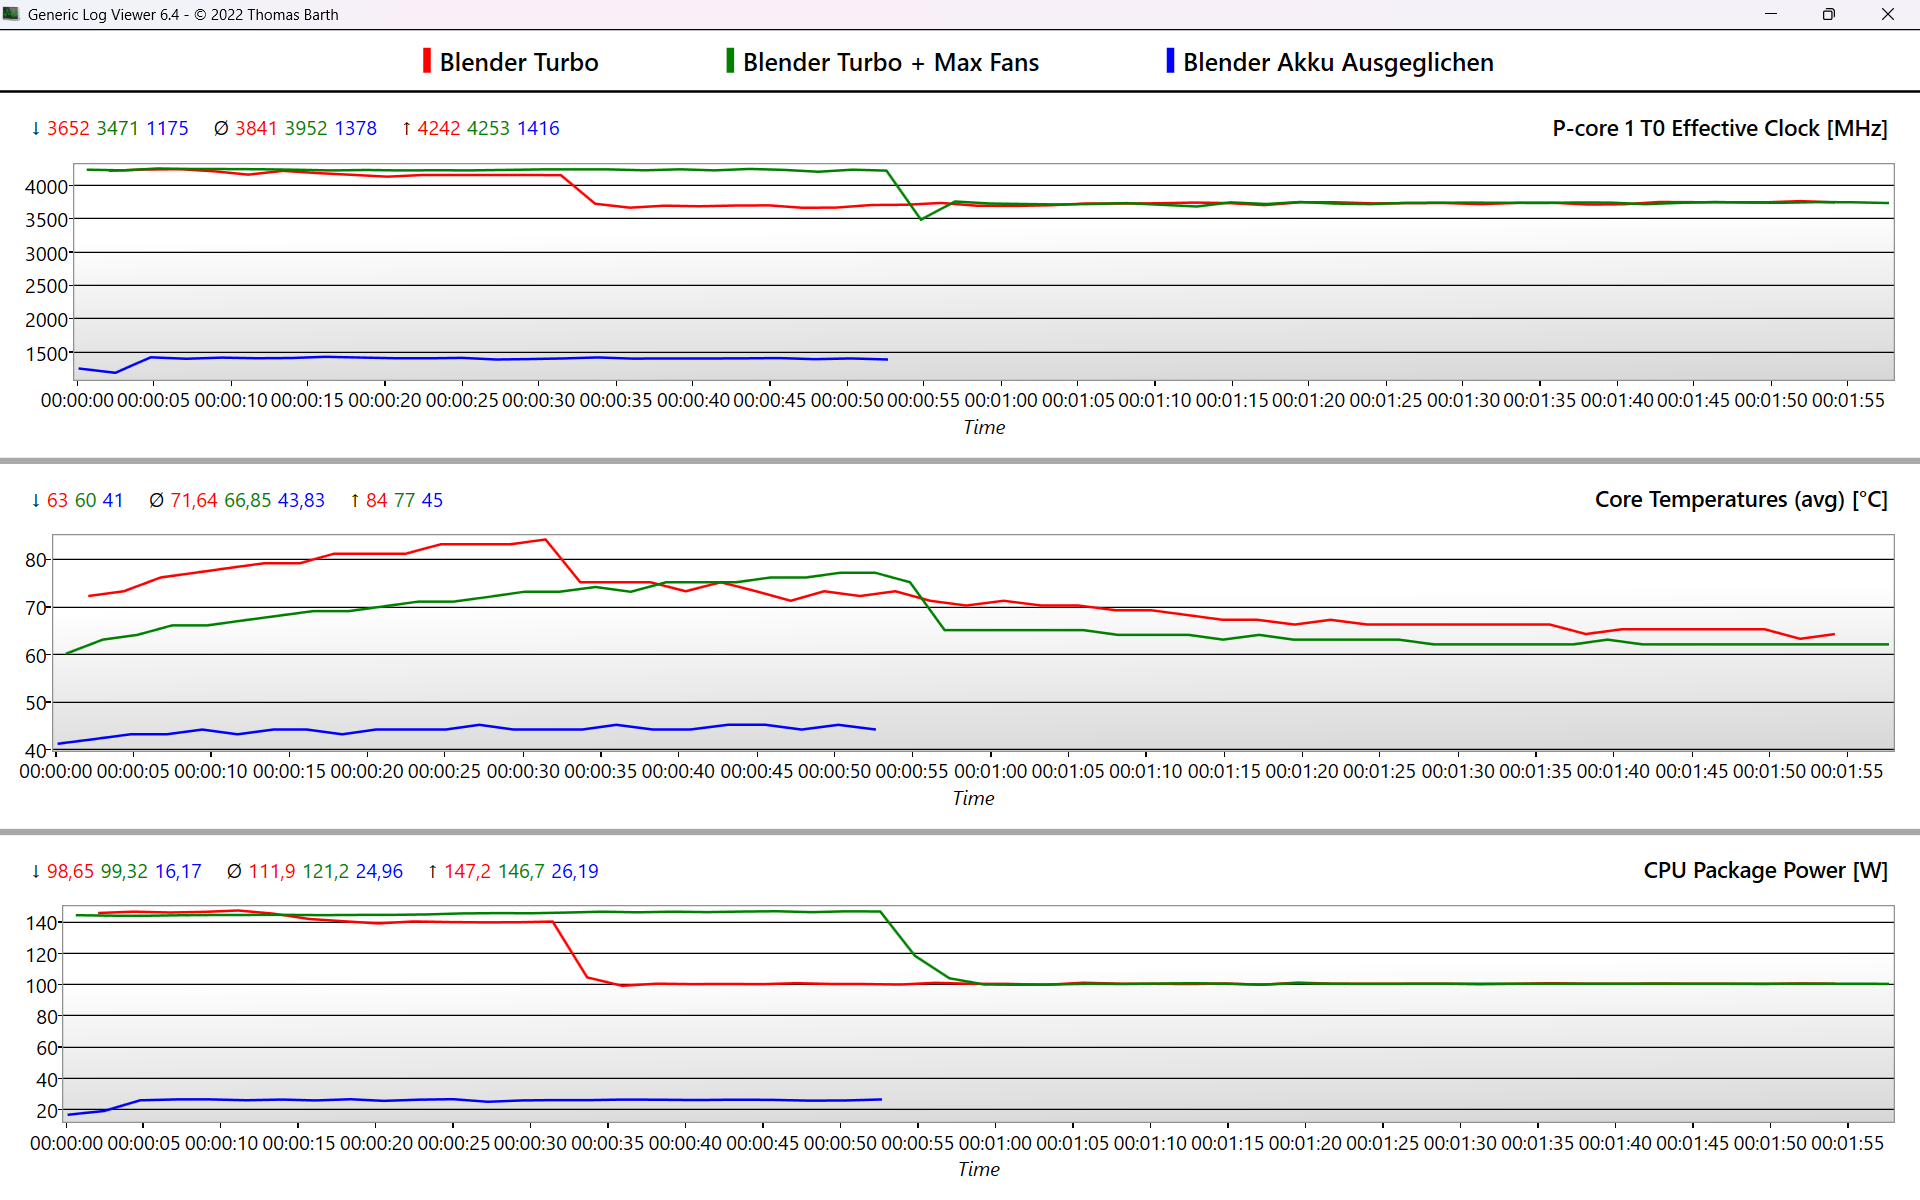
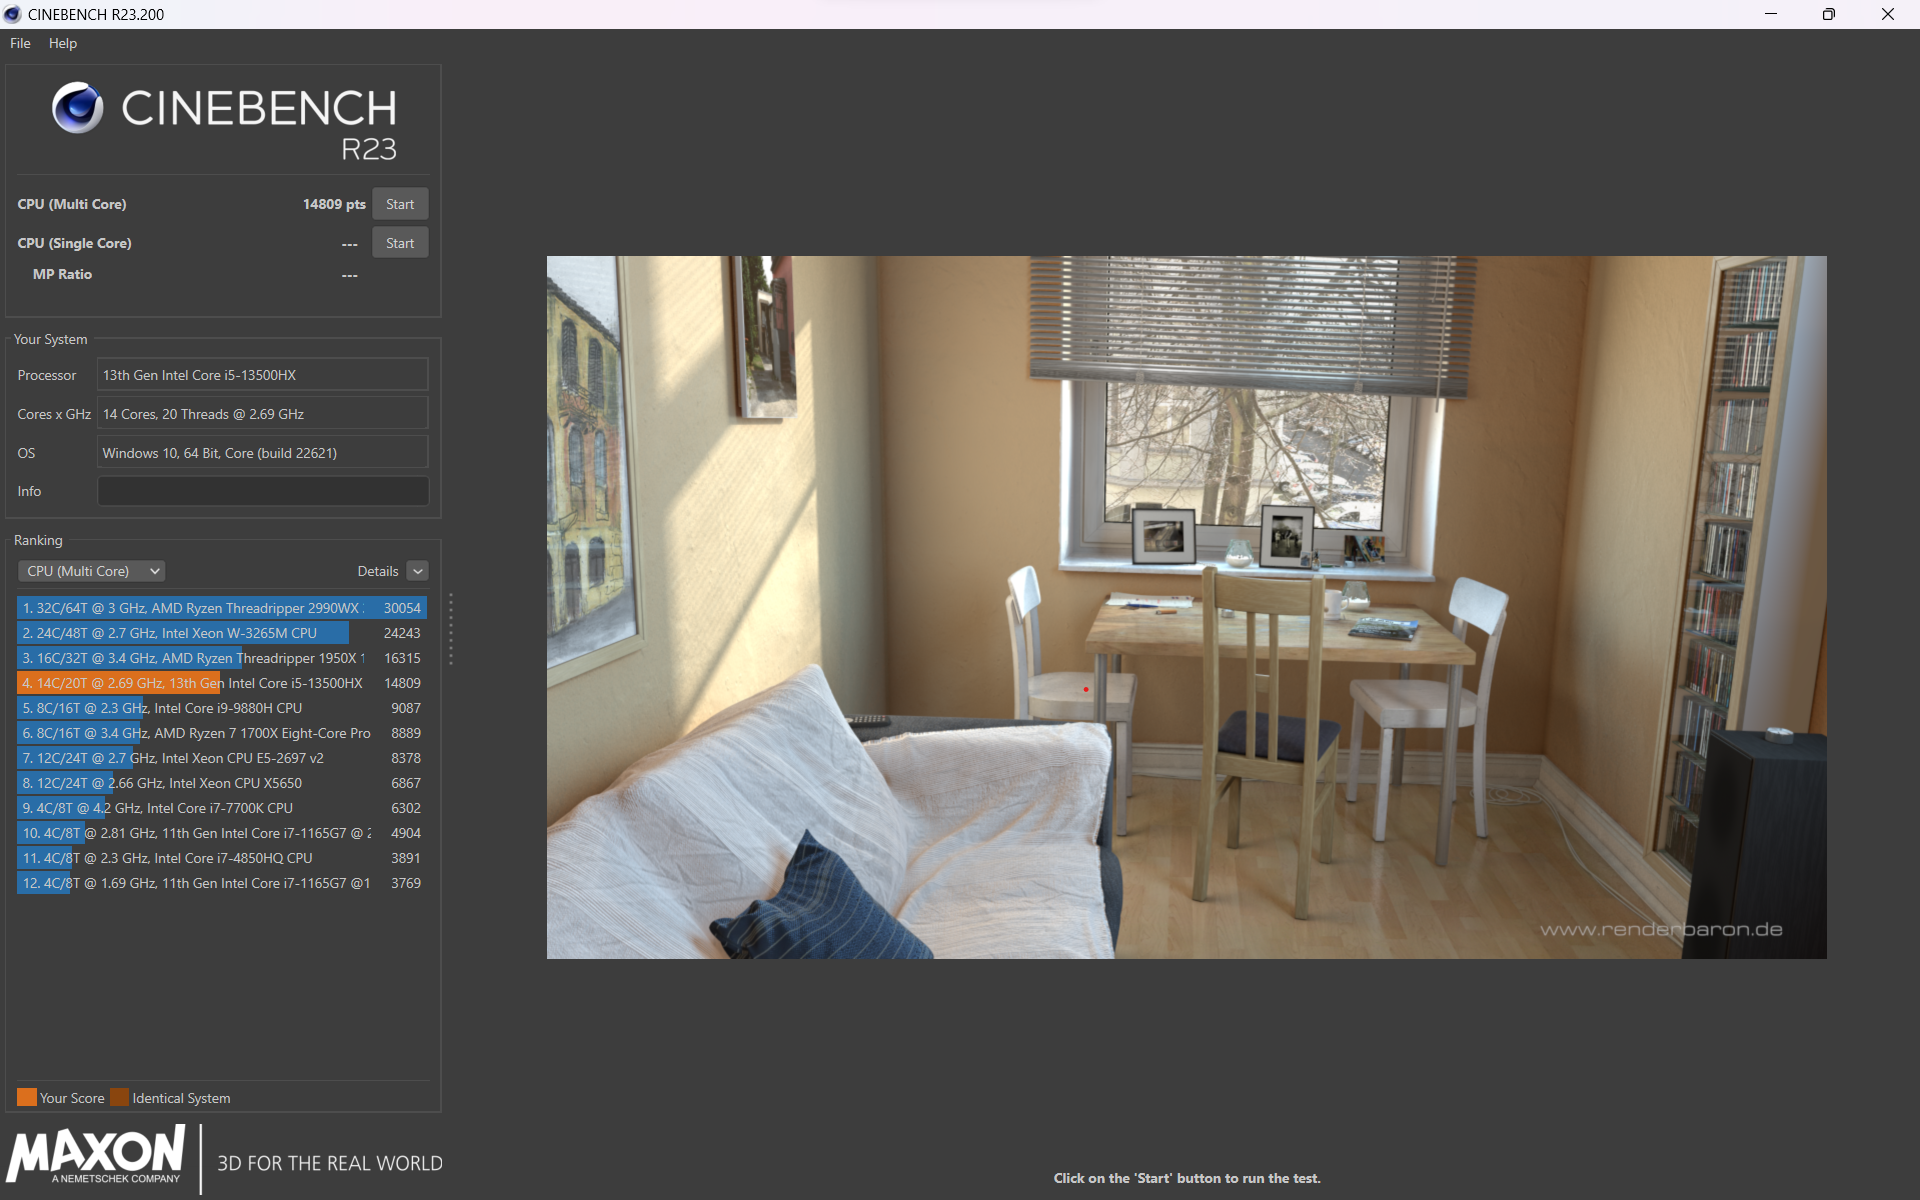
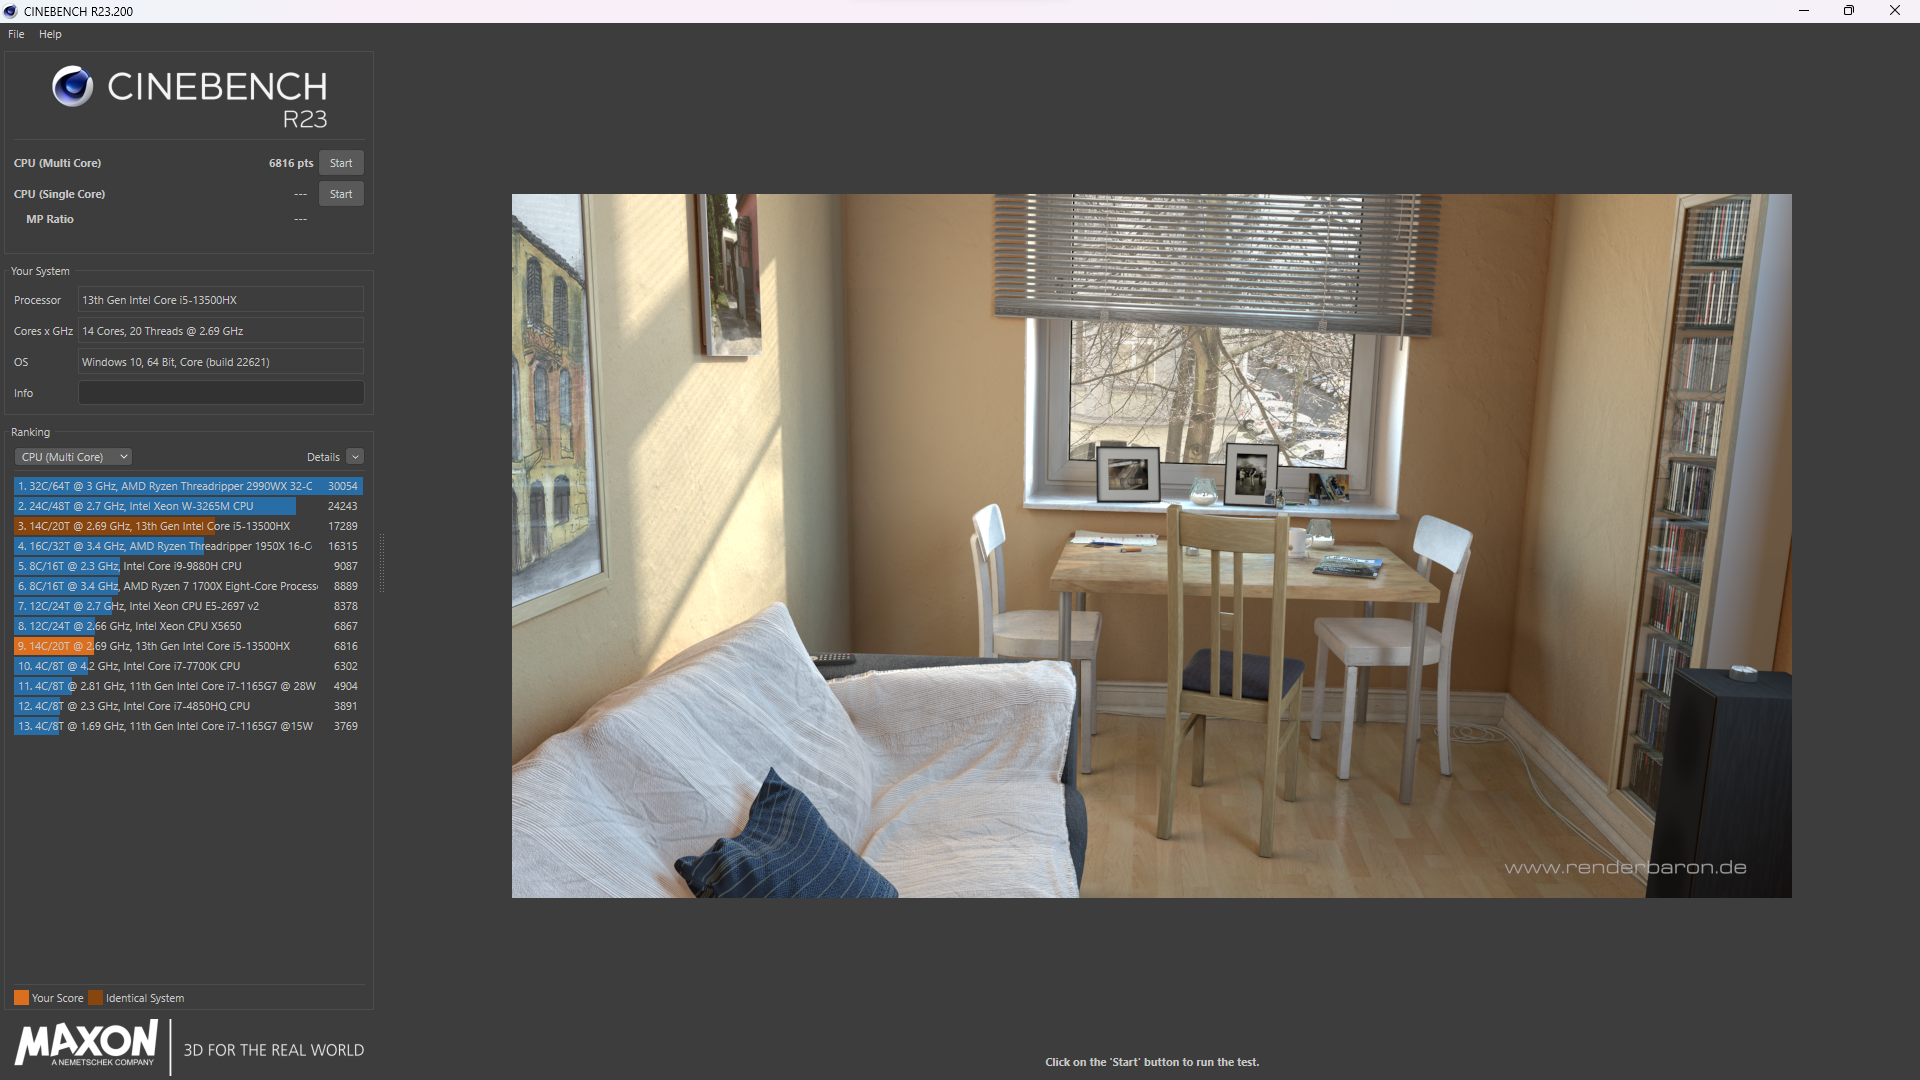
The laptop's installed Intel Core i5-13500HX is a desktop-class processor with 14 cores, 20 threads (6 P cores + 8 E cores) and a TDP of 55 watts. The P cores initially clock at around 4.2 GHz and, as a result, just miss their maximum possible Turbo of 4.5 GHz. After around 30 seconds, the clock rates drop slightly to 3.8 GHz (Turbo mode) or 3.4 GHz (performance mode).
When it comes to multi-core performance, the Helios Neo came in 10 % behind the Dell G15 5530 with a Core i7-13650HX and 15 % behind the Helios 16 with a Core i7-13700HX. The Core i7-12700H within its direct predecessor, the Predator Helios 300, was outperformed by 12 % and the eight-core AMD Ryzen 7 7840HS within the Schenker XMG Apex 15 was outperformed by a full 20 %.
From the fifth Cinebench R15 run onwards, its performance was throttled by about 17 %, but this can almost be prevented by activating the loud Turbo mode. The optionally available Core i9-13900HX has a full 24 cores and works 60 % faster in multi-core tasks within the Helios 18. In battery mode, its TDP is limited to a disappointing 27 watts, which results in a drop in performance of almost 60 %.


Cinebench R15 Multi continuous test
Cinebench R23: Multi Core | Single Core
Cinebench R20: CPU (Multi Core) | CPU (Single Core)
Cinebench R15: CPU Multi 64Bit | CPU Single 64Bit
Blender: v2.79 BMW27 CPU
7-Zip 18.03: 7z b 4 | 7z b 4 -mmt1
Geekbench 5.5: Multi-Core | Single-Core
HWBOT x265 Benchmark v2.2: 4k Preset
LibreOffice : 20 Documents To PDF
R Benchmark 2.5: Overall mean
| CPU Performance rating | |
| Acer Predator Helios 18 N23Q2 | |
| Average of class Gaming | |
| Acer Predator Helios 16 PH16-71-731Q | |
| Dell G15 5530 | |
| Acer Predator Helios Neo 16 NH.QLTEG.002 | |
| Schenker XMG Apex 15 (Late 23) | |
| Average Intel Core i5-13500HX | |
| Lenovo Legion Pro 5 16ARX8 (R5 7645HX, RTX 4050) | |
| Lenovo LOQ 16IRH8 | |
| Acer Predator Helios 300 (i7-12700H, RTX 3070 Ti) | |
| Acer Nitro 16 AN16-41-R7YE | |
| Cinebench R23 / Multi Core | |
| Acer Predator Helios 18 N23Q2 | |
| Average of class Gaming (10488 - 40970, n=113, last 2 years) | |
| Acer Predator Helios 16 PH16-71-731Q | |
| Dell G15 5530 | |
| Acer Predator Helios Neo 16 NH.QLTEG.002 | |
| Average Intel Core i5-13500HX (18235 - 19176, n=3) | |
| Acer Predator Helios 300 (i7-12700H, RTX 3070 Ti) | |
| Schenker XMG Apex 15 (Late 23) | |
| Lenovo LOQ 16IRH8 | |
| Lenovo Legion Pro 5 16ARX8 (R5 7645HX, RTX 4050) | |
| Acer Nitro 16 AN16-41-R7YE | |
| Cinebench R23 / Single Core | |
| Acer Predator Helios 18 N23Q2 | |
| Average of class Gaming (1166 - 2356, n=113, last 2 years) | |
| Acer Predator Helios 16 PH16-71-731Q | |
| Lenovo LOQ 16IRH8 | |
| Dell G15 5530 | |
| Lenovo Legion Pro 5 16ARX8 (R5 7645HX, RTX 4050) | |
| Acer Predator Helios Neo 16 NH.QLTEG.002 | |
| Schenker XMG Apex 15 (Late 23) | |
| Acer Predator Helios 300 (i7-12700H, RTX 3070 Ti) | |
| Average Intel Core i5-13500HX (1689 - 1772, n=2) | |
| Acer Nitro 16 AN16-41-R7YE | |
| Cinebench R20 / CPU (Multi Core) | |
| Acer Predator Helios 18 N23Q2 | |
| Average of class Gaming (4029 - 16108, n=112, last 2 years) | |
| Acer Predator Helios 16 PH16-71-731Q | |
| Dell G15 5530 | |
| Acer Predator Helios Neo 16 NH.QLTEG.002 | |
| Average Intel Core i5-13500HX (6978 - 7371, n=3) | |
| Schenker XMG Apex 15 (Late 23) | |
| Acer Predator Helios 300 (i7-12700H, RTX 3070 Ti) | |
| Lenovo LOQ 16IRH8 | |
| Lenovo Legion Pro 5 16ARX8 (R5 7645HX, RTX 4050) | |
| Acer Nitro 16 AN16-41-R7YE | |
| Cinebench R20 / CPU (Single Core) | |
| Acer Predator Helios 18 N23Q2 | |
| Average of class Gaming (442 - 895, n=112, last 2 years) | |
| Acer Predator Helios 16 PH16-71-731Q | |
| Dell G15 5530 | |
| Lenovo LOQ 16IRH8 | |
| Lenovo Legion Pro 5 16ARX8 (R5 7645HX, RTX 4050) | |
| Acer Predator Helios 300 (i7-12700H, RTX 3070 Ti) | |
| Schenker XMG Apex 15 (Late 23) | |
| Acer Predator Helios Neo 16 NH.QLTEG.002 | |
| Average Intel Core i5-13500HX (648 - 695, n=3) | |
| Acer Nitro 16 AN16-41-R7YE | |
| Cinebench R15 / CPU Single 64Bit | |
| Acer Predator Helios 18 N23Q2 | |
| Average of class Gaming (188.8 - 343, n=112, last 2 years) | |
| Lenovo Legion Pro 5 16ARX8 (R5 7645HX, RTX 4050) | |
| Schenker XMG Apex 15 (Late 23) | |
| Dell G15 5530 | |
| Acer Predator Helios 16 PH16-71-731Q | |
| Lenovo LOQ 16IRH8 | |
| Acer Predator Helios 300 (i7-12700H, RTX 3070 Ti) | |
| Acer Predator Helios Neo 16 NH.QLTEG.002 | |
| Average Intel Core i5-13500HX (242 - 263, n=3) | |
| Acer Nitro 16 AN16-41-R7YE | |
| Blender / v2.79 BMW27 CPU | |
| Acer Nitro 16 AN16-41-R7YE | |
| Lenovo Legion Pro 5 16ARX8 (R5 7645HX, RTX 4050) | |
| Lenovo LOQ 16IRH8 | |
| Acer Predator Helios 300 (i7-12700H, RTX 3070 Ti) | |
| Schenker XMG Apex 15 (Late 23) | |
| Acer Predator Helios Neo 16 NH.QLTEG.002 | |
| Average Intel Core i5-13500HX (178 - 193, n=3) | |
| Dell G15 5530 | |
| Acer Predator Helios 16 PH16-71-731Q | |
| Average of class Gaming (80 - 330, n=110, last 2 years) | |
| Acer Predator Helios 18 N23Q2 | |
| 7-Zip 18.03 / 7z b 4 -mmt1 | |
| Lenovo Legion Pro 5 16ARX8 (R5 7645HX, RTX 4050) | |
| Acer Predator Helios 18 N23Q2 | |
| Schenker XMG Apex 15 (Late 23) | |
| Average of class Gaming (4199 - 7436, n=111, last 2 years) | |
| Acer Predator Helios 16 PH16-71-731Q | |
| Lenovo LOQ 16IRH8 | |
| Dell G15 5530 | |
| Acer Predator Helios 300 (i7-12700H, RTX 3070 Ti) | |
| Acer Predator Helios Neo 16 NH.QLTEG.002 | |
| Acer Nitro 16 AN16-41-R7YE | |
| Average Intel Core i5-13500HX (5377 - 5850, n=3) | |
| Geekbench 5.5 / Multi-Core | |
| Acer Predator Helios 18 N23Q2 | |
| Average of class Gaming (6460 - 27010, n=111, last 2 years) | |
| Acer Predator Helios 16 PH16-71-731Q | |
| Dell G15 5530 | |
| Acer Predator Helios Neo 16 NH.QLTEG.002 | |
| Acer Predator Helios 300 (i7-12700H, RTX 3070 Ti) | |
| Average Intel Core i5-13500HX (12683 - 13767, n=3) | |
| Lenovo LOQ 16IRH8 | |
| Schenker XMG Apex 15 (Late 23) | |
| Lenovo Legion Pro 5 16ARX8 (R5 7645HX, RTX 4050) | |
| Acer Nitro 16 AN16-41-R7YE | |
| Geekbench 5.5 / Single-Core | |
| Acer Predator Helios 18 N23Q2 | |
| Average of class Gaming (986 - 2474, n=111, last 2 years) | |
| Lenovo Legion Pro 5 16ARX8 (R5 7645HX, RTX 4050) | |
| Schenker XMG Apex 15 (Late 23) | |
| Acer Predator Helios 16 PH16-71-731Q | |
| Dell G15 5530 | |
| Lenovo LOQ 16IRH8 | |
| Average Intel Core i5-13500HX (1688 - 1779, n=3) | |
| Acer Predator Helios Neo 16 NH.QLTEG.002 | |
| Acer Predator Helios 300 (i7-12700H, RTX 3070 Ti) | |
| Acer Nitro 16 AN16-41-R7YE | |
| HWBOT x265 Benchmark v2.2 / 4k Preset | |
| Acer Predator Helios 18 N23Q2 | |
| Average of class Gaming (11.5 - 44.3, n=111, last 2 years) | |
| Acer Predator Helios 16 PH16-71-731Q | |
| Dell G15 5530 | |
| Average Intel Core i5-13500HX (20.3 - 20.9, n=3) | |
| Acer Predator Helios Neo 16 NH.QLTEG.002 | |
| Schenker XMG Apex 15 (Late 23) | |
| Lenovo Legion Pro 5 16ARX8 (R5 7645HX, RTX 4050) | |
| Lenovo LOQ 16IRH8 | |
| Acer Predator Helios 300 (i7-12700H, RTX 3070 Ti) | |
| Acer Nitro 16 AN16-41-R7YE | |
| LibreOffice / 20 Documents To PDF | |
| Acer Predator Helios 300 (i7-12700H, RTX 3070 Ti) | |
| Lenovo Legion Pro 5 16ARX8 (R5 7645HX, RTX 4050) | |
| Acer Predator Helios 18 N23Q2 | |
| Average of class Gaming (19 - 88.8, n=111, last 2 years) | |
| Dell G15 5530 | |
| Acer Nitro 16 AN16-41-R7YE | |
| Lenovo LOQ 16IRH8 | |
| Acer Predator Helios Neo 16 NH.QLTEG.002 | |
| Schenker XMG Apex 15 (Late 23) | |
| Average Intel Core i5-13500HX (42.5 - 45, n=2) | |
| Acer Predator Helios 16 PH16-71-731Q | |
| R Benchmark 2.5 / Overall mean | |
| Acer Nitro 16 AN16-41-R7YE | |
| Average Intel Core i5-13500HX (0.4512 - 0.4891, n=3) | |
| Acer Predator Helios Neo 16 NH.QLTEG.002 | |
| Acer Predator Helios 300 (i7-12700H, RTX 3070 Ti) | |
| Lenovo LOQ 16IRH8 | |
| Schenker XMG Apex 15 (Late 23) | |
| Lenovo Legion Pro 5 16ARX8 (R5 7645HX, RTX 4050) | |
| Average of class Gaming (0.3439 - 0.759, n=112, last 2 years) | |
| Acer Predator Helios 16 PH16-71-731Q | |
| Dell G15 5530 | |
| Acer Predator Helios 18 N23Q2 | |
* ... smaller is better
AIDA64: FP32 Ray-Trace | FPU Julia | CPU SHA3 | CPU Queen | FPU SinJulia | FPU Mandel | CPU AES | CPU ZLib | FP64 Ray-Trace | CPU PhotoWorxx
| Performance rating | |
| Average of class Gaming | |
| Schenker XMG Apex 15 (Late 23) | |
| Dell G15 5530 | |
| Acer Predator Helios Neo 16 NH.QLTEG.002 | |
| Average Intel Core i5-13500HX | |
| Lenovo Legion Pro 5 16ARX8 (R5 7645HX, RTX 4050) | |
| HP Victus 16-r0076TX | |
| Lenovo LOQ 16IRH8 | |
| AIDA64 / FP32 Ray-Trace | |
| Average of class Gaming (10227 - 85542, n=110, last 2 years) | |
| Schenker XMG Apex 15 (Late 23) | |
| Lenovo Legion Pro 5 16ARX8 (R5 7645HX, RTX 4050) | |
| Dell G15 5530 | |
| Average Intel Core i5-13500HX (15888 - 16544, n=3) | |
| Acer Predator Helios Neo 16 NH.QLTEG.002 | |
| HP Victus 16-r0076TX | |
| Lenovo LOQ 16IRH8 | |
| AIDA64 / FPU Julia | |
| Average of class Gaming (51376 - 238426, n=110, last 2 years) | |
| Schenker XMG Apex 15 (Late 23) | |
| Lenovo Legion Pro 5 16ARX8 (R5 7645HX, RTX 4050) | |
| Dell G15 5530 | |
| HP Victus 16-r0076TX | |
| Average Intel Core i5-13500HX (80761 - 85623, n=3) | |
| Acer Predator Helios Neo 16 NH.QLTEG.002 | |
| Lenovo LOQ 16IRH8 | |
| AIDA64 / CPU SHA3 | |
| Average of class Gaming (2180 - 9817, n=110, last 2 years) | |
| Dell G15 5530 | |
| Schenker XMG Apex 15 (Late 23) | |
| Average Intel Core i5-13500HX (3868 - 4017, n=3) | |
| HP Victus 16-r0076TX | |
| Acer Predator Helios Neo 16 NH.QLTEG.002 | |
| Lenovo Legion Pro 5 16ARX8 (R5 7645HX, RTX 4050) | |
| Lenovo LOQ 16IRH8 | |
| AIDA64 / CPU Queen | |
| Average of class Gaming (49785 - 173351, n=101, last 2 years) | |
| Dell G15 5530 | |
| Acer Predator Helios Neo 16 NH.QLTEG.002 | |
| Average Intel Core i5-13500HX (105168 - 107075, n=3) | |
| Schenker XMG Apex 15 (Late 23) | |
| HP Victus 16-r0076TX | |
| Lenovo Legion Pro 5 16ARX8 (R5 7645HX, RTX 4050) | |
| Lenovo LOQ 16IRH8 | |
| AIDA64 / FPU SinJulia | |
| Schenker XMG Apex 15 (Late 23) | |
| Average of class Gaming (4424 - 33636, n=110, last 2 years) | |
| Lenovo Legion Pro 5 16ARX8 (R5 7645HX, RTX 4050) | |
| Dell G15 5530 | |
| Average Intel Core i5-13500HX (10334 - 10793, n=3) | |
| Acer Predator Helios Neo 16 NH.QLTEG.002 | |
| HP Victus 16-r0076TX | |
| Lenovo LOQ 16IRH8 | |
| AIDA64 / FPU Mandel | |
| Average of class Gaming (25115 - 128721, n=110, last 2 years) | |
| Schenker XMG Apex 15 (Late 23) | |
| Lenovo Legion Pro 5 16ARX8 (R5 7645HX, RTX 4050) | |
| Dell G15 5530 | |
| Average Intel Core i5-13500HX (39805 - 41418, n=3) | |
| Acer Predator Helios Neo 16 NH.QLTEG.002 | |
| HP Victus 16-r0076TX | |
| Lenovo LOQ 16IRH8 | |
| AIDA64 / CPU AES | |
| Schenker XMG Apex 15 (Late 23) | |
| Acer Predator Helios Neo 16 NH.QLTEG.002 | |
| Average Intel Core i5-13500HX (79903 - 154368, n=3) | |
| Average of class Gaming (39258 - 247074, n=110, last 2 years) | |
| Dell G15 5530 | |
| HP Victus 16-r0076TX | |
| Lenovo LOQ 16IRH8 | |
| Lenovo Legion Pro 5 16ARX8 (R5 7645HX, RTX 4050) | |
| AIDA64 / CPU ZLib | |
| Average of class Gaming (574 - 2531, n=110, last 2 years) | |
| Dell G15 5530 | |
| Acer Predator Helios Neo 16 NH.QLTEG.002 | |
| Average Intel Core i5-13500HX (1104 - 1233, n=3) | |
| HP Victus 16-r0076TX | |
| Schenker XMG Apex 15 (Late 23) | |
| Lenovo Legion Pro 5 16ARX8 (R5 7645HX, RTX 4050) | |
| Lenovo LOQ 16IRH8 | |
| AIDA64 / FP64 Ray-Trace | |
| Average of class Gaming (5509 - 45446, n=110, last 2 years) | |
| Schenker XMG Apex 15 (Late 23) | |
| Lenovo Legion Pro 5 16ARX8 (R5 7645HX, RTX 4050) | |
| Dell G15 5530 | |
| Average Intel Core i5-13500HX (8587 - 9008, n=3) | |
| Acer Predator Helios Neo 16 NH.QLTEG.002 | |
| HP Victus 16-r0076TX | |
| Lenovo LOQ 16IRH8 | |
| AIDA64 / CPU PhotoWorxx | |
| Average of class Gaming (12271 - 89891, n=110, last 2 years) | |
| Average Intel Core i5-13500HX (36861 - 42683, n=3) | |
| Dell G15 5530 | |
| HP Victus 16-r0076TX | |
| Acer Predator Helios Neo 16 NH.QLTEG.002 | |
| Schenker XMG Apex 15 (Late 23) | |
| Lenovo LOQ 16IRH8 | |
| Lenovo Legion Pro 5 16ARX8 (R5 7645HX, RTX 4050) | |
System performance
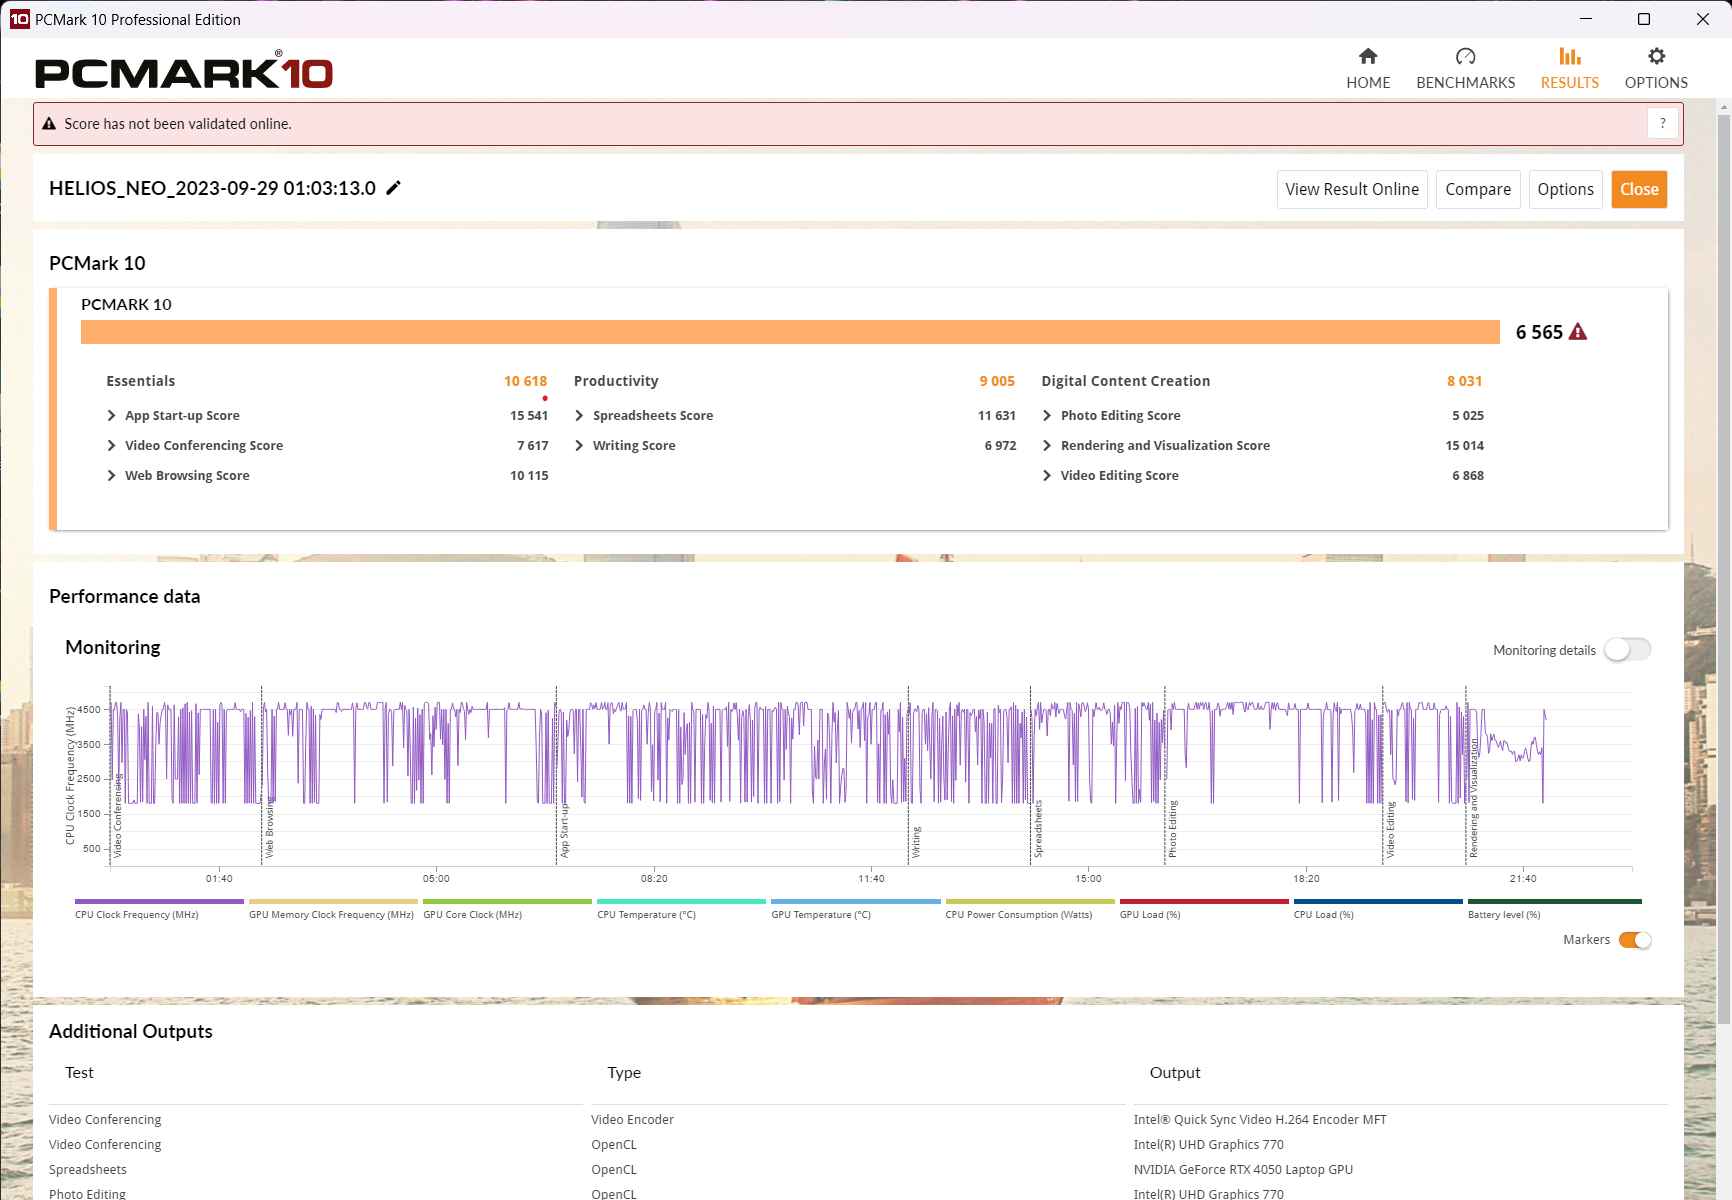
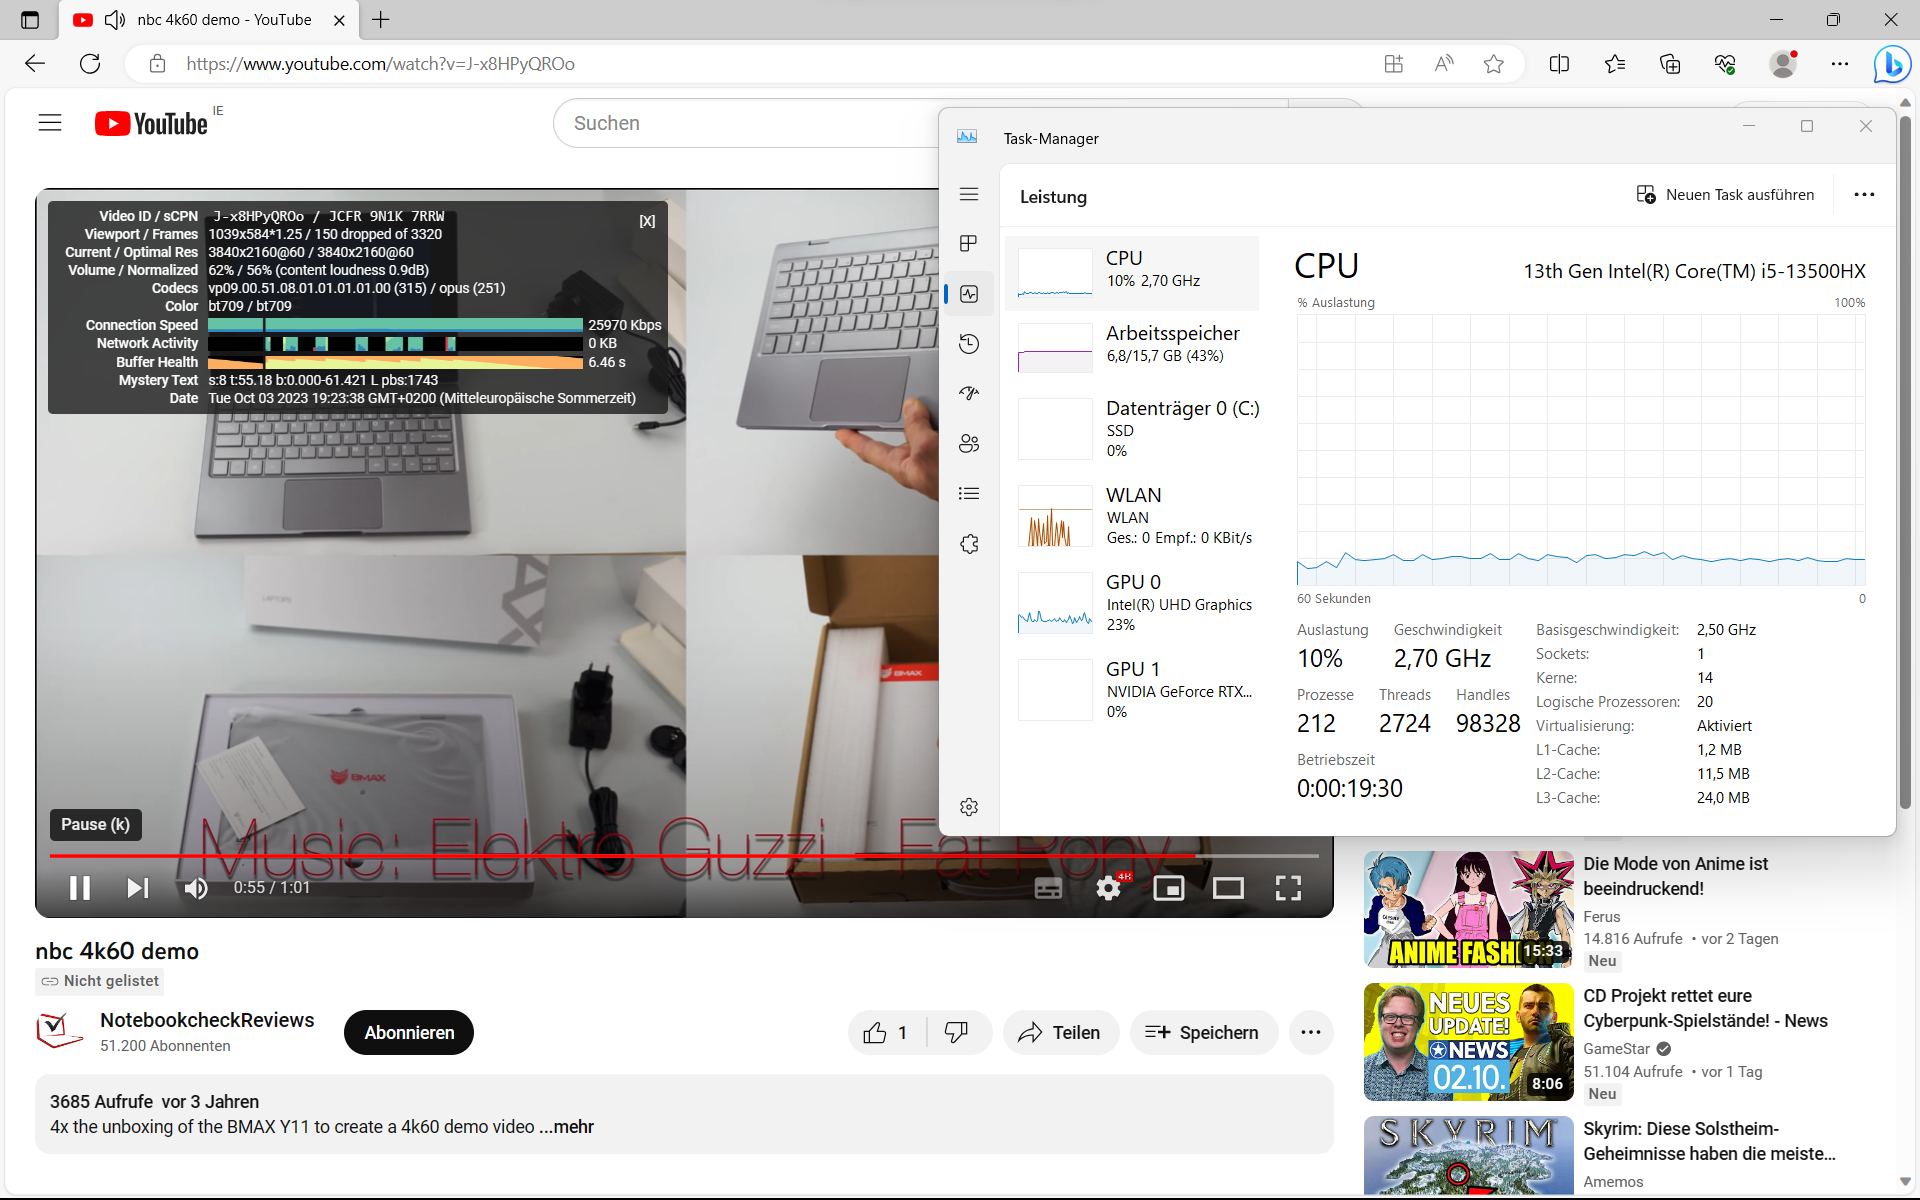
Acer's gaming laptop is very responsive during everyday tasks. Surfing the web while the 4K YouTube plays feels like a holiday for the Intel HX system. During the PCMark 10 benchmark, the Predator Helios Neo lagged behind the AMD systems Lenovo Legion Pro 5 and Schenker XMG Apex 15 by around 30 %, especially when it came to content creation. However, the Neo just about reached the top position during the Crossmark test.
Its web browsing performance, for example using Mozilla Kraken 1.1 and WebXPRT, is very good thanks to the laptop's strong single-core performance — but not quite as good as the Legion Pro 5.
CrossMark: Overall | Productivity | Creativity | Responsiveness
Mozilla Kraken 1.1: Total
Octane V2: Total Score
Speedometer 2.0: Result 2.0
Jetstream 2: 2.0 Total
WebXPRT 3: Overall
WebXPRT 4: Overall
| PCMark 10 / Score | |
| Average of class Gaming (5828 - 11574, n=96, last 2 years) | |
| Lenovo Legion Pro 5 16ARX8 (R5 7645HX, RTX 4050) | |
| Schenker XMG Apex 15 (Late 23) | |
| Dell G15 5530 | |
| Lenovo LOQ 16IRH8 | |
| Acer Predator Helios Neo 16 NH.QLTEG.002 | |
| Average Intel Core i5-13500HX, NVIDIA GeForce RTX 4050 Laptop GPU (6125 - 6565, n=2) | |
| HP Victus 16-r0076TX | |
| PCMark 10 / Essentials | |
| Lenovo Legion Pro 5 16ARX8 (R5 7645HX, RTX 4050) | |
| Dell G15 5530 | |
| Schenker XMG Apex 15 (Late 23) | |
| Average of class Gaming (8810 - 12600, n=100, last 2 years) | |
| Acer Predator Helios Neo 16 NH.QLTEG.002 | |
| Average Intel Core i5-13500HX, NVIDIA GeForce RTX 4050 Laptop GPU (9625 - 10618, n=2) | |
| Lenovo LOQ 16IRH8 | |
| HP Victus 16-r0076TX | |
| PCMark 10 / Productivity | |
| Lenovo Legion Pro 5 16ARX8 (R5 7645HX, RTX 4050) | |
| Average of class Gaming (6845 - 18766, n=98, last 2 years) | |
| Schenker XMG Apex 15 (Late 23) | |
| Dell G15 5530 | |
| Acer Predator Helios Neo 16 NH.QLTEG.002 | |
| Average Intel Core i5-13500HX, NVIDIA GeForce RTX 4050 Laptop GPU (8471 - 9005, n=2) | |
| Lenovo LOQ 16IRH8 | |
| HP Victus 16-r0076TX | |
| PCMark 10 / Digital Content Creation | |
| Average of class Gaming (7602 - 19657, n=98, last 2 years) | |
| Schenker XMG Apex 15 (Late 23) | |
| Lenovo Legion Pro 5 16ARX8 (R5 7645HX, RTX 4050) | |
| Lenovo LOQ 16IRH8 | |
| Dell G15 5530 | |
| Acer Predator Helios Neo 16 NH.QLTEG.002 | |
| Average Intel Core i5-13500HX, NVIDIA GeForce RTX 4050 Laptop GPU (7649 - 8031, n=2) | |
| HP Victus 16-r0076TX | |
| CrossMark / Overall | |
| Average of class Gaming (1366 - 2409, n=98, last 2 years) | |
| Acer Predator Helios Neo 16 NH.QLTEG.002 | |
| Lenovo LOQ 16IRH8 | |
| Lenovo Legion Pro 5 16ARX8 (R5 7645HX, RTX 4050) | |
| Dell G15 5530 | |
| Average Intel Core i5-13500HX, NVIDIA GeForce RTX 4050 Laptop GPU (1701 - 1964, n=2) | |
| Schenker XMG Apex 15 (Late 23) | |
| HP Victus 16-r0076TX | |
| CrossMark / Productivity | |
| Lenovo Legion Pro 5 16ARX8 (R5 7645HX, RTX 4050) | |
| Acer Predator Helios Neo 16 NH.QLTEG.002 | |
| Lenovo LOQ 16IRH8 | |
| Average of class Gaming (1386 - 2254, n=98, last 2 years) | |
| Dell G15 5530 | |
| Average Intel Core i5-13500HX, NVIDIA GeForce RTX 4050 Laptop GPU (1585 - 1878, n=2) | |
| Schenker XMG Apex 15 (Late 23) | |
| HP Victus 16-r0076TX | |
| CrossMark / Creativity | |
| Average of class Gaming (1343 - 2729, n=98, last 2 years) | |
| Dell G15 5530 | |
| Lenovo LOQ 16IRH8 | |
| Lenovo Legion Pro 5 16ARX8 (R5 7645HX, RTX 4050) | |
| Acer Predator Helios Neo 16 NH.QLTEG.002 | |
| Average Intel Core i5-13500HX, NVIDIA GeForce RTX 4050 Laptop GPU (1912 - 2022, n=2) | |
| Schenker XMG Apex 15 (Late 23) | |
| HP Victus 16-r0076TX | |
| CrossMark / Responsiveness | |
| Acer Predator Helios Neo 16 NH.QLTEG.002 | |
| Lenovo LOQ 16IRH8 | |
| Lenovo Legion Pro 5 16ARX8 (R5 7645HX, RTX 4050) | |
| Average Intel Core i5-13500HX, NVIDIA GeForce RTX 4050 Laptop GPU (1478 - 2053, n=2) | |
| Average of class Gaming (1226 - 2334, n=98, last 2 years) | |
| Dell G15 5530 | |
| Schenker XMG Apex 15 (Late 23) | |
| HP Victus 16-r0076TX | |
| Mozilla Kraken 1.1 / Total | |
| HP Victus 16-r0076TX | |
| Average Intel Core i5-13500HX, NVIDIA GeForce RTX 4050 Laptop GPU (521 - 550, n=3) | |
| Acer Predator Helios Neo 16 NH.QLTEG.002 | |
| Schenker XMG Apex 15 (Late 23) | |
| Dell G15 5530 | |
| Lenovo LOQ 16IRH8 | |
| Lenovo LOQ 16IRH8 | |
| Lenovo Legion Pro 5 16ARX8 (R5 7645HX, RTX 4050) | |
| Average of class Gaming (391 - 590, n=106, last 2 years) | |
| Octane V2 / Total Score | |
| Average of class Gaming (87588 - 139447, n=31, last 2 years) | |
| Schenker XMG Apex 15 (Late 23) | |
| Acer Predator Helios Neo 16 NH.QLTEG.002 | |
| Average Intel Core i5-13500HX, NVIDIA GeForce RTX 4050 Laptop GPU (n=1) | |
| Lenovo Legion Pro 5 16ARX8 (R5 7645HX, RTX 4050) | |
| Speedometer 2.0 / Result 2.0 | |
| Average of class Gaming (29 - 686, n=30, last 2 years) | |
| Average Intel Core i5-13500HX, NVIDIA GeForce RTX 4050 Laptop GPU (n=1) | |
| Acer Predator Helios Neo 16 NH.QLTEG.002 | |
| Schenker XMG Apex 15 (Late 23) | |
| Jetstream 2 / 2.0 Total | |
| Average of class Gaming (291 - 516, n=32, last 2 years) | |
| Acer Predator Helios Neo 16 NH.QLTEG.002 | |
| Average Intel Core i5-13500HX, NVIDIA GeForce RTX 4050 Laptop GPU (n=1) | |
| Schenker XMG Apex 15 (Late 23) | |
| Lenovo Legion Pro 5 16ARX8 (R5 7645HX, RTX 4050) | |
| WebXPRT 3 / Overall | |
| Lenovo Legion Pro 5 16ARX8 (R5 7645HX, RTX 4050) | |
| Lenovo LOQ 16IRH8 | |
| Lenovo LOQ 16IRH8 | |
| Average of class Gaming (242 - 532, n=101, last 2 years) | |
| Schenker XMG Apex 15 (Late 23) | |
| Acer Predator Helios Neo 16 NH.QLTEG.002 | |
| Dell G15 5530 | |
| Average Intel Core i5-13500HX, NVIDIA GeForce RTX 4050 Laptop GPU (255 - 294, n=3) | |
| HP Victus 16-r0076TX | |
| WebXPRT 4 / Overall | |
| Average of class Gaming (176.4 - 354, n=101, last 2 years) | |
| Dell G15 5530 | |
| Lenovo Legion Pro 5 16ARX8 (R5 7645HX, RTX 4050) | |
| Average Intel Core i5-13500HX, NVIDIA GeForce RTX 4050 Laptop GPU (240 - 257, n=3) | |
| HP Victus 16-r0076TX | |
| Acer Predator Helios Neo 16 NH.QLTEG.002 | |
* ... smaller is better
| PCMark 10 Score | 6565 points | |
Help | ||
* ... smaller is better
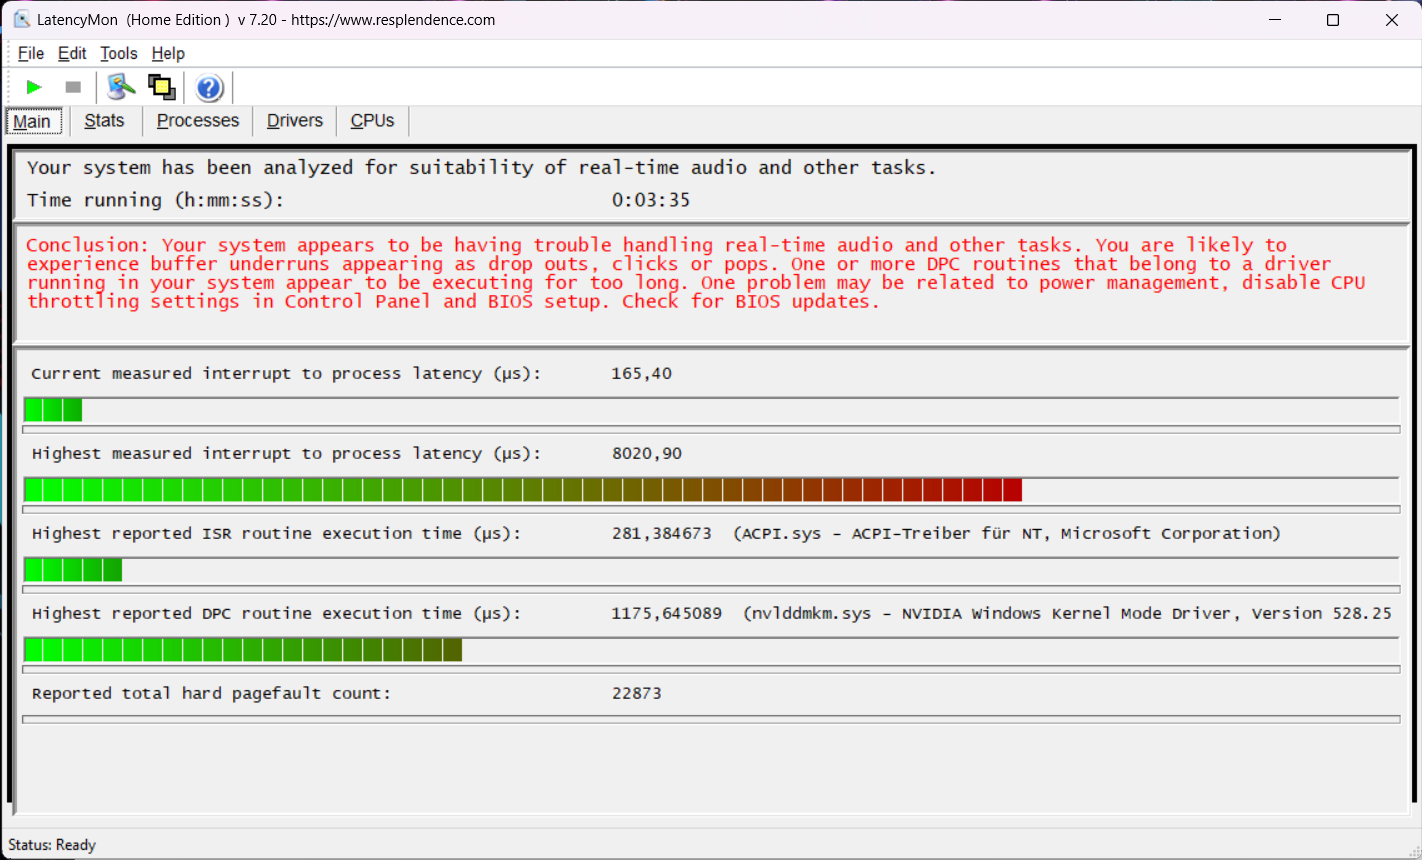
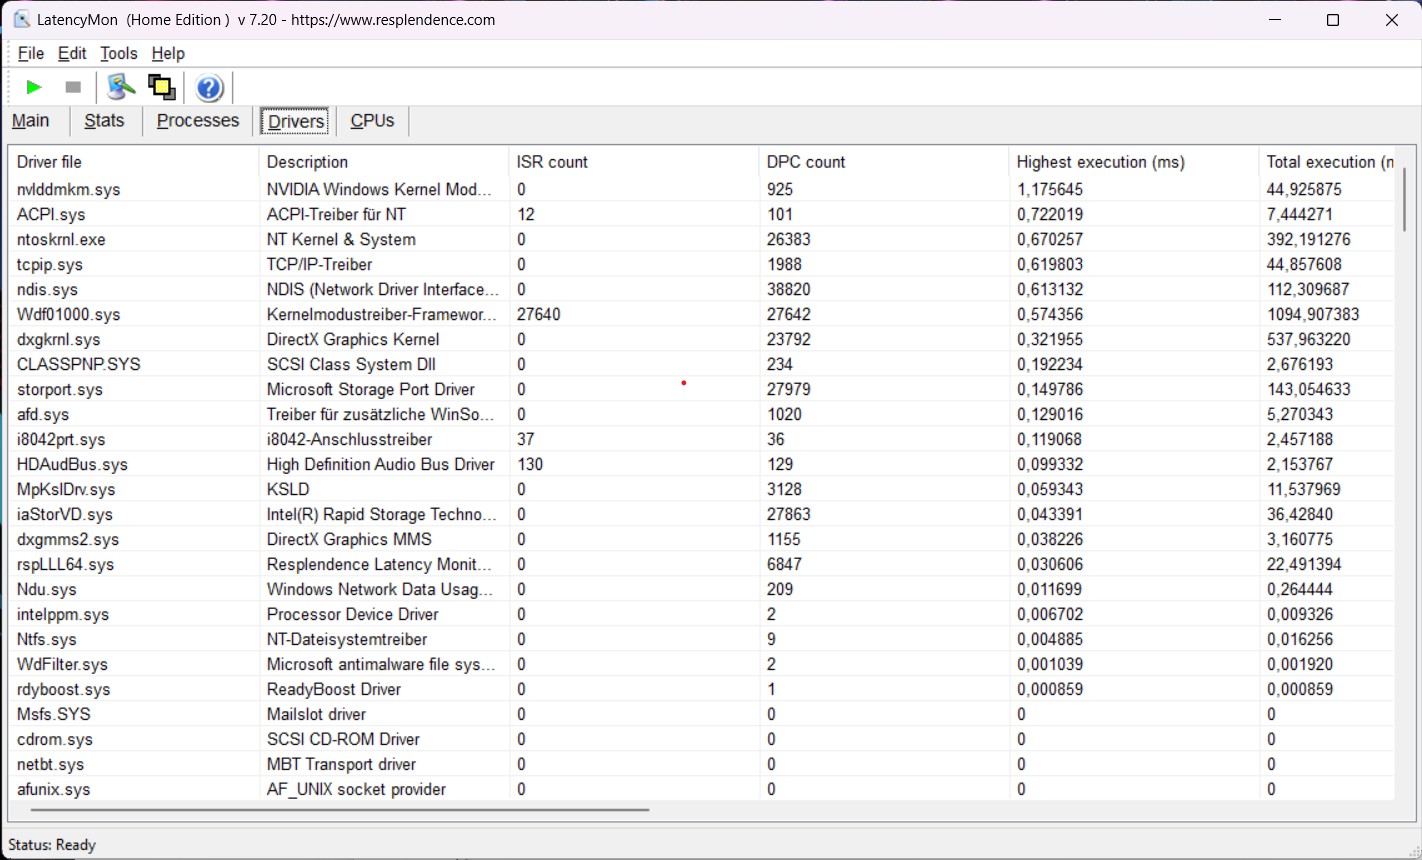
DPC latency
The Acer device's very high DPC latencies of 8,021 µs (tested several times) prevent the use of real-time multimedia software. The main reason for this is the Nvidia graphics driver. Driver and BIOS updates can improve or worsen the result.
| DPC Latencies / LatencyMon - interrupt to process latency (max), Web, Youtube, Prime95 | |
| Acer Predator Helios Neo 16 NH.QLTEG.002 | |
| Dell G15 5530 | |
| HP Victus 16-r0076TX | |
| Lenovo LOQ 16IRH8 | |
| Lenovo Legion Pro 5 16ARX8 (R5 7645HX, RTX 4050) | |
| Schenker XMG Apex 15 (Late 23) | |
* ... smaller is better
Storage devices
The installed PCIe 4.0 SSD from SK Hynix has a capacity of 512 GB. Its transfer rates of up to 5,330 MB/s (sequential reads) are high, as are its write rates and 4K values. This puts the Helios Neo 16 in first place among the comparison devices in our performance rating.
However, a thermally induced, cyclical throttling occurs after some time, as can be seen in the "DiskSpd Read Loop" graph below. Up to two internal M.2 SSDs (also double-sided) are supported.


| Acer Predator Helios Neo 16 NH.QLTEG.002 SK hynix HFS512GEJ9X125N | Lenovo Legion Pro 5 16ARX8 (R5 7645HX, RTX 4050) SK hynix PC801 HFS512GEJ9X115N | Lenovo LOQ 16IRH8 Solidigm SSDPFINW512GZL | Schenker XMG Apex 15 (Late 23) Samsung 990 Pro 1 TB | HP Victus 16-r0076TX SK hynix PC801 HFS512GEJ9X101N BF | Dell G15 5530 SSTC CL4-3D512-Q11 | |
|---|---|---|---|---|---|---|
| AS SSD | -11% | -59% | -18% | -27% | -142% | |
| Seq Read (MB/s) | 5329.5 | 5872 10% | 2603 -51% | 5586.1 5% | 5149.98 -3% | 2603.73 -51% |
| Seq Write (MB/s) | 4913.9 | 4253 -13% | 1427 -71% | 5512.25 12% | 3064.93 -38% | 494.63 -90% |
| 4K Read (MB/s) | 80.05 | 70.52 -12% | 64.4 -20% | 65.32 -18% | 62.73 -22% | 36.37 -55% |
| 4K Write (MB/s) | 306.67 | 251.8 -18% | 237 -23% | 193.71 -37% | 219.1 -29% | 188.64 -38% |
| 4K-64 Read (MB/s) | 2798.6 | 2755 -2% | 451 -84% | 2970.82 6% | 902.17 -68% | 932.26 -67% |
| 4K-64 Write (MB/s) | 4157.7 | 2647 -36% | 1265 -70% | 3872.46 -7% | 2901.89 -30% | 276.64 -93% |
| Access Time Read * (ms) | 0.035 | 0.039 -11% | 0.055 -57% | 0.038 -9% | 0.036 -3% | 0.103 -194% |
| Access Time Write * (ms) | 0.018 | 0.017 6% | 0.036 -100% | 0.02 -11% | 0.018 -0% | 0.182 -911% |
| Score Read (Points) | 3412 | 3413 0% | 776 -77% | 3595 5% | 1480 -57% | 1229 -64% |
| Score Write (Points) | 4956 | 3324 -33% | 1645 -67% | 4617 -7% | 3427 -31% | 515 -90% |
| Score Total (Points) | 10092 | 8397 -17% | 2782 -72% | 10039 -1% | 5574 -45% | 2271 -77% |
| Copy ISO MB/s (MB/s) | 4018.8 | 2397.08 -40% | 1100.94 -73% | 3765 -6% | 488.98 -88% | |
| Copy Program MB/s (MB/s) | 1391.9 | 751.31 -46% | 579.88 -58% | 1030 -26% | 296.26 -79% | |
| Copy Game MB/s (MB/s) | 2830.1 | 1329.99 -53% | 1006.61 -64% | 2124 -25% | 452.22 -84% | |
| DiskSpd | -1% | -48% | 5% | -29% | -64% | |
| seq read (MB/s) | 3283 | 4770 45% | 2171 -34% | 3181 -3% | 4378 33% | 2726 -17% |
| seq write (MB/s) | 4923 | 4938 0% | 1640 -67% | 5612 14% | 3325 -32% | 535 -89% |
| seq q8 t1 read (MB/s) | 6309 | 7328 16% | 3507 -44% | 7148 13% | 7109 13% | 2985 -53% |
| seq q8 t1 write (MB/s) | 4968 | 4936 -1% | 1645 -67% | 6887 39% | 5027 1% | 539 -89% |
| 4k q1 t1 read (MB/s) | 78.3 | 75.5 -4% | 82.1 5% | 68 -13% | 61.5 -21% | 34 -57% |
| 4k q1 t1 write (MB/s) | 393 | 296 -25% | 288 -27% | 231 -41% | 157.3 -60% | 224 -43% |
| 4k q32 t16 read (MB/s) | 4255 | 3794 -11% | 478 -89% | 4920 16% | 954 -78% | 1054 -75% |
| 4k q32 t16 write (MB/s) | 3869 | 2679 -31% | 1631 -58% | 4336 12% | 527 -86% | 507 -87% |
| Total Average (Program / Settings) | -6% /
-7% | -54% /
-55% | -7% /
-10% | -28% /
-28% | -103% /
-113% |
* ... smaller is better
* ... smaller is better
Reading continuous performance: DiskSpd Read Loop, Queue Depth 8
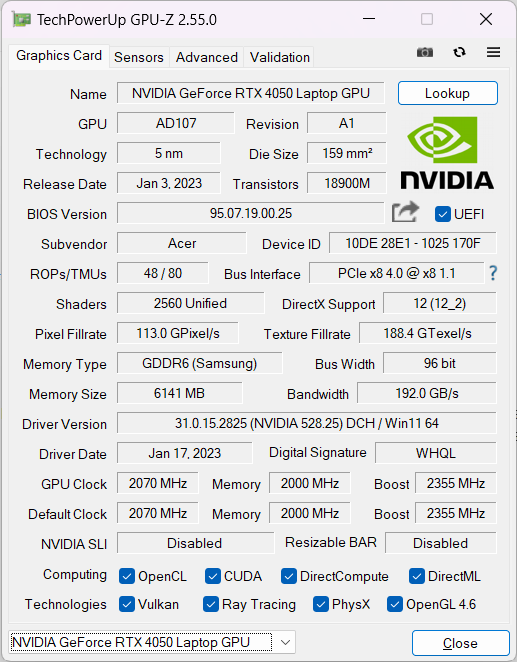
Graphics card
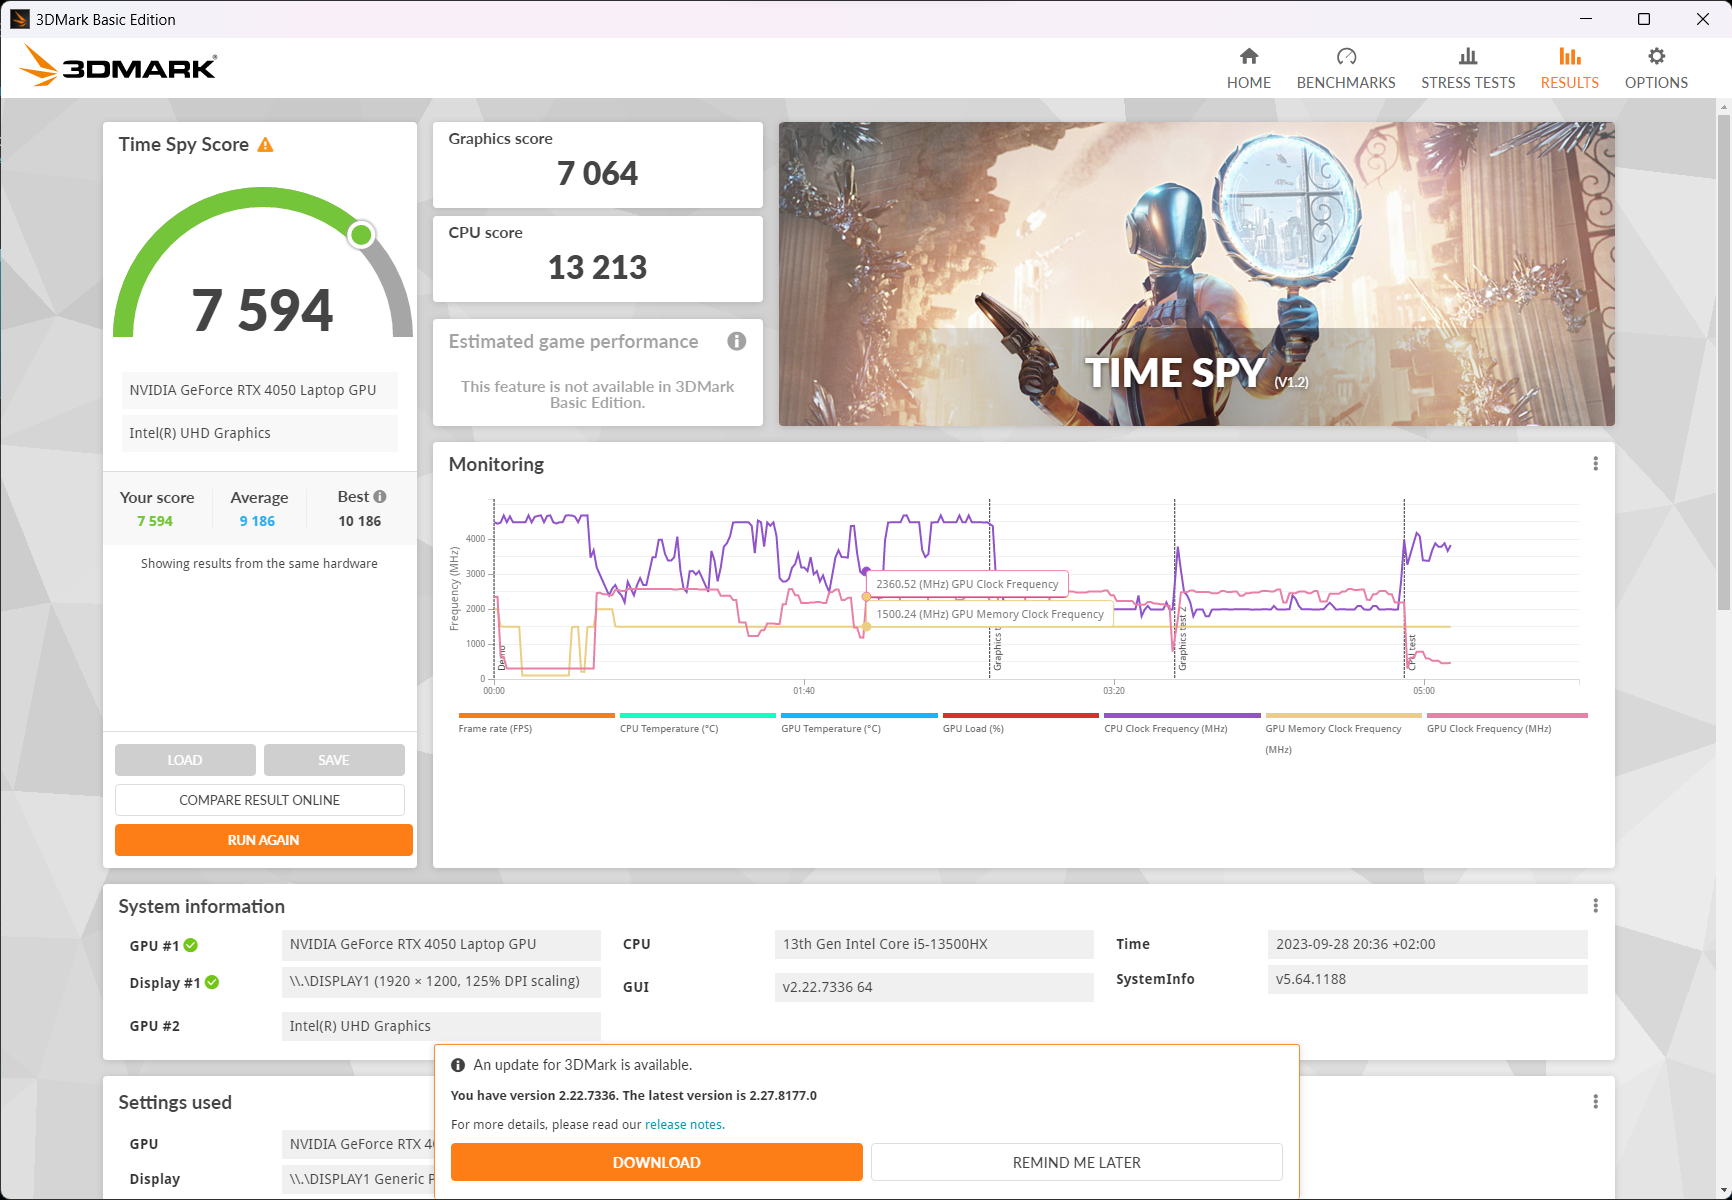
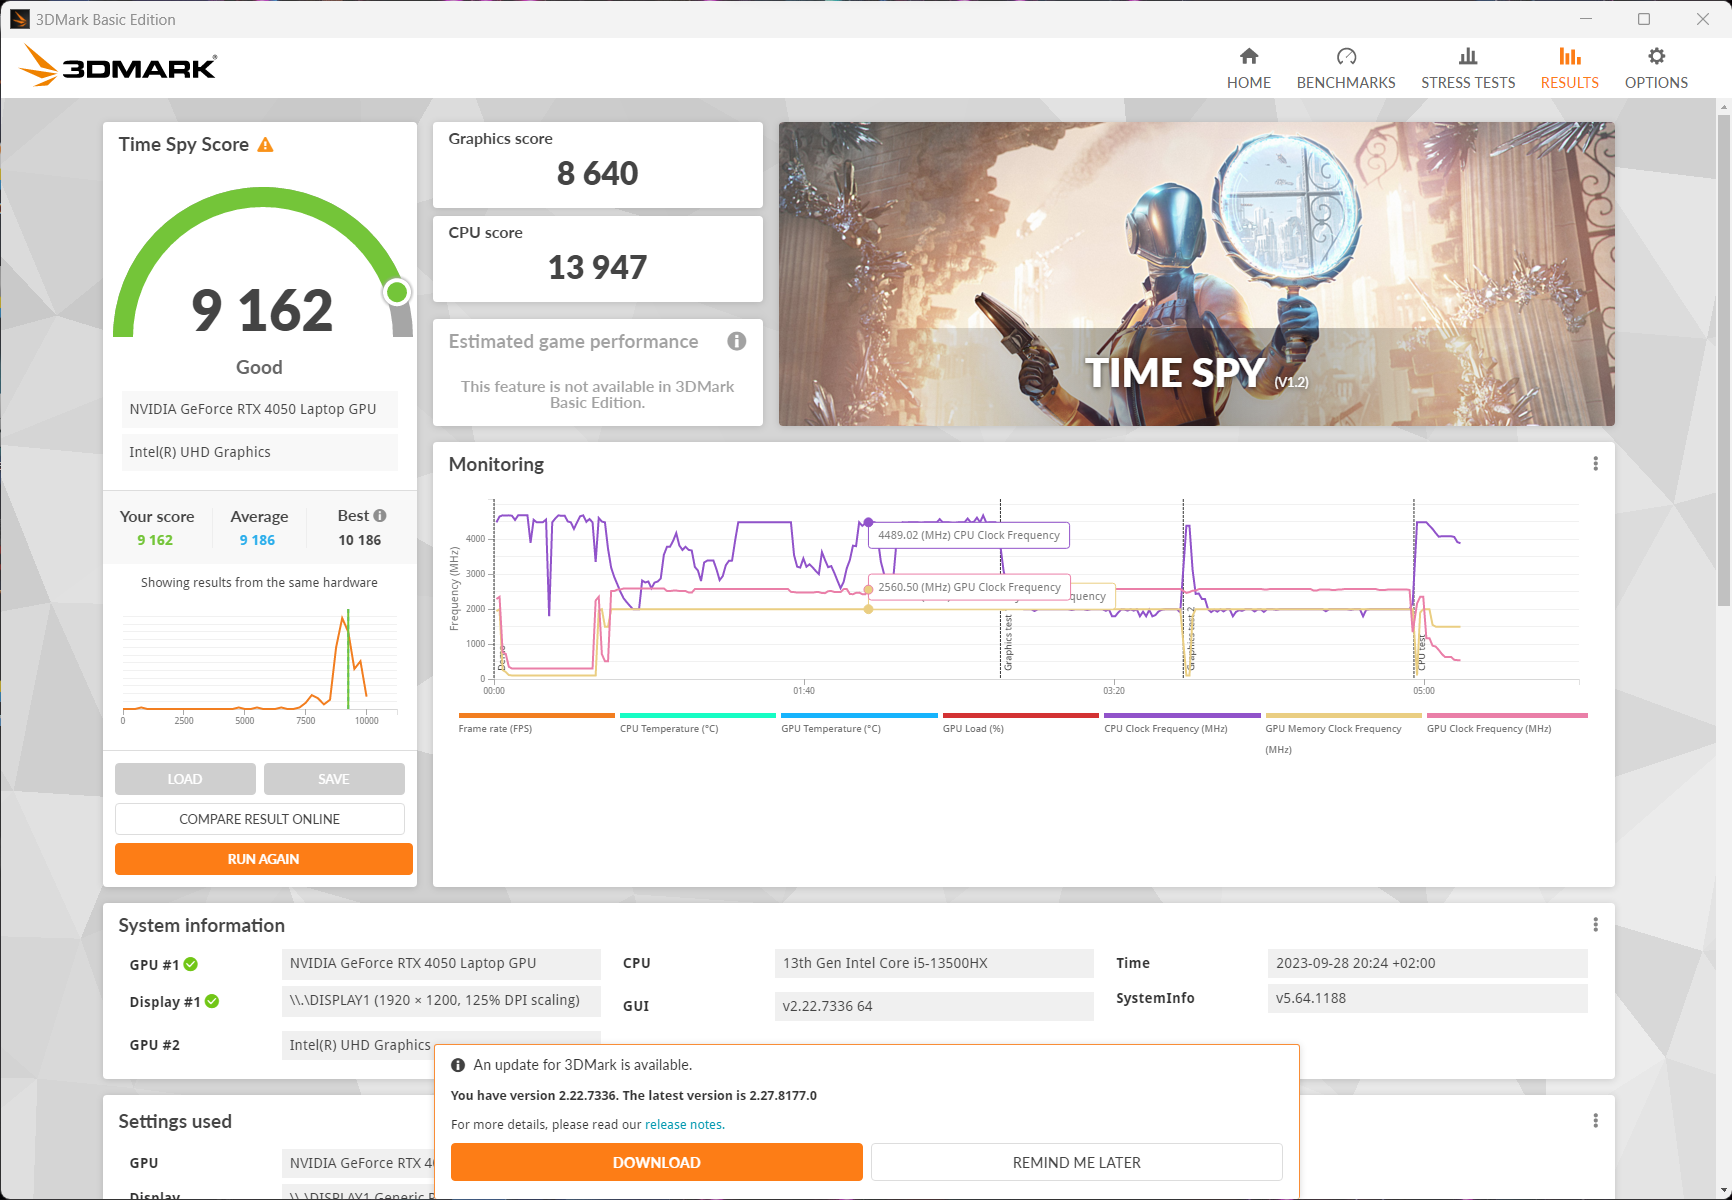
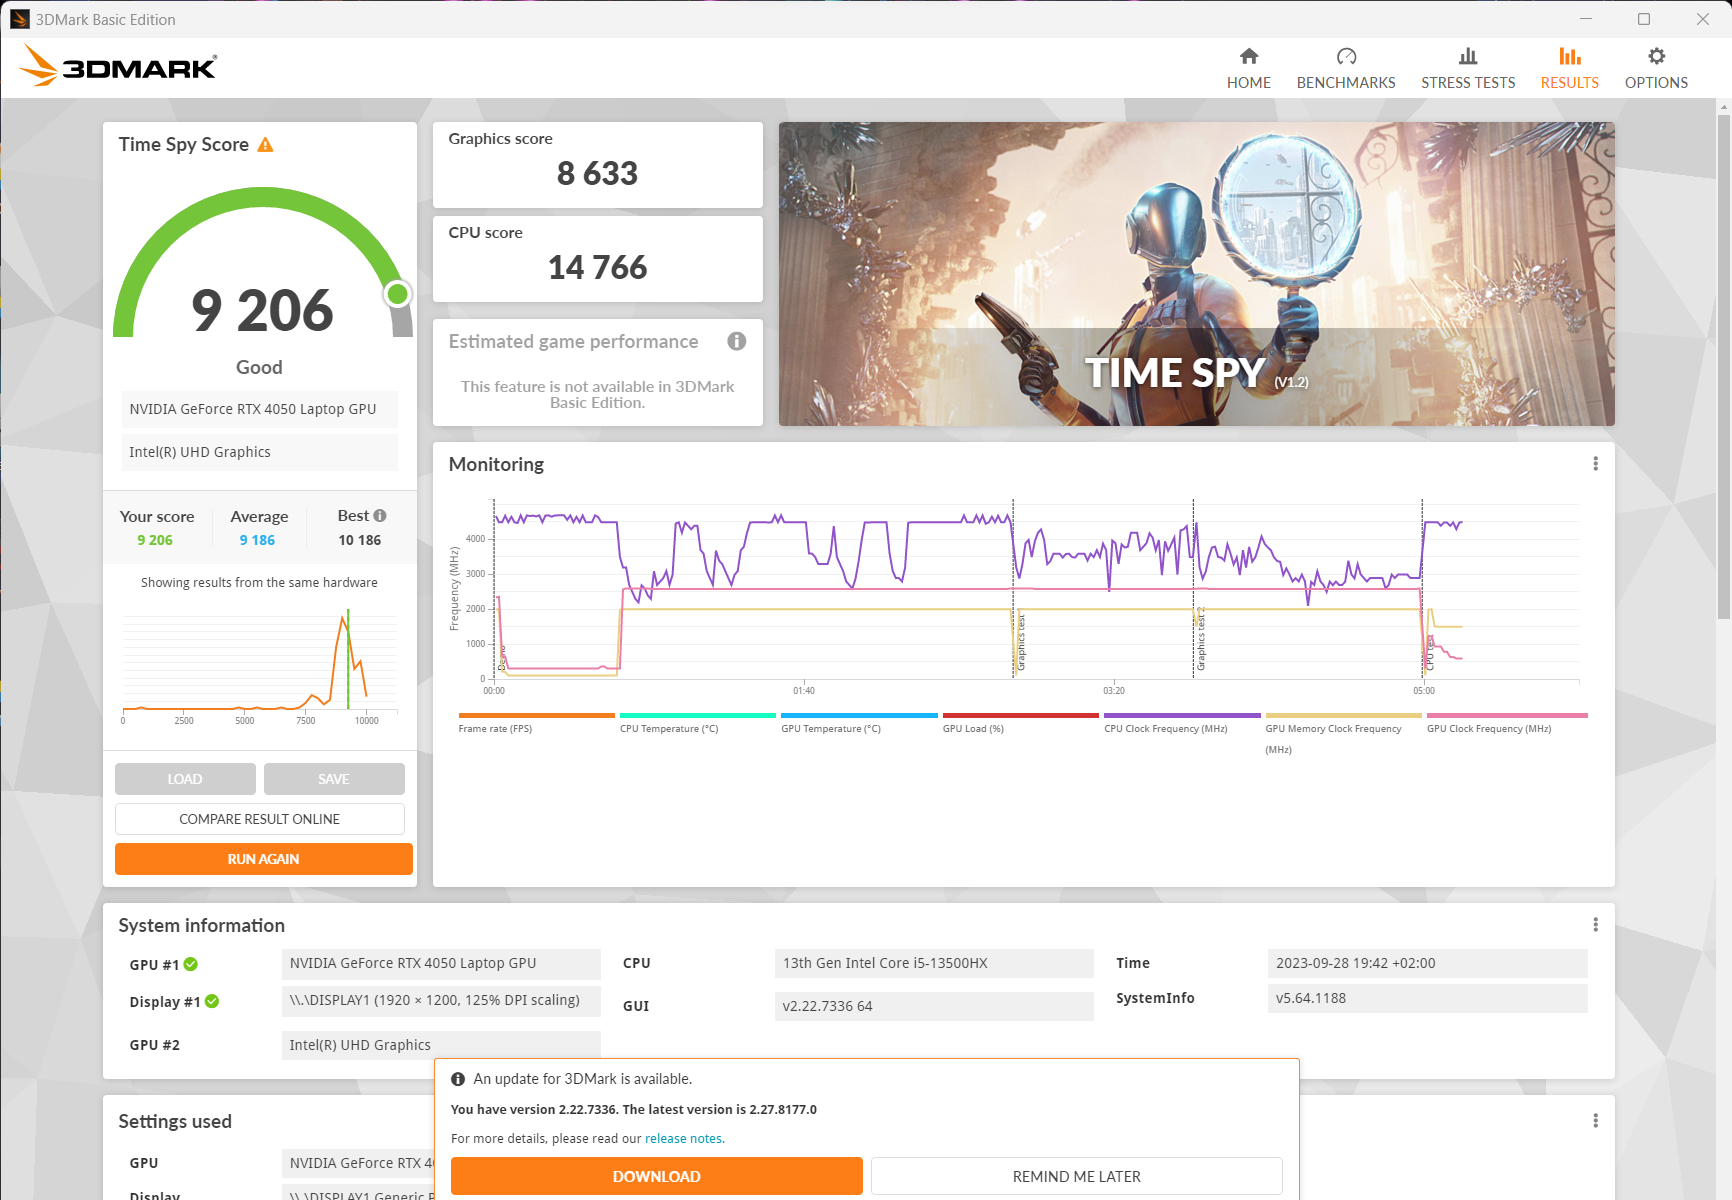
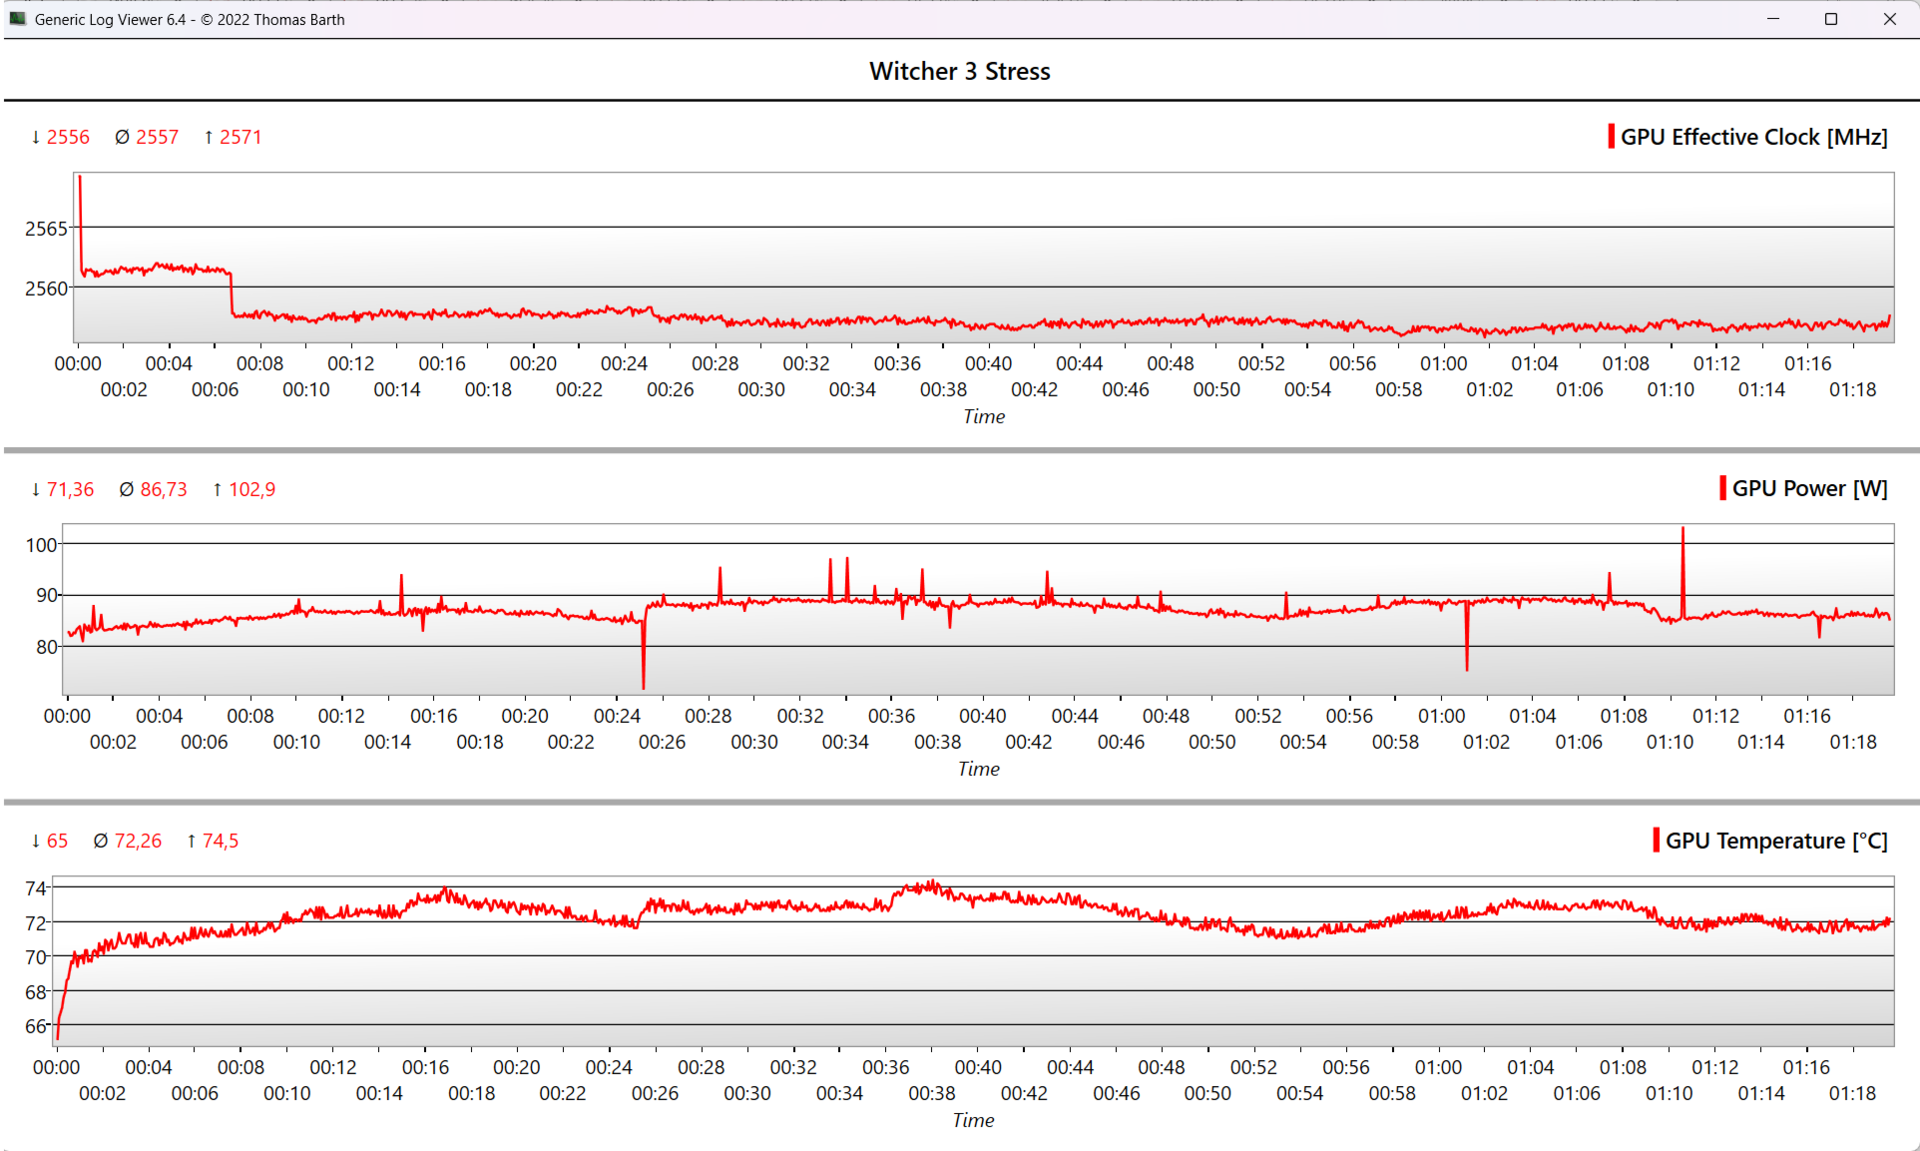
Nvidia's GeForce RTX 4050 is an entry-level GPU with 6 GB of VRAM, which draws a maximum of 130 watts (115 watts + 15 watts Dynamic Boost) within the Helios Neo 16. However, its maximum clock rate of 2,570 MHz is already reached at 85 watts to 90 watts. Only the FurMark stress test can make use of the full 130 watts, while the laptop GPU never needs more than ~88 watts when running games.
This puts the device's performance on par with other gaming laptops with the same GPU, such as the Legion Pro 5 16, Schenker XMG Apex 15 and HP Victus 16. In the synthetic benchmarks, an RTX 4060 also achieved similar results (10 % lead), such as in the Lenovo LOQ 16 and the Helios 16 (non-Neo). Its synthetic benchmark results were half as good in battery mode.
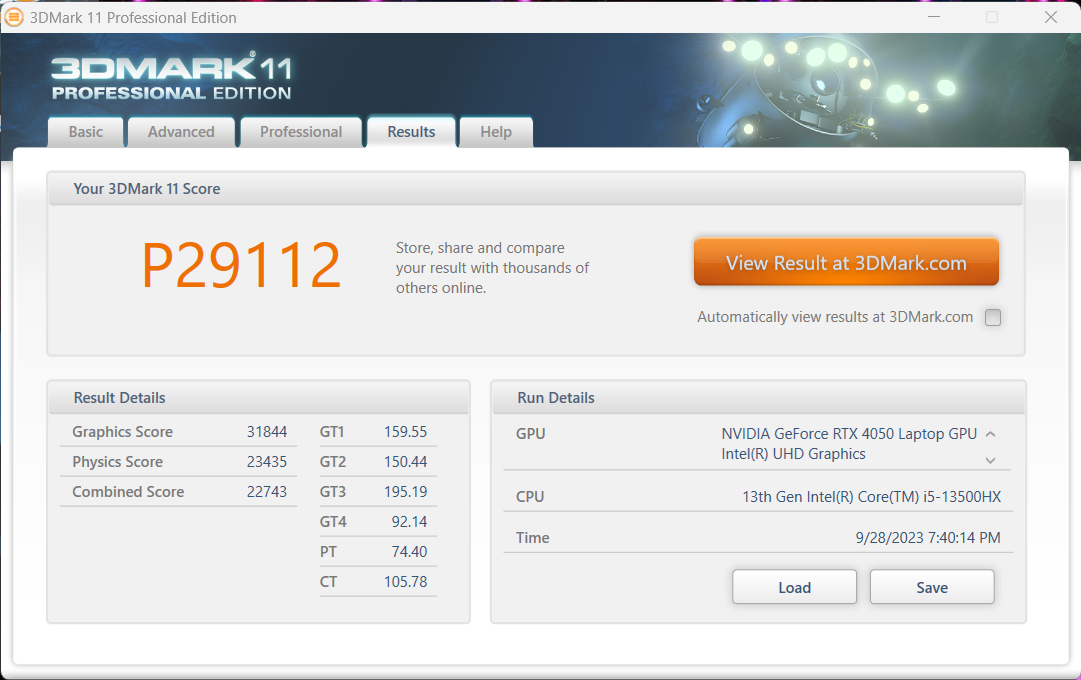
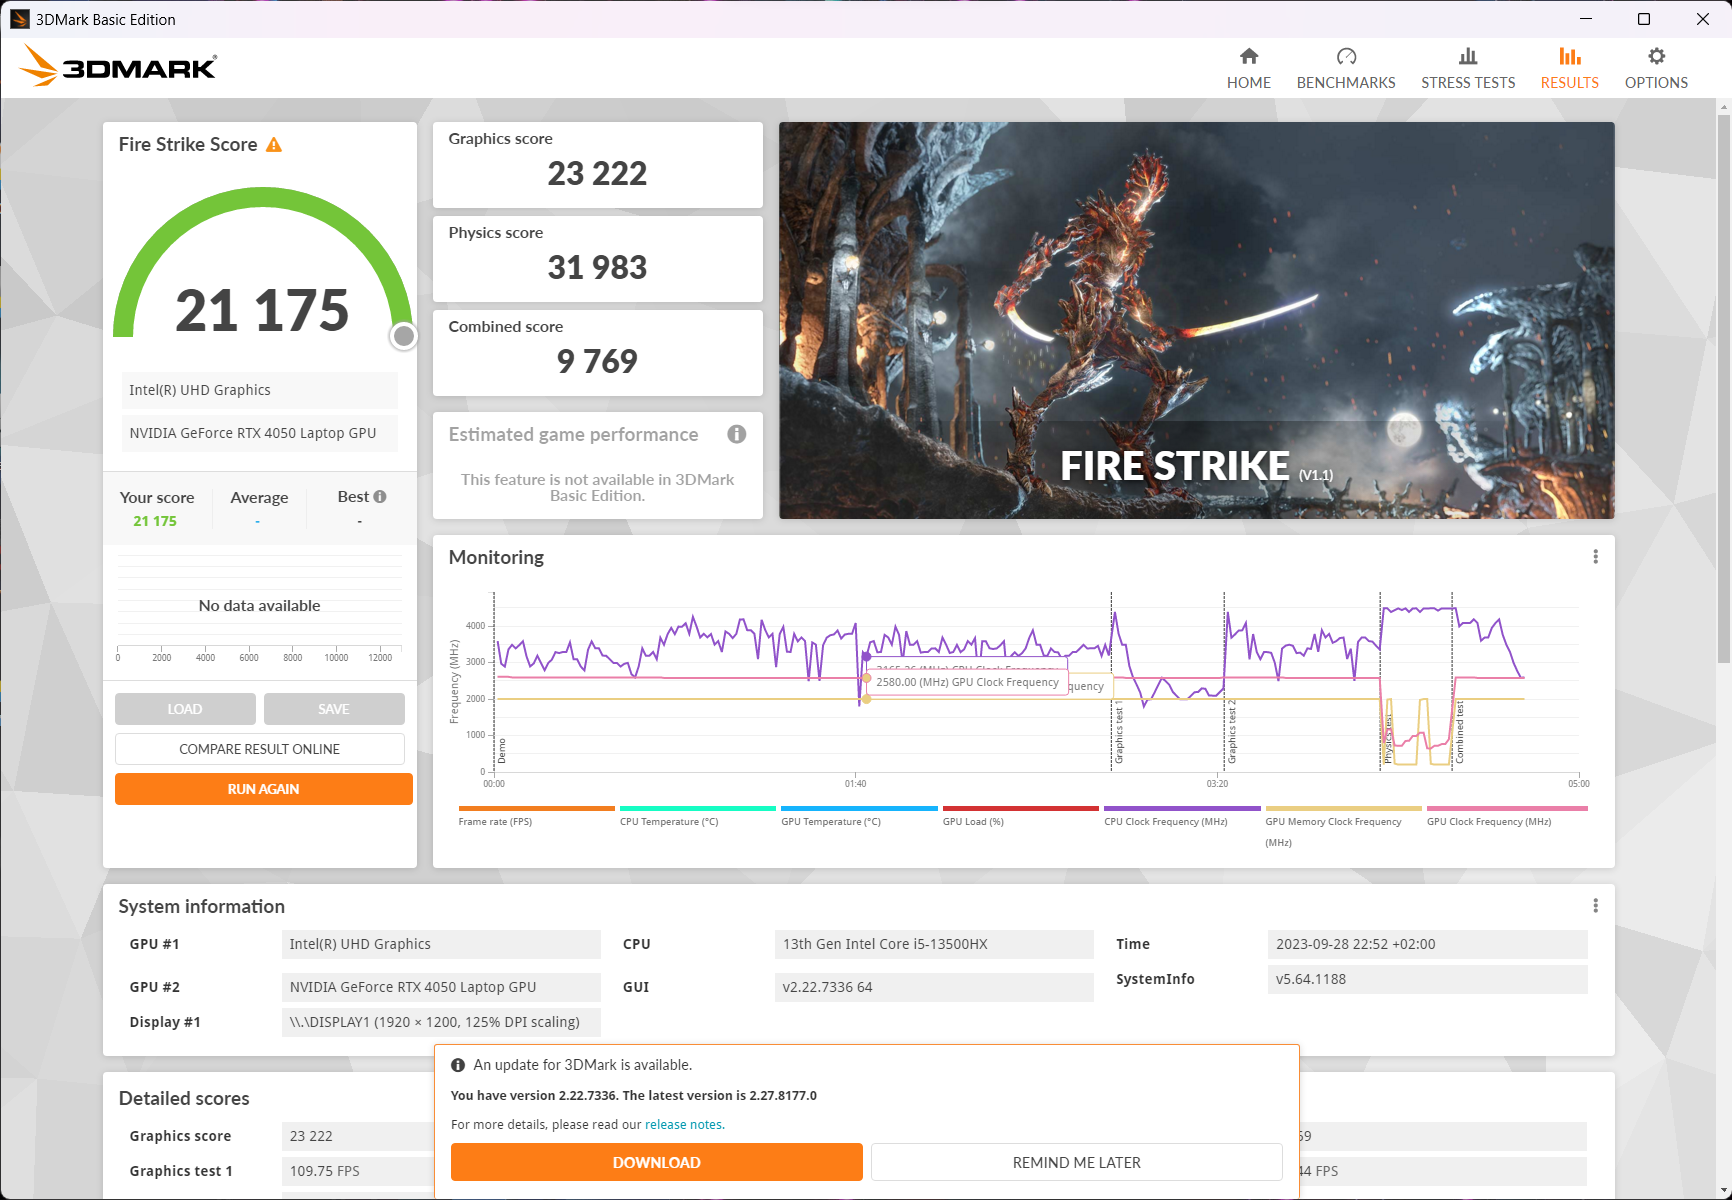
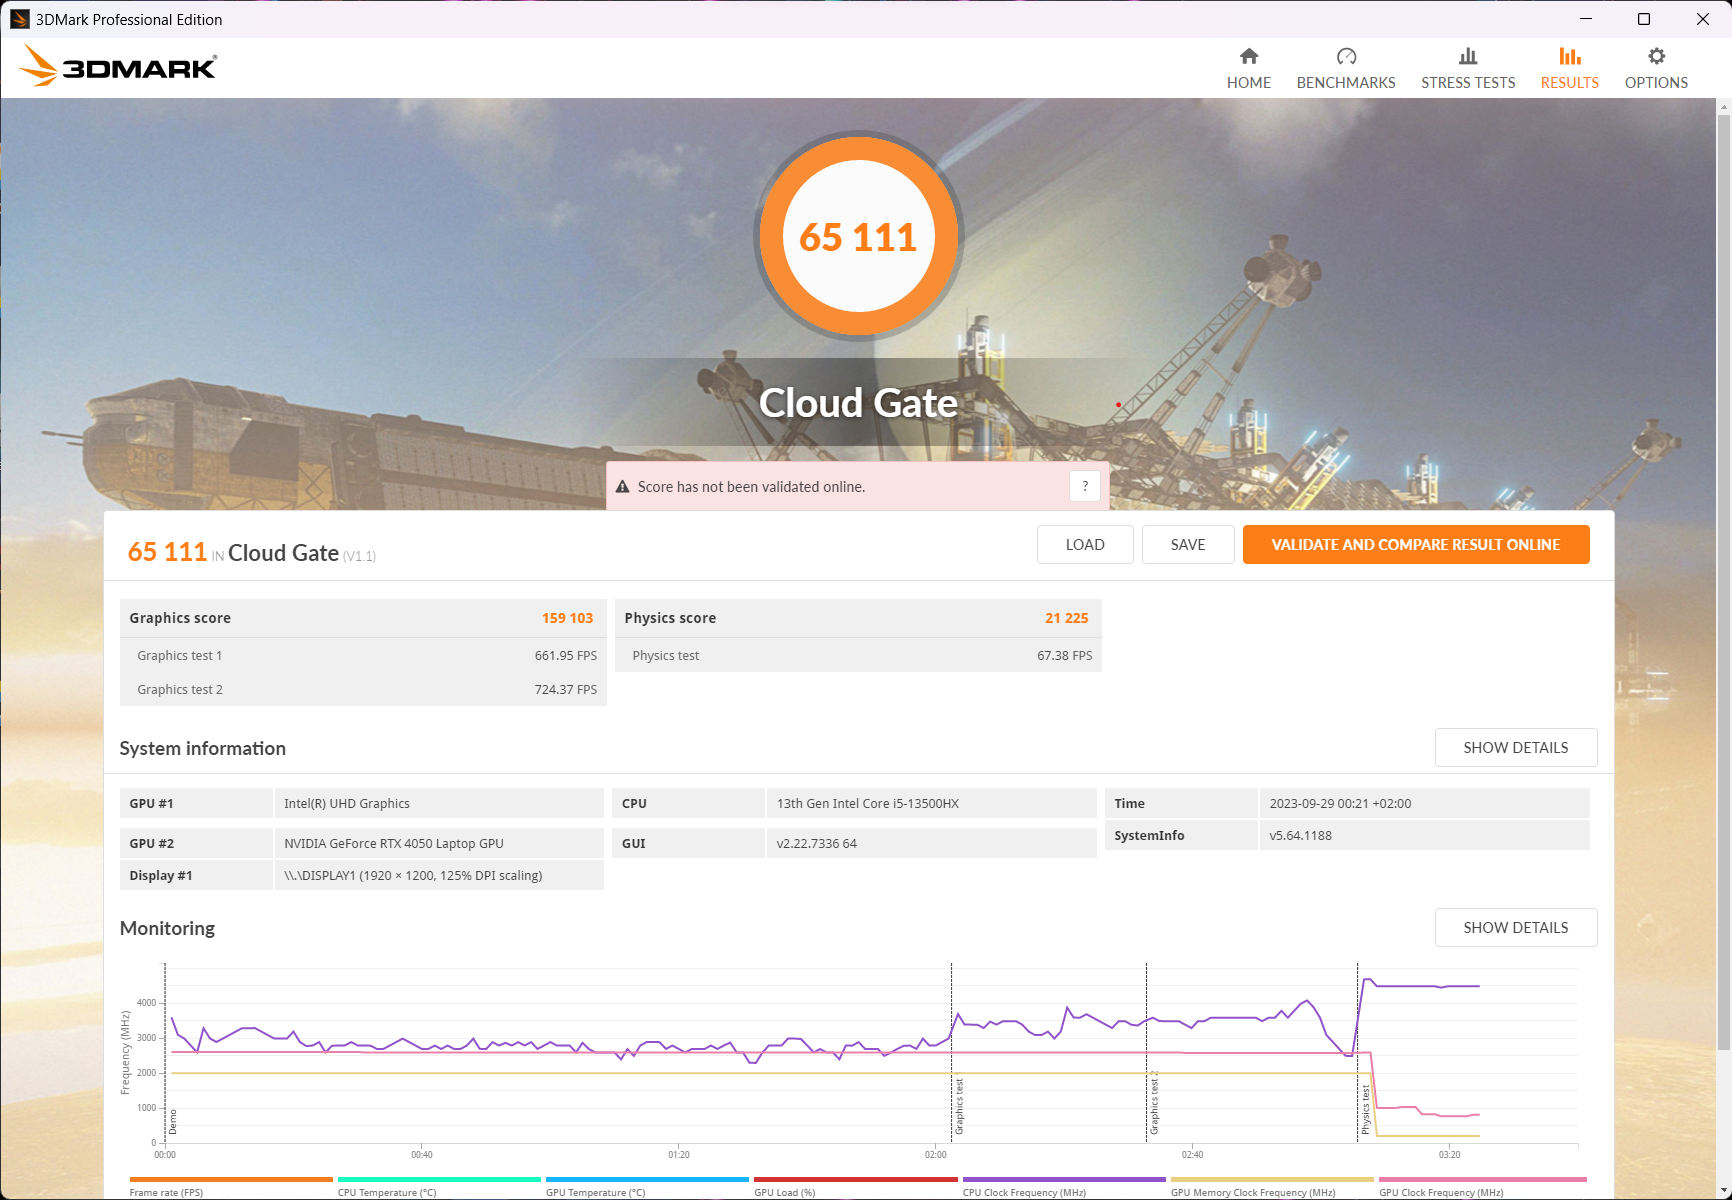

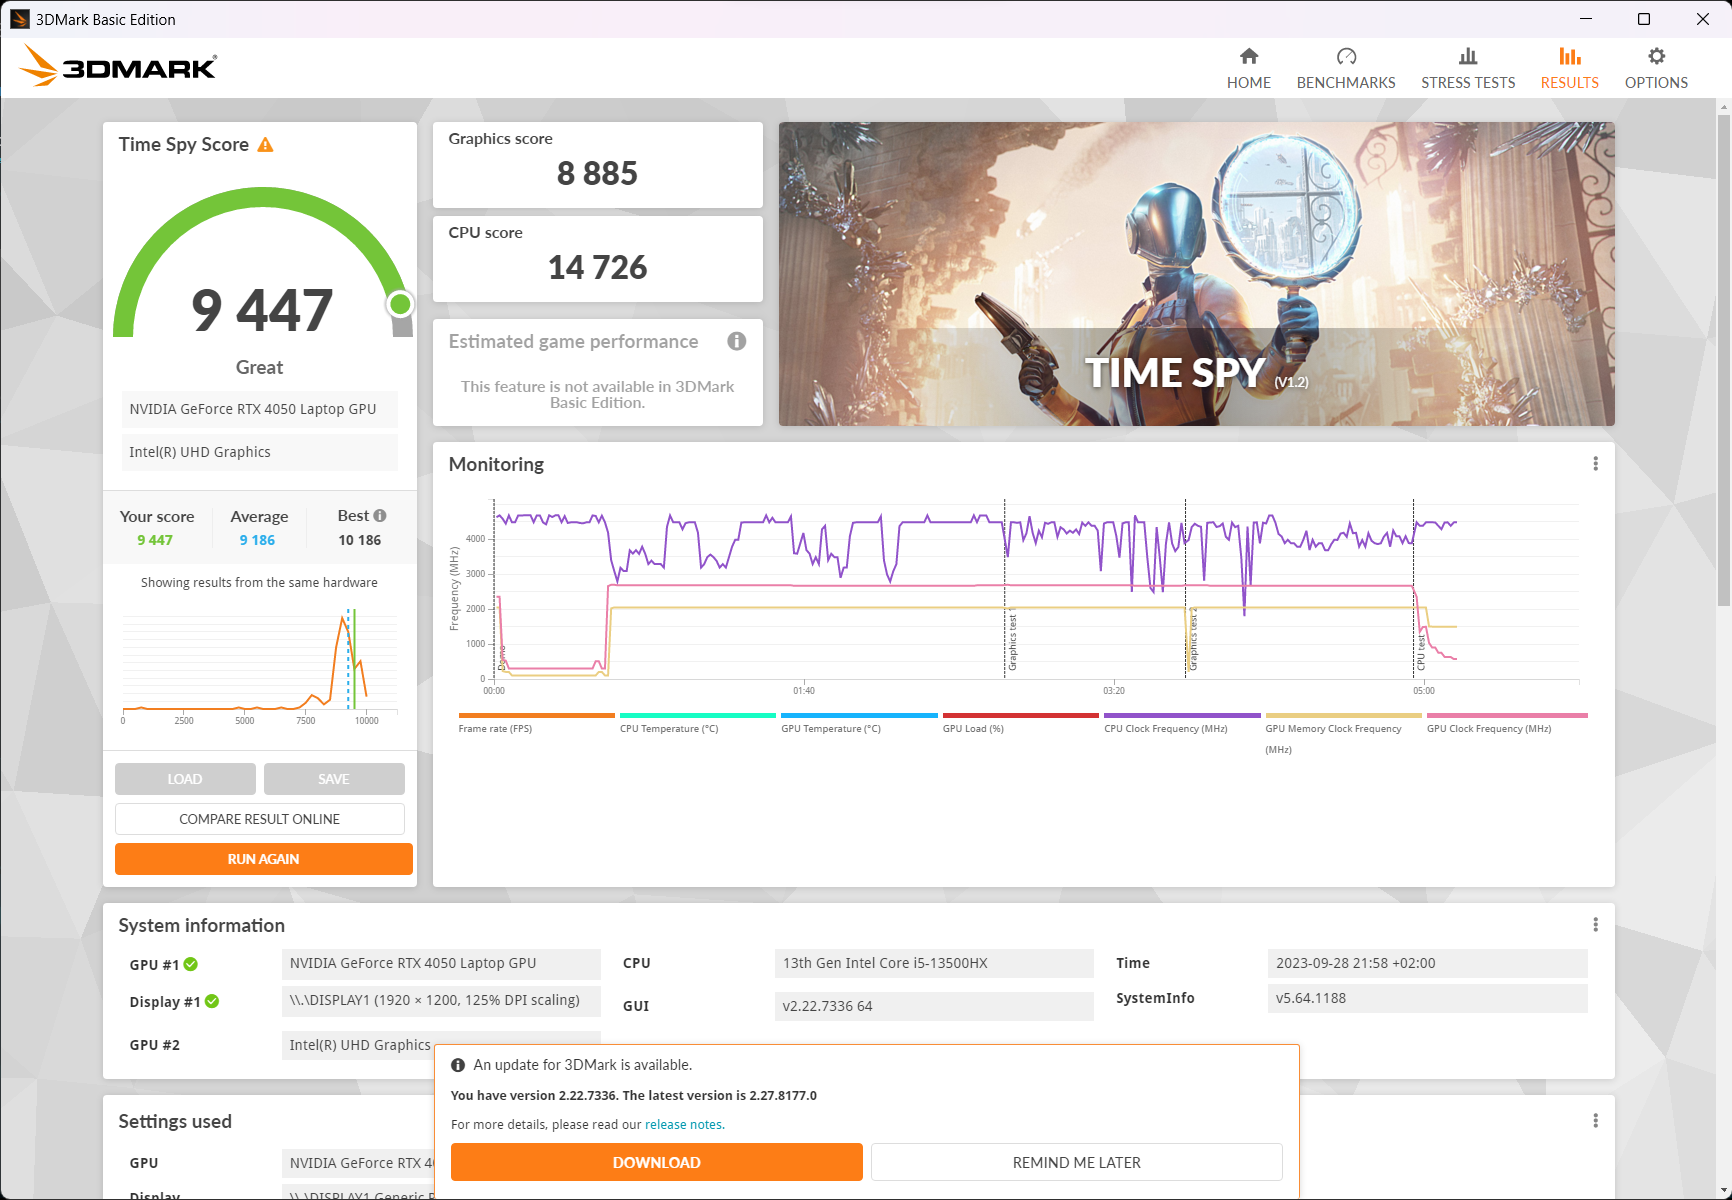
| 3DMark 11 Performance | 29112 points | |
| 3DMark Cloud Gate Standard Score | 65111 points | |
| 3DMark Fire Strike Score | 21175 points | |
| 3DMark Time Spy Score | 9206 points | |
Help | ||
* ... smaller is better
Gaming performance
In our performance ranking, the Legion Pro 5 16 came in around 7 % higher than the Helios Neo 16, while the Dell G15 5530 and the Lenovo LOQ 16 each delivered around 15 % better performance with an RTX 4060. Depending on the game, the gap to the RTX 4060 increased - to 30 % for God of War and 20 % for Hogwarts Legacy.
We recommend using balanced mode, as only 2-3 % of 3D performance is lost with significantly quieter fan noise. In battery mode, its performance was only a third as good.
| Sons of the Forest | |
| 1920x1080 Ultra Preset AA:T | |
| Lenovo Legion Pro 5 16ARX8 (R5 7645HX, RTX 4050) | |
| Average NVIDIA GeForce RTX 4050 Laptop GPU (61.9 - 76, n=4) | |
| Acer Predator Helios Neo 16 NH.QLTEG.002 | |
| 1920x1080 High Preset AA:T | |
| Lenovo Legion Pro 5 16ARX8 (R5 7645HX, RTX 4050) | |
| Acer Predator Helios Neo 16 NH.QLTEG.002 | |
| Average NVIDIA GeForce RTX 4050 Laptop GPU (63.5 - 76, n=4) | |
Witcher 3 FPS diagram
| low | med. | high | ultra | |
|---|---|---|---|---|
| GTA V (2015) | 186.7 | 185.1 | 176.3 | 96.5 |
| The Witcher 3 (2015) | 286 | 154.4 | 81 | |
| Dota 2 Reborn (2015) | 180.9 | 167.9 | 156.4 | 147 |
| Final Fantasy XV Benchmark (2018) | 215 | 118.6 | 84.6 | |
| X-Plane 11.11 (2018) | 152.4 | 134.7 | 106.1 | |
| Strange Brigade (2018) | 476 | 211 | 171.9 | 149.4 |
| F1 2021 (2021) | 291 | 222 | 119.5 | |
| God of War (2022) | 86.8 | 71.1 | 50.1 | |
| Hogwarts Legacy (2023) | 64 | 53.1 | 51.1 | |
| Sons of the Forest (2023) | 78.8 | 74.5 | 70 | |
| Star Wars Jedi Survivor (2023) | 58 | 53.6 | 50.7 | |
| F1 23 (2023) | 262 | 208 | 150.7 | 44.5 |
Emissions: Liquid metal inside the mid-range Helios Neo 16
Noise emissions
The Acer Predator Helios Neo 16 remains mostly quiet in every performance mode — not only in idle mode, but also when surfing the web and performing simple office tasks, although the fan always emits a quiet whirring.
Under pure CPU load, the noise levels rise to 37.7 dB(A), which is still not overly annoying. Balanced mode is recommended for gaming — when using this mode, the laptop's noise emissions are almost pleasant. The Legion Pro 5 16, on the other hand, only reaches 43.8 dB(A) ex works when gaming. The Dell G15 5530 is also quite quiet, especially under medium load. We could not detect any electronic noise in our model.
Noise level
| Idle |
| 25.9 / 25.9 / 29.3 dB(A) |
| Load |
| 37.7 / 62.7 dB(A) |
 | ||
30 dB silent 40 dB(A) audible 50 dB(A) loud |
||
min: | ||
| Acer Predator Helios Neo 16 NH.QLTEG.002 GeForce RTX 4050 Laptop GPU, i5-13500HX, SK hynix HFS512GEJ9X125N | Lenovo Legion Pro 5 16ARX8 (R5 7645HX, RTX 4050) GeForce RTX 4050 Laptop GPU, R5 7645HX, SK hynix PC801 HFS512GEJ9X115N | Lenovo LOQ 16IRH8 GeForce RTX 4060 Laptop GPU, i7-13620H, Solidigm SSDPFINW512GZL | HP Victus 16-r0076TX GeForce RTX 4050 Laptop GPU, i5-13500HX, SK hynix PC801 HFS512GEJ9X101N BF | Dell G15 5530 GeForce RTX 4060 Laptop GPU, i7-13650HX, SSTC CL4-3D512-Q11 | Schenker XMG Apex 15 (Late 23) GeForce RTX 4050 Laptop GPU, R7 7840HS, Samsung 990 Pro 1 TB | |
|---|---|---|---|---|---|---|
| Noise | 13% | 2% | 10% | 12% | 1% | |
| off / environment * (dB) | 25.9 | 23 11% | 23 11% | 21.57 17% | 20.41 21% | 24 7% |
| Idle Minimum * (dB) | 25.9 | 23 11% | 23 11% | 23.68 9% | 26.85 -4% | 25 3% |
| Idle Average * (dB) | 25.9 | 23 11% | 23 11% | 23.68 9% | 26.85 -4% | 29 -12% |
| Idle Maximum * (dB) | 29.3 | 24.42 17% | 27.66 6% | 23.68 19% | 26.85 8% | 33 -13% |
| Load Average * (dB) | 37.7 | 34.94 7% | 53.62 -42% | 39.44 -5% | 27.65 27% | 36 5% |
| Load Maximum * (dB) | 62.7 | 50 20% | 53.5 15% | 55.37 12% | 47.86 24% | 53 15% |
| Witcher 3 ultra * (dB) | 43.79 | 53.5 | 55.4 | 47.9 | 48 |
* ... smaller is better
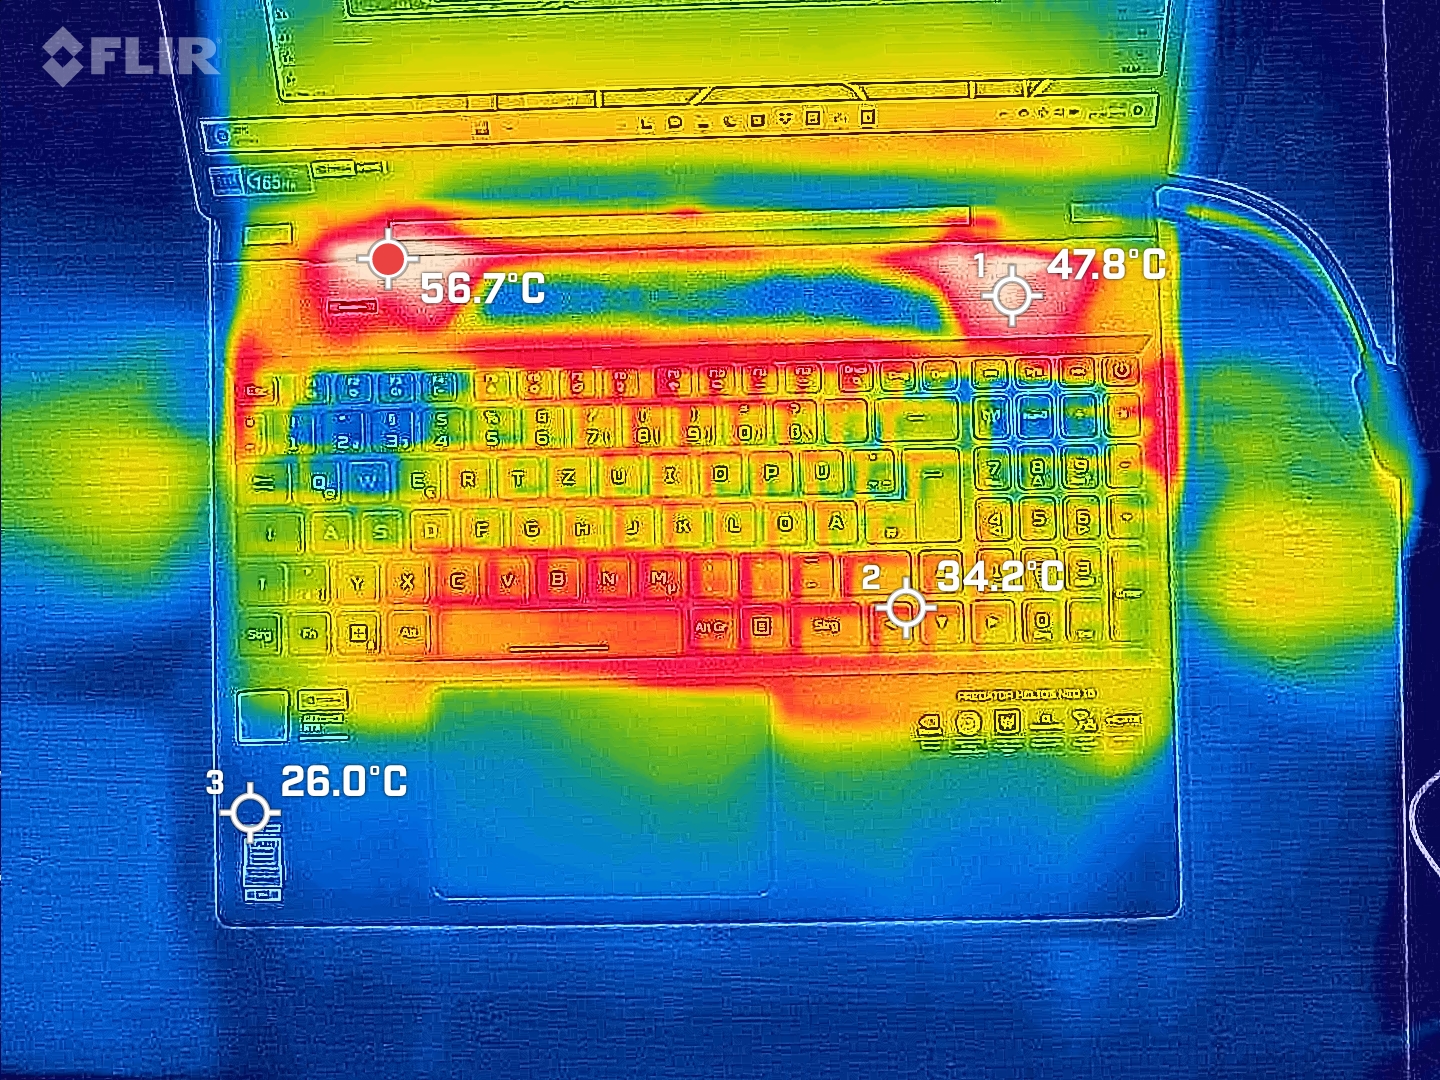
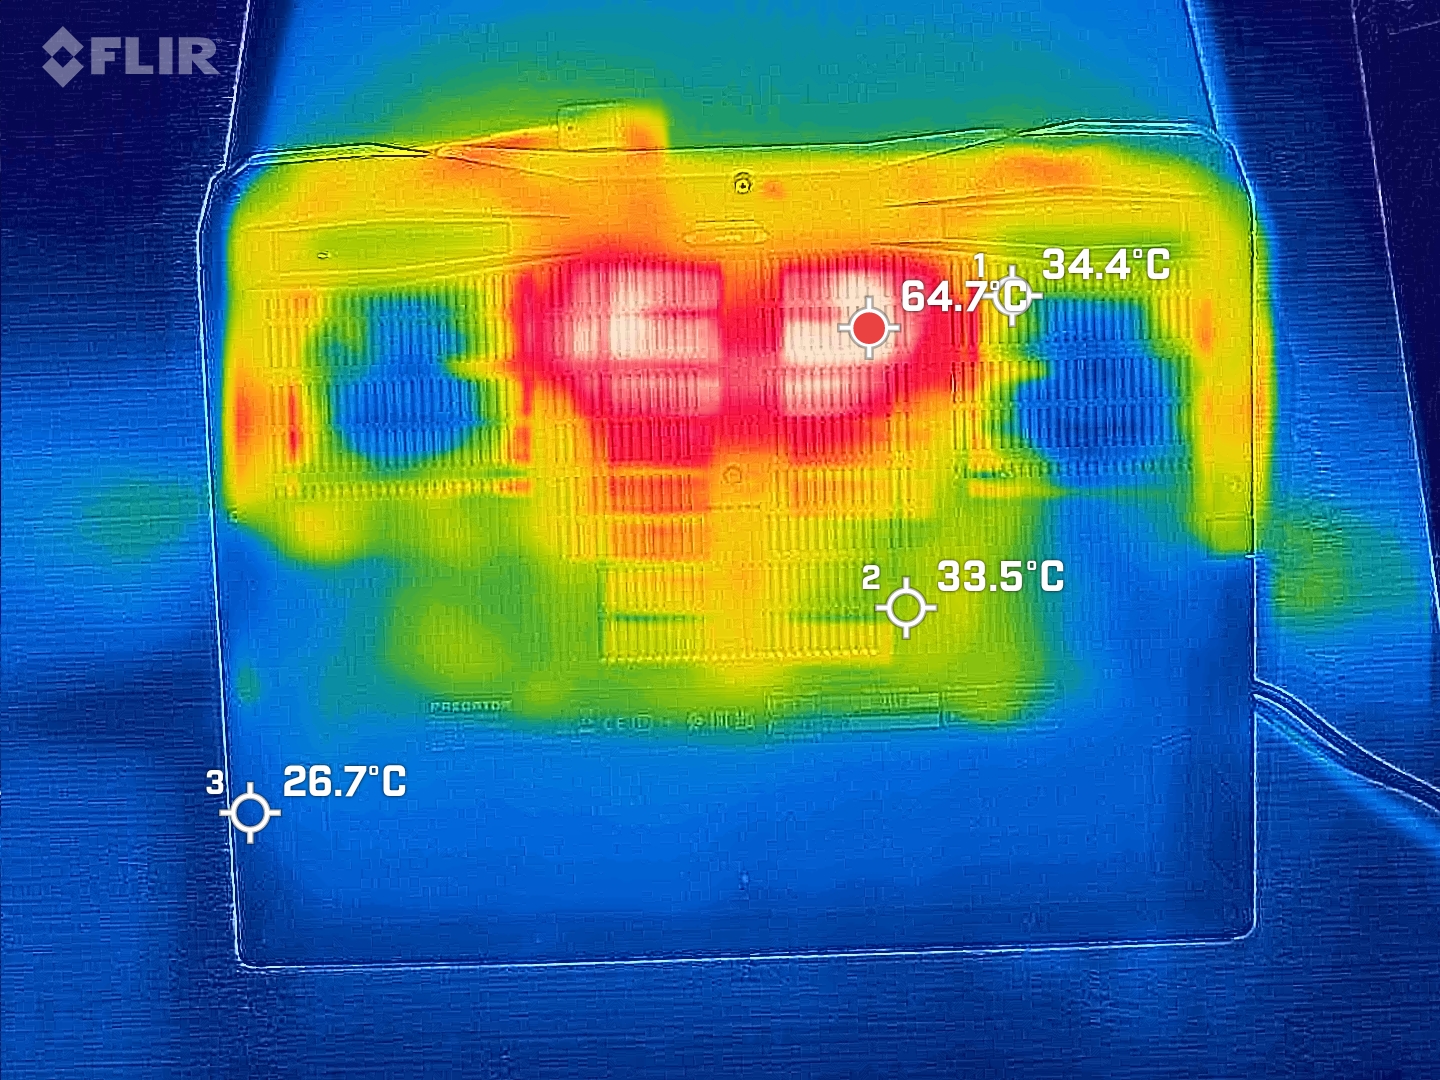
Temperature
Overall, Acer's gaming laptop remains fairly cool, with its surfaces mostly only reaching 25 to 35 °C under full load. However, we noted some hotspots with temperatures up to 56 °C: on the left above the keyboard and on the back at the center top. The latter might get uncomfortable when gaming with the laptop positioned on your lap, for example.
(-) The maximum temperature on the upper side is 55.7 °C / 132 F, compared to the average of 40.4 °C / 105 F, ranging from 21.2 to 68.8 °C for the class Gaming.
(-) The bottom heats up to a maximum of 55 °C / 131 F, compared to the average of 43.2 °C / 110 F
(+) In idle usage, the average temperature for the upper side is 24.1 °C / 75 F, compared to the device average of 33.9 °C / 93 F.
(+) The palmrests and touchpad are cooler than skin temperature with a maximum of 26.1 °C / 79 F and are therefore cool to the touch.
(+) The average temperature of the palmrest area of similar devices was 28.8 °C / 83.8 F (+2.7 °C / 4.8 F).


| Acer Predator Helios Neo 16 NH.QLTEG.002 Intel Core i5-13500HX, NVIDIA GeForce RTX 4050 Laptop GPU | Lenovo Legion Pro 5 16ARX8 (R5 7645HX, RTX 4050) AMD Ryzen 5 7645HX, NVIDIA GeForce RTX 4050 Laptop GPU | Lenovo LOQ 16IRH8 Intel Core i7-13620H, NVIDIA GeForce RTX 4060 Laptop GPU | Schenker XMG Apex 15 (Late 23) AMD Ryzen 7 7840HS, NVIDIA GeForce RTX 4050 Laptop GPU | HP Victus 16-r0076TX Intel Core i5-13500HX, NVIDIA GeForce RTX 4050 Laptop GPU | Dell G15 5530 Intel Core i7-13650HX, NVIDIA GeForce RTX 4060 Laptop GPU | |
|---|---|---|---|---|---|---|
| Heat | -15% | -2% | -7% | -0% | -16% | |
| Maximum Upper Side * (°C) | 55.7 | 45 19% | 48 14% | 52 7% | 48 14% | 54 3% |
| Maximum Bottom * (°C) | 55 | 54 2% | 59 -7% | 47 15% | 48 13% | 62.2 -13% |
| Idle Upper Side * (°C) | 26 | 36 -38% | 28 -8% | 33 -27% | 29.6 -14% | 33.4 -28% |
| Idle Bottom * (°C) | 26.6 | 38 -43% | 28 -5% | 33 -24% | 30.2 -14% | 33.4 -26% |
* ... smaller is better
Stress test
During our combined stress test (FurMark + Prime95), the P cores' clock rate dropped from 4 GHz to just 2 GHz after one minute and started to fluctuate around 2.25 GHz from minute 5, which is above the base clock of 1.8 GHz.
The CPU reached up to 92 °C but fluctuated so much that even after an hour it still occasionally fell below the 80 °C mark. Its average power consumption is 58 watts, while the Helios 16 (non-Neo) with an i7-13700HX draws 100 watts despite having (almost) the same cooling system. The GPU's clock rate quickly went from 2,560 MHz (maximum clock) to around 2,350 MHz and reached temperatures of up to 87 °C.
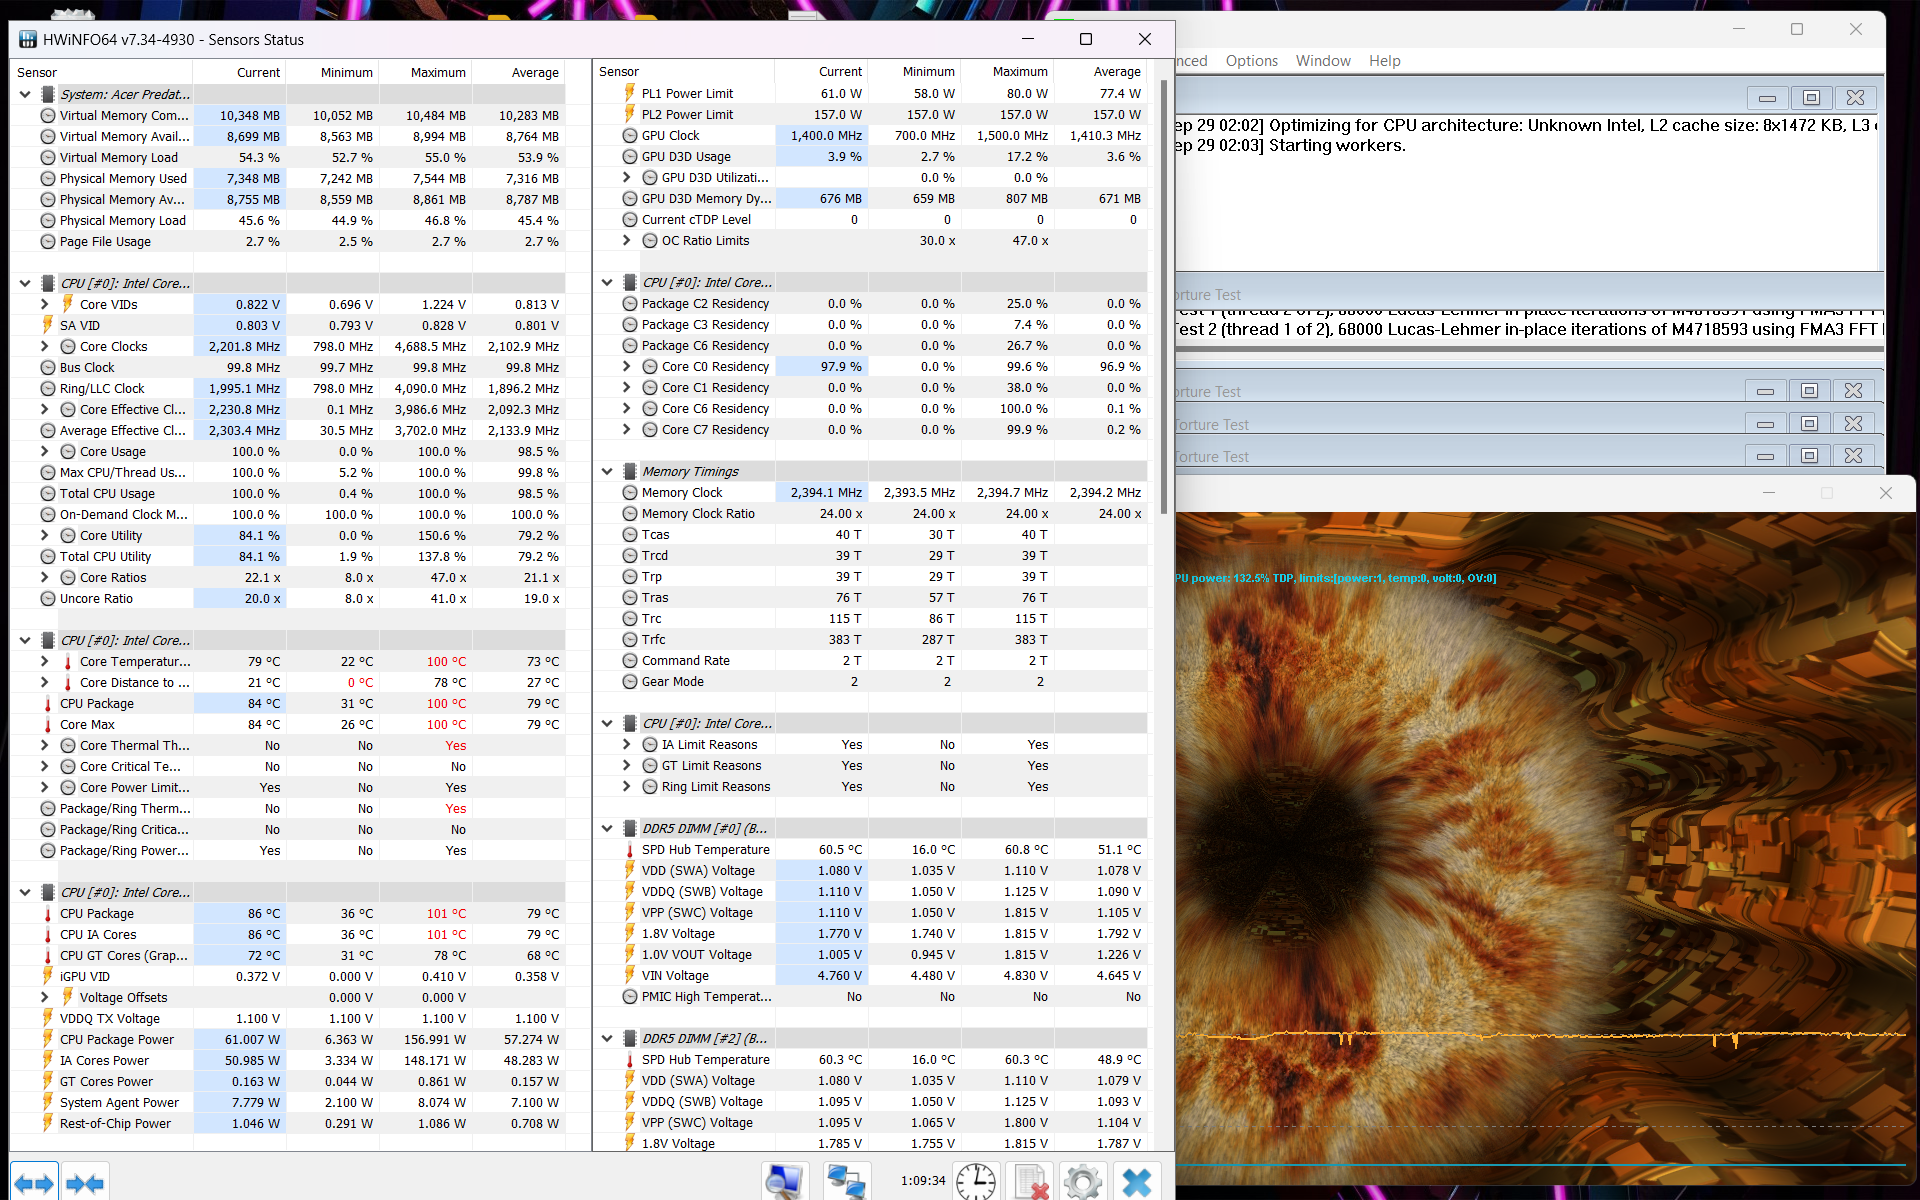
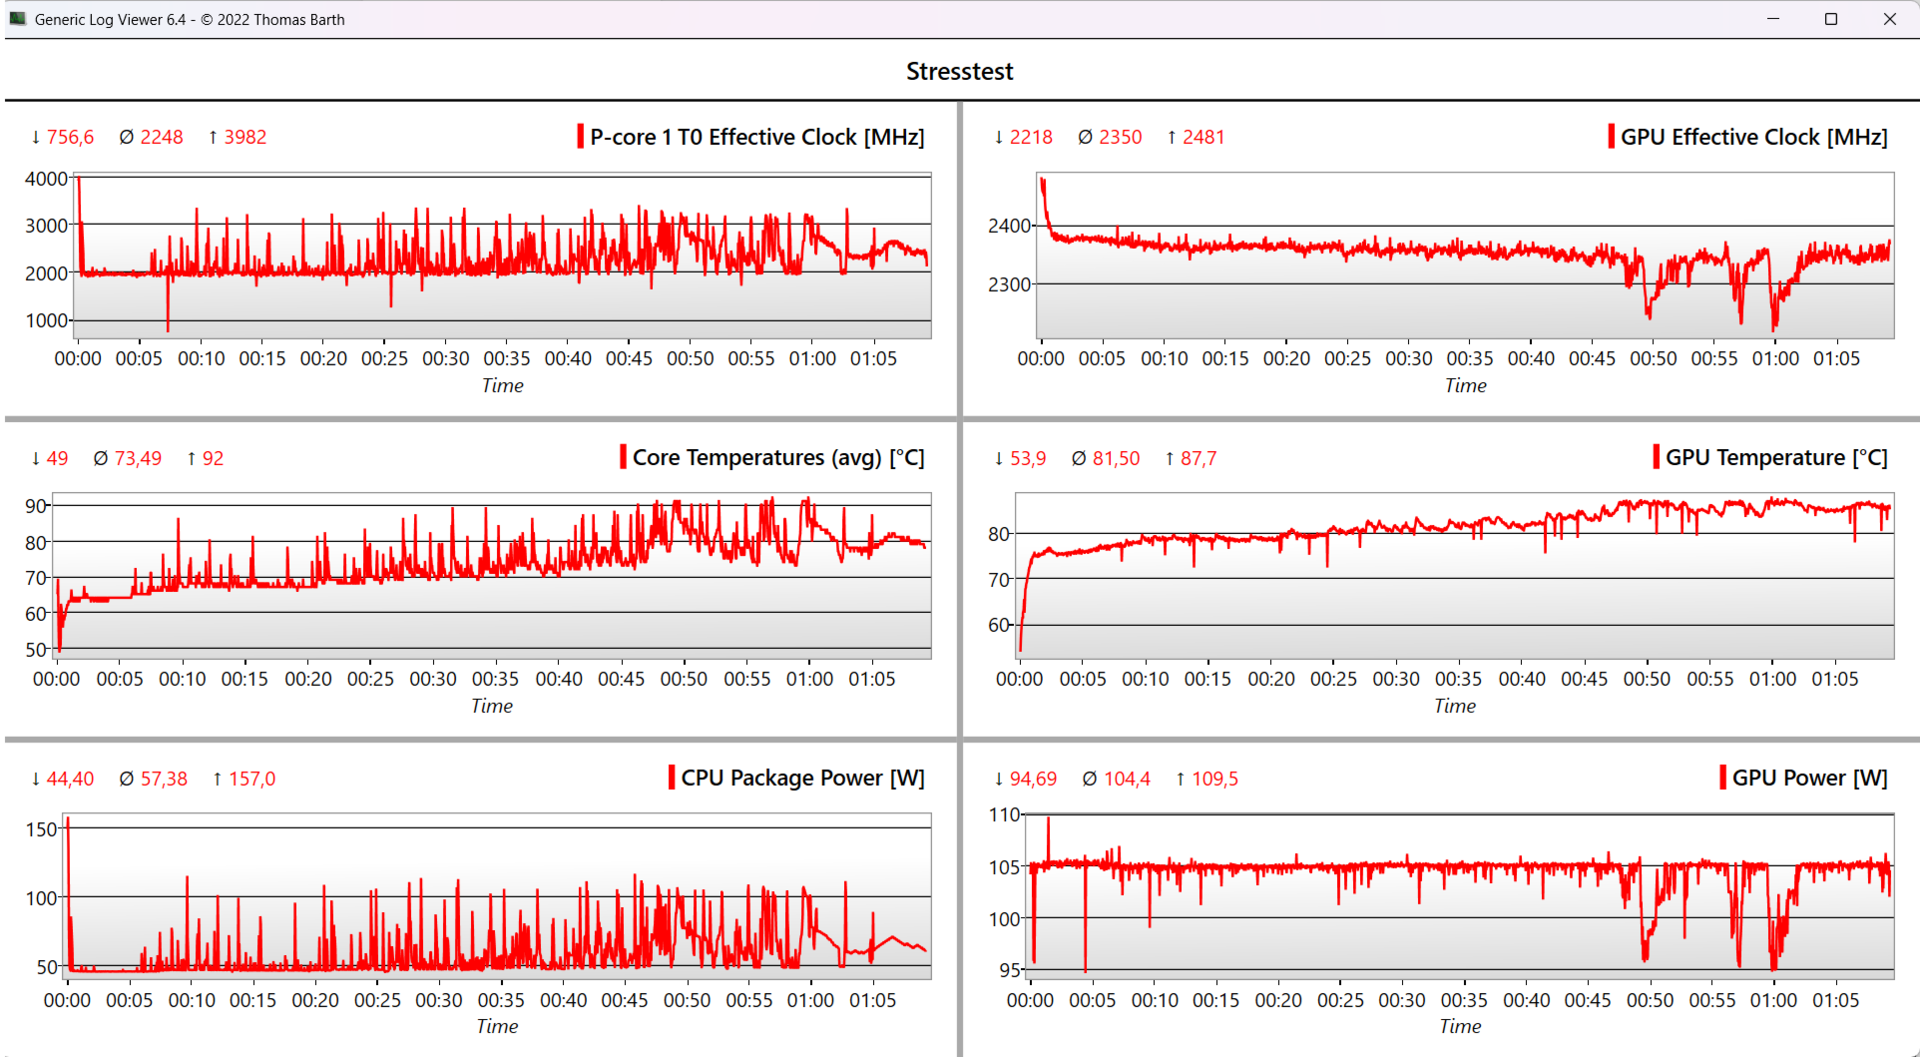
| CPU clock (GHz) | GPU clock (MHz) | Average CPU temperature (°C) | Average GPU temperature (°C) | |
| Prime95+FurMark | 2.25 | 2,350 | 74 | 82 |
Speakers
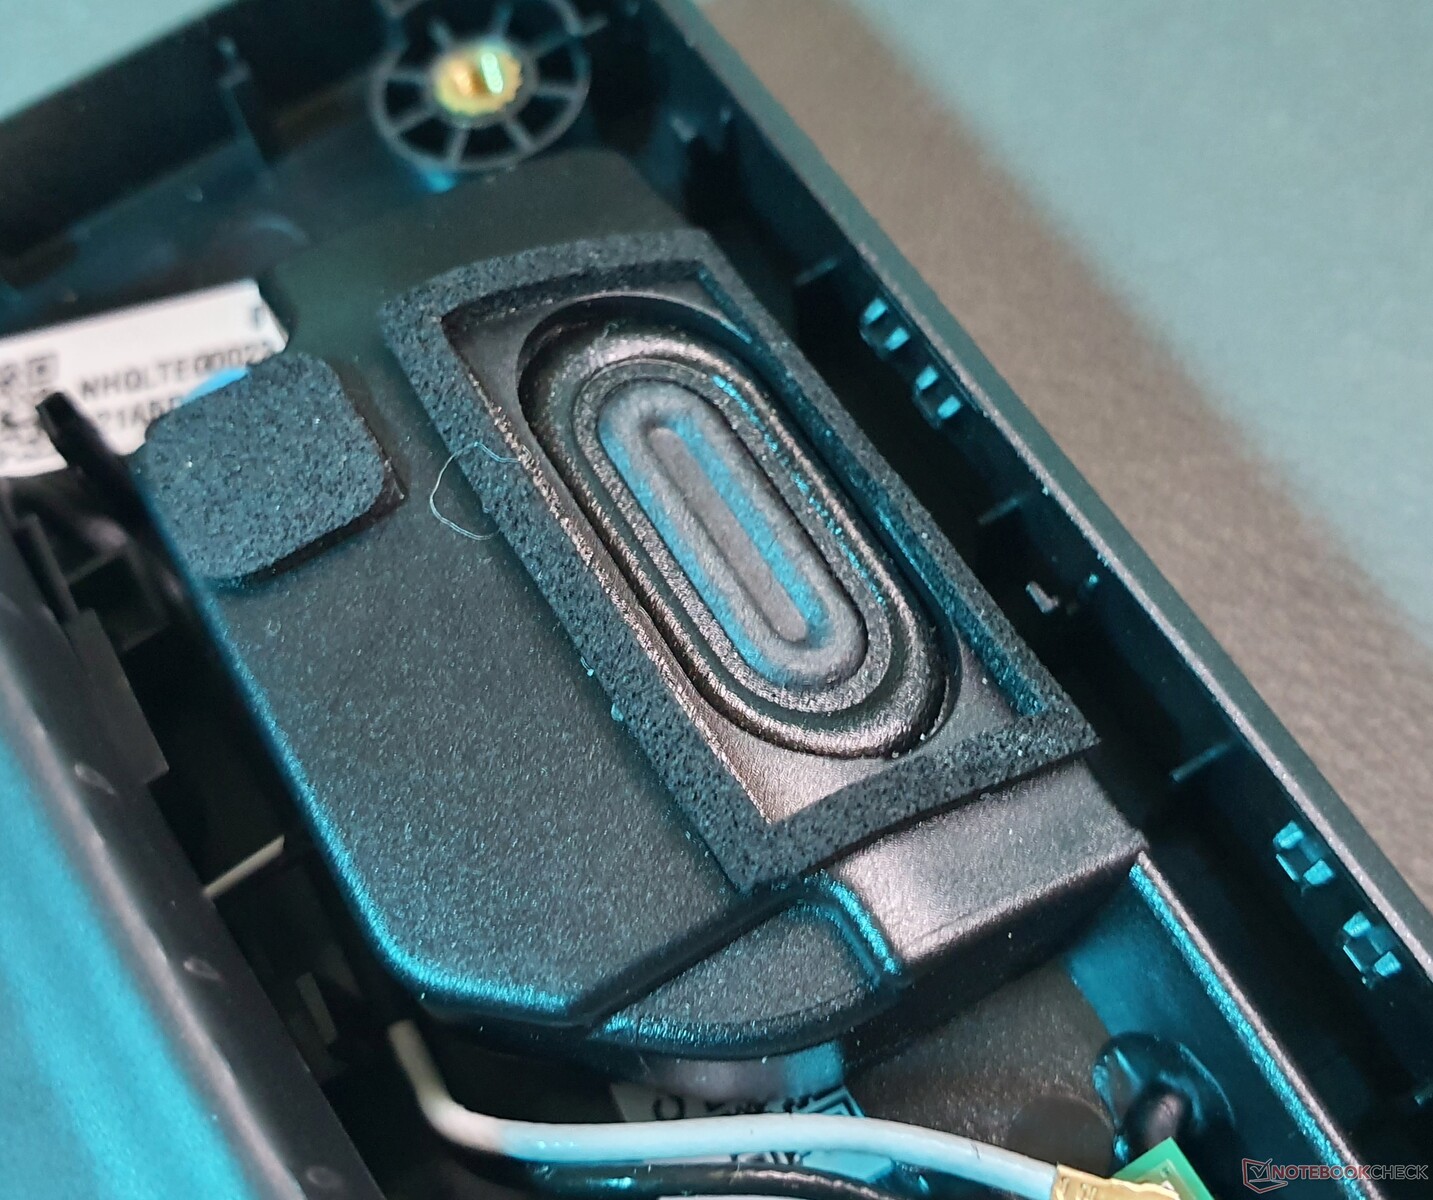
The device's downward-facing 2-watt stereo speakers produce balanced mids and highs, but the bass is almost completely absent. Their maximum volume of 78.5 dB(A) is also average. The gaming laptops in our comparison field don't deliver better sound, either.
A headset or sound system connected via the audio jack or Bluetooth is therefore recommended for an immersive sound experience.
Acer Predator Helios Neo 16 NH.QLTEG.002 audio analysis
(±) | speaker loudness is average but good (78.5 dB)
Bass 100 - 315 Hz
(-) | nearly no bass - on average 24.6% lower than median
(±) | linearity of bass is average (12.3% delta to prev. frequency)
Mids 400 - 2000 Hz
(+) | balanced mids - only 2.4% away from median
(+) | mids are linear (5.7% delta to prev. frequency)
Highs 2 - 16 kHz
(+) | balanced highs - only 1.9% away from median
(+) | highs are linear (3.3% delta to prev. frequency)
Overall 100 - 16.000 Hz
(±) | linearity of overall sound is average (17.4% difference to median)
Compared to same class
» 48% of all tested devices in this class were better, 12% similar, 40% worse
» The best had a delta of 6%, average was 18%, worst was 132%
Compared to all devices tested
» 33% of all tested devices were better, 8% similar, 59% worse
» The best had a delta of 4%, average was 24%, worst was 134%
Lenovo Legion Pro 5 16ARX8 (R5 7645HX, RTX 4050) audio analysis
(±) | speaker loudness is average but good (78.06 dB)
Bass 100 - 315 Hz
(-) | nearly no bass - on average 20.9% lower than median
(±) | linearity of bass is average (11.7% delta to prev. frequency)
Mids 400 - 2000 Hz
(±) | higher mids - on average 6.8% higher than median
(+) | mids are linear (5.7% delta to prev. frequency)
Highs 2 - 16 kHz
(+) | balanced highs - only 2.8% away from median
(±) | linearity of highs is average (7.5% delta to prev. frequency)
Overall 100 - 16.000 Hz
(±) | linearity of overall sound is average (21.5% difference to median)
Compared to same class
» 77% of all tested devices in this class were better, 5% similar, 18% worse
» The best had a delta of 6%, average was 18%, worst was 132%
Compared to all devices tested
» 61% of all tested devices were better, 7% similar, 33% worse
» The best had a delta of 4%, average was 24%, worst was 134%
Power management: The desktop-class CPU takes its toll on the gaming laptop
Power consumption
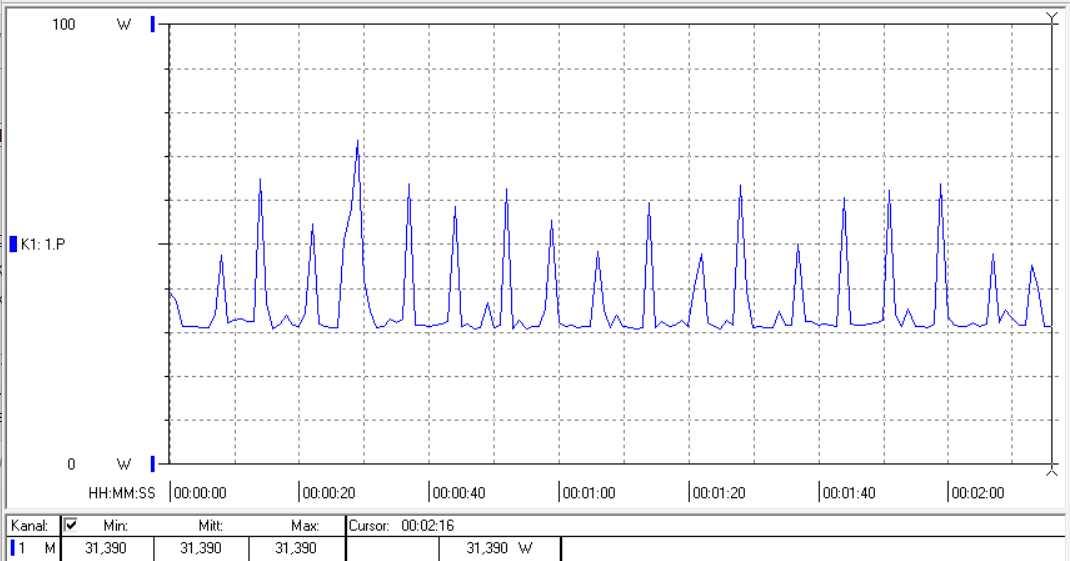

The gaming laptop's idle power consumption of 15.5 watts is not surprising given its installed desktop-class CPU. Other HX systems (55-watt TDP), whether Intel or AMD, often draw as much as 20 watts. AMD HS systems (35-watt TDP) such as the XMG Apex 15 (which only draws 10 watts in idle mode) often have a corresponding advantage.
A consumption of 145 watts while gaming is relatively low, but not when you consider that the RTX 4050 already reaches its maximum clock at ~87 watts. Only in the non-everyday stress test did it reach a peak of up to 239 watts, which the 230-watt power supply can still manage.
| Off / Standby | |
| Idle | |
| Load |
|
Key:
min: | |
| Acer Predator Helios Neo 16 NH.QLTEG.002 i5-13500HX, GeForce RTX 4050 Laptop GPU, SK hynix HFS512GEJ9X125N, IPS, 1920x1200, 16" | Lenovo Legion Pro 5 16ARX8 (R5 7645HX, RTX 4050) R5 7645HX, GeForce RTX 4050 Laptop GPU, SK hynix PC801 HFS512GEJ9X115N, IPS, 2560x1600, 16" | Lenovo LOQ 16IRH8 i7-13620H, GeForce RTX 4060 Laptop GPU, Solidigm SSDPFINW512GZL, IPS, 2560x1600, 16" | Schenker XMG Apex 15 (Late 23) R7 7840HS, GeForce RTX 4050 Laptop GPU, Samsung 990 Pro 1 TB, IPS, 2560x1440, 15.6" | HP Victus 16-r0076TX i5-13500HX, GeForce RTX 4050 Laptop GPU, SK hynix PC801 HFS512GEJ9X101N BF, IPS, 1920x1080, 16.1" | Dell G15 5530 i7-13650HX, GeForce RTX 4060 Laptop GPU, SSTC CL4-3D512-Q11, IPS, 1920x1080, 15.6" | Average NVIDIA GeForce RTX 4050 Laptop GPU | Average of class Gaming | |
|---|---|---|---|---|---|---|---|---|
| Power Consumption | 4% | -6% | 31% | -9% | 7% | 15% | -9% | |
| Idle Minimum * (Watt) | 11.95 | 13 -9% | 17.2 -44% | 6 50% | 16.12 -35% | 8.4 30% | 9.95 ? 17% | 13.3 ? -11% |
| Idle Average * (Watt) | 32 | 17.4 46% | 19.3 40% | 11 66% | 20.47 36% | 14.98 53% | 15.8 ? 51% | 19 ? 41% |
| Idle Maximum * (Watt) | 15.5 | 21.8 -41% | 21.2 -37% | 14 10% | 22.11 -43% | 15.56 -0% | 20.1 ? -30% | 24.5 ? -58% |
| Load Average * (Watt) | 97.5 | 96.4 1% | 90 8% | 65 33% | 94.8 3% | 96.8 1% | 88 ? 10% | 108.1 ? -11% |
| Witcher 3 ultra * (Watt) | 144.9 | 125 14% | 168 -16% | 136.5 6% | 166.9 -15% | 186 -28% | ||
| Load Maximum * (Watt) | 239 | 204 15% | 211 12% | 195 18% | 237 1% | 271.42 -14% | 176.3 ? 26% | 254 ? -6% |
* ... smaller is better
Power consumption Witcher 3 / stress test
Power consumption with external monitor
Runtimes
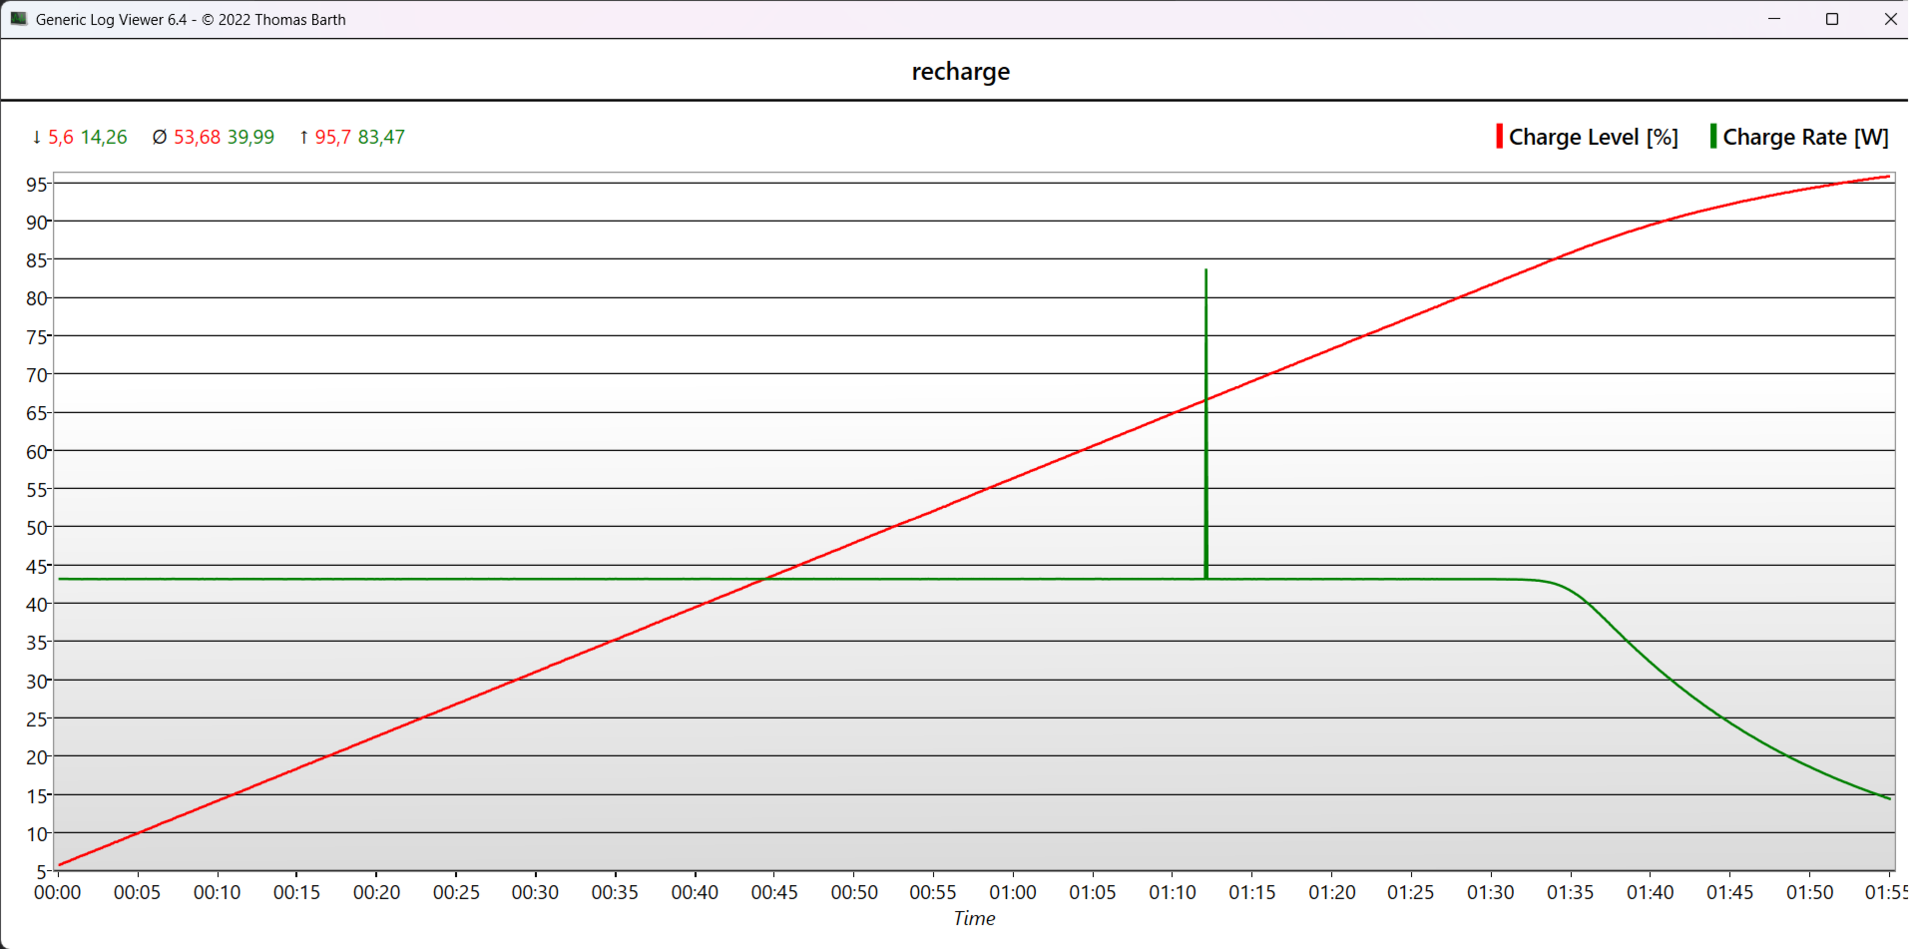
With runtimes of 4 hours and 16 minutes, the Helios Neo 16 doesn't have all too much endurance, even in the context of gaming devices. Its refresh rate is automatically set variably between 83 Hz and 120 Hz.
The HP Victus 16 (9 hours) and the AMD XMG Apex 15 system (7 hours) deliver significantly longer battery runtimes despite the latter having a smaller 63-Wh battery.
A full hour is needed to charge the battery to 50 % and a full charge takes two hours. Charging via USB-C takes even longer.
| Acer Predator Helios Neo 16 NH.QLTEG.002 i5-13500HX, GeForce RTX 4050 Laptop GPU, 90 Wh | Lenovo Legion Pro 5 16ARX8 (R5 7645HX, RTX 4050) R5 7645HX, GeForce RTX 4050 Laptop GPU, 80 Wh | Acer Predator Helios 16 PH16-71-731Q i7-13700HX, GeForce RTX 4060 Laptop GPU, 90 Wh | Lenovo LOQ 16IRH8 i7-13620H, GeForce RTX 4060 Laptop GPU, 80 Wh | Schenker XMG Apex 15 (Late 23) R7 7840HS, GeForce RTX 4050 Laptop GPU, 62.32 Wh | HP Victus 16-r0076TX i5-13500HX, GeForce RTX 4050 Laptop GPU, 83 Wh | Dell G15 5530 i7-13650HX, GeForce RTX 4060 Laptop GPU, 86 Wh | Average of class Gaming | |
|---|---|---|---|---|---|---|---|---|
| Battery runtime | 3% | -7% | 6% | 23% | 27% | -4% | 20% | |
| H.264 (h) | 7.2 | 5.4 -25% | 4.8 -33% | 6.4 -11% | 8.3 15% | 7.7 7% | 6.8 -6% | 8.26 ? 15% |
| WiFi v1.3 (h) | 4.3 | 5.6 30% | 5.6 30% | 6.3 47% | 7.1 65% | 8.9 107% | 6.5 51% | 7.01 ? 63% |
| Load (h) | 1.8 | 1.5 -17% | 1.5 -17% | 1.6 -11% | 1.2 -33% | 0.8 -56% | 1.47 ? -18% | |
| Witcher 3 ultra (h) | 0.8 | 1.5 | 1.5 | 0.8 |
Pros
Cons
Verdict: The mid-range gamer with an RTX 4050 isn't very promising

Acer's Predator Helios Neo 16 is a chimera consisting of a solid mid-range gaming laptop and quite a few entry-level features. In particular, the latter includes the RTX 4050 installed into our test device — but its Full HD panel, which may deliver decent values, is pretty standard. The same can be said for its keyboard, which can also be found in many other budget gaming laptops.
Acer has paired all of this with a powerful desktop-class Intel Core i5-13500HX processor including a liquid metal cooling solution, a sleek and robust, well-built case, as well as lots of connectivity options, which include true HDMI 2.1 connecting to the dGPU and two Thunderbolt 4 ports. Completing the setup are Advanced Optimus and G-Sync.
Unfortunately, we aren't entirely sure whether this combination (in connection with its MRSP of US$1,069) can find its target market. It would rather require an RTX 4060 or an RTX 4070 to make it worth it, which can often only be found within the Neo 16 for a surcharge. Also in contrast to the regular Helios 16, this model doesn't have the option to go for an i9-13900HX, a QHD panel with 100 % sRGB coverage, or a Mini LED option. Its 720p webcam is additionally a big difference and, in view of the laptop's price, is a real reason for critique. Its short runtimes of 4 1/2 hours also aren't the best.
The Acer Predator Helios Neo 16 is a slimmed-down version of the solid Helios 16. In theory, this is a good idea, but it would only work if the price difference between the two wasn't as small.
Its powerful cooling system has been adopted almost 1:1 from the Helios 16, which results in low internal temperatures and low noise emissions (at the latest when using balanced mode) — and not at the cost of any performance. On the flip side, its large GPU and CPU power restrictions in battery mode are a little over-the-top.
We find it totally bizarre that you can get the regular Helios 16 with the same configuration but with more features for the same price. Alternatively, it might be worth taking a look at the Legion Pro 5 16 (Intel), which costs a little more but benefits from a 240 Hz QHD panel, a more powerful RTX 4060, a comfortable keyboard, as well as quieter cooling when playing games. On the other hand, if you are looking for a true budget gamer then you might be better off taking a look at the Lenovo LOQ 16, which features a frugal AMD Ryzen 9 7940HS, a QHD panel and an RTX 4050 (US$1,200) or an RTX 4060 (US$1,400).
Price and availability
The version of the Acer Predator Helios 16 we tested, with an Intel Core i5-13500HX, RTX 4050 and a FHD+ display, can be found on Amazon for US$1,069.
Acer Predator Helios Neo 16 NH.QLTEG.002
- 11/02/2023 v7 (old)
Marvin Gollor
Transparency
The selection of devices to be reviewed is made by our editorial team. The test sample was provided to the author as a loan by the manufacturer or retailer for the purpose of this review. The lender had no influence on this review, nor did the manufacturer receive a copy of this review before publication. There was no obligation to publish this review. As an independent media company, Notebookcheck is not subjected to the authority of manufacturers, retailers or publishers.
This is how Notebookcheck is testing
Every year, Notebookcheck independently reviews hundreds of laptops and smartphones using standardized procedures to ensure that all results are comparable. We have continuously developed our test methods for around 20 years and set industry standards in the process. In our test labs, high-quality measuring equipment is utilized by experienced technicians and editors. These tests involve a multi-stage validation process. Our complex rating system is based on hundreds of well-founded measurements and benchmarks, which maintains objectivity. Further information on our test methods can be found here.
Price comparison

