Dell Inspiron 15 7570 (i7-8550U, 940MX) Laptop Review
For the original German review, see here.
At this point, there are numerous models from the Dell Inspiron 15 series: gaming notebooks with various Nvidia or AMD graphics cards, business models without a dedicated graphics card or with a smaller version, many different designs, etc. All are called "Inspiron 15," which can become confusing to the customer.
They are differentiated by the long number that follows the designation. Today we are testing the device with the long name "Dell Inspiron 15 7000 (7570-9726)." This is a business or all-round device with the new Kaby Lake processor and the GTX 940MX by Nvidia. (A similar model starts from $780 in the US.)
We are evaluating the new Inspiron, comparing it against the Asus VivoBook S15 S510UQ, the Acer TravelMate P658-G2, the Lenovo IdeaPad 510-15IKB, and the Huawei MateBook D. While all these models are also equipped with a GTX 940MX, their processors are different, even if they are always Kaby Lake CPUs. As the fifth comparison device, we have selected the Inspiron 15 5000 5567-1753 also from Dell. Even though it has an AMD GPU, its performance is at about the same level as that of the 940MX.
Case
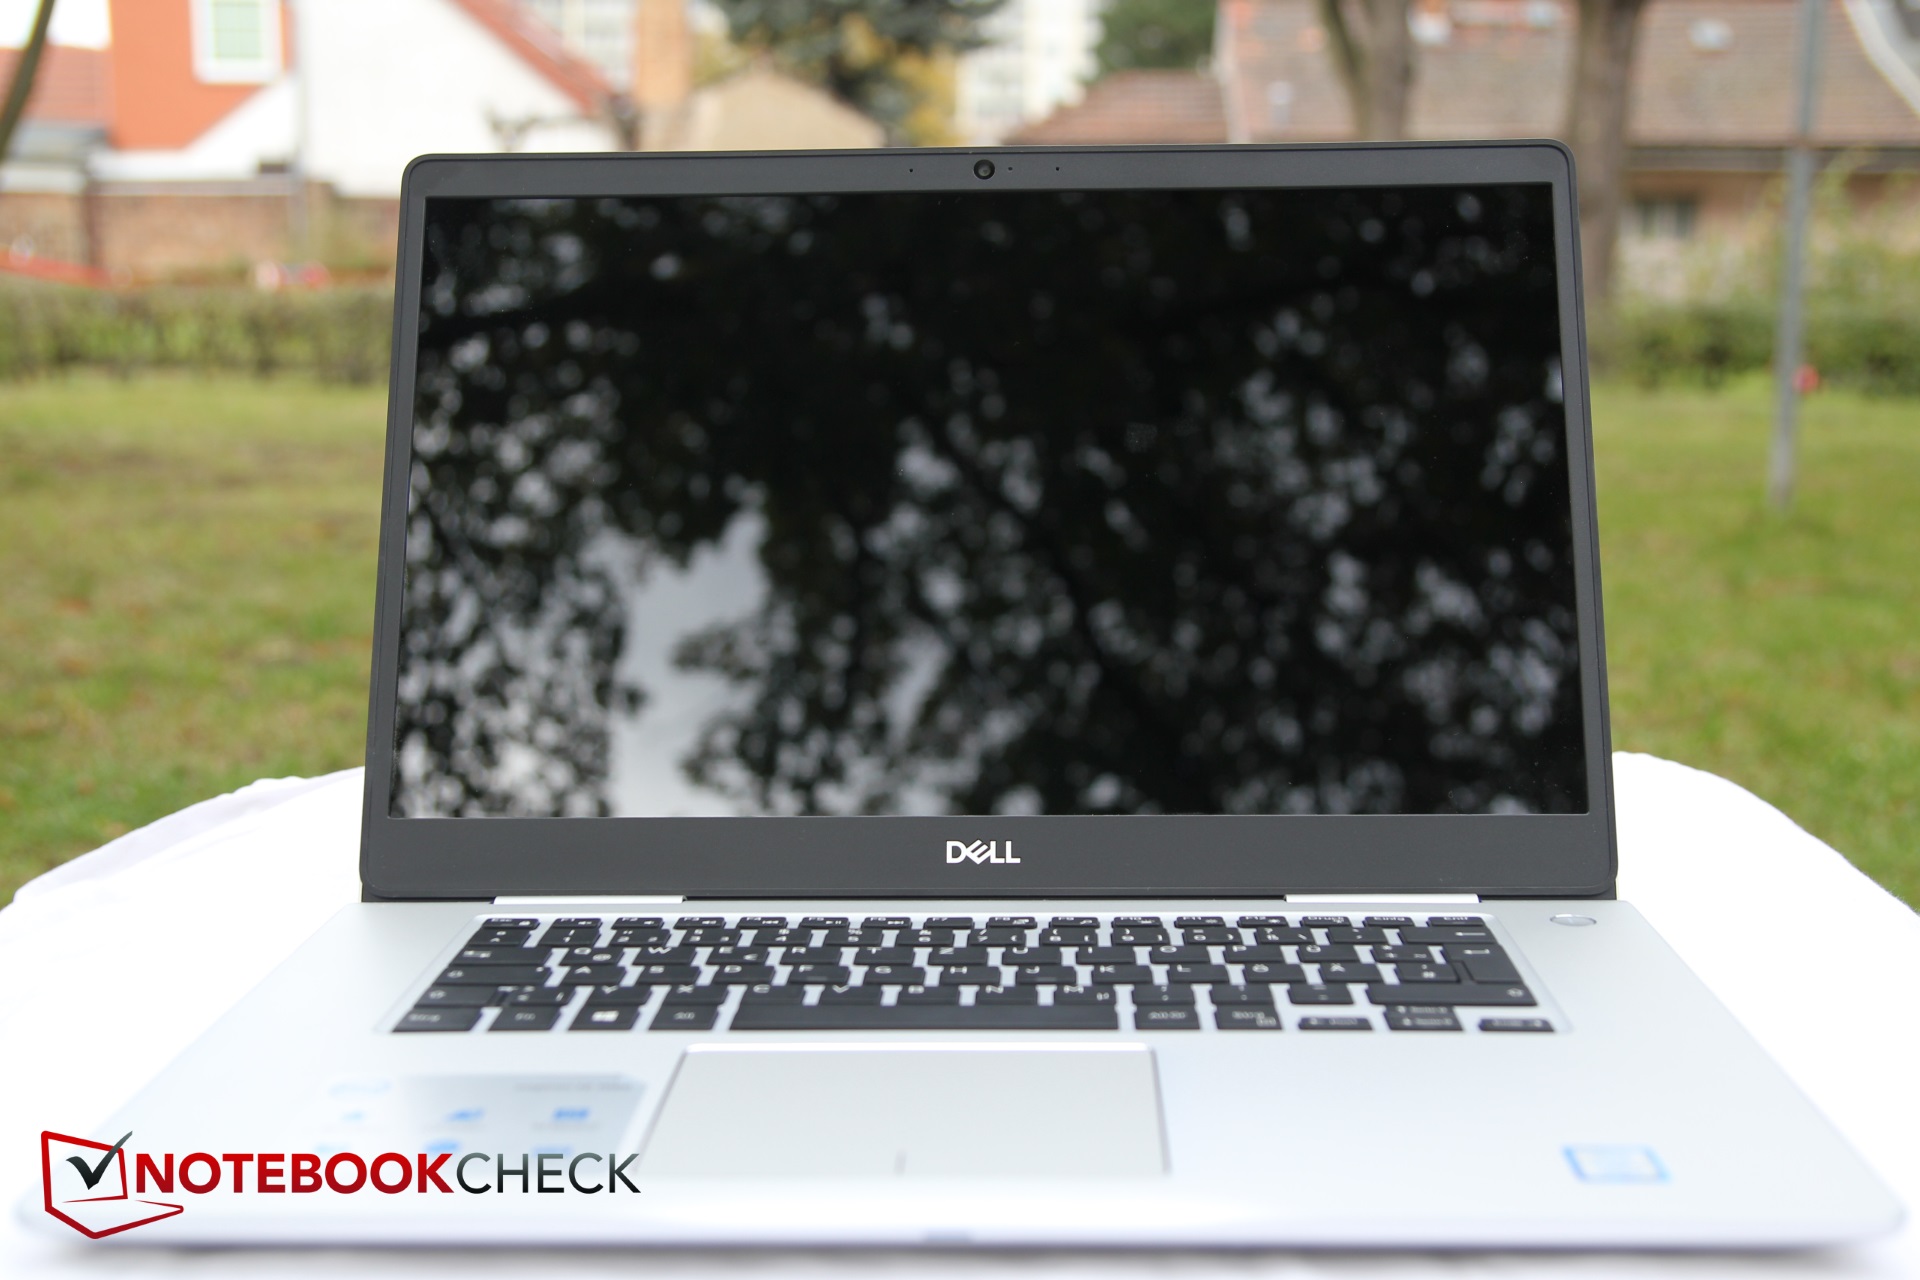
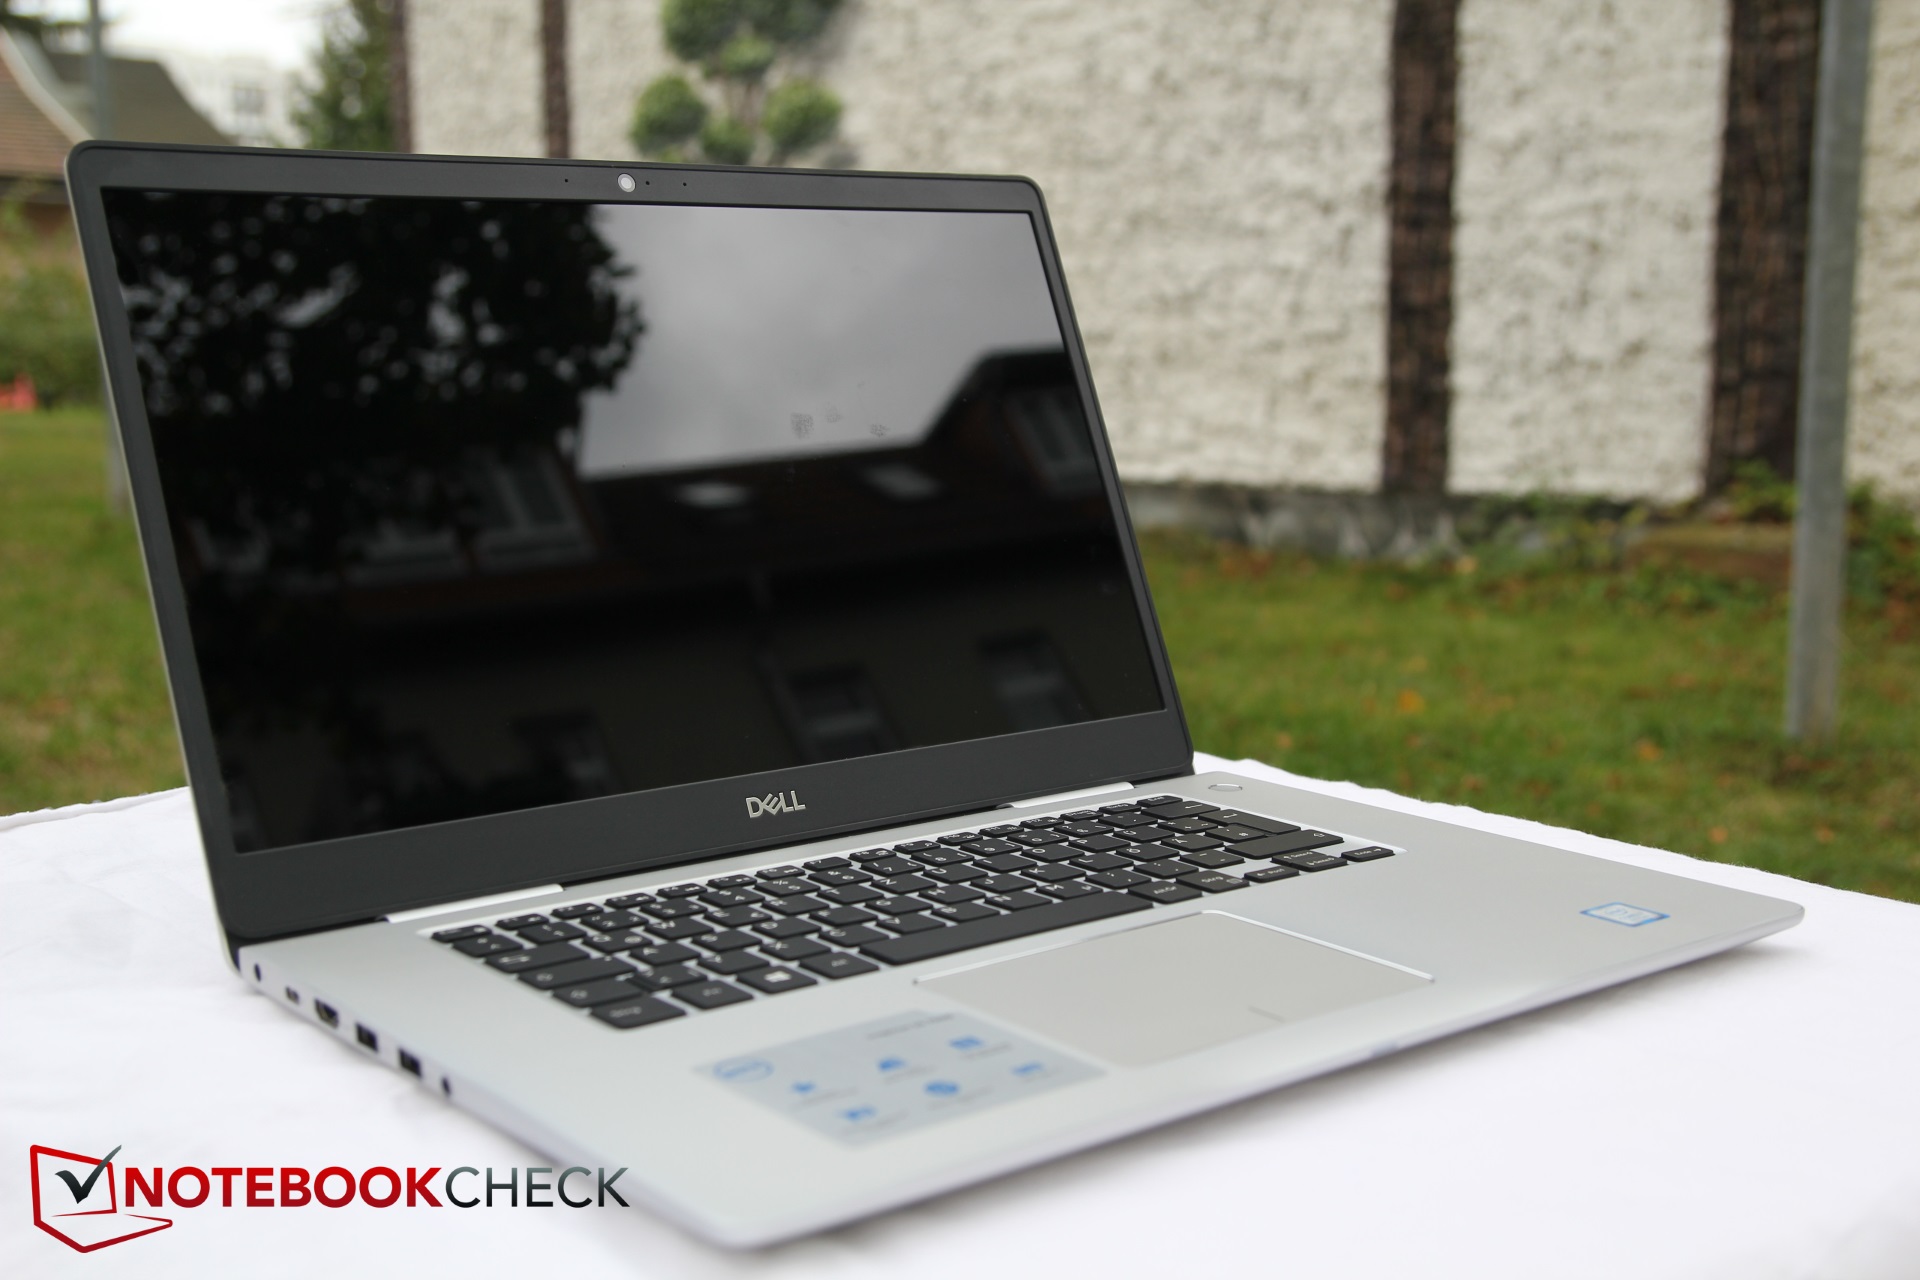
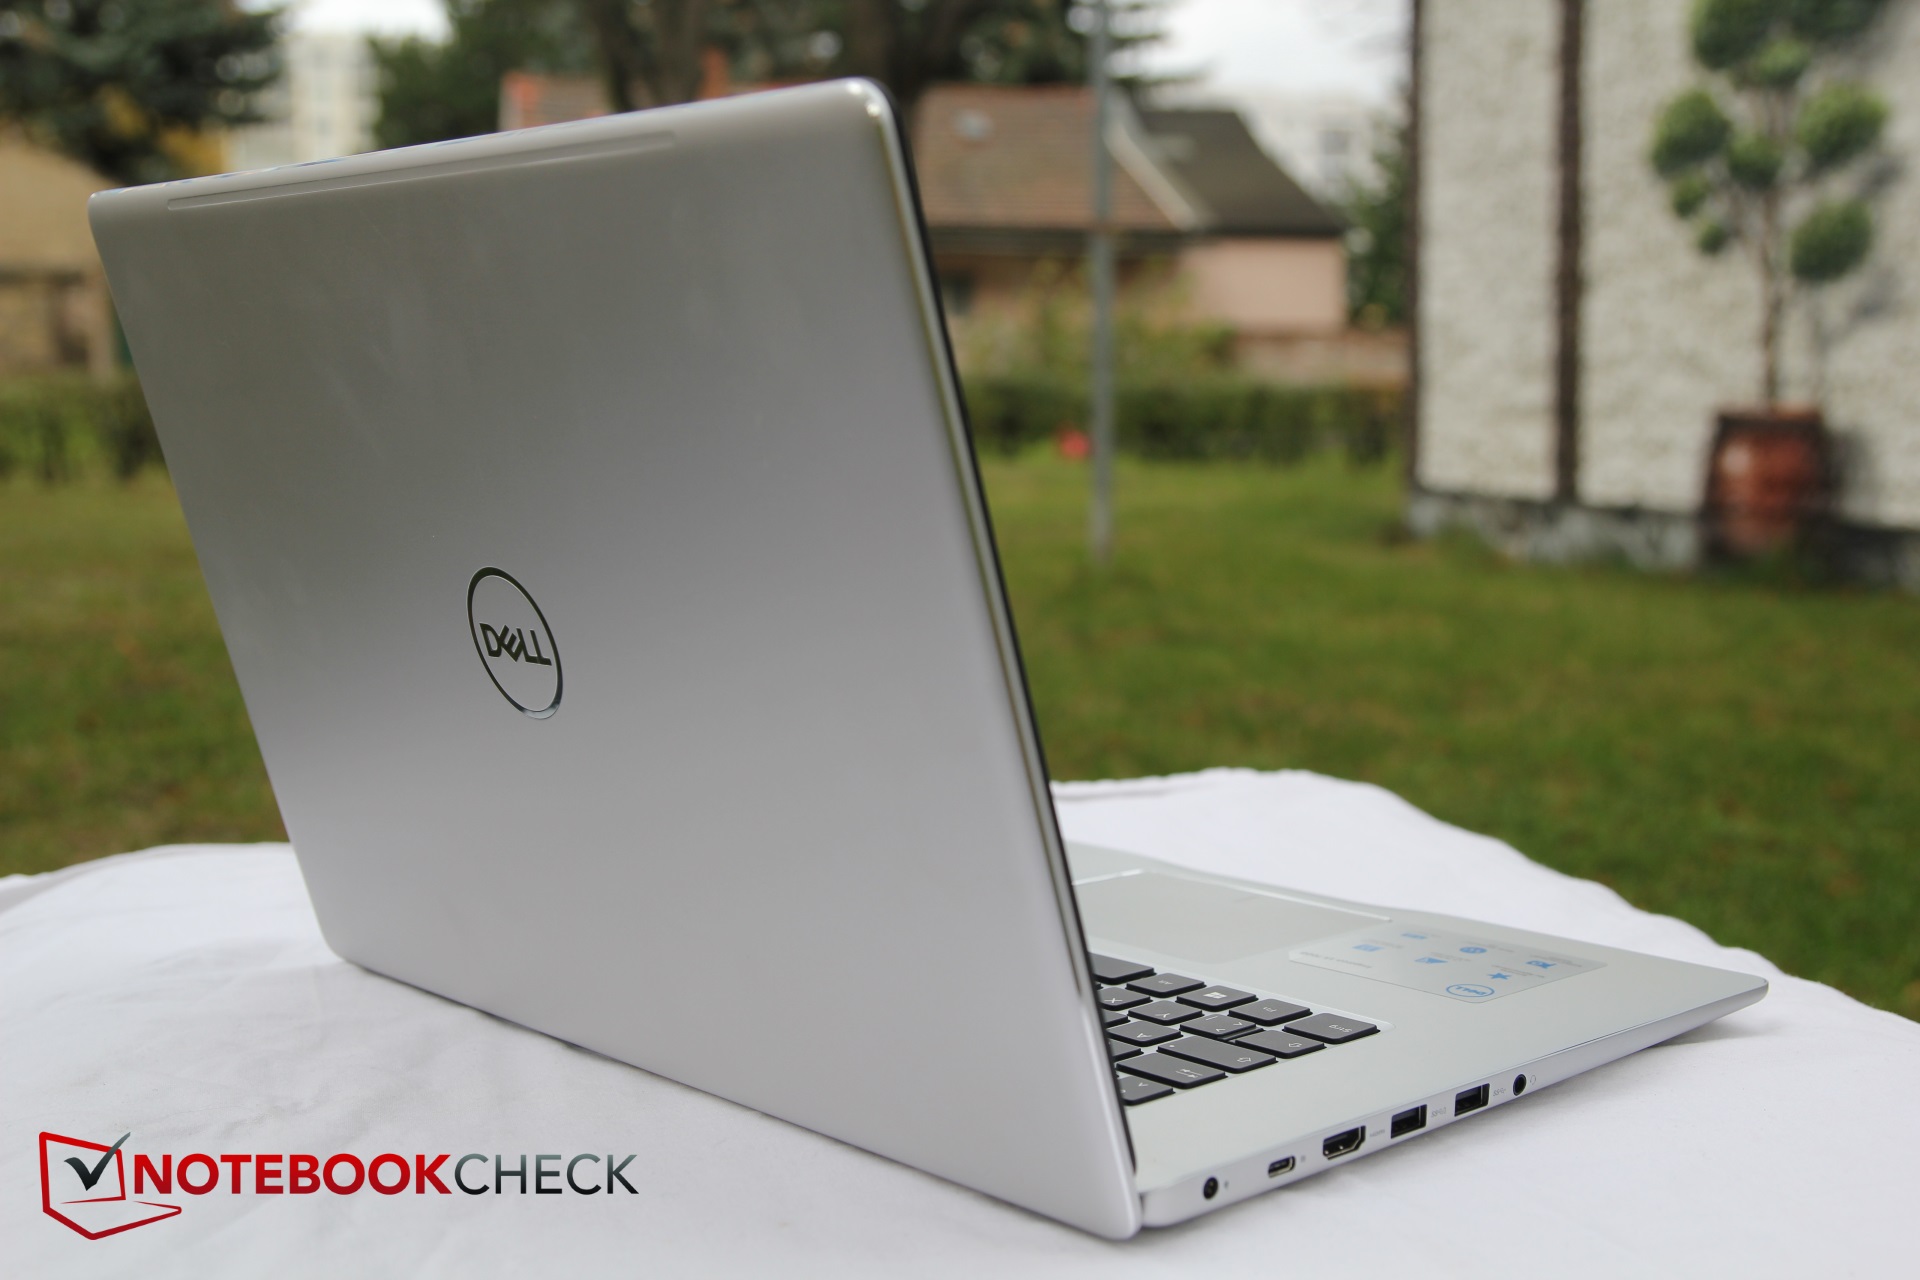
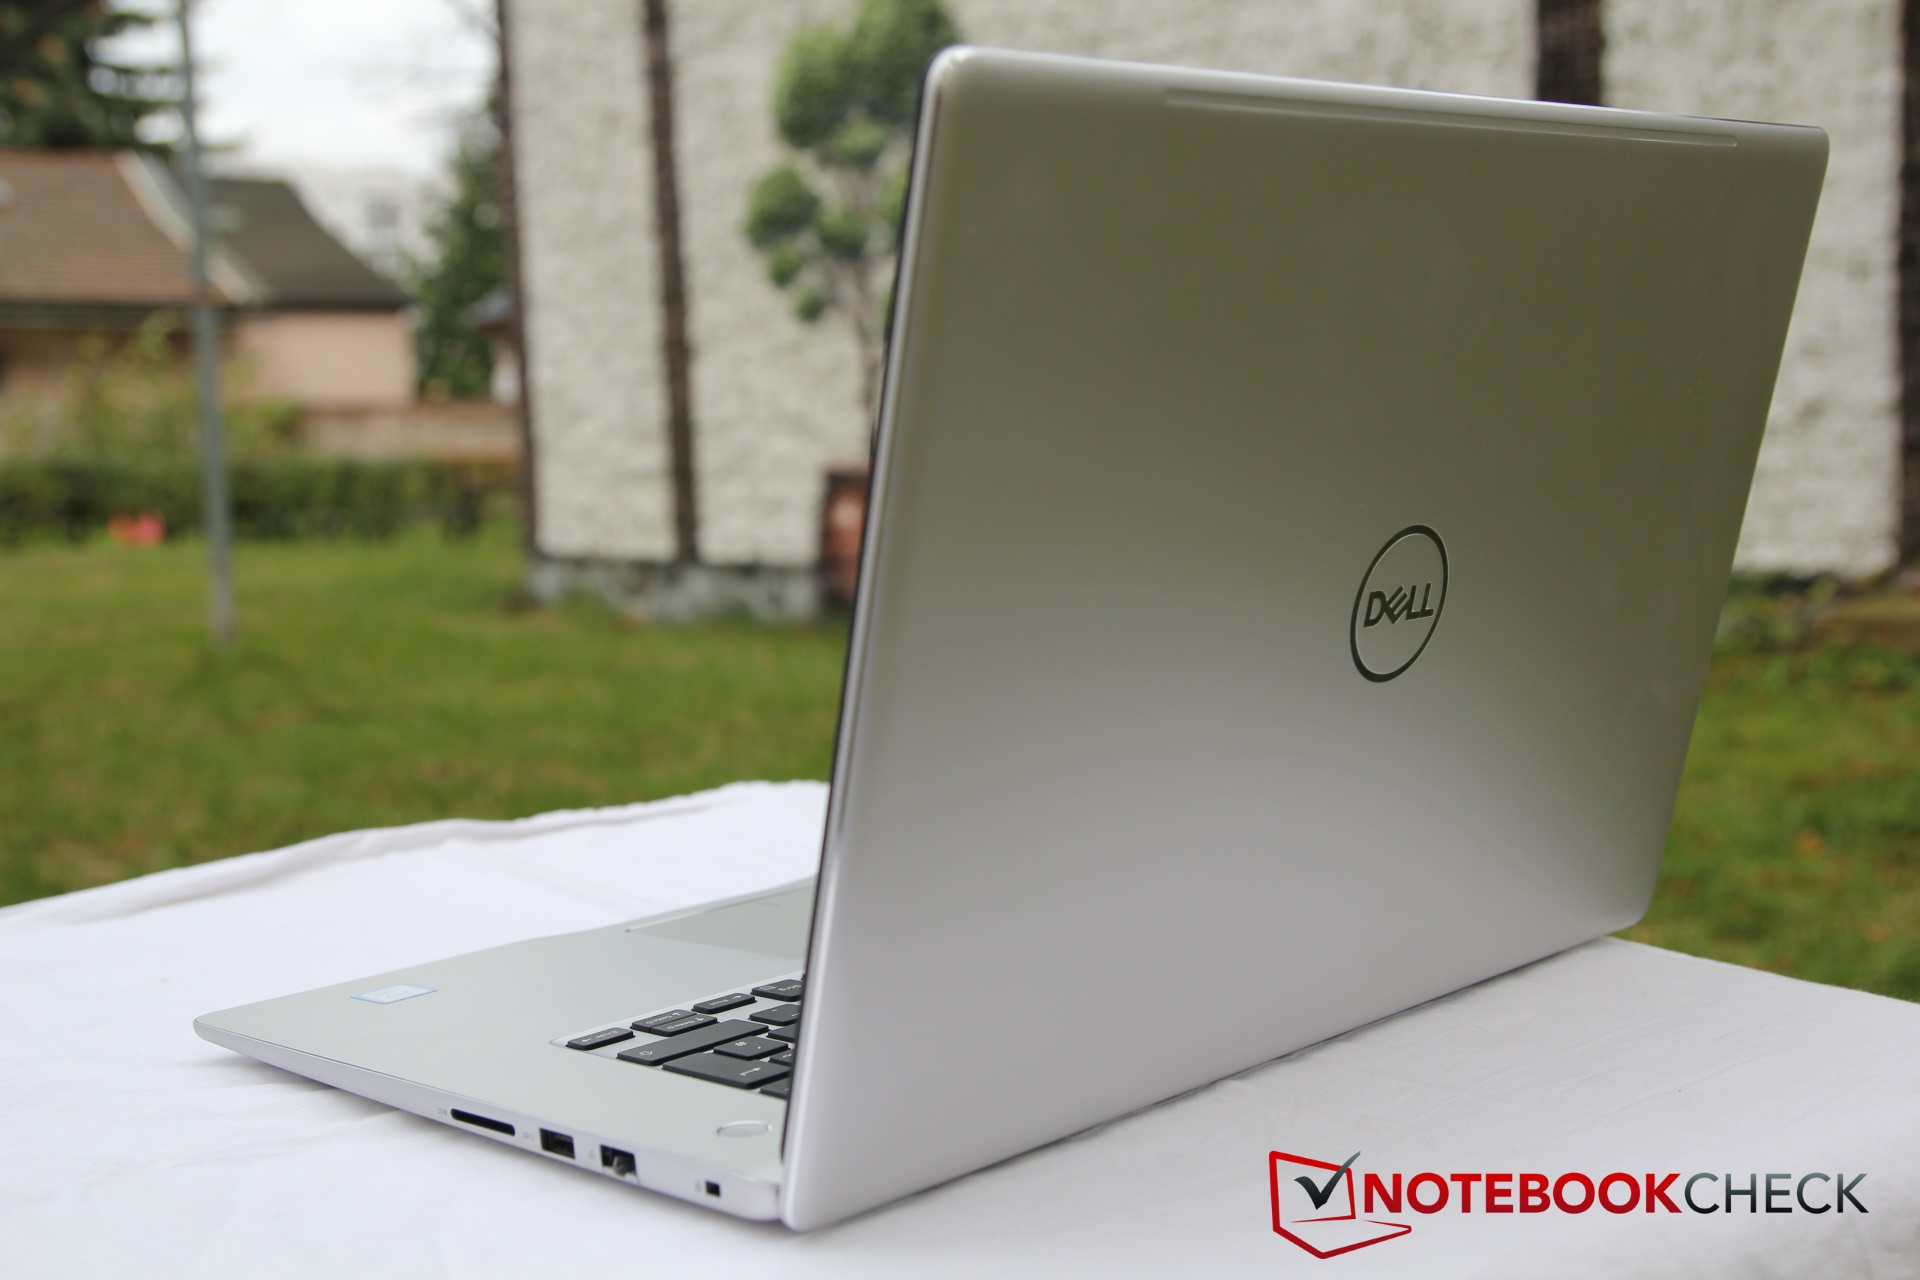
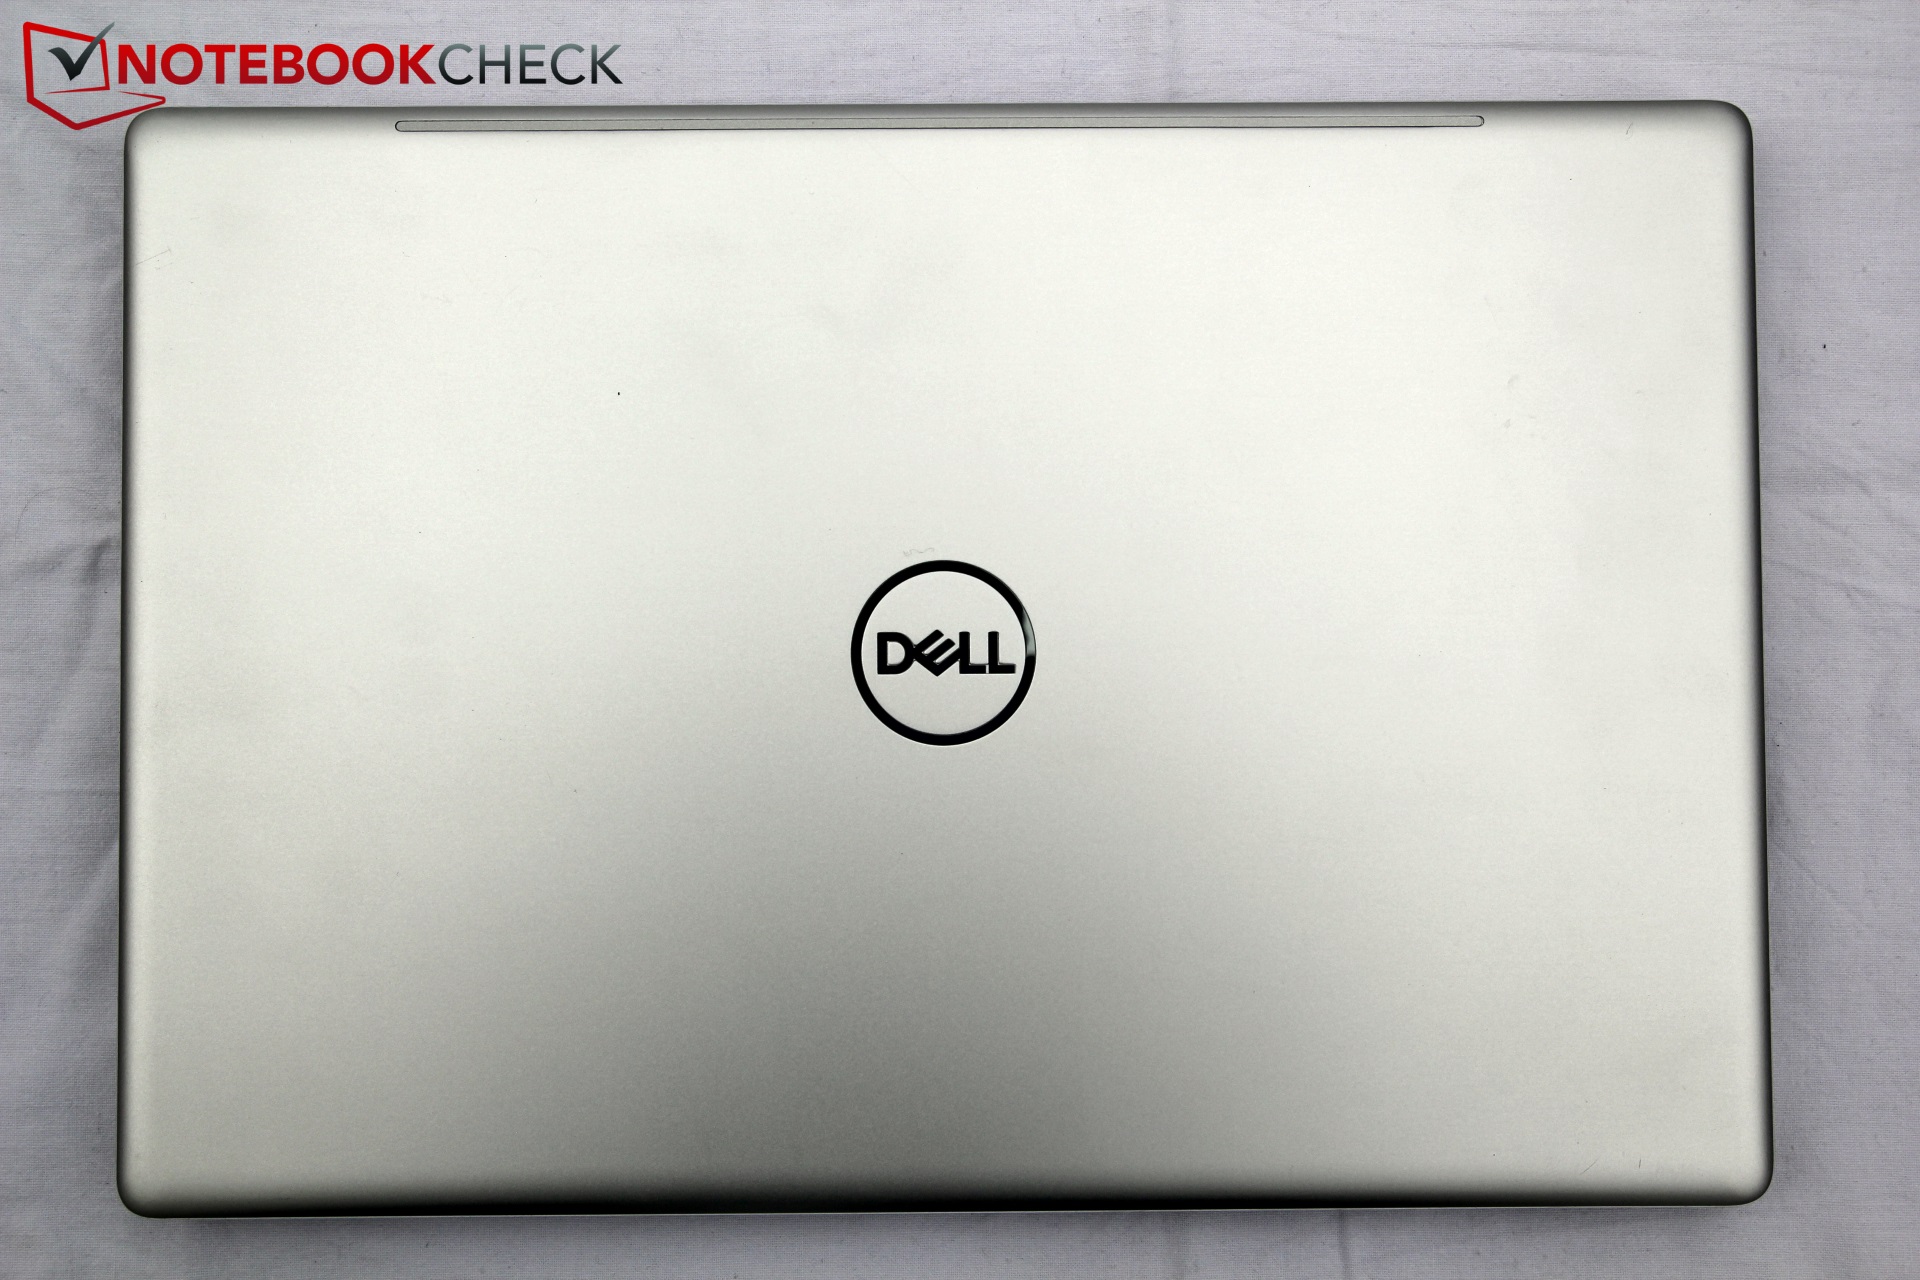
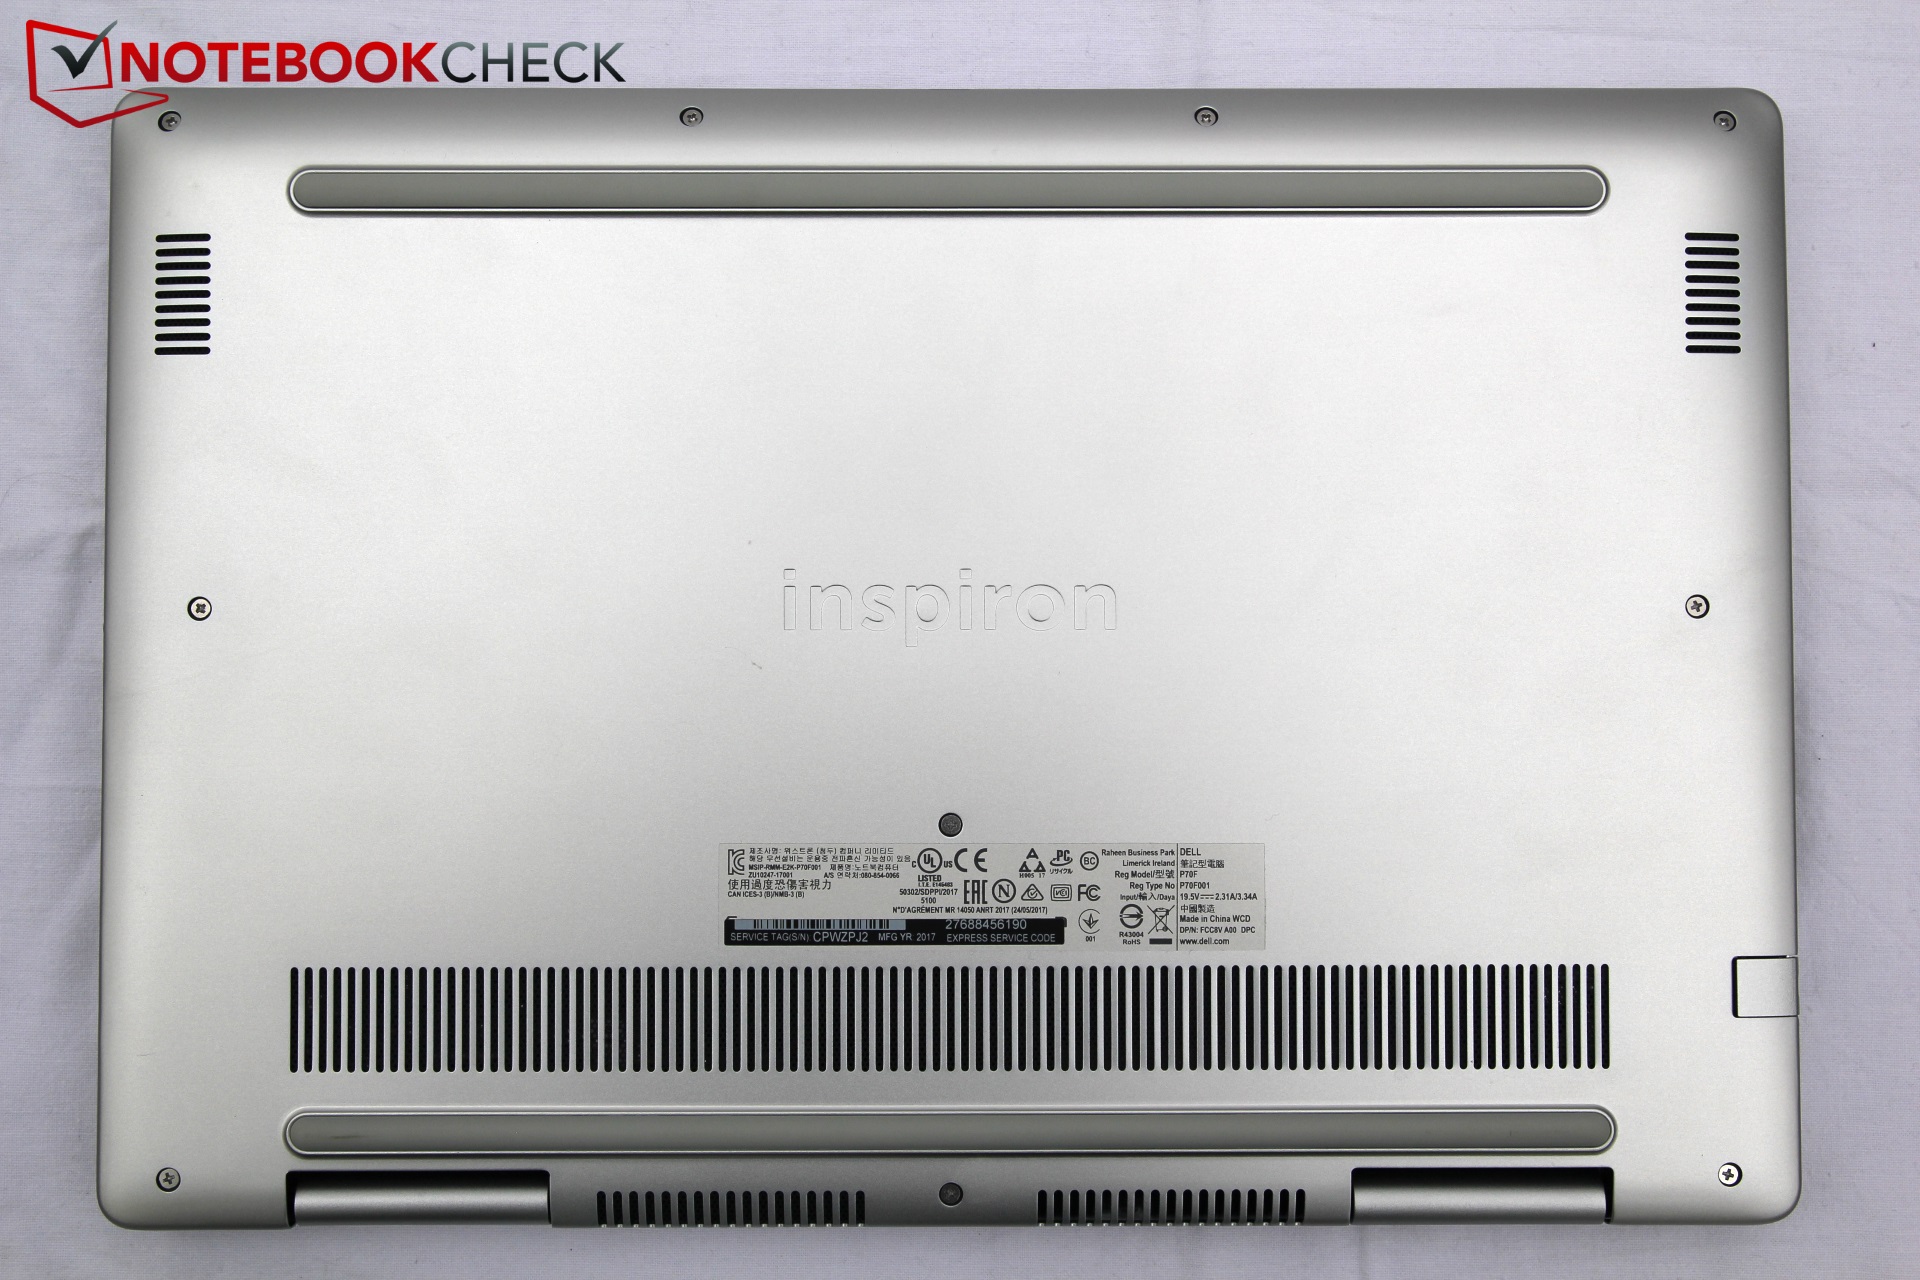
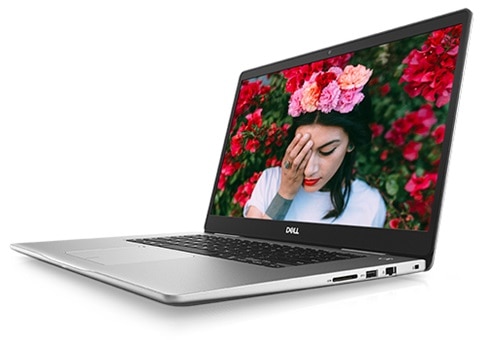
According to the manufacturer, the case is made of aluminum with "glass-bead brilliance." Whether there are glass beads or not, the silver aluminum case provides good stability and a high-quality appearance to the new Inspiron. The design is kept nicely modest, only the reflective "Dell" logo stands out in the center of the top.
The bottom with the keyboard base is comfortably sturdy, and there are no creaks when pressing down on it. The same goes for the lid, although naturally it is not quite as robust. Because of the aluminum, it appears more resistant than some of the plastic competitors. The lid cannot be opened with one hand, due to the relatively light base and the stability of the hinges, which hold the display in position well.
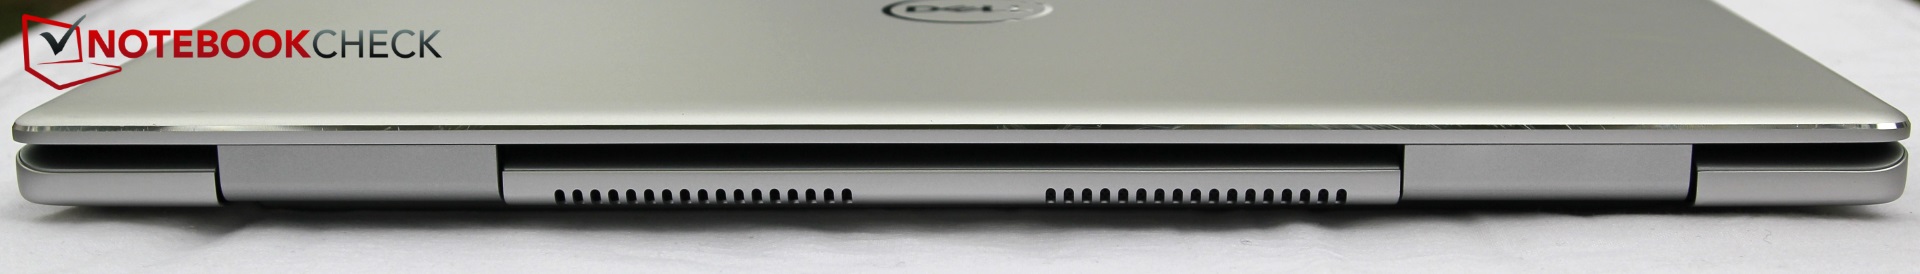
The openings for the speakers are at the bottom in the front, and the fan vents are further back. The battery is built-in, and there is no maintenance hatch.
The gaps between the top holding the keyboard and the bottom edge are not always completely even. In some places, the gaps turn out slightly larger. However, the workmanship in our test unit leaves a good impression overall.
Behind the Huawei, our test unit is the smallest model, and the Asus has about the same size. These two competitors are also even slightly slimmer than the Dell. The Asus is also the lightest device, followed by the Huawei. Overall, the Inspiron achieves a good third place in terms of its size and weight.
Connections
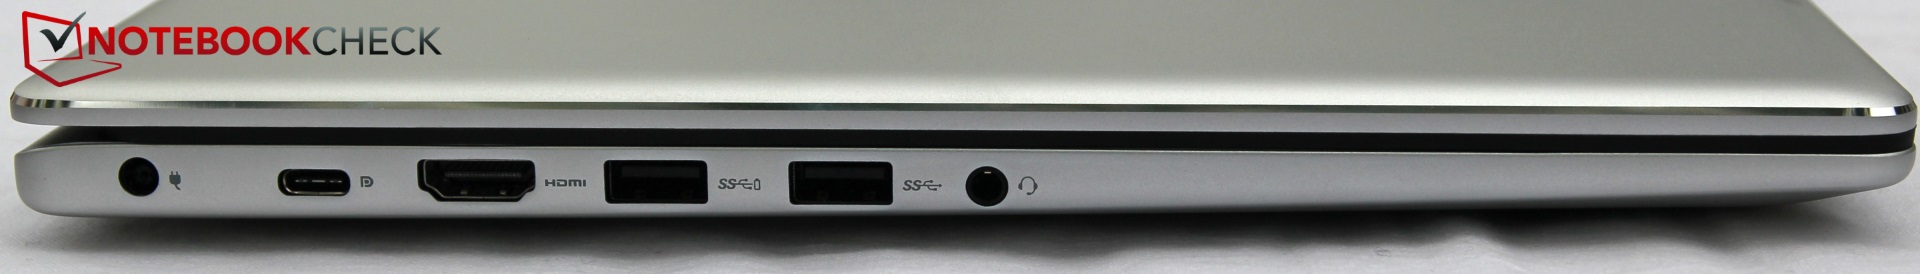
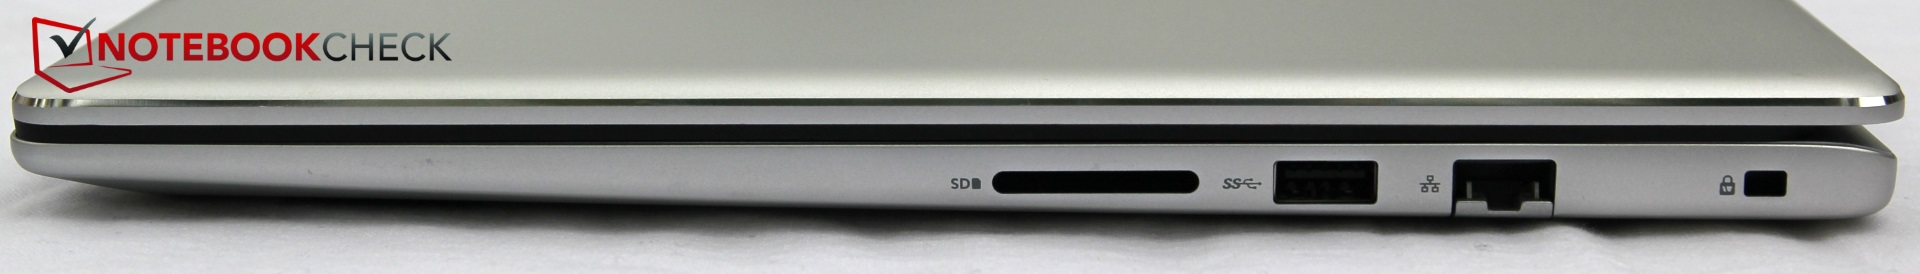
The Inspiron offers all the usual connections. USB 2.0 is history, but unfortunately we are missing Thunderbolt 3. Instead, one of the USB-A ports offers support for PowerShare and the USB-C port supports DisplayPort. All the connections are on the sides of the notebook, most of them on the left. This is good for right-handed users, but not so good for left-handed ones. The distances between the ports are okay, but could have been even larger on the left side, since there is still plenty of space towards the front.
SD-Card Reader
We are testing the transfer speeds of the card reader with our Toshiba Exceria Pro SDXC 64 GB UHS-II reference storage card. Unfortunately, the standard device does not strike such a good figure. In the JPG-file copy test, only the sibling model does worse, and in the sequential read test, the Lenovo also joins this slow group. For comparison, the Acer, which ranked highest in both SD tests, performed 150 to 230% better than the Inspiron!
| SD Card Reader | |
| average JPG Copy Test (av. of 3 runs) | |
| Acer TravelMate P658-G2-MG-7327 (Toshiba Exceria Pro SDXC 64 GB UHS-II) | |
| Lenovo IdeaPad 510-15IKB 80SV0087GE (Toshiba Exceria Pro SDXC 64 GB UHS-II) | |
| Asus Vivobook S15 S510UQ-BQ189T (Toshiba Exceria Pro SDXC 64 GB UHS-II) | |
| Dell Inspiron 15 7570 (Toshiba Exceria Pro SDXC 64 GB UHS-II) | |
| Dell Inspiron 15 5000 5567-1753 (Toshiba Exceria Pro SDXC 64 GB UHS-II) | |
| maximum AS SSD Seq Read Test (1GB) | |
| Acer TravelMate P658-G2-MG-7327 (Toshiba Exceria Pro SDXC 64 GB UHS-II) | |
| Asus Vivobook S15 S510UQ-BQ189T (Toshiba Exceria Pro SDXC 64 GB UHS-II) | |
| Dell Inspiron 15 7570 (Toshiba Exceria Pro SDXC 64 GB UHS-II) | |
| Dell Inspiron 15 5000 5567-1753 (Toshiba Exceria Pro SDXC 64 GB UHS-II) | |
| Lenovo IdeaPad 510-15IKB 80SV0087GE (Toshiba Exceria Pro SDXC 64 GB UHS-II) | |
Communication
Security
Apart from a Kensington security lock, we did not see any other security features.
Accessories
The manufacturer is stingy in terms of accessories, and apart from a quick-start manual and a warranty card, there is nothing else in the box of the Inspiron 15. However, Dell offers a range of external accessories, such as bags, docking stations, additional batteries, optical drives, and more. None of these accessories are exclusive to this model, so we are not including them in our testing. Dell's website offers further information.
Maintenance
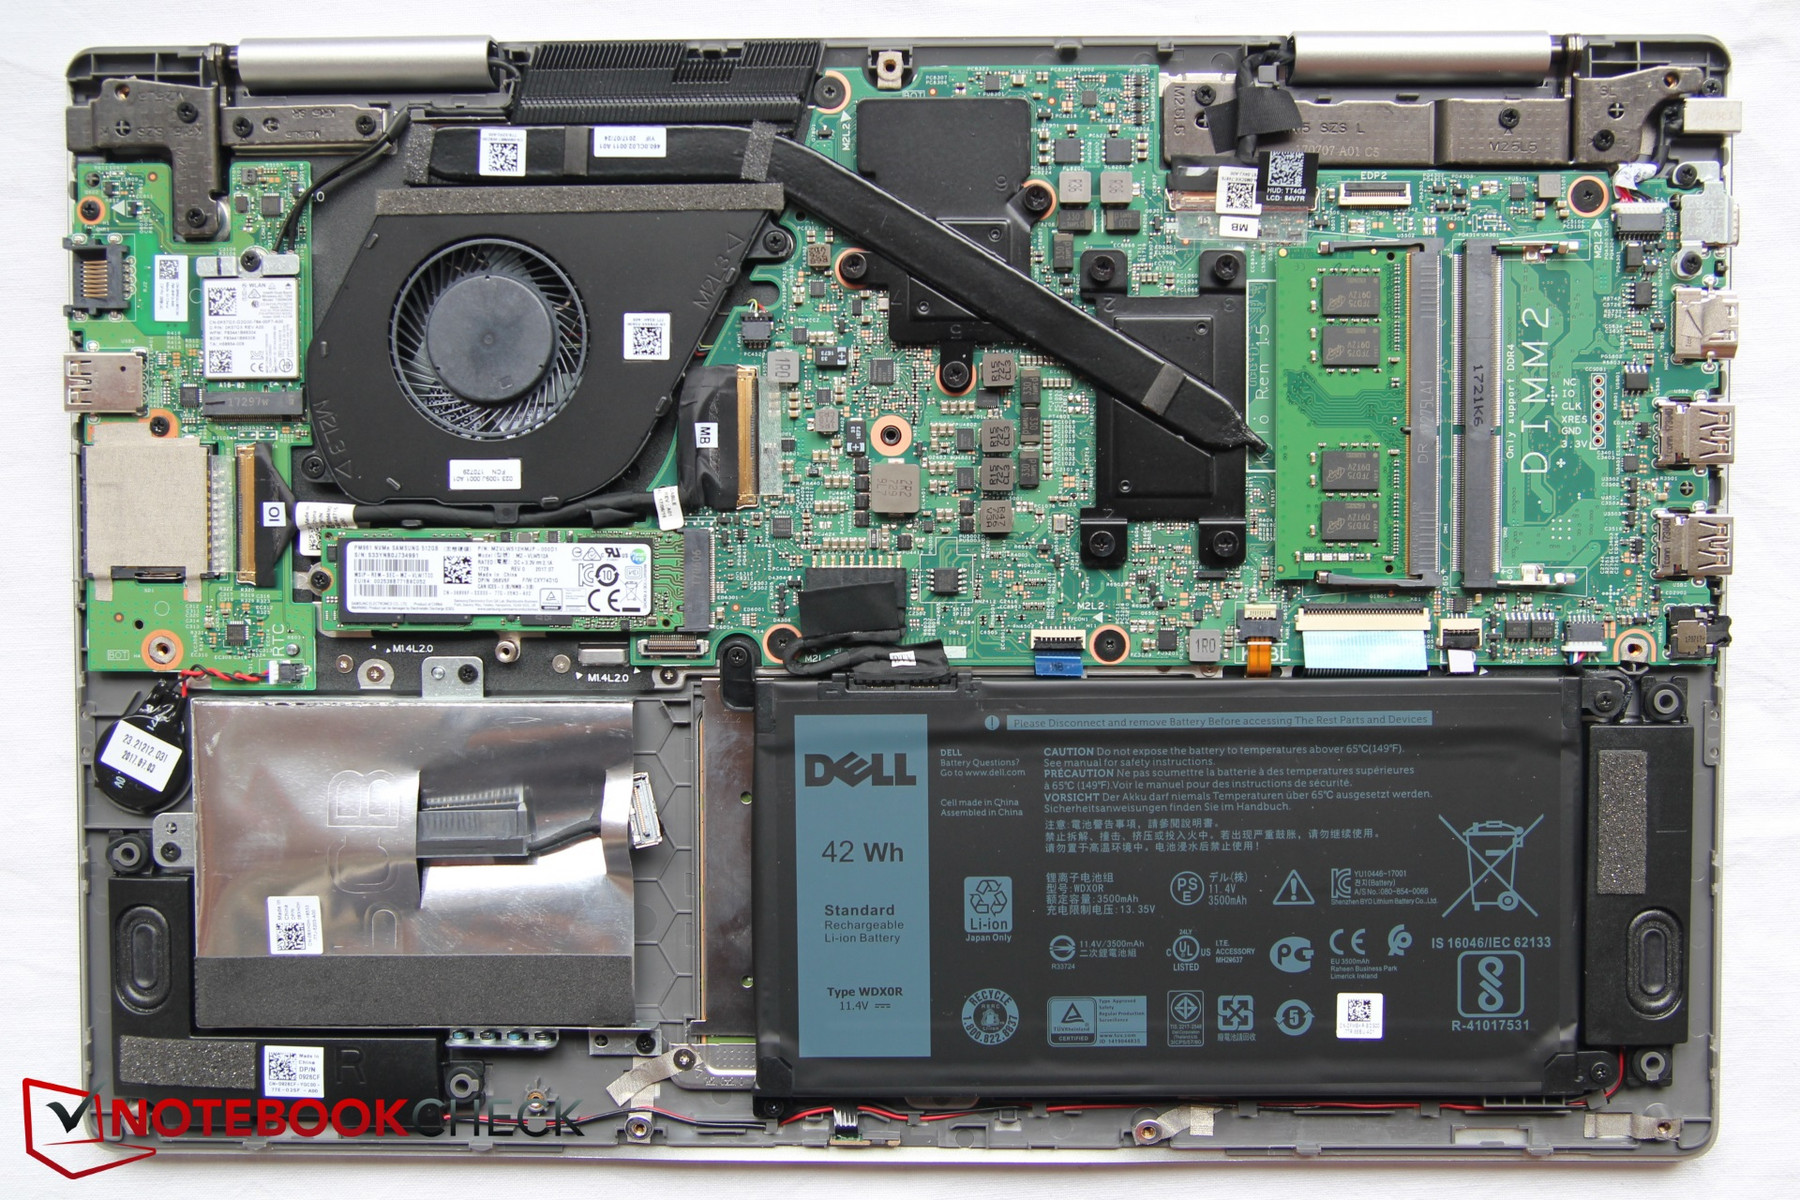
The Inspiron does not have a maintenance hatch, but you can remove the entire base plate. In order to do this, you have to first remove 10 visible screws. Afterwards, it is not that easy to find a point of leverage to remove the bottom. The best place is at the back, in the center between the two hinges. After loosening and taking off the bottom, you get access to the RAM slots, the battery, the SSD, and the empty SATA slot, as well as the fan.
Warranty
The manufacturer offers a two-year warranty. Please see our Guarantees, Return Policies & Warranties FAQ for country-specific information.
Input Devices
Keyboard
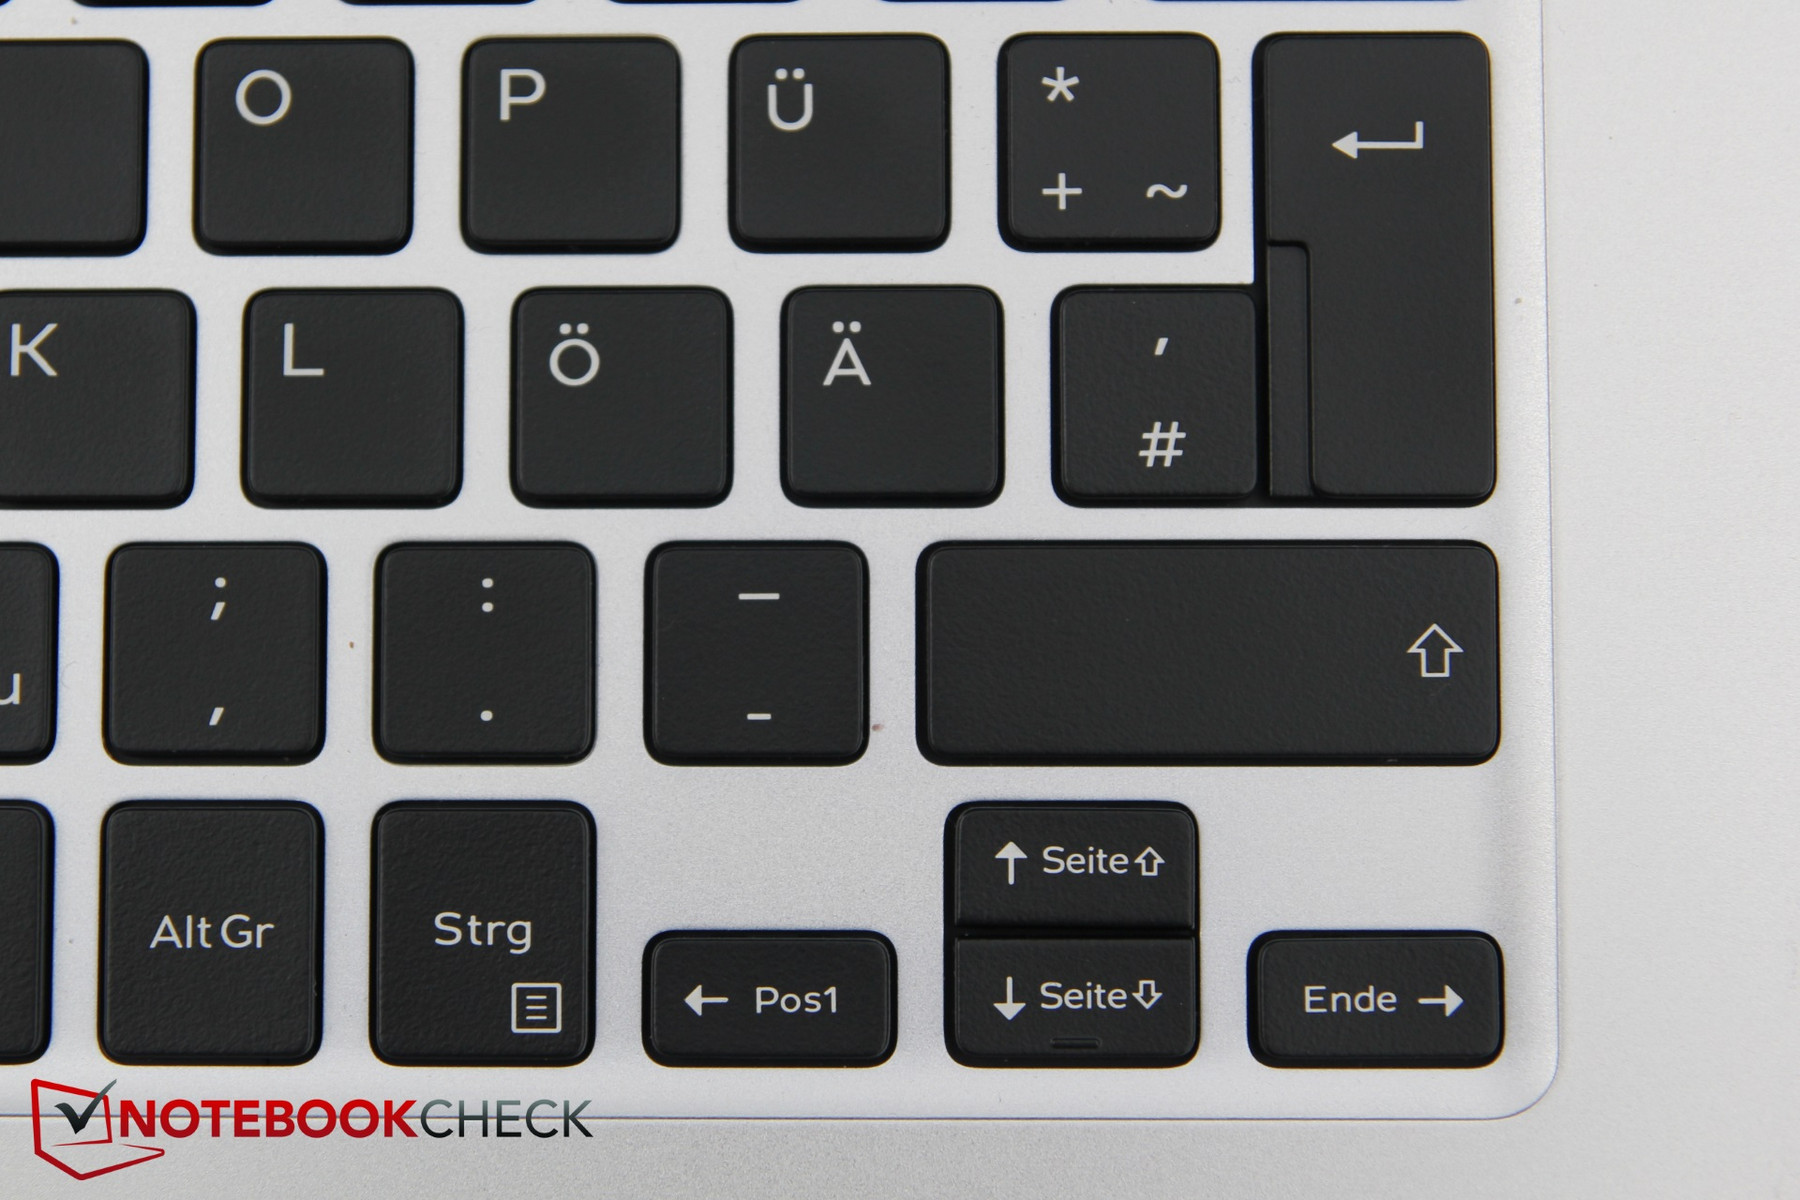
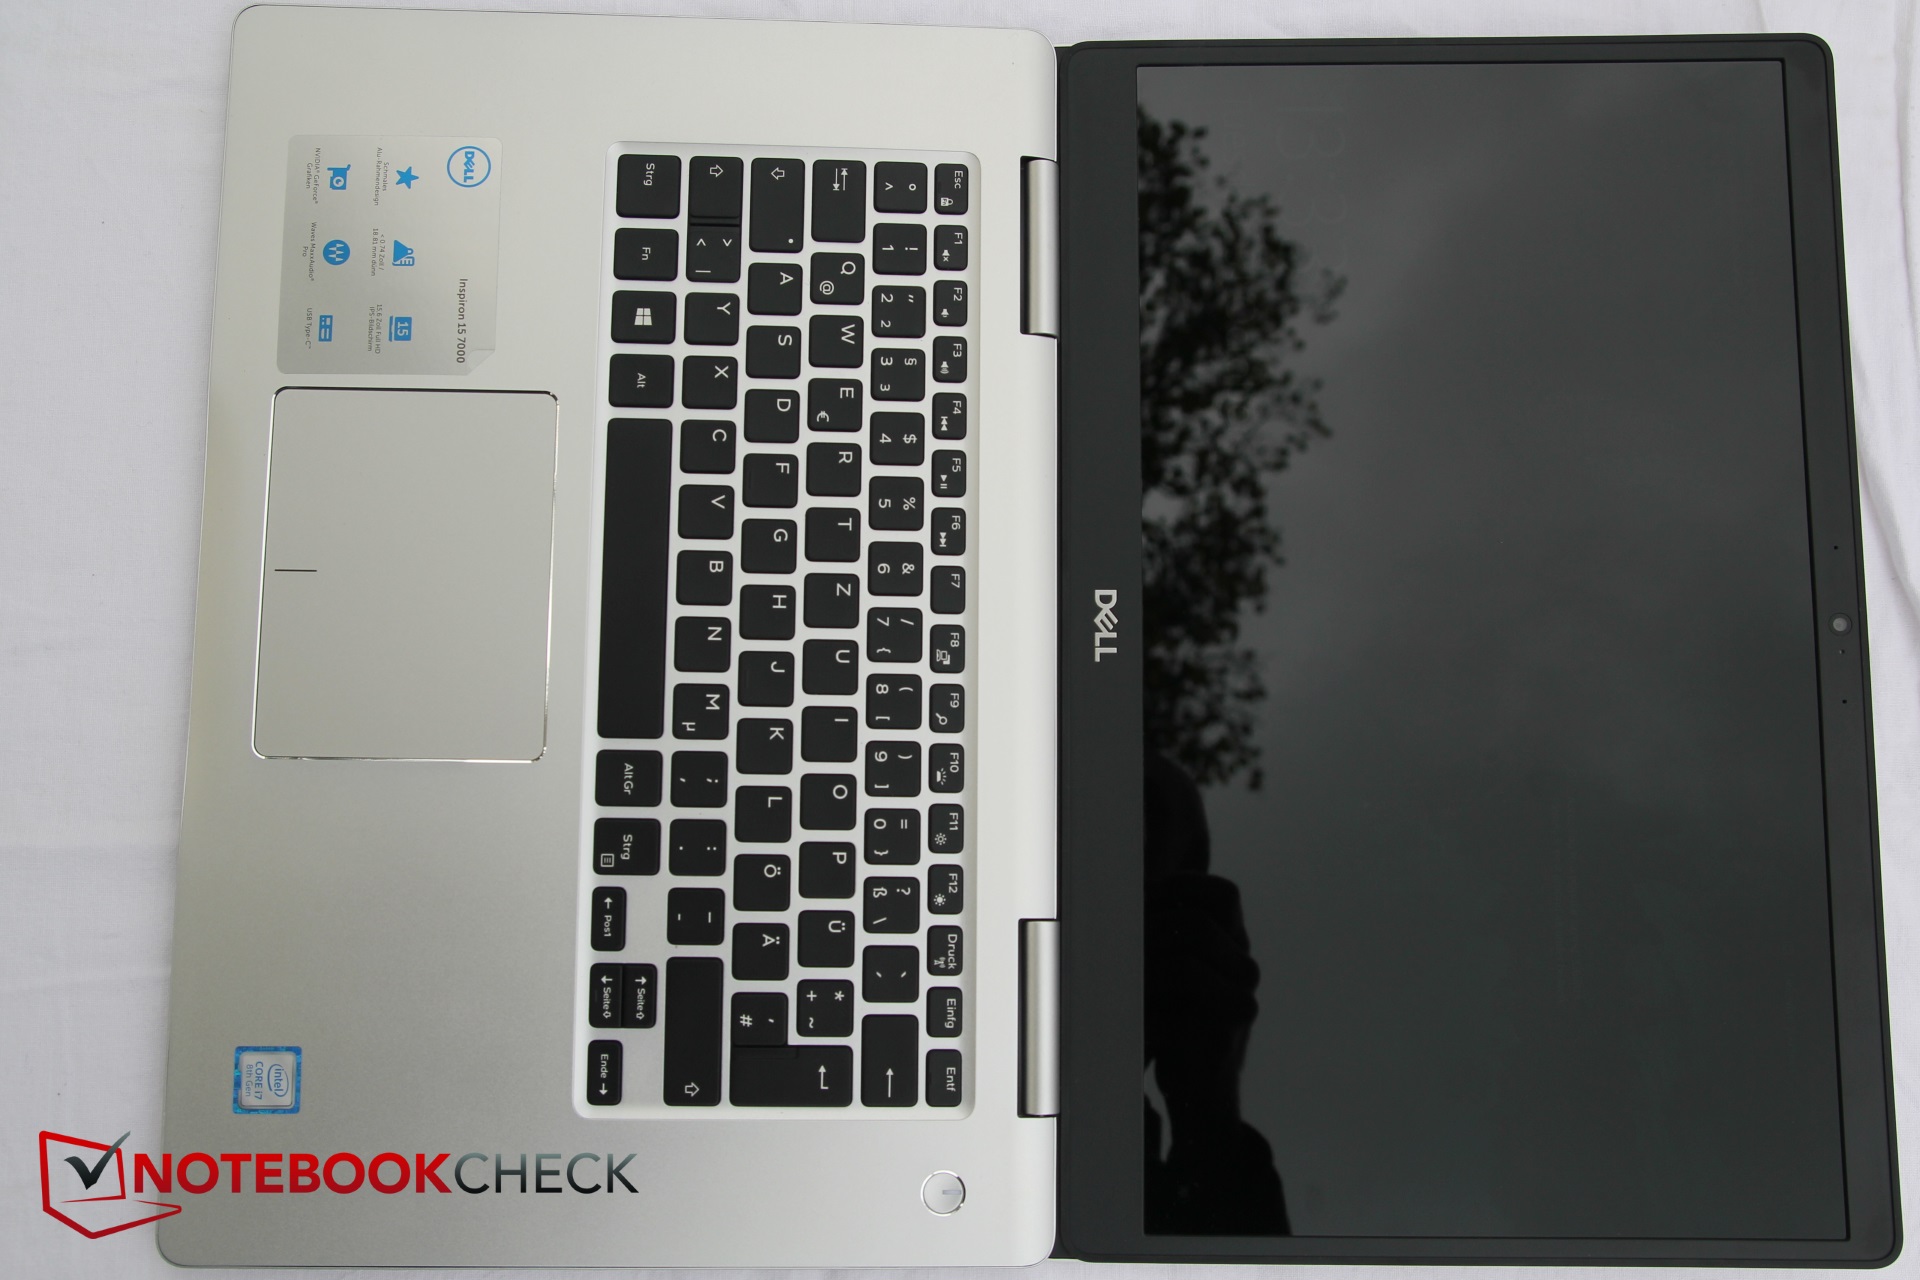
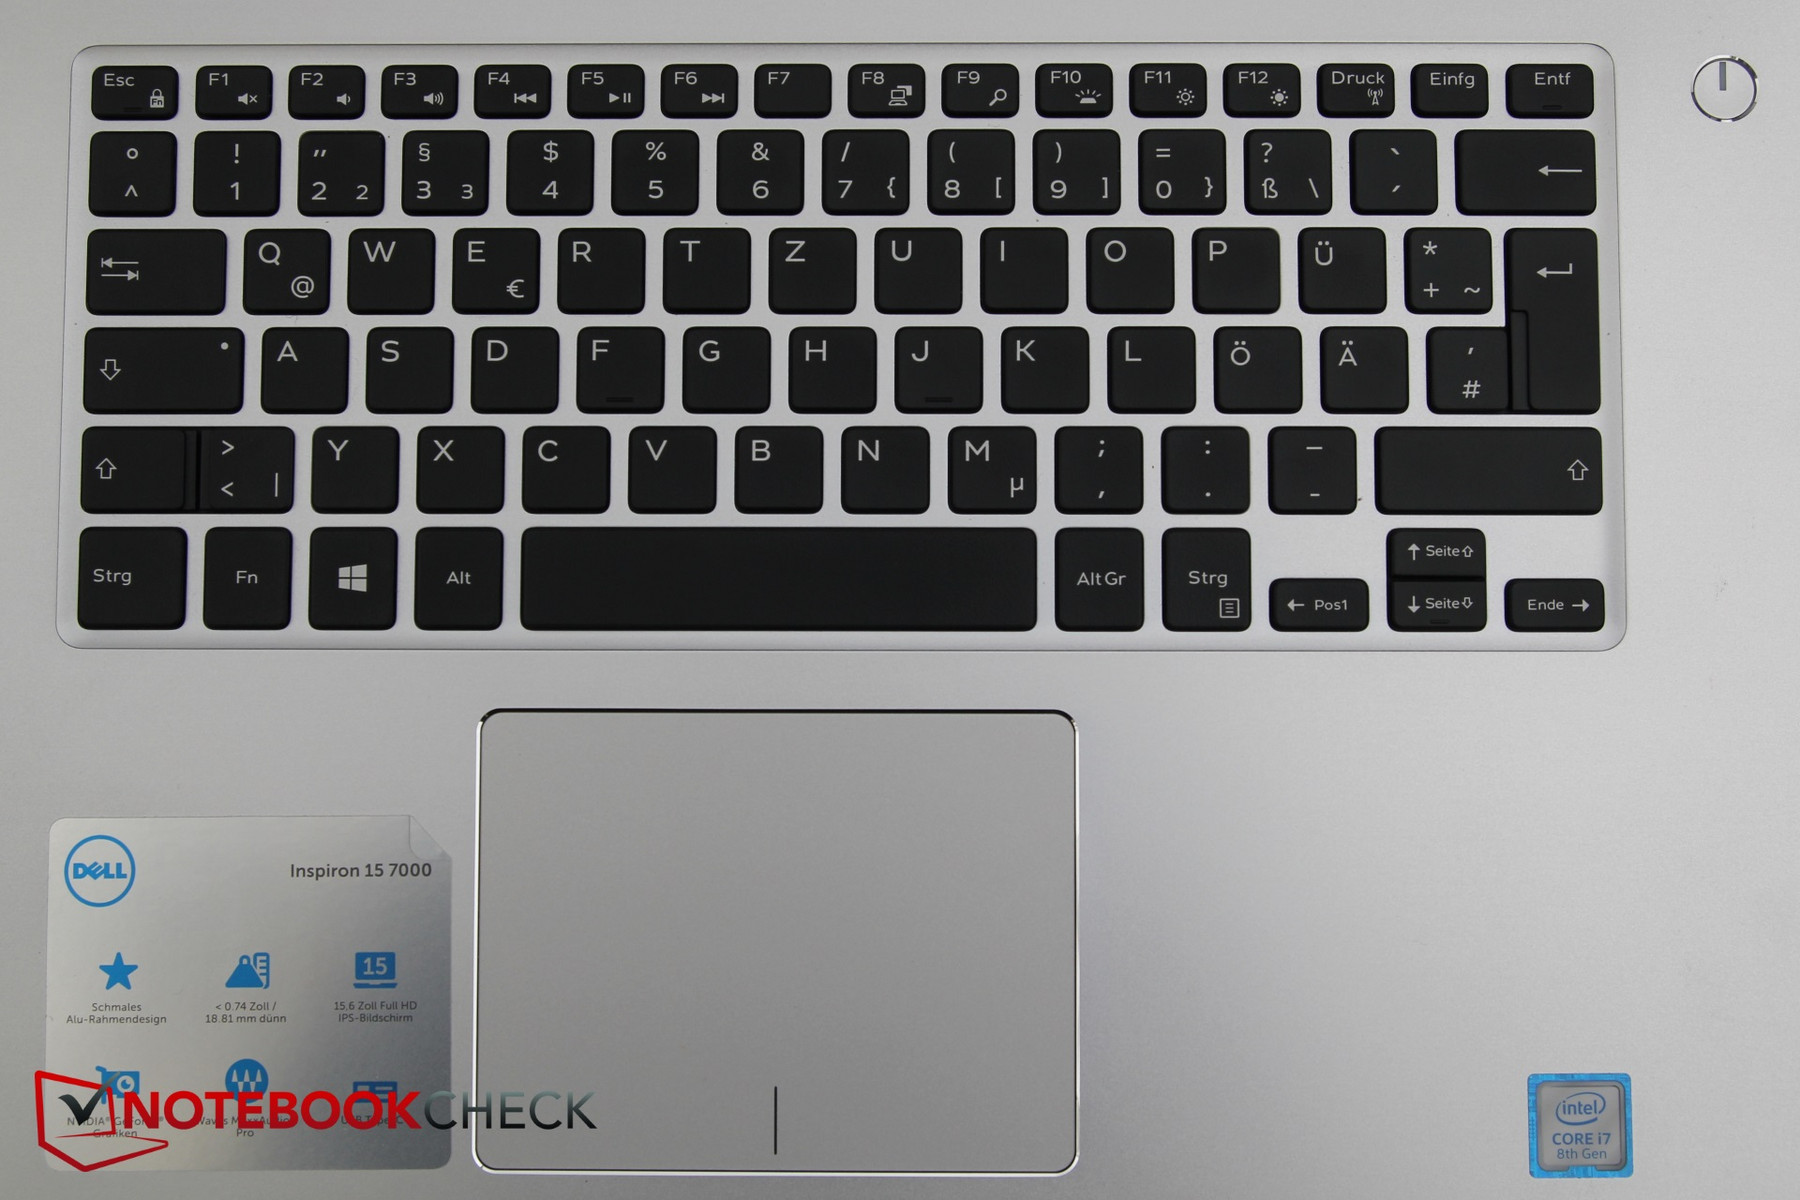
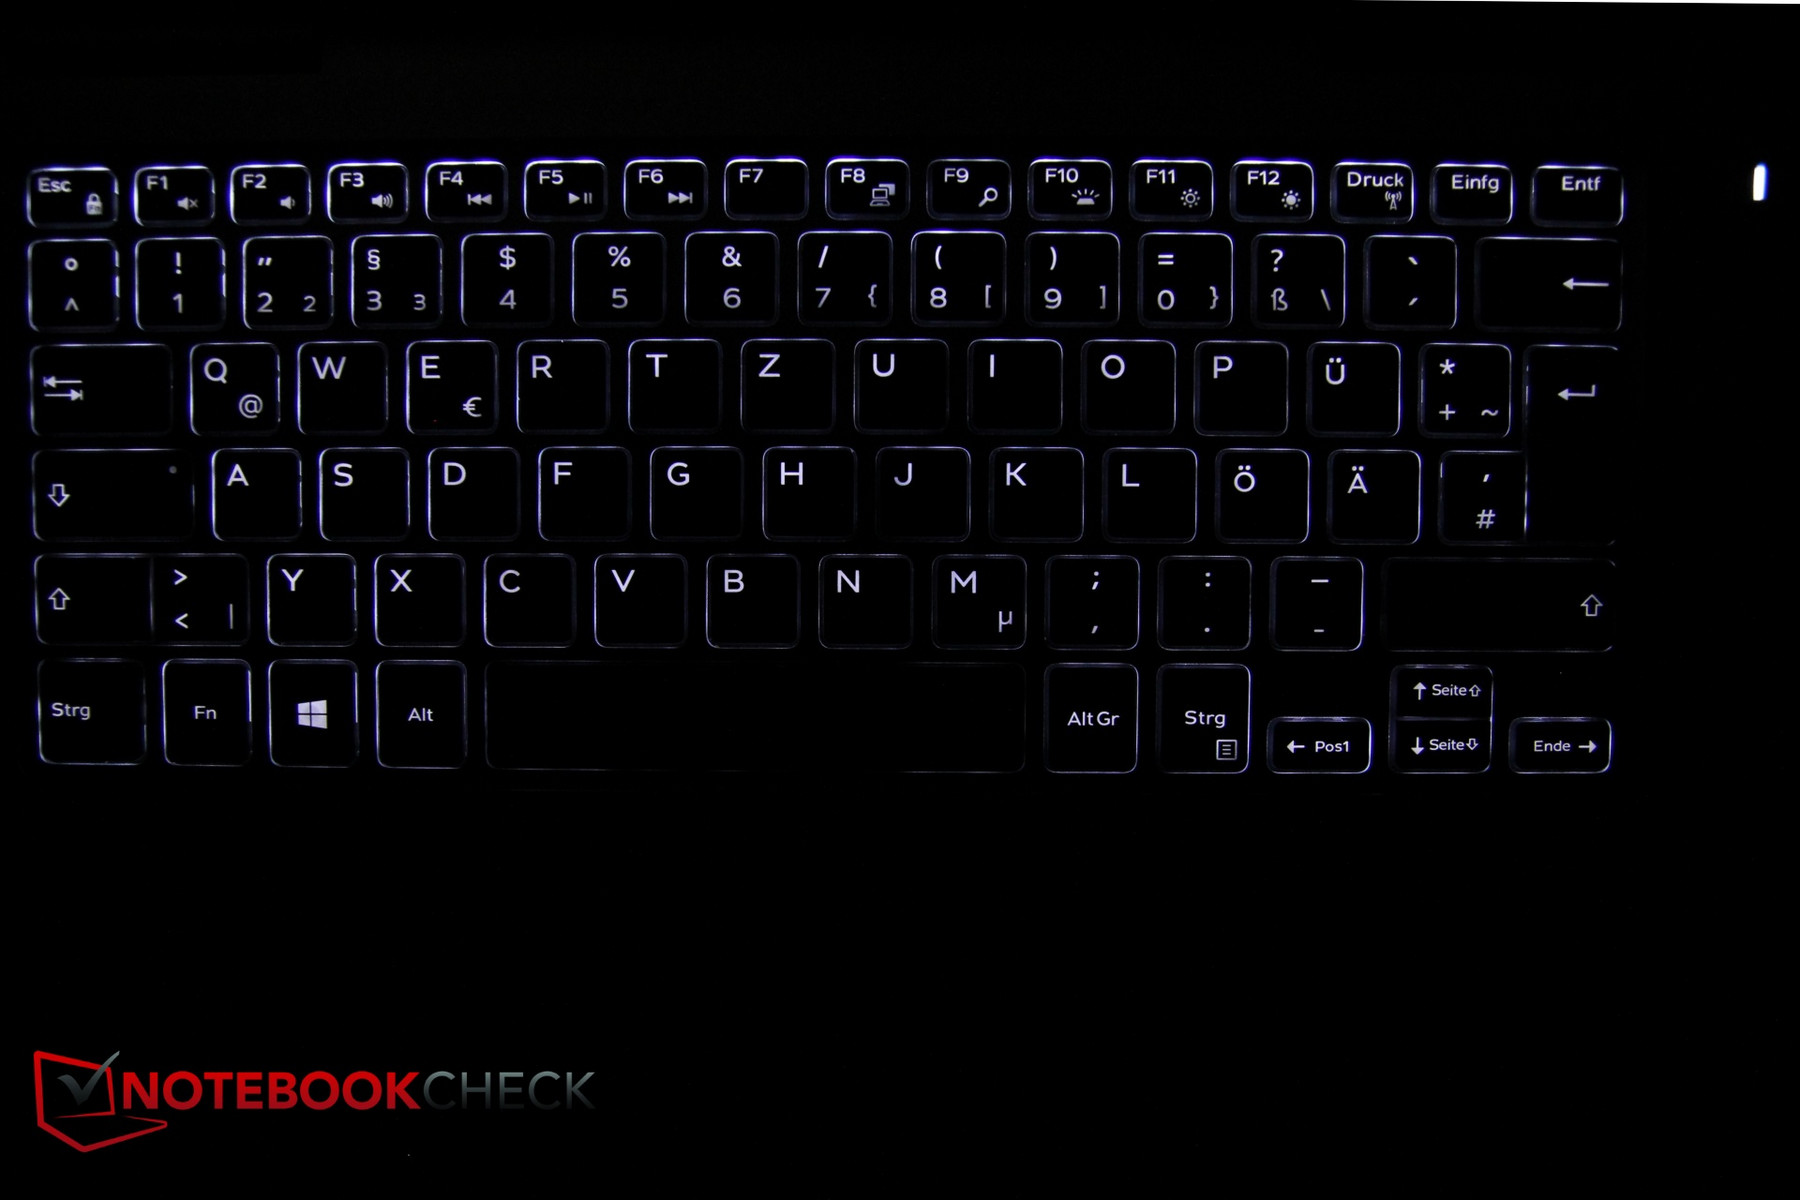
The 15 x 15 mm (~0.6 x 0.6 in) keys offer a comfortable keystroke. Typing with them is simple and straightforward, and the typing noise is also okay. Moreover, the layout is extremely clean, and there is plenty of space for all the keys. However, this is due to the fact that there is no number pad. In a 15-inch device which is advertised as a business or all-round device, we would have really liked a number pad, since it makes a lot of tasks easier. Despite the ample amount of space, the Shift, Enter, and particularly the arrow keys are smaller than usual.
The mapping of the function keys is unusual, since their default is set to the special functions. For example, pressing F5 does not reload a website, but triggers the special media function of the key (Play/Pause). However, Dell is not consistent here - that would be impractical - but some keys do the opposite (for example F4). Since there is no additional labeling, you have to find out by trial and error.
You can optionally illuminate the keyboard in a single color and two steps of brightness, although the difference between them is very slight.
Touchpad
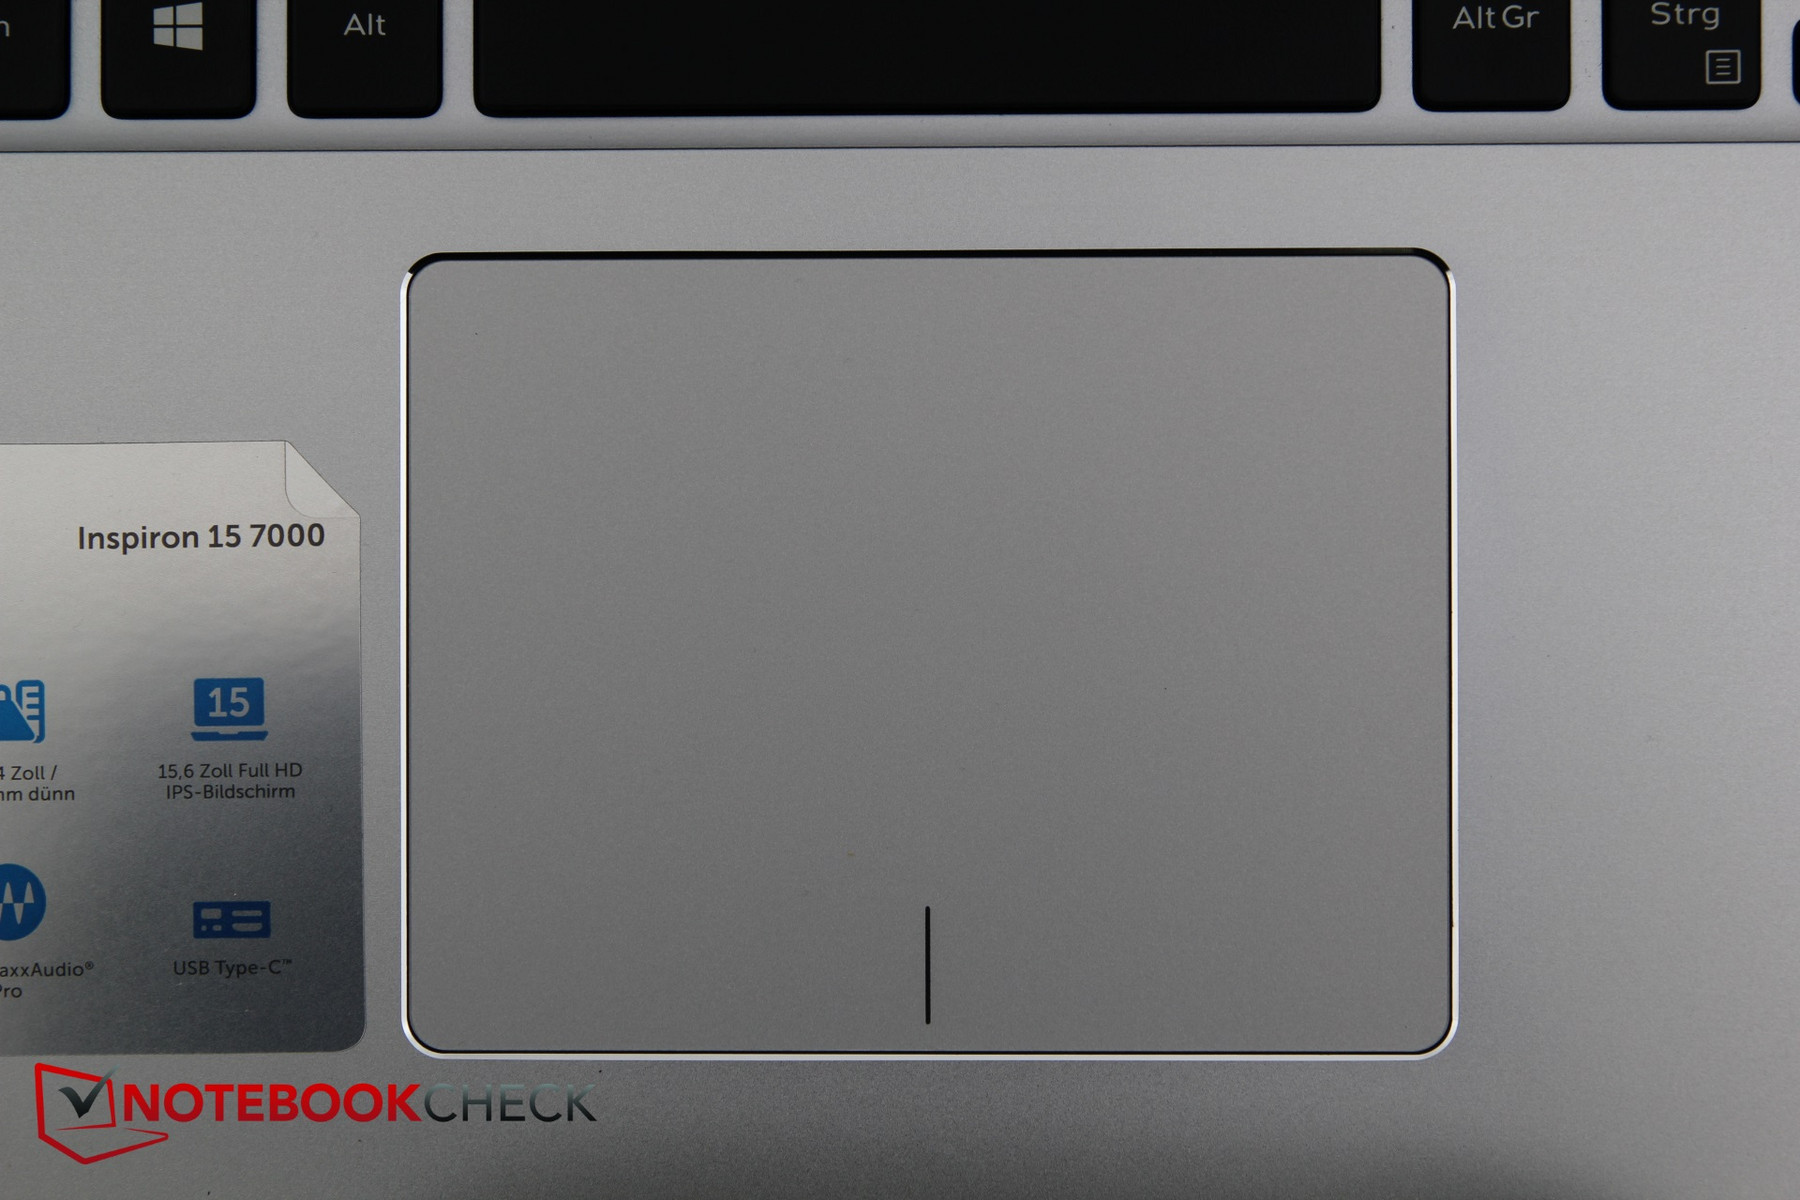
The touchpad has a good size (105 x 81 mm/~4.1 x 3.2 in), reacts accurately, and offers a pleasing sliding characteristic. The key area also reacts reliably, but the clicking noises could have been quieter. Multi-touch gestures were also recognized in the test without any problems. Dragging and swiping actions worked with up to four fingers.
Display

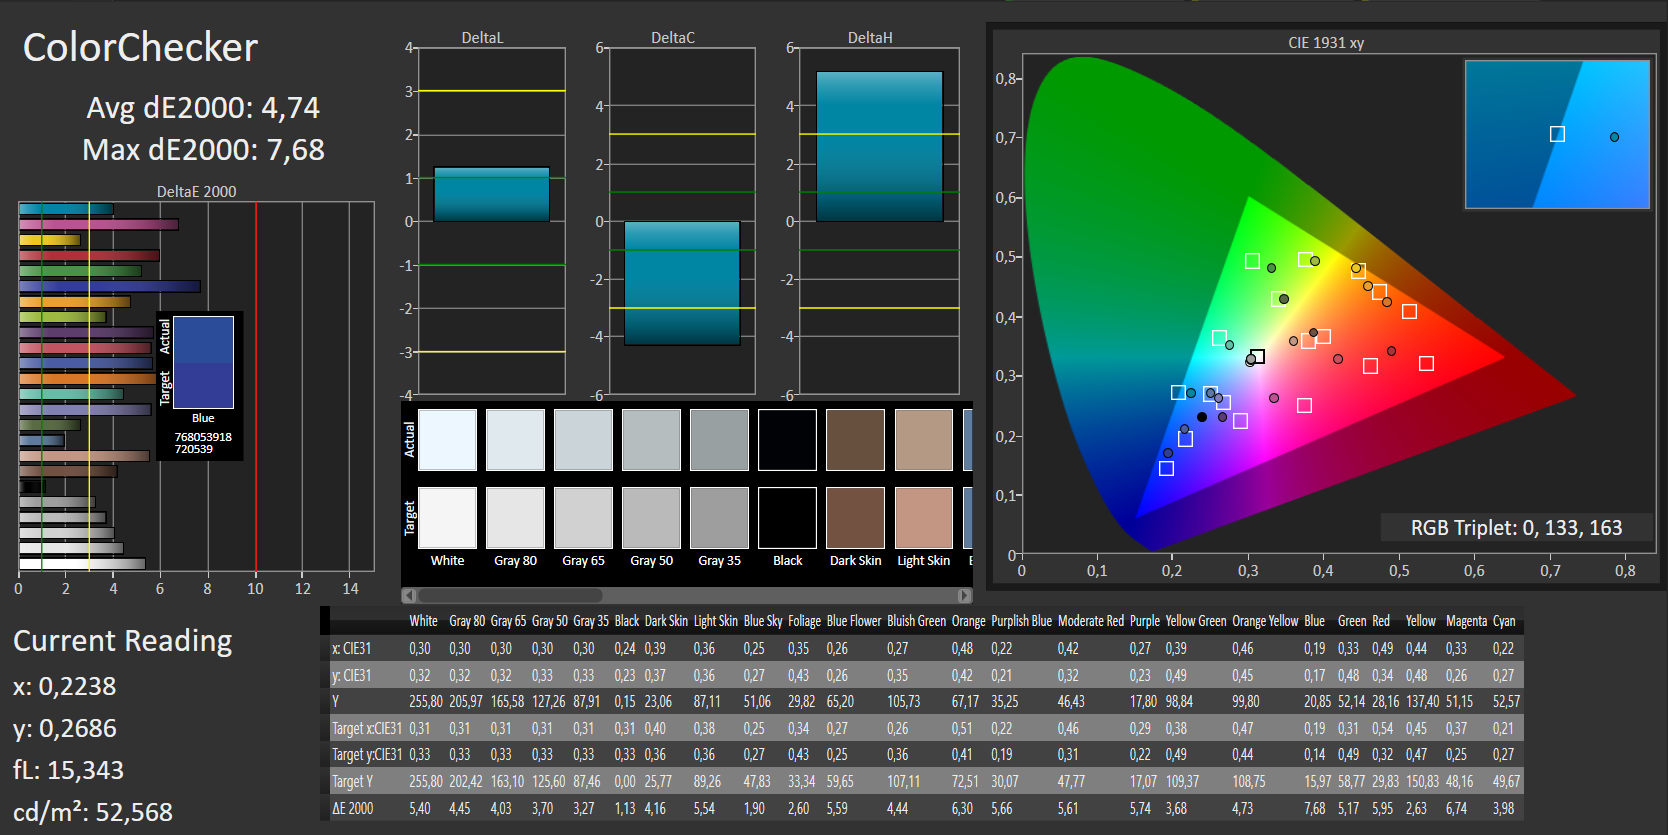
In our test unit, Dell has used a 15-inch Full HD IPS panel made by BOE. Optionally, you can also get a (much more expensive) version with a 4K UHD display including the touch function. While the display used is convincing in many respects, it also has two or three weaknesses. Probably the biggest weakness of the display is the relatively low average brightness of 240 cd/m2 . With the exception of the mediocre TN panel of the sibling model, this is the worst value in the comparison. However, at a maximum of 275 cd/m2 the competitors are not much better either. In addition, the display of the new Inspiron is also reflective. The combination of the barely acceptable brightness and reflective surface creates some doubts as to the outdoor suitability of the device. But more on this later.
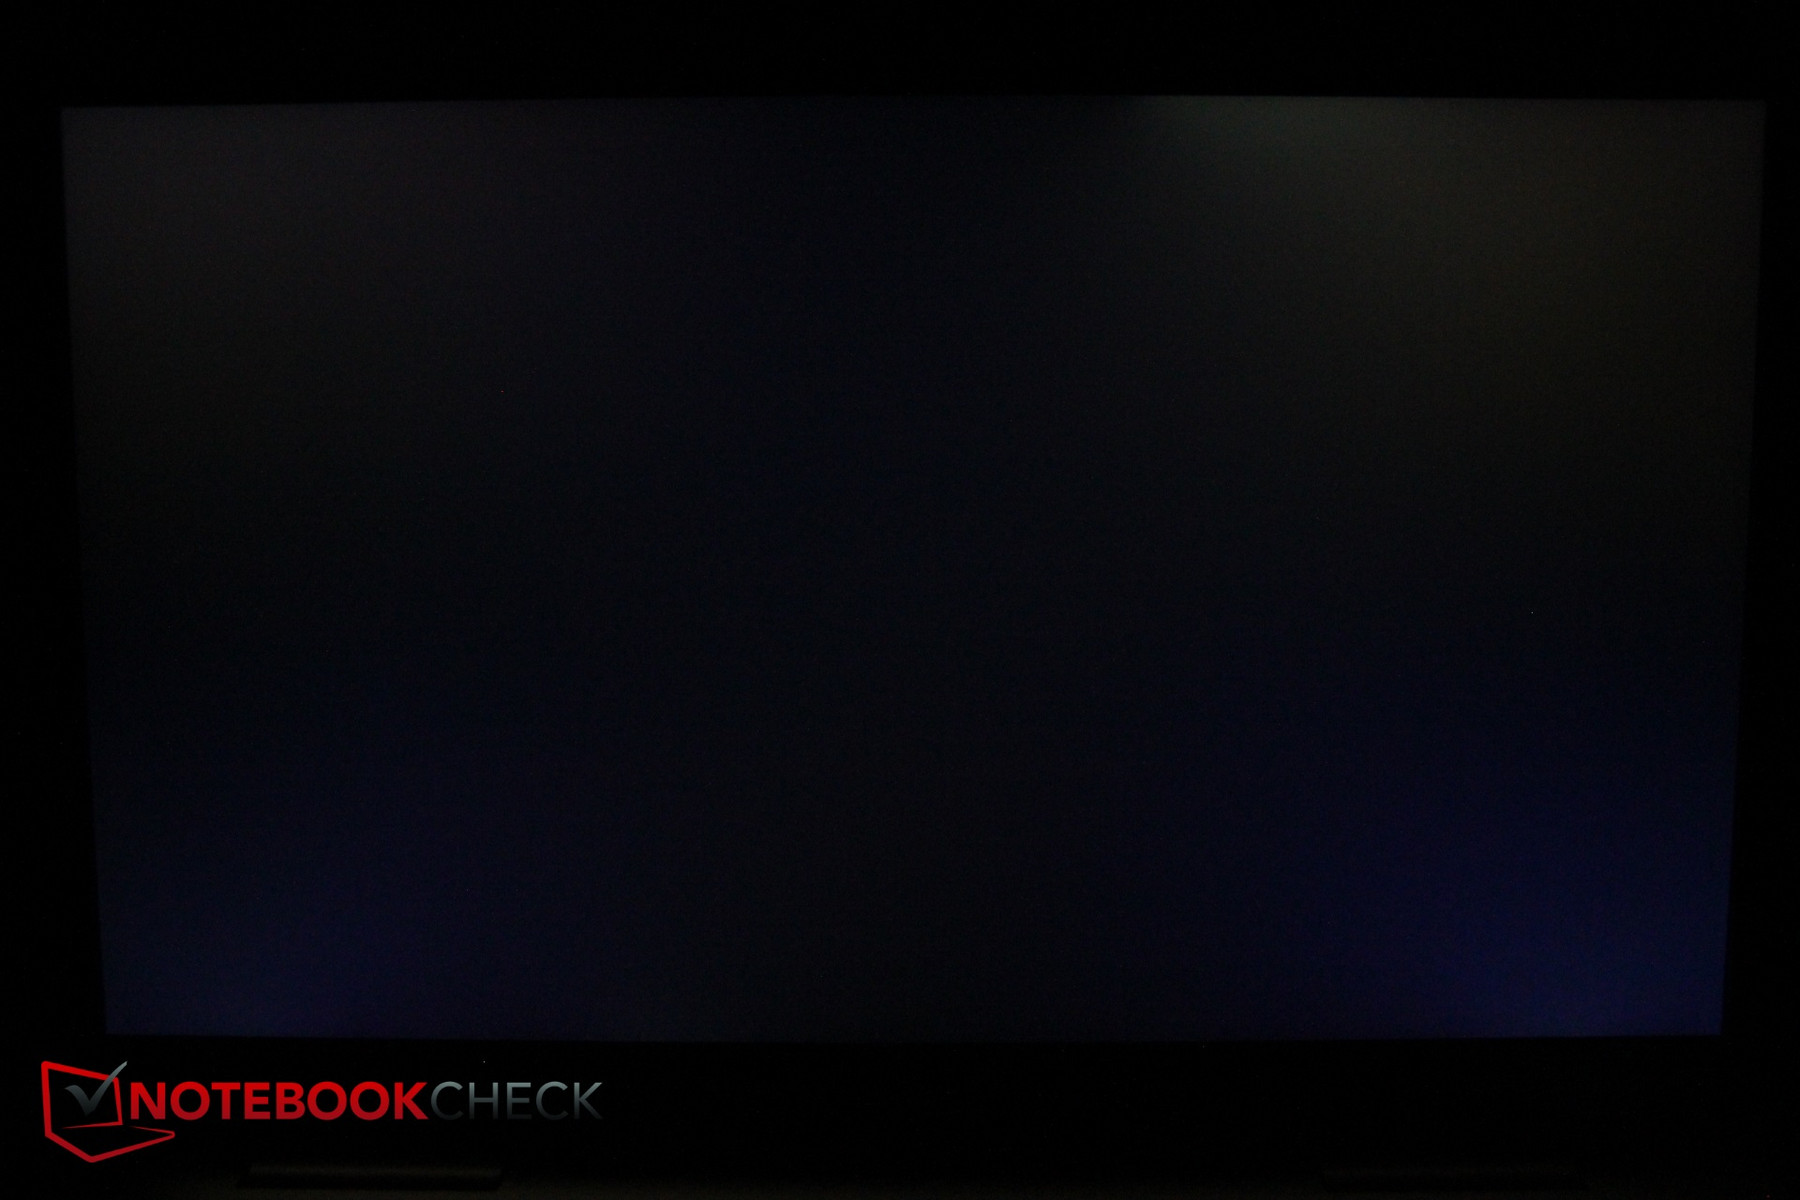
At 91%, the brightness distribution turns out very strong, so the brightness is distributed very evenly across the display. As typical for IPS displays, we also noticed some slight screen bleeding. This was mainly in the top right corner visible in very dark scenes and that only when you were looking for it.
| |||||||||||||||||||||||||
Brightness Distribution: 91 %
Center on Battery: 255 cd/m²
Contrast: 1594:1 (Black: 0.16 cd/m²)
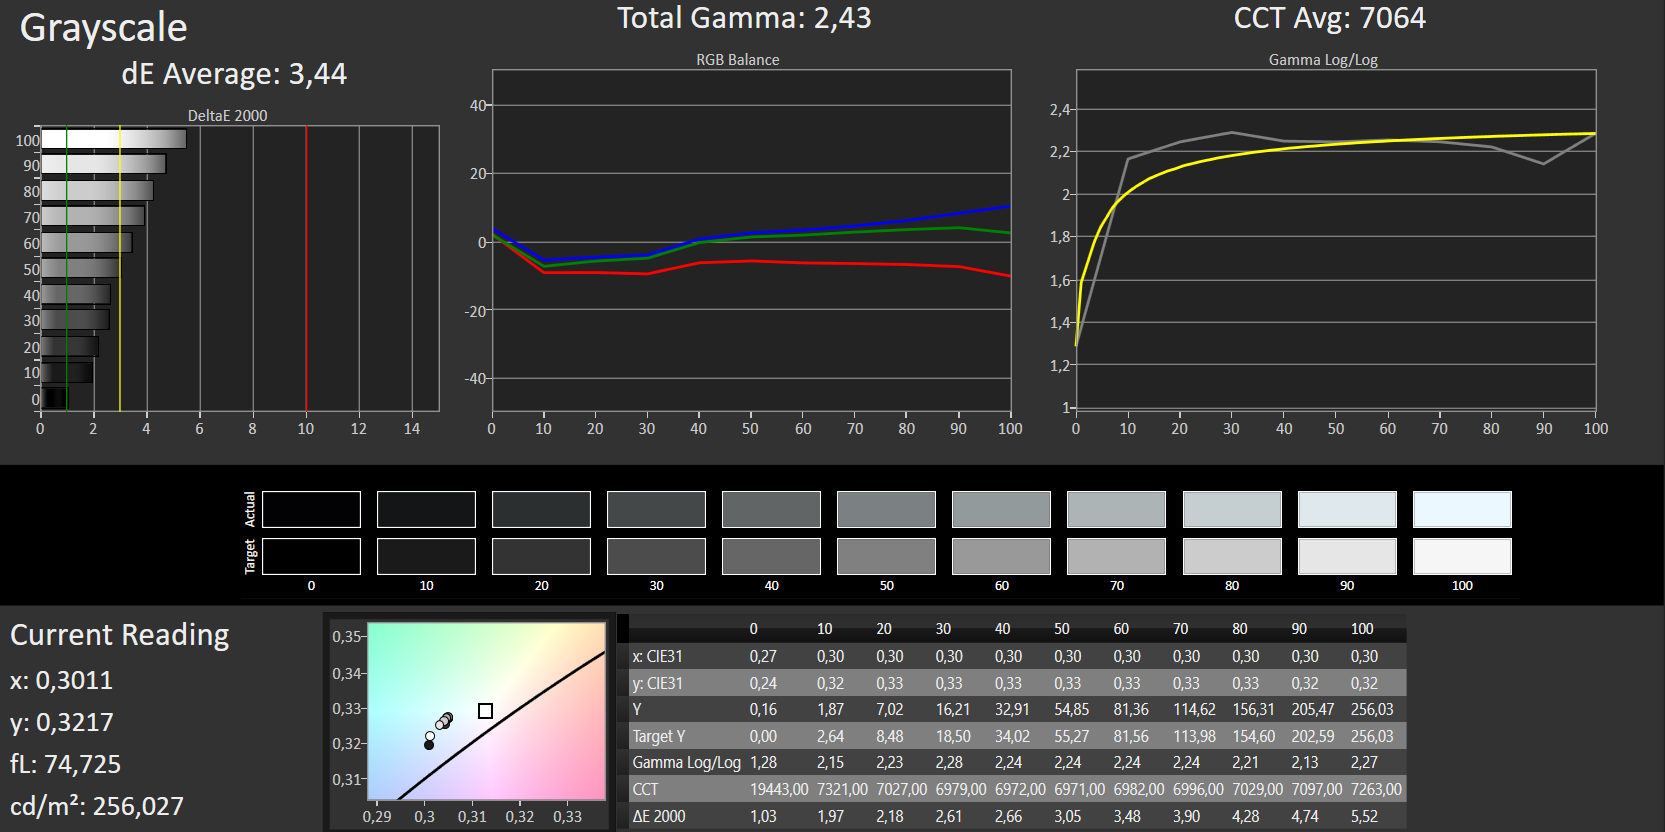
ΔE ColorChecker Calman: 4.74 | ∀{0.5-29.43 Ø4.73}
ΔE Greyscale Calman: 3.44 | ∀{0.09-98 Ø4.97}
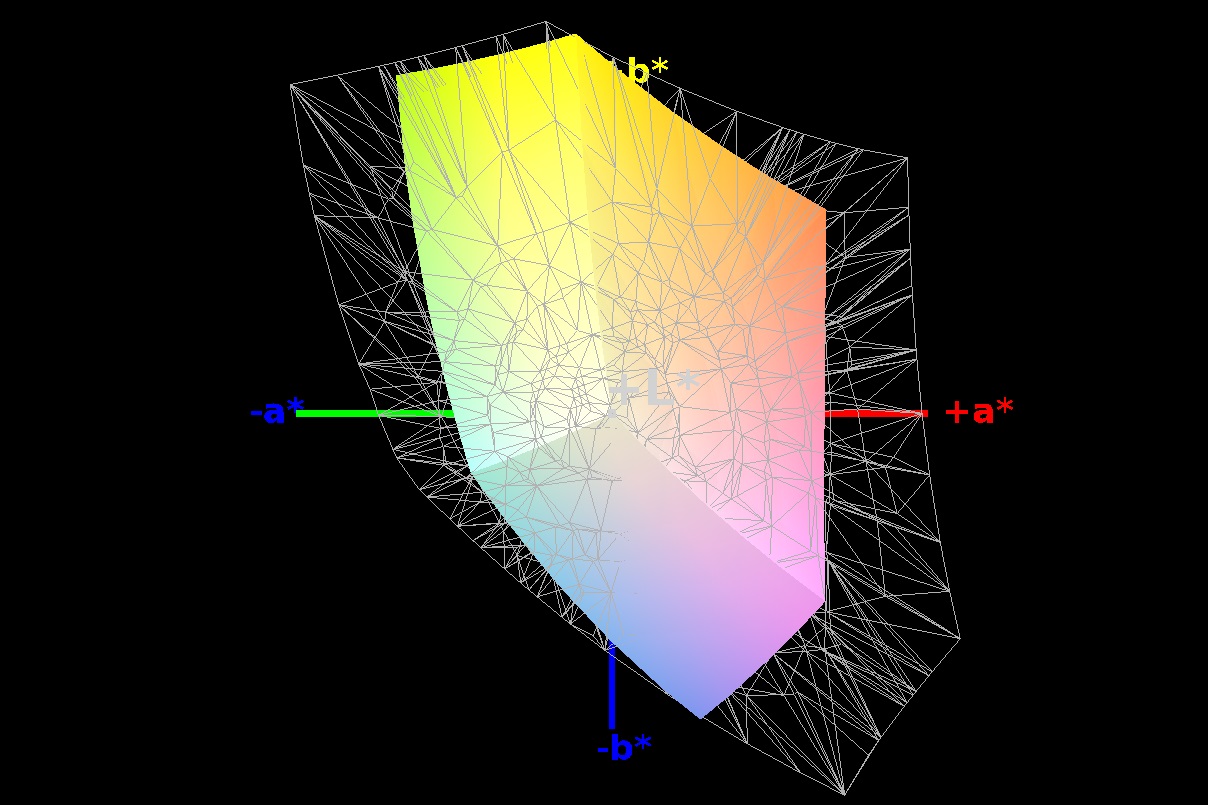
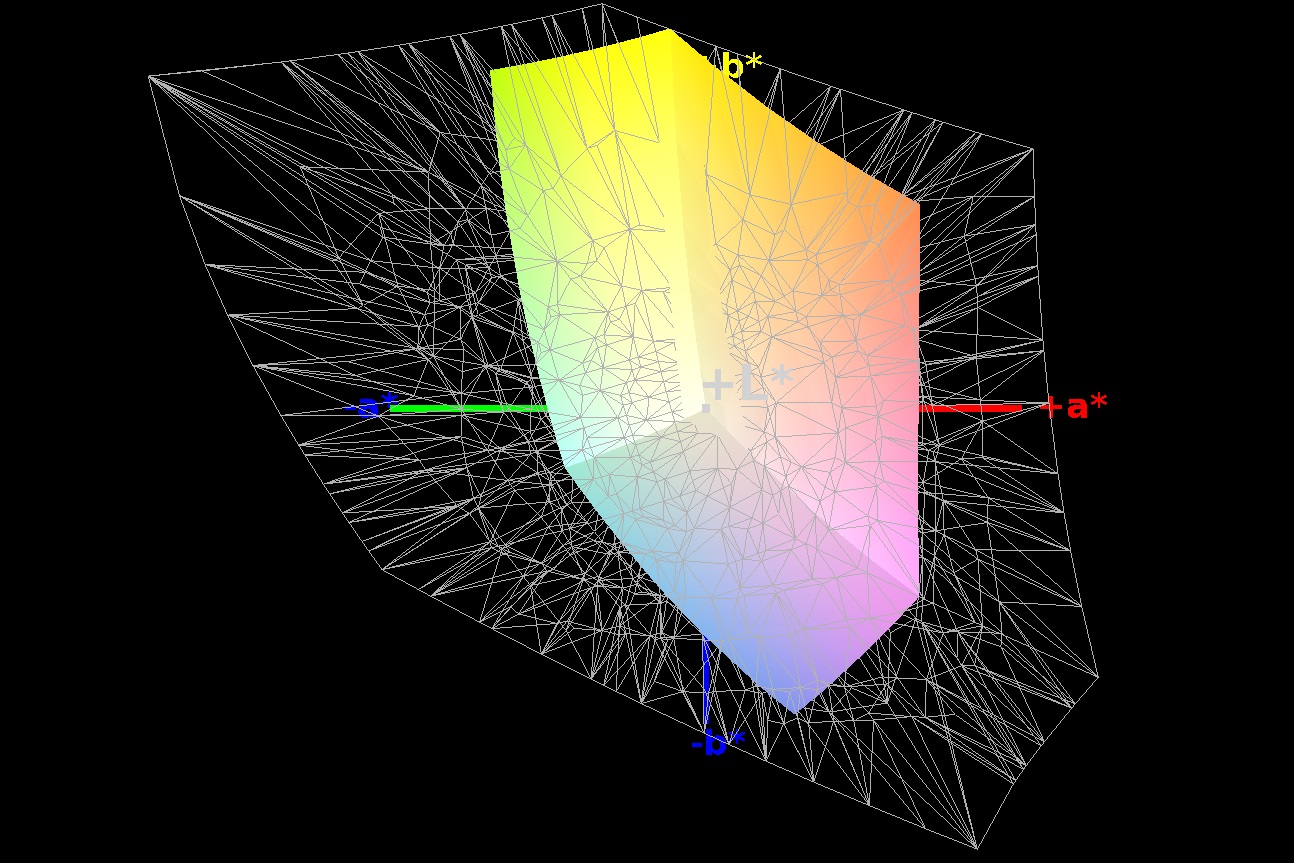
60% sRGB (Argyll 1.6.3 3D)
38% AdobeRGB 1998 (Argyll 1.6.3 3D)
41.77% AdobeRGB 1998 (Argyll 3D)
60% sRGB (Argyll 3D)
40.43% Display P3 (Argyll 3D)
Gamma: 2.43
CCT: 7064 K
| Dell Inspiron 15 7570 BOE06B4, , 1920x1080, 15.6" | Asus Vivobook S15 S510UQ-BQ189T AU Optronics B156W02 / AUO B156HAN02.1, , 1920x1080, 15.6" | Acer TravelMate P658-G2-MG-7327 LG Philips LP156WF6-SPP1, , 1920x1080, 15.6" | Lenovo IdeaPad 510-15IKB 80SV0087GE BOE HF NV156FHM-N42, , 1920x1080, 15.6" | Huawei MateBook D 15, i7-7500U 940MX BOE070C, , 1920x1080, 15.6" | Dell Inspiron 15 5000 5567-1753 BOE NT15N41, , 1920x1080, 15.6" | |
|---|---|---|---|---|---|---|
| Display | -3% | 51% | 6% | 3% | -10% | |
| Display P3 Coverage (%) | 40.43 | 38.94 -4% | 64.9 61% | 42.66 6% | 41.79 3% | 36.24 -10% |
| sRGB Coverage (%) | 60 | 58.5 -2% | 85.9 43% | 64.1 7% | 61.5 2% | 54.6 -9% |
| AdobeRGB 1998 Coverage (%) | 41.77 | 40.23 -4% | 62.8 50% | 44.08 6% | 43.17 3% | 37.44 -10% |
| Response Times | 6% | 16% | -14% | -8% | 31% | |
| Response Time Grey 50% / Grey 80% * (ms) | 45 ? | 47 ? -4% | 38 ? 16% | 51 ? -13% | 46.4 ? -3% | 43 ? 4% |
| Response Time Black / White * (ms) | 33 ? | 28 ? 15% | 28 ? 15% | 38 ? -15% | 36.8 ? -12% | 14 ? 58% |
| PWM Frequency (Hz) | 996 ? | 21000 ? | 50 ? | 21190 | ||
| Screen | -1% | -3% | -6% | -45% | -86% | |
| Brightness middle (cd/m²) | 255 | 293 15% | 284 11% | 291 14% | 268 5% | 145 -43% |
| Brightness (cd/m²) | 240 | 275 15% | 276 15% | 265 10% | 258 8% | 144 -40% |
| Brightness Distribution (%) | 91 | 86 -5% | 82 -10% | 86 -5% | 92 1% | 90 -1% |
| Black Level * (cd/m²) | 0.16 | 0.25 -56% | 0.295 -84% | 0.23 -44% | 0.47 -194% | 0.49 -206% |
| Contrast (:1) | 1594 | 1172 -26% | 963 -40% | 1265 -21% | 570 -64% | 296 -81% |
| Colorchecker dE 2000 * | 4.74 | 3.81 20% | 4.07 14% | 4.78 -1% | 5.7 -20% | 9.27 -96% |
| Colorchecker dE 2000 max. * | 7.68 | 6.64 14% | 10.52 -37% | 9.51 -24% | 21.7 -183% | 16.9 -120% |
| Greyscale dE 2000 * | 3.44 | 2.66 23% | 3.13 9% | 3.49 -1% | 4.2 -22% | 12.28 -257% |
| Gamma | 2.43 91% | 2.54 87% | 2.41 91% | 2.58 85% | 2.3 96% | 2.03 108% |
| CCT | 7064 92% | 6541 99% | 7082 92% | 6013 108% | 6820 95% | 10732 61% |
| Color Space (Percent of AdobeRGB 1998) (%) | 38 | 37 -3% | 56 47% | 40 5% | 43.2 14% | 35 -8% |
| Color Space (Percent of sRGB) (%) | 60 | 58 -3% | 86 43% | 64 7% | 61.5 2% | 55 -8% |
| Total Average (Program / Settings) | 1% /
-0% | 21% /
10% | -5% /
-5% | -17% /
-31% | -22% /
-55% |
* ... smaller is better
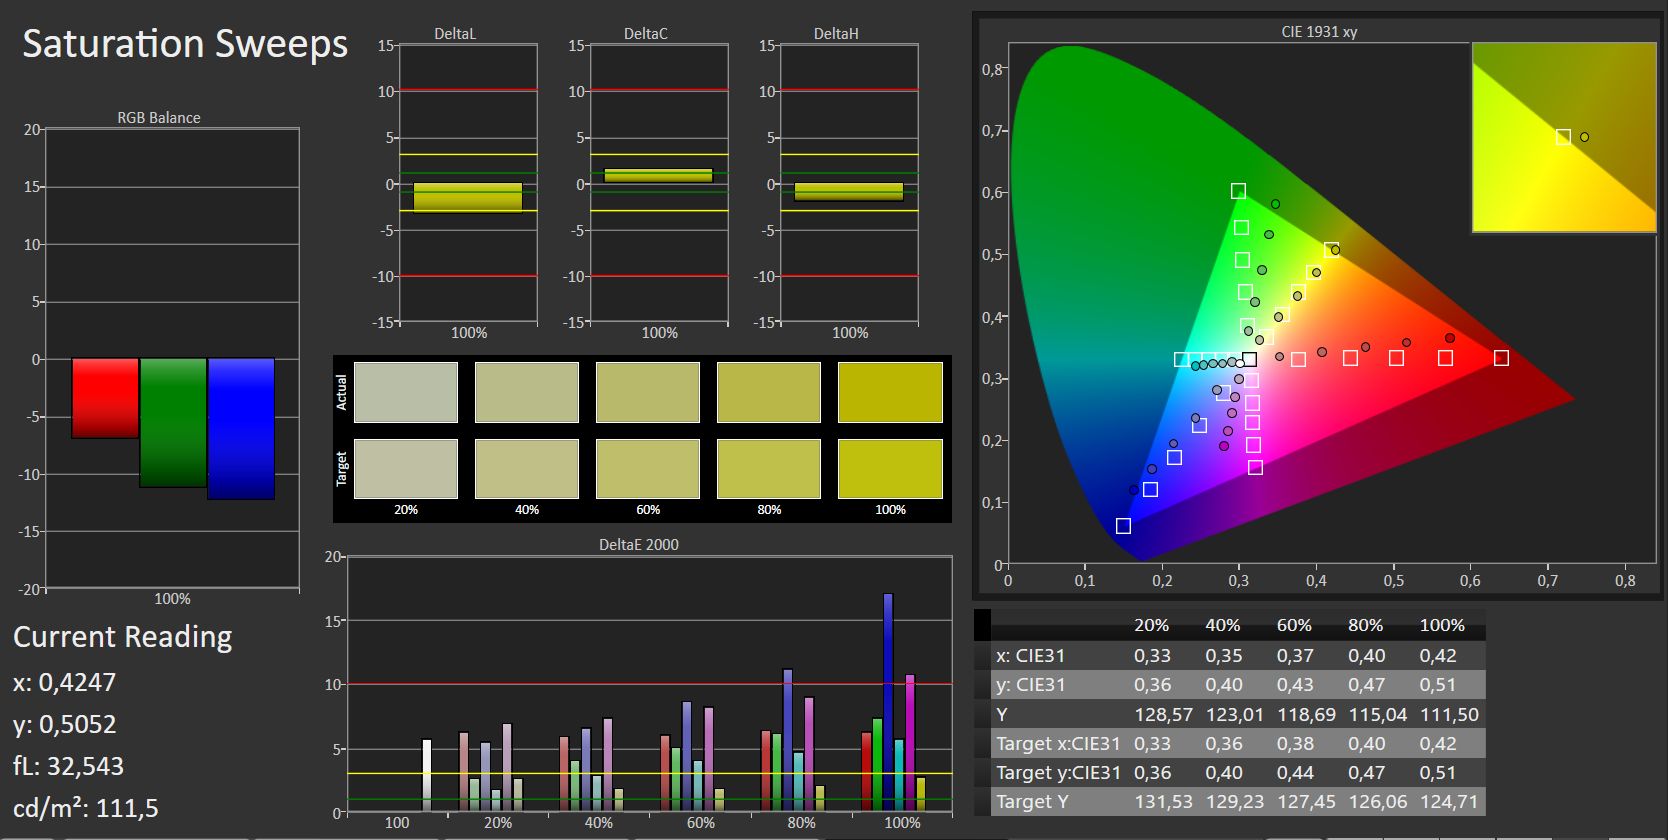
In many other measurements, the panel is convincing. This is the case particularly for the very good contrast (1594:1) and black value (0.16). Both values are the best of the direct comparison and ensure that the display is also very pleasing subjectively. The impression of the very good contrast and saturated black is even more emphasized by the reflective screen, which makes the colors appear even more saturated, at least indoors. The color deviations and the grayscales are also in the acceptable range.
The panel is obviously using PWM for brightness control. The technology is used from a brightness of 90% and lower at a frequency of 996 Hz, which should be sufficiently high to not be noticeable even by sensitive people.
Even though the color space coverage is only important for (semi-) professional users, it should be mentioned. At 60% sRGB and 38% AdobeRGB, this is not particularly high, but almost all of the direct competitors have similar values. Only the Asus can do better here (86% and 56%). Subjectively, we liked the display very much overall, and only the mediocre brightness marred the impression slightly.
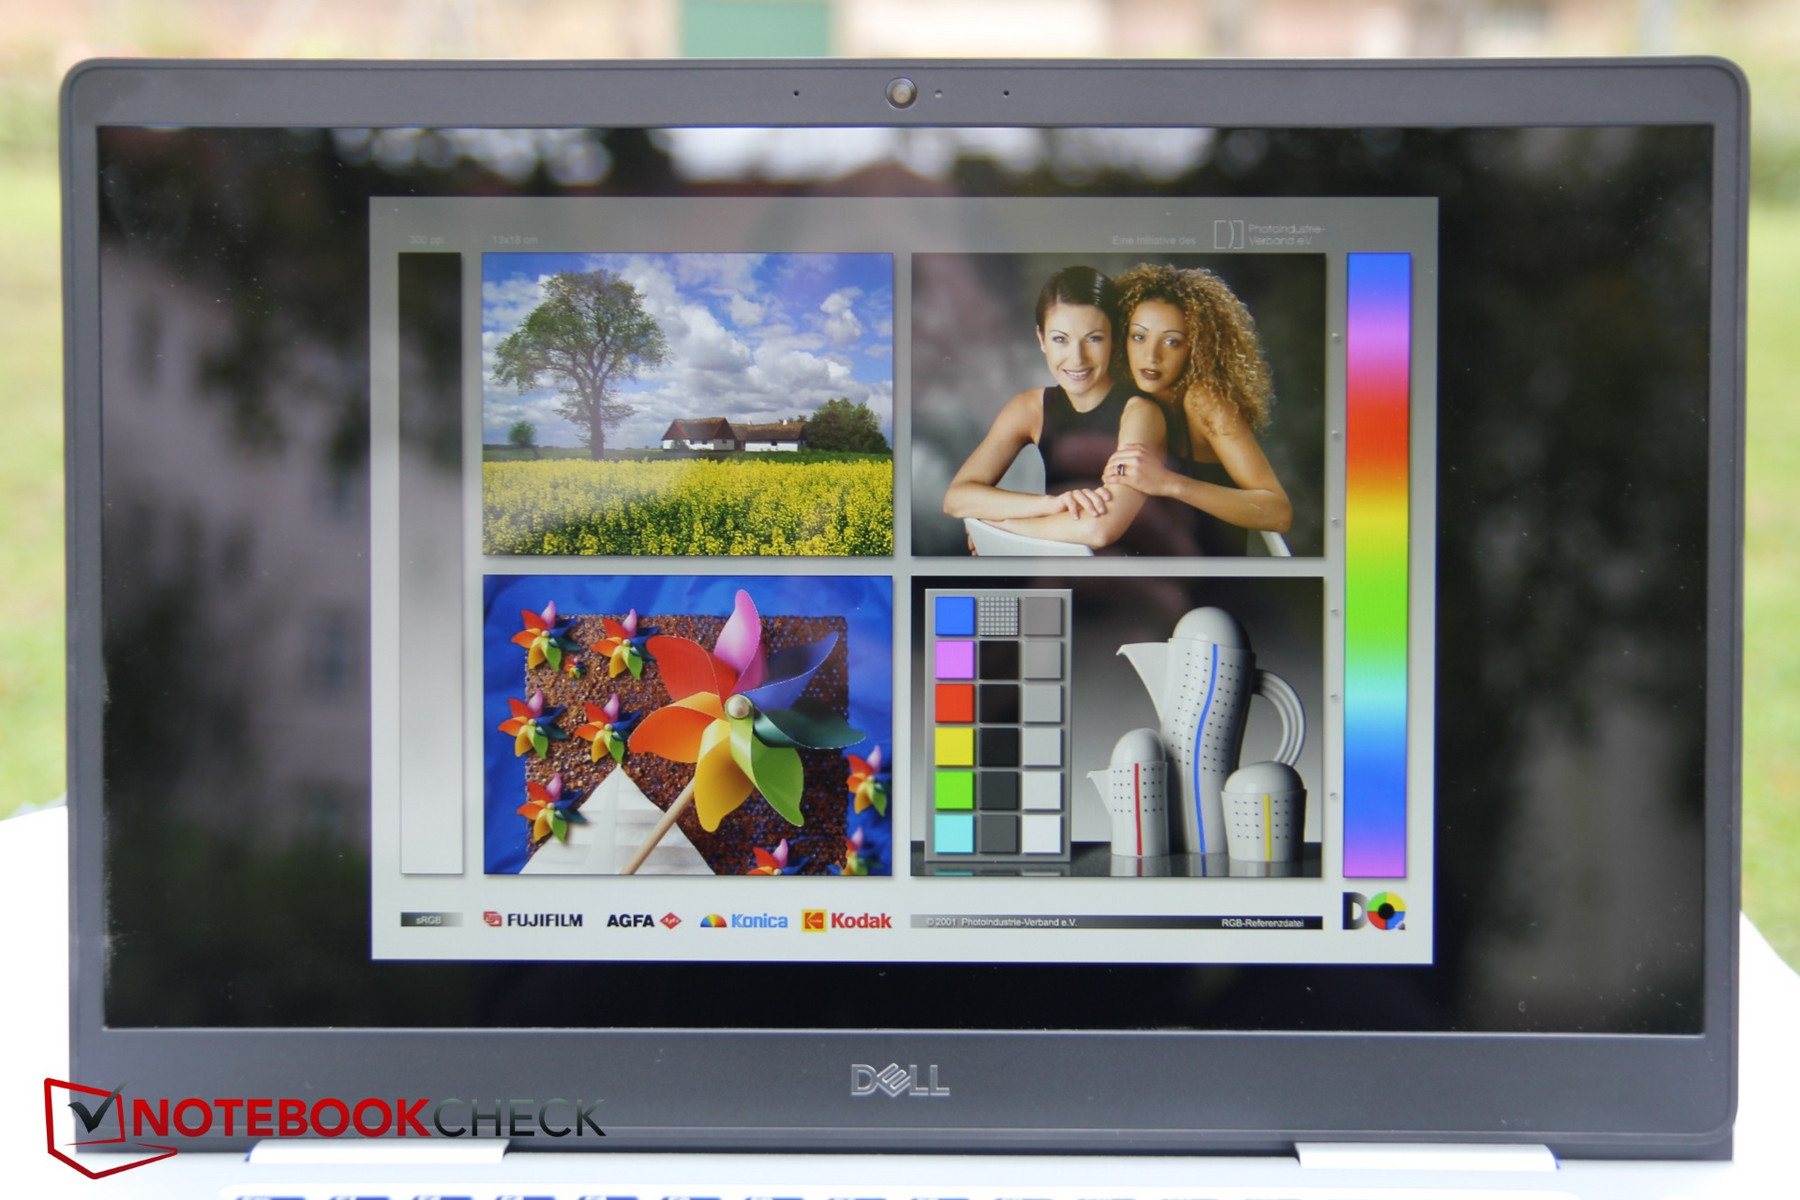
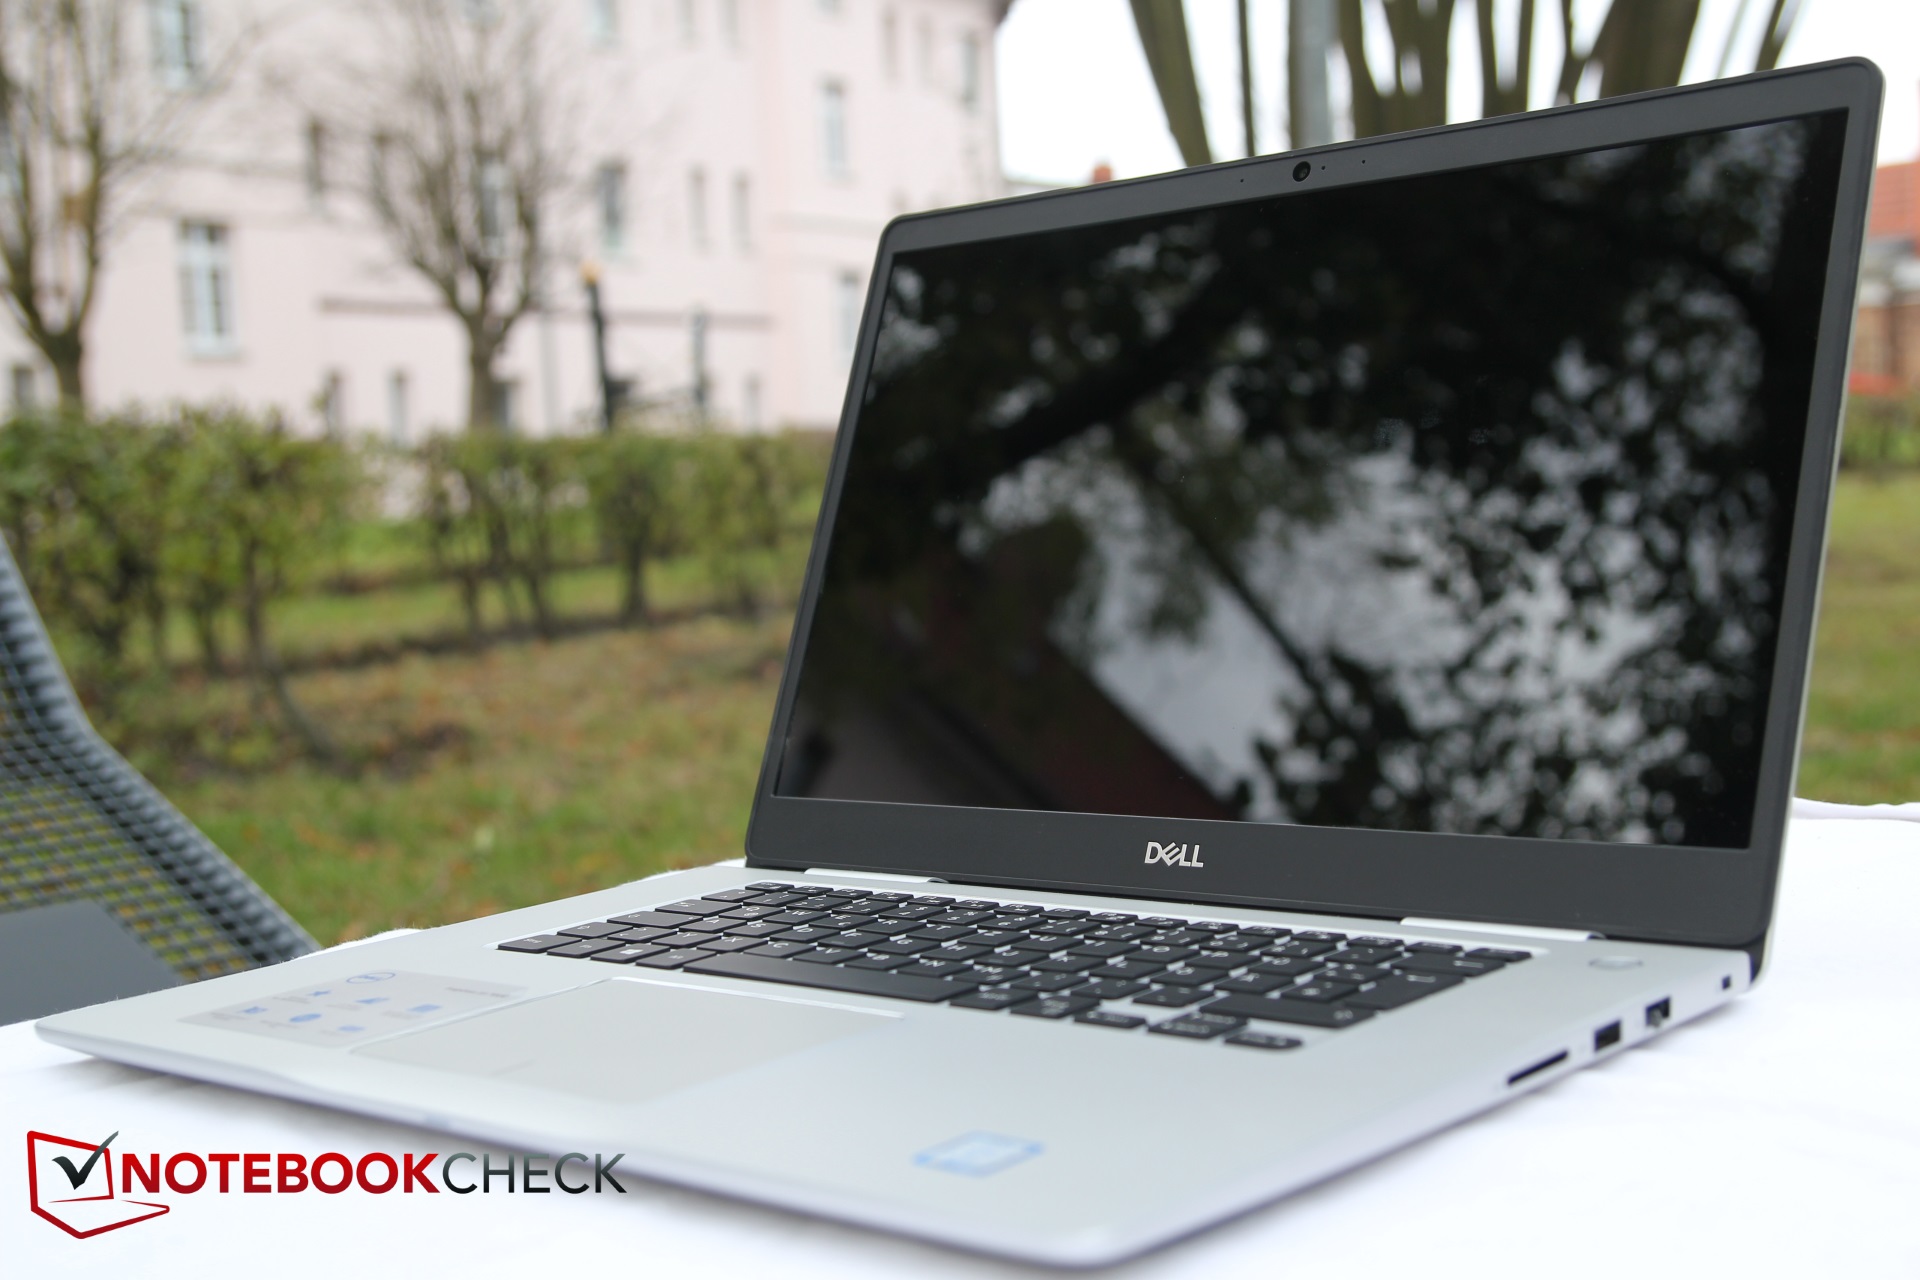
Since this year’s end of October and beginning of November were not blessed by much sun, we were only able to test the outdoor suitability of the Inspiron 15 on a cloudy day. Despite the reflective screen and only mediocre brightness, it fared surprisingly well, which is mainly due to the strong contrast and excellent black value. But of course, you still have to live with the reflections. However, even then the display contents remain surprisingly visible. However, in direct sunlight the visibility will be reduced further.
Display Response Times
| ↔ Response Time Black to White | ||
|---|---|---|
| 33 ms ... rise ↗ and fall ↘ combined | ↗ 18 ms rise | 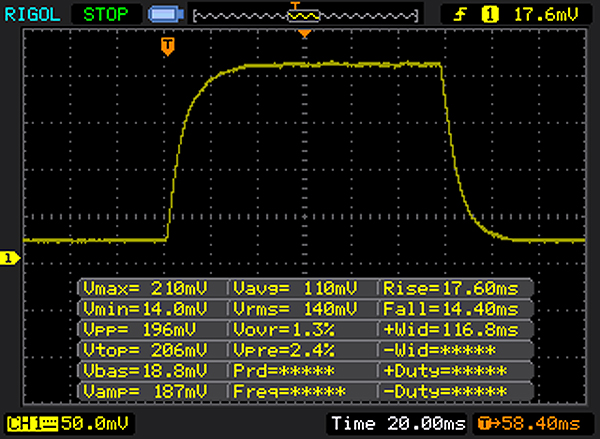 |
| ↘ 15 ms fall | ||
| The screen shows slow response rates in our tests and will be unsatisfactory for gamers. In comparison, all tested devices range from 0.1 (minimum) to 240 (maximum) ms. » 89 % of all devices are better. This means that the measured response time is worse than the average of all tested devices (19.9 ms). | ||
| ↔ Response Time 50% Grey to 80% Grey | ||
| 45 ms ... rise ↗ and fall ↘ combined | ↗ 23 ms rise | 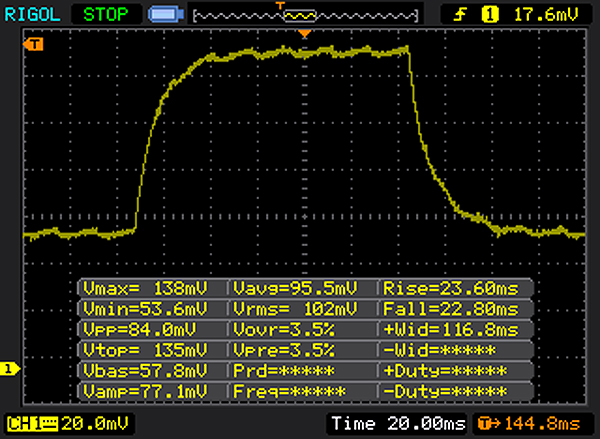 |
| ↘ 22 ms fall | ||
| The screen shows slow response rates in our tests and will be unsatisfactory for gamers. In comparison, all tested devices range from 0.165 (minimum) to 636 (maximum) ms. » 77 % of all devices are better. This means that the measured response time is worse than the average of all tested devices (31.1 ms). | ||
Screen Flickering / PWM (Pulse-Width Modulation)
| Screen flickering / PWM detected | 996 Hz | ≤ 90 % brightness setting | 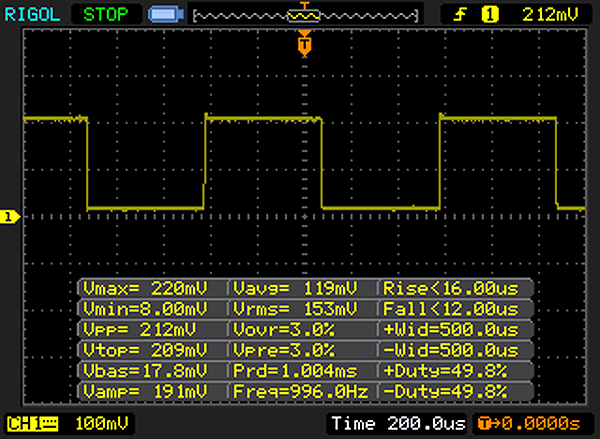 |
The display backlight flickers at 996 Hz (worst case, e.g., utilizing PWM) Flickering detected at a brightness setting of 90 % and below. There should be no flickering or PWM above this brightness setting. The frequency of 996 Hz is quite high, so most users sensitive to PWM should not notice any flickering. In comparison: 52 % of all tested devices do not use PWM to dim the display. If PWM was detected, an average of 7784 (minimum: 5 - maximum: 343500) Hz was measured. | |||
Despite the reflective display, the viewing angle stability is very good, at least indoors. Outdoors, reflections will probably interfere with the view of the contents. The image below shows the display from various viewing angles of about 45 degrees.

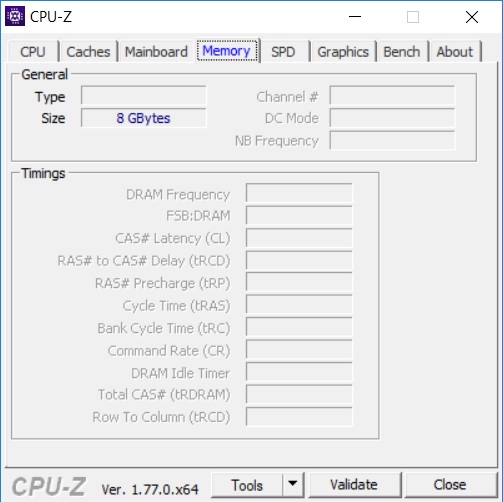
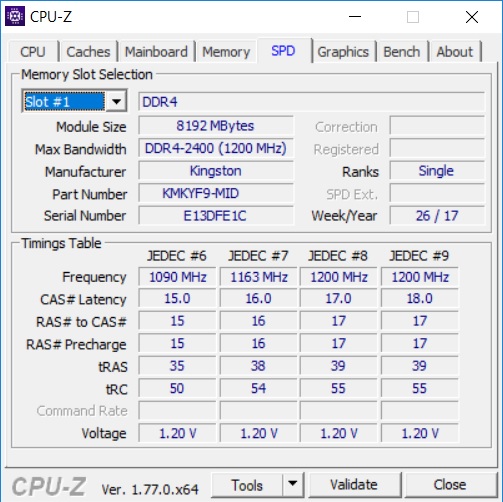
Performance
The equipment of the Inspiron 15 combines an Intel Core i7-8550U with an Nvidia GeForce 940MX, 8 GB of working memory, and a potentially fast SSD from Samsung. With these performance characteristics, the device targets mainly business and office users, graphics editors, and also video editors. However, this notebook is not really recommended to gamers since the built-in graphics are too weak.
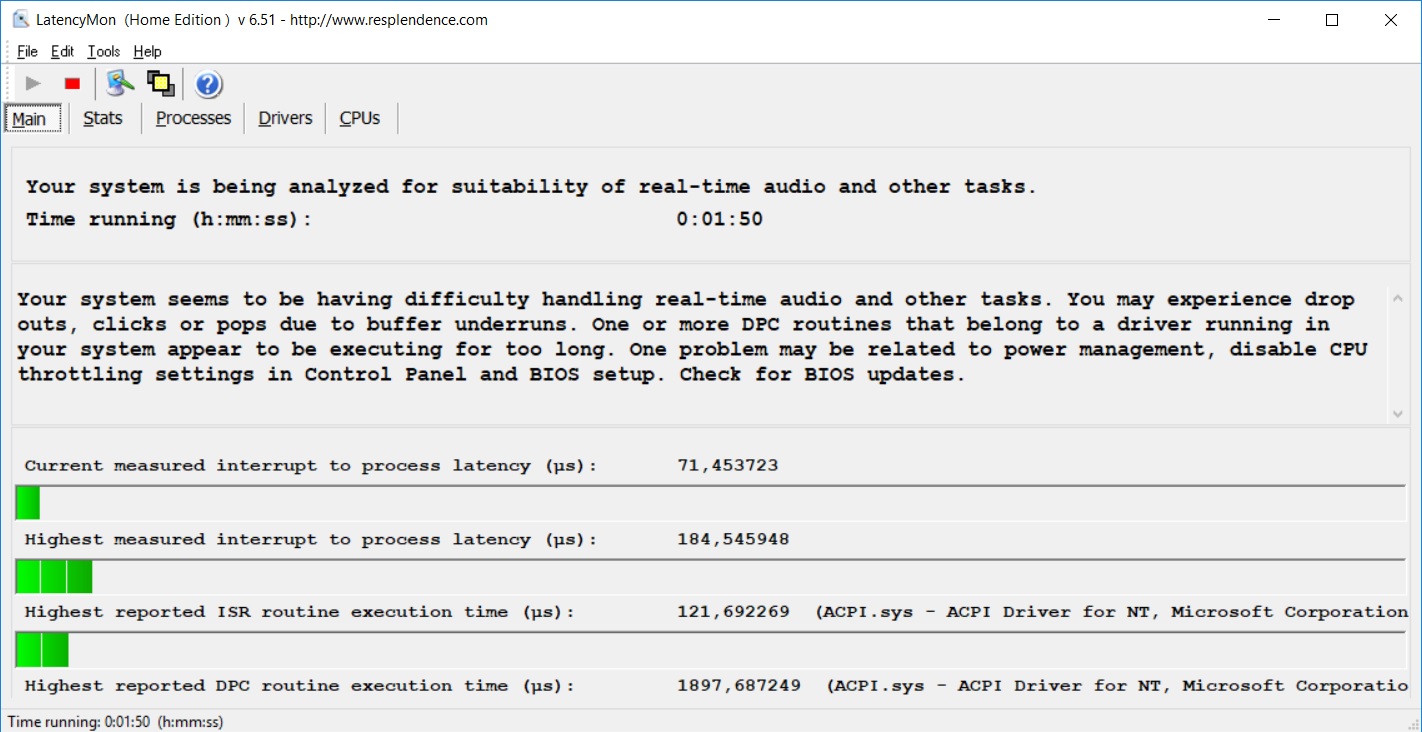
In the test, the LatencyMon tool showed latencies and the risk of drop outs while playing real-time audio and other applications. A BIOS update is recommended, the Performance power profile was selected, and throttling was not set.
Processor
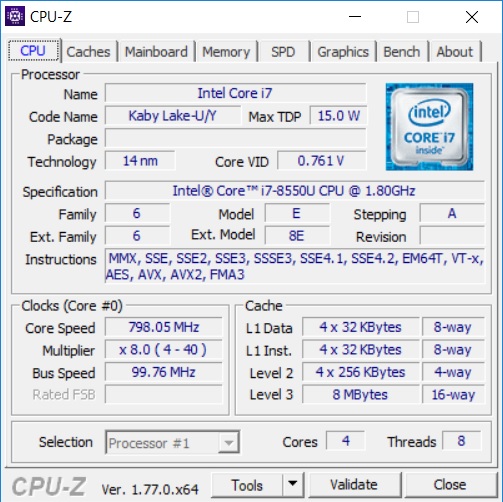
The Intel Core i7-8550U is an energy-efficient processor of the Kaby-Lake-refresh generation. The power consumption is only 15 watts. Thanks to Hyperthreading, its four cores are able to run two threads each. They have a very variable clock speed of 1.8 to 4 GHz. The decisive factor is the cooling system and notebook configuration, determining whether the CPU can use its full performance potential or it is throttled because of high temperatures.
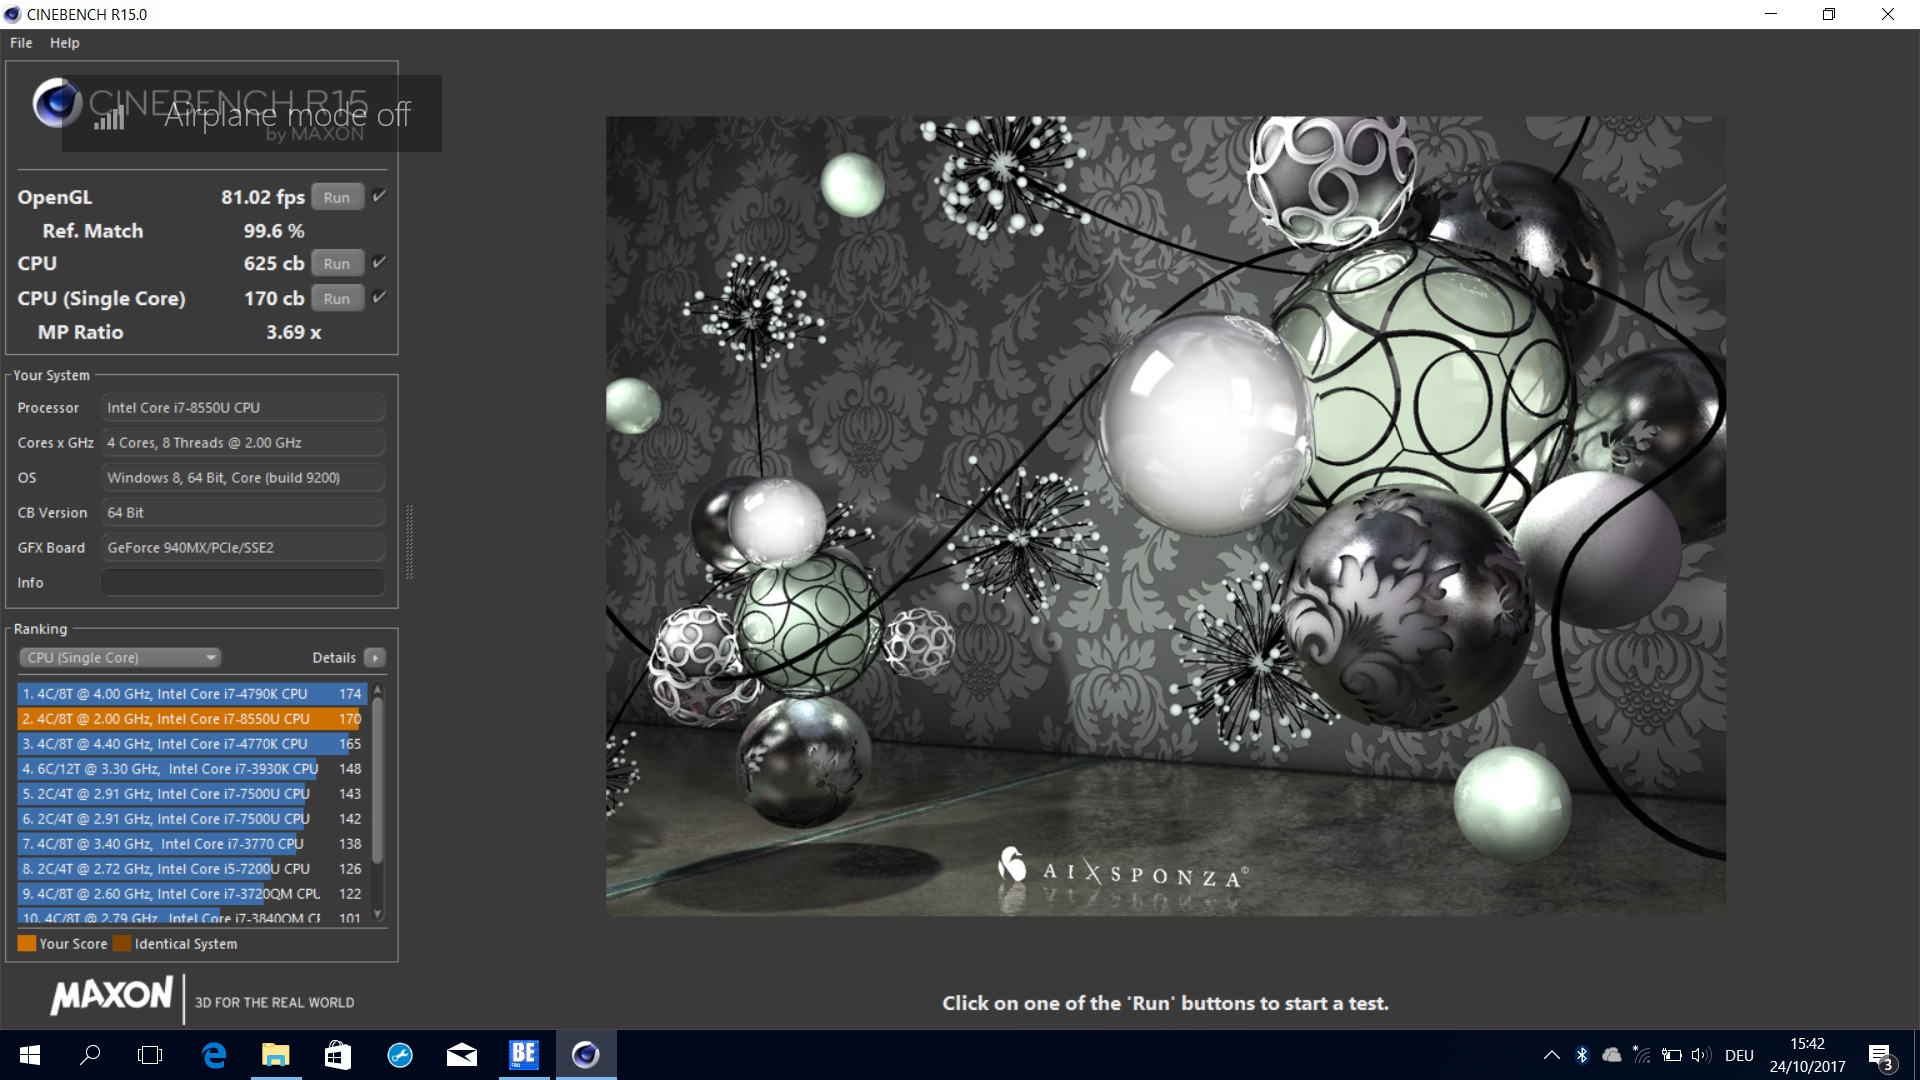
In our 30-minute Cinebench loop, the typical behavior of the ultra-efficient CPU is showing. After the first, strong run, the values decline in the second run and then level off. For a short time, the CPU can get up to 44 watts, which means that the first run is not really representative. The outliers downwards trend without an external cause is striking. Perhaps there are some specific background processes that interfere with the performance, but we do not know the real reason.
The values that the sensors report via HWiNFO are also surprising. By just starting Cinebench, the core temperature jumps from 50 - 70 °C (~122 - ~158 °F) up to 98 °C (~208 °F) for a brief time, before they lower again to 71 °C (~160 °F). Such a sudden temperature change is not very likely, so we must question the information of the sensors on the core temperature.
In battery mode, the clock speed is 3.4 to 3.5 GHz on average. Away from the outlet, these values are decent. However, they also vary. If you run only the multi-core test, they barely average out at 2.4 GHz. In this way, the notebook achieves a value of about 526 points from the second run on. Compared to the 565 points when plugged in, this is only a slight throttling of about 7%.
The performance comparison to the other notebooks is a bit difficult here, since they are using the weaker Core i7-7500U predecessor CPU, and the Asus has just an i7-7200U. The predecessor series has only two real computing cores and can therefore only operate on half the amount of threads. Accordingly, it is not very surprising that the Inspiron 15 7570 comes out on top in the Cinebench tests. The differences are relatively constant across all Cinebench versions: in the single-core test our test unit mostly leads by 12% at least, and in the multi-core test it is even ahead of the rest of the devices by at least 40%.
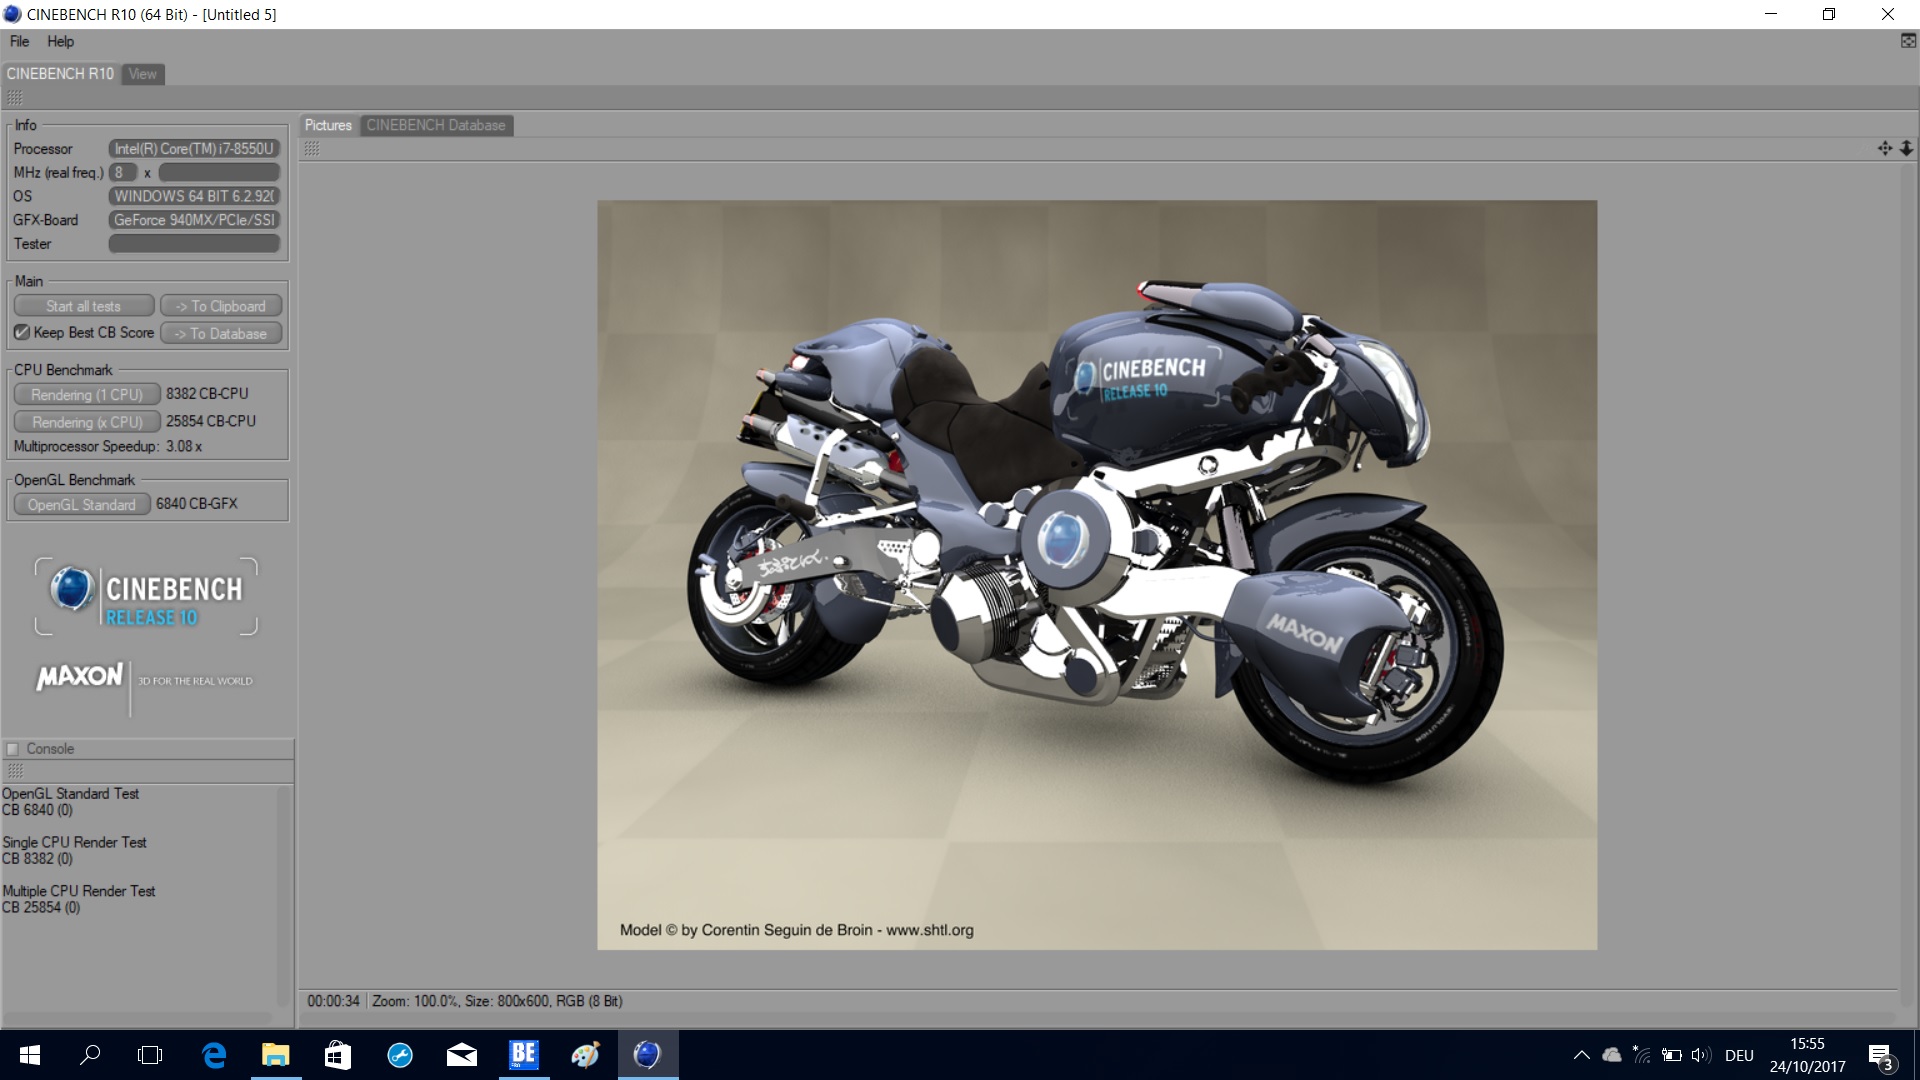
For a better comparison of the processor, we also use the Acer Aspire 5 A517-51G and the Acer Swift 3, which have the same CPU as the Inspiron 15, but a different graphics card, and their sizes are also different (17-inch and 14-inch). Apparently the relatively new CPU has not been used much in 15-inch notebooks of the same price range until now. In the comparison, the three devices produce very similar results, so the CPU-performance of the Inspiron 15 lies within the expected range. You can find more information and benchmark results in our database on the i7-8550U.
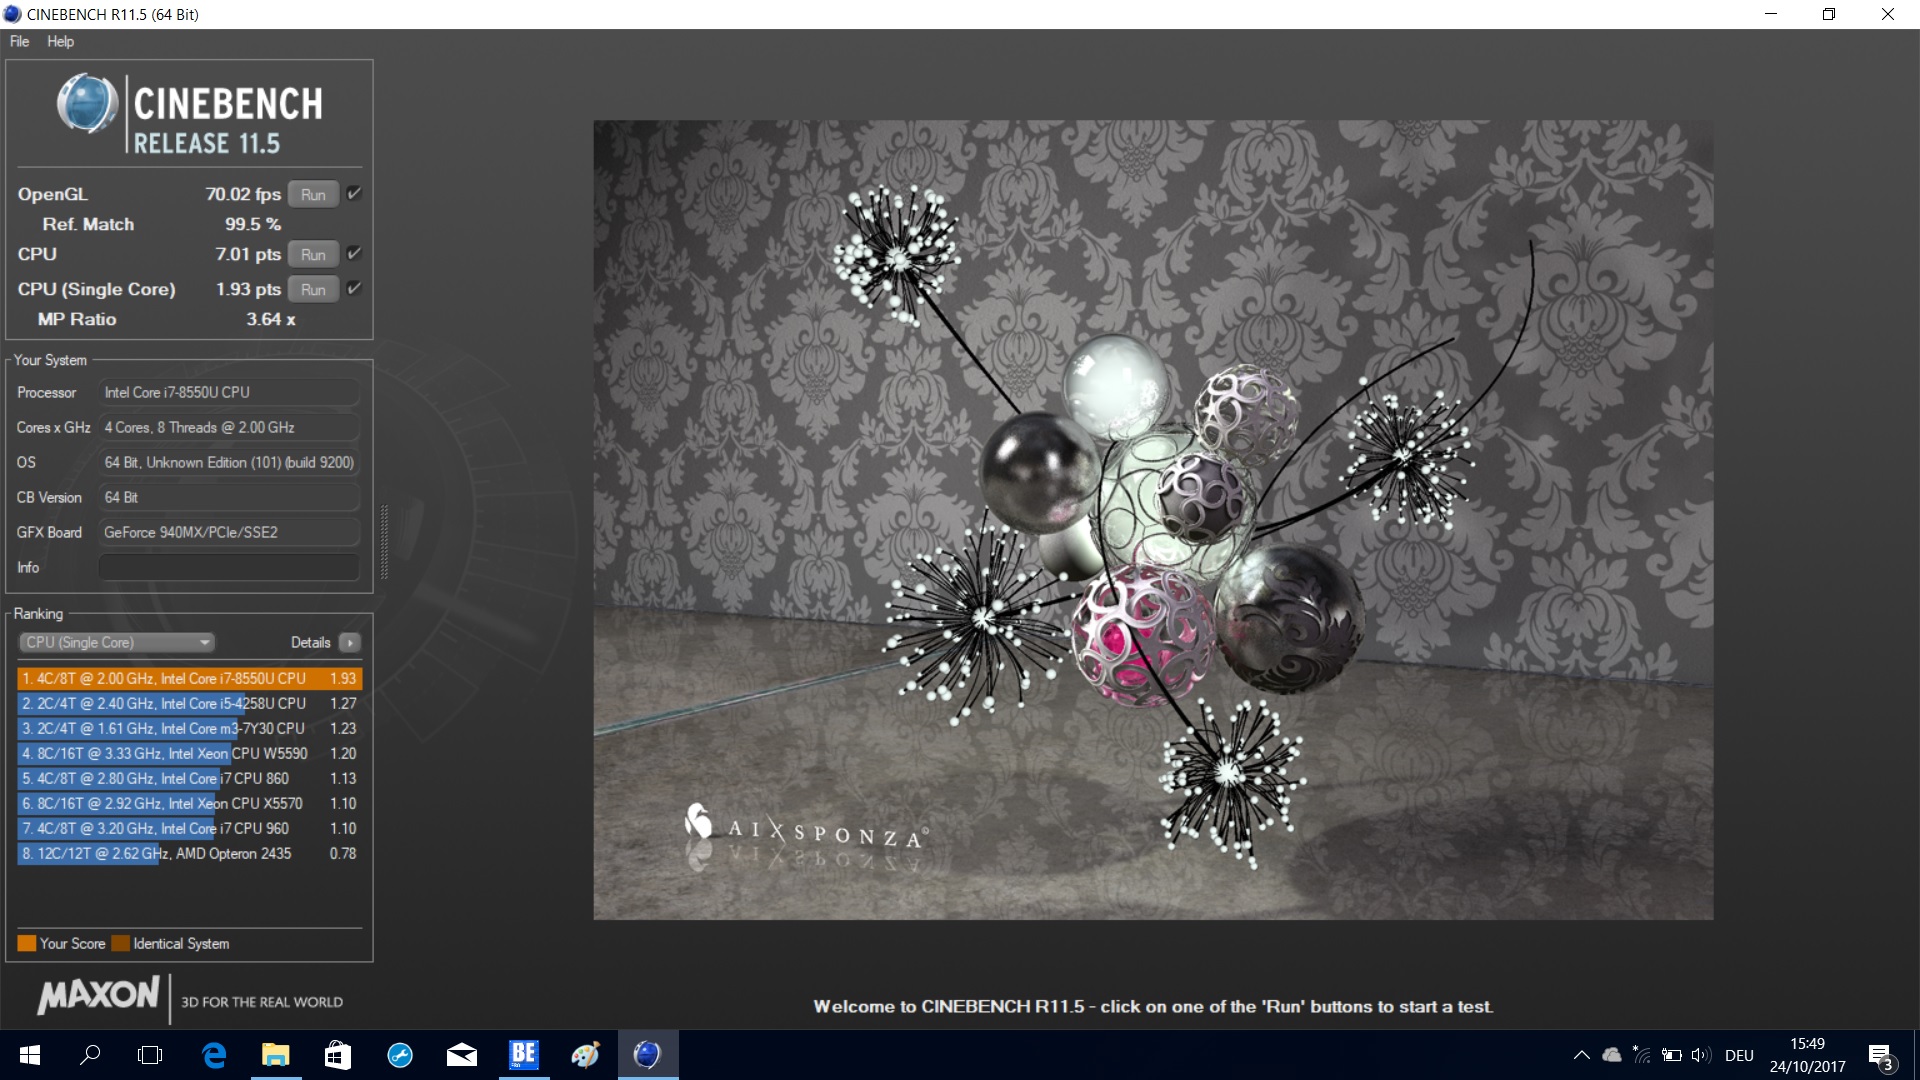
| Cinebench R11.5 | |
| CPU Single 64Bit | |
| Acer Aspire 5 A517-51G-80L | |
| Dell Inspiron 15 7570 | |
| Huawei MateBook D 15, i7-7500U 940MX | |
| CPU Multi 64Bit | |
| Dell Inspiron 15 7570 | |
| Acer Aspire 5 A517-51G-80L | |
| Huawei MateBook D 15, i7-7500U 940MX | |
| Cinebench R10 | |
| Rendering Single CPUs 64Bit | |
| Acer Aspire 5 A517-51G-80L | |
| Dell Inspiron 15 7570 | |
| Rendering Multiple CPUs 64Bit | |
| Dell Inspiron 15 7570 | |
| Acer Aspire 5 A517-51G-80L | |
System Performance
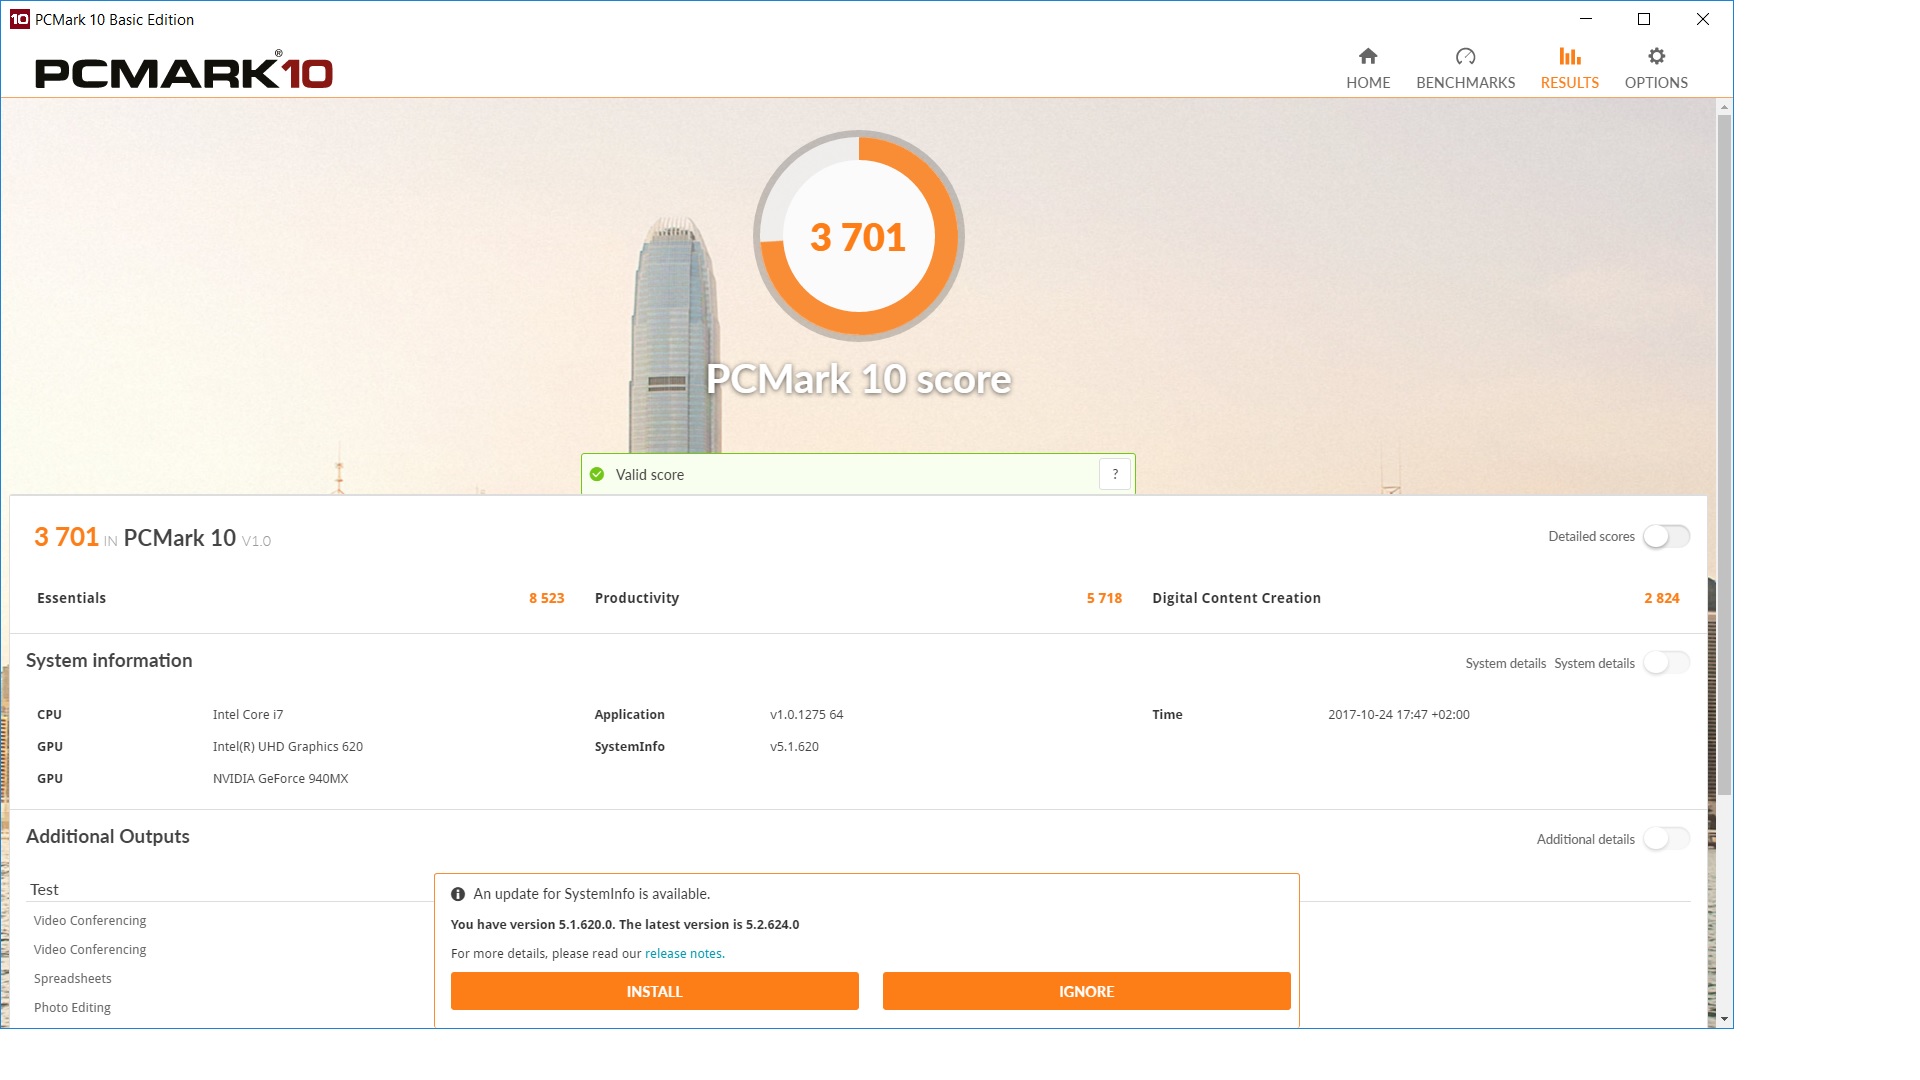
In order to evaluate the system performance via PCMark 8, we are using the two additional Acer models with the same CPU for comparison. To avoid the comparison becoming too large, we are leaving out the Acer TravelMate and the Dell sibling model. The results show that the three devices with the better CPU cannot really break away from the rest of the field. Only the Asus is always 8 to 10% behind the rest. Despite having only two cores, the Huawei is able to keep up well against the Inspiron 15 and is almost at the same level. The Acer Swift 3 and the Aspire 5 are almost 4 to 5% ahead of the Inspiron. However, in practice the slight advantage should not be very noticeable.
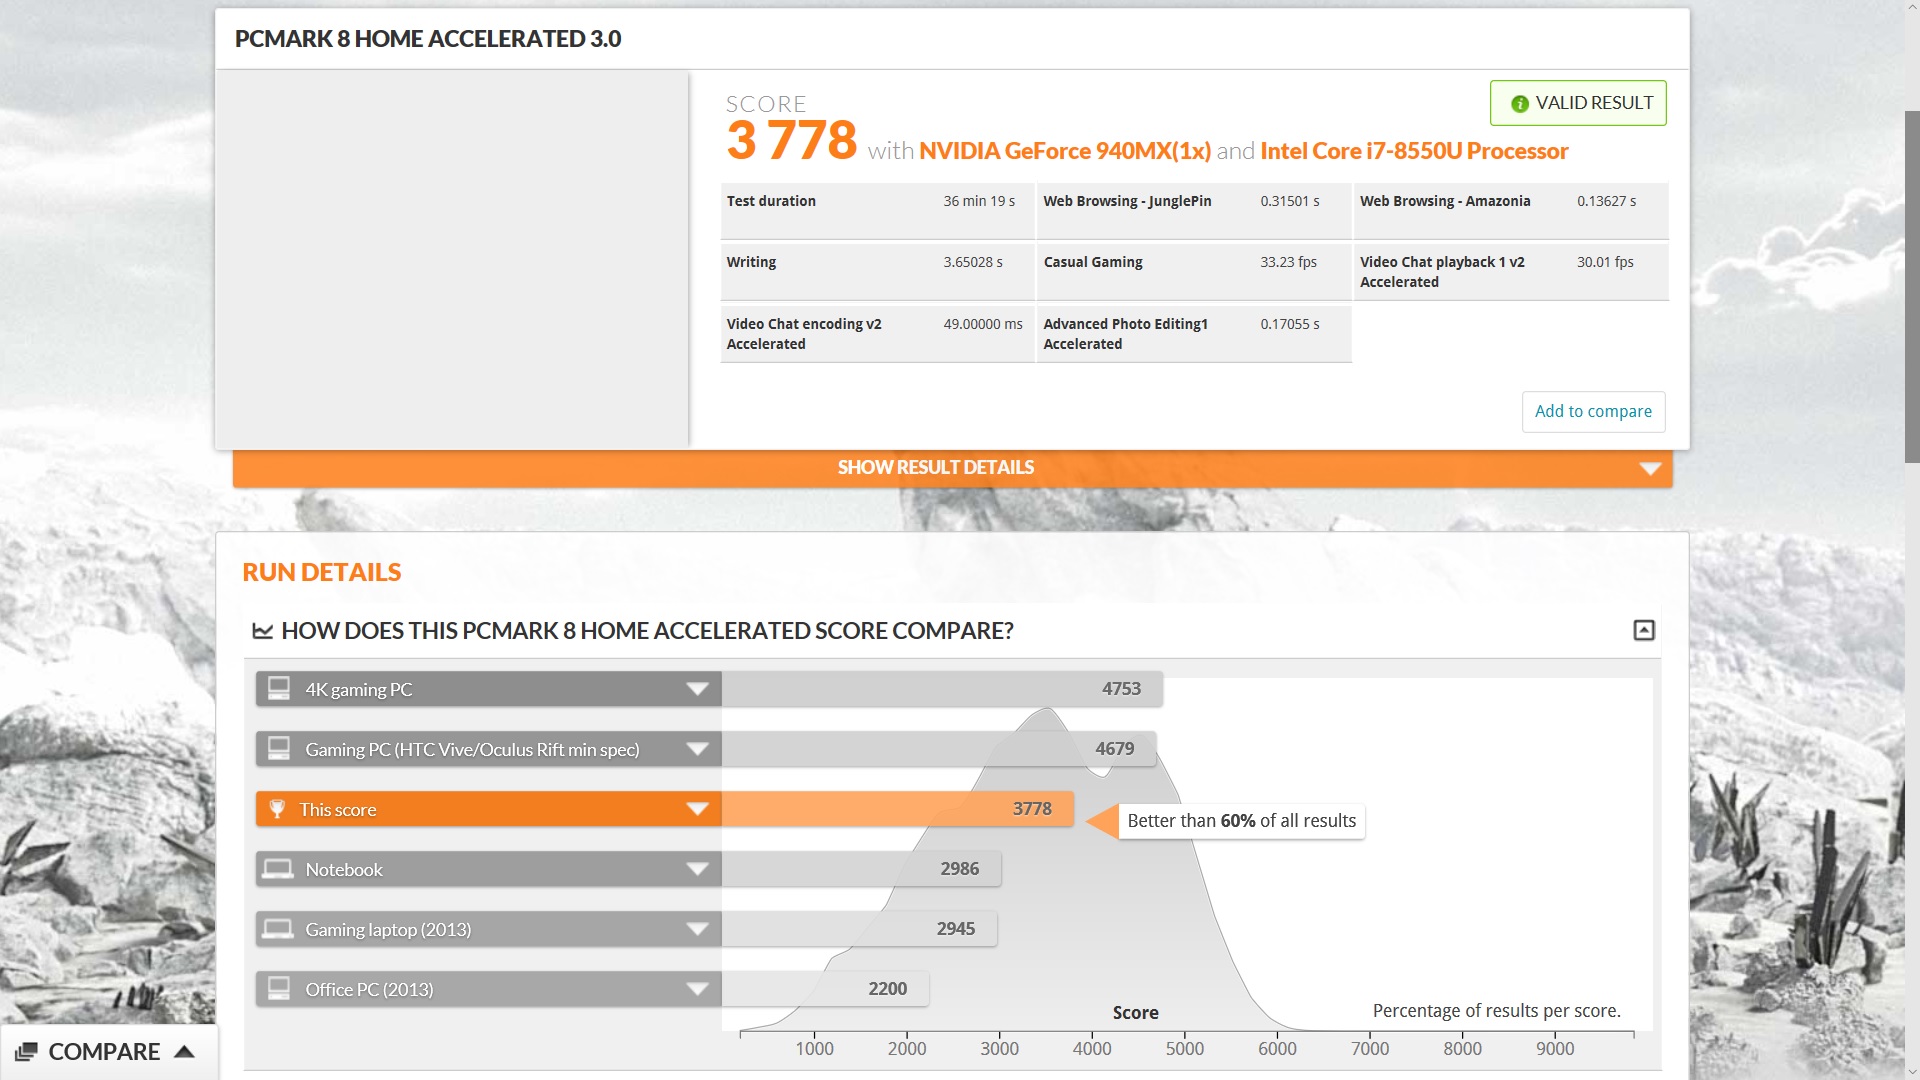
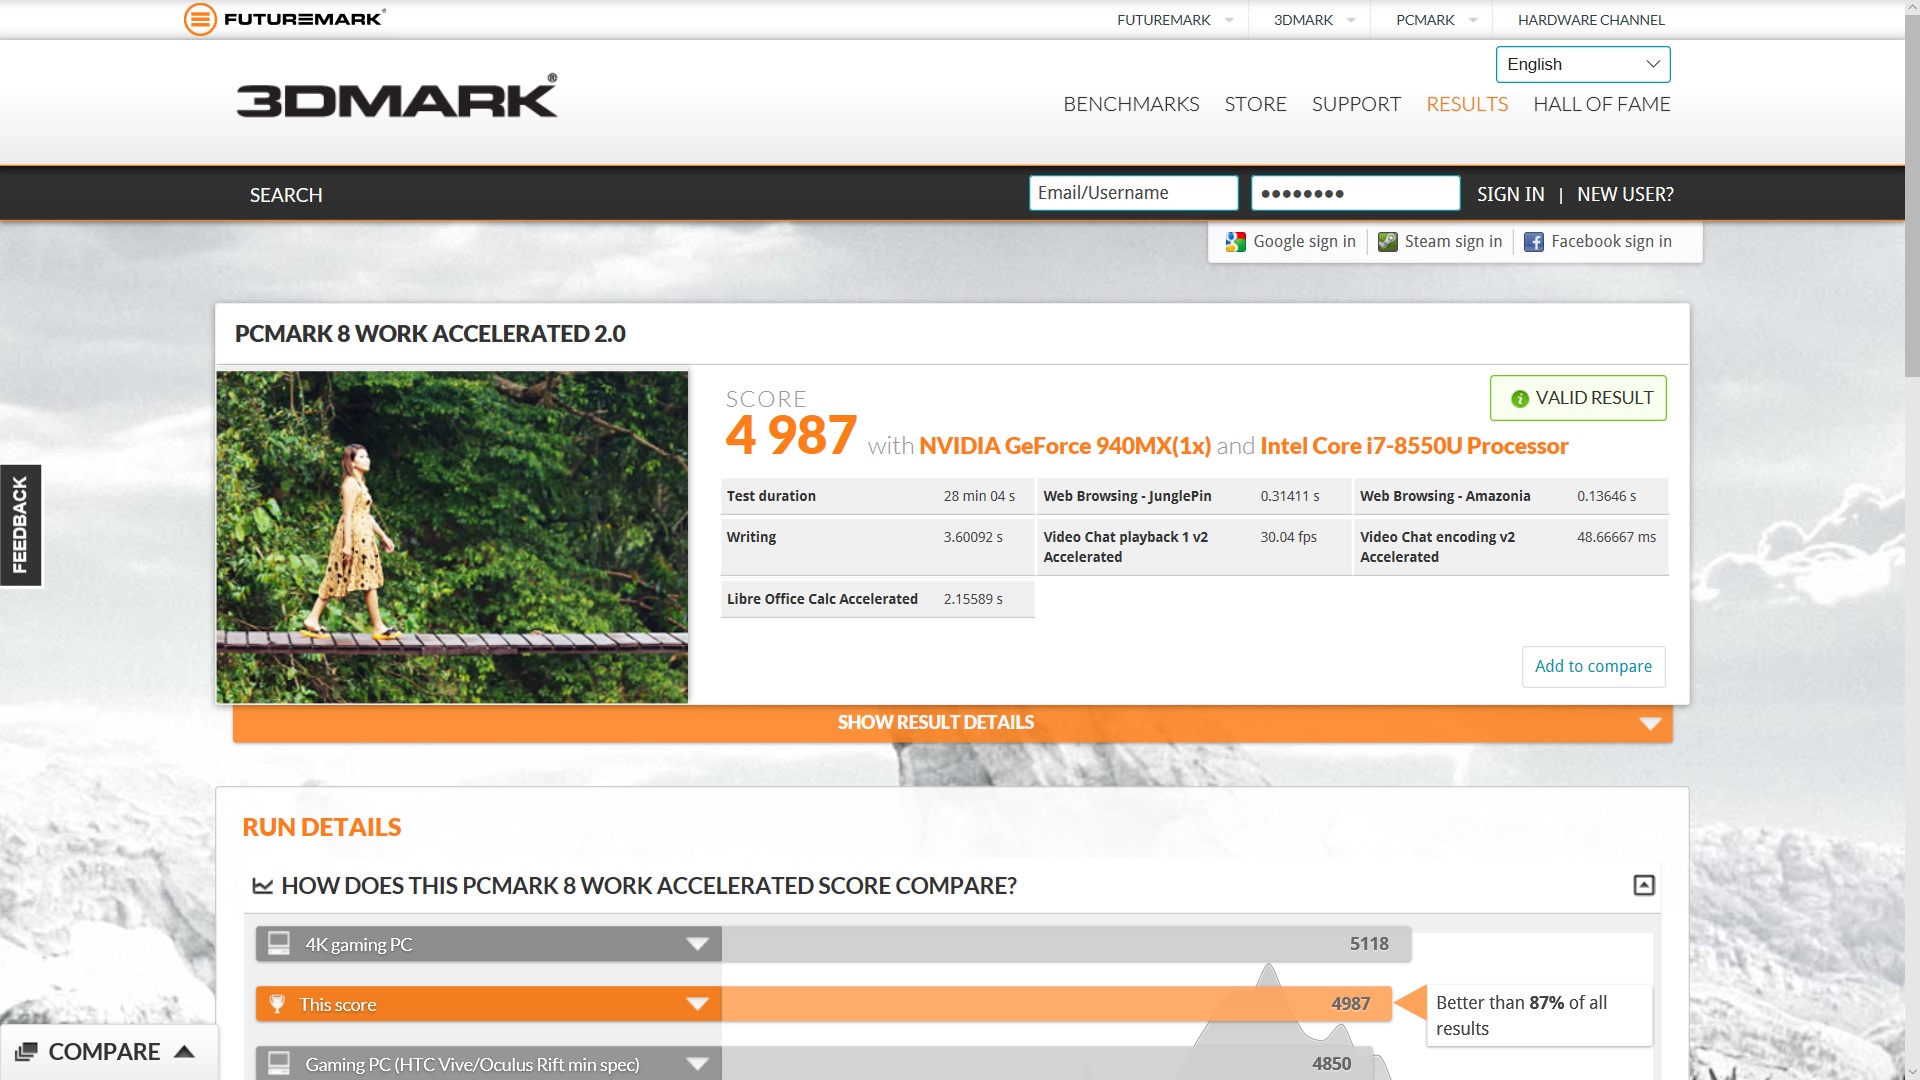
| PCMark 8 Home Score Accelerated v2 | 3778 points | |
| PCMark 8 Work Score Accelerated v2 | 4987 points | |
| PCMark 10 Score | 3701 points | |
Help | ||
Storage Solution
A 512 GB Samsung PM961 SSD is used as the main storage. In our benchmark list, this model is one of the fastest SSDs ever, leading our list. Our measurements confirm the good performance of the NVMe disk; it is by far the best storage medium in the direct comparison with the competitors. So it is even more surprising that the Inspiron 15 was unable to gain more of an advantage in the system performance via PCMark. Perhaps the very variable clock speed of the CPU is responsible, since it can only rarely use its full potential (see Cinebench loop above).
| Dell Inspiron 15 7570 Samsung PM961 NVMe MZVLW512HMJP | Asus Vivobook S15 S510UQ-BQ189T Toshiba SG5 THNSNK128GVN8 | Acer TravelMate P658-G2-MG-7327 Liteonit CV3-8D512 | Lenovo IdeaPad 510-15IKB 80SV0087GE Liteonit CV3-DE256 | Huawei MateBook D 15, i7-7500U 940MX SanDisk SD8SN8U128G1027 | Dell Inspiron 15 5000 5567-1753 SanDisk X400 SED 256GB, SATA (SD8TB8U-256G) | |
|---|---|---|---|---|---|---|
| CrystalDiskMark 3.0 | -66% | -58% | -54% | -56% | -55% | |
| Read Seq (MB/s) | 2013 | 437.6 -78% | 526 -74% | 469.2 -77% | 478.4 -76% | 502 -75% |
| Write Seq (MB/s) | 1015 | 138.6 -86% | 256.9 -75% | 431.5 -57% | 314.9 -69% | 458.1 -55% |
| Read 512 (MB/s) | 1076 | 368.6 -66% | 227.1 -79% | 338.3 -69% | 331.2 -69% | 382.8 -64% |
| Write 512 (MB/s) | 1038 | 138.2 -87% | 246.3 -76% | 297.9 -71% | 181.4 -83% | 385.7 -63% |
| Read 4k (MB/s) | 52.1 | 16.05 -69% | 25.74 -51% | 28.68 -45% | 36.84 -29% | 29.25 -44% |
| Write 4k (MB/s) | 135 | 86.2 -36% | 68.8 -49% | 66.8 -51% | 82.7 -39% | 55.9 -59% |
| Read 4k QD32 (MB/s) | 404.2 | 279.1 -31% | 354.8 -12% | 364.7 -10% | 368.5 -9% | 285.2 -29% |
| Write 4k QD32 (MB/s) | 510 | 121.8 -76% | 248.8 -51% | 245.9 -52% | 123.2 -76% | 239.6 -53% |

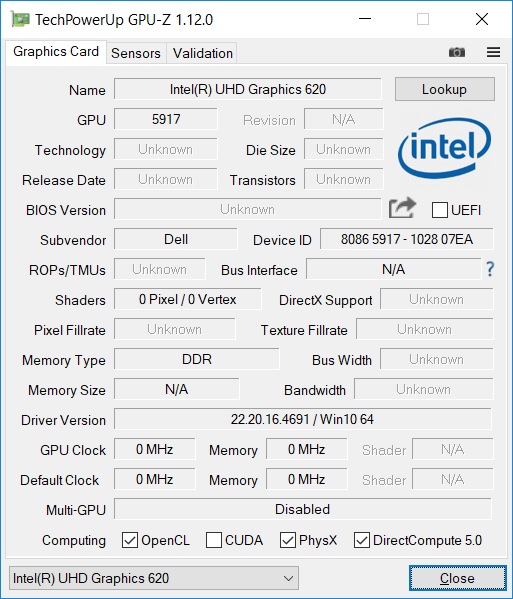
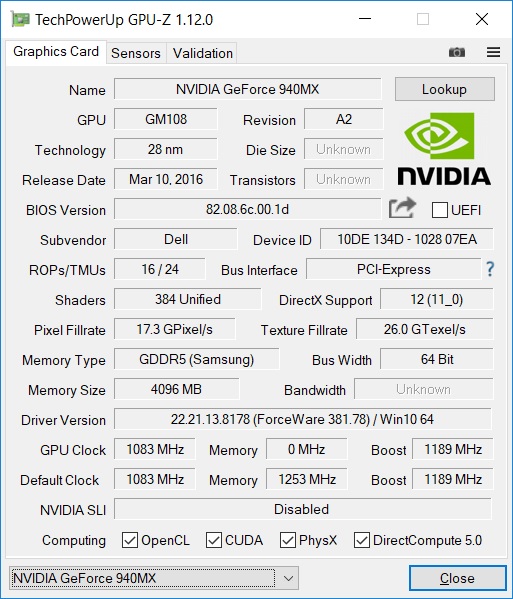
Graphics Card
The built-in graphics card is an Nvidia GeForce 940MX. There are at least two versions of this, and fortunately Dell is using the faster variant with GDDR5 storage (4 GB). This leads to the card having about a 25% advantage to the version with GDDR3 storage. But there are also two different versions of the model with GDDR5 storage. Whereas this is a model with 384 shaders, there is also supposed to be a version with 512 shaders, which has a slightly slower clock speed instead. You can find additional information on this on our special page for the model.
It will probably display the current games smoothly only in low to medium details at resolutions of around 1366x768. Thus the Inspiron 15 is suitable for the occasional gamer at most, but the real usage area is rather in the office or to edit photos and videos.
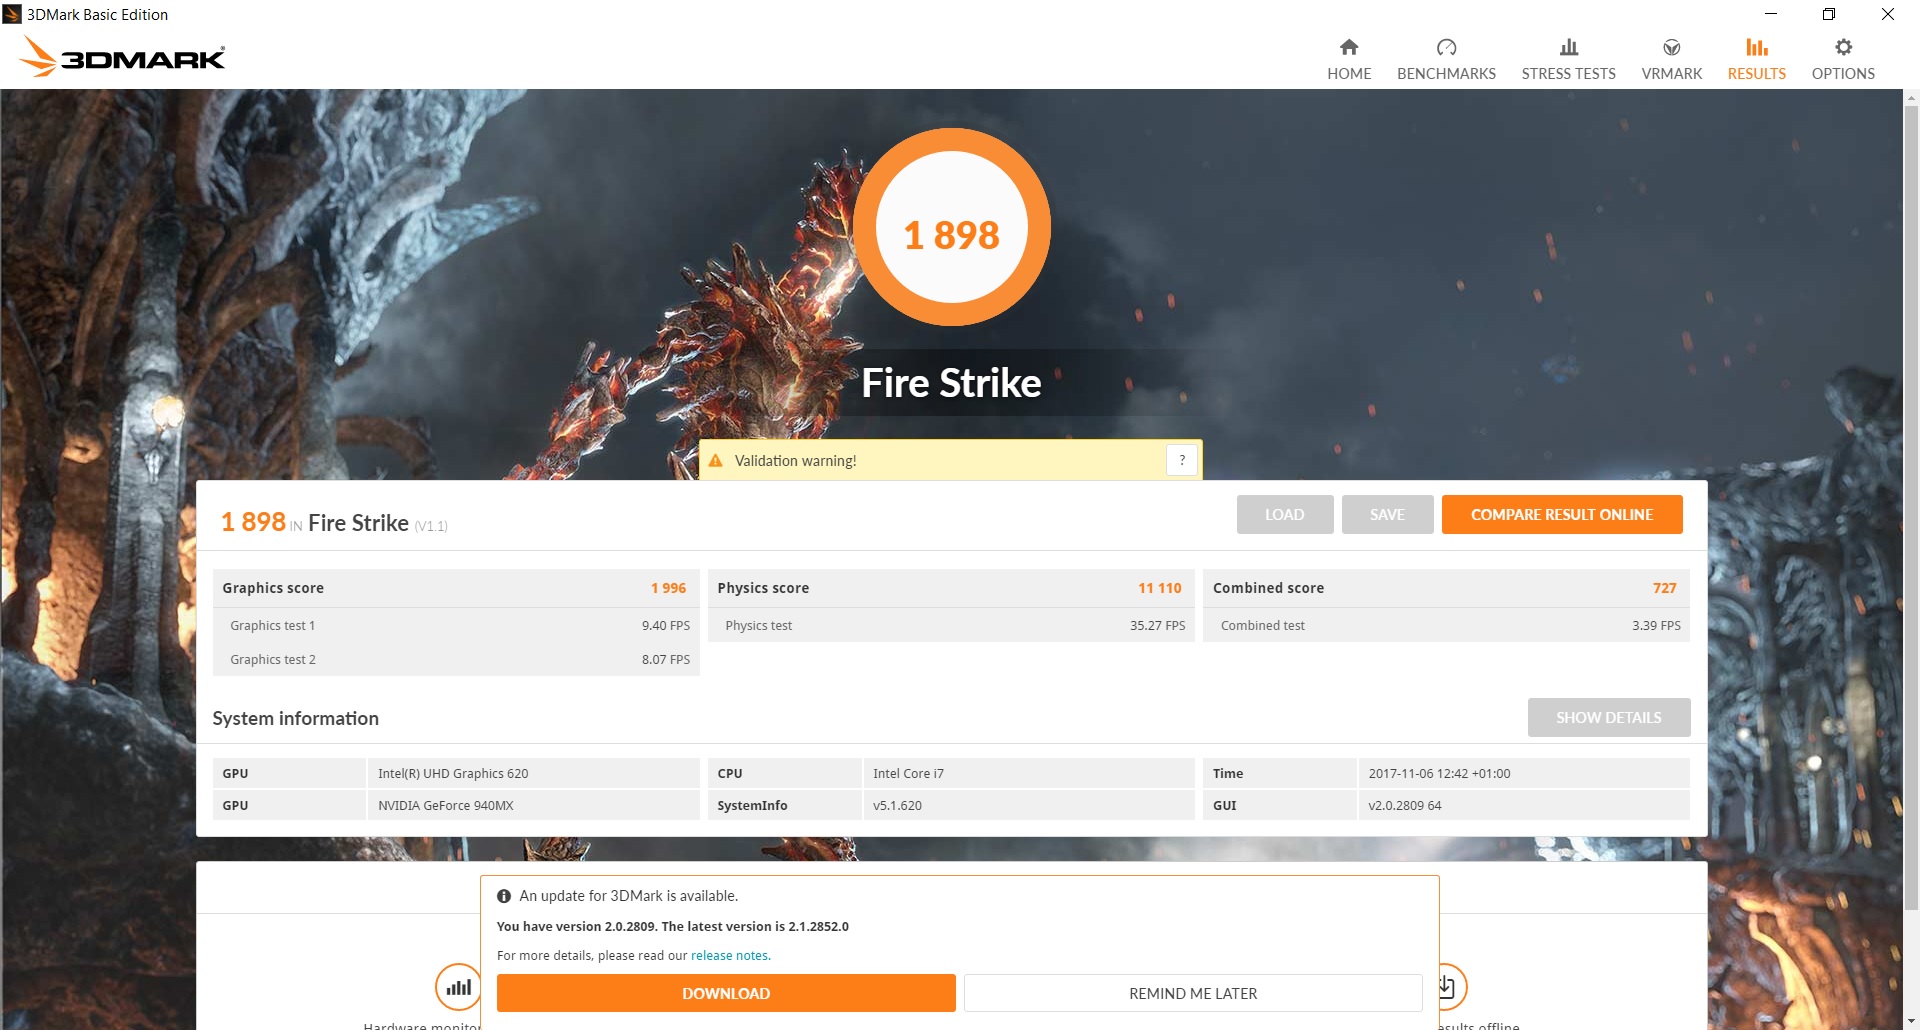
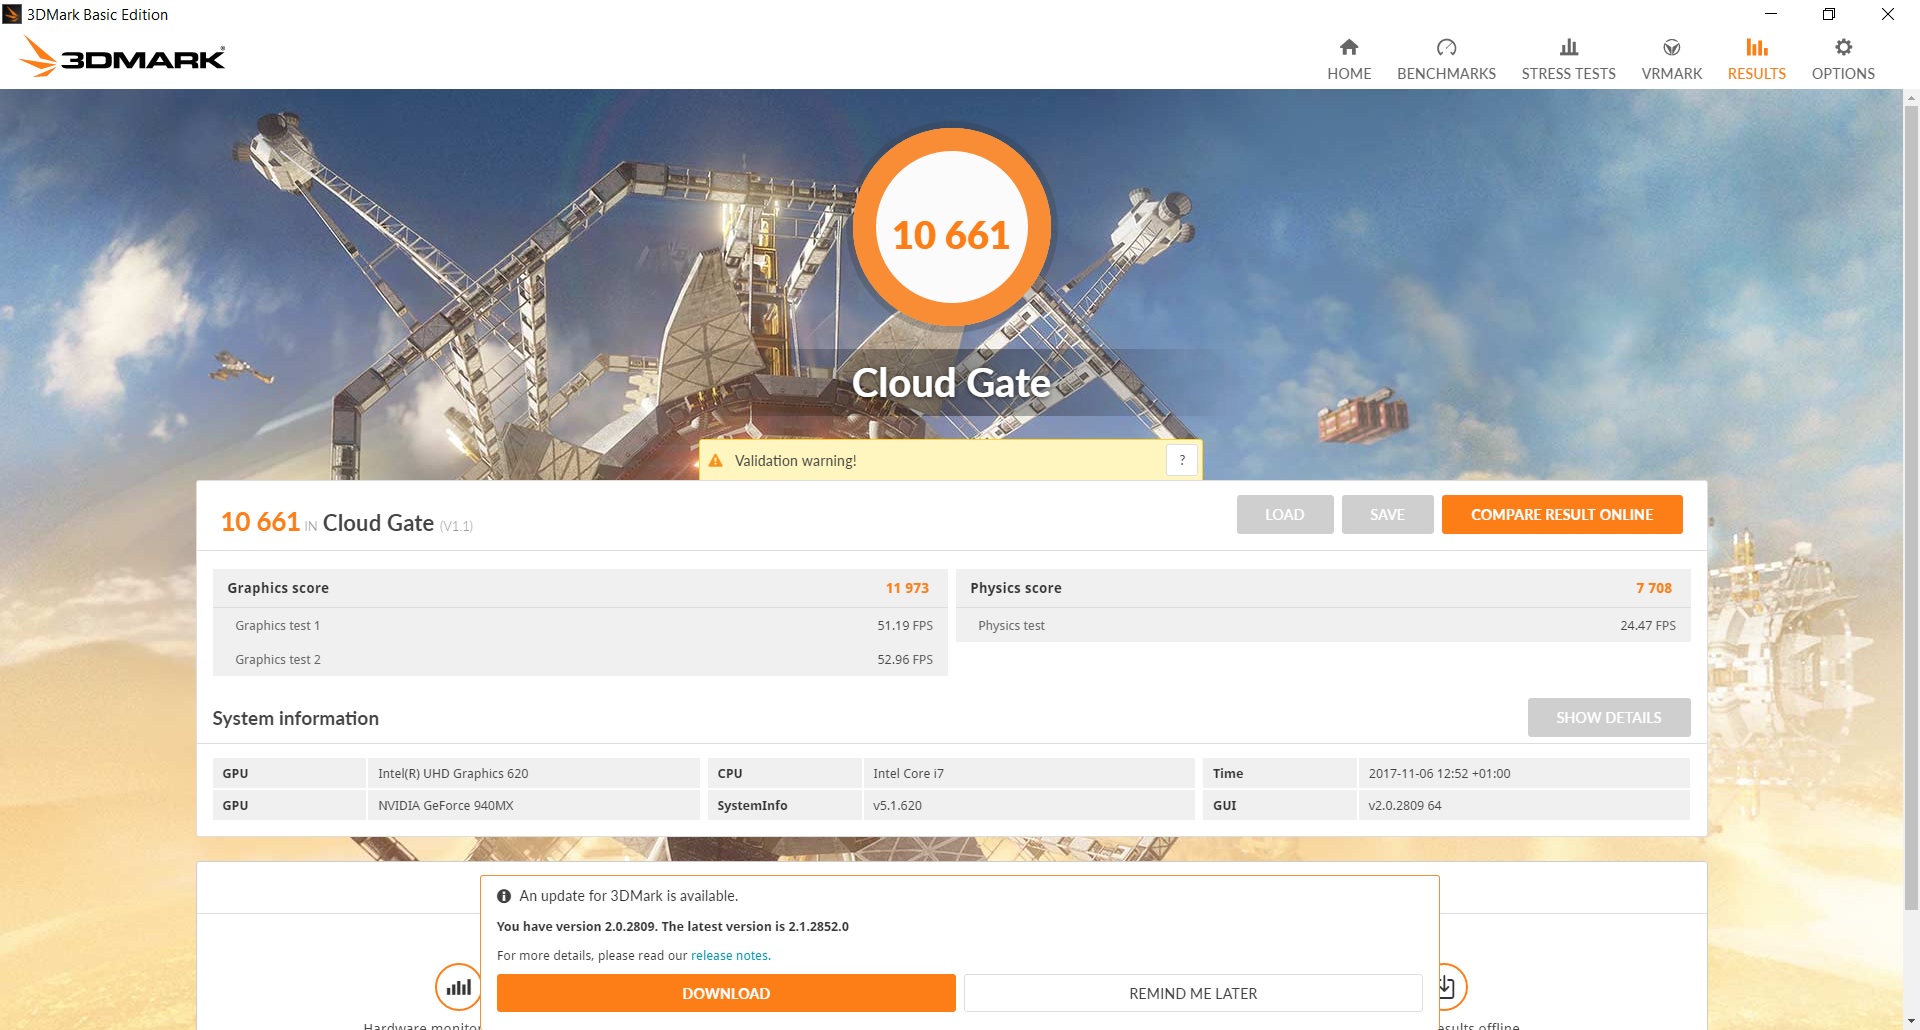
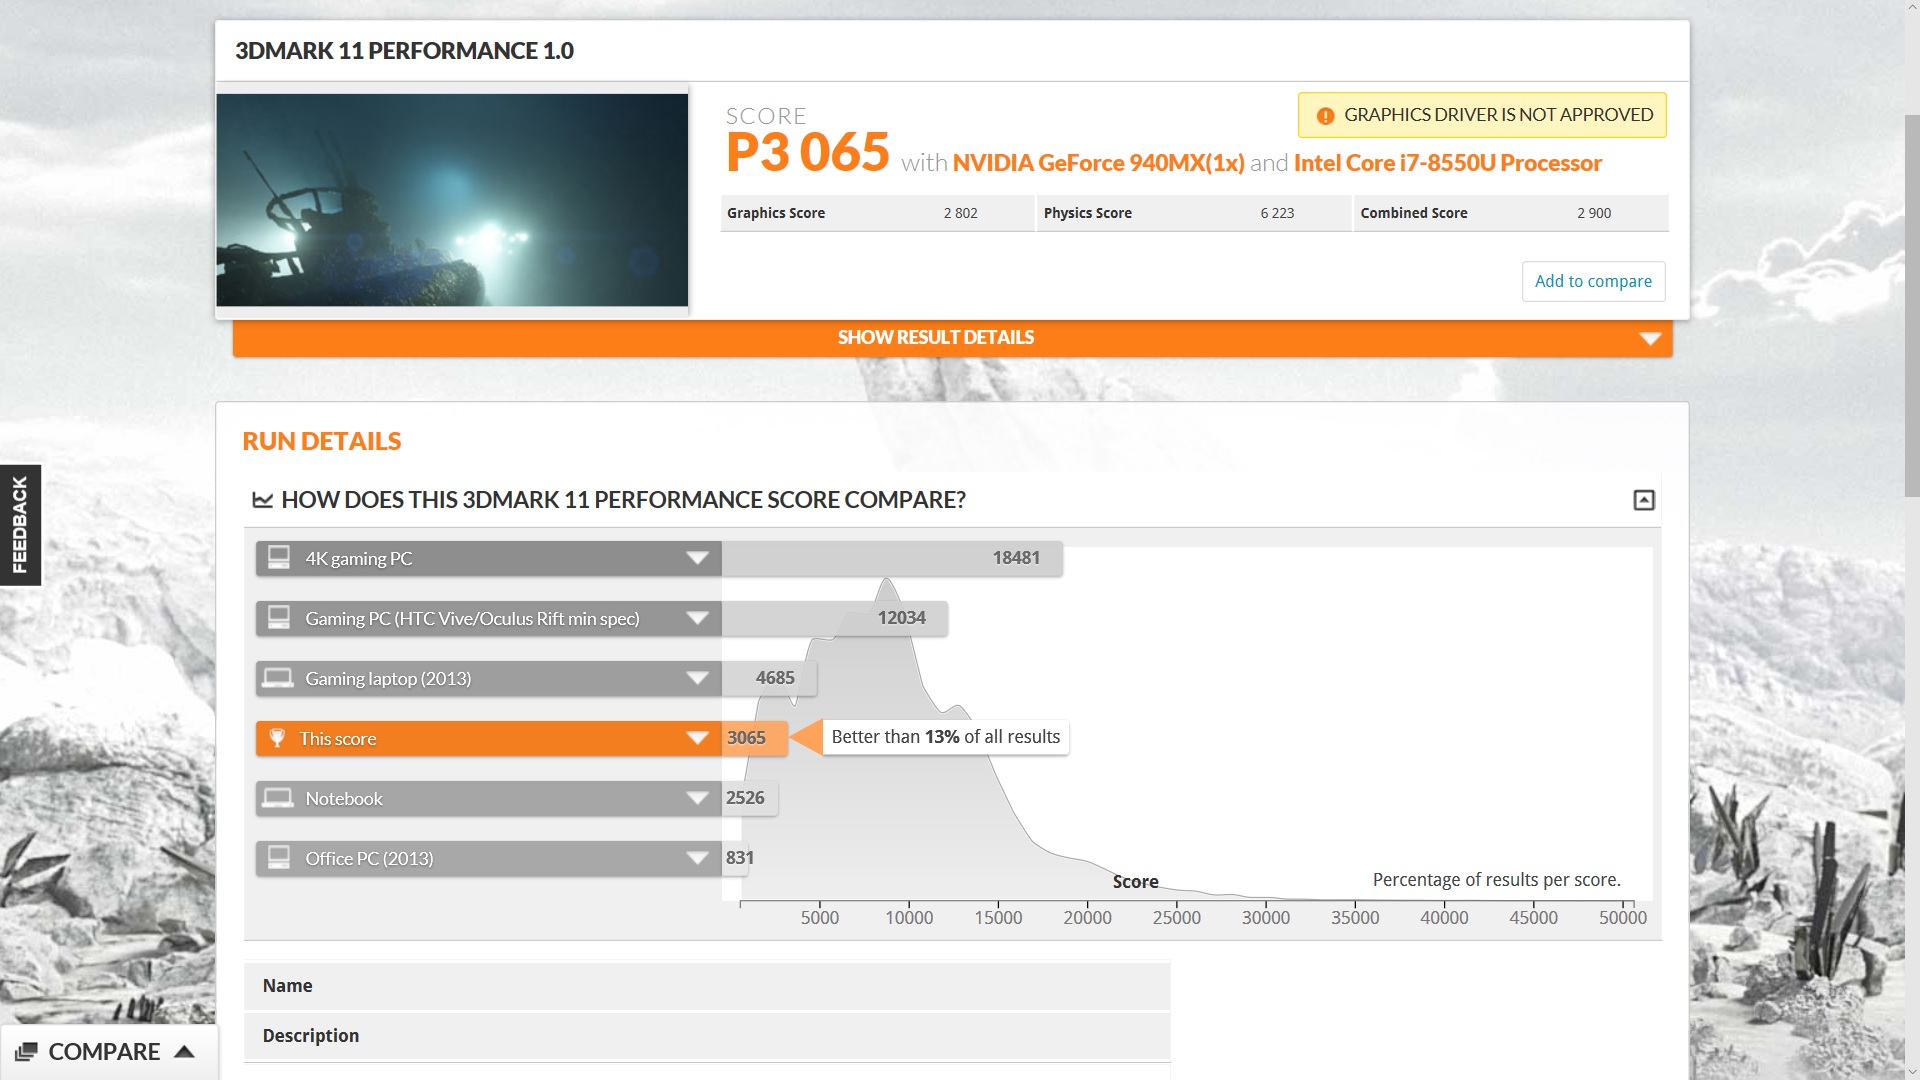
The Huawei is on top in all three 3DMark tests. While the Huawei also has a 940MX GPU with GDDR5 storage, the Mate model has only 2 GB of video storage. The shader amount should also be similar, so the advantage of 10% (Cloud Gate) and 29 % (Fire Strike) is surprising. At least in 3DMark 11, the Inspiron can achieve second place behind the Huawei. In Fire Strike it is only enough for third place, since even the Asus is 9% faster here. Apparently, even during regular operation the graphics of the Inspiron are throttled slightly.
In battery operation, the Fire Strike benchmark does not run during our first attempt, but at the second attempt it works. The result is not much different from that in mains operation, so there is no throttling.
| 3DMark | |
| 1280x720 Cloud Gate Standard Graphics | |
| Huawei MateBook D 15, i7-7500U 940MX | |
| Asus Vivobook S15 S510UQ-BQ189T | |
| Dell Inspiron 15 7570 | |
| Dell Inspiron 15 5000 5567-1753 | |
| 1920x1080 Fire Strike Graphics | |
| Huawei MateBook D 15, i7-7500U 940MX | |
| Asus Vivobook S15 S510UQ-BQ189T | |
| Dell Inspiron 15 7570 | |
| Dell Inspiron 15 5000 5567-1753 | |
| 3DMark 11 Performance | 3065 points | |
| 3DMark Cloud Gate Standard Score | 10661 points | |
| 3DMark Fire Strike Score | 1898 points | |
Help | ||
Gaming Performance
As already mentioned, the 940MX is not suitable for serious gaming. While it offers slightly more performance than the integrated graphics unit, and both can be switched via Nvidia Optimus, the current games are not very enjoyable in minimum detail. You can see in the benchmark results that the graphic performance is quite reduced, since the competing models with the same card achieve higher frame rates.
For example, even in the lowest resolution and the lowest details, it cannot really display "The Witcher 3" smoothly. The Inspiron 15 7570 achieves 26 FPS on average in these settings. Anything more than that is not playable anyway. Normally notebooks with the 940MX reach about 35 FPS here, so the performance is throttled.
At least you can play "Rise of the Tomb Raider" smoothly in the minimum settings, but is there anyone who wants to do this? Even in medium settings, Lara moves only at a snail's pace.
Even at its lowest settings, "Doom" became a benchmark torture for the tester. About 14 FPS in the minimum configuration is not comfortable to test, but the device is not really a gaming but rather a business model. Normally "Doom" is less demanding than "The Witcher 3." Since notebooks with the 940MX normally achieve about 39 FPS and "Doom" is our last game of the test series, we definitely saw additional throttling over time here.
The general throttling of the graphics performance and the additional throttling over time have a negative effect on the comparison with the competitors. Most of the time, the Inspiron 15 can be found in one of the last places, and the Huawei and the Asus mostly fare much better. But the results in the other models are also quite variable, depending on the resolution and details.
Finally, we have to negate the gaming suitability of the Inspiron 15 7570. While it might still be enough for a game of "Rocket League" or one of the older "FIFA" games in much reduced settings, the device does not have sufficient power for the current, demanding games. But this is Dell's fault, since the graphics card should at least do a little better and enable playing games in the lowest settings. However, the performance is throttled considerably at times.
| The Witcher 3 | |
| 1024x768 Low Graphics & Postprocessing | |
| Asus Vivobook S15 S510UQ-BQ189T | |
| Huawei MateBook D 15, i7-7500U 940MX | |
| Dell Inspiron 15 5000 5567-1753 | |
| Dell Inspiron 15 7570 | |
| 1366x768 Medium Graphics & Postprocessing | |
| Asus Vivobook S15 S510UQ-BQ189T | |
| Huawei MateBook D 15, i7-7500U 940MX | |
| Dell Inspiron 15 7570 | |
| Dell Inspiron 15 5000 5567-1753 | |
| 1920x1080 High Graphics & Postprocessing (Nvidia HairWorks Off) | |
| Huawei MateBook D 15, i7-7500U 940MX | |
| Dell Inspiron 15 7570 | |
| Dell Inspiron 15 5000 5567-1753 | |
| 1920x1080 Ultra Graphics & Postprocessing (HBAO+) | |
| Dell Inspiron 15 7570 | |
| Huawei MateBook D 15, i7-7500U 940MX | |
| Dell Inspiron 15 5000 5567-1753 | |
| Rise of the Tomb Raider | |
| 1024x768 Lowest Preset | |
| Asus Vivobook S15 S510UQ-BQ189T | |
| Dell Inspiron 15 7570 | |
| Dell Inspiron 15 5000 5567-1753 | |
| Huawei MateBook D 15, i7-7500U 940MX | |
| 1366x768 Medium Preset AF:2x | |
| Asus Vivobook S15 S510UQ-BQ189T | |
| Huawei MateBook D 15, i7-7500U 940MX | |
| Dell Inspiron 15 5000 5567-1753 | |
| Dell Inspiron 15 7570 | |
| 1920x1080 High Preset AA:FX AF:4x | |
| Huawei MateBook D 15, i7-7500U 940MX | |
| Dell Inspiron 15 7570 | |
| Dell Inspiron 15 5000 5567-1753 | |
| 1920x1080 Very High Preset AA:FX AF:16x | |
| Huawei MateBook D 15, i7-7500U 940MX | |
| Dell Inspiron 15 7570 | |
| Dell Inspiron 15 5000 5567-1753 | |
| Doom | |
| 1280x720 Low Preset | |
| Dell Inspiron 15 5000 5567-1753 | |
| Dell Inspiron 15 7570 | |
| 1366x768 Medium Preset | |
| Dell Inspiron 15 5000 5567-1753 | |
| Dell Inspiron 15 7570 | |
| 1920x1080 High Preset AA:FX | |
| Dell Inspiron 15 5000 5567-1753 | |
| Dell Inspiron 15 7570 | |
| low | med. | high | ultra | |
|---|---|---|---|---|
| The Witcher 3 (2015) | 26.34 | 22.22 | 10.64 | 7.12 |
| Rise of the Tomb Raider (2016) | 35.9 | 13.39 | 10.39 | 8.55 |
| Doom (2016) | 13.78 | 11.32 | 6.76 |
Emissions
Noise Emissions
According to the measurements, the noise development of the Dell Inspiron 7570 is quite decent, particularly during idle. In parts, the fans are completely deactivated when there is no load, and the device is silent. But the rest of the competitors also produce around 30 dB(A) during idle, and only the Lenovo is louder here. However, from time to time the fans also start during idle, revving up to be quite loud for a short moment, before they go back to being quieter. The revving occurs without any discernible change in the load.
Unfortunately, under load, the test unit cannot quite keep up with most of the rivals in the comparison anymore and becomes quite loud at around 43 dB(A). The Asus is similarly loud, but the rest of the competitors remain mostly around 38 dB(A). At about 42 dB(A), the sibling model is just slightly quieter. Unfortunately, the fans also emit a high-frequency noise during operation.
| Dell Inspiron 15 7570 GeForce 940MX, i5-8550U, Samsung PM961 NVMe MZVLW512HMJP | Asus Vivobook S15 S510UQ-BQ189T GeForce 940MX, i5-7200U, Toshiba SG5 THNSNK128GVN8 | Acer TravelMate P658-G2-MG-7327 GeForce 940MX, i7-7500U, Liteonit CV3-8D512 | Lenovo IdeaPad 510-15IKB 80SV0087GE GeForce 940MX, i7-7500U, Liteonit CV3-DE256 | Huawei MateBook D 15, i7-7500U 940MX GeForce 940MX, i7-7500U, SanDisk SD8SN8U128G1027 | Dell Inspiron 15 5000 5567-1753 Radeon R7 M445, i7-7500U, SanDisk X400 SED 256GB, SATA (SD8TB8U-256G) | |
|---|---|---|---|---|---|---|
| Noise | -2% | 5% | 0% | 4% | 0% | |
| off / environment * (dB) | 30.3 | 30.6 -1% | 30 1% | 31.6 -4% | 28.8 5% | 30.6 -1% |
| Idle Minimum * (dB) | 30.3 | 31.2 -3% | 30 1% | 32.6 -8% | 30 1% | 30.6 -1% |
| Idle Average * (dB) | 30.3 | 31.2 -3% | 30 1% | 32.6 -8% | 30.2 -0% | 30.6 -1% |
| Idle Maximum * (dB) | 30.3 | 31.2 -3% | 30 1% | 32.6 -8% | 30.2 -0% | 30.6 -1% |
| Load Average * (dB) | 42.6 | 43.3 -2% | 37.3 12% | 35.3 17% | 39 8% | 41.9 2% |
| Load Maximum * (dB) | 42.5 | 43.3 -2% | 38 11% | 37.1 13% | 39 8% | 41.8 2% |
| Witcher 3 ultra * (dB) | 38.7 |
* ... smaller is better
Noise level
| Idle |
| 30.3 / 30.3 / 30.3 dB(A) |
| Load |
| 42.6 / 42.5 dB(A) |
 | ||
30 dB silent 40 dB(A) audible 50 dB(A) loud |
||
min: | ||
Temperature
The temperature of the Inspiron 15 is comfortably even. It warms up evenly on the top and bottom and remains relatively cool in the direct comparison. The sibling model and also the Huawei and the Acer get hotter, and the Lenovo has the best values. Under load, the test unit warms up to a maximum of 43 °C (~110 °F), and the aluminum surface quickly transfers the heat outside. The palm rests also remain cool at all times. The most heat develops in the central area towards the back. Overall, the Inspiron can score in terms of its temperatures, which might also be the result of the strong throttling of the graphics performance.
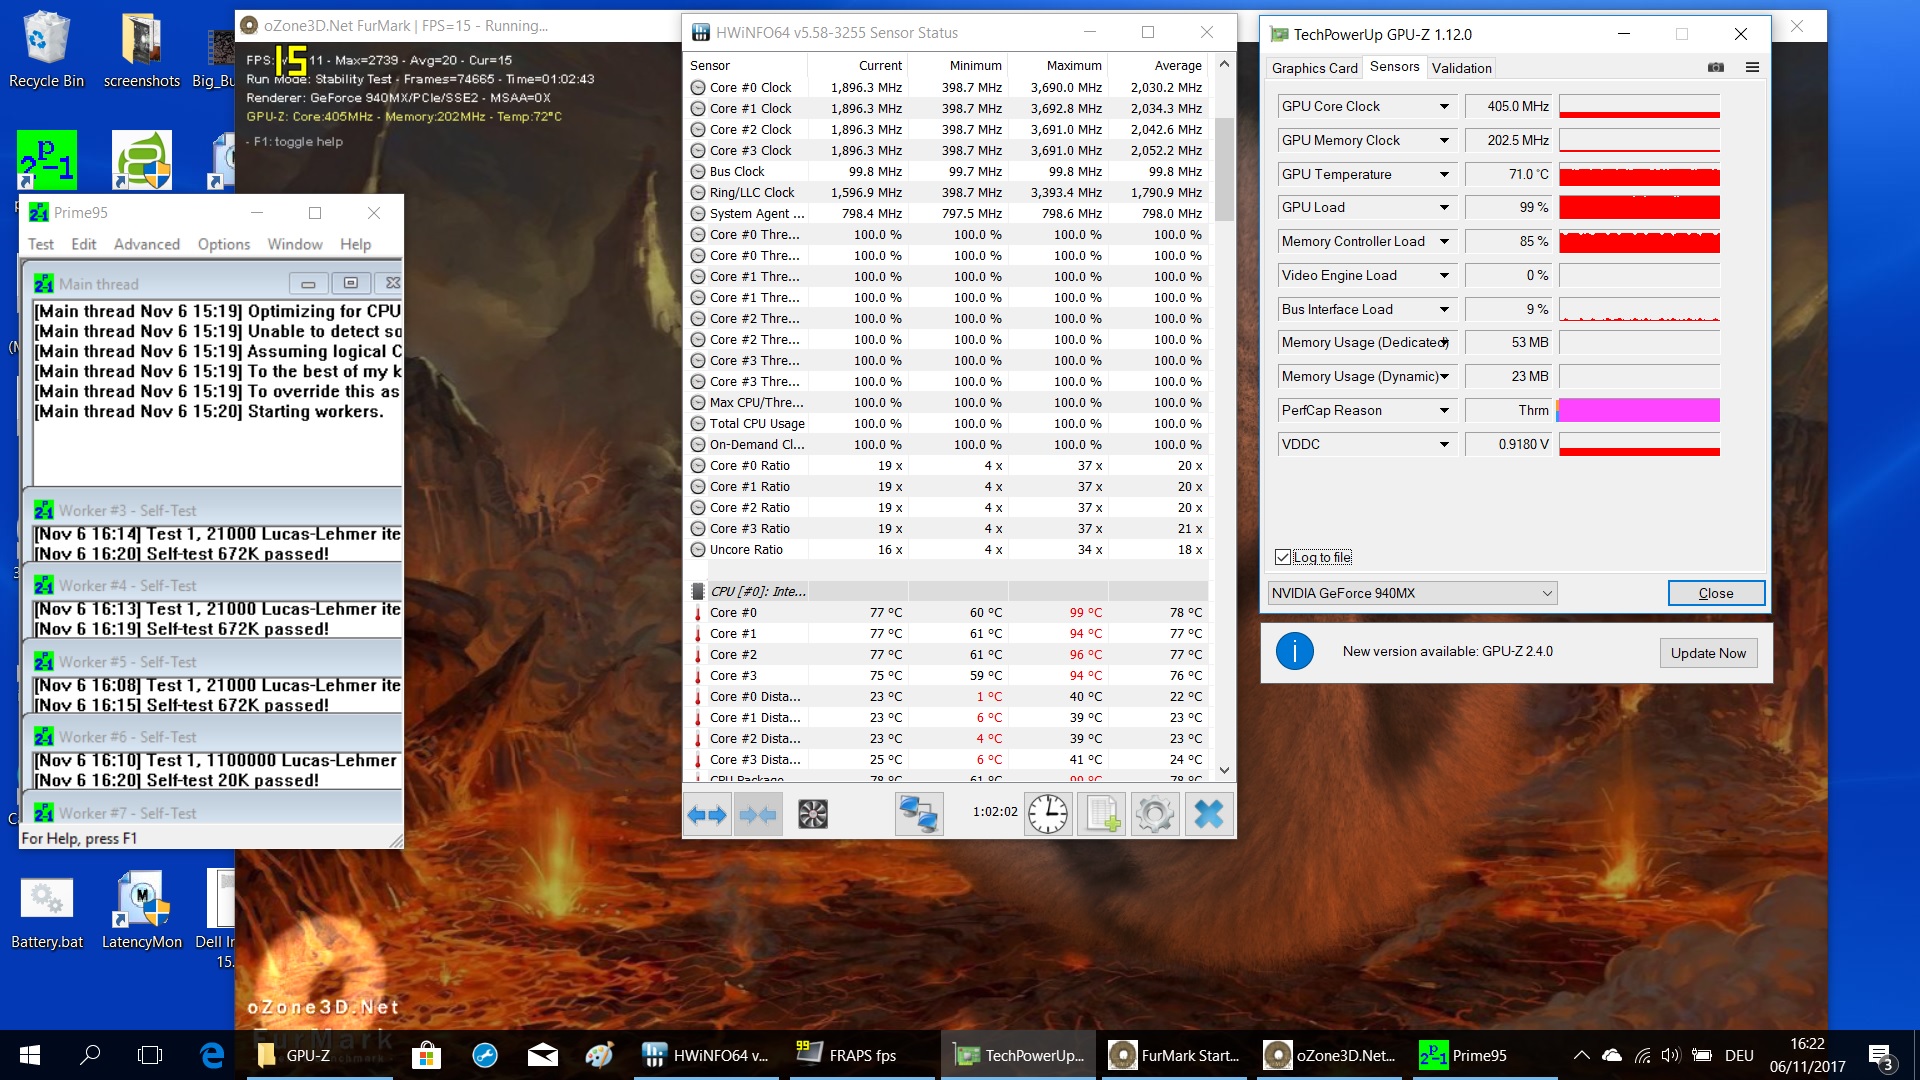
The stress tests via Prime 95 and FurMark show the throttling. After only a brief time, the graphics card is throttled from about 1200 MHz down to 405 MHz, and the storage speed even drops to 203 MHz. In this way, the GPU temperature stays at 72 °C (~162 °F), which would leave some head room. The processor levels out at a clock speed of about 2 GHz, and the core temperatures lie at around 80 °C (~176 °F). Dell probably throttles the performance of the Inspiron this much in order to keep a comfortable temperature. After the stress test, the fans remain very active for a long time.
| Dell Inspiron 15 7570 GeForce 940MX, i5-8550U, Samsung PM961 NVMe MZVLW512HMJP | Asus Vivobook S15 S510UQ-BQ189T GeForce 940MX, i5-7200U, Toshiba SG5 THNSNK128GVN8 | Acer TravelMate P658-G2-MG-7327 GeForce 940MX, i7-7500U, Liteonit CV3-8D512 | Lenovo IdeaPad 510-15IKB 80SV0087GE GeForce 940MX, i7-7500U, Liteonit CV3-DE256 | Huawei MateBook D 15, i7-7500U 940MX GeForce 940MX, i7-7500U, SanDisk SD8SN8U128G1027 | Dell Inspiron 15 5000 5567-1753 Radeon R7 M445, i7-7500U, SanDisk X400 SED 256GB, SATA (SD8TB8U-256G) | |
|---|---|---|---|---|---|---|
| Heat | 3% | -5% | 10% | -11% | -11% | |
| Maximum Upper Side * (°C) | 42.8 | 38.2 11% | 46.4 -8% | 38.3 11% | 44.8 -5% | 41.6 3% |
| Maximum Bottom * (°C) | 43 | 49 -14% | 51.3 -19% | 36 16% | 50.4 -17% | 51.3 -19% |
| Idle Upper Side * (°C) | 27.8 | 24.7 11% | 26 6% | 24.9 10% | 29.4 -6% | 29.4 -6% |
| Idle Bottom * (°C) | 26.6 | 25.8 3% | 25.7 3% | 25.6 4% | 31 -17% | 32.4 -22% |
* ... smaller is better
(±) The maximum temperature on the upper side is 42.8 °C / 109 F, compared to the average of 34.3 °C / 94 F, ranging from 21.2 to 62.5 °C for the class Office.
(±) The bottom heats up to a maximum of 43 °C / 109 F, compared to the average of 36.8 °C / 98 F
(+) In idle usage, the average temperature for the upper side is 25.5 °C / 78 F, compared to the device average of 29.5 °C / 85 F.
(+) The palmrests and touchpad are cooler than skin temperature with a maximum of 29.5 °C / 85.1 F and are therefore cool to the touch.
(±) The average temperature of the palmrest area of similar devices was 27.5 °C / 81.5 F (-2 °C / -3.6 F).
Speakers
As with so many notebooks, the audio reproduction cannot convince in this notebook either. The maximum volume is not particularly high, and the bass reproduction is worse than mediocre. The sound spectrum is thin and not enjoyable.
You can connect external audio devices such as headphones, a stereo system, or microphone via the combined headphone/microphone port.
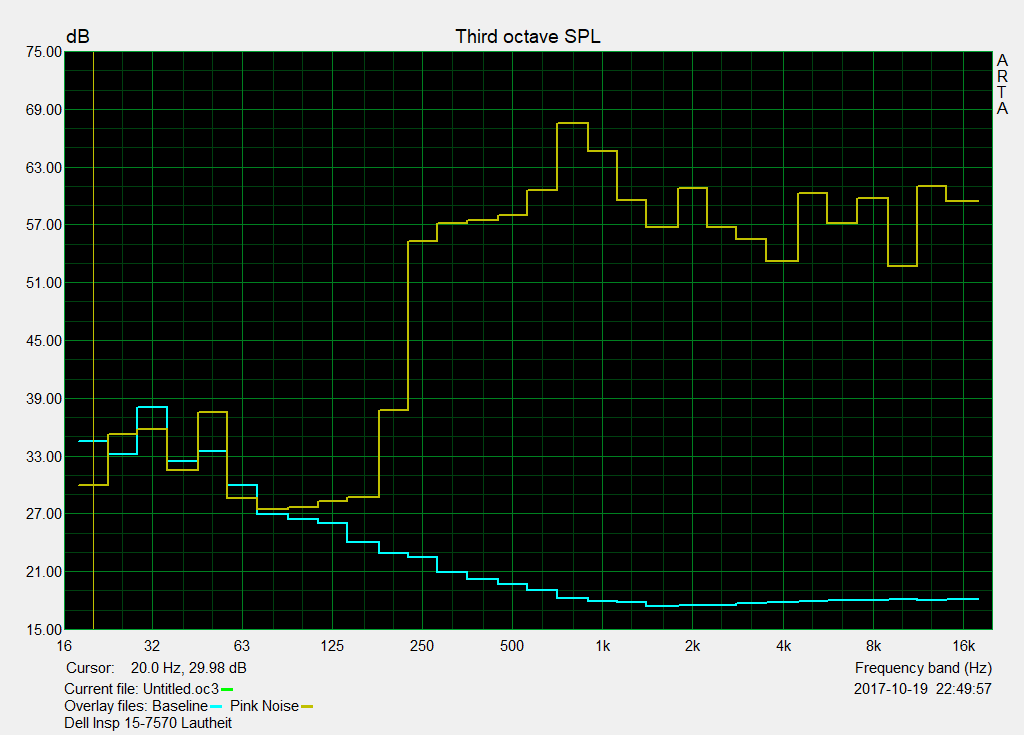
Dell Inspiron 15 7570 audio analysis
(-) | not very loud speakers (67.4 dB)
Bass 100 - 315 Hz
(-) | nearly no bass - on average 18.2% lower than median
(±) | linearity of bass is average (13.1% delta to prev. frequency)
Mids 400 - 2000 Hz
(+) | balanced mids - only 3.5% away from median
(±) | linearity of mids is average (8.1% delta to prev. frequency)
Highs 2 - 16 kHz
(+) | balanced highs - only 2.3% away from median
(±) | linearity of highs is average (9.9% delta to prev. frequency)
Overall 100 - 16.000 Hz
(±) | linearity of overall sound is average (20.8% difference to median)
Compared to same class
» 48% of all tested devices in this class were better, 9% similar, 42% worse
» The best had a delta of 7%, average was 21%, worst was 53%
Compared to all devices tested
» 56% of all tested devices were better, 8% similar, 36% worse
» The best had a delta of 4%, average was 24%, worst was 134%
Apple MacBook 12 (Early 2016) 1.1 GHz audio analysis
(+) | speakers can play relatively loud (83.6 dB)
Bass 100 - 315 Hz
(±) | reduced bass - on average 11.3% lower than median
(±) | linearity of bass is average (14.2% delta to prev. frequency)
Mids 400 - 2000 Hz
(+) | balanced mids - only 2.4% away from median
(+) | mids are linear (5.5% delta to prev. frequency)
Highs 2 - 16 kHz
(+) | balanced highs - only 2% away from median
(+) | highs are linear (4.5% delta to prev. frequency)
Overall 100 - 16.000 Hz
(+) | overall sound is linear (10.2% difference to median)
Compared to same class
» 7% of all tested devices in this class were better, 2% similar, 91% worse
» The best had a delta of 5%, average was 18%, worst was 53%
Compared to all devices tested
» 5% of all tested devices were better, 1% similar, 94% worse
» The best had a delta of 4%, average was 24%, worst was 134%
Frequency comparison (Checkboxes selectable!)
Power Management
Power Consumption
While idling, the Inspiron is efficient. Thanks to Optimus and the very variable processor speed, it keeps up with the competition. Under load, the picture changes slightly. Despite the relatively strong performance throttling, our test unit consumes more power than most of the competitors during very demanding work. Only the Acer and the sibling model consume a similar amount during maximum load. We measured a top value of 59 watts. The included power supply is rated at 65 watts, which should be sufficient.
| Off / Standby | |
| Idle | |
| Load |
|
Key:
min: | |
| Dell Inspiron 15 7570 i5-8550U, GeForce 940MX, Samsung PM961 NVMe MZVLW512HMJP, IPS, 1920x1080, 15.6" | Asus Vivobook S15 S510UQ-BQ189T i5-7200U, GeForce 940MX, Toshiba SG5 THNSNK128GVN8, IPS, 1920x1080, 15.6" | Acer TravelMate P658-G2-MG-7327 i7-7500U, GeForce 940MX, Liteonit CV3-8D512, IPS, 1920x1080, 15.6" | Lenovo IdeaPad 510-15IKB 80SV0087GE i7-7500U, GeForce 940MX, Liteonit CV3-DE256, IPS, 1920x1080, 15.6" | Huawei MateBook D 15, i7-7500U 940MX i7-7500U, GeForce 940MX, SanDisk SD8SN8U128G1027, IPS, 1920x1080, 15.6" | Dell Inspiron 15 5000 5567-1753 i7-7500U, Radeon R7 M445, SanDisk X400 SED 256GB, SATA (SD8TB8U-256G), TN LED, 1920x1080, 15.6" | |
|---|---|---|---|---|---|---|
| Power Consumption | 2% | -7% | 5% | -6% | 6% | |
| Idle Minimum * (Watt) | 3.6 | 3.6 -0% | 3.9 -8% | 3.9 -8% | 5.14 -43% | 4 -11% |
| Idle Average * (Watt) | 6.7 | 6.8 -1% | 7.9 -18% | 7.4 -10% | 9.07 -35% | 5.4 19% |
| Idle Maximum * (Watt) | 9.2 | 9.5 -3% | 11.3 -23% | 9.5 -3% | 9.33 -1% | 8.3 10% |
| Load Average * (Watt) | 59 | 51.6 13% | 47 20% | 41 31% | 46.76 21% | 54 8% |
| Load Maximum * (Watt) | 58 | 56 3% | 62 -7% | 48 17% | 42.59 27% | 55.4 4% |
| Witcher 3 ultra * (Watt) | 40.18 |
* ... smaller is better
Battery Life
The Inspiron 15 has a 42-Wh battery. To establish how long the device can last away from the mains outlet, we test various scenarios.
For the maximum runtime, we deactivate all the communication modules, minimize the brightness, and activate power saving mode. We simulate a minimal load via the BatteryEater read benchmark. In this way, our test unit lasts for a maximum of 4 hours and 40 minutes. For an all-rounder with such built-in hardware, this is anything but a top value. In the comparison, this is only sufficient for the last place. The next best competitors last almost twice as long. However, since the Acer and Lenovo lack some important measurement data, they are dropping out of the comparison.
To measure the minimum runtime, we turn up all the power users and simulate a large load with the BatteryEater Classic test. The Inspiron lasts for only 1 hour and 20 minutes. Even though all the competitors come out close together here, this measurement is anything but satisfactory.
We activate the Balanced mode in the WLAN practice test, reduce the brightness to 150 cd/m2, and surf the web with changing pages via a script. The test unit achieves a runtime of 1 hour and 45 minutes, which is quite subterranean for a notebook of this price range.
In our video test, the Inspiron achieves about 4 hours. The power saver mode was active, the communication modules deactivated, but the brightness was maximized.
Overall, the battery life of the Inspiron 15 is a negative surprise. Although the device is relatively light and offers Optimus and an energy efficient processor, the measured runtimes are very weak, which clearly limits the mobility that it has aimed for. Considering the hardware, it is a mystery to us as to why the device does so badly here.
| Dell Inspiron 15 7570 i5-8550U, GeForce 940MX, 42 Wh | Asus Vivobook S15 S510UQ-BQ189T i5-7200U, GeForce 940MX, 42 Wh | Acer TravelMate P658-G2-MG-7327 i7-7500U, GeForce 940MX, 55 Wh | Lenovo IdeaPad 510-15IKB 80SV0087GE i7-7500U, GeForce 940MX, 30 Wh | Huawei MateBook D 15, i7-7500U 940MX i7-7500U, GeForce 940MX, 43.3 Wh | Dell Inspiron 15 5000 5567-1753 i7-7500U, Radeon R7 M445, 42 Wh | |
|---|---|---|---|---|---|---|
| Battery runtime | 61% | 367% | 156% | 191% | 103% | |
| Reader / Idle (h) | 4.7 | 7.1 51% | 15.9 238% | 7.8 66% | ||
| H.264 (h) | 4 | 5.3 33% | ||||
| WiFi v1.3 (h) | 1.8 | 4.3 139% | 8.4 367% | 4.6 156% | 7.4 311% | 7 289% |
| Load (h) | 1.3 | 1.2 -8% | 1.6 23% | 1.6 23% |
Verdict
Pros
Cons
The Inspiron 15 7000 (7570-9726) is a difficult case. On the one hand, we like the design and workmanship all around the sturdy aluminum case. Despite the reflective surface, the display also strikes a very good figure in some parts, and at least on paper, the hardware convinces with good values, particularly the excellent SSD. In addition, the device always stays comfortably cool.
On the other hand, the Dell Inspiron has some weaknesses, some of which cannot be explained. The worst are the very poor battery life, as well as the measured latencies and drop outs. Apparently the device struggles with some great driver problems, since the graphics performance is also heavily throttled. In the system and particularly graphics performance, the device does not reach the level of the competitors and cannot make full use of the potential promised by the good hardware. But that alone would not be so bad, if at least the mobility would have been better with a good battery life. After all, the device is a light business or all-round model. Unfortunately the opposite is the case.
While the Dell Inspiron has good prerequisites in terms of strong components, unfortunately by having surprising weaknesses, it messes up its justified promises of a top value.
Currently, the device can be purchased for a price of about 1150 Euros (~$1324; starting at $750 in the US). Users for whom the graphics performance is less important and who look for a good notebook for their home are still well-served by the Dell Inspiron. Perhaps Dell can manage to remedy some of the worst weaknesses through updates. We would wish it, since then the device would also be suitable for more mobile usage tasks.
Dell Inspiron 15 7570
- 11/08/2017 v6 (old)
Christian Hintze
Price comparison
