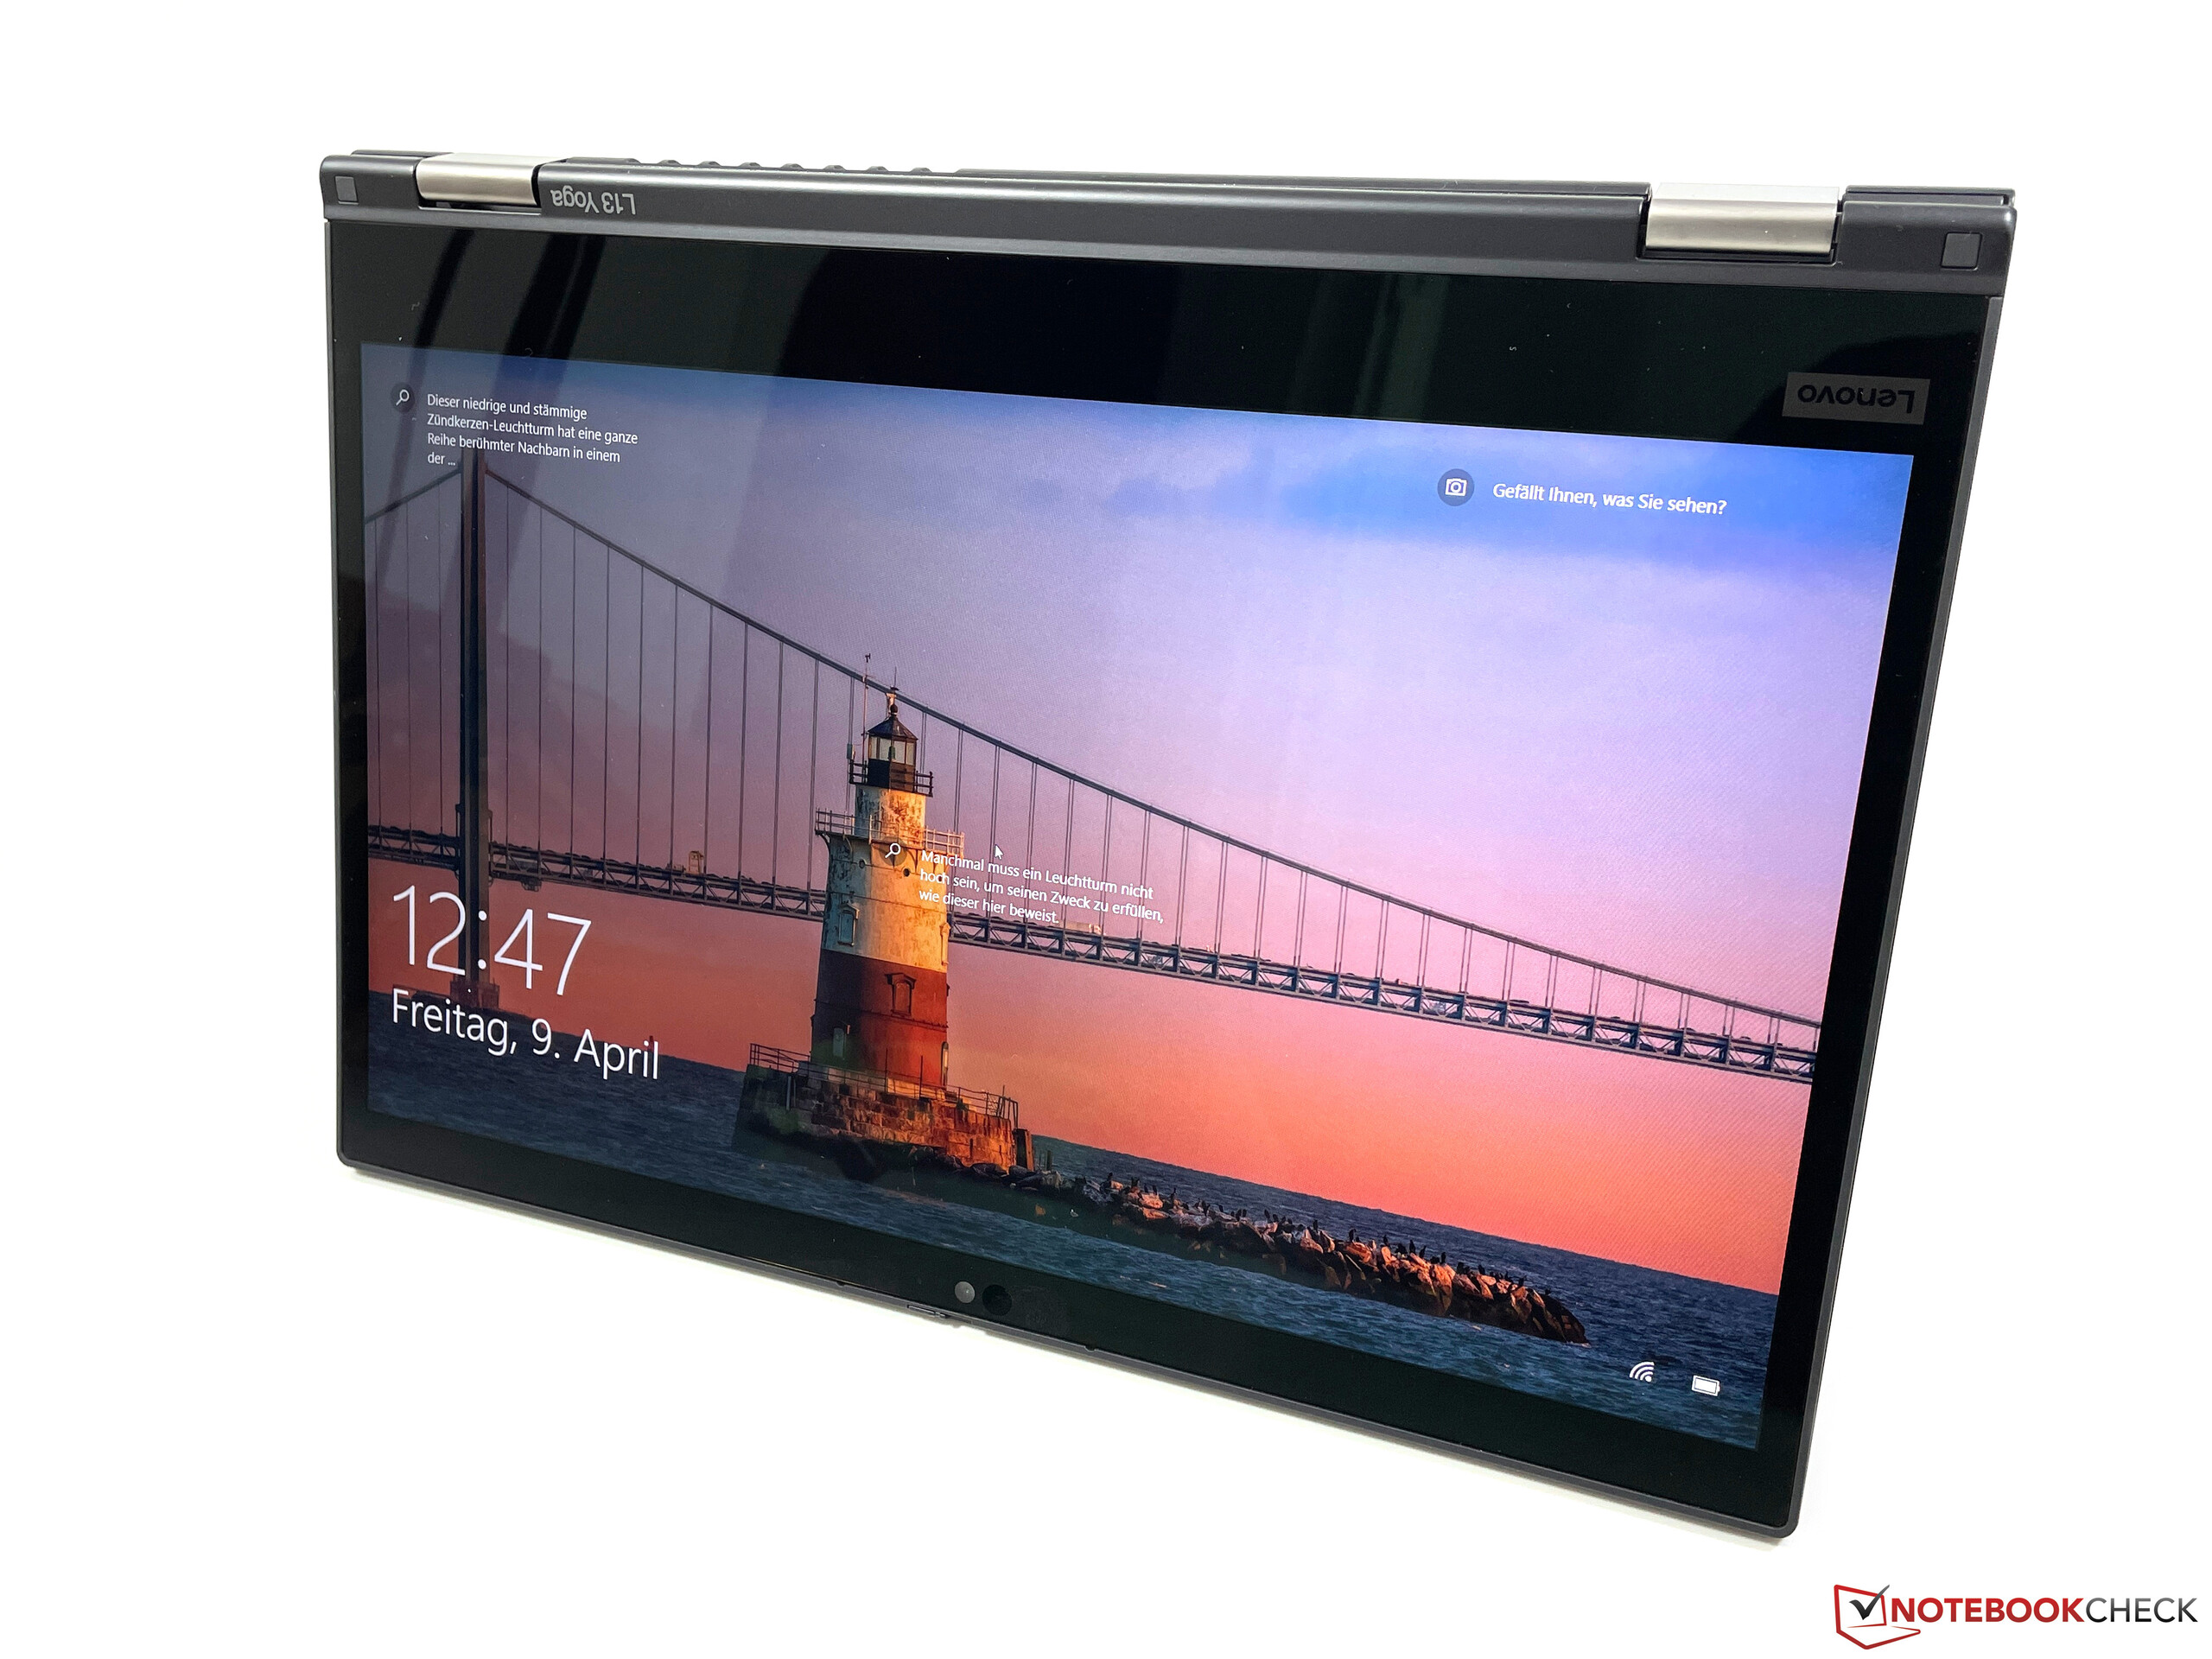
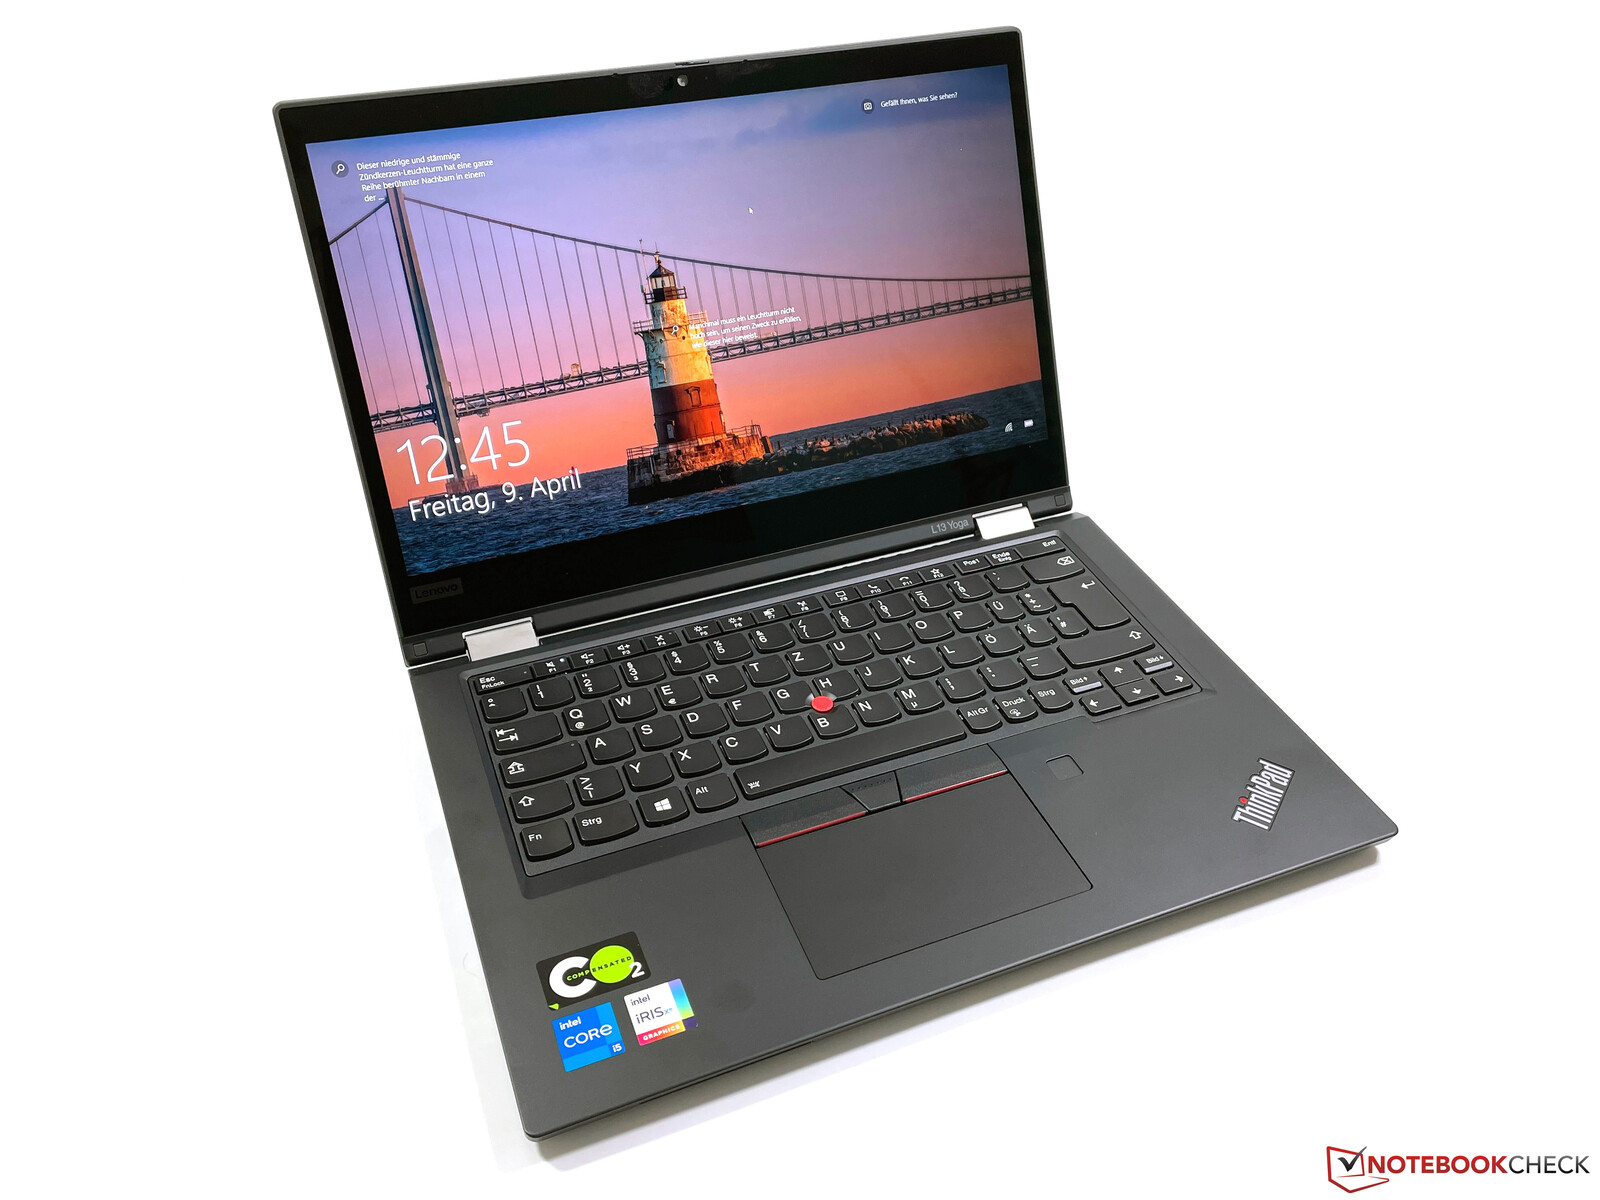
Lenovo ThinkPad L13 Yoga Gen 2 laptop review: Business convertible now with Tiger Lake

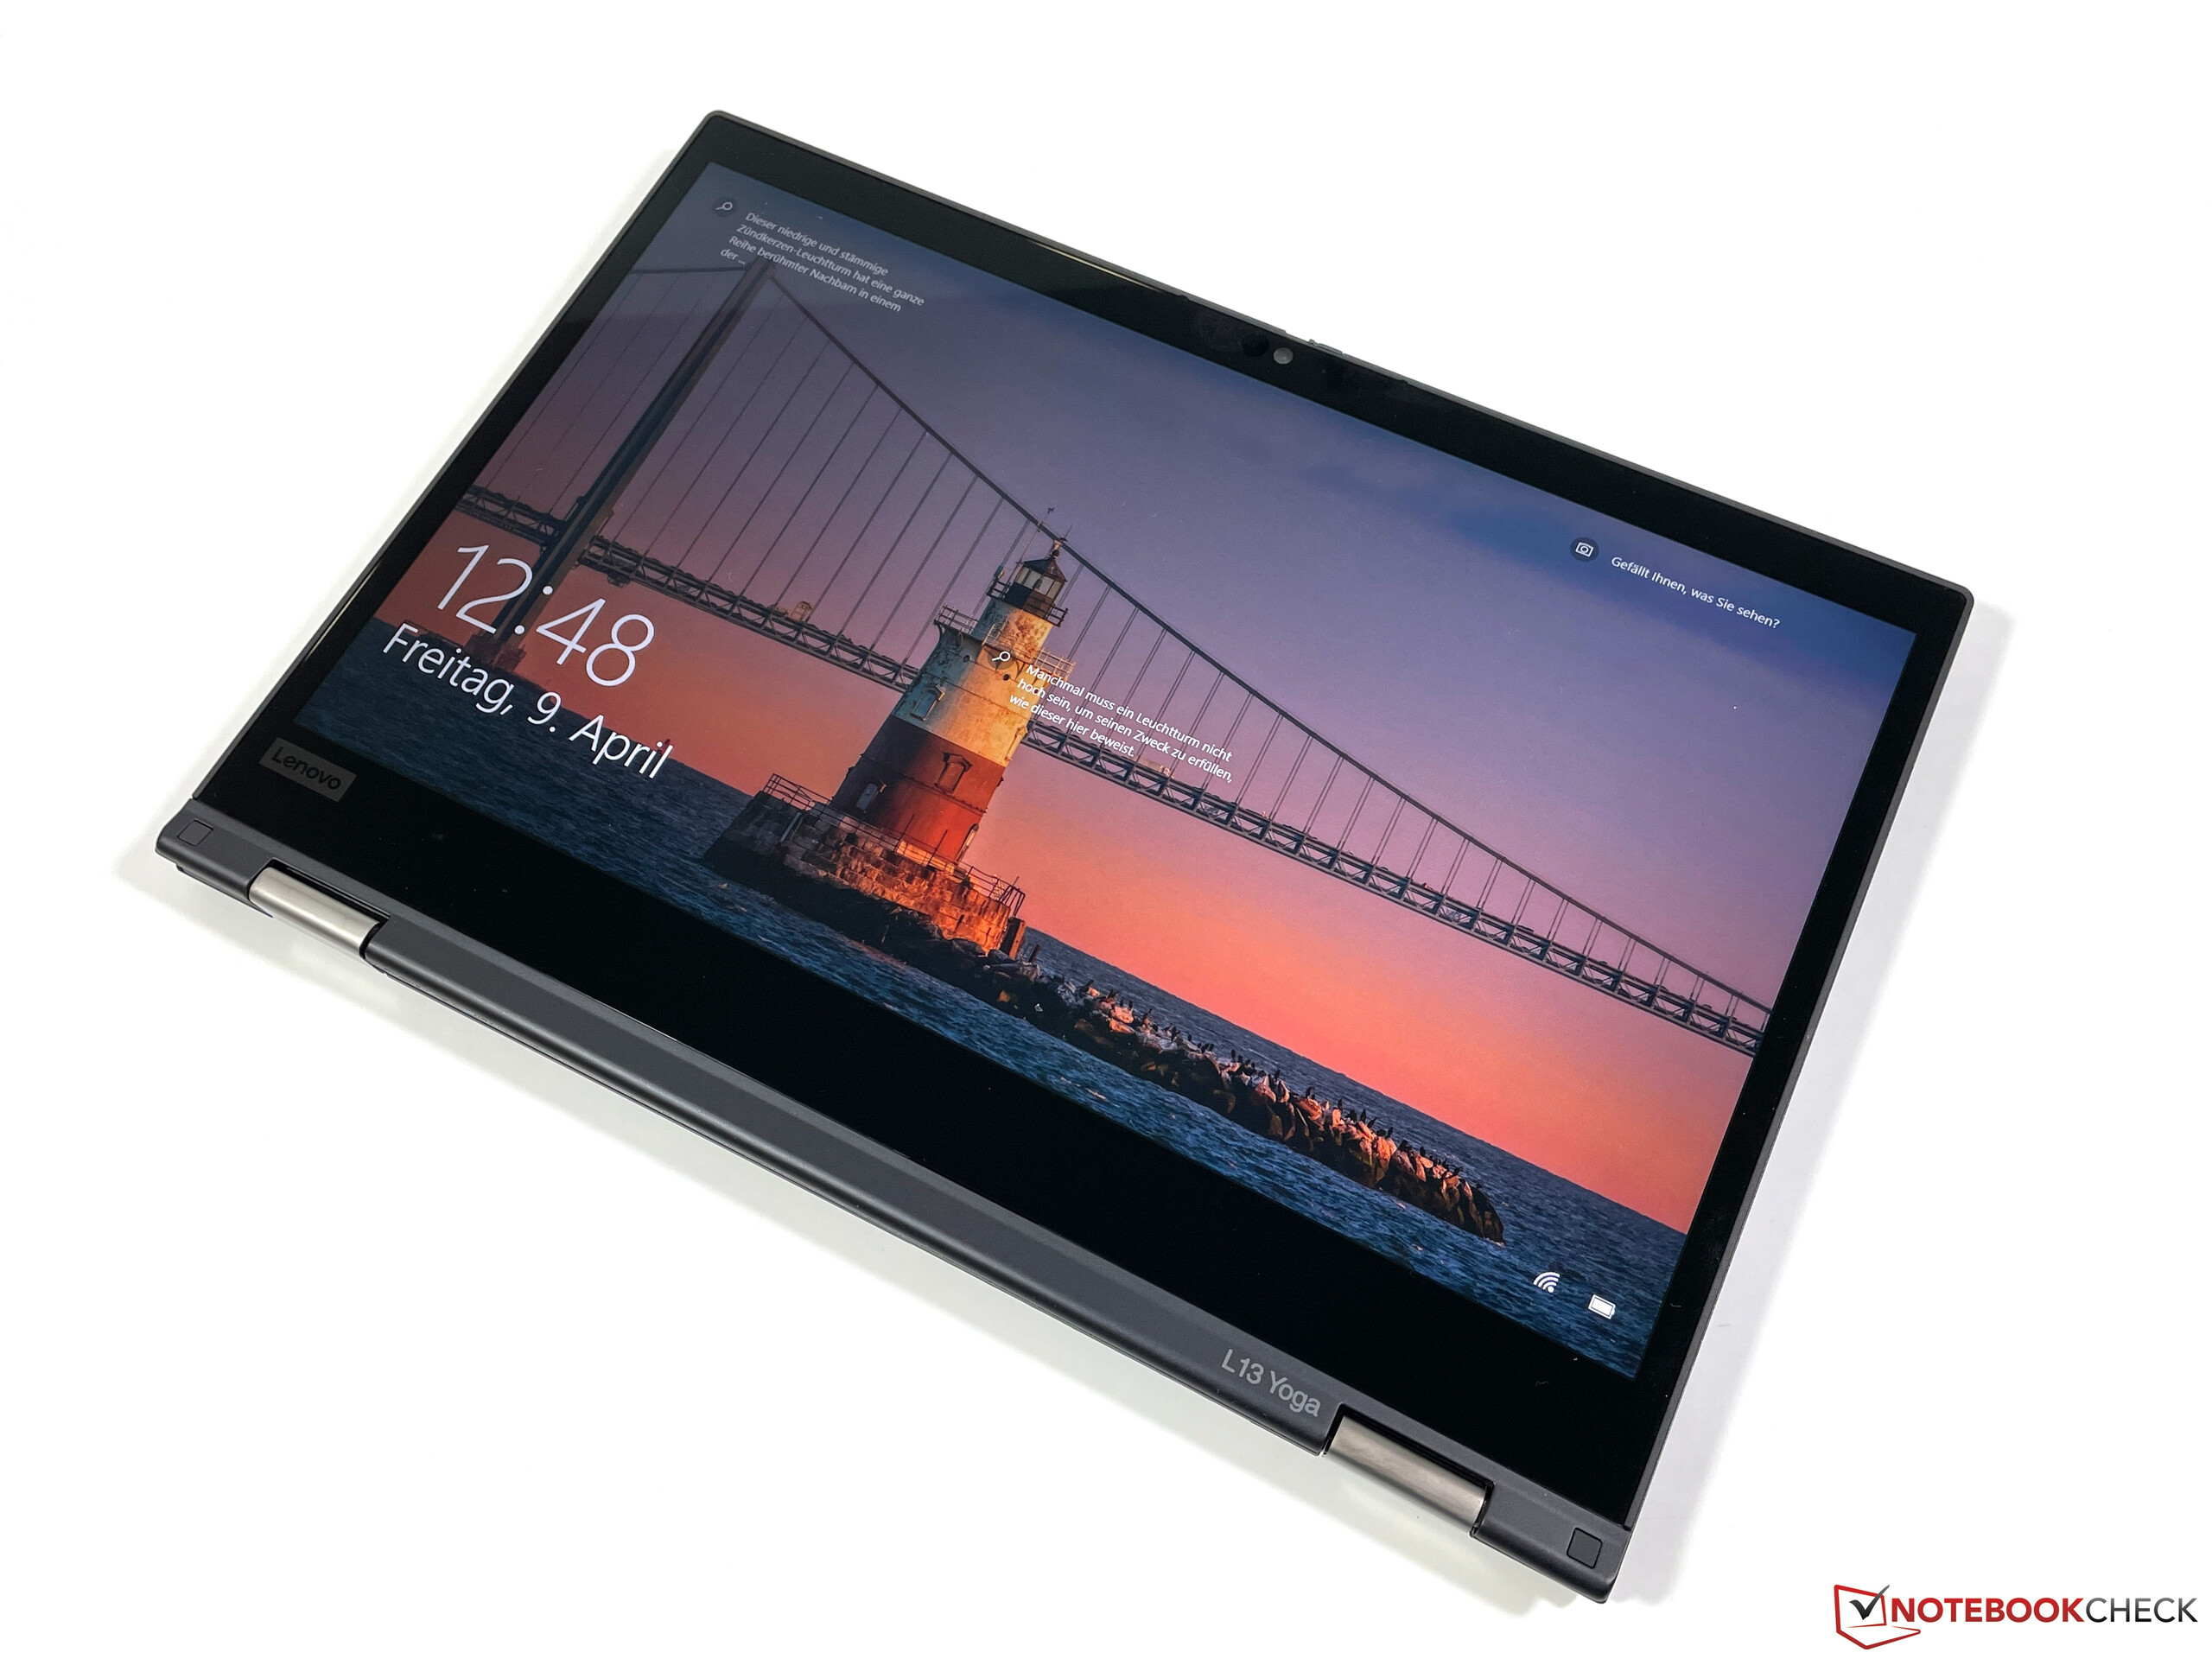
Besides the usual updates for processors, displays in particular are currently in focus, since 16:9 displays are being replaced increasingly by 16:10 panels in the business sector as well. This is also the case with Lenovo, but not all model series are able to benefit from this yet, which is also partly due to the availability of the corresponding panels. The affordable second-generation ThinkPad L13 Yoga that we review today is still equipped with the familiar 13.3-inch 1080p panel. Therefore, the novelties are limited to Intel's Tiger Lake processor and the Thunderbolt 4 port.
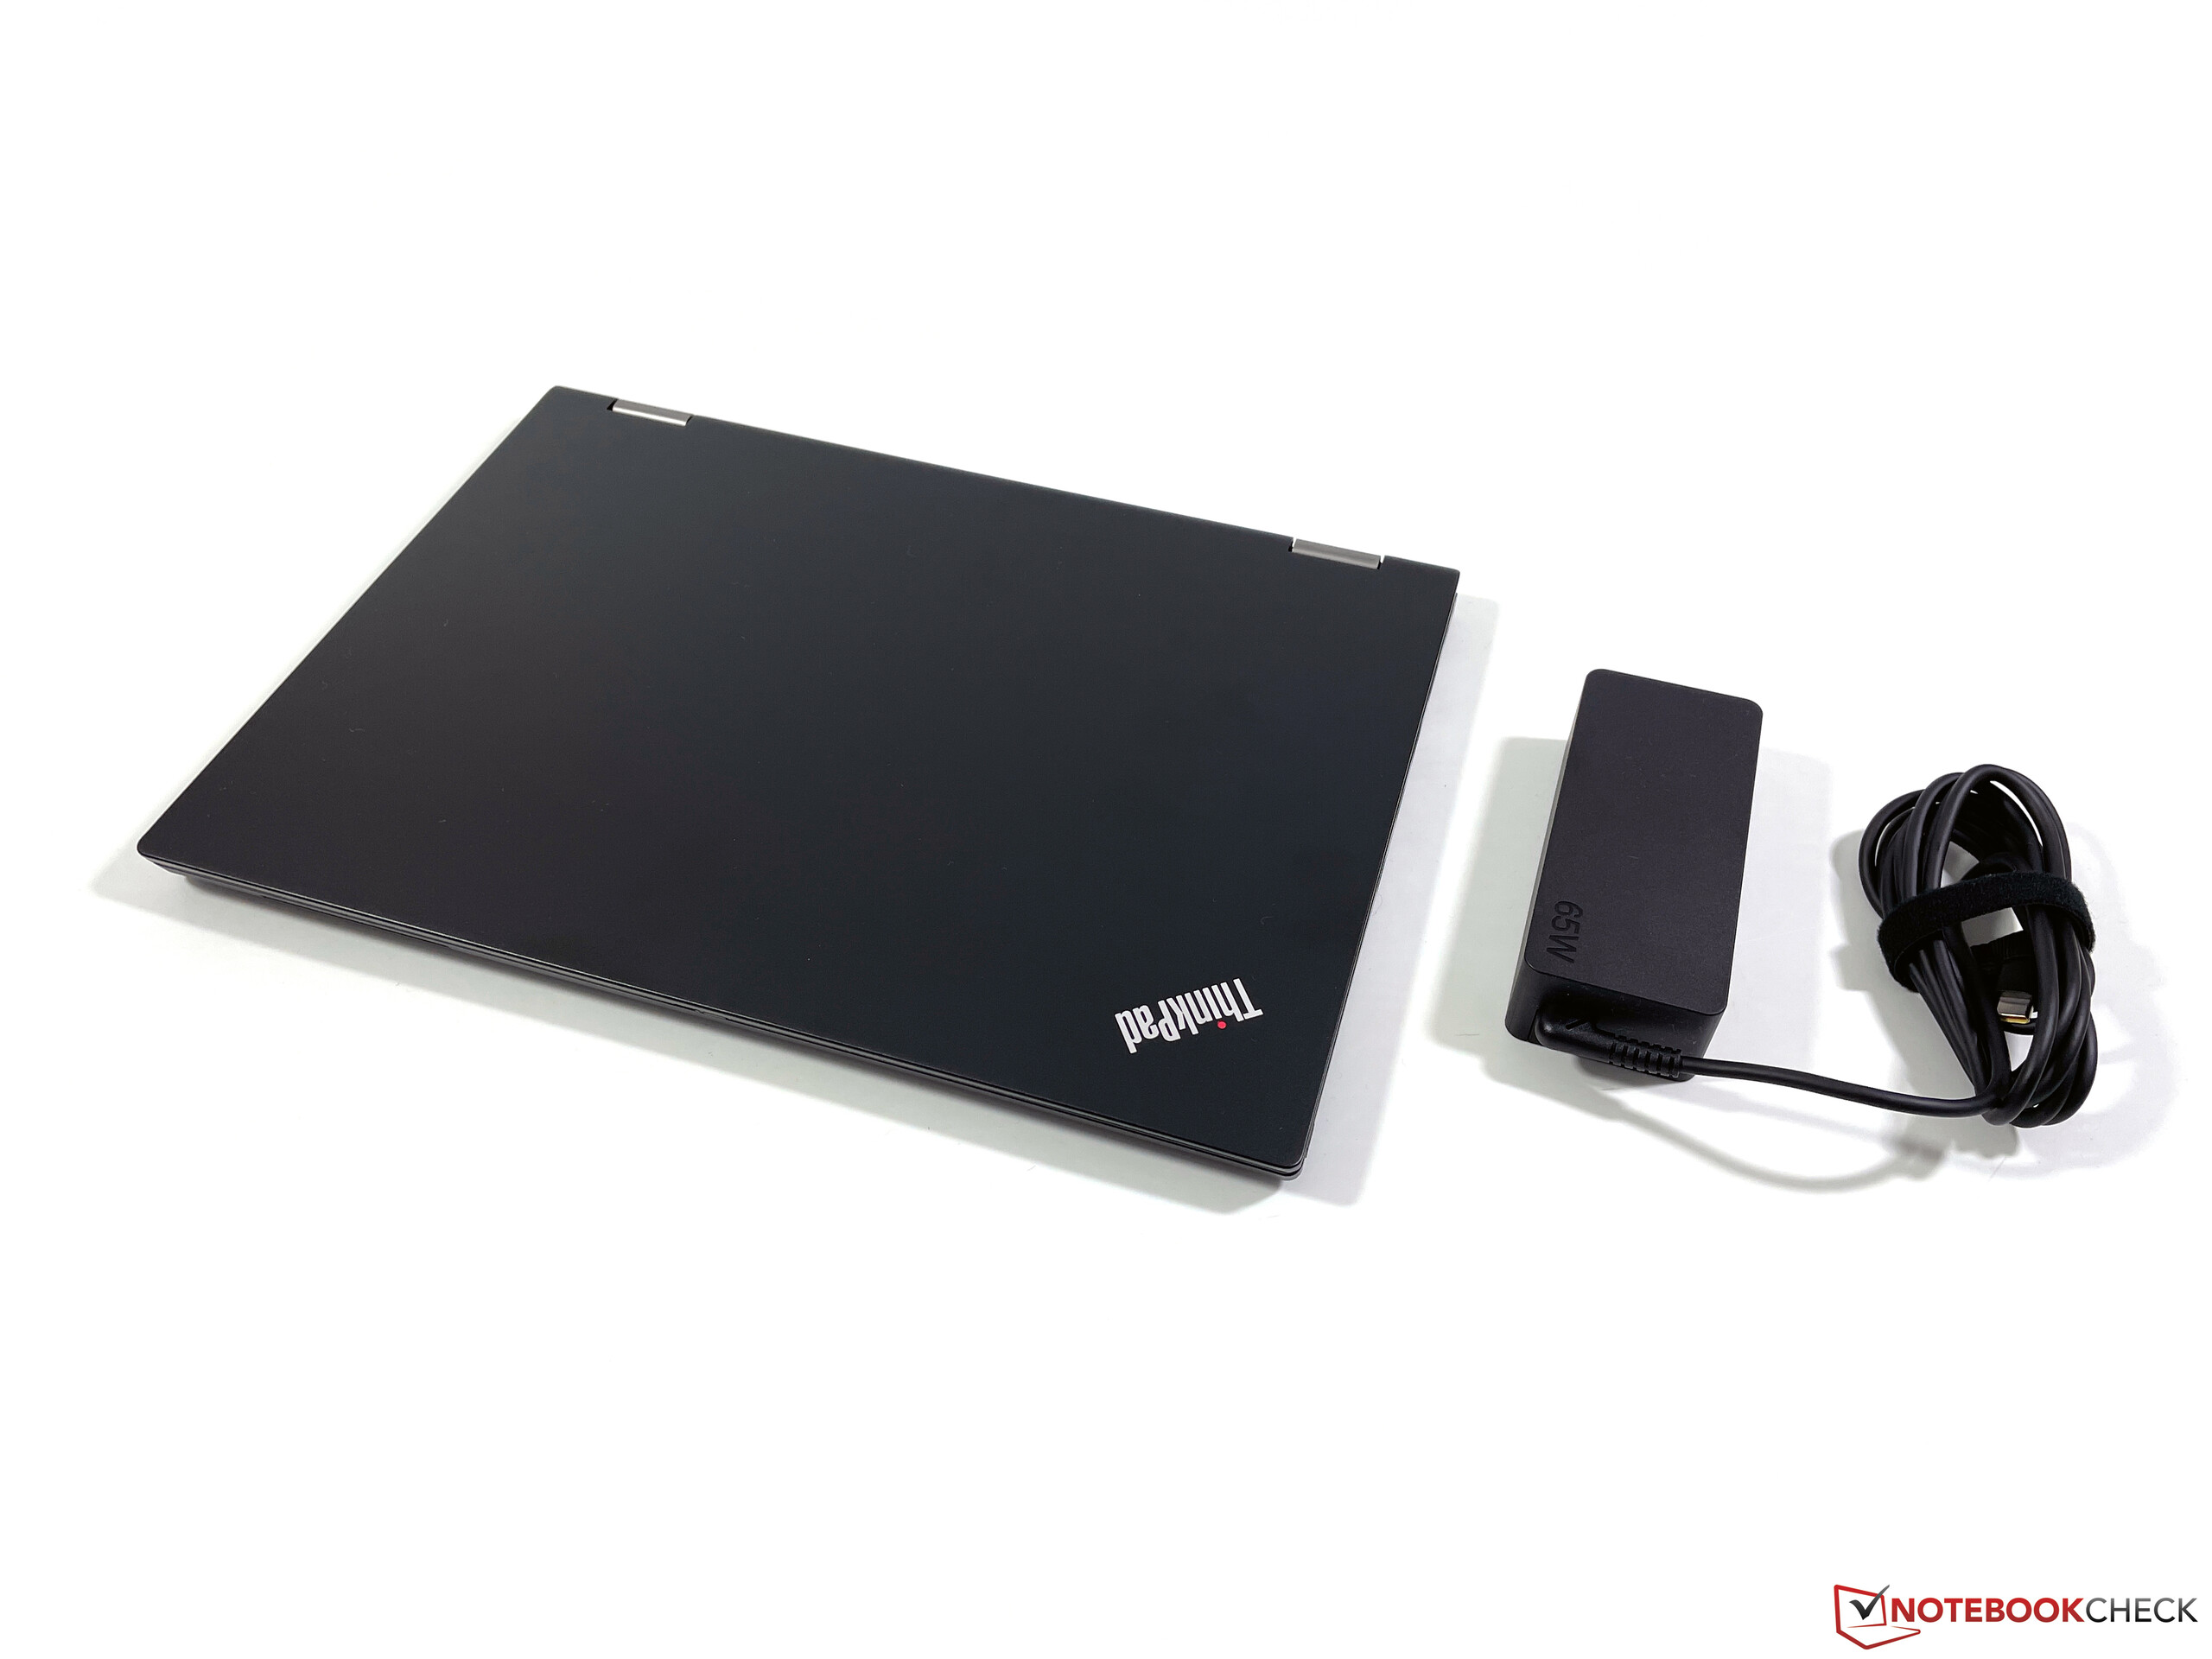
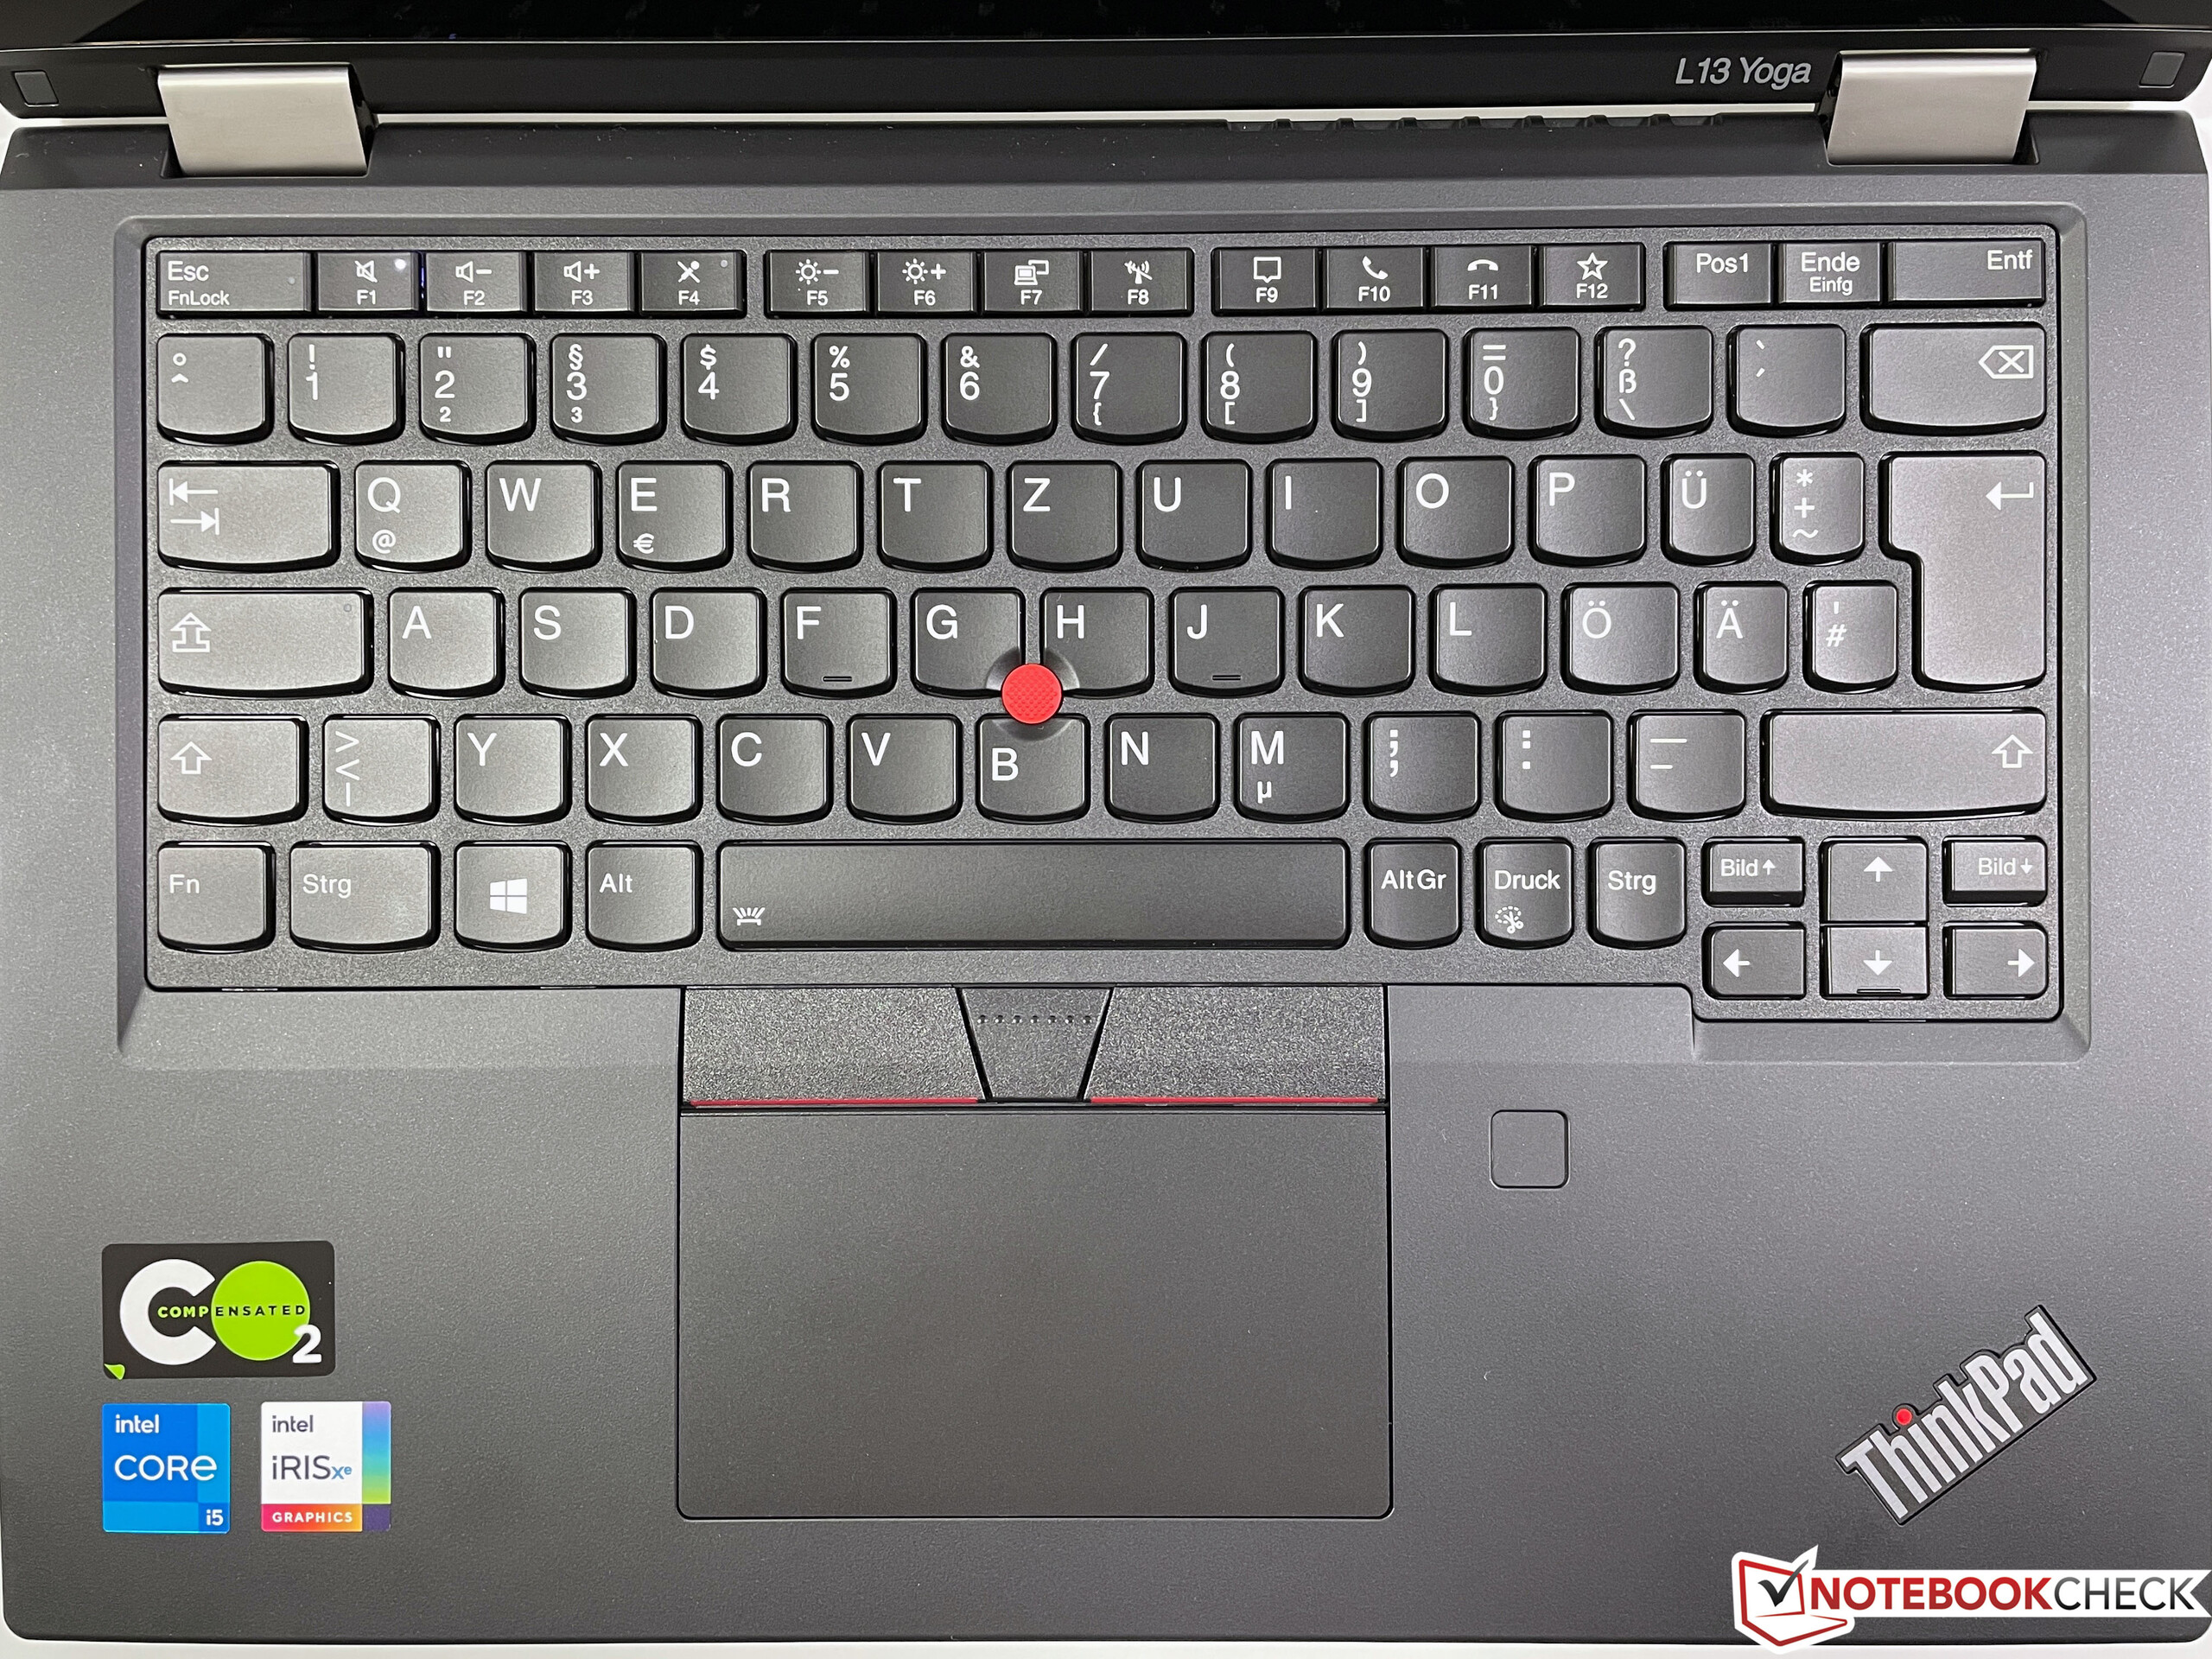
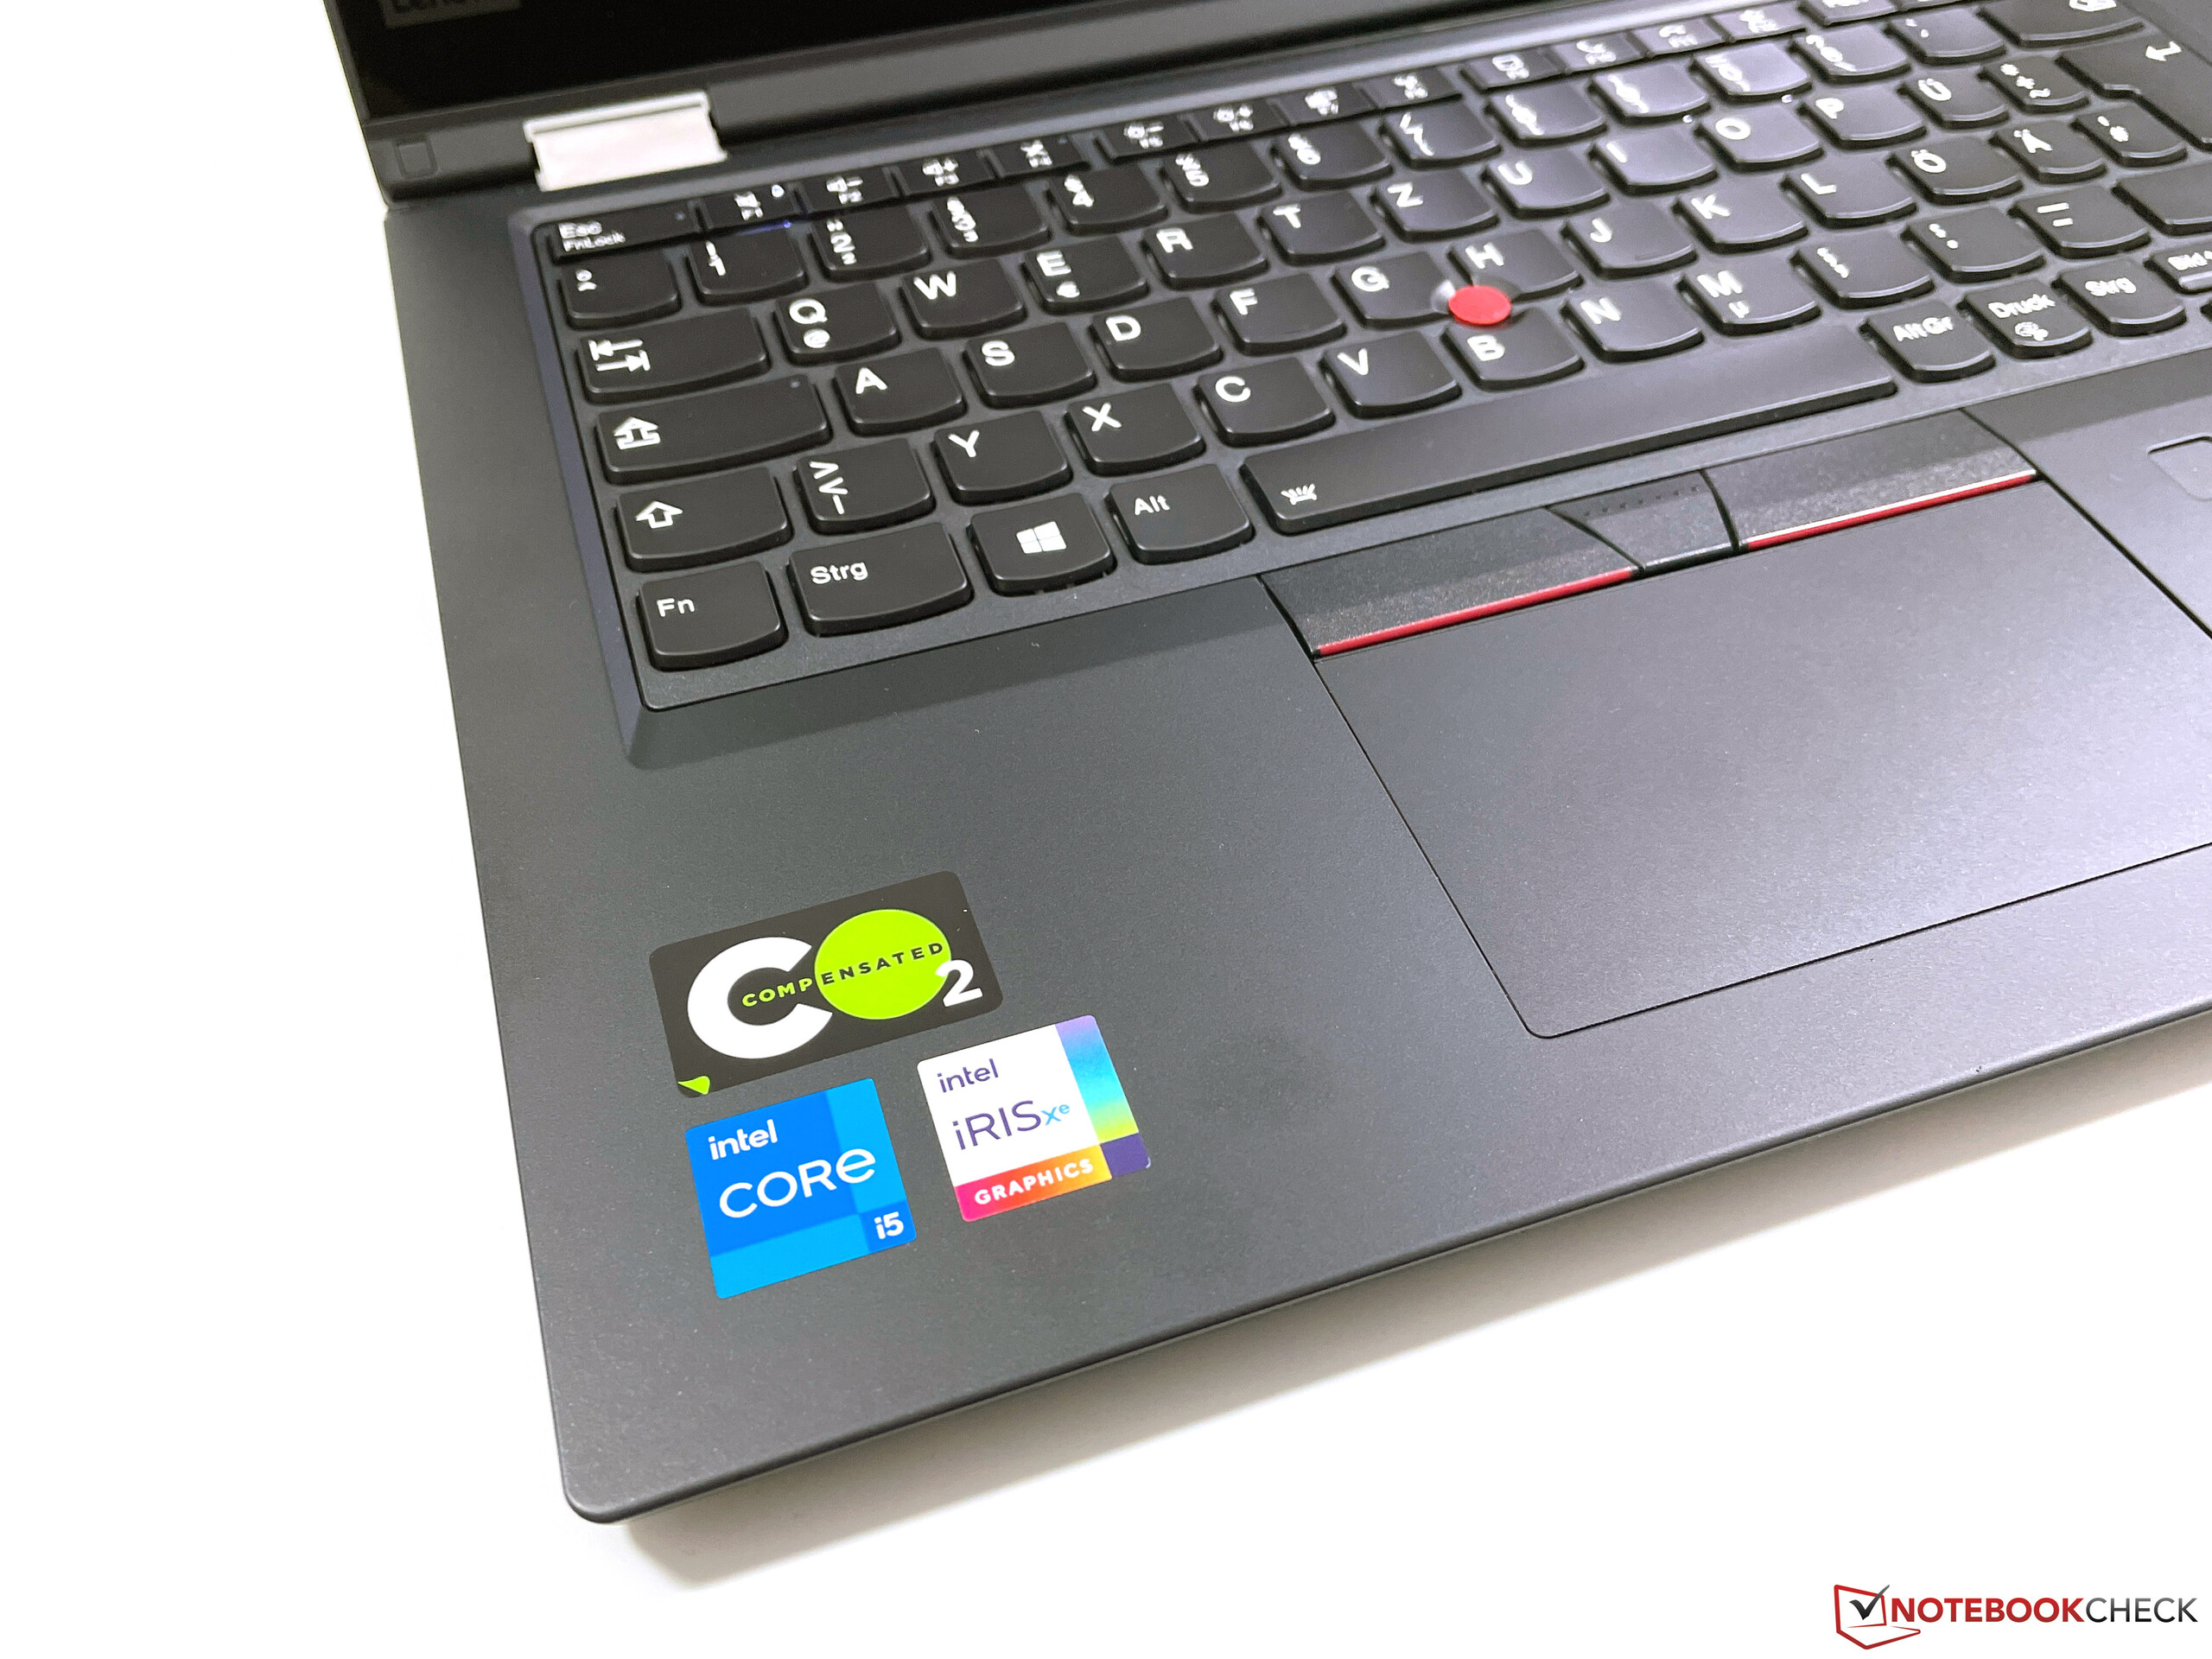
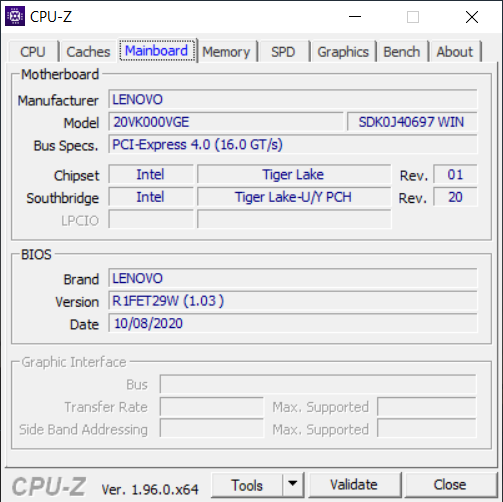
Our test device that carries the name ThinkPad L13 Yoga Gen 2 20VK000VGE costs around 1,060 Euros (~$1,273) in stores or around 980 Euros (~$1,177) for students and academic employees. In return, you get the Core i5-1135G7, 8 GB of RAM, and a 256 GB PCIe SSD. Compared with the L13 Yoga Gen 1, the case, keyboard, and speakers have remained the same. Therefore, please refer to our detailed review from last year for more information about these sections:
Possible contenders in comparison
Rating | Date | Model | Weight | Height | Size | Resolution | Price |
|---|---|---|---|---|---|---|---|
| 88.3 % v7 (old) | 04 / 2021 | Lenovo ThinkPad L13 Yoga Gen2-20VK000VGE i5-1135G7, Iris Xe G7 80EUs | 1.5 kg | 17.6 mm | 13.30" | 1920x1080 | |
| 86.8 % v7 (old) | 09 / 2020 | HP ProBook x360 435 G7, Ryzen 5 4500U R5 4500U, Vega 6 | 1.4 kg | 17.9 mm | 13.30" | 1920x1080 | |
| 88.1 % v7 (old) | 09 / 2020 | Acer Spin 5 SP513-54N-79EY i7-1065G7, Iris Plus Graphics G7 (Ice Lake 64 EU) | 1.2 kg | 14.9 mm | 13.50" | 2256x1504 | |
| 86.2 % v7 (old) | 01 / 2021 | Fujitsu LifeBook U9310X i5-10210U, UHD Graphics 620 | 1 kg | 17 mm | 13.30" | 1920x1080 |
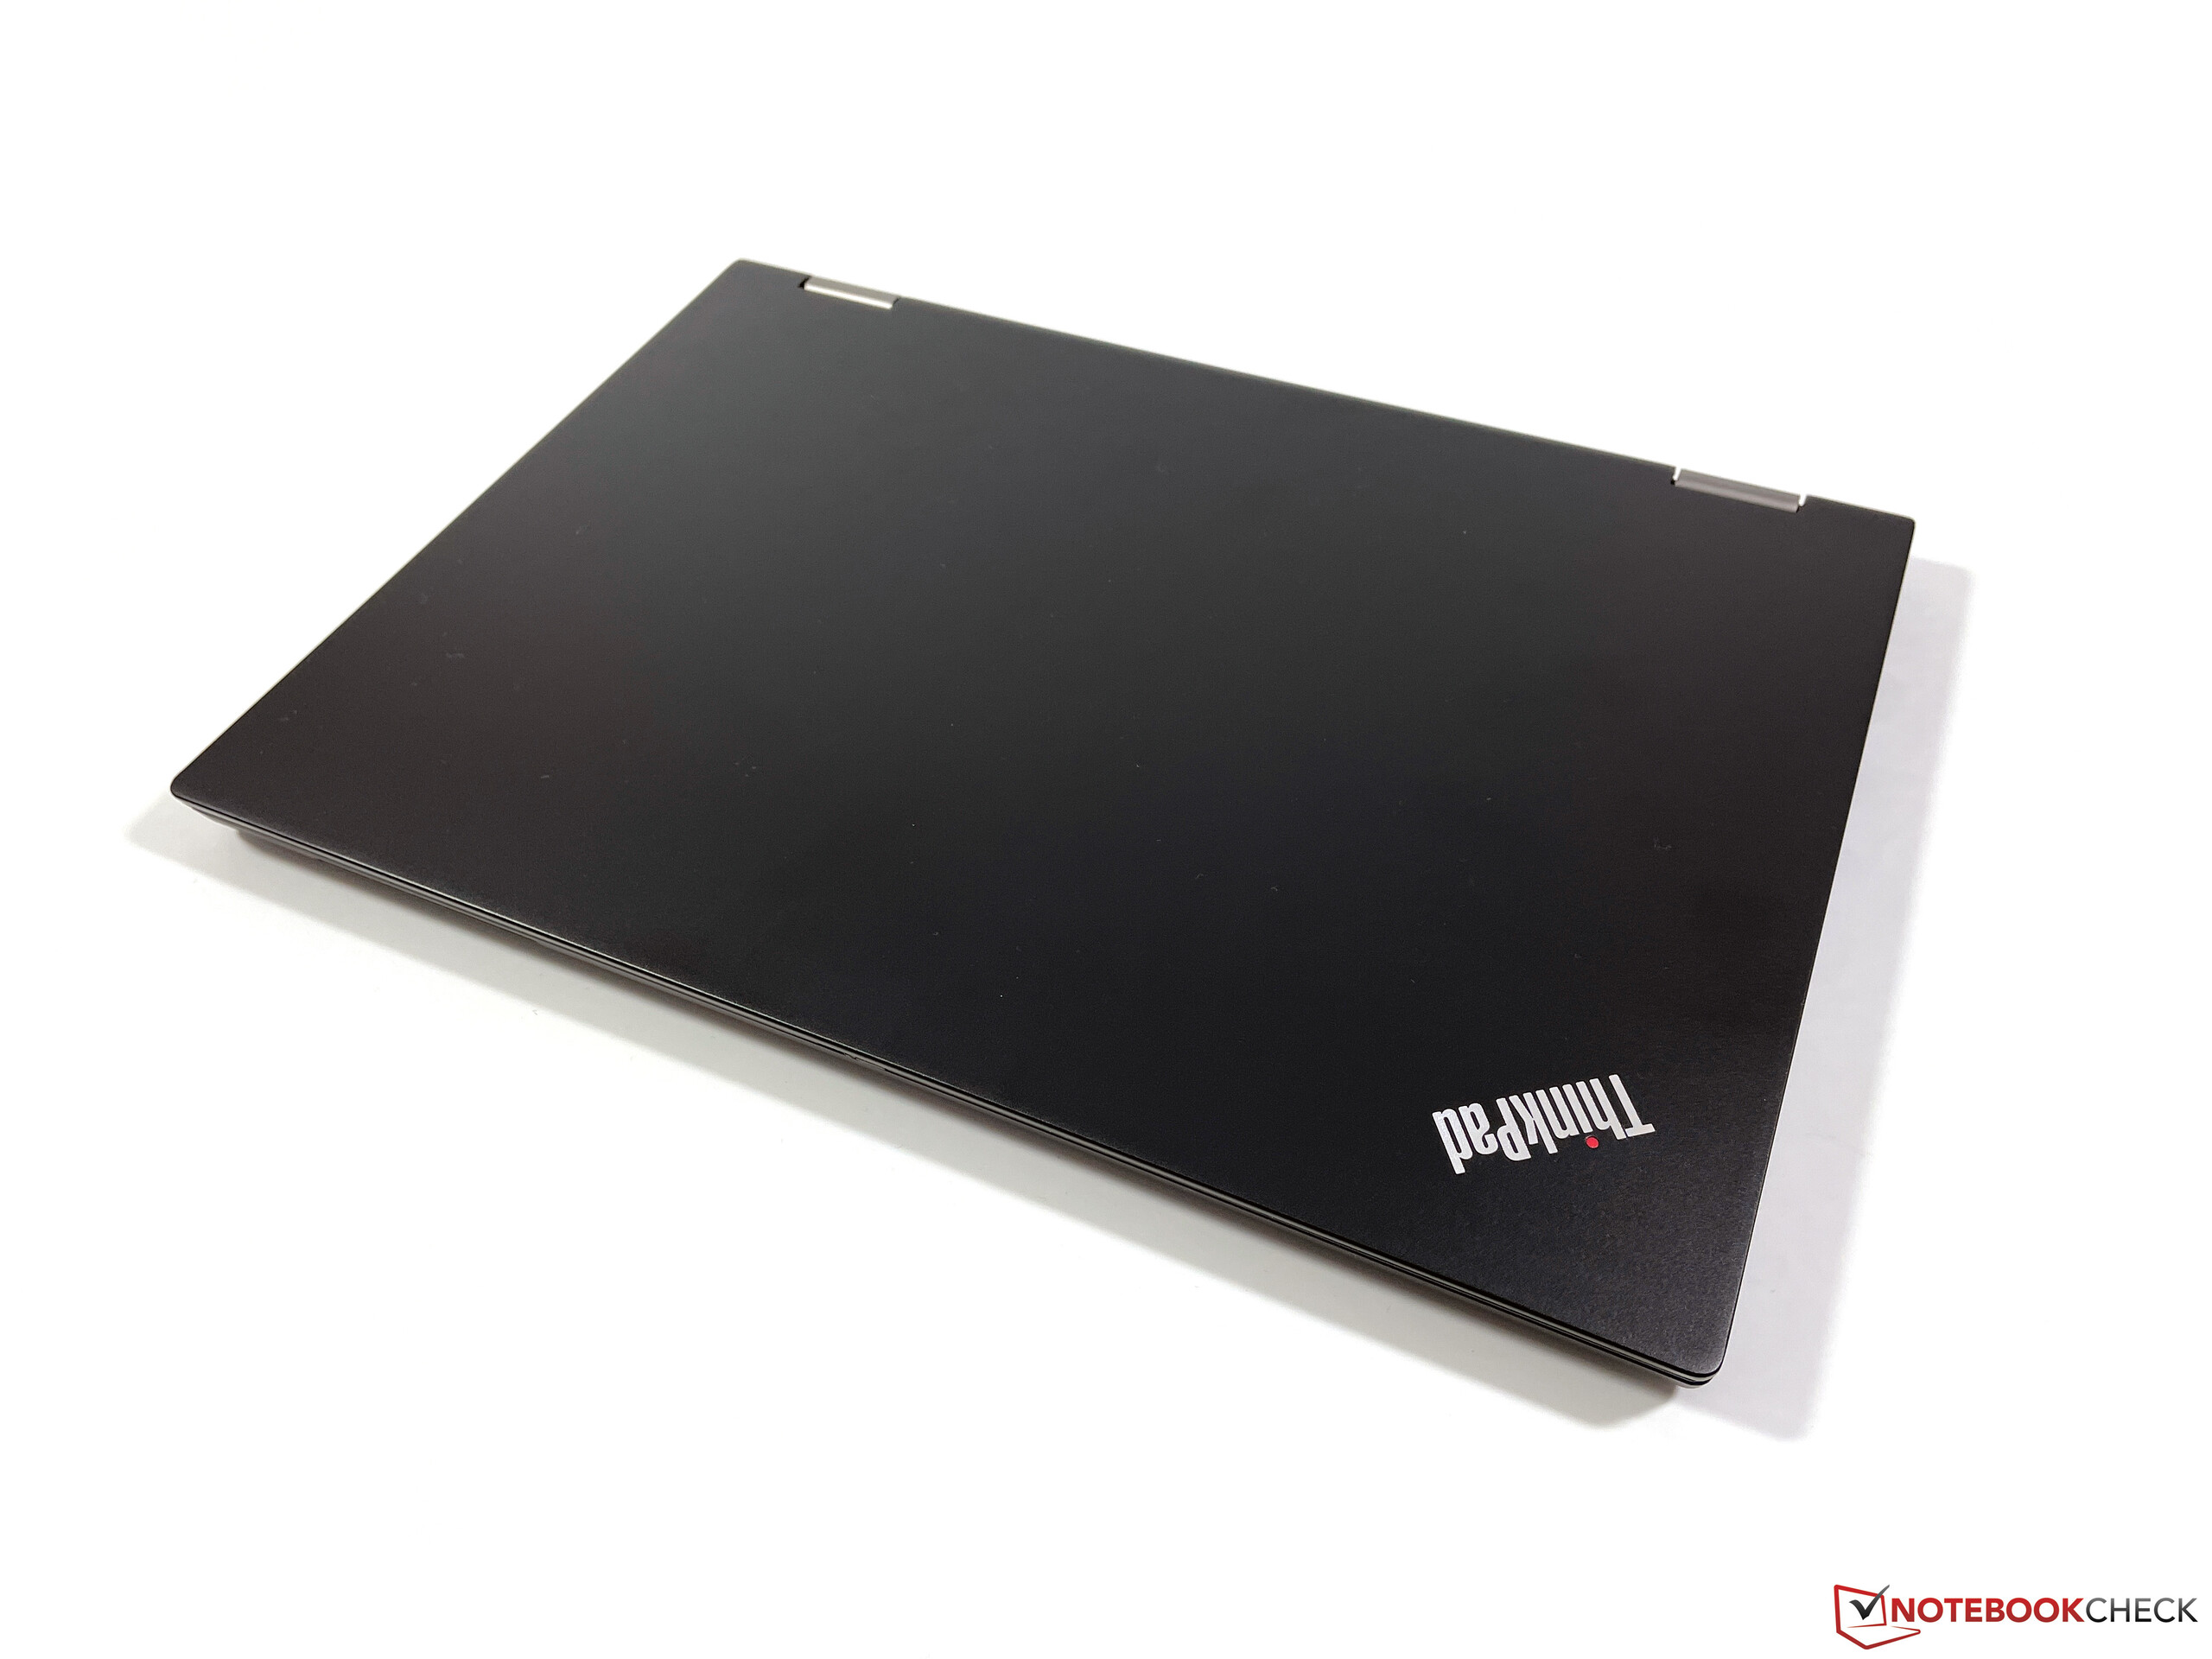
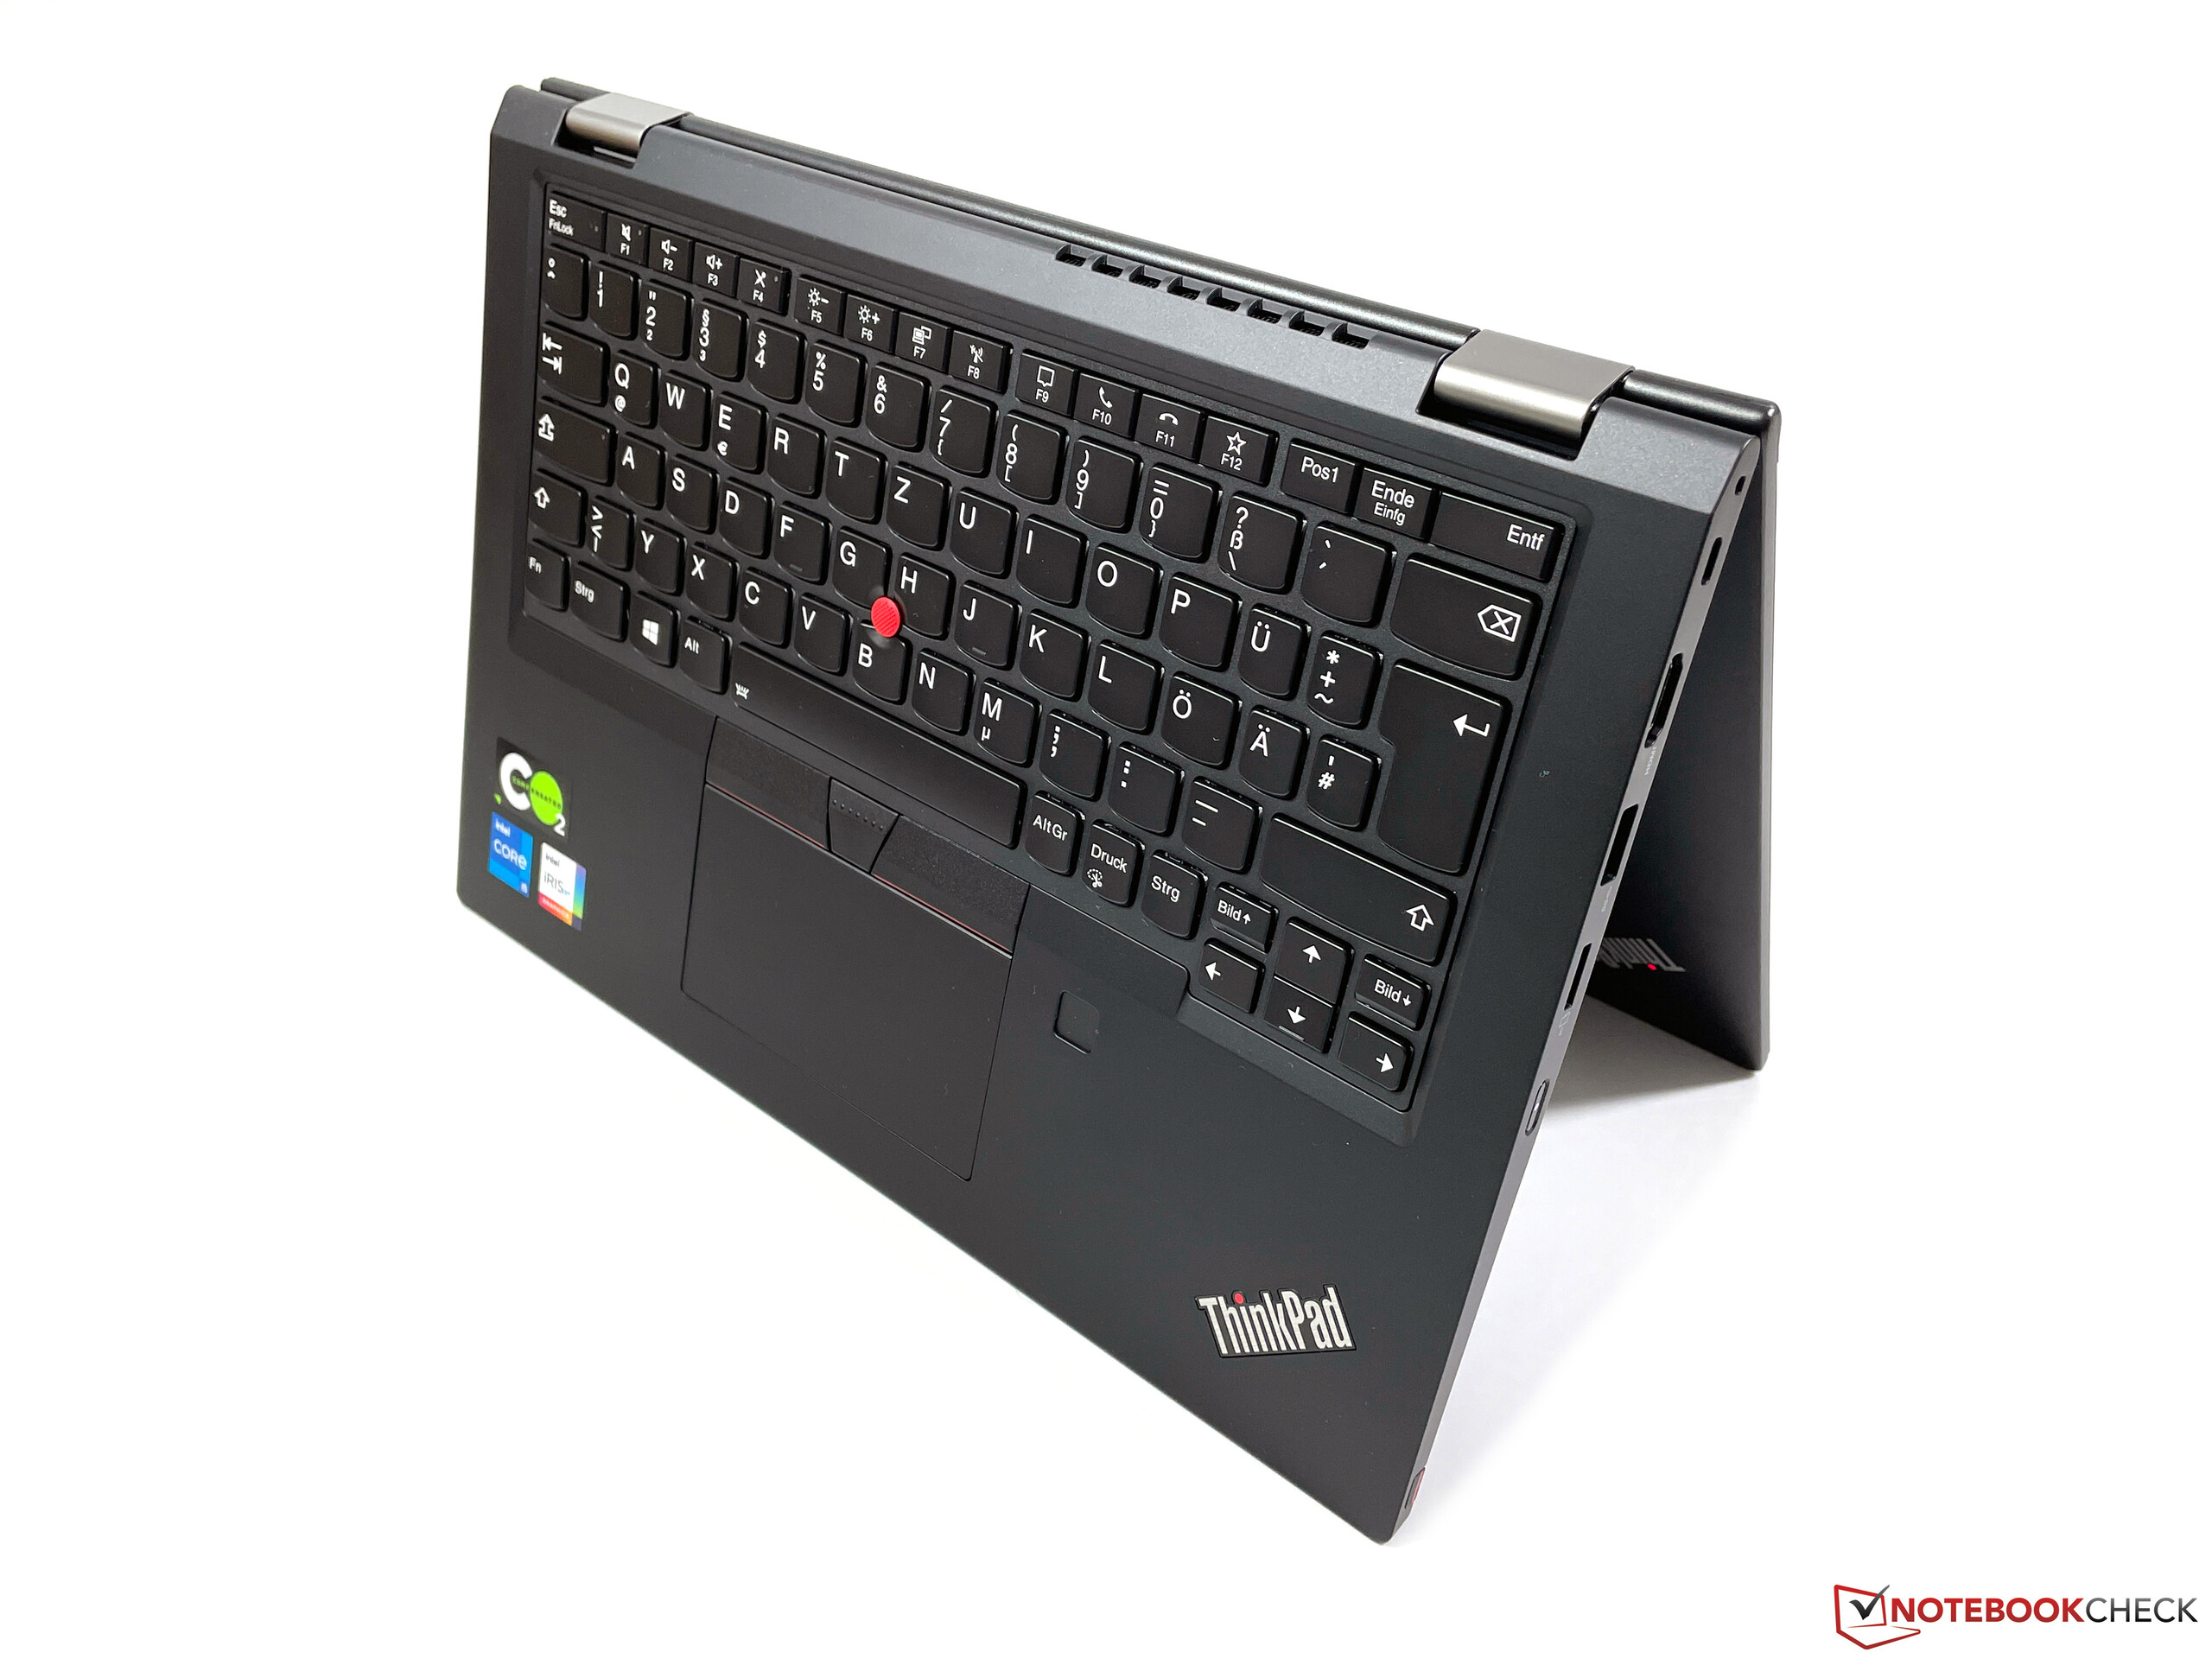
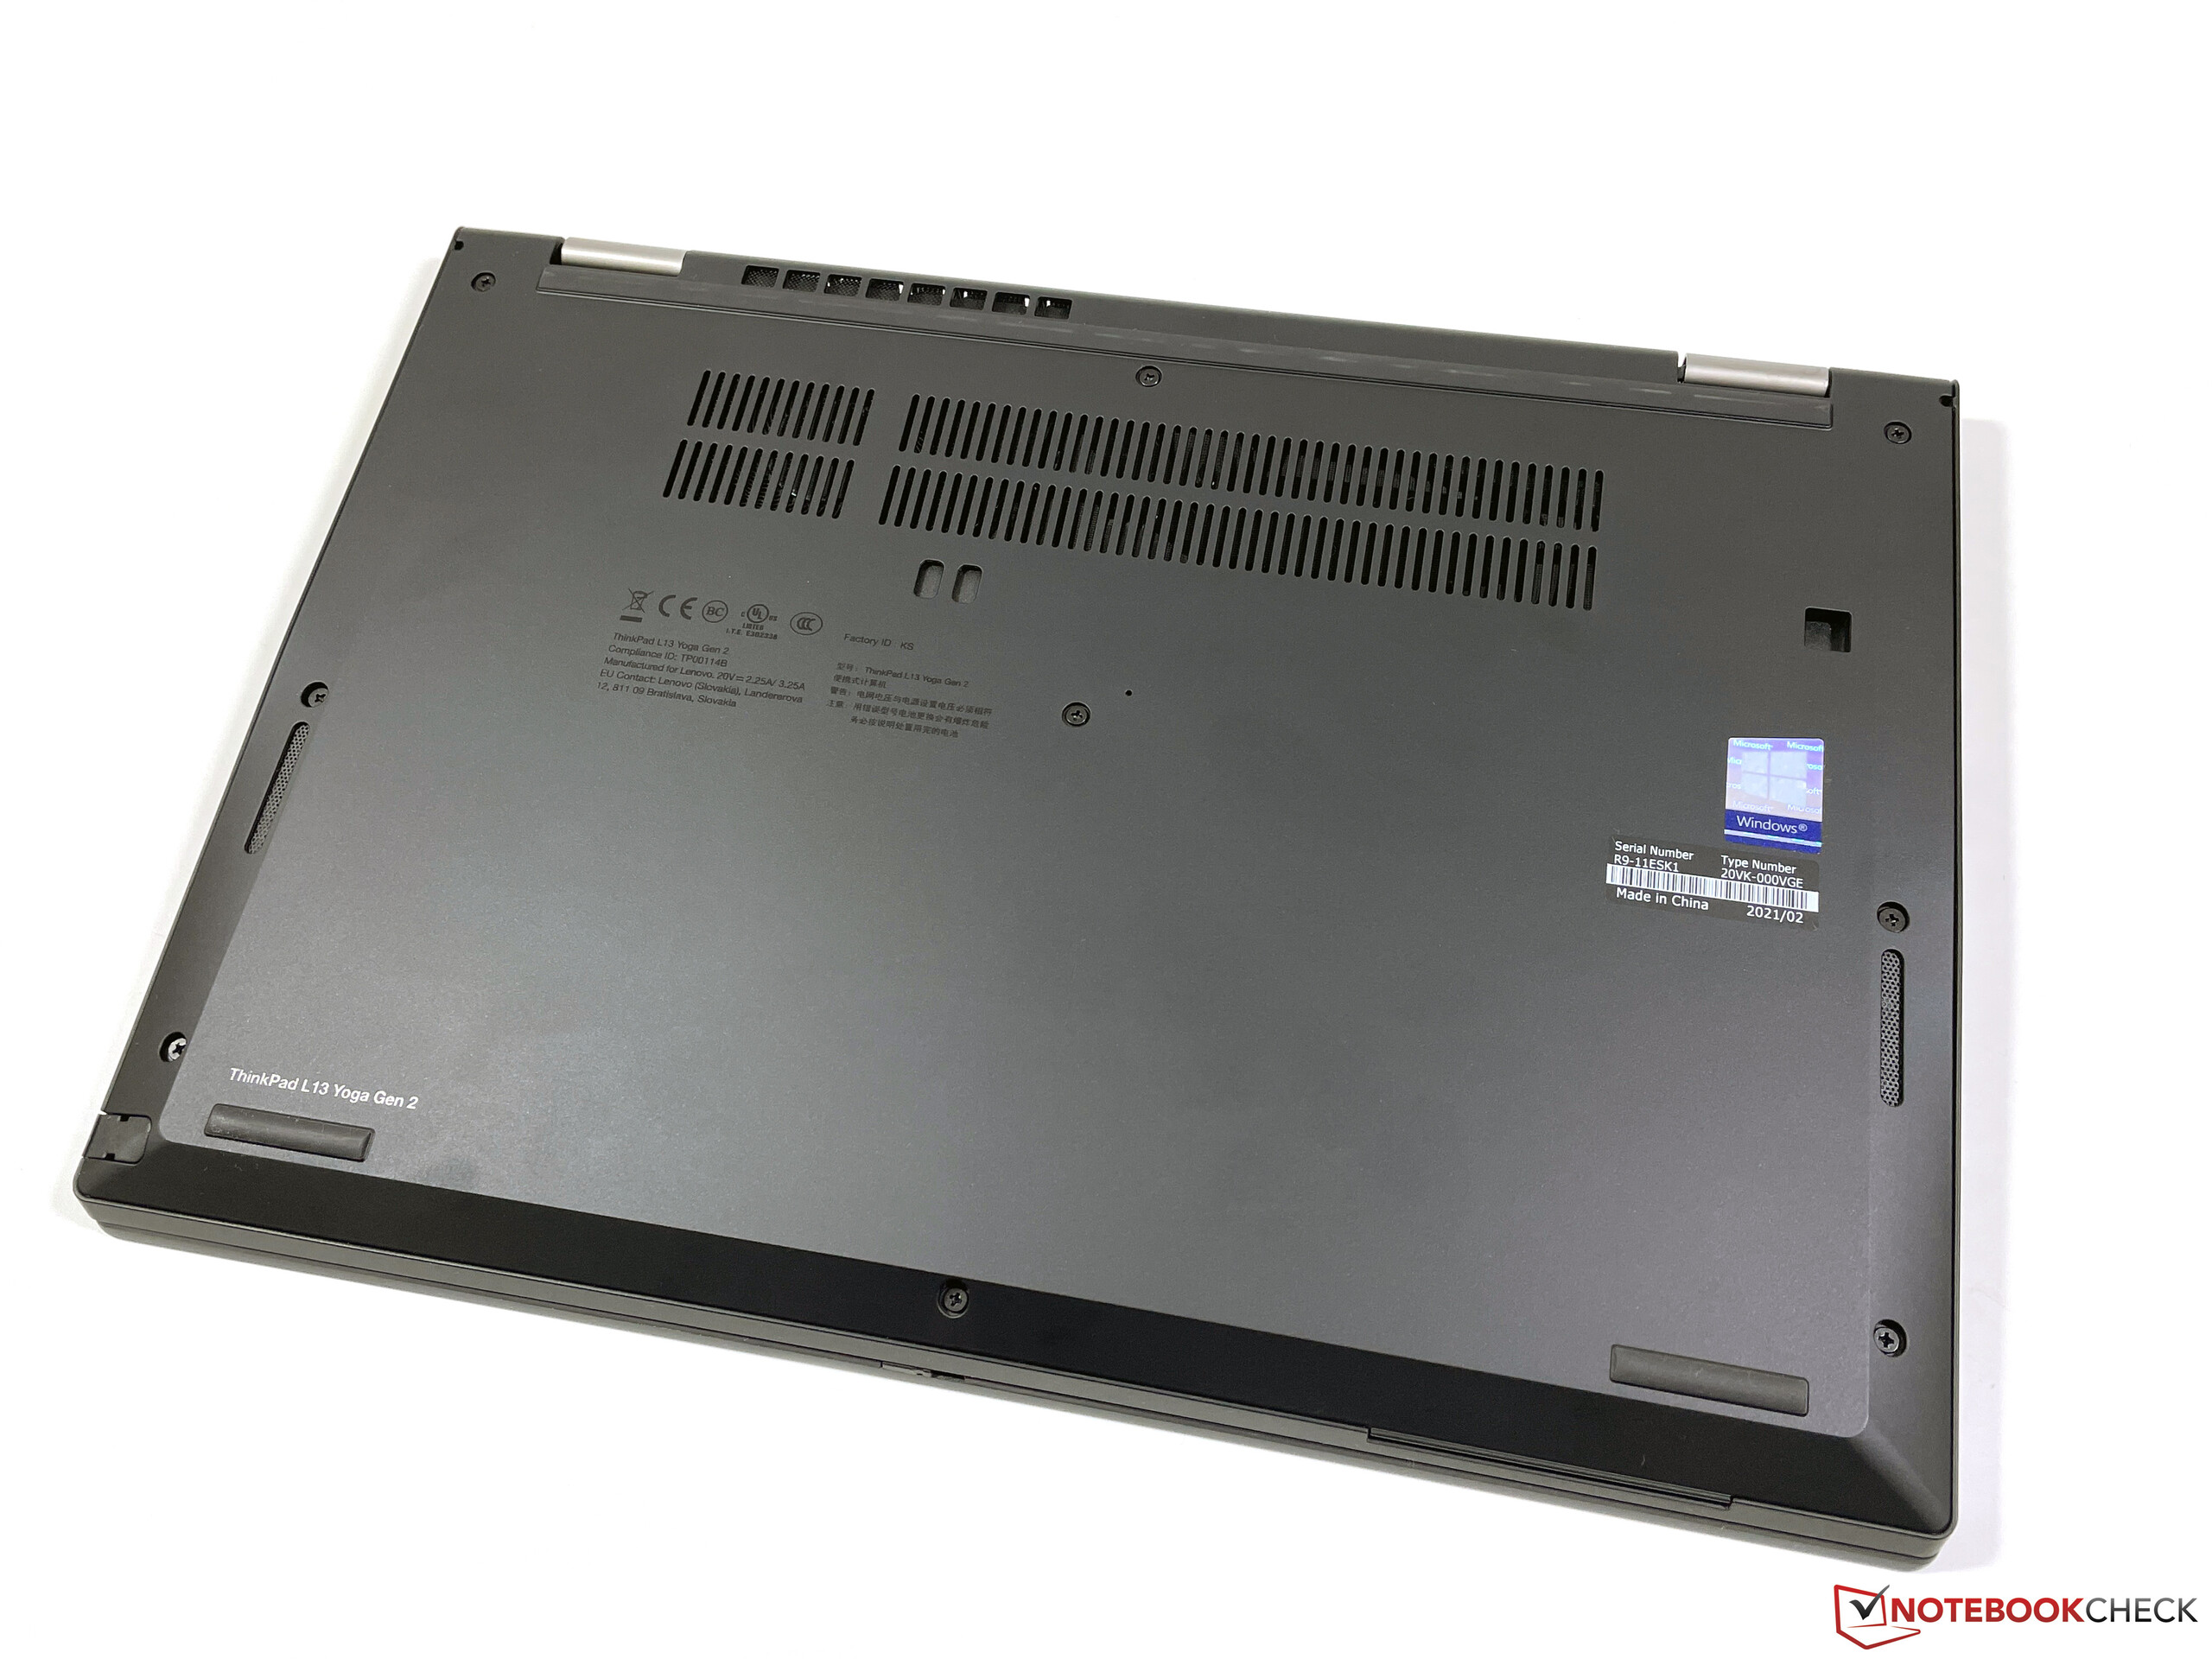
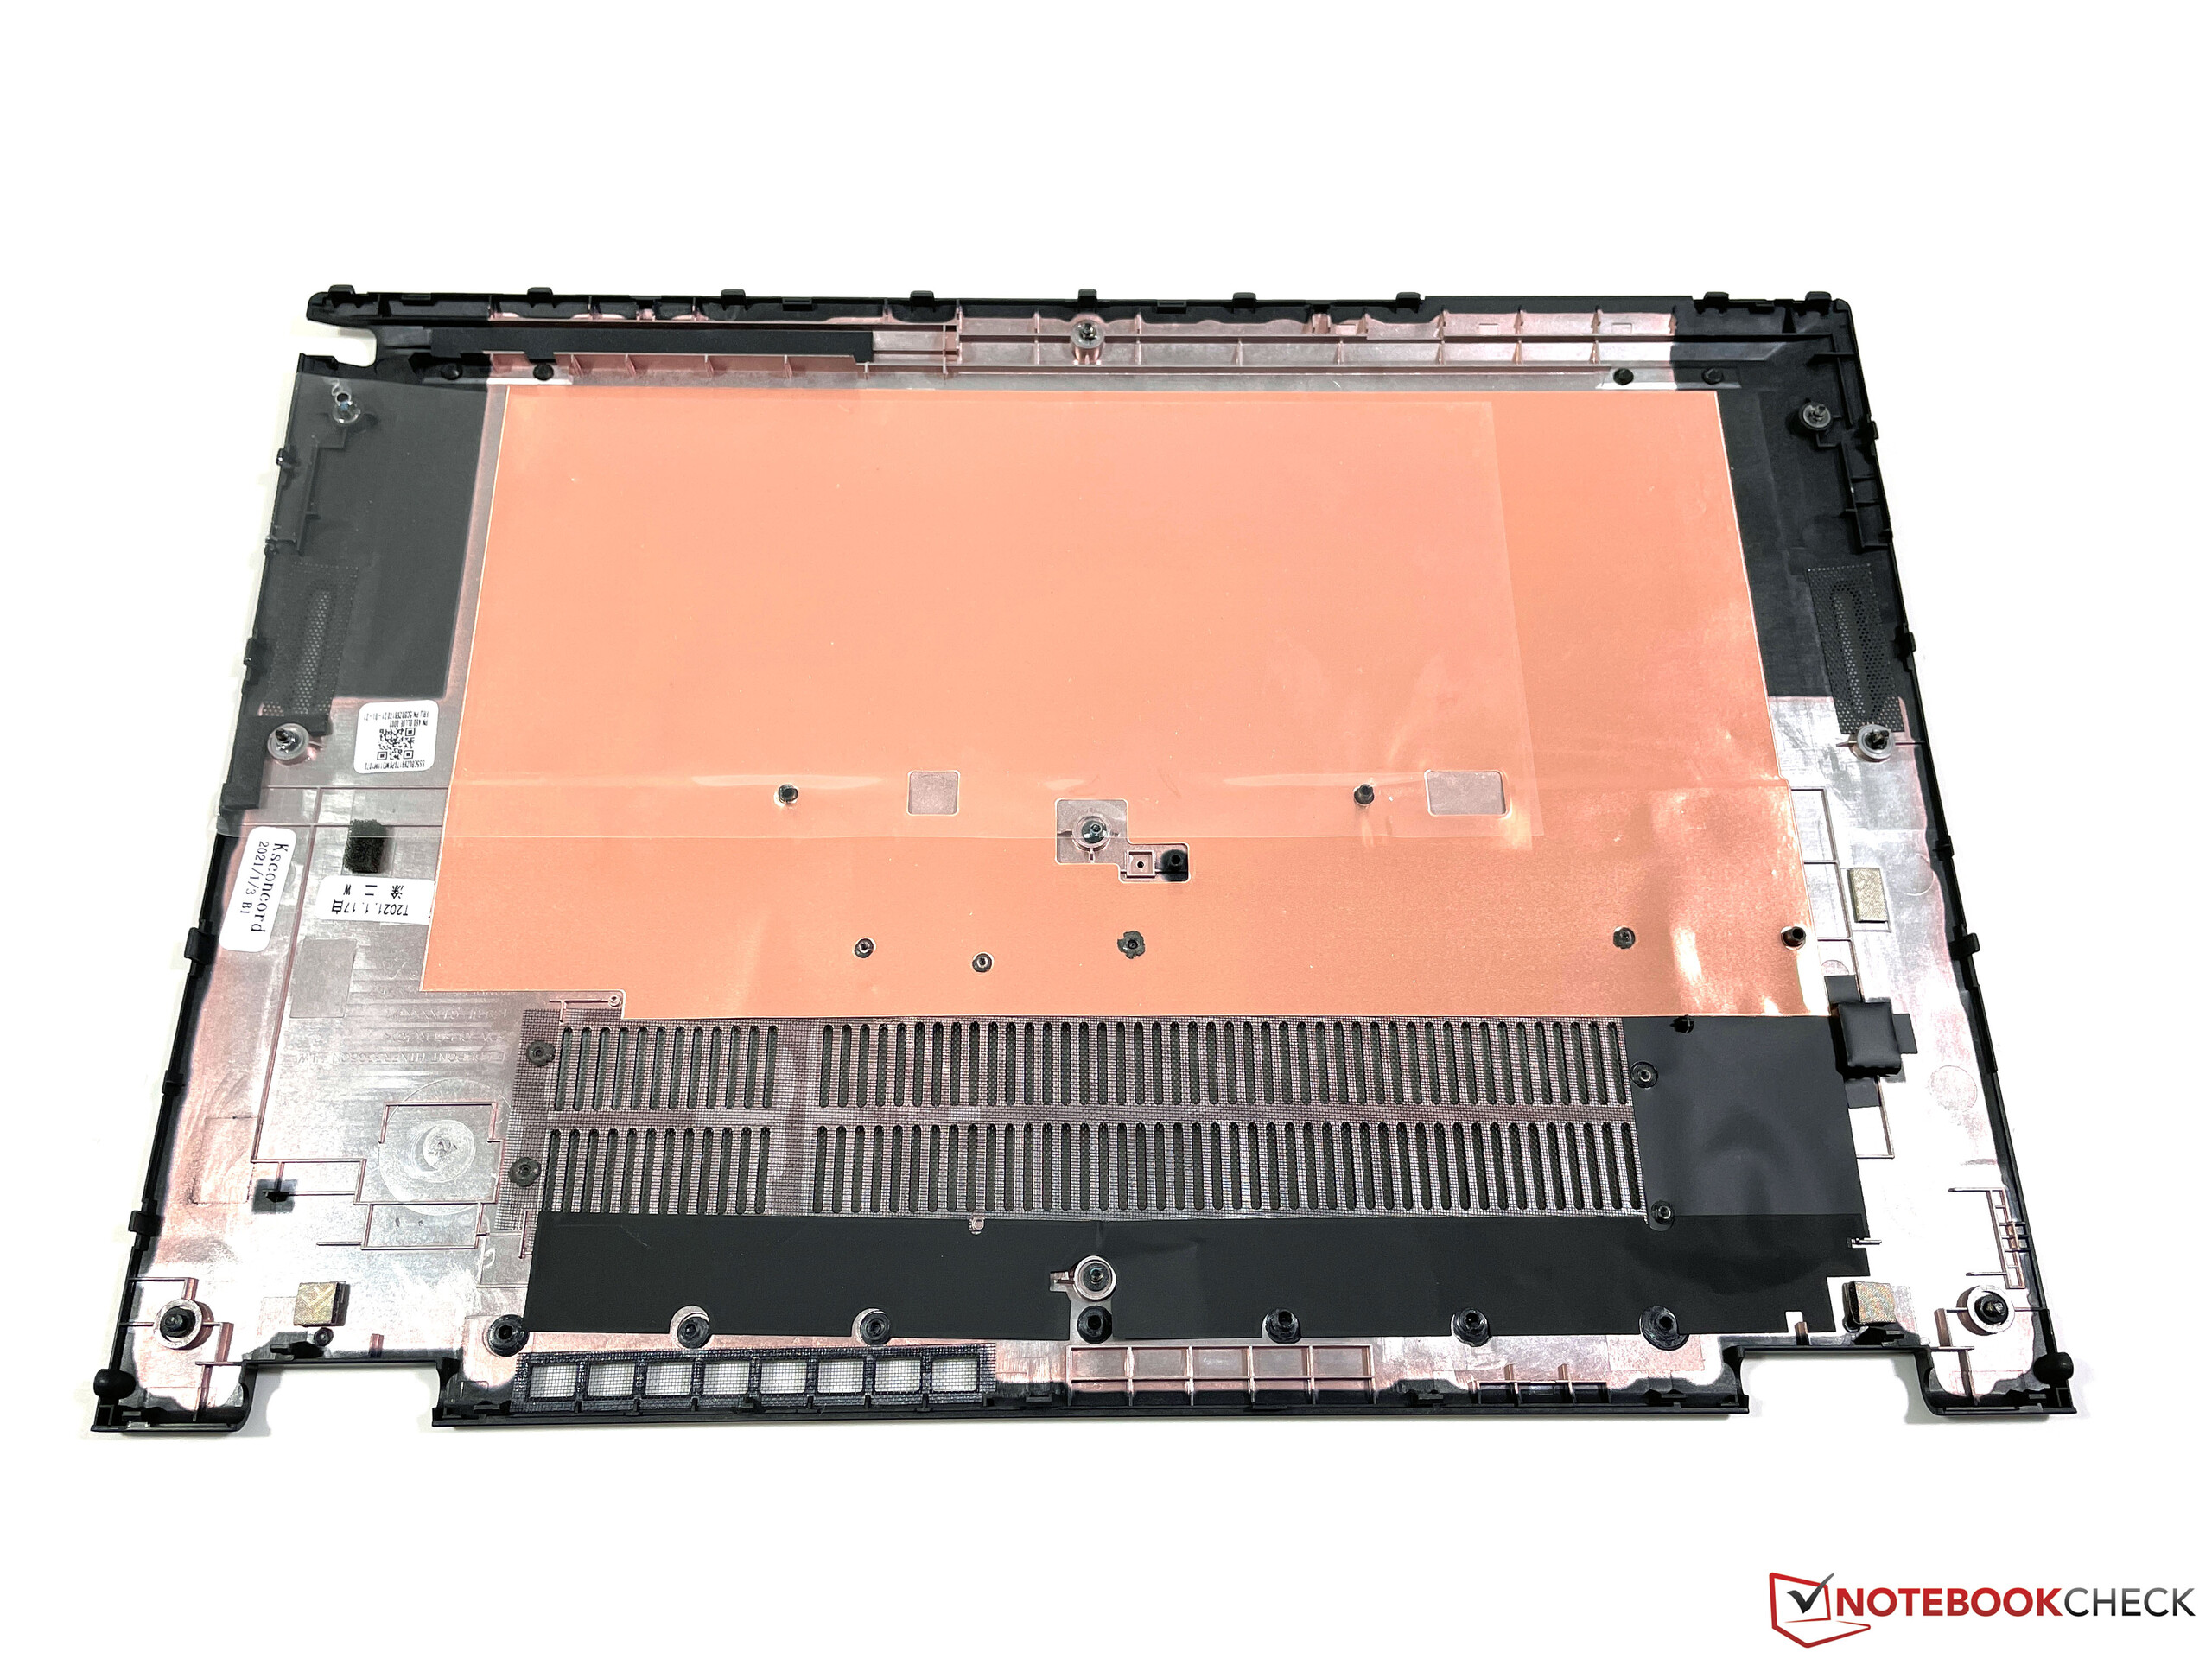
Case - Typical ThinkPad convertible

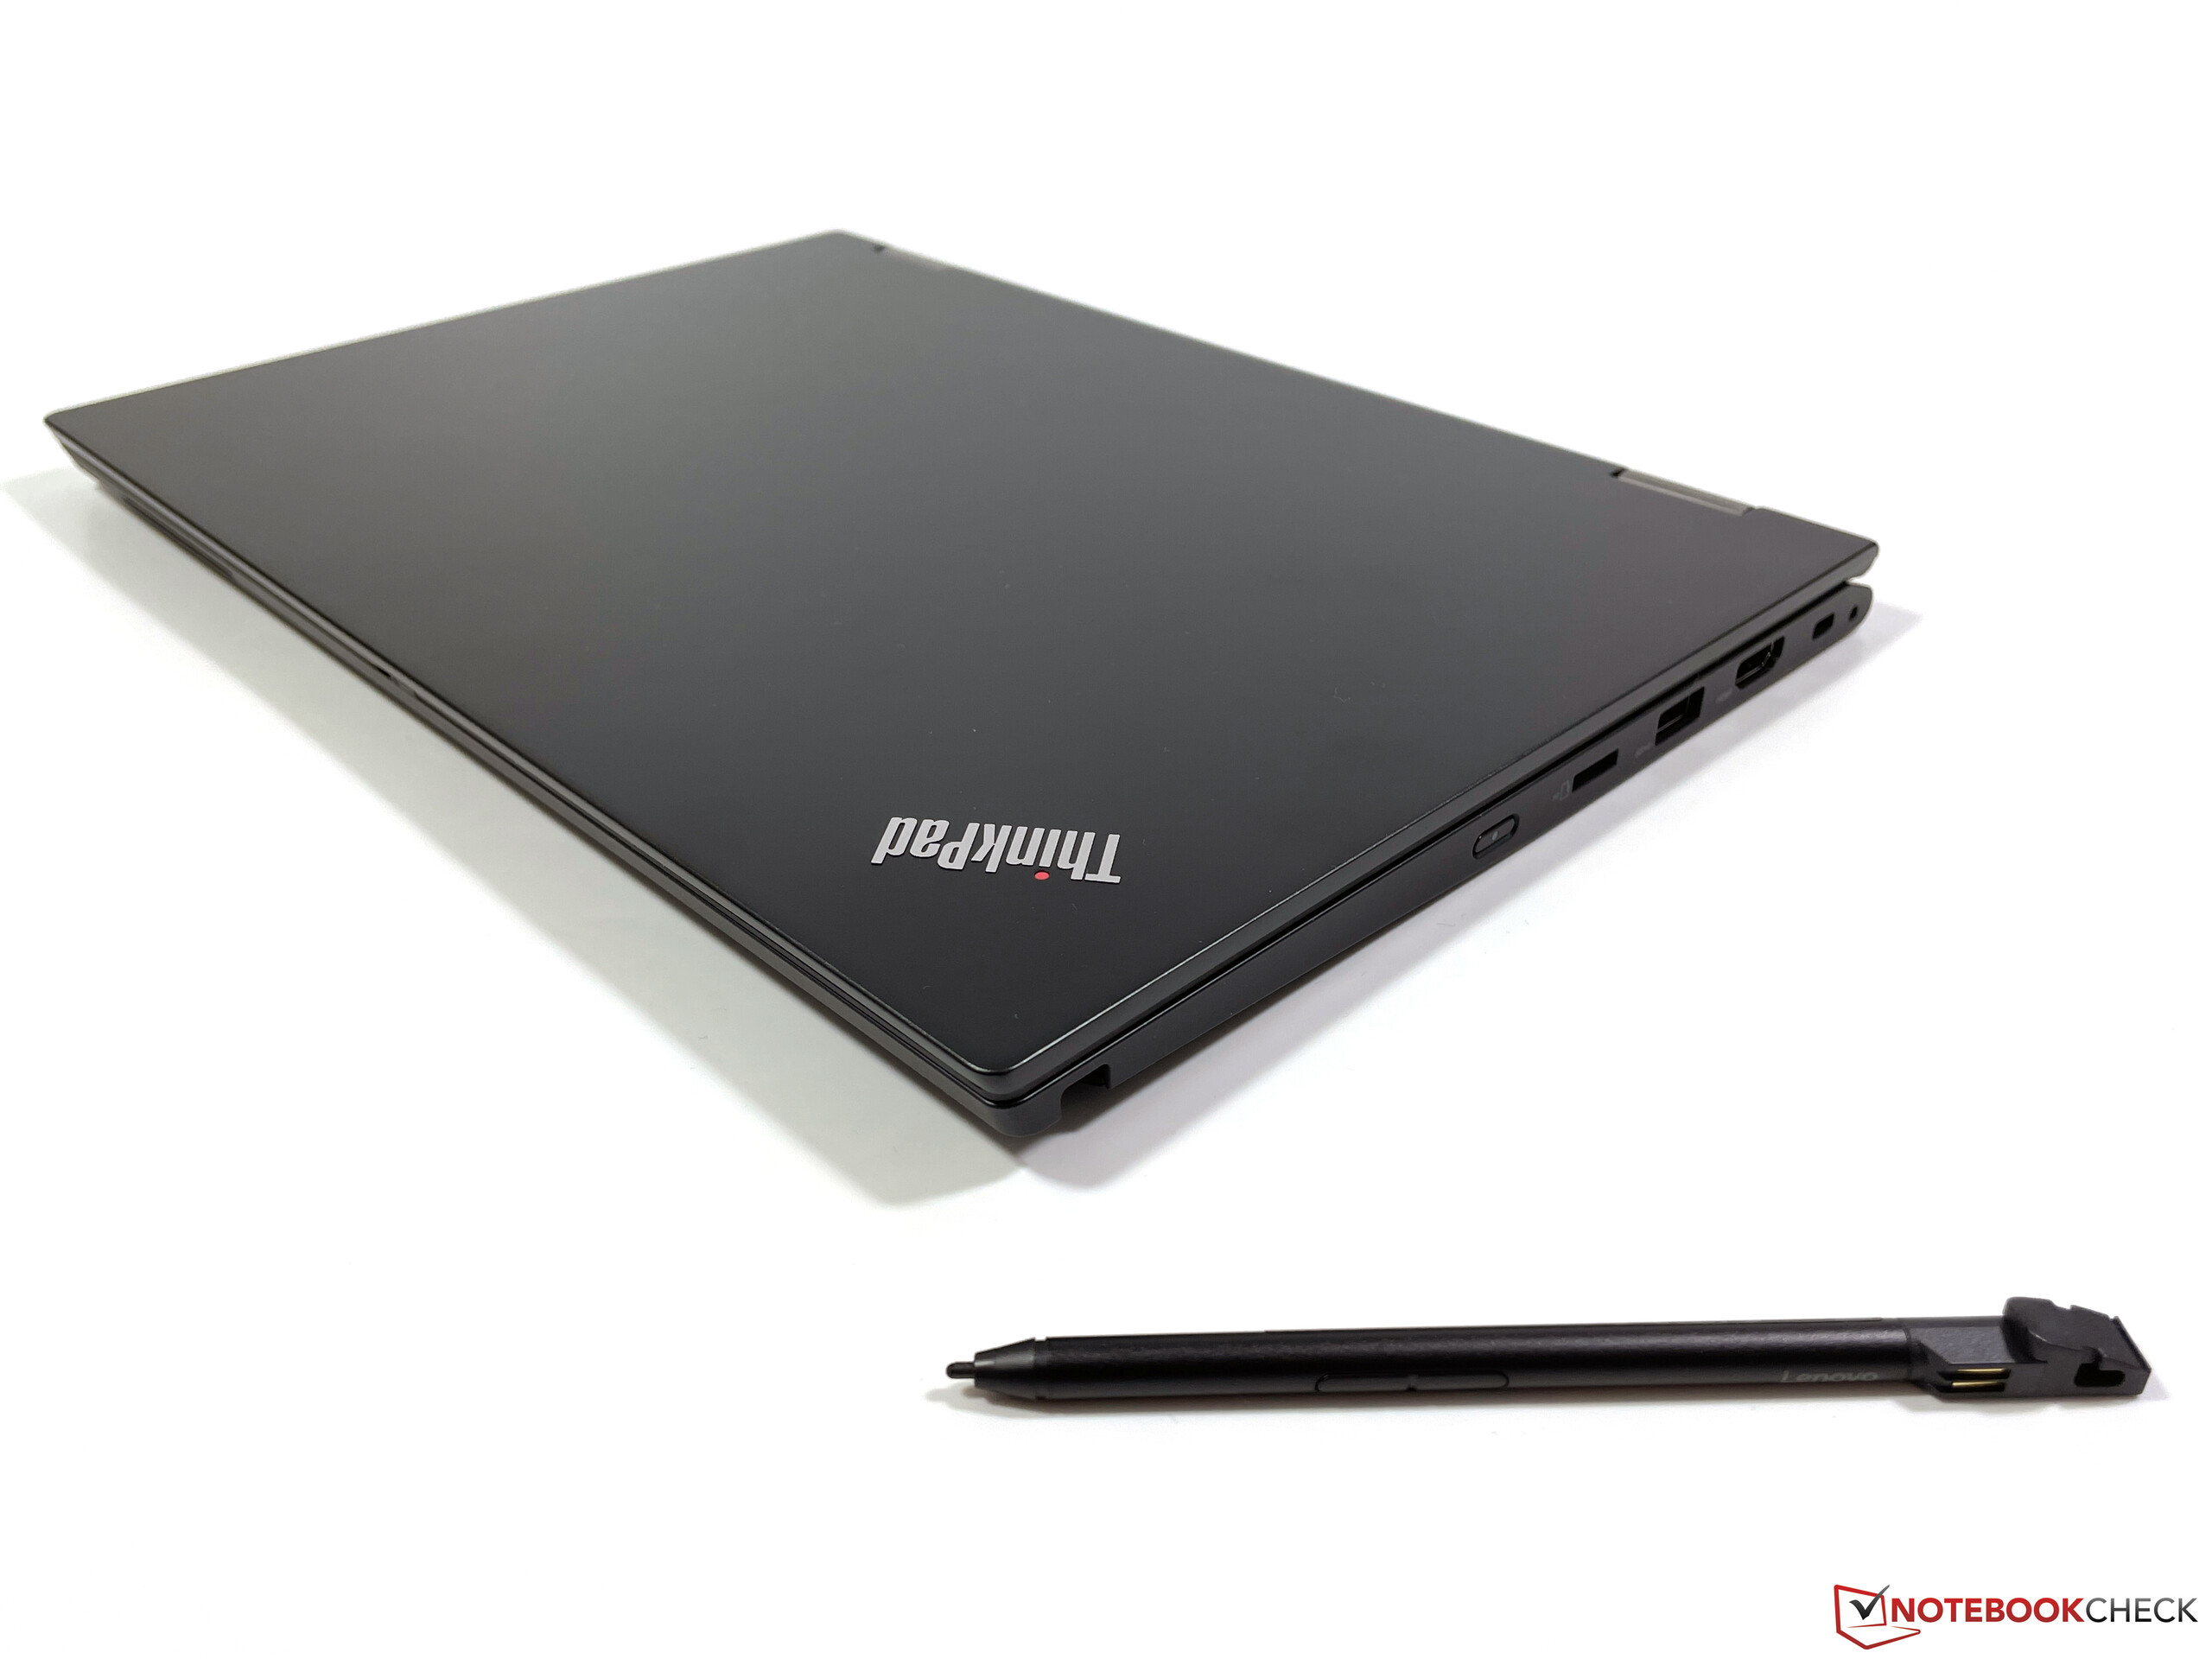
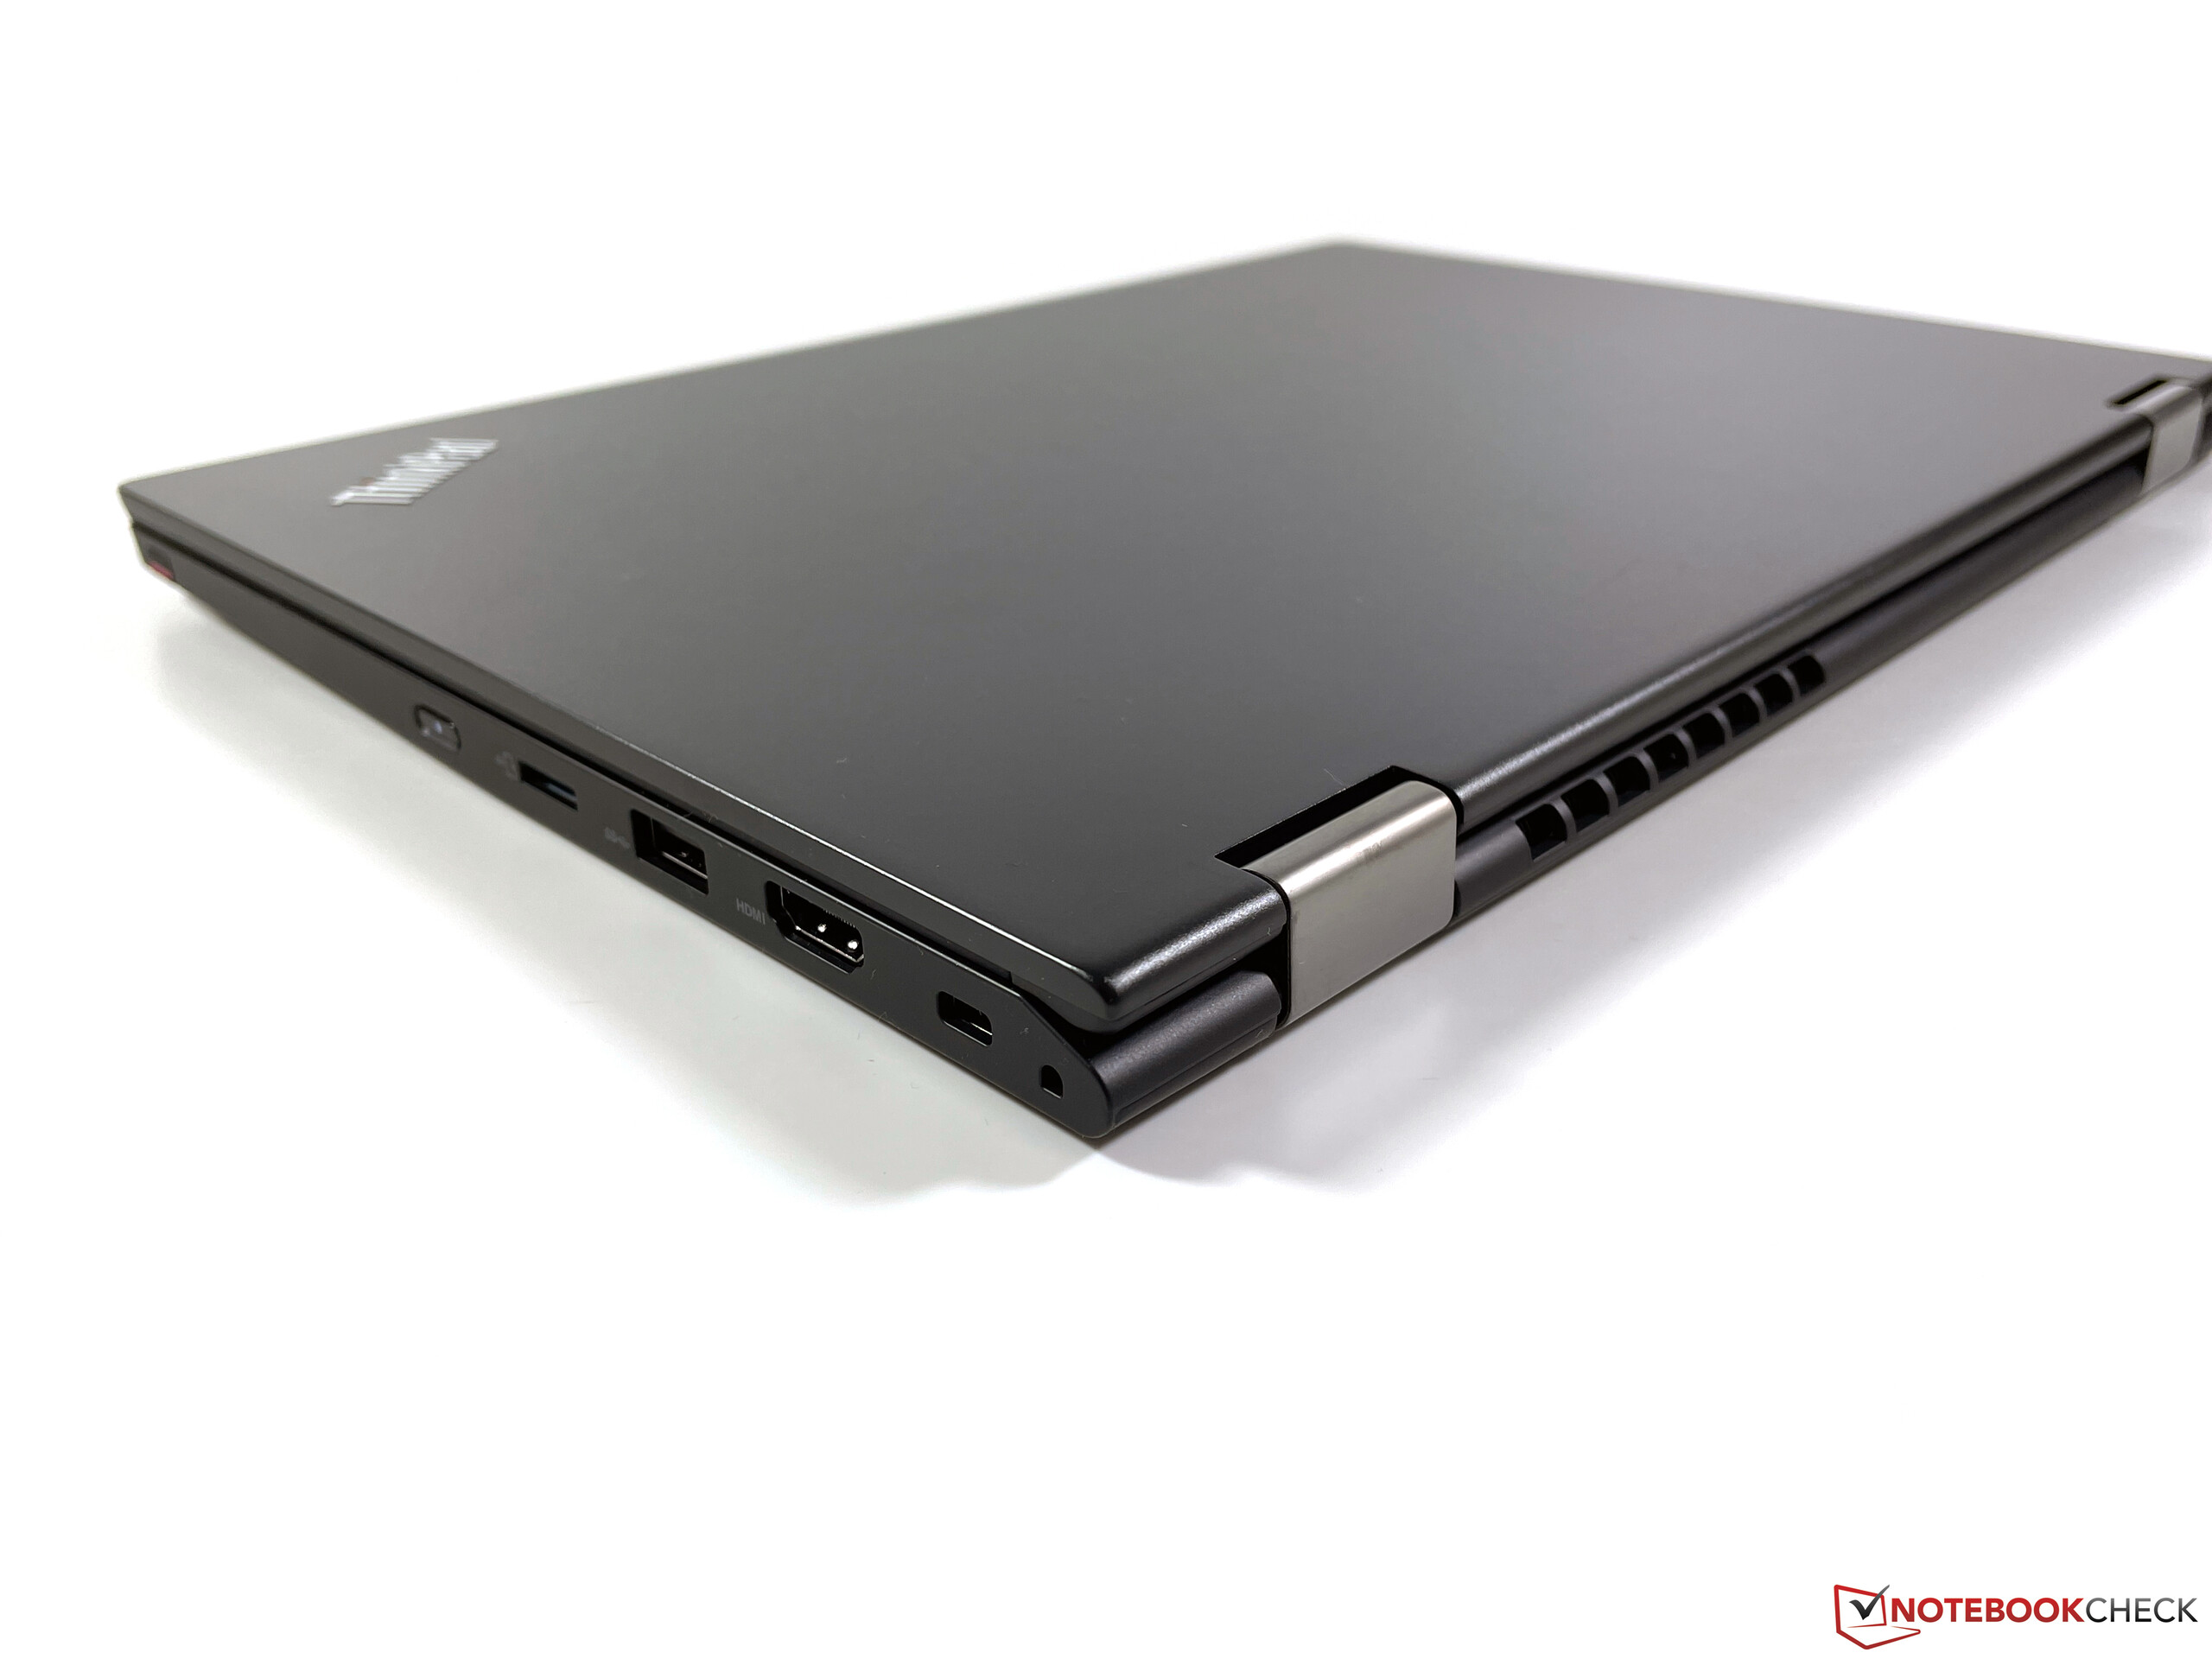
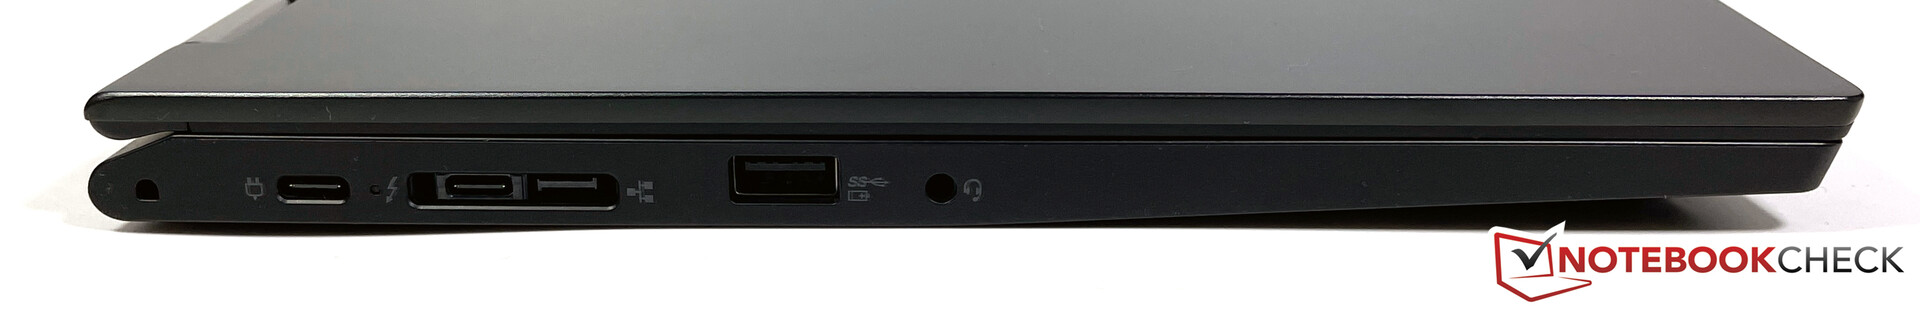
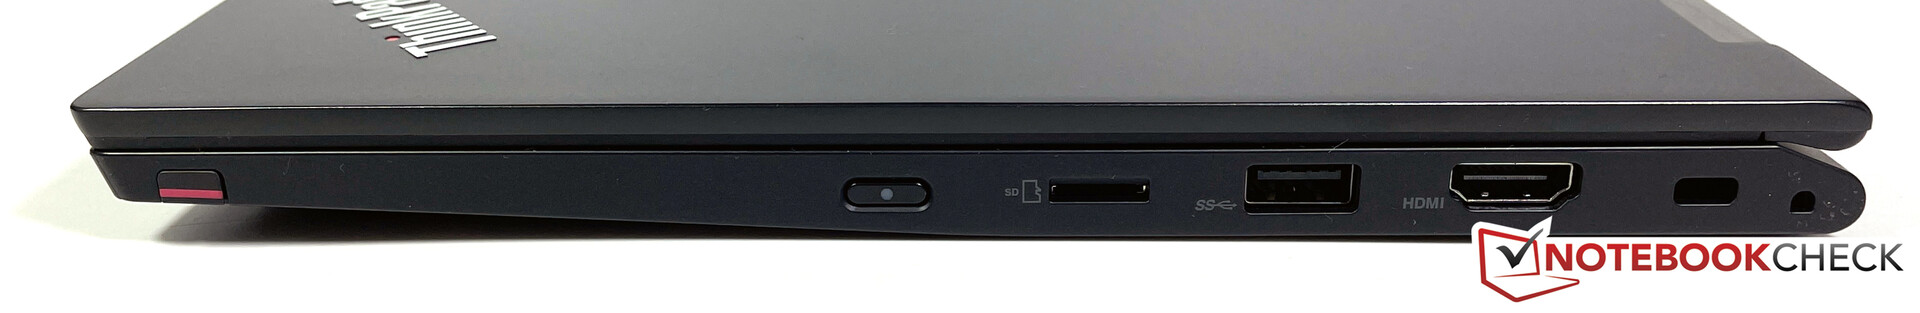
Connectivity - ThinkPad now comes with Thunderbolt 4
The layout and number of ports hasn't changed, but the USB ports have now become faster. Another new feature is that one of the two USB-C ports supports Thunderbolt 4. The HDMI output is now also compliant with the 2.0 standard; therefore, it supports output to a 4K monitor at 60 Hz.
SD card reader
| SD Card Reader | |
| average JPG Copy Test (av. of 3 runs) | |
| Fujitsu LifeBook U9310X (Toshiba Exceria Pro SDXC 64 GB UHS-II) | |
| Lenovo ThinkPad L13 Yoga Gen2-20VK000VGE (AV PRO V60) | |
| HP ProBook x360 435 G7, Ryzen 5 4500U (Toshiba Exceria Pro M501 64 GB UHS-II) | |
| Lenovo ThinkPad L13 Yoga 20R6S00800 | |
| Average of class Convertible (28.1 - 197, n=23, last 2 years) | |
| Acer Spin 5 SP513-54N-79EY (Toshiba Exceria Pro M501 microSDXC 64GB) | |
| maximum AS SSD Seq Read Test (1GB) | |
| Average of class Convertible (28.9 - 254, n=22, last 2 years) | |
| Fujitsu LifeBook U9310X (Toshiba Exceria Pro SDXC 64 GB UHS-II) | |
| HP ProBook x360 435 G7, Ryzen 5 4500U (Toshiba Exceria Pro M501 64 GB UHS-II) | |
| Lenovo ThinkPad L13 Yoga 20R6S00800 (Toshiba Exceria Pro M501 64 GB UHS-II) | |
| Lenovo ThinkPad L13 Yoga Gen2-20VK000VGE (AV PRO V60) | |
| Acer Spin 5 SP513-54N-79EY (Toshiba Exceria Pro M501 microSDXC 64GB) | |
Communication
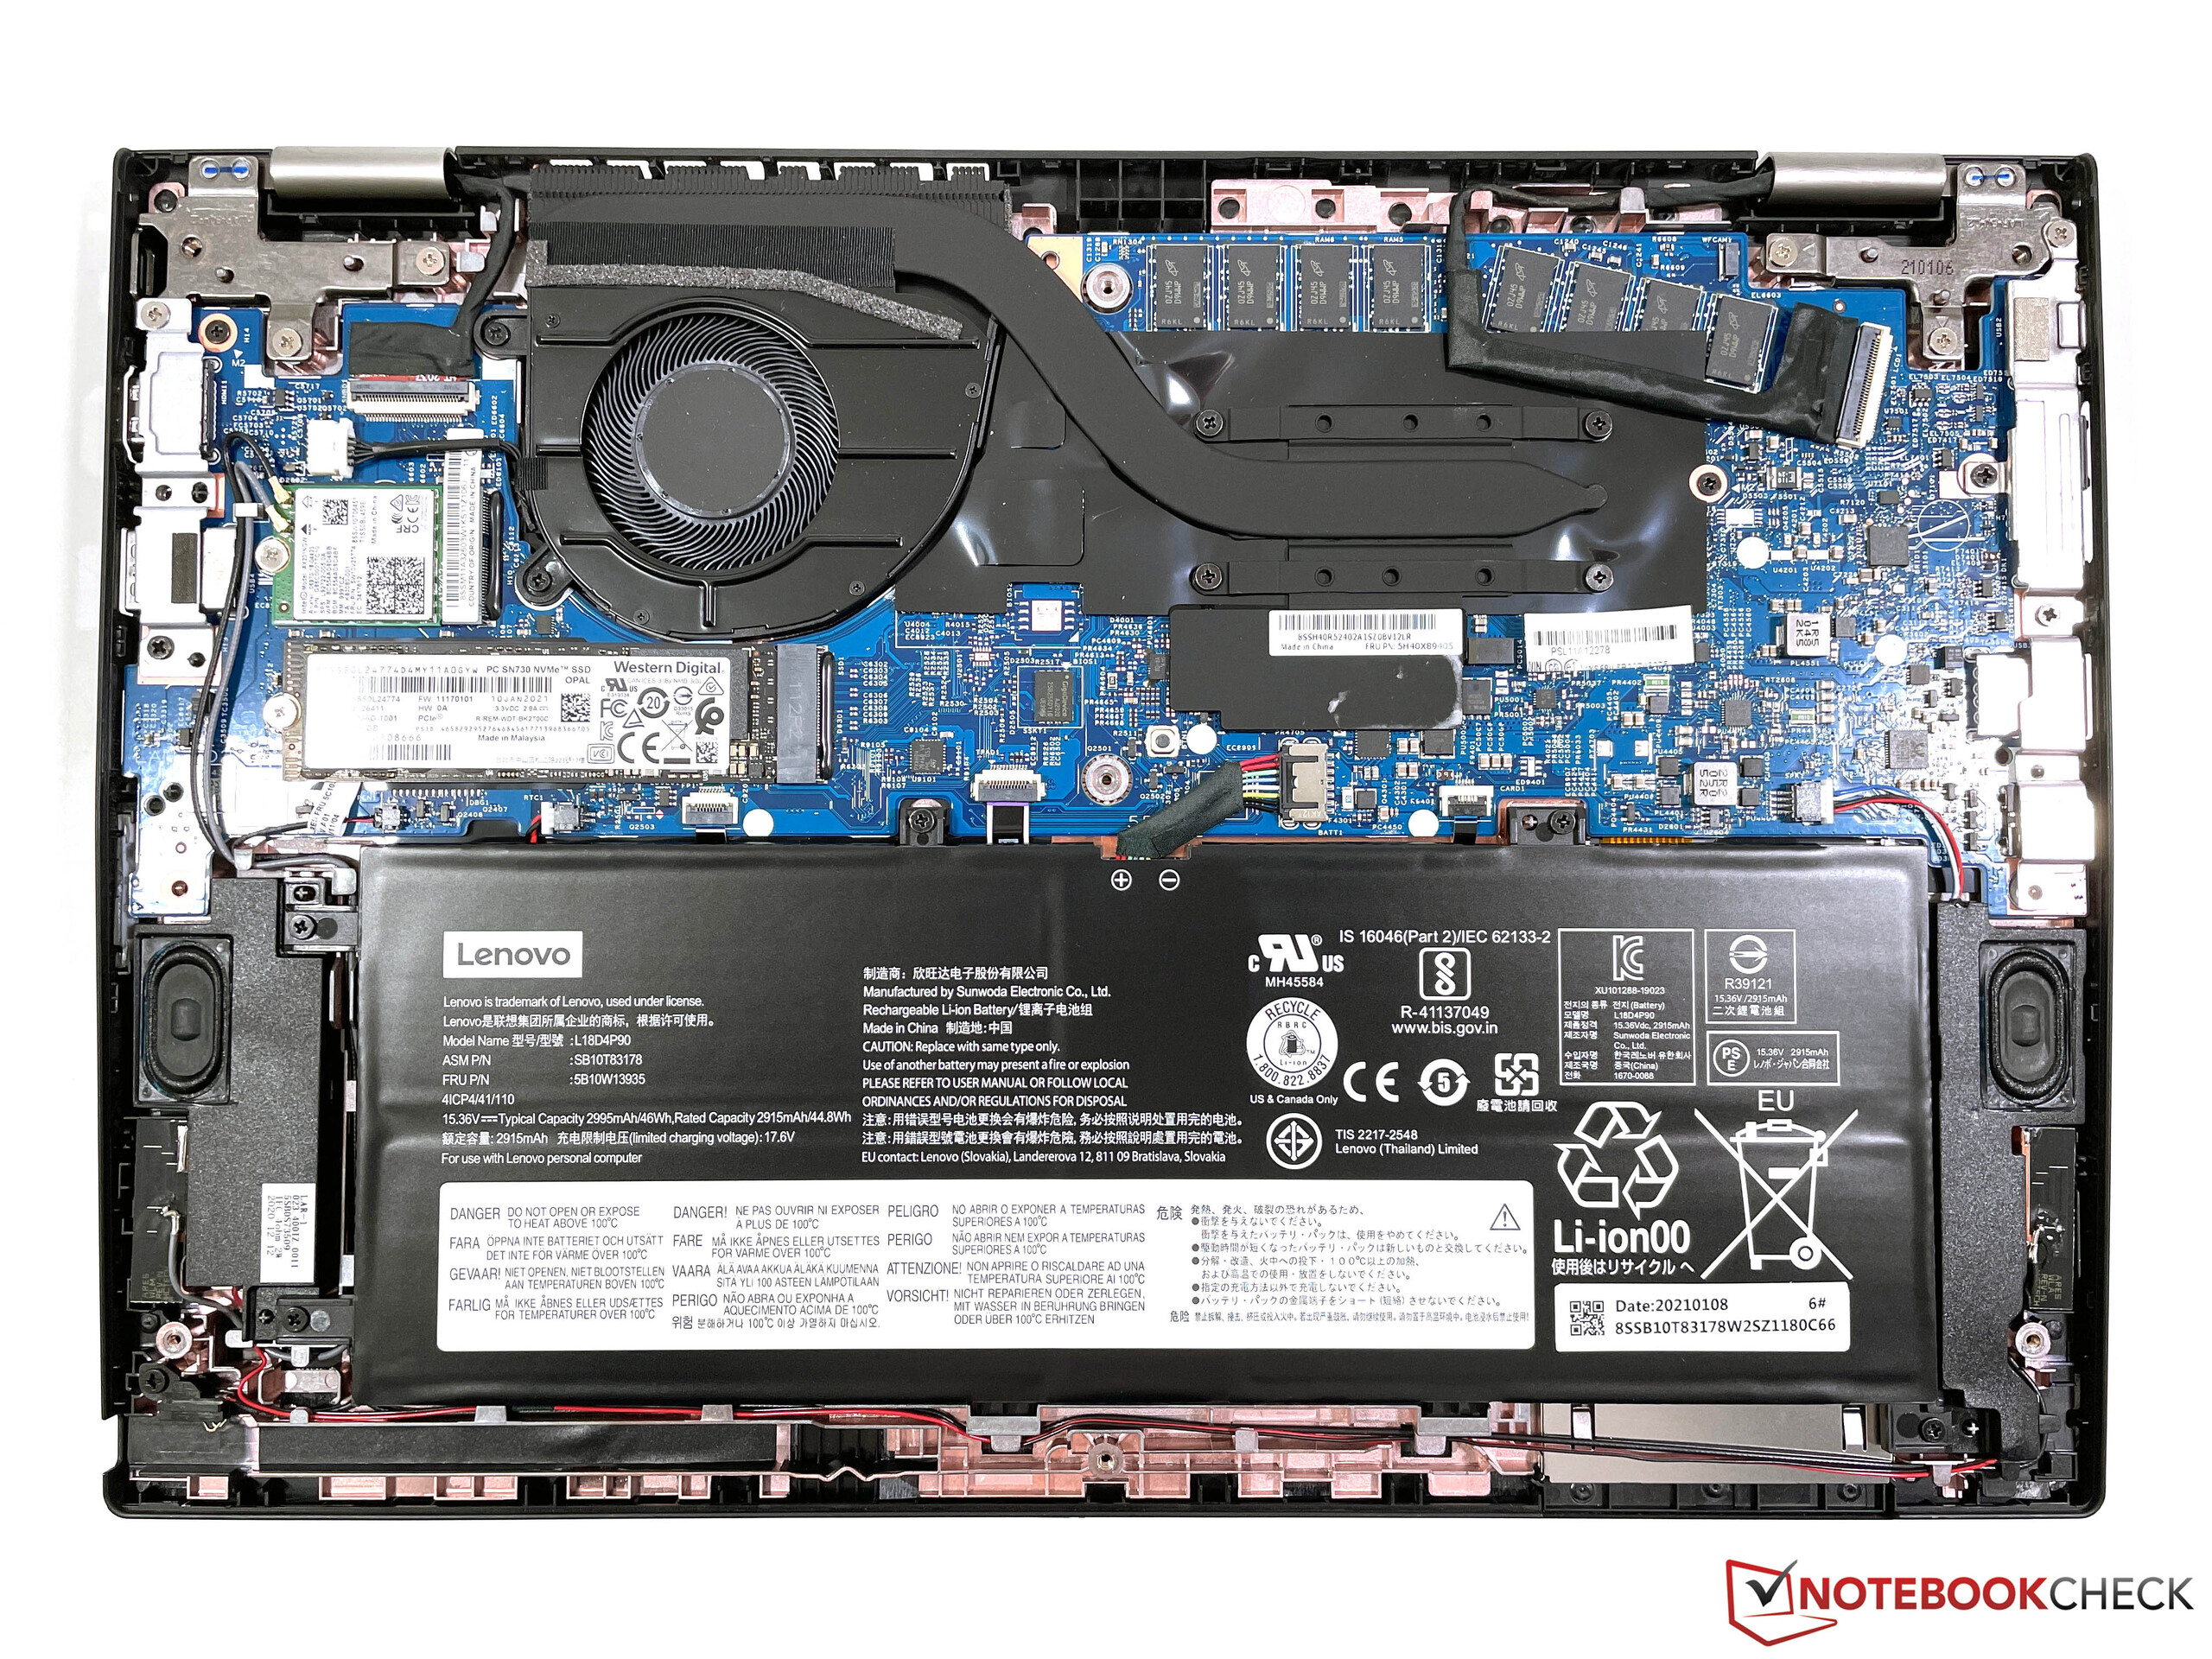
The modern Intel WLAN module (AX201) achieves very high transfer rates in our test with the Netgear Nighthawk RAX120 router. The WLAN module (M.2 2242) can also be replaced if necessary, but the ThinkPad L13 Yoga Gen 2 is not equipped with a WWAN module.
Webcam


Display - L13 Yoga with 1080p touchscreen
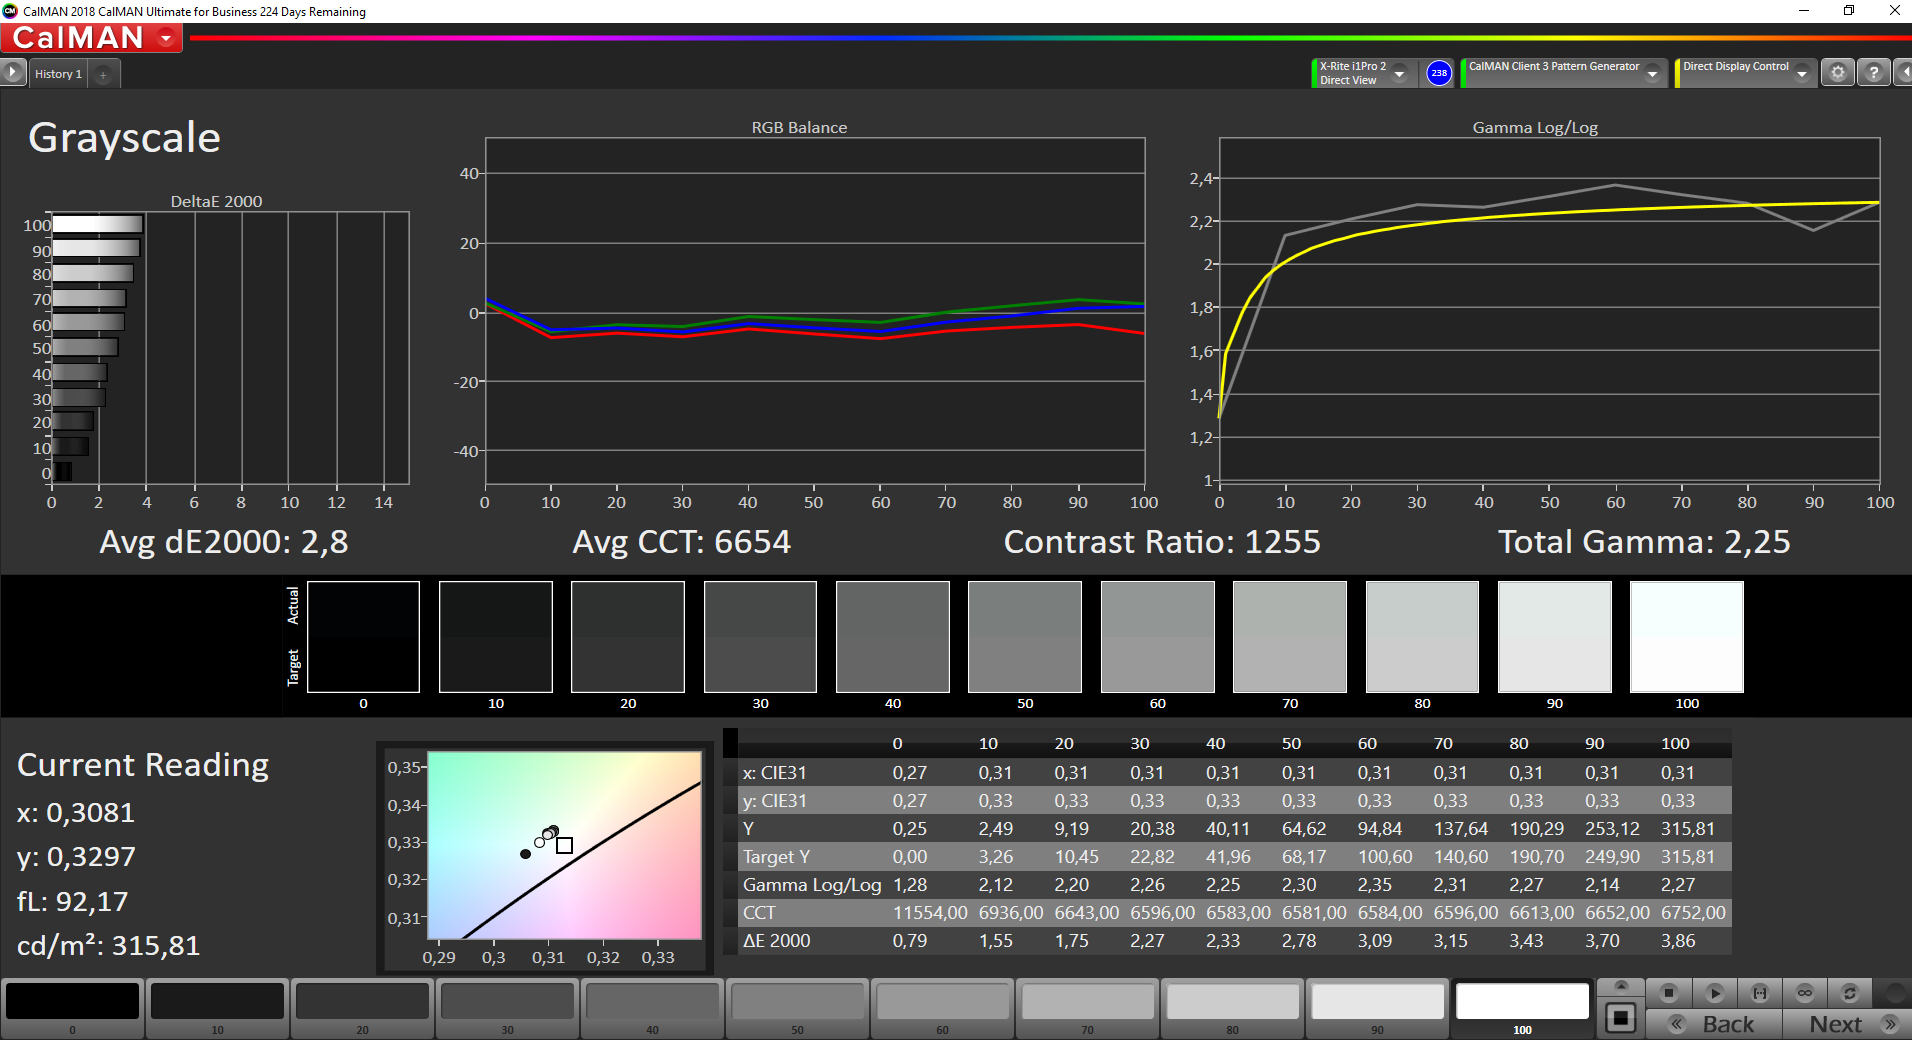
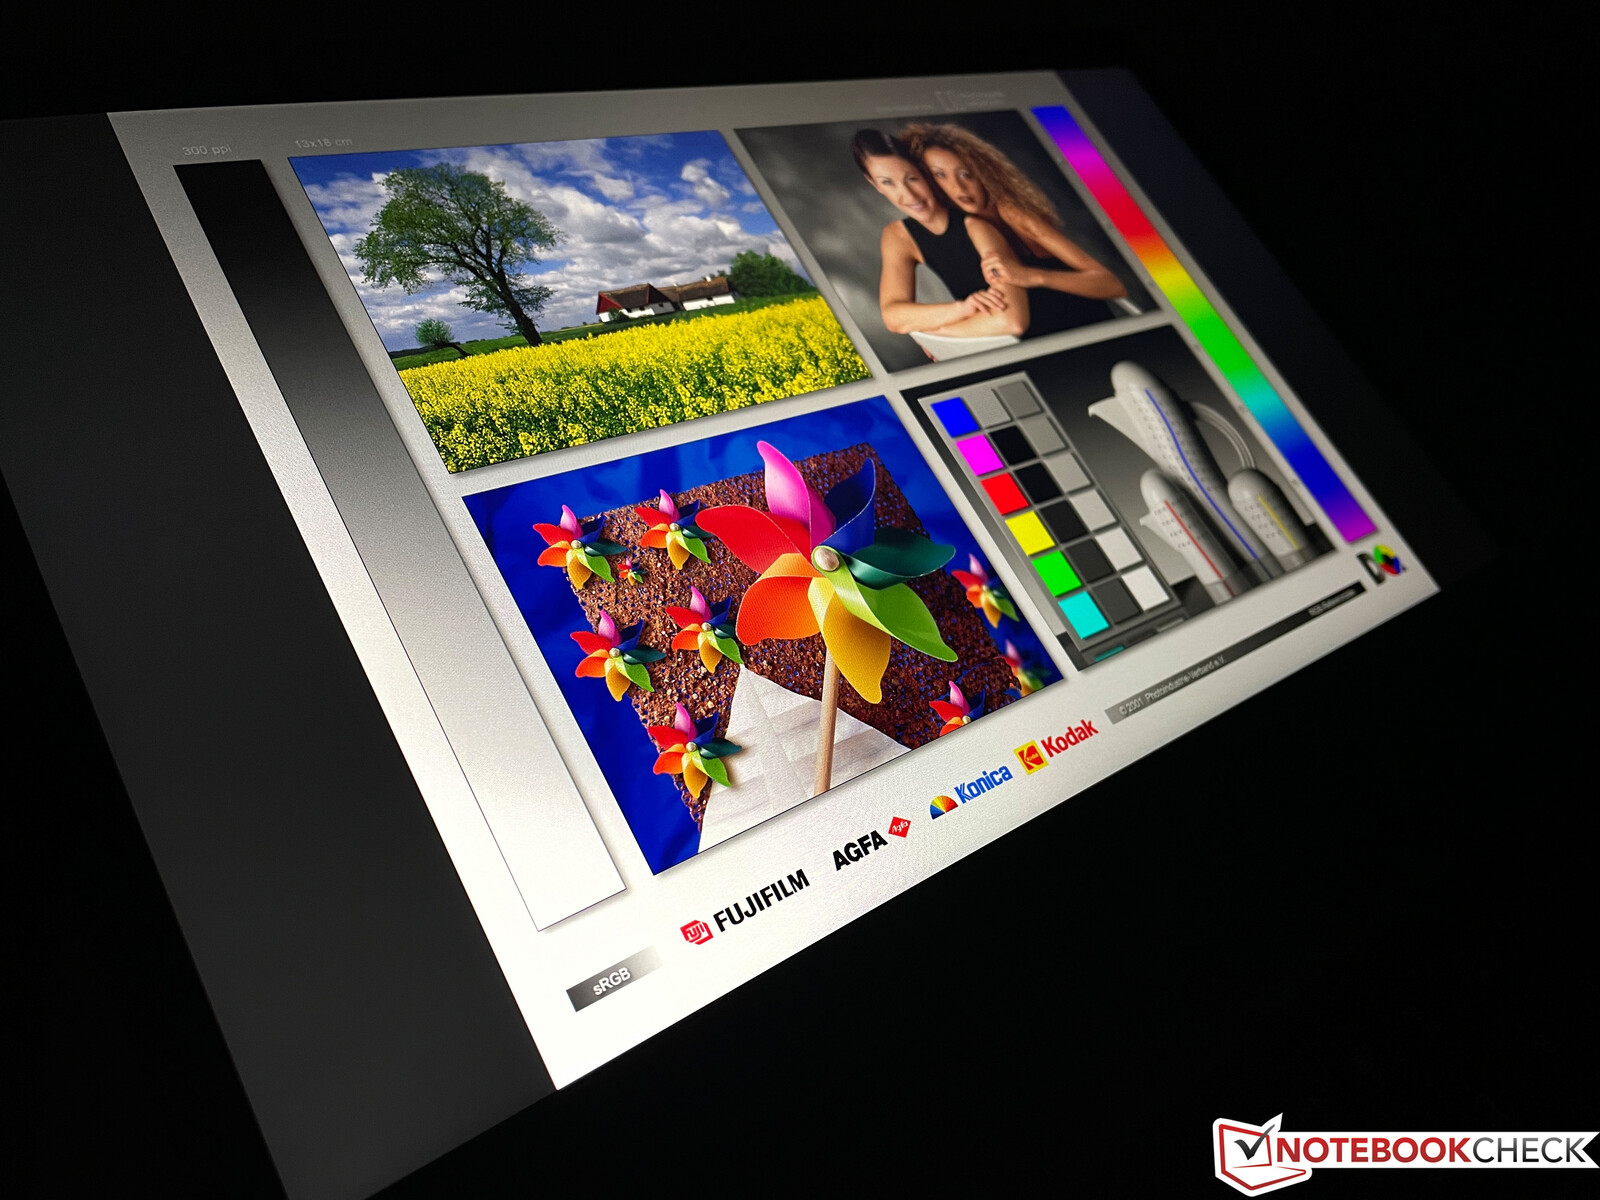
Nothing has changed as far as the 13.3-inch display is concerned. It's still a glossy capacitive touchscreen with Full HD resolution. The subjective image quality is very good, even though the measured values are slightly worse than those of the predecessor with the same panel. However, we're still within the range of the series variation here.
The average brightness of around 300 cd/m² is exactly on target, and the contrast ratio of over 1,200:1 is also very respectable. Once again, we measure PWM flickering starting at brightness levels of 50% and below, but the high frequency of 25 kHz shouldn't cause any problems. We can also see slight screen bleeding at the edges against a black background, but this isn't visible in practice.
| |||||||||||||||||||||||||
Brightness Distribution: 92 %
Center on Battery: 313 cd/m²
Contrast: 1264:1 (Black: 0.25 cd/m²)
ΔE ColorChecker Calman: 1.7 | ∀{0.5-29.43 Ø4.73}
calibrated: 0.7
ΔE Greyscale Calman: 2.8 | ∀{0.09-98 Ø4.97}
99.4% sRGB (Argyll 1.6.3 3D)
64.5% AdobeRGB 1998 (Argyll 1.6.3 3D)
70.7% AdobeRGB 1998 (Argyll 3D)
99.4% sRGB (Argyll 3D)
68.5% Display P3 (Argyll 3D)
Gamma: 2.25
CCT: 6654 K
| Lenovo ThinkPad L13 Yoga Gen2-20VK000VGE N133HCE-EP2, IPS, 1920x1080, 13.3" | HP ProBook x360 435 G7, Ryzen 5 4500U LGD0675, IPS LED, 1920x1080, 13.3" | Acer Spin 5 SP513-54N-79EY BOE08BC, IPS, 2256x1504, 13.5" | Fujitsu LifeBook U9310X LQ133M1JW48, IPS, 1920x1080, 13.3" | Lenovo ThinkPad L13 Yoga 20R6S00800 N133HCE-EP2, IPS, 1920x1080, 13.3" | |
|---|---|---|---|---|---|
| Display | -9% | 0% | -4% | -2% | |
| Display P3 Coverage (%) | 68.5 | 63.1 -8% | 69.4 1% | 66.4 -3% | 68.1 -1% |
| sRGB Coverage (%) | 99.4 | 90.8 -9% | 99.6 0% | 96.9 -3% | 94.7 -5% |
| AdobeRGB 1998 Coverage (%) | 70.7 | 64.5 -9% | 71 0% | 67.4 -5% | 70.2 -1% |
| Response Times | -1% | 0% | -26% | 10% | |
| Response Time Grey 50% / Grey 80% * (ms) | 44.4 ? | 45.6 ? -3% | 49 ? -10% | 62.4 ? -41% | 40 ? 10% |
| Response Time Black / White * (ms) | 31.2 ? | 30.8 ? 1% | 28 ? 10% | 34.4 ? -10% | 28 ? 10% |
| PWM Frequency (Hz) | 25000 ? | 208 ? | 211.9 ? | 25000 ? | |
| Screen | -26% | 16% | -10% | 16% | |
| Brightness middle (cd/m²) | 316 | 354 12% | 454 44% | 345 9% | 340 8% |
| Brightness (cd/m²) | 299 | 344 15% | 426 42% | 317 6% | 336 12% |
| Brightness Distribution (%) | 92 | 83 -10% | 91 -1% | 86 -7% | 90 -2% |
| Black Level * (cd/m²) | 0.25 | 0.16 36% | 0.33 -32% | 0.24 4% | 0.18 28% |
| Contrast (:1) | 1264 | 2213 75% | 1376 9% | 1438 14% | 1889 49% |
| Colorchecker dE 2000 * | 1.7 | 3.4 -100% | 1.27 25% | 2.7 -59% | 1.3 24% |
| Colorchecker dE 2000 max. * | 3.8 | 5.8 -53% | 2.42 36% | 4.2 -11% | 2.8 26% |
| Colorchecker dE 2000 calibrated * | 0.7 | 2 -186% | 0.78 -11% | 1 -43% | 0.7 -0% |
| Greyscale dE 2000 * | 2.8 | 4.5 -61% | 1.07 62% | 3.3 -18% | 1.9 32% |
| Gamma | 2.25 98% | 2.29 96% | 2.39 92% | 2.31 95% | 2.15 102% |
| CCT | 6654 98% | 6046 108% | 6530 100% | 7188 90% | 6735 97% |
| Color Space (Percent of AdobeRGB 1998) (%) | 64.5 | 59 -9% | 65 1% | 62.4 -3% | 64.1 -1% |
| Color Space (Percent of sRGB) (%) | 99.4 | 90.6 -9% | 100 1% | 96.9 -3% | 99.6 0% |
| Total Average (Program / Settings) | -12% /
-20% | 5% /
11% | -13% /
-11% | 8% /
12% |
* ... smaller is better
We use the professional CalMAN software and the X-Rite i1 Pro 2 spectrophotometer to analyze the display. The panel is already decently calibrated out of the box, because the deviations in grayscales as well as in colors compared to the sRGB reference are below the important mark of 3. Although there's a minimal color tint leaning towards green, you can only see it in a direct comparison with a calibrated display.
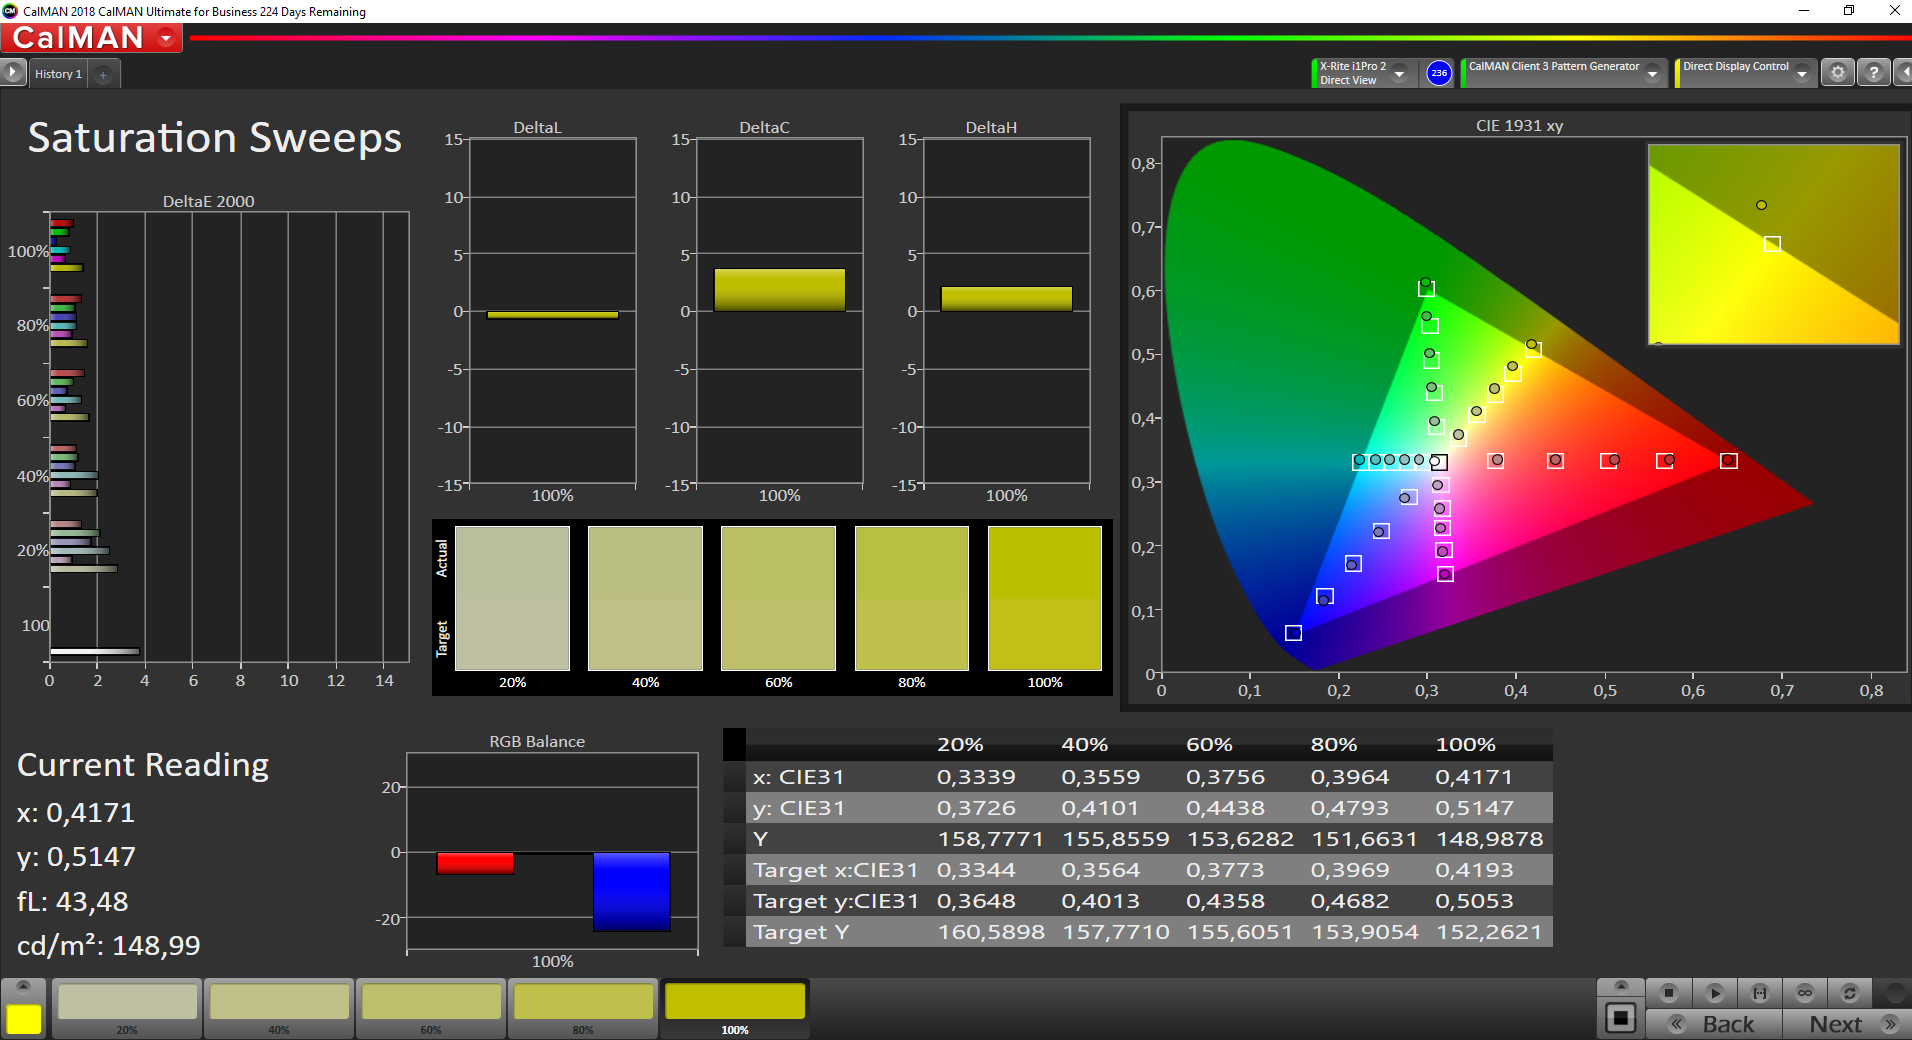
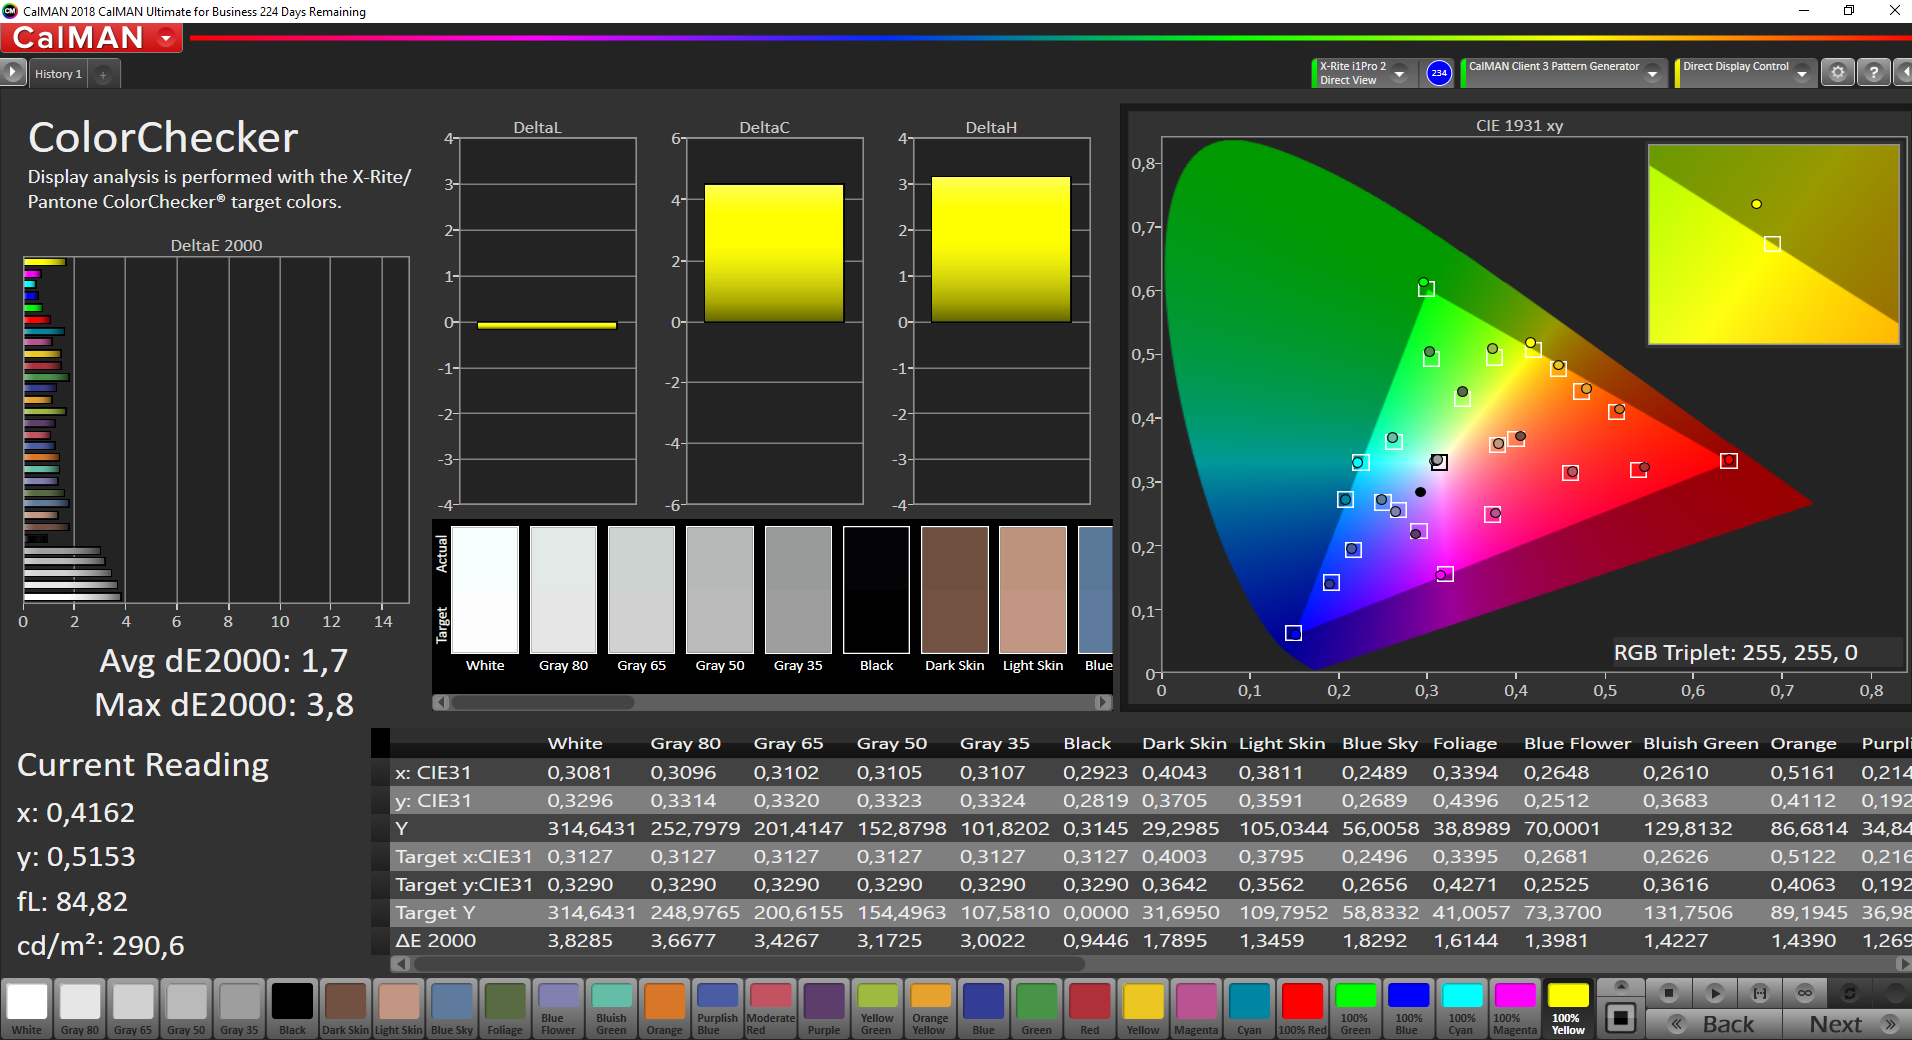
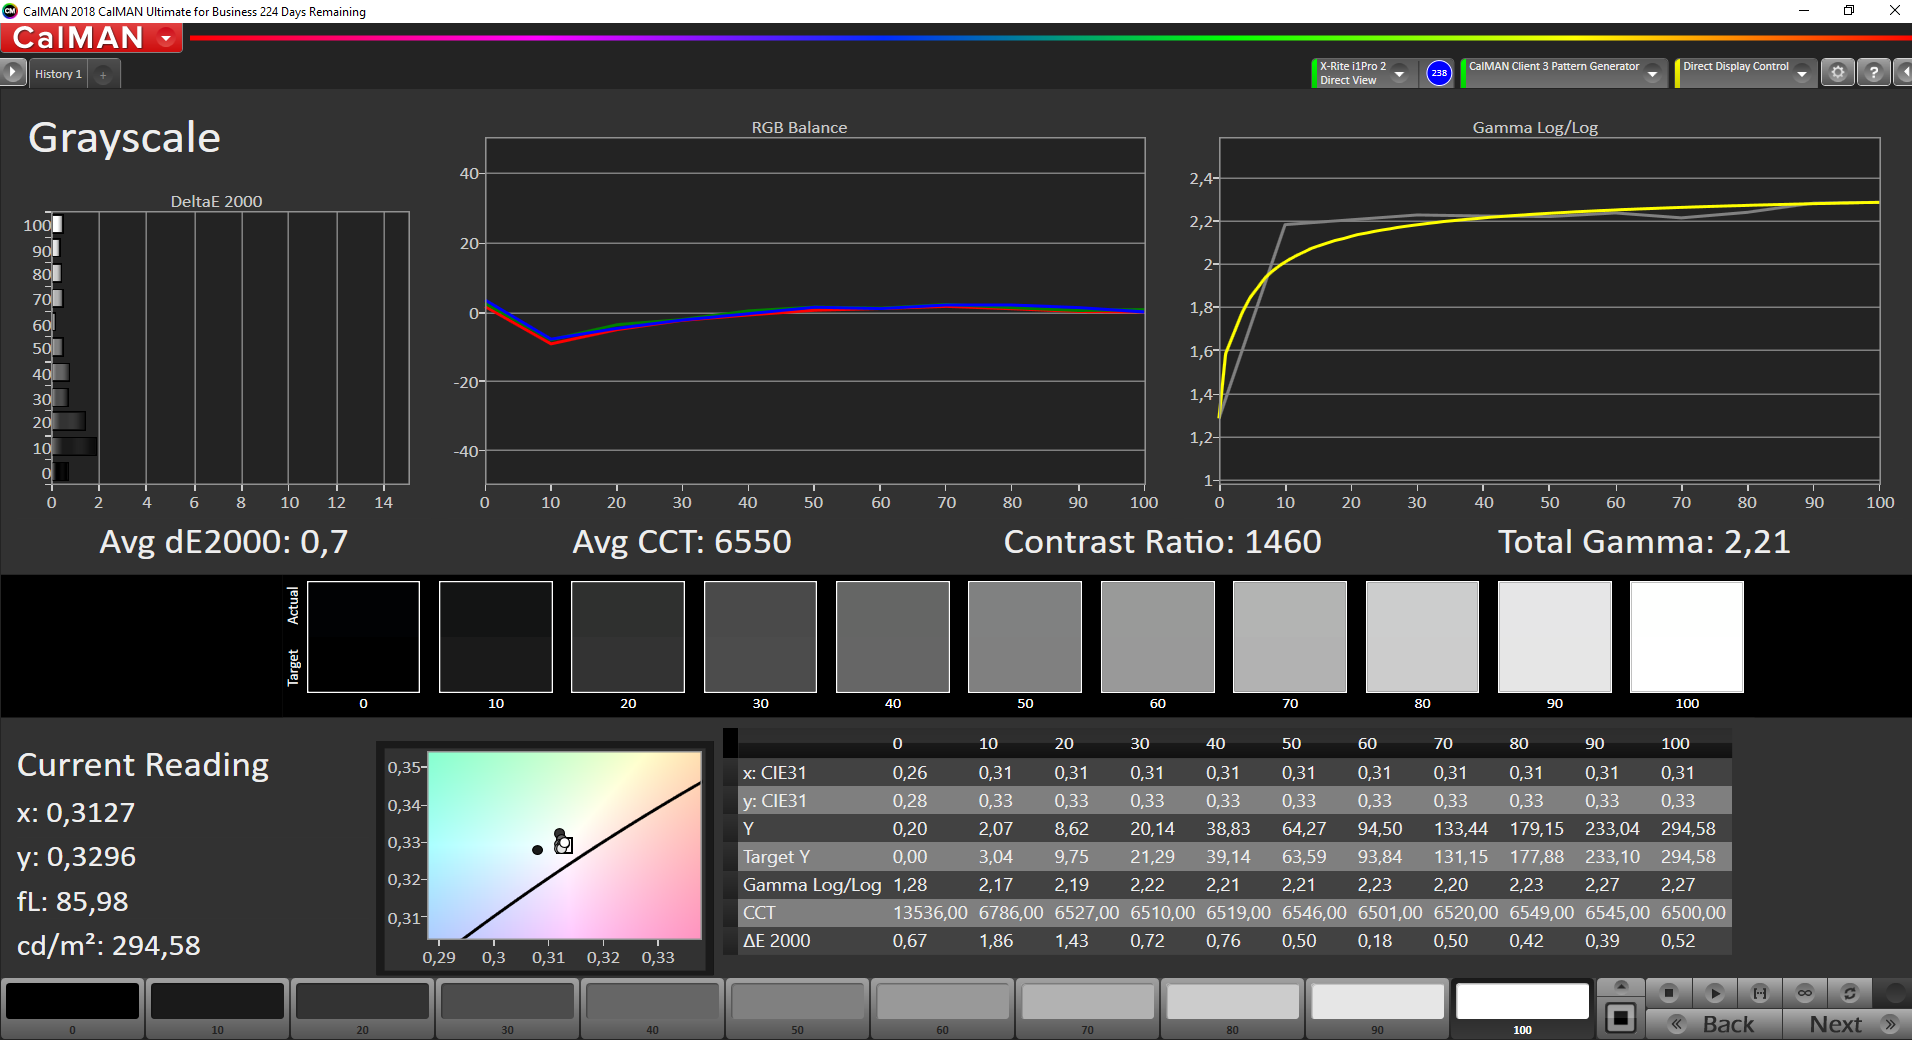
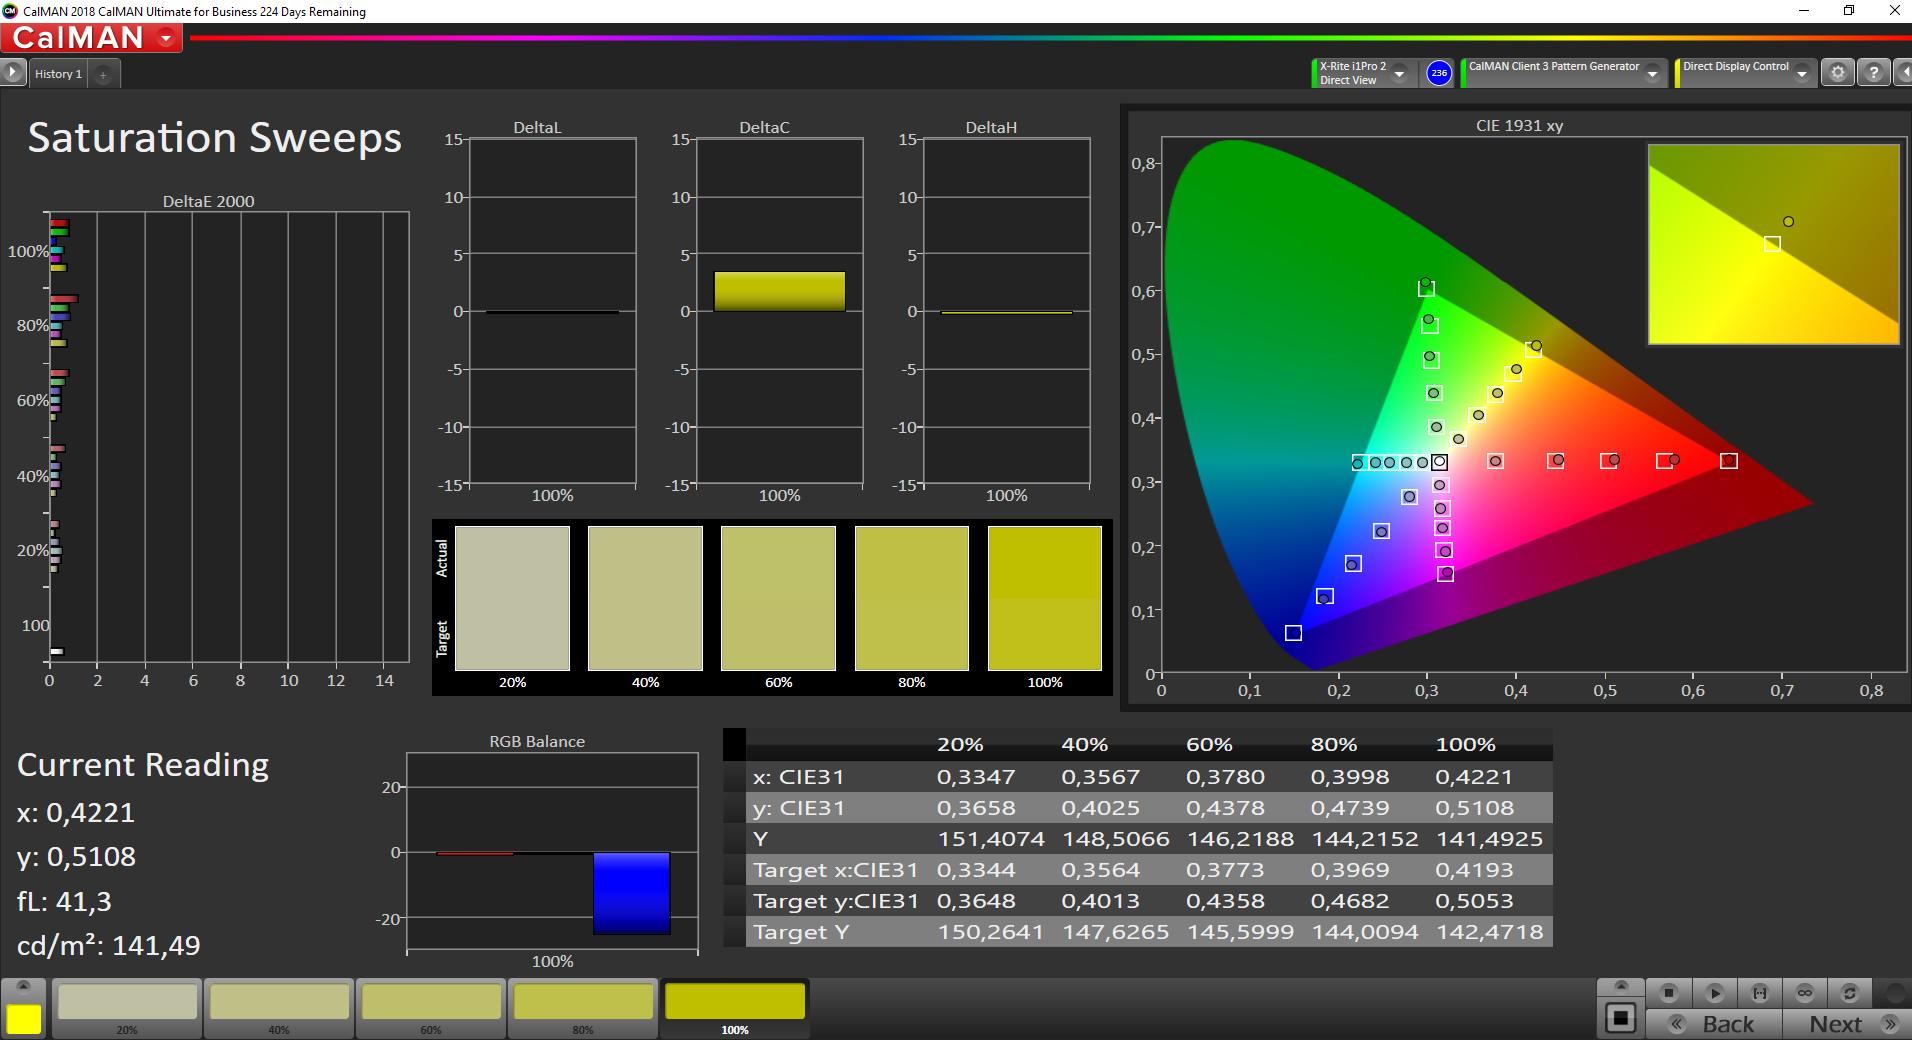
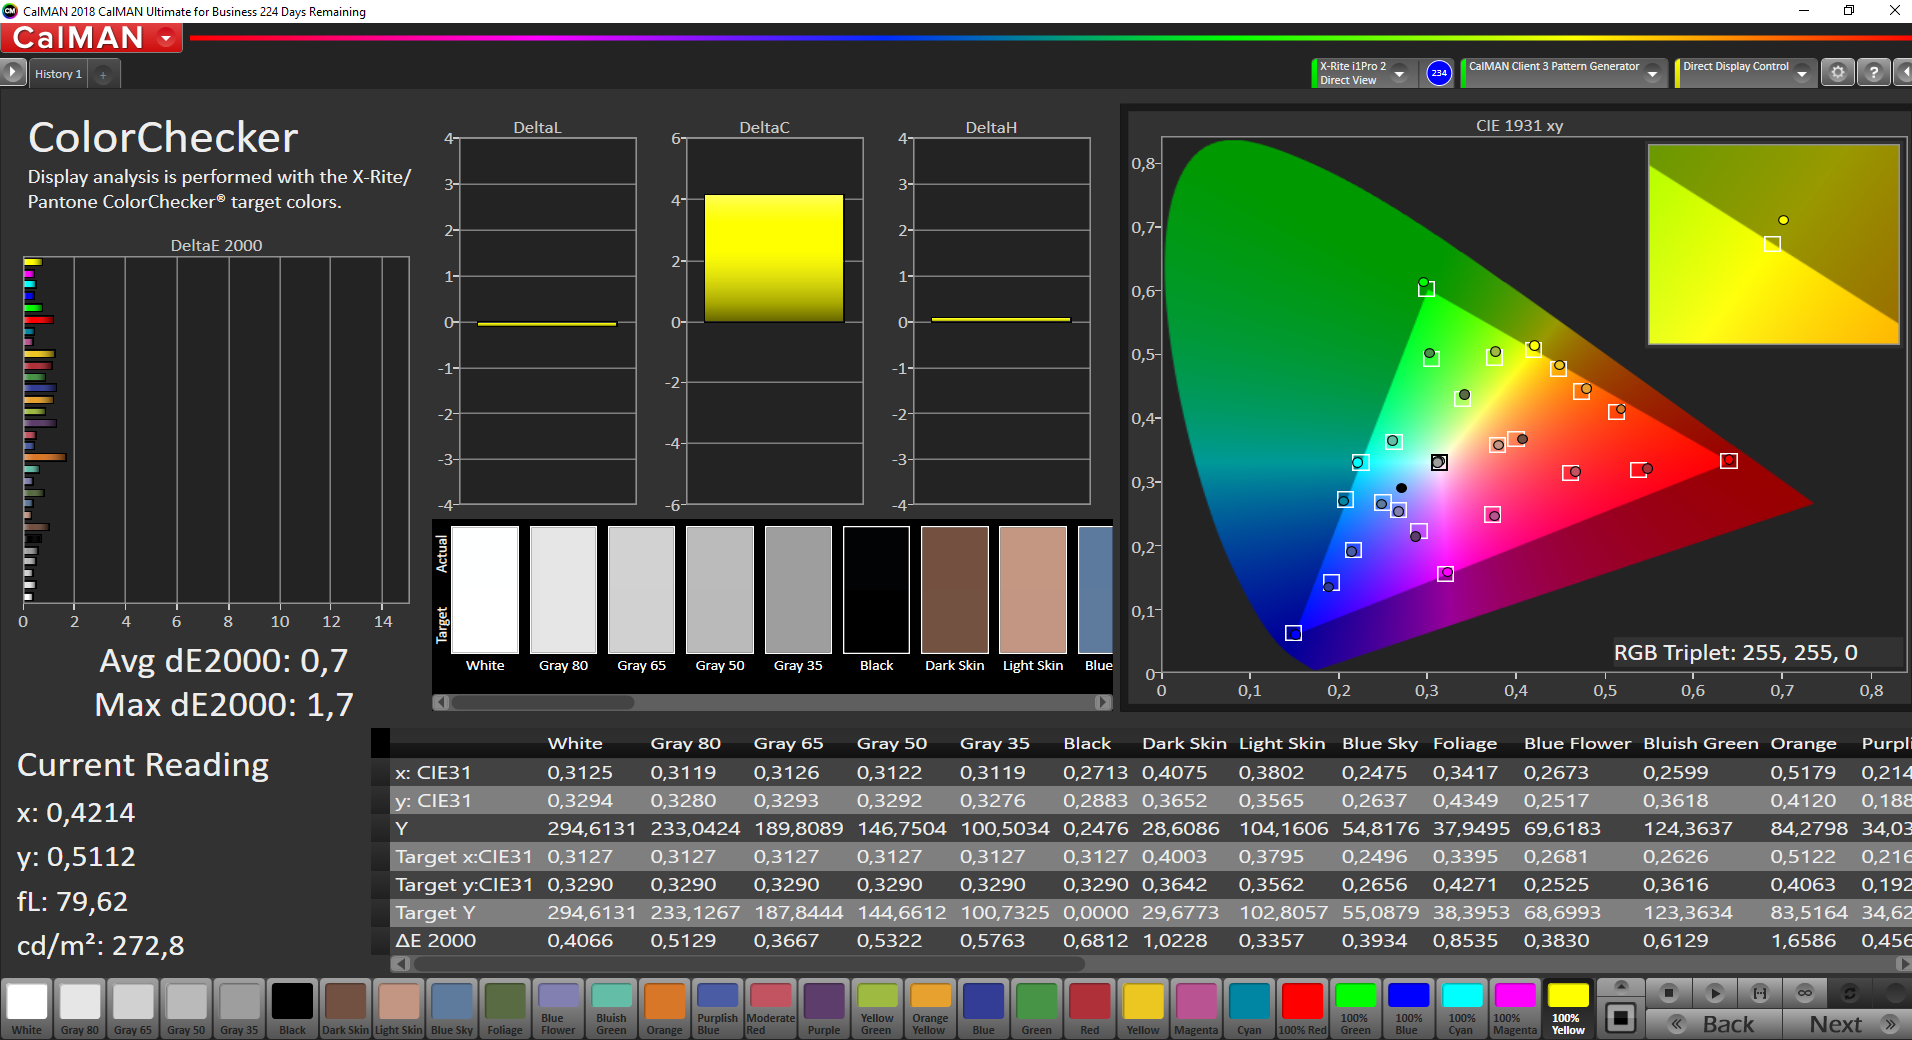
With our calibration (the profile is available to be downloaded for free above), we can improve reproduction even further, and the color tint disappears as well. Therefore, together with the full coverage of the small sRGB color space, editing pictures and videos is also possible without any issues.
Display Response Times
| ↔ Response Time Black to White | ||
|---|---|---|
| 31.2 ms ... rise ↗ and fall ↘ combined | ↗ 16.4 ms rise | 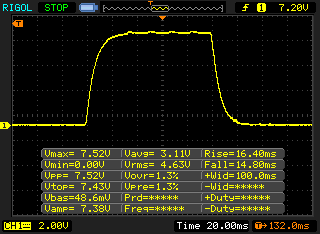 |
| ↘ 14.8 ms fall | ||
| The screen shows slow response rates in our tests and will be unsatisfactory for gamers. In comparison, all tested devices range from 0.1 (minimum) to 240 (maximum) ms. » 84 % of all devices are better. This means that the measured response time is worse than the average of all tested devices (19.9 ms). | ||
| ↔ Response Time 50% Grey to 80% Grey | ||
| 44.4 ms ... rise ↗ and fall ↘ combined | ↗ 24 ms rise | 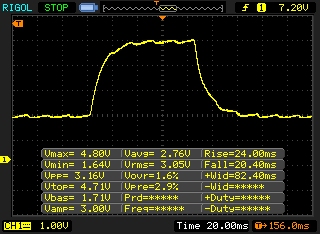 |
| ↘ 20.4 ms fall | ||
| The screen shows slow response rates in our tests and will be unsatisfactory for gamers. In comparison, all tested devices range from 0.165 (minimum) to 636 (maximum) ms. » 76 % of all devices are better. This means that the measured response time is worse than the average of all tested devices (31.1 ms). | ||
Screen Flickering / PWM (Pulse-Width Modulation)
| Screen flickering / PWM detected | 25000 Hz | ≤ 50 % brightness setting | 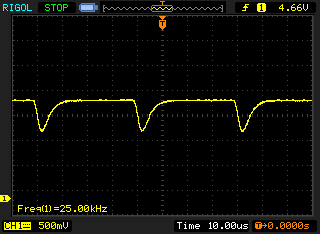 |
The display backlight flickers at 25000 Hz (worst case, e.g., utilizing PWM) Flickering detected at a brightness setting of 50 % and below. There should be no flickering or PWM above this brightness setting. The frequency of 25000 Hz is quite high, so most users sensitive to PWM should not notice any flickering. In comparison: 52 % of all tested devices do not use PWM to dim the display. If PWM was detected, an average of 7798 (minimum: 5 - maximum: 343500) Hz was measured. | |||
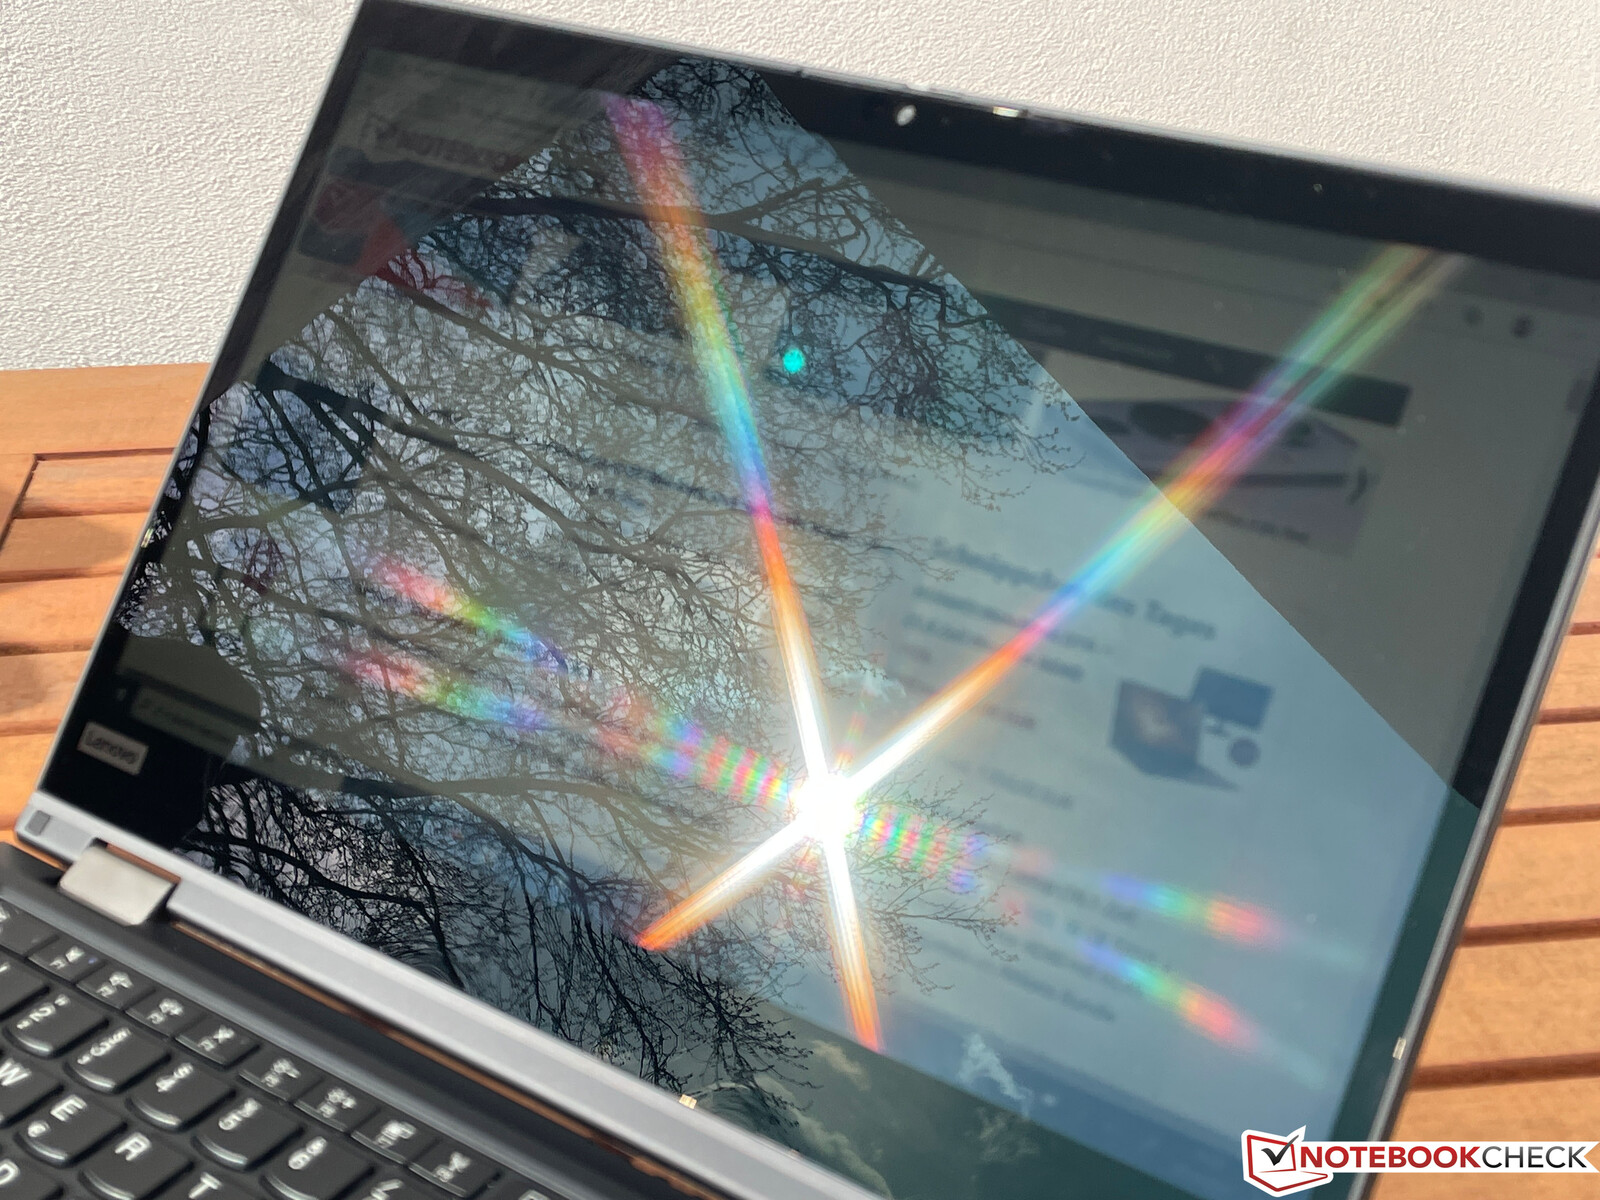
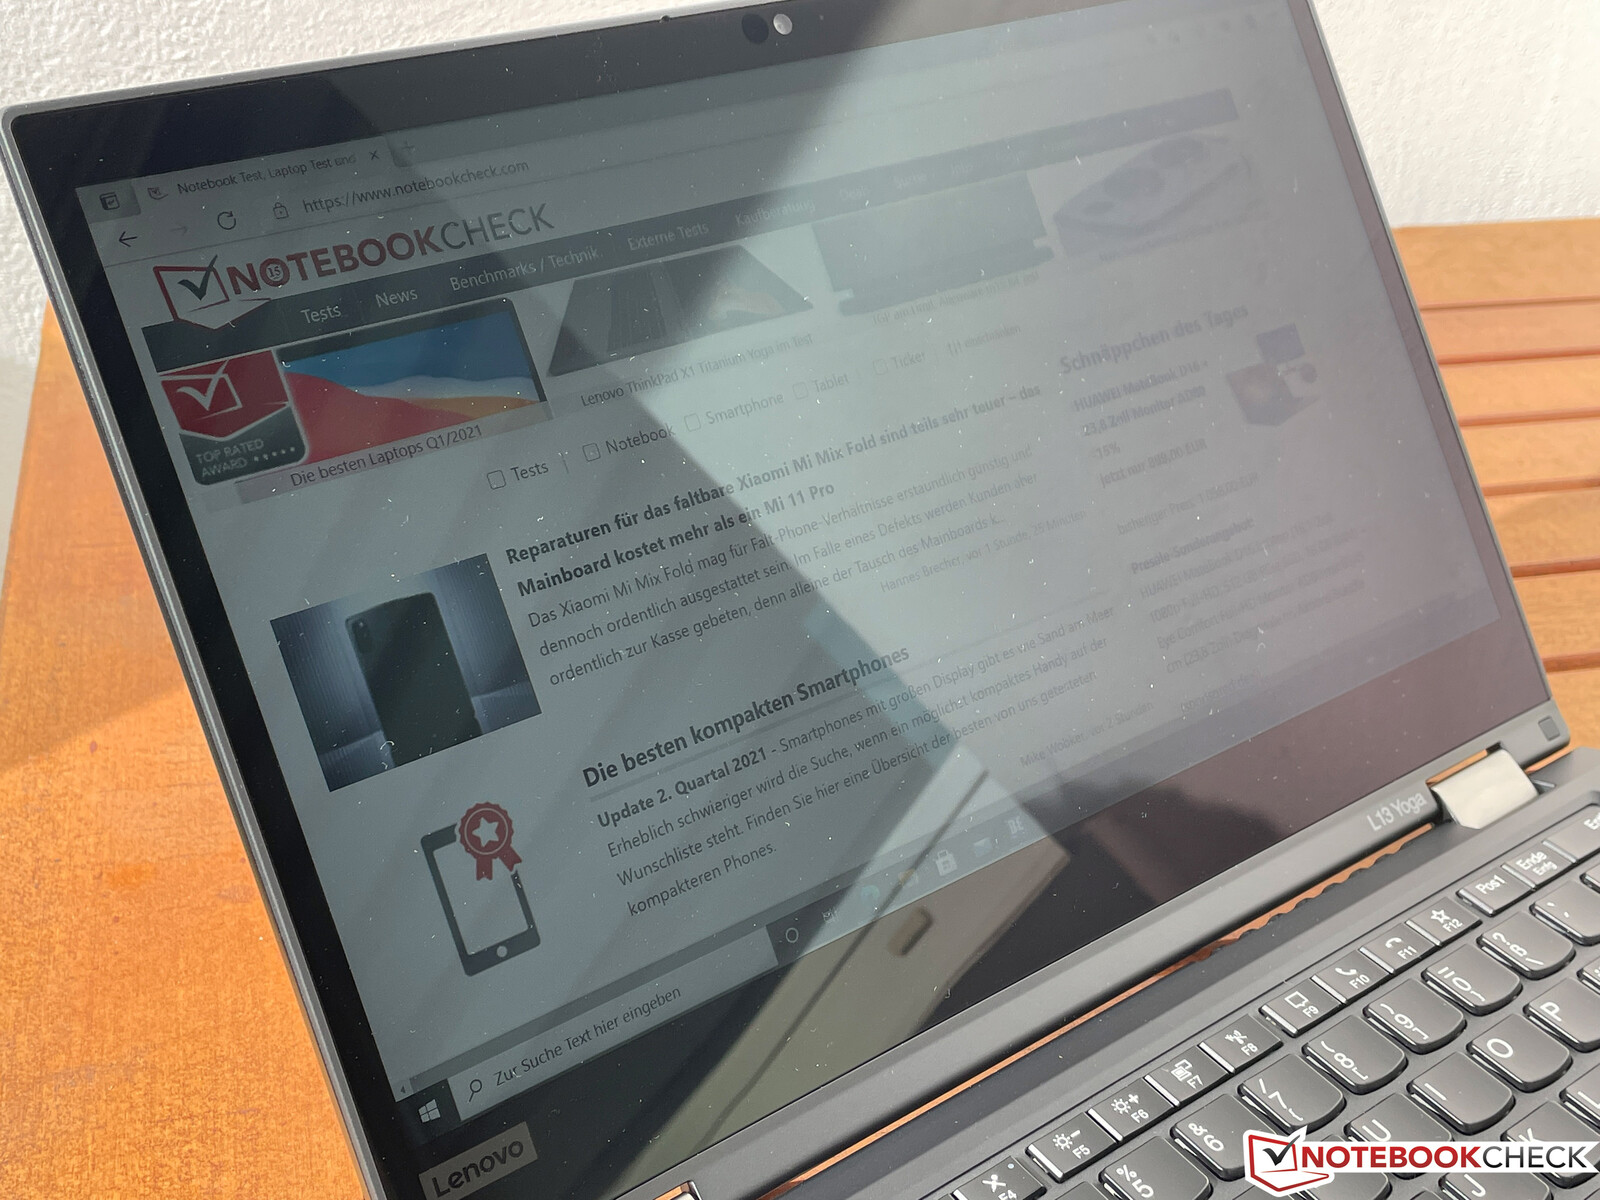
Outdoor use is noticeably limited by the highly reflective touchscreen. It's almost impossible to use the device on bright days; the backlight would simply have to be much stronger for that. However, the convertible's viewing-angle stability is excellent thanks to its IPS technology.
Performance - Tiger Lake i5 and PCIe SSD
The ThinkPad L13 Yoga is exclusively available with Intel's Tiger Lake mobile processors (UP3) and is consequently easily suitable for all common office applications. RAM is soldered and can't be expanded. The 8 GB of our review sample is certainly sufficient for simple tasks, but users who want more headroom for the next few years should opt for a model with 16 GB of RAM.
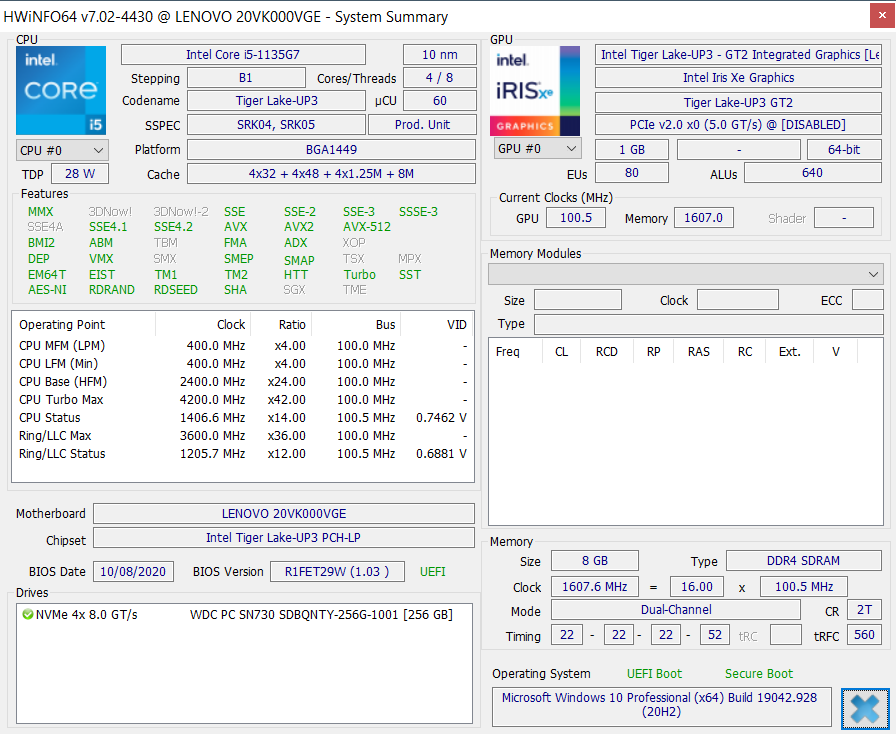
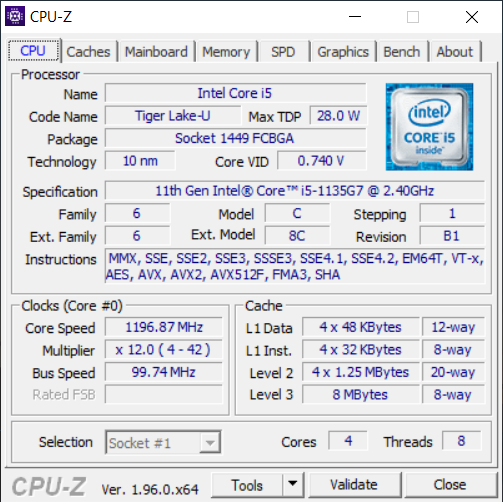
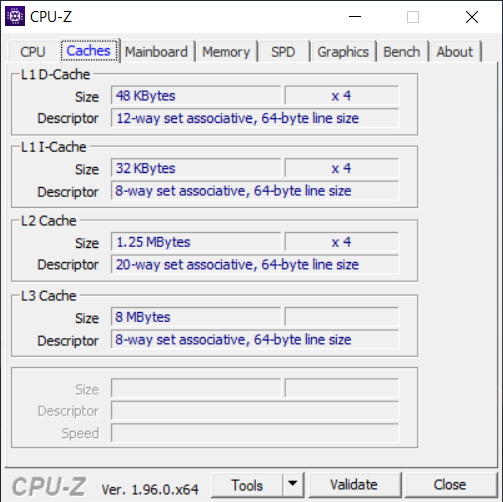

Processor - Core i5-1135G7
The Core i5-1135G7 in our test device offers 4 cores (8 threads) that have a base clock speed of 2.4 GHz and can reach a maximum of 4.2 GHz (1 core) or 3.8 GHz (4 active cores), respectively. Initially, Lenovo gives the processor free rein, which is why it consumes 35 watts for a short time and then settles at 25 watts for a while (4x 2.9 GHz). However, this level can't be maintained, and at some point, it's down to only 15 watts. In addition, the values here fluctuate a bit with each new test run, which also explains the erratic results in the Cinebench loop.
Performance falls a bit behind the average results of the Core i5-1135G7 in our database, and the lead over the old L13 Yoga Gen 1 is around 20% in most tests. The i5 can only hold its own against the Ryzen 5 4500U of the HP ProBook in the single-core benchmarks, but it falls behind significantly in the multi-core tests. Moreover, the processor's performance is not reduced on battery power.
Cinebench R15: CPU Single 64Bit | CPU Multi 64Bit
Blender: v2.79 BMW27 CPU
7-Zip 18.03: 7z b 4 -mmt1 | 7z b 4
Geekbench 5.5: Single-Core | Multi-Core
HWBOT x265 Benchmark v2.2: 4k Preset
LibreOffice : 20 Documents To PDF
R Benchmark 2.5: Overall mean
| Cinebench R20 / CPU (Single Core) | |
| Average of class Convertible (273 - 834, n=49, last 2 years) | |
| Lenovo ThinkPad L13 Yoga Gen2-20VK000VGE | |
| Average Intel Core i5-1135G7 (375 - 527, n=62) | |
| Acer Spin 5 SP513-54N-79EY | |
| HP ProBook x360 435 G7, Ryzen 5 4500U | |
| Lenovo ThinkPad L13 Yoga 20R6S00800 | |
| Fujitsu LifeBook U9310X | |
| Cinebench R20 / CPU (Multi Core) | |
| Average of class Convertible (595 - 12102, n=49, last 2 years) | |
| HP ProBook x360 435 G7, Ryzen 5 4500U | |
| Average Intel Core i5-1135G7 (979 - 2382, n=62) | |
| Acer Spin 5 SP513-54N-79EY | |
| Lenovo ThinkPad L13 Yoga Gen2-20VK000VGE | |
| Fujitsu LifeBook U9310X | |
| Lenovo ThinkPad L13 Yoga 20R6S00800 | |
| Cinebench R15 / CPU Single 64Bit | |
| Average of class Convertible (149.8 - 317, n=48, last 2 years) | |
| Lenovo ThinkPad L13 Yoga Gen2-20VK000VGE | |
| Average Intel Core i5-1135G7 (141.4 - 205, n=61) | |
| Acer Spin 5 SP513-54N-79EY | |
| HP ProBook x360 435 G7, Ryzen 5 4500U | |
| Fujitsu LifeBook U9310X | |
| Lenovo ThinkPad L13 Yoga 20R6S00800 | |
| Cinebench R15 / CPU Multi 64Bit | |
| Average of class Convertible (478 - 4940, n=48, last 2 years) | |
| HP ProBook x360 435 G7, Ryzen 5 4500U | |
| Average Intel Core i5-1135G7 (431 - 941, n=65) | |
| Lenovo ThinkPad L13 Yoga Gen2-20VK000VGE | |
| Acer Spin 5 SP513-54N-79EY | |
| Fujitsu LifeBook U9310X | |
| Lenovo ThinkPad L13 Yoga 20R6S00800 | |
| Blender / v2.79 BMW27 CPU | |
| Fujitsu LifeBook U9310X | |
| Lenovo ThinkPad L13 Yoga 20R6S00800 | |
| Lenovo ThinkPad L13 Yoga Gen2-20VK000VGE | |
| Acer Spin 5 SP513-54N-79EY | |
| Average Intel Core i5-1135G7 (499 - 1044, n=60) | |
| HP ProBook x360 435 G7, Ryzen 5 4500U | |
| Average of class Convertible (105 - 1051, n=48, last 2 years) | |
| 7-Zip 18.03 / 7z b 4 -mmt1 | |
| Average of class Convertible (3672 - 6655, n=48, last 2 years) | |
| Lenovo ThinkPad L13 Yoga Gen2-20VK000VGE | |
| Average Intel Core i5-1135G7 (3924 - 4921, n=62) | |
| Lenovo ThinkPad L13 Yoga 20R6S00800 | |
| Acer Spin 5 SP513-54N-79EY | |
| HP ProBook x360 435 G7, Ryzen 5 4500U | |
| Fujitsu LifeBook U9310X | |
| 7-Zip 18.03 / 7z b 4 | |
| Average of class Convertible (12977 - 121368, n=48, last 2 years) | |
| HP ProBook x360 435 G7, Ryzen 5 4500U | |
| Average Intel Core i5-1135G7 (14745 - 24873, n=62) | |
| Lenovo ThinkPad L13 Yoga 20R6S00800 | |
| Lenovo ThinkPad L13 Yoga Gen2-20VK000VGE | |
| Acer Spin 5 SP513-54N-79EY | |
| Fujitsu LifeBook U9310X | |
| Geekbench 5.5 / Single-Core | |
| Average of class Convertible (806 - 2275, n=48, last 2 years) | |
| Lenovo ThinkPad L13 Yoga Gen2-20VK000VGE | |
| Average Intel Core i5-1135G7 (1147 - 1428, n=58) | |
| Acer Spin 5 SP513-54N-79EY | |
| Lenovo ThinkPad L13 Yoga 20R6S00800 | |
| HP ProBook x360 435 G7, Ryzen 5 4500U | |
| Fujitsu LifeBook U9310X | |
| Geekbench 5.5 / Multi-Core | |
| Average of class Convertible (1608 - 22023, n=48, last 2 years) | |
| Average Intel Core i5-1135G7 (3475 - 5472, n=58) | |
| Lenovo ThinkPad L13 Yoga Gen2-20VK000VGE | |
| HP ProBook x360 435 G7, Ryzen 5 4500U | |
| Lenovo ThinkPad L13 Yoga 20R6S00800 | |
| Acer Spin 5 SP513-54N-79EY | |
| Fujitsu LifeBook U9310X | |
| HWBOT x265 Benchmark v2.2 / 4k Preset | |
| Average of class Convertible (3.43 - 36.2, n=48, last 2 years) | |
| HP ProBook x360 435 G7, Ryzen 5 4500U | |
| Average Intel Core i5-1135G7 (3.57 - 7.6, n=57) | |
| Lenovo ThinkPad L13 Yoga Gen2-20VK000VGE | |
| Lenovo ThinkPad L13 Yoga 20R6S00800 | |
| Fujitsu LifeBook U9310X | |
| LibreOffice / 20 Documents To PDF | |
| HP ProBook x360 435 G7, Ryzen 5 4500U | |
| Lenovo ThinkPad L13 Yoga Gen2-20VK000VGE | |
| Fujitsu LifeBook U9310X | |
| Acer Spin 5 SP513-54N-79EY | |
| Average of class Convertible (42.5 - 84.3, n=48, last 2 years) | |
| Average Intel Core i5-1135G7 (44.2 - 62.9, n=60) | |
| R Benchmark 2.5 / Overall mean | |
| Fujitsu LifeBook U9310X | |
| Lenovo ThinkPad L13 Yoga 20R6S00800 | |
| HP ProBook x360 435 G7, Ryzen 5 4500U | |
| Average Intel Core i5-1135G7 (0.619 - 0.727, n=59) | |
| Lenovo ThinkPad L13 Yoga Gen2-20VK000VGE | |
| Average of class Convertible (0.3915 - 0.84, n=48, last 2 years) | |
* ... smaller is better
System performance
Our review sample's configuration is very well balanced, and there is no bottleneck. In everyday use, the L13 Yoga Gen 2 is very fast, and we couldn't detect any problems either. Performance in the synthetic benchmarks is very good as well.
| PCMark 10 Score | 4588 points | |
Help | ||
DPC latencies
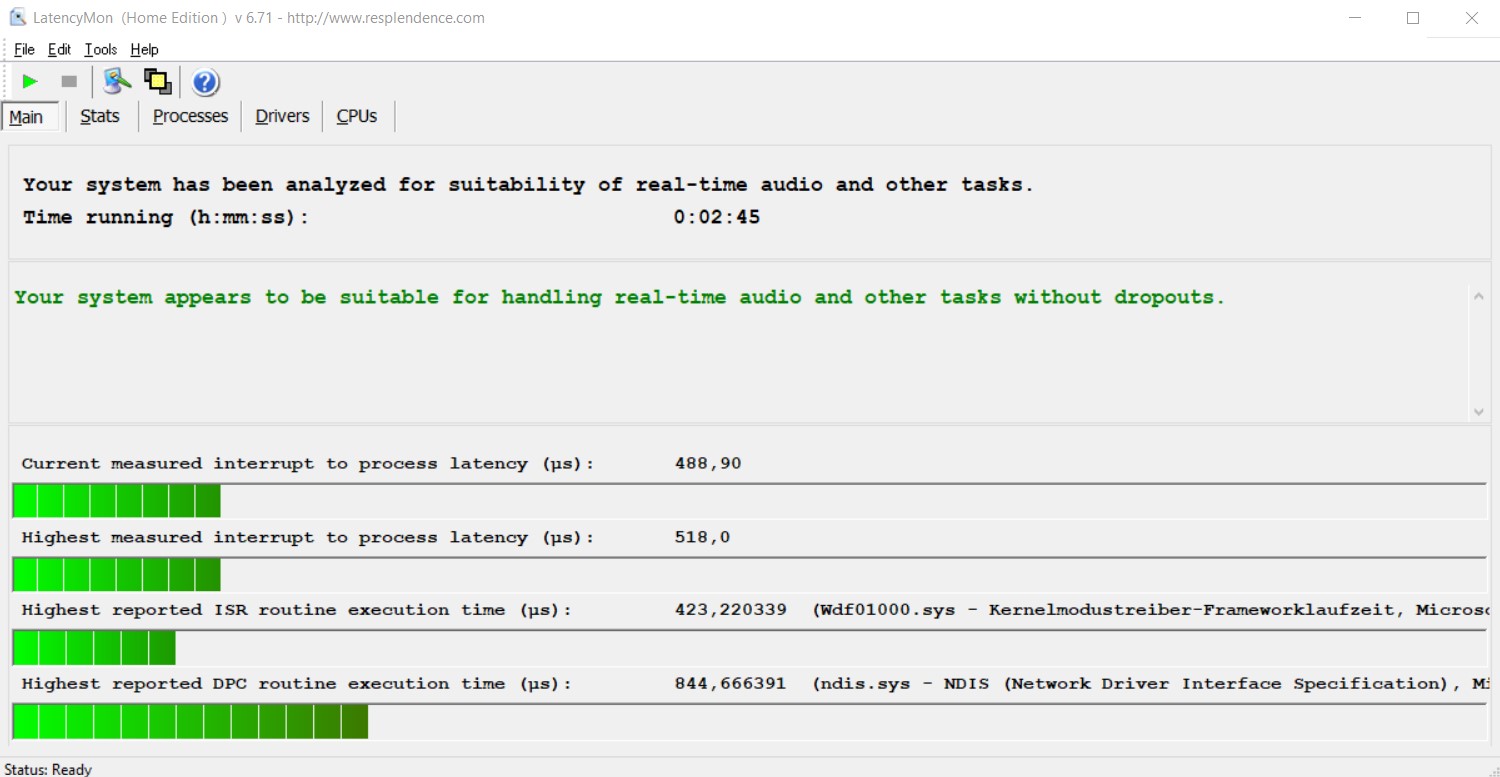
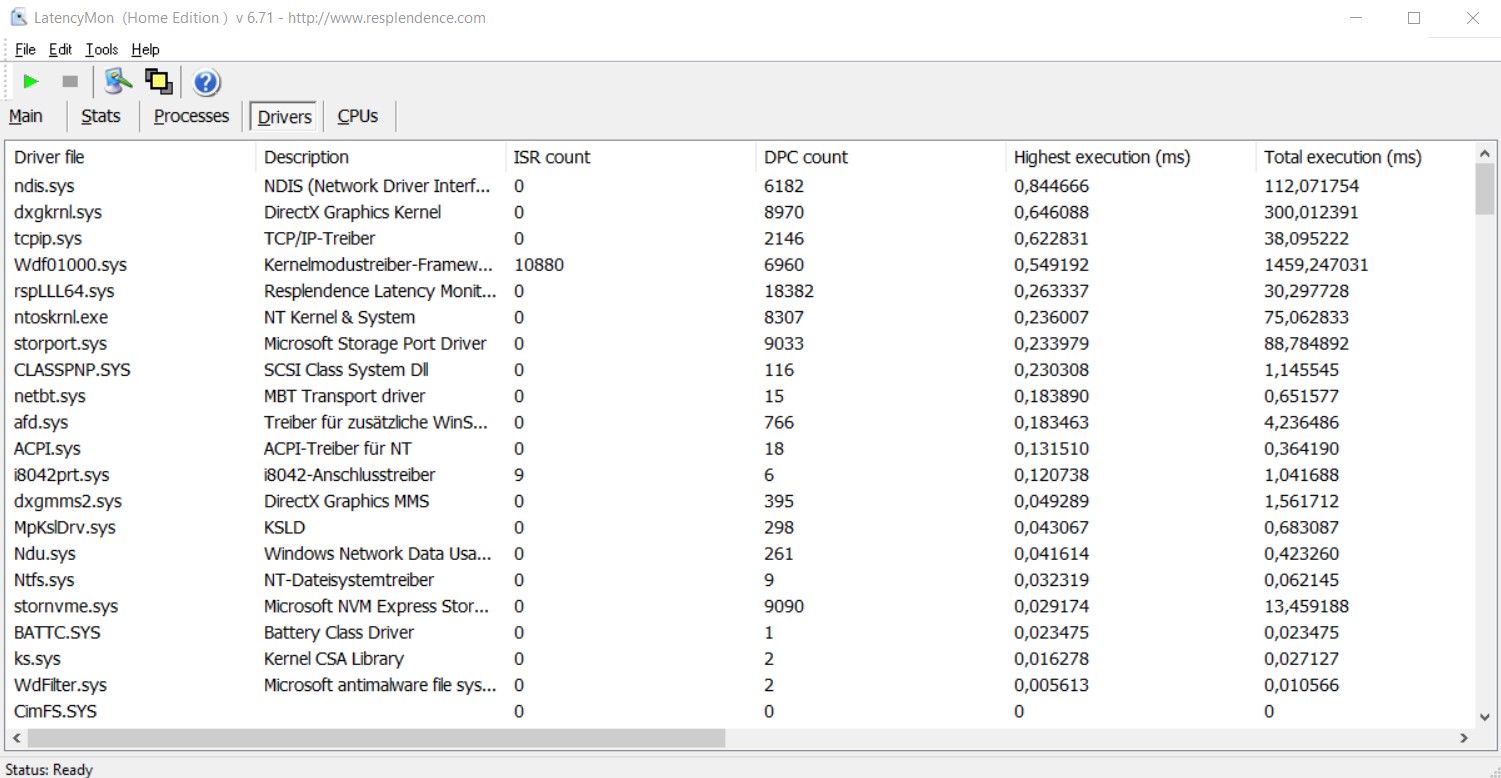
| DPC Latencies / LatencyMon - interrupt to process latency (max), Web, Youtube, Prime95 | |
| HP ProBook x360 435 G7, Ryzen 5 4500U | |
| Fujitsu LifeBook U9310X | |
| Acer Spin 5 SP513-54N-79EY | |
| Lenovo ThinkPad L13 Yoga Gen2-20VK000VGE | |
* ... smaller is better
Storage - M.2-2280 PCIe SSD
Lenovo continues to use a standard M.2-2280 SSD in the L13 Yoga Gen 2, which is connected via a PCIe 3.0 x4 interface and can also be easily replaced by the user. Our review sample uses an NVMe SSD from Western Digital (SN730) with a storage capacity of 256 GB; out of this, 201 GB is still available after the first startup. The drive achieves very good transfer rates in the benchmarks. Further benchmarks regarding this model and other SSDs are available in our HDD/SSD Benchmarks article.
| Lenovo ThinkPad L13 Yoga Gen2-20VK000VGE WDC PC SN730 SDBPNTY-256G | HP ProBook x360 435 G7, Ryzen 5 4500U WDC PC SN520 SDAPNUW-512G | Acer Spin 5 SP513-54N-79EY Samsung PM991 MZVLQ1T0HALB | Fujitsu LifeBook U9310X Toshiba KBG40ZNS512G NVMe | Lenovo ThinkPad L13 Yoga 20R6S00800 Toshiba XG6 KXG6AZNV512G | Average WDC PC SN730 SDBPNTY-256G | |
|---|---|---|---|---|---|---|
| CrystalDiskMark 5.2 / 6 | -18% | 10% | -8% | 15% | 5% | |
| Write 4K (MB/s) | 119.7 | 94.1 -21% | 168.4 41% | 134.2 12% | 172.3 44% | 138.6 ? 16% |
| Read 4K (MB/s) | 38.54 | 41.01 6% | 55 43% | 53.4 39% | 44.37 15% | 43.6 ? 13% |
| Write Seq (MB/s) | 1754 | 1465 -16% | 1216 -31% | 1492 -15% | 1977 ? 13% | |
| Read Seq (MB/s) | 1709 | 1453 -15% | 1291 -24% | 1471 -14% | 1860 ? 9% | |
| Write 4K Q32T1 (MB/s) | 461.9 | 322.6 -30% | 476.1 3% | 401.5 -13% | 483.1 5% | 364 ? -21% |
| Read 4K Q32T1 (MB/s) | 390.5 | 421.8 8% | 506 30% | 491.4 26% | 551 41% | 435 ? 11% |
| Write Seq Q32T1 (MB/s) | 2185 | 1463 -33% | 1492 -32% | 1224 -44% | 2951 35% | 2189 ? 0% |
| Read Seq Q32T1 (MB/s) | 3118 | 1751 -44% | 2357 -24% | 2314 -26% | 3289 5% | 2994 ? -4% |
| Write 4K Q8T8 (MB/s) | 930 | 1498 | ||||
| Read 4K Q8T8 (MB/s) | 963 | 1531 | ||||
| AS SSD | -1% | -2% | -44% | 35% | -8% | |
| Seq Read (MB/s) | 2387 | 1491 -38% | 2071 -13% | 2030 -15% | 2719 14% | 2290 ? -4% |
| Seq Write (MB/s) | 2000 | 1306 -35% | 1462 -27% | 1071 -46% | 2441 22% | 1899 ? -5% |
| 4K Read (MB/s) | 41.18 | 41.2 0% | 49.82 21% | 49.16 19% | 51.5 25% | 43.5 ? 6% |
| 4K Write (MB/s) | 169.6 | 118.1 -30% | 140.7 -17% | 117.3 -31% | 142.8 -16% | 155 ? -9% |
| 4K-64 Read (MB/s) | 681 | 1033 52% | 869 28% | 1268 86% | 1426 109% | 701 ? 3% |
| 4K-64 Write (MB/s) | 571 | 1007 76% | 729 28% | 699 22% | 1287 125% | 611 ? 7% |
| Access Time Read * (ms) | 0.051 | 0.103 -102% | 0.069 -35% | 0.067 -31% | 0.041 20% | 0.0685 ? -34% |
| Access Time Write * (ms) | 0.025 | 0.031 -24% | 0.028 -12% | 0.168 -572% | 0.029 -16% | 0.026 ? -4% |
| Score Read (Points) | 961 | 1223 27% | 1126 17% | 1520 58% | 1749 82% | 974 ? 1% |
| Score Write (Points) | 941 | 1256 33% | 1016 8% | 923 -2% | 1674 78% | 956 ? 2% |
| Score Total (Points) | 2384 | 3102 30% | 2700 13% | 3179 33% | 4310 81% | 2419 ? 1% |
| Copy ISO MB/s (MB/s) | 1855 | 1574 -15% | 2028 9% | 1528 ? -18% | ||
| Copy Program MB/s (MB/s) | 565 | 553 -2% | 499.1 -12% | 434 ? -23% | ||
| Copy Game MB/s (MB/s) | 1360 | 993 -27% | 1022 -25% | 898 ? -34% | ||
| Total Average (Program / Settings) | -10% /
-8% | 4% /
1% | -26% /
-28% | 25% /
28% | -2% /
-3% |
* ... smaller is better

Continuous load read: DiskSpd Read Loop, Queue Depth 8
Graphics card
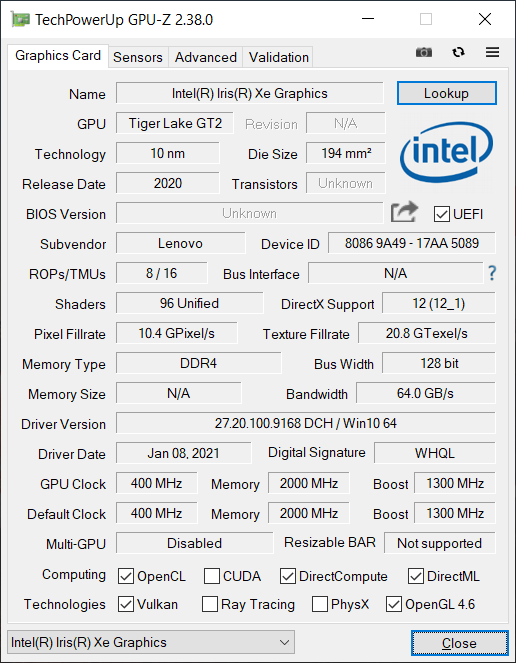
The integrated Intel Xe Graphics G7 is responsible for graphics processing. In combination with the Core i5 processor, the somewhat slower model with 80 processing units is used, while configurations with the optional i7 processor get the faster G7 iGPU with 96 processing units. Compared to the old UHD iGPUs, performance is significantly higher, but it depends a lot on the RAM configuration. As we've seen in our tests, not only does the Xe Graphics benefit greatly from dual-channel RAM but also from fast LPDDR4x-4266 memory. However, since the L13 Yoga Gen 2 "only" uses DDR4-3200 RAM (dual-channel), the results are a bit below the average values of all the devices that we have tested so far.
Nevertheless, the performance increase compared to the old L13 Yoga is enormous (~150%), and the iGPU is also perfectly sufficient for a business convertible. The Xe Graphics G7 also performs well in comparison with AMD's iGPUs, and it even has clear efficiency advantages when it comes to the integrated video decoder.
Nevertheless, the ThinkPad L13 Gen 2 is only suitable for gaming to a limited extent. Users should limit themselves to older titles, which usually still run smoothly at medium or high details. More gaming benchmarks based on the Xe Graphics G7 can be found here.
The iGPU's performance remains largely constant even under longer load. At 95.8%, the 3DMark Fire Strike stress test is not passed, but the 4% loss will hardly be noticed in practice. The GPU performance remains stable on battery power.
| 3DMark 11 Performance | 4950 points | |
| 3DMark Cloud Gate Standard Score | 14377 points | |
| 3DMark Fire Strike Score | 2574 points | |
| 3DMark Time Spy Score | 1104 points | |
Help | ||
| low | med. | high | ultra | |
|---|---|---|---|---|
| The Witcher 3 (2015) | 36.1 | 31.3 | 16.5 | |
| Dota 2 Reborn (2015) | 73.8 | 43.3 | 31.1 | 29.6 |
| X-Plane 11.11 (2018) | 27.8 | 24.7 | ||
| Far Cry 5 (2018) | 27 | 13 | ||
| F1 2020 (2020) | 45 | 26 |
Emissions - Loud fan results in lower temperatures
Noise emissions
The fan now gets a bit louder under load, but this is certainly the right decision considering the high surface temperatures of the predecessor. The emitted noise is also clearly audible when gaming or under full CPU load, but it doesn't become unpleasant or high-frequency. Under lighter load, the fan is barely audible in a normal office environment anyway. There was no coil whine or other electronic noise in our review unit.
Noise level
| Idle |
| 24.1 / 24.1 / 28.5 dB(A) |
| Load |
| 33.9 / 36.9 dB(A) |
 | ||
30 dB silent 40 dB(A) audible 50 dB(A) loud |
||
min: | ||
| Lenovo ThinkPad L13 Yoga Gen2-20VK000VGE Iris Xe G7 80EUs, i5-1135G7, WDC PC SN730 SDBPNTY-256G | HP ProBook x360 435 G7, Ryzen 5 4500U Vega 6, R5 4500U, WDC PC SN520 SDAPNUW-512G | Acer Spin 5 SP513-54N-79EY Iris Plus Graphics G7 (Ice Lake 64 EU), i7-1065G7, Samsung PM991 MZVLQ1T0HALB | Fujitsu LifeBook U9310X UHD Graphics 620, i5-10210U, Toshiba KBG40ZNS512G NVMe | Lenovo ThinkPad L13 Yoga 20R6S00800 UHD Graphics 620, i5-10210U, Toshiba XG6 KXG6AZNV512G | |
|---|---|---|---|---|---|
| Noise | -10% | -2% | -10% | -9% | |
| off / environment * (dB) | 24.1 | 29.3 -22% | 26.9 -12% | 29.4 -22% | 29.3 -22% |
| Idle Minimum * (dB) | 24.1 | 29.3 -22% | 26.9 -12% | 29.4 -22% | 29.3 -22% |
| Idle Average * (dB) | 24.1 | 29.3 -22% | 26.9 -12% | 29.4 -22% | 29.3 -22% |
| Idle Maximum * (dB) | 28.5 | 30.4 -7% | 27.8 2% | 30.7 -8% | 29.3 -3% |
| Load Average * (dB) | 33.9 | 31.3 8% | 30.5 10% | 32.6 4% | 32.7 4% |
| Witcher 3 ultra * (dB) | 36.9 | ||||
| Load Maximum * (dB) | 36.9 | 34.6 6% | 32.4 12% | 33.7 9% | 32.7 11% |
* ... smaller is better
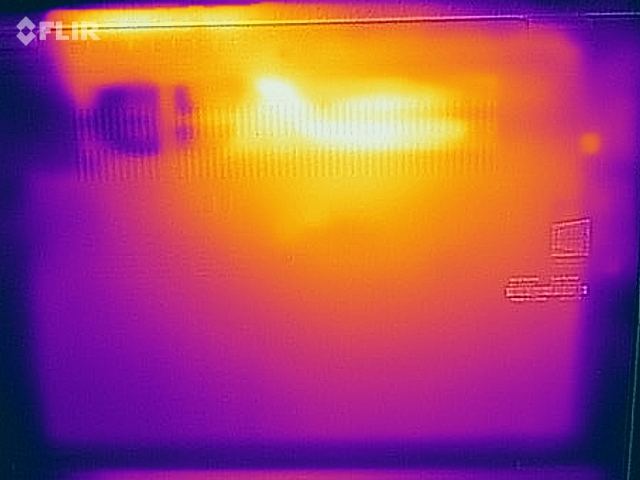
Temperature
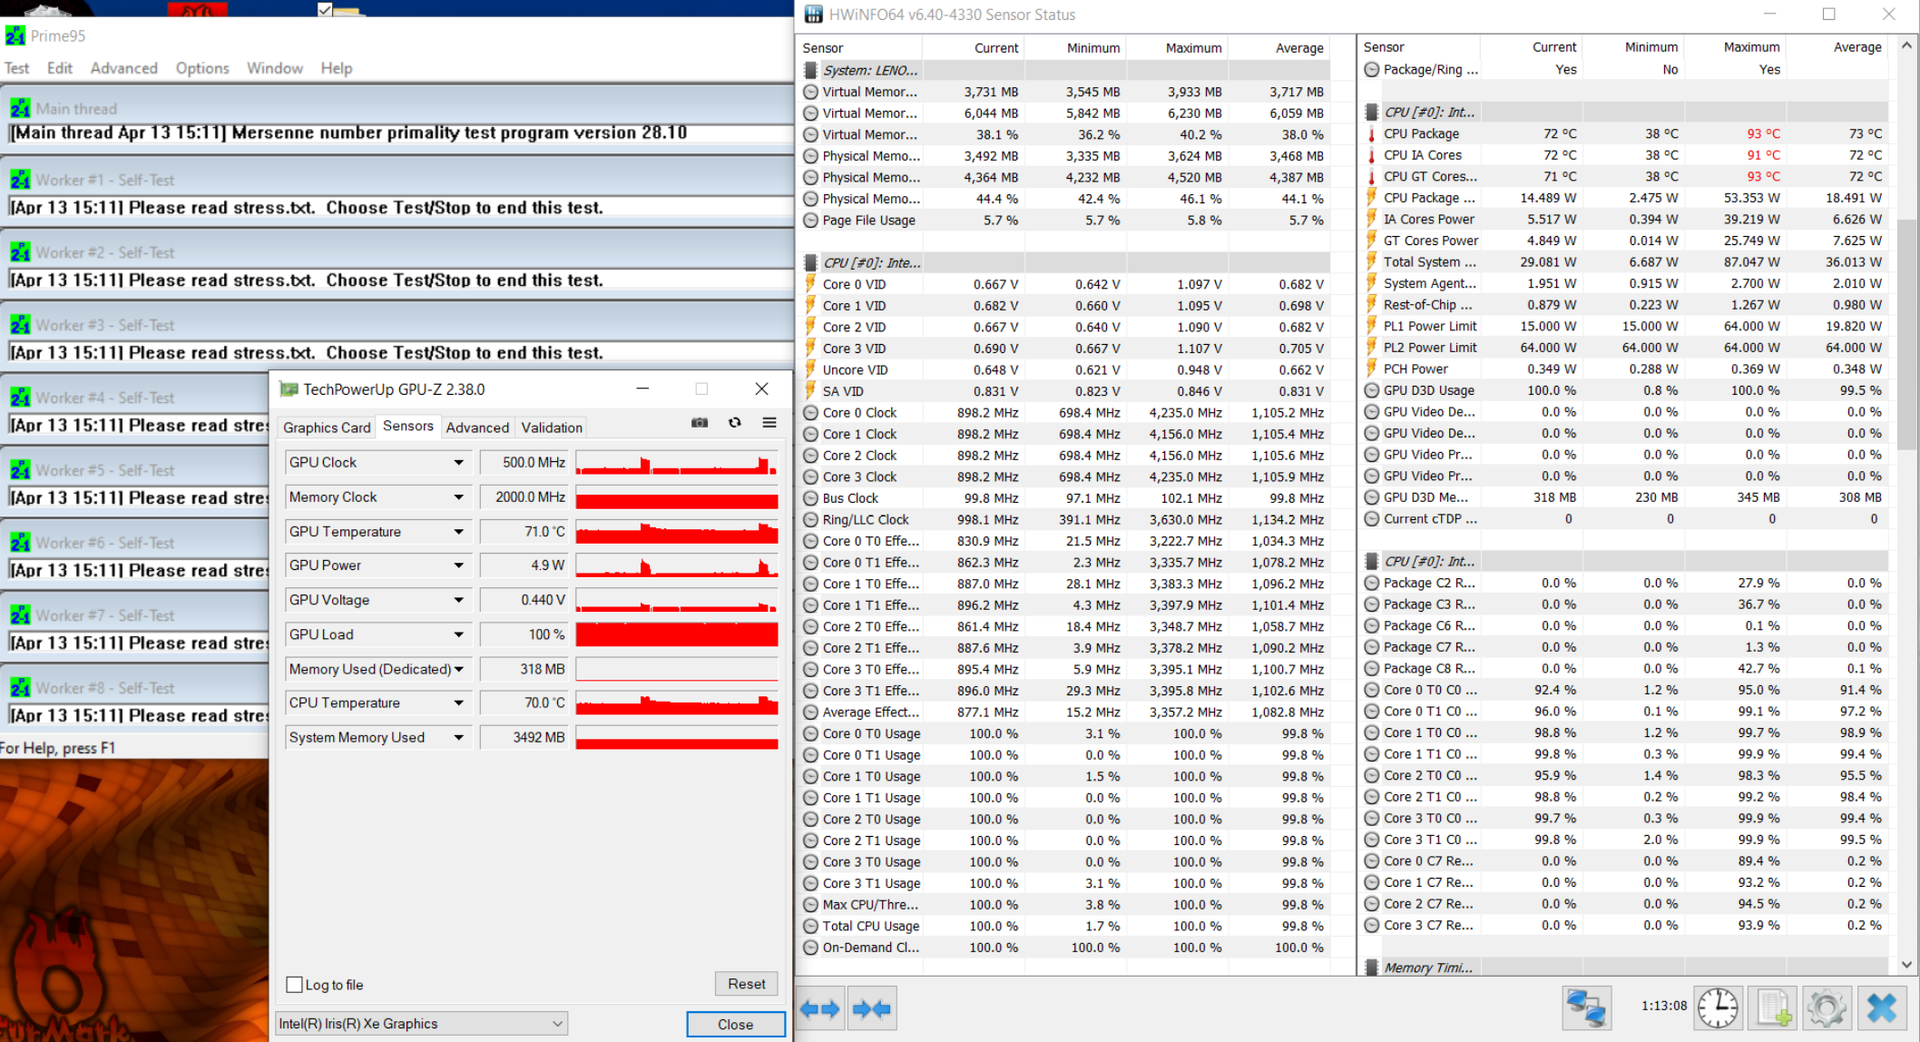
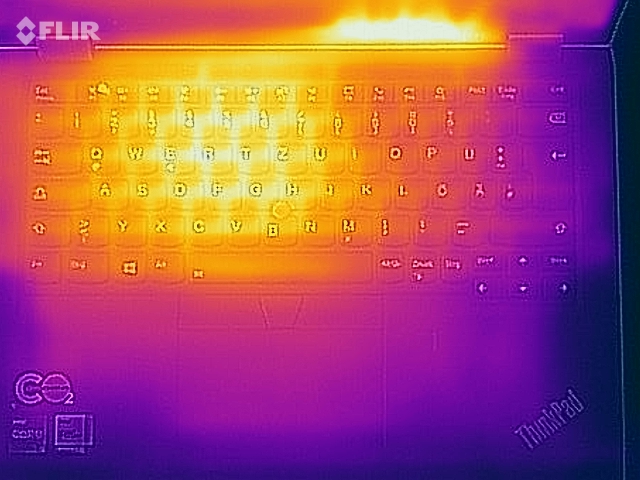
Overall, heat development is very similar to the predecessor, but the maximum temperatures are slightly lower on the whole thanks to the faster fan. We measured a maximum of almost 63 °C (~145 °F) on the bottom and 50 °C (~122 °F) on the top of the old model, but now it's just under 55 °C (~131 °F) and 43 °C (~109 °F), respectively. Nevertheless, you shouldn't place the device on your lap when under full load.
During the stress test, the processor's power consumption quickly settles at 15 watts (sporadic jumps to 25 watts), which is sufficient for 4x 900 MHz (CPU) and 500 MHz (GPU). Performance is slightly affected immediately after the stress test, and a 3DMark 11 run results in about 10% fewer points.
(±) The maximum temperature on the upper side is 43.3 °C / 110 F, compared to the average of 35.4 °C / 96 F, ranging from 19.6 to 60 °C for the class Convertible.
(-) The bottom heats up to a maximum of 54.5 °C / 130 F, compared to the average of 36.9 °C / 98 F
(+) In idle usage, the average temperature for the upper side is 25 °C / 77 F, compared to the device average of 30.3 °C / 87 F.
(+) The palmrests and touchpad are cooler than skin temperature with a maximum of 27.3 °C / 81.1 F and are therefore cool to the touch.
(±) The average temperature of the palmrest area of similar devices was 28 °C / 82.4 F (+0.7 °C / 1.3 F).
Speakers
Lenovo ThinkPad L13 Yoga Gen2-20VK000VGE audio analysis
(±) | speaker loudness is average but good (81.4 dB)
Bass 100 - 315 Hz
(-) | nearly no bass - on average 19.4% lower than median
(±) | linearity of bass is average (10.4% delta to prev. frequency)
Mids 400 - 2000 Hz
(+) | balanced mids - only 3.9% away from median
(+) | mids are linear (3.7% delta to prev. frequency)
Highs 2 - 16 kHz
(±) | reduced highs - on average 6.9% lower than median
(+) | highs are linear (6.2% delta to prev. frequency)
Overall 100 - 16.000 Hz
(±) | linearity of overall sound is average (19.5% difference to median)
Compared to same class
» 47% of all tested devices in this class were better, 6% similar, 46% worse
» The best had a delta of 6%, average was 20%, worst was 57%
Compared to all devices tested
» 48% of all tested devices were better, 7% similar, 44% worse
» The best had a delta of 4%, average was 24%, worst was 134%
HP ProBook x360 435 G7, Ryzen 5 4500U audio analysis
(±) | speaker loudness is average but good (74.1 dB)
Bass 100 - 315 Hz
(-) | nearly no bass - on average 22.9% lower than median
(±) | linearity of bass is average (10.3% delta to prev. frequency)
Mids 400 - 2000 Hz
(+) | balanced mids - only 3% away from median
(+) | mids are linear (5.5% delta to prev. frequency)
Highs 2 - 16 kHz
(+) | balanced highs - only 2.6% away from median
(+) | highs are linear (4.9% delta to prev. frequency)
Overall 100 - 16.000 Hz
(±) | linearity of overall sound is average (22.9% difference to median)
Compared to same class
» 69% of all tested devices in this class were better, 5% similar, 26% worse
» The best had a delta of 6%, average was 20%, worst was 57%
Compared to all devices tested
» 68% of all tested devices were better, 6% similar, 26% worse
» The best had a delta of 4%, average was 24%, worst was 134%
Energy management - ThinkPad with little endurance
Energy consumption
Interestingly, the new model sometimes requires a bit more power than its predecessor in idle scenarios. All in all, the rates are very similar. We measure 65 watts under load for a short time, but this value quickly settles at 49 watts and increases to up to 60 watts every now and then in between. Therefore, the included 65-watt power adapter is sufficient even under load.
| Off / Standby | |
| Idle | |
| Load |
|
Key:
min: | |
| Lenovo ThinkPad L13 Yoga Gen2-20VK000VGE i5-1135G7, Iris Xe G7 80EUs, WDC PC SN730 SDBPNTY-256G, IPS, 1920x1080, 13.3" | HP ProBook x360 435 G7, Ryzen 5 4500U R5 4500U, Vega 6, WDC PC SN520 SDAPNUW-512G, IPS LED, 1920x1080, 13.3" | Acer Spin 5 SP513-54N-79EY i7-1065G7, Iris Plus Graphics G7 (Ice Lake 64 EU), Samsung PM991 MZVLQ1T0HALB, IPS, 2256x1504, 13.5" | Fujitsu LifeBook U9310X i5-10210U, UHD Graphics 620, Toshiba KBG40ZNS512G NVMe, IPS, 1920x1080, 13.3" | Lenovo ThinkPad L13 Yoga 20R6S00800 i5-10210U, UHD Graphics 620, Toshiba XG6 KXG6AZNV512G, IPS, 1920x1080, 13.3" | Average Intel Iris Xe Graphics G7 80EUs | Average of class Convertible | |
|---|---|---|---|---|---|---|---|
| Power Consumption | 19% | 24% | 16% | -2% | 1% | -3% | |
| Idle Minimum * (Watt) | 4.6 | 3.8 17% | 2.8 39% | 2.9 37% | 3.7 20% | 4.49 ? 2% | 4.29 ? 7% |
| Idle Average * (Watt) | 7.3 | 5.7 22% | 5.4 26% | 5.8 21% | 6.2 15% | 7.4 ? -1% | 7.08 ? 3% |
| Idle Maximum * (Watt) | 10.2 | 7.9 23% | 7.6 25% | 9.6 6% | 11.2 -10% | 9.26 ? 9% | 8.68 ? 15% |
| Load Average * (Watt) | 32.3 | 29.3 9% | 36.6 -13% | 34.6 -7% | 44.3 -37% | 36.6 ? -13% | 44 ? -36% |
| Witcher 3 ultra * (Watt) | 35 | ||||||
| Load Maximum * (Watt) | 65.3 | 48.6 26% | 37 43% | 50.7 22% | 65 -0% | 61.7 ? 6% | 67.3 ? -3% |
* ... smaller is better
Battery life
There have been changes in battery life compared to the old model. In our WLAN test, where there are always short load peaks, the high TDP limits are noticeable, and the runtimes are overall a bit shorter both at 150 cd/m² and at maximum brightness (30-60 minutes). Our video test, on the other hand, shows the advantage of the new iGPU that works more efficiently. Therefore, the new L13 Yoga Gen 2 lasts over 2 hours longer.
| Lenovo ThinkPad L13 Yoga Gen2-20VK000VGE i5-1135G7, Iris Xe G7 80EUs, 46 Wh | HP ProBook x360 435 G7, Ryzen 5 4500U R5 4500U, Vega 6, 45 Wh | Acer Spin 5 SP513-54N-79EY i7-1065G7, Iris Plus Graphics G7 (Ice Lake 64 EU), 55 Wh | Fujitsu LifeBook U9310X i5-10210U, UHD Graphics 620, 50 Wh | Lenovo ThinkPad L13 Yoga 20R6S00800 i5-10210U, UHD Graphics 620, 46 Wh | Average of class Convertible | |
|---|---|---|---|---|---|---|
| Battery runtime | 16% | 53% | 97% | 13% | 60% | |
| H.264 (h) | 8.8 | 11 25% | 10.5 19% | 6.6 -25% | 15.3 ? 74% | |
| WiFi v1.3 (h) | 6.7 | 9.7 45% | 10.8 61% | 11.6 73% | 7.7 15% | 11.9 ? 78% |
| Load (h) | 1.4 | 1.1 -21% | 2.5 79% | 3.1 121% | 2.1 50% | 1.779 ? 27% |
Pros
Cons
Verdict - Compact business convertible with many ports

The second generation of the ThinkPad L13 Yoga is still a good business convertible, but the differences are rather minor. Although the Tiger Lake processor also offers a bit more CPU performance, the integrated GPU has made the biggest leap. In addition, a Thunderbolt 4 port is available now. In our opinion, however, this doesn't justify an upgrade from the first L13 Yoga, but users who are currently looking for an affordable business convertible should definitely take a closer look at the device.
For around 1,000 Euros (~$1,207), you get a quality case, a very good keyboard, many ports, and also extensive security features. Although there's no 16:10 panel yet, the display reproduces colors very accurately and also covers the small sRGB color space completely. However, the glossy touchscreen still affects the use in very bright environments. Furthermore, Lenovo has adjusted the fan control to get a better grip on the high case temperatures of the predecessor, and this has worked successfully. Nevertheless, the fan doesn't get unpleasantly loud.
The new Tiger Lake processor improves graphics performance in particular, and there are faster ports that include Thunderbolt 4. This makes the ThinkPad L13 Yoga Gen 2 a very interesting business convertible with a sturdy case and a very good keyboard.
Price and availability
You can find the Lenovo ThinkPad L13 Gen 2 directly on the manufacturer's online store starting at around $940 for the version with an Intel Core i3-1115G4 and 4 GB of RAM. The model with the i5-1135G7, 8 GB of RAM, and 512 GB of SSD storage will set you back about $1,230. Alternatively, you can find a version with the i7-1165G7, 16 GB of RAM, and a 512 GB SSD for approximately $1,530 on Amazon.
Lenovo ThinkPad L13 Yoga Gen2-20VK000VGE
- 04/22/2021 v7 (old)
Andreas Osthoff
Price comparison

