Lenovo ThinkCentre M910z All-in-One Desktop Review
While the wider market continues to trend toward portable computing, there’s still substantial demand for desktops for certain applications, most notably in the business segment. But the latest generation of mainstream business desktops has not ignored the progress of the rest of the industry—and the Lenovo ThinkCentre M910z leverages the improvements in chipset efficiency alongside years of experience in business machine R&D to provide a well-balanced, quiet, cool, and conveniently-designed all-in-one for the office.
Our test unit includes a 23.8-inch FHD IPS anti-glare touchscreen display, 512 GB NVMe SSD, 8 GB DDR4 memory, and a Core i5-7500 quad-core CPU. It retails for $1,285 at Lenovo.com currently, which is a reasonable price given its large NVMe solid-state drive and other expensive components. What other surprises has Lenovo packed into this machine—and can its real-world performance live up to its promise?
Case
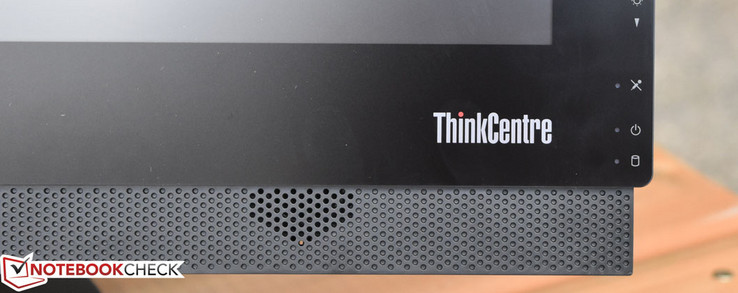
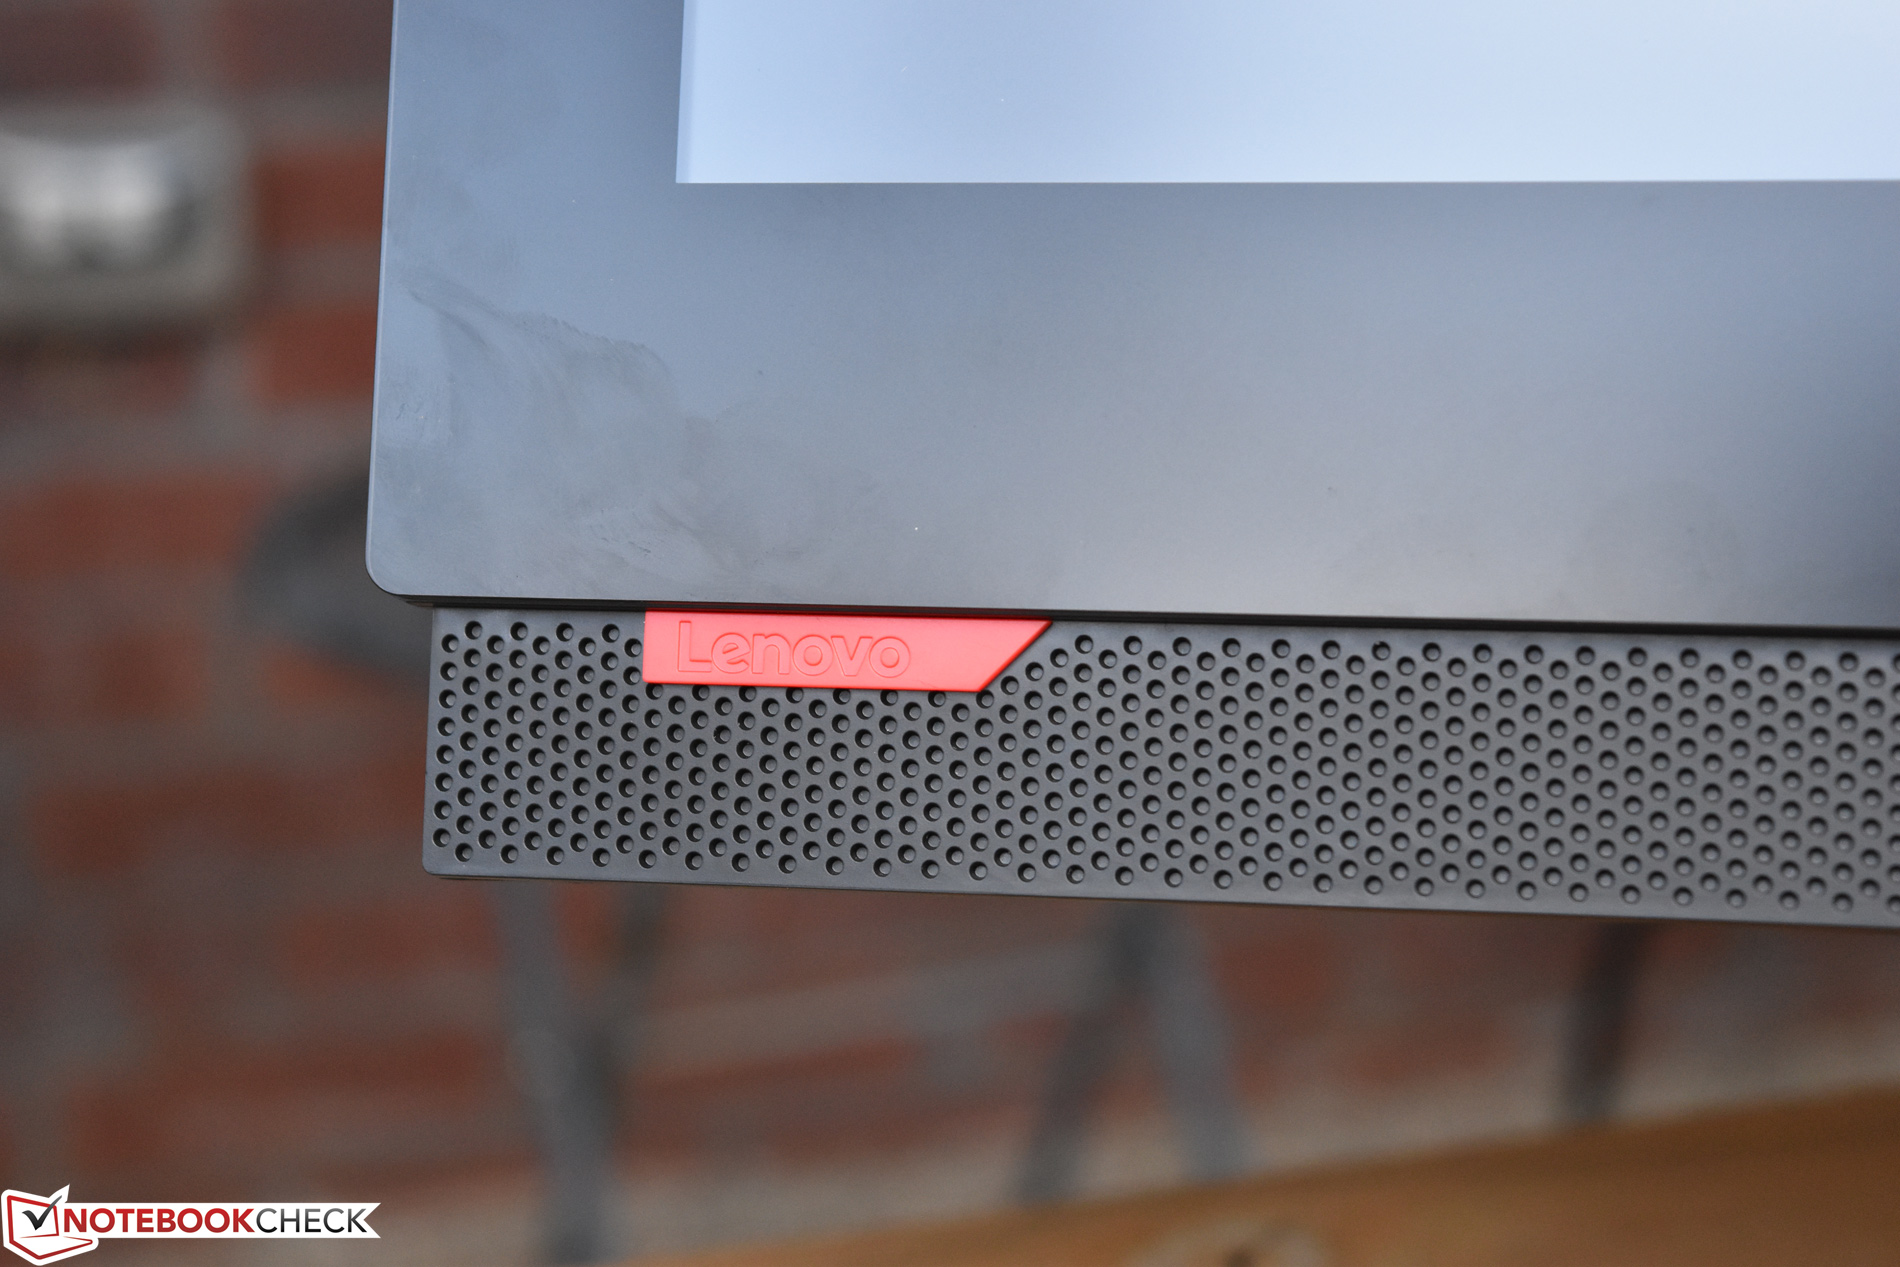
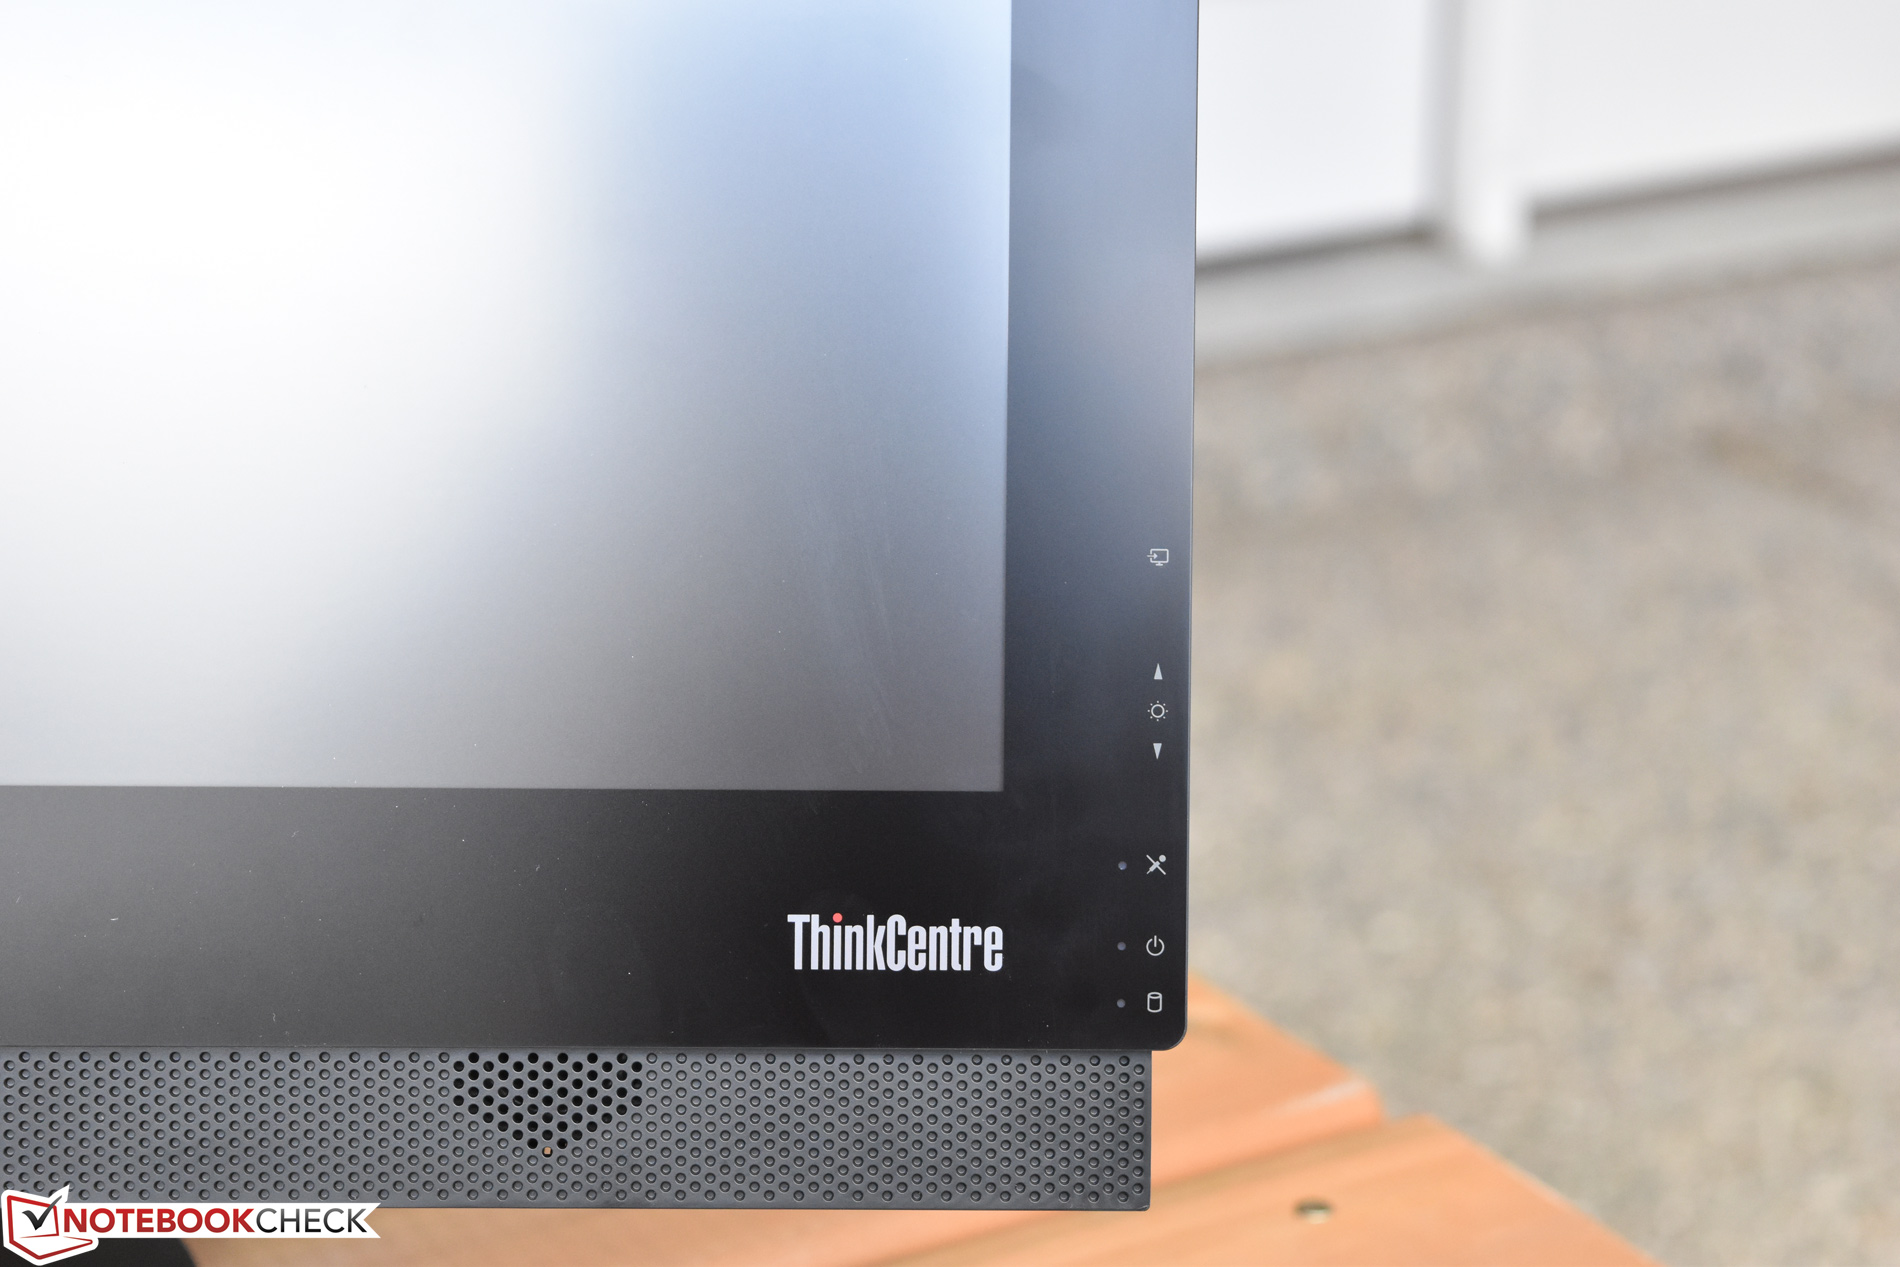
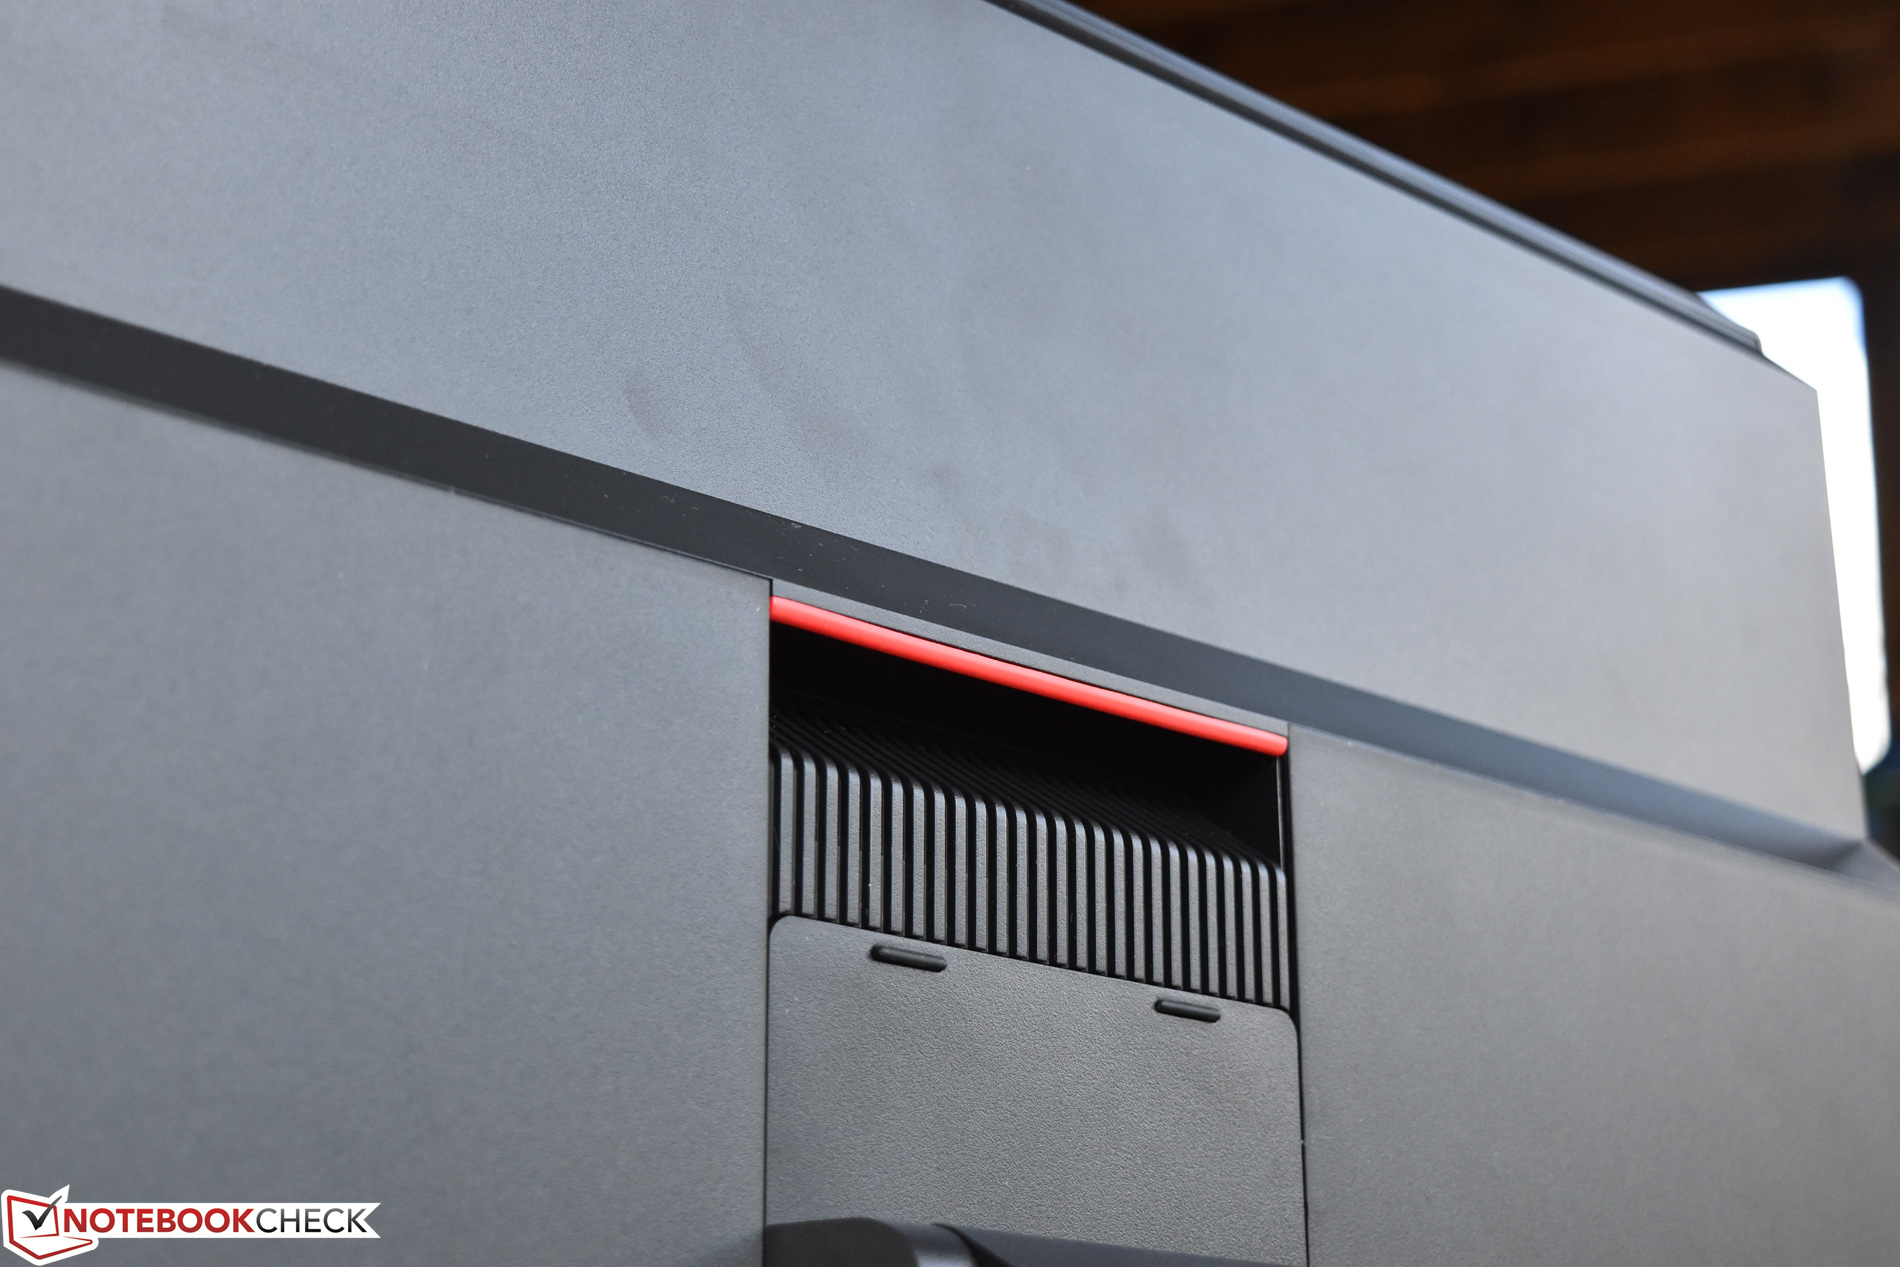
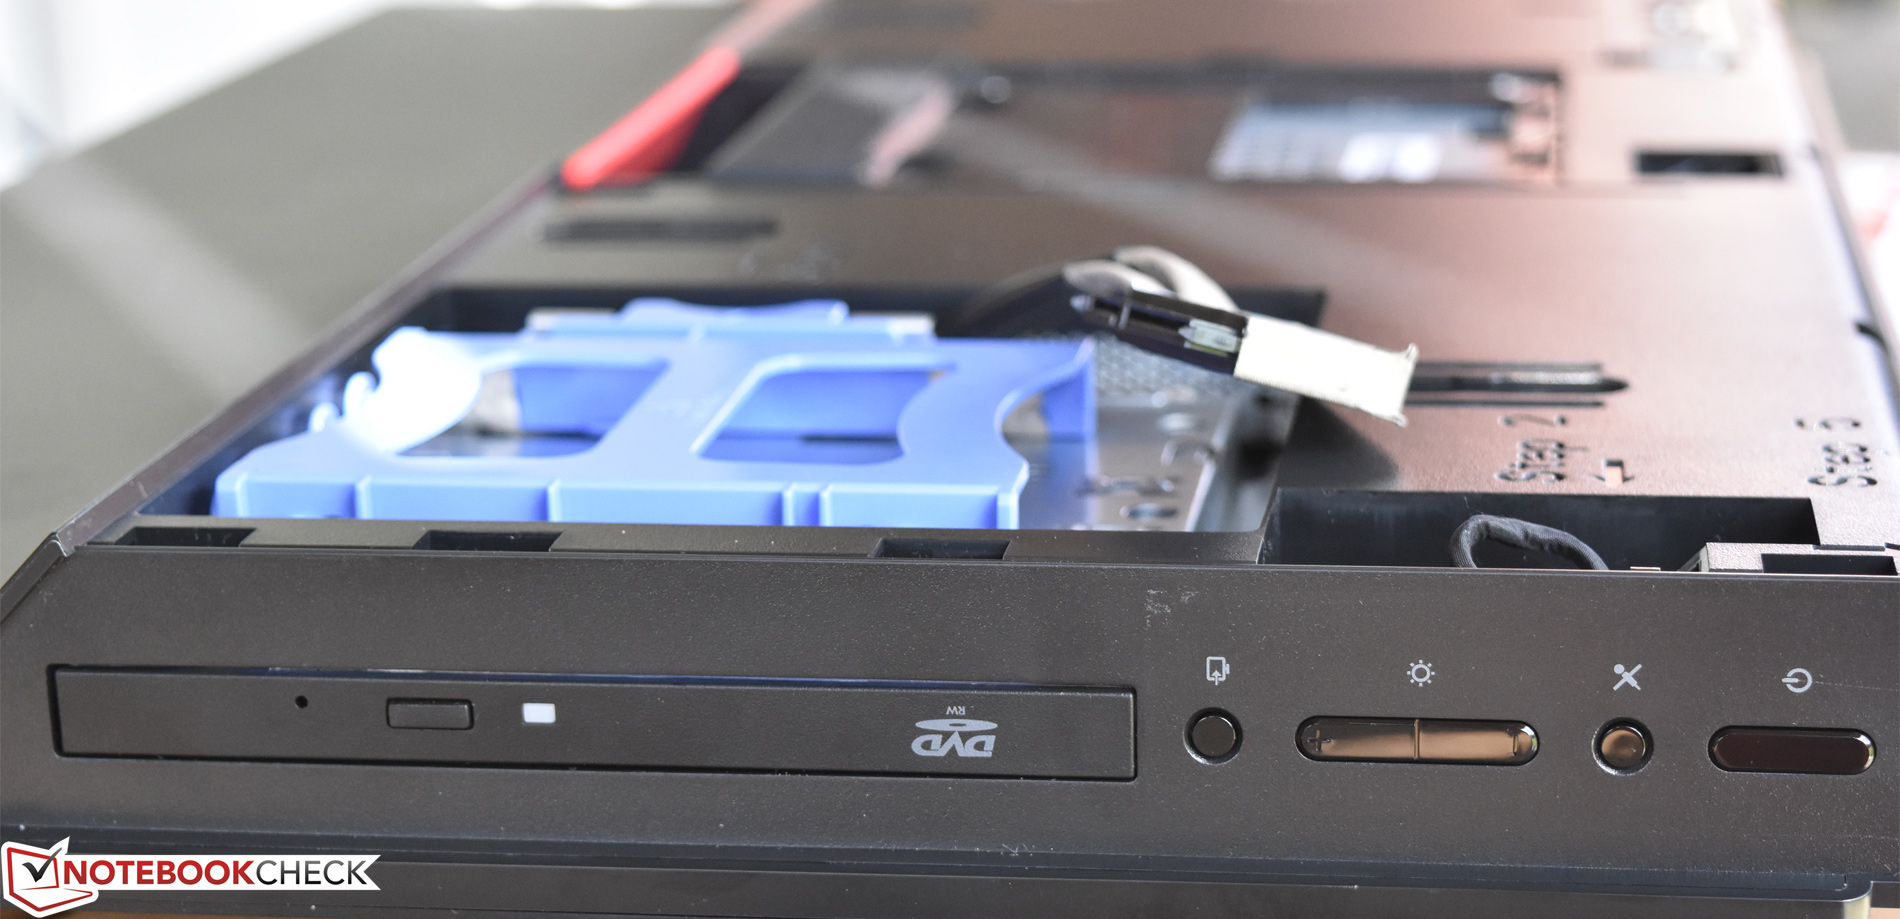
The ThinkCentre M910z adopts the venerable classic ThinkPad styling and color scheme, adorned in matte black surfaces (hard, sturdy plastic, that is) with occasional red accents. Control buttons (monitor input mode, brightness, microphone mute, power) are conveniently located on the right edge of the machine below the optical drive. The entire machine is fairly compact considering its incorporation of a 23.8-inch display; depth (measuring roughly 255 mm / 10 inches) is the single variable that may prove problematic for some office spaces. Apart from that, the convenience of doing away with a “tower” carries obvious appeal—especially when one considers the relative ease of access to internal components (more on this in our maintenance section in a bit).
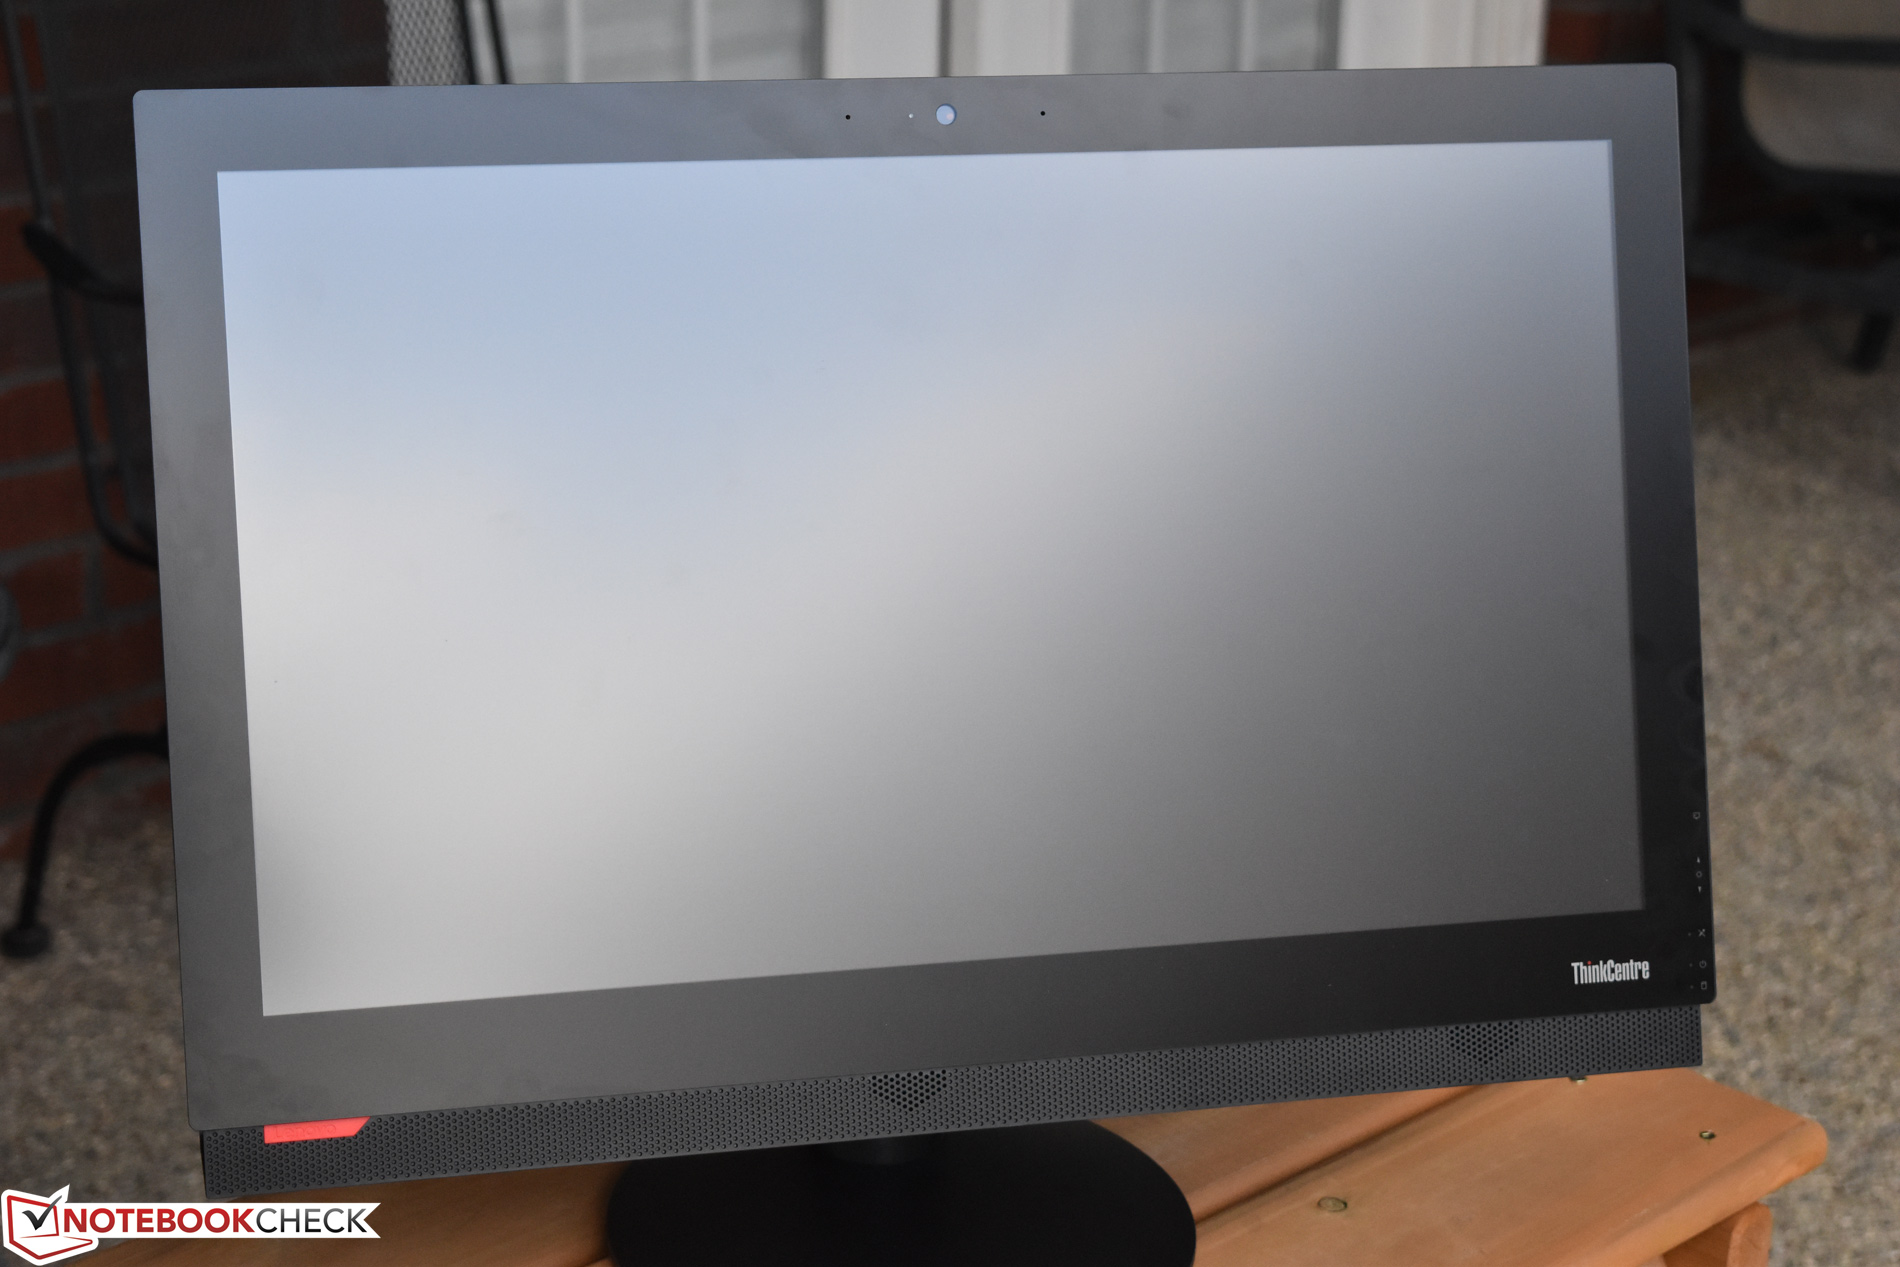
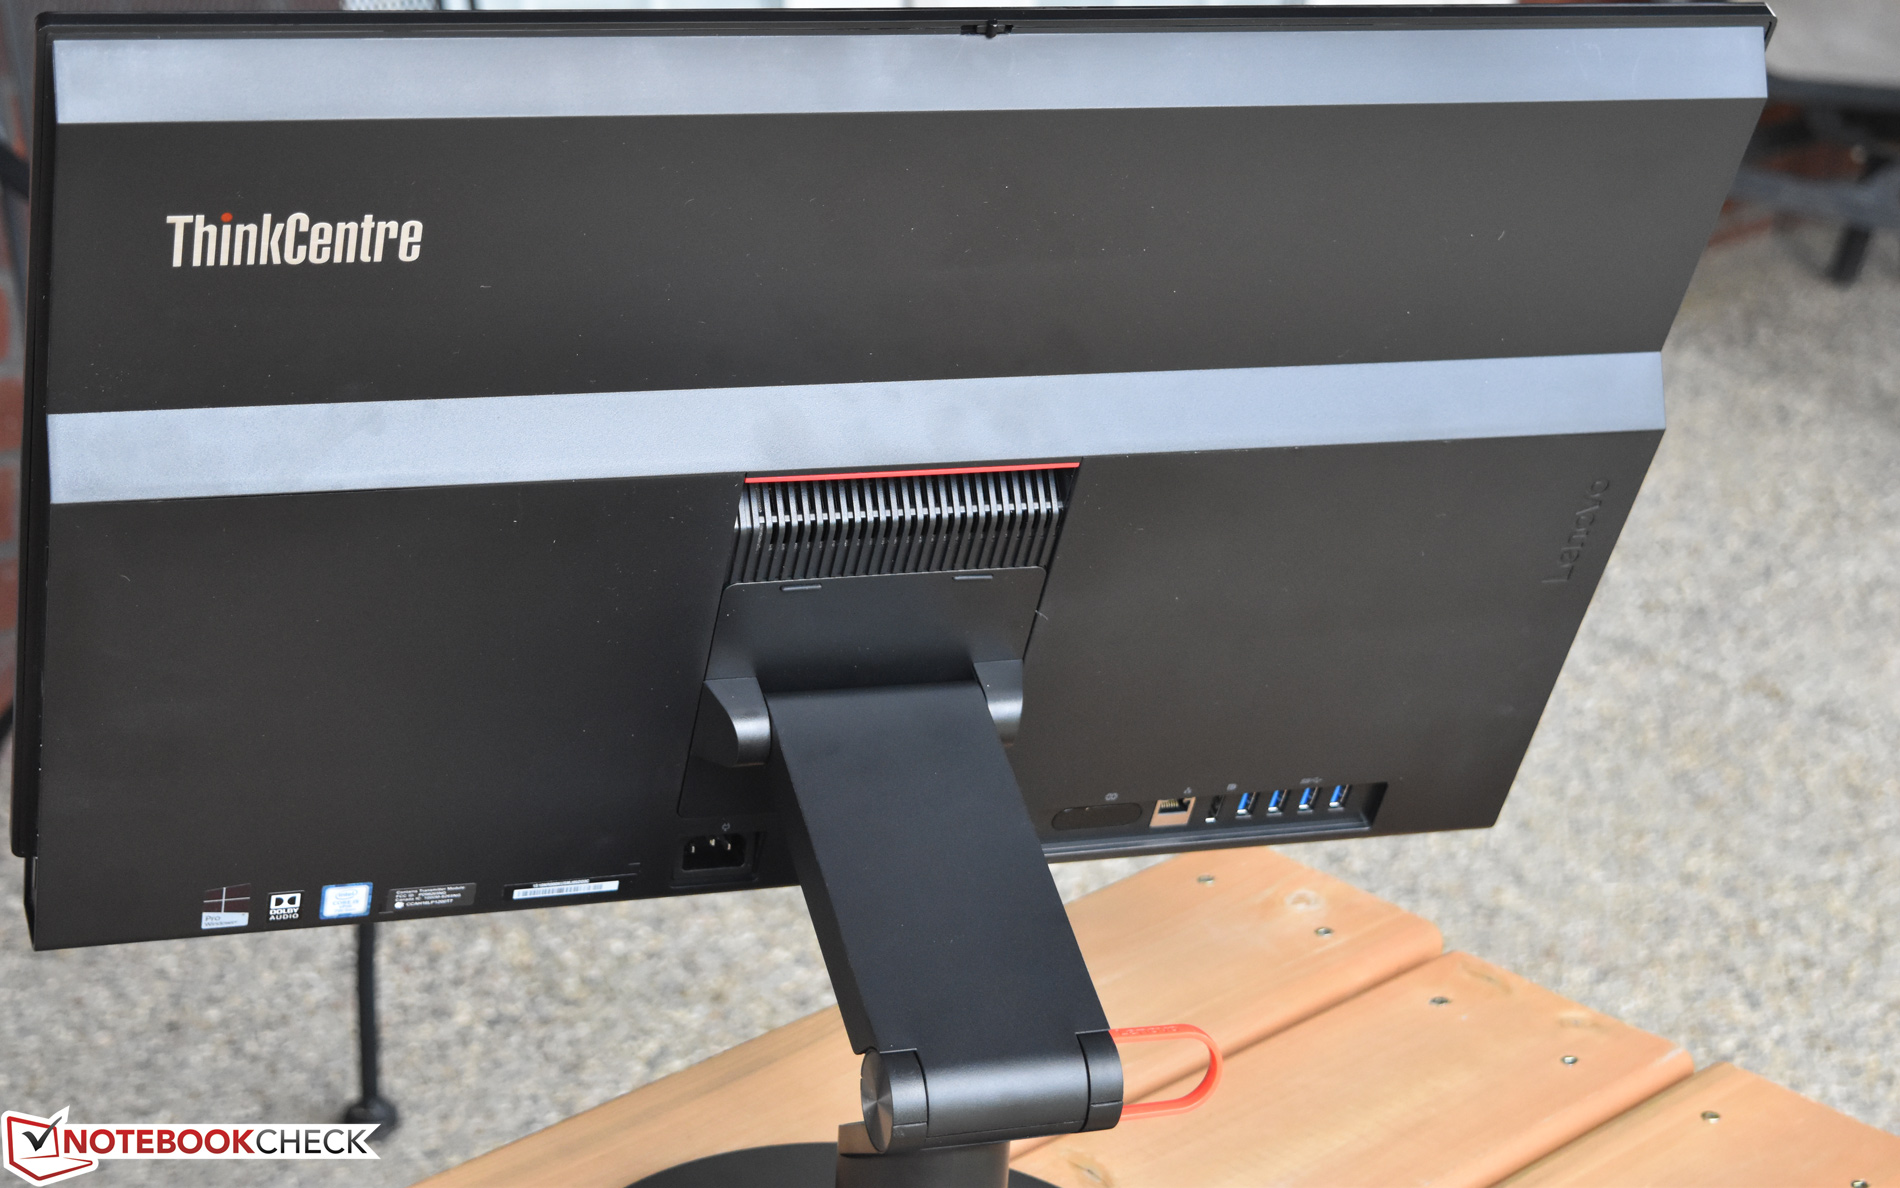
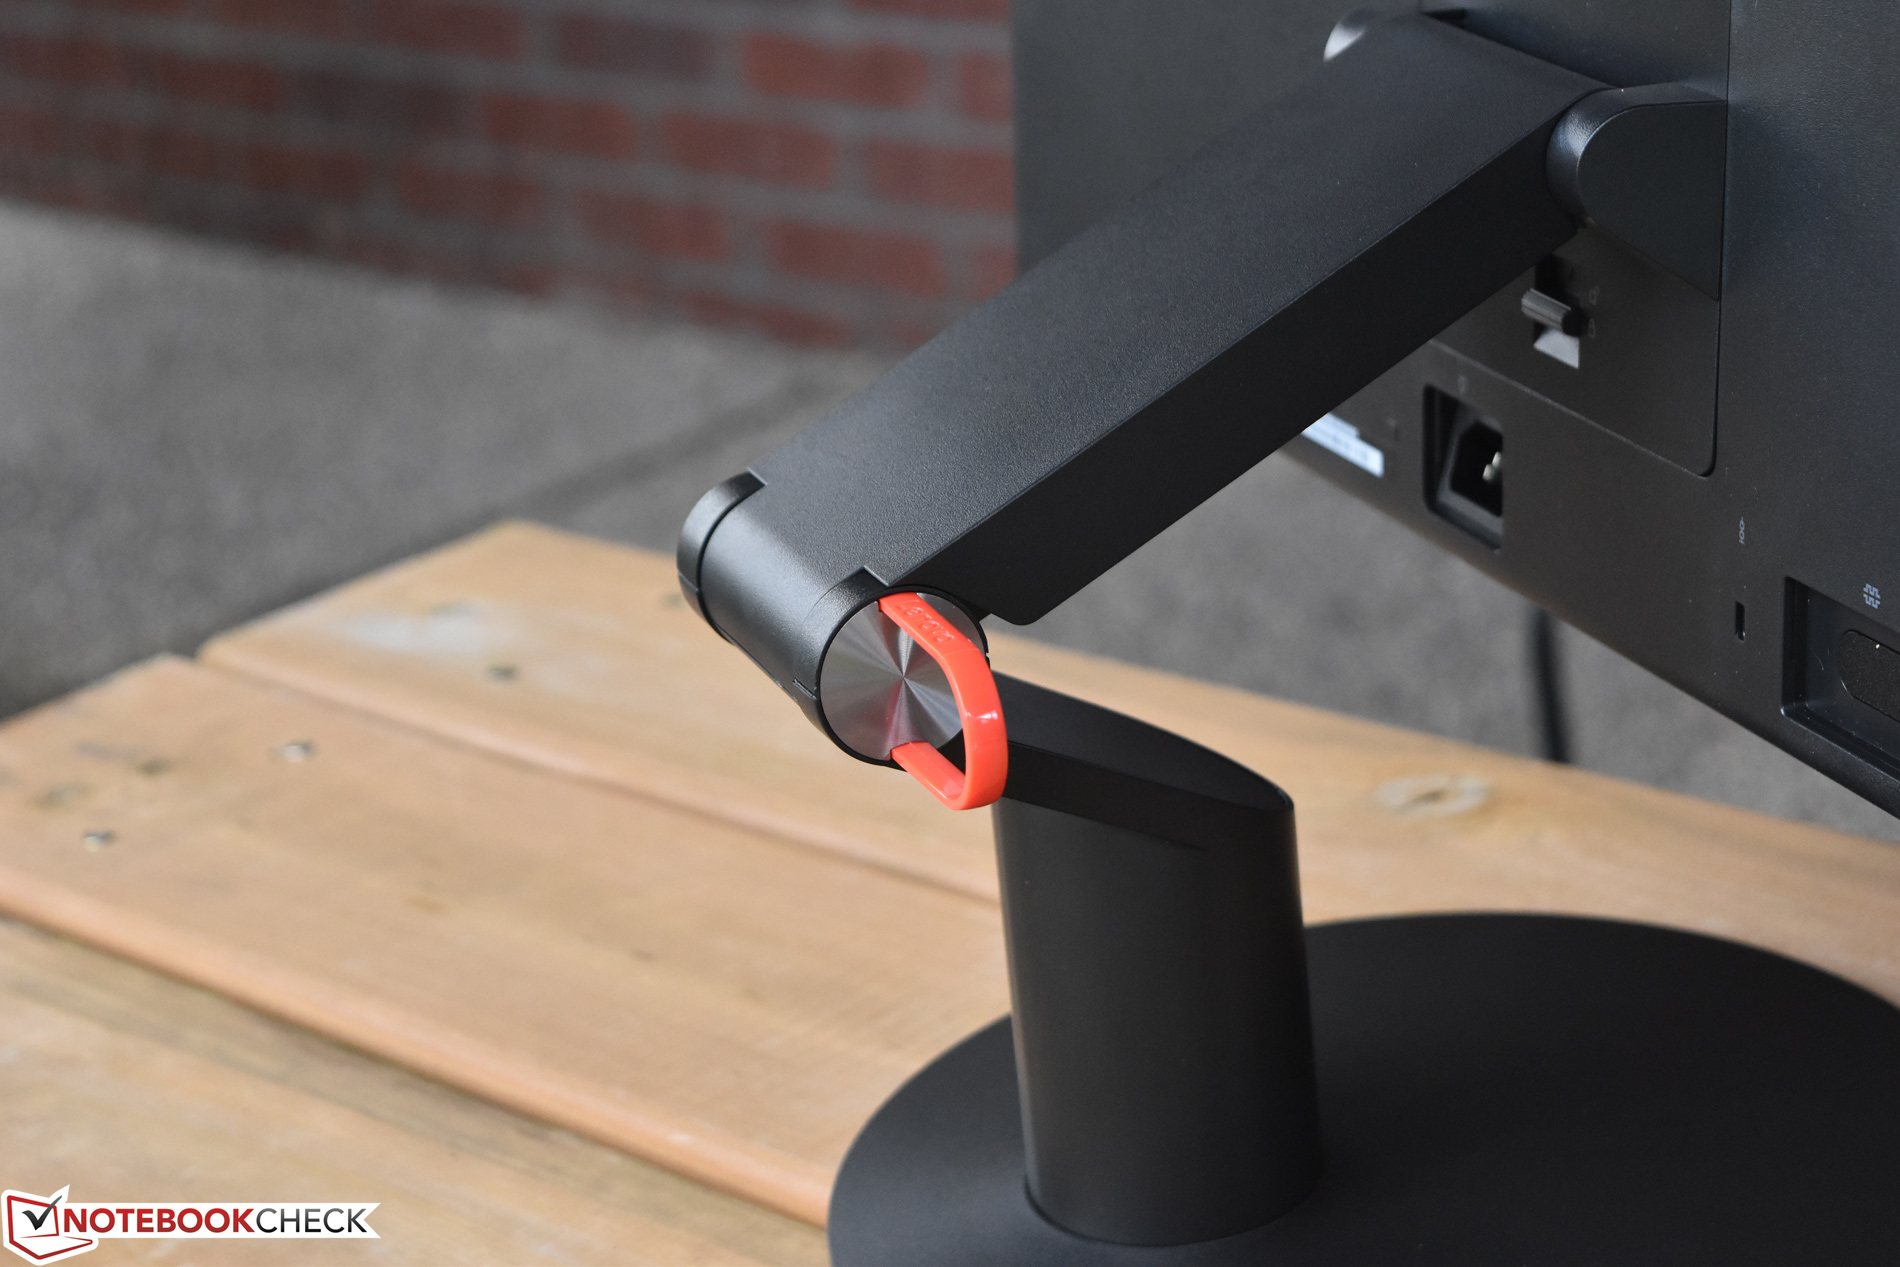
The base/stand is also constructed of plastic, but like the rest of the machine, there is little concern surrounding its stability. It’s an articulating stand which allows for height adjustments ranging between 1 inch up to 4.5 inches off the surface, as well as just about every viewing angle (frontwards, anyway) that a user could practically hope for. Thanks to the anti-glare screen finish, positioning the monitor as desired carries few repercussions. The entire machine weighs in at around 10.3 kg (22.71 pounds). There is no separate power adapter; a standard AC cable connects the device directly to an outlet.
Connectivity
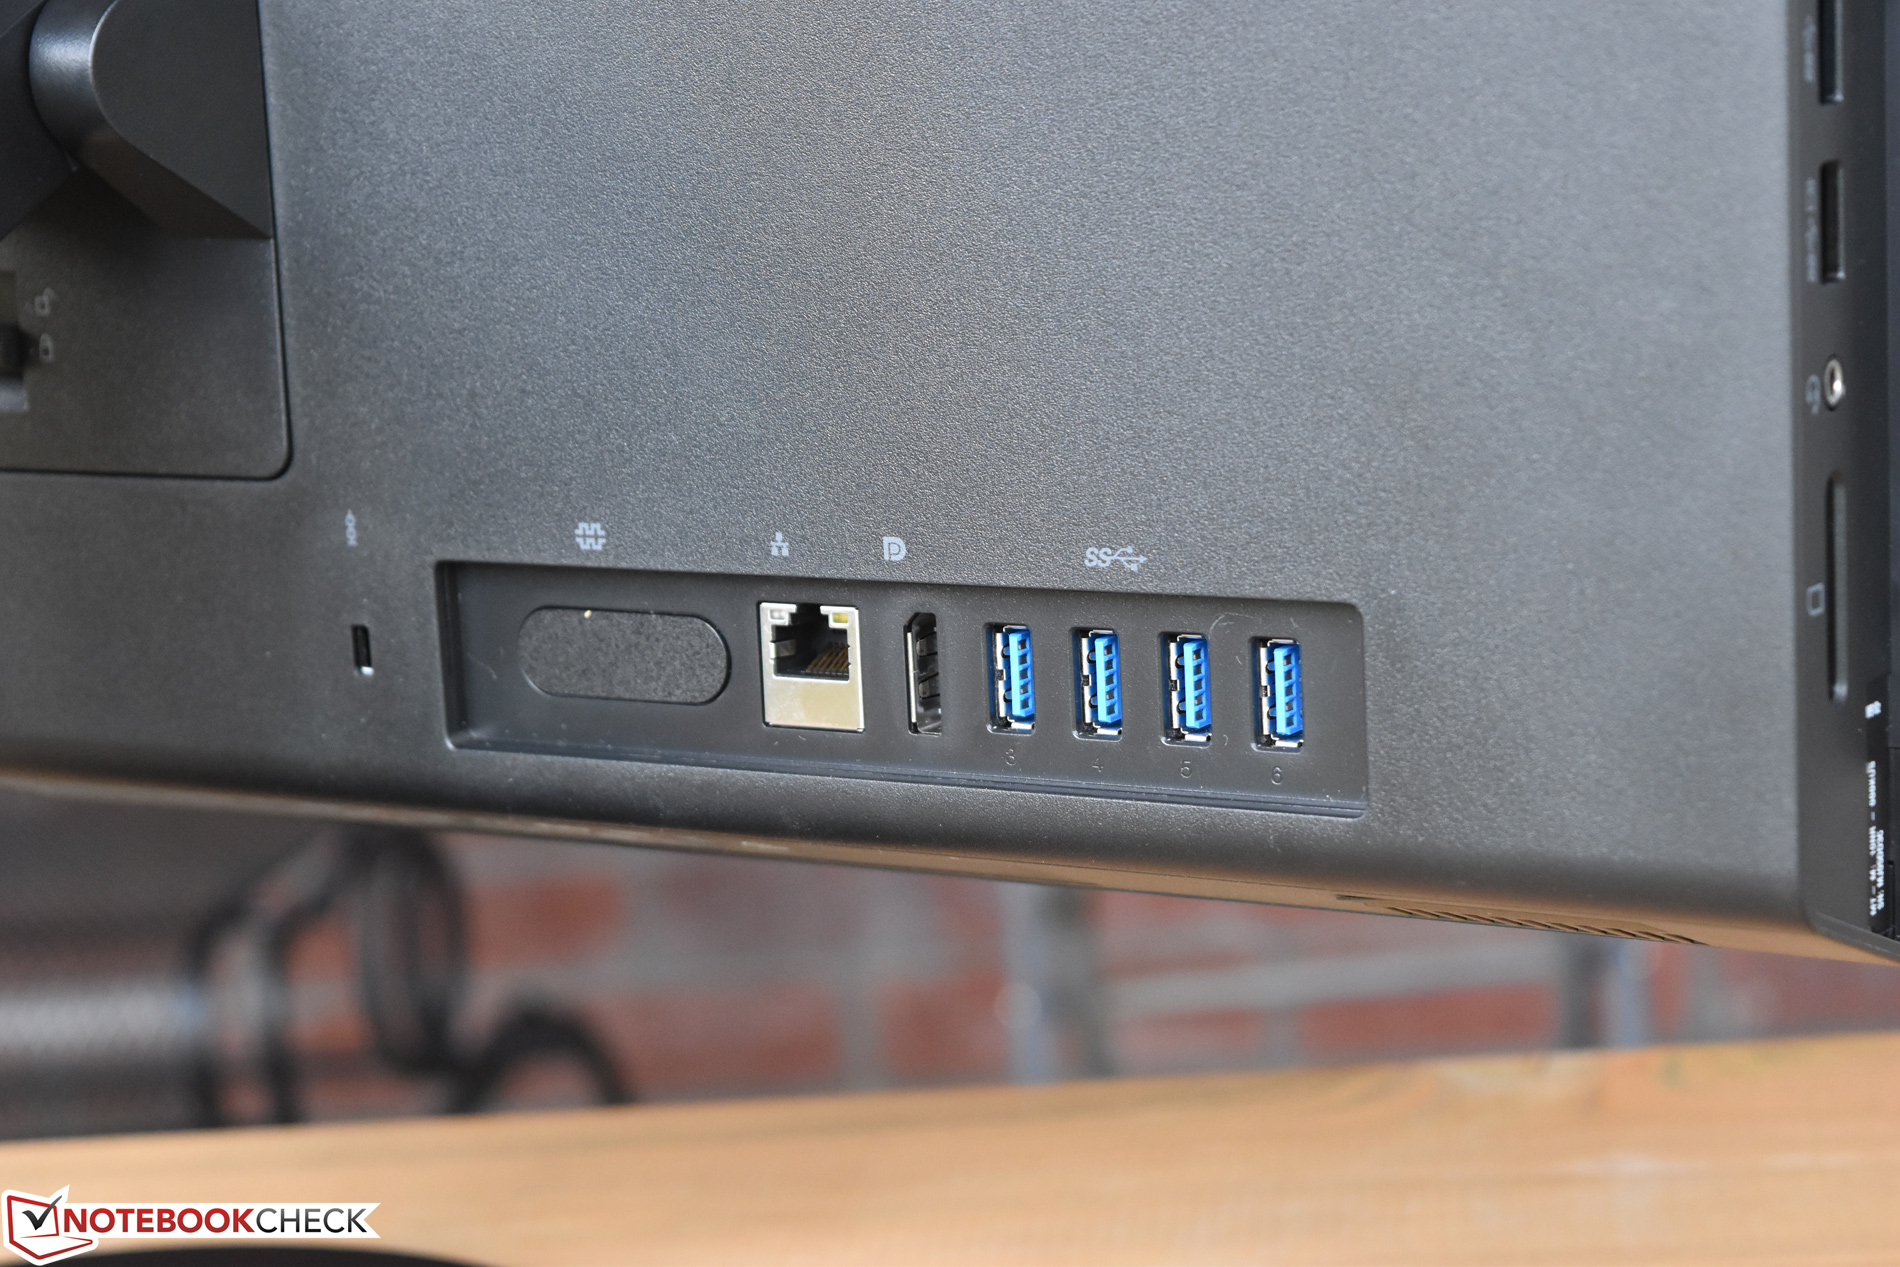
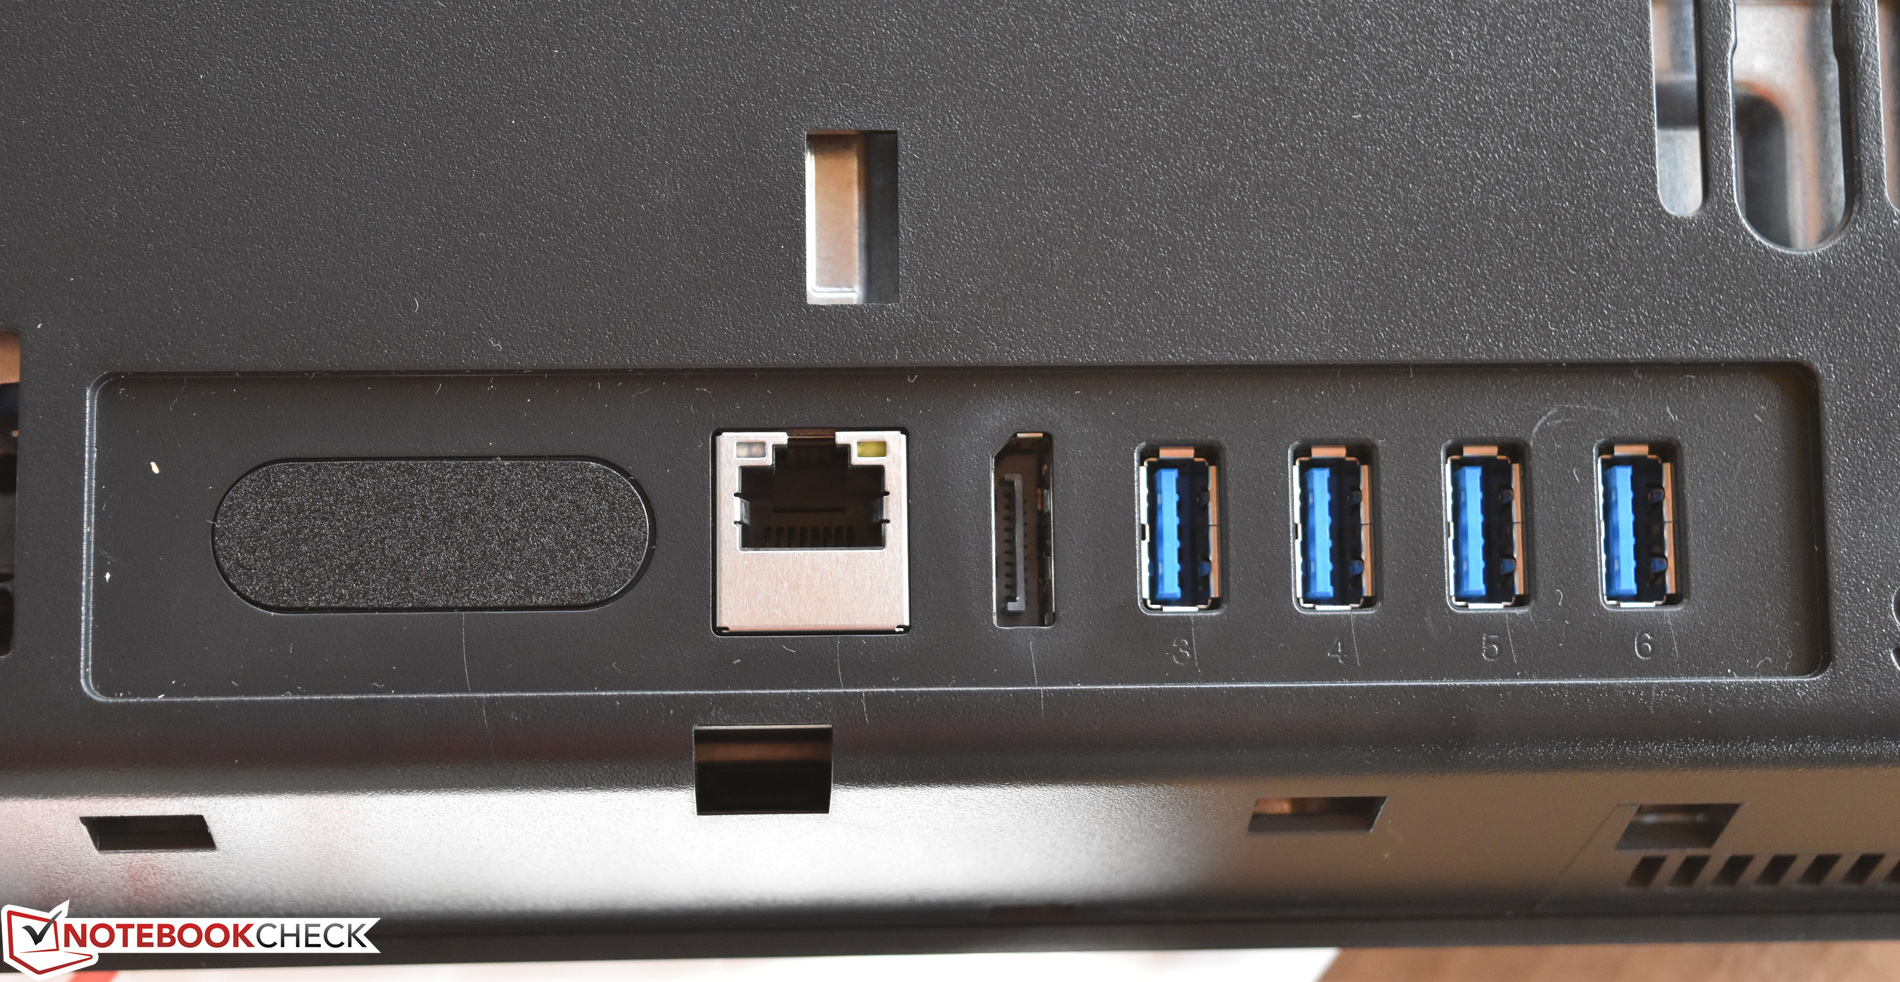
Two USB 3.1 Gen 1 ports (one Always On + Fast Charge), the card reader, and a headphone/microphone combo audio jack line the left side of the machine for easy access. The remaining four USB 3.1 ports (for a total of 6), DisplayPort, and Gigabit Ethernet port are located on the back. The power port is also in the center of the back; cables can be routed through an attached organizer loop on the left side of the rear hinge, leaving a clean look behind the machine at the user’s desk.
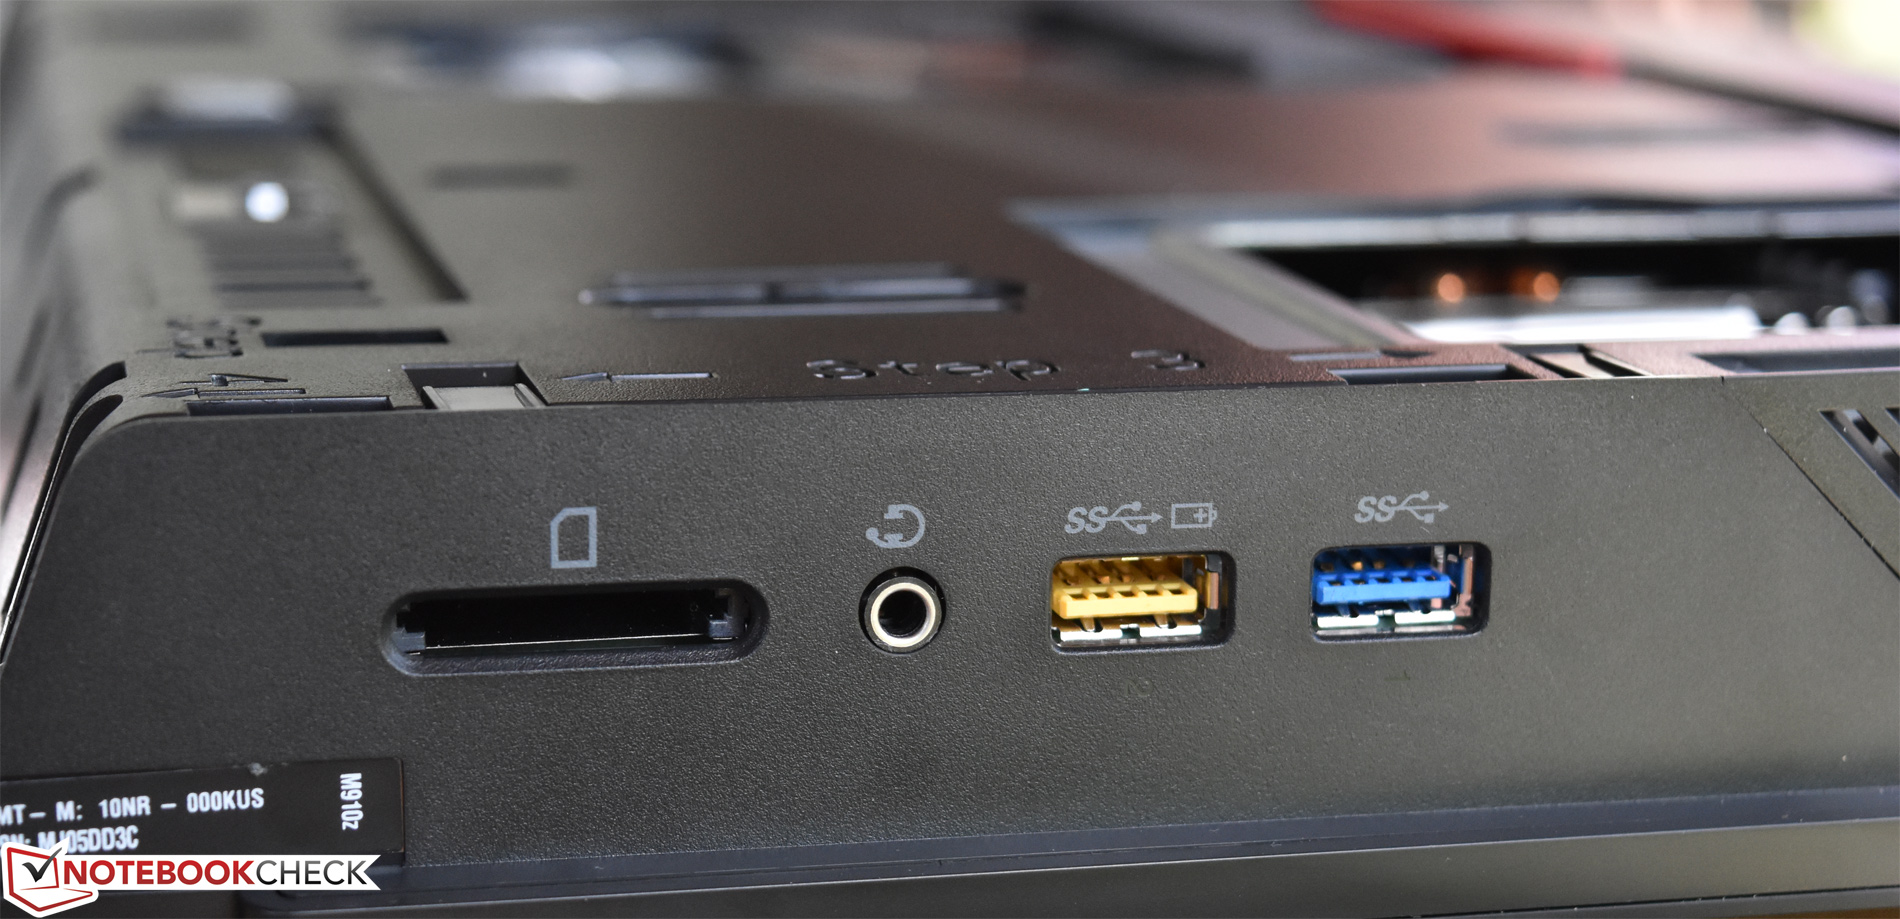
SD Card Reader
The integrated card reader is convenient, yet quite slow as determined by our usual benchmarks.
| SD Card Reader | |
| average JPG Copy Test (av. of 3 runs) | |
| Dell Latitude 5580 | |
| HP Z1 G2 G1X47EA | |
| Lenovo ThinkPad T470p-20J7S00000 | |
| Lenovo ThinkCentre M910z-10NR000KUS | |
| maximum AS SSD Seq Read Test (1GB) | |
| Dell Latitude 5580 | |
| Lenovo ThinkPad T470p-20J7S00000 | |
| HP Z1 G2 G1X47EA | |
| Lenovo ThinkCentre M910z-10NR000KUS | |
Communication
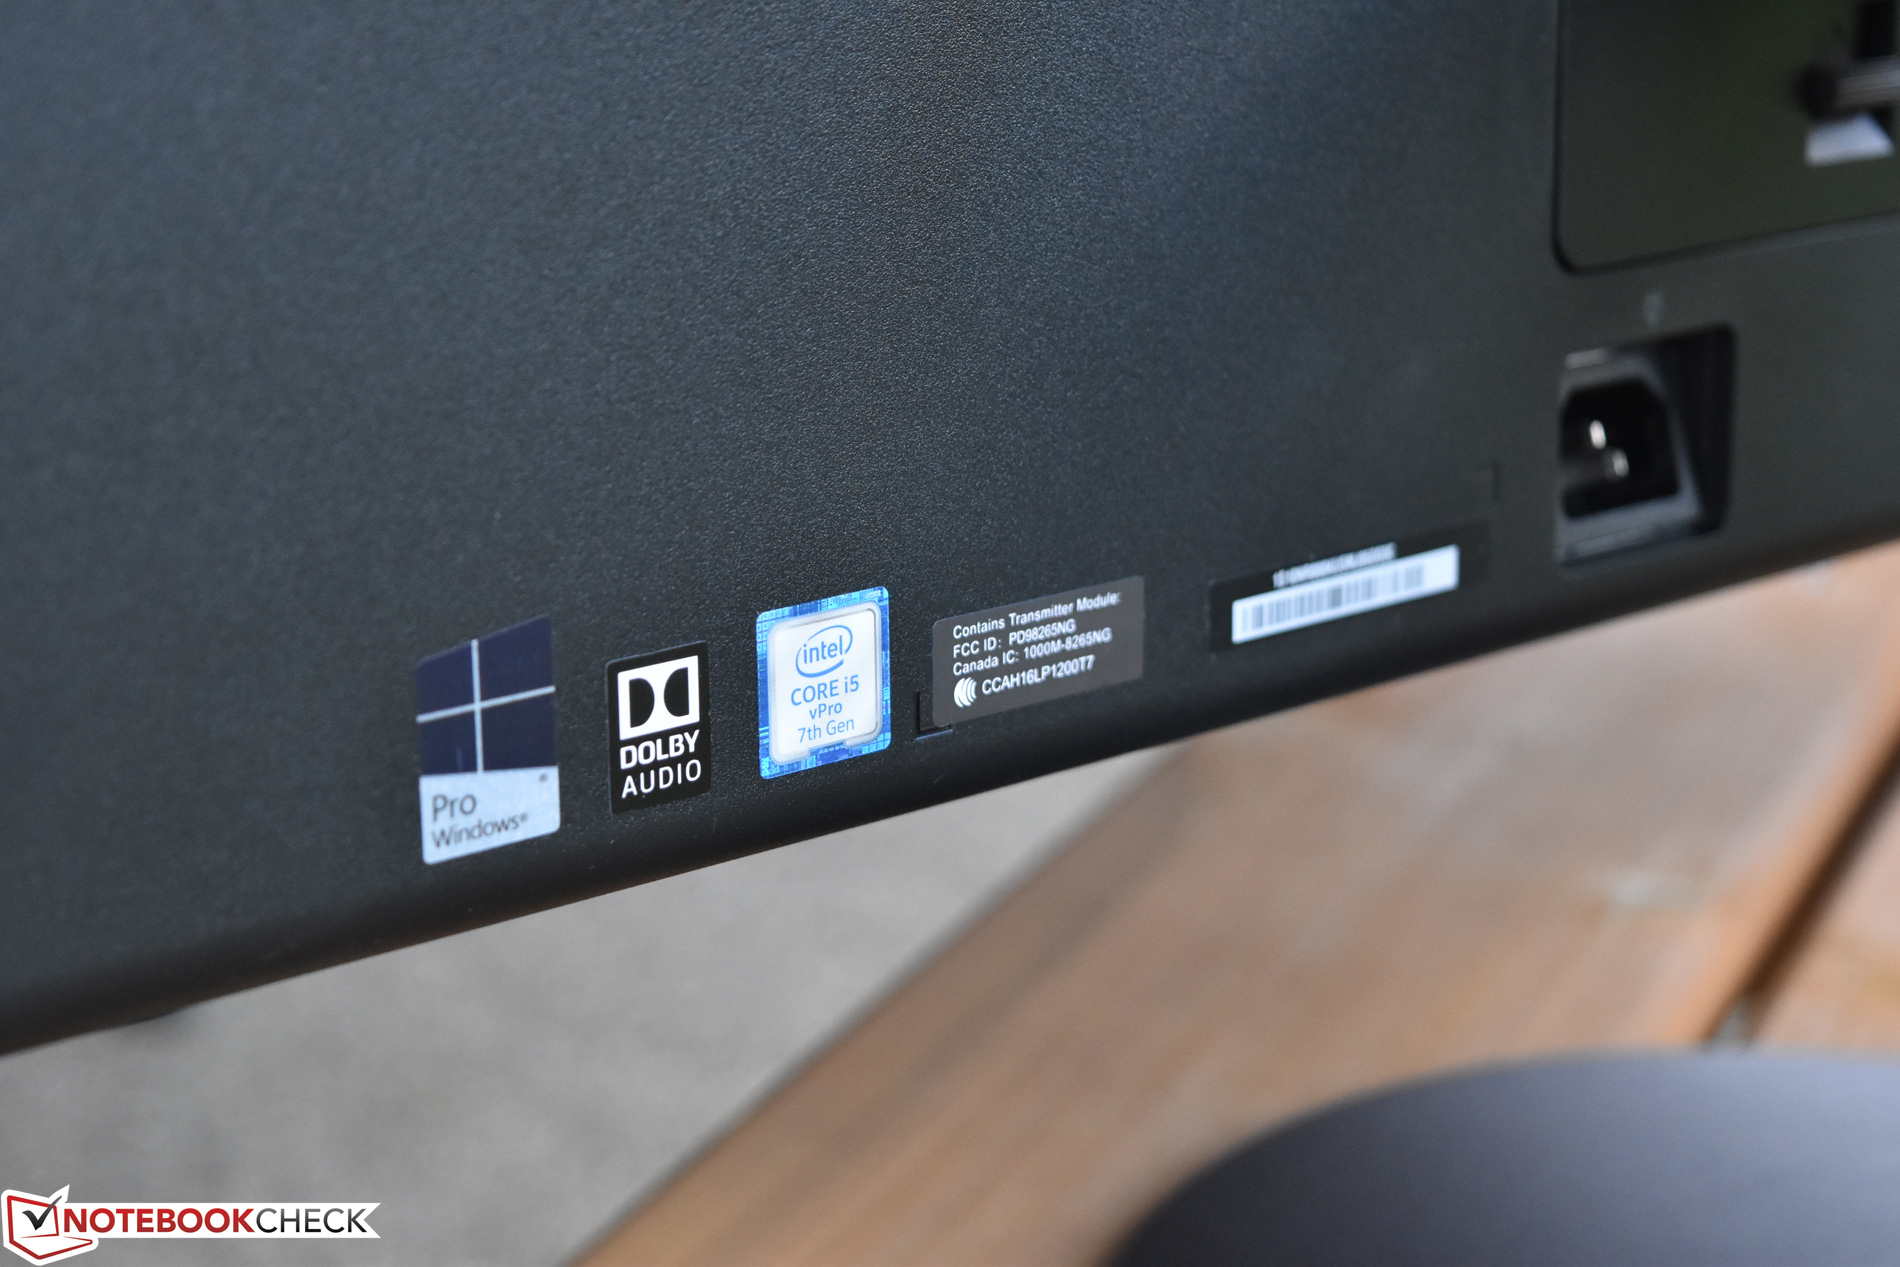
The WLAN adapter powering the ThinkCentre’s wireless networking is the popular Intel 8265 Wireless-AC, which also includes Bluetooth 4.1 connectivity. Meanwhile, an Intel I219-LM Gigabit Ethernet adapter is also on board. The webcam can easily be blinded for security via the integrated cover switch.
| Networking | |
| iperf3 transmit AX12 | |
| Lenovo ThinkCentre M910z-10NR000KUS | |
| Lenovo ThinkPad T470p-20J7S00000 | |
| Dell Latitude 5580 | |
| iperf3 receive AX12 | |
| Lenovo ThinkCentre M910z-10NR000KUS | |
| Lenovo ThinkPad T470p-20J7S00000 | |
| Dell Latitude 5580 | |
Accessories
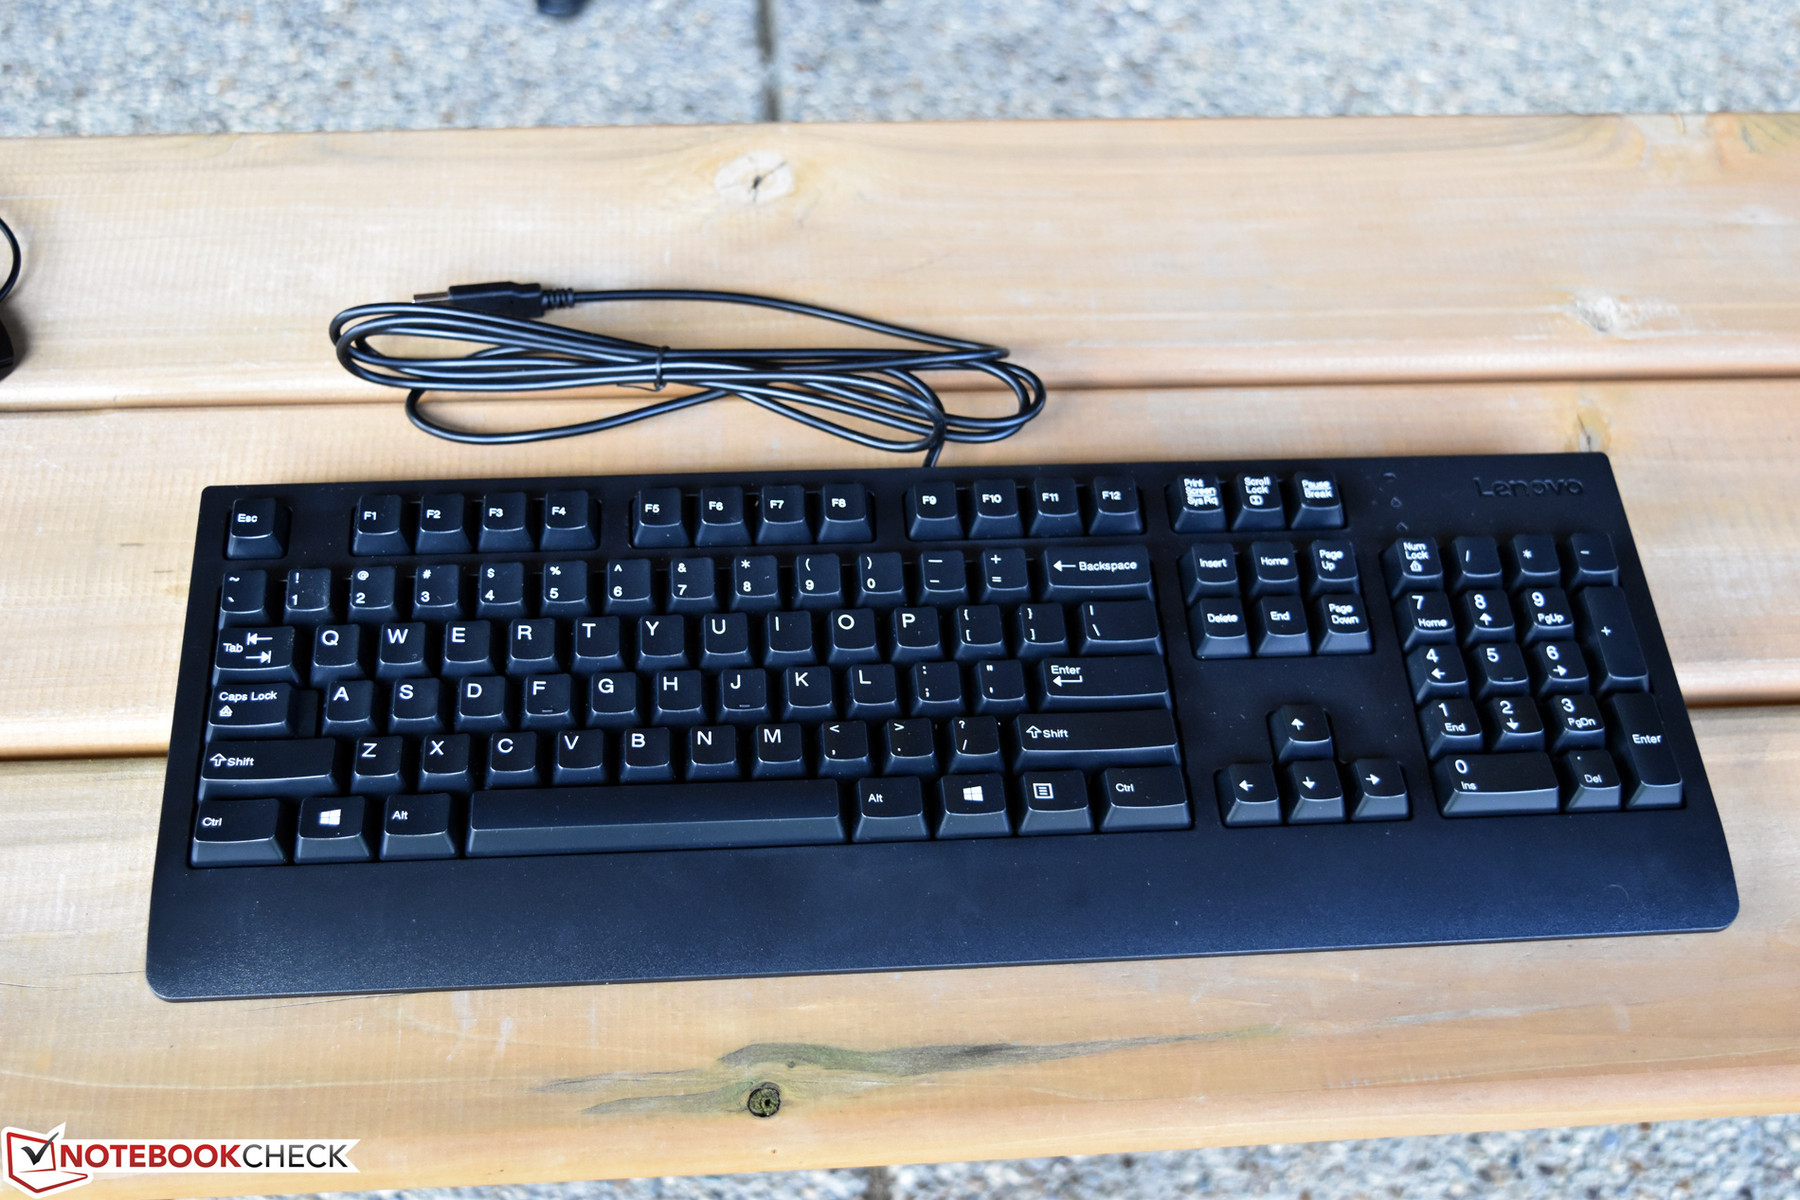
No accessories are included with the ThinkCentre M910z apart from the keyboard and mouse peripherals, which we’ll cover in just a moment.
Maintenance
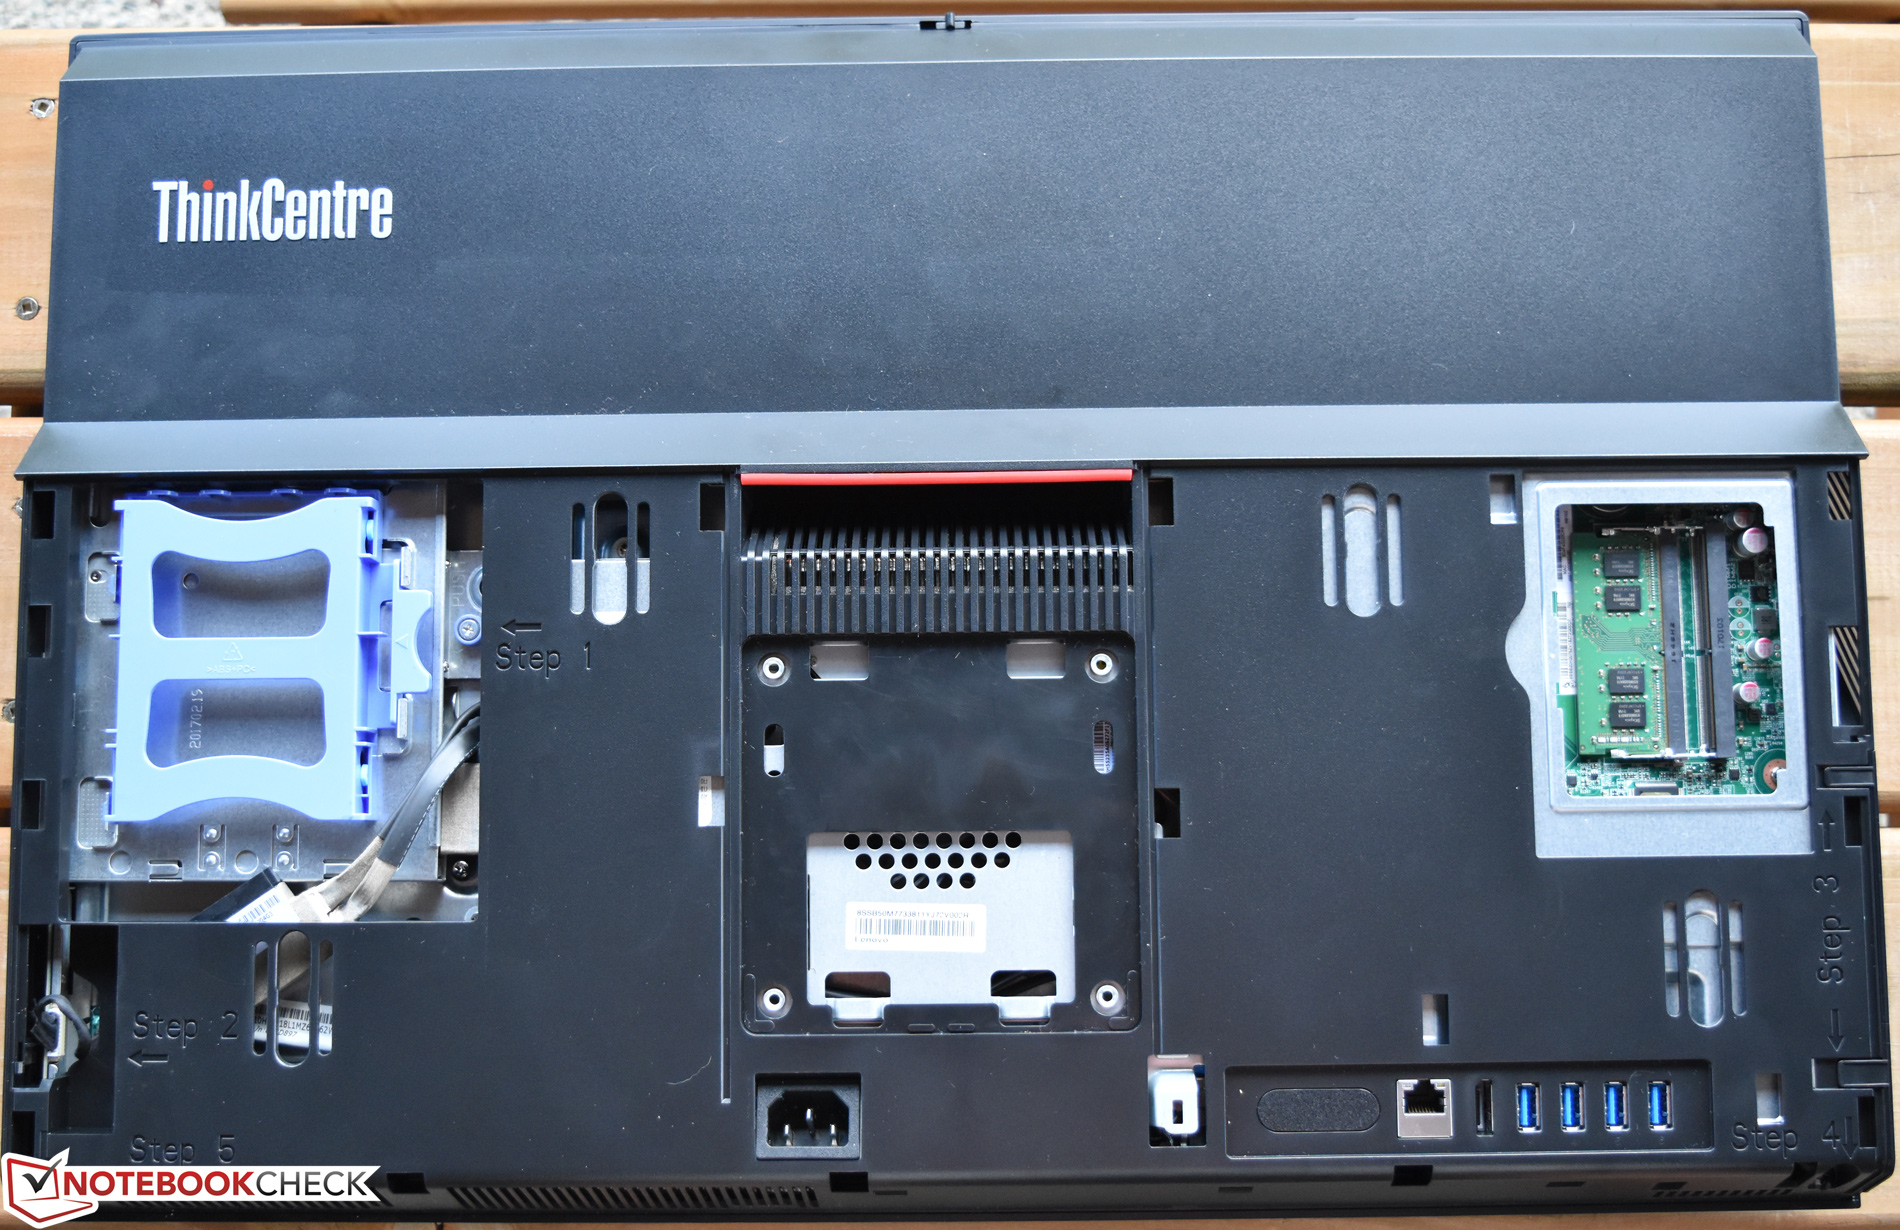
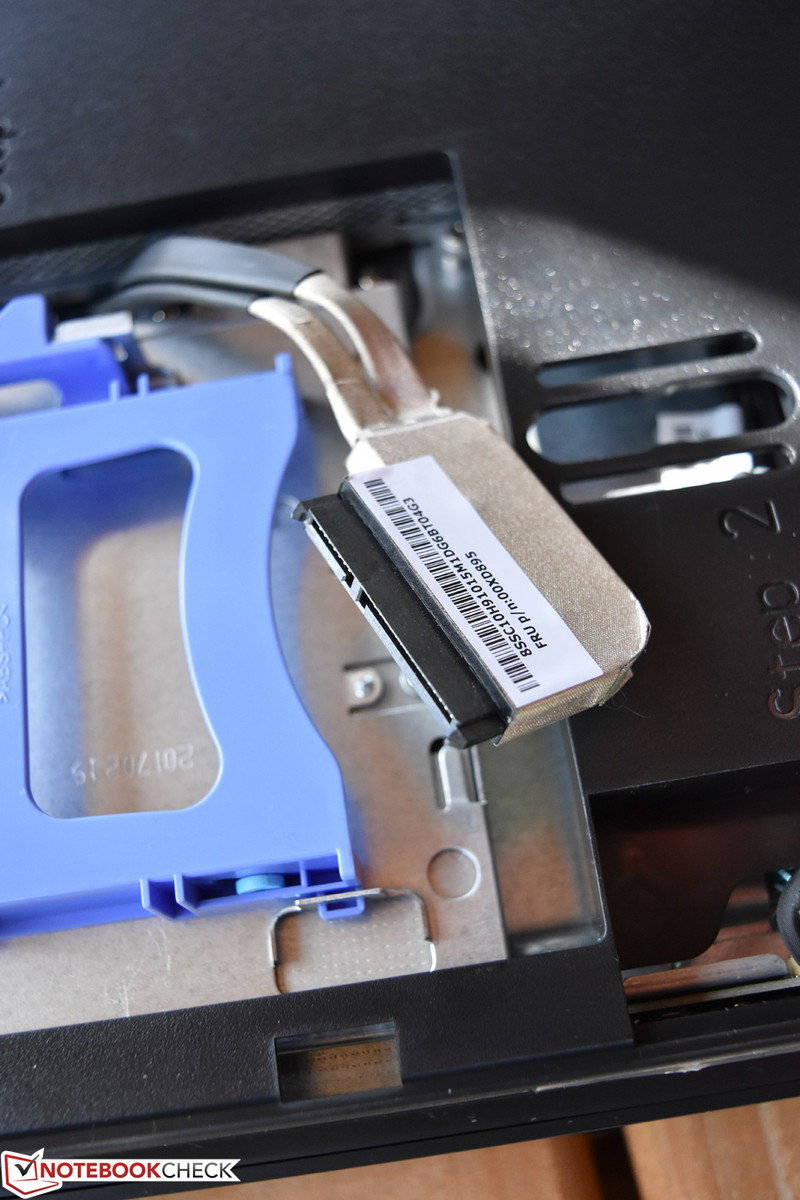
Maintenance is relatively simple for an all-in-one. One of the biggest criticisms historically of AIO desktops has been the accessibility of internal parts—but, at least in terms of the hard drive and RAM access, the M910z makes it easy: simply place the system face down on a safe surface, slide the release latch upward to release and remove the stand from the rear, and press down and slide on the back cover to remove it. Beneath it, you’ll find both the hard drive bay and the RAM (our machine came with an NVMe SSD installed in the interior PCIe M.2 slot, so the hard drive bay was actually empty, awaiting a storage drive if desired).
However, if additional maintenance is required, the internal computer cover must also be removed, which involves the careful disengagement of multiple plastics clips along with a couple of screws, followed by the removal of the system board shield, which is secured by a number of other screws. Overall, maintenance isn’t terrible, though, and for the most part, the easy access to the RAM and the second drive bay probably cover most of what will normally be necessary.
Warranty
The M910z carries a 1-year on-site warranty. Please see our Guarantees, Return Policies & Warranties FAQ for country-specific information.
Input Devices
Keyboard and Mouse
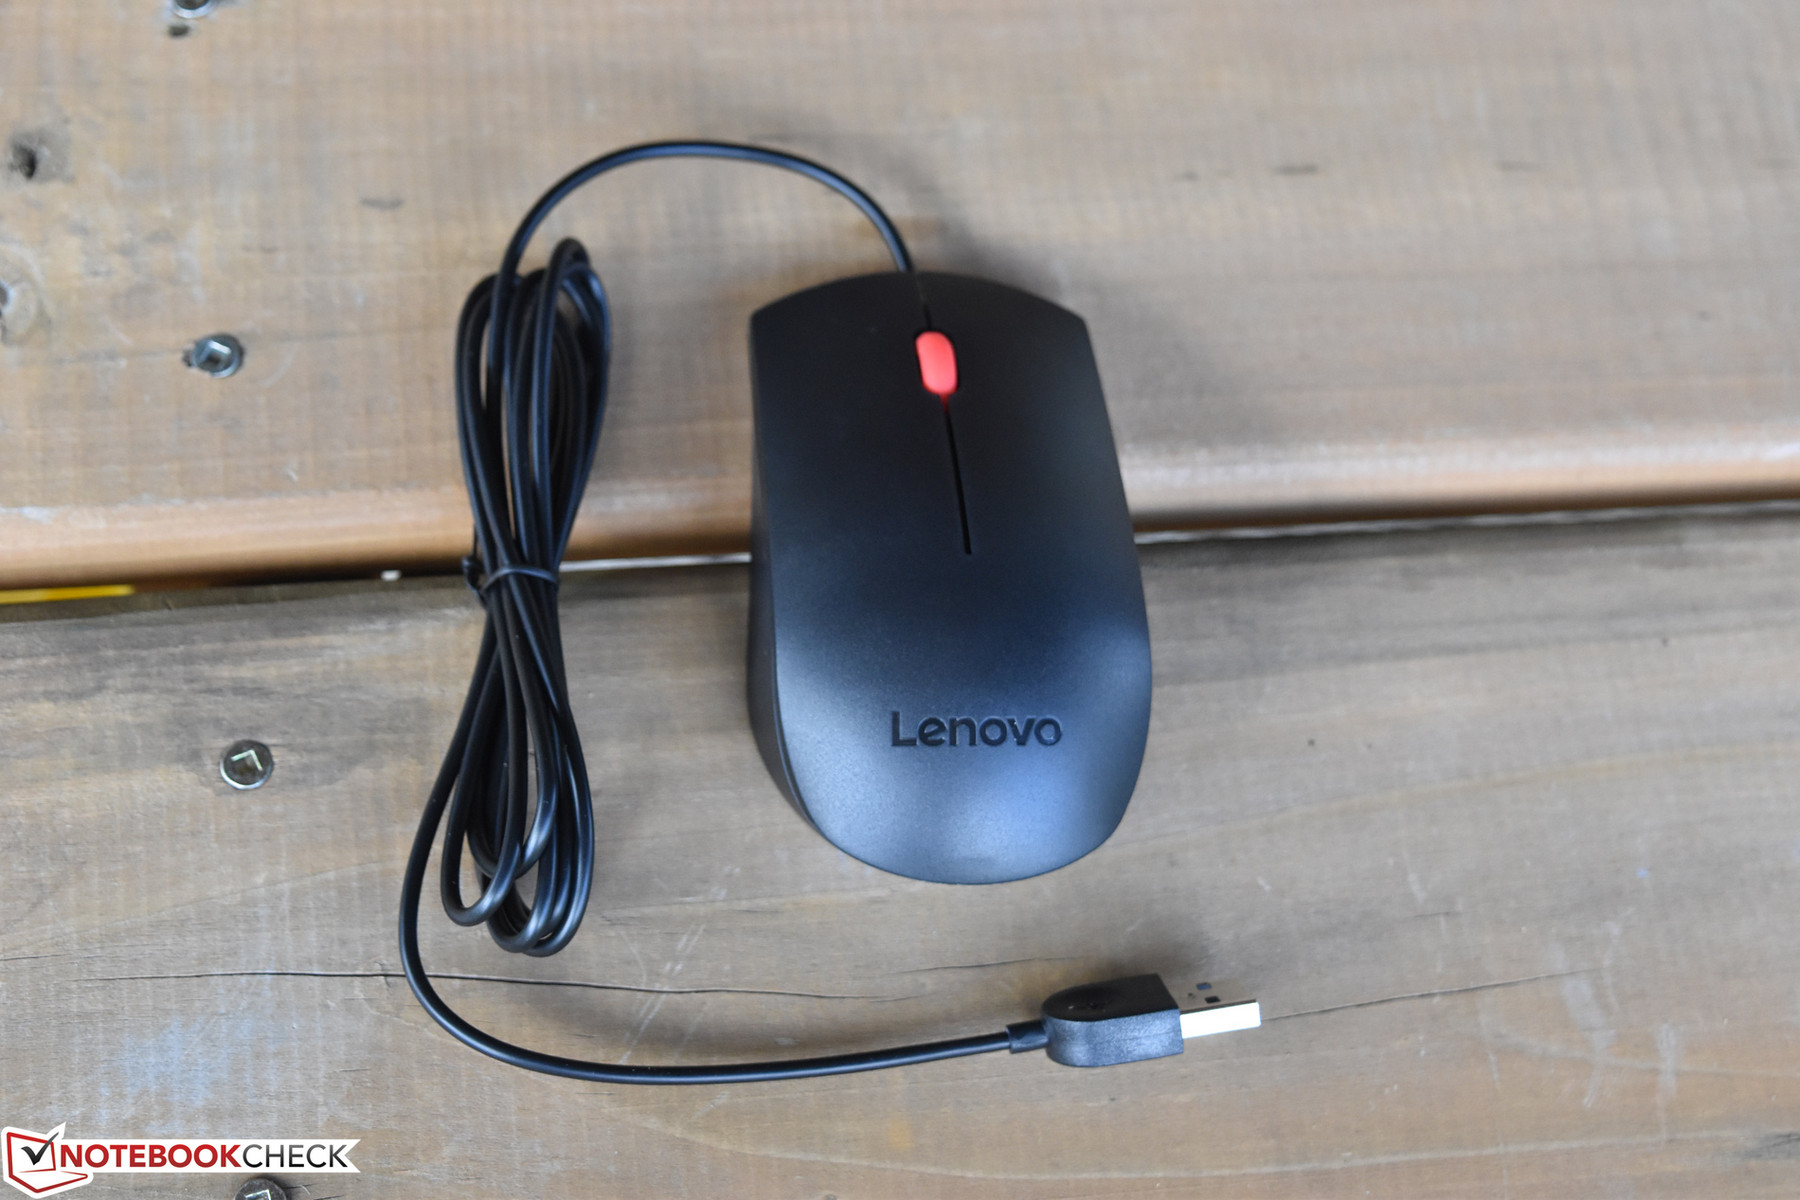
The included (corded) input devices are nothing terribly unique, but they are at the very least extremely comfortable and superior to those packed in with competitors such as Dell OptiPlex machines. The Lenovo keyboard features a standard width with full 10-key number pad on the right side. Key travel and feedback are both very good, and typing is relatively quiet. As with most standard office keyboards, it features fold-out feet to optionally prop up the back of the keyboard for a more ergonomic angle.
Meanwhile, the mouse tracks well and slides comfortably across a desk both with and without a mousepad. The buttons provide excellent feedback, and the center scroll wheel clicks perceptibly in increments as it rotates. While basic, these are two very good business input devices.
Touchscreen
The ThinkCentre also features a touchscreen with 10-point multitouch input. It’s easy to forget about its presence thanks to the effective anti-glare coating on the panel, but the screen is accurate, comfortable to use, and fingerprint resistant.
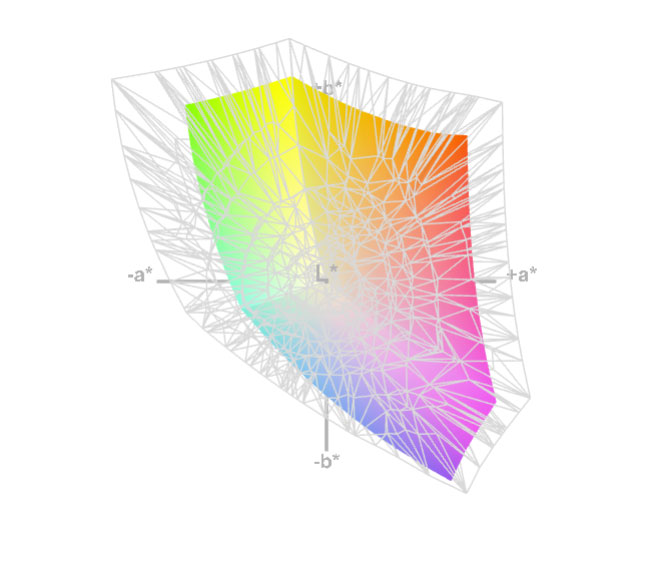
Display

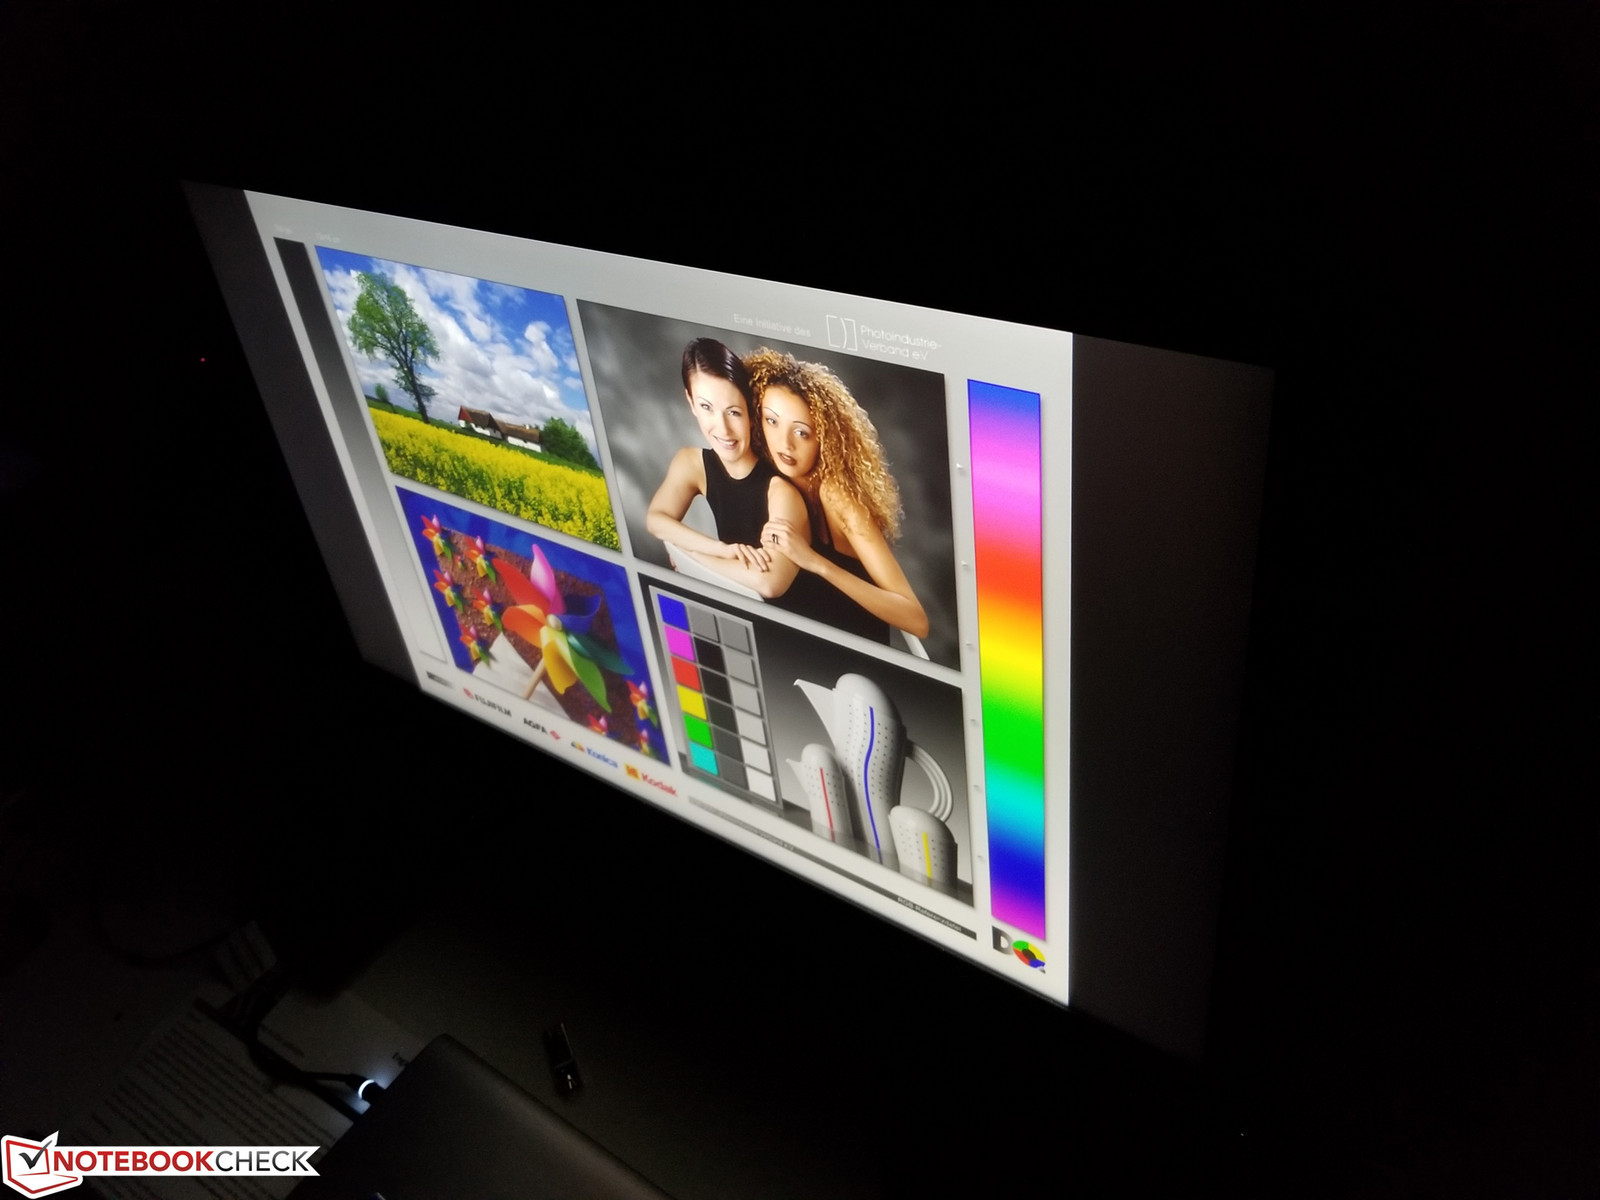
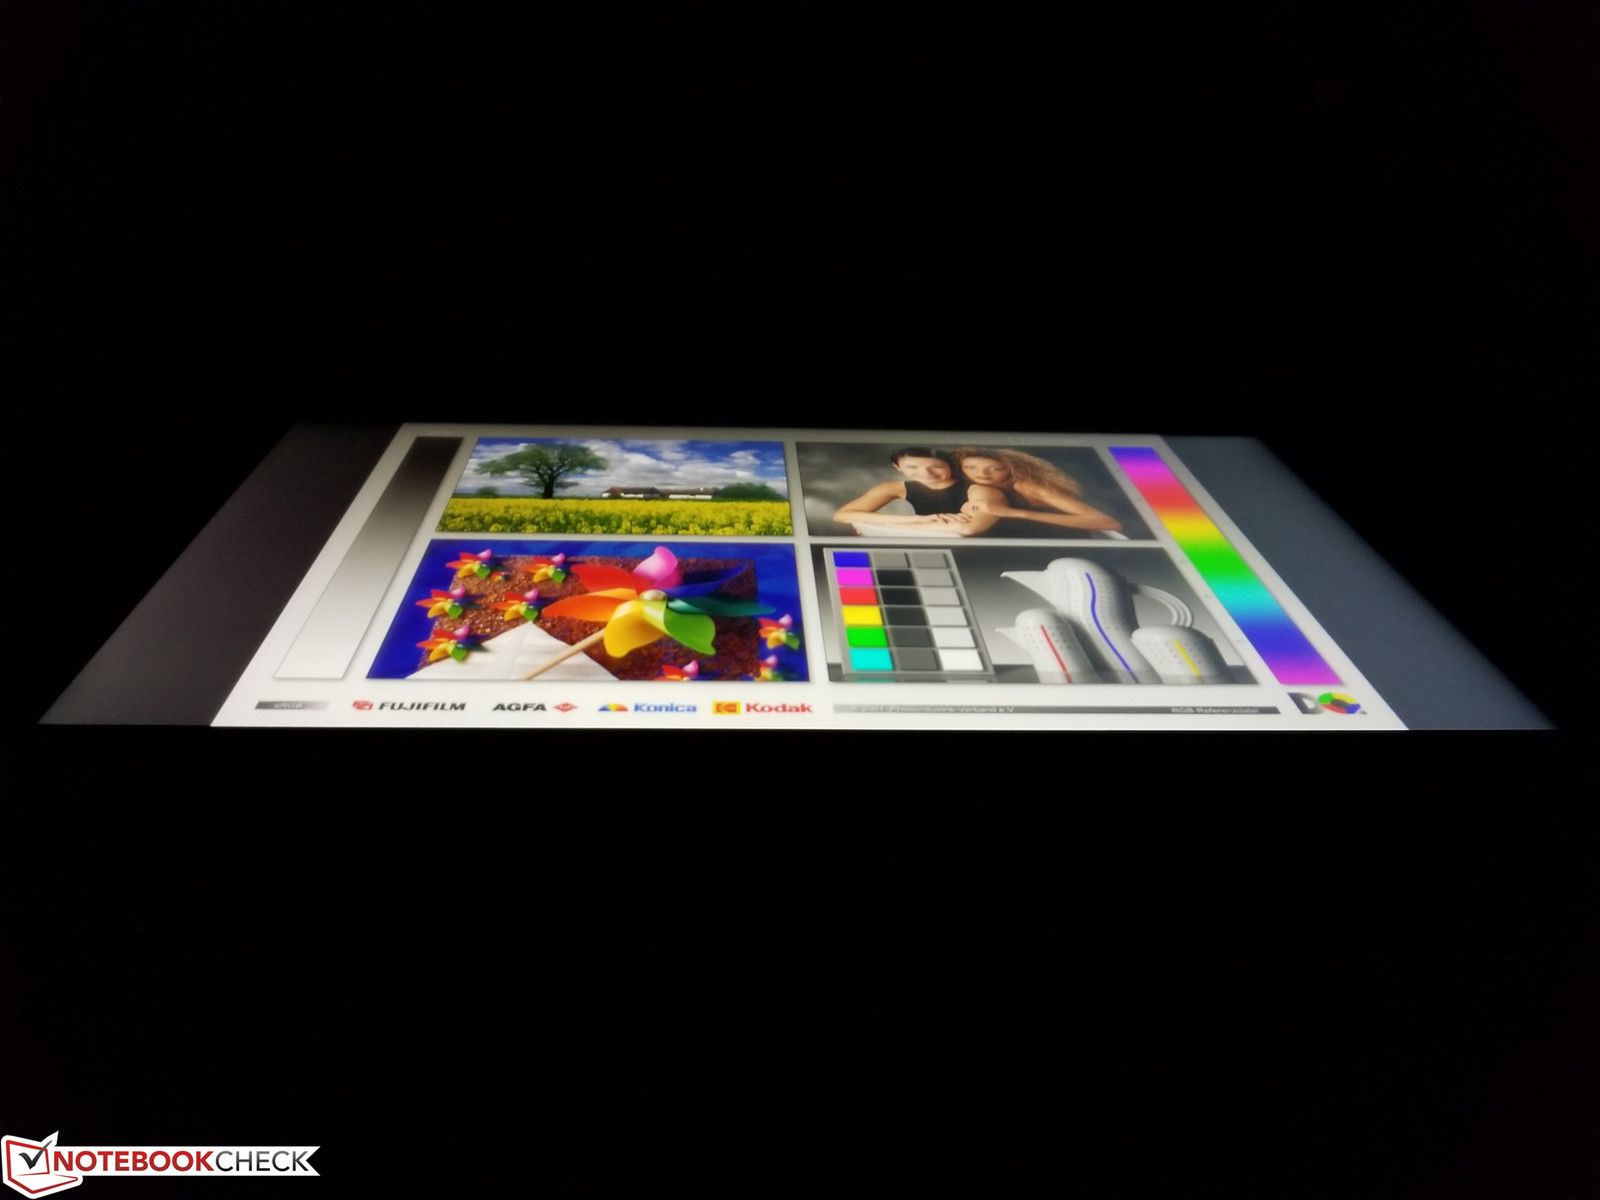
Speaking of the display, the ThinkCentre’s 23.8-inch FHD (1920x1080) IPS anti-glare panel is nothing particularly special by itself. While it’s large, the 1080p resolution factors out to a paltry 93 PPI. Fortunately, for conventional office use, that’s perfectly sufficient.
Subjectively, the display appears rather dim, and there is a bit of a detectable haze as a result of the distance of the actual panel from the digitizer layer/plastic anti-glare surface. Ultimately, it’s still probably a more usable implementation of touch in any office environment where reflections from ambient light could become bothersome, so it’s hard to criticize Lenovo’s decision here at any rate. But it does bring into question whether or not the incorporation of touch interface is all that worthwhile to begin with—since without it, we could be supplied with a normal, anti-glare, single-layer display assembly instead. By the way, a standard non-touch screen is an available option.
| |||||||||||||||||||||||||
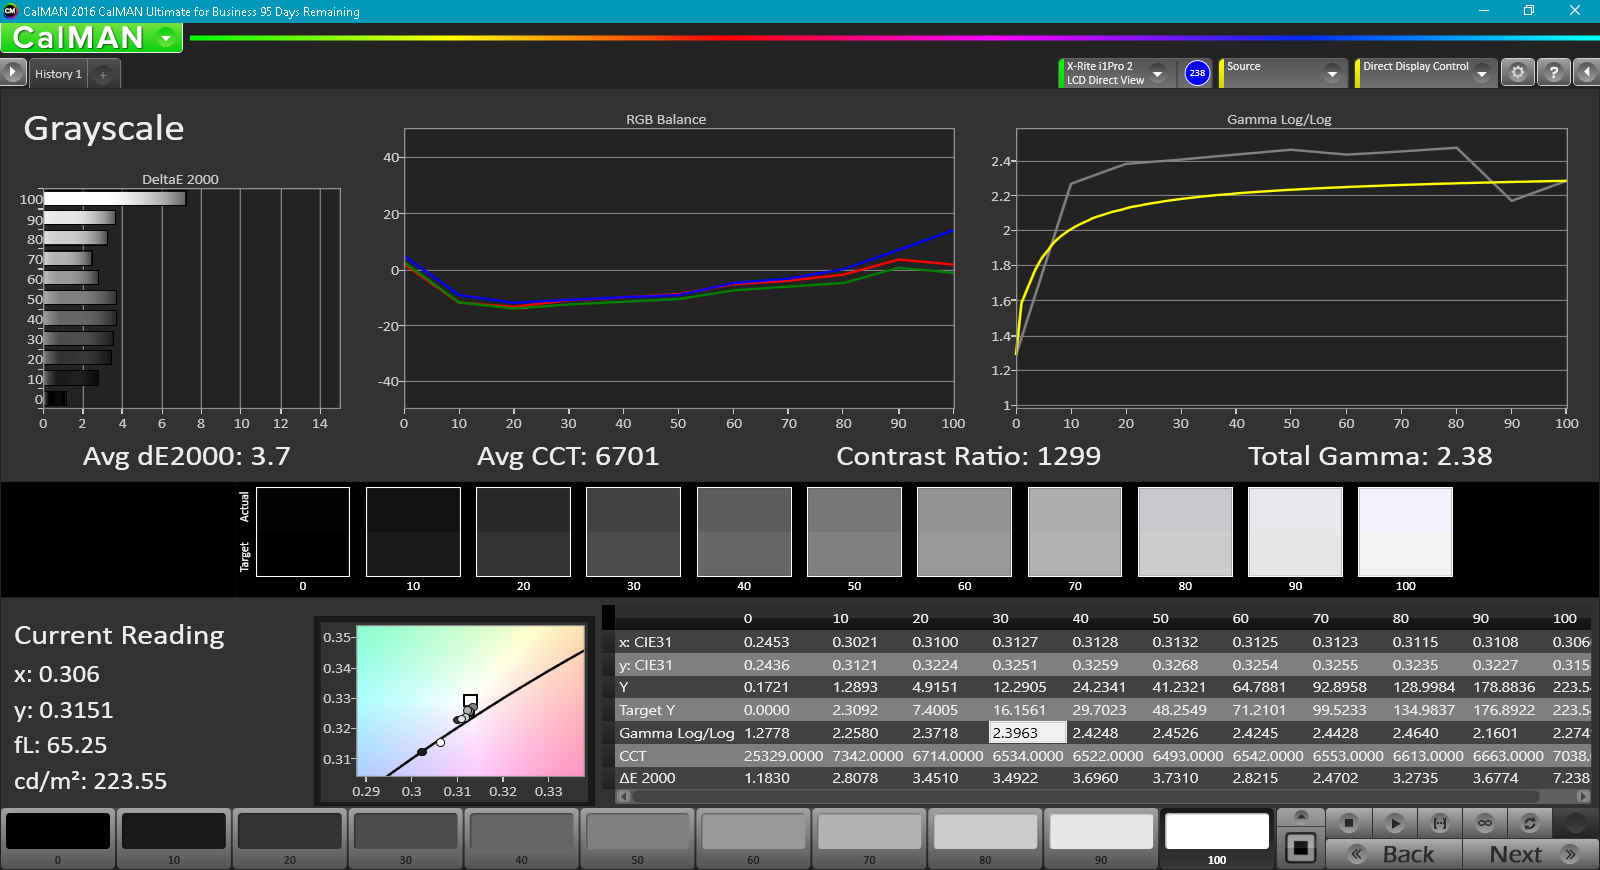
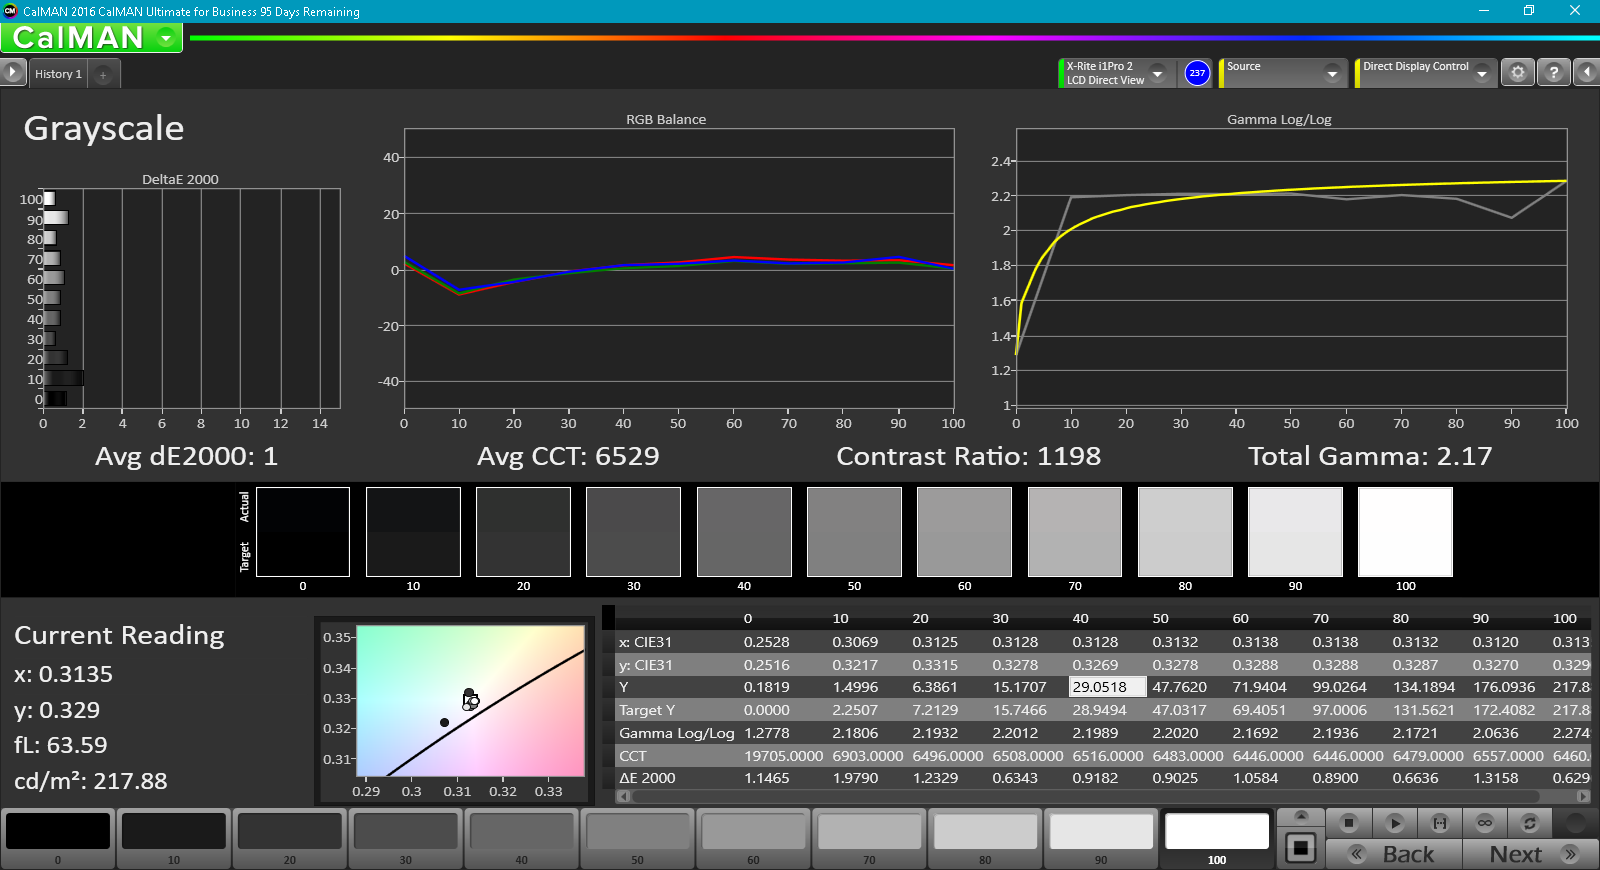
Brightness Distribution: 93 %
Contrast: 961:1 (Black: 0.23 cd/m²)
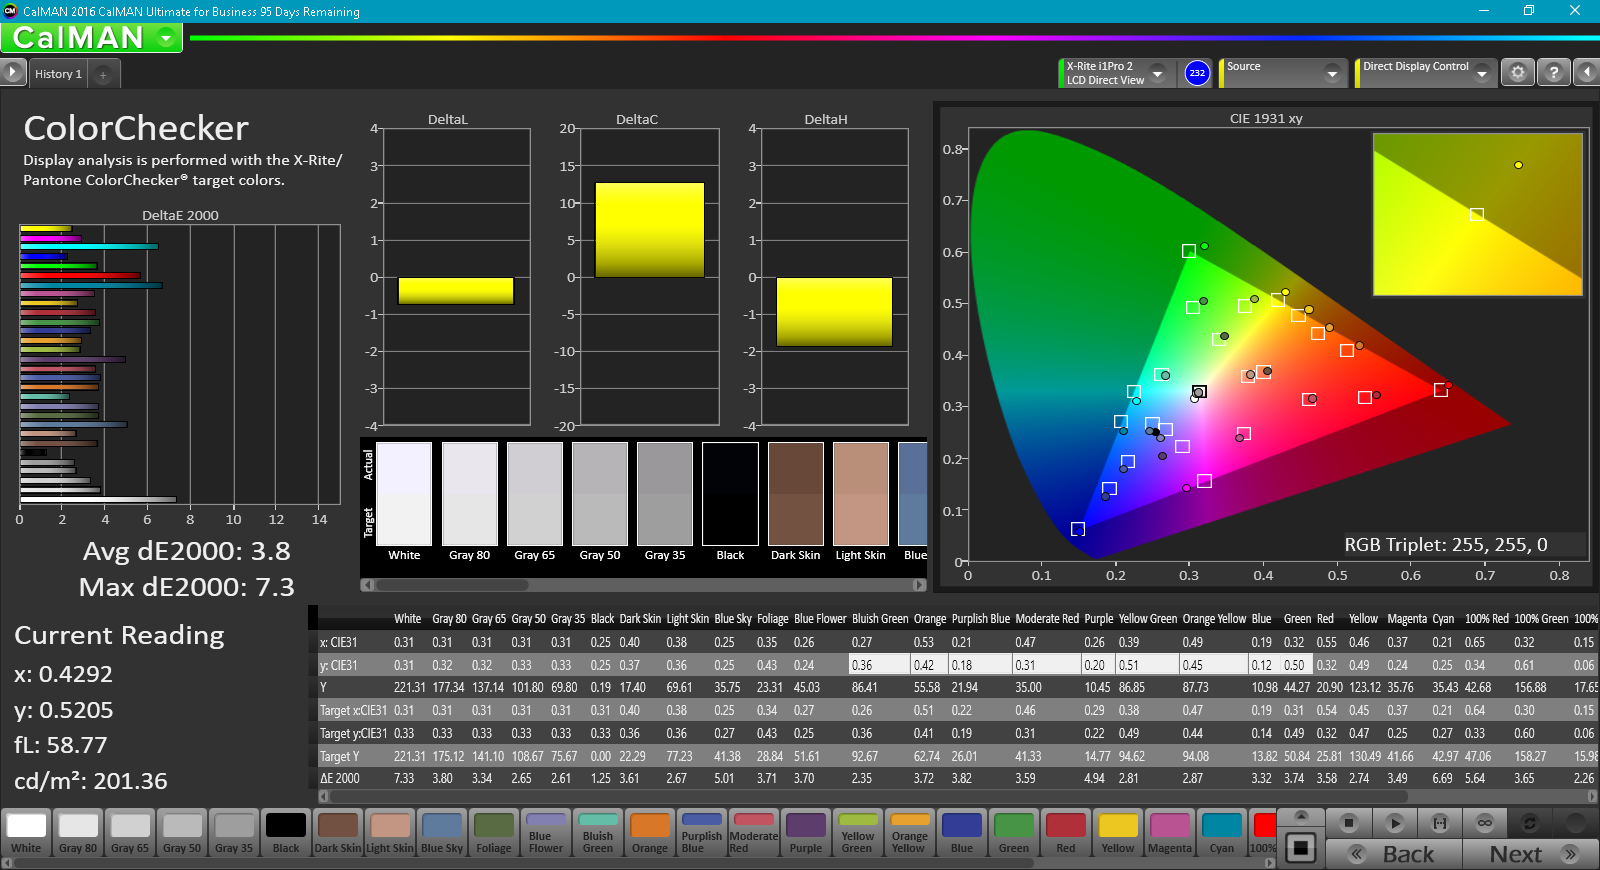
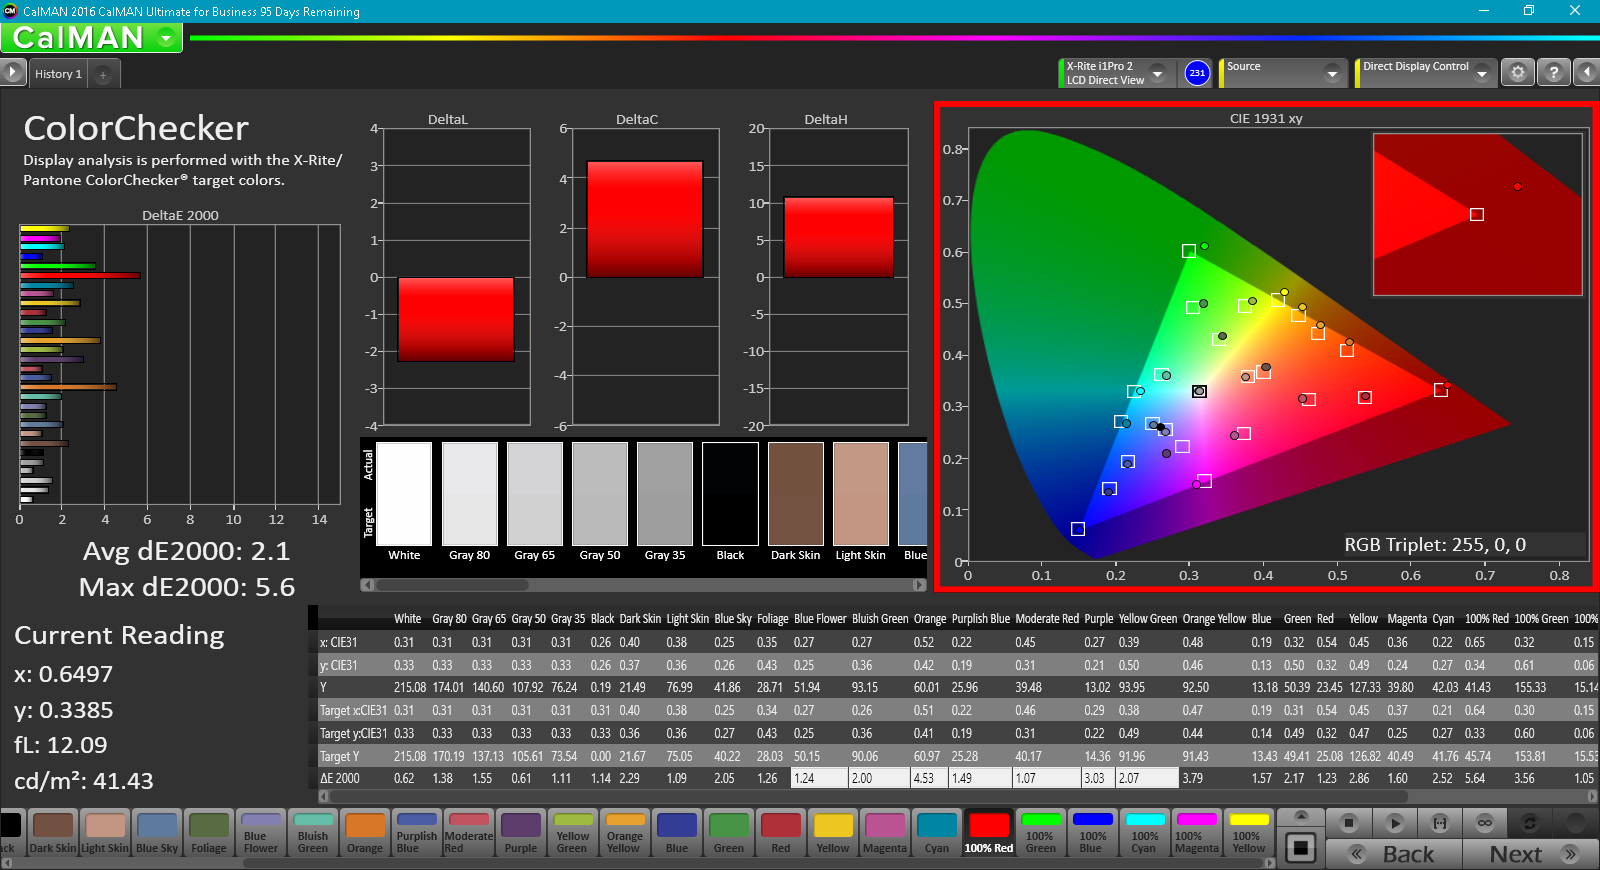
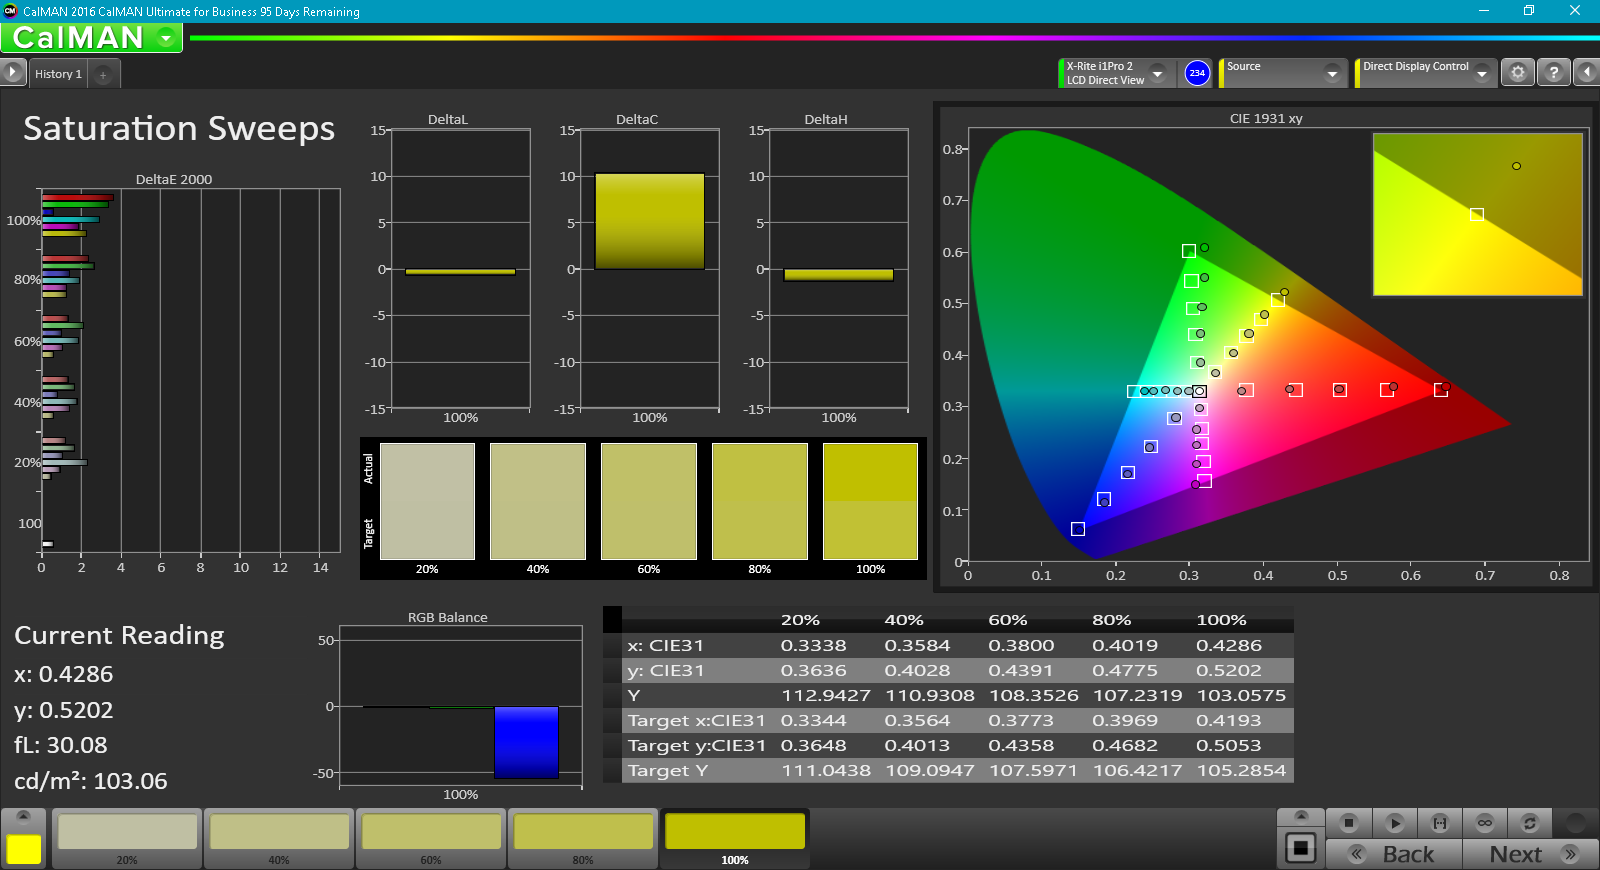
ΔE ColorChecker Calman: 3.8 | ∀{0.5-29.43 Ø4.71}
ΔE Greyscale Calman: 3.7 | ∀{0.09-98 Ø4.96}
90.3% sRGB (Argyll 1.6.3 3D)
58.44% AdobeRGB 1998 (Argyll 1.6.3 3D)
65.6% AdobeRGB 1998 (Argyll 3D)
90.3% sRGB (Argyll 3D)
64.4% Display P3 (Argyll 3D)
Gamma: 2.38
CCT: 6701 K
| Lenovo ThinkCentre M910z-10NR000KUS LEN-M910z-B, IPS, 23.8", 1920x1080 | HP Z1 G2 G1X47EA HWP192F, IPS LED, 27", 2560x1440 | Apple iMac Retina 5K 27 Late 2015 3.2 GHz M390 MK472D/A 27", 5120x2880 | |
|---|---|---|---|
| Display | 14% | 33% | |
| Display P3 Coverage (%) | 64.4 | 76.8 19% | 99.3 54% |
| sRGB Coverage (%) | 90.3 | 99.7 10% | 100 11% |
| AdobeRGB 1998 Coverage (%) | 65.6 | 74.4 13% | 88.2 34% |
| Response Times | -49% | -2% | |
| Response Time Grey 50% / Grey 80% * (ms) | 35.2 ? | 44.4 ? -26% | 30.4 ? 14% |
| Response Time Black / White * (ms) | 17.6 ? | 30.2 ? -72% | 20.8 ? -18% |
| PWM Frequency (Hz) | 21740 ? | 200 ? | |
| Screen | -3% | 15% | |
| Brightness middle (cd/m²) | 221 | 365 65% | 429 94% |
| Brightness (cd/m²) | 214 | 367 71% | 424 98% |
| Brightness Distribution (%) | 93 | 87 -6% | 95 2% |
| Black Level * (cd/m²) | 0.23 | 0.4 -74% | 0.58 -152% |
| Contrast (:1) | 961 | 913 -5% | 740 -23% |
| Colorchecker dE 2000 * | 3.8 | 4.68 -23% | 2.8 26% |
| Colorchecker dE 2000 max. * | 7.3 | ||
| Greyscale dE 2000 * | 3.7 | 6.6 -78% | 1.97 47% |
| Gamma | 2.38 92% | 2.34 94% | 2.13 103% |
| CCT | 6701 97% | 6094 107% | 6889 94% |
| Color Space (Percent of AdobeRGB 1998) (%) | 58.44 | 66.26 13% | 79 35% |
| Color Space (Percent of sRGB) (%) | 90.3 | 99.69 10% | 99.97 11% |
| Total Average (Program / Settings) | -13% /
-6% | 15% /
17% |
* ... smaller is better
Although Lenovo quotes 250 nits brightness from the panel, we only measured an average of 214.4 cd/m² with a maximum of 222.2 cd/m² (center-left quadrant), which subjectively seems closer to reality as the display is noticeably dim even at the brightest setting. Contrast is a very good 961:1, whereas brightness distribution of 93% confirms a consistent luminosity across the entire panel.
Meanwhile, our color coverage measurements revealed pedestrian (yet still acceptable) results, with 90.3% of the sRGB spectrum covered by the panel and just 58.4% of AdobeRGB. This is compared with 66.3% and 79% of AdobeRGB from the HP Z1 G2 and Apple iMac Retina 5K (2015) displays.
CalMAN mostly yielded positive results, with ColorChecker and Greyscale DeltaE average values of 3.8 and 3.7, respectively, as well as a Total Gamma of 2.38 and CCT Average of 6701, both of which are practically ideal (and, in this case, actually better than both of the other competing displays in our comparison field).

Display Response Times
| ↔ Response Time Black to White | ||
|---|---|---|
| 17.6 ms ... rise ↗ and fall ↘ combined | ↗ 10.8 ms rise | 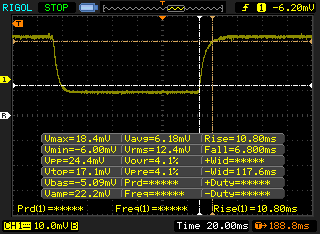 |
| ↘ 6.8 ms fall | ||
| The screen shows good response rates in our tests, but may be too slow for competitive gamers. In comparison, all tested devices range from 0.1 (minimum) to 240 (maximum) ms. » 40 % of all devices are better. This means that the measured response time is better than the average of all tested devices (19.8 ms). | ||
| ↔ Response Time 50% Grey to 80% Grey | ||
| 35.2 ms ... rise ↗ and fall ↘ combined | ↗ 15.2 ms rise | 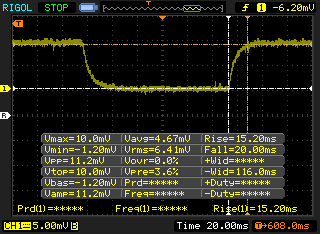 |
| ↘ 20 ms fall | ||
| The screen shows slow response rates in our tests and will be unsatisfactory for gamers. In comparison, all tested devices range from 0.165 (minimum) to 636 (maximum) ms. » 49 % of all devices are better. This means that the measured response time is worse than the average of all tested devices (31 ms). | ||
Screen Flickering / PWM (Pulse-Width Modulation)
| Screen flickering / PWM detected | 21740 Hz | ≤ 20 % brightness setting | 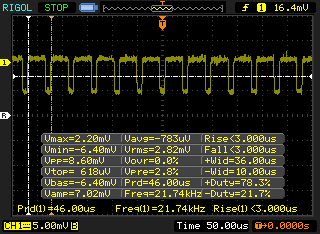 |
The display backlight flickers at 21740 Hz (worst case, e.g., utilizing PWM) Flickering detected at a brightness setting of 20 % and below. There should be no flickering or PWM above this brightness setting. The frequency of 21740 Hz is quite high, so most users sensitive to PWM should not notice any flickering. In comparison: 52 % of all tested devices do not use PWM to dim the display. If PWM was detected, an average of 7754 (minimum: 5 - maximum: 343500) Hz was measured. | |||
We detected PWM at brightness levels of 20 percent and below, but the frequency of 21740 is high, so it’s unlikely to be bothersome to most users sensitive to flickering.
We didn’t bother testing the machine outdoors as it isn’t a practical use for most people. However, near windows and other bright light sources, the display mostly remains comfortably usable thanks to its anti-glare finish. The low brightness does make it a bit harder to appreciate in bright environments, however, and viewing angles suffer a bit (in spite of the “WVA” IPS panel Lenovo uses) because of the separation between the plastic touch layer and the display panel beneath.
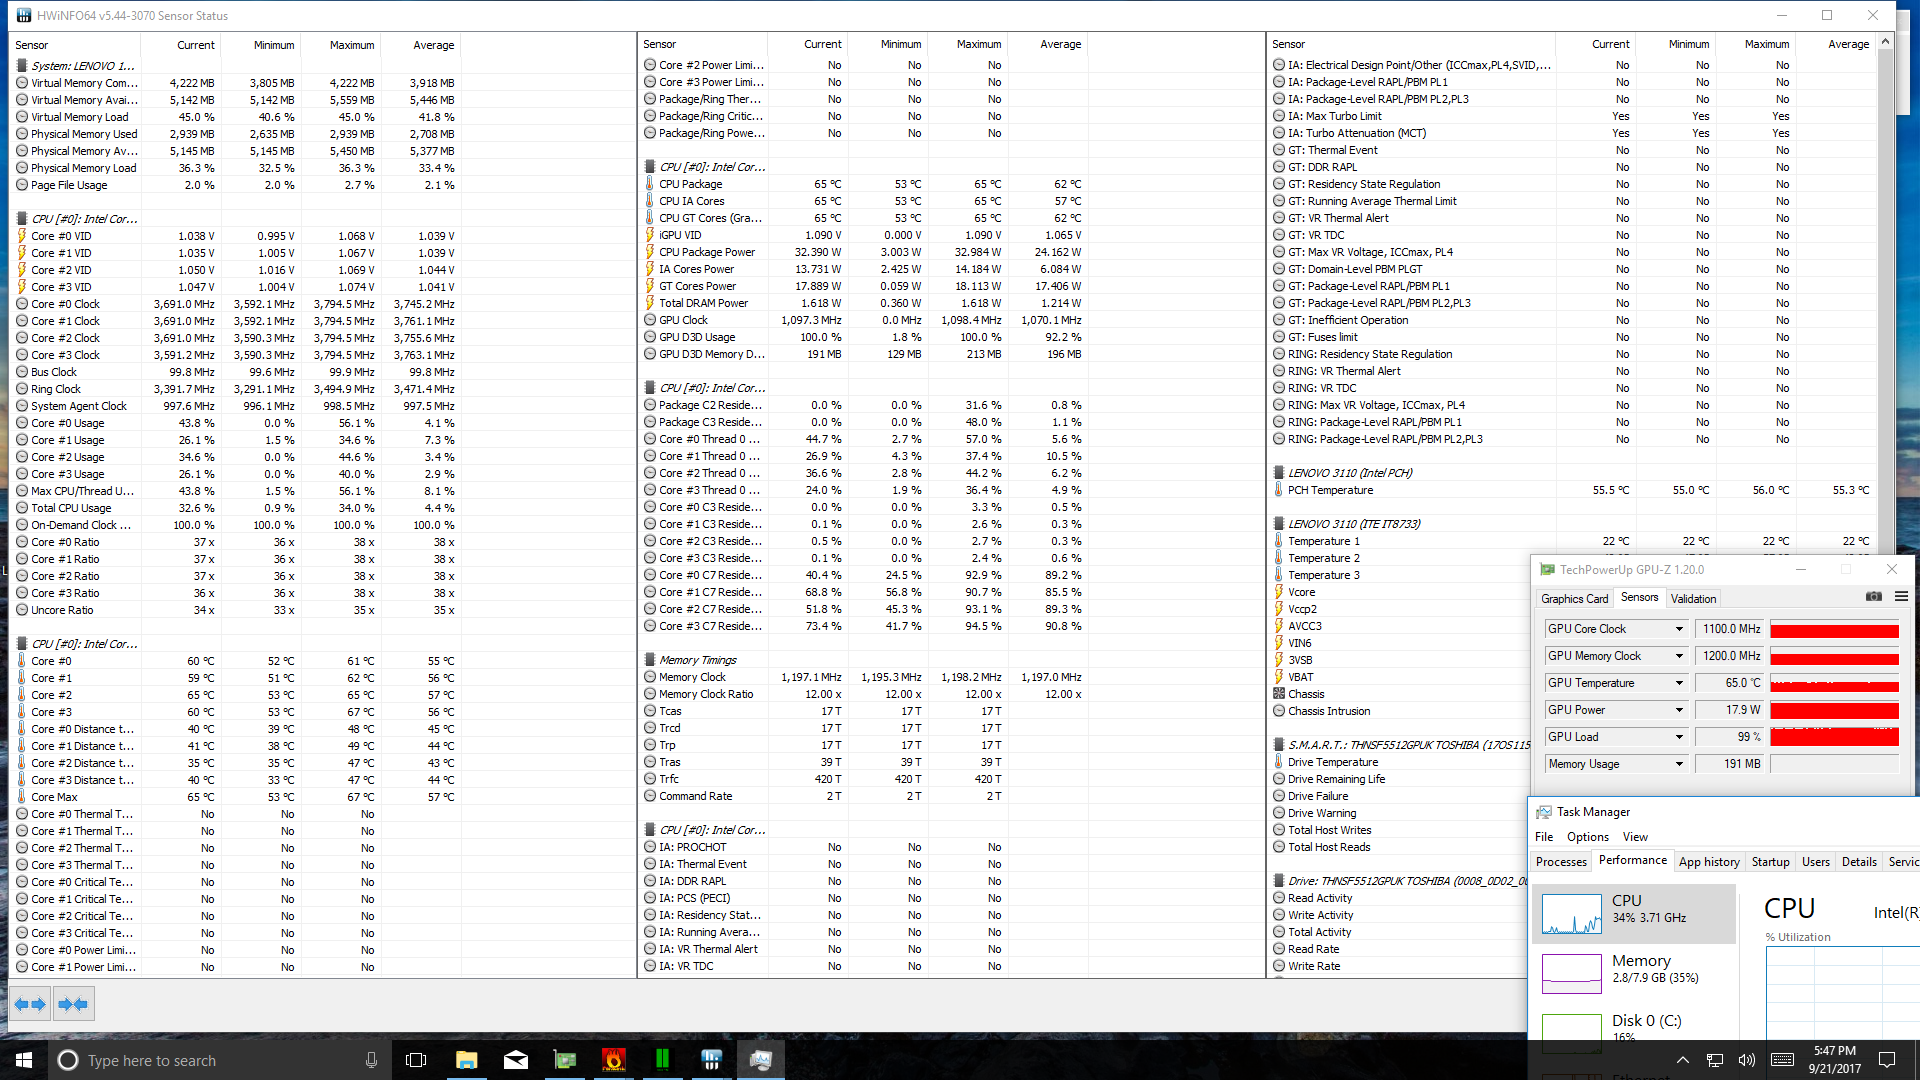
Performance
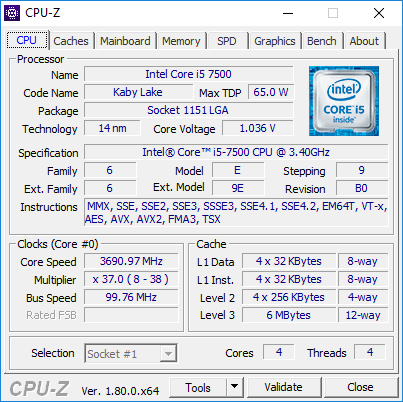
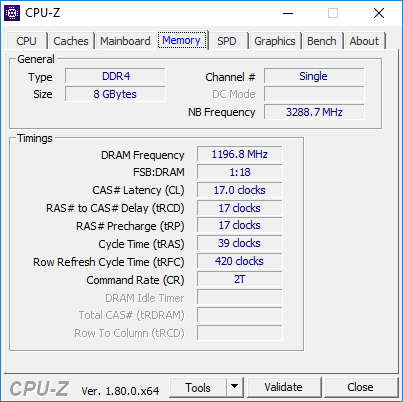
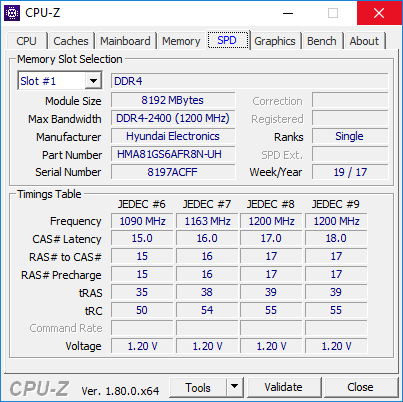
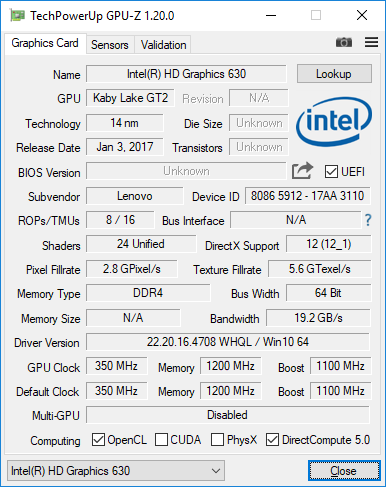
The M910z can be configured with a couple of different CPUs, between 4 GB and 32 GB of DDR4-2400 RAM, and a variety of different single/dual-storage combinations. Our particular unit came equipped with an Intel Core i5-7500 quad-core CPU, 8 GB DDR4 memory, and a 512 GB NVMe Opal SSD. As mentioned above, both the storage drive (especially the secondary storage drive) and memory are fairly easily upgradeable if the user chooses to go with a lower-end configuration from the outset.
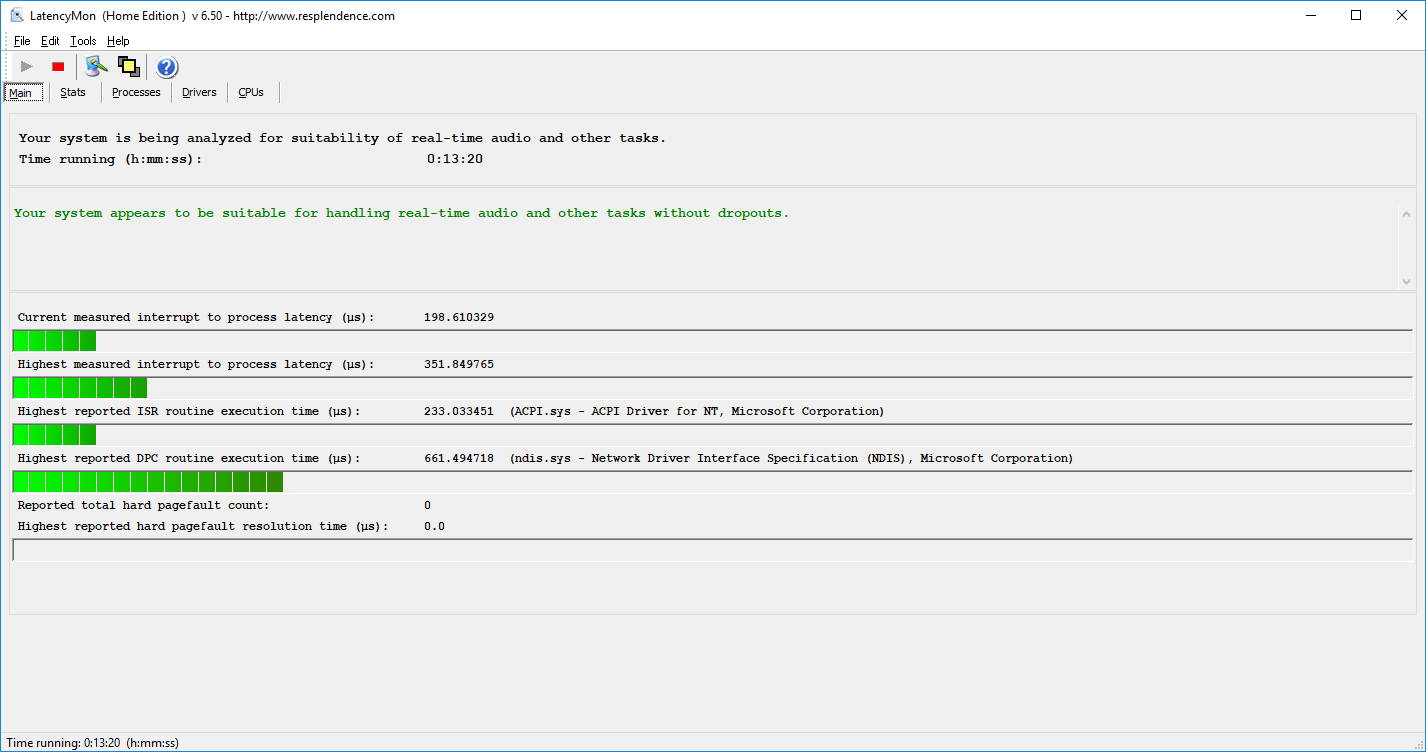
LatencyMon reported no issues with real-time audio/video streaming on the M910z.
Processor
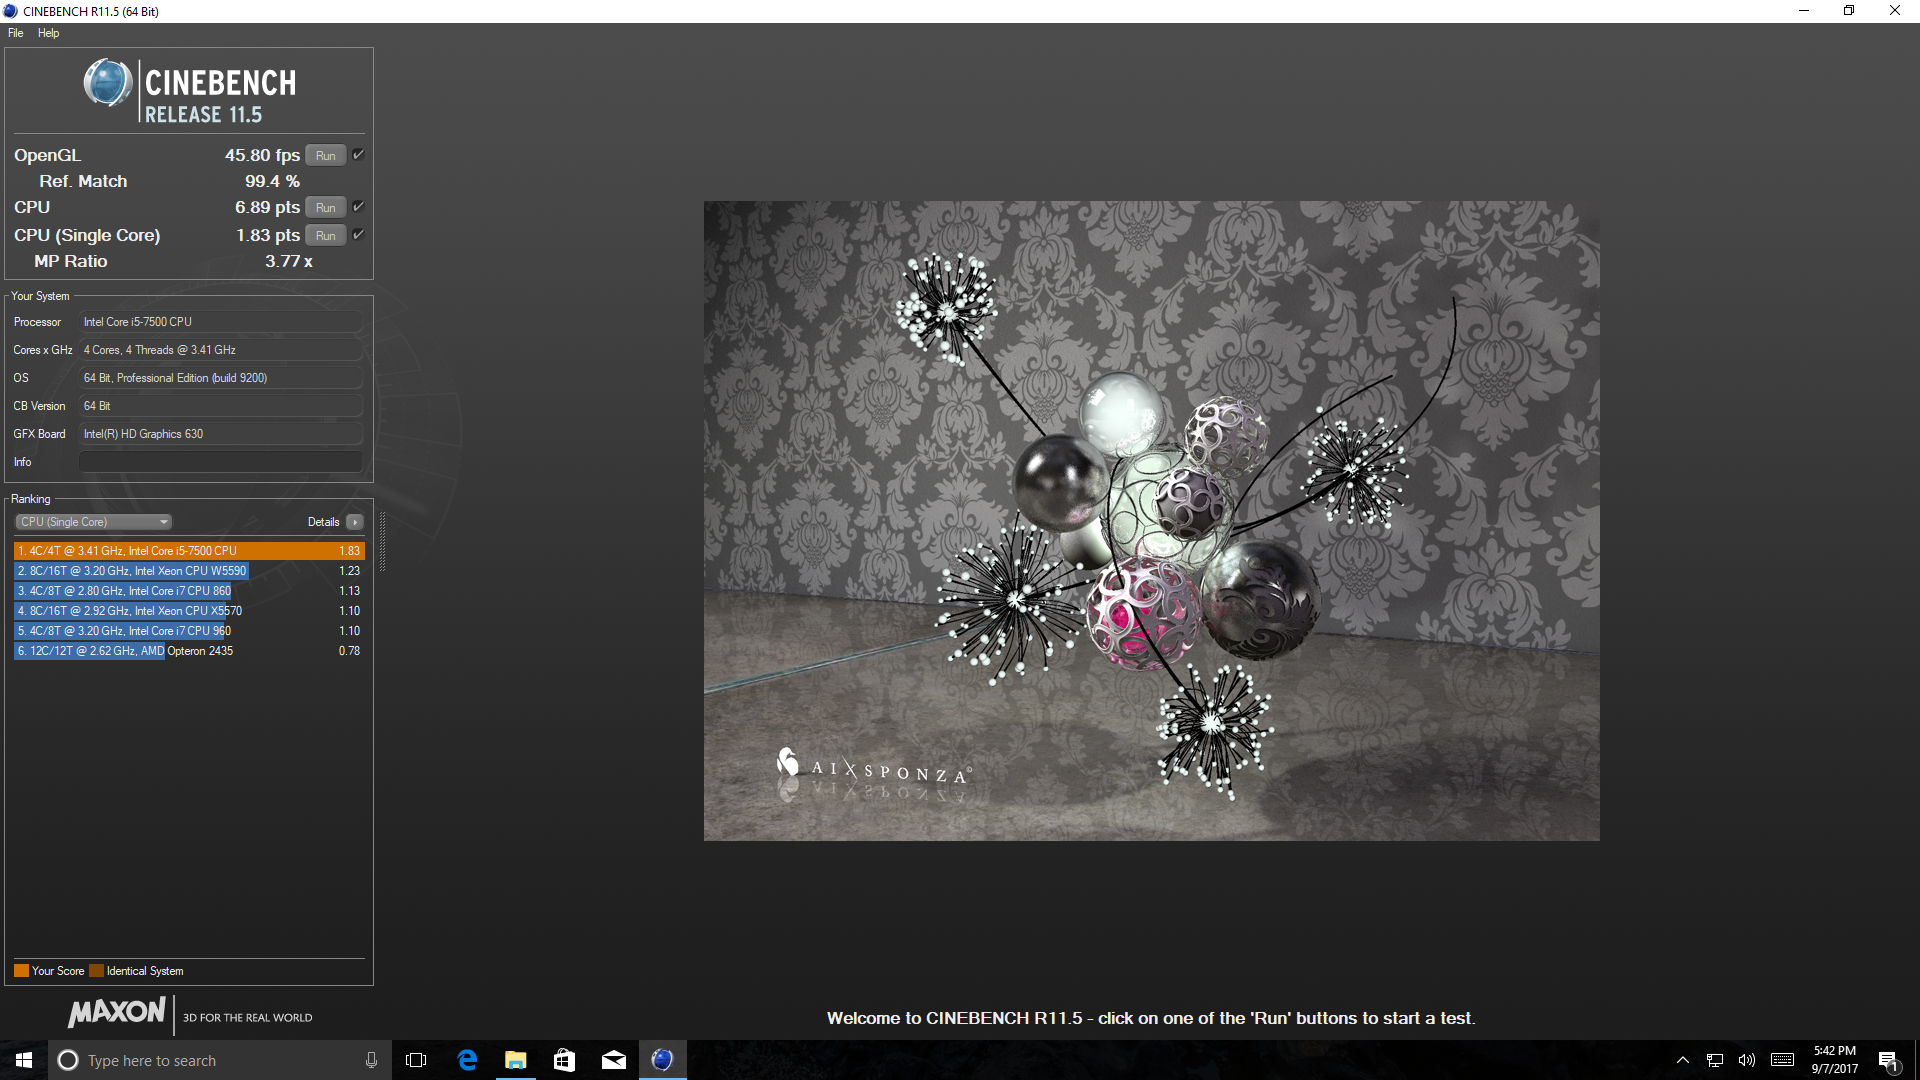
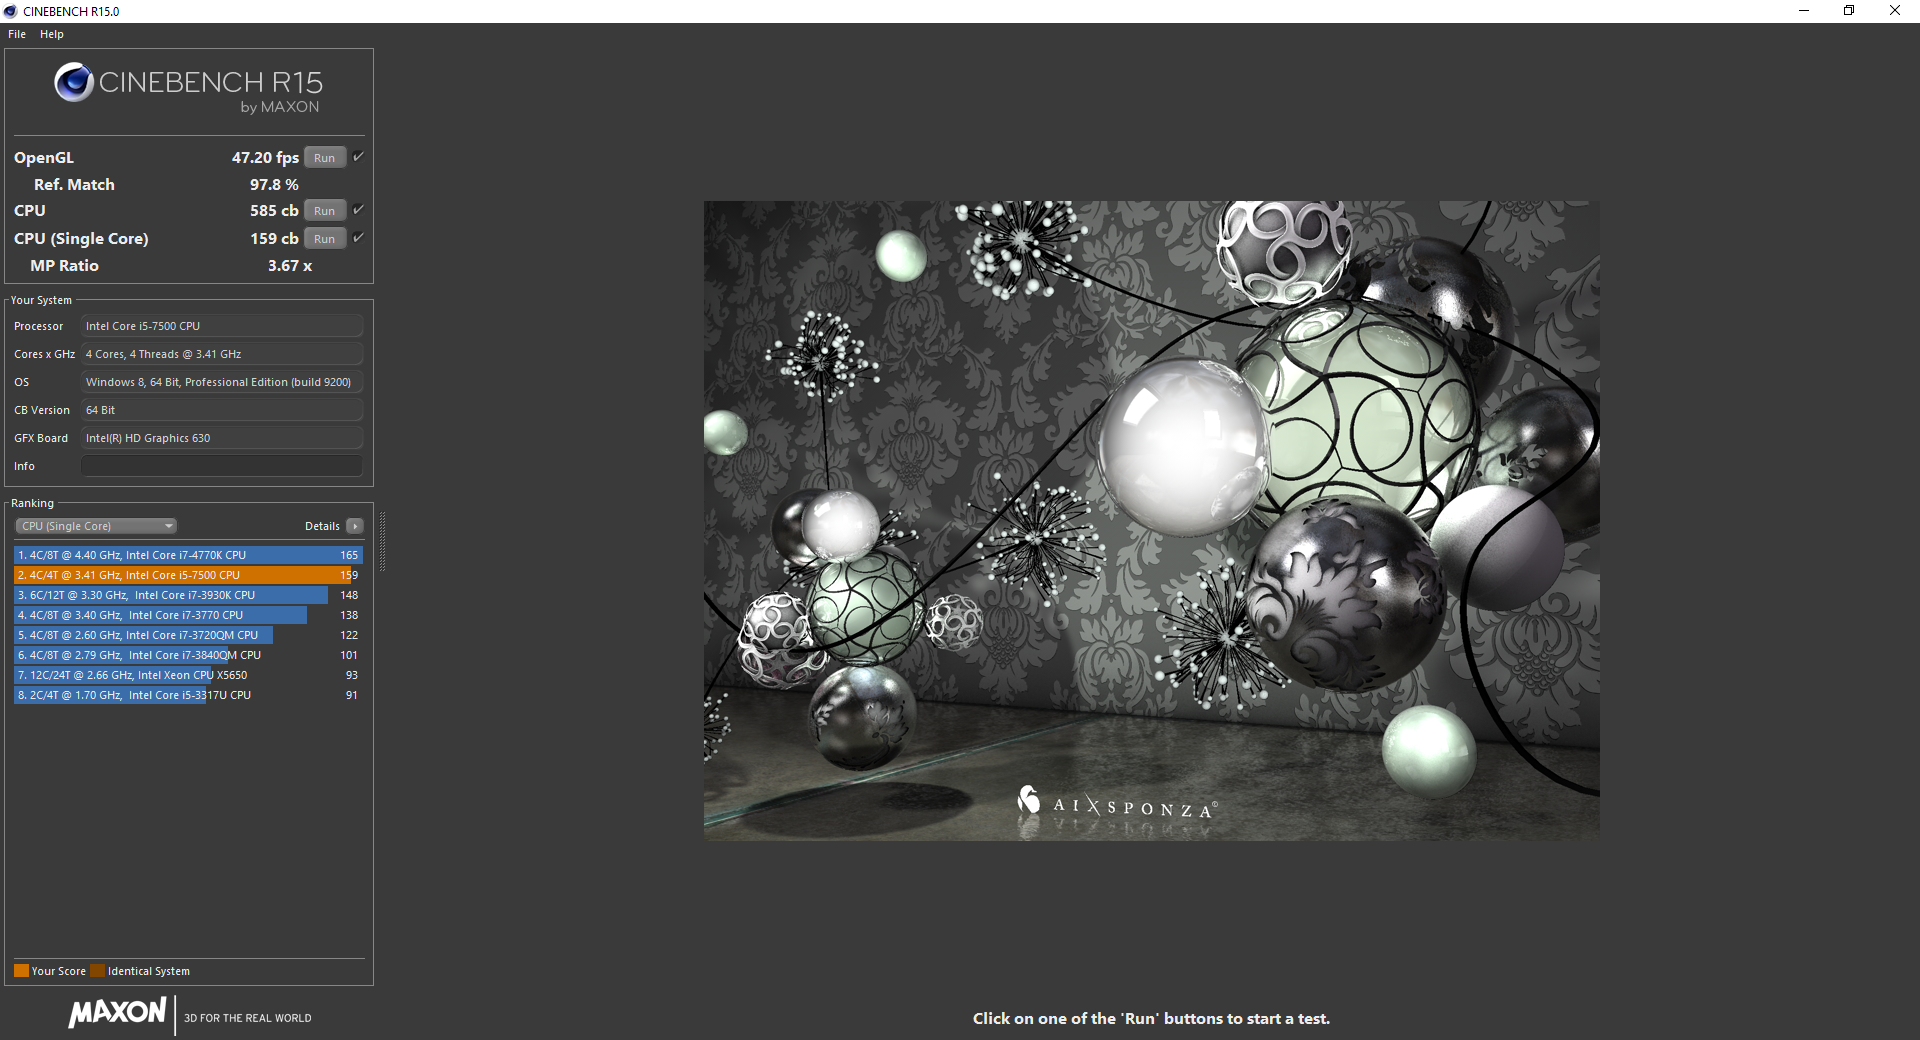
The Intel Core i5-7500 CPU included in our review unit is a quad-core processor based on the Kaby Lake architecture with a base clock rate of 3.4 GHz and a max turbo frequency of 3.8 GHz across all four cores. This is the first sample of this processor we’ve evaluated, but according to our benchmarks, performance is only several percentage points above that of its Skylake predecessor (the Core i5-6500). We recorded 159 points and 585 points in Cinebench R15 single/multi-CPU 64-bit, respectively—scores which are just 5% and 7% above those of the Apple iMac Retina 5K 27 AIO (from late 2015), which is equipped with the i5-6500. Meanwhile, the HP Z1 G2 with its Xeon E3-1226 CPU lags behind the iMac by a few more percentage points. The gap narrows to just a couple of percentage points when both single- and multi-core sustained performance is tested via wPrime and Super Pi, however. Meanwhile, the ThinkPad T470p, with its Core i7-7700HQ, manages comparable single-core scores and roughly 18 to 26 percent faster multi-core performance.
It’s uncommon than an All-In-One is expected to feature rock-solid, blistering CPU performance as compared to, say, a gaming or professional workstation desktop. But in spite of that, the M910z provides plenty of power for just about any practical office application outside of those requiring dedicated graphics or heavy-duty professional rendering work.
| Cinebench R11.5 | |
| CPU Single 64Bit | |
| Lenovo ThinkCentre M910z-10NR000KUS | |
| Lenovo ThinkPad T470p-20J7S00000 | |
| CPU Multi 64Bit | |
| Lenovo ThinkPad T470p-20J7S00000 | |
| Lenovo ThinkCentre M910z-10NR000KUS | |
| wPrime 2.10 - 1024m | |
| HP Z1 G2 G1X47EA | |
| Lenovo ThinkCentre M910z-10NR000KUS | |
* ... smaller is better
System Performance
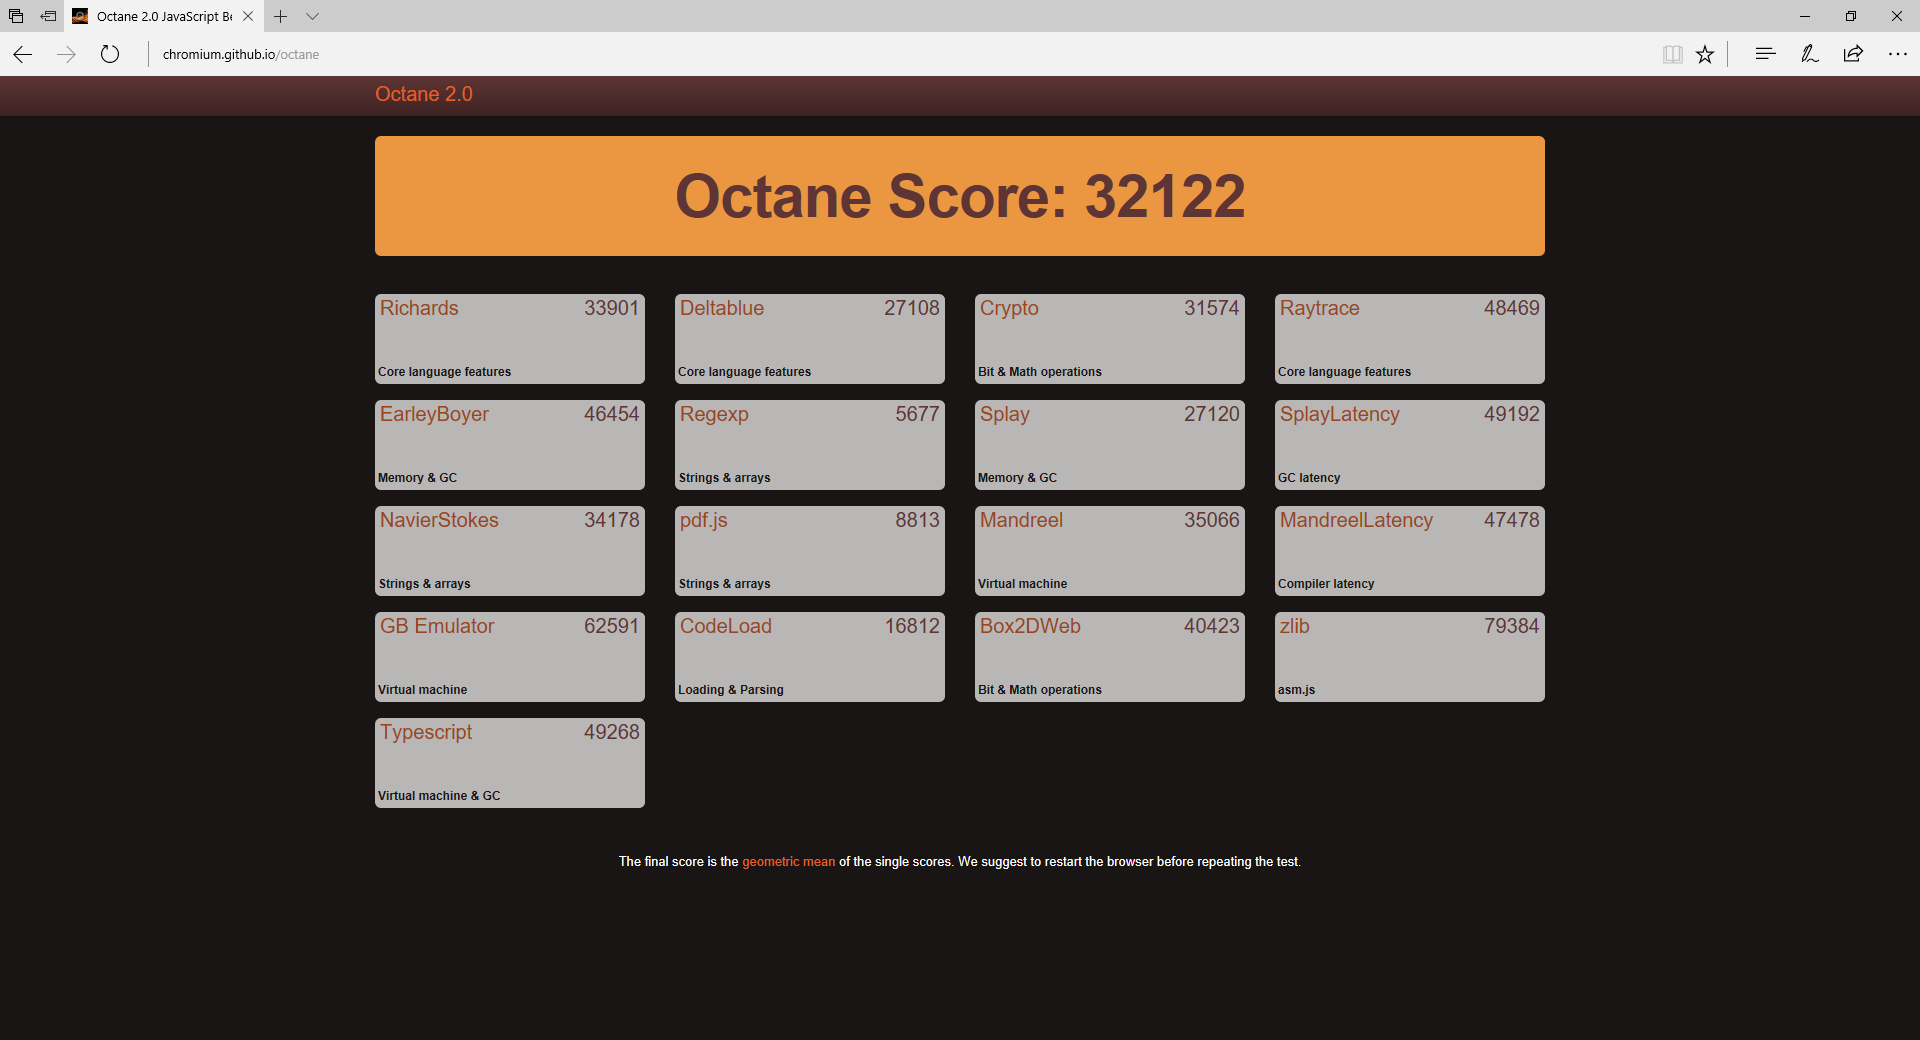
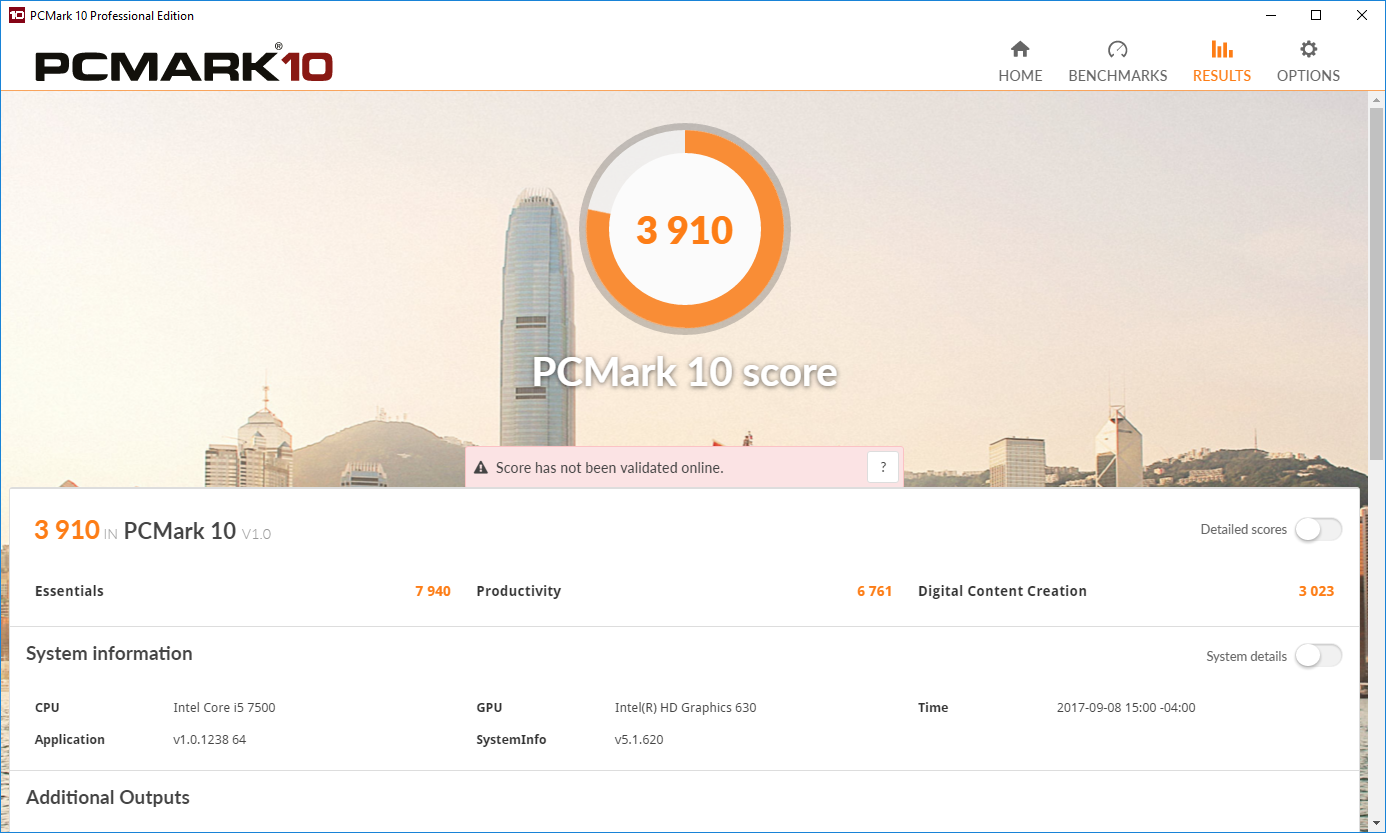
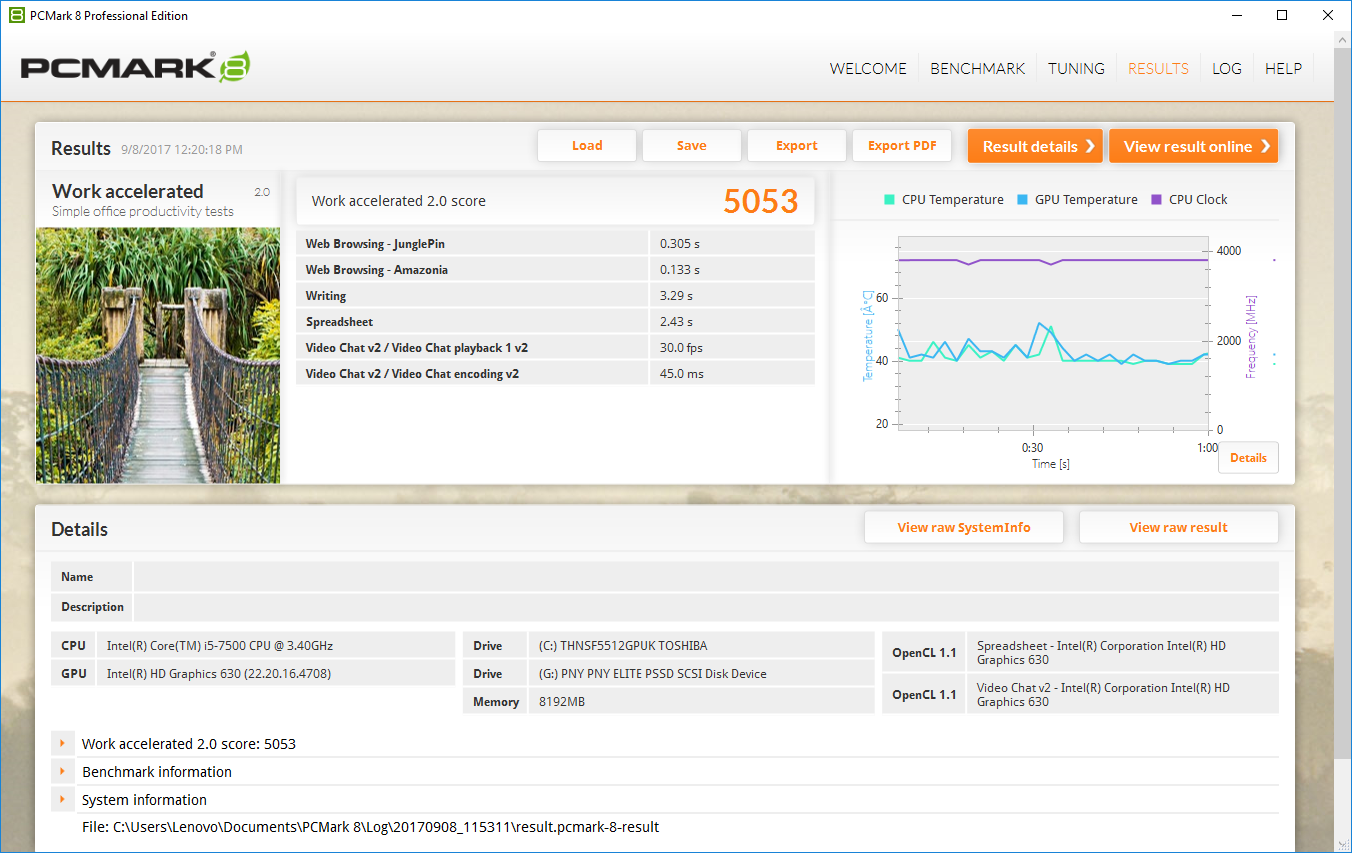
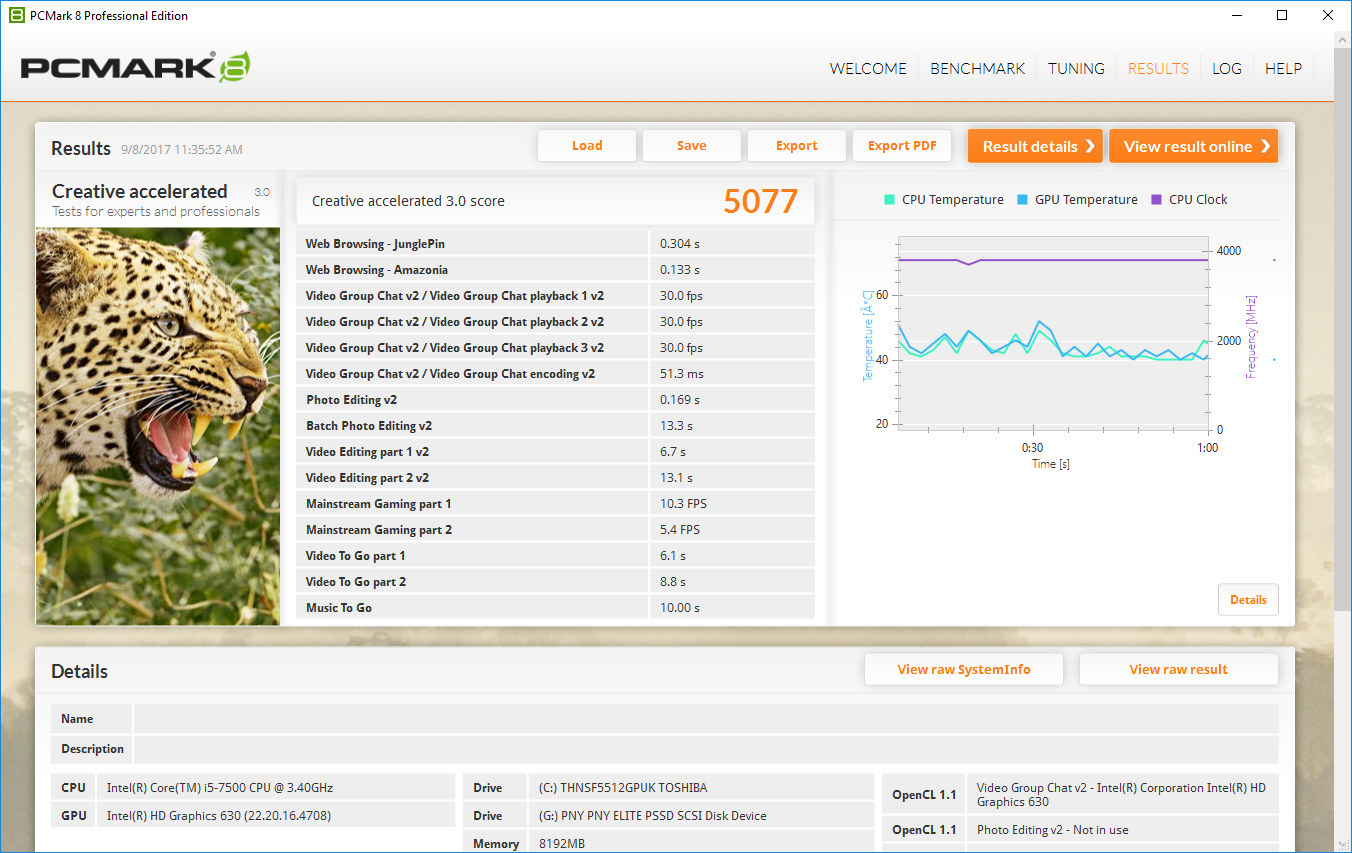
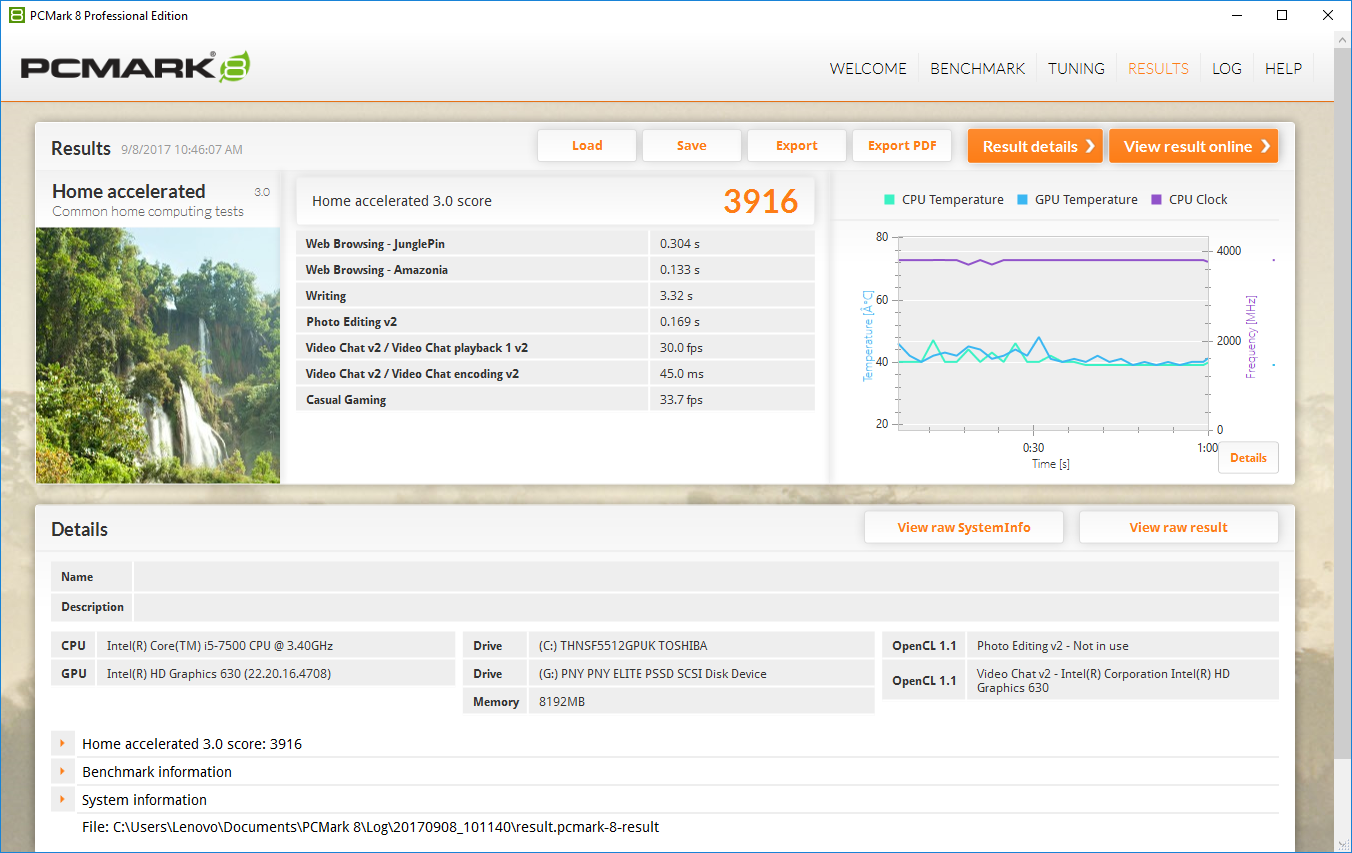
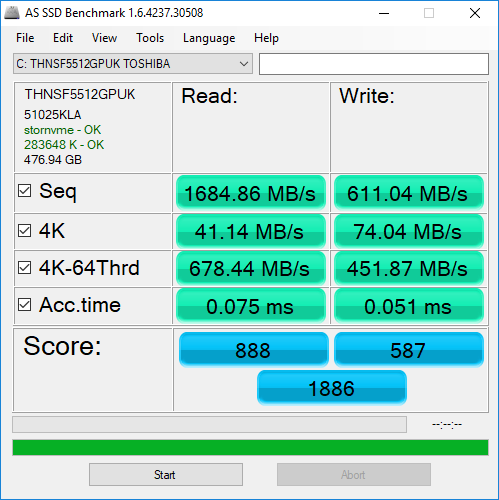
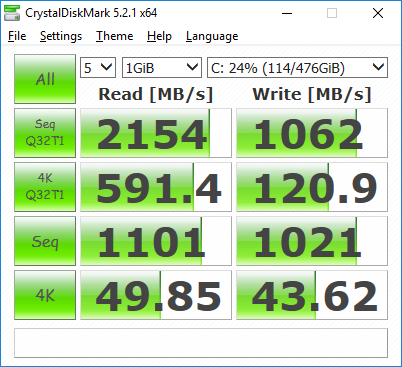
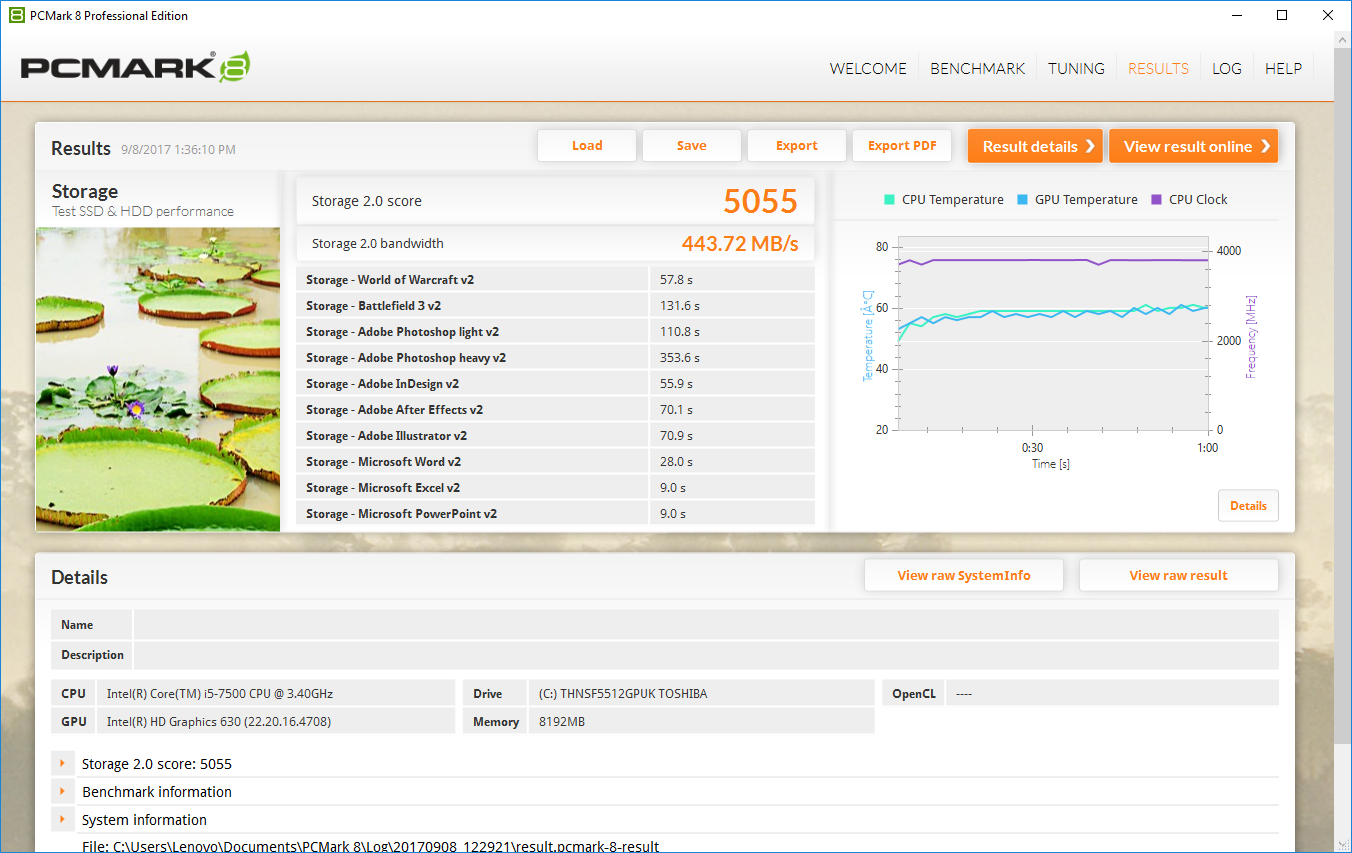
General system performance is also excellent, thanks mostly to the fast NVMe SSD. Scores of 5053 in PCMark 8 Work Accelerated and 5077 in PCMark 8 Creative Accelerated dwarf those of the HP Z1 (albeit, from nearly two years ago) by 15% and 68% respectively. PCMark 10, meanwhile, issued a score of 3910.
| PCMark 8 | |
| Home Score Accelerated v2 | |
| Lenovo ThinkCentre M910z-10NR000KUS | |
| Lenovo ThinkPad T470p-20J7S00000 | |
| HP Z1 G2 G1X47EA | |
| Dell Latitude 5580 | |
| Work Score Accelerated v2 | |
| Lenovo ThinkCentre M910z-10NR000KUS | |
| Lenovo ThinkPad T470p-20J7S00000 | |
| HP Z1 G2 G1X47EA | |
| Creative Score Accelerated v2 | |
| Lenovo ThinkCentre M910z-10NR000KUS | |
| Lenovo ThinkPad T470p-20J7S00000 | |
| HP Z1 G2 G1X47EA | |
| PCMark 8 Home Score Accelerated v2 | 3916 points | |
| PCMark 8 Creative Score Accelerated v2 | 5077 points | |
| PCMark 8 Work Score Accelerated v2 | 5053 points | |
| PCMark 10 Score | 3910 points | |
Help | ||
Storage Devices
The above dominance is largely a factor of storage speeds, and the Toshiba NVMe in the Lenovo M910z is at the center of the equation. Other configurations exist, including one which includes a mere 500 GB 7200 RPM mechanical hard drive. However, opting for an NVMe SSD out of the gate and possibly adding a secondary storage drive in the open SATA bay later (even another SSD) is an easy way to save money and keep the door open for later hassle-free upgrades.

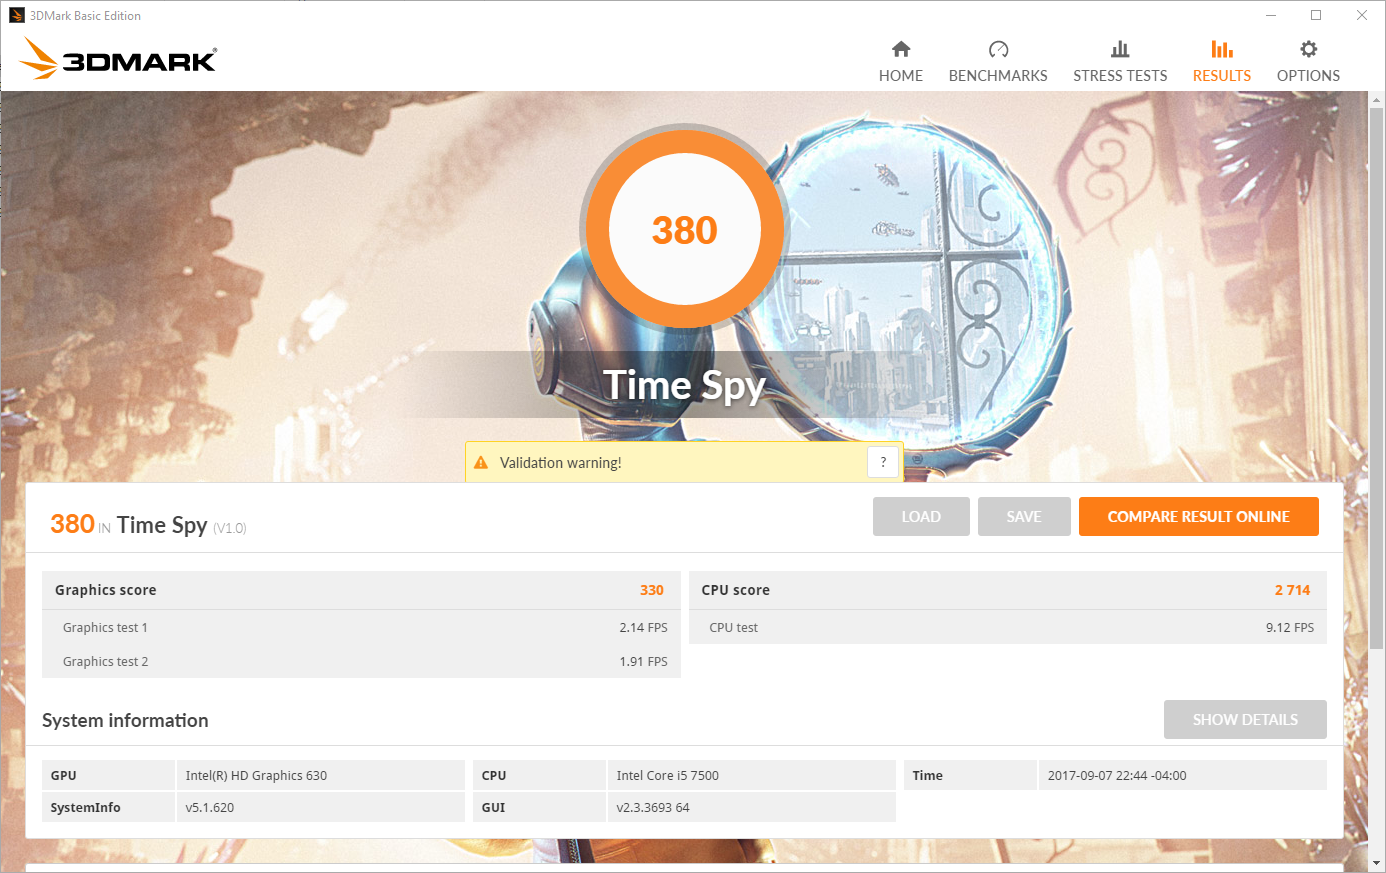
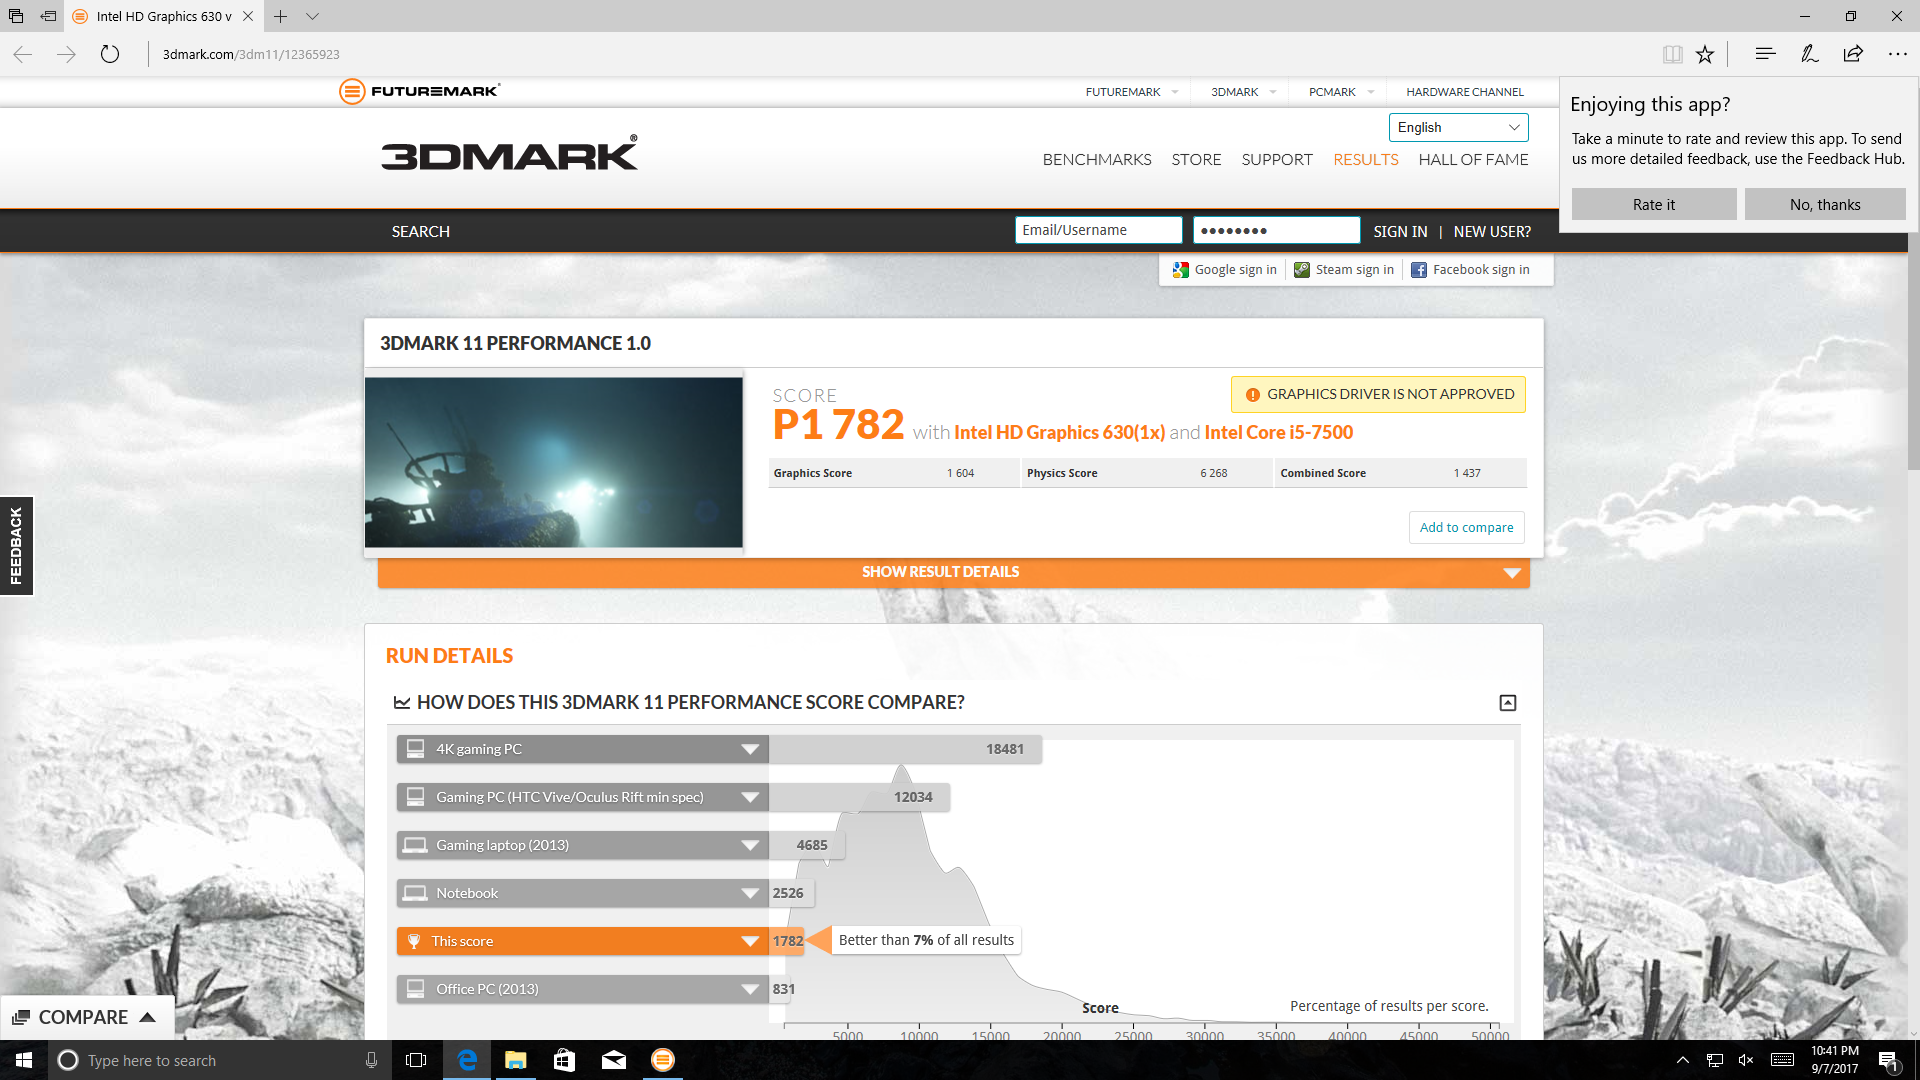
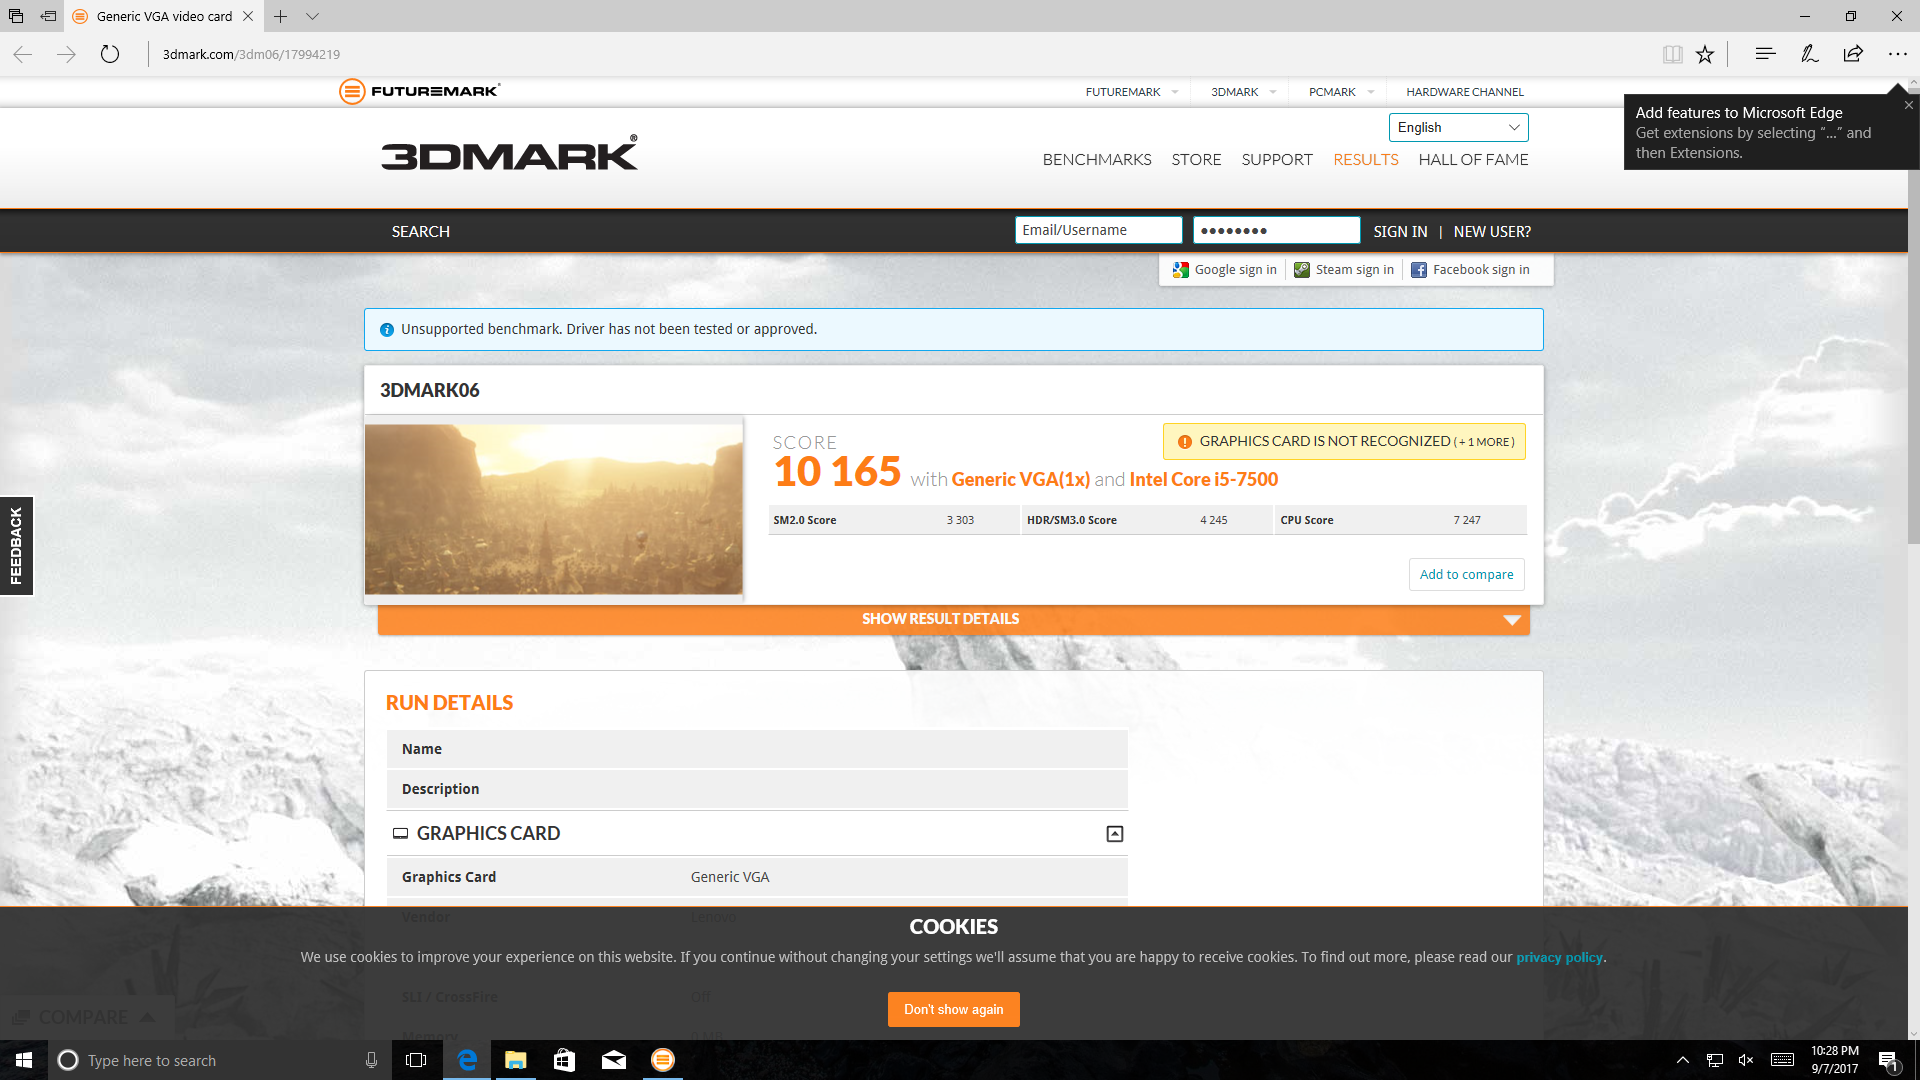
GPU Performance
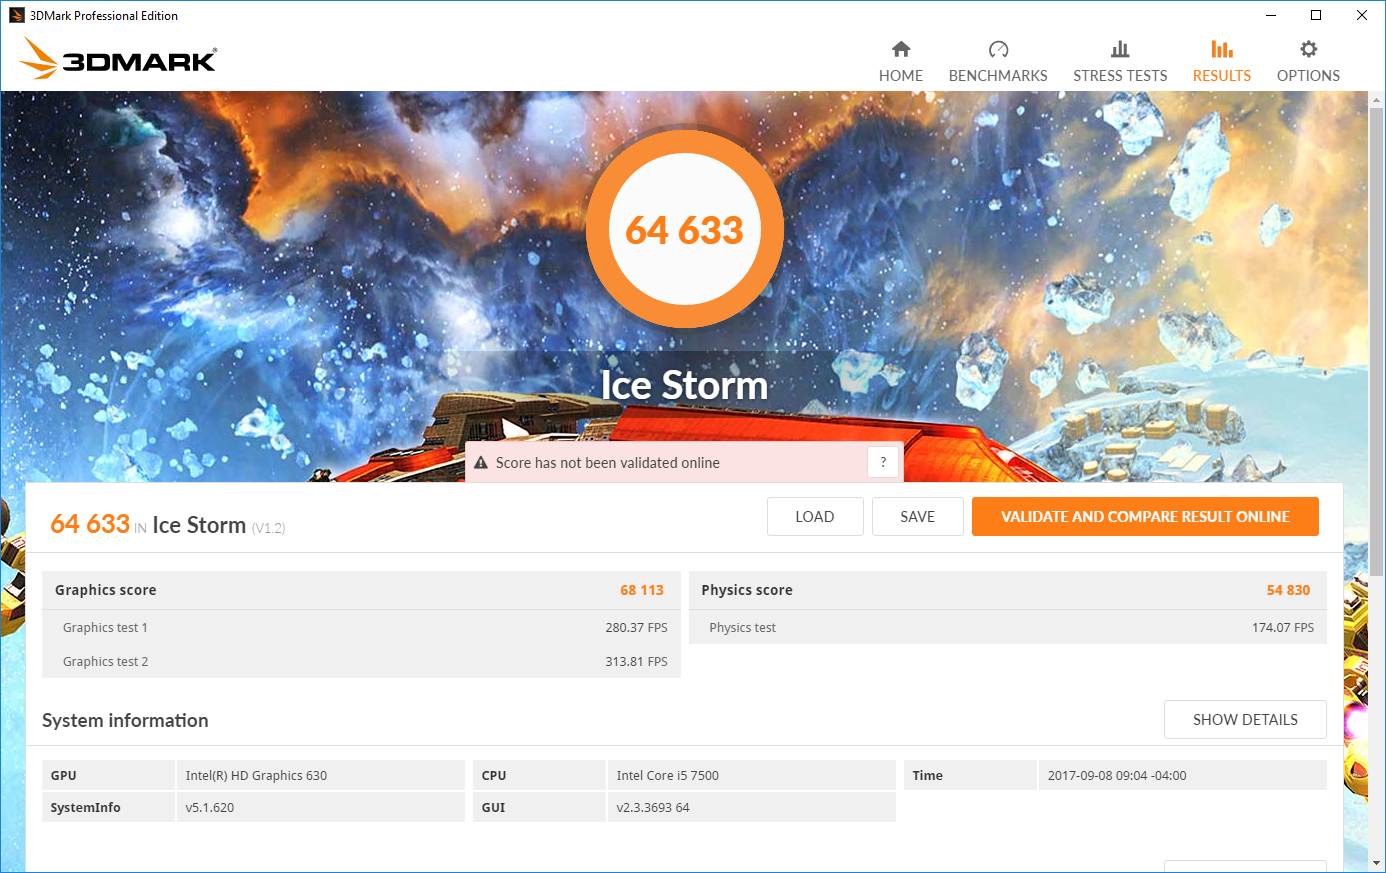
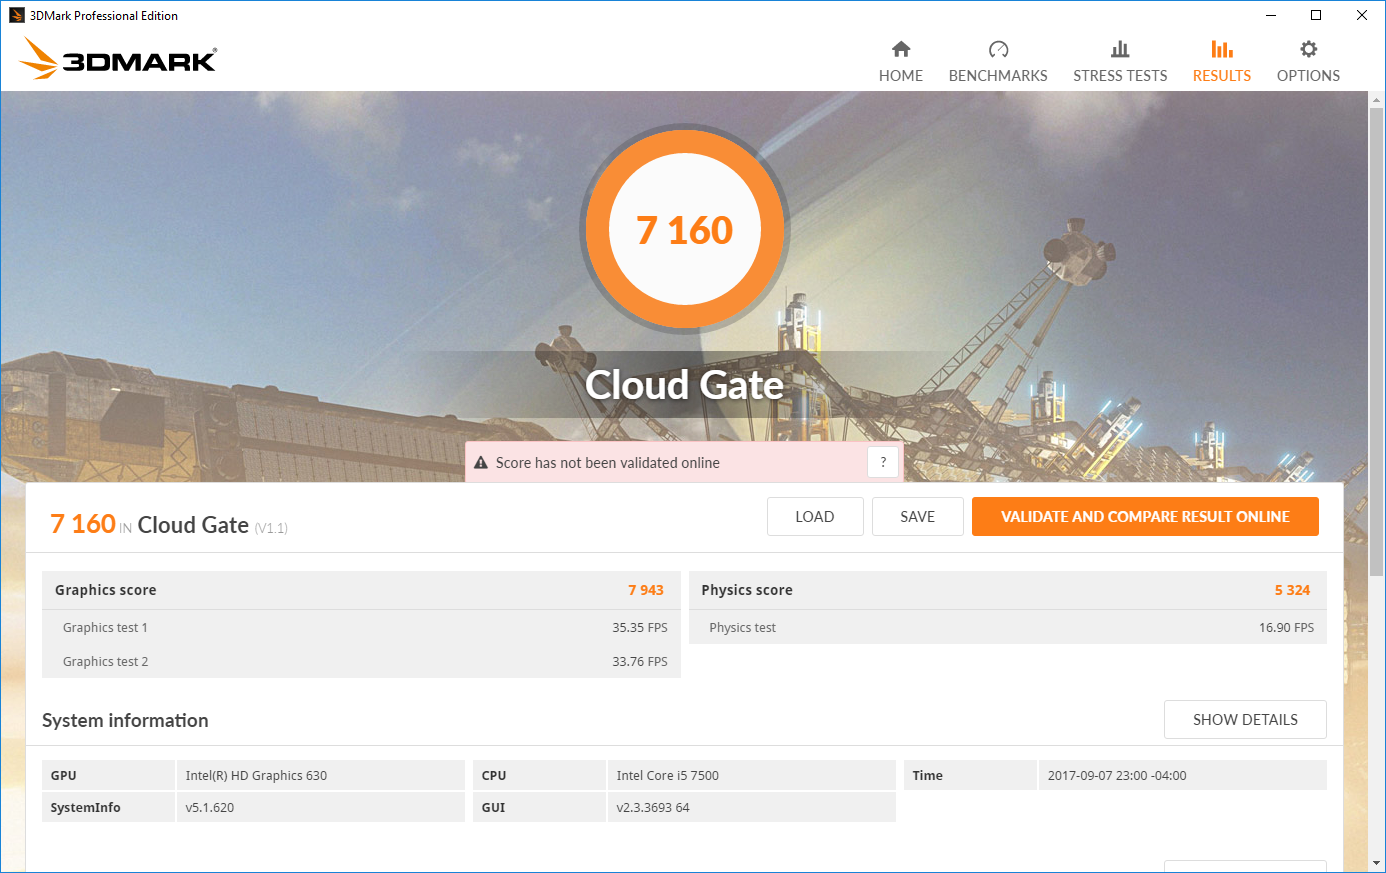
The M910z is no professional workstation, and as such, it lacks the dedicated graphics of the HP Z1 and T470p. The latter unsurprisingly trumps it in terms of GPU performance as a result, but the M910z still turns in a respectable performance which indicates more than capable speeds for everyday office use.
| 3DMark 11 | |
| 1280x720 Performance GPU | |
| Lenovo ThinkPad T470p-20J7S00000 | |
| Lenovo ThinkCentre M910z-10NR000KUS | |
| Dell Latitude 5580 | |
| 1280x720 Performance Combined | |
| Lenovo ThinkPad T470p-20J7S00000 | |
| Lenovo ThinkCentre M910z-10NR000KUS | |
| Dell Latitude 5580 | |
| 3DMark | |
| 1280x720 Cloud Gate Standard Graphics | |
| Lenovo ThinkPad T470p-20J7S00000 | |
| HP Z1 G2 G1X47EA | |
| Lenovo ThinkCentre M910z-10NR000KUS | |
| 1920x1080 Fire Strike Graphics | |
| Lenovo ThinkPad T470p-20J7S00000 | |
| HP Z1 G2 G1X47EA | |
| Lenovo ThinkCentre M910z-10NR000KUS | |
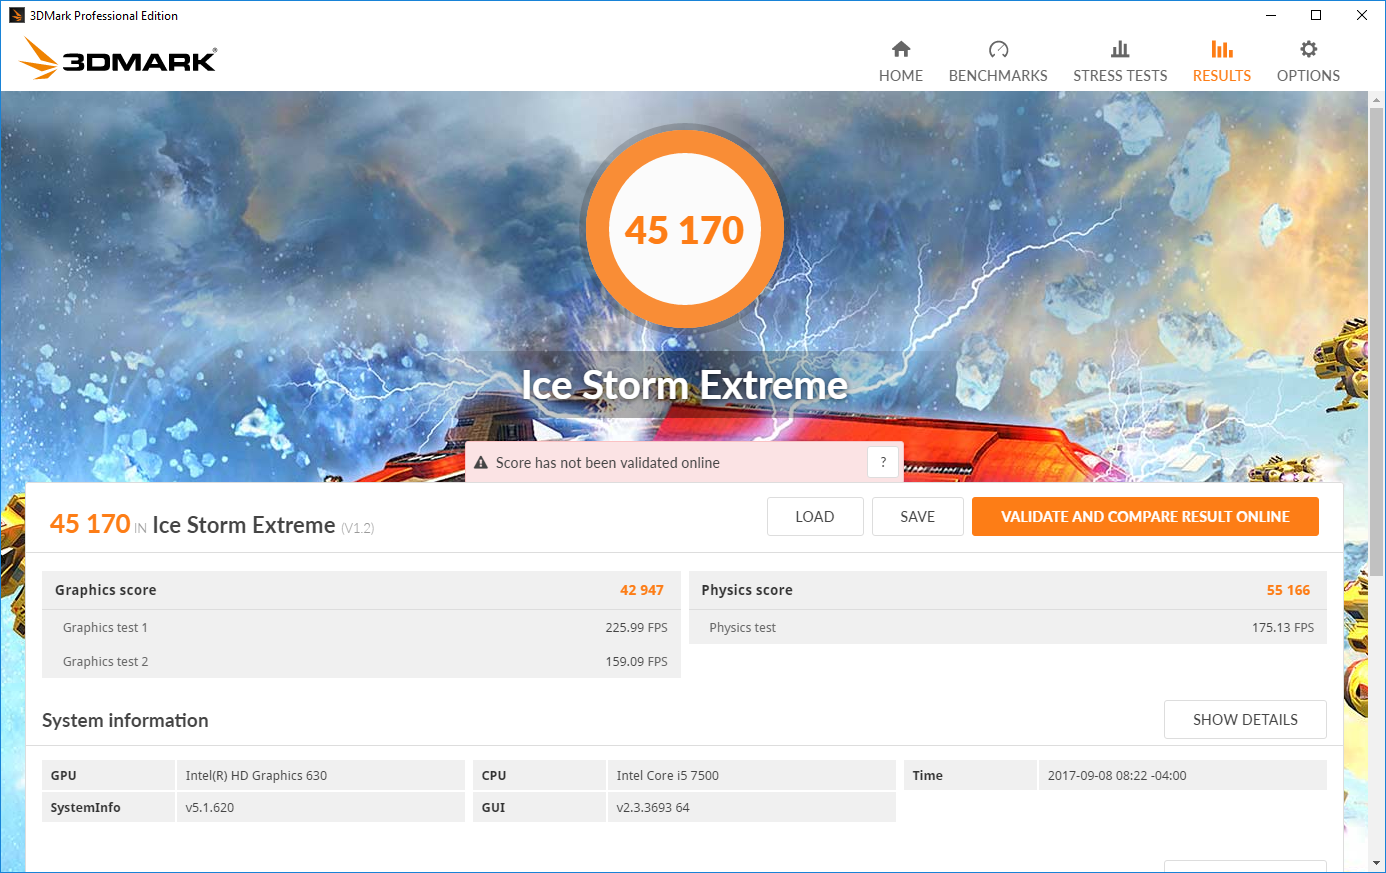
| 1920x1080 Ice Storm Extreme Graphics | |
| Lenovo ThinkPad T470p-20J7S00000 | |
| 3DMark 06 Standard Score | 10165 points | |
| 3DMark 11 Performance | 1782 points | |
| 3DMark Cloud Gate Standard Score | 7160 points | |
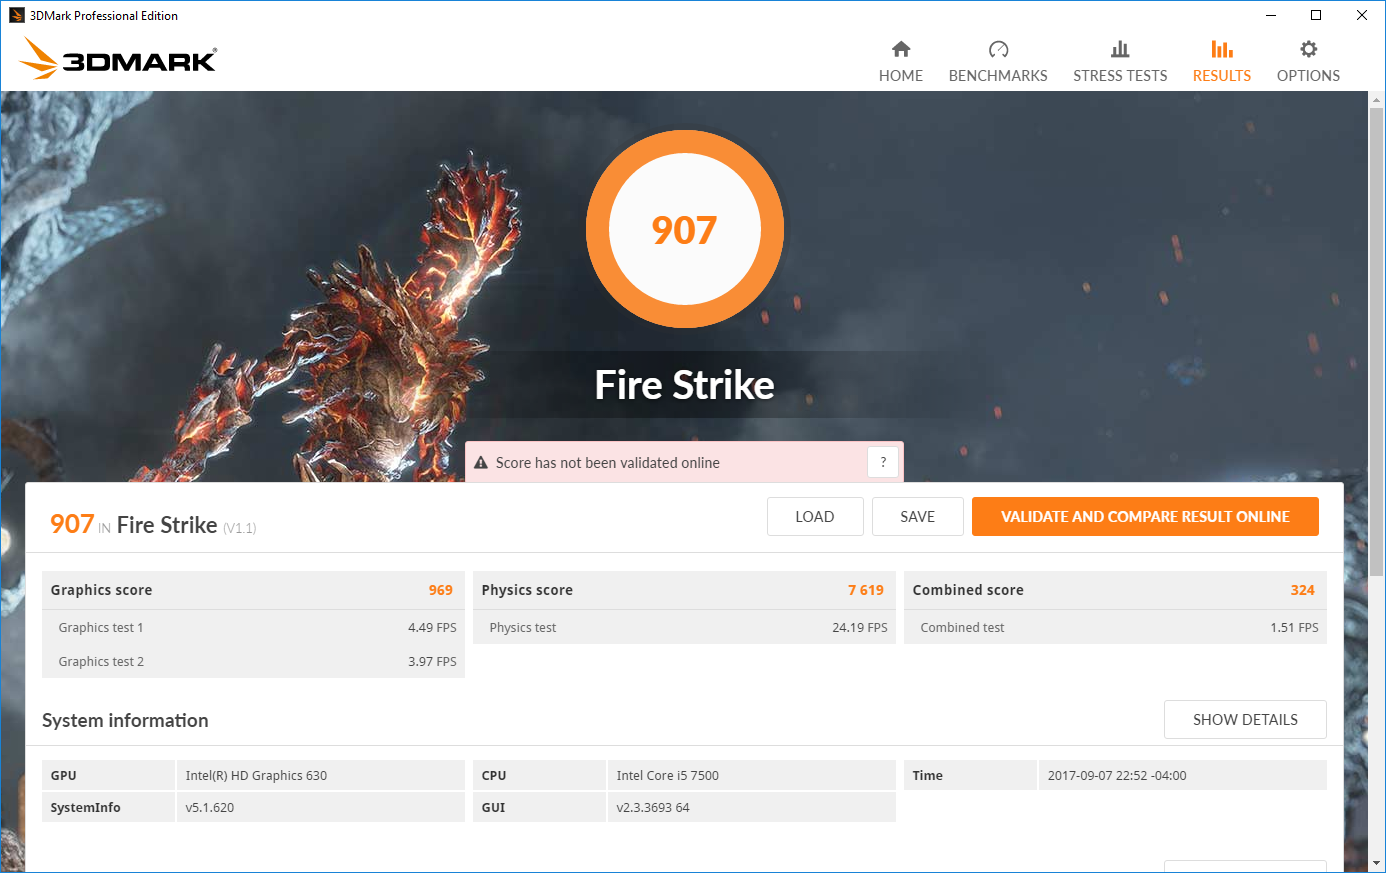
| 3DMark Fire Strike Score | 907 points | |
Help | ||
| low | med. | high | ultra | |
|---|---|---|---|---|
| BioShock Infinite (2013) | 52 | 35 | 23 | 8 |
Stress Test
The M910z enjoys stable performance under load in our Cinebench loop test (see the graph above in our Processor section for more on that). We also didn’t see any throttling in play during our synthetic stress test.
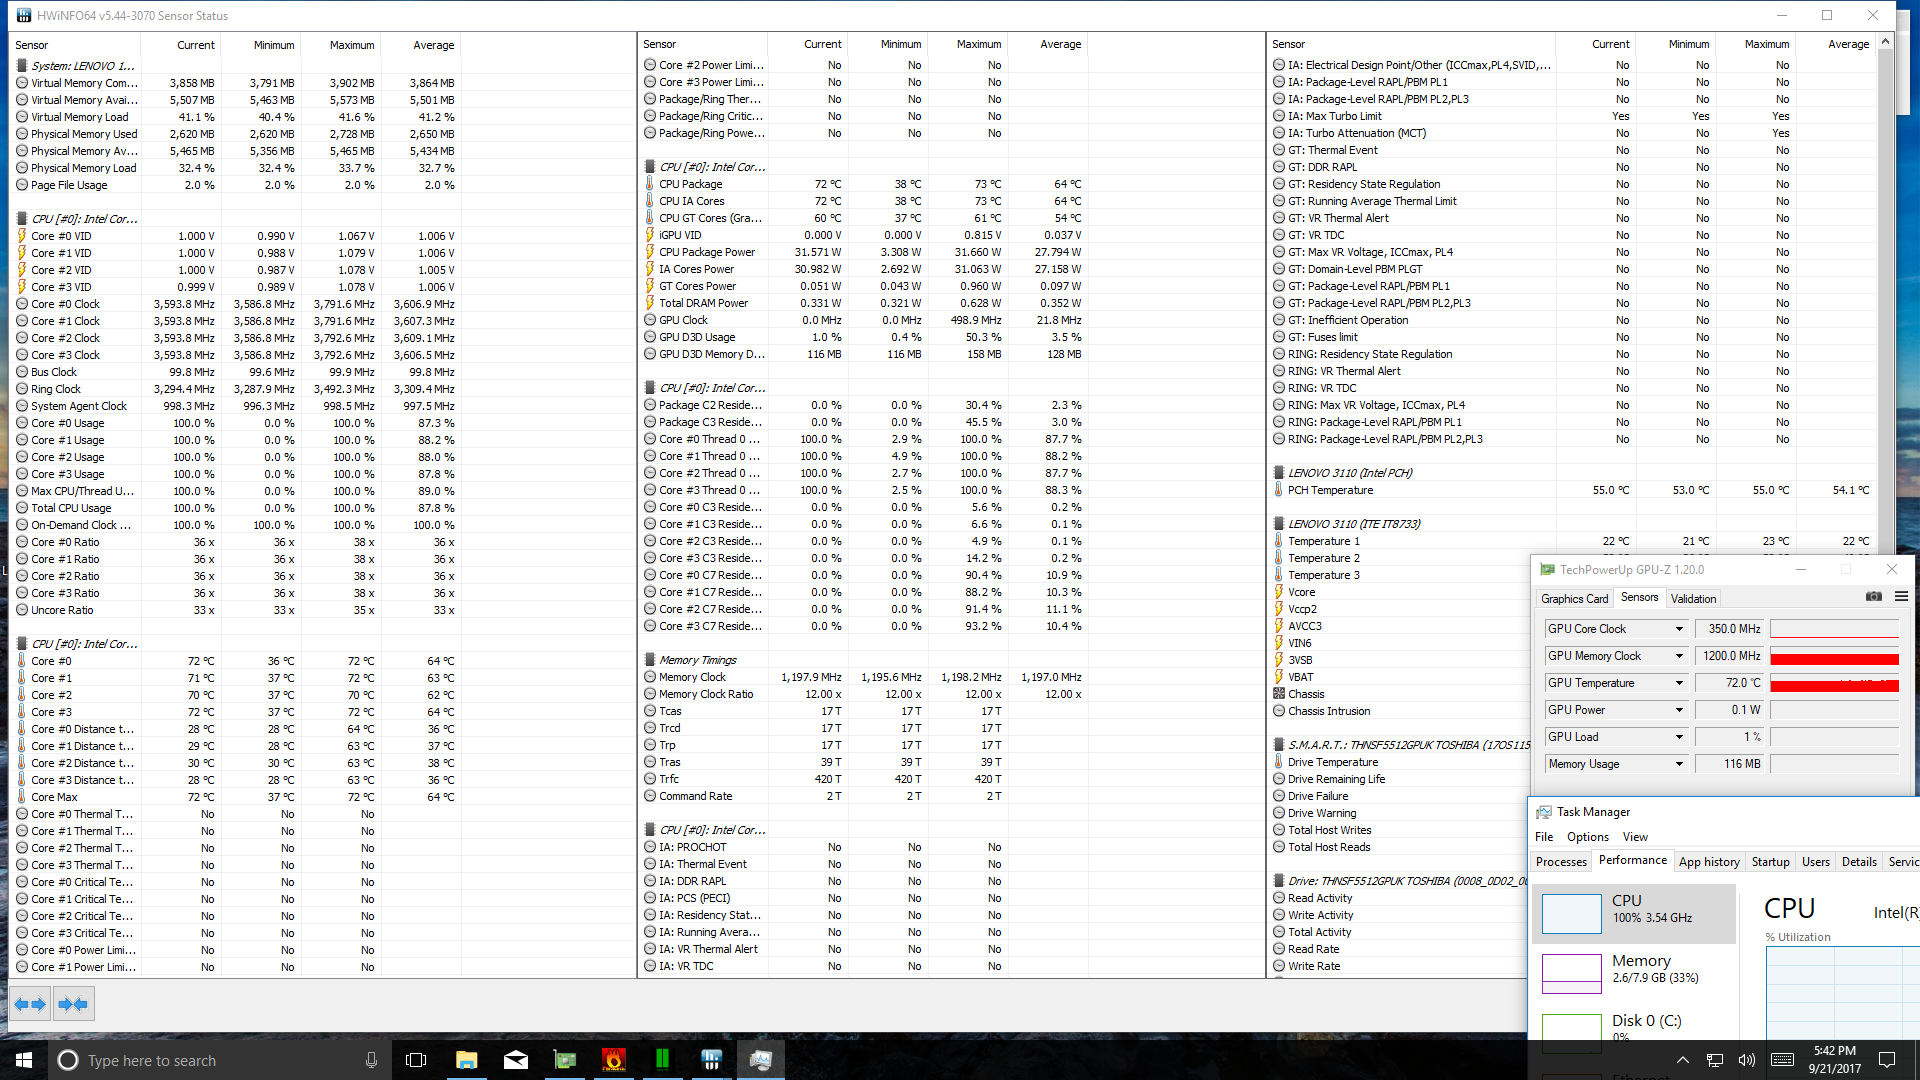

| CPU Clock (GHz) | GPU Clock (MHz) | Average CPU Temperature (°C) | Average GPU Temperature (°C) | |
| Prime95 Stress | 3.6 | - | 72 | - |
| FurMark Stress | - | 1100 | - | 65 |
| Prime95 + FurMark Stress | 3.6 | 1100 | 84 | 85 |
Emissions
System Noise
As is not uncommon with AIO desktops, the fan speeds (and thus noise levels) associated with the operation of the M910z are mostly unchanging regardless of stress level, performance state, or power plan. We measured a relatively unobtrusive 34.6 dB(A)—around 6 to 7 dB(A) higher than ambient noise levels—under all conditions. The iMac in particular can get to be quite a bit louder under load, but it also features dedicated graphics.
Noise level
| Idle |
| 34.5 / 34.6 / 34.6 dB(A) |
| Load |
| 34.6 / 34.6 dB(A) |
 | ||
30 dB silent 40 dB(A) audible 50 dB(A) loud |
||
min: | ||
| Lenovo ThinkCentre M910z-10NR000KUS HD Graphics 630, i5-7500, Toshiba NVMe THNSF5512GPUK | HP Z1 G2 G1X47EA Quadro K2100M, E3-1226 v3, Micron M600 MTFDDAT256MBF mSATA | Apple iMac Retina 5K 27 Late 2015 3.2 GHz M390 MK472D/A Radeon R9 M390, 6500, Apple Fusion Drive 1TB (24 GB SSD + 1 TB HDD) | Lenovo ThinkPad T470p-20J7S00000 GeForce 940MX, i7-7700HQ, Samsung PM961 NVMe MZVLW512HMJP | Dell Latitude 5580 HD Graphics 620, i5-7300U, Toshiba MQ01ACF050 | |
|---|---|---|---|---|---|
| Noise | 5% | -7% | 4% | -2% | |
| off / environment * (dB) | 28 | 30 -7% | 29 -4% | 30.6 -9% | |
| Idle Minimum * (dB) | 34.5 | 32.4 6% | 32.5 6% | 29 16% | 32.8 5% |
| Idle Average * (dB) | 34.6 | 32.4 6% | 32.5 6% | 29 16% | 32.8 5% |
| Idle Maximum * (dB) | 34.6 | 32.4 6% | 32.5 6% | 29 16% | 33.6 3% |
| Load Average * (dB) | 34.6 | 33.7 3% | 39 -13% | 35.6 -3% | 37.6 -9% |
| Load Maximum * (dB) | 34.6 | 33.7 3% | 48.2 -39% | 39.7 -15% | 37.6 -9% |
* ... smaller is better
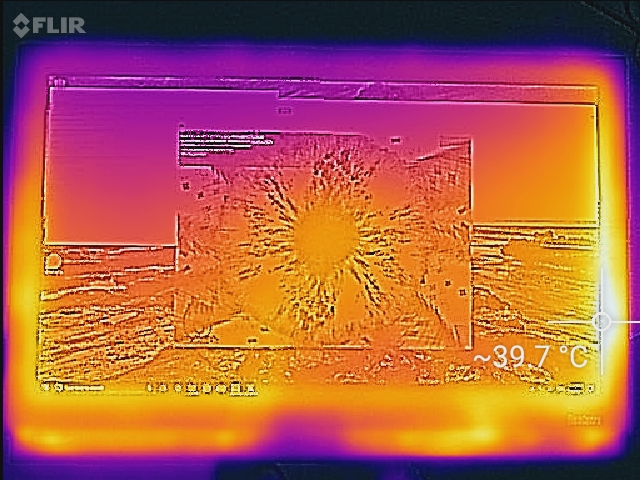
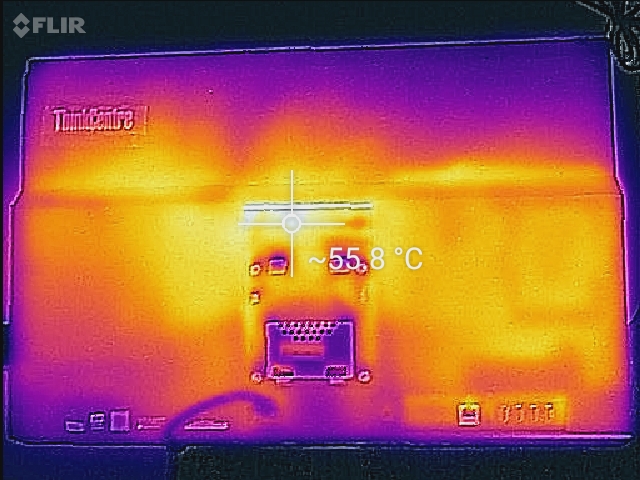
Temperature
Surface temperatures aren’t a terrible concern with desktops considering the fact that they rarely ever come into contact with the user. Still, the back of the ThinkCentre M910z can get to be rather toasty in a couple of regions—specifically, the center quadrant where the exhaust vent is located, at which point we measured 54.8 °C.
(+) The maximum temperature on the upper side is 39.8 °C / 104 F, compared to the average of 33.9 °C / 93 F, ranging from 25 to 47 °C for the class Desktop.
(-) The bottom heats up to a maximum of 54.8 °C / 131 F, compared to the average of 33.6 °C / 92 F
(+) In idle usage, the average temperature for the upper side is 26.6 °C / 80 F, compared to the device average of 29.5 °C / 85 F.
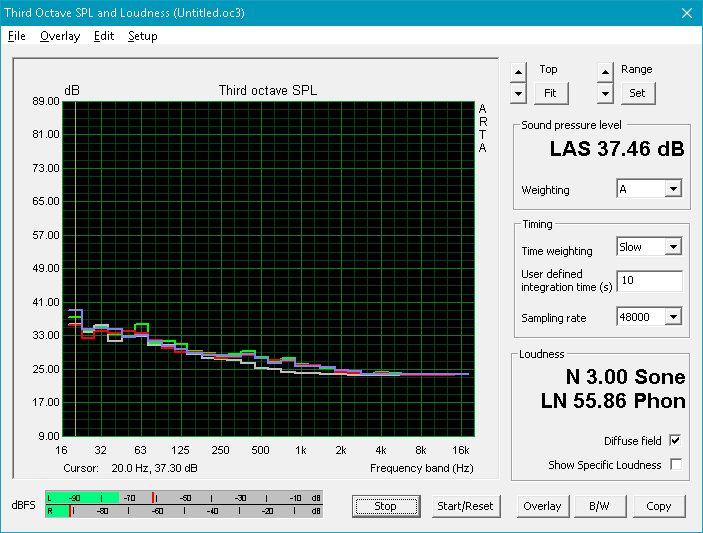
Speakers

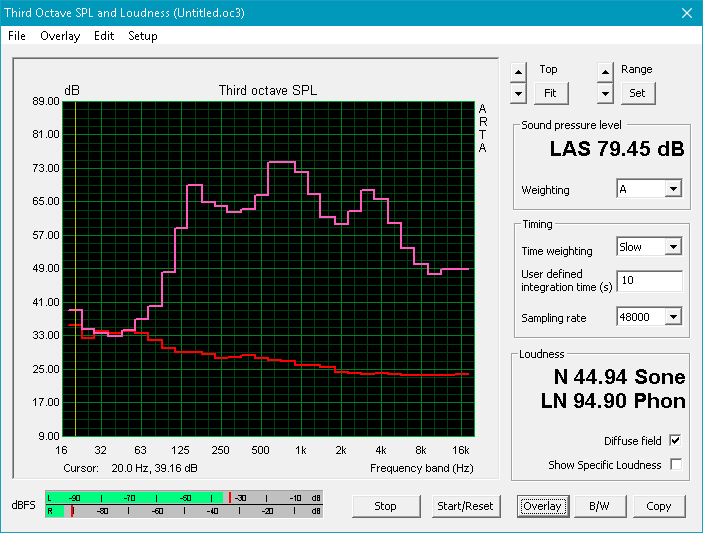
The two 3W front-facing speakers on the M910z muster good volume without noticeable distortions. They’re supplemented with Dolby Audio post-processing software—and while the included presets are mostly underwhelming, it’s easy to customize the equalizer to your liking (and disable that pesky “Simulated Surround” feature) to produce a nicer-sounding output with good clarity, lower mids, and a pretty decent amount of bass, too. The only oddity is the fact that the speakers are offset to the right side of the machine, with the left driver positioned in the center of the screen.
Lenovo ThinkCentre M910z-10NR000KUS audio analysis
(±) | speaker loudness is average but good (79.4 dB)
Bass 100 - 315 Hz
(+) | good bass - only 4.7% away from median
(-) | bass is not linear (15.9% delta to prev. frequency)
Mids 400 - 2000 Hz
(±) | higher mids - on average 5.7% higher than median
(±) | linearity of mids is average (9.1% delta to prev. frequency)
Highs 2 - 16 kHz
(±) | reduced highs - on average 6.8% lower than median
(±) | linearity of highs is average (11% delta to prev. frequency)
Overall 100 - 16.000 Hz
(±) | linearity of overall sound is average (19.9% difference to median)
Compared to same class
» 67% of all tested devices in this class were better, 22% similar, 11% worse
» The best had a delta of 6%, average was 16%, worst was 46%
Compared to all devices tested
» 51% of all tested devices were better, 7% similar, 42% worse
» The best had a delta of 4%, average was 23%, worst was 134%
Lenovo ThinkPad T470p-20J7S00000 audio analysis
(+) | speakers can play relatively loud (83.1 dB)
Bass 100 - 315 Hz
(-) | nearly no bass - on average 18.1% lower than median
(±) | linearity of bass is average (14.6% delta to prev. frequency)
Mids 400 - 2000 Hz
(+) | balanced mids - only 4.2% away from median
(+) | mids are linear (5.9% delta to prev. frequency)
Highs 2 - 16 kHz
(+) | balanced highs - only 3.3% away from median
(+) | highs are linear (6.5% delta to prev. frequency)
Overall 100 - 16.000 Hz
(±) | linearity of overall sound is average (19.6% difference to median)
Compared to same class
» 41% of all tested devices in this class were better, 8% similar, 51% worse
» The best had a delta of 7%, average was 21%, worst was 53%
Compared to all devices tested
» 49% of all tested devices were better, 7% similar, 44% worse
» The best had a delta of 4%, average was 23%, worst was 134%
Frequency Comparison (Checkbox selectable!)
Graph 1: Pink Noise 100% Vol.; Graph 2: Audio off
Energy Management
Power Consumption
Thanks to its smaller display and lack of dedicated graphics, the ThinkCentre M910z is a much more power-efficient solution than either the HP Z1 or the Apple iMac Retina 5K. We measured an idle minimum of just 14.4 W with an average of 29.4 W. The machine never exceeded 88.4 W under load, with an average of 64.1 W in stressful conditions. Of course, the two notebooks in our comparison are miles ahead in terms of idle efficiency, but a large part of that is the larger LCD panels in the AIOs.
| Off / Standby | |
| Idle | |
| Load |
|
Key:
min: | |
| Lenovo ThinkCentre M910z-10NR000KUS i5-7500, HD Graphics 630, Toshiba NVMe THNSF5512GPUK, IPS, 1920x1080, 23.8" | HP Z1 G2 G1X47EA E3-1226 v3, Quadro K2100M, Micron M600 MTFDDAT256MBF mSATA, IPS LED, 2560x1440, 27" | Apple iMac Retina 5K 27 Late 2015 3.2 GHz M390 MK472D/A 6500, Radeon R9 M390, Apple Fusion Drive 1TB (24 GB SSD + 1 TB HDD), , 5120x2880, 27" | Lenovo ThinkPad T470p-20J7S00000 i7-7700HQ, GeForce 940MX, Samsung PM961 NVMe MZVLW512HMJP, IPS, 2560x1440, 14" | Dell Latitude 5580 i5-7300U, HD Graphics 620, Toshiba MQ01ACF050, IPS, 1920x1080, 15.6" | |
|---|---|---|---|---|---|
| Power Consumption | -109% | -119% | 43% | 63% | |
| Idle Minimum * (Watt) | 14.4 | 36.8 -156% | 29.5 -105% | 3.8 74% | 4.3 70% |
| Idle Average * (Watt) | 29.4 | 65.3 -122% | 59.2 -101% | 6.5 78% | 10.1 66% |
| Idle Maximum * (Watt) | 29.7 | 67 -126% | 68 -129% | 7.2 76% | 11.8 60% |
| Load Average * (Watt) | 64.1 | 114 -78% | 126 -97% | 62.5 2% | 32 50% |
| Load Maximum * (Watt) | 88.4 | 142 -61% | 231 -161% | 99.6 -13% | 29 67% |
* ... smaller is better
Pros
Cons
Verdict
Business desktops, including all-in-ones, are part of a market which is simpler to parse than that of the crowded and diverse business laptops landscape. Incidentally, there’s nothing particularly exciting about the ThinkCentre M910z (our configuration: $1,285), which plays it safe with a functional, understated design and checks all of the boxes of a conventional office machine.
But that’s not a bad thing: in keeping with its heritage, the ThinkCentre gets the job done with a function-over-form design that delivers such appreciated features as (relatively) easy maintenance and upgrades and a versatile yet sturdy articulating stand design. But it’s also quiet (even under load), fast in general operation thanks to its quad-core CPU and NVMe SSD, and it packs a set of speakers which belie the typically poor reputation of their business brethren with good sound across most of the spectrum (after a bit of tweaking). The display is a mixed bag, thanks mostly to a dim overall brightness and a somewhat off-putting touchscreen layer (which brings into question whether the buyer should bother with touch interface when it probably is mostly to blame for this deficiency)—but at least it remains anti-glare even when configured for touch! Finally, power consumption is comfortably low, so anyone considering mass-deployment of a fleet of M910z machines should rest easy that they shouldn’t wreck the electrical bill.
There’s nothing particularly exciting about the ThinkCentre M910z, but that’s not a bad thing; it plays it safe with a functional, understated design and checks all of the boxes of a conventional office machine.
Ultimately, there really aren’t any major negatives associated with the ThinkCentre M910z—it’s a capable business desktop that—while unexciting by design—covers all its bases in the business market and is easy enough to maintain and deploy that it ought to enjoy the support of many IT departments.
Lenovo ThinkCentre M910z-10NR000KUS
- 09/22/2017 v6 (old)
Steve Schardein
Price comparison
