Ryzen 3 Review: 1200 and 1300X for Desktop PCs
Introduction
For the original German article, see here.
In March of 2017, AMD released its first Ryzen processors 1700, 1700X, and 1800X. To this day, these high-end models are the fastest microprocessors based on AMD’s Zen architecture available. At the same time, Ryzen 5 CPUs were meant to bring new life to the somewhat stale middle class. And last but not least, Ryzen 3 1200 and 1300X are now finally available and aimed to fight Intel’s grip on the entry-level market for affordable and low-demand systems. Compared to the higher-end models, the number of available cores has been cut in half and the number of threads even quartered due to the lack of SMT.
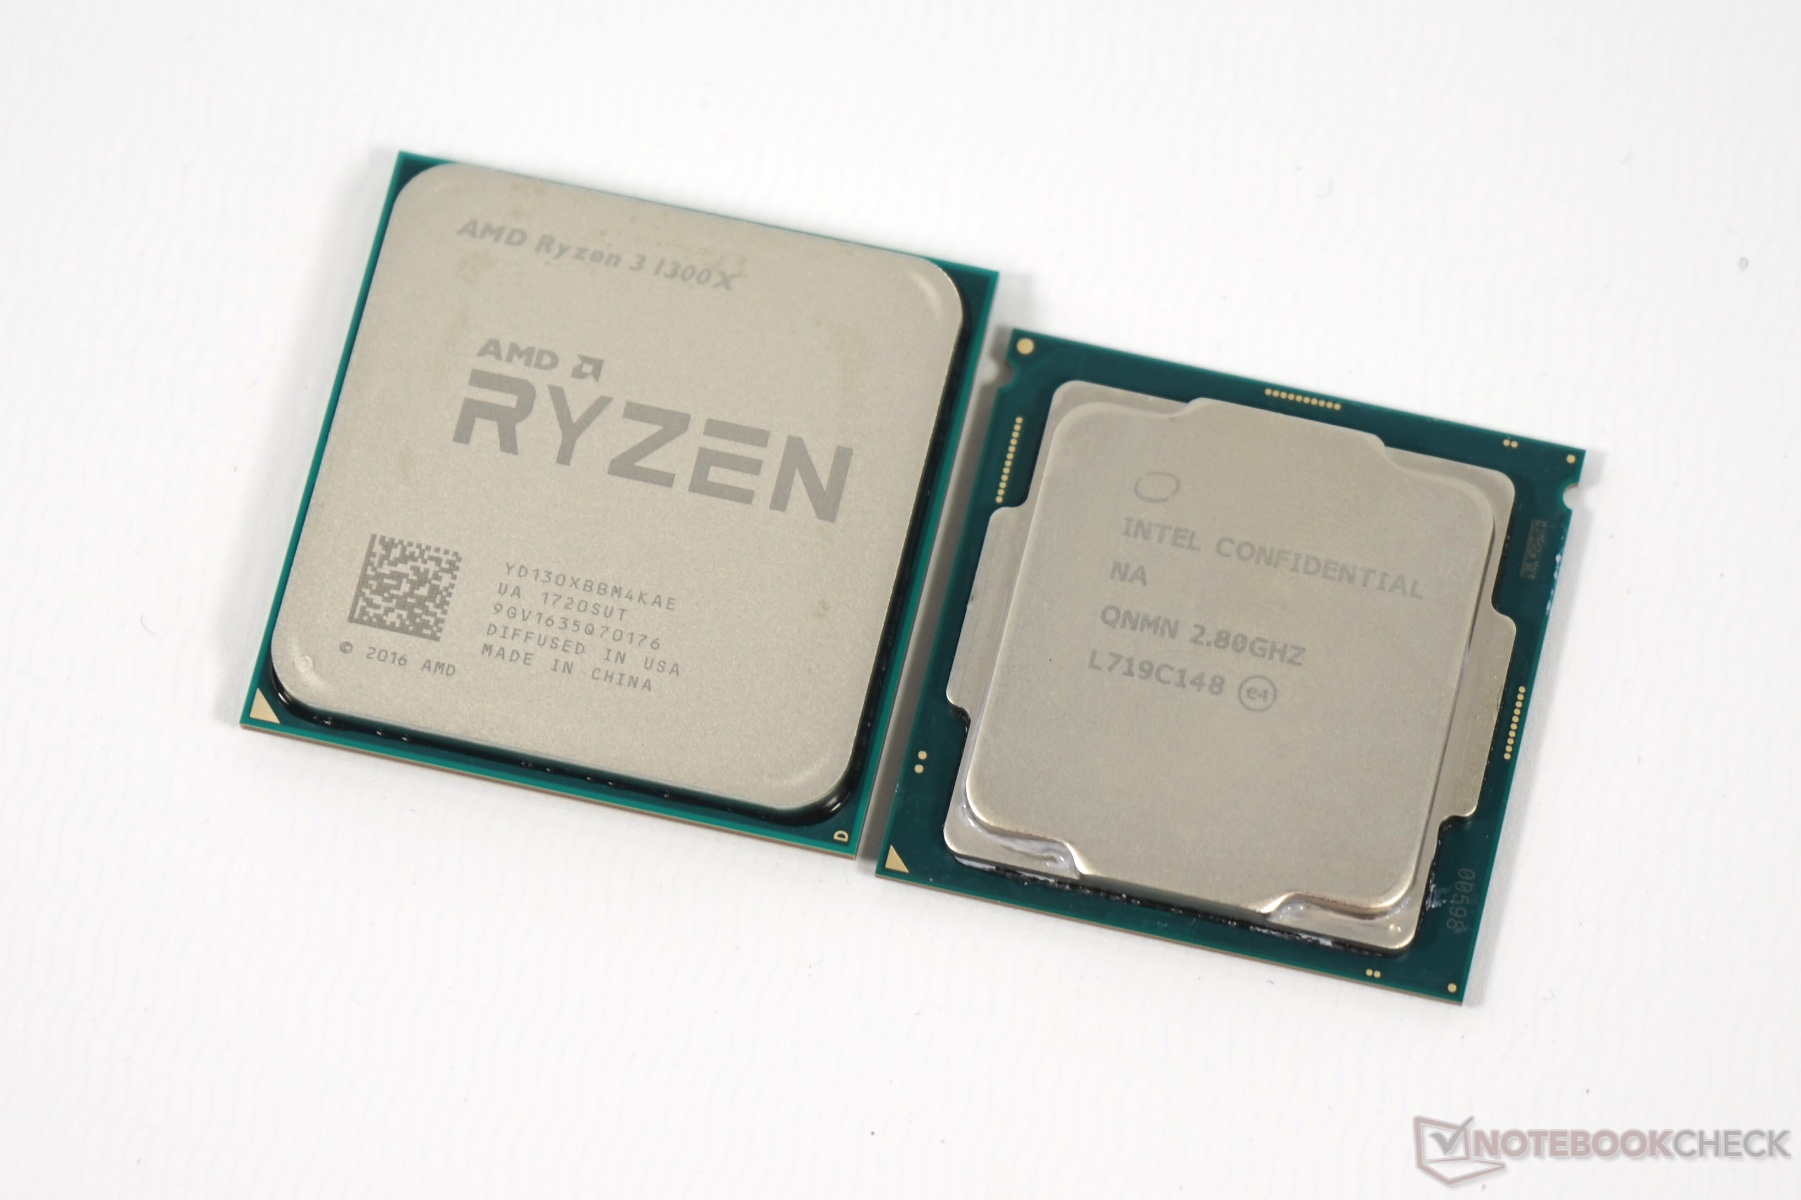
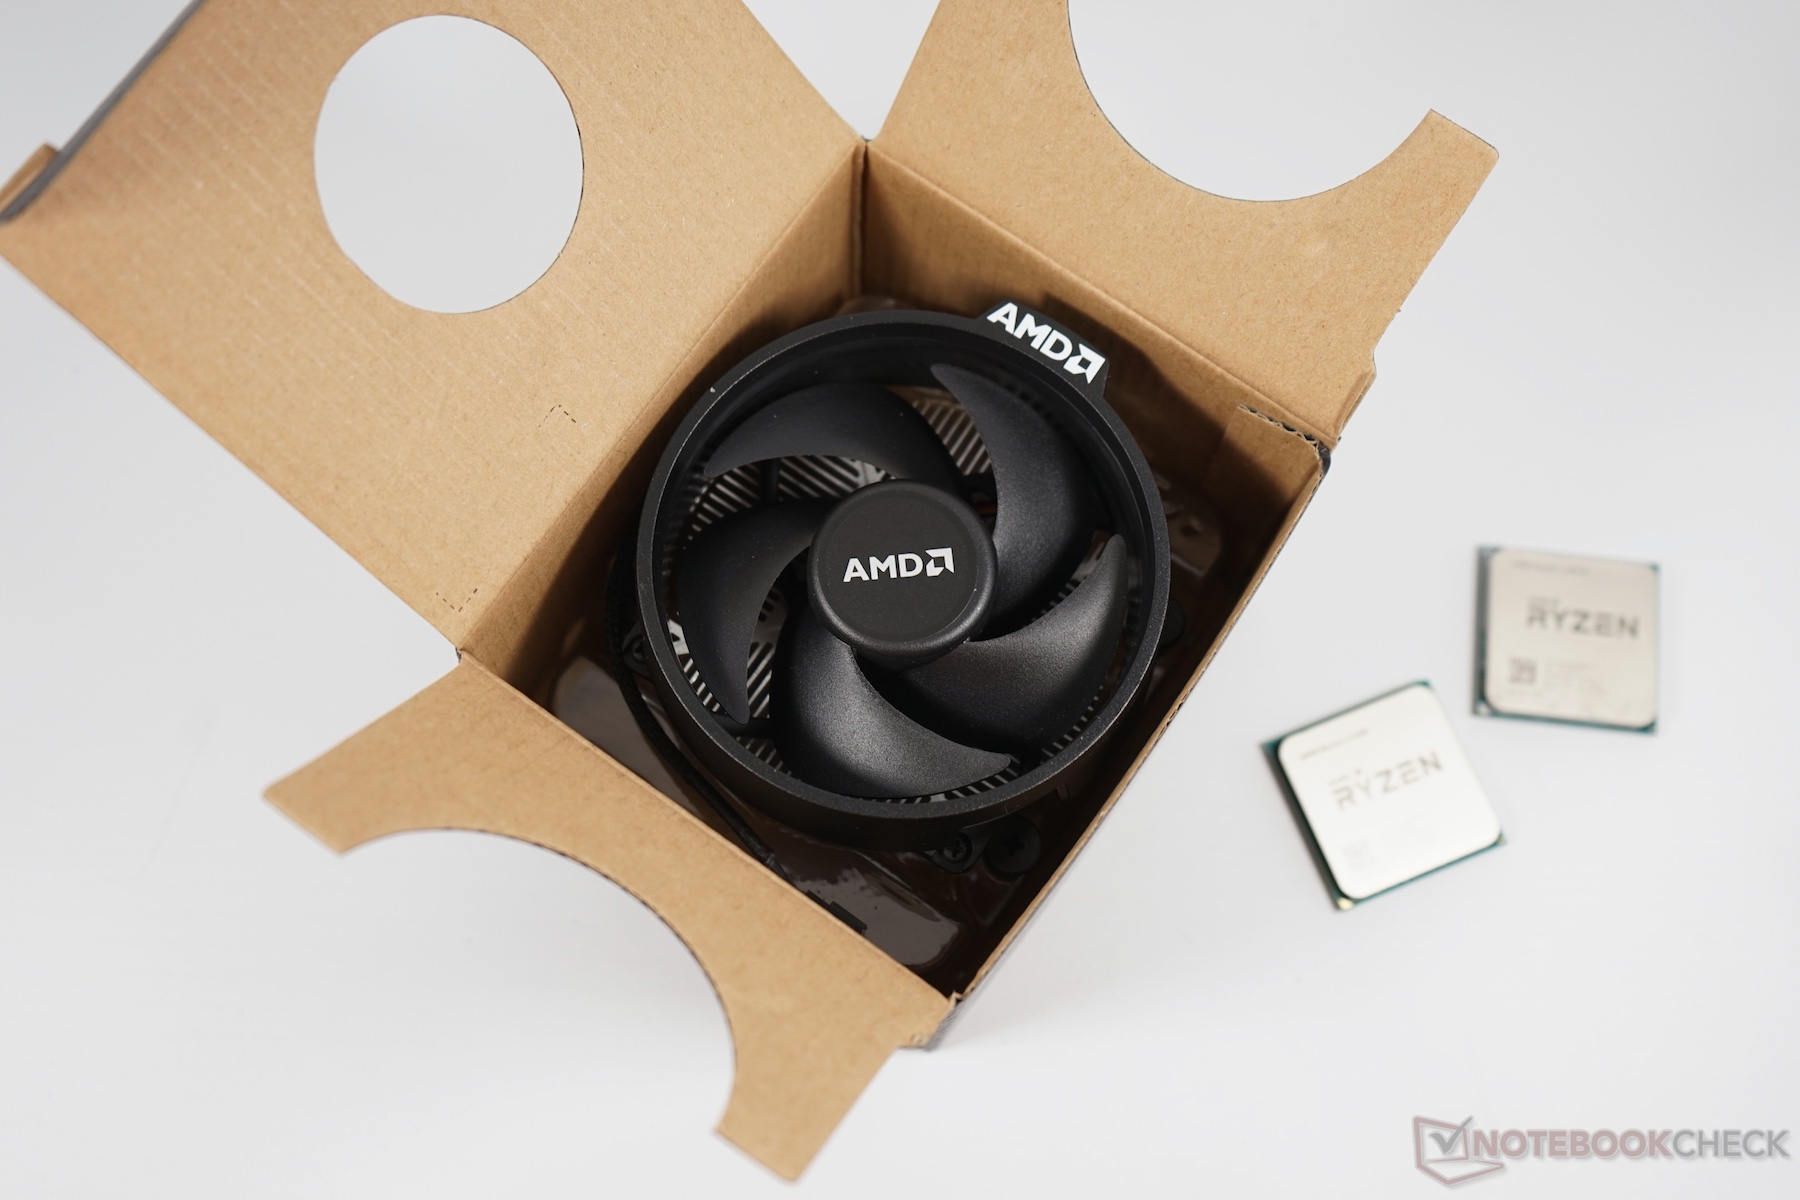
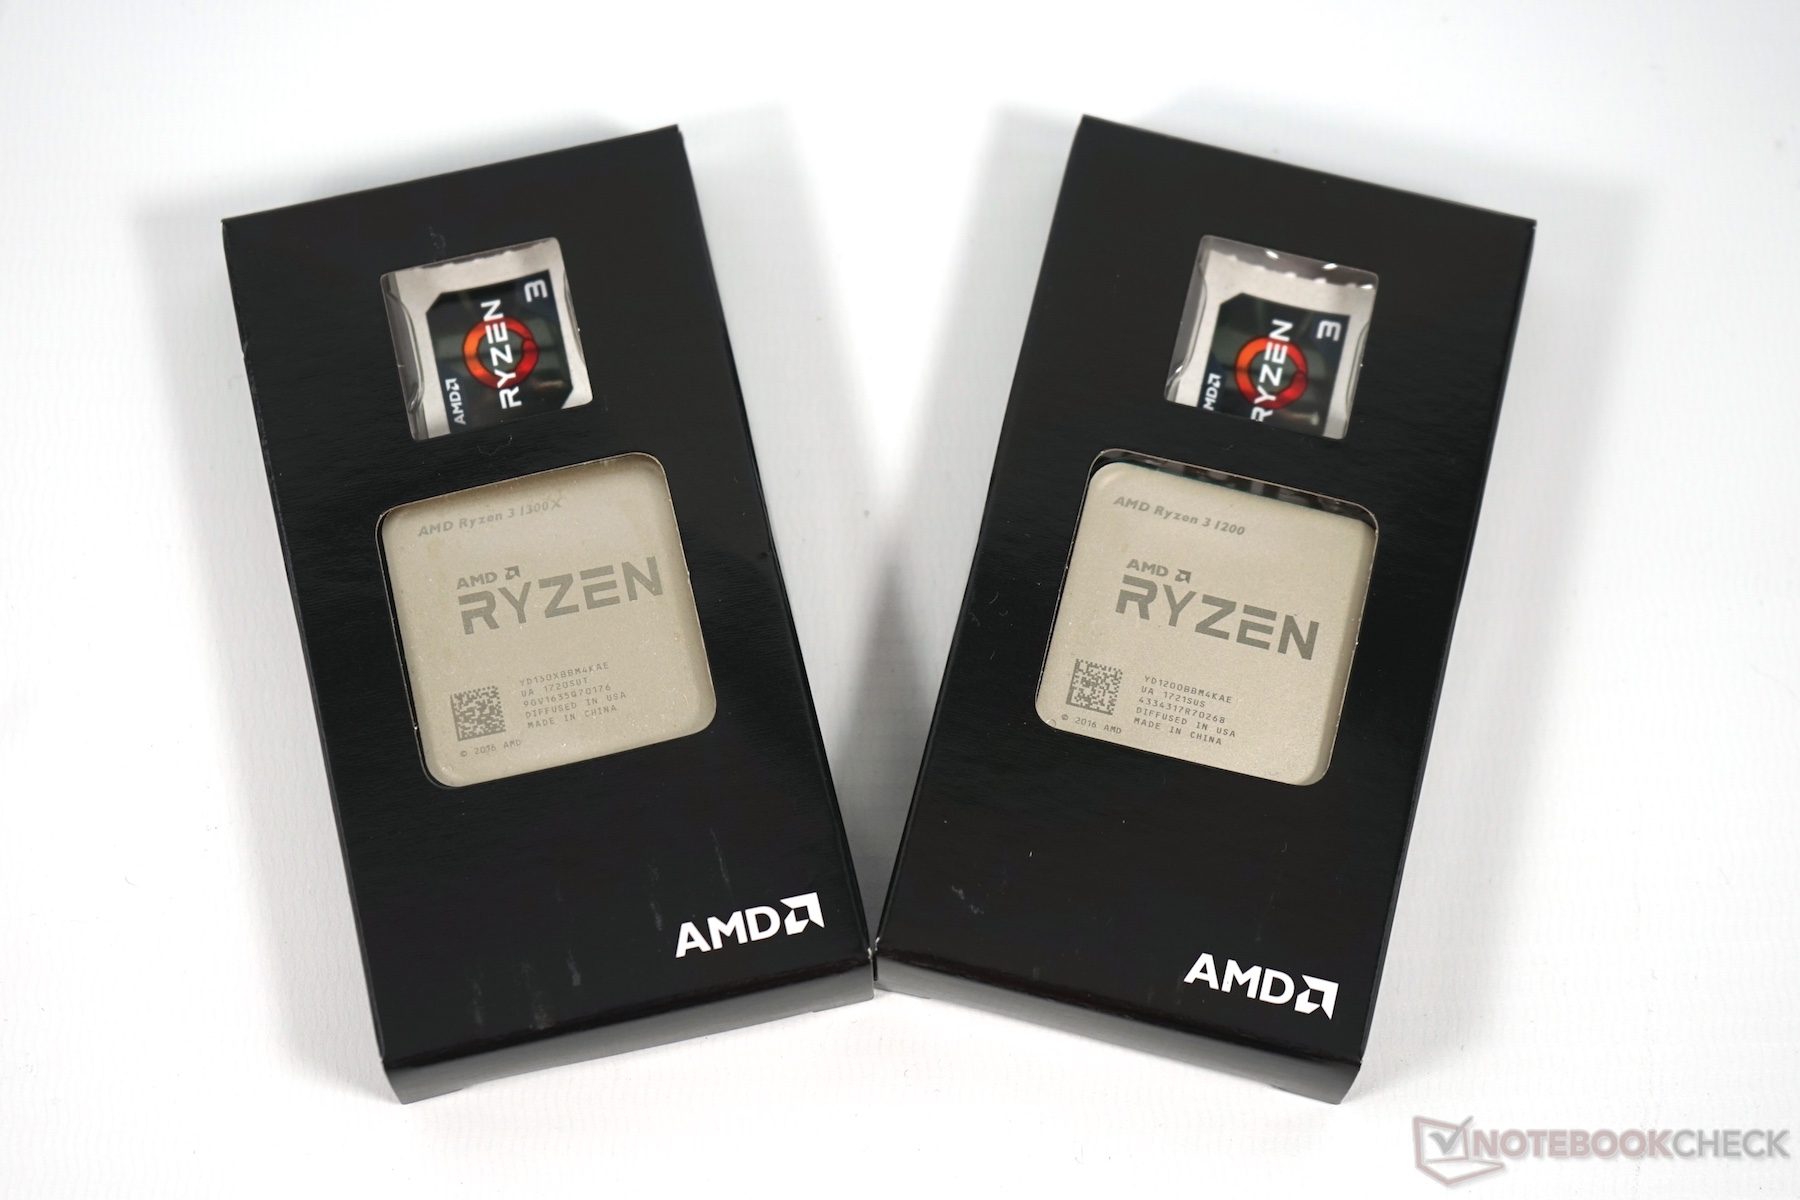
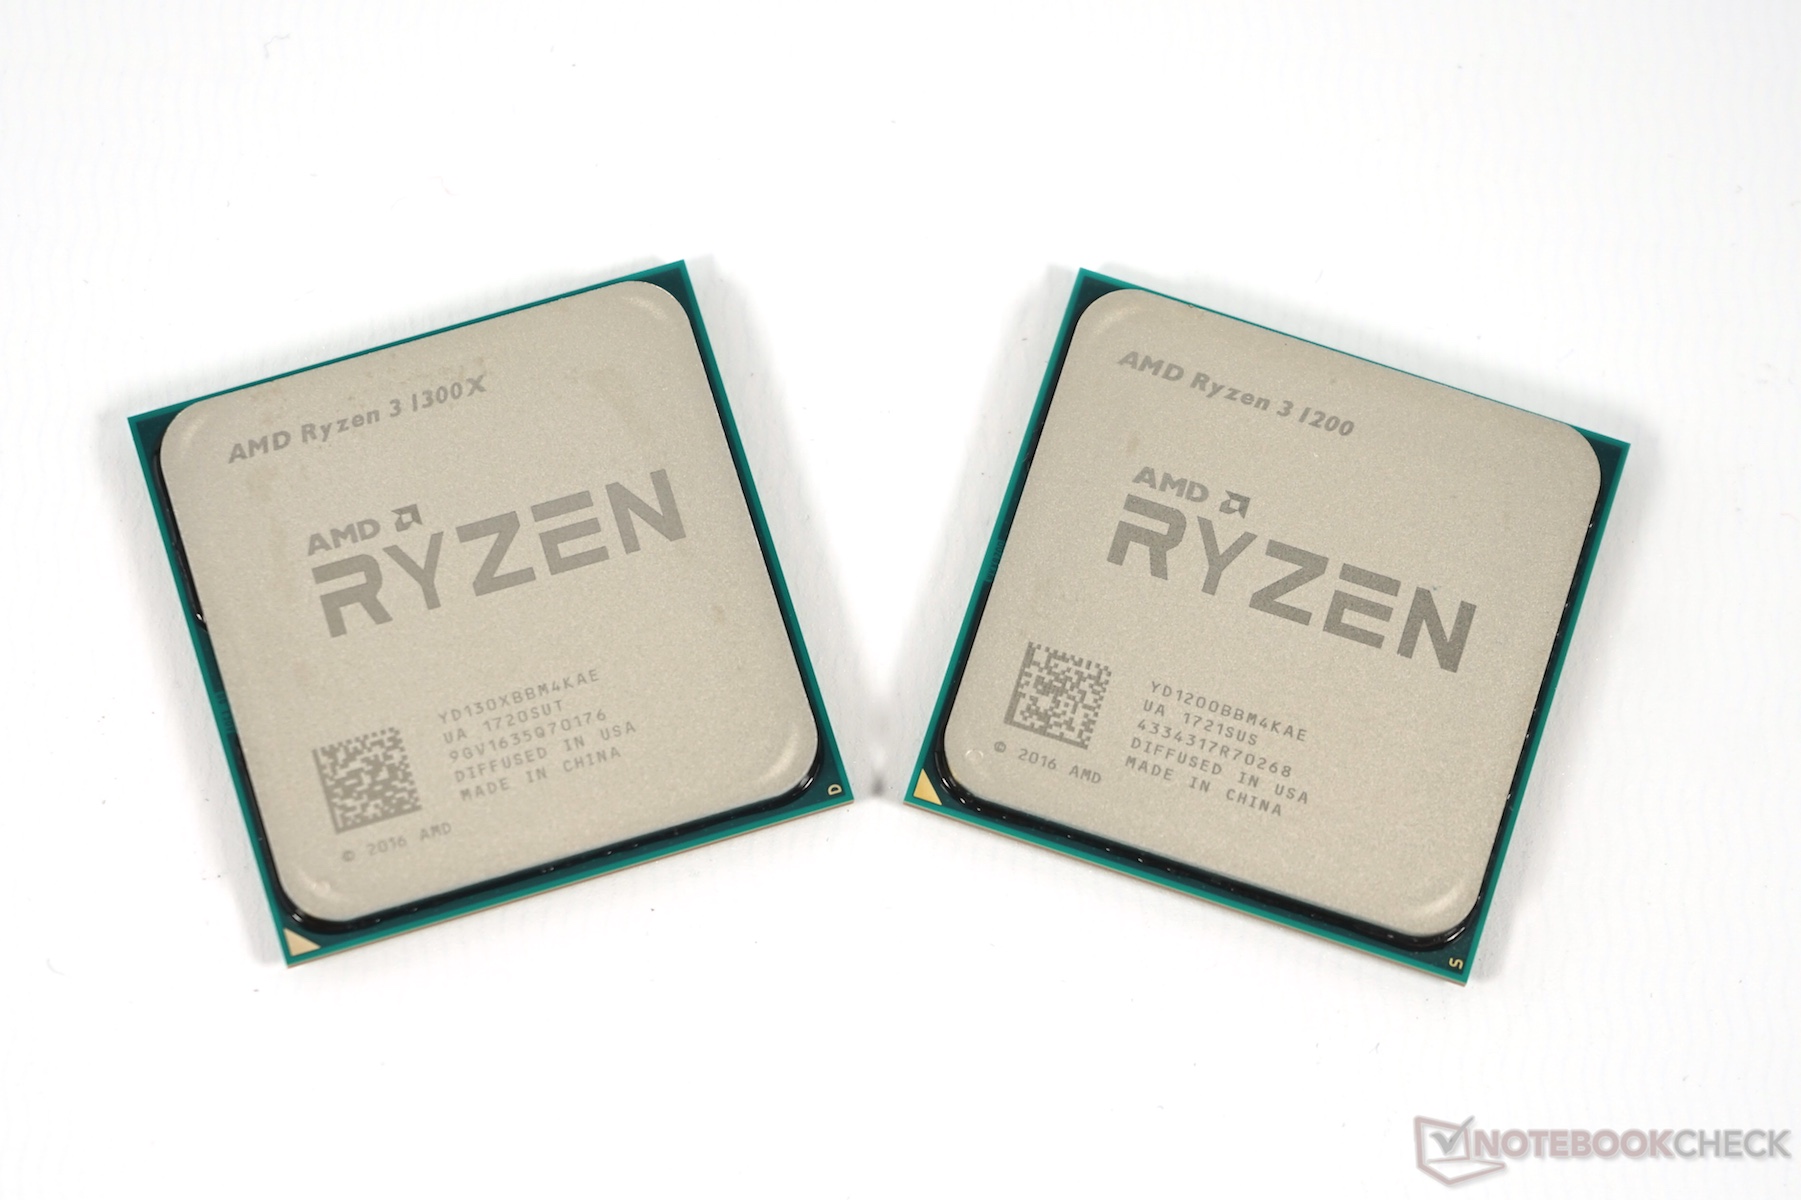
Ryzen 3 1200 and 1300X
Like all Ryzen CPUs, the 1200 and 1300X are based on AMD’s Zen architecture that has remained unchanged even for these entry-level microprocessors. As such, both are still based on the same symmetrical design that we have already reviewed in depth during our Ryzen 7 review. Compared to the higher-end models Ryzen 5 and 7, only two cores per cluster are enabled. Accordingly, even the low-end models get full access to all 24 PCIe 3.0 lanes and 8 MB of L3-cache. Thanks to the unlocked multiplier overclocking is still fairly straightforward.
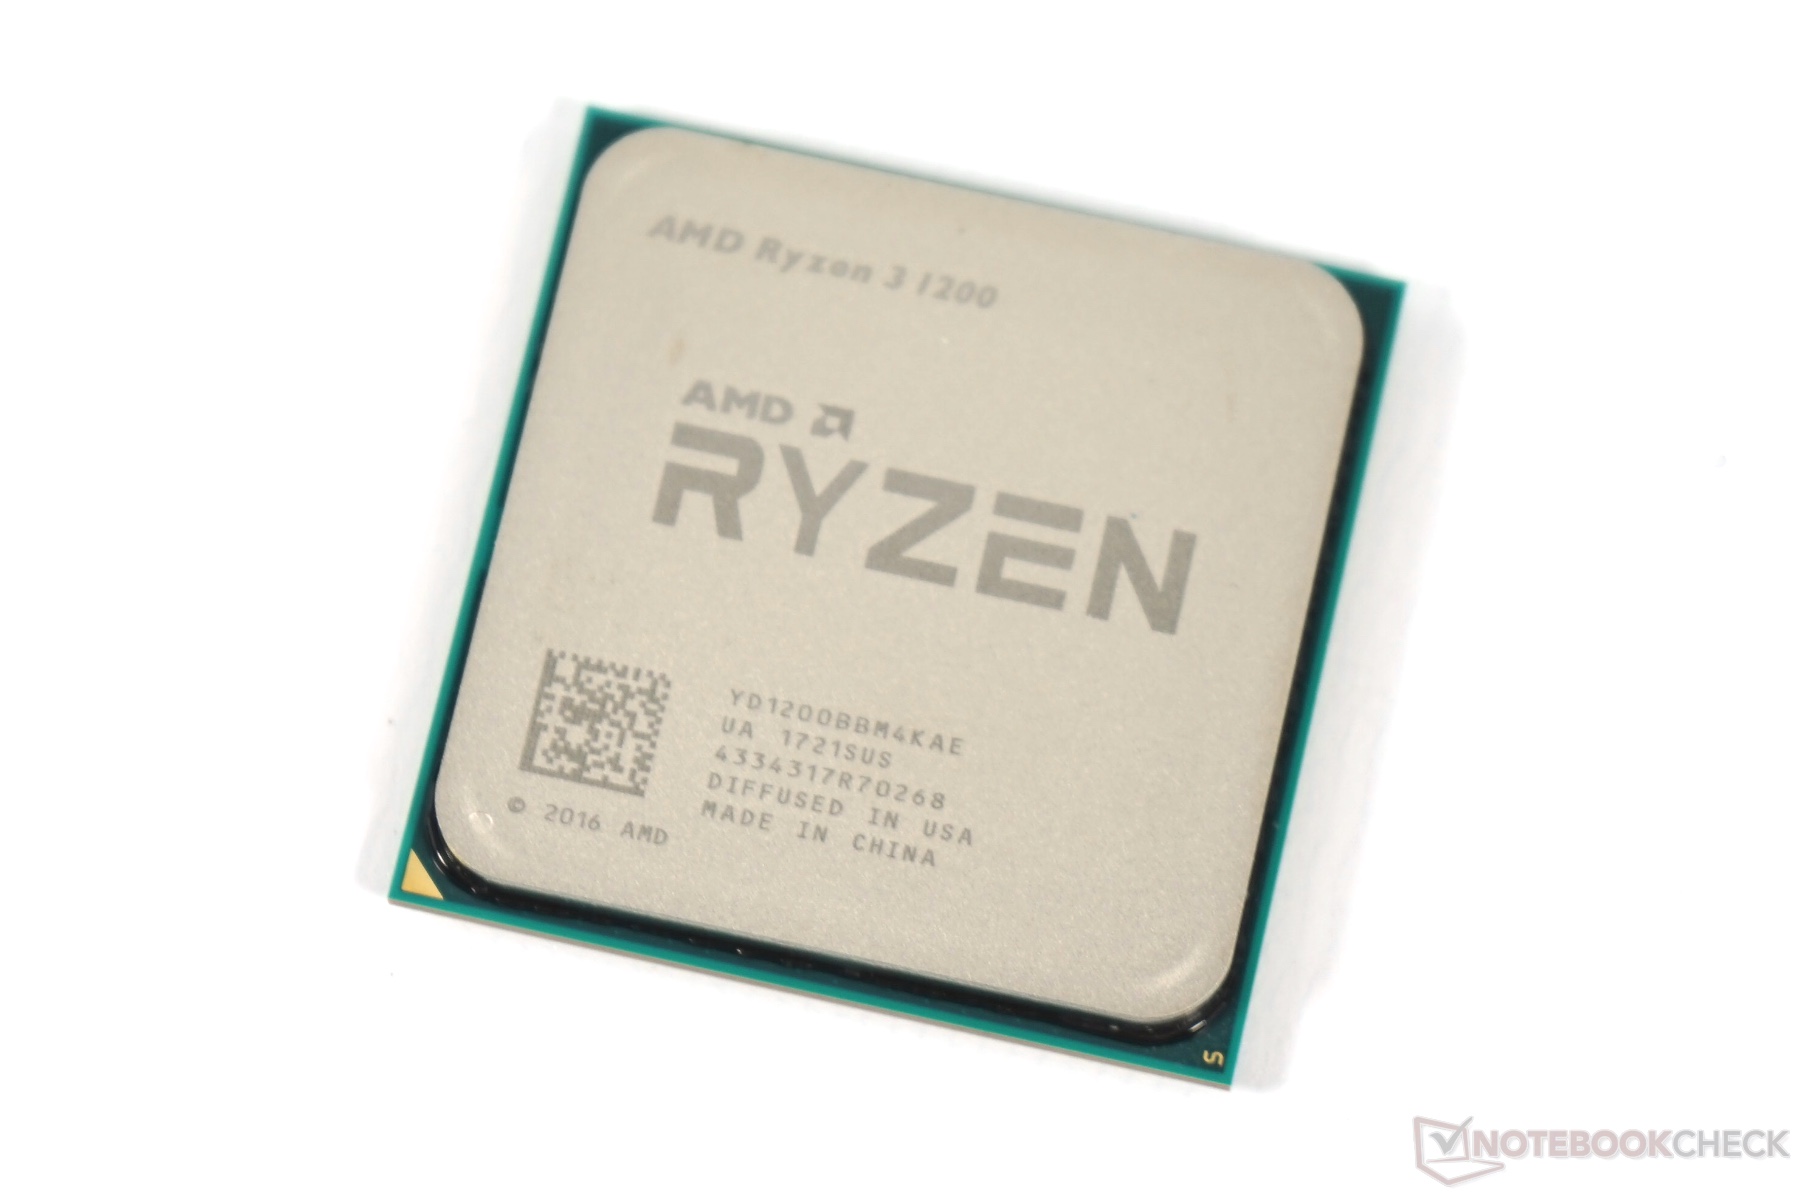
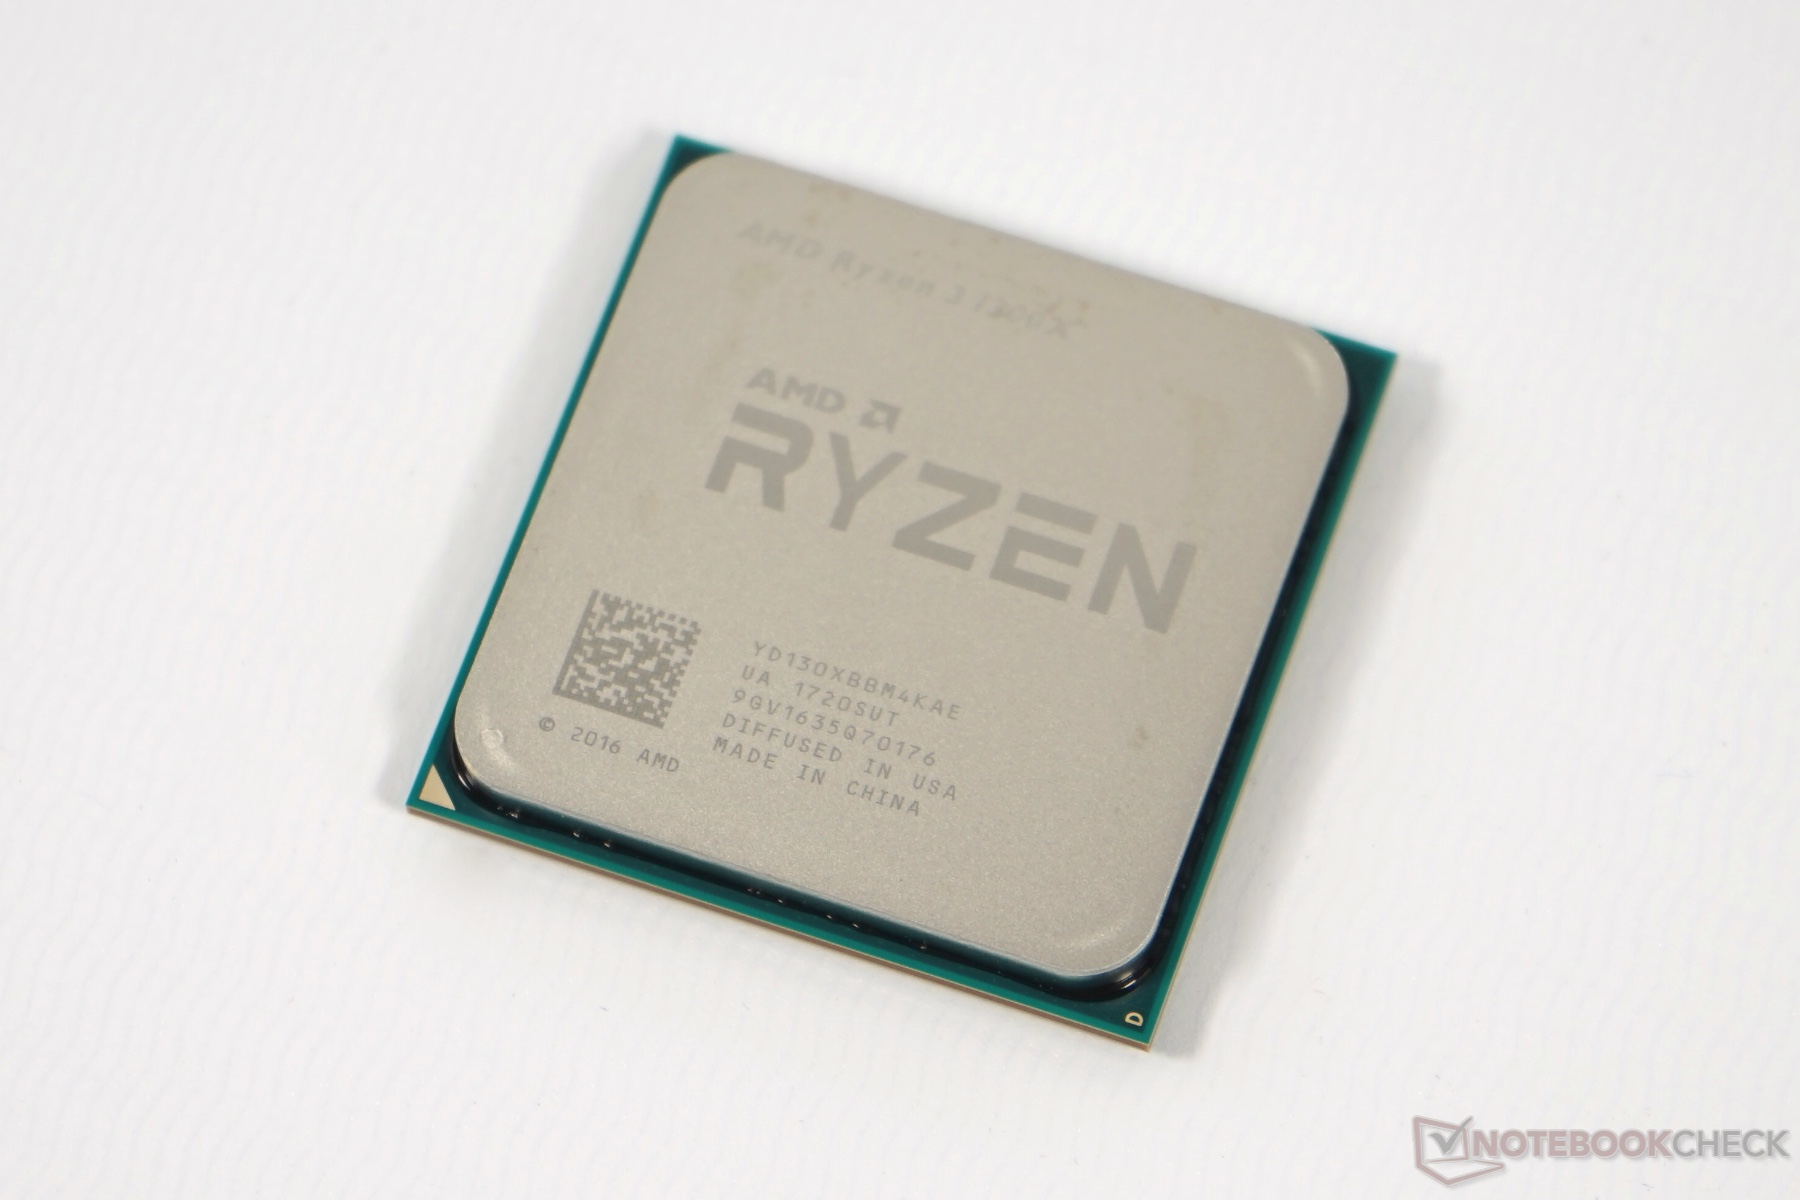
Selling for around $130, the Ryzen 3 1300X is clocked at 3.5 GHz with a maximum turbo boost of 3.9 GHz on a single, 3.7 GHz on two, and 3.6 GHz on three or more cores. Thus, its base clock speed is significantly higher than the Ryzen 5’s yet in return it has just four cores and threads in total. The $20 cheaper Ryzen 1200 is clocked at 3.1 GHz (turbo boosts of 3.45 GHz on one and 3.4 GHz on two cores) and both processors are rated at 65 W TDP.
Current Market Situation
Both Ryzen 3 models are positioned somewhere between the upper lower and the lower middle class of microprocessors. Traditionally dominated by Intel’s Core i3 lineup, this category also includes the $80 Pentium G4560; all of which are dual-core processors with SMT enabled and, not uncommon for Intel CPUs, fairly high clock speeds. And while SMT does improve performance noticeably, its benefits are far from doubling the available amount of physical cores. At least in optimized applications, that is.
Generally speaking even entry-level processors offer more than sufficient performance for everyday use even under more strenuous conditions. They are, however, no viable alternative for high-demand workstations for, say CAD rendering. Combined with a decent graphics card these affordable CPUs are even suitable for gaming, albeit restrictions apply in this case.
| Model | Cores - Threads | Base Clock | Turbo Boost (1-2 cores) | Turbo Boost (3 or more cores) | L3-Cache | TDP | Price |
| Ryzen 7 1700X | 8-16 | 3.4 GHz | 3.8 GHz | 3.5 GHz | 16 MB | 95 Watt | $300 |
| Ryzen 5 1500X | 4-8 | 3.5 GHz | 3.7 GHz | 3.6 GHz | 16 MB | 65 Watt | $160 |
| Ryzen 5 1400 | 4-8 | 3.2 GHz | 3.4 GHz | 3.2 GHz | 8 MB | 65 Watt | $150 |
| Ryzen 3 1300X | 4-4 | 3.4 GHz | 3.9/3.7 GHz | 3.6 GHz | 8 MB | 65 Watt | $130 |
| Ryzen 3 1200 | 4-4 | 3.1 GHz | 3.45/3.4 GHz | 3.1 GHz | 8 MB | 65 Watt | $110 |
| Pentium G4560 | 2-4 | 3.5 GHz | N/A | N/A | 3 MB | 54 Watt | $80 |
| Core i3-7100 | 2-4 | 3.9 GHz | N/A | N/A | 3 MB | 51 Watt | $120 |
Synthetic Benchmarks
Cinebench R15
Being an all-synthetic benchmark, Cinebench R15 allows for a quick and first assessment of a microprocessor’s raw computing prowess by throwing more than 200,000 polygons to render at it. It profits from high clock speeds and a high core count, and to a lesser degree also from large caches and Hyperthreading in the multi-thread test.
As expected, the Ryzen 3 1300X is faster than the Ryzen 5 1500X but slower than the 1600 in the single-thread test of this benchmark. However, it is outperformed by all of its relevant Intel-competitors. The high-end Ryzen 7 1800X is only 8 % faster, and the slower Ryzen 3 1200 is about as fast as the Ryzen 5 1400. The (much more expensive) Intel processors are faster in this test, even the Core i3-7100 manages to outperform AMD’s low-end offering.
In the multi-thread test of this benchmark, the new entry-level Ryzen CPUs are massively handicapped compared to their middle class and high-end brethren due to their lack of cores and threads. They even end up performing worse than AMD’s 2012-released FX-8350. However, this time Intel’s Core i7-7100 doesn’t stand a chance and is 13 % slower than even the Ryzen 3 1200.
| Cinebench R15 | |
| CPU Single 64Bit | |
| Intel Core i7-7740X | |
| Intel Core i7-7700K | |
| Intel Core i5-7600K | |
| Intel Core i7-6950X | |
| Intel Core i7-6950X | |
| AMD Ryzen 7 1800X | |
| AMD Ryzen 7 1700X | |
| AMD Ryzen 5 1500X | |
| AMD Ryzen 3 1300X | |
| Intel Core i7-7700HQ | |
| AMD Ryzen 5 1600 | |
| AMD Ryzen 7 1700 | |
| Intel Core i7-5960X | |
| Intel Core i3-7100 | |
| AMD Ryzen 5 1400 | |
| Intel Xeon E5-2697 v2 | |
| Intel Xeon E5-2680 v4 | |
| AMD FX-8350 | |
| CPU Multi 64Bit | |
| Intel Core i7-6950X | |
| Intel Xeon E5-2680 v4 | |
| AMD Ryzen 7 1800X | |
| AMD Ryzen 7 1700X | |
| Intel Xeon E5-2697 v2 | |
| AMD Ryzen 7 1700 | |
| Intel Core i7-5960X | |
| AMD Ryzen 5 1600 | |
| Intel Core i7-7740X | |
| Intel Core i7-7700K | |
| AMD Ryzen 5 1500X | |
| Intel Core i7-7700HQ | |
| AMD Ryzen 5 1400 | |
| Intel Core i5-7600K | |
| AMD FX-8350 | |
| AMD Ryzen 3 1300X | |
| Intel Core i3-7100 | |
Truecrypt
The benchmark included with Truecrypt measures a CPU’s performance by running multiple encryption algorithms. Not very likely to ever occur in the real world as such, this benchmark does offer a glimpse of real-world performance and a processor’s potential nevertheless. The encryption method in question is the Rijndael algorithm, which is better know under its three-letter acronym AES. It profits from a high core count and high frequencies.
And since today’s contestants are lacking in both departments they were not particularly fast in this test, at least when compared to their in-house competition. Compared to Intel’s i3-7100, the 1300X was quite a bit faster.
| Performance rating - Percent | |
| Intel Core i7-6950X | |
| AMD Ryzen 7 1800X | |
| Intel Xeon E5-2697 v2 | |
| AMD Ryzen 7 1700X | |
| Intel Xeon E5-2680 v4 | |
| Intel Core i7-5960X | |
| AMD Ryzen 5 1600 | |
| AMD Ryzen 5 1600 | |
| Intel Core i7-7740X | |
| Intel Core i7-7700K | |
| AMD Ryzen 5 1500X | |
| AMD Ryzen 5 1400 | |
| Intel Core i5-7600K | |
| AMD Ryzen 3 1300X | |
| AMD Ryzen 3 1200 | |
| TrueCrypt | |
| Serpent Mean 100MB | |
| Intel Core i7-6950X | |
| AMD Ryzen 7 1800X | |
| Intel Xeon E5-2697 v2 | |
| AMD Ryzen 7 1700X | |
| Intel Xeon E5-2680 v4 | |
| Intel Core i7-5960X | |
| AMD Ryzen 5 1600 | |
| AMD Ryzen 5 1600 | |
| Intel Core i7-7700K | |
| Intel Core i7-7740X | |
| AMD Ryzen 5 1500X | |
| AMD Ryzen 5 1400 | |
| Intel Core i5-7600K | |
| AMD Ryzen 3 1300X | |
| AMD Ryzen 3 1200 | |
| Twofish Mean 100MB | |
| Intel Core i7-6950X | |
| Intel Xeon E5-2697 v2 | |
| AMD Ryzen 7 1800X | |
| Intel Xeon E5-2680 v4 | |
| AMD Ryzen 7 1700X | |
| Intel Core i7-5960X | |
| AMD Ryzen 5 1600 | |
| AMD Ryzen 5 1600 | |
| Intel Core i7-7740X | |
| Intel Core i7-7700K | |
| AMD Ryzen 5 1500X | |
| AMD Ryzen 5 1400 | |
| Intel Core i5-7600K | |
| AMD Ryzen 3 1300X | |
| AMD Ryzen 3 1200 | |
| AES Mean 100MB | |
| Intel Core i7-6950X | |
| AMD Ryzen 7 1800X | |
| Intel Xeon E5-2680 v4 | |
| AMD Ryzen 7 1700X | |
| Intel Xeon E5-2697 v2 | |
| Intel Core i7-5960X | |
| AMD Ryzen 5 1600 | |
| Intel Core i7-7740X | |
| Intel Core i7-7700K | |
| AMD Ryzen 5 1600 | |
| AMD Ryzen 5 1500X | |
| AMD Ryzen 5 1400 | |
| Intel Core i5-7600K | |
| AMD Ryzen 3 1300X | |
| AMD Ryzen 3 1200 | |
wPrime
wPrime uses Newton’s method for estimating functions in order to calculate square roots, verifying the results by squaring them, and comparing the result with the original input. This highly iterative algorithm profits from a high core count, and is as such fairly similar to the Truecrypt benchmark.
And once again the two entry-level Ryzen CPUs are not particularly fast. Intel’s Core i5-7600K is 22 % faster than the 1300X. Compared to its bigger brother, the Ryzen 5 1600, the 1300X is 162 % slower, which is proof for the Zen architecture’s excellent scaling.
| wPrime 2.10 | |
| 1024m | |
| Intel Xeon E5-2697 v2 | |
| AMD Ryzen 3 1200 | |
| AMD Ryzen 3 1300X | |
| Intel Core i5-7600K | |
| AMD Ryzen 5 1400 | |
| AMD Ryzen 5 1500X | |
| Intel Core i7-7700K | |
| Intel Core i7-7740X | |
| Intel Core i7-5960X | |
| AMD Ryzen 7 1700X | |
| AMD Ryzen 7 1800X | |
| Intel Core i7-6950X | |
| 32m | |
| AMD Ryzen 3 1200 | |
| Intel Xeon E5-2697 v2 | |
| AMD Ryzen 3 1300X | |
| Intel Core i5-7600K | |
| AMD Ryzen 5 1400 | |
| AMD Ryzen 5 1500X | |
| Intel Core i7-7700K | |
| Intel Core i7-7740X | |
| Intel Core i7-5960X | |
| AMD Ryzen 7 1700X | |
| AMD Ryzen 7 1800X | |
| Intel Core i7-6950X | |
* ... smaller is better
Other Synthetic Benchmarks
We won’t analyze and discuss the following benchmarks in detail. All we can say is that they serve to reinforce our hitherto observations. Unfortunately, WinRAR tends to be very unreliable on some CPUs, and returns reproducibly incomprehensible results.
| Geekbench 4.0 | |
| 64 Bit Single-Core Score | |
| Intel Core i7-7740X | |
| Intel Core i7-7700K | |
| Intel Core i5-7600K | |
| AMD Ryzen 7 1800X | |
| AMD Ryzen 7 1700X | |
| Intel Core i7-7700HQ | |
| AMD Ryzen 3 1300X | |
| AMD Ryzen 7 1700 | |
| AMD Ryzen 5 1500X | |
| AMD Ryzen 5 1600 | |
| Intel Core i7-6950X | |
| Intel Core i7-5960X | |
| AMD Ryzen 5 1400 | |
| AMD Ryzen 3 1200 | |
| Intel Xeon E5-2680 v4 | |
| 64 Bit Multi-Core Score | |
| Intel Core i7-6950X | |
| Intel Core i7-5960X | |
| AMD Ryzen 7 1800X | |
| Intel Xeon E5-2680 v4 | |
| AMD Ryzen 7 1700X | |
| AMD Ryzen 7 1700 | |
| Intel Core i7-7740X | |
| AMD Ryzen 5 1600 | |
| Intel Core i7-7700K | |
| Intel Core i5-7600K | |
| AMD Ryzen 5 1500X | |
| Intel Core i7-7700HQ | |
| AMD Ryzen 5 1400 | |
| AMD Ryzen 3 1300X | |
| AMD Ryzen 3 1200 | |
| WinRAR - Result | |
| Intel Core i7-6950X | |
| Intel Xeon E5-2697 v2 | |
| Intel Core i7-5960X | |
| Intel Core i7-7740X | |
| Intel Xeon E5-2680 v4 | |
| Intel Core i7-7700K | |
| AMD Ryzen 7 1800X | |
| AMD Ryzen 7 1700X | |
| AMD Ryzen 5 1500X | |
| AMD Ryzen 5 1600 | |
| Intel Core i5-7600K | |
| AMD Ryzen 5 1400 | |
| AMD Ryzen 3 1300X | |
| AMD Ryzen 3 1200 | |
| X264 HD Benchmark 4.0 | |
| Pass 1 | |
| Intel Core i7-7740X | |
| Intel Core i7-7700K | |
| Intel Core i5-7600K | |
| Intel Core i7-6950X | |
| AMD Ryzen 7 1800X | |
| Intel Core i7-5960X | |
| AMD Ryzen 7 1700X | |
| AMD Ryzen 3 1300X | |
| AMD Ryzen 5 1600 | |
| AMD Ryzen 5 1500X | |
| Intel Xeon E5-2697 v2 | |
| AMD Ryzen 3 1200 | |
| AMD Ryzen 5 1400 | |
| Intel Xeon E5-2680 v4 | |
| Pass 2 | |
| Intel Core i7-6950X | |
| AMD Ryzen 7 1800X | |
| AMD Ryzen 7 1700X | |
| Intel Xeon E5-2697 v2 | |
| Intel Core i7-5960X | |
| Intel Xeon E5-2680 v4 | |
| AMD Ryzen 5 1600 | |
| Intel Core i7-7740X | |
| Intel Core i7-7700K | |
| AMD Ryzen 5 1500X | |
| Intel Core i5-7600K | |
| AMD Ryzen 5 1400 | |
| AMD Ryzen 3 1300X | |
| AMD Ryzen 3 1200 | |
| PCMark 8 | |
| Home Score Accelerated v2 | |
| Intel Core i7-7740X | |
| Intel Core i7-7700K | |
| Intel Core i5-7600K | |
| AMD Ryzen 7 1800X | |
| AMD Ryzen 5 1500X | |
| Intel Core i7-4790K | |
| AMD Ryzen 7 1700X | |
| AMD Ryzen 3 1300X | |
| AMD Ryzen 7 1700 | |
| AMD Ryzen 5 1600 | |
| AMD Ryzen 5 1400 | |
| Intel Core i7-6950X | |
| AMD Ryzen 3 1200 | |
| Intel Core i7-5960X | |
| Intel Core i7-7700HQ | |
| Intel Xeon E5-2697 v2 | |
| Work Score Accelerated v2 | |
| Intel Core i7-7700HQ | |
| Intel Core i7-7700K | |
| Intel Core i7-7740X | |
| AMD Ryzen 5 1500X | |
| Intel Xeon E5-2697 v2 | |
| AMD Ryzen 7 1800X | |
| AMD Ryzen 7 1700X | |
| Intel Core i7-6950X | |
| AMD Ryzen 5 1600 | |
| Intel Core i7-5960X | |
| AMD Ryzen 3 1200 | |
| AMD Ryzen 7 1700 | |
| AMD Ryzen 5 1400 | |
| 3DMark | |
| 1920x1080 Fire Strike Physics | |
| Intel Core i7-6950X | |
| AMD Ryzen 7 1800X | |
| AMD Ryzen 7 1700X | |
| Intel Core i7-5960X | |
| AMD Ryzen 7 1700 | |
| Intel Xeon E5-2697 v2 | |
| Intel Xeon E5-2680 v4 | |
| AMD Ryzen 5 1600 | |
| Intel Core i7-7740X | |
| Intel Core i7-7700K | |
| Intel Core i7-4790K | |
| AMD Ryzen 5 1400 | |
| Intel Core i7-7700HQ | |
| Intel Core i5-7600K | |
| AMD Ryzen 3 1200 | |
| 2560x1440 Time Spy CPU | |
| Intel Core i7-6950X | |
| Intel Xeon E5-2680 v4 | |
| AMD Ryzen 7 1800X | |
| Intel Core i7-5960X | |
| AMD Ryzen 7 1700X | |
| AMD Ryzen 7 1700X | |
| AMD Ryzen 7 1700 | |
| Intel Core i7-7740X | |
| AMD Ryzen 5 1600 | |
| Intel Core i7-7700K | |
| Intel Core i7-4790K | |
| Intel Core i7-7700HQ | |
| Intel Core i5-7600K | |
| AMD Ryzen 5 1500X | |
| AMD Ryzen 5 1400 | |
| AMD Ryzen 3 1200 | |
| 3DMark 11 - 1280x720 Performance Physics | |
| Intel Core i7-6950X | |
| Intel Core i7-5960X | |
| AMD Ryzen 7 1800X | |
| Intel Xeon E5-2697 v2 | |
| AMD Ryzen 7 1700 | |
| Intel Xeon E5-2680 v4 | |
| Intel Core i7-7740X | |
| Intel Core i7-7700K | |
| AMD Ryzen 5 1600 | |
| Intel Core i7-4790K | |
| AMD Ryzen 5 1500X | |
| Intel Core i7-7700HQ | |
| AMD Ryzen 5 1400 | |
| AMD Ryzen 3 1300X | |
| AMD Ryzen 3 1200 | |
| 3DMark 06 - CPU - CPU Score | |
| Intel Core i7-6950X | |
| Intel Core i7-7740X | |
| Intel Core i7-7700K | |
| Intel Core i7-5960X | |
| AMD Ryzen 7 1700 | |
| Intel Xeon E5-2697 v2 | |
| Intel Core i5-7600K | |
| AMD Ryzen 5 1600 | |
| Intel Xeon E5-2680 v4 | |
| Intel Core i7-7700HQ | |
| AMD Ryzen 5 1500X | |
| AMD Ryzen 5 1400 | |
| AMD Ryzen 3 1300X | |
| AMD Ryzen 3 1200 | |
Preliminary Verdict
So far, the synthetic benchmarks show a significant expansion of AMD’s Zen architecture in both price and performance range. The lack of Simultaneous Multithreading becomes painfully obvious when compared to the Ryzen 5 1400. You might end up saving $20 but the more expensive processor might turn out to be significantly more future-proof in the end. As expected, the Ryzen 3 1200 is a little bit slower than the 1300X, however it is much faster than Intel’s Core i3-7100.
Gaming Benchmarks
Test System
Due to the contestants’ comparatively low raw performance we don’t expect a less powerful graphics card to ever become the system’s primary bottleneck. Nevertheless, for the sake of comparison we have paired both, the 1300X and the 1200, with the fastest currently available GPU: Nvidia’s GeForce GTX 1080. Mounted on an Asus Crosshair VI X370 and equipped with DDR4-2933 RAM, the processors were already overclocked as per official specification (fastest officially supported memory speed: DDR4-2677).
Frame Rates
Unsurprisingly, both CPUs were comparatively slow when running For Honor in low resolution and with low details, a benchmark scenario that puts more strain on the CPU than on the GPU. As a result, average frame rates were 21 and 26 percent lower than on the Ryzen 5 1400. In Farming Simulator 17, where a microprocessor’s performance can be assessed even in high details, the Ryzen 3 1300X managed to outperform the 1400 in average frame rates but had a significantly lower minimum frame rate.
The most important benchmark for us is The Witcher 3 at a resolution of 1024 x 768 and low details. In this test, both Ryzen 3 contenders do very poorly compared to the Ryzen 5 1400 in both, minimum and average frame rate.
| Farming Simulator 17 - 3840x2160 High Preset AA:2xMS AF:2x | |
| Intel Core i7-7740X | |
| Intel Core i7-6950X | |
| Intel Core i5-7600K | |
| Intel Core i7-4790K | |
| Intel Core i7-7700K | |
| AMD Ryzen 5 1500X | |
| Intel Core i7-5960X | |
| AMD Ryzen 7 1800X | |
| AMD Ryzen 5 1600 | |
| AMD Ryzen 7 1700 | |
| Intel Xeon E5-2680 v4 | |
| AMD Ryzen 3 1300X | |
| AMD Ryzen 5 1400 | |
| AMD Ryzen 3 1200 | |
| The Witcher 3 | |
| 1920x1080 Ultra Graphics & Postprocessing (HBAO+) | |
| Intel Core i7-7740X | |
| Intel Core i7-7700K | |
| Intel Core i7-6950X | |
| Intel Core i7-4790K | |
| AMD Ryzen 7 1700 | |
| AMD Ryzen 7 1800X | |
| AMD Ryzen 3 1200 | |
| AMD Ryzen 5 1500X | |
| AMD Ryzen 5 1400 | |
| AMD Ryzen 5 1600 | |
| Intel Xeon E5-2680 v4 | |
| 1024x768 Low Graphics & Postprocessing | |
| Intel Core i7-7740X | |
| Intel Core i7-4790K | |
| Intel Core i7-6950X | |
| Intel Core i7-7700K | |
| AMD Ryzen 7 1800X | |
| AMD Ryzen 7 1700 | |
| Intel Xeon E5-2680 v4 | |
| AMD Ryzen 5 1600 | |
| AMD Ryzen 5 1500X | |
| AMD Ryzen 5 1400 | |
| AMD Ryzen 3 1300X | |
| AMD Ryzen 3 1200 | |
| For Honor | |
| 3840x2160 High Preset AA:T AF:8x | |
| Intel Xeon E5-2680 v4 | |
| Intel Core i7-7700K | |
| Intel Core i7-7740X | |
| Intel Core i7-6950X | |
| AMD Ryzen 7 1700 | |
| Intel Core i5-7600K | |
| AMD Ryzen 5 1500X | |
| AMD Ryzen 3 1200 | |
| AMD Ryzen 5 1400 | |
| AMD Ryzen 3 1300X | |
| AMD Ryzen 5 1600 | |
| Intel Core i7-4790K | |
| AMD Ryzen 7 1800X | |
| Intel Core i7-5960X | |
| 1280x720 Low Preset | |
| Intel Core i7-7740X | |
| Intel Core i7-7700K | |
| Intel Core i7-4790K | |
| AMD Ryzen 5 1500X | |
| Intel Core i5-7600K | |
| AMD Ryzen 5 1600 | |
| Intel Xeon E5-2680 v4 | |
| AMD Ryzen 5 1400 | |
| AMD Ryzen 7 1800X | |
| Intel Core i7-5960X | |
| AMD Ryzen 7 1700 | |
| AMD Ryzen 3 1300X | |
| AMD Ryzen 3 1200 | |
| Intel Core i7-6950X | |
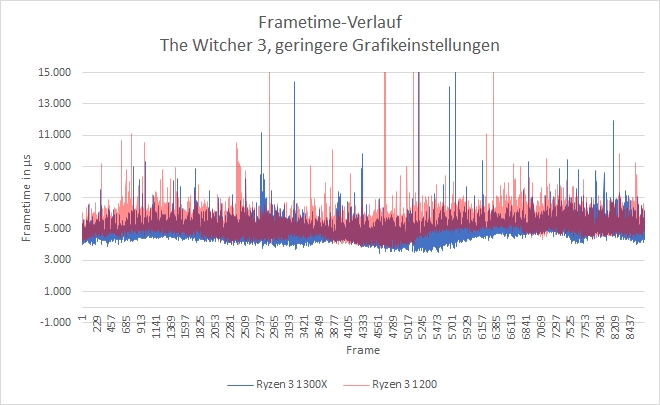
Frame Time Analysis
The frame time analysis for both new Ryzen 3 processors turned out conspicuously inconspicuous. While neither of them managed to achieve the Ryzen 5 1500X’s frame rates we found no noticeable deviations worth mentioning. Accordingly, frame rate stability was very good. Translated into real world experience, this means they both offer sufficient performance for gaming purposes. In most cases, the GPU is going to become the bottleneck instead.
| Model | Ryzen 5 1500X | Ryzen 3 1200 | Ryzen 3 1300X |
| Frametime (Median, in µs) | 3,965 | 5,300 | 4,841 |
| min. 20 % deviation | 2.463% | 3.545% | 5.616 |
| min. 50 % deviation | 0.246% | 0.336% | 0.391% |
| min. 100 % deviation | 0.061% | 0.103% | 0.077% |
| min. 300 % deviation | 0.007% | 0.019% | 0.000% |
Energy Efficiency
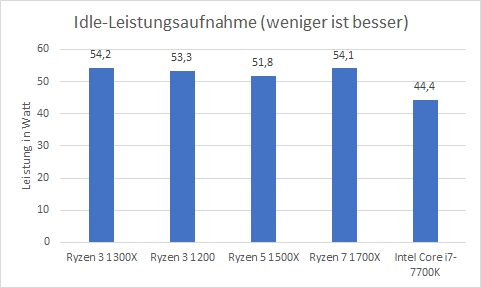
Power consumption is measured at the outlet and is therefore the sum of all components - motherboard, CPU, and hard disk drive. Accordingly, the significance in regard to microprocessor-specific power consumption is rather limited.
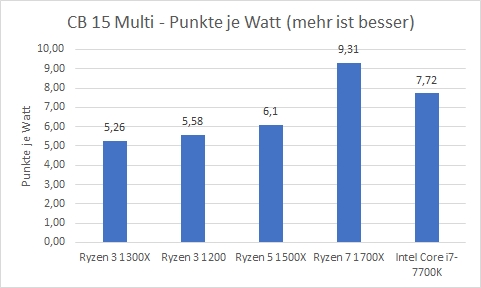
Once again, both Ryzen CPUs were fairly unremarkable, and as expected the Ryzen 3 1200 was ever so slightly more efficient than the 1300X. However, both were less efficient than expected under load: while the delta between the two and the Ryzen 5 1500X was fairly small, the Ryzen 7 1700X and Core i7-7700K had a much better points-per-watt ratio.
We also ran a second series of benchmarks using the new Seasonic Focus+ Platinum 850 W power supply, and noticed a significantly lower power consumption. When idle, both Ryzen 3 processors as well as the Ryzen 7 1700X dropped to 47-48 W. Under load, power consumption was around 5-10 W lower than before.
Verdict

Both new Ryzen 3 processors, the 1300X and the 1200, are very affordable quad-core CPUs for all intents and purposes. AMD’s biggest advantage is the fact that Intel does not offer any quad-core processors in this price range whatsoever. In our personal view, four physical cores are the advisable minimum for 2017 not only because of higher sustainability in the long run but also because of the immediate advantages available today. Combined with a cheap B350 mainboard both CPUs can be easily overclocked thanks to their unlocked multipliers.
Those on a very tight budget might want to take a closer look at the G4560 despite the fact that AMD’s AM4 platform is much more future-proof. Due to their lack of integrated graphics Zen-based CPUs may not yet be the best choice when it comes to pure office/business or multimedia demands. The extra graphics card required in this case might make the resulting PC more expensive than a comparable Intel design.
In the very near future, AMD’s mobile Ryzen APUs combining a Zen CPU with a Vega GPU are going to address this issue in the mobile devices segment, and we expect corresponding desktop APUs next year.
Review Samples
The samples for this review have been provided mostly by AMD (Ryzen CPUs, Asus motherboard, memory kit, Noctua cooler). The Core i7-6950X and i7-5960X have been provided by Intel, the X99-E motherboard has been provided by Asus. Noctua has provided us with an NH-U12S cooler for the AM4 and the X99 motherboard. Special thanks go to PCO Computer Handels GmbH for providing is with a Core i7-7700K, 7600K, memory kit, and a Gigabyte motherboard on very short notice. The power-efficient 850 Watt Focus+ Platinum power supply was provided by Seasonic.