MSI CX62 7QL Notebook Review
We had a close look at the budget 17.3-inch CX72 late last year as it was one of our first models with the Kaby Lake i7-7200U CPU and GeForce 940MX GPU. Now, our latest unit from MSI is the 15.6-inch version of the very same CX series. The CX62 is a near carbon copy of the budget GP62 gaming system with lower specced internals for a more affordable starting price of $800 USD. This puts the notebooks in the same price range as many mainstream multimedia solutions including the HP Pavilion 15, Acer Aspire V15, and the Lenovo Ideapad 510.
We recommend checking out our full reviews on the GP62, GL62, and GE62 series for more information on the chassis and its overall features.
Case
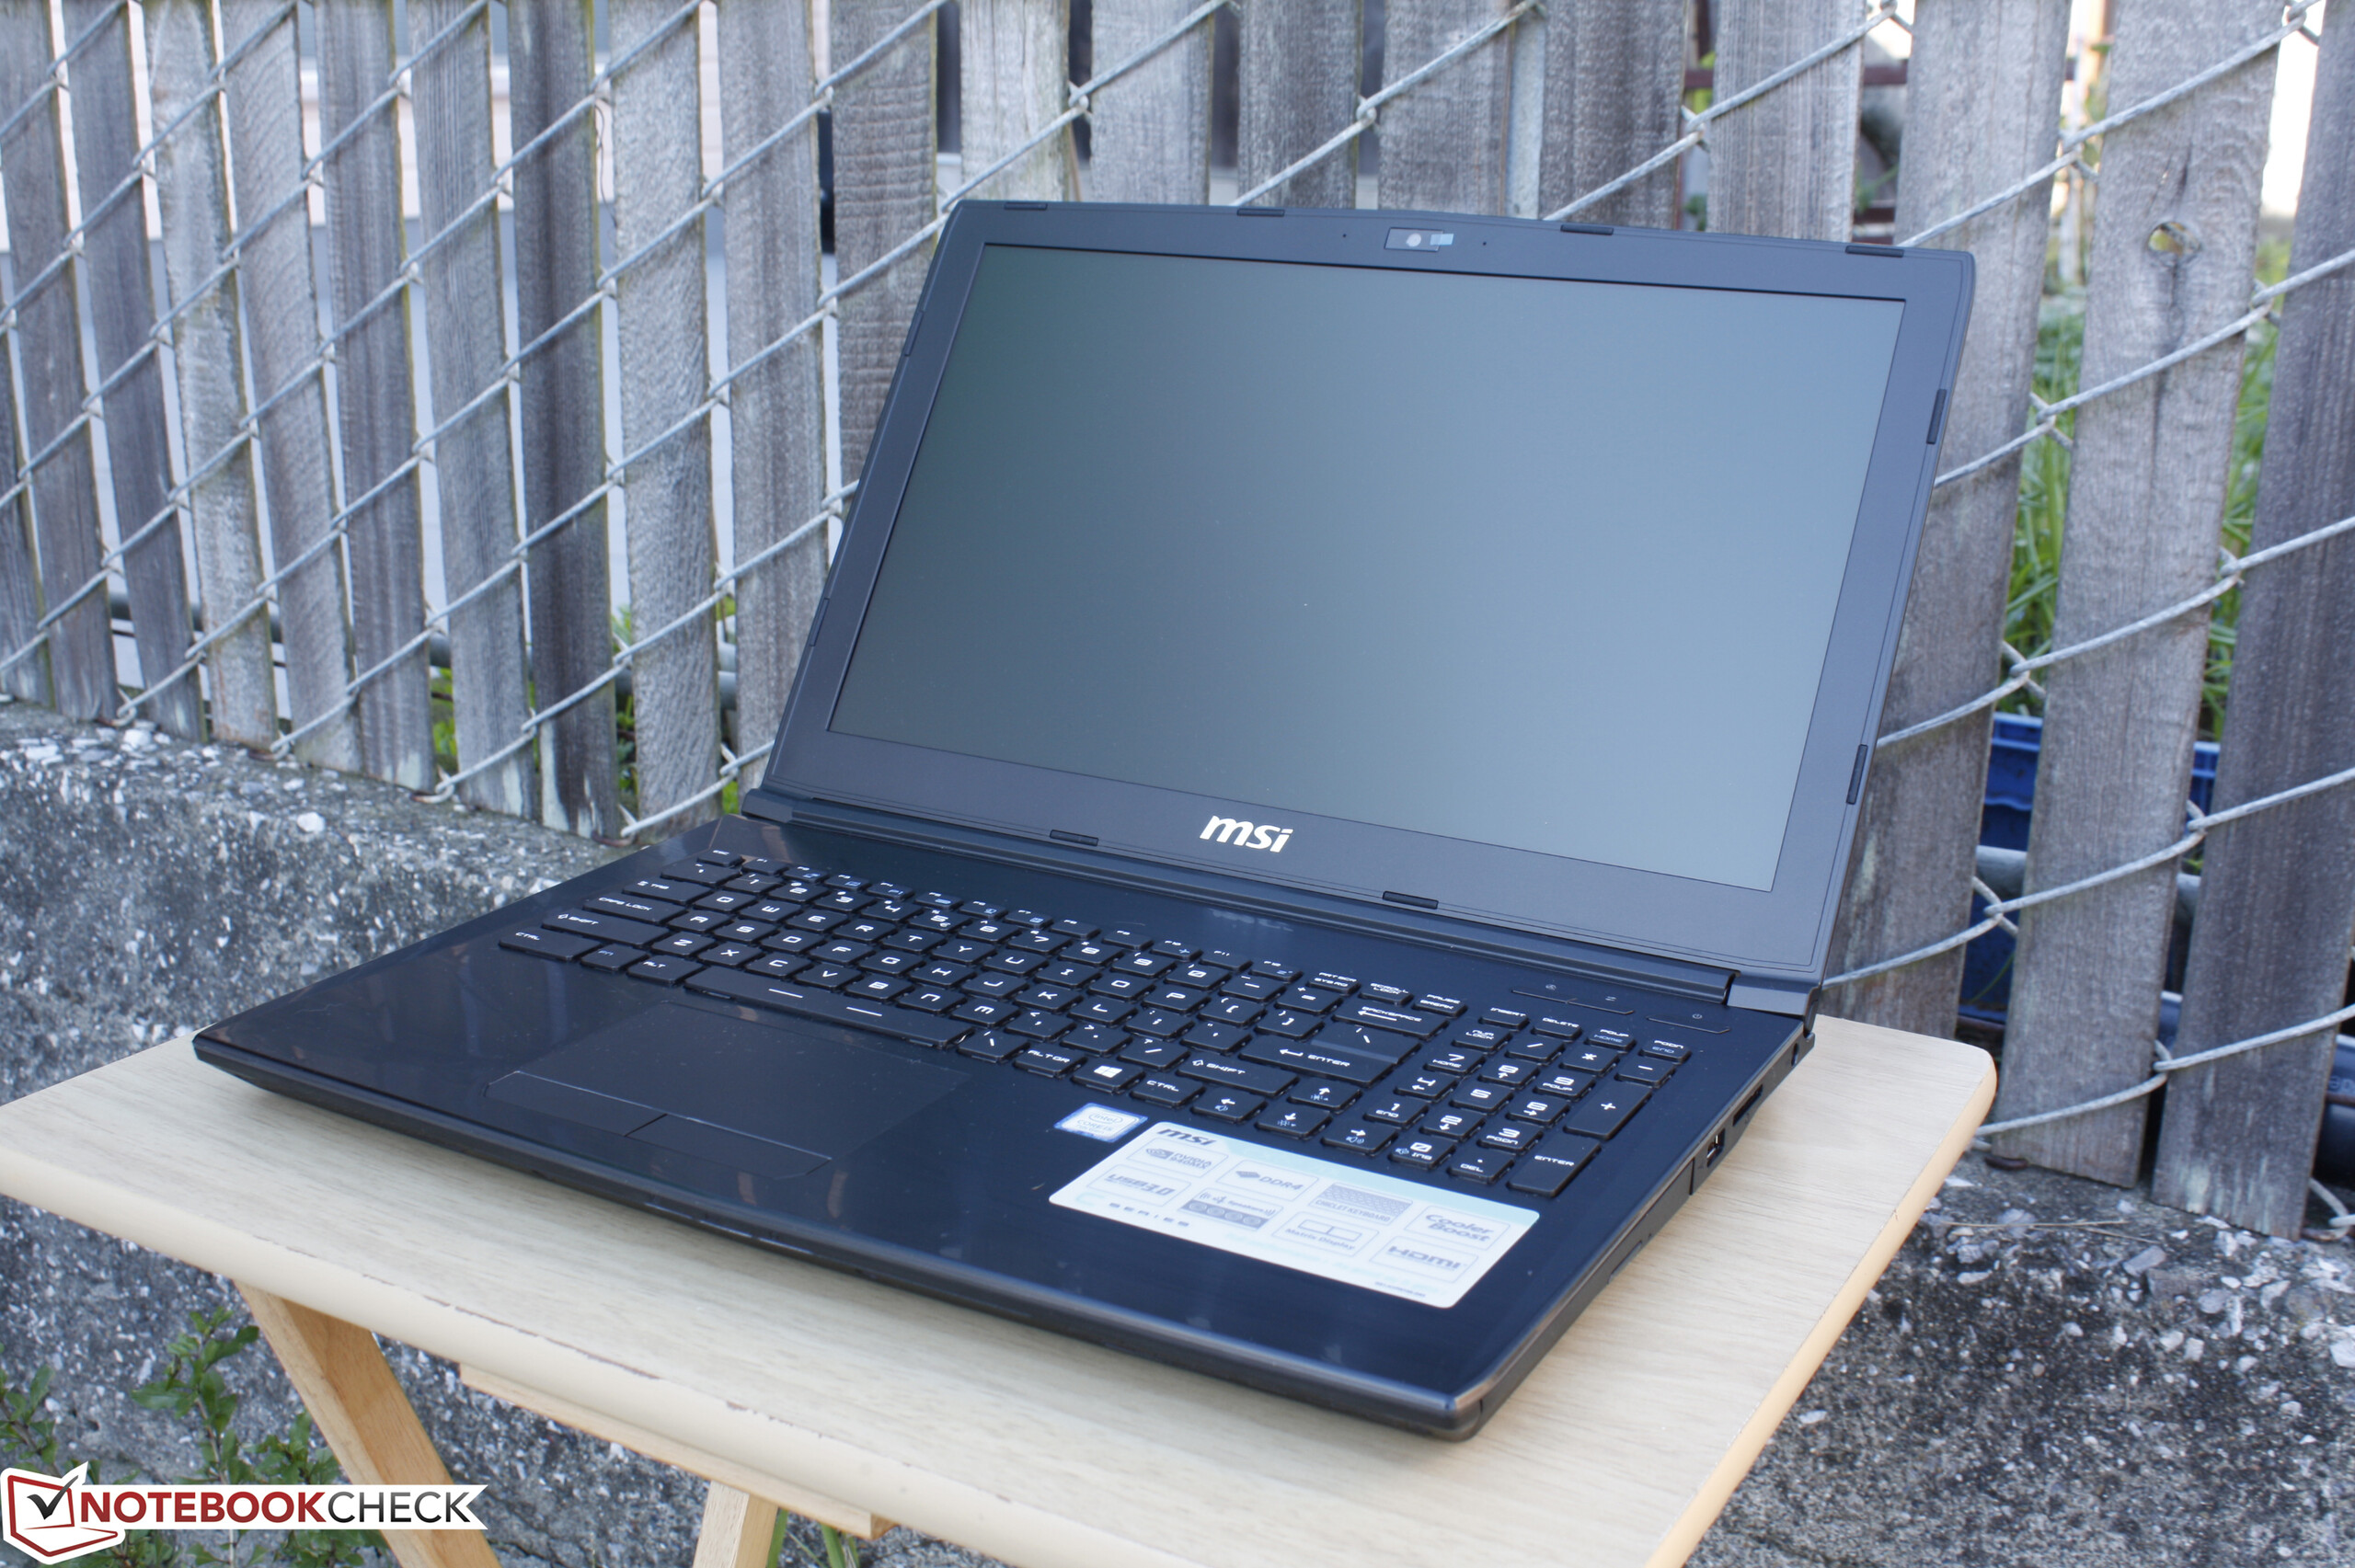
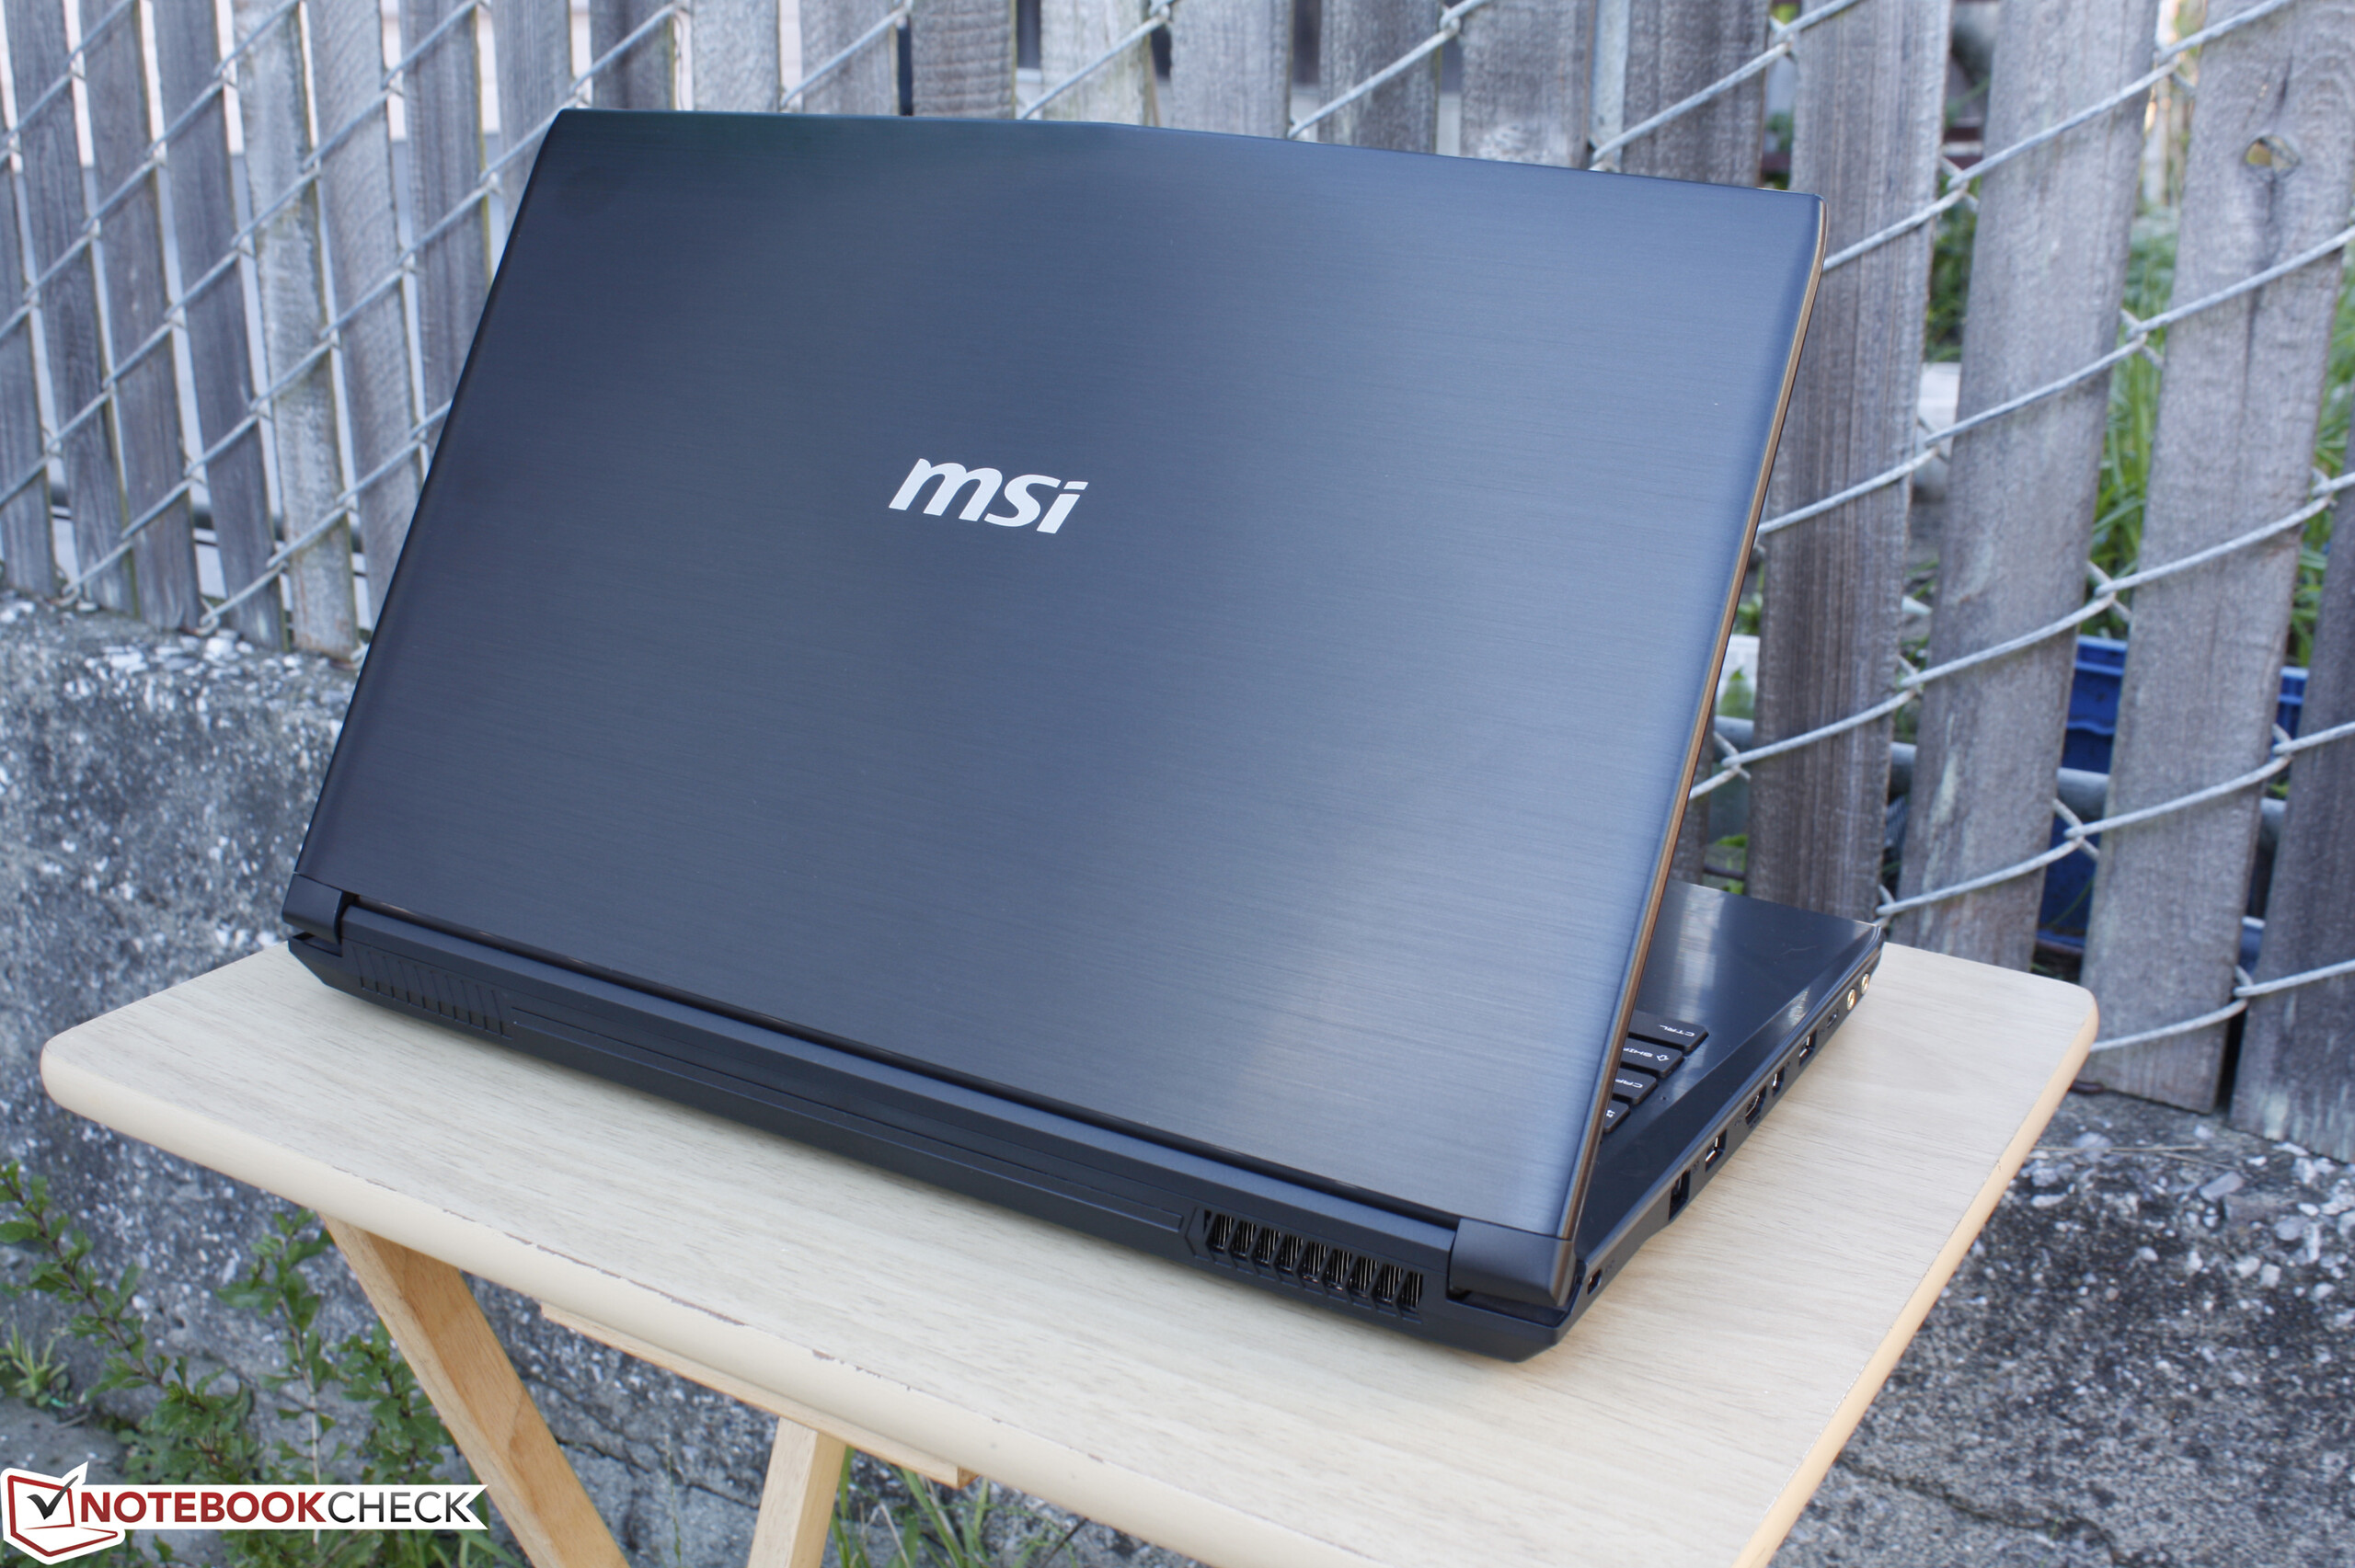
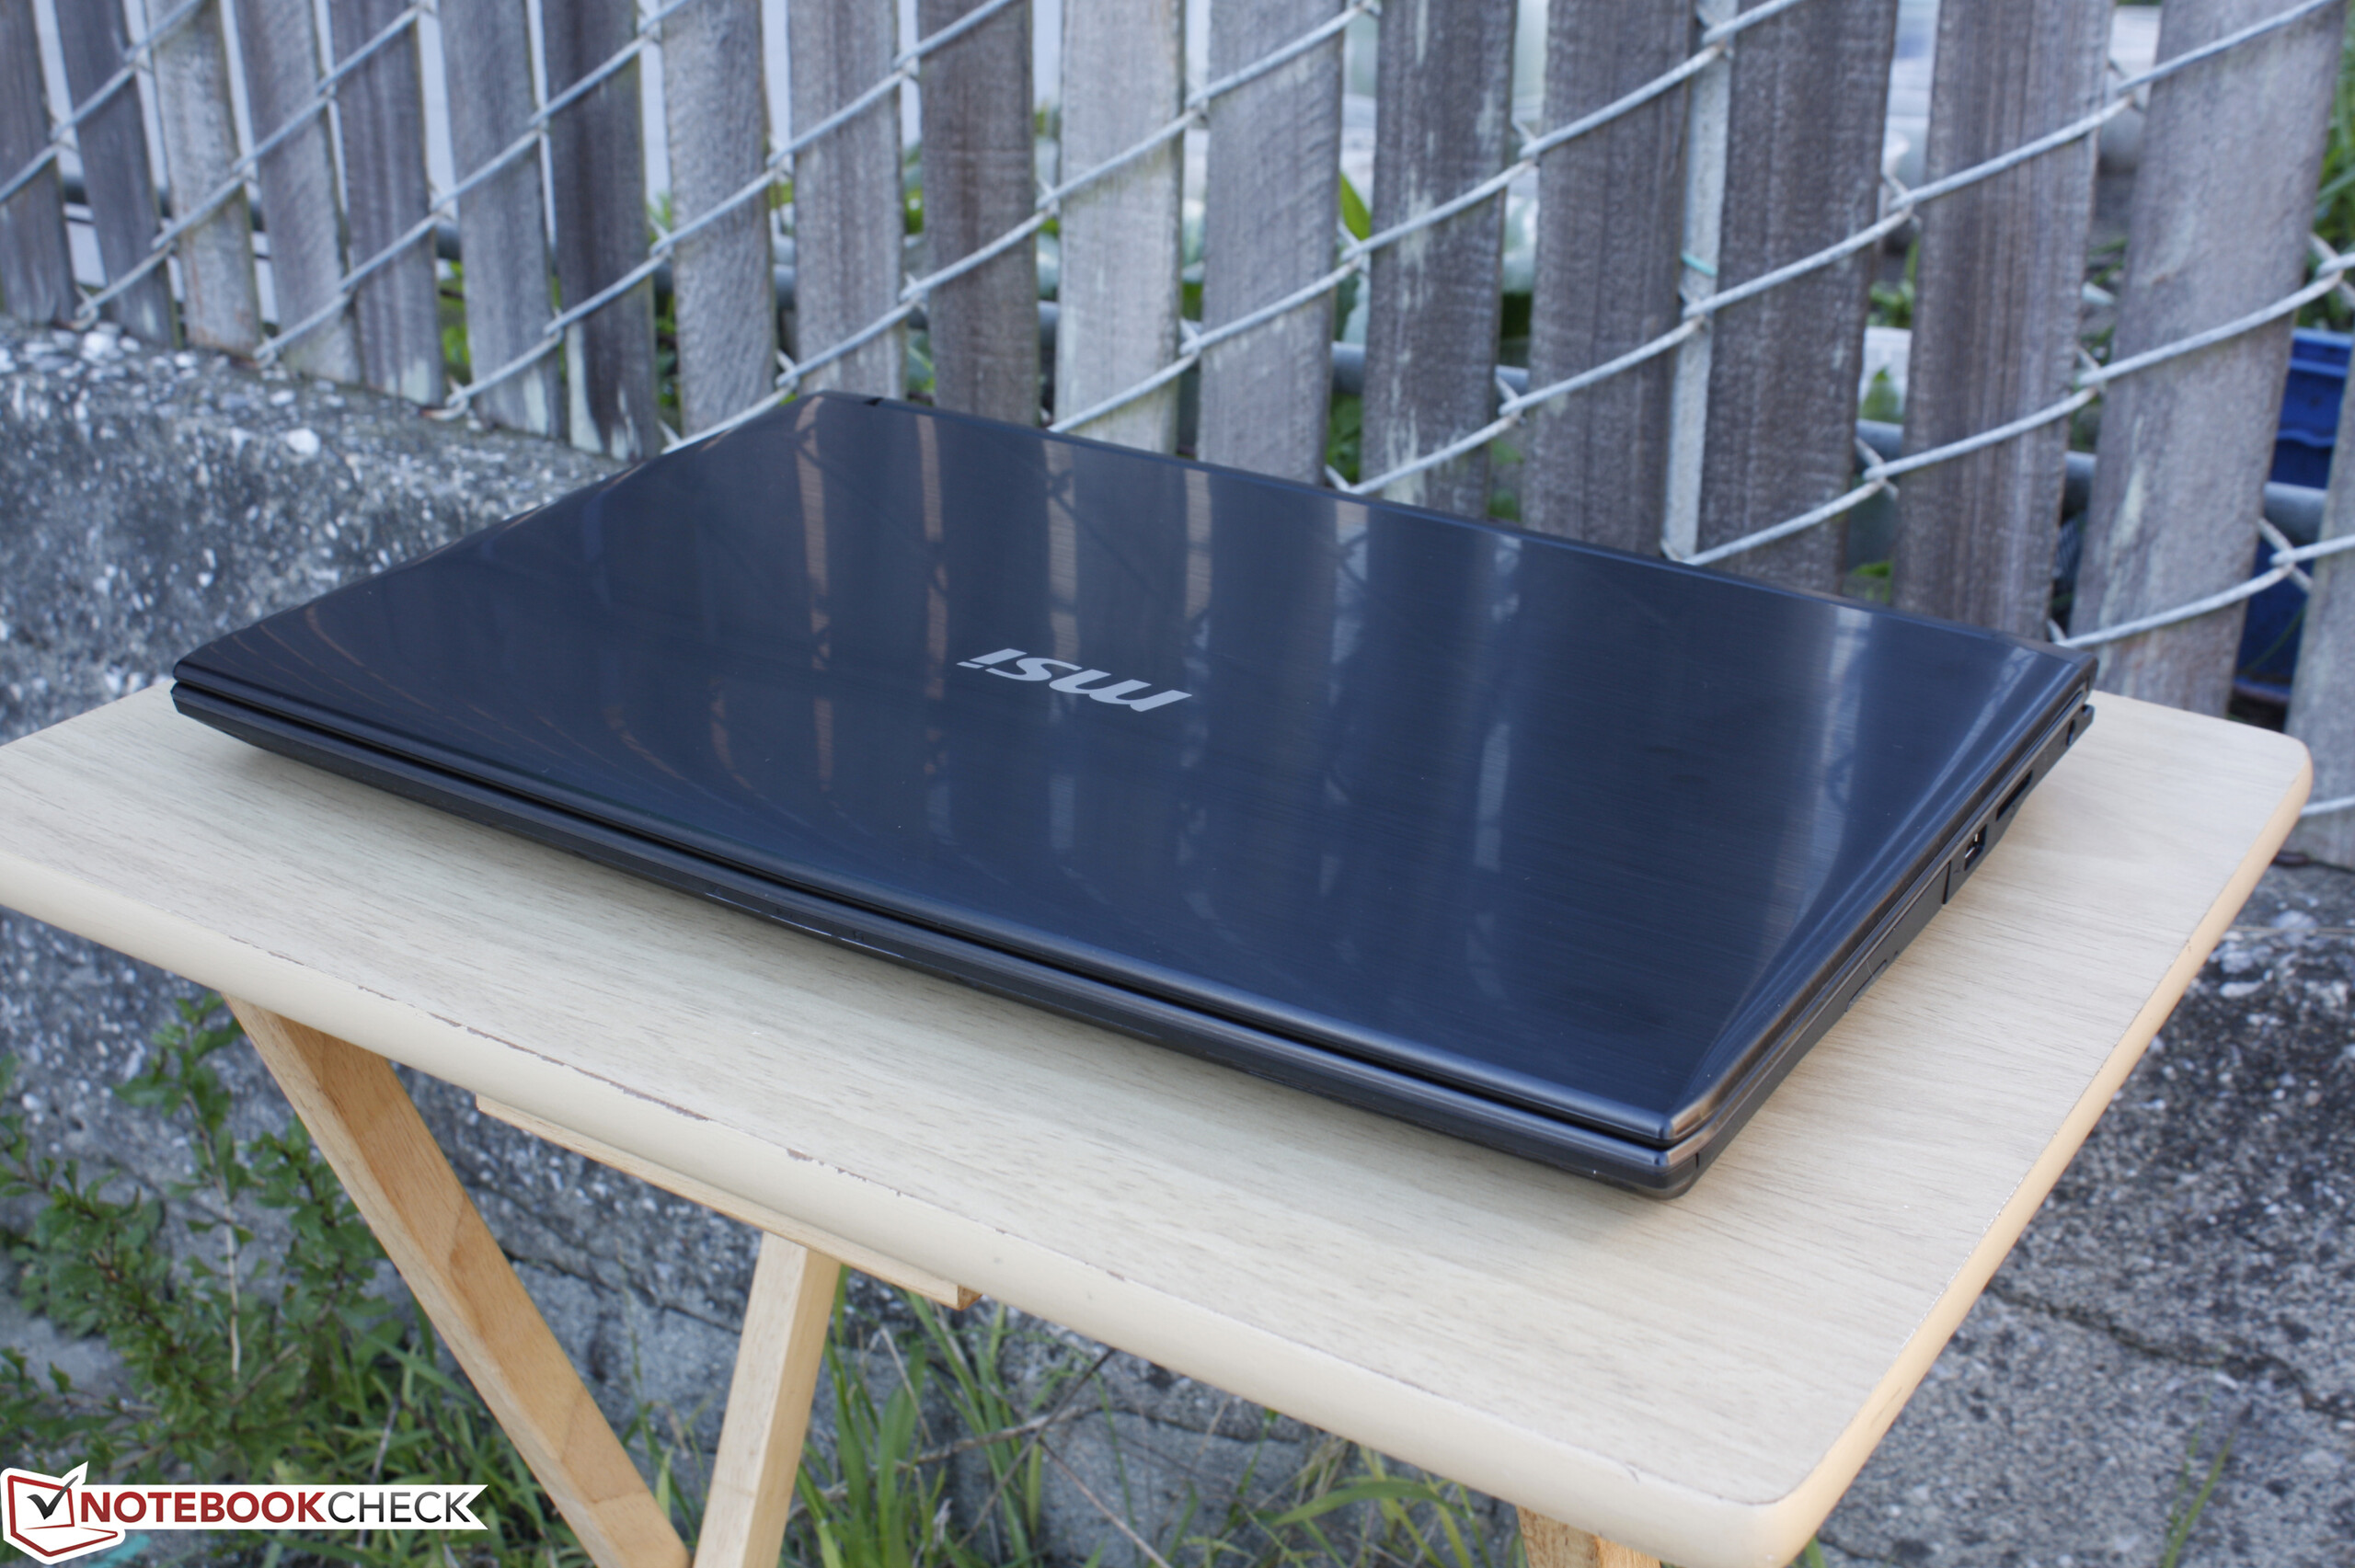
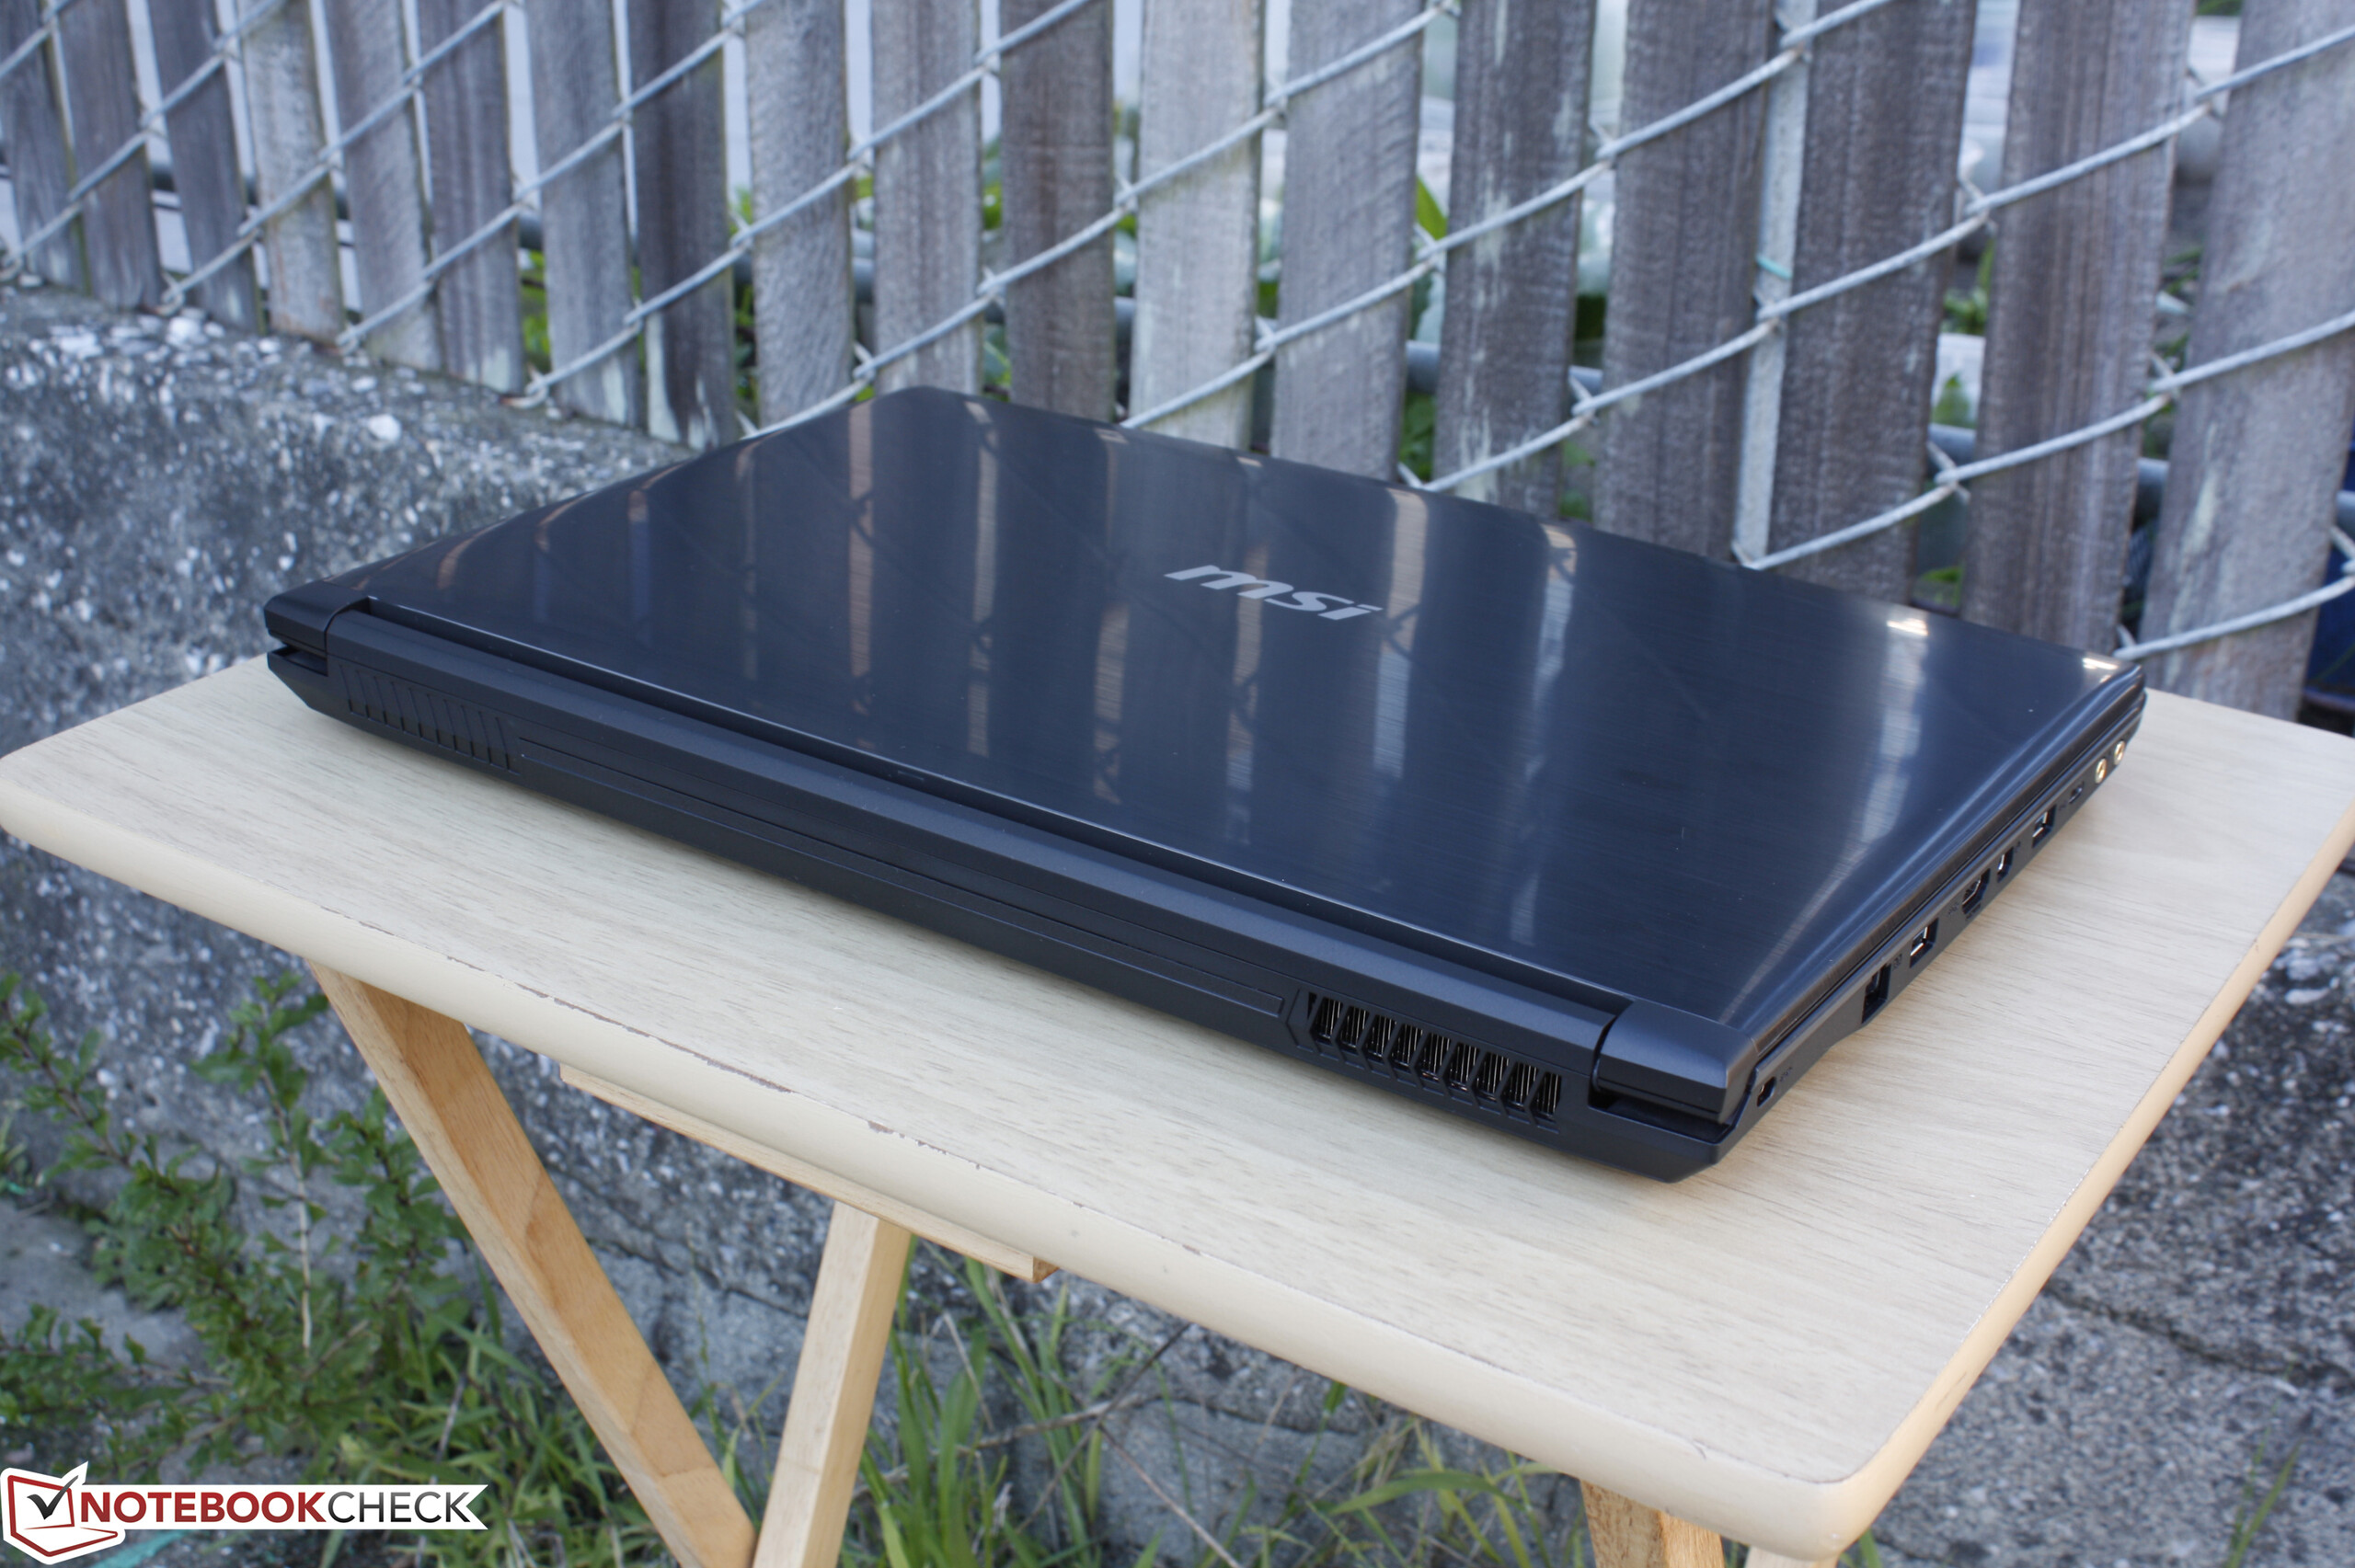
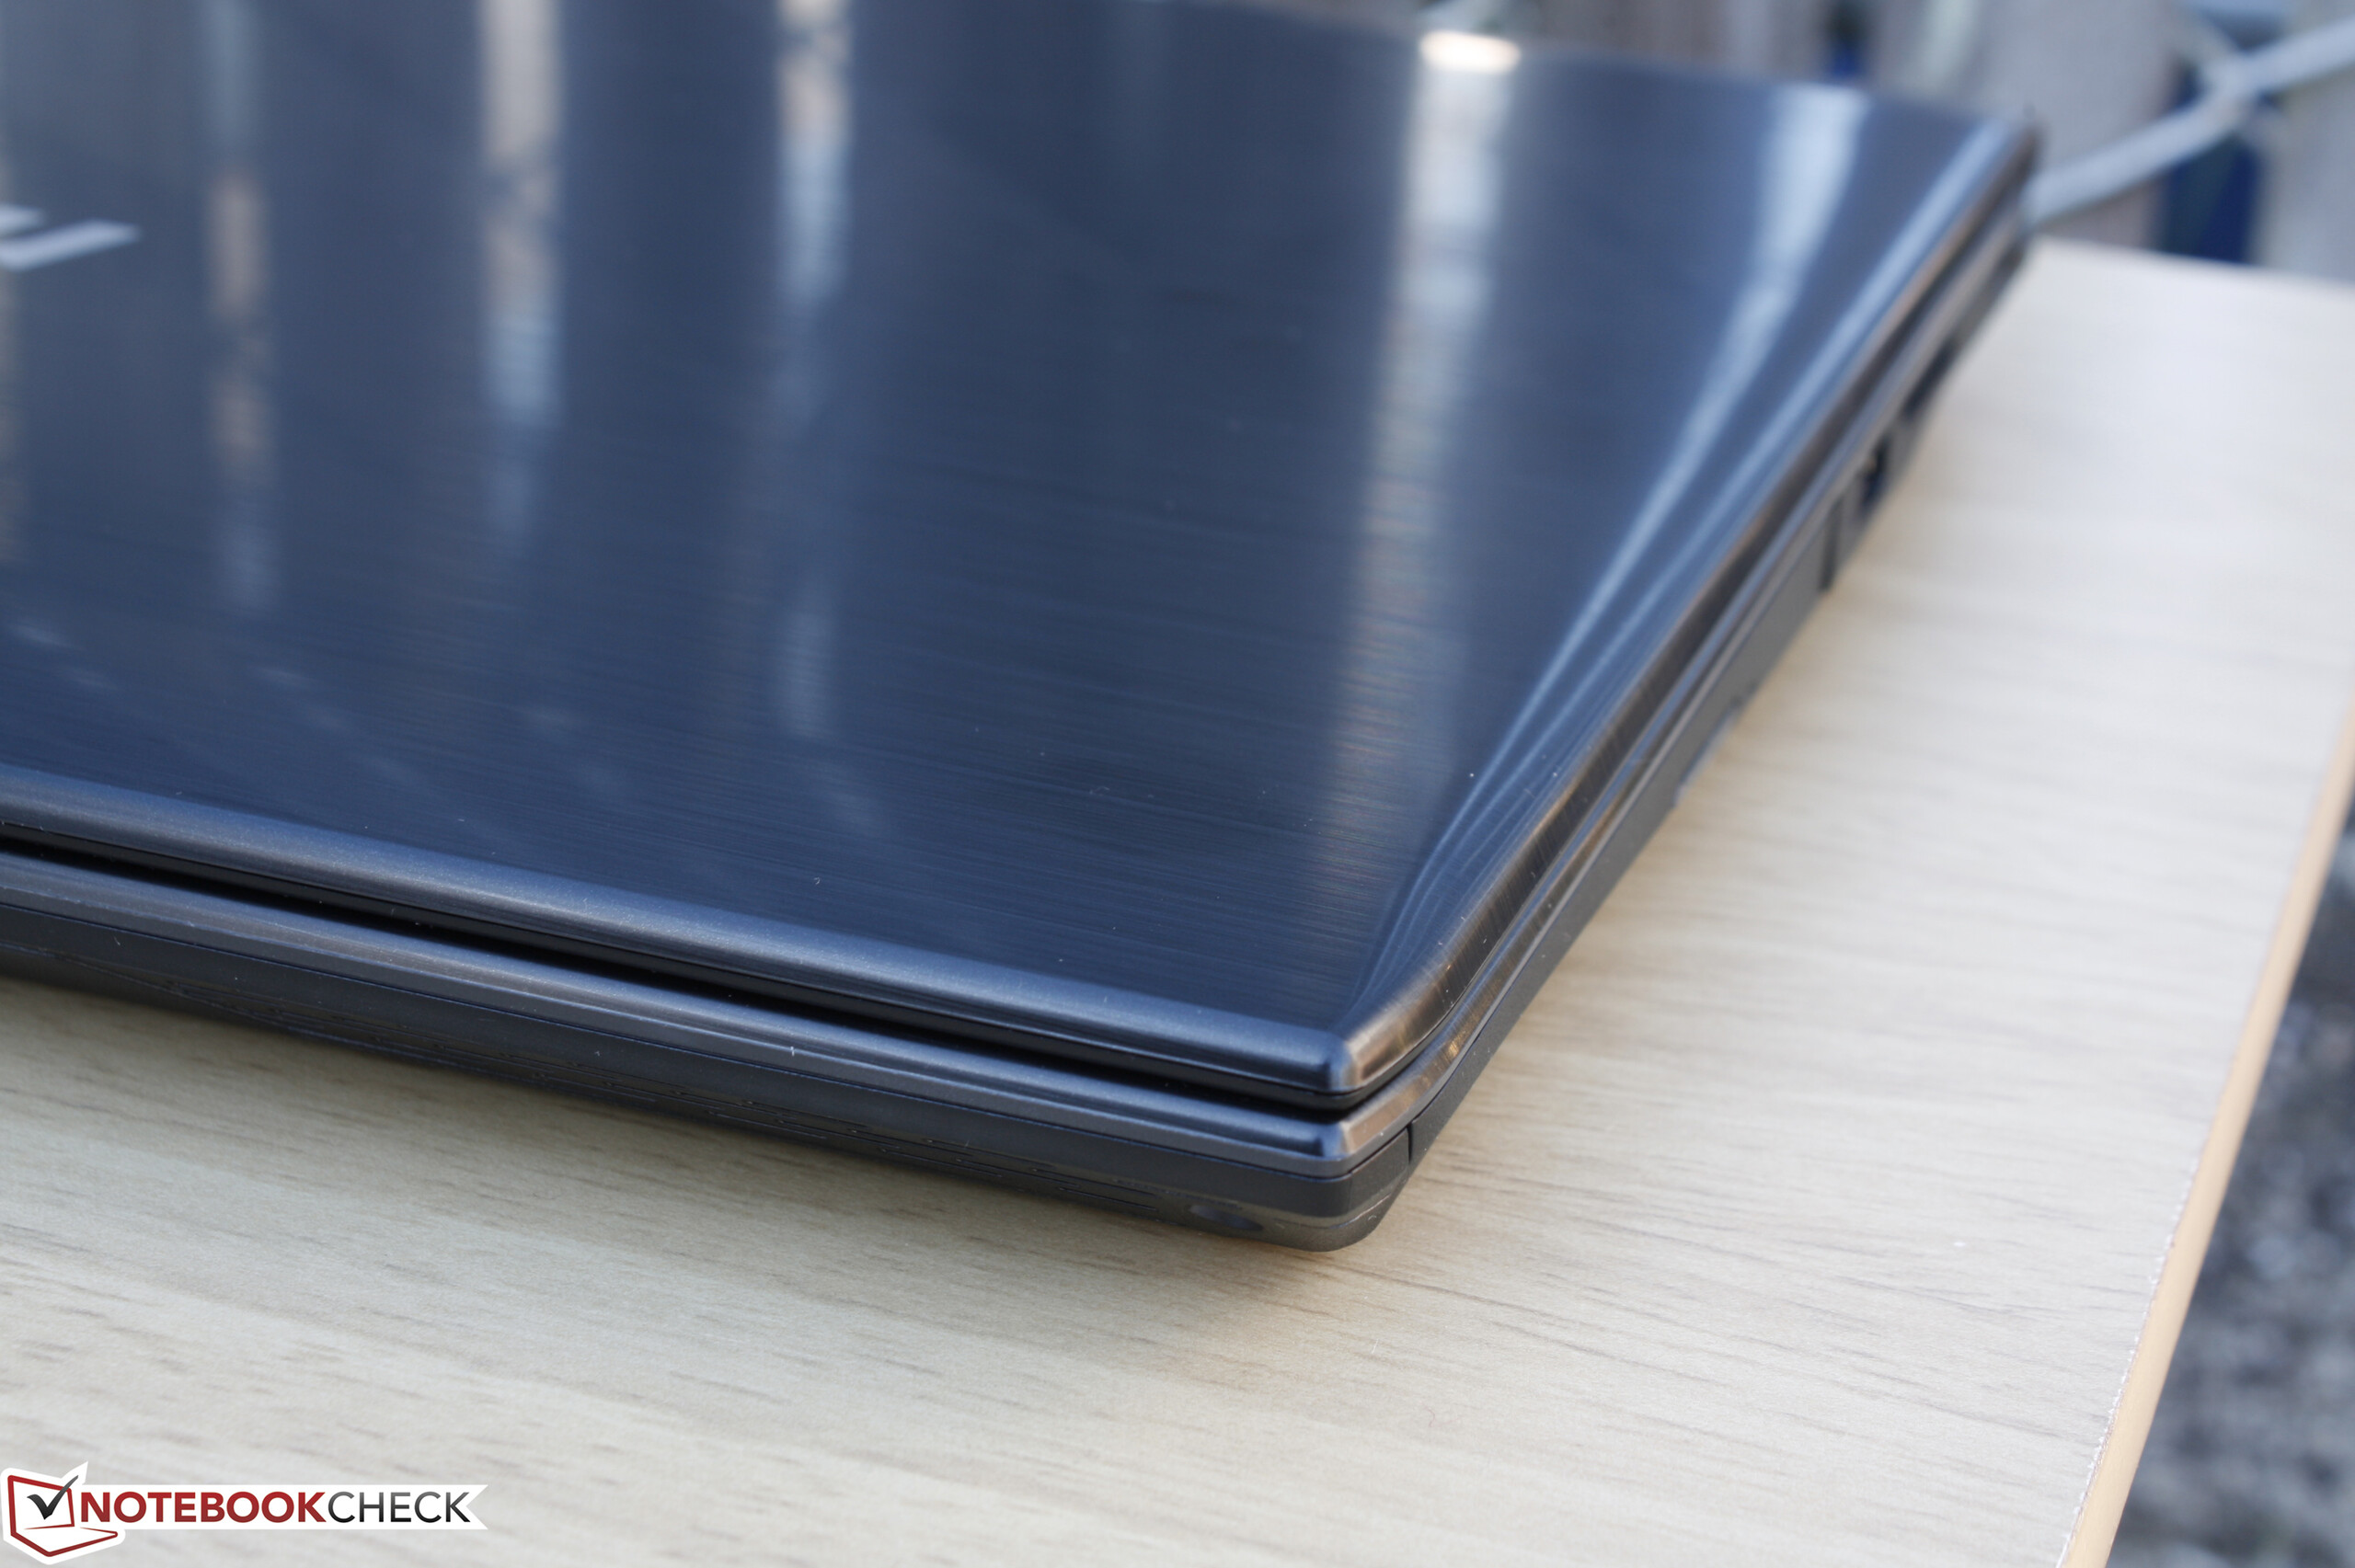
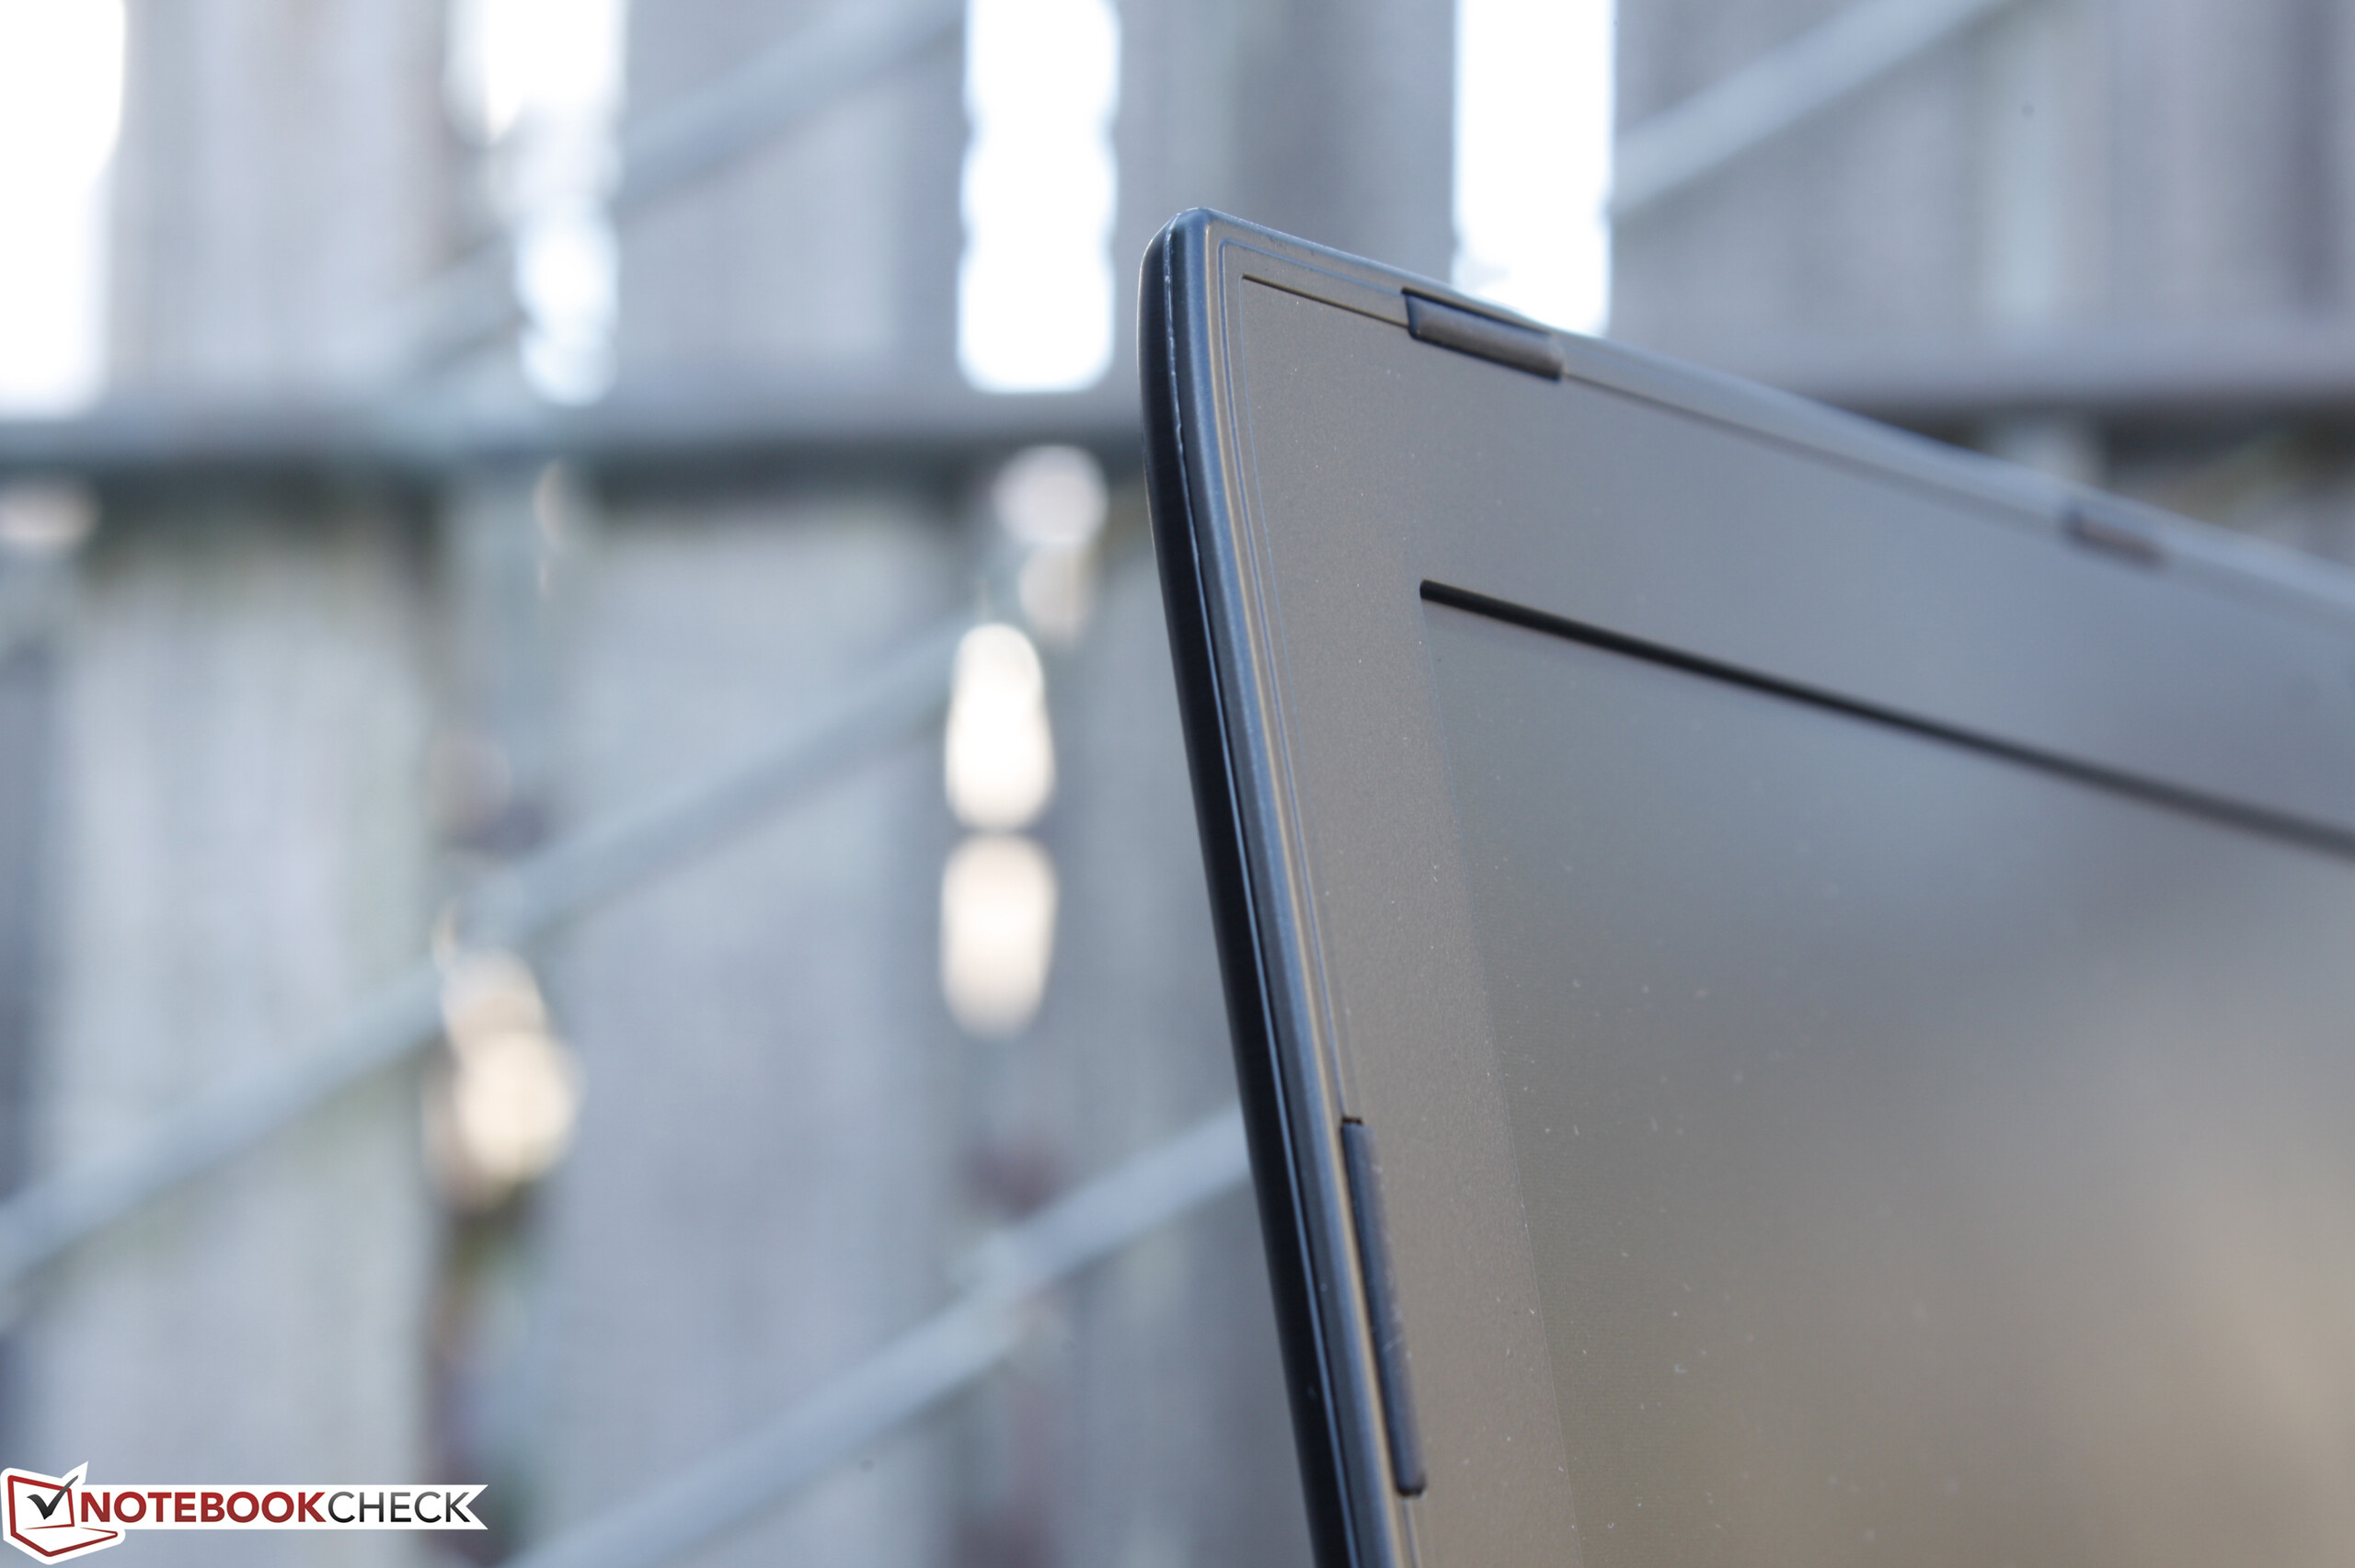
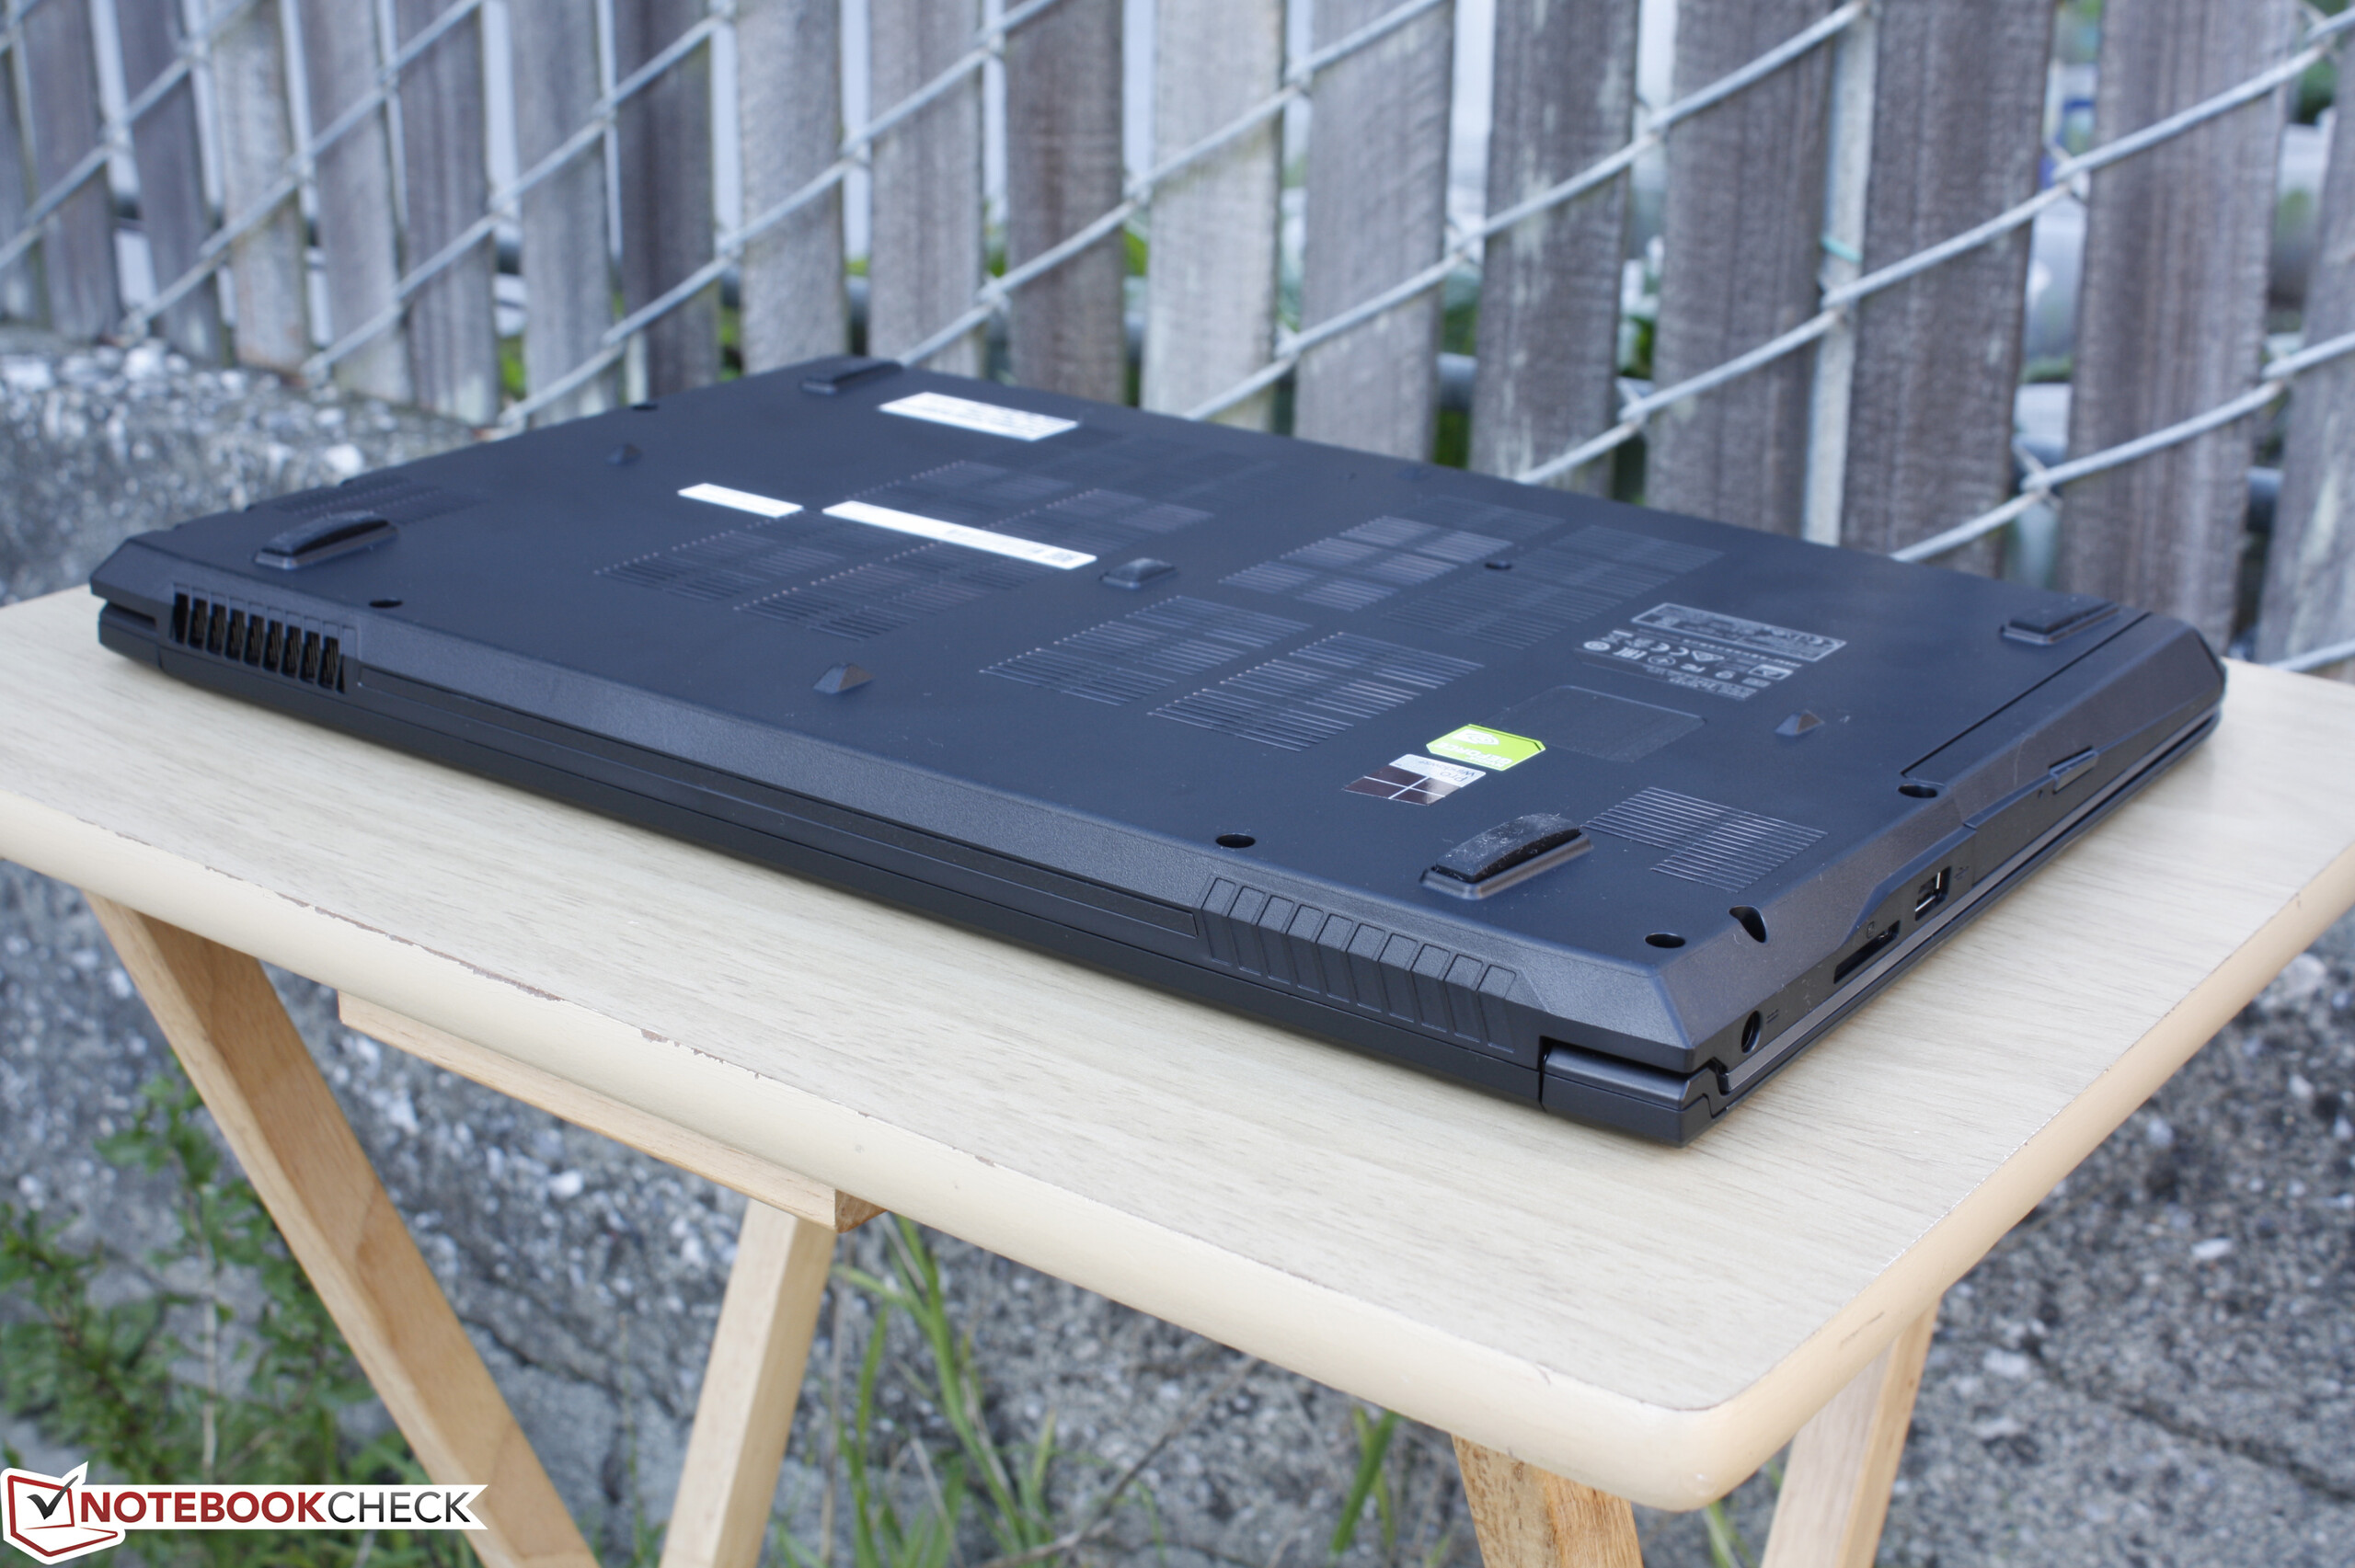
The CX62 is a gutted version of both the GP62 and GE62. The chassis is visually identical as MSI has simply removed internal features to differentiate the budget CX62 from its costlier gaming G series siblings. Nonetheless, the surfaces of the CX62 feel cheaper, more hollow, and more plastic to the touch. The base warps fairly easily when attempting to twist it from its front corners and the palm rests and keyboard will depress when pushed down with a finger. The lid is also quite flexible and warps easily down its center with applied pressure. Aside from the satisfactory hinges and minimal teetering, we're disappointed in the overall rigidity of the notebook.
The size and weight of the CX62 are thicker and slightly heavier than the competition. At almost 30 mm thick, the MSI is almost 10 mm thicker than the Asus Zenbook UX510UW or HP Pavilion 15t while weighing 100 g to 200 g more. The larger dimensions would have been acceptable if the CX62 was of a higher build quality than its competitors, but this is unfortunately not the case.
Connectivity
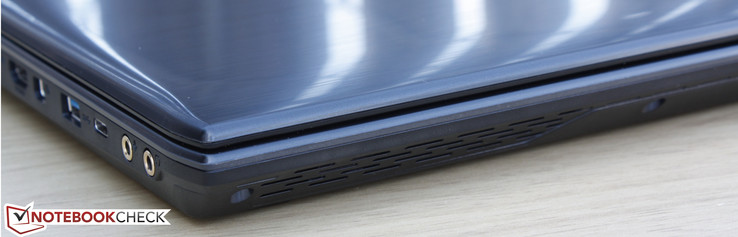
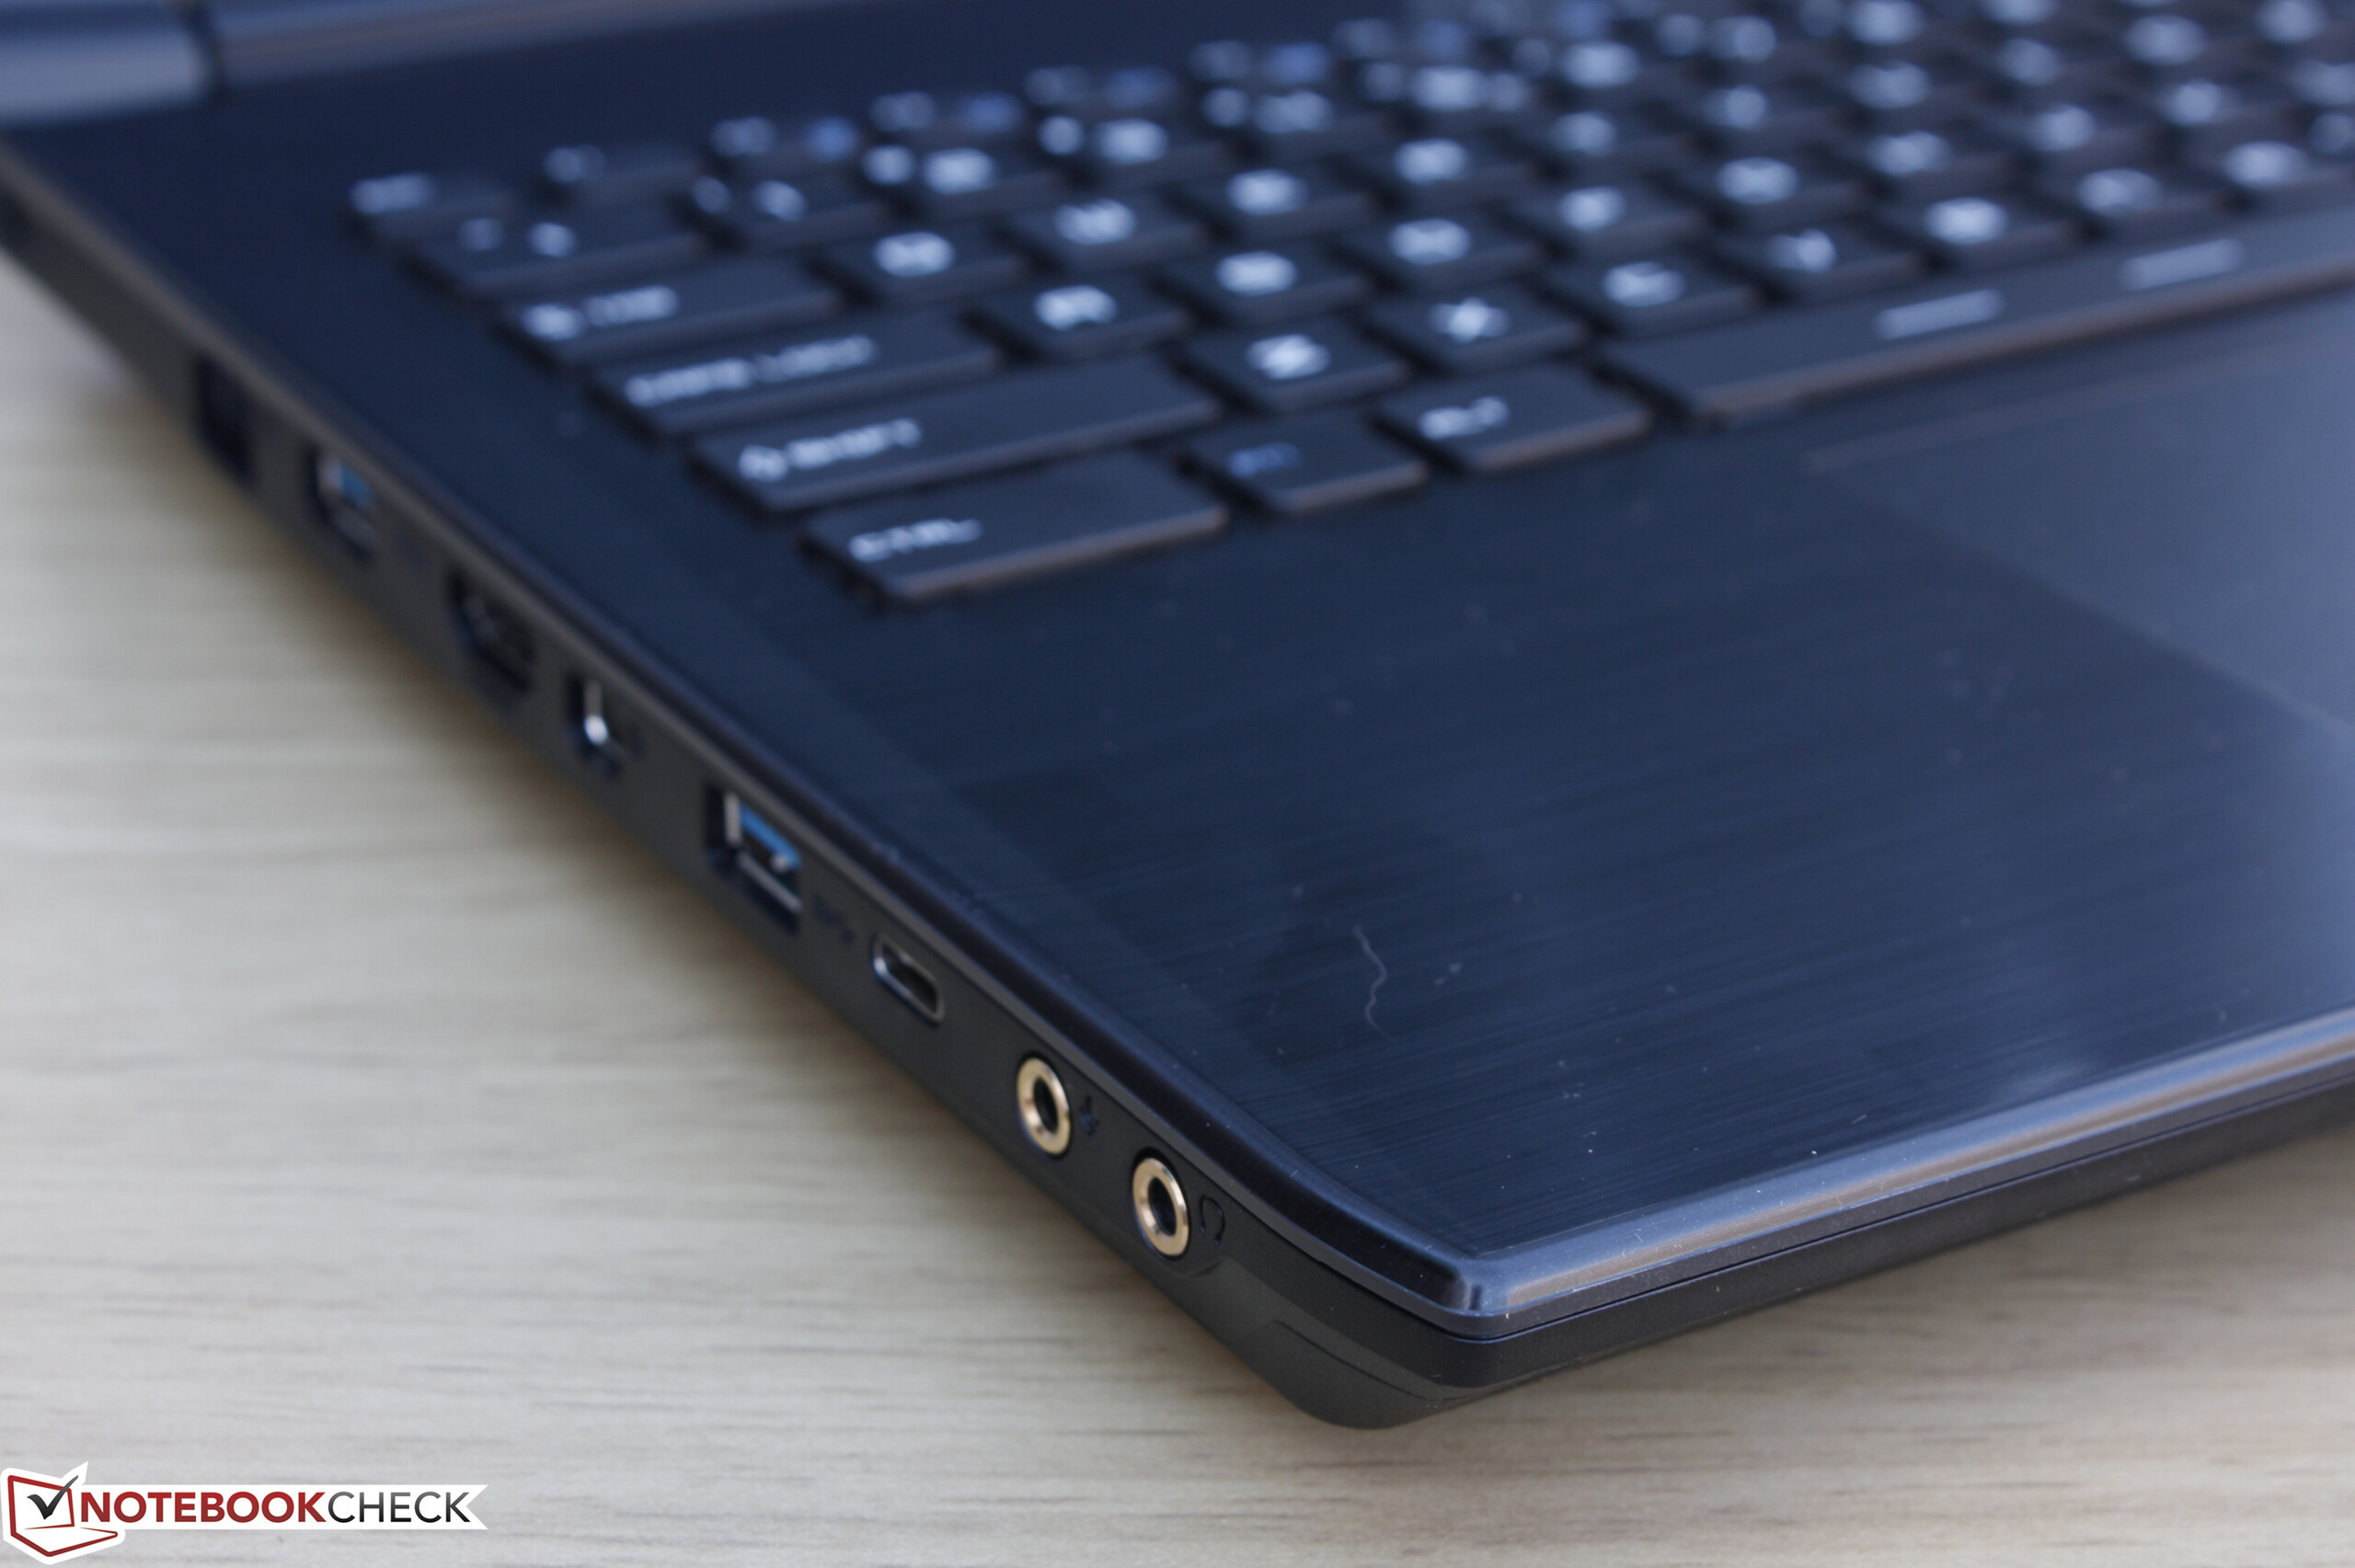
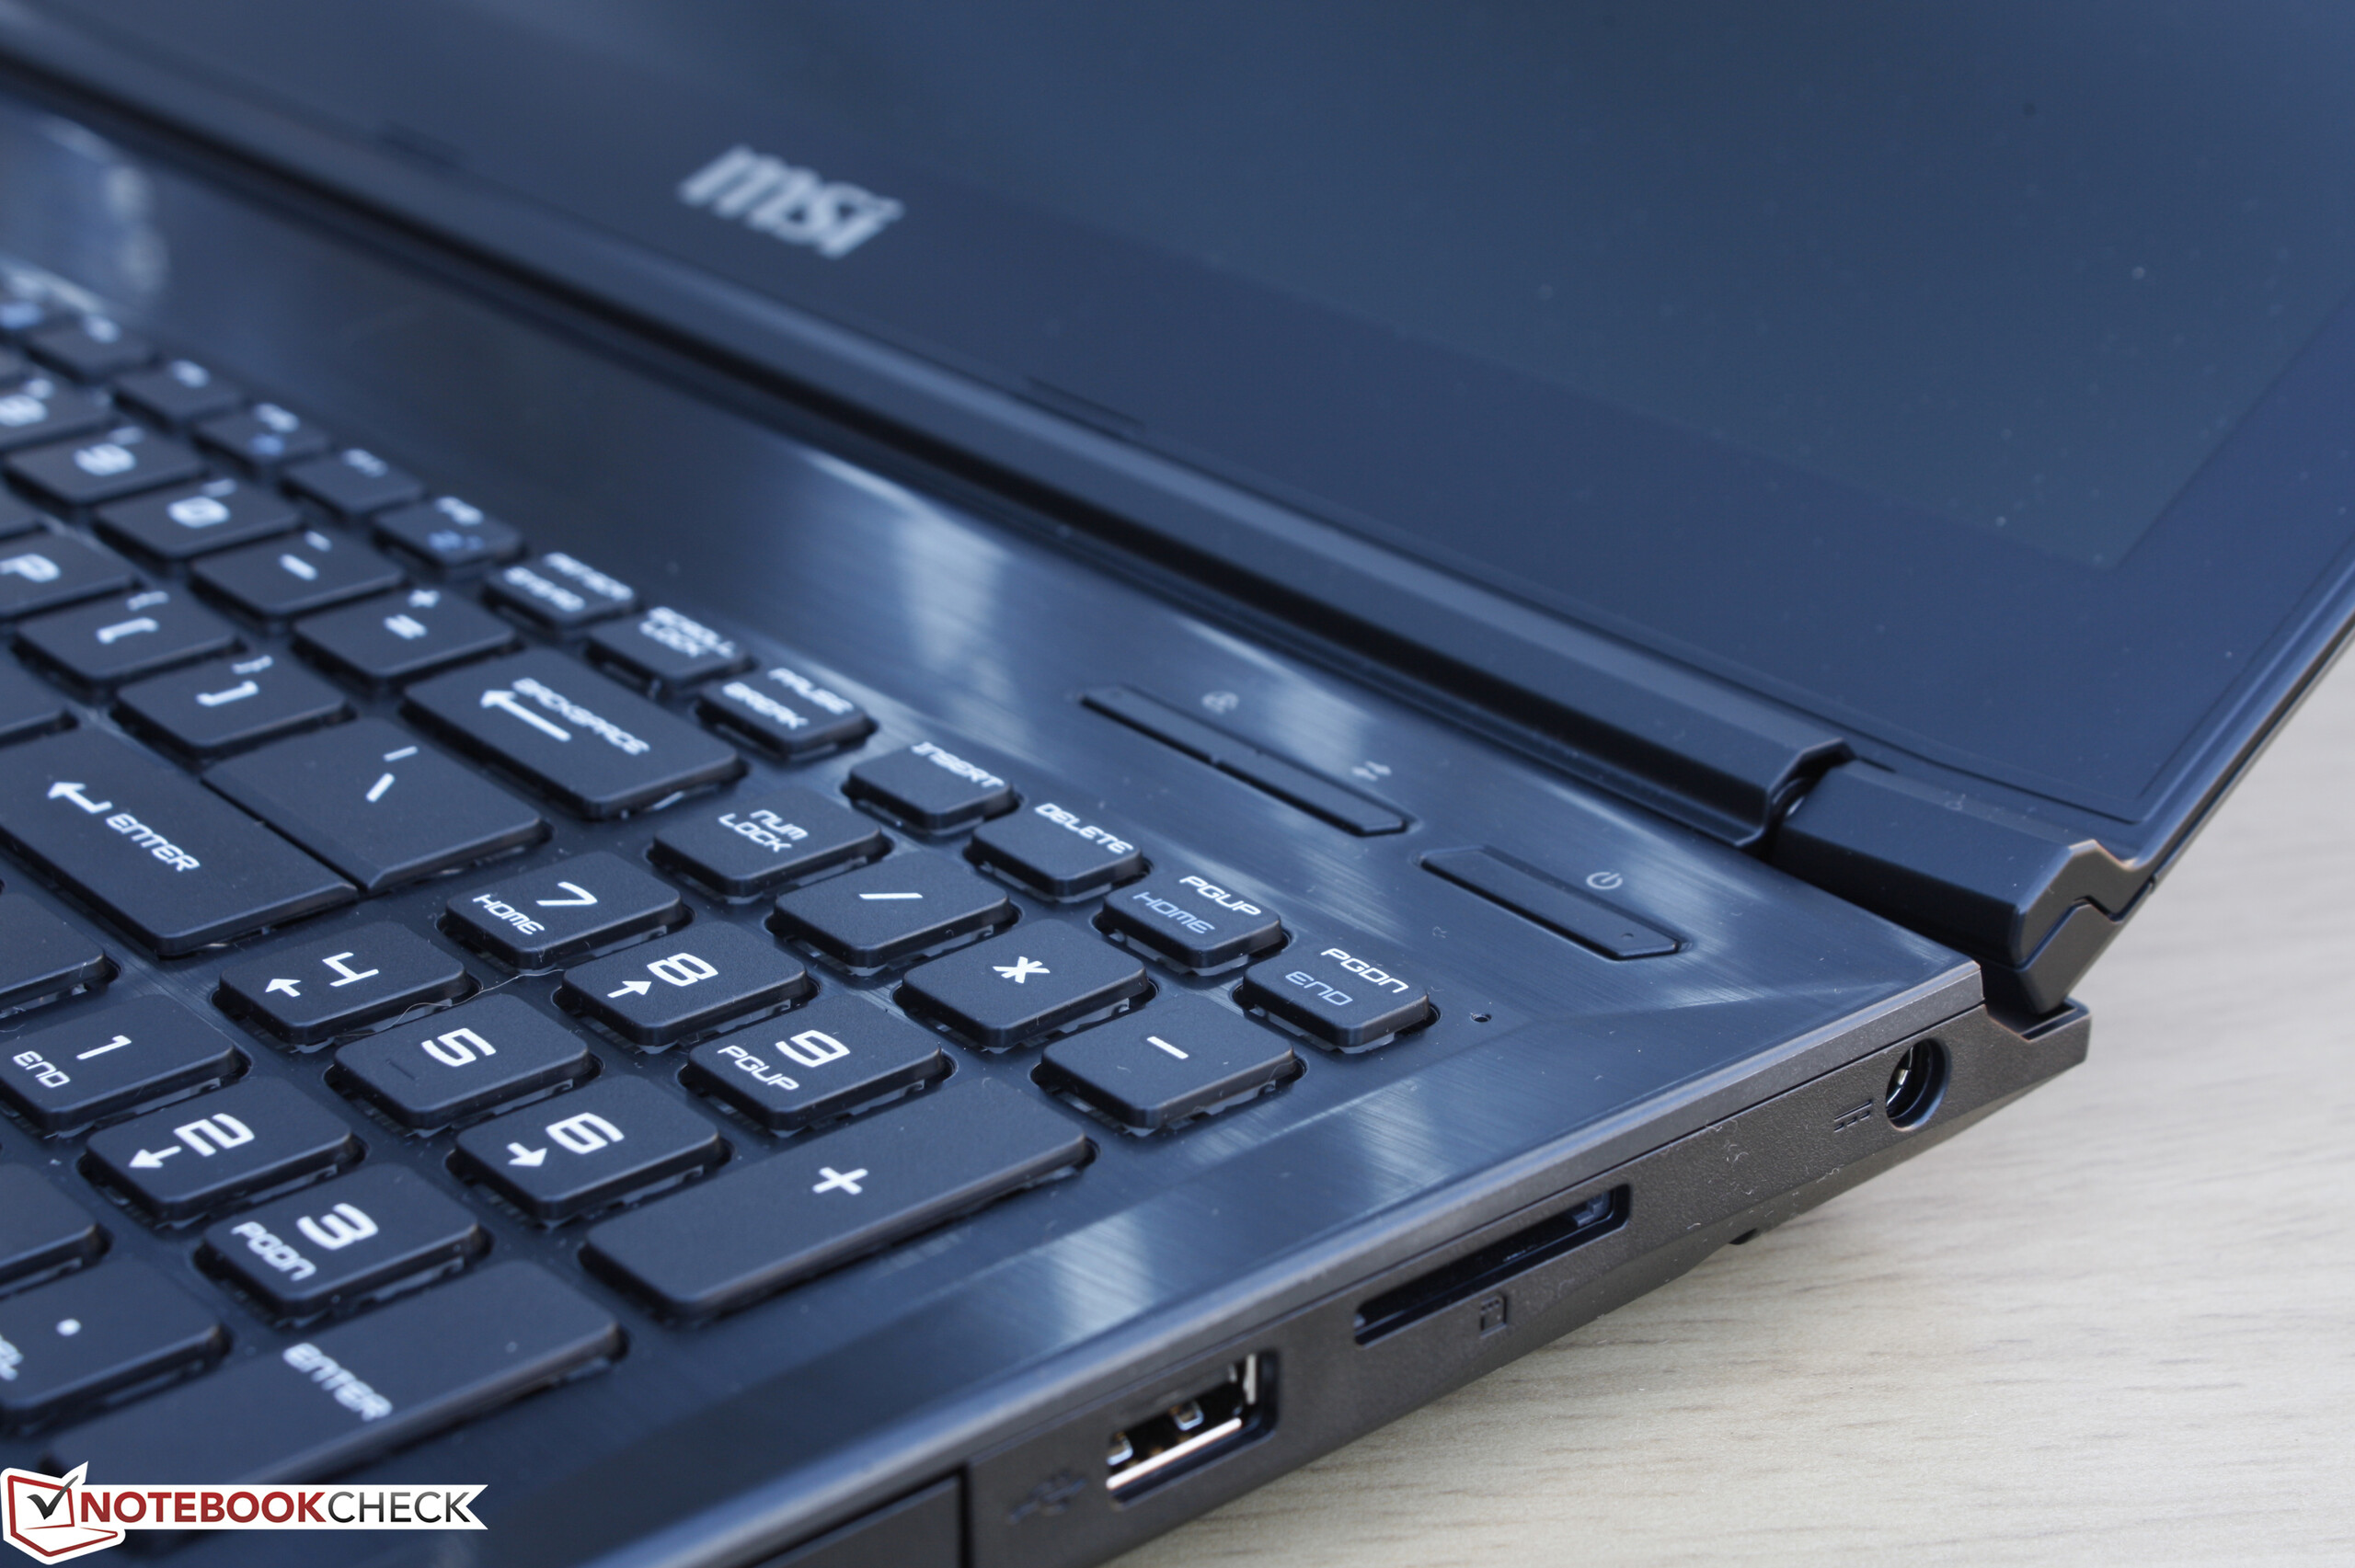
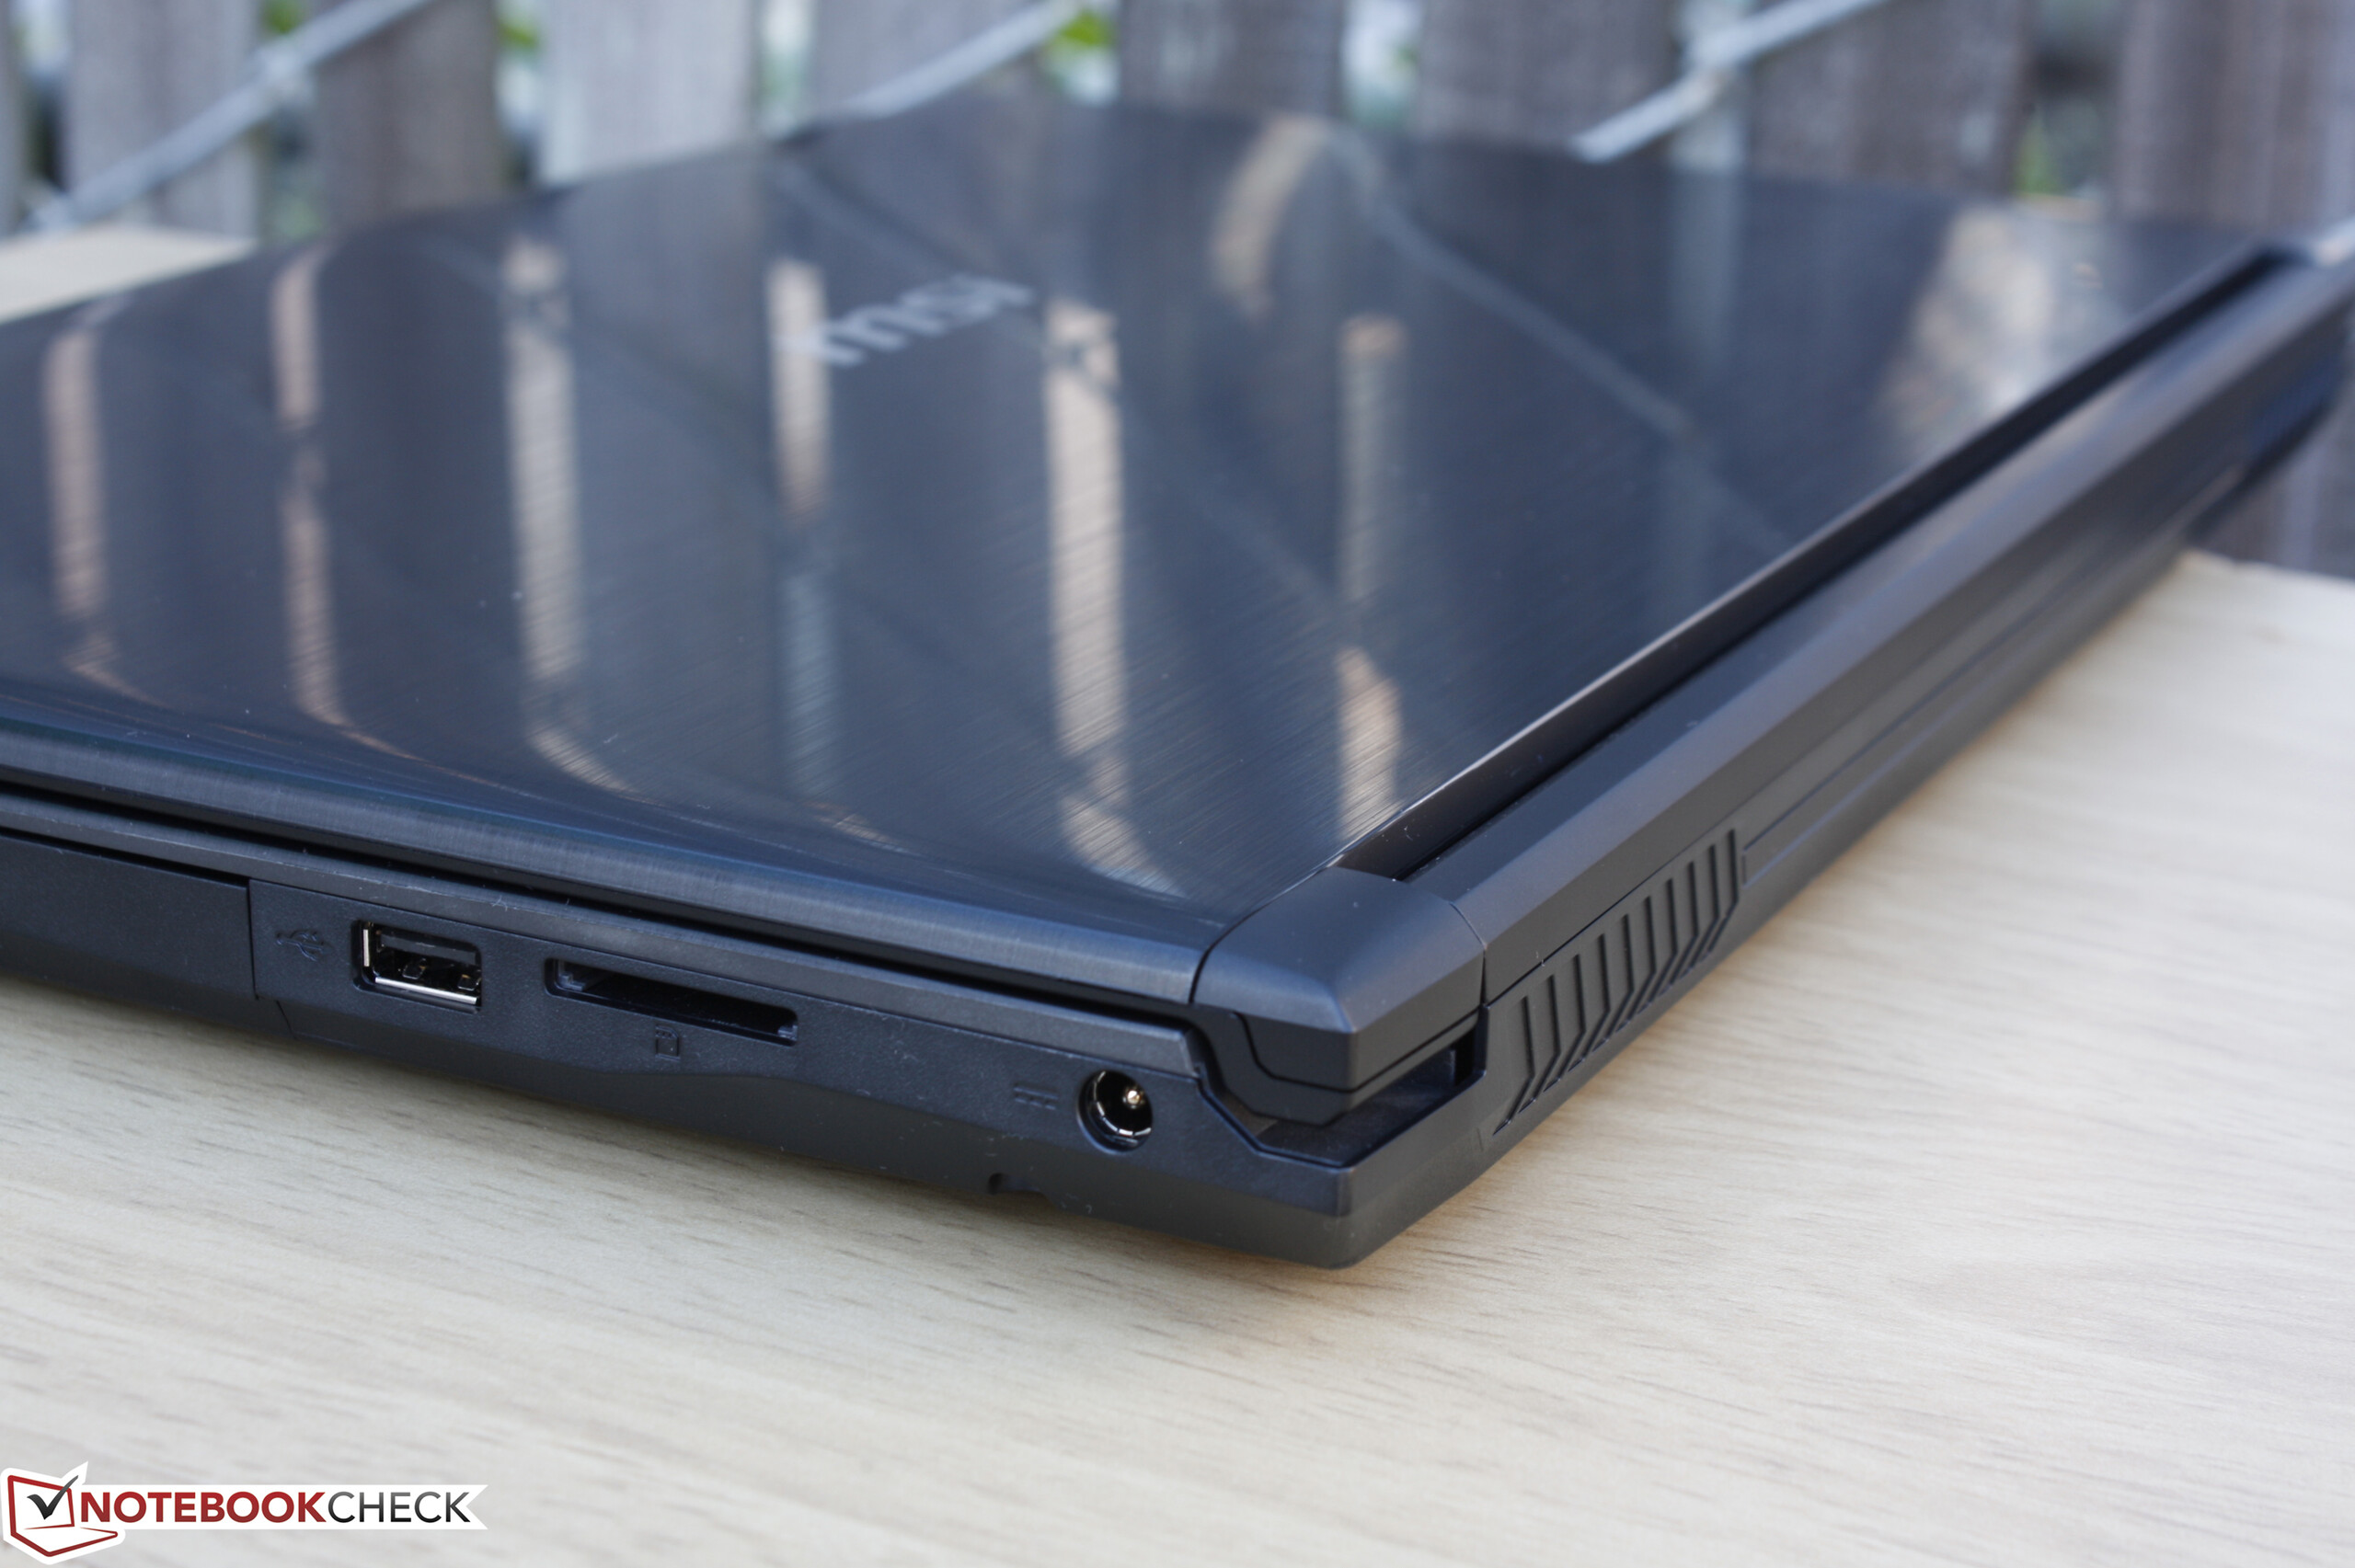
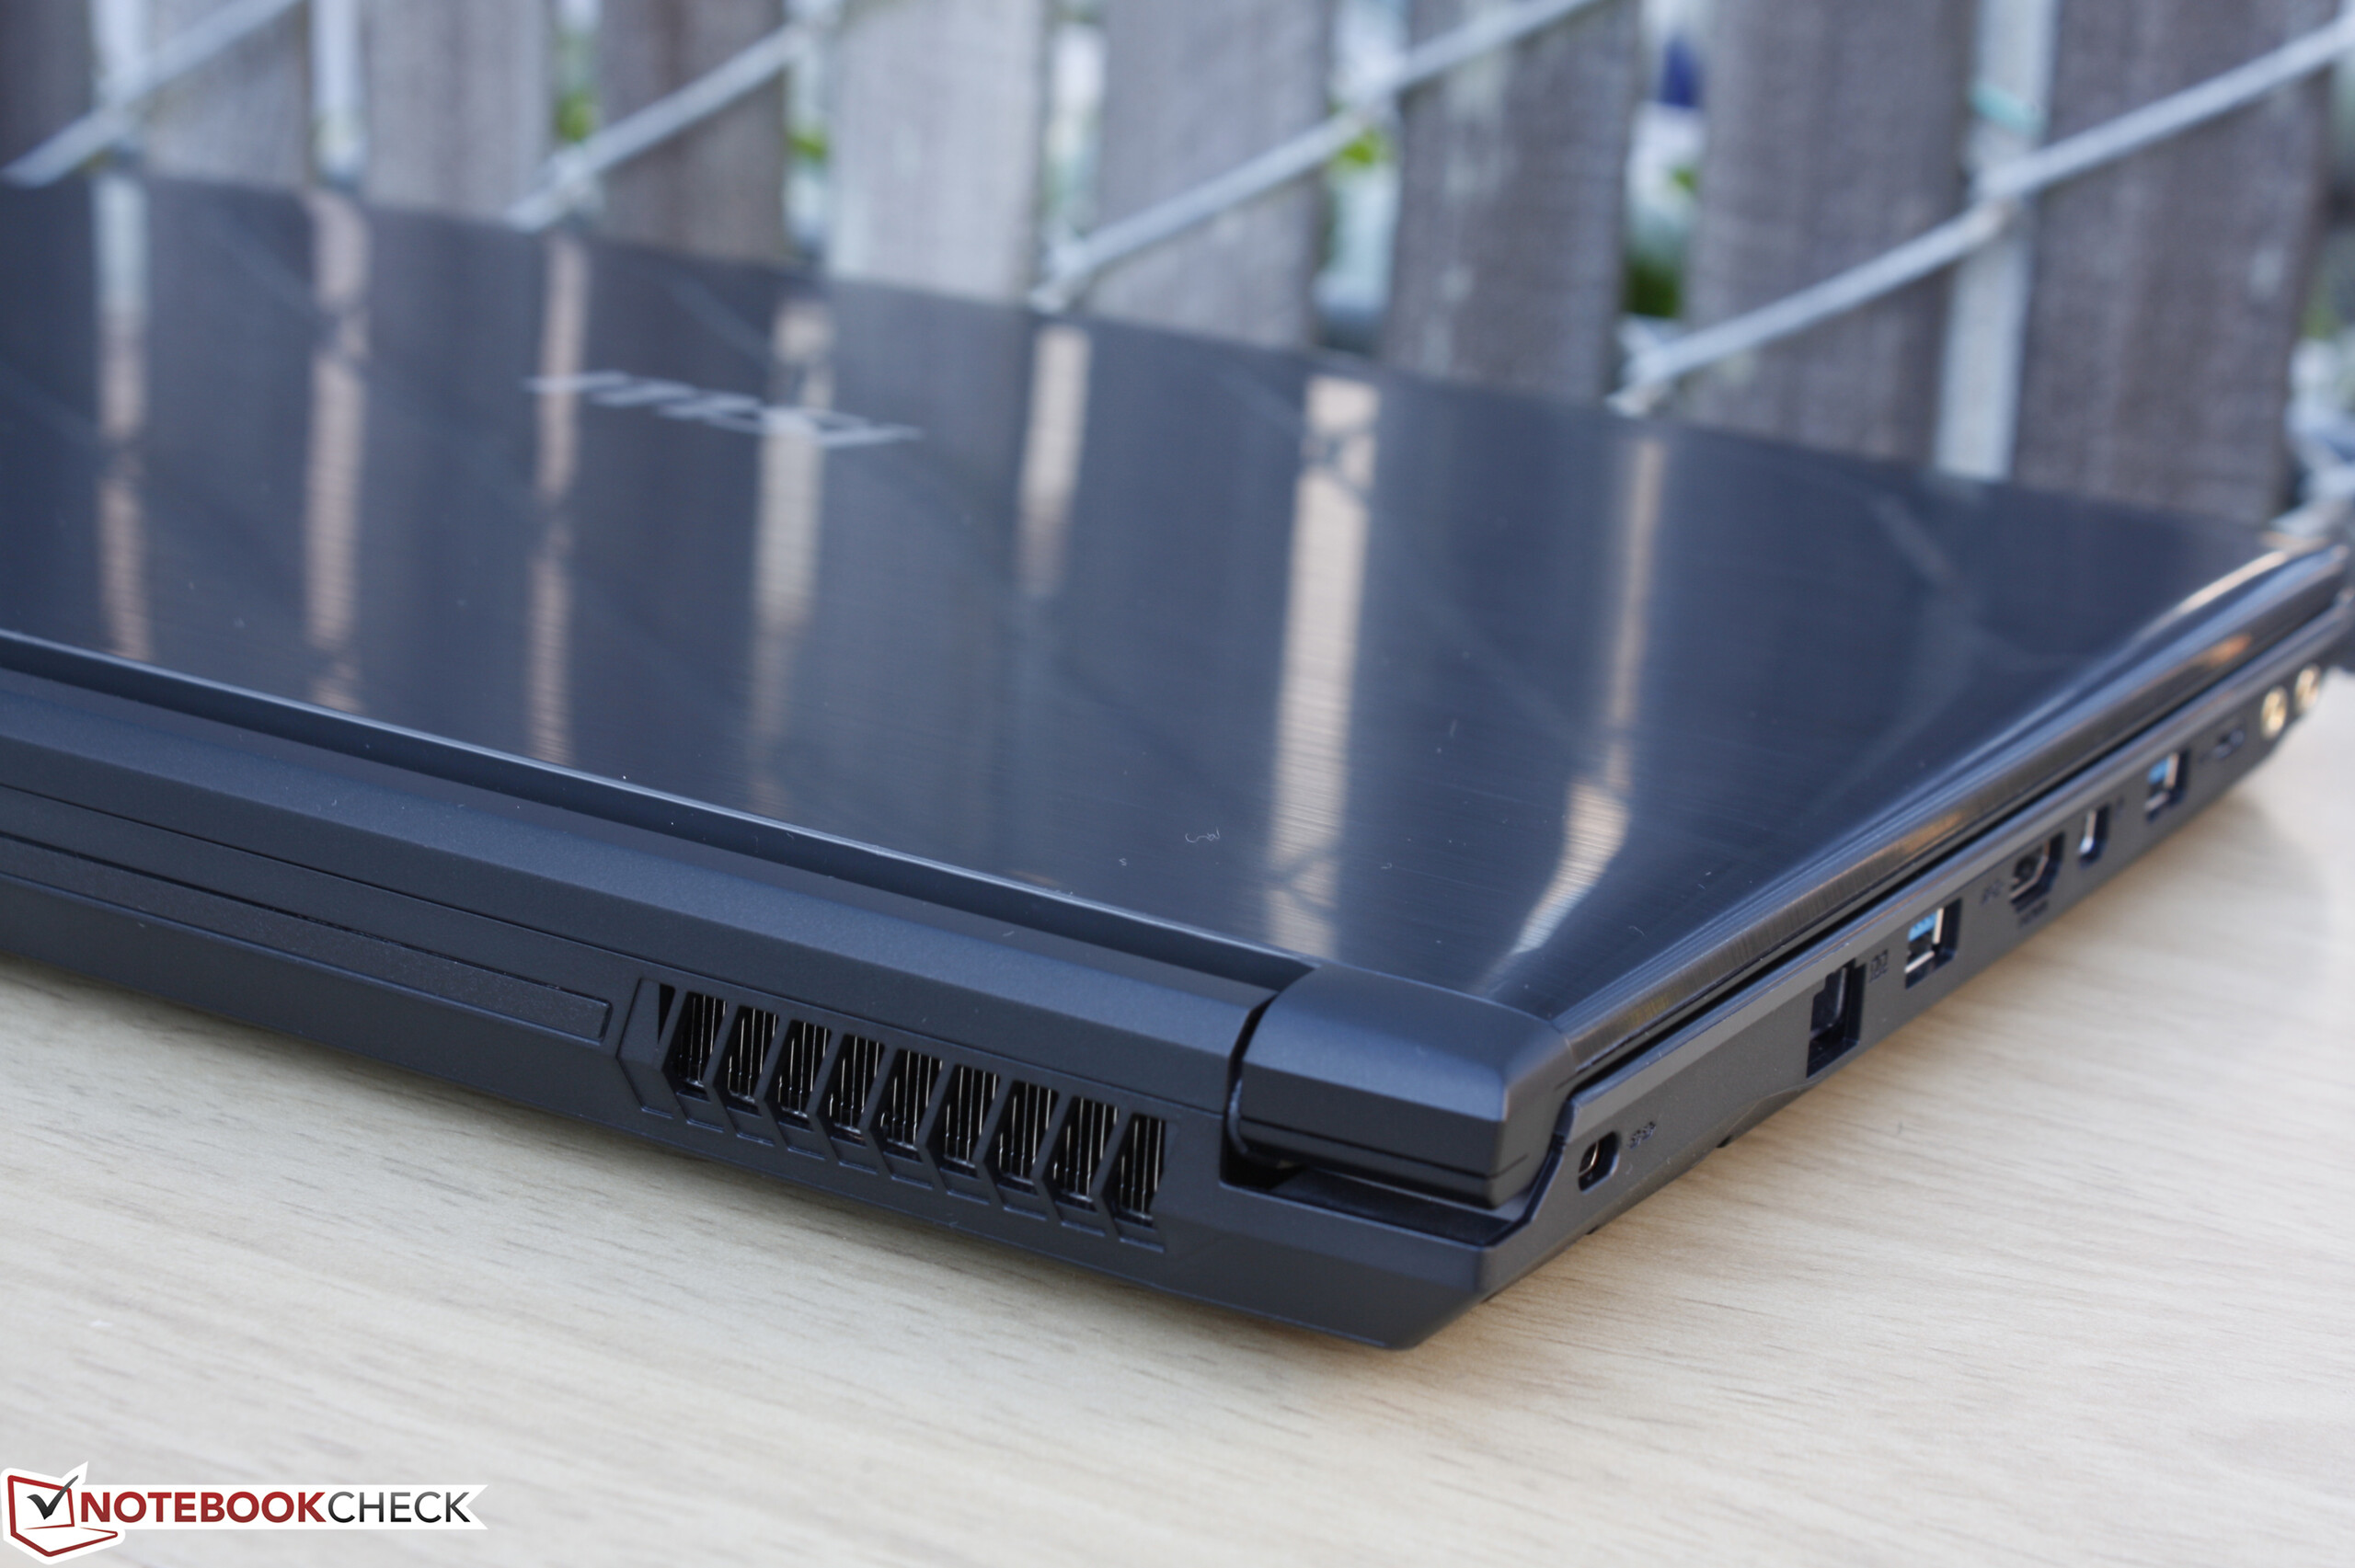
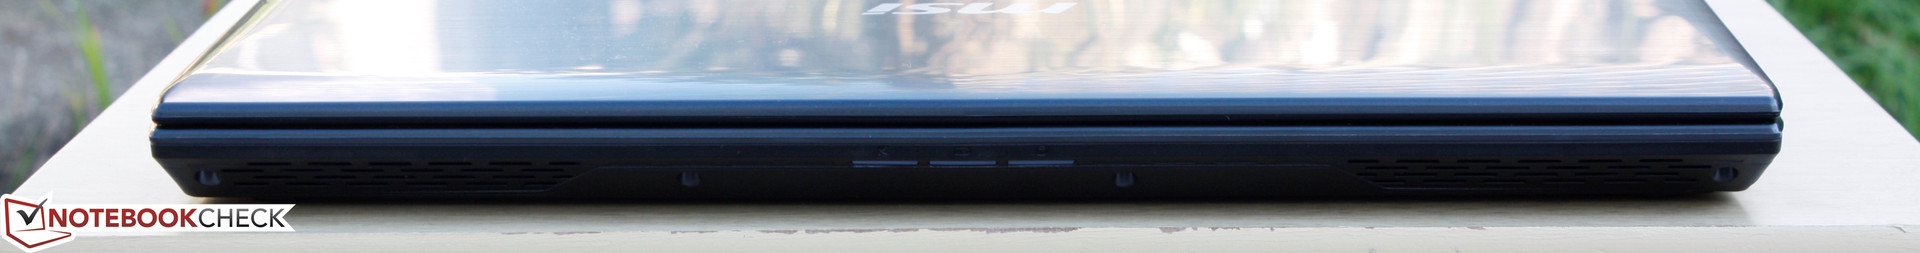
Available ports are more plentiful than what a standard Ultrabook can offer including gold-plated dual audio ports, both mDP and full-size HDMI 1.4, USB Type-C Gen. 1, and even an optical drive. Thunderbolt 3 is missing and its inclusion could have boosted the versatility of the notebook. All ports are easy to reach although their positioning tends to favor right-handed mouse users.


SD Card Reader
The integrated SD reader is very slow at just around 24 MB/s with our Toshiba UHS-II test card. Transferring 1 GB worth of images from the card to desktop will take around 42 seconds.
| SD Card Reader | |
| average JPG Copy Test (av. of 3 runs) | |
| HP Pavilion 15t-au100 CTO (W0P31AV) | |
| MSI CX62 7QL | |
| Asus Zenbook UX510UW-CN044T | |
| maximum AS SSD Seq Read Test (1GB) | |
| HP Pavilion 15t-au100 CTO (W0P31AV) | |
| Asus Zenbook UX510UW-CN044T | |
| MSI CX62 7QL | |
Communication
The Intel 3168 is a dual-band 1x1 WLAN module with theoretical transfer rates of up to 433 Mbps. Our own test with a Linksys EA8500 802.11ac router shows a real-world transfer rate of around 282 Mbps or even slower depending on the conditions. While certainly many times faster than a notebook on a standard 802.11n network, the Intel 3168 is no match against the 2x2 Killer 1535 WLAN module found on most high-end gaming notebooks or the new Kaby Lake Dell XPS 13.
| Networking | |
| iperf3 transmit AX12 | |
| MSI GT73VR 6RF | |
| MSI CX62 7QL | |
| HP Pavilion 15t-au100 CTO (W0P31AV) | |
| iperf3 receive AX12 | |
| MSI GT73VR 6RF | |
| MSI CX62 7QL | |
| HP Pavilion 15t-au100 CTO (W0P31AV) | |
Accessories
Included extras are slim as the notebook ships with just a power adapter, Quick Start guide, and warranty card.
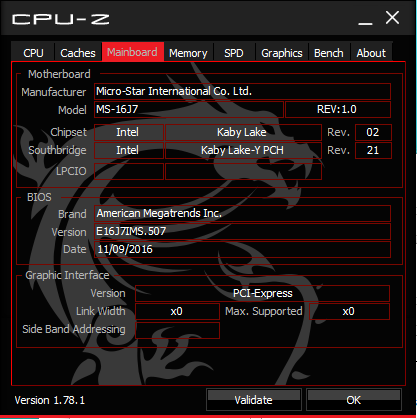
Maintenance
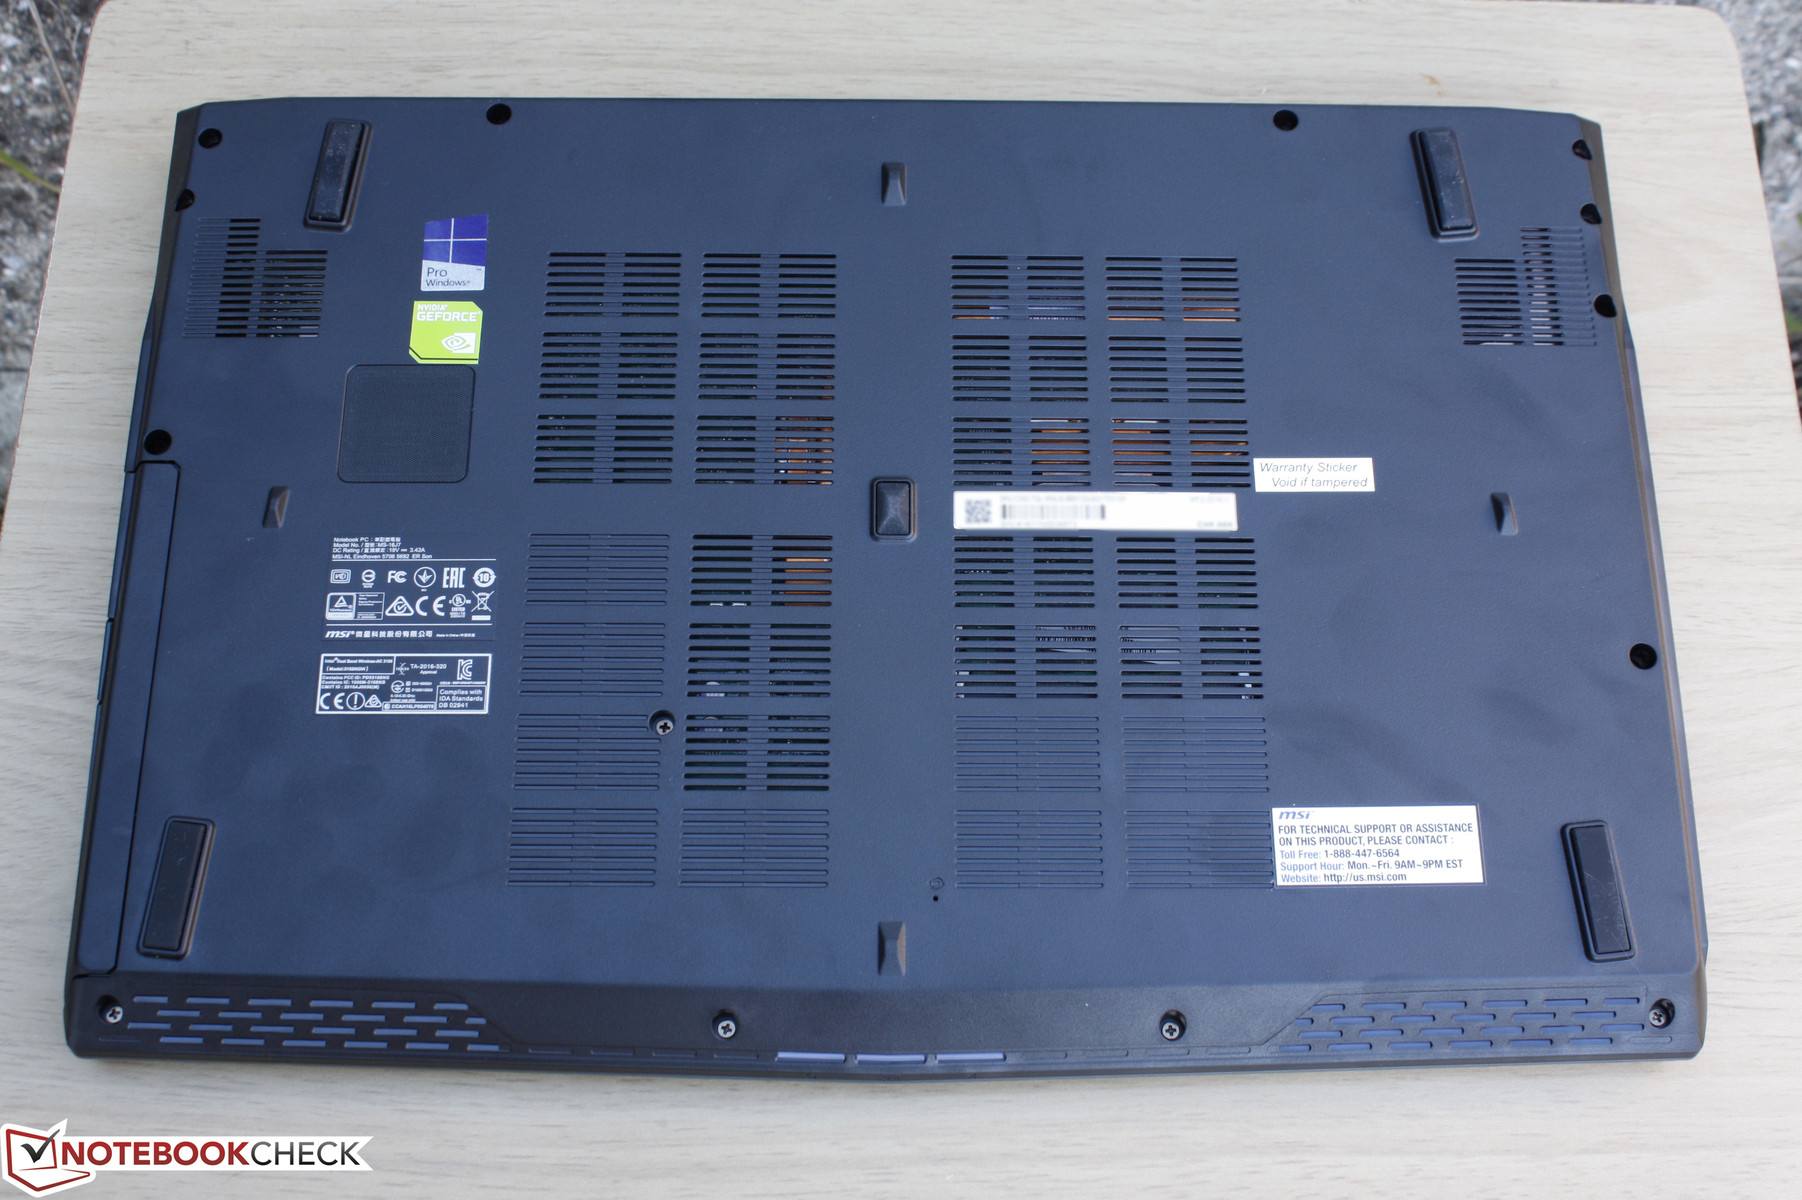
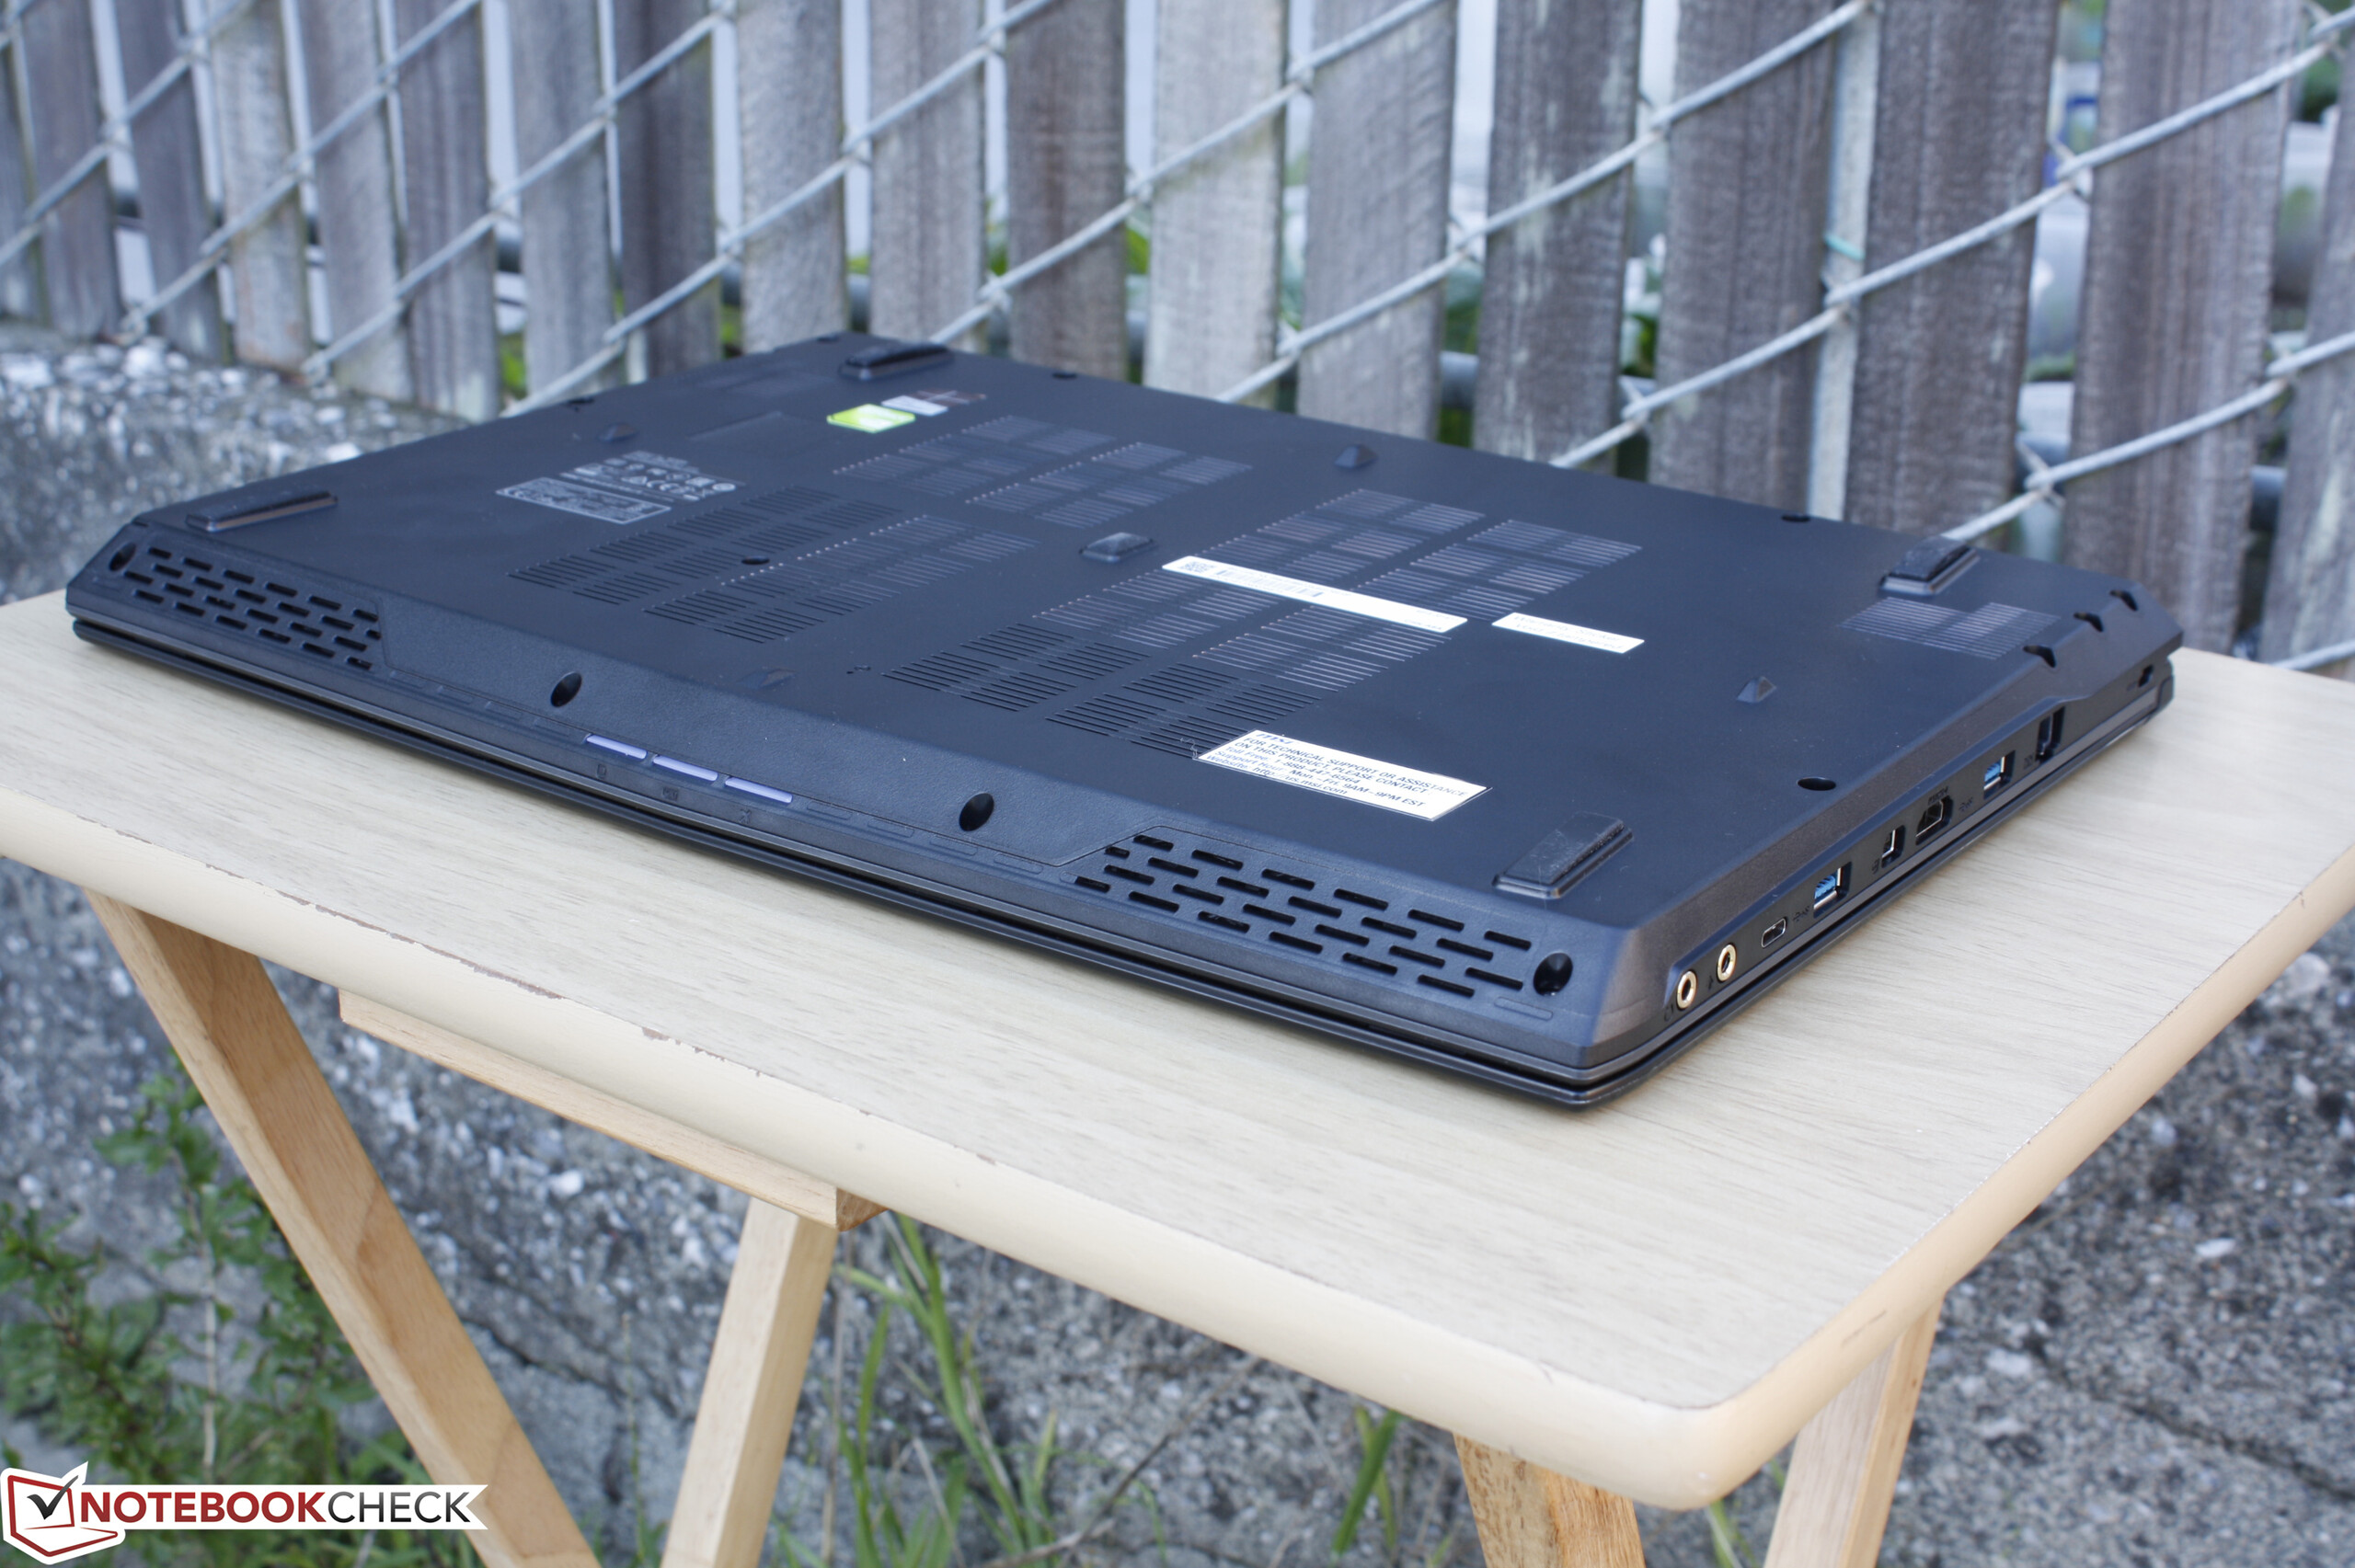
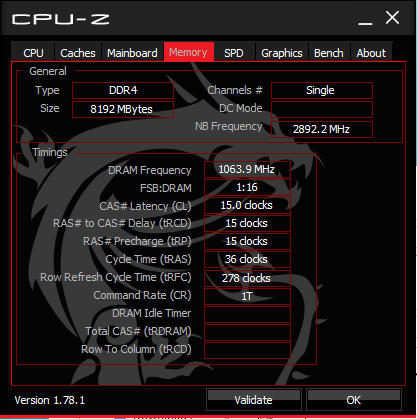
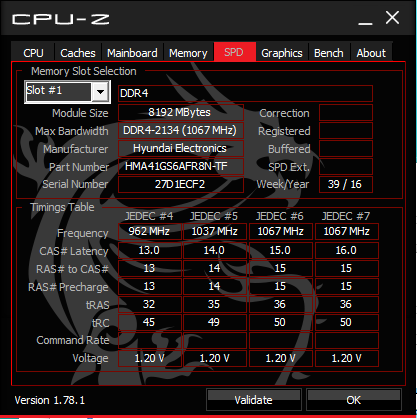
The bottom panel can be removed with just a Philips screwdriver and some patience. Doing so, however, will void the warranty and we did not attempt to disassemble it as a result. The motherboard is otherwise nearly identical to the GP62 as shown here. DDR4 RAM is expandable via the two accessible SODIMM bays.
Warranty
MSI has a standard 24-month coverage for its notebooks while both the internal battery and LCD panel are covered for the first year only. Users must register their purchases with the manufacturer in order to take advantage of the warranty.
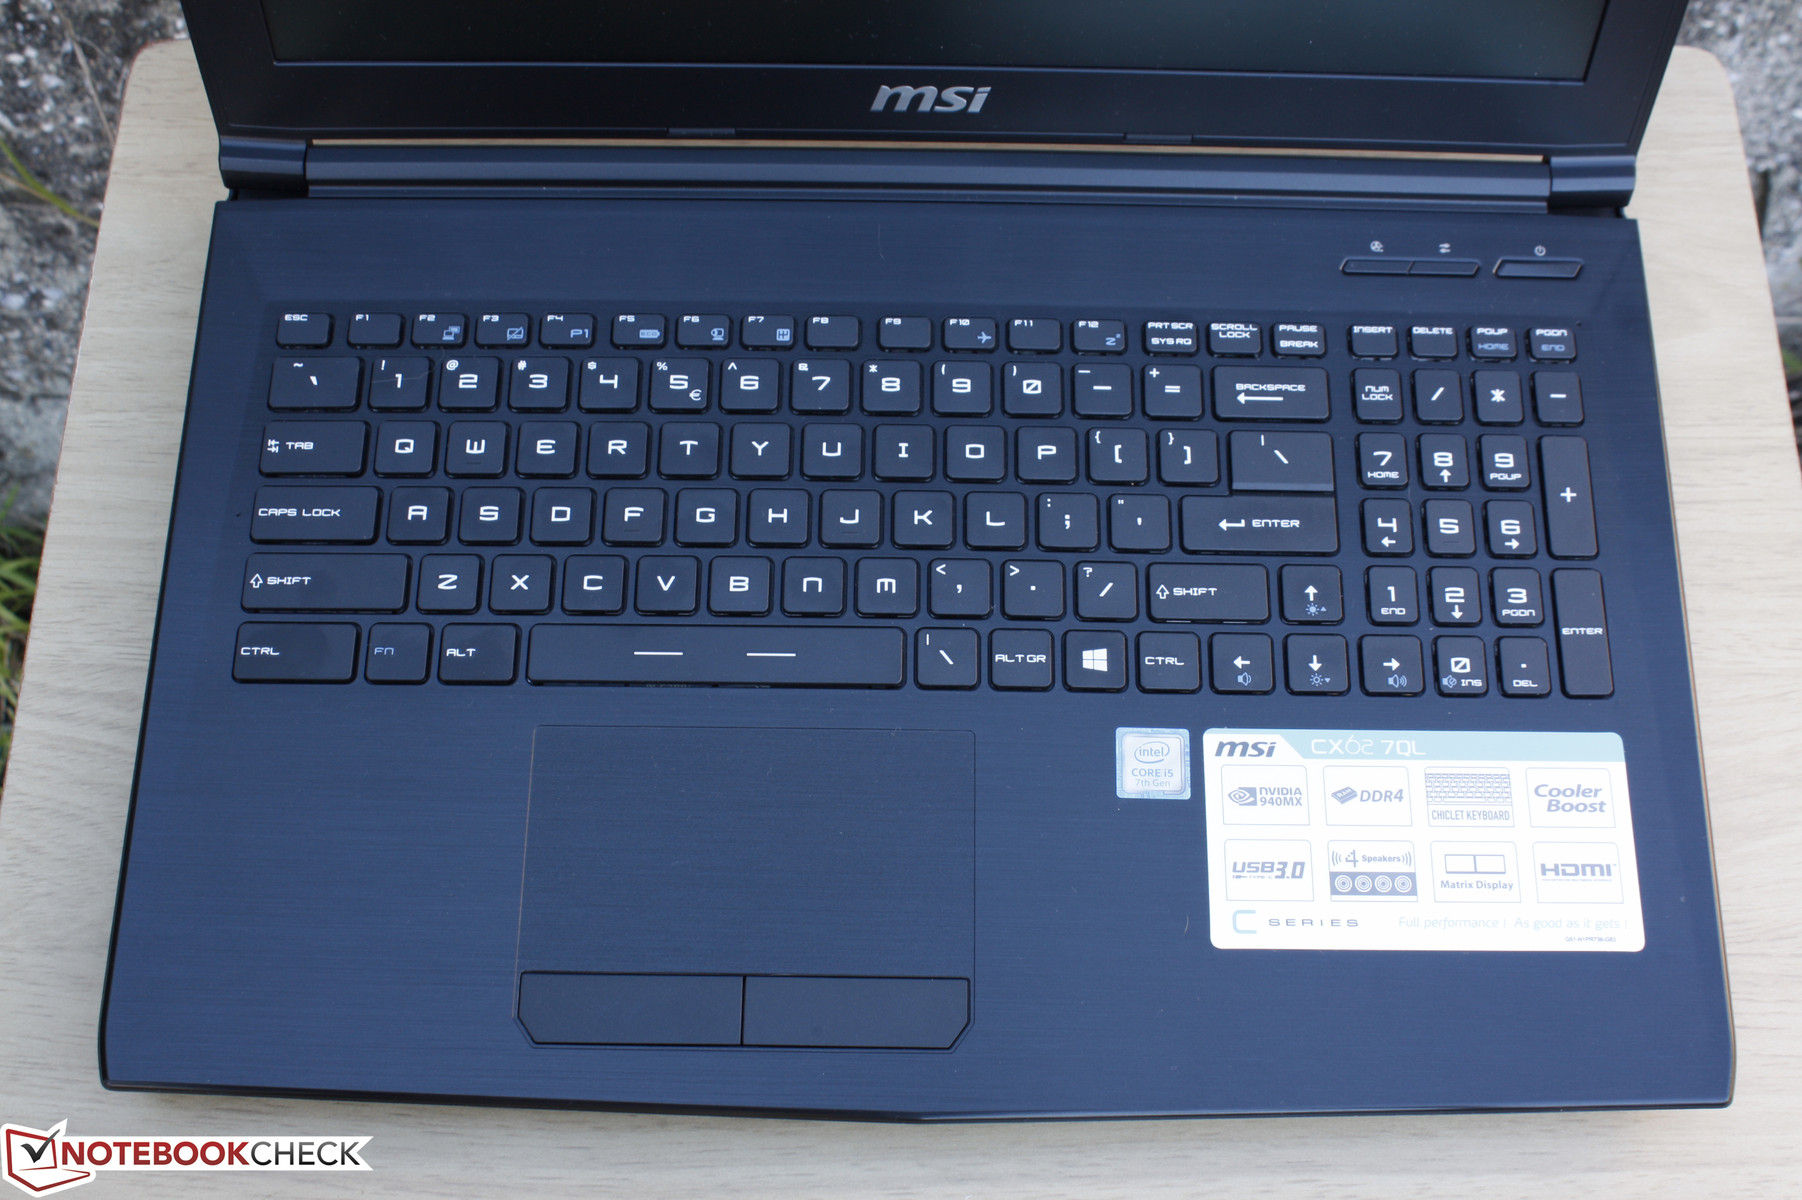
Input Devices
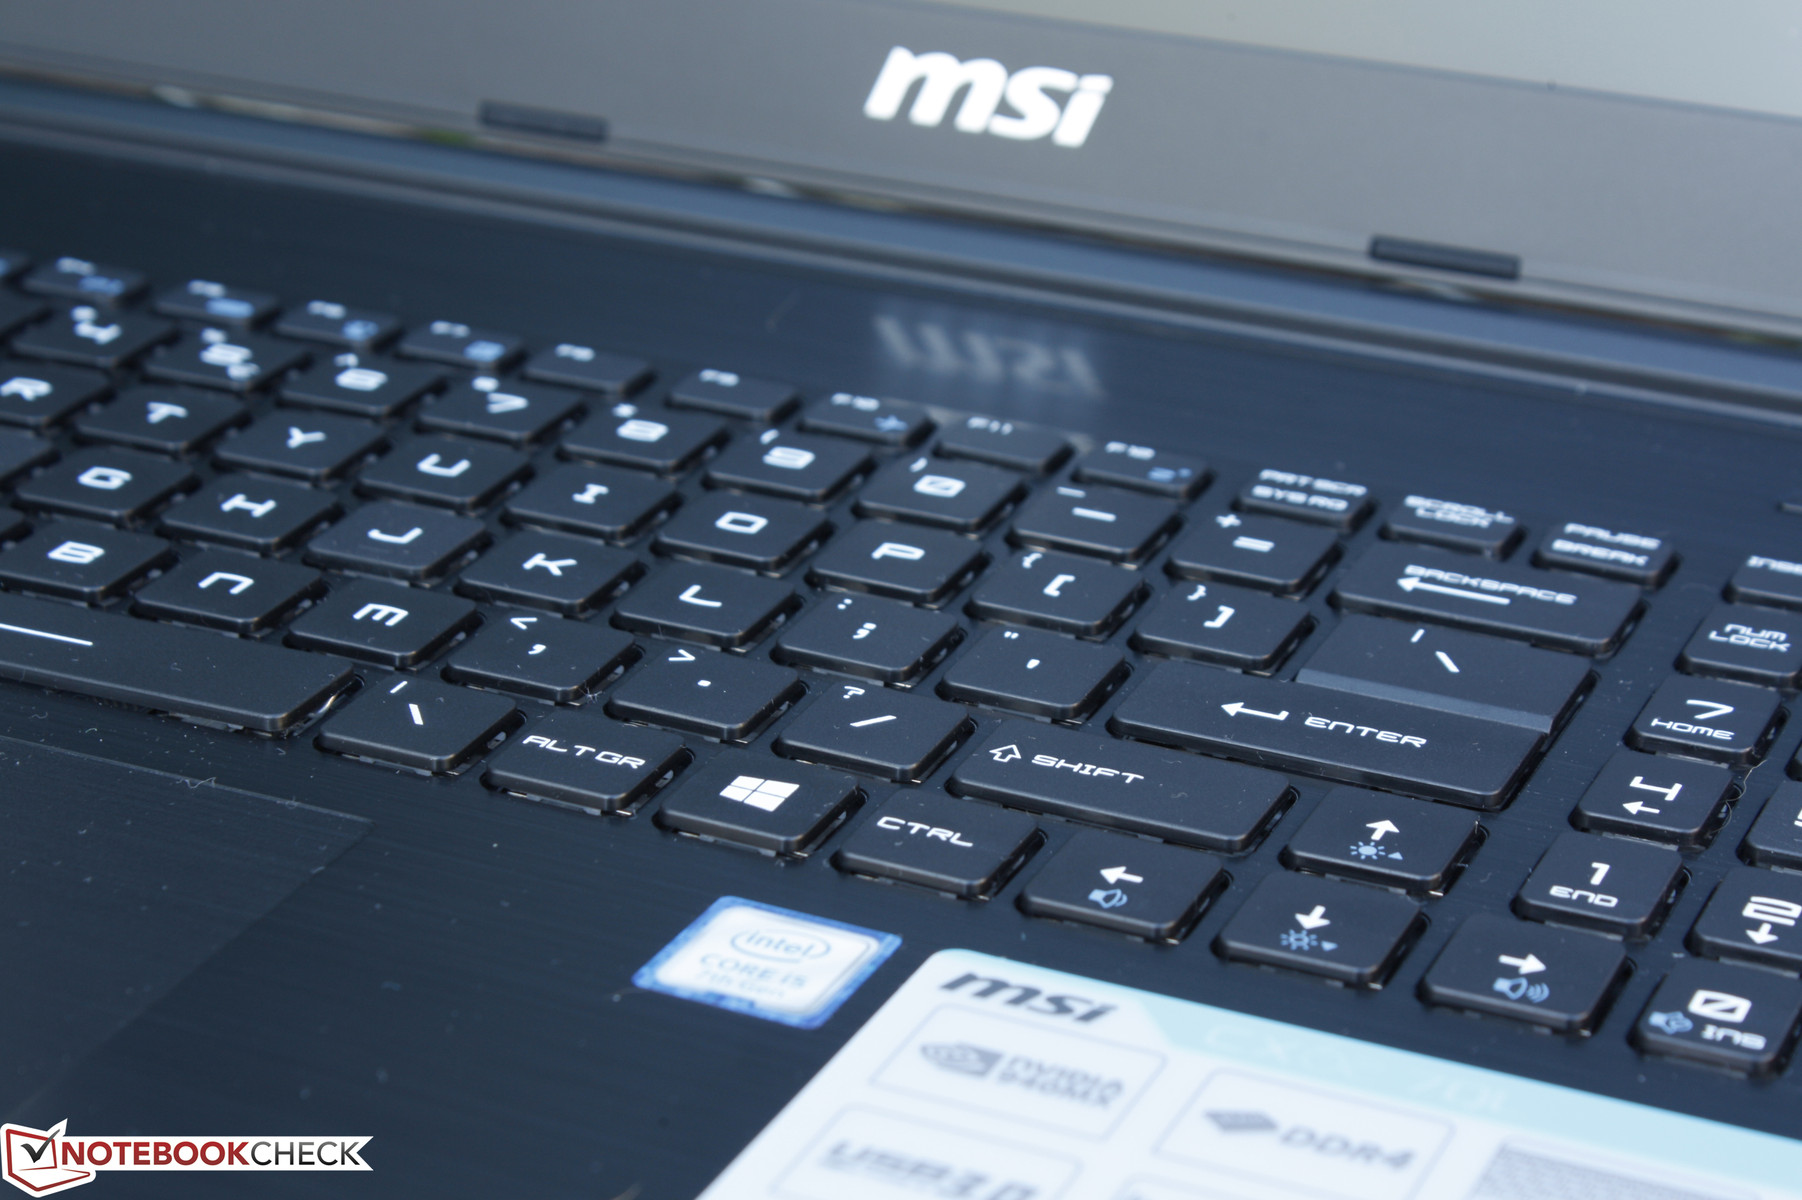
Keyboard
The CX series does not utilize the same SteelSeries keyboard as on MSI's costlier G series even though the layout may appear identical. Instead, the keys here have a cheap plastic feel with shallower feedback when pressed. The center of the keyboard has a tendency to warp which makes the surrounding keys feel softer than they ought to be as well. Clatter is relatively quiet as a result, though we were hoping for an overall better typing experience than an Ultrabook due to the thicker size of the MSI.
Curiously, the manufacturer has elected to keep the Turbo Fan and System Control Manager auxiliary keys from the G series. Both of the non-customizable keys sit adjacent to the Power button and are arguably unnecessary on a mainstream notebook like the CX62. The Turbo Fan feature in particular is not needed considering the low-power hardware inside.
Touchpad
The touchpad is adequately sized (11 x 6 cm) and slightly textured to better distinguish it from the surrounding palm rests. There's little to complain as the surface is firm and rigid in comparison to the center of the keyboard. Cursor control is equally responsive around the edges and corners and the Synaptics software is capable of recognizing up to three fingers simultaneously.
The dedicated mouse keys are shallow in travel but firm in feedback with a loud auditory click. Clicking repeatedly in rapid succession is not tiresome since only a small amount of force is required to push down. The actual keys themselves, however, feel thin with a cheap plastic texture.
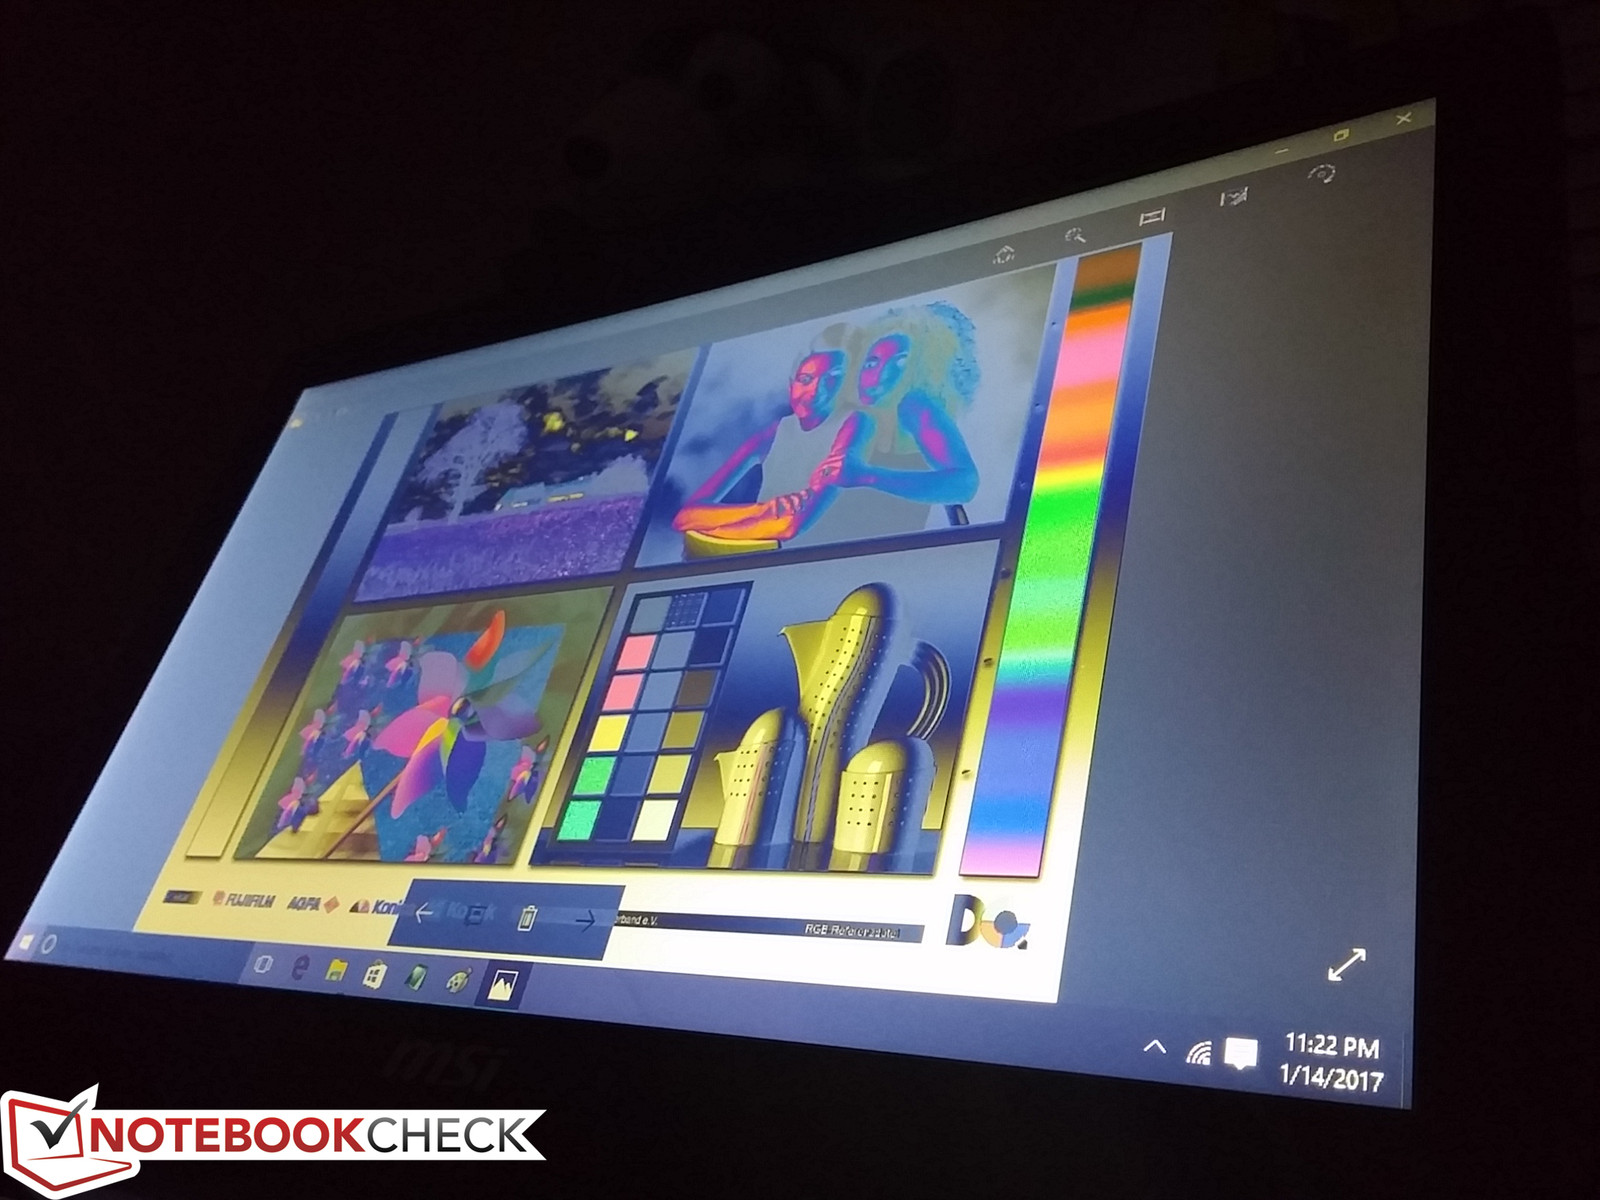
Display
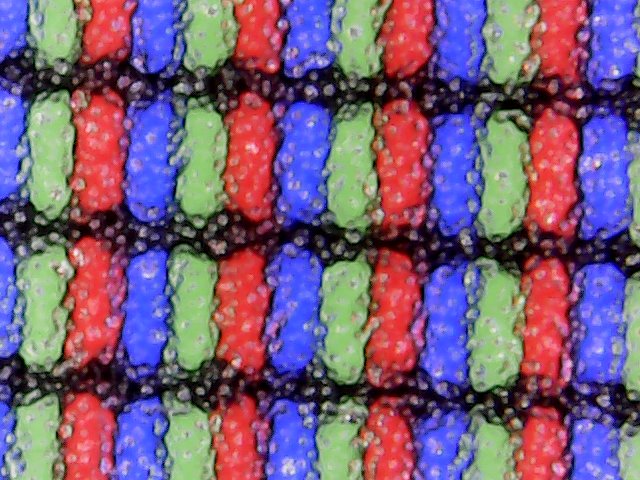
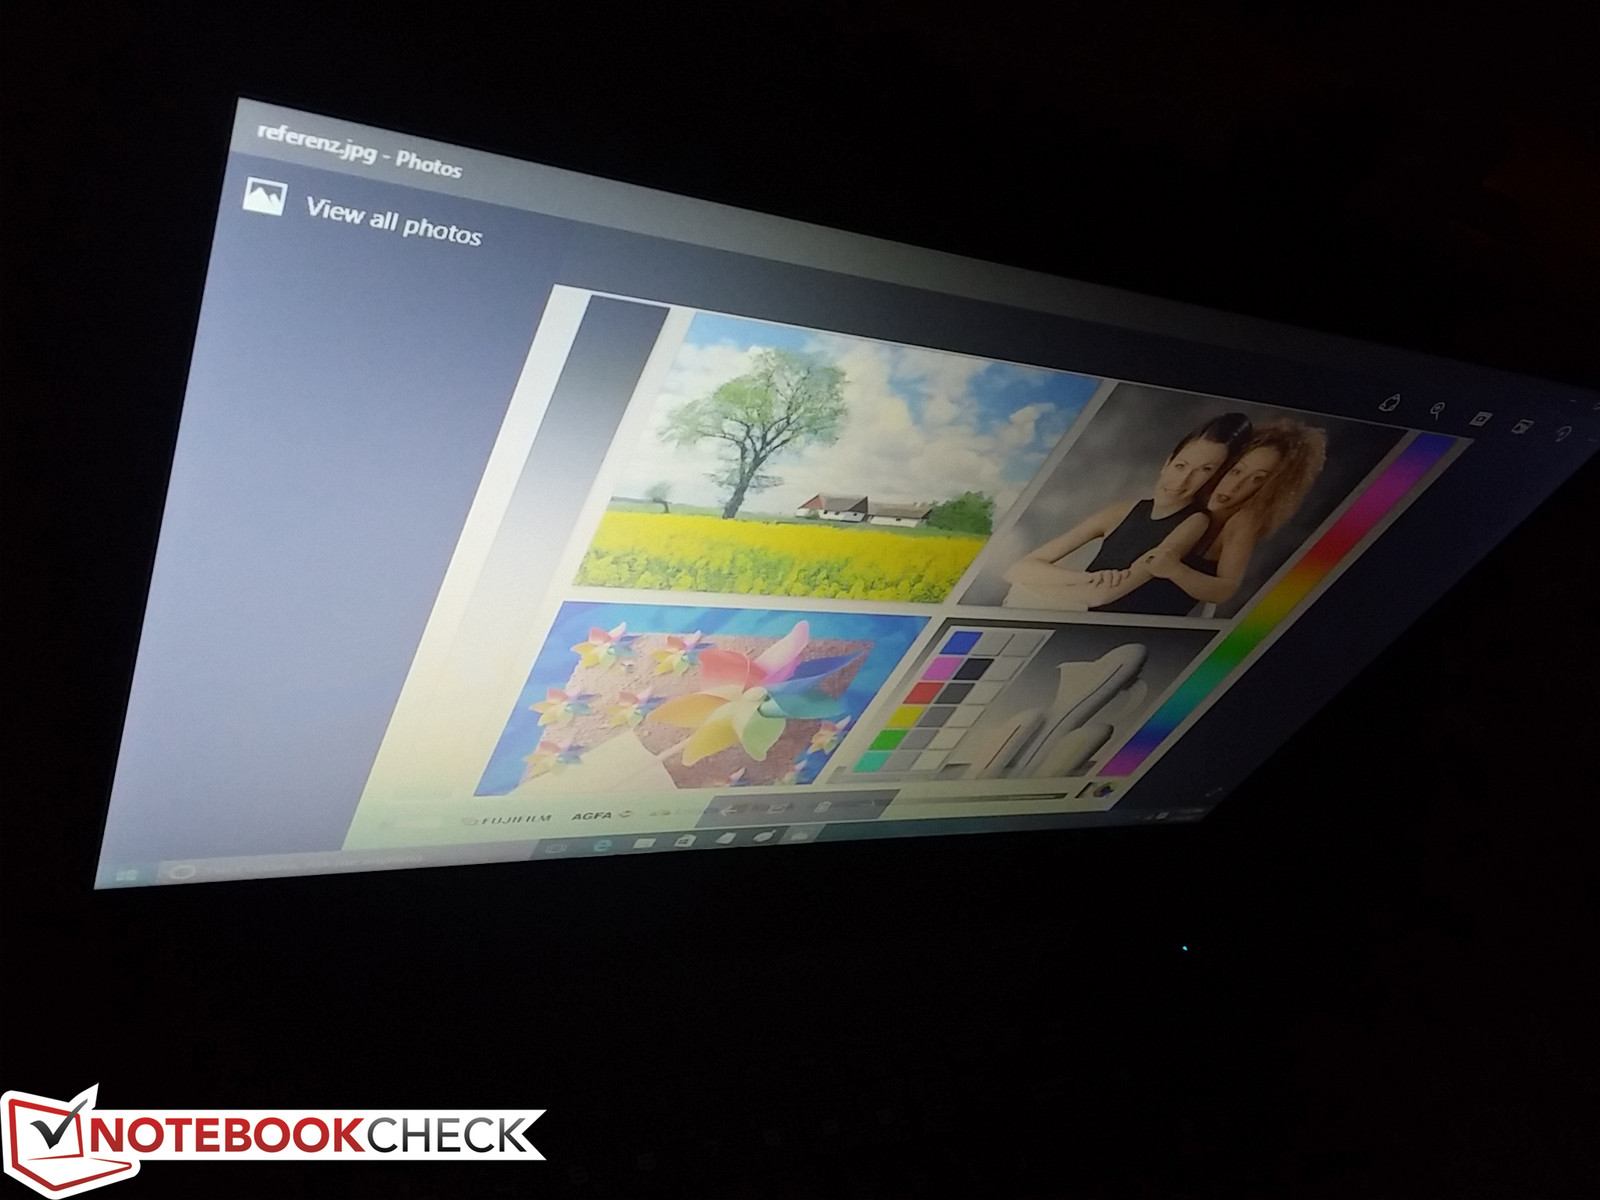
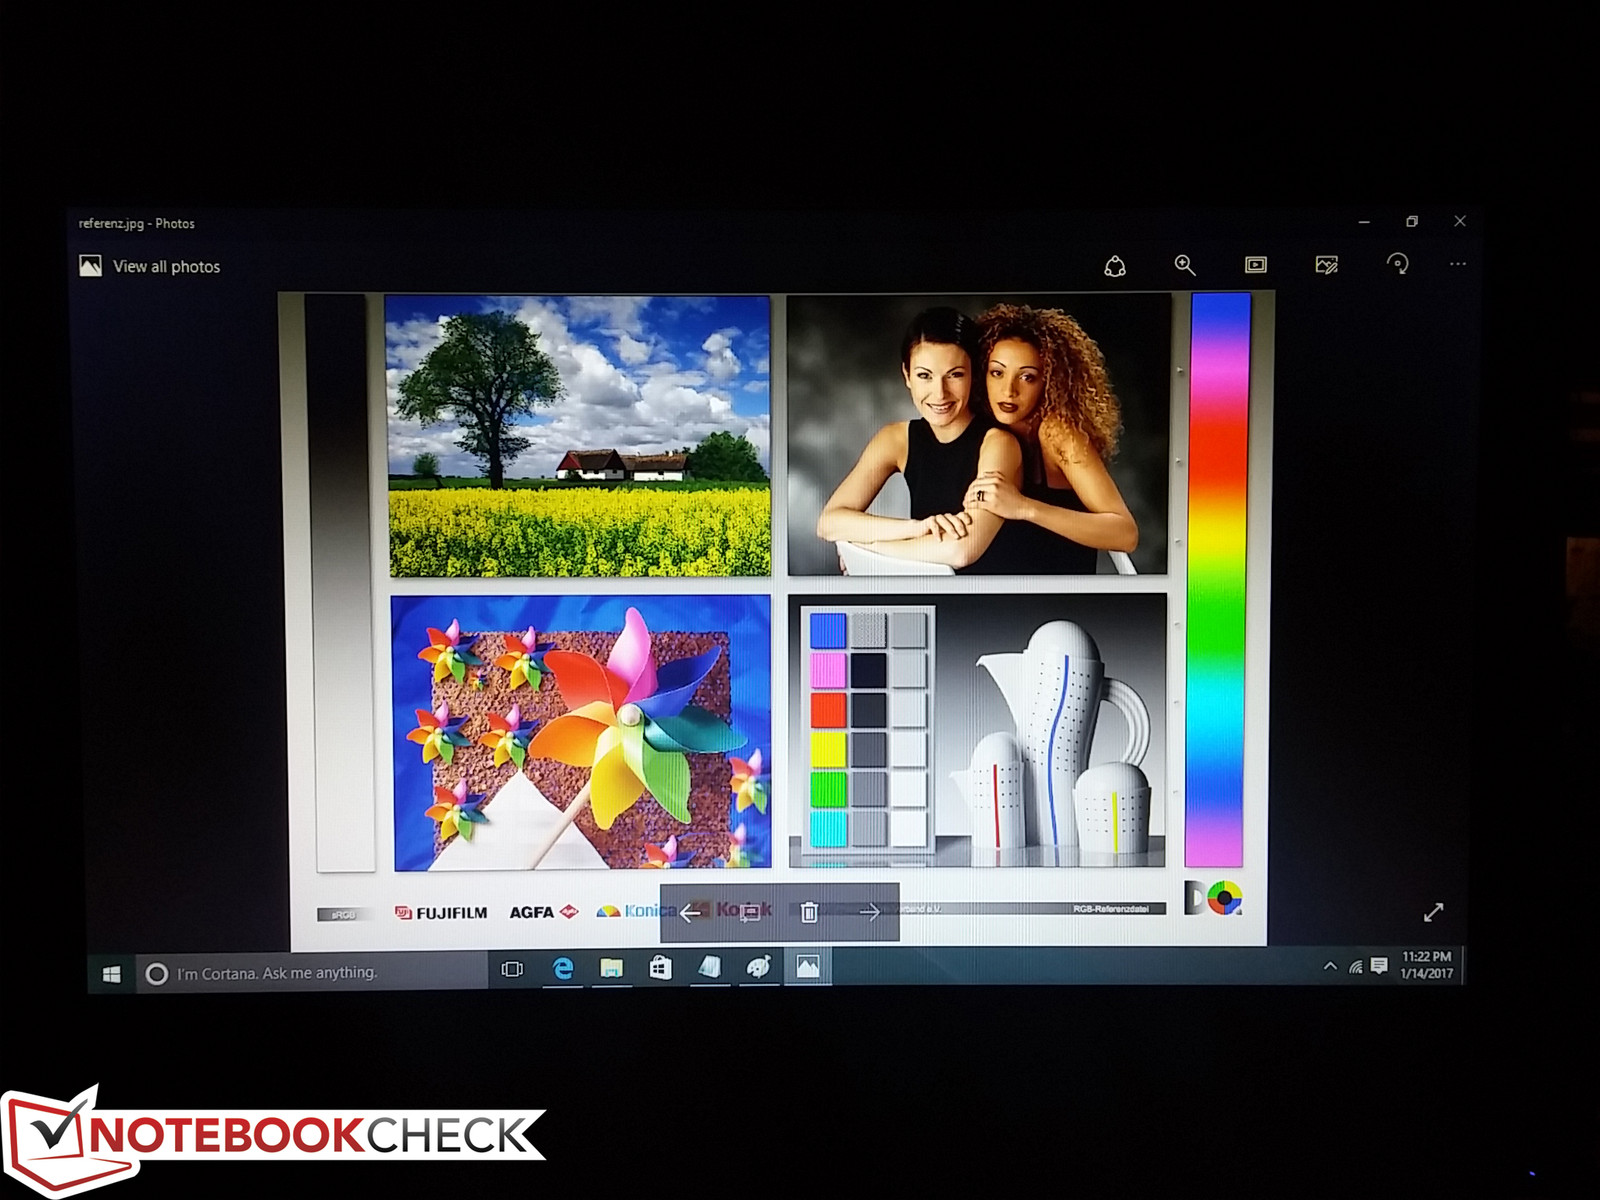
The budget 768p matte TN display is just average at best. Even subjectively we can see that it suffers from slight graininess, low contrast, inaccurate colors, and an overly cool color temperature. Measured contrast is poor at just 260:1 and maximum backlight brightness is equally unimpressive at an average of 195 nits. A search for its LG Philips LGD04AF panel name shows that the low-end SKUs of the Dell Precision 3510 and HP ProBook 450 G4 each carry a similar panel with poor results. Perhaps the only redeeming quality of the panel is that it suffers from just minimal uneven backlight bleeding around the edges and corners.
| |||||||||||||||||||||||||
Brightness Distribution: 85 %
Center on Battery: 196.1 cd/m²
Contrast: 261:1 (Black: 0.75 cd/m²)
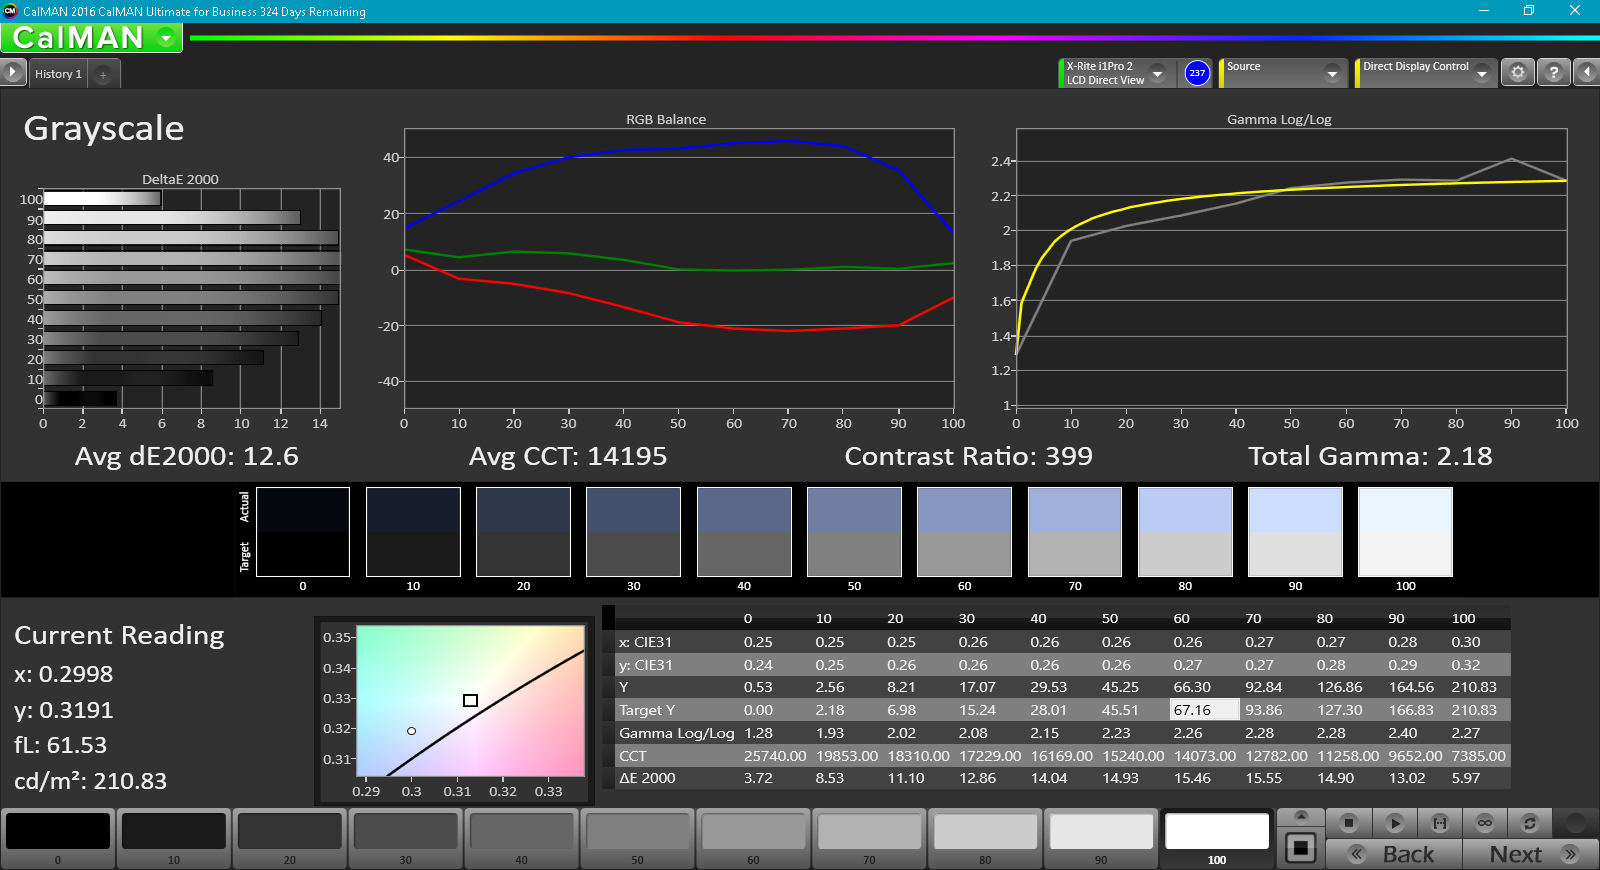
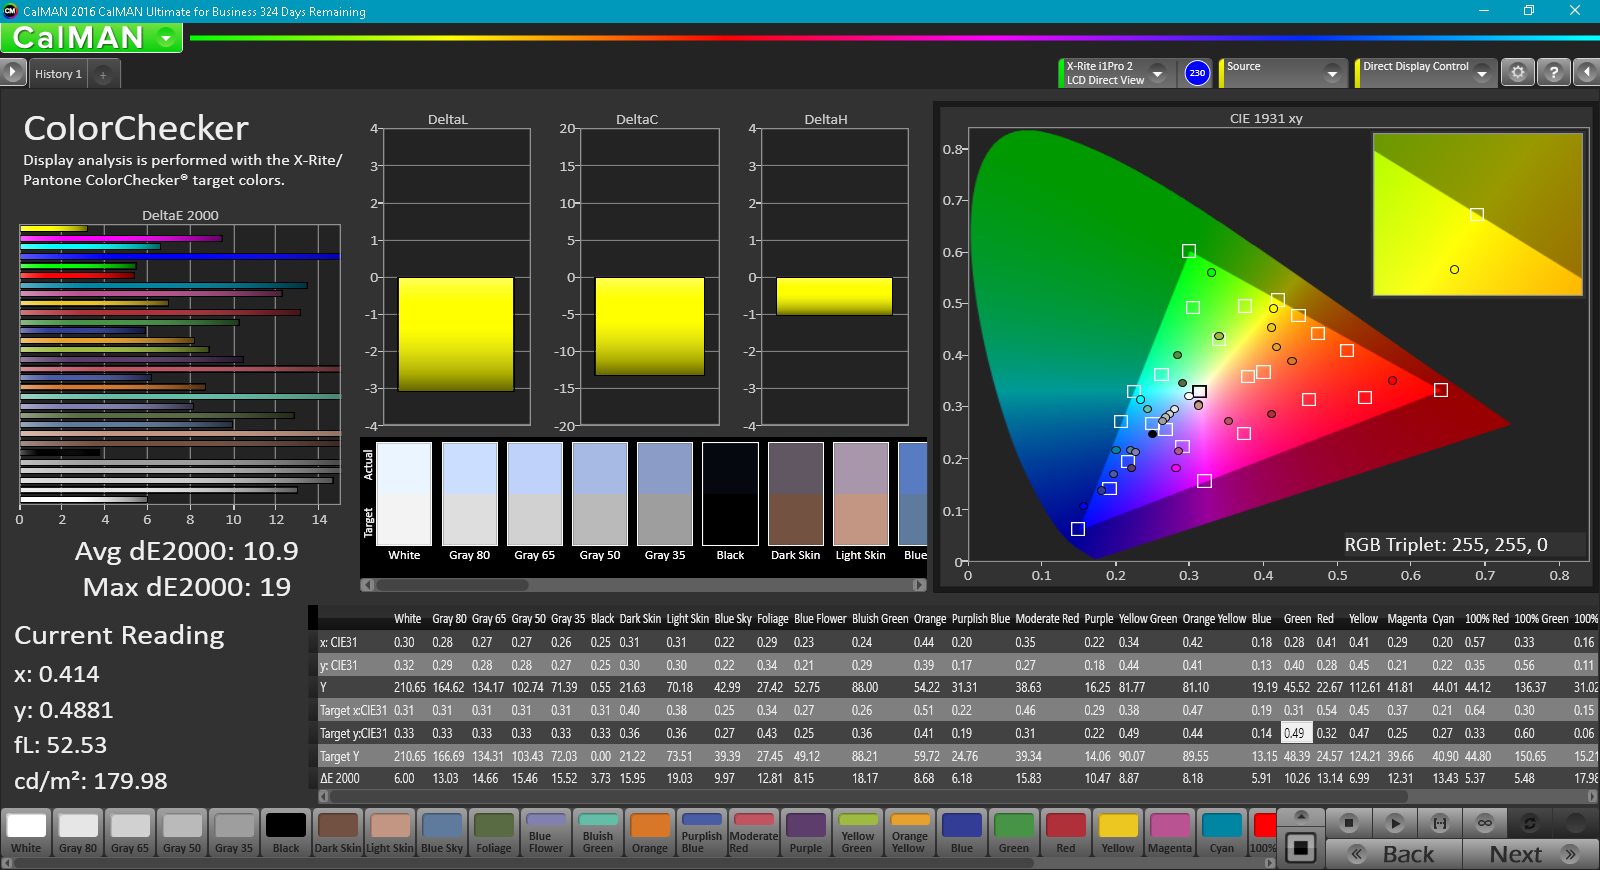
ΔE ColorChecker Calman: 10.9 | ∀{0.5-29.43 Ø4.72}
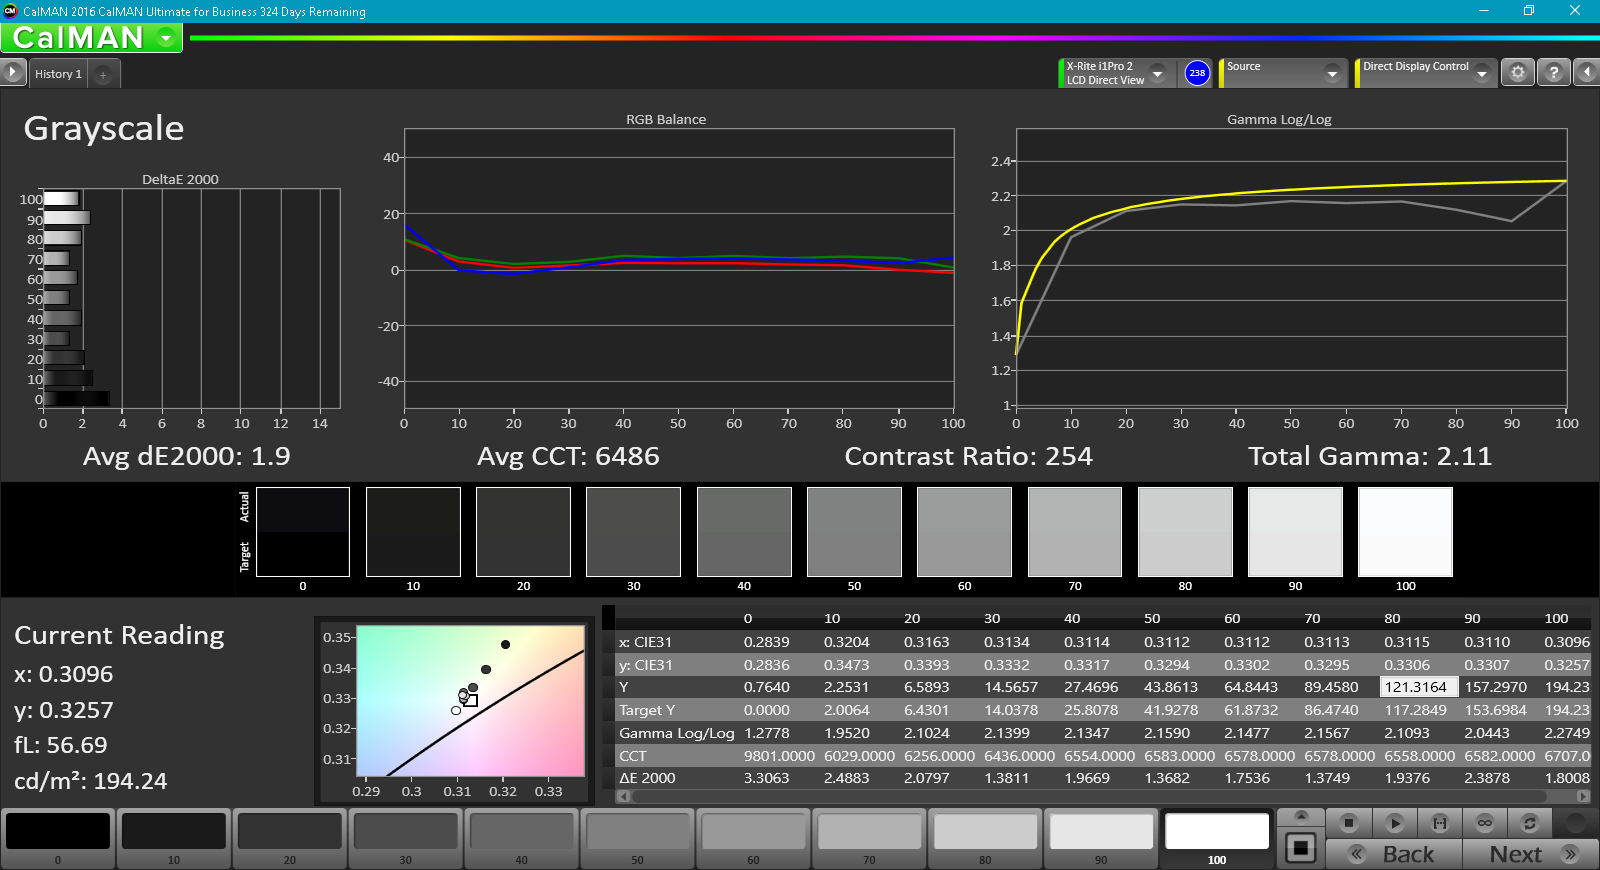
ΔE Greyscale Calman: 12.6 | ∀{0.09-98 Ø4.97}
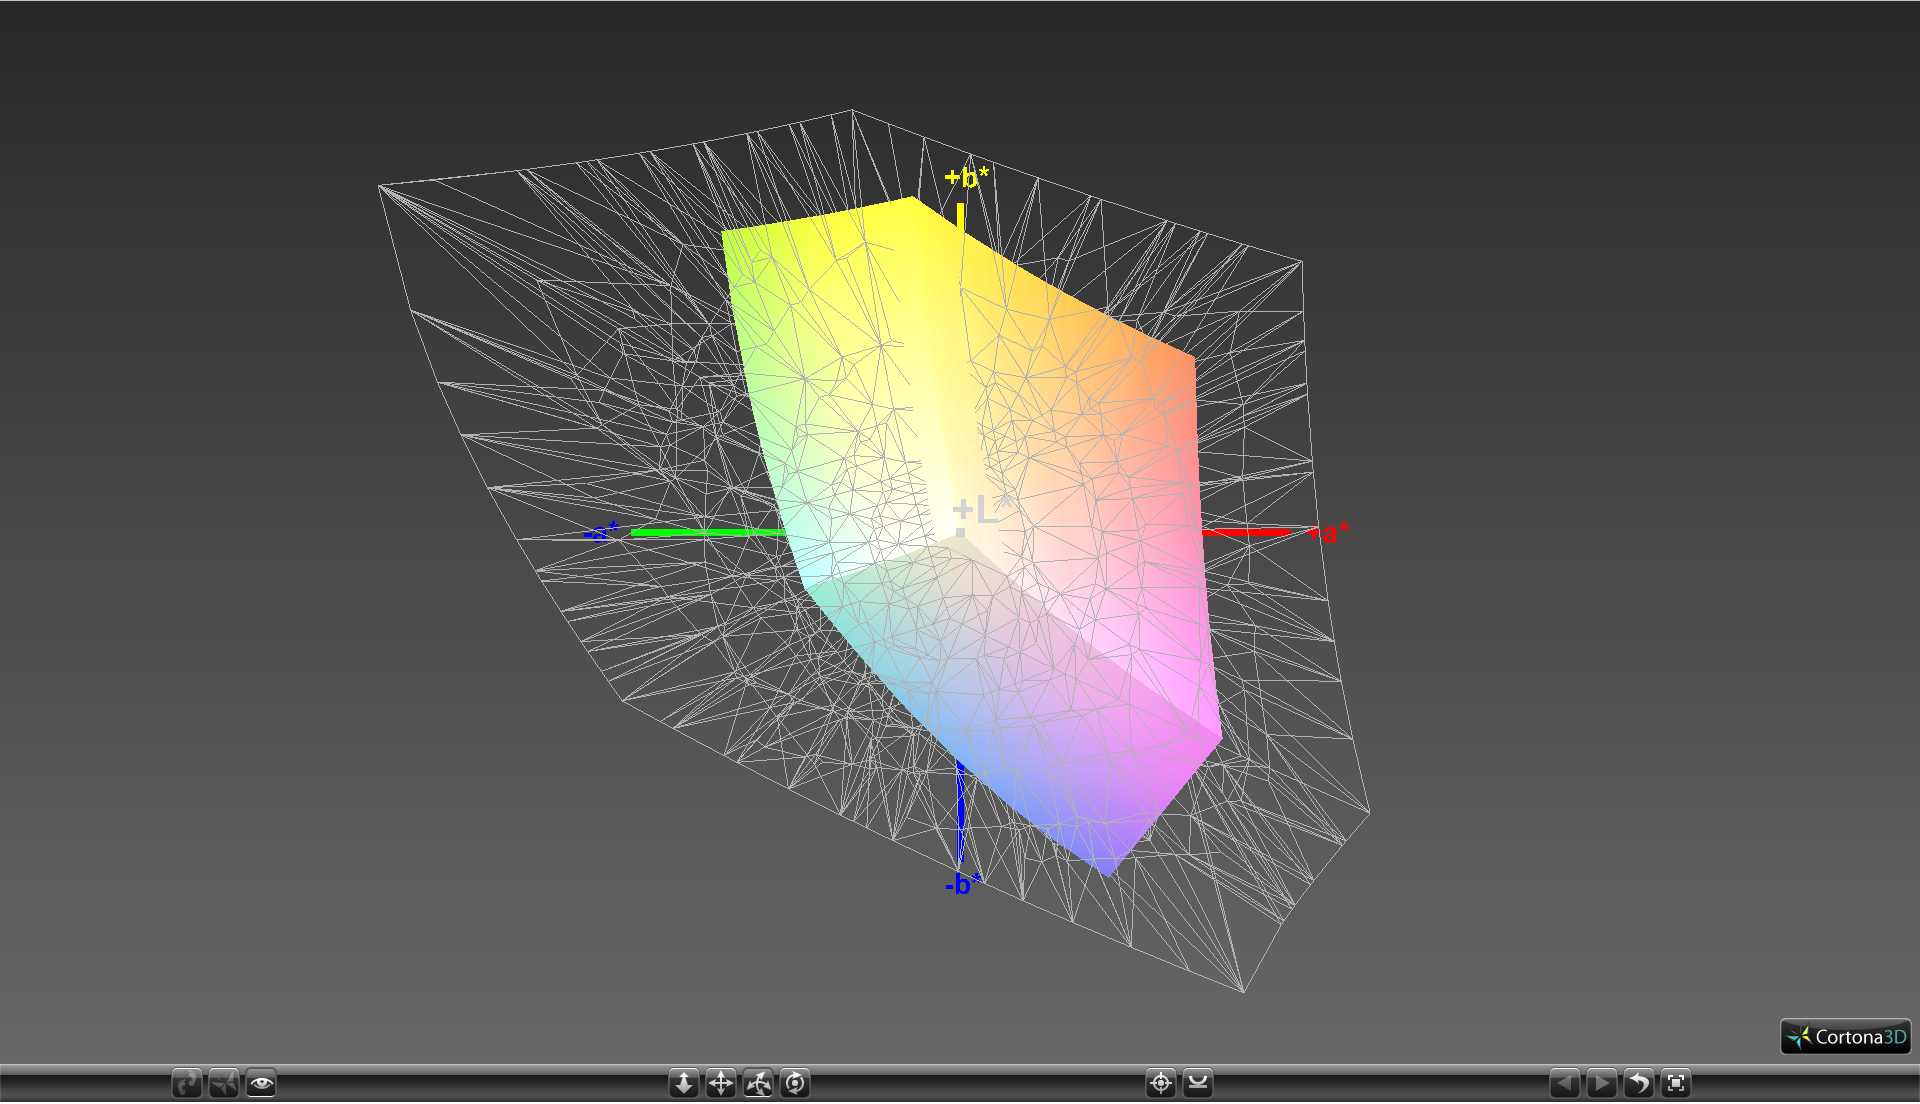
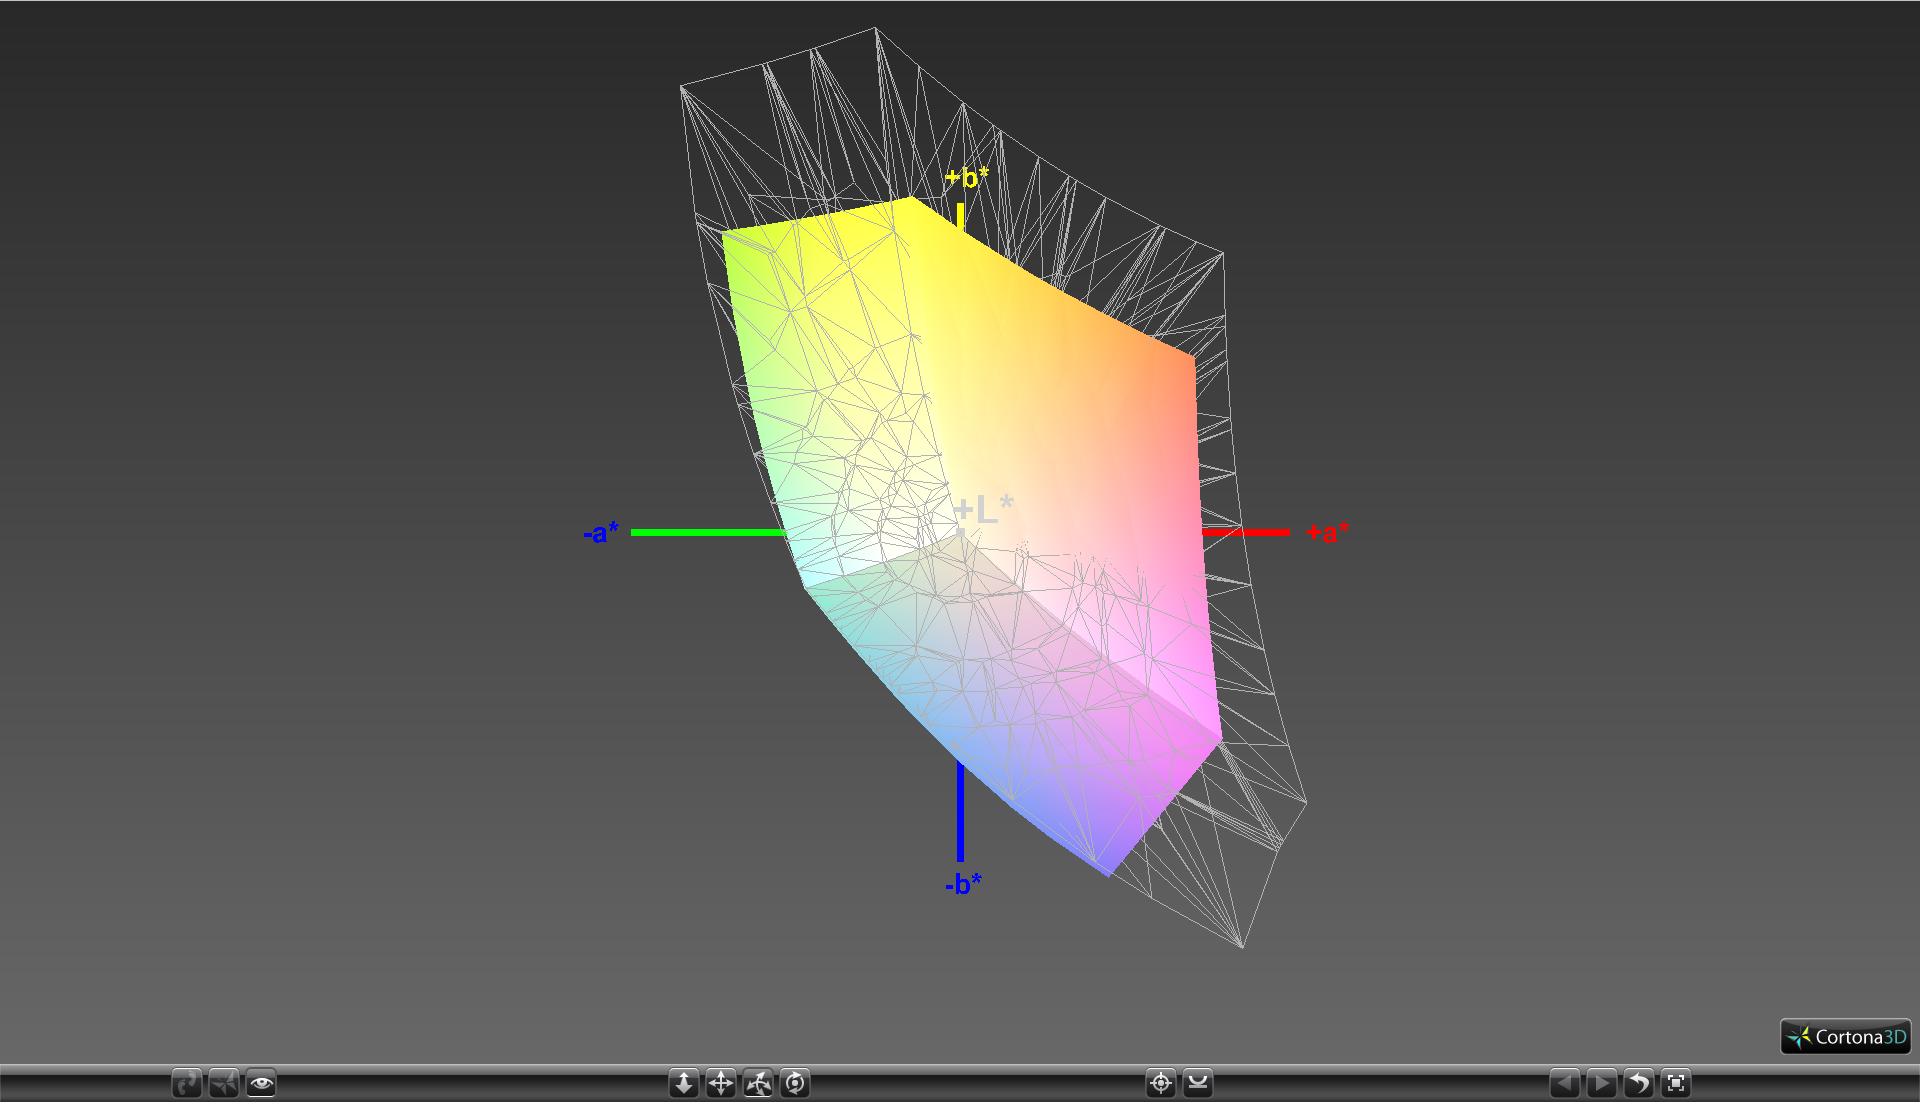
60.6% sRGB (Argyll 1.6.3 3D)
38.4% AdobeRGB 1998 (Argyll 1.6.3 3D)
41.56% AdobeRGB 1998 (Argyll 3D)
60.5% sRGB (Argyll 3D)
40.22% Display P3 (Argyll 3D)
Gamma: 2.18
CCT: 14195 K
| MSI CX62 7QL TN LED, 15.6", 1366x768 | HP Pavilion 15t-au100 CTO (W0P31AV) BOE0693, IPS, 15.6", 1920x1080 | Lenovo Yoga 510-15IKB 80VC000XGE BOE HF NV156FHM-N42, IPS, 15.6", 1920x1080 | Asus Zenbook UX510UW-CN044T LG Philips LP156WF6-SPB6, IPS, 15.6", 1920x1080 | MSI GL62-6QFi781H11 CMN N156HGE-EAL (CMN15D2), TN LED, 15.6", 1920x1080 | |
|---|---|---|---|---|---|
| Display | 8% | 4% | 42% | 93% | |
| Display P3 Coverage (%) | 40.22 | 43.27 8% | 41.92 4% | 61.5 53% | 85.8 113% |
| sRGB Coverage (%) | 60.5 | 64.9 7% | 62.9 4% | 80.4 33% | 99.8 65% |
| AdobeRGB 1998 Coverage (%) | 41.56 | 44.71 8% | 43.32 4% | 58.8 41% | 84.1 102% |
| Response Times | -2% | 1% | 14% | 17% | |
| Response Time Grey 50% / Grey 80% * (ms) | 50.4 ? | 42 ? 17% | 53 ? -5% | 40 ? 21% | 43 ? 15% |
| Response Time Black / White * (ms) | 28 ? | 33.6 ? -20% | 26 ? 7% | 26 ? 7% | 23 ? 18% |
| PWM Frequency (Hz) | 198.4 | 50 ? | 1000 ? | ||
| Screen | 46% | 70% | 65% | 31% | |
| Brightness middle (cd/m²) | 196.1 | 186.5 -5% | 236 20% | 326 66% | 216 10% |
| Brightness (cd/m²) | 196 | 174 -11% | 212 8% | 316 61% | 202 3% |
| Brightness Distribution (%) | 85 | 69 -19% | 78 -8% | 80 -6% | 83 -2% |
| Black Level * (cd/m²) | 0.75 | 0.18 76% | 0.18 76% | 0.35 53% | 0.48 36% |
| Contrast (:1) | 261 | 1036 297% | 1311 402% | 931 257% | 450 72% |
| Colorchecker dE 2000 * | 10.9 | 5.7 48% | 3.92 64% | 5.49 50% | 9.98 8% |
| Colorchecker dE 2000 max. * | 19 | 22.5 -18% | 9.2 52% | 11.36 40% | 17.12 10% |
| Greyscale dE 2000 * | 12.6 | 4.4 65% | 2.35 81% | 4.84 62% | 10.91 13% |
| Gamma | 2.18 101% | 2.35 94% | 2.34 94% | 2.23 99% | 2.31 95% |
| CCT | 14195 46% | 6963 93% | 6161 106% | 5971 109% | 13185 49% |
| Color Space (Percent of AdobeRGB 1998) (%) | 38.4 | 44.71 16% | 40 4% | 53 38% | 75 95% |
| Color Space (Percent of sRGB) (%) | 60.6 | 64.95 7% | 63 4% | 80 32% | 100 65% |
| Total Average (Program / Settings) | 17% /
32% | 25% /
48% | 40% /
54% | 47% /
42% |
* ... smaller is better
Color coverage is only about 61 percent of the sRGB standard compared to 80 or 100 percent on the Asus UX510UW or MSI GL62, respectively. This has little impact on gaming, but colors will appear less vibrant especially to digital graphics artists or users accustomed to higher quality displays.
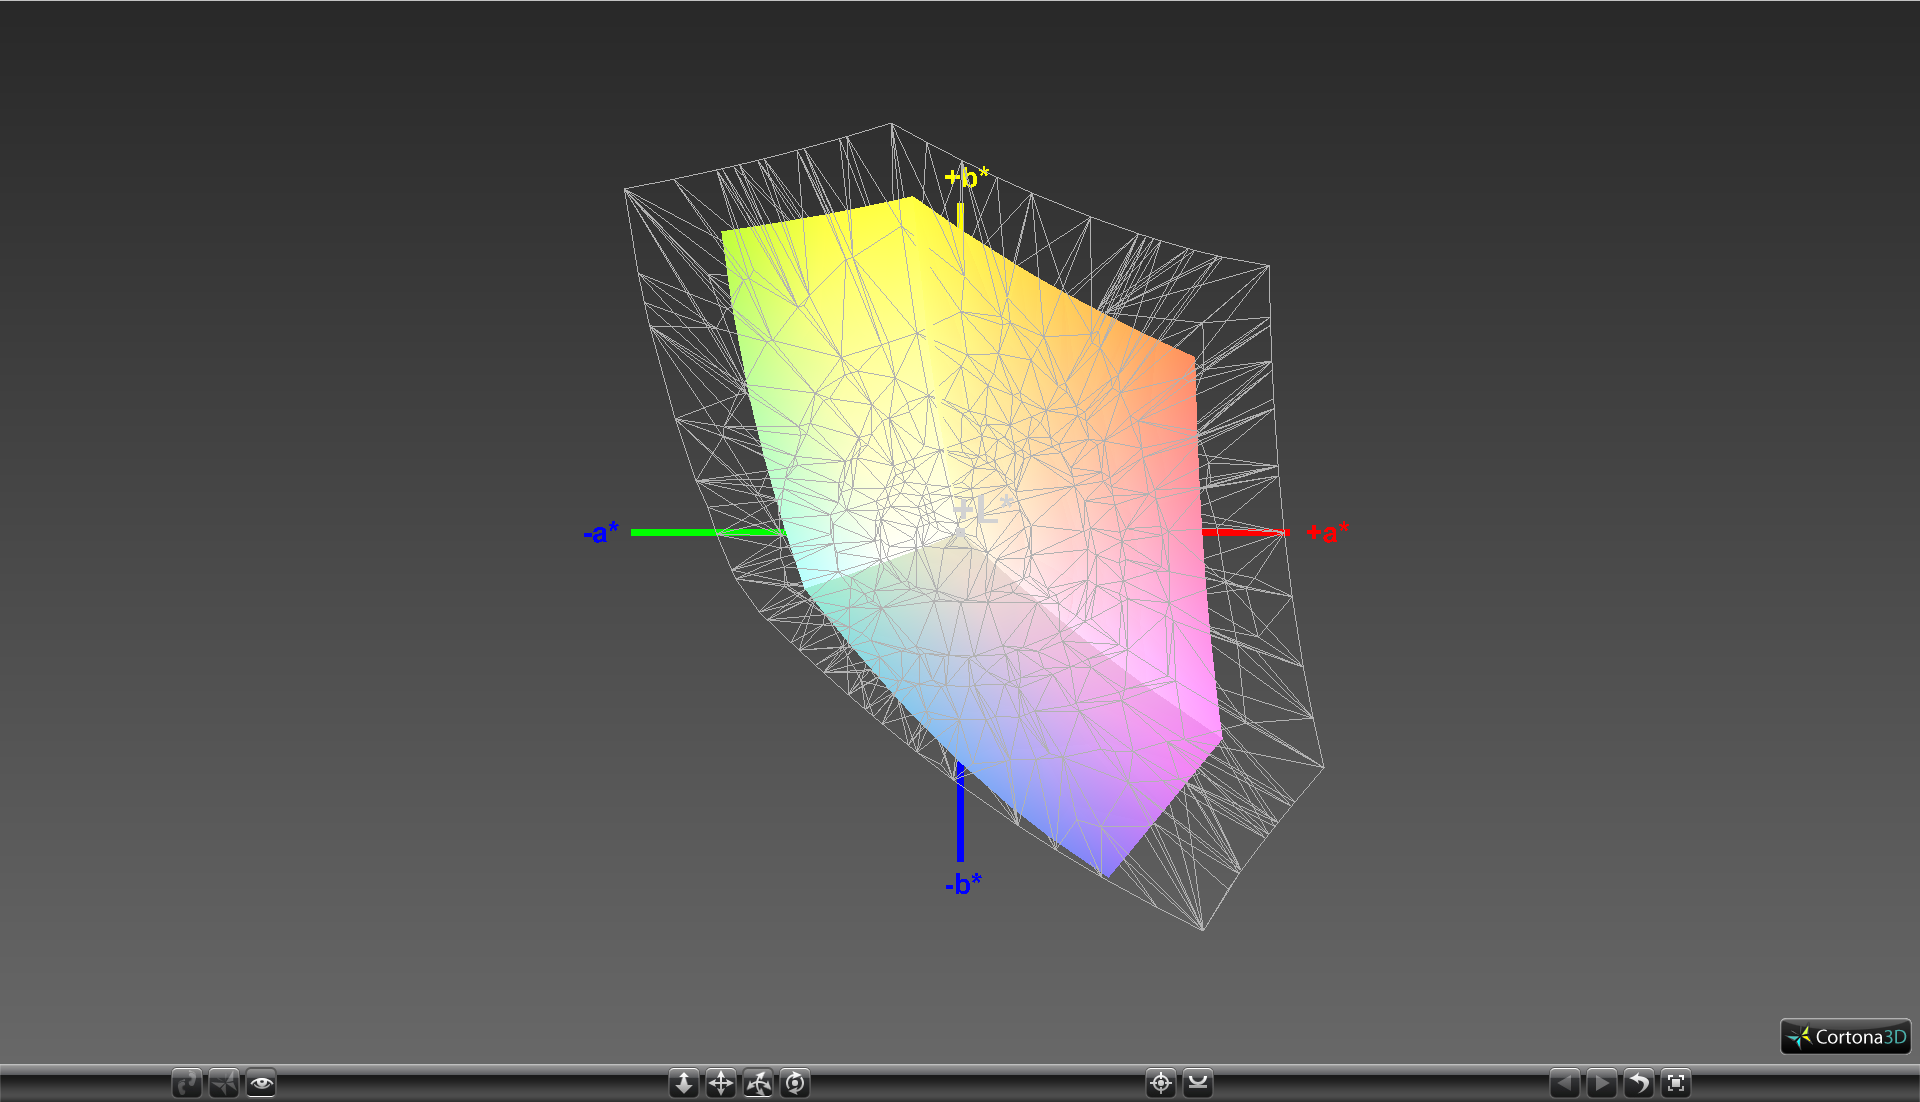
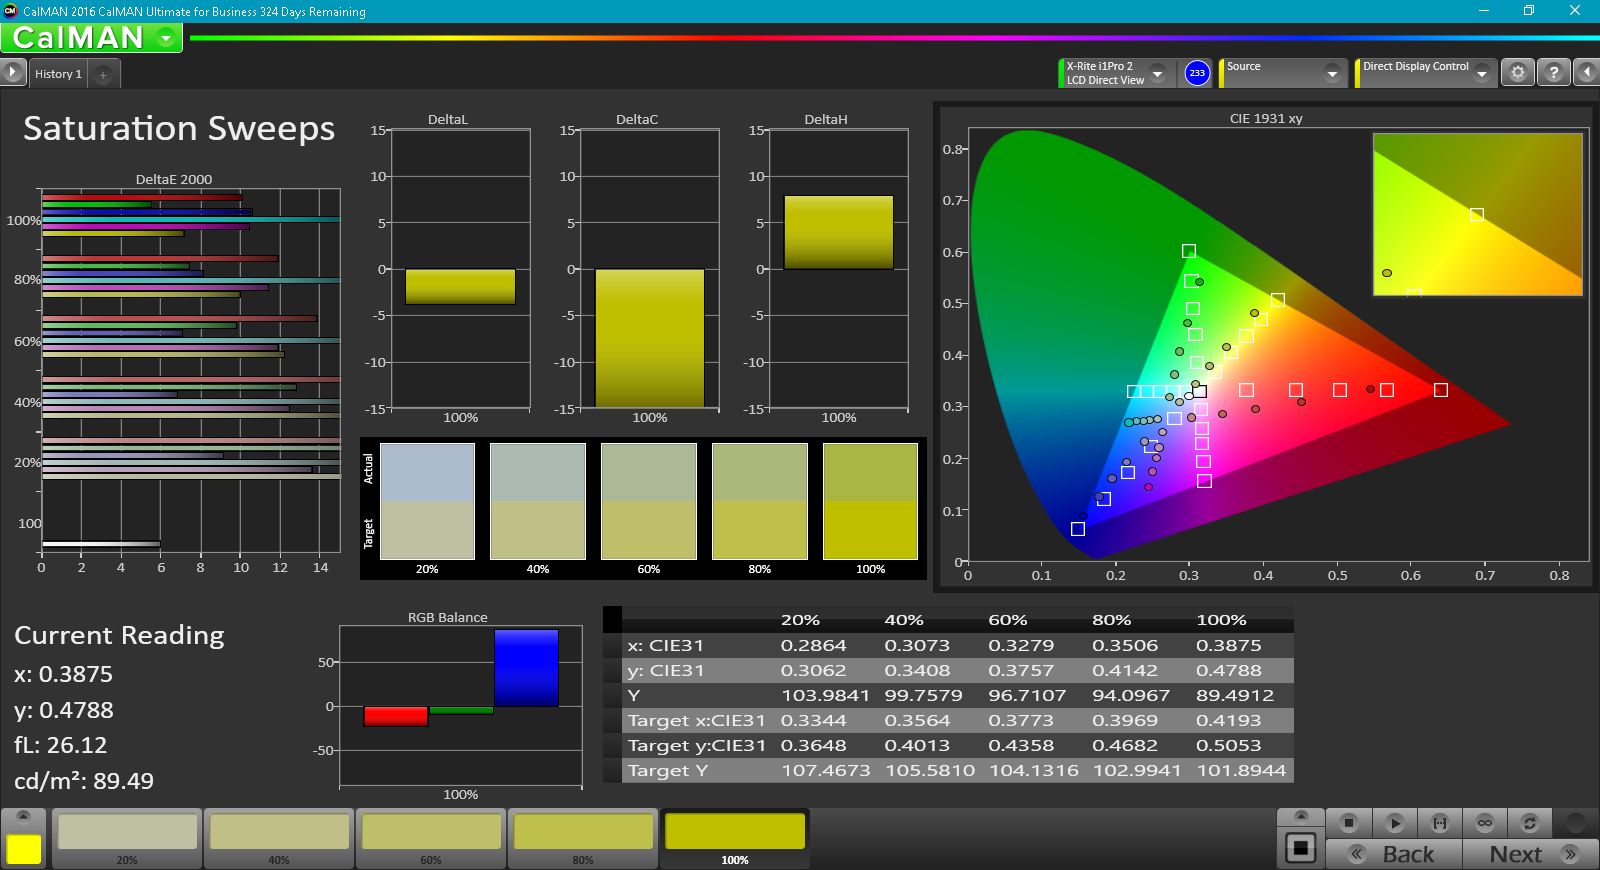
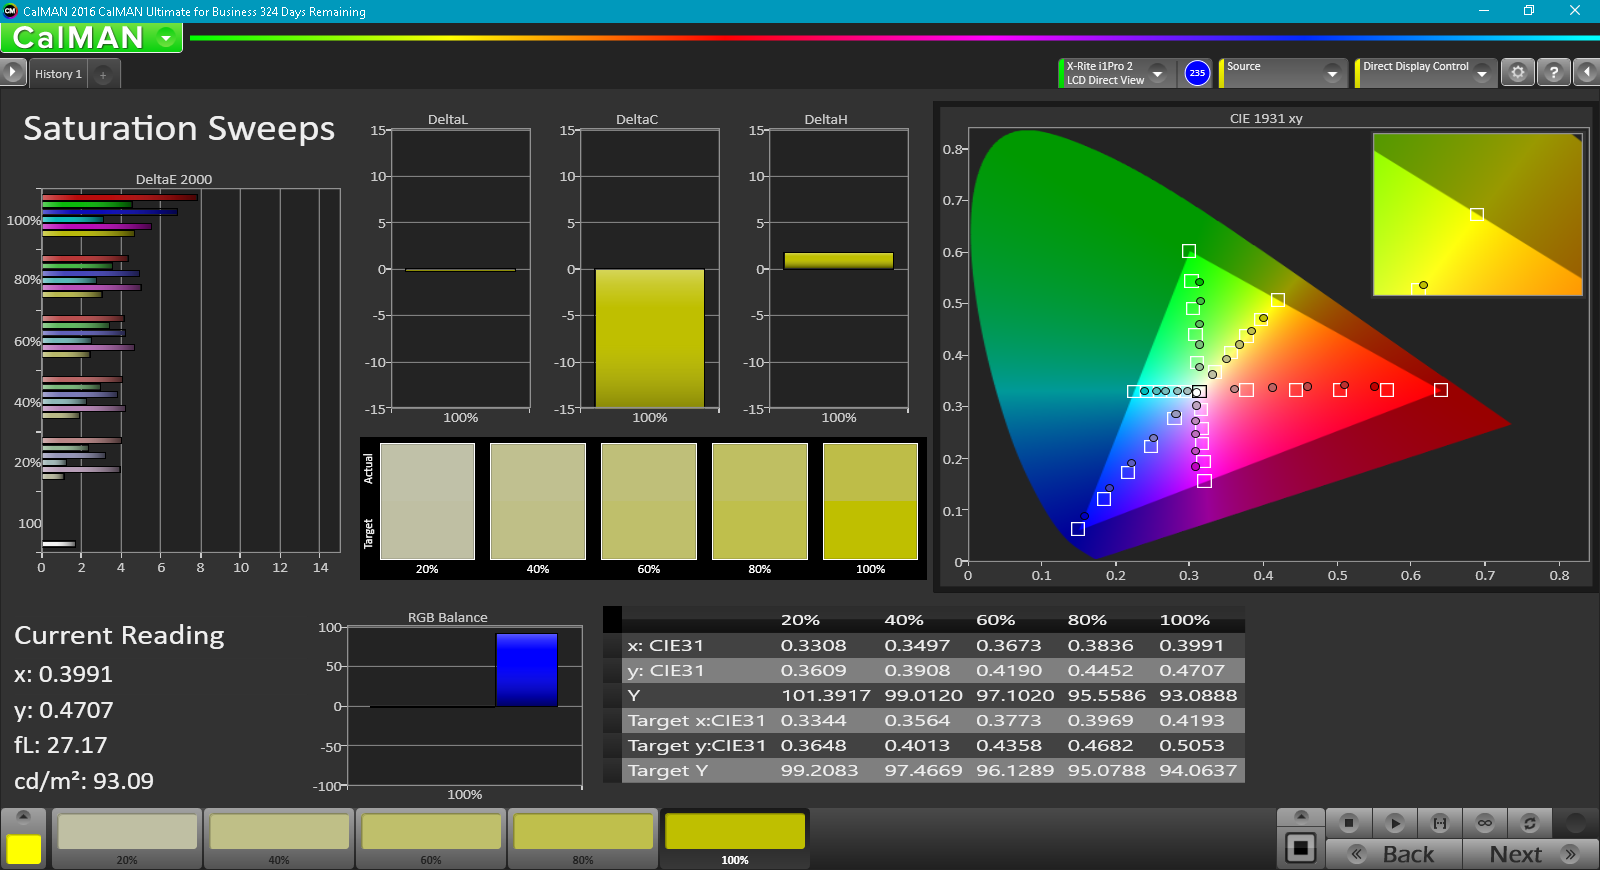
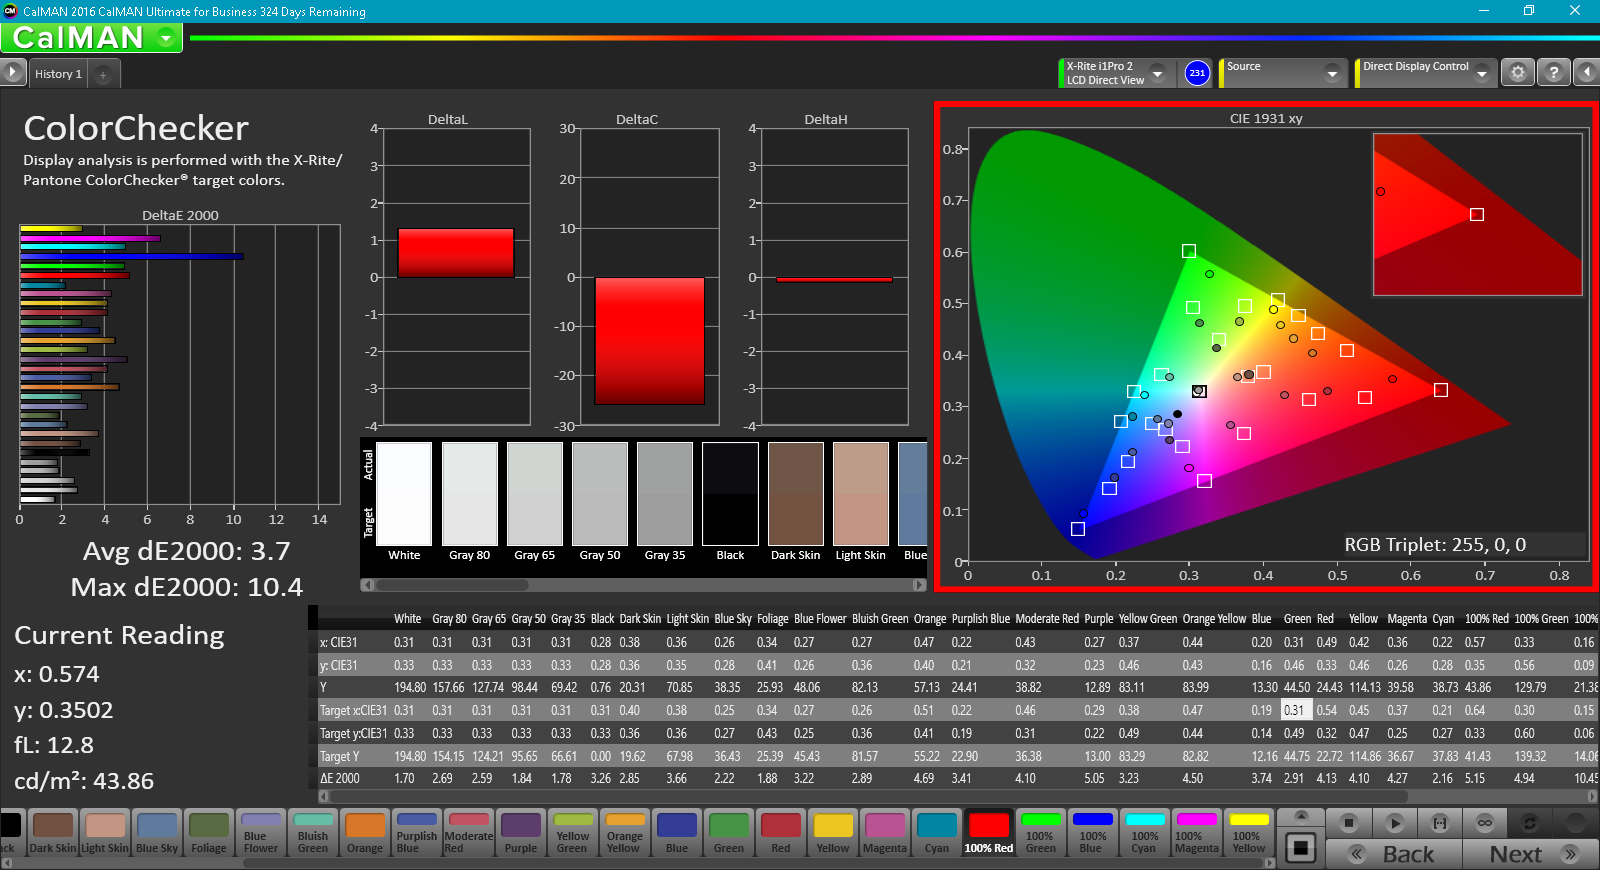
Further analyses with a X-Rite spectrophotometer confirm the poor colors and grayscale. Color temperature is much too cool as is common on many budget TN displays. A calibration improves the display dramatically in terms of grayscale and RGB balance and is highly recommended for any CX62 owners with a similar panel. Colors still become less accurate the higher the saturation level due to the imperfecct sRGB coverage of the display.
Display Response Times
| ↔ Response Time Black to White | ||
|---|---|---|
| 28 ms ... rise ↗ and fall ↘ combined | ↗ 10 ms rise | 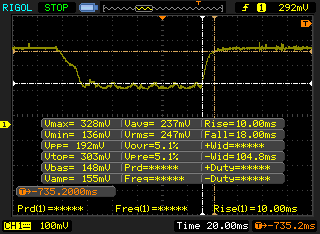 |
| ↘ 18 ms fall | ||
| The screen shows relatively slow response rates in our tests and may be too slow for gamers. In comparison, all tested devices range from 0.1 (minimum) to 240 (maximum) ms. » 71 % of all devices are better. This means that the measured response time is worse than the average of all tested devices (19.8 ms). | ||
| ↔ Response Time 50% Grey to 80% Grey | ||
| 50.4 ms ... rise ↗ and fall ↘ combined | ↗ 24 ms rise | 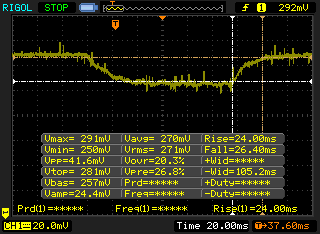 |
| ↘ 26.4 ms fall | ||
| The screen shows slow response rates in our tests and will be unsatisfactory for gamers. In comparison, all tested devices range from 0.165 (minimum) to 636 (maximum) ms. » 87 % of all devices are better. This means that the measured response time is worse than the average of all tested devices (31 ms). | ||
Screen Flickering / PWM (Pulse-Width Modulation)
| Screen flickering / PWM not detected | 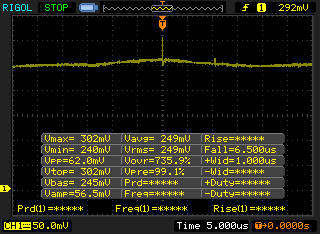 | ||
In comparison: 52 % of all tested devices do not use PWM to dim the display. If PWM was detected, an average of 7753 (minimum: 5 - maximum: 343500) Hz was measured. | |||
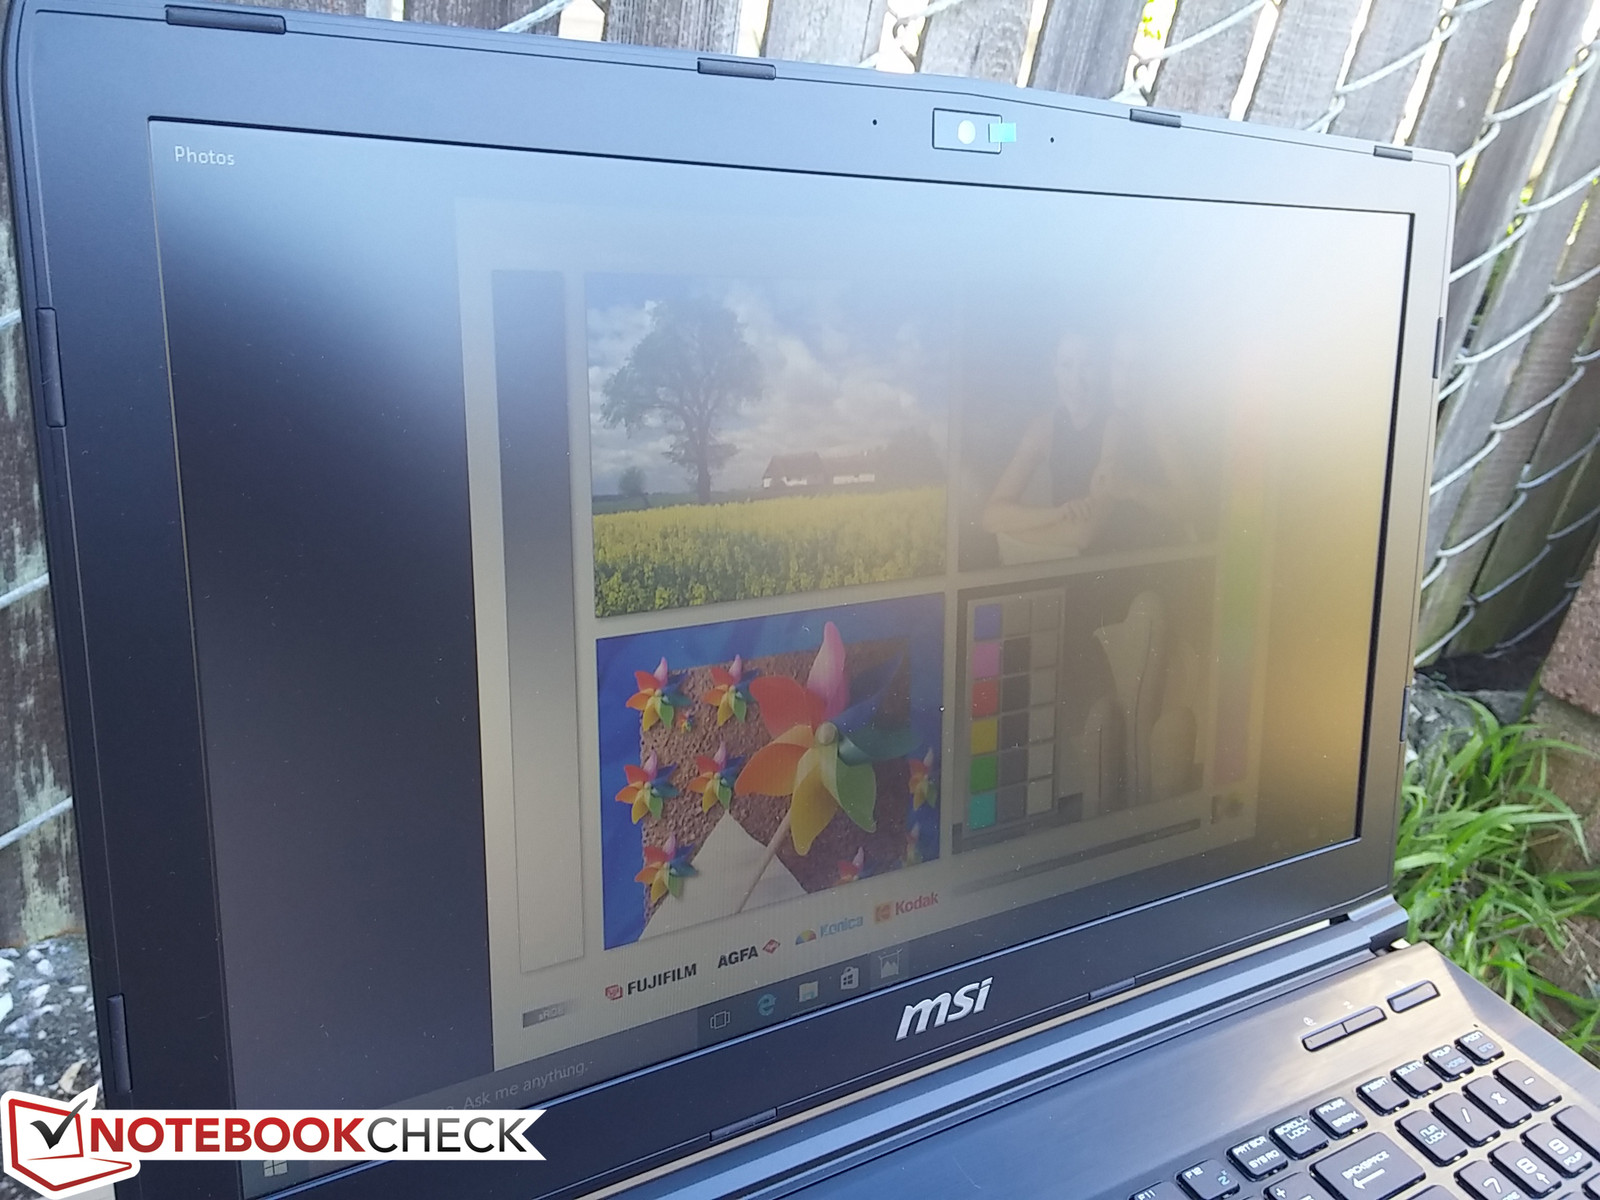
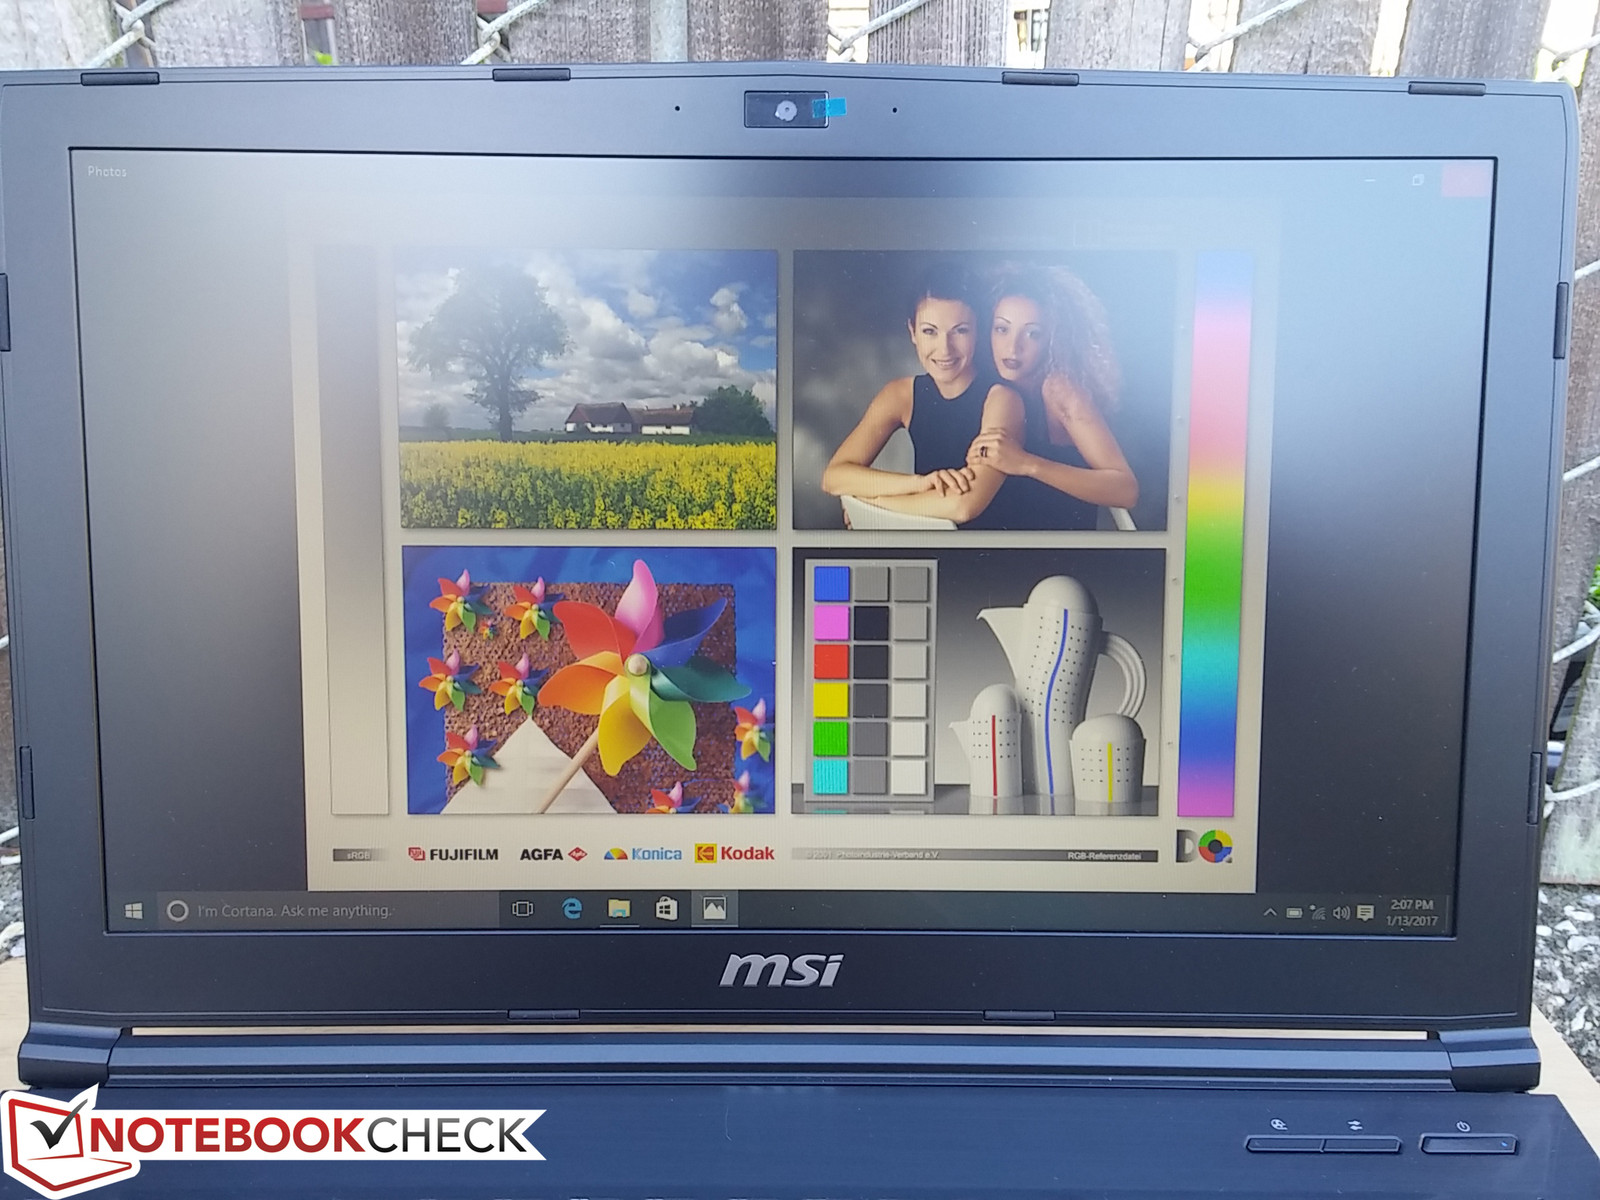
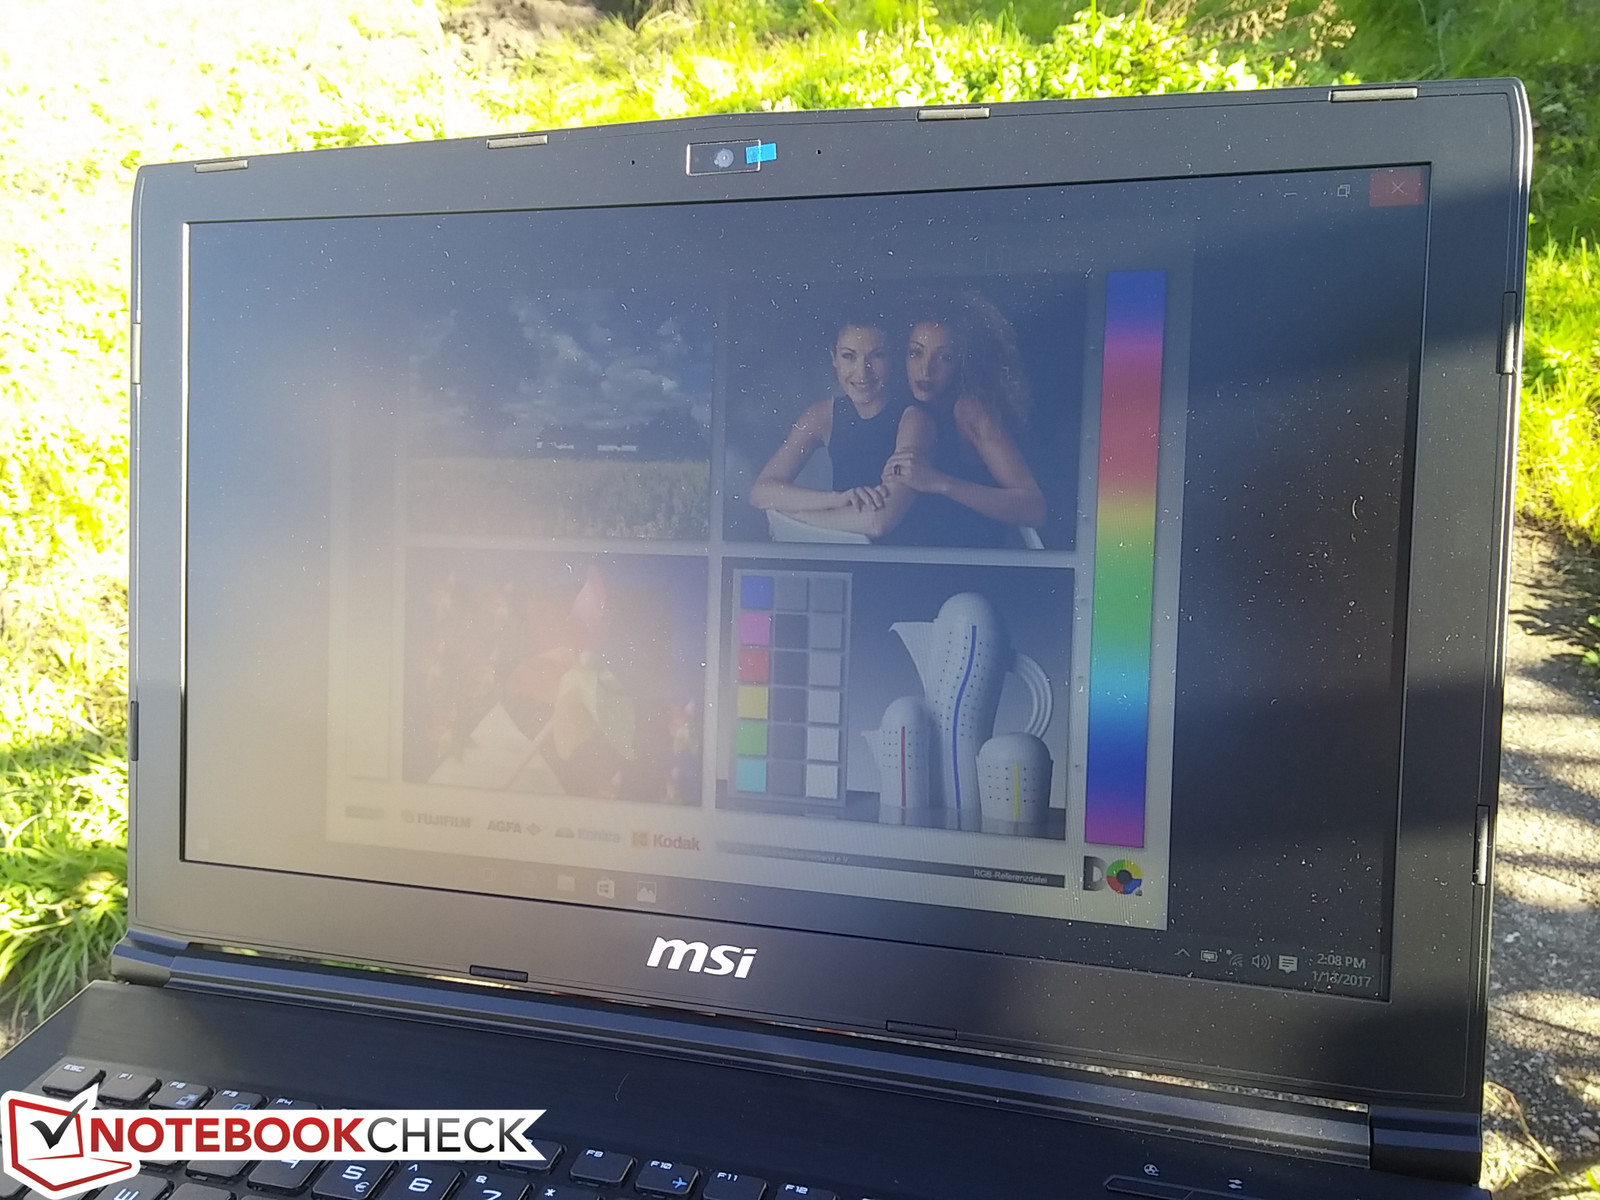
Outdoor visibility is poor due to the low maximum brightness of the backlight. The poor contrast makes matters even worse as colors and text wash out more easily from sunlight or ambient lighting. The limited viewing angles of the TN panel dampens the usefulness of the notebook when outdoors even further.
Performance
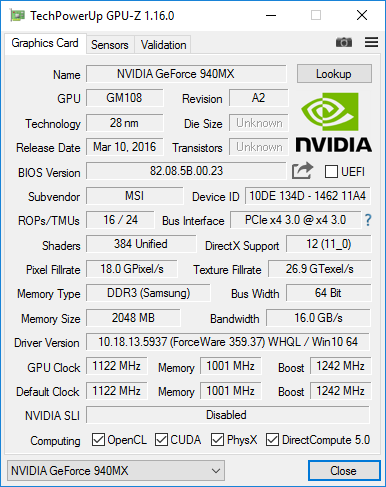
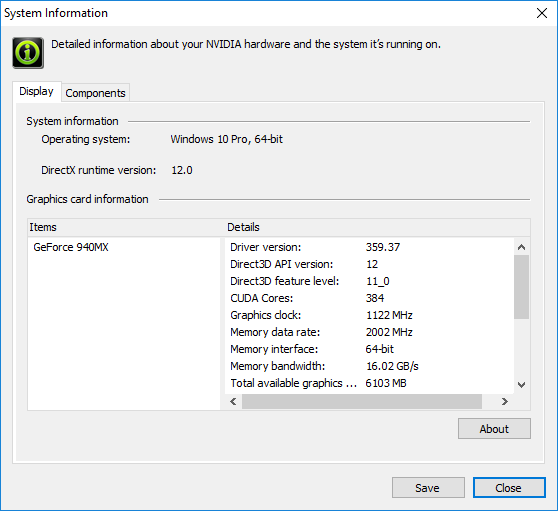
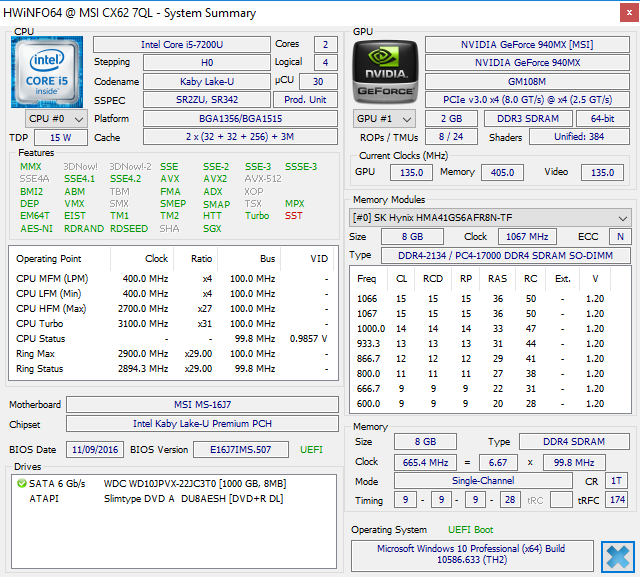
Our Core i7-7200U CPU and GeForce 940MX GPU configuration mirrors our CX72 test unit. These are low-power processors in a gaming chassis designed for much more demanding hardware, so we're not expecting any throttling or temperature issues from the notebook at all. The ULV CPU, for example, can be found on thin convertible notebooks like the HP Spectre x360 13 while the GeForce 940MX is available on a number of lighter Asus Zenbooks and Lenovo Yogas.
Optimus is available for switching to the more power efficient integrated HD Graphics 620 GPU.
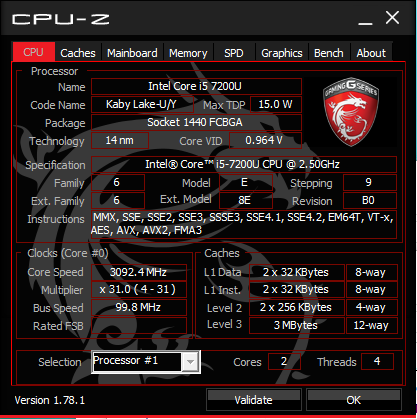
Processor
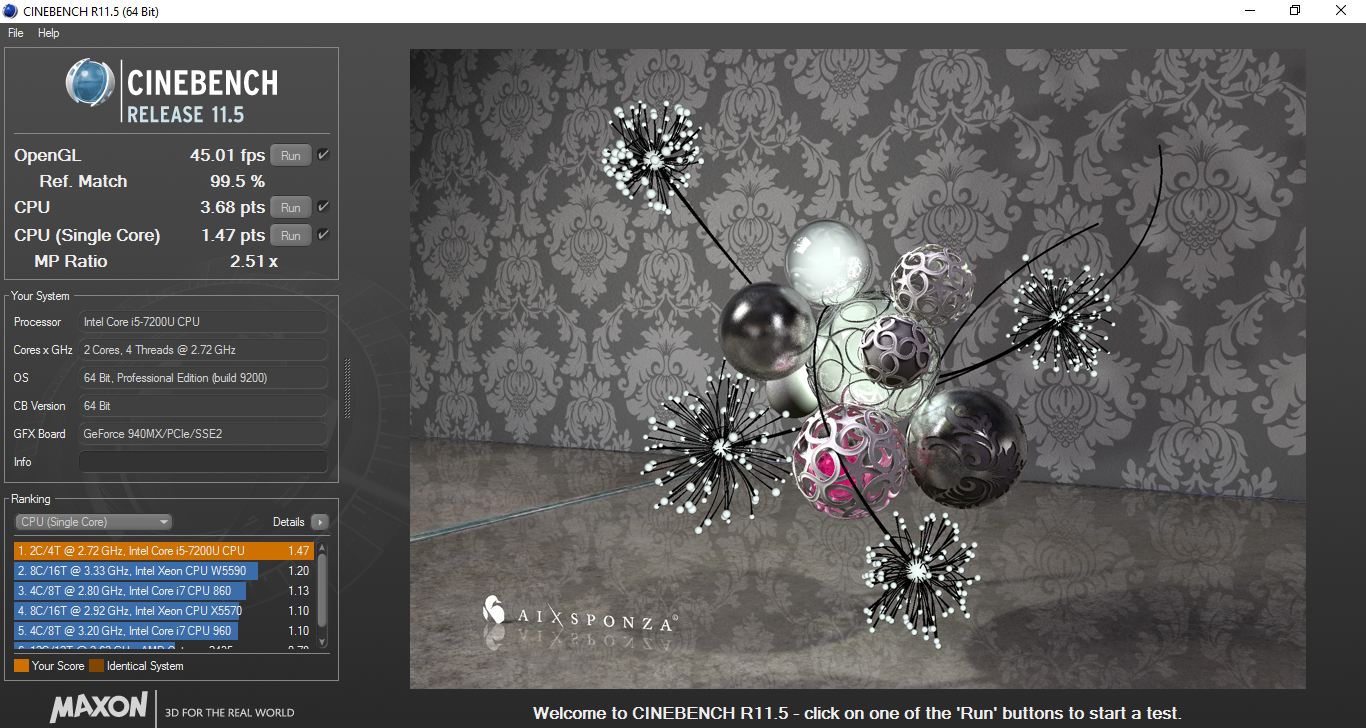
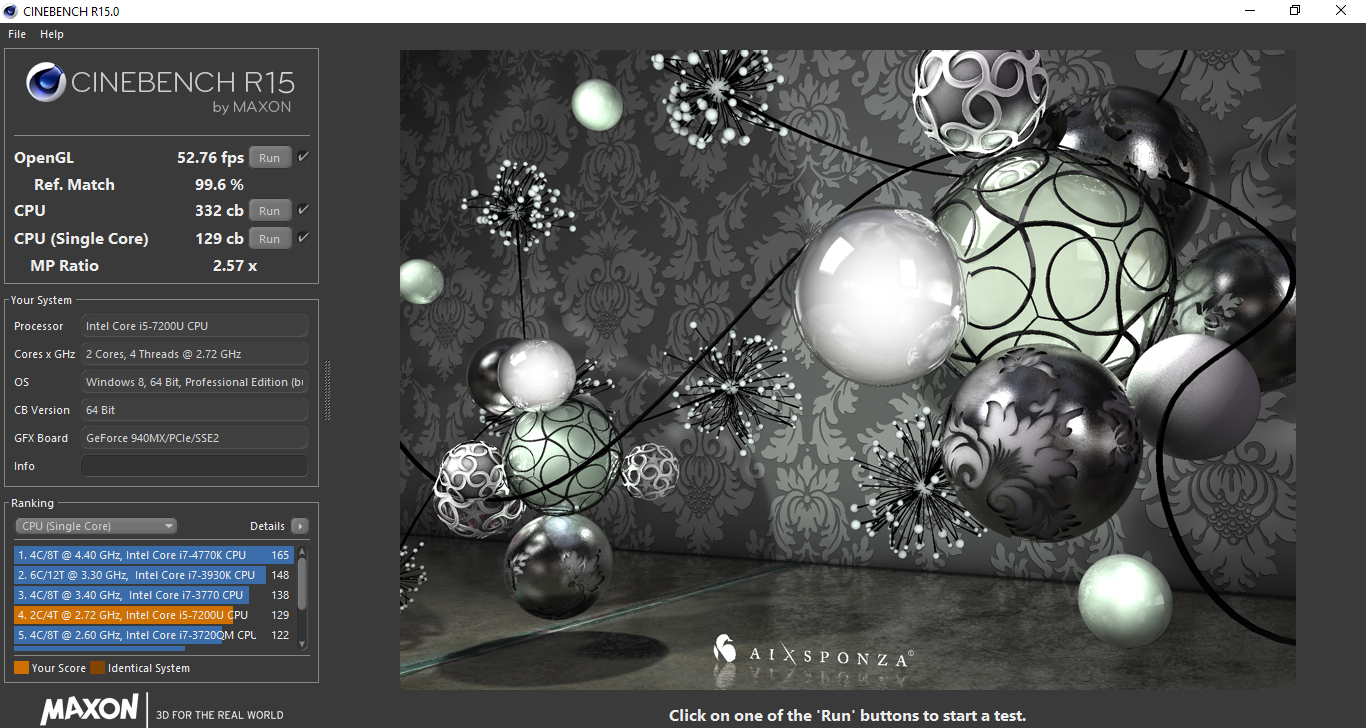
CPU performance is about 10 to 15 percent faster than the Skylake i5-6200U and roughly equivalent to the i7-6500U in both single- and multi-threaded workloads according to CineBench. The Kaby Lake processor is able to achieve this partly through higher core clock rates of 2.5 to 3.1 GHz compared to 2.3 to 2.8 GHz on the i5-6200U. Single-threaded performance from the i7-7200U is very close to the powerful quad-core i7-6700HQ while multi-threaded performance is only half as fast.
See our dedicated page on the i7-7200U for more technical information and benchmark comparisons.
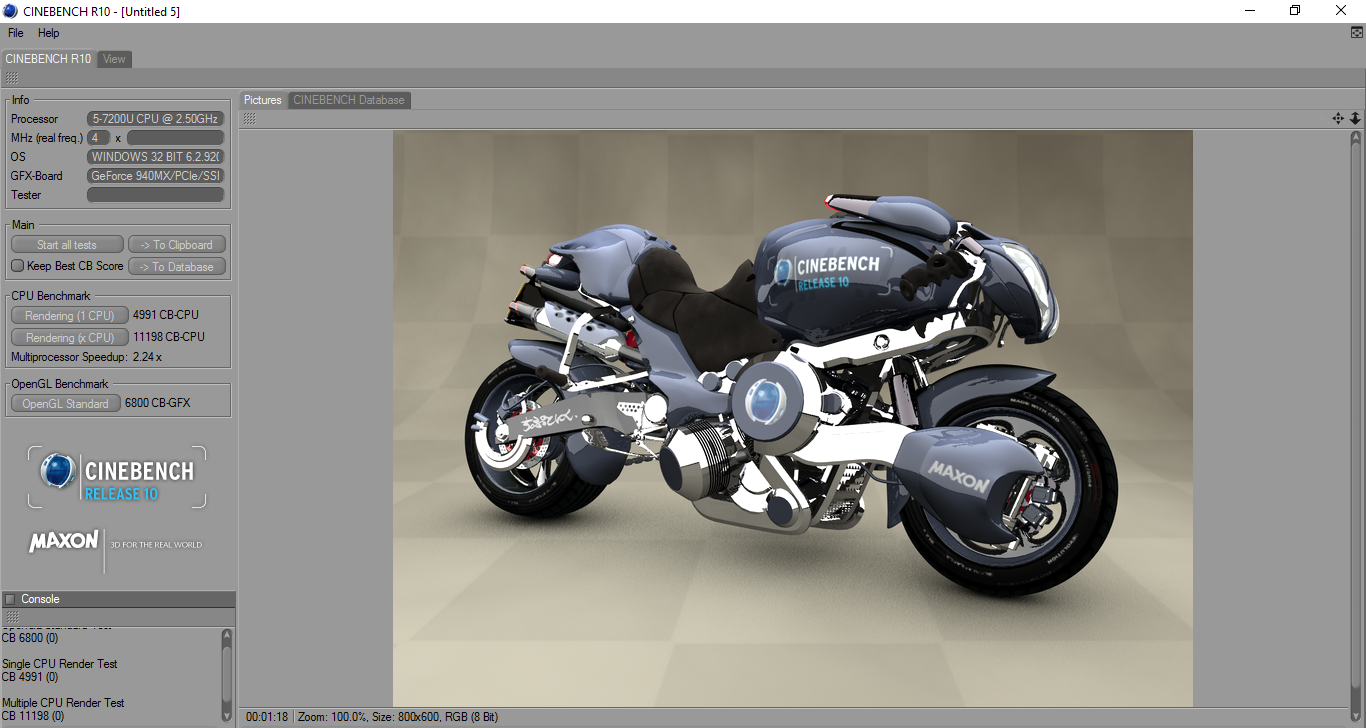
| Cinebench R10 | |
| Rendering Multiple CPUs 32Bit | |
| Asus GL702VM-GC102D | |
| MSI CX62 7QL | |
| Asus Zenbook UX510UW-CN044T | |
| HP ProBook 640 G2-T9X60ET | |
| HP 250 G4 T6P08ES | |
| Lenovo IdeaPad Z40-59422614 | |
| Rendering Single 32Bit | |
| Asus GL702VM-GC102D | |
| MSI CX62 7QL | |
| Asus Zenbook UX510UW-CN044T | |
| HP ProBook 640 G2-T9X60ET | |
| HP 250 G4 T6P08ES | |
| Lenovo IdeaPad Z40-59422614 | |
| wPrime 2.10 - 1024m | |
| Lenovo IdeaPad Z40-59422614 | |
| HP Envy x360 15t-w200 | |
| Super Pi Mod 1.5 XS 32M - 32M | |
| Lenovo IdeaPad Z40-59422614 | |
| HP Envy x360 15t-w200 | |
* ... smaller is better
System Performance
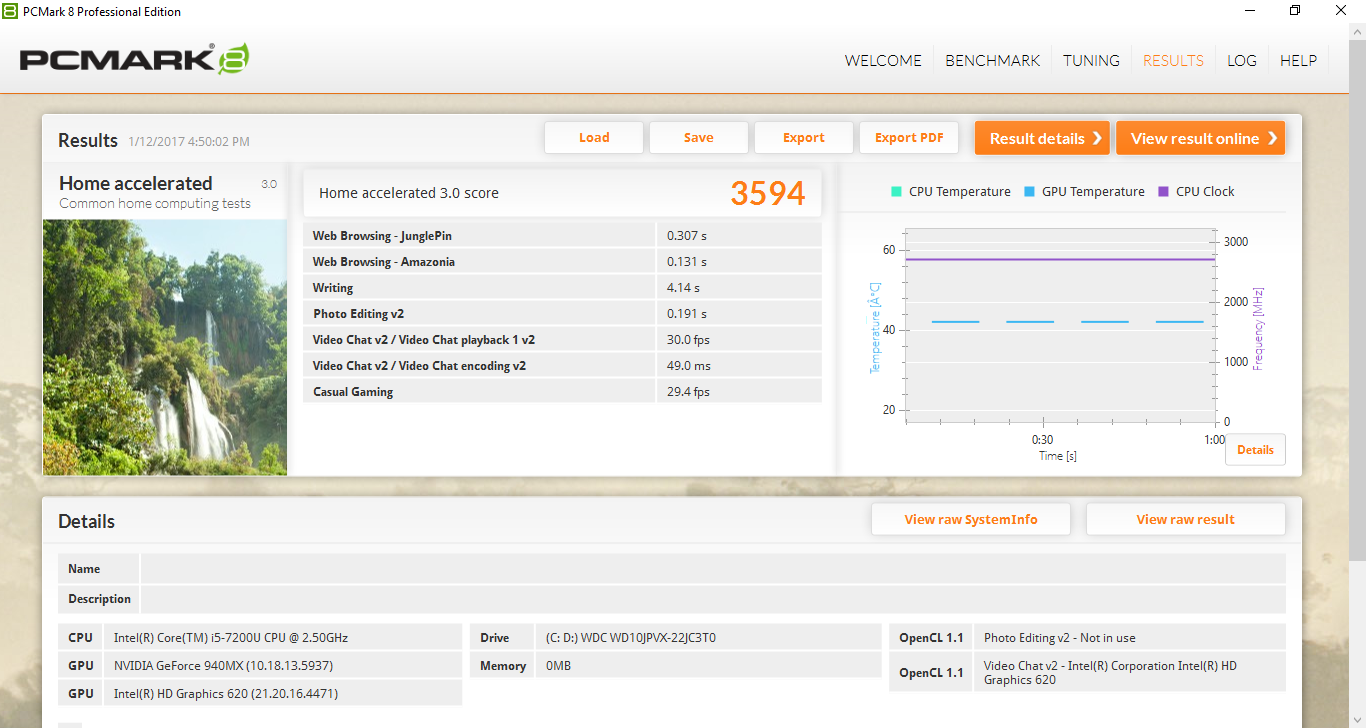
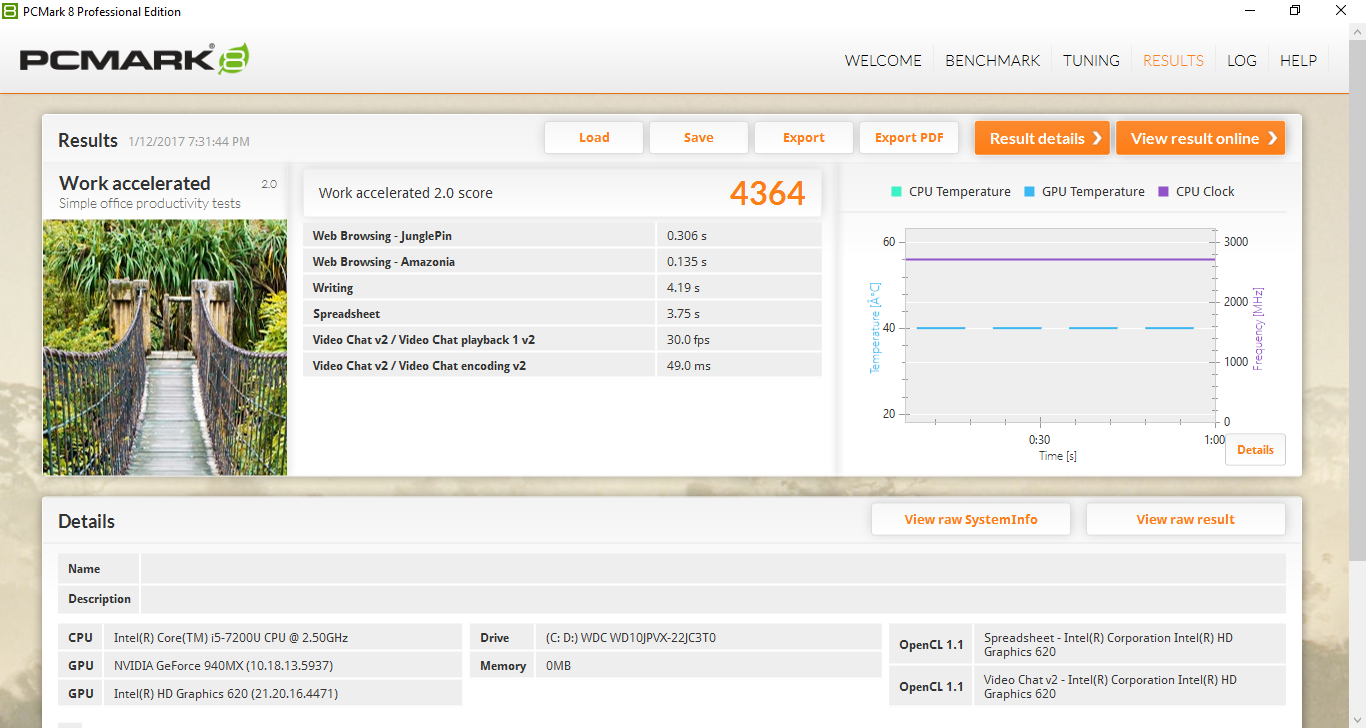
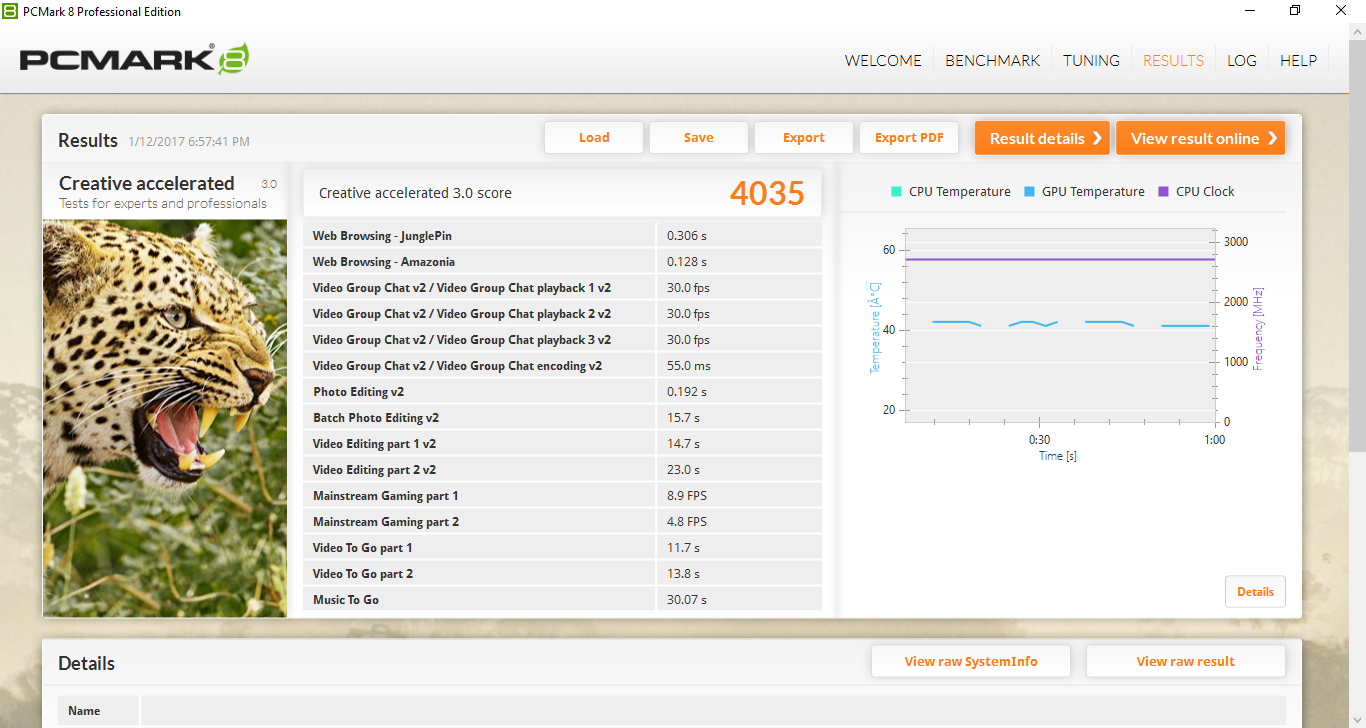
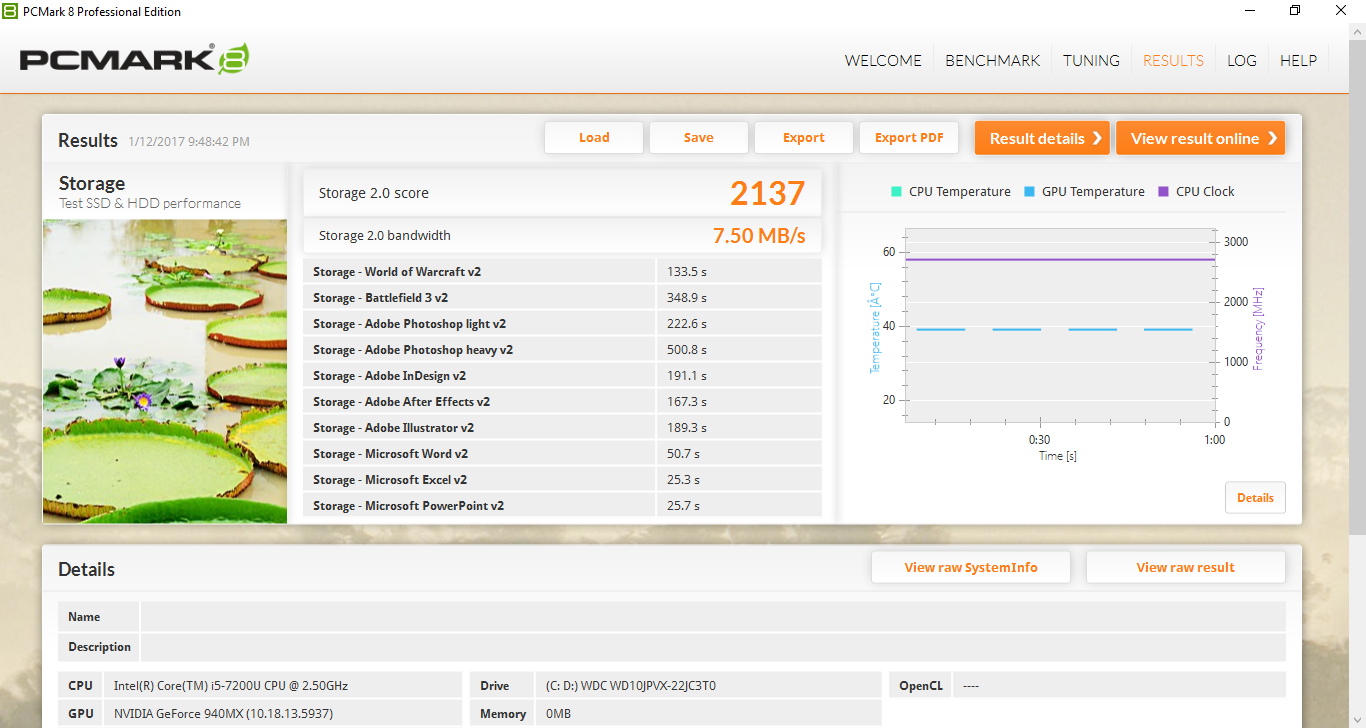
PCMark 8 ranks the CX62 in the same ballpark as competing notebooks with similar ULV CPUs. Subjectively, however, the MSI notebook feels held back by the primary mechanical HDD. Launching and loading applications are very slow compared to Ultrabooks with primary SSDs. In this case, the relatively large size of the CX62 doesn't necessarily mean faster performance.
| PCMark 8 | |
| Home Score Accelerated v2 | |
| Lenovo Yoga 510-15IKB 80VC000XGE | |
| MSI GL62-6QFi781H11 | |
| MSI CX62 7QL | |
| HP Pavilion 15t-au100 CTO (W0P31AV) | |
| Asus Zenbook UX510UW-CN044T | |
| Work Score Accelerated v2 | |
| MSI GL62-6QFi781H11 | |
| MSI CX62 7QL | |
| Asus Zenbook UX510UW-CN044T | |
| HP Pavilion 15t-au100 CTO (W0P31AV) | |
| Creative Score Accelerated v2 | |
| MSI GL62-6QFi781H11 | |
| Asus Zenbook UX510UW-CN044T | |
| HP Pavilion 15t-au100 CTO (W0P31AV) | |
| MSI CX62 7QL | |
| PCMark 8 Home Score Accelerated v2 | 3594 points | |
| PCMark 8 Creative Score Accelerated v2 | 4035 points | |
| PCMark 8 Work Score Accelerated v2 | 4364 points | |
Help | ||
Storage Devices
Both a M.2 2280 slot and 2.5-inch SATA III bay are available for internal storage. The M.2 slot is indeed compatible with NVMe SSDs and we recommend at least a primary SATA SSD for faster system performance.
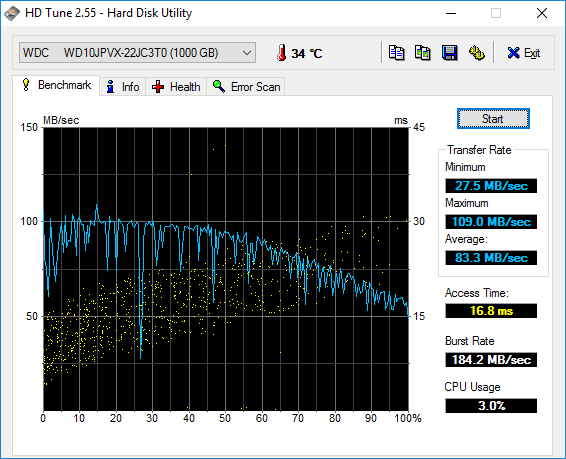
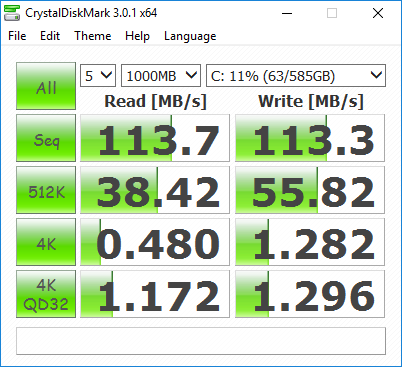
Our test unit comes equipped with an admittedly slow primary 1 TB Western Digital Blue HDD. The 5400 RPM drive returns an average transfer rate of just 83.3 MB/s according to HD Tune compared to well over 90 MB/s or even 100 MB/s on most 7200 RPM alternatives. Competing notebooks with primary SSDs run laps around our configured CX62.
See our growing table of HDDs and SSDs for more benchmark comparisons.
| MSI CX62 7QL WDC Scorpio Blue WD10JPVX-22JC3T0 | HP Pavilion 15t-au100 CTO (W0P31AV) Toshiba MQ01ABD100 | Lenovo Yoga 510-15IKB 80VC000XGE Samsung MZYTY256HDHP | Asus Zenbook UX510UW-CN044T SanDisk SD8SNAT256G1002 | MSI GL62-6QFi781H11 Toshiba HG6 THNSNJ128G8NY | |
|---|---|---|---|---|---|
| CrystalDiskMark 3.0 | -18% | 8589% | 5301% | 6073% | |
| Read Seq (MB/s) | 113.7 | 109.5 -4% | 529 365% | 459.3 304% | 530 366% |
| Write Seq (MB/s) | 113.3 | 105.2 -7% | 508 348% | 325.5 187% | 442.7 291% |
| Read 512 (MB/s) | 38.42 | 34.08 -11% | 409.8 967% | 279.2 627% | 409.1 965% |
| Write 512 (MB/s) | 55.8 | 40.02 -28% | 316.5 467% | 280.1 402% | 417.3 648% |
| Read 4k (MB/s) | 0.48 | 0.429 -11% | 36.01 7402% | 22.43 4573% | 21.81 4444% |
| Write 4k (MB/s) | 1.282 | 1.008 -21% | 106.7 8223% | 74.9 5742% | 93 7154% |
| Read 4k QD32 (MB/s) | 1.172 | 0.81 -31% | 384.8 32733% | 149 12613% | 257 21828% |
| Write 4k QD32 (MB/s) | 1.296 | 0.893 -31% | 237.3 18210% | 234 17956% | 168.3 12886% |

GPU Performance
3DMark ranks the 940MX just a few percentages above the 930MX. The GTX 950M can score over twice as high as the 940MX while the integrated Intel Iris Pro Graphics 580 consistently outperforms it. Although this is a discrete Nvidia GPU, the 940MX does not have the raw horsepower necessary to satisfy even mainstream gamers. Nonetheless, it offers a significant performance boost over the integrated HD Graphics 620 by almost 140 percent according to Fire Strike Graphics.
See our dedicated page on the GeForce 940MX for more technical information and benchmark comparisons.
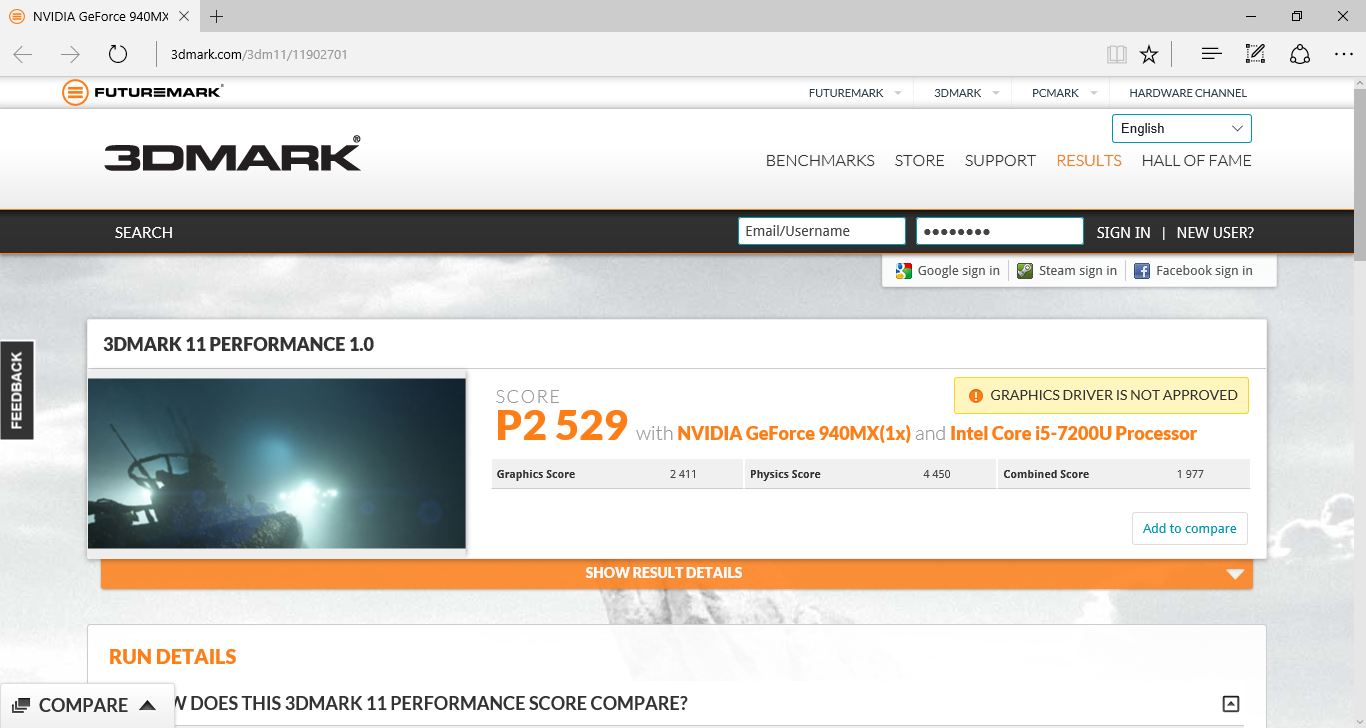
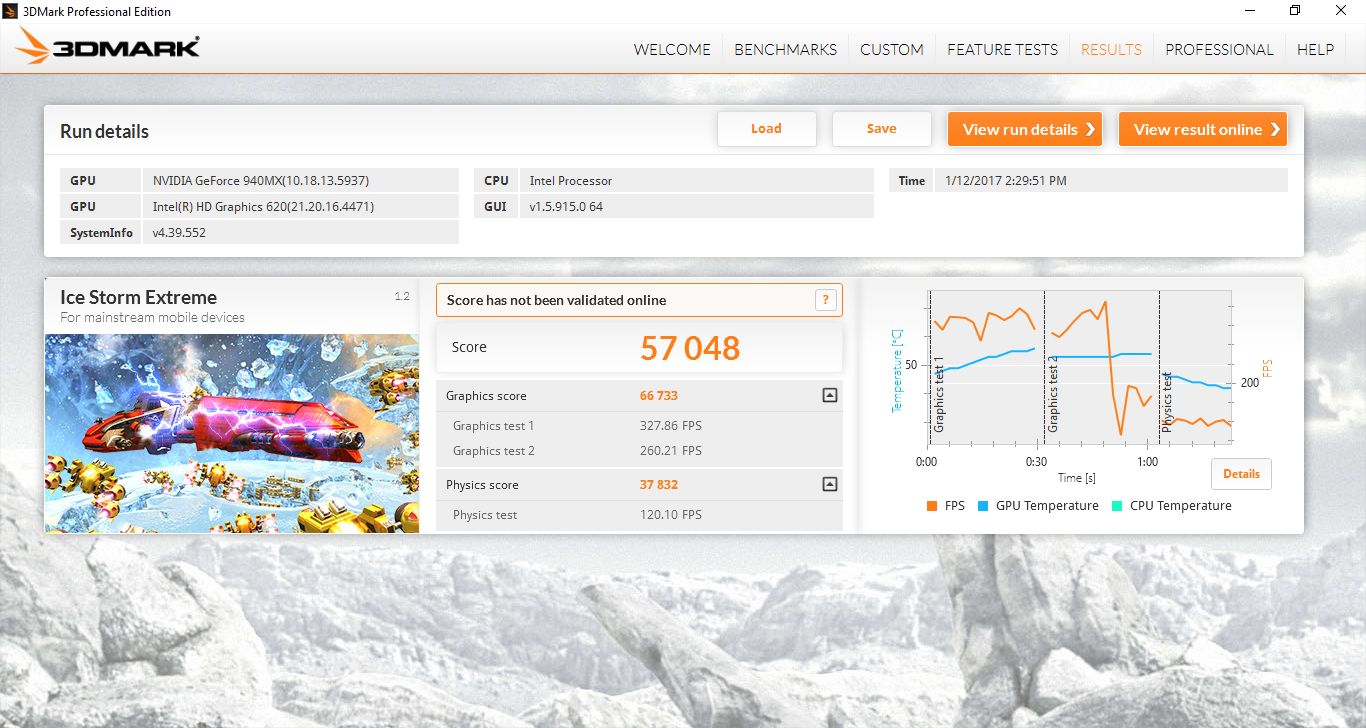
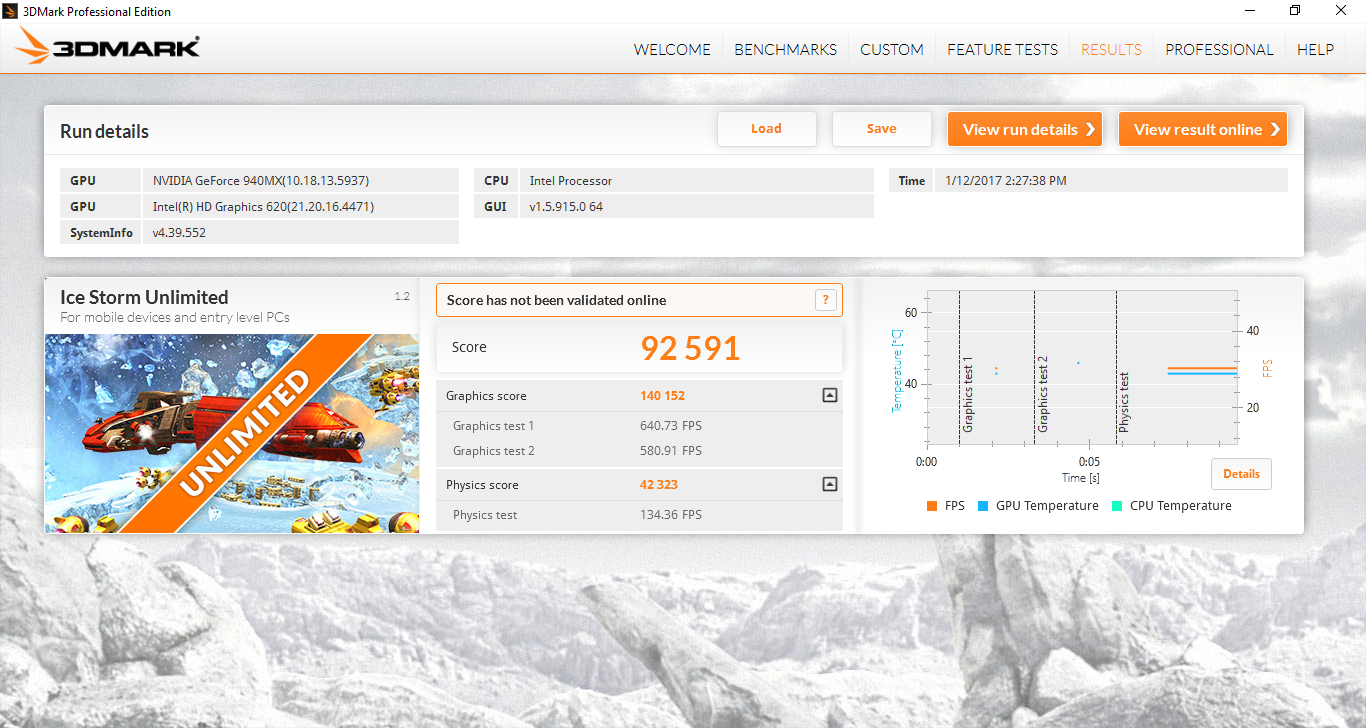
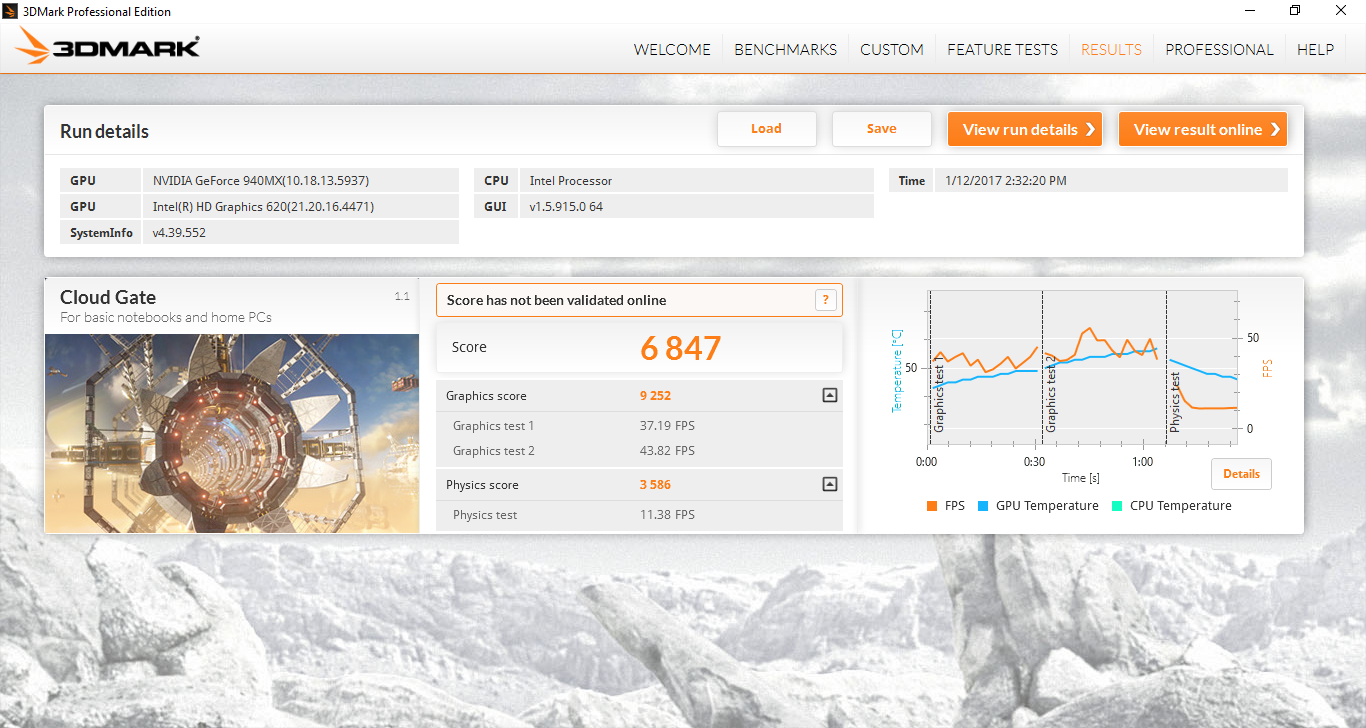
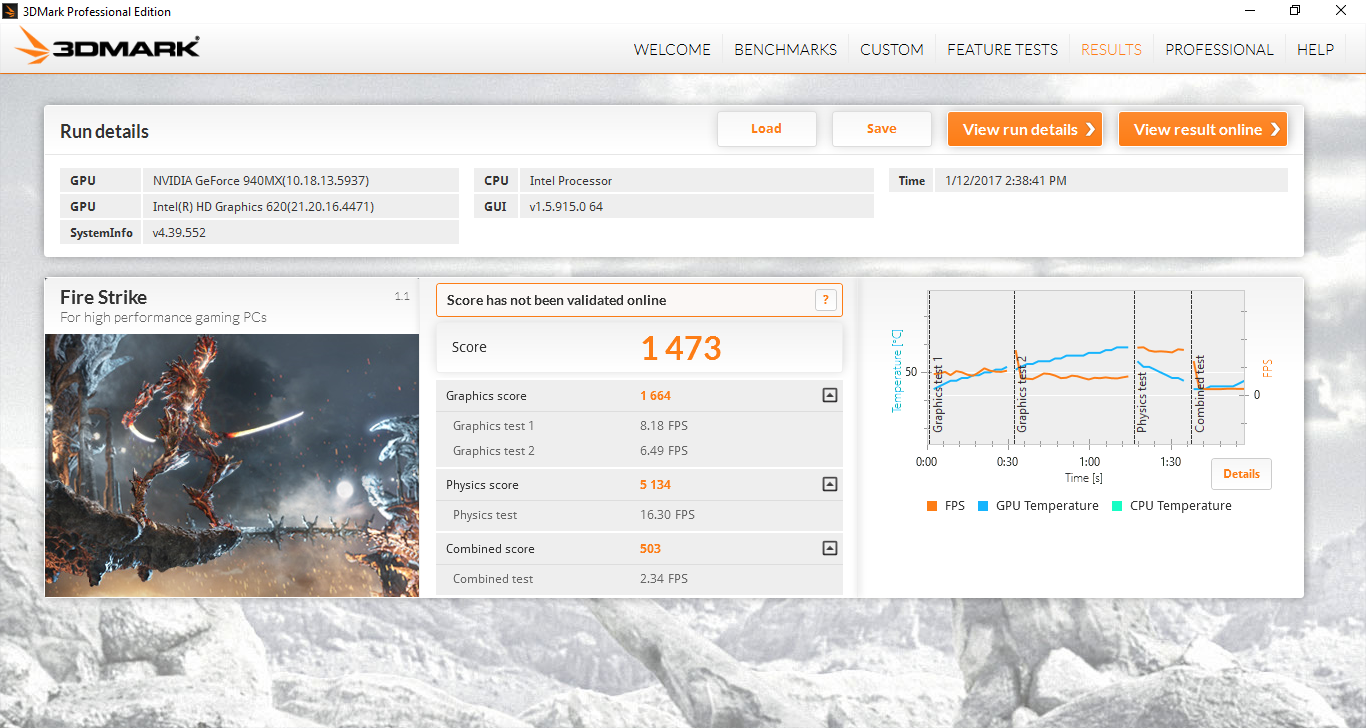
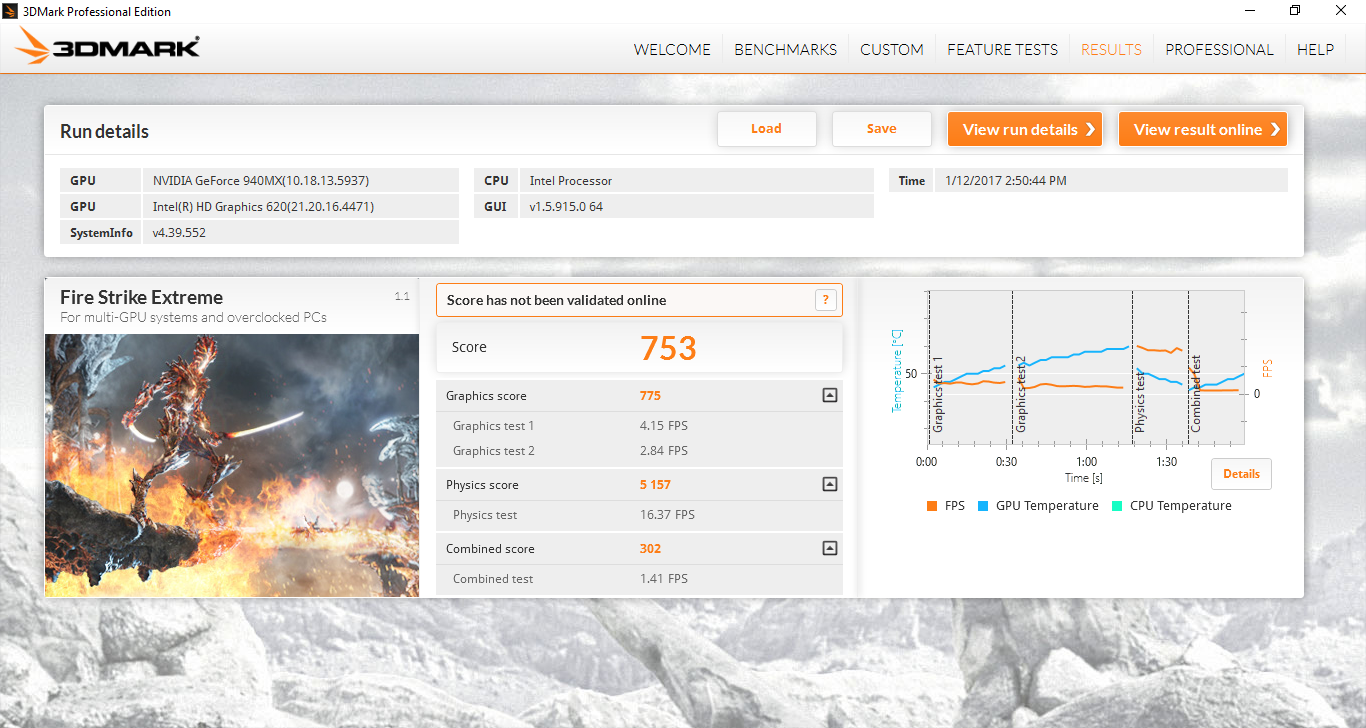
| 3DMark 11 Performance | 2529 points | |
| 3DMark Ice Storm Standard Score | 65002 points | |
| 3DMark Cloud Gate Standard Score | 6847 points | |
| 3DMark Fire Strike Score | 1473 points | |
| 3DMark Fire Strike Extreme Score | 753 points | |
Help | ||
Gaming Performance
The GeForce 940MX is largely unfit for native 1080p gaming on most 3D titles. Instead, users will be limited to 768p on low to medium settings at best. Older titles like Bioshock Infinite can get away with higher settings, but newer and more demanding titles like Rise of the Tomb Raider can become unplayable unless if on the lowest settings.
| low | med. | high | ultra | |
|---|---|---|---|---|
| BioShock Infinite (2013) | 97.2 | 54.3 | 44 | |
| Metro: Last Light (2013) | 51.3 | 39.5 | 28.5 | |
| Thief (2014) | 50.7 | 29.3 | ||
| Batman: Arkham Knight (2015) | 28 | |||
| Metal Gear Solid V (2015) | 60 | 58 | ||
| Fallout 4 (2015) | 34.6 | |||
| Rise of the Tomb Raider (2016) | 40.1 | 23.2 | ||
| Ashes of the Singularity (2016) | 19.4 | |||
| Overwatch (2016) | 73.5 | 51.4 |
Stress Test
We stress the notebook with unrealistic loads to identify for any potential throttling or stability issues. Overall core temperatures for the CX62 are very low even when subjected to extreme loads. Running Prime95, for example, sees the ULV CPU stabilizing at just 48 C.
Running FurMark to stress the GPU will have core temperature fluctuating in the 45 to 55 C range as shown by our screenshot below. This is due to the pulsing system fan since it appears to automatically spin at higher RPMs once GPU temperature reaches 55 C only to spin down to a slower speed once core temperature hits 45 C. When both Prime95 and FurMark are active, the system fan is thankfully steady for stable CPU and GPU temperatures of 64 C and 54 C, respectively. The notebook is able to maintain maximum Boost clock rates for both the CPU and GPU, which is an uncommon occurrence on many systems with ULV CPUs.
The pulsing fan unfortunately persists when running Unigine Valley. On the bright side, core temperatures remain in the low 50 C range for both the CPU and GPU.
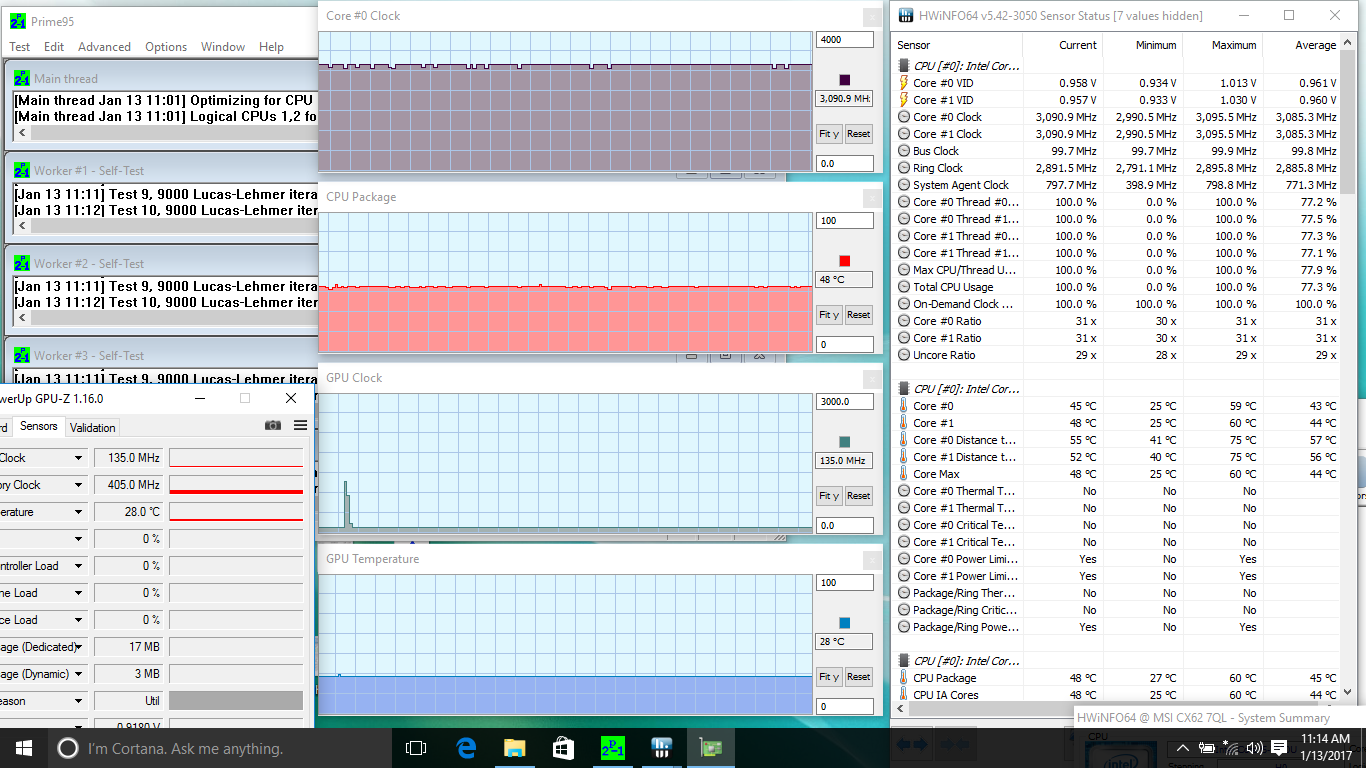
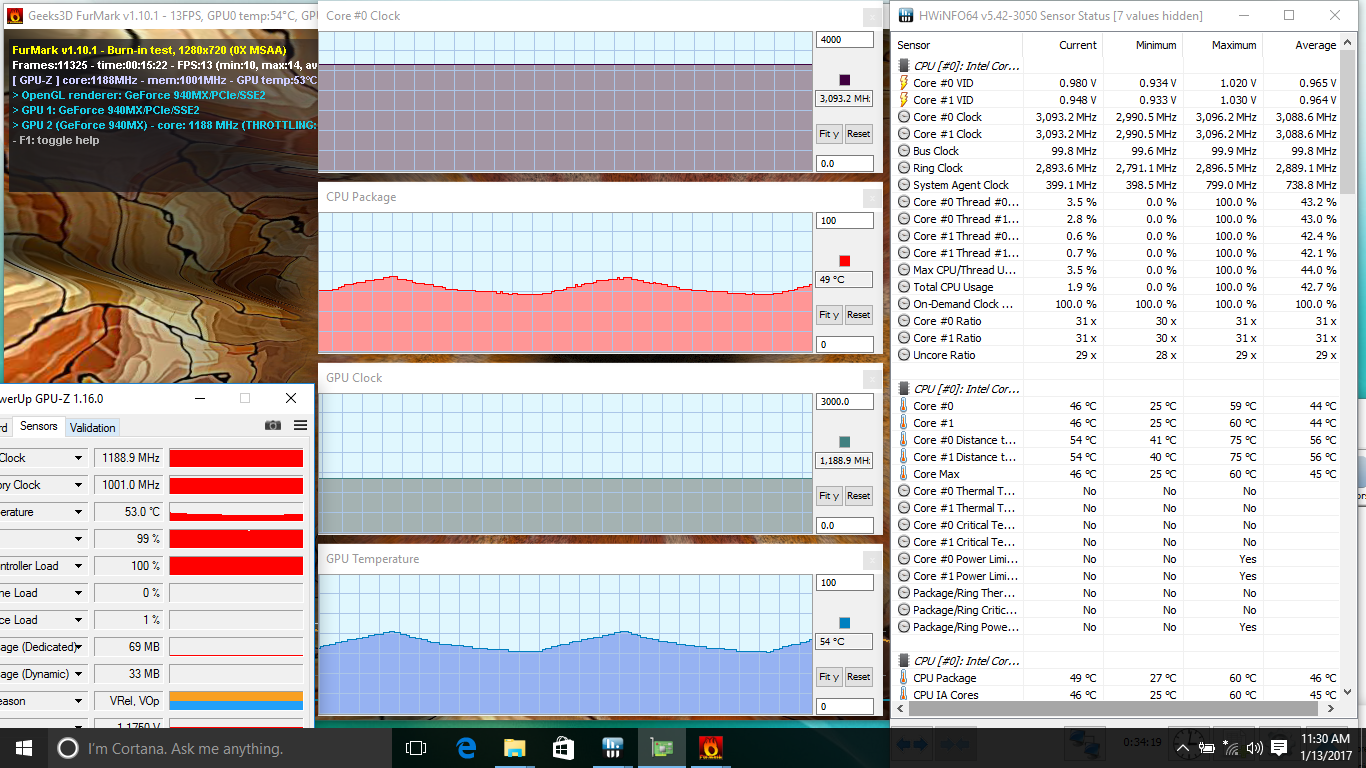
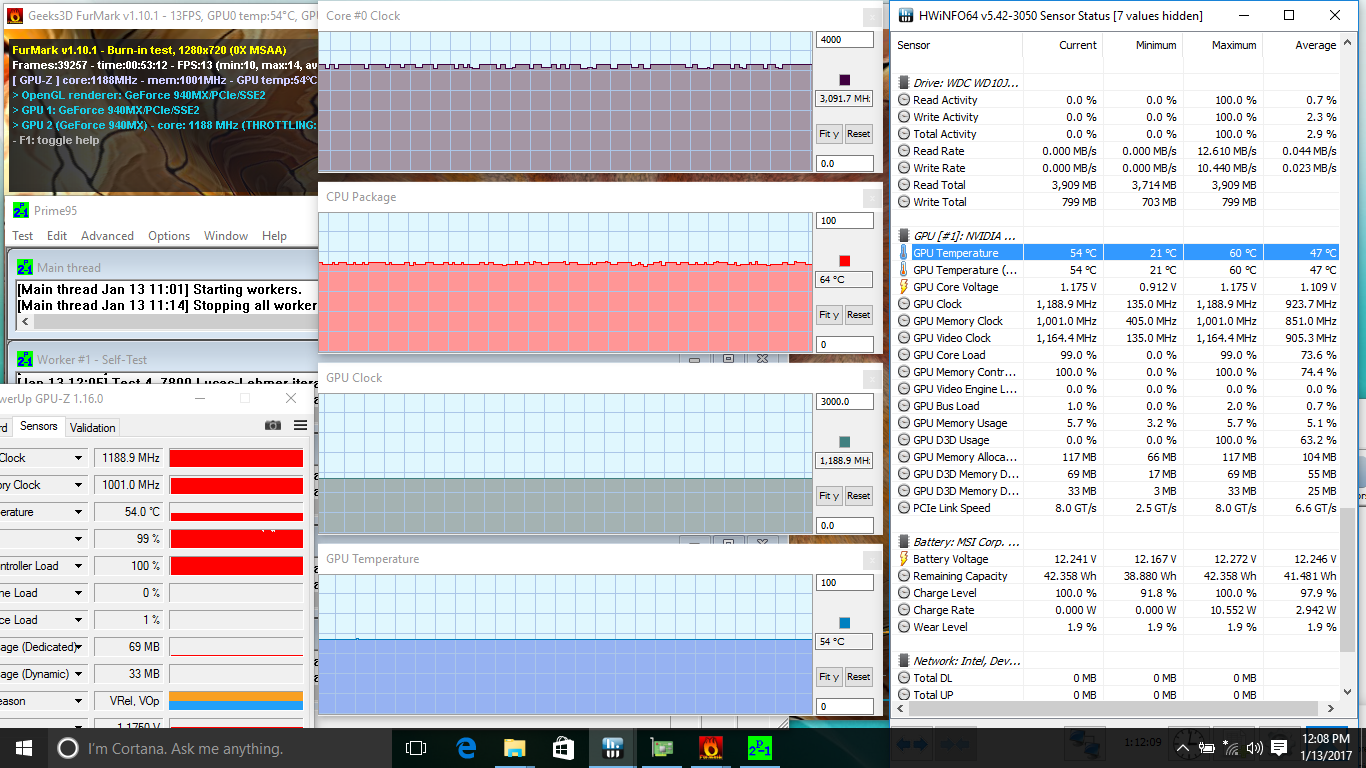
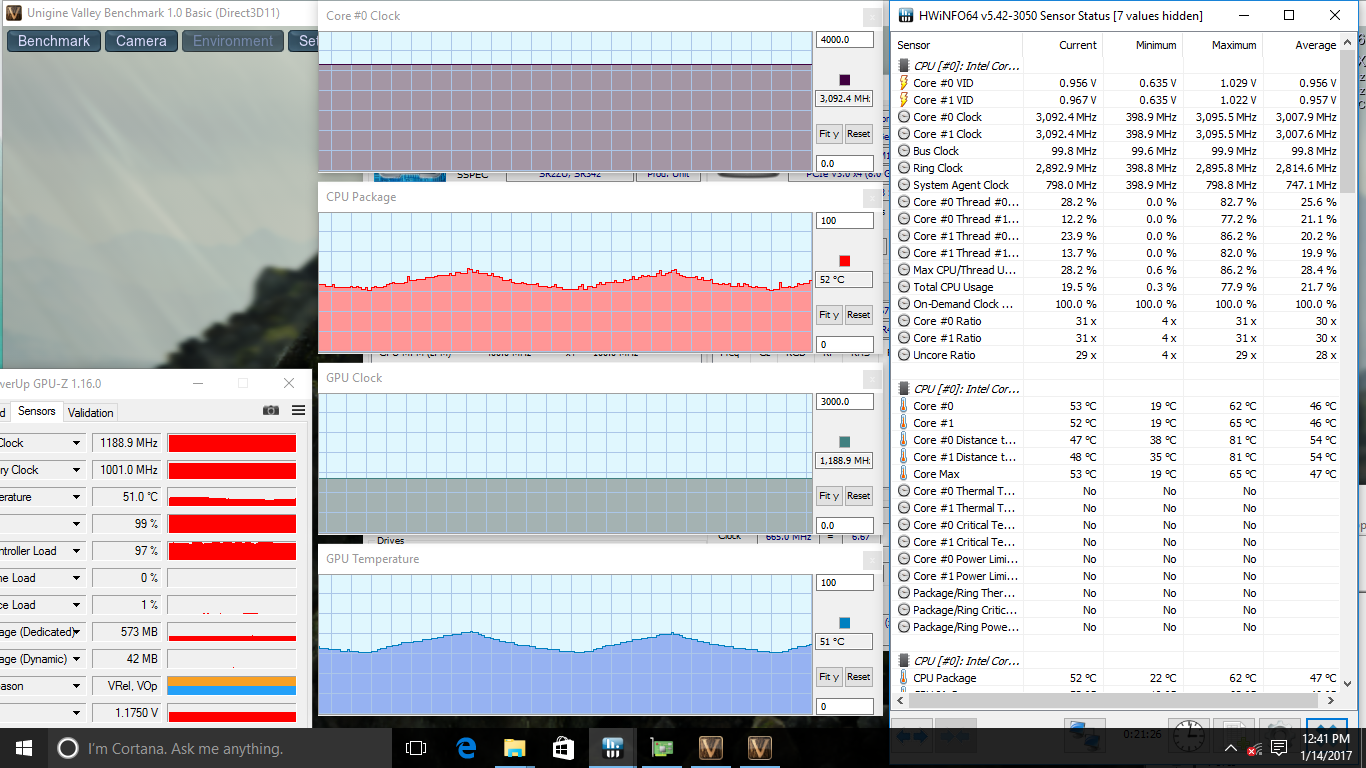
| CPU Clock (GHz) | GPU Clock (MHz) | Average CPU Temperature (°C) | Average GPU Temperature (°C) | |
| Prime95 Stress | 3.1 | -- | 48 | 28 |
| FurMark Stress | -- | 1189 | 45 - 53 | 45 - 55 |
| Prime95 + FurMark Stress | 3.1 | 1189 | 64 | 54 |
| Unigine Valley Stress | 3.1 | 1189 | 45 - 55 | 45 - 55 |
Emissions
System Noise
The cooling system is a cut-down version of the GE62 and consists of just two heat pipes and a single system fan. Fan noise, unfortunately, is always active at about 32 dB(A) against a background noise of 29 dB(A). This is thankfully low enough to be almost inaudible in typical office environments or when word processing, but it's also a bit of a disappointment since the system will not run in complete silence during low loads.
As mentioned in our Stress Test section above, gaming loads will cause the system fan to pulse from as low as 32 dB(A) up to around 37 dB(A). While this range is quieter than most gaming notebooks, we always prefer a steady and consistent fan instead for a less bothersome experience. Activating Turbo Fan mode will bump system noise to over 51 dB(A) and is arguably unnecessary as the fan is more than sufficient at its default settings. Proper software for more fan control options would have been more useful in this case.
Noise level
| Idle |
| 32.1 / 32.2 / 32.2 dB(A) |
| Load |
| 37.4 / 51.4 dB(A) |
 | ||
30 dB silent 40 dB(A) audible 50 dB(A) loud |
||
min: | ||
| MSI CX62 7QL GeForce 940MX, i5-7200U, WDC Scorpio Blue WD10JPVX-22JC3T0 | HP Pavilion 15t-au100 CTO (W0P31AV) GeForce 940MX, i7-7500U, Toshiba MQ01ABD100 | Lenovo Yoga 510-15IKB 80VC000XGE Radeon R7 M460, i5-7200U, Samsung MZYTY256HDHP | Asus Zenbook UX510UW-CN044T GeForce GTX 960M, 6500U, SanDisk SD8SNAT256G1002 | MSI GL62-6QFi781H11 GeForce GTX 960M, 6700HQ, Toshiba HG6 THNSNJ128G8NY | |
|---|---|---|---|---|---|
| Noise | 2% | 6% | -1% | -6% | |
| off / environment * (dB) | 29 | 30.15 -4% | 31.6 -9% | 30 -3% | |
| Idle Minimum * (dB) | 32.1 | 32.2 -0% | 30.2 6% | 31.6 2% | 35 -9% |
| Idle Average * (dB) | 32.2 | 32.2 -0% | 30.2 6% | 31.6 2% | 36 -12% |
| Idle Maximum * (dB) | 32.2 | 33.7 -5% | 31 4% | 33.4 -4% | 37 -15% |
| Load Average * (dB) | 37.4 | 39.4 -5% | 38 -2% | 41.7 -11% | 41 -10% |
| Load Maximum * (dB) | 51.4 | 42.2 18% | 38.6 25% | 44.8 13% | 46 11% |
* ... smaller is better
Temperature
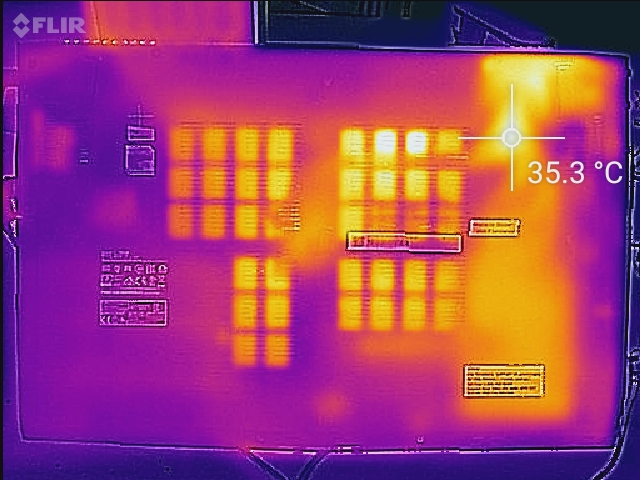
Surface temperatures are flat on both sides of the notebook when idling or during low loads. The system remains quite cool even when under heavy processing loads due in part to the low core temperatures as shown in our Stress Test section. The right half of the MSI experiences almost no rise in temperature compared to the left half according to the temperature maps below. We were able to record a maximum surface temperature of just over 38 C near the center of the keyboard where the processor lies directly underneath. In comparison, the Lenovo Yoga 710 with the same 940MX GPU can become much warmer at over 43 C on some areas under similar processing loads.
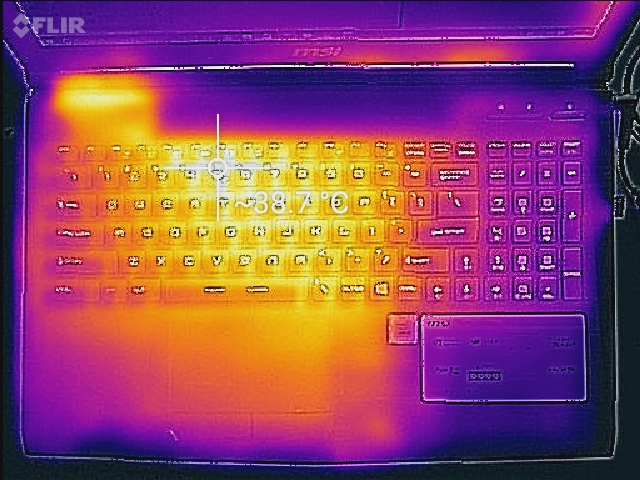
(+) The maximum temperature on the upper side is 38.4 °C / 101 F, compared to the average of 36.8 °C / 98 F, ranging from 21 to 71 °C for the class Multimedia.
(+) The bottom heats up to a maximum of 35.8 °C / 96 F, compared to the average of 39.1 °C / 102 F
(+) In idle usage, the average temperature for the upper side is 24 °C / 75 F, compared to the device average of 31.3 °C / 88 F.
(+) The palmrests and touchpad are reaching skin temperature as a maximum (32.2 °C / 90 F) and are therefore not hot.
(-) The average temperature of the palmrest area of similar devices was 28.7 °C / 83.7 F (-3.5 °C / -6.3 F).
Speakers
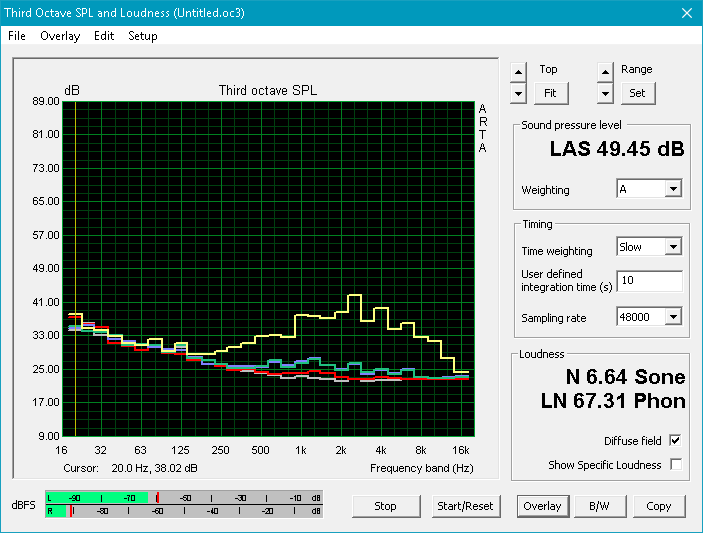
The CX62 retains the quad-speaker setup of the GE62 but drops the dedicated subwoofer for an overall poorer experience. Sound reproduction is very narrow and treble heavy as shown by our microphone measurements below. When compared to the GE62, lower frequencies are hardly reproduced and the resulting sound quality has a "tin can" impression. Higher volume settings are loud enough to fill a small conference room, but balance and quality will worsen.
")

MSI CX62 7QL audio analysis
(±) | speaker loudness is average but good (74.8 dB)
Bass 100 - 315 Hz
(-) | nearly no bass - on average 19.6% lower than median
(±) | linearity of bass is average (11.1% delta to prev. frequency)
Mids 400 - 2000 Hz
(±) | higher mids - on average 9.5% higher than median
(-) | mids are not linear (15.2% delta to prev. frequency)
Highs 2 - 16 kHz
(±) | higher highs - on average 7.4% higher than median
(±) | linearity of highs is average (9.5% delta to prev. frequency)
Overall 100 - 16.000 Hz
(-) | overall sound is not linear (38.2% difference to median)
Compared to same class
» 99% of all tested devices in this class were better, 1% similar, 0% worse
» The best had a delta of 5%, average was 17%, worst was 45%
Compared to all devices tested
» 95% of all tested devices were better, 1% similar, 5% worse
» The best had a delta of 4%, average was 23%, worst was 134%
Apple MacBook 12 (Early 2016) 1.1 GHz audio analysis
(+) | speakers can play relatively loud (83.6 dB)
Bass 100 - 315 Hz
(±) | reduced bass - on average 11.3% lower than median
(±) | linearity of bass is average (14.2% delta to prev. frequency)
Mids 400 - 2000 Hz
(+) | balanced mids - only 2.4% away from median
(+) | mids are linear (5.5% delta to prev. frequency)
Highs 2 - 16 kHz
(+) | balanced highs - only 2% away from median
(+) | highs are linear (4.5% delta to prev. frequency)
Overall 100 - 16.000 Hz
(+) | overall sound is linear (10.2% difference to median)
Compared to same class
» 7% of all tested devices in this class were better, 2% similar, 91% worse
» The best had a delta of 5%, average was 18%, worst was 53%
Compared to all devices tested
» 5% of all tested devices were better, 1% similar, 94% worse
» The best had a delta of 4%, average was 23%, worst was 134%
Frequency Comparison (Checkbox selectable!)
Graph 1: Pink Noise 100% Vol.; Graph 2: Audio off
Energy Management
Power Consumption
Overall power consumption is significantly lower than systems with the GTX 960M including the MSI GL62 and is about the same as the HP Pavilion 15t with the same GeForce 940MX GPU. Gaming loads will draw just over 35 W while extreme loads with both Prime95 and FurMark running simultaneously will demand around 61 W. The small power adapter (10.5 x 4.5 x 3 cm) is rated for 65 W, so there is very little headroom available.
| Off / Standby | |
| Idle | |
| Load |
|
Key:
min: | |
| MSI CX62 7QL i5-7200U, GeForce 940MX, WDC Scorpio Blue WD10JPVX-22JC3T0, TN LED, 1366x768, 15.6" | HP Pavilion 15t-au100 CTO (W0P31AV) i7-7500U, GeForce 940MX, Toshiba MQ01ABD100, IPS, 1920x1080, 15.6" | Lenovo Yoga 510-15IKB 80VC000XGE i5-7200U, Radeon R7 M460, Samsung MZYTY256HDHP, IPS, 1920x1080, 15.6" | Asus Zenbook UX510UW-CN044T 6500U, GeForce GTX 960M, SanDisk SD8SNAT256G1002, IPS, 1920x1080, 15.6" | MSI GL62-6QFi781H11 6700HQ, GeForce GTX 960M, Toshiba HG6 THNSNJ128G8NY, TN LED, 1920x1080, 15.6" | |
|---|---|---|---|---|---|
| Power Consumption | -15% | 6% | -36% | -110% | |
| Idle Minimum * (Watt) | 6.3 | 6.16 2% | 3.9 38% | 5 21% | 10 -59% |
| Idle Average * (Watt) | 7 | 8.48 -21% | 7.8 -11% | 8.9 -27% | 14 -100% |
| Idle Maximum * (Watt) | 7.2 | 9.62 -34% | 8.4 -17% | 11.8 -64% | 19 -164% |
| Load Average * (Watt) | 35.1 | 41.63 -19% | 37 -5% | 55 -57% | 82 -134% |
| Load Maximum * (Watt) | 61.2 | 63.22 -3% | 46 25% | 93 -52% | 118 -93% |
* ... smaller is better
Battery Life
Runtimes from the integrated 41 Wh battery are decent at almost five hours under real-world WLAN conditions or about two hours when under extreme processing stress. Overall battery life is longer than the more powerful GL62 but still shorter than the Zenbook UX510UW and Lenovo Yoga 510.
Charging from near empty to full capacity will take just under two hours.
| MSI CX62 7QL i5-7200U, GeForce 940MX, 41 Wh | HP Pavilion 15t-au100 CTO (W0P31AV) i7-7500U, GeForce 940MX, 41 Wh | Lenovo Yoga 510-15IKB 80VC000XGE i5-7200U, Radeon R7 M460, 35 Wh | Asus Zenbook UX510UW-CN044T 6500U, GeForce GTX 960M, 48 Wh | MSI GL62-6QFi781H11 6700HQ, GeForce GTX 960M, 41.4 Wh | |
|---|---|---|---|---|---|
| Battery runtime | -21% | 13% | 21% | -44% | |
| Reader / Idle (h) | 10.2 | 7.3 -28% | 13.6 33% | 5.7 -44% | |
| WiFi v1.3 (h) | 4.7 | 3.7 -21% | 5.3 13% | 7.2 53% | 2.6 -45% |
| Load (h) | 2.1 | 1.8 -14% | 1.6 -24% | 1.2 -43% |
Pros
Cons
Verdict
The performance of the CX62 is subpar when considering the bulky size and weight. The ULV Kaby Lake CPU and entry-level GeForce 940MX are a poor fit for any demanding workloads outside of browser multi-tasking and multimedia streaming. Gaming is largely limited to very low settings at 768p especially for modern 3D titles while the system fan has an annoying tendency to pulse when under load. The chassis, while visually identical to the respectable GE62, feels more flexible and cheap to the touch. To top it off, the TN display is poorly calibrated out of the box with weak contrast levels and a dim backlight.
The few redeeming qualities of the notebook are its NVMe M.2 slot and the low operating temperatures. The former should boost system responsiveness immensely over our HDD configuration, although an end-user upgrade will unfortunately break the warranty. Meanwhile, the low core temperatures shouldn't be surprising since the thick chassis is derived from the gaming G series where CPUs and GPUs of much higher TDP levels are common. This allows the CX62 to simultaneously maintain faster Turbo Boost speeds and run at cooler temperatures than most systems with similar ULV processors.
The CX62 is essentially a weakened gaming notebook shell outfitted with hardware from a budget multimedia notebook. There are too many cut corners and users will be better off spending the extra hundred or two on a proper Ultrabook with equal or better CPU performance and display options.
MSI CX62 7QL
- 01/16/2017 v6 (old)
Allen Ngo
Price comparison
