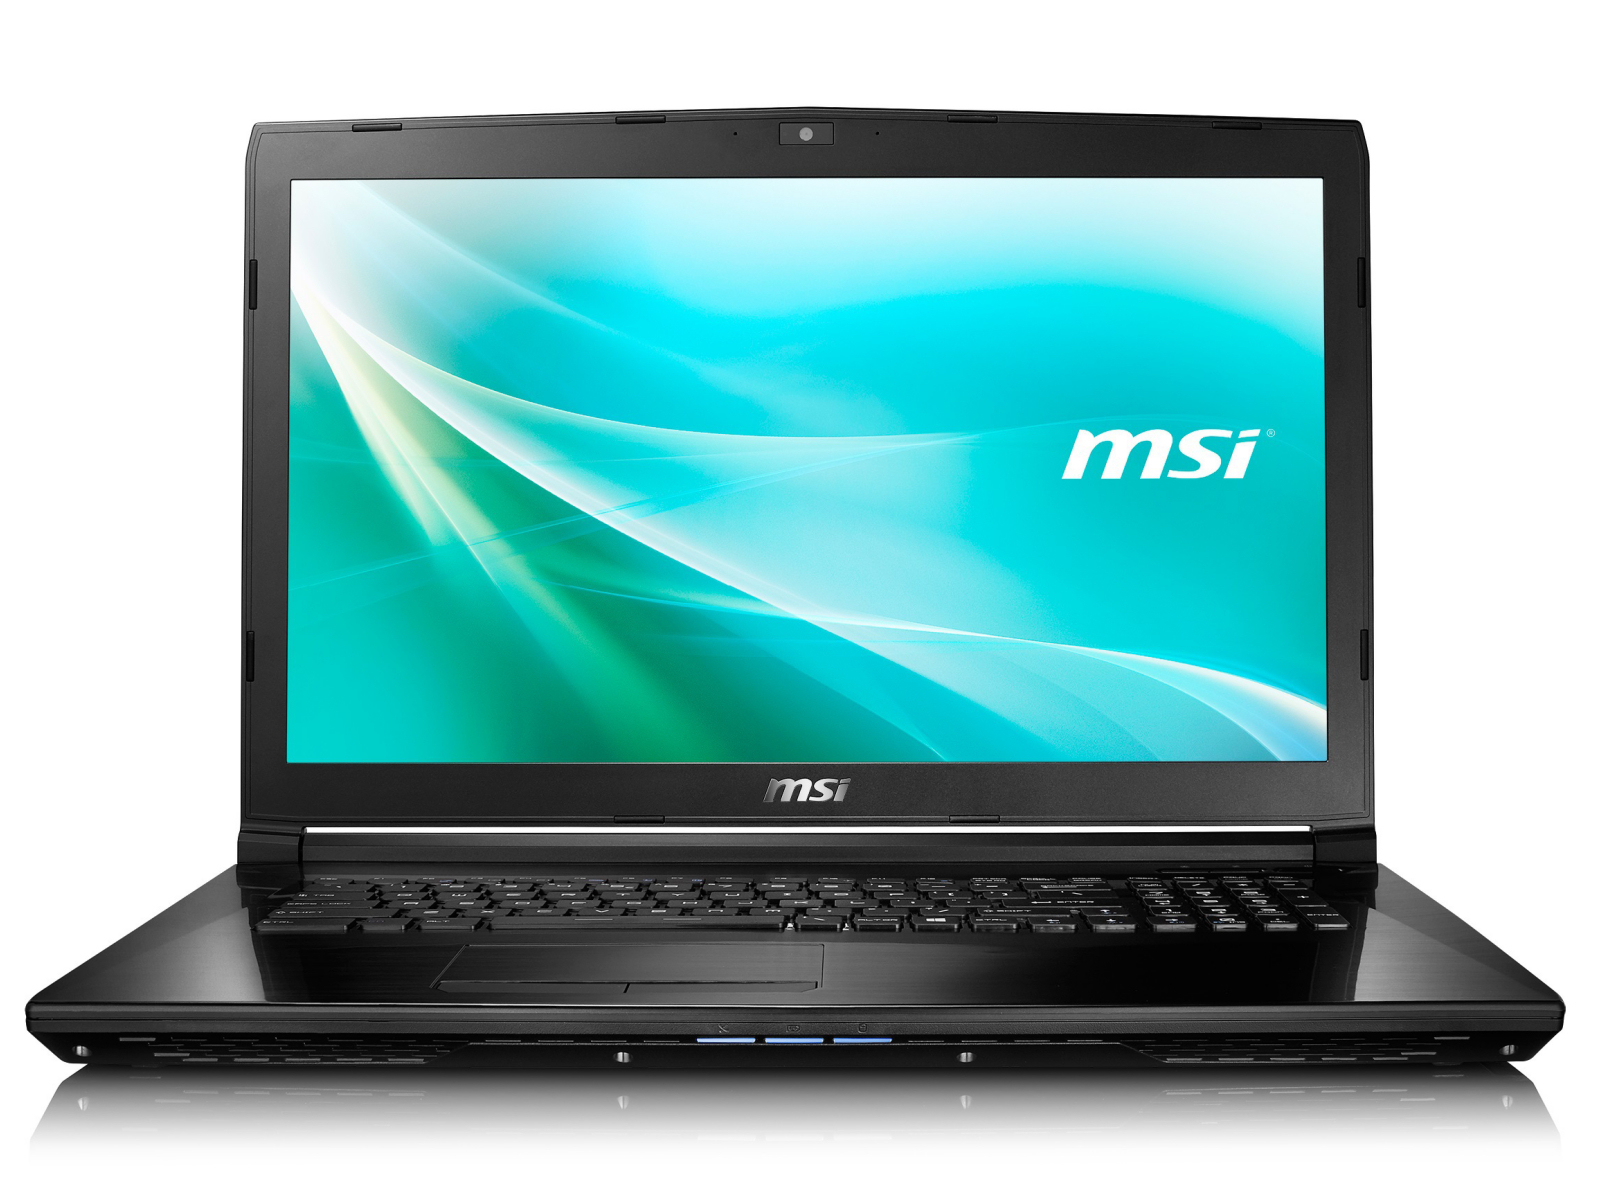
MSI CX72-7QLi581 Notebook Review

For the original German review, see here.
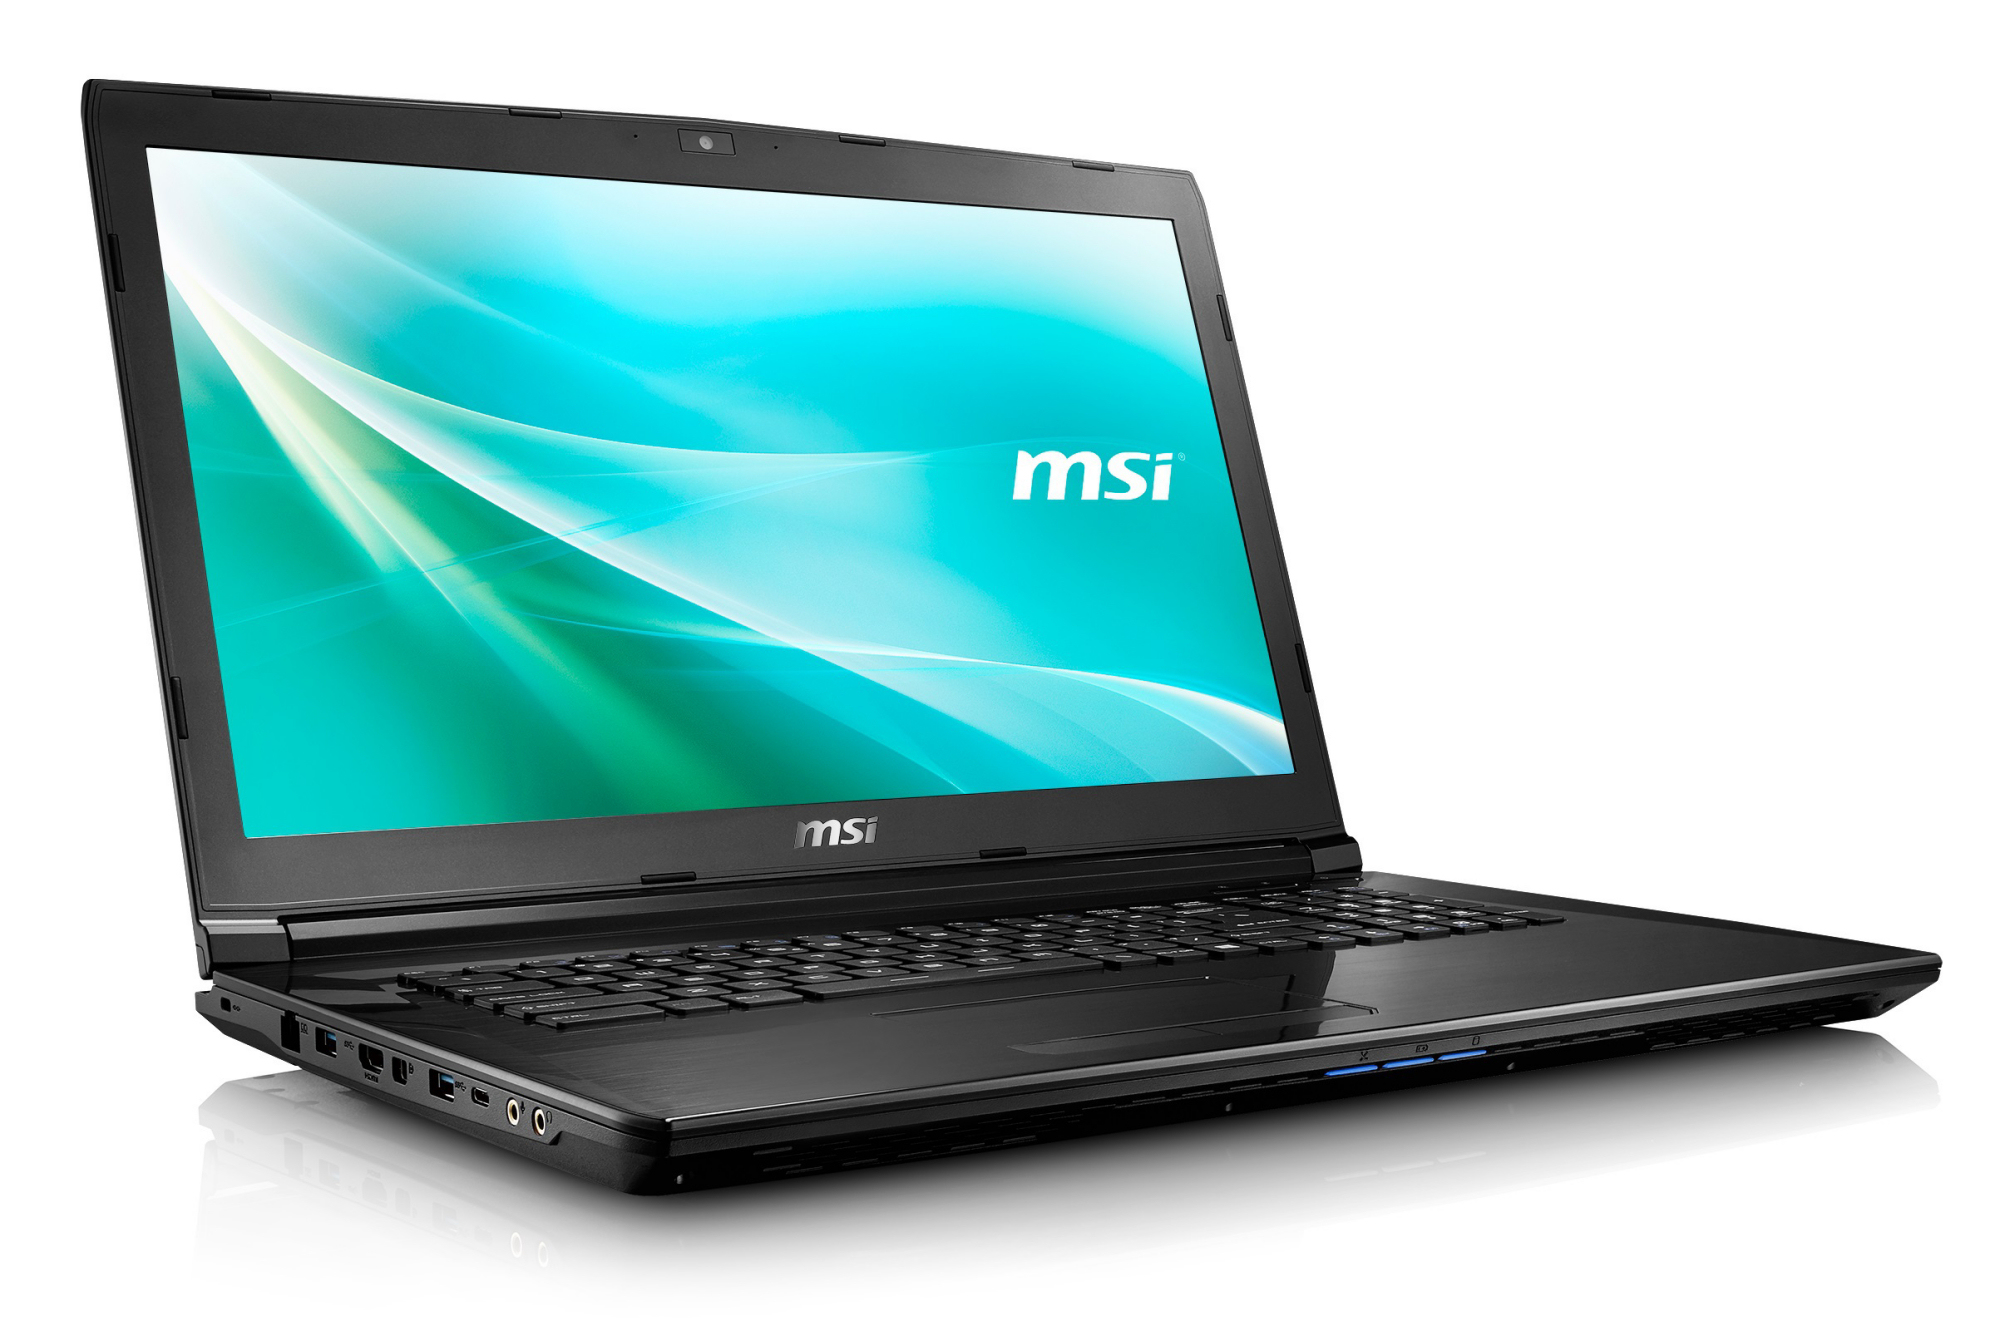
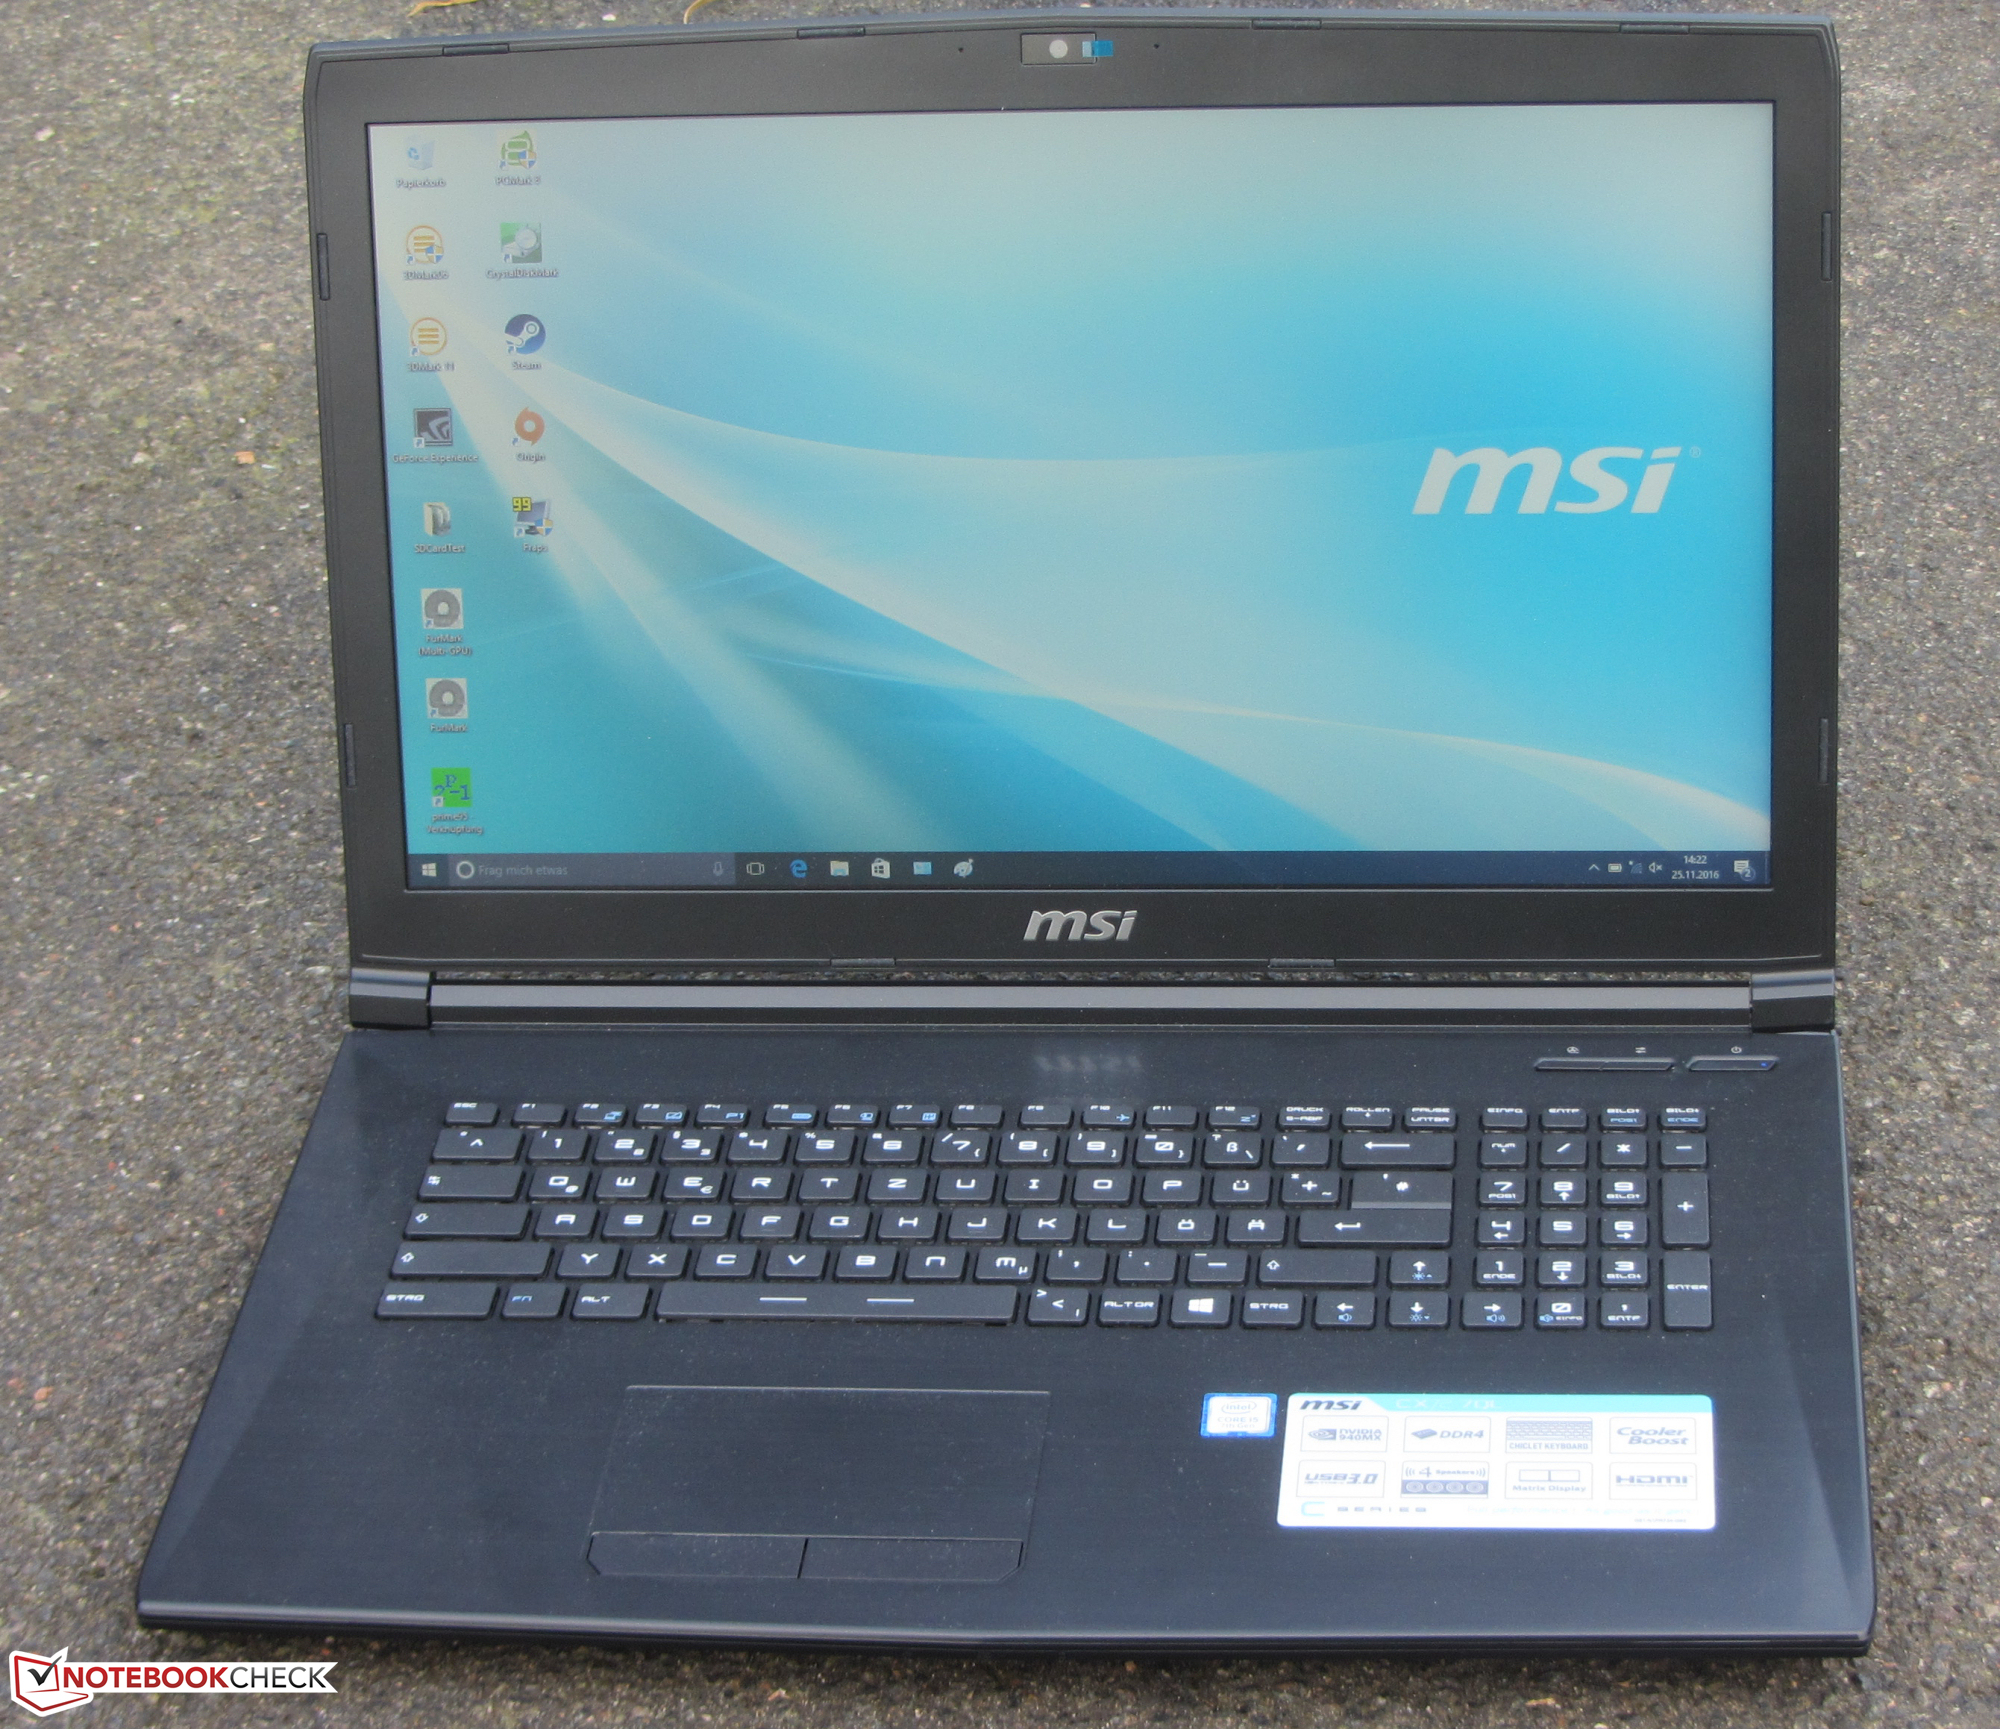
The MSI CX72-7QLi581 is a 17.3-inch all-rounder, which boasts a duo of a Kaby Lake processor and a GeForce 940MX graphics core. We are quite familiar with this case, as it has been used by MSI before: see the MSI GE72 6QF Apache Pro, the MSI GP72 2QE Leopard Pro or the MSI PE70-2QEi581. For our review, we picked out the Acer Aspire E5-774G, the Lenovo IdeaPad 300-17ISK and the Asus F756UX for comparison.
As the CX72 shares the same case as other laptops, we will not be discussing the case, the connectivity, the input devices and the speakers. This information can be found in the reviews of the MSI GE72 6QF Apache Pro, the MSI GP72 2QE Leopard Pro and the MSI PE70-2QEi581.
| SD Card Reader | |
| average JPG Copy Test (av. of 3 runs) | |
| Acer Aspire E5-774G-78NA | |
| Asus F756UX-T7013T | |
| MSI CX72-7QLi581 | |
| Lenovo IdeaPad 300-17ISK 80QH001EGE | |
| Acer TravelMate P278-MG-76L2 | |
| maximum AS SSD Seq Read Test (1GB) | |
| Acer Aspire E5-774G-78NA | |
| Asus F756UX-T7013T | |
| Acer TravelMate P278-MG-76L2 | |
| Lenovo IdeaPad 300-17ISK 80QH001EGE | |
| MSI CX72-7QLi581 | |
| Networking | |
| iperf Server (receive) TCP 1 m | |
| Acer Aspire E5-774G-78NA (seb) | |
| MSI CX72-7QLi581 (jseb) | |
| iperf Client (transmit) TCP 1 m | |
| Acer Aspire E5-774G-78NA (seb) | |
| MSI CX72-7QLi581 (jseb) | |
Display
The matte 17.3-inch display of the CX72 works at a native resolution of 1600x900 pixels. The brightness (262.2 cd/m²) and the contrast (273:1) are low. Furthermore, the screen suffers from PWM flickering (50 Hz) at brightness levels below 50%. This can cause headaches and eye strain.
| |||||||||||||||||||||||||
Brightness Distribution: 77 %
Center on Battery: 268 cd/m²
Contrast: 273:1 (Black: 0.98 cd/m²)
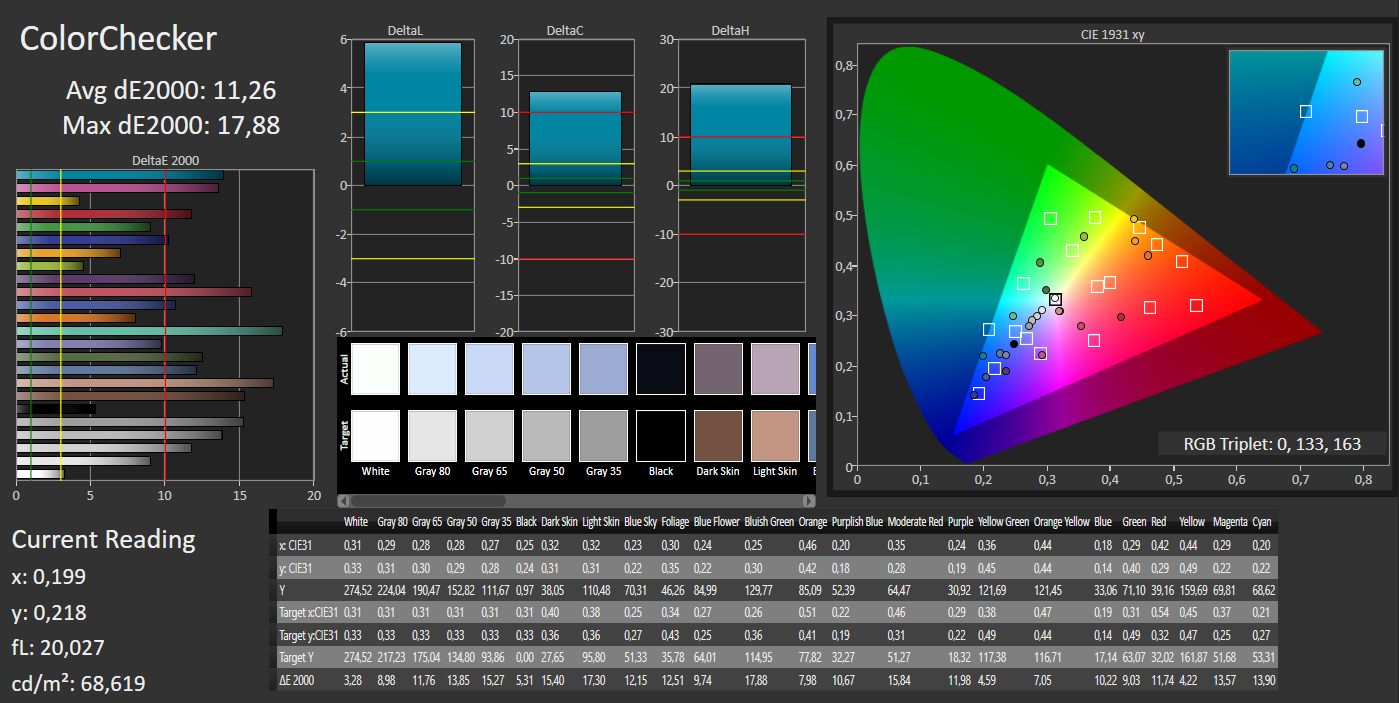
ΔE ColorChecker Calman: 11.26 | ∀{0.5-29.43 Ø4.73}
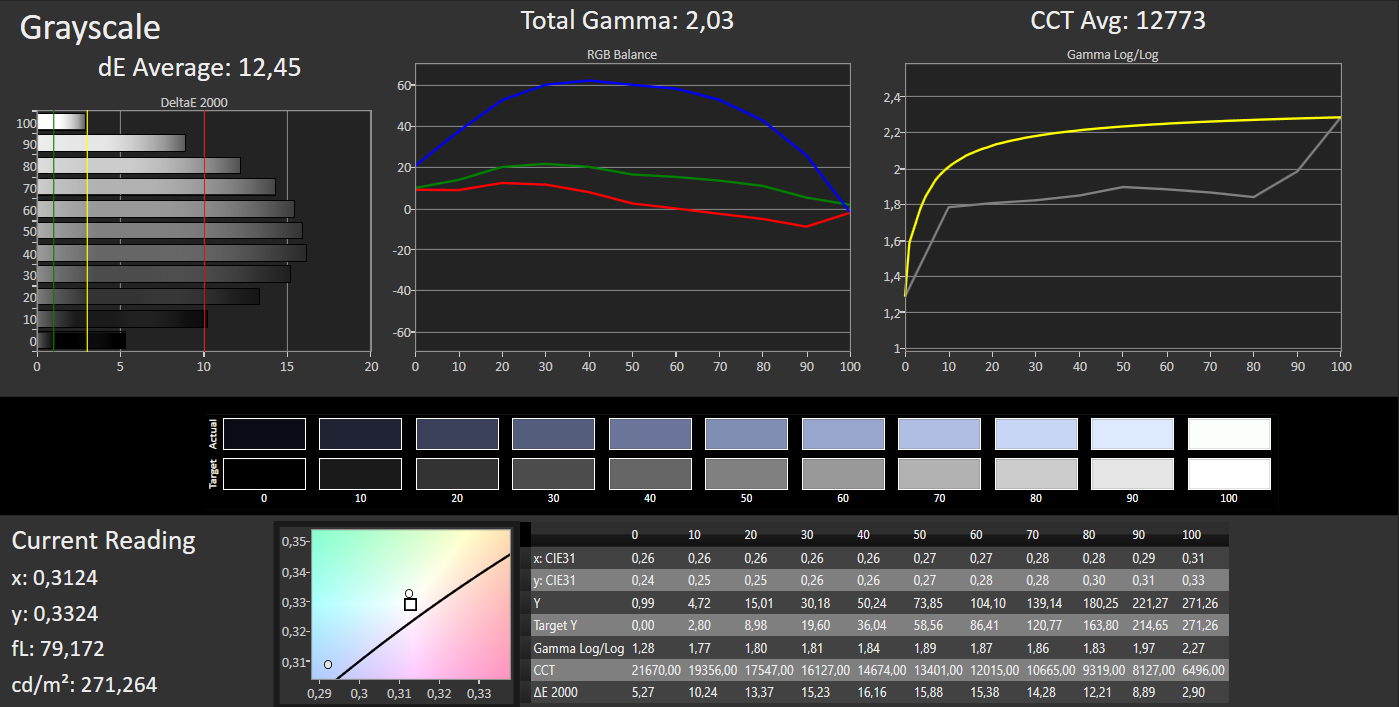
ΔE Greyscale Calman: 12.45 | ∀{0.09-98 Ø4.97}
71% sRGB (Argyll 1.6.3 3D)
46% AdobeRGB 1998 (Argyll 1.6.3 3D)
52% AdobeRGB 1998 (Argyll 3D)
70.8% sRGB (Argyll 3D)
53% Display P3 (Argyll 3D)
Gamma: 2.03
CCT: 12273 K
| MSI CX72-7QLi581 TN LED, 1600x900, 17.3" | Acer Aspire E5-774G-78NA TN LED, 1920x1080, 17.3" | Asus F756UX-T7013T TN LED, 1920x1080, 17.3" | Acer TravelMate P278-MG-76L2 TN LED, 1920x1080, 17.3" | Lenovo IdeaPad 300-17ISK 80QH001EGE TN LED, 1600x900, 17.3" | |
|---|---|---|---|---|---|
| Display | 34% | 26% | 28% | 3% | |
| Display P3 Coverage (%) | 53 | 72.3 36% | 63.9 21% | 68.8 30% | 52.4 -1% |
| sRGB Coverage (%) | 70.8 | 94.8 34% | 93.7 32% | 90.6 28% | 76.1 7% |
| AdobeRGB 1998 Coverage (%) | 52 | 69.3 33% | 64.6 24% | 66.3 27% | 54.2 4% |
| Response Times | 6% | 9% | 7% | 3% | |
| Response Time Grey 50% / Grey 80% * (ms) | 43 ? | 43 ? -0% | 42 ? 2% | 41 ? 5% | 42 ? 2% |
| Response Time Black / White * (ms) | 25 ? | 22 ? 12% | 21 ? 16% | 23 ? 8% | 24 ? 4% |
| PWM Frequency (Hz) | 50 ? | 1000 ? | 1000 ? | 1000 ? | |
| Screen | 46% | 73% | 35% | 12% | |
| Brightness middle (cd/m²) | 268 | 320 19% | 268 0% | 362 35% | 205 -24% |
| Brightness (cd/m²) | 262 | 302 15% | 255 -3% | 344 31% | 182 -31% |
| Brightness Distribution (%) | 77 | 86 12% | 83 8% | 84 9% | 77 0% |
| Black Level * (cd/m²) | 0.98 | 0.4 59% | 0.17 83% | 0.57 42% | 0.43 56% |
| Contrast (:1) | 273 | 800 193% | 1576 477% | 635 133% | 477 75% |
| Colorchecker dE 2000 * | 11.26 | 7.78 31% | 7.18 36% | 9.54 15% | 9.75 13% |
| Colorchecker dE 2000 max. * | 17.88 | 12.74 29% | 11.67 35% | 16.11 10% | 16.02 10% |
| Greyscale dE 2000 * | 12.45 | 8.87 29% | 7.97 36% | 10.39 17% | 12.09 3% |
| Gamma | 2.03 108% | 2.27 97% | 2.34 94% | 2.55 86% | 2.62 84% |
| CCT | 12273 53% | 8979 72% | 8541 76% | 11093 59% | 12875 50% |
| Color Space (Percent of AdobeRGB 1998) (%) | 46 | 62 35% | 59 28% | 59 28% | 49 7% |
| Color Space (Percent of sRGB) (%) | 71 | 95 34% | 94 32% | 90 27% | 76 7% |
| Total Average (Program / Settings) | 29% /
38% | 36% /
55% | 23% /
30% | 6% /
9% |
* ... smaller is better
Screen Flickering / PWM (Pulse-Width Modulation)
| Screen flickering / PWM detected | 50 Hz | ≤ 50 % brightness setting | 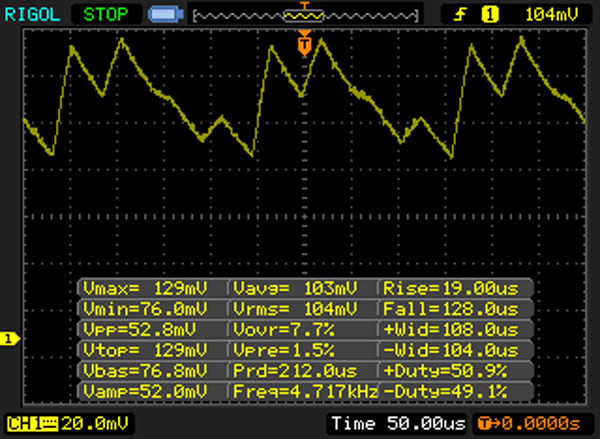 |
The display backlight flickers at 50 Hz (worst case, e.g., utilizing PWM) Flickering detected at a brightness setting of 50 % and below. There should be no flickering or PWM above this brightness setting. The frequency of 50 Hz is very low, so the flickering may cause eyestrain and headaches after extended use. In comparison: 52 % of all tested devices do not use PWM to dim the display. If PWM was detected, an average of 7791 (minimum: 5 - maximum: 343500) Hz was measured. | |||
With factory settings, the screen has a DeltaE 2000 color deviation of 11.26. The optimal range (DeltaE smaller than 3) is far off. The display also suffers from a blue tint.
Display Response Times
| ↔ Response Time Black to White | ||
|---|---|---|
| 25 ms ... rise ↗ and fall ↘ combined | ↗ 7 ms rise | 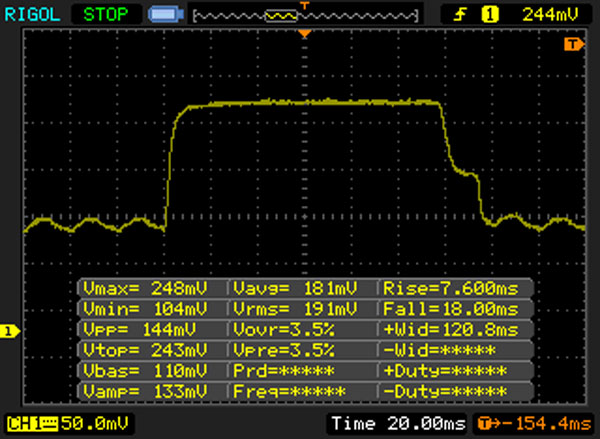 |
| ↘ 18 ms fall | ||
| The screen shows relatively slow response rates in our tests and may be too slow for gamers. In comparison, all tested devices range from 0.1 (minimum) to 240 (maximum) ms. » 59 % of all devices are better. This means that the measured response time is worse than the average of all tested devices (19.9 ms). | ||
| ↔ Response Time 50% Grey to 80% Grey | ||
| 43 ms ... rise ↗ and fall ↘ combined | ↗ 22 ms rise | 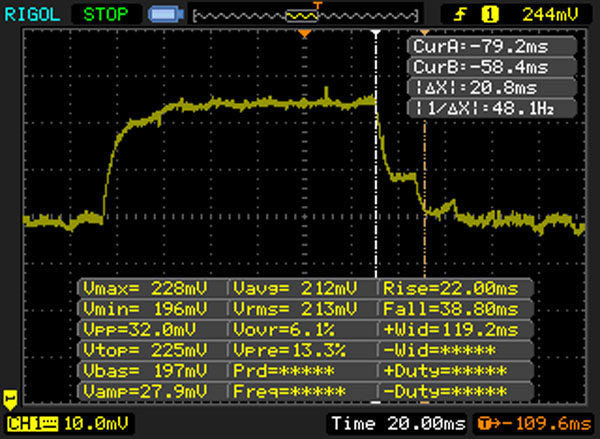 |
| ↘ 21 ms fall | ||
| The screen shows slow response rates in our tests and will be unsatisfactory for gamers. In comparison, all tested devices range from 0.165 (minimum) to 636 (maximum) ms. » 71 % of all devices are better. This means that the measured response time is worse than the average of all tested devices (31.1 ms). | ||
MSI has installed a TN panel in this model, which means the viewing angles are not great. The screen might not be legible from all angles and the low brightness, paired with the poor contrast, means outdoors use is going to be difficult. We recommend finding a well-shaded spot.
Performance
For the MSI CX72-7QLi581 to be a 17.3-inch all-rounder, the model needs sufficient performance to accomplish everyday tasks and run a few games. Our test model is available for 750 Euros (~$794). Currently, this seems to be the only configuration available.
Processor
The CX72 runs on an Intel Core i5-7200U (Kaby Lake) dual-core processor. The CPU is middle-class and offers good performance. It deals with typical tasks, such as surfing the web or writing documents, with aplomb. The processor of our model is a conservative ULV model (TDP: 15 W). The CPU works at a base clock speed of 2.5 GHz. Thanks to Turbo, it is possible for the CPU to run at up to 3.1 GHz (both cores). The full performance of the processor is available while on battery and while plugged in.
| Geekbench 3 | |
| 32 Bit Single-Core Score | |
| Acer Aspire E5-774G-78NA | |
| MSI CX72-7QLi581 | |
| Lenovo IdeaPad 300-17ISK 80QH001EGE | |
| 32 Bit Multi-Core Score | |
| Acer Aspire E5-774G-78NA | |
| MSI CX72-7QLi581 | |
| Lenovo IdeaPad 300-17ISK 80QH001EGE | |
| Geekbench 4.0 | |
| 64 Bit Single-Core Score | |
| MSI CX72-7QLi581 | |
| 64 Bit Multi-Core Score | |
| MSI CX72-7QLi581 | |
| JetStream 1.1 - 1.1 Total | |
| Acer Aspire E5-774G-78NA | |
| MSI CX72-7QLi581 | |
| Lenovo IdeaPad 300-17ISK 80QH001EGE | |
| Acer TravelMate P278-MG-76L2 | |
System Performance
The system runs smoothly and we did not find any major issues. The PCMark benchmark results are quite good, but the overall performance can be increased further by installing an M.2 SSD as the system drive. A second RAM module would also boost the performance.
| PCMark 8 Home Score Accelerated v2 | 3586 points | |
Help | ||
| PCMark 8 - Home Score Accelerated v2 | |
| Acer Aspire E5-774G-78NA | |
| MSI CX72-7QLi581 | |
| Acer TravelMate P278-MG-76L2 | |
| Lenovo IdeaPad 300-17ISK 80QH001EGE | |
| Asus F756UX-T7013T | |
Storage Device
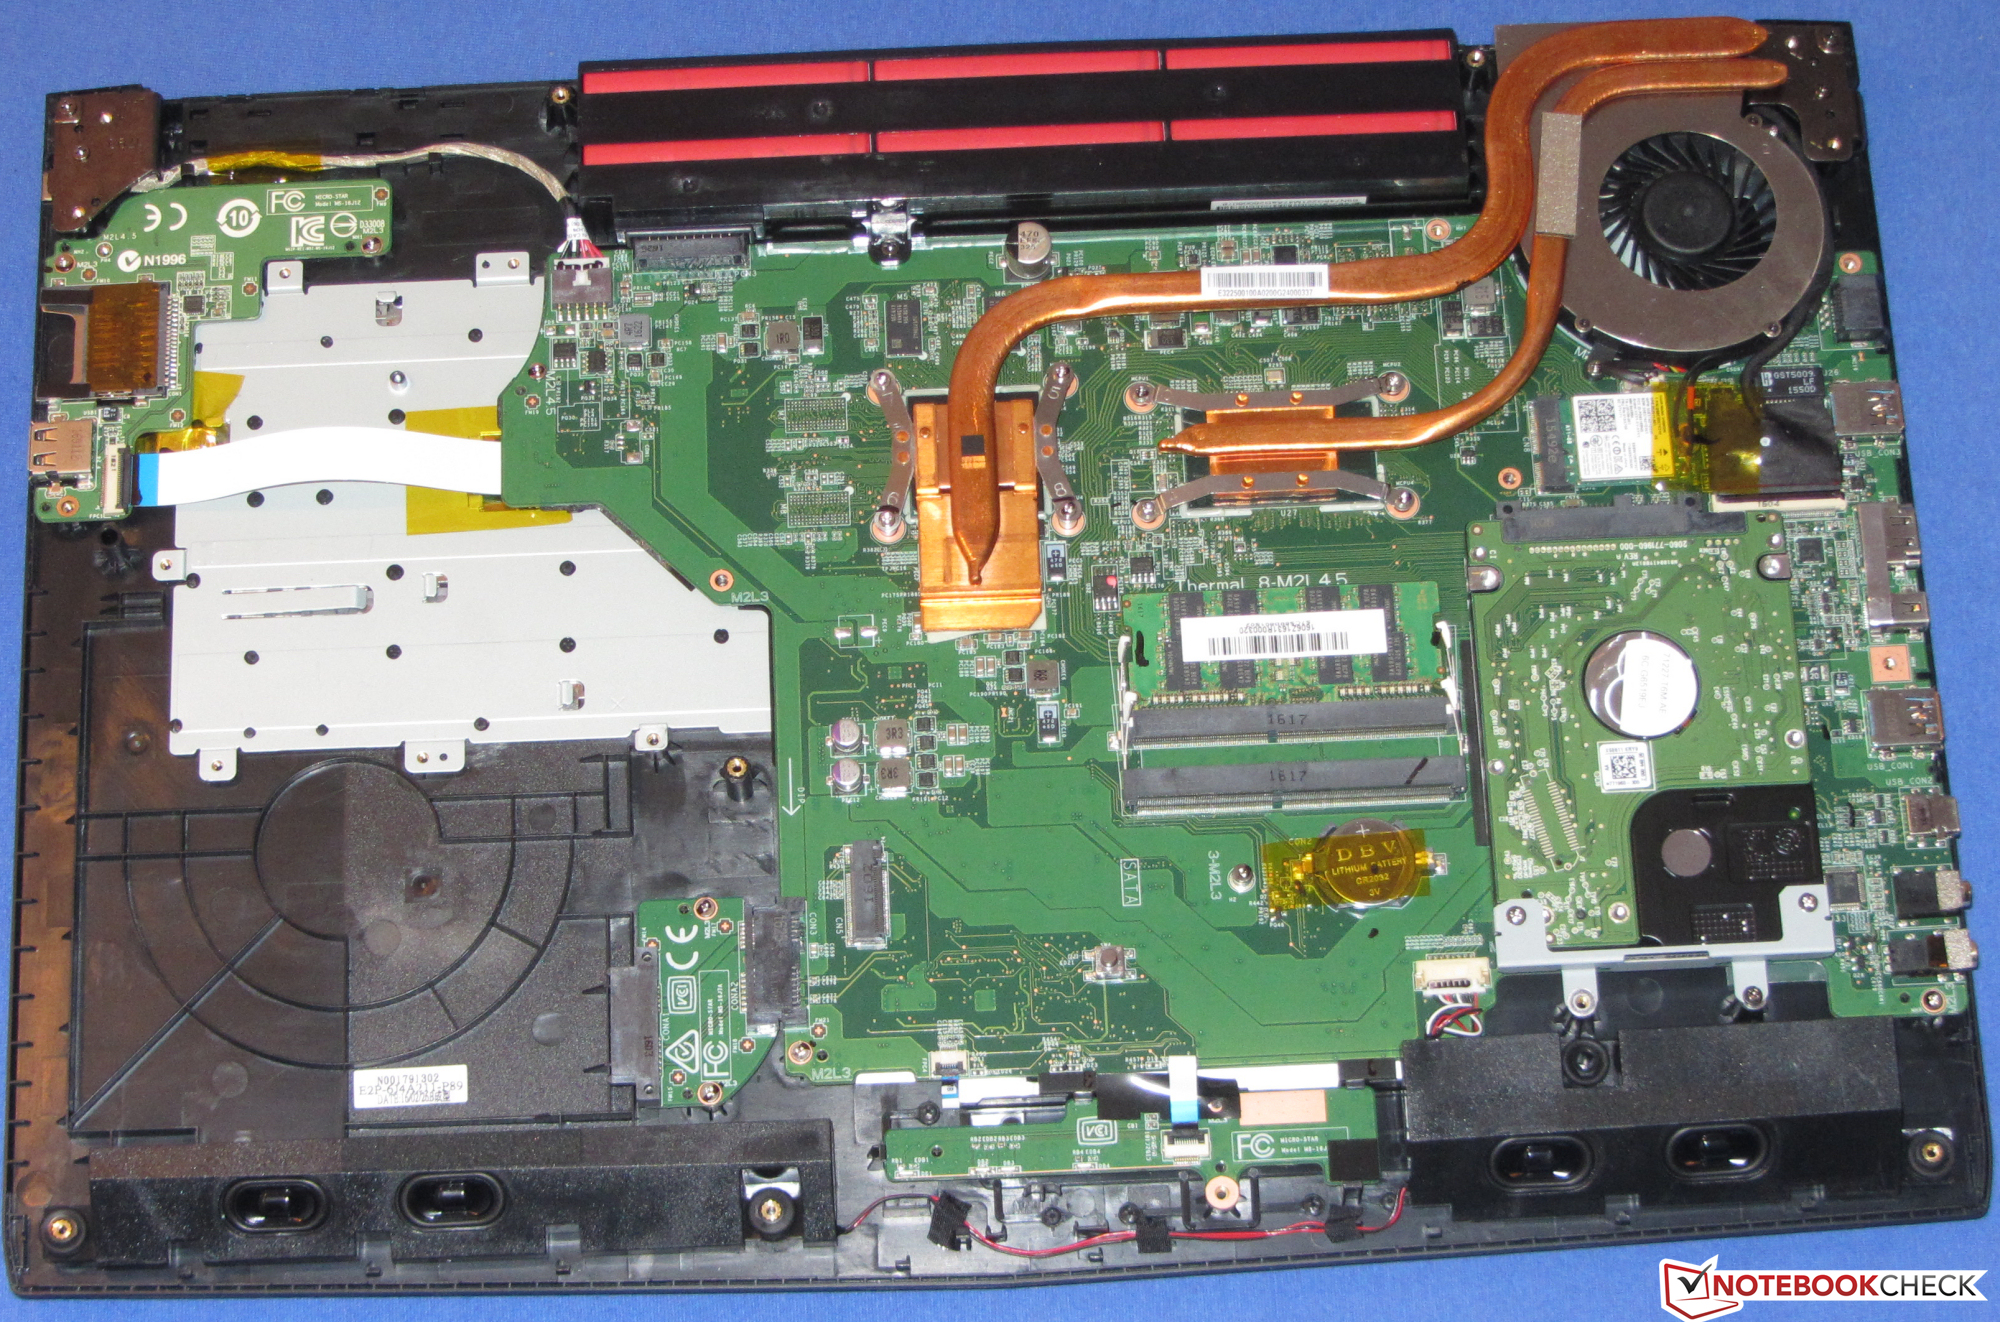
Currently, the system drive is a traditional 2.5-inch HDD from Western Digital. The drive runs at 5,400 rpm and has a capacity of 1 TB. The transfer speeds of the HDD are at the expected level. The notebook offers an empty slot for M.2 SSDs (2280).

| MSI CX72-7QLi581 WDC Scorpio Blue WD10JPVX-22JC3T0 | Acer Aspire E5-774G-78NA Lite-On CV1-8B256 | Asus F756UX-T7013T HGST Travelstar 5K1000 HTS541010A9E680 | Acer TravelMate P278-MG-76L2 Lite-On CV1-8B256 | Lenovo IdeaPad 300-17ISK 80QH001EGE Toshiba MQ01ABD100 | |
|---|---|---|---|---|---|
| CrystalDiskMark 3.0 | 9146% | -6% | 7900% | -17% | |
| Read Seq (MB/s) | 102.8 | 520 406% | 105.8 3% | 473 360% | 100.6 -2% |
| Write Seq (MB/s) | 100.2 | 332.8 232% | 105 5% | 366.3 266% | 96.3 -4% |
| Read 512 (MB/s) | 34.83 | 382.8 999% | 33.33 -4% | 329.4 846% | 28.15 -19% |
| Write 512 (MB/s) | 46.87 | 357.7 663% | 39.12 -17% | 357.3 662% | 43.34 -8% |
| Read 4k (MB/s) | 0.422 | 32.31 7556% | 0.413 -2% | 30.83 7206% | 0.312 -26% |
| Write 4k (MB/s) | 1.063 | 85.1 7906% | 0.947 -11% | 74.8 6937% | 0.792 -25% |
| Read 4k QD32 (MB/s) | 0.918 | 277.7 30151% | 0.812 -12% | 245.1 26599% | 0.708 -23% |
| Write 4k QD32 (MB/s) | 1.064 | 269.8 25257% | 0.968 -9% | 217.3 20323% | 0.764 -28% |
Graphics Card
The GeForce 940MX graphics core is a good fit for the middle-class processor. This dedicated GPU offers 2,048 MB DDR3 memory and supports DirectX 12. It should run at a max of 1,242 MHz, but our model caps out at 1,176 MHz. It seems that MSI has regulated the speeds. The GeForce 940M GPU offers the same speed, which means the 3DMark results of the two are quite similar.
The 940MX is available with DDR3 and GDDR5 memory. The latter offers higher performance thanks to the faster memory. If you want to find out more about this GPU, check out our review of the Aspire E5-774G.
| 3DMark 11 Performance | 2508 points | |
Help | ||
| 3DMark 11 - 1280x720 Performance GPU | |
| Asus F756UX-T7013T | |
| Acer Aspire E5-774G-78NA | |
| MSI CX72-7QLi581 | |
| Acer TravelMate P278-MG-76L2 | |
| Lenovo IdeaPad 300-17ISK 80QH001EGE | |
Gaming Performance
The CX72 can run many games fluidly at an HD resolution (1366x768 pixels) and medium settings. However, games with high hardware requirements (like Dishonored 2 or Mafia 3) will not run well on this laptop. We recommend trying out games which have been out for a few years.
| low | med. | high | ultra | |
|---|---|---|---|---|
| BioShock Infinite (2013) | 99.9 | 53.8 | 45 | |
| Call of Duty Infinite Warfare (2016) | 37.6 | 34.4 | 17.8 | |
| Dishonored 2 (2016) | 18 | 14.7 |
Emissions and Energy
System Noise
The laptop does not make much noise. While idle, the fan is off and we can hear the hard drive running. However, as the HDD is quiet, we have to listen closely to distinguish it. At load, the laptop does not get very loud: during our stress test, the model reaches a max noise emission of 34.2 dB.
Noise level
| Idle |
| 30.9 / 30.9 / 30.9 dB(A) |
| HDD |
| 31.4 dB(A) |
| DVD |
| 36.3 / dB(A) |
| Load |
| 34 / 34.2 dB(A) |
 | ||
30 dB silent 40 dB(A) audible 50 dB(A) loud |
||
min: | ||
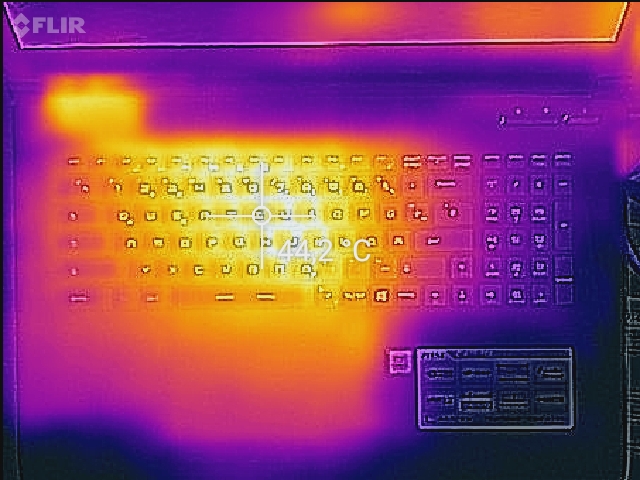
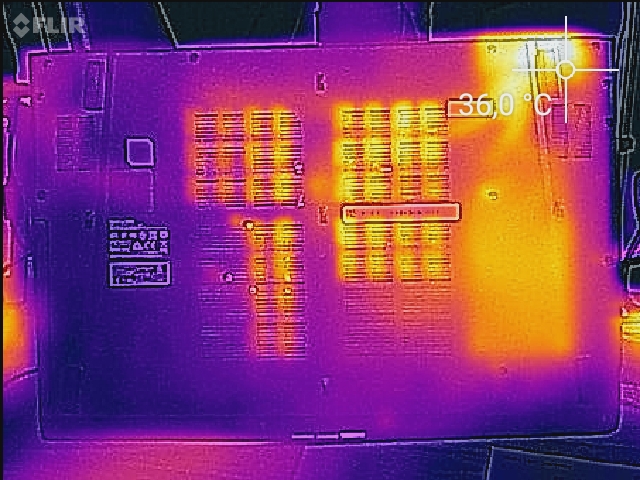
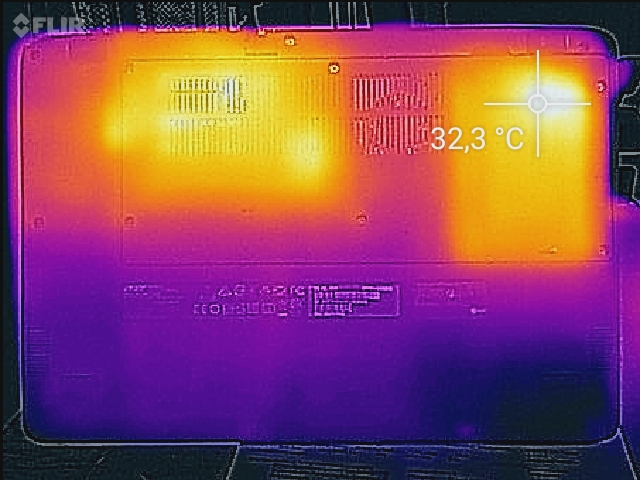
Temperature
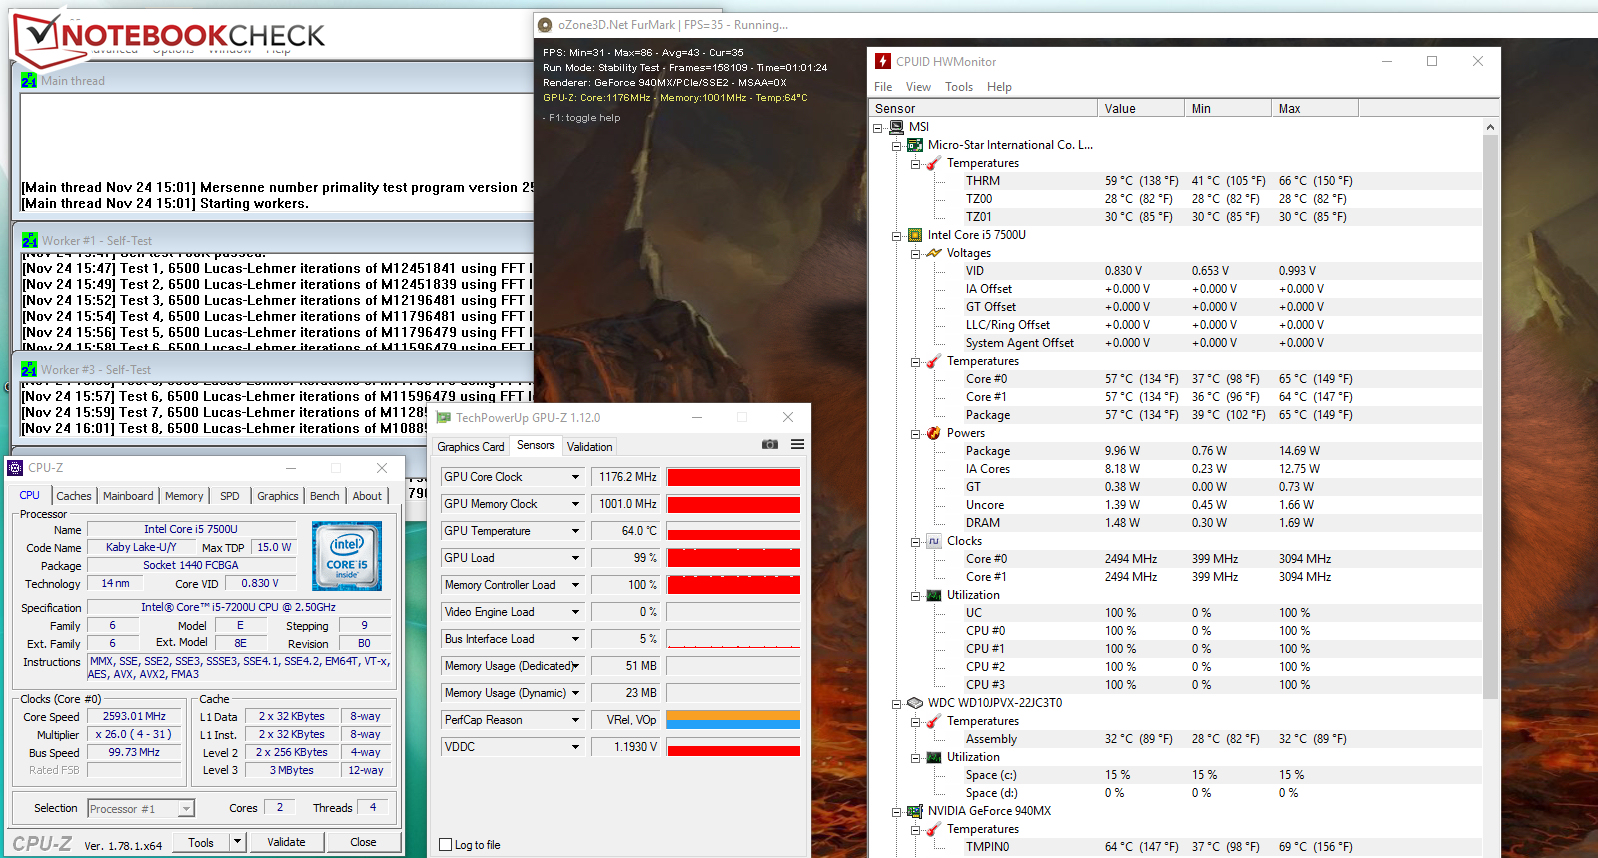
In our stress test (Prime95 and Furmark run together for at least a hour), the CX72 performs at the same level while plugged in and while on battery: the CPU runs at 2.6 to 2.7 GHz, while the graphics core runs at 1,176 MHz. The laptop barely heats up and we could only find one measurement point which crossed the 40 °C mark during our stress test.
(±) The maximum temperature on the upper side is 40.1 °C / 104 F, compared to the average of 36.8 °C / 98 F, ranging from 21 to 71 °C for the class Multimedia.
(+) The bottom heats up to a maximum of 36.6 °C / 98 F, compared to the average of 39.1 °C / 102 F
(+) In idle usage, the average temperature for the upper side is 25.2 °C / 77 F, compared to the device average of 31.3 °C / 88 F.
(+) The palmrests and touchpad are cooler than skin temperature with a maximum of 31.7 °C / 89.1 F and are therefore cool to the touch.
(-) The average temperature of the palmrest area of similar devices was 28.7 °C / 83.7 F (-3 °C / -5.4 F).

Apple MacBook 12 (Early 2016) 1.1 GHz audio analysis
(+) | speakers can play relatively loud (83.6 dB)
Bass 100 - 315 Hz
(±) | reduced bass - on average 11.3% lower than median
(±) | linearity of bass is average (14.2% delta to prev. frequency)
Mids 400 - 2000 Hz
(+) | balanced mids - only 2.4% away from median
(+) | mids are linear (5.5% delta to prev. frequency)
Highs 2 - 16 kHz
(+) | balanced highs - only 2% away from median
(+) | highs are linear (4.5% delta to prev. frequency)
Overall 100 - 16.000 Hz
(+) | overall sound is linear (10.2% difference to median)
Compared to same class
» 7% of all tested devices in this class were better, 2% similar, 91% worse
» The best had a delta of 5%, average was 18%, worst was 53%
Compared to all devices tested
» 5% of all tested devices were better, 1% similar, 94% worse
» The best had a delta of 4%, average was 24%, worst was 134%
Frequency diagram for comparison (checkboxes can be selected)
Power Consumption
The laptop needs max 11.6 W while idle, and during our stress test it consumed up to 61 W. This is quite normal, as this is a 17.3-inch model. The power adapter can handle these levels as it offers 65 W.
| Off / Standby | |
| Idle | |
| Load |
|
Key:
min: | |
Battery Life
In our practical WLAN test, our script simulates the load from surfing the web and going on different websites. The power profile is set to "Balanced" and the power-saver functions are turned off. The brightness is set to around 150 cd/m². The CX72 lasts 4:38 hours.
| Battery Runtime - WiFi Websurfing | |
| Lenovo IdeaPad 300-17ISK 80QH001EGE | |
| Acer Aspire E5-774G-78NA | |
| Acer TravelMate P278-MG-76L2 | |
| MSI CX72-7QLi581 | |
| Asus F756UX-T7013T | |
Pros
Cons
Verdict
The MSI CX72-7QLi581 is destined for home office use. It offers sufficient performance to accomplish everyday tasks and run a few games. It runs quietly and barely heats up. Furthermore, the laptop offers 1 TB storage space and can be upgraded with an M.2 SSD (2280). This procedure is made possible by the removable bottom flap of the laptop. The keyboard is great for home use and the battery life is decent. We do not like the HD+ display as much as it has poor brightness and contrast.
The MSI CX72-7QLi581 is a solid 17.3-inch all-rounder for home office use. This model has no great strengths, but it also has no glaring weaknesses.
The recently tested Acer Aspire E5-774G may be a good alternative. The E5-774G-553R model is available for 800 Euros (~$848) and offers a 1 TB HDD alongside an SSD. It comes with a much better FHD screen and the more powerful GDDR5 version of the GeForce 940MX GPU.
MSI CX72-7QLi581
- 11/26/2016 v5.1 (old)
Sascha Mölck
Price comparison
