HP Pavilion x360 13t-u100 Convertible Review
Since Lenovo’s Yoga brand launched the 360-degree hinge convertible craze several years ago, a number of competitors have followed suit with their own adaptations of the concept. Among those have been larger convertibles—whose practicality about which we have more recently voiced our doubts—and less expensive, budget versions of the original Yoga concept. HP was one of the first movers in the latter market, which has since picked up quite a lot of steam amongst general consumers.
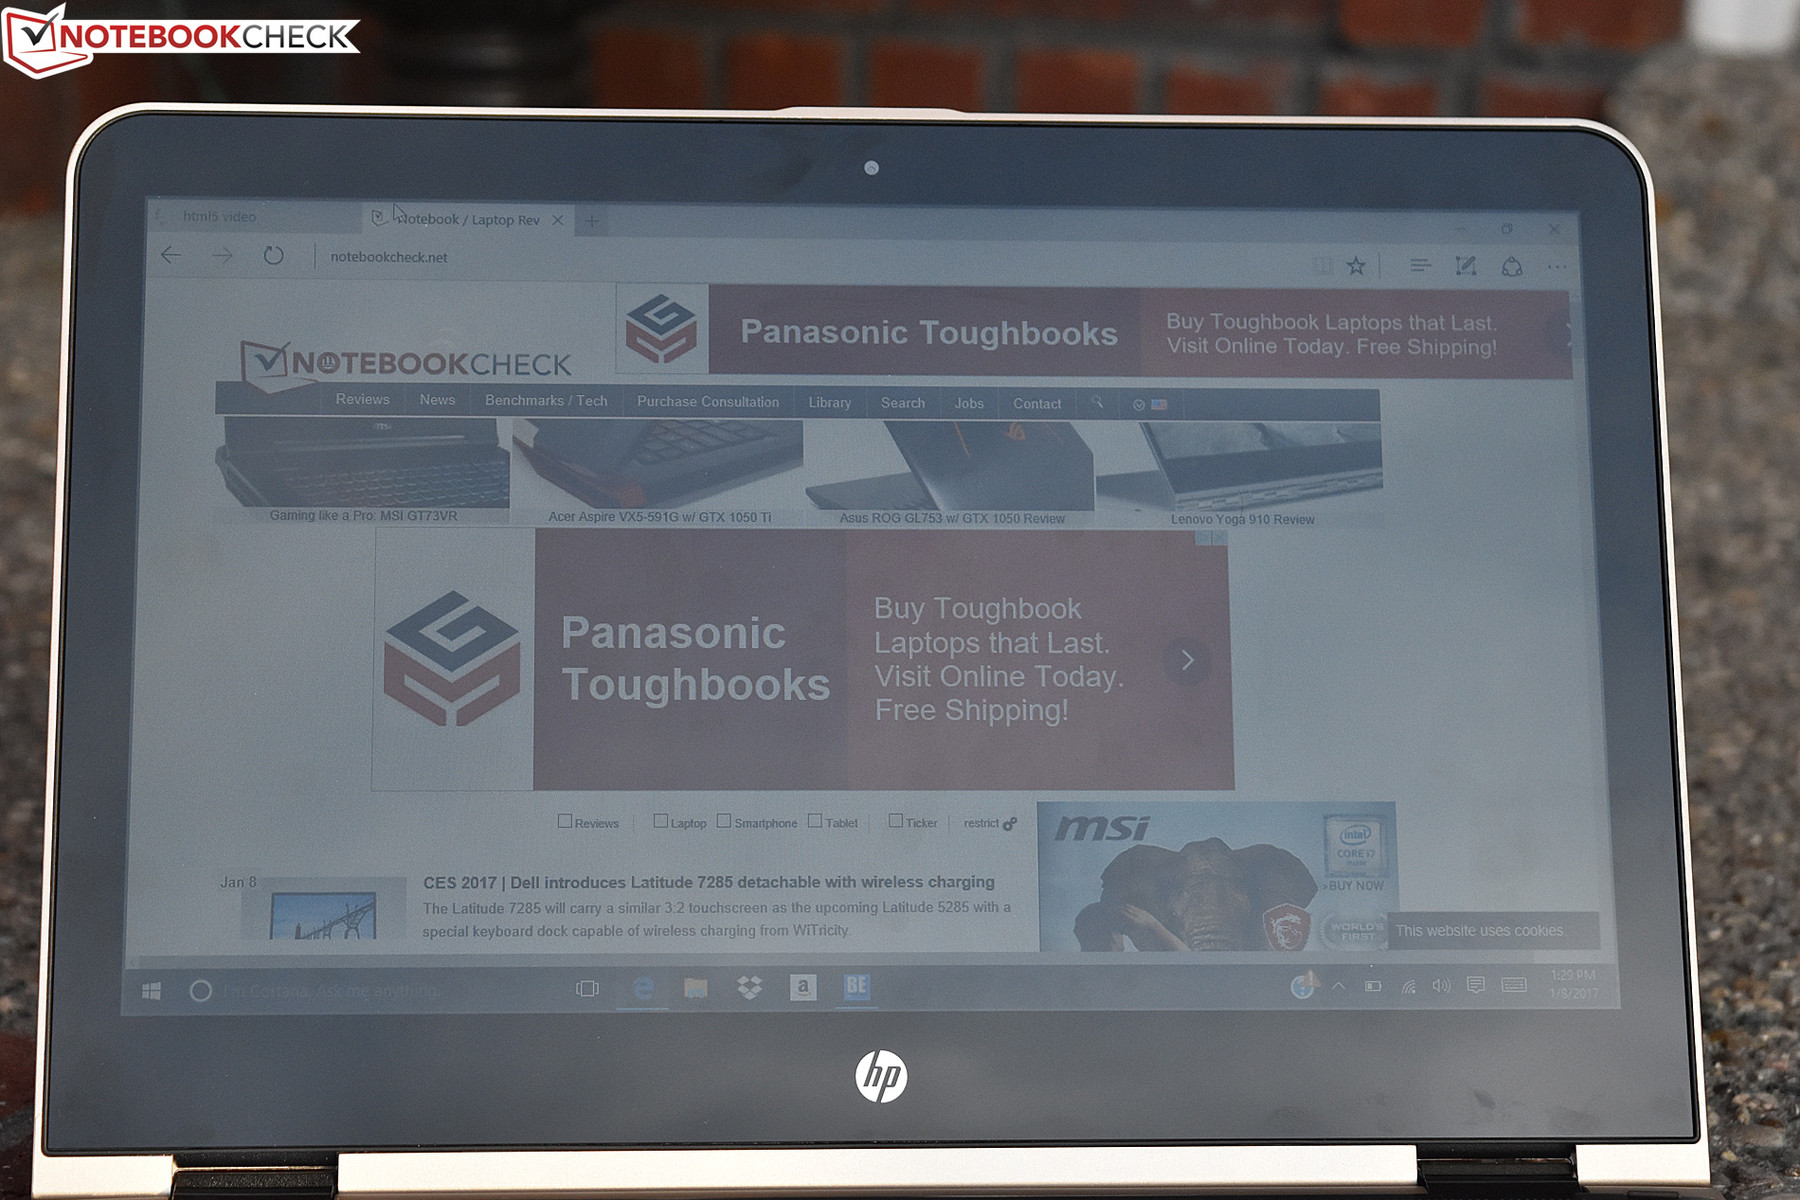
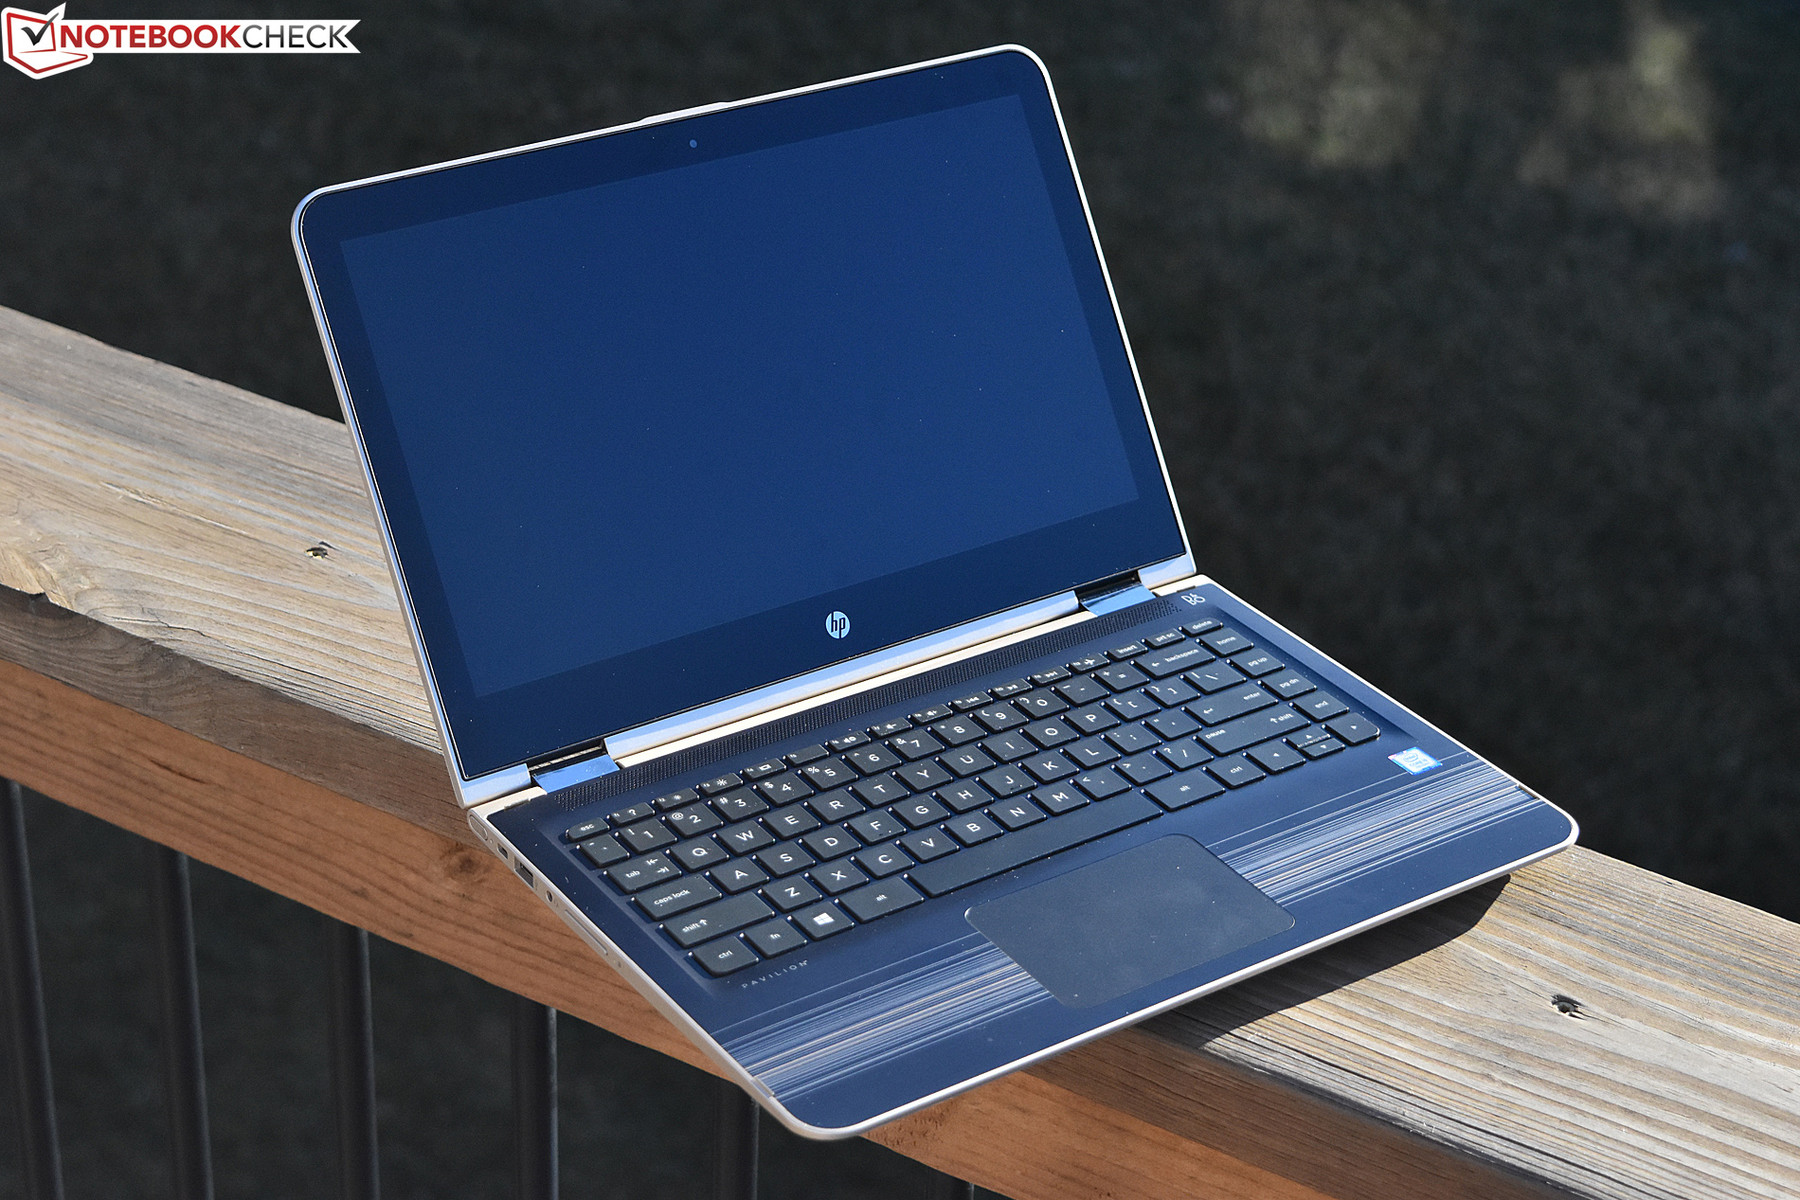
Unlike the recently-reviewed 15.6-inch Envy x360 15t, the HP x360 13t-u100 features a 13.3-inch display panel and a very manageable weight and size to go with it. Of course, it also maintains the touchscreen, albeit a lower-resolution (and thus less expensive) alternative to the norm for machines in this segment. Other highlights include a stylish (if primarily plastic) case design, Core i5 CPU, 8 GB DDR4 memory, and solid-state storage. All of this comes in at a price of around $665 currently (at Amazon), which places the 13t-u100 a notch above the budget segment, but still well within reach of those searching within.
Case
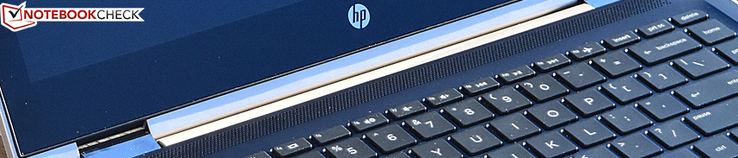
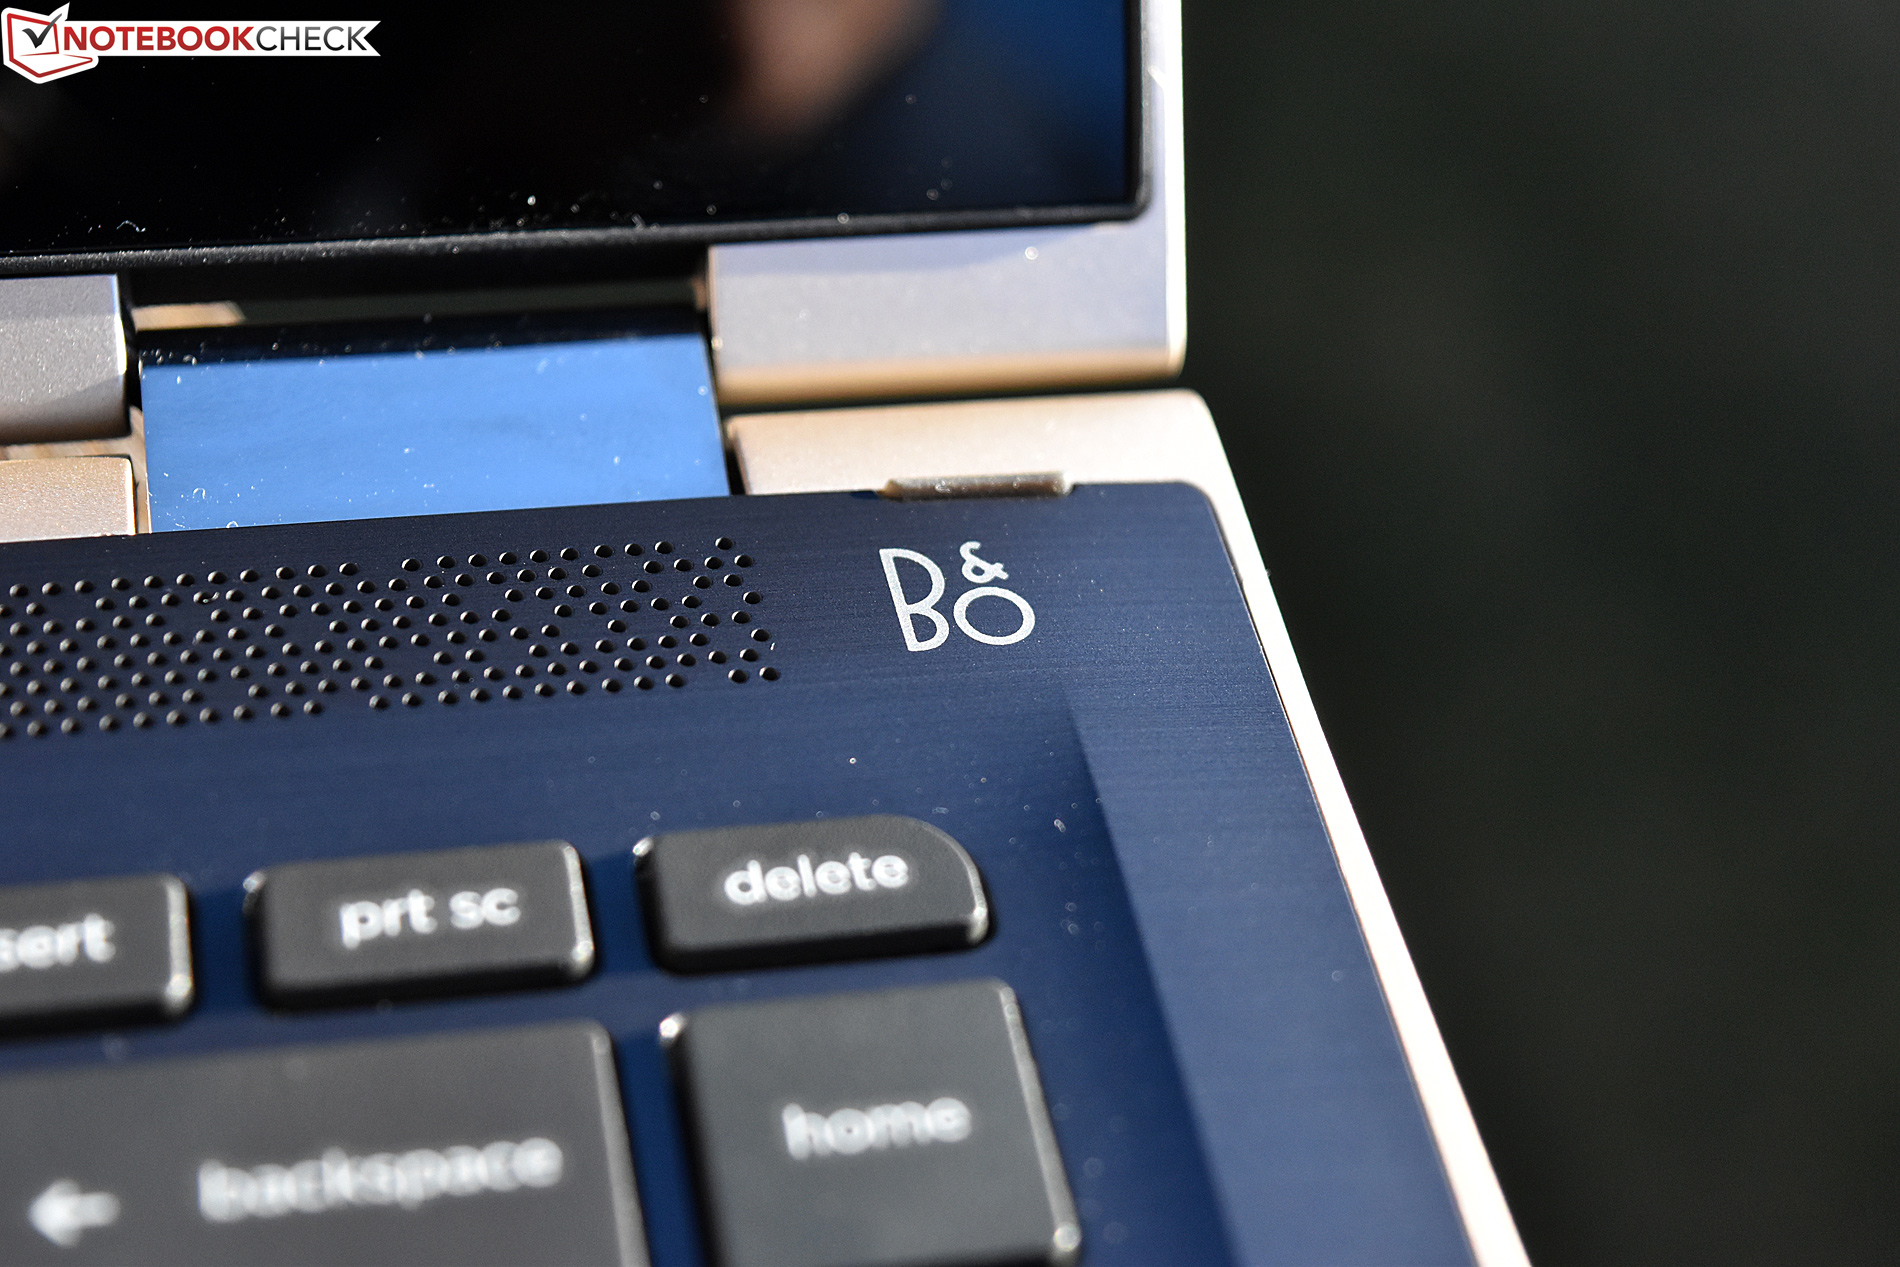
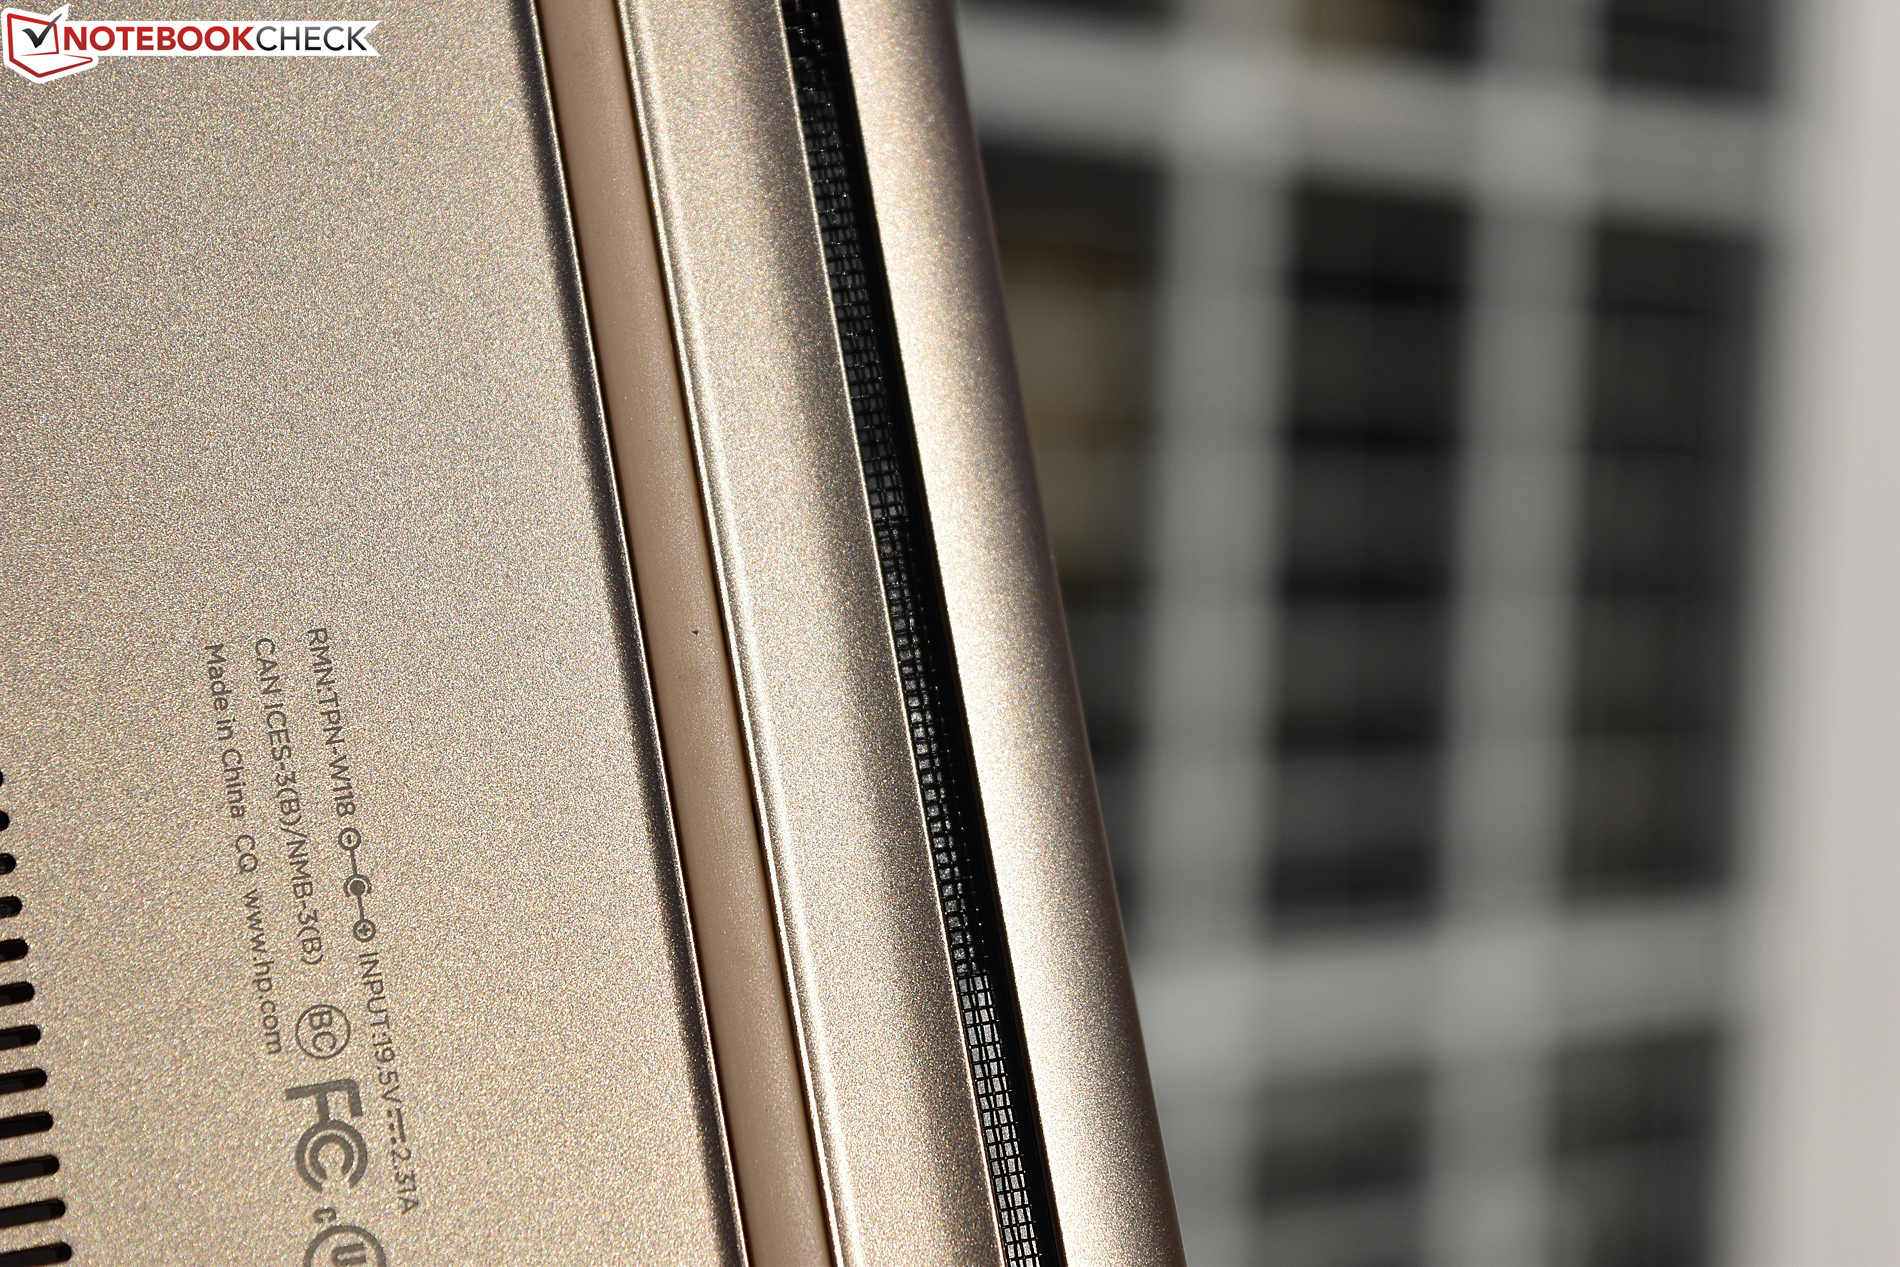
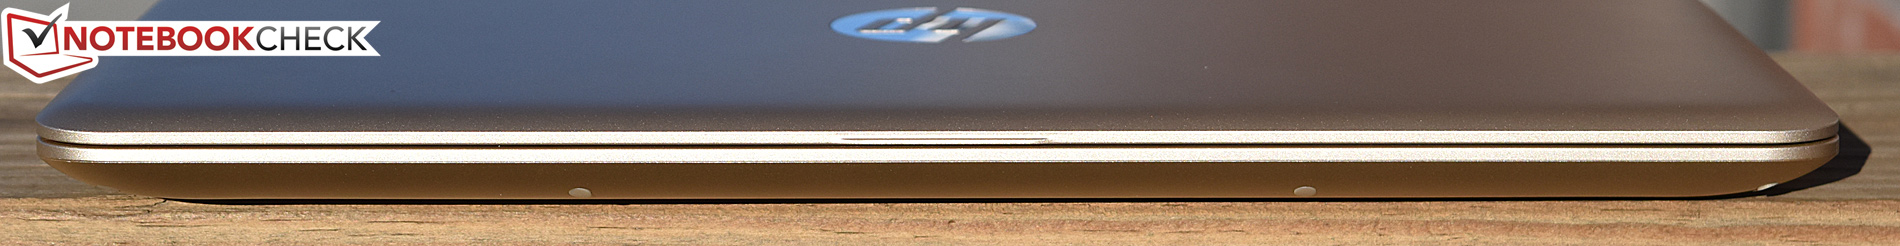
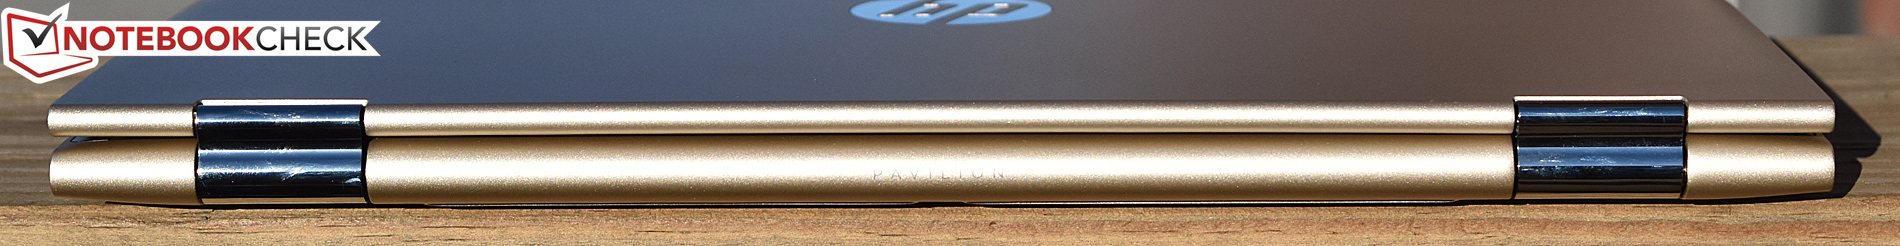
The Pavilion x360 13t-u100 features a plastic case finished with a metallic sheen. From a distance, the notebook certainly appears higher-end than it is, right down to the flashy chrome hinge covers and HP logo on the display lid. Closer up, the compromises in build quality become somewhat more prevalent, and those with a keen eye will notice the same plastic production seams in the border of the base unit which almost at first appear to be tiny cracks. Still, all in all, the x360 13t looks and feels satisfactory.
Although mostly solid, the case does succumb quite readily to any twisting, and pressure on the back of the display lid leads to visible distortions on the LCD panel. Although mostly solid while resting on a hard surface, the base unit suffers a noticeable bit of yield in the area just between the touchpad and keyboard, where even moderate pressure results in phantom clicks from the integrated touchpad buttons. Apart from this, the x360 seems well fit for general use, and it’s very comfortable both on the lap or on a desk.
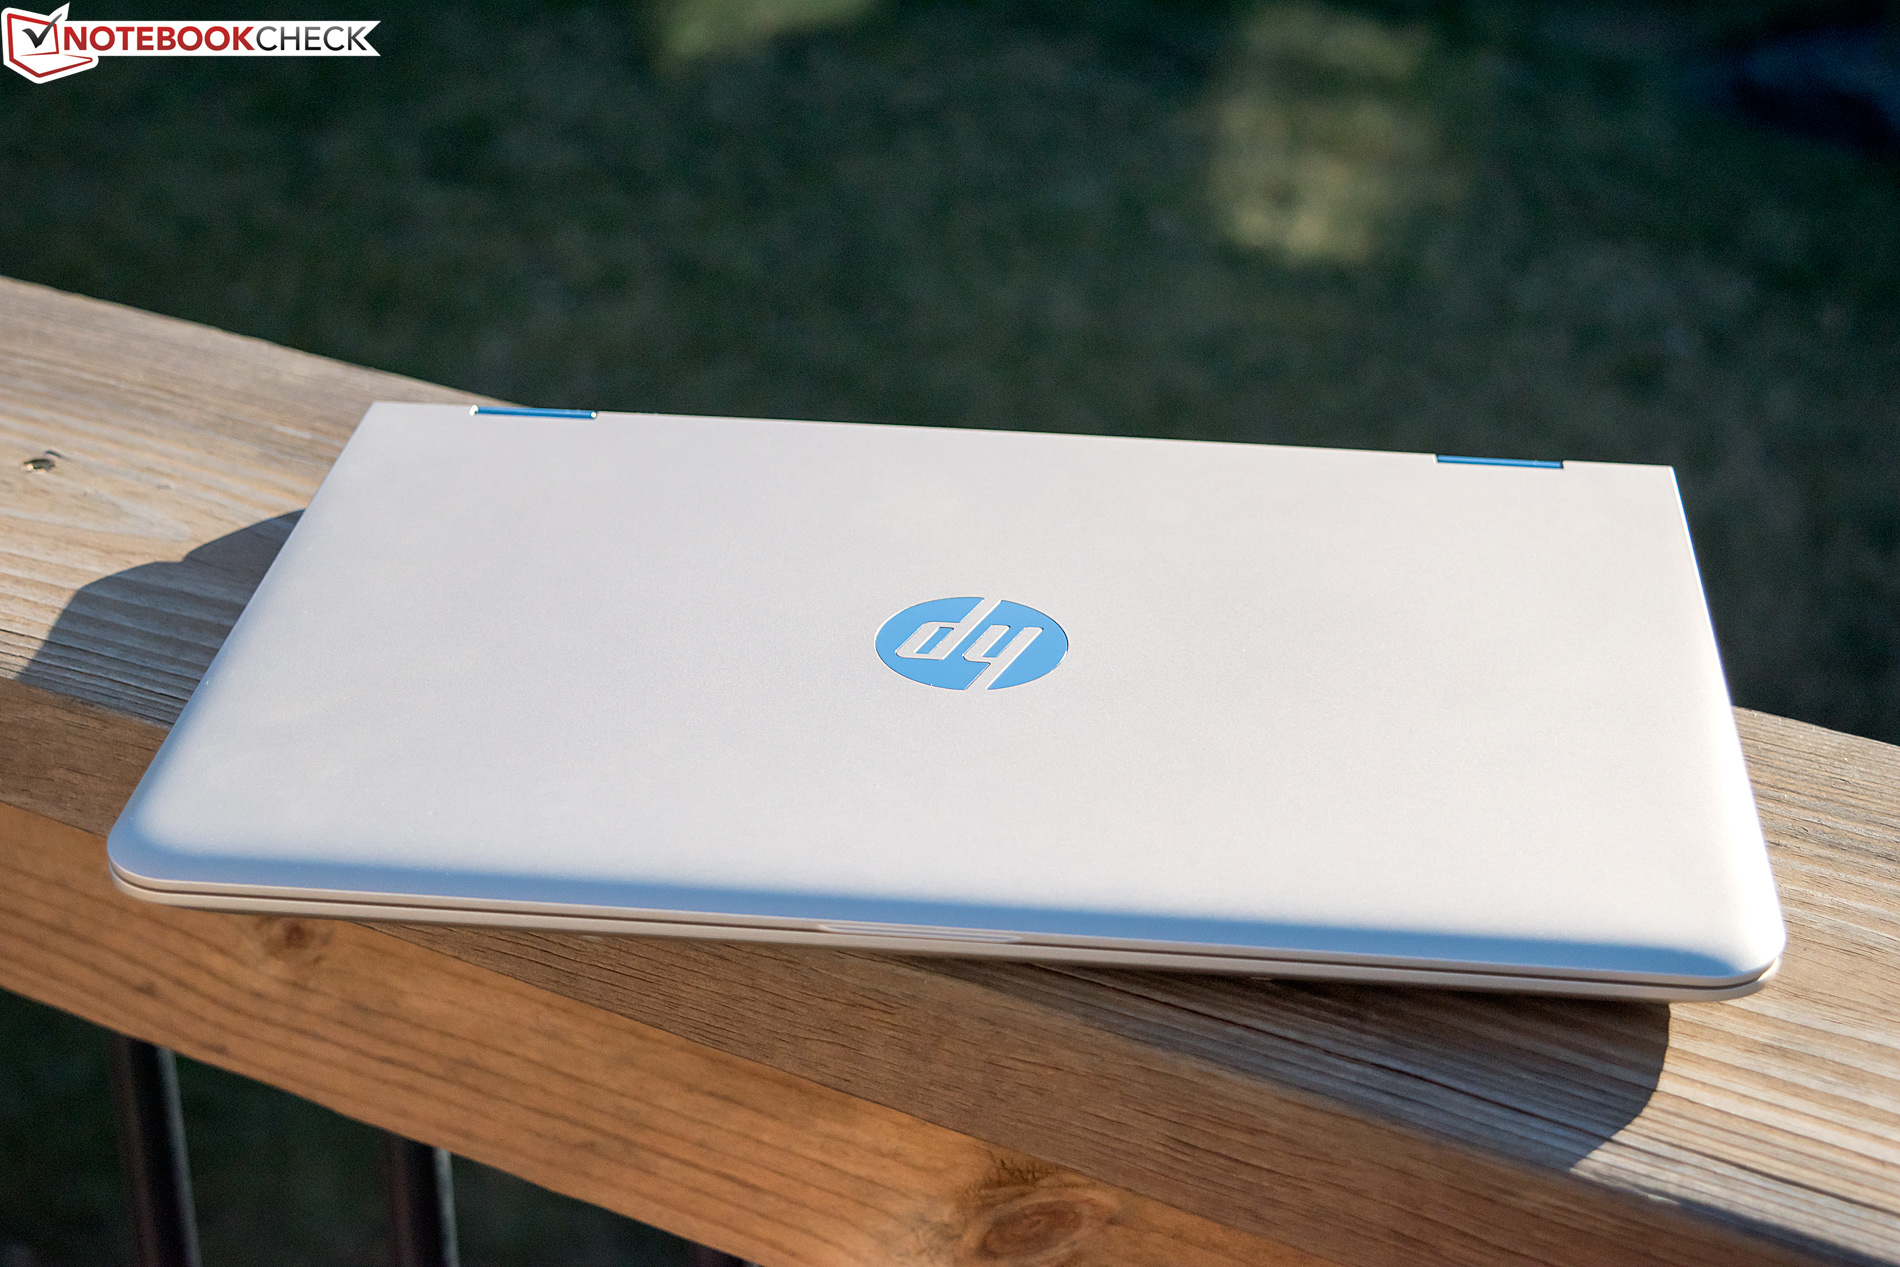
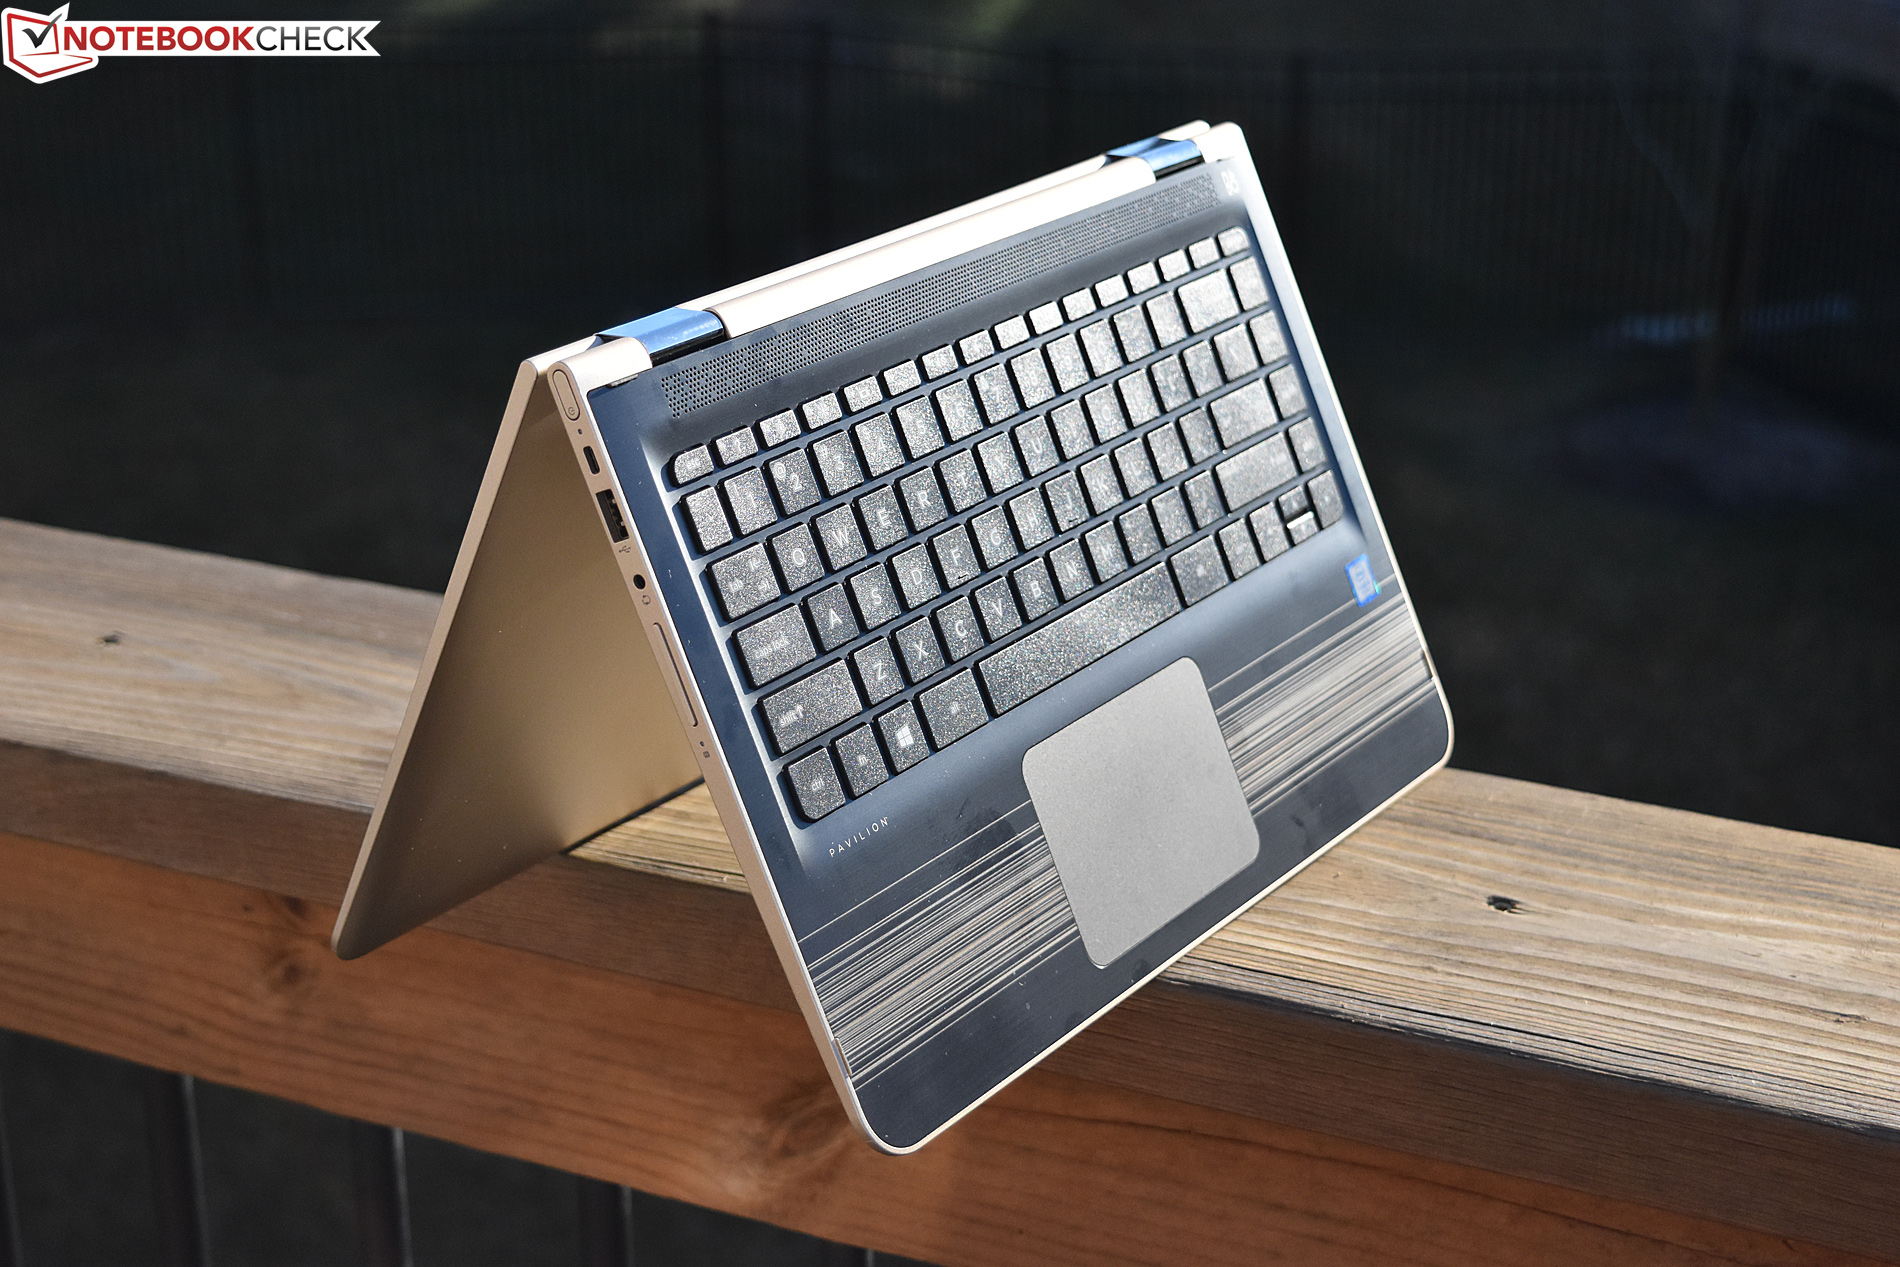

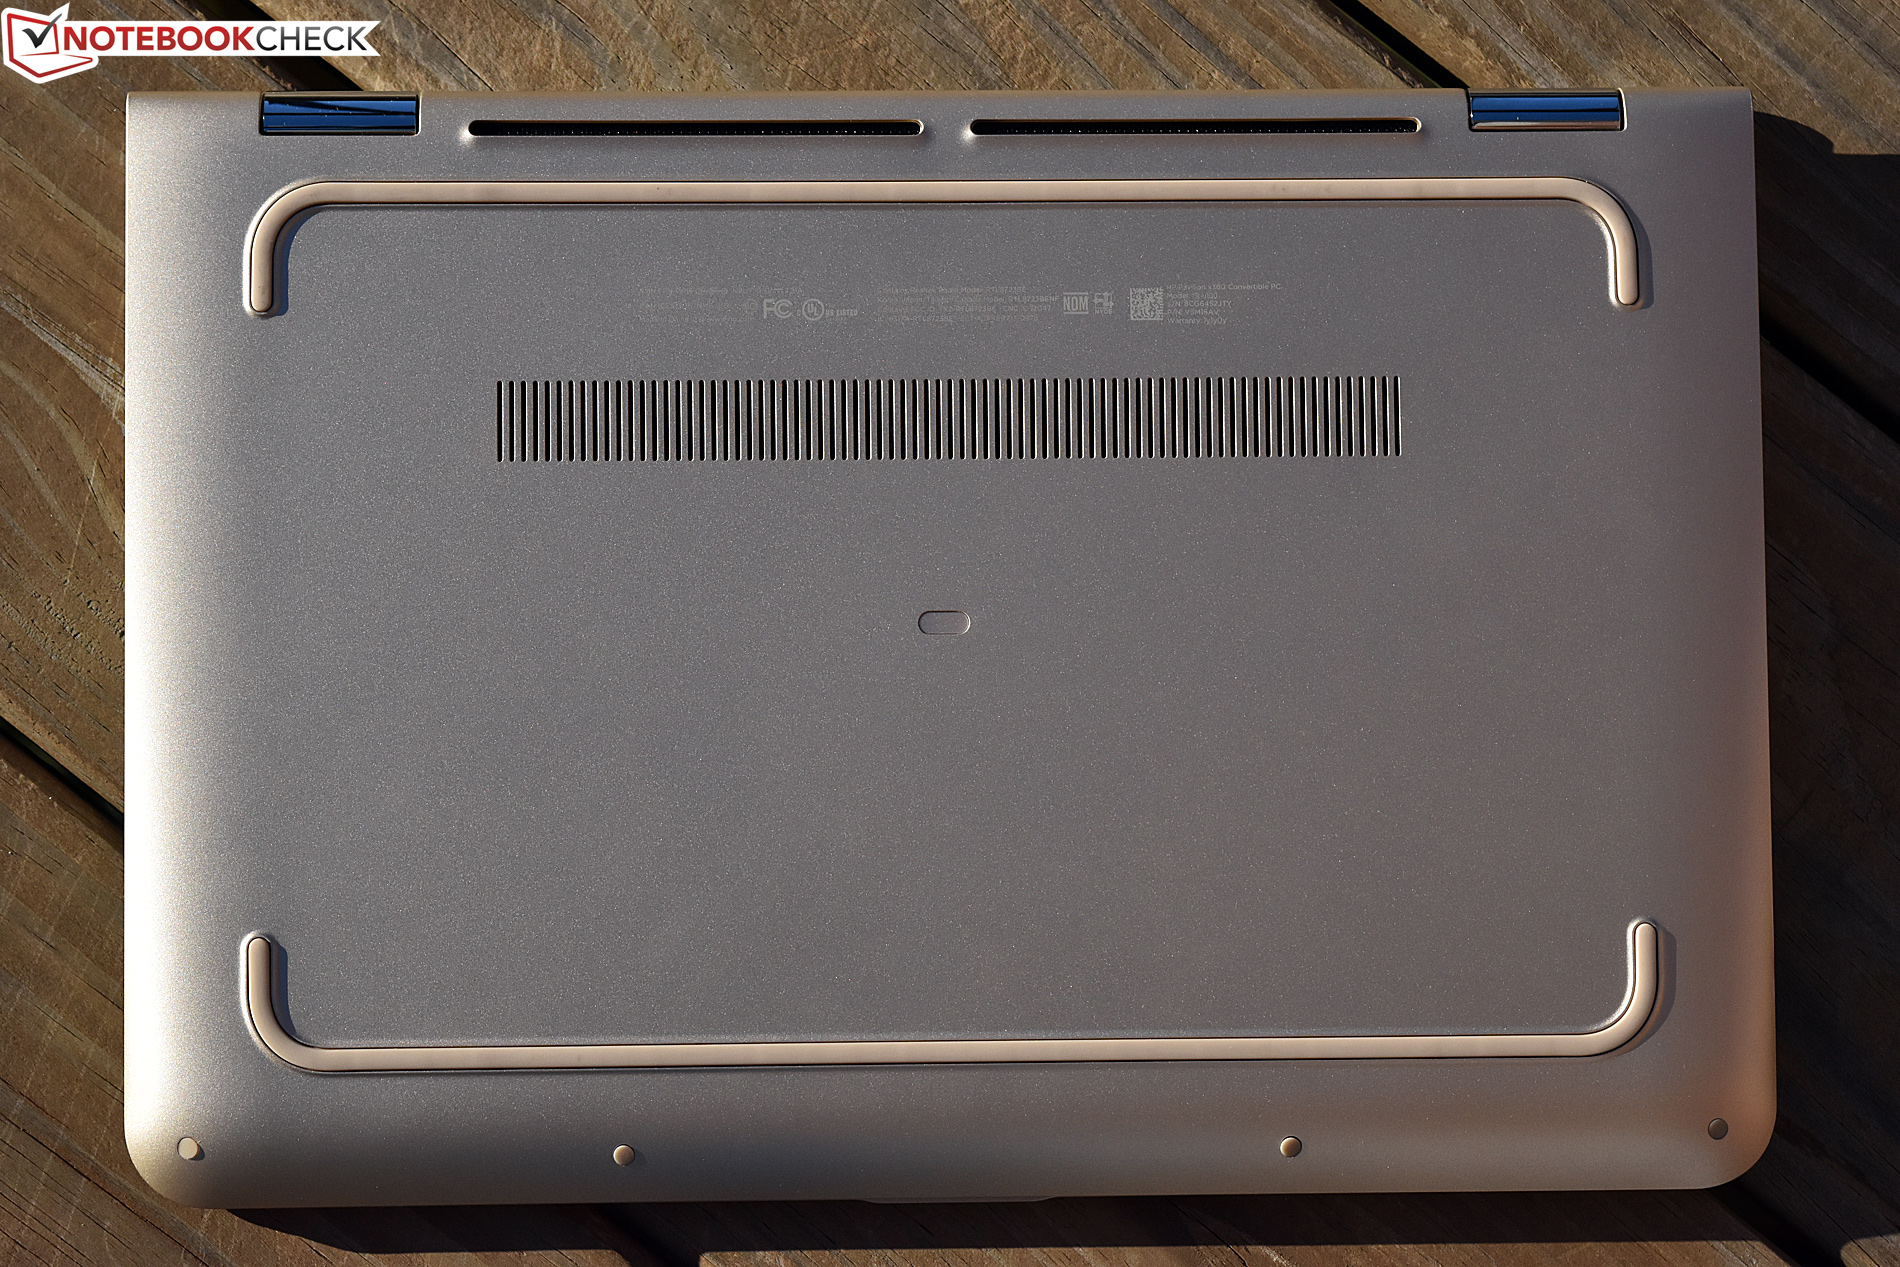
Its weight of just 1.58 kg puts it in the same category as the Dell Inspiron 13 5368 in terms of portability, noticeably heavier than the premium-grade Spectre x360 (1.3 kg) and Yoga 3 Pro 13 (1.2 kg), but less than the Asus VivoBook Flip (1.7 kg), which is weighty for a 13-inch model. It’s thus very usable as a convertible, and although still on the heavy side for a tablet, far more practical in such use than its 15.6-inch Envy x360 sibling. It’s also worth mentioning that—partially thanks to the smaller screen—the 13t’s hinges also have an easier time of stabilizing the screen than did the 15t’s. There’s still a bit of bounce when tapping, but it’s nothing nearly as pronounced as it was with the latter.
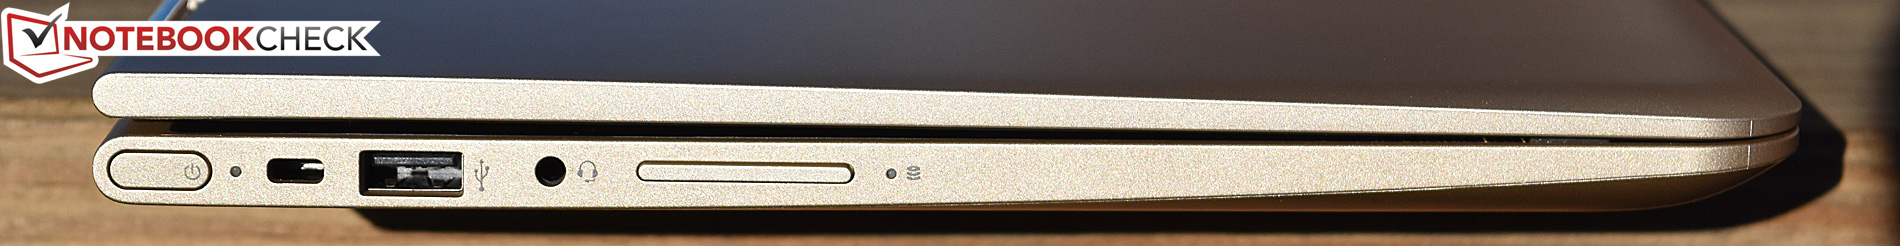
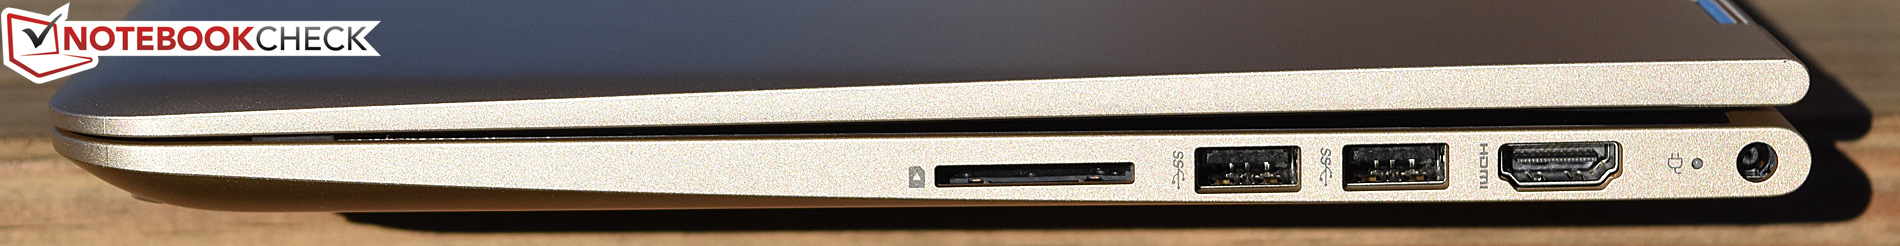
Connectivity
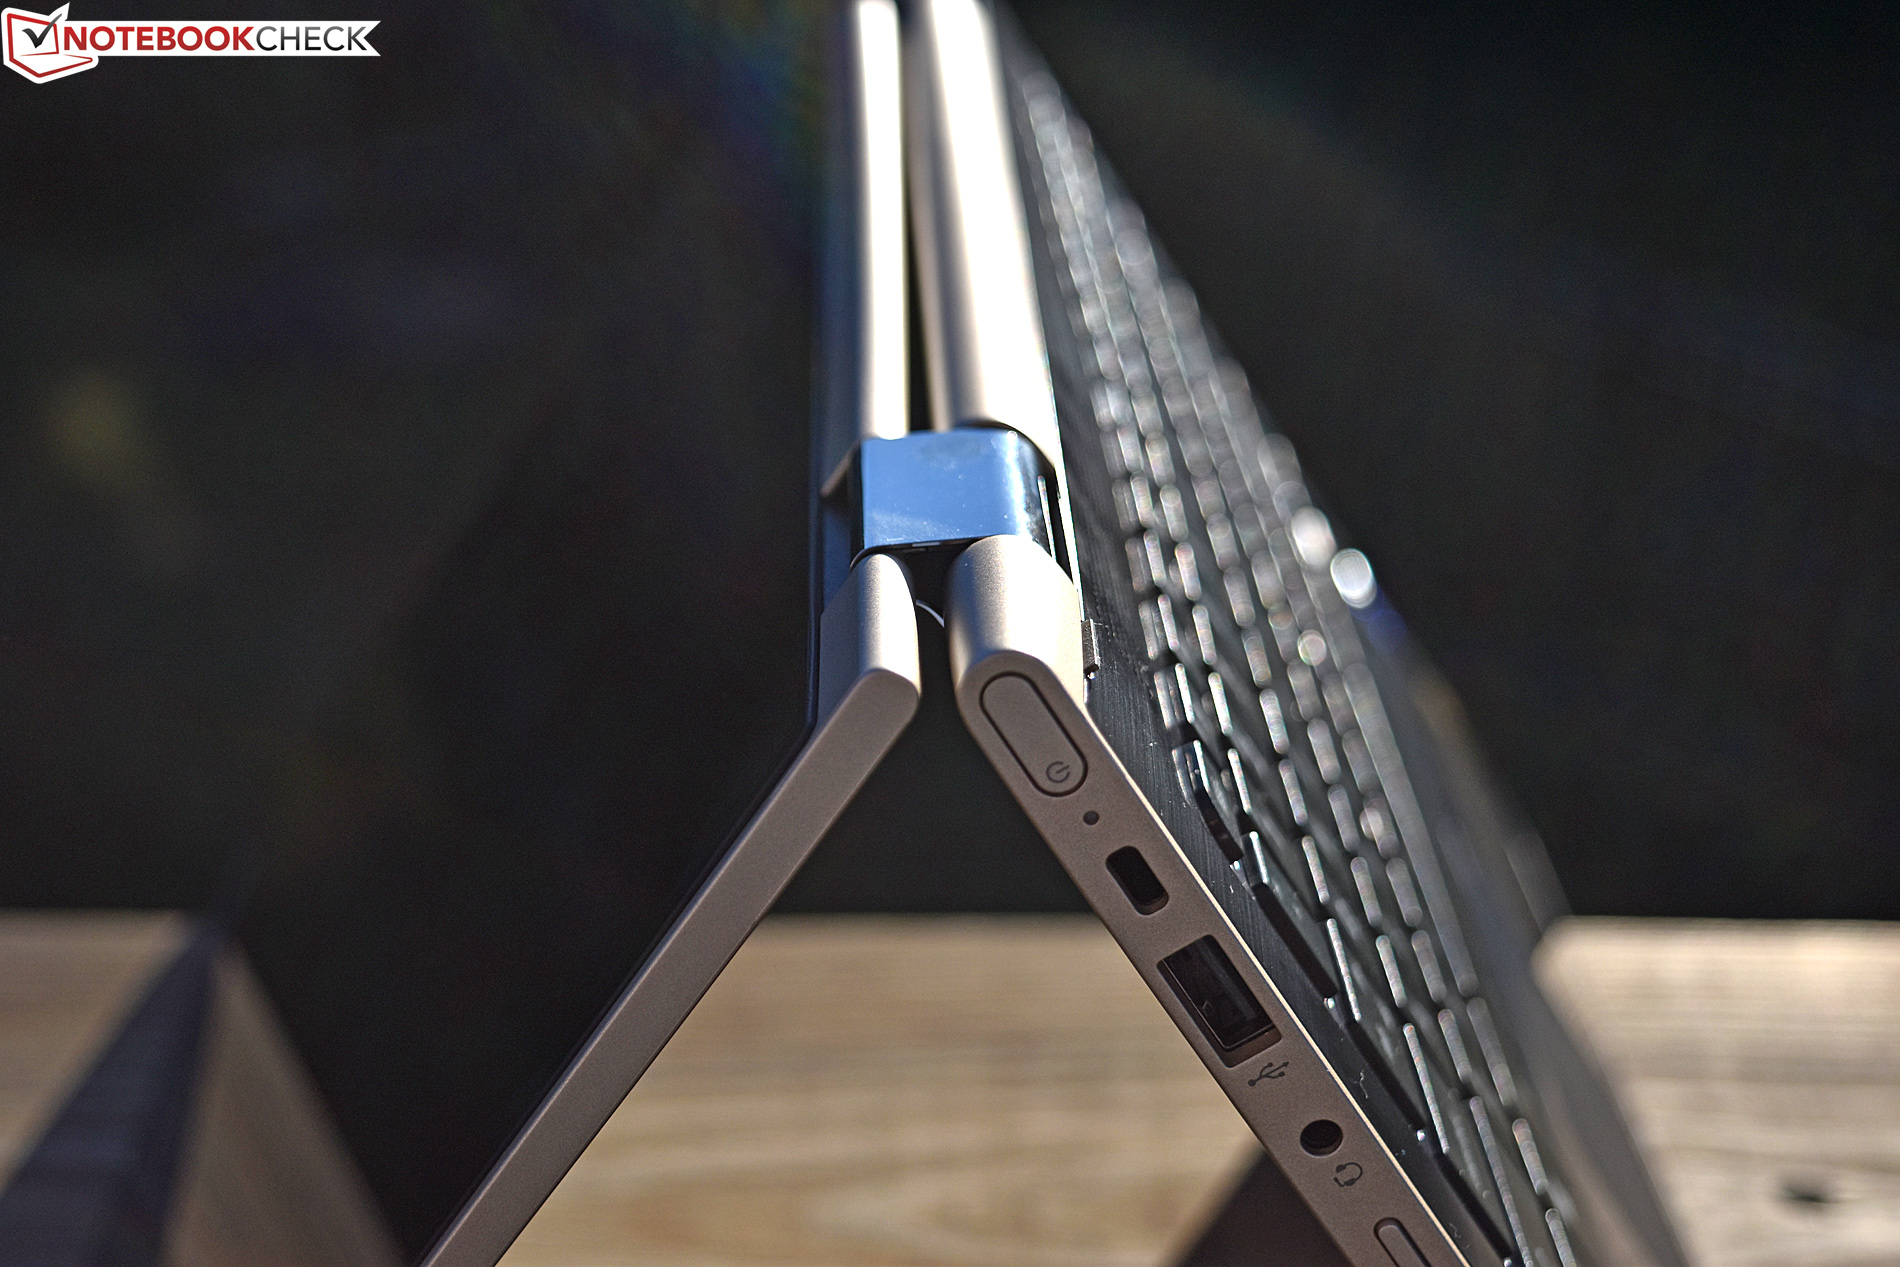
The Pavilion x360 manages a standard array of ports for its class. There are three total USB ports, two of which are USB 3.0 speed, along with HDMI for video output. Ethernet does not make the cut, and although most users in the target segment are not likely to mind, there is one other omission that would render it valuable—which we’ll cover in the next section.
| SD Card Reader | |
| average JPG Copy Test (av. of 3 runs) | |
| Lenovo Yoga 3 Pro 13 80HE004LGE | |
| HP Pavilion x360 13t-u100 | |
| Dell Inspiron 13 5368 | |
| maximum AS SSD Seq Read Test (1GB) | |
| HP Pavilion x360 13t-u100 | |
| Lenovo Yoga 3 Pro 13 80HE004LGE | |
| Dell Inspiron 13 5368 | |
Communication
What precisely is it we’re referring to above? The lack of Wireless-AC connectivity—and, in fact, even dual-band N connectivity. The x360 is limited to N speeds, and 150 Mbps ones at that. That’s incredibly slow by today’s standards, especially when internet speeds even now frequently exceed 200 or 300 Mbps. Unfortunately, there is no way to upgrade this component without removing the system board, which requires a near-complete teardown. Instead, the only rational solution is to resort to an external USB WLAN adapter with better capabilities. With an Ethernet port on board, perhaps this omission wouldn’t be quite so painful, but the x360 doesn’t provide one of those, either.
| Networking | |
| iperf Server (receive) TCP 1 m 512KB | |
| HP Spectre x360 13-w023dx | |
| Dell Inspiron 13 5368 | |
| HP Pavilion x360 13t-u100 | |
| iperf Client (transmit) TCP 1 m 512KB | |
| HP Spectre x360 13-w023dx | |
| Dell Inspiron 13 5368 | |
| HP Pavilion x360 13t-u100 | |
Accessories
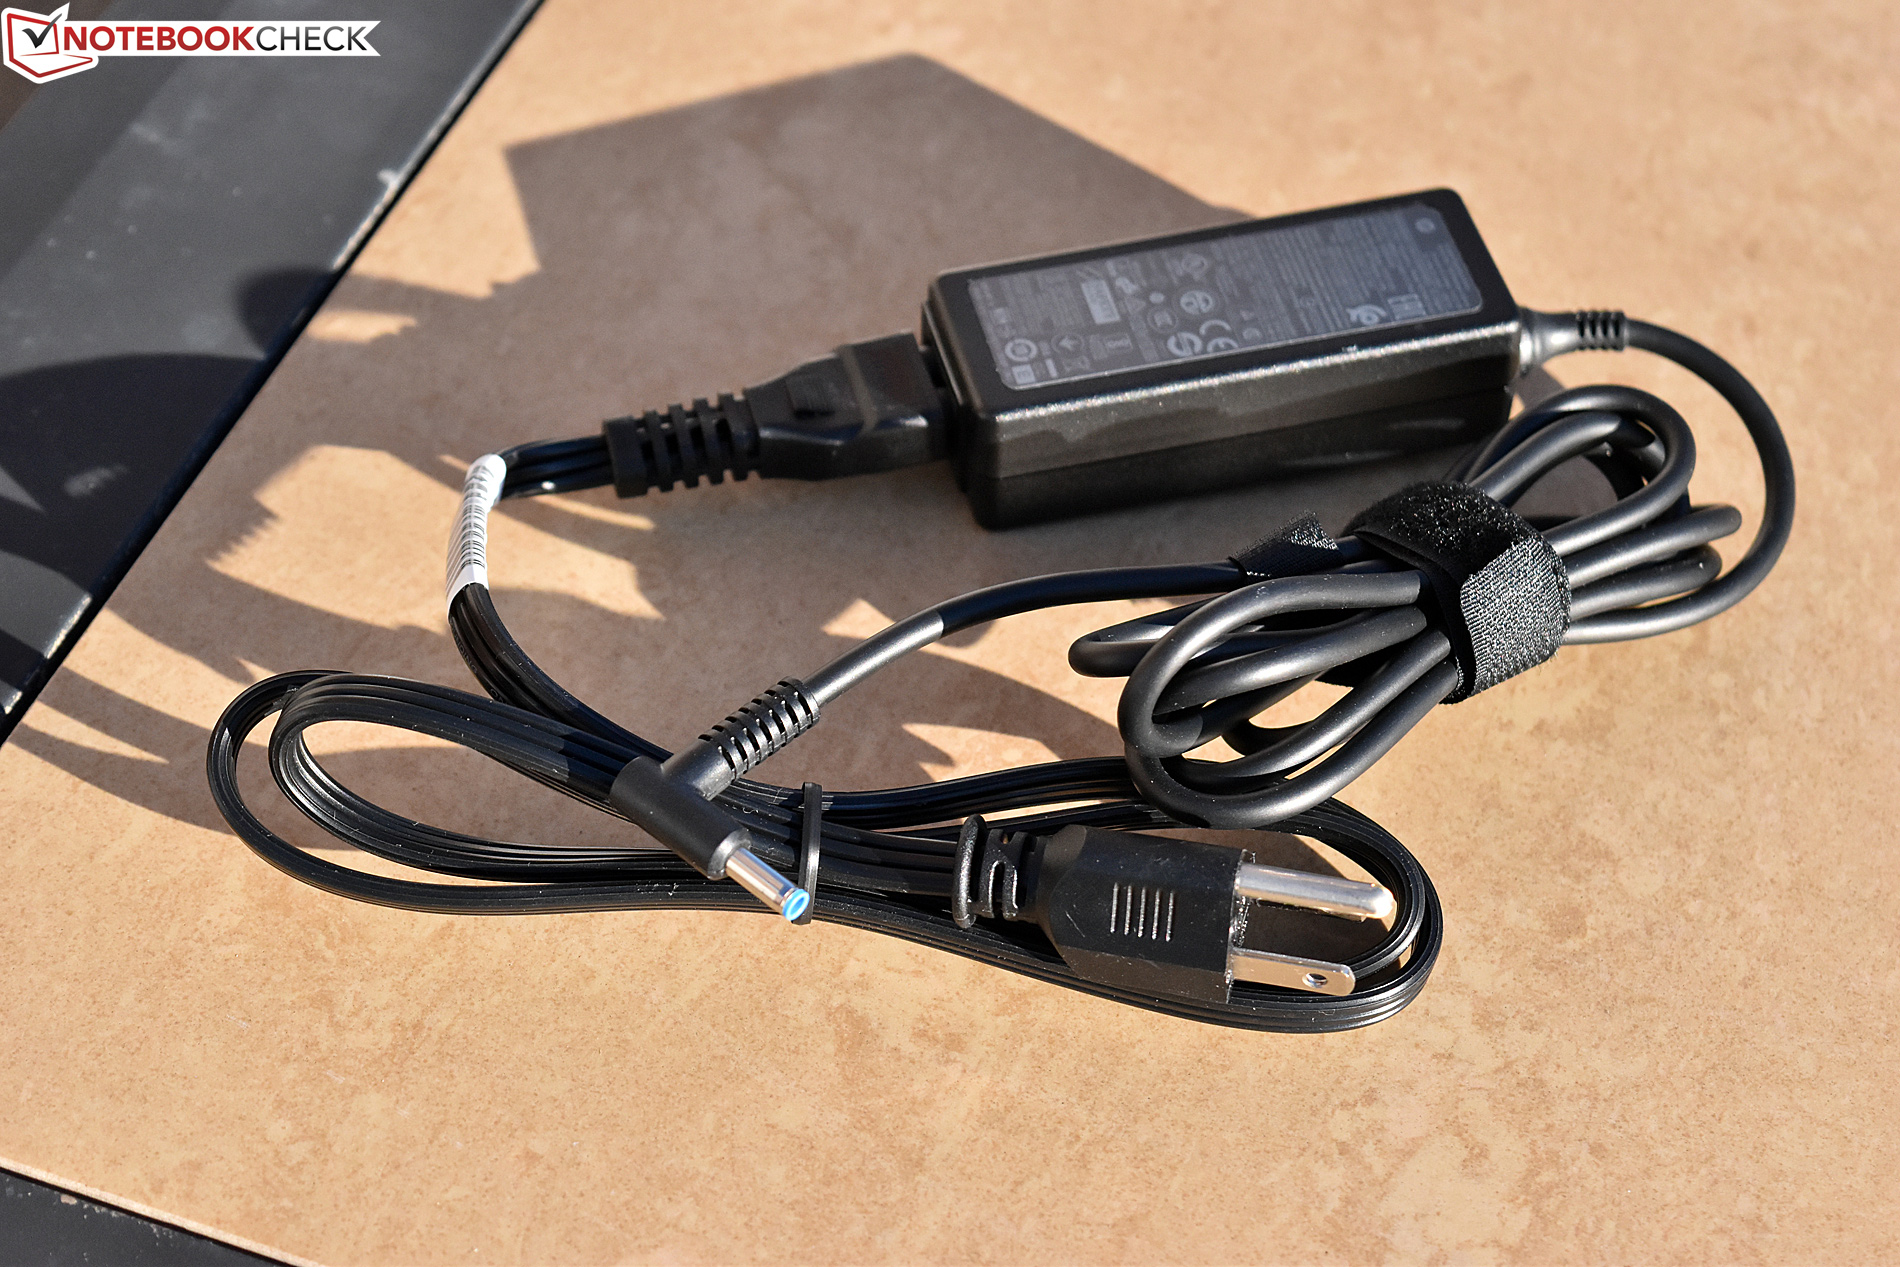
The power adapter packaged with the x360 13t is a standard 45 W HP Ultrabook AC Adapter. Weighing around 316 g, it isn’t the smallest one around, but it’s still relatively lightweight, and it provides plenty of cord length.
Maintenance
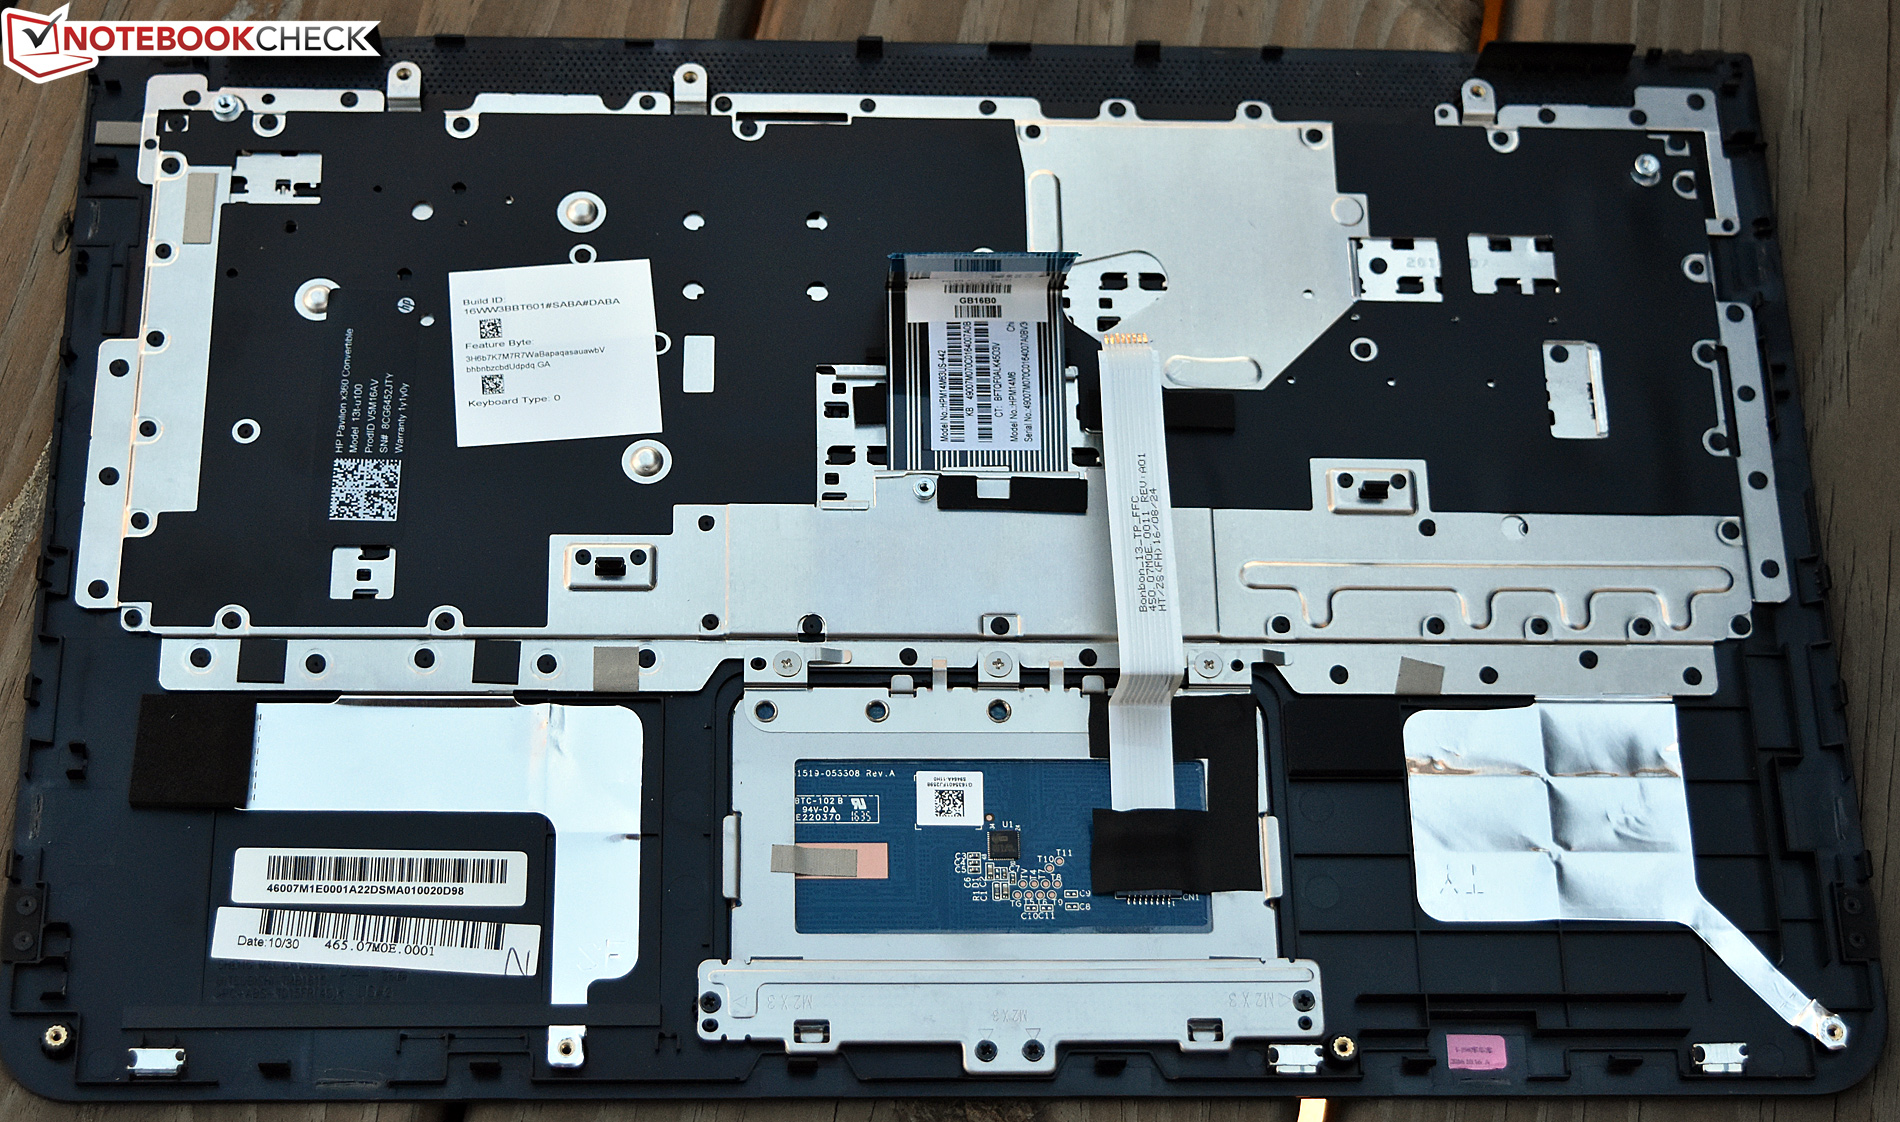
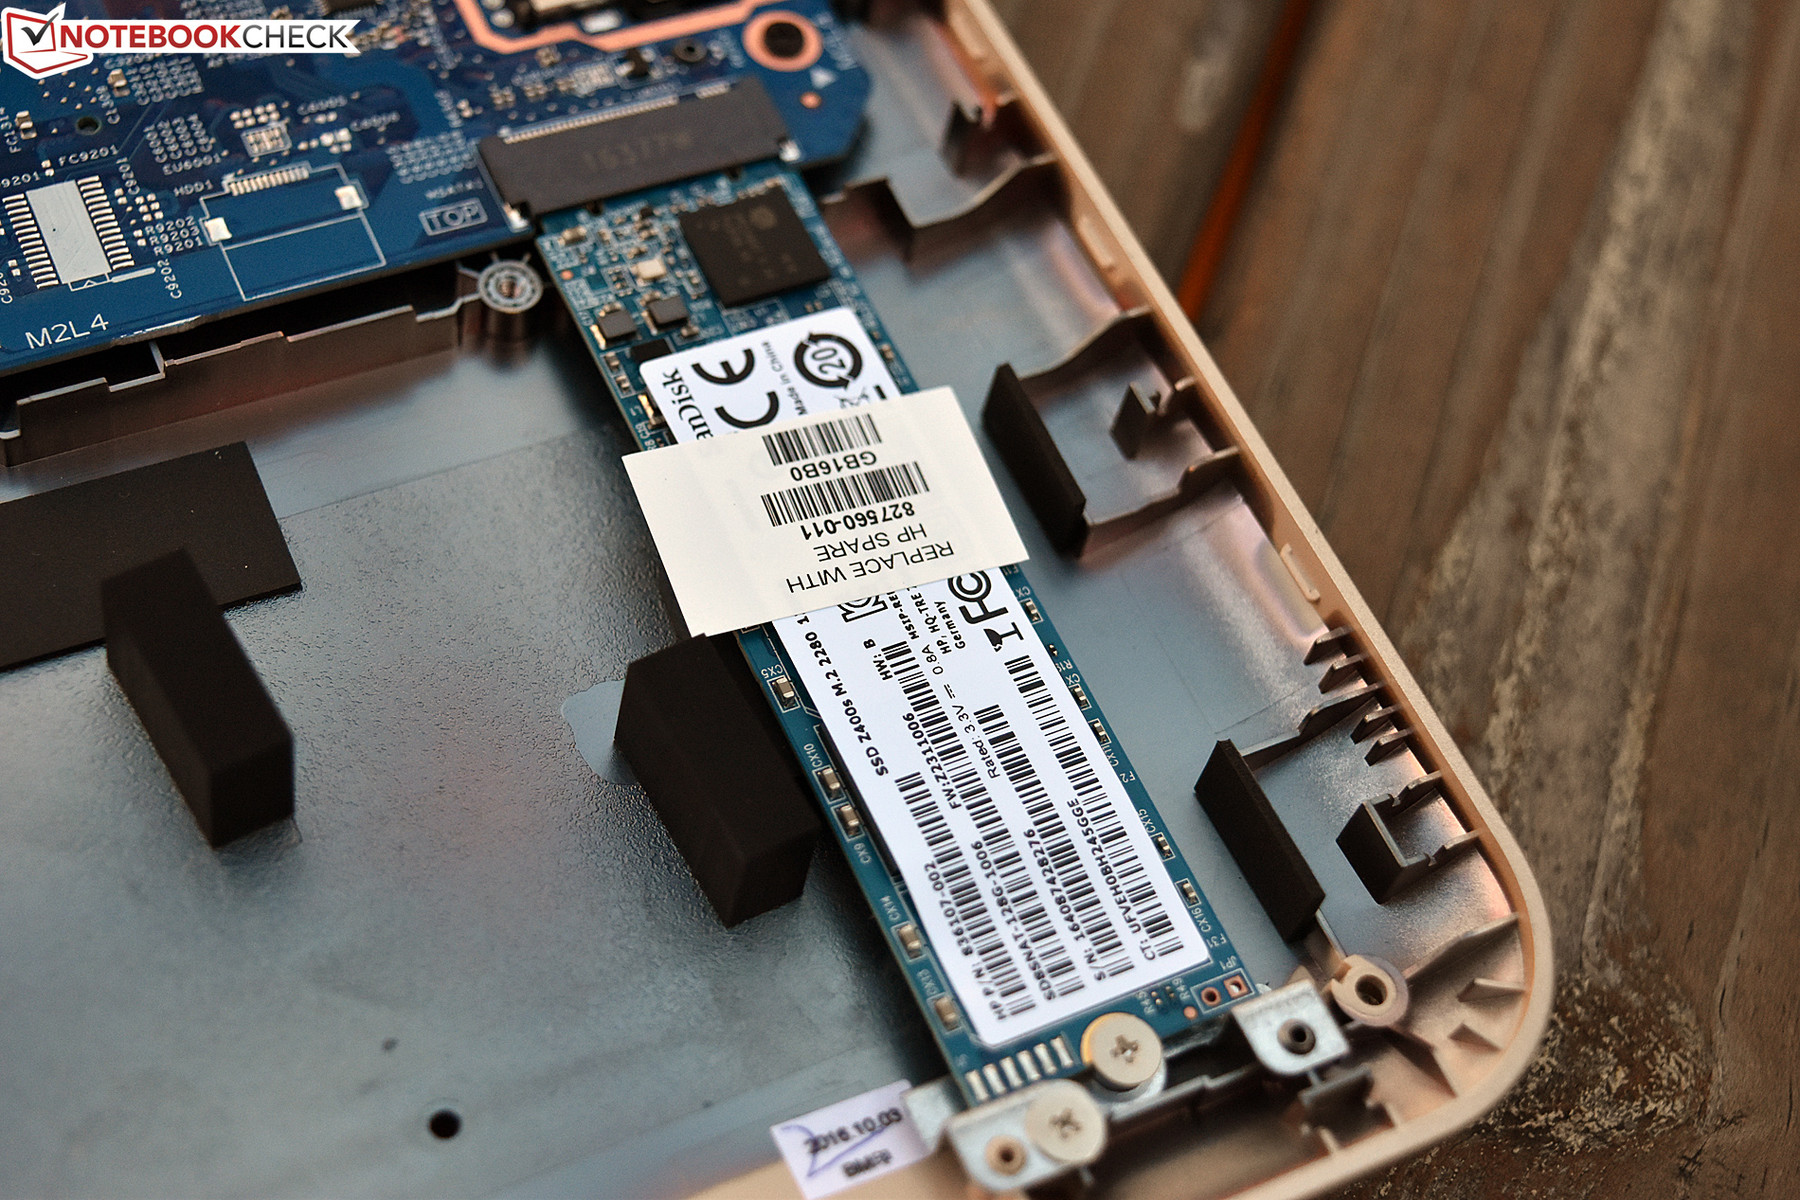
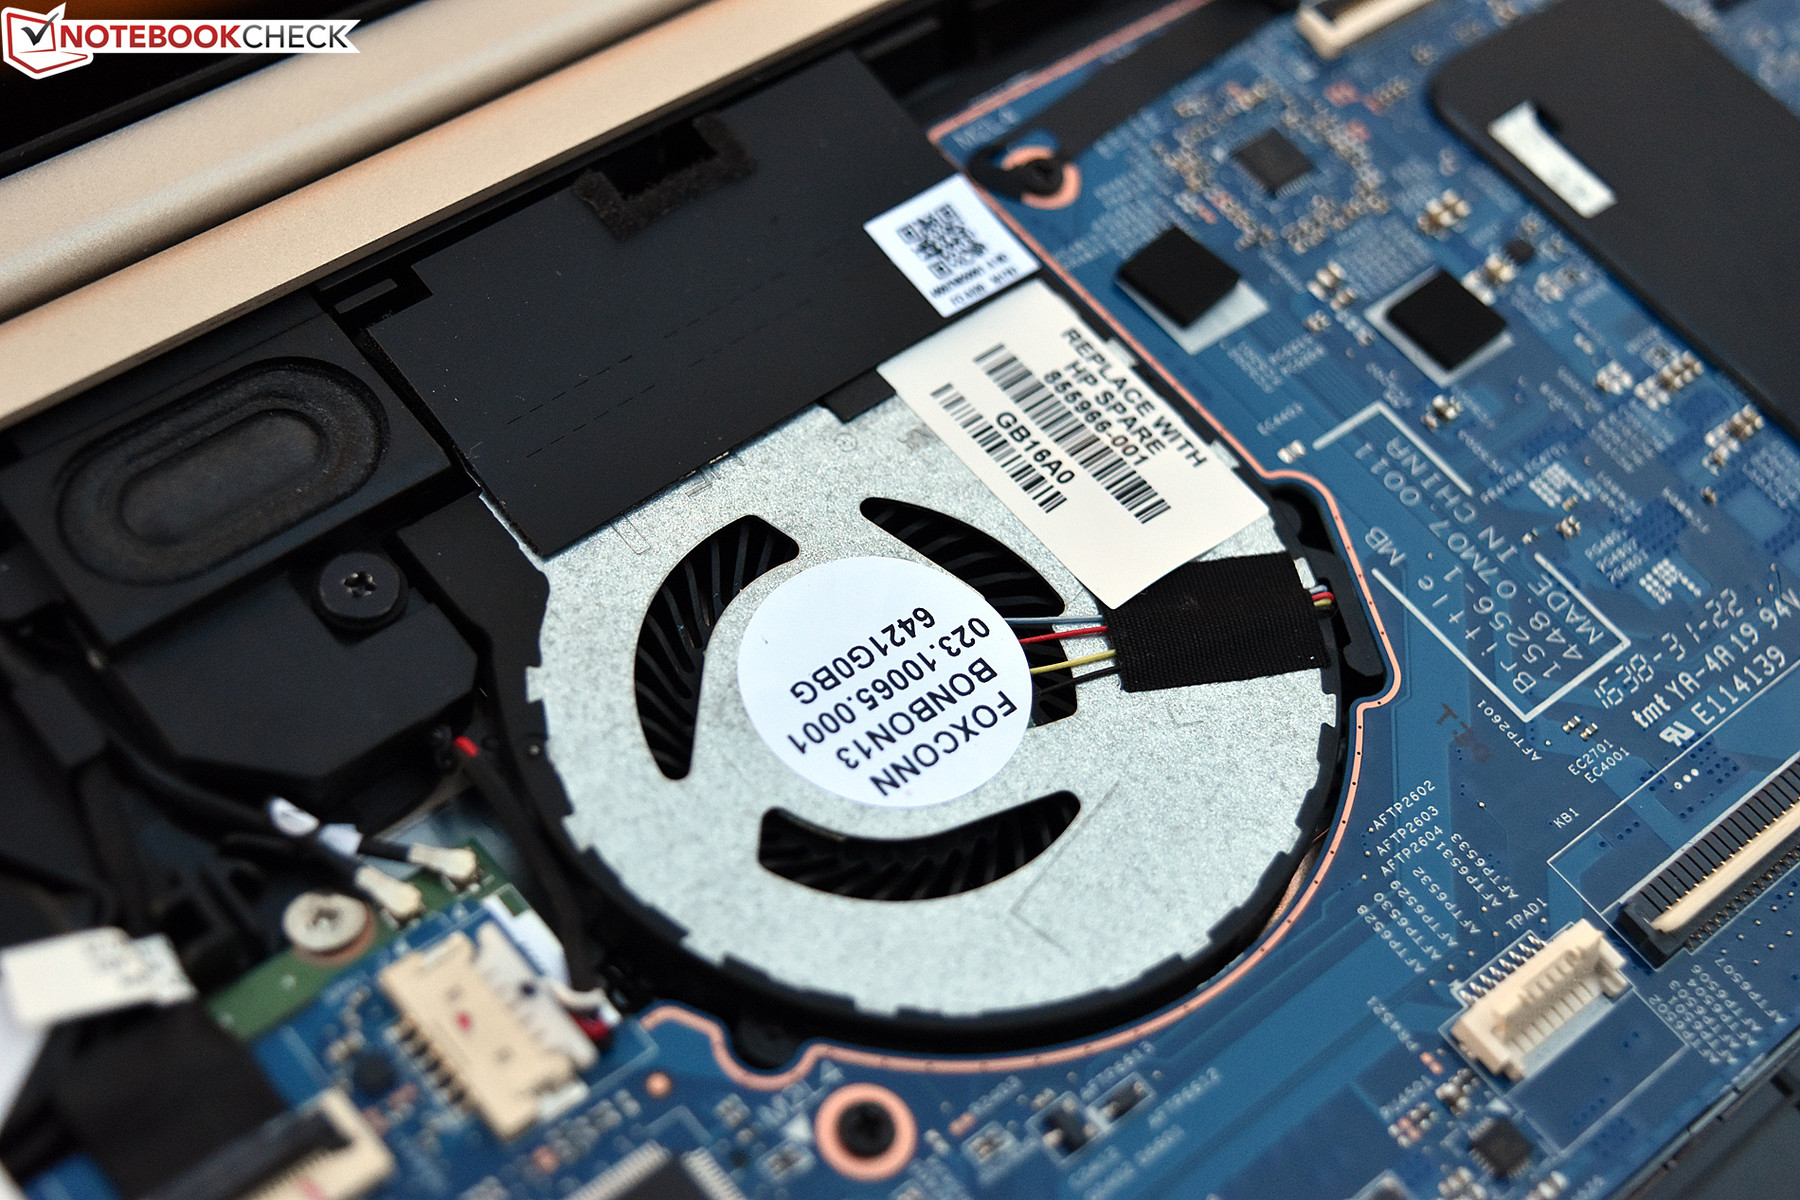
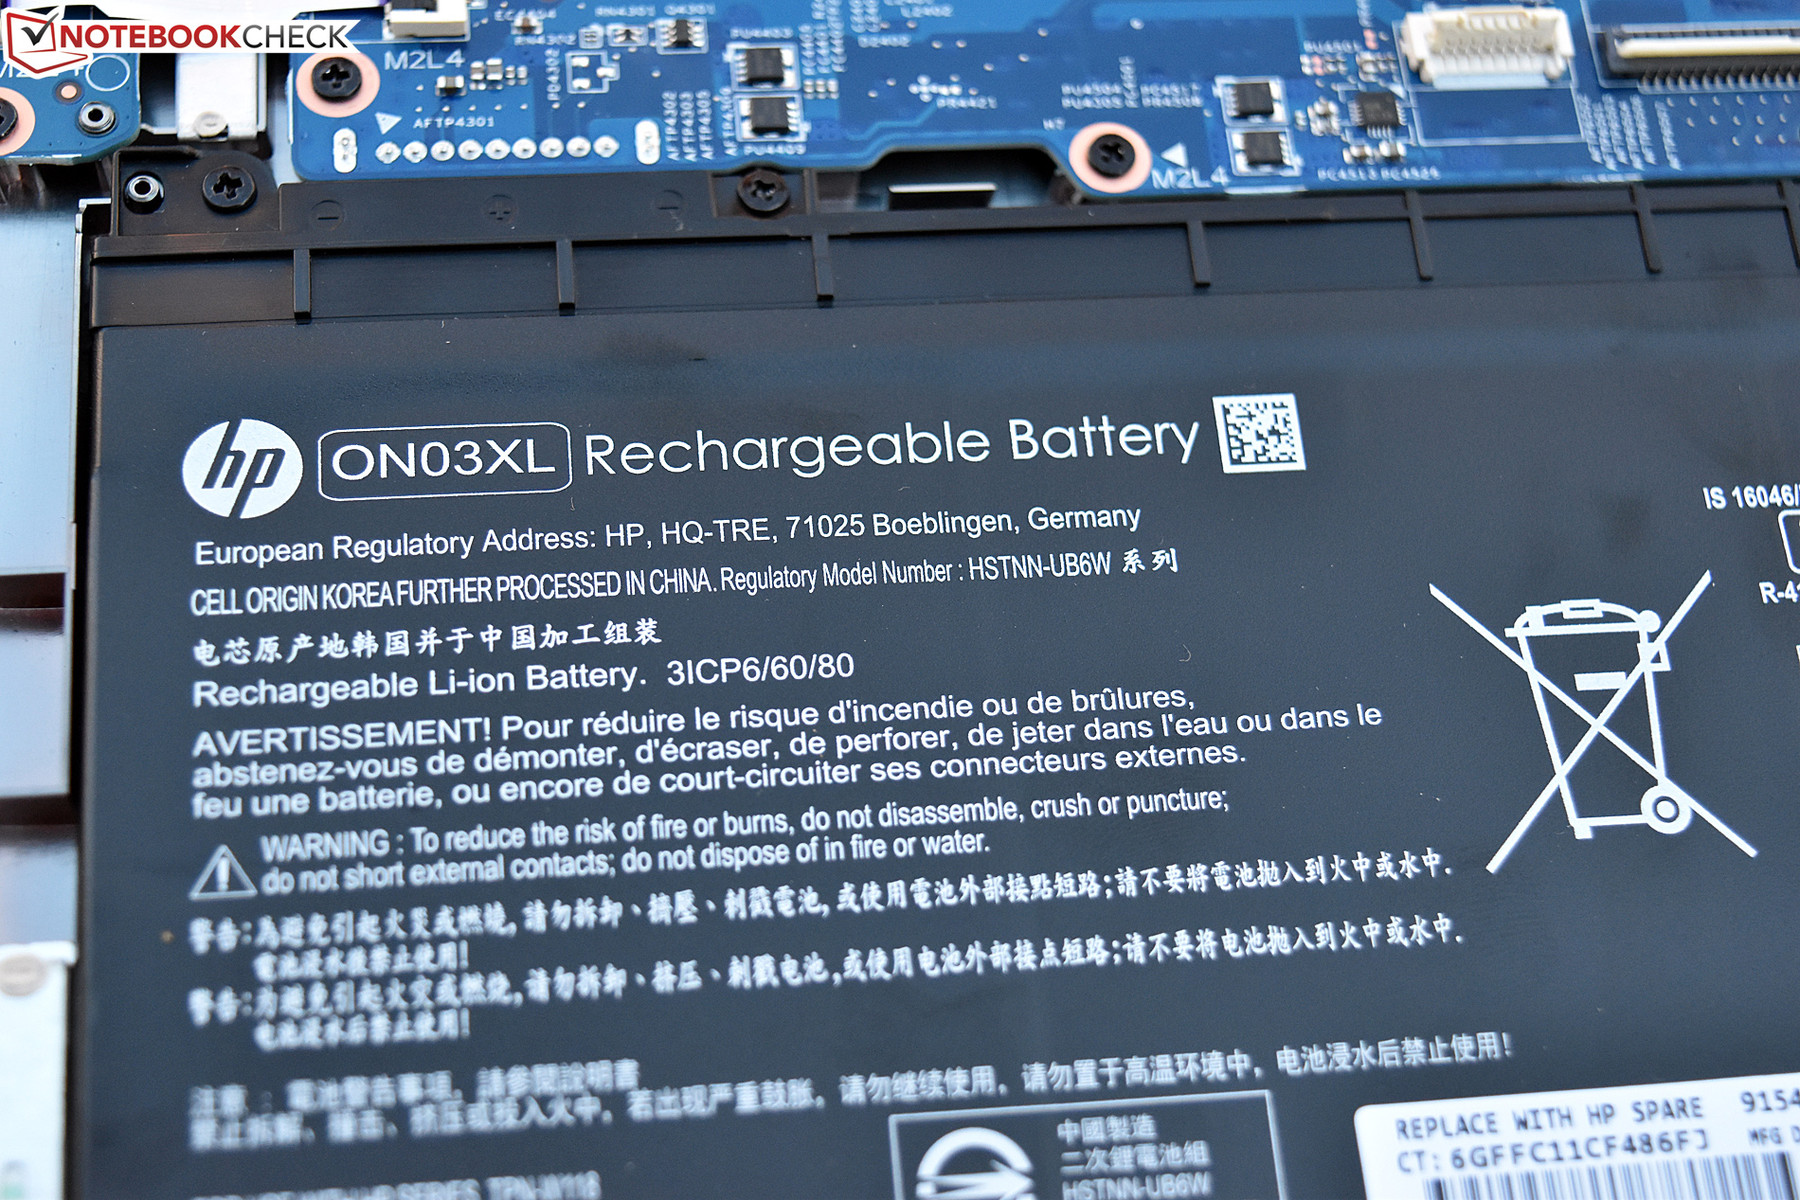
The disassembly procedure for the x360 13t is unnecessary complex, much like that of the larger Envy x360 15t. First, the user must remove both long rubber feet from the bottom of the machine—along with a single cosmetic sticker in the center—after which ten total screws can be removed from the bottom of the unit. Next, the unit is flipped over and opened up, and the palm rest assembly (the top cover) is completely removed by carefully prying upward on the lip near either of the hinge covers. Two flat cables with ZIF connectors bridge the top cover to the system board below, so these must be carefully disconnected in the process before the cover can be completely set aside. Once inside, only a couple of components are replaceable, including the M.2 SSD and the battery. Anything else would require removal of the system board, and the RAM cannot be upgraded at all.
Warranty
The Pavilion x360 includes a 1-year depot warranty.
Input Devices
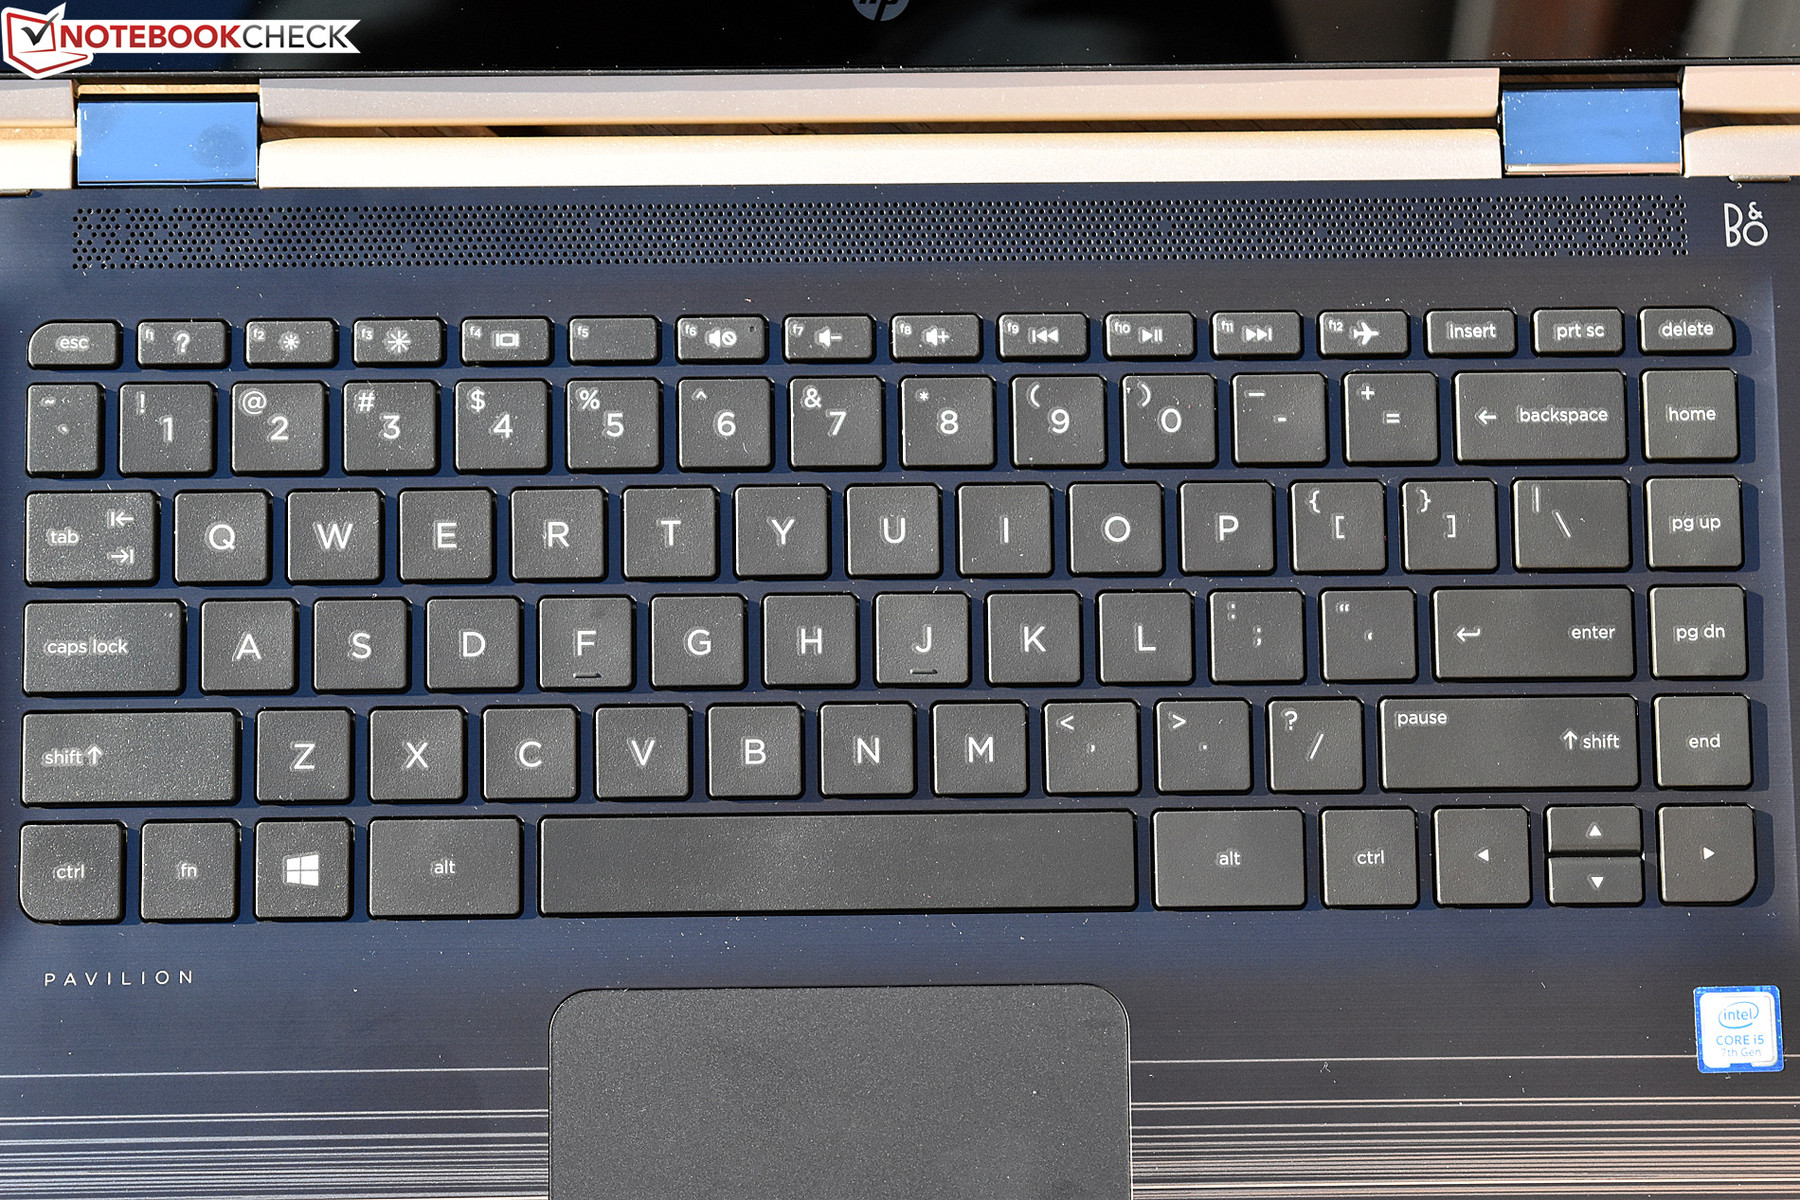
Keyboard
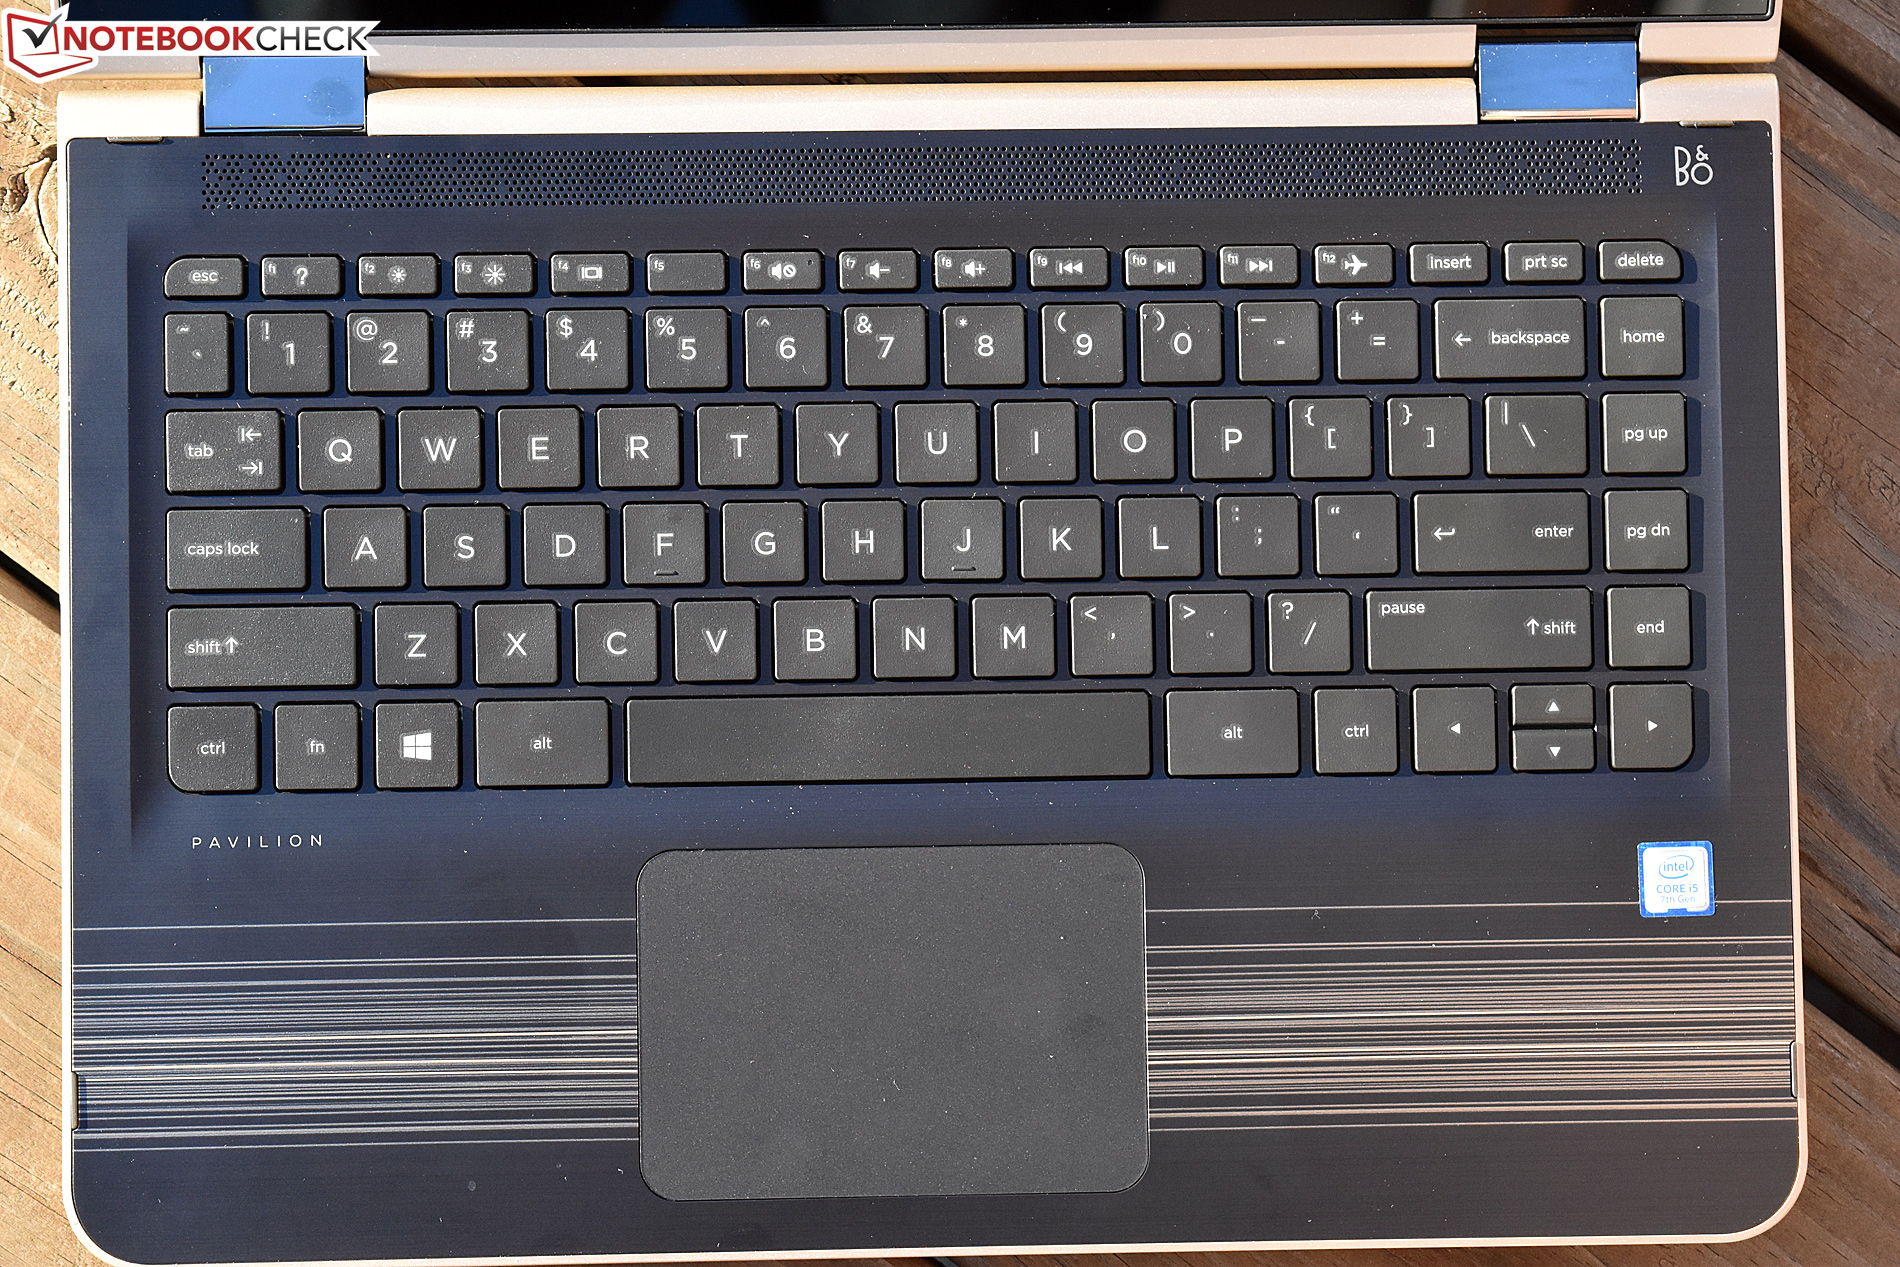
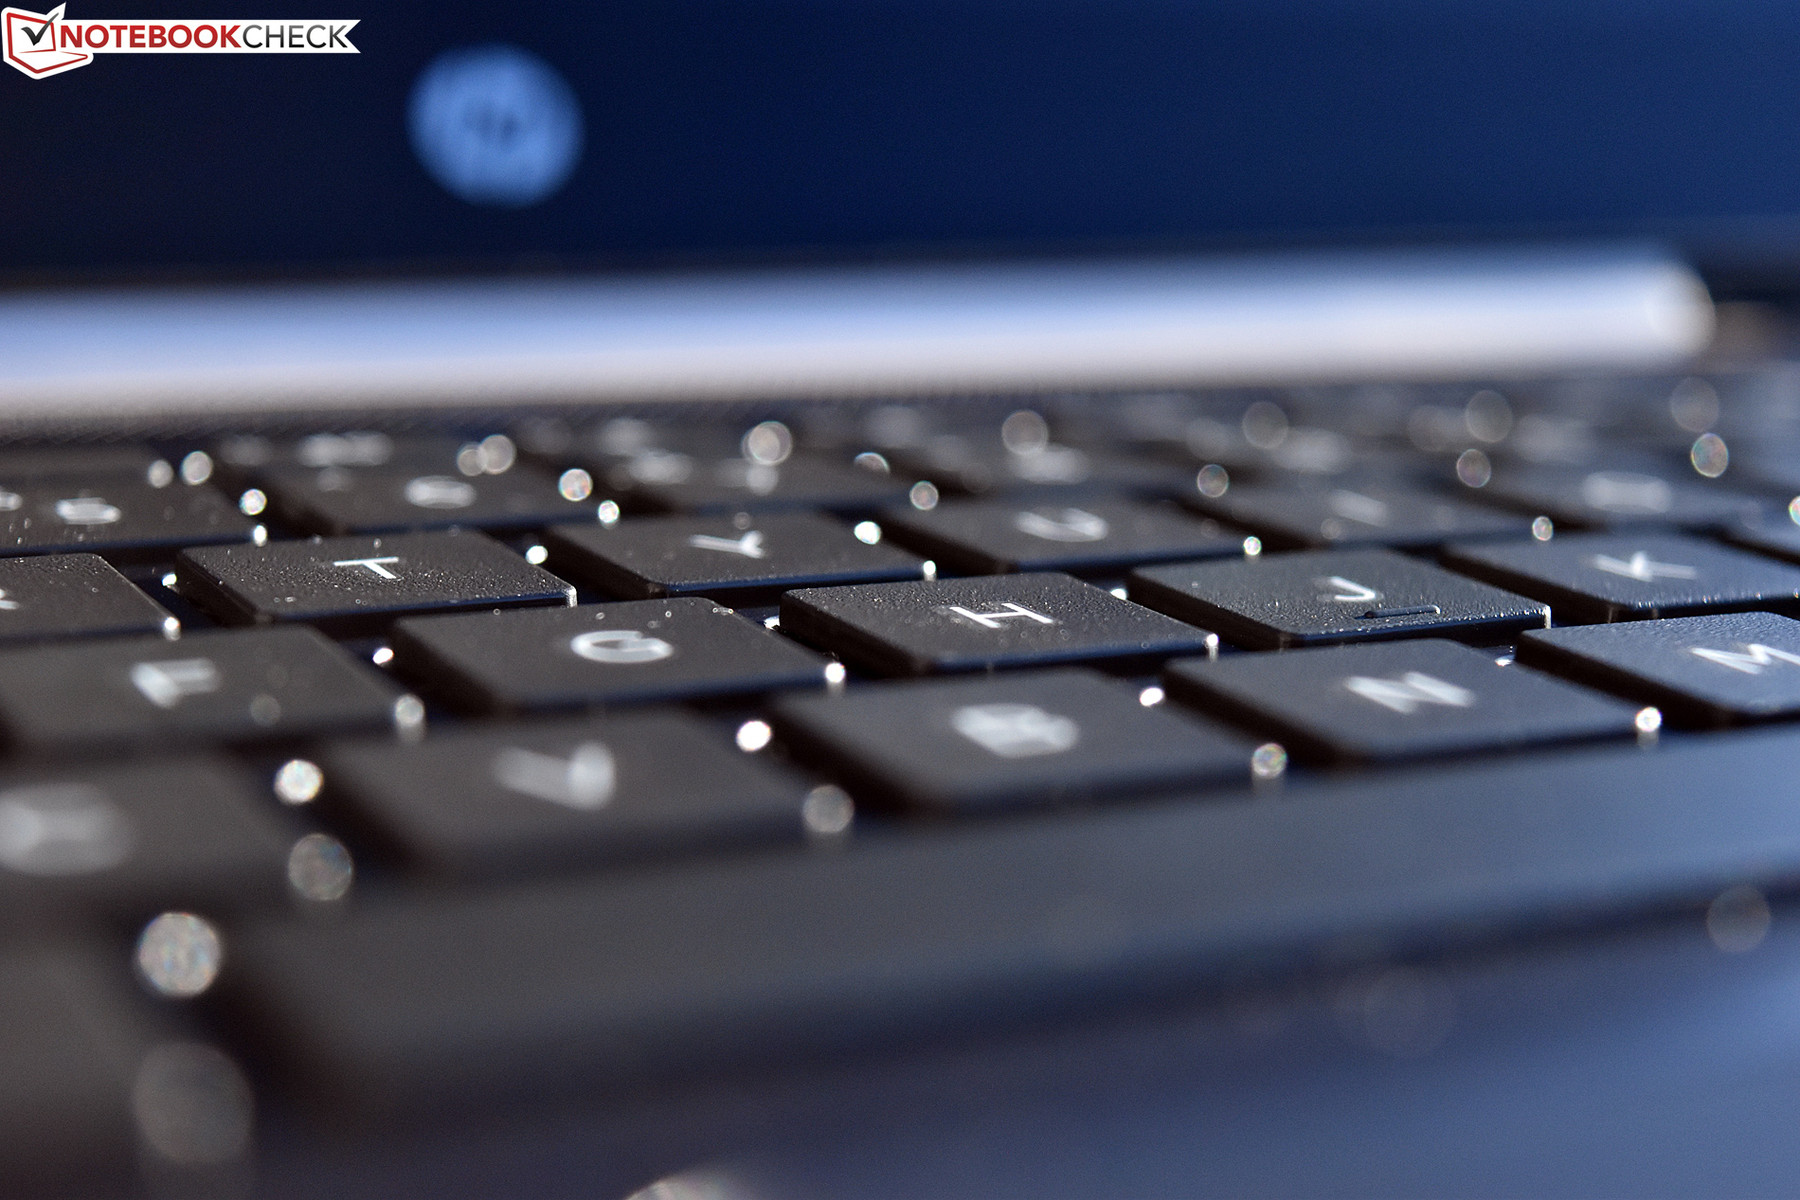
Although the key surfaces are comprised of a cheap plastic (in contrast to the higher-quality materials found in nicer Ultrabooks), the Pavilion x360 still manages to provide a mostly comfortable typing experience. The keys are tightly affixed and feature no wiggle or rattle when touched. Key travel distance is short and actuation force is relatively light, but feedback is crisp, so following some adjustment the keyboard should be adequate for longer typing sessions.
The key layout is familiar and acceptable. We regret the absence of a backlight, but it’s a relatively minor omission.
Touchpad
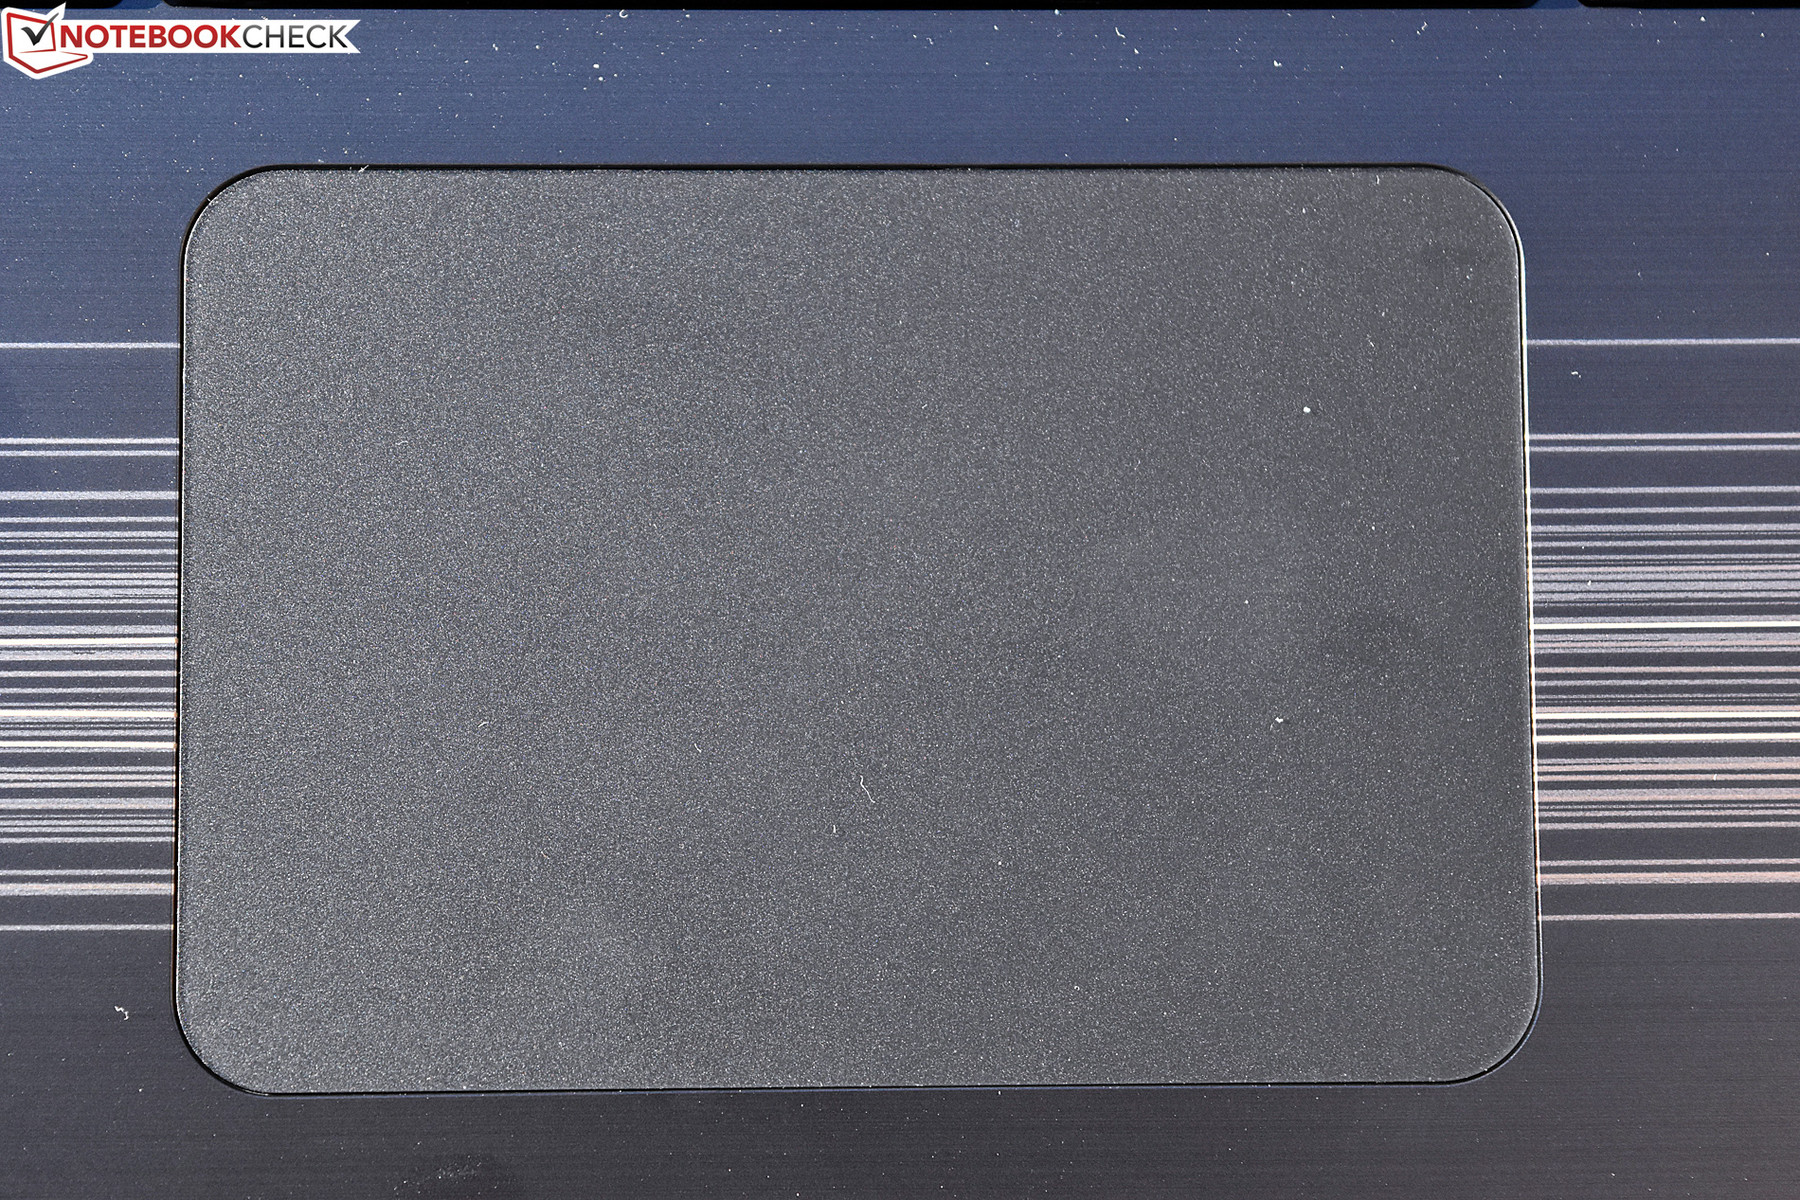
Although the ELAN Clickpad is spacious considering the smaller screen size and resolution, the pointer response time is noticeably slower than usual, and the integrated buttons are troublesome (as they so often are). Probably thanks to the aforementioned lag, we at least had no issues with collateral pointer movement while clicking—but dragging and dropping irritated us on multiple occasions, and feedback from the buttons is on the mushier side. Gestures, meanwhile, were interpreted without fail. The touchpad surface is plastic, but it’s finished with a soft-touch surface which makes gliding across it effortless.
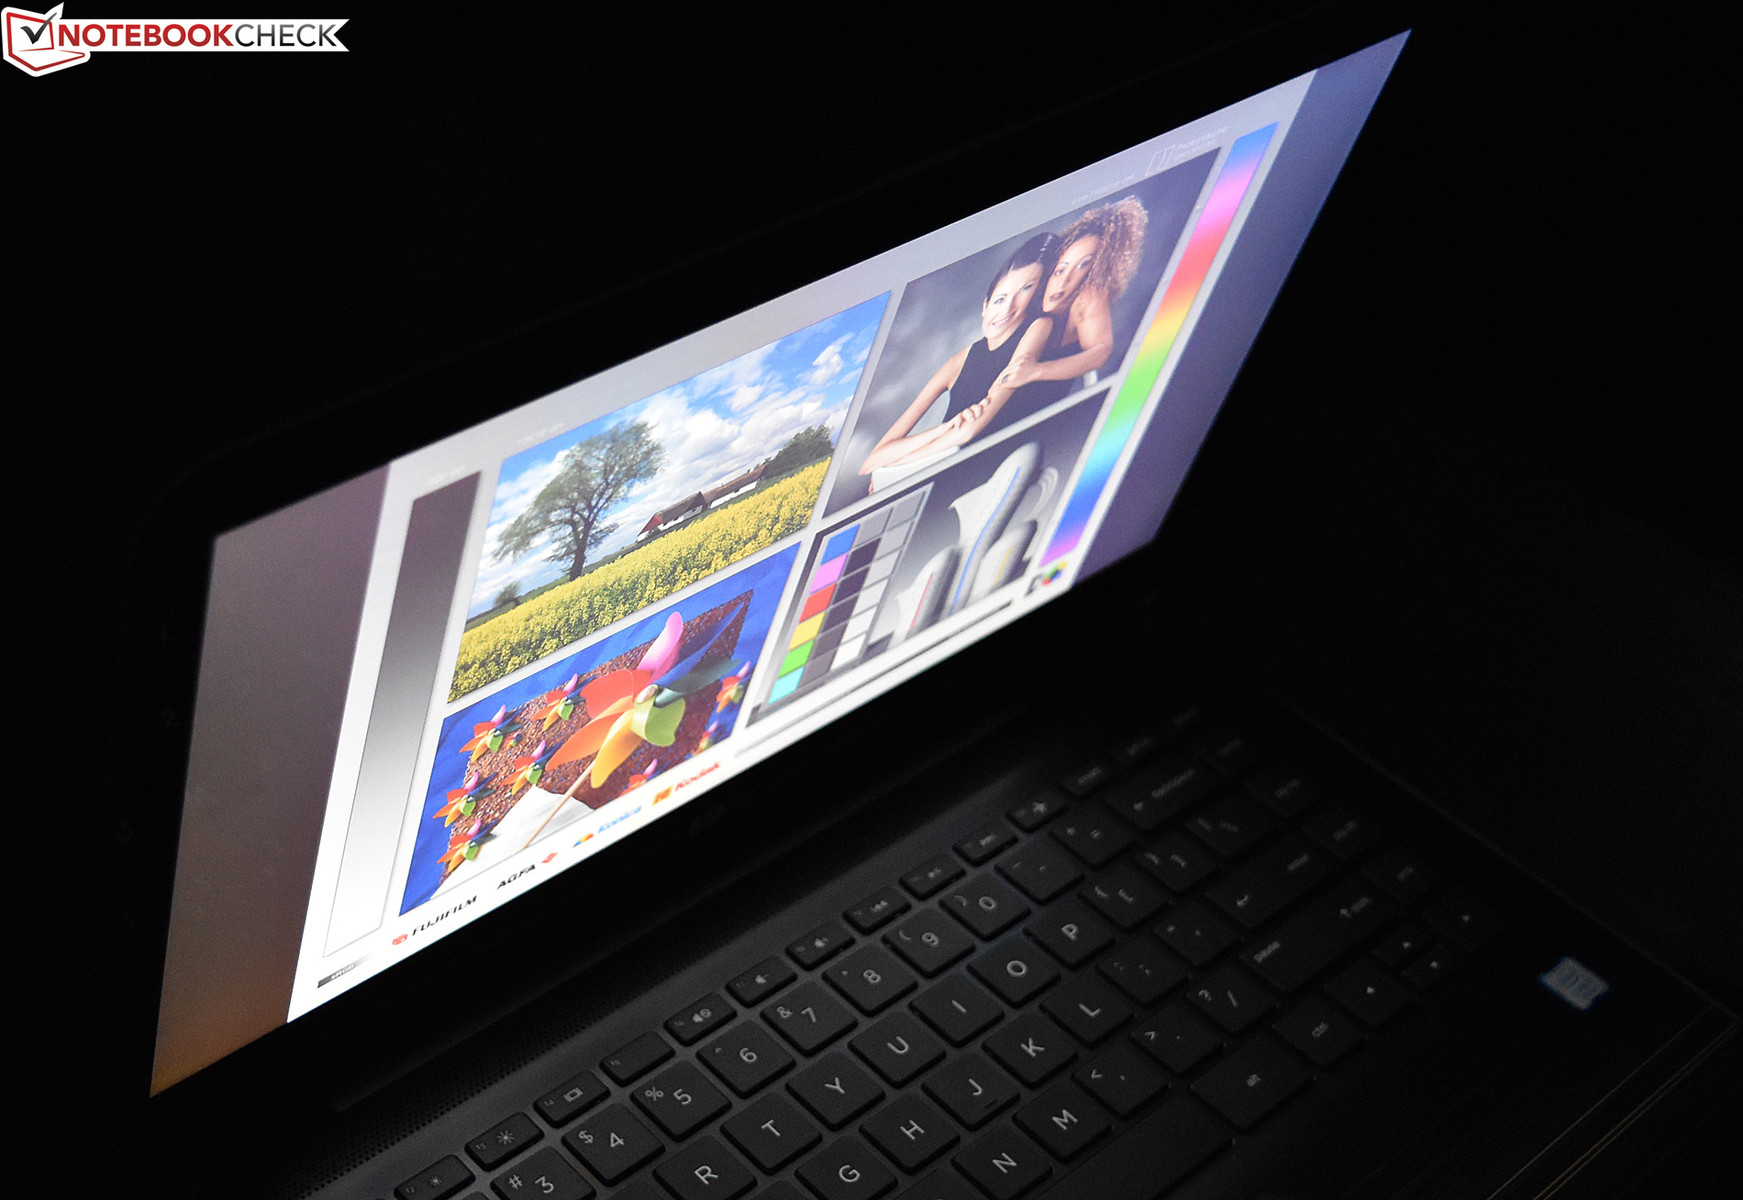
Display
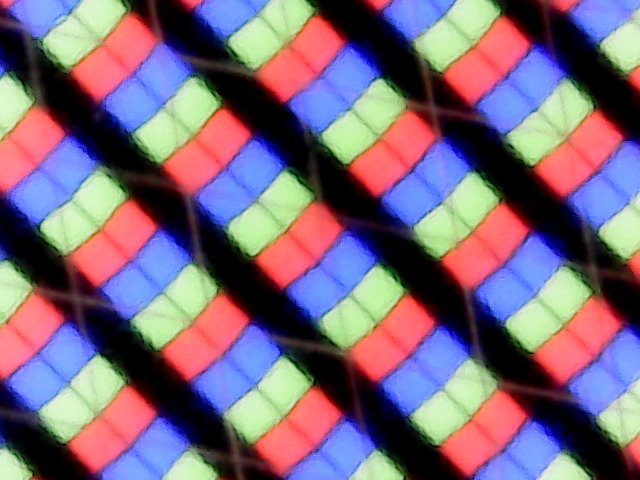
The Pavilion x360 13t includes a 1366x768 resolution glossy IPS touchscreen, which naturally won’t be turning any heads—but at least it gets the job done. By contrast, the screen in the Envy x360 we reviewed last month—which featured a higher resolution—was significantly dimmer (roughly 60 cd/m² on average) and didn’t really appear to be any more vivid.
| |||||||||||||||||||||||||
Brightness Distribution: 84 %
Center on Battery: 256.4 cd/m²
Contrast: 712:1 (Black: 0.36 cd/m²)
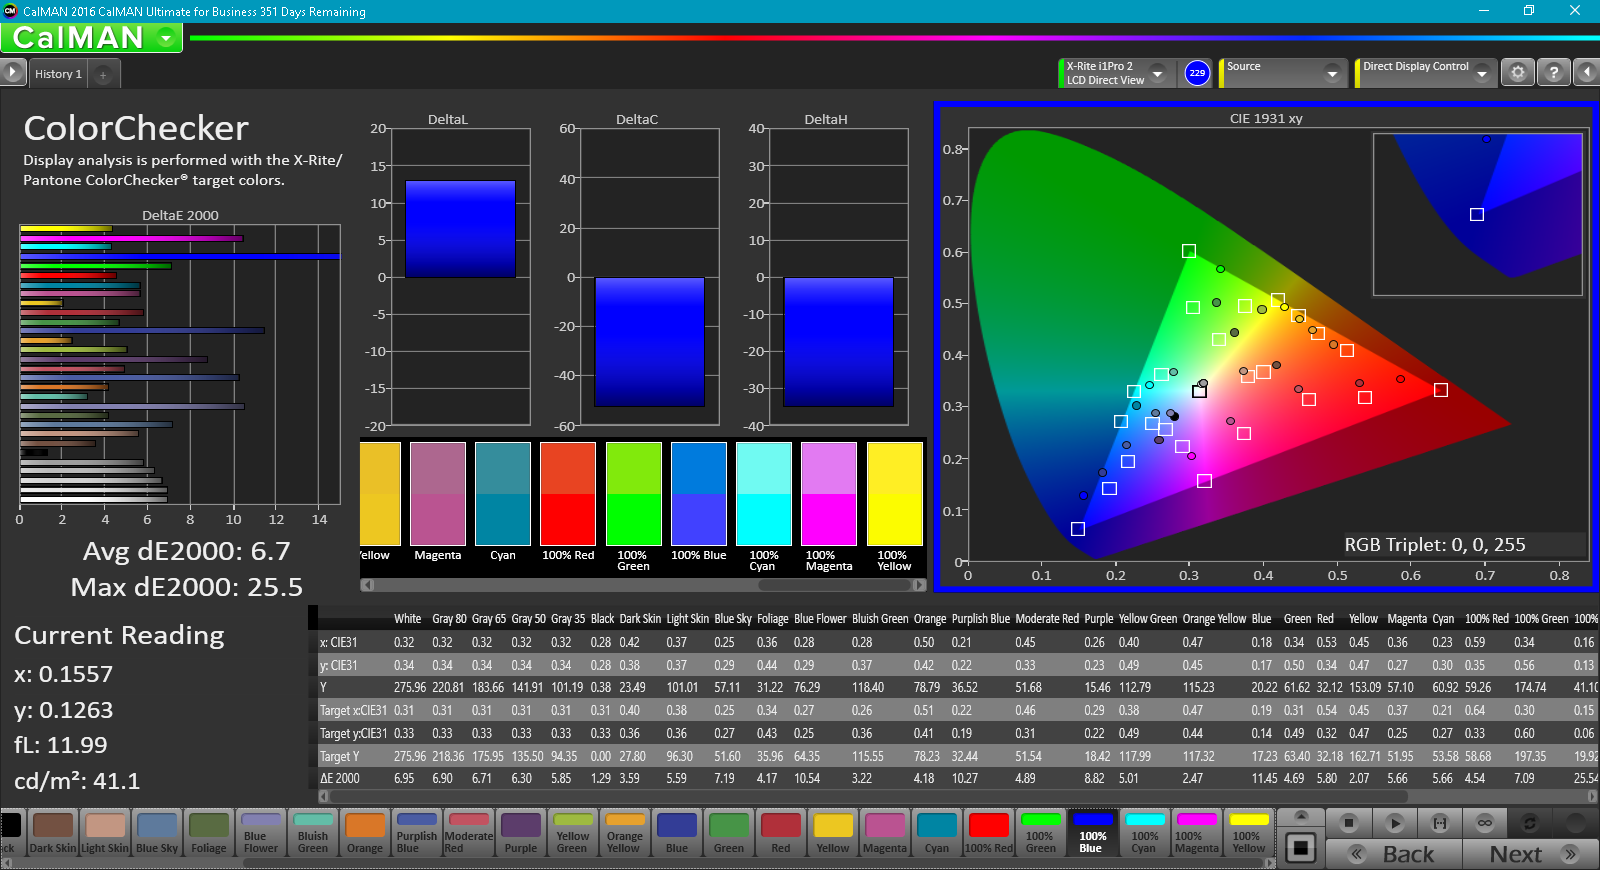
ΔE ColorChecker Calman: 6.7 | ∀{0.5-29.43 Ø4.71}
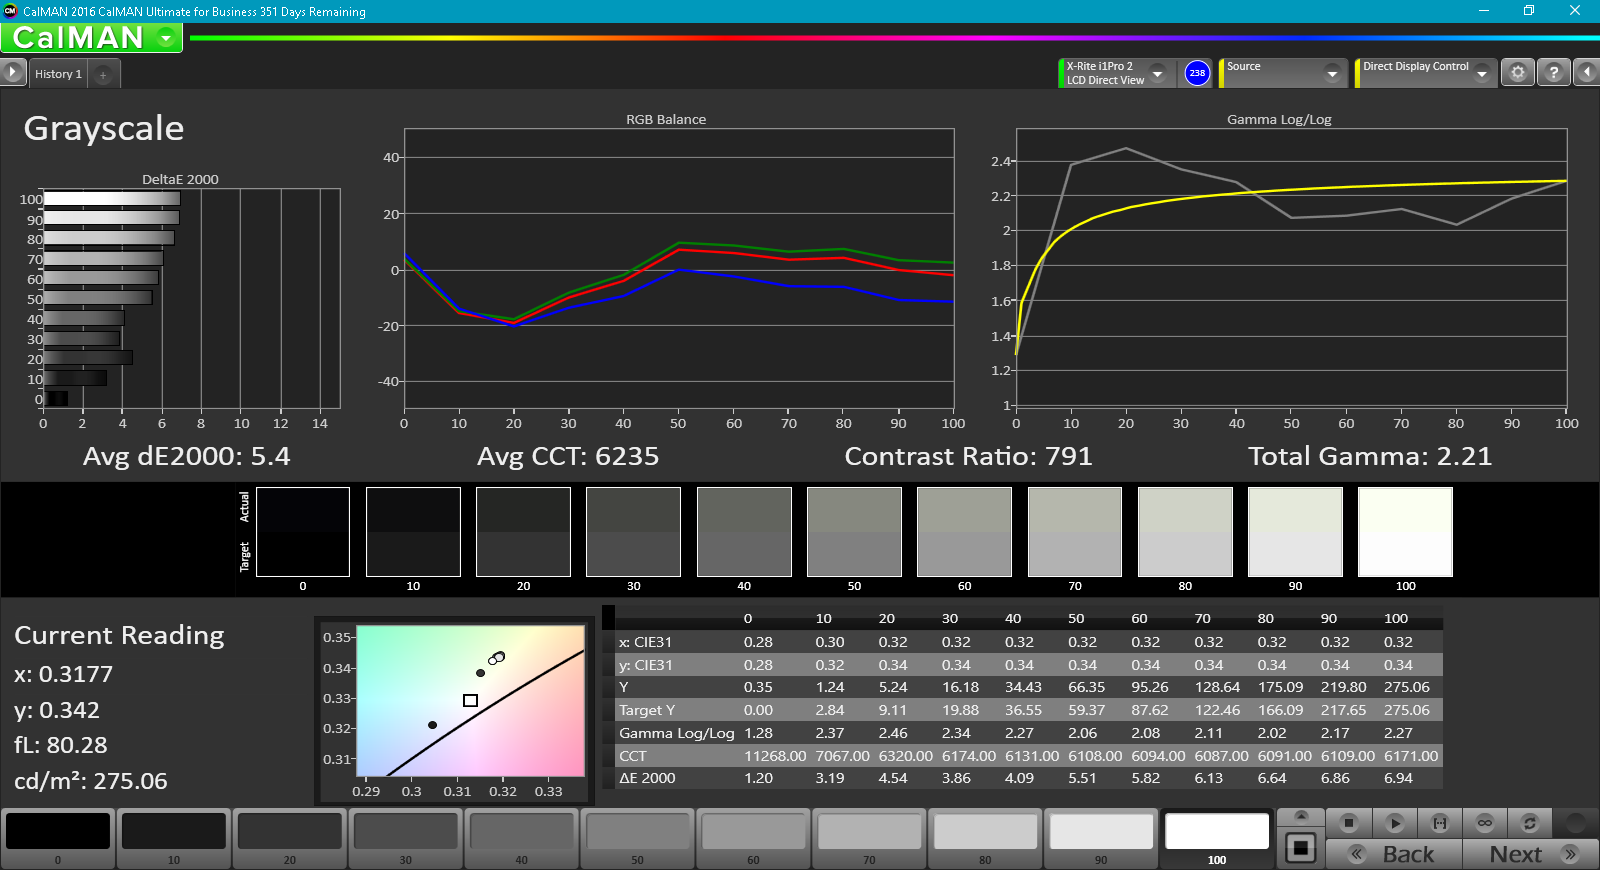
ΔE Greyscale Calman: 5.4 | ∀{0.09-98 Ø4.96}
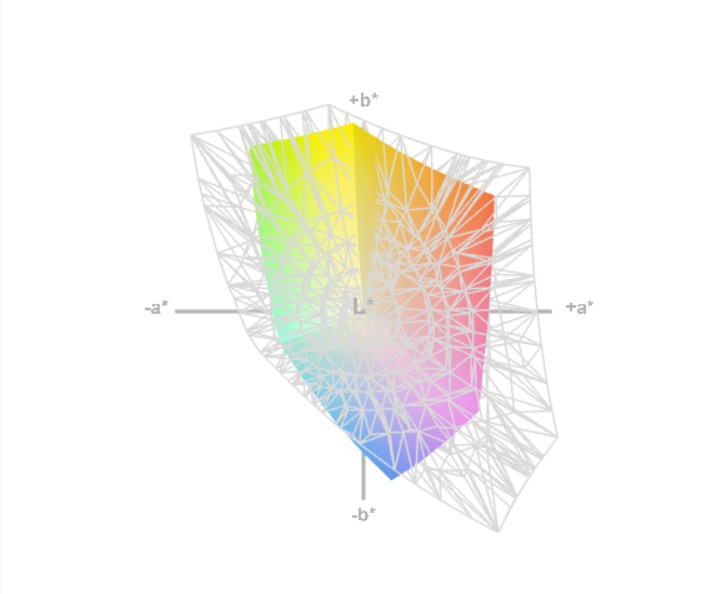
61% sRGB (Argyll 1.6.3 3D)
39% AdobeRGB 1998 (Argyll 1.6.3 3D)
42.2% AdobeRGB 1998 (Argyll 3D)
61% sRGB (Argyll 3D)
40.81% Display P3 (Argyll 3D)
Gamma: 2.21
CCT: 6235 K
| HP Pavilion x360 13t-u100 LGD052E, IPS, 13.3", 1366x768 | HP Spectre x360 13-w023dx Chi Mei CMN1367, IPS, 13.3", 1920x1080 | Dell Inspiron 13 5368 AUO B133HAB, IPS, 13.3", 1920x1080 | Asus VivoBook Flip TP301UA-DW006T BOE HB133WX1-402, TN, 13.3", 1920x1080 | Lenovo Yoga 3 Pro 13 80HE004LGE Samsung L_LLTN133YL03L01, IPS, 13.3", 3200x1800 | |
|---|---|---|---|---|---|
| Display | 55% | -5% | 2% | 53% | |
| Display P3 Coverage (%) | 40.81 | 65.4 60% | 38.88 -5% | 41.63 2% | 64.6 58% |
| sRGB Coverage (%) | 61 | 90.4 48% | 57.7 -5% | 62.6 3% | 89.5 47% |
| AdobeRGB 1998 Coverage (%) | 42.2 | 65.8 56% | 40.17 -5% | 43.02 2% | 65.5 55% |
| Response Times | 34% | 21% | 55% | 32% | |
| Response Time Grey 50% / Grey 80% * (ms) | 57.2 ? | 33.2 ? 42% | 44 ? 23% | 38 ? 34% | 36 ? 37% |
| Response Time Black / White * (ms) | 37.6 ? | 28 ? 26% | 31 ? 18% | 9 ? 76% | 28 ? 26% |
| PWM Frequency (Hz) | 50 ? | 1330 ? | |||
| Screen | 23% | 17% | 2% | 25% | |
| Brightness middle (cd/m²) | 256.4 | 334.6 30% | 240 -6% | 166 -35% | 314 22% |
| Brightness (cd/m²) | 251 | 319 27% | 229 -9% | 165 -34% | 294 17% |
| Brightness Distribution (%) | 84 | 90 7% | 92 10% | 90 7% | 83 -1% |
| Black Level * (cd/m²) | 0.36 | 0.336 7% | 0.24 33% | 0.44 -22% | 0.57 -58% |
| Contrast (:1) | 712 | 996 40% | 1000 40% | 377 -47% | 551 -23% |
| Colorchecker dE 2000 * | 6.7 | 6.21 7% | 4.75 29% | 4.07 39% | 2.18 67% |
| Colorchecker dE 2000 max. * | 25.5 | 12 53% | 9.09 64% | 6.38 75% | 6.48 75% |
| Greyscale dE 2000 * | 5.4 | 7.71 -43% | 4.3 20% | 3.99 26% | 2.45 55% |
| Gamma | 2.21 100% | 2.36 93% | 2.5 88% | 2.49 88% | 2.39 92% |
| CCT | 6235 104% | 6458 101% | 5893 110% | 7491 87% | 6745 96% |
| Color Space (Percent of AdobeRGB 1998) (%) | 39 | 58.6 50% | 36.79 -6% | 40 3% | 58 49% |
| Color Space (Percent of sRGB) (%) | 61 | 90 48% | 57.39 -6% | 63 3% | 89 46% |
| Total Average (Program / Settings) | 37% /
31% | 11% /
13% | 20% /
9% | 37% /
31% |
* ... smaller is better
Turning to our measurements, we recorded an average brightness of 251.5 cd/m² and a contrast of 712:1. These are reasonable values at least, and although the contrast can’t match that of the more expensive, “higher-end” Envy x360, the brightness is far superior (31% better). The black value is acceptable at 0.36 cd/m², and the brightness distribution of 84% means a fairly uniform picture in terms of luminosity.
The panel managed to cover just 61% of the sRGB spectrum in our tests, which is a weak result, but hardly uncommon for machines of this price point. Even the Envy only achieved 64%, so apart from resolution and a small difference in contrast, the picture quality on the Pavilion is actually arguably better than the Envy thanks to the brightness and the lack of PWM.
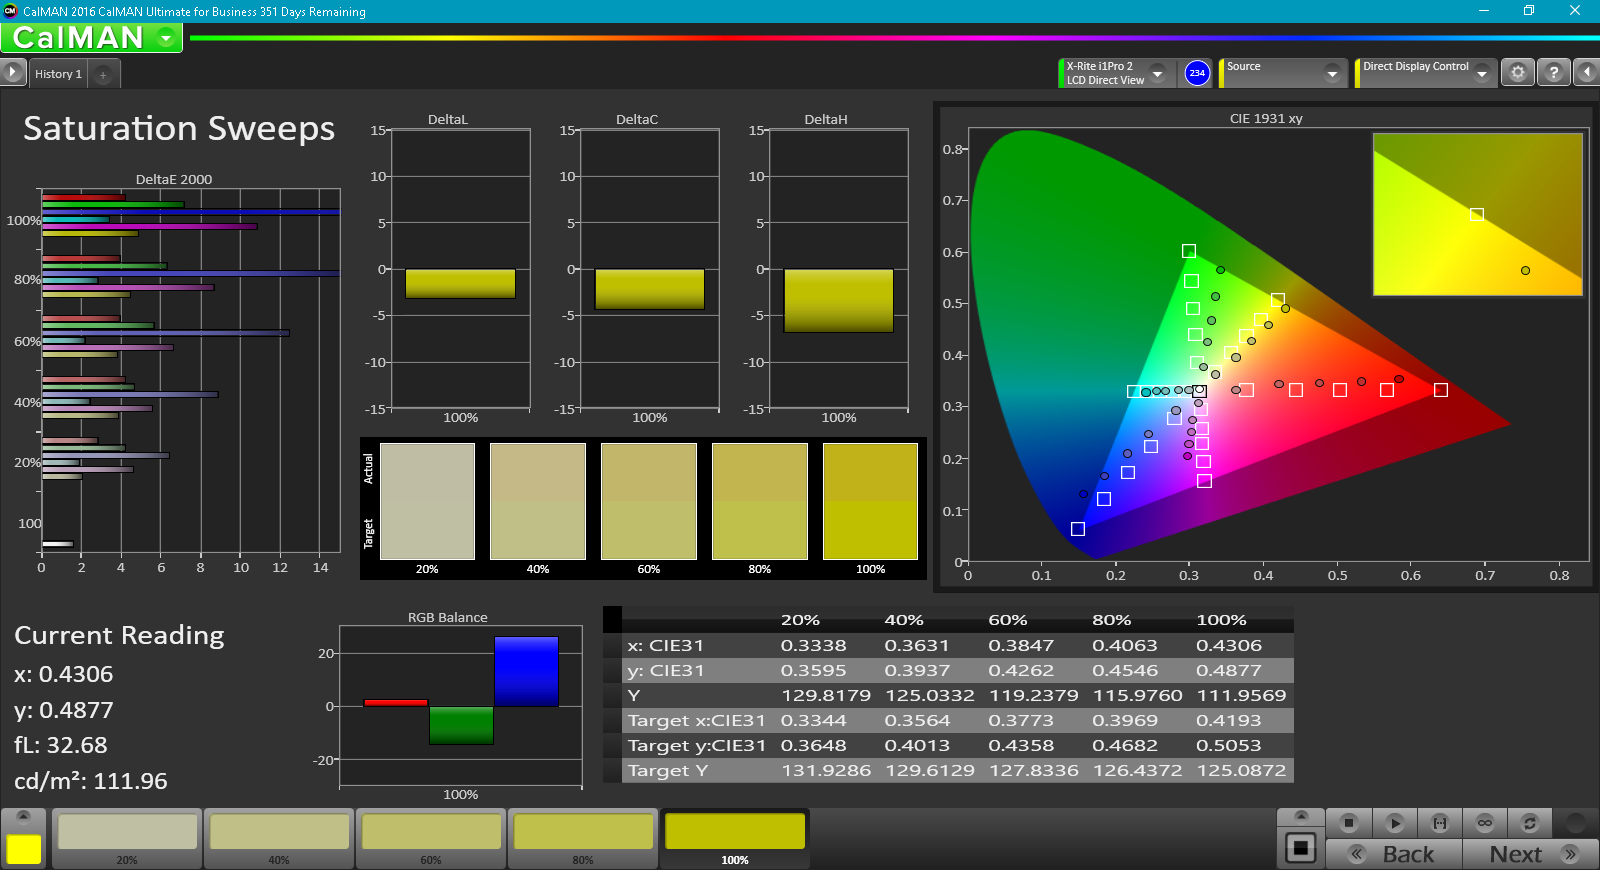
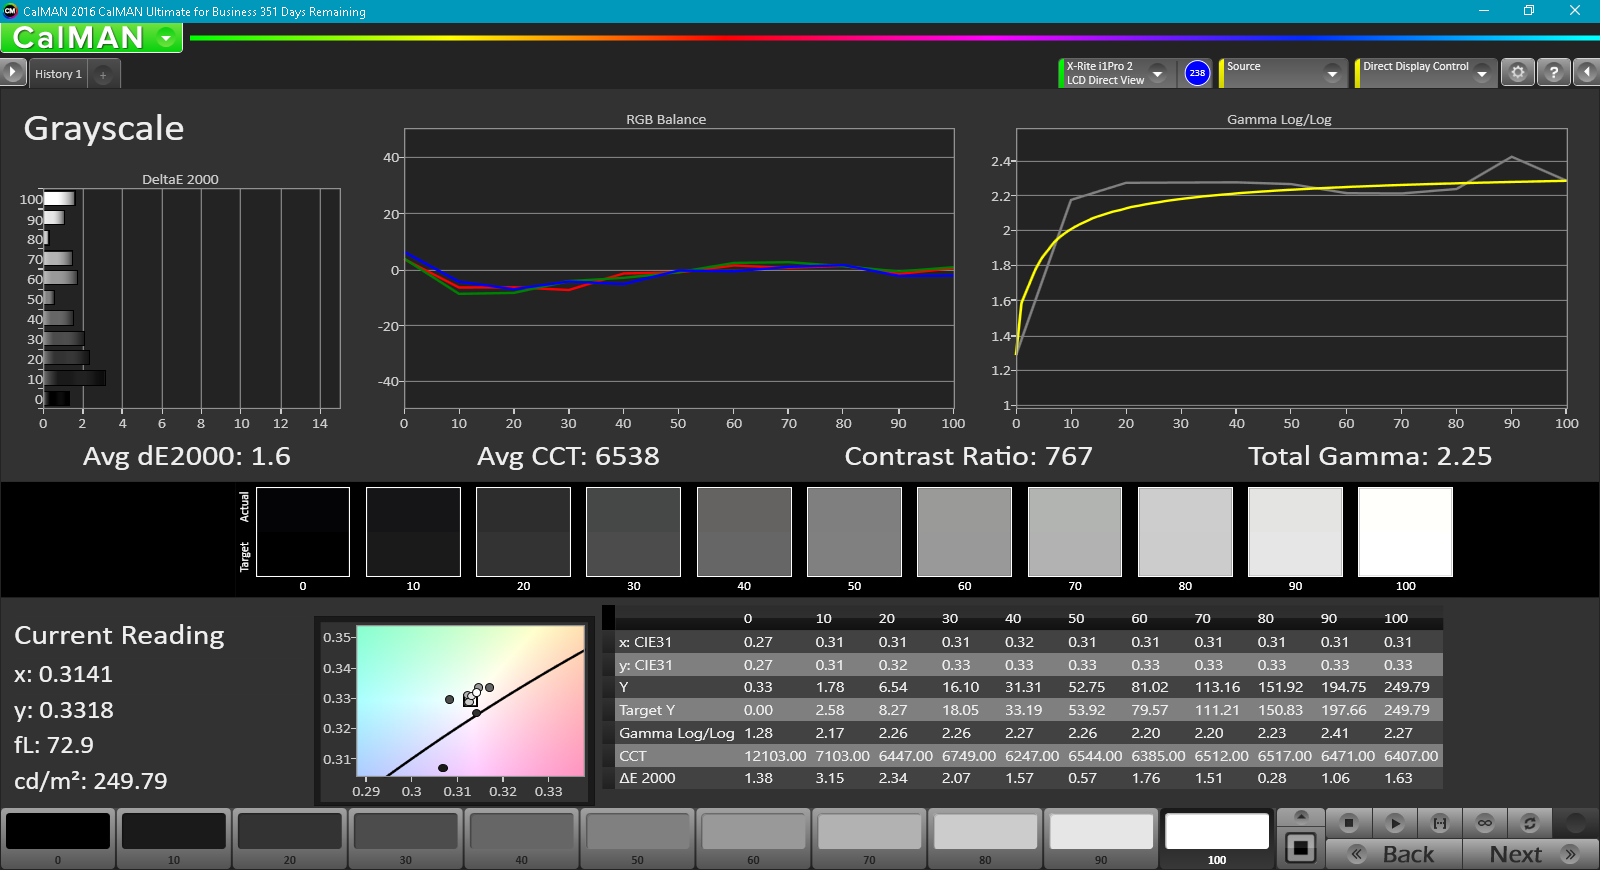
CalMAN measurements provide a couple of surprises. Blue hues are notably deviant, with pure blue registering a DeltaE value north of 14 (ideal is 0, indicating perfect accuracy). Magenta is also a problem, and a number of other colors also hover around the 5-6 mark. Average ColorChecker DeltaE is still just 6.7 thanks to a good number of reasonably low values elsewhere, but in short, this is not a PC to be used for any sort of color-accurate work (such as photo editing). Even after calibration, the values had only somewhat improved. Mostly calibration resulted in improved Grayscale values, taking the CCT Average from to 6538 from 6235 and Grayscale DeltaE to 1.6 from 5.4. Total Gamma is close enough to 2.2 already.
Display Response Times
| ↔ Response Time Black to White | ||
|---|---|---|
| 37.6 ms ... rise ↗ and fall ↘ combined | ↗ 8.4 ms rise | 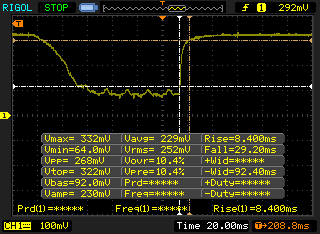 |
| ↘ 29.2 ms fall | ||
| The screen shows slow response rates in our tests and will be unsatisfactory for gamers. In comparison, all tested devices range from 0.1 (minimum) to 240 (maximum) ms. » 95 % of all devices are better. This means that the measured response time is worse than the average of all tested devices (19.8 ms). | ||
| ↔ Response Time 50% Grey to 80% Grey | ||
| 57.2 ms ... rise ↗ and fall ↘ combined | ↗ 23.2 ms rise | 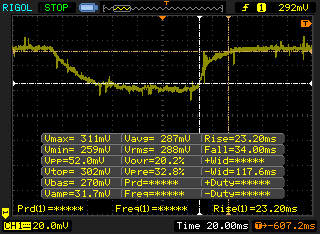 |
| ↘ 34 ms fall | ||
| The screen shows slow response rates in our tests and will be unsatisfactory for gamers. In comparison, all tested devices range from 0.165 (minimum) to 636 (maximum) ms. » 94 % of all devices are better. This means that the measured response time is worse than the average of all tested devices (31 ms). | ||
Screen Flickering / PWM (Pulse-Width Modulation)
| Screen flickering / PWM not detected | 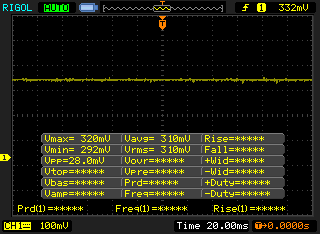 | ||
In comparison: 52 % of all tested devices do not use PWM to dim the display. If PWM was detected, an average of 7754 (minimum: 5 - maximum: 343500) Hz was measured. | |||
Outdoors, the panel struggles thanks to its edge-to-edge glossy finish—but it still handles bright environments better than the Envy thanks to the improved luminosity. Viewing angles are good (as expected for IPS) and seem also to be more stable than those of the 15.6-inch Envy, presumably due to differences in display lid design and the separation between the digitizer layer and the panel beneath.

Performance
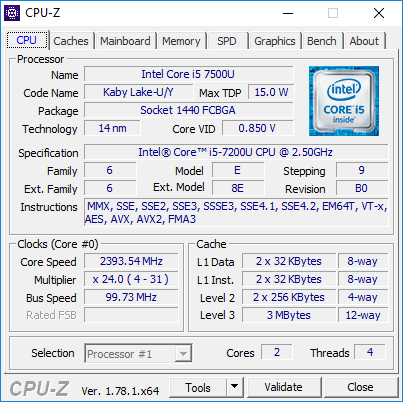
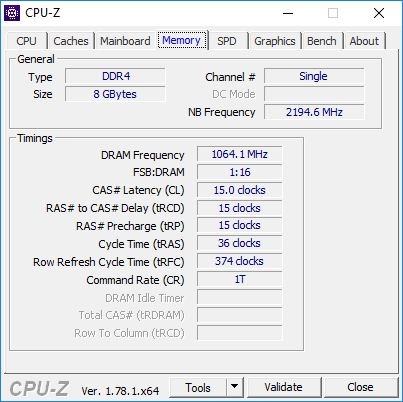
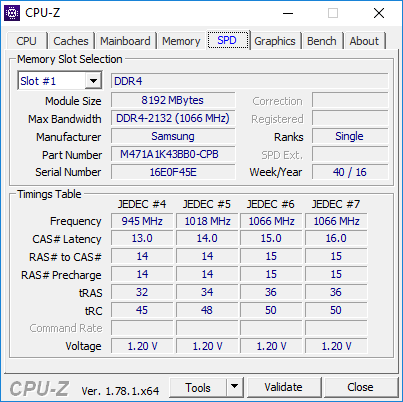
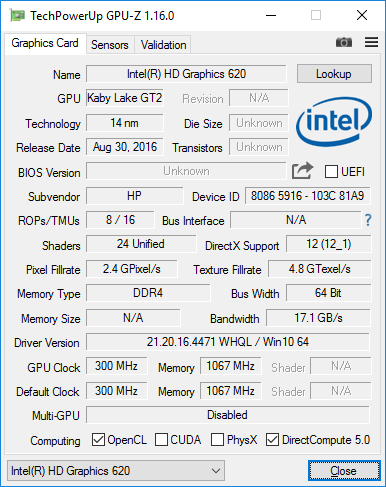
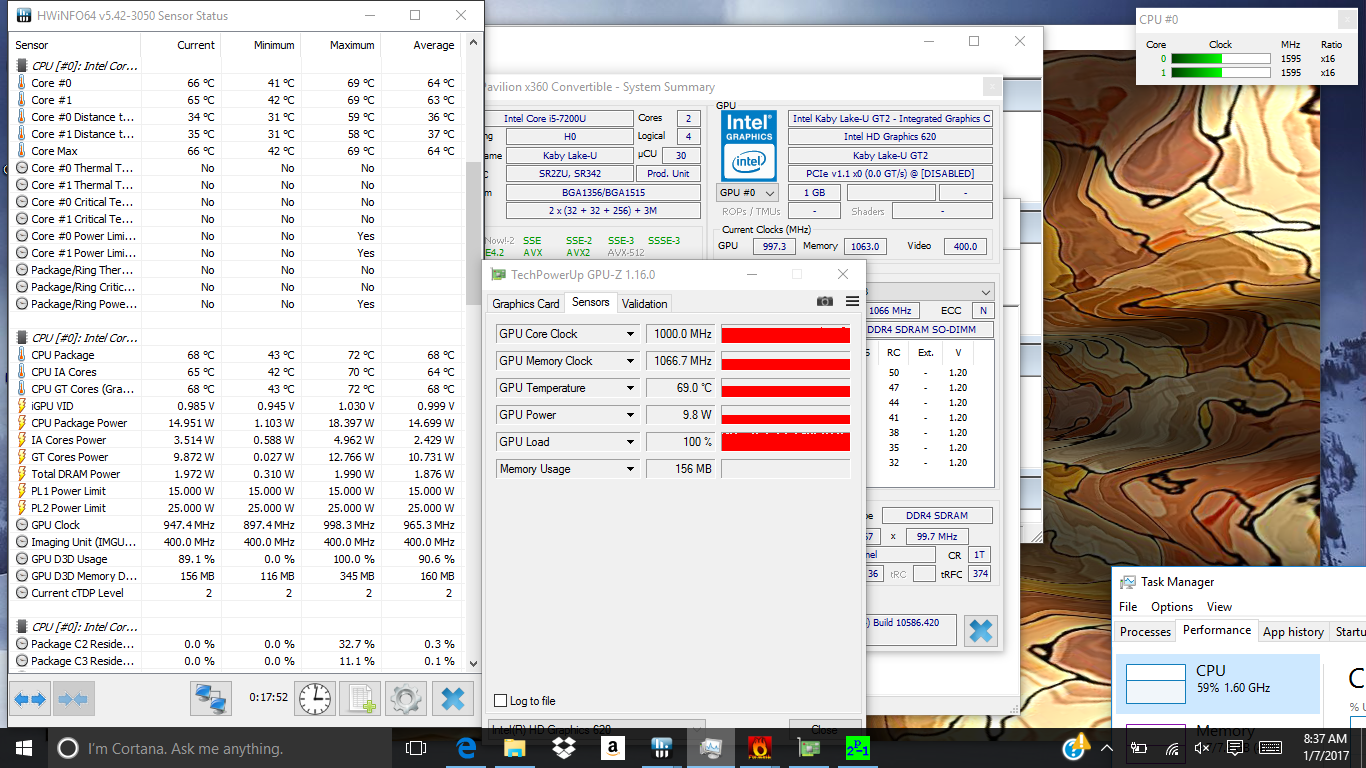
The Pavilion x360 we received for review came equipped with an Intel Core i5-7200U and 8 GB of DDR4 2133 MHz single-channel memory. These are solid specs right out of the gate, but we should remind you that the memory is not upgradeable—you’re stuck with what you get. The only disappointment here is that, since it’s single-channel memory, you aren’t able to reap some of the other benefits that come alongside a second match SODIMM running in parallel (specifically, vastly improved integrated graphics performance, provided thermal headroom exists). Still, again, for the average user, these specs are perfectly sufficient—and when paired with the M.2 128 GB SSD, we ought to see respectable general system performance.
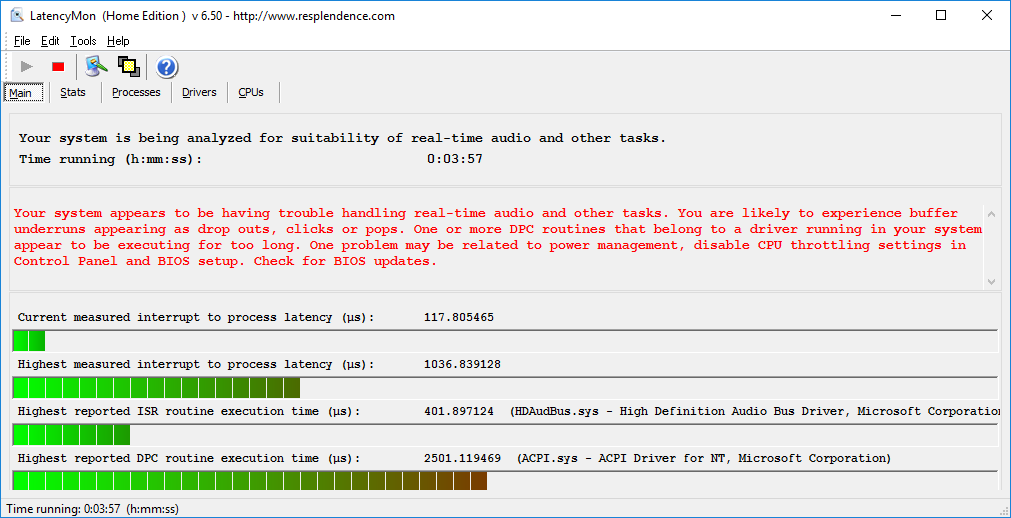
The machine has no trouble performing while unplugged; a secondary run of 3DMark 11 while running on battery power produced a nearly identical result to the original (1521 vs. 1523). Elsewhere, LatencyMon reports some troubles with DPC Latencies occasionally spiking which might result in stutters during real-time audio and video streaming, but these spikes were very infrequent in our observations, so it’s actually probably not much of a concern.
Processor
The Kaby Lake Intel Core i5-7200U is, for the most part, a higher-clocked version of the Skylake Core i5-6200U. Elsewhere, architecturally, the differences are quite small—so the extra 300 MHz (clock rate: 2.5 GHz – 31. GHz) is primarily what results in the performance bonus. This CPU is manufactured using a 14 nm FinFET process, and it features a 15 W TDP.
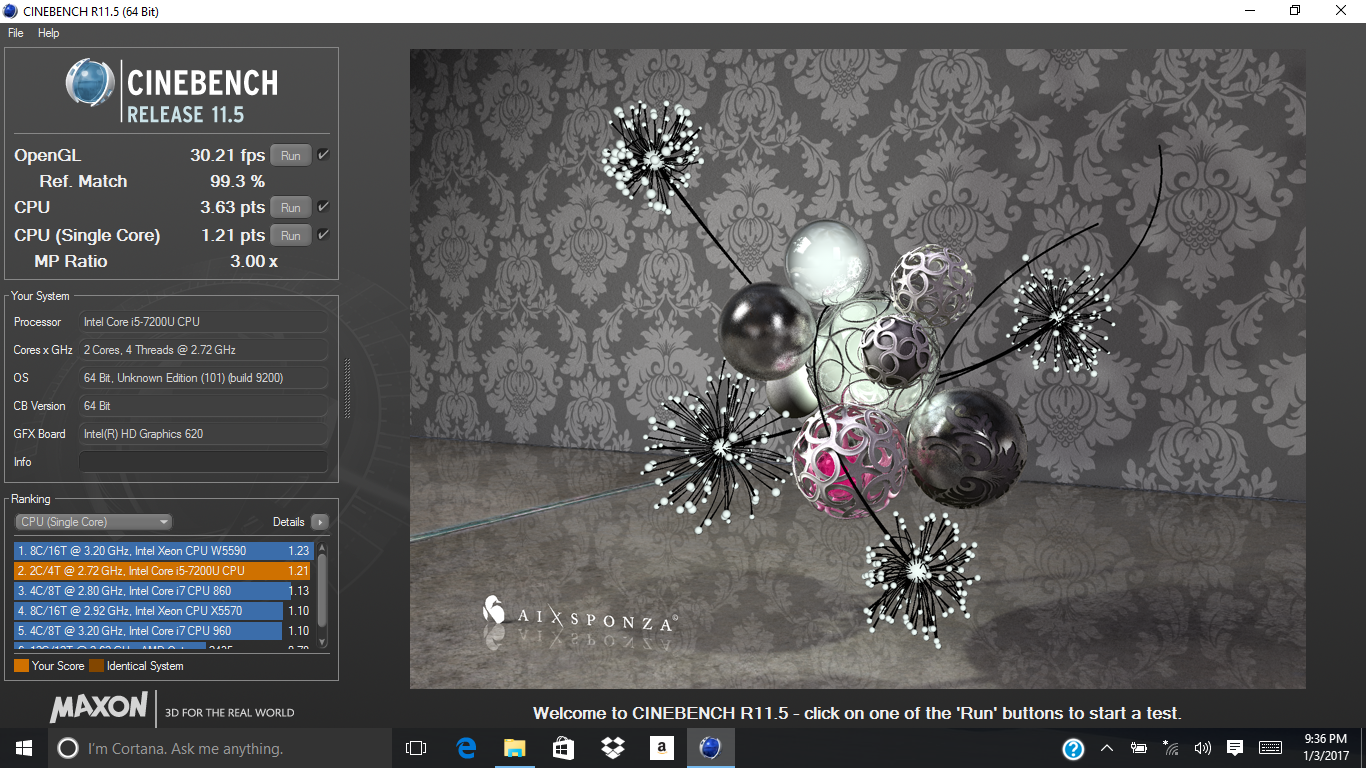
We’ve done plenty of comparisons to put this processor in context with its predecessors already; see our dedicated page here for a full list of those. As for how the Pavilion x360 handles itself versus its peers, it’s not bad at all. Performance in most of the benchmarks was generally near the median for this processor, and in multi-CPU performance, it actually manages to beat the Spectre x360 and its Intel Core i7-7500U. This is probably thanks to the fact that the Spectre could not maintain full Turbo clock rates and instead relinquished itself to 2.7 GHz for the duration of the CPU stress test, while the Pavilion x360 stays put at 3.1 GHz effectively permanently (as we’ll explore in more detail later on).
| Cinebench R11.5 | |
| CPU Single 64Bit | |
| HP Spectre x360 13-w023dx | |
| HP Pavilion x360 13t-u100 | |
| CPU Multi 64Bit | |
| HP Pavilion x360 13t-u100 | |
| HP Spectre x360 13-w023dx | |
| wPrime 2.10 - 1024m | |
| HP Pavilion x360 13t-u100 | |
| HP Spectre x360 13-w023dx | |
| Super Pi Mod 1.5 XS 32M - 32M | |
| HP Pavilion x360 13t-u100 | |
| HP Spectre x360 13-w023dx | |
* ... smaller is better
System Performance
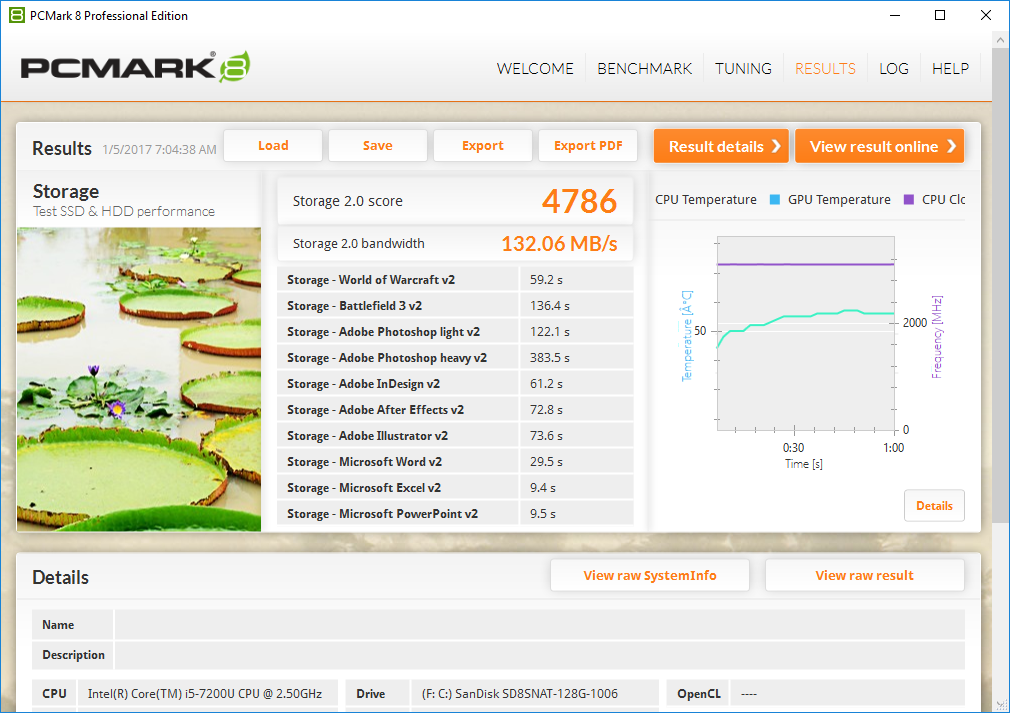
Thanks to its nimble solid-state storage, the Pavilion x360 13t-u100 excelled in our system performance tests. Before we get to the actual scores, we should mention that subjective performance was always quick and without stutters or wait times. The x360 performs like a premium Ultrabook—minus the fancy case design, gorgeous display, and accompanying premium price tag.
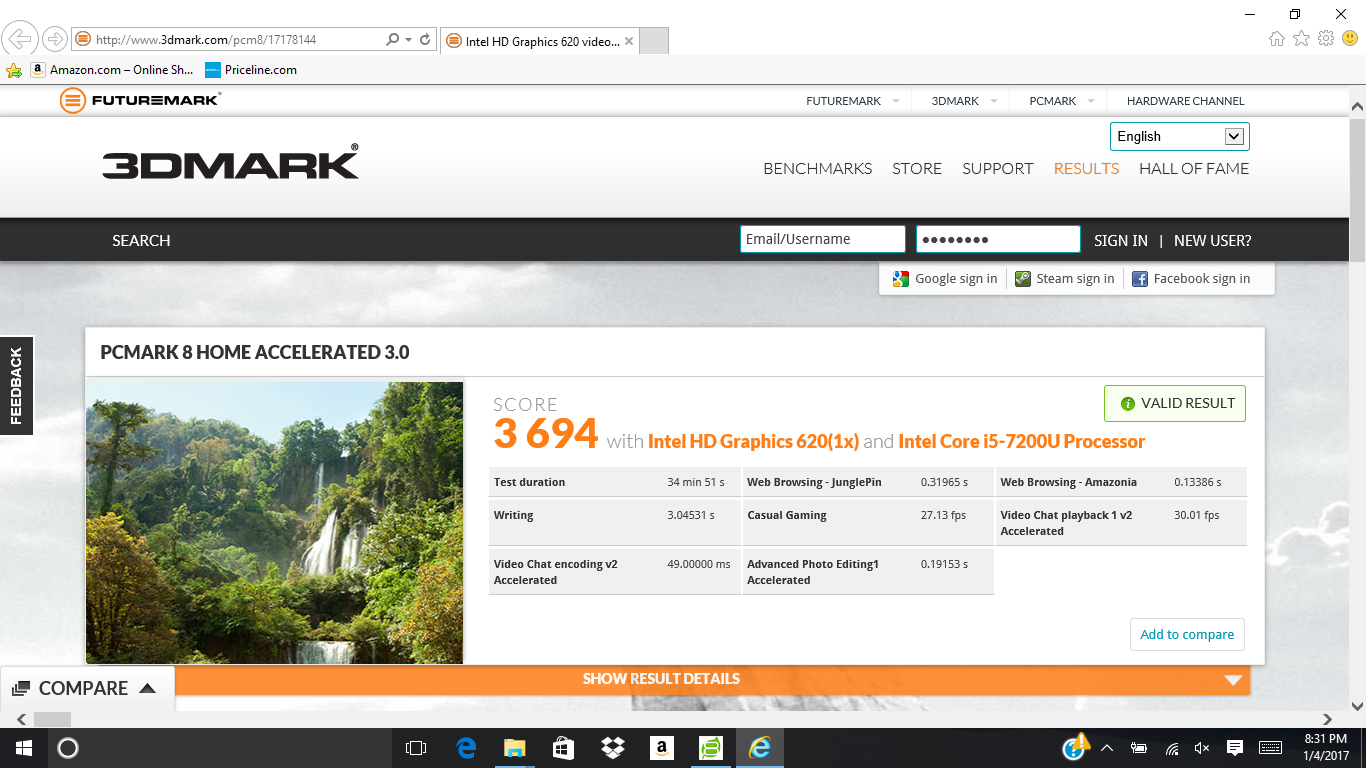
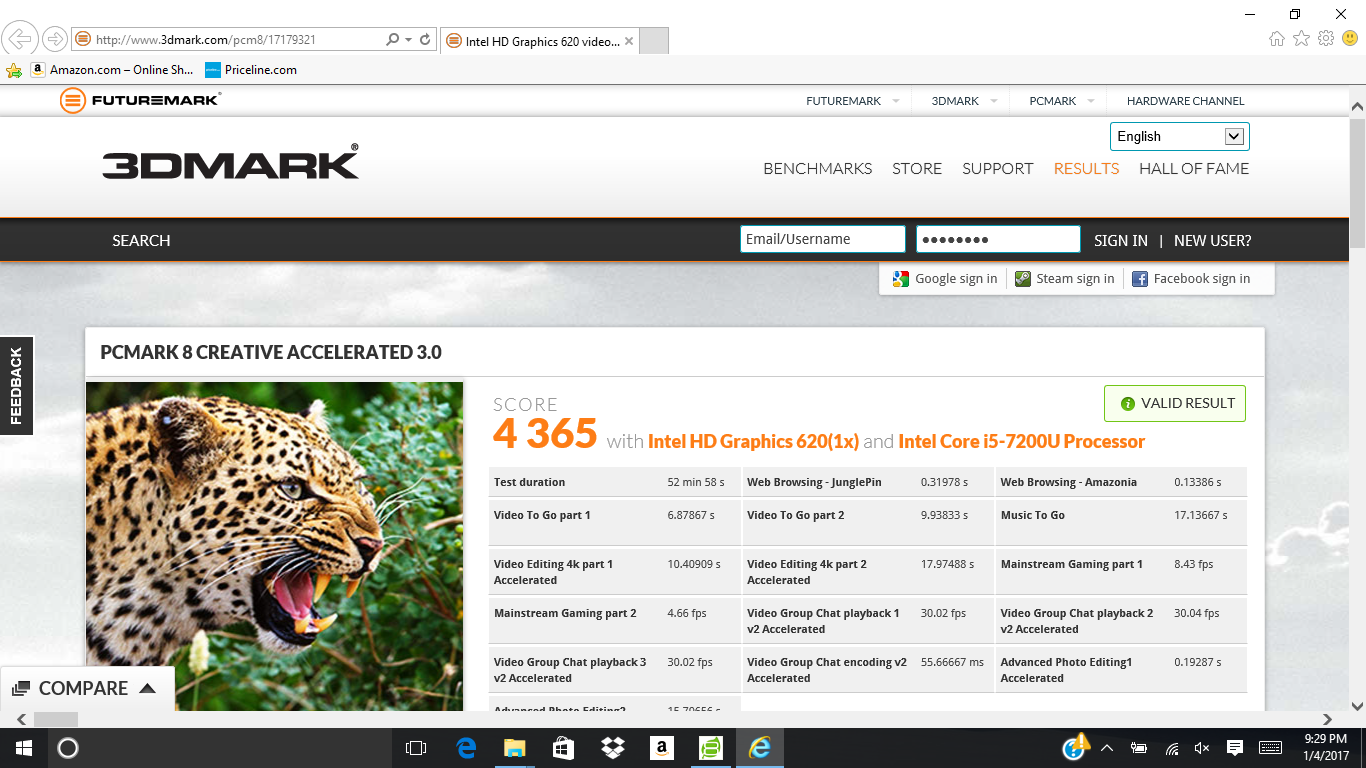
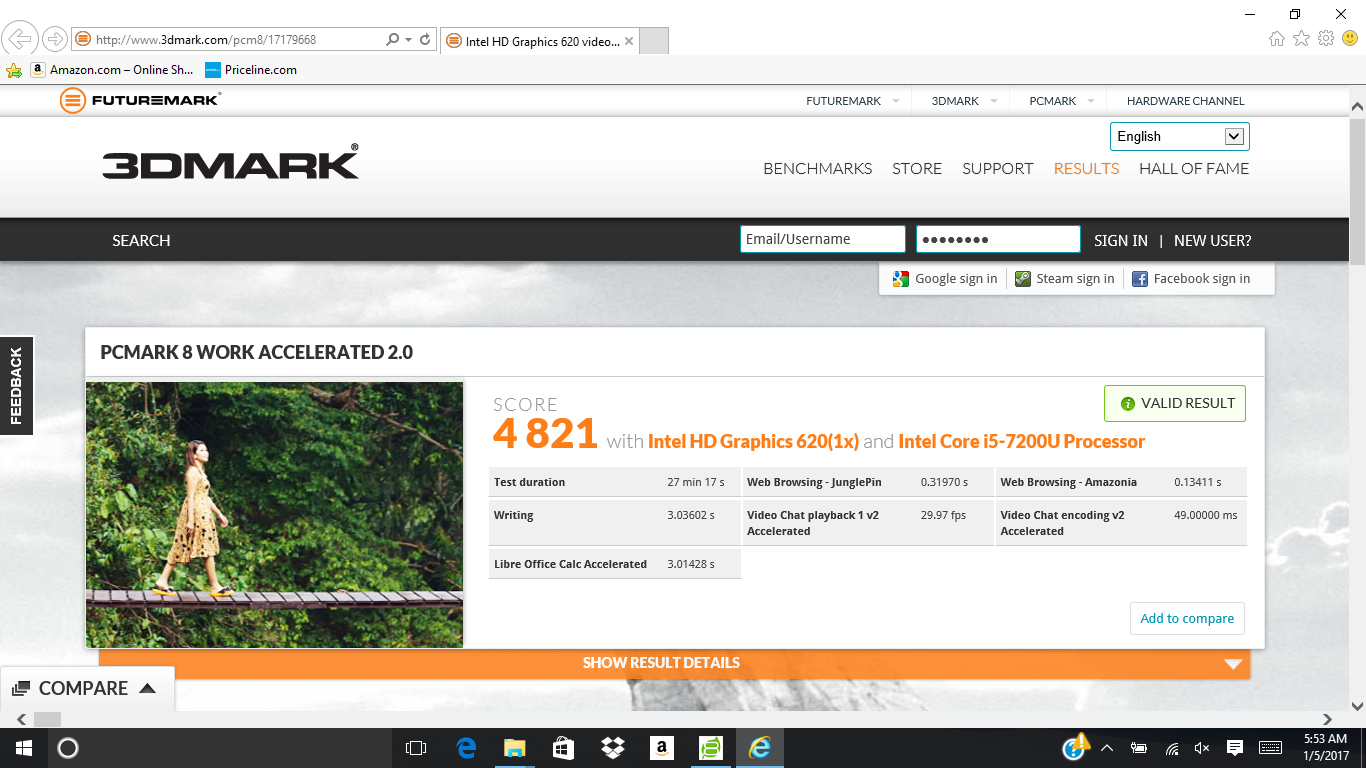
In our PCMark 8 synthetic performance tests, only the Spectre x360 13-w023dx produces consistently higher scores, and only by single-digit margins, to boot (between 2 and 8 percent). Scores of 4821 and 4365 in PCMark 8 Work Accelerated and Creative Accelerated represent a very capable machine, and the Home Accelerated score of 3694 (again, just 3% below that of the Spectre) easily eclipses that of the Envy x360 we reviewed a month ago (3236) by a full 14%. In comparison, subjectively, the Pavilion feels substantially quicker than the Envy; this is the difference a solid-state drive makes.
| PCMark 8 | |
| Home Score Accelerated v2 | |
| HP Spectre x360 13-w023dx | |
| Dell Inspiron 13 5368 | |
| HP Pavilion x360 13t-u100 | |
| Asus VivoBook Flip TP301UA-DW006T | |
| Lenovo Yoga 3 Pro 13 80HE004LGE | |
| Work Score Accelerated v2 | |
| HP Spectre x360 13-w023dx | |
| HP Pavilion x360 13t-u100 | |
| Dell Inspiron 13 5368 | |
| Asus VivoBook Flip TP301UA-DW006T | |
| Lenovo Yoga 3 Pro 13 80HE004LGE | |
| Creative Score Accelerated v2 | |
| HP Spectre x360 13-w023dx | |
| HP Pavilion x360 13t-u100 | |
| Lenovo Yoga 3 Pro 13 80HE004LGE | |
| PCMark 8 Home Score Accelerated v2 | 3694 points | |
| PCMark 8 Creative Score Accelerated v2 | 4365 points | |
| PCMark 8 Work Score Accelerated v2 | 4821 points | |
Help | ||
Storage Devices
All of this is made possible by the SanDisk Z400s SSD that powers the Pavilion x360 13t-u100, though in the grand scheme of things, as communicated by our chart below, this is hardly one of the fastest SSDs around. Mediocre write speeds (171.2 MB/s sequential and 126 MB/s 4K-64 as measured by AS SSD) and merely average 4K performance in general mean that the Z400s is easily bested by more expensive NVMe drives. Still, the difference even a cheap solid-state drive makes to overall system performance cannot be understated, and taking the time to compare these numbers to the Envy x360 underscores this as well as anything.
The drive can be replaced with a higher-capacity drive once the machine has been disassembled. Of course, as mentioned in our maintenance section, that process isn’t exactly easy—but at least it’s possible.

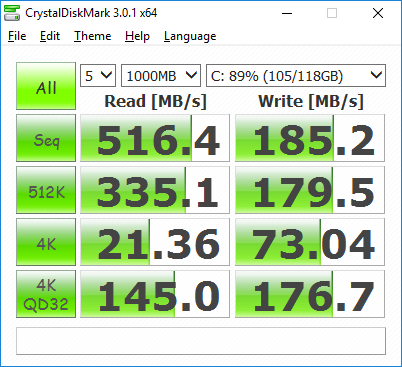
| HP Pavilion x360 13t-u100 SanDisk Z400s SD8SNAT-128G | HP Spectre x360 13-w023dx Samsung PM951 NVMe MZVLV512 | Dell Inspiron 13 5368 Toshiba THNSNK256GCS8 | Asus VivoBook Flip TP301UA-DW006T Samsung CM871 MZ7LF128HCHP | Lenovo Yoga 3 Pro 13 80HE004LGE Samsung SSD PM851 MZNTE512HMJH | |
|---|---|---|---|---|---|
| CrystalDiskMark 3.0 | 157% | 35% | -56% | 47% | |
| Read Seq (MB/s) | 516 | 1376 167% | 479 -7% | 396 -23% | 521 1% |
| Write Seq (MB/s) | 185.2 | 571 208% | 270.1 46% | 133.5 -28% | 238.6 29% |
| Read 512 (MB/s) | 335.1 | 679 103% | 428.3 28% | 259.5 -23% | 417.3 25% |
| Write 512 (MB/s) | 179.5 | 571 218% | 267.9 49% | 23.86 -87% | 237.7 32% |
| Read 4k (MB/s) | 21.36 | 42.66 100% | 23.77 11% | 5.783 -73% | 35.9 68% |
| Write 4k (MB/s) | 73 | 137.9 89% | 81.4 12% | 8.507 -88% | 99.9 37% |
| Read 4k QD32 (MB/s) | 145 | 535 269% | 333.6 130% | 97.5 -33% | 366.6 153% |
| Write 4k QD32 (MB/s) | 176.7 | 361.2 104% | 200.9 14% | 8.515 -95% | 236.7 34% |

GPU Performance
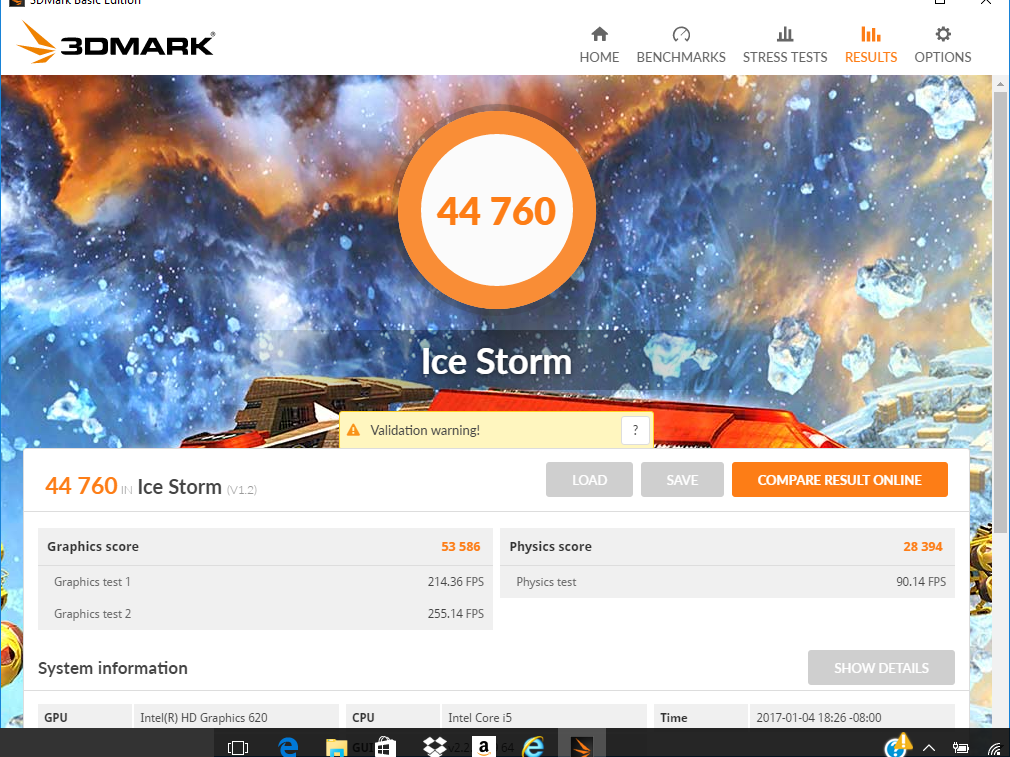
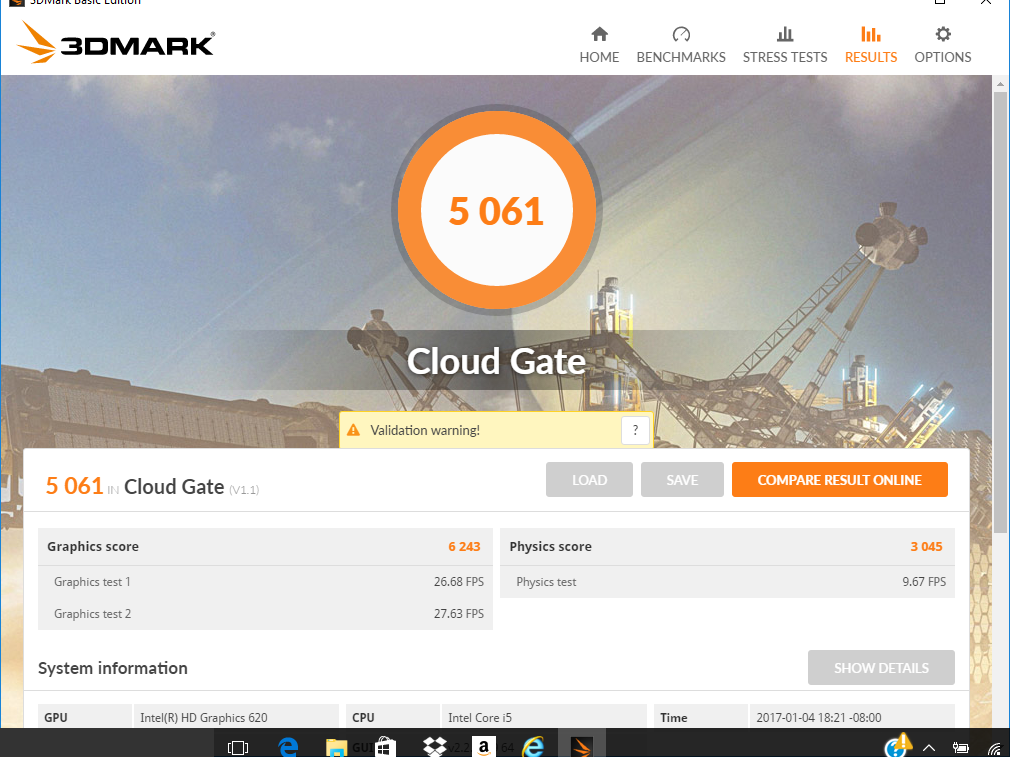
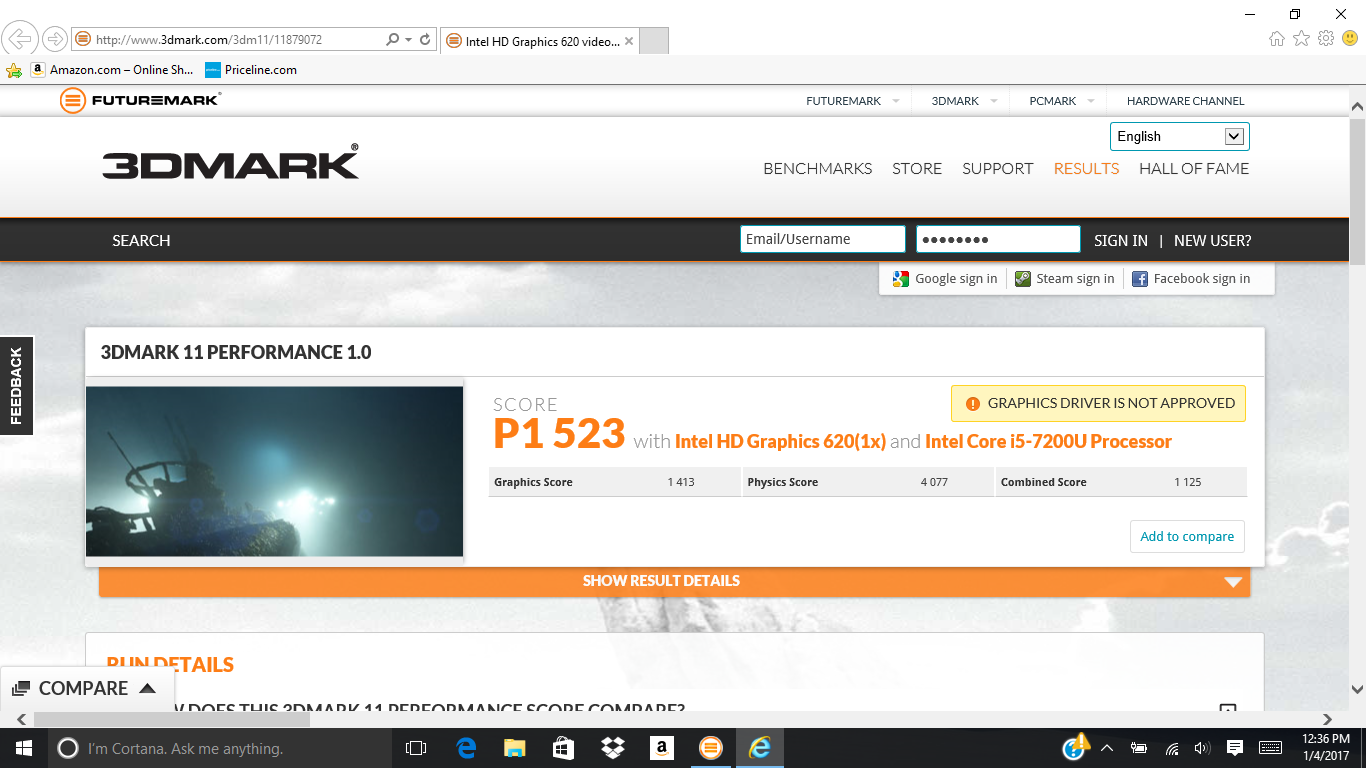
One area in which the Pavilion x360 will never excel is that of GPU performance. It isn’t bad, but as compared to, for instance, dual-channel memory configurations featuring Core i7 (both Skylake and Kaby Lake) CPUs, it lags by nearly 30% in our benchmarks. The 3DMark 11 Performance GPU scores show a smaller gap of 5 to 10%, but even still, the aggregate performance, with scores such as 1125 in 3DMark 11 Performance Combined and 704 in 3DMark Fire Strike, is not going to result in playable frame rates in nearly any modern game at palatable settings.
Our gaming benchmarks are proof of this: the Pavilion x360 only manages 43 fps on low settings at 1024x768 resolution in Bioshock Infinite, and on high settings at native resolution, it drops all the way to 20 fps. Rise of the Tomb Raider, meanwhile, is completely unplayable regardless of settings. Dual-channel memory would have probably helped quite a lot here, but either way, the x360 was never meant for gaming to begin with.
| 3DMark | |
| 1280x720 Cloud Gate Standard Graphics | |
| HP Spectre x360 13-w023dx | |
| Dell Inspiron 13 5368 | |
| HP Pavilion x360 13t-u100 | |
| Asus VivoBook Flip TP301UA-DW006T | |
| Lenovo Yoga 3 Pro 13 80HE004LGE | |
| 1920x1080 Fire Strike Graphics | |
| HP Spectre x360 13-w023dx | |
| HP Pavilion x360 13t-u100 | |
| Lenovo Yoga 3 Pro 13 80HE004LGE | |
| 1920x1080 Ice Storm Extreme Graphics | |
| HP Spectre x360 13-w023dx | |
| HP Pavilion x360 13t-u100 | |
| 3DMark 11 Performance | 1523 points | |
| 3DMark Ice Storm Standard Score | 44760 points | |
| 3DMark Cloud Gate Standard Score | 5061 points | |
| 3DMark Fire Strike Score | 653 points | |
Help | ||
| Rise of the Tomb Raider | |
| 1024x768 Lowest Preset (sort by value) | |
| HP Pavilion x360 13t-u100 | |
| HP Spectre x360 13-w023dx | |
| Dell Inspiron 13 5368 | |
| Asus VivoBook Flip TP301UA-DW006T | |
| Lenovo Yoga 3 Pro 13 80HE004LGE | |
| 1366x768 Medium Preset AF:2x (sort by value) | |
| HP Pavilion x360 13t-u100 | |
| HP Spectre x360 13-w023dx | |
| Dell Inspiron 13 5368 | |
| Asus VivoBook Flip TP301UA-DW006T | |
| Lenovo Yoga 3 Pro 13 80HE004LGE | |
| low | med. | high | ultra | |
|---|---|---|---|---|
| BioShock Infinite (2013) | 43 | 25 | 20 | |
| Rise of the Tomb Raider (2016) | 17 | 10 |
Stress Test
During our synthetic stress tests (using Prime95 and FurMark), the Pavilion x360 exceeded expectations. During full CPU stress, the processor managed to stay locked at 3.1 GHz for the entire duration of the test, with stable enough temperatures (76 °C max) that we are comfortable saying that we don’t expect that this would have changed over an even longer term. GPU stress, meanwhile, produced clock rates fluctuating between 950 and 1000 MHz after a short period of time.
Combined stress, of course, was a bit more problematic for the little machine. While the GPU frequencies still maintained the same values, the CPU resigned itself to just 1.6 GHz (below the base clock rate) for the duration of the test. In spite of this, temperatures still never exceeded 68 °C, suggesting that this is a TDP limitation rather than a thermal one.
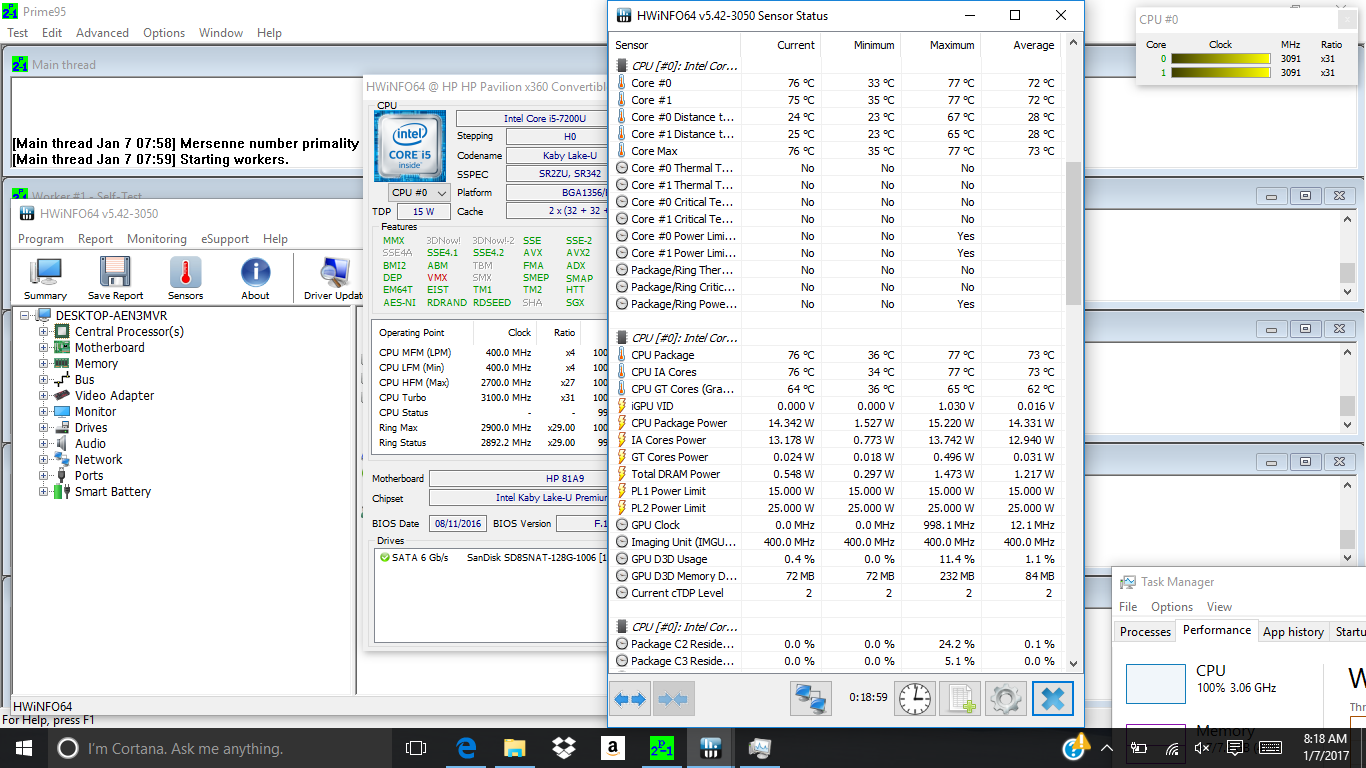
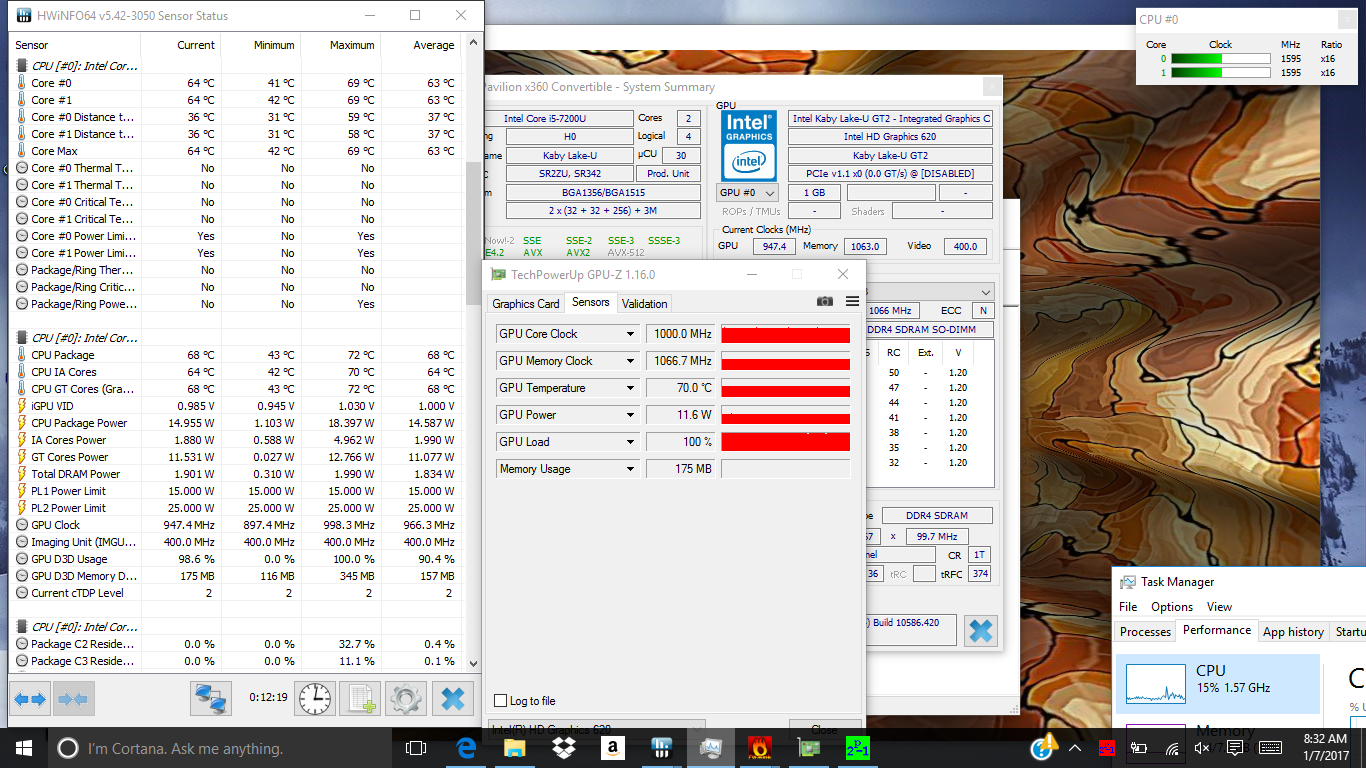
| CPU Clock (GHz) | GPU Clock (MHz) | Average CPU Temperature (°C) | Average GPU Temperature (°C) | |
| Prime95 Stress | 3.1 | - | 76 | - |
| FurMark Stress | - | 950 - 1000 | - | 69 |
| Prime95 + FurMark Stress | 1.6 | 950 - 1000 | 68 | 68 |
Emissions
System Noise
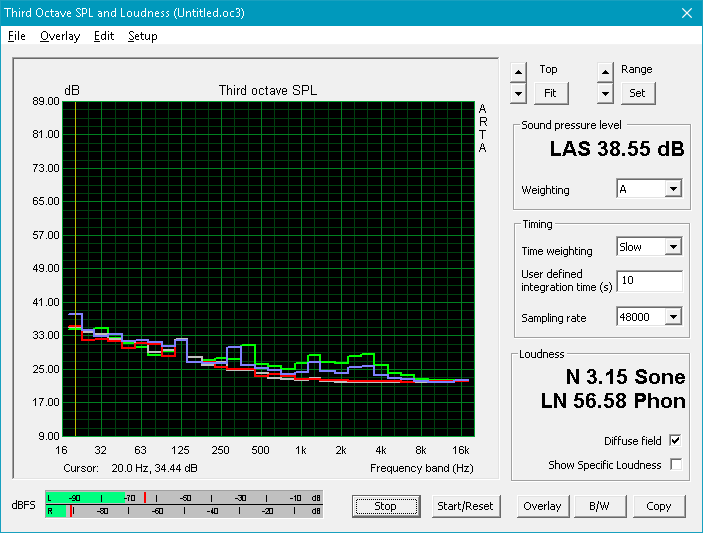
The Pavilion x360’s fan is relatively quiet in most cases, but it does produce a high-pitched whine which can be irritating to some users. Also, at lower fan speeds, there was a very particular rattling noise which almost sounded as though the fan bearings in our particular unit may be going bad. Nevertheless, we’ll chalk the latter symptom up to an idiosyncrasy with our specific test machine, as it very likely is not indicative of a wider problem. An overall load maximum of just 40.3 dB(A) and a median value of only 36 dB(A) are very good results.
Noise level
| Idle |
| 28.9 / 28.9 / 29.2 dB(A) |
| Load |
| 36 / 40.3 dB(A) |
 | ||
30 dB silent 40 dB(A) audible 50 dB(A) loud |
||
min: | ||
| HP Pavilion x360 13t-u100 HD Graphics 620, i5-7200U, SanDisk Z400s SD8SNAT-128G | HP Spectre x360 13-w023dx HD Graphics 620, i7-7500U, Samsung PM951 NVMe MZVLV512 | Dell Inspiron 13 5368 HD Graphics 520, 6500U, Toshiba THNSNK256GCS8 | Asus VivoBook Flip TP301UA-DW006T HD Graphics 520, 6100U, Samsung CM871 MZ7LF128HCHP | Lenovo Yoga 3 Pro 13 80HE004LGE HD Graphics 5300, 5Y70, Samsung SSD PM851 MZNTE512HMJH | |
|---|---|---|---|---|---|
| Noise | -2% | 3% | -3% | -1% | |
| off / environment * (dB) | 28.9 | 29.1 -1% | 29 -0% | 31 -7% | 31.2 -8% |
| Idle Minimum * (dB) | 28.9 | 29.1 -1% | 29 -0% | 31.3 -8% | 31.2 -8% |
| Idle Average * (dB) | 28.9 | 29.1 -1% | 29 -0% | 31.3 -8% | 31.4 -9% |
| Idle Maximum * (dB) | 29.2 | 31.2 -7% | 29 1% | 32.9 -13% | 31.8 -9% |
| Load Average * (dB) | 36 | 37.3 -4% | 31 14% | 35 3% | 32.3 10% |
| Load Maximum * (dB) | 40.3 | 39.6 2% | 40.3 -0% | 34.9 13% | 32 21% |
* ... smaller is better
Temperature
Overall, the Pavilion x360 maintains comfortable temperatures, though there is a particular hot spot in the top center of the underside which reached an uncomfortable 49 °C. Fortunately, even while lap-borne, the user’s legs will not often touch this spot. Average temperatures on top and bottom were just 27.9 °C and 29.6 °C respectively (room temperature 20 °C).
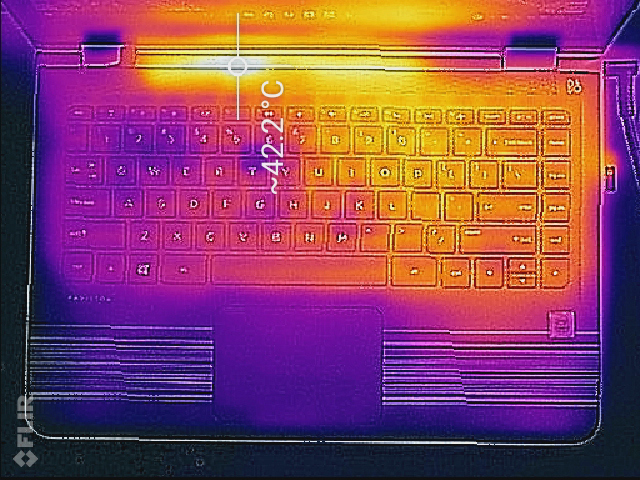
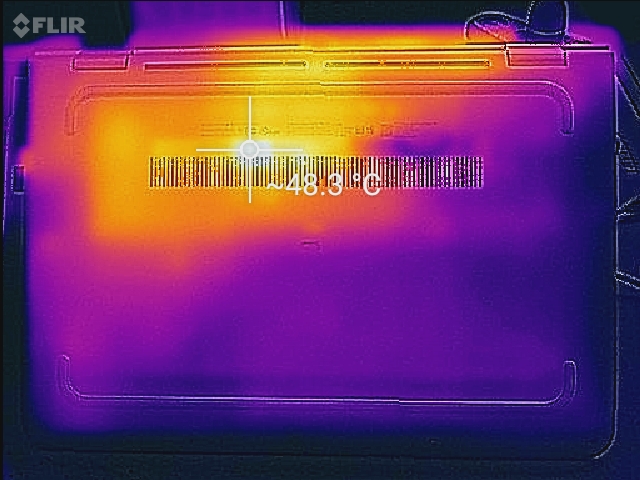
(±) The maximum temperature on the upper side is 42 °C / 108 F, compared to the average of 35.4 °C / 96 F, ranging from 19.6 to 60 °C for the class Convertible.
(-) The bottom heats up to a maximum of 49 °C / 120 F, compared to the average of 36.9 °C / 98 F
(+) In idle usage, the average temperature for the upper side is 22.7 °C / 73 F, compared to the device average of 30.3 °C / 87 F.
(+) The palmrests and touchpad are cooler than skin temperature with a maximum of 22.2 °C / 72 F and are therefore cool to the touch.
(+) The average temperature of the palmrest area of similar devices was 28 °C / 82.4 F (+5.8 °C / 10.4 F).
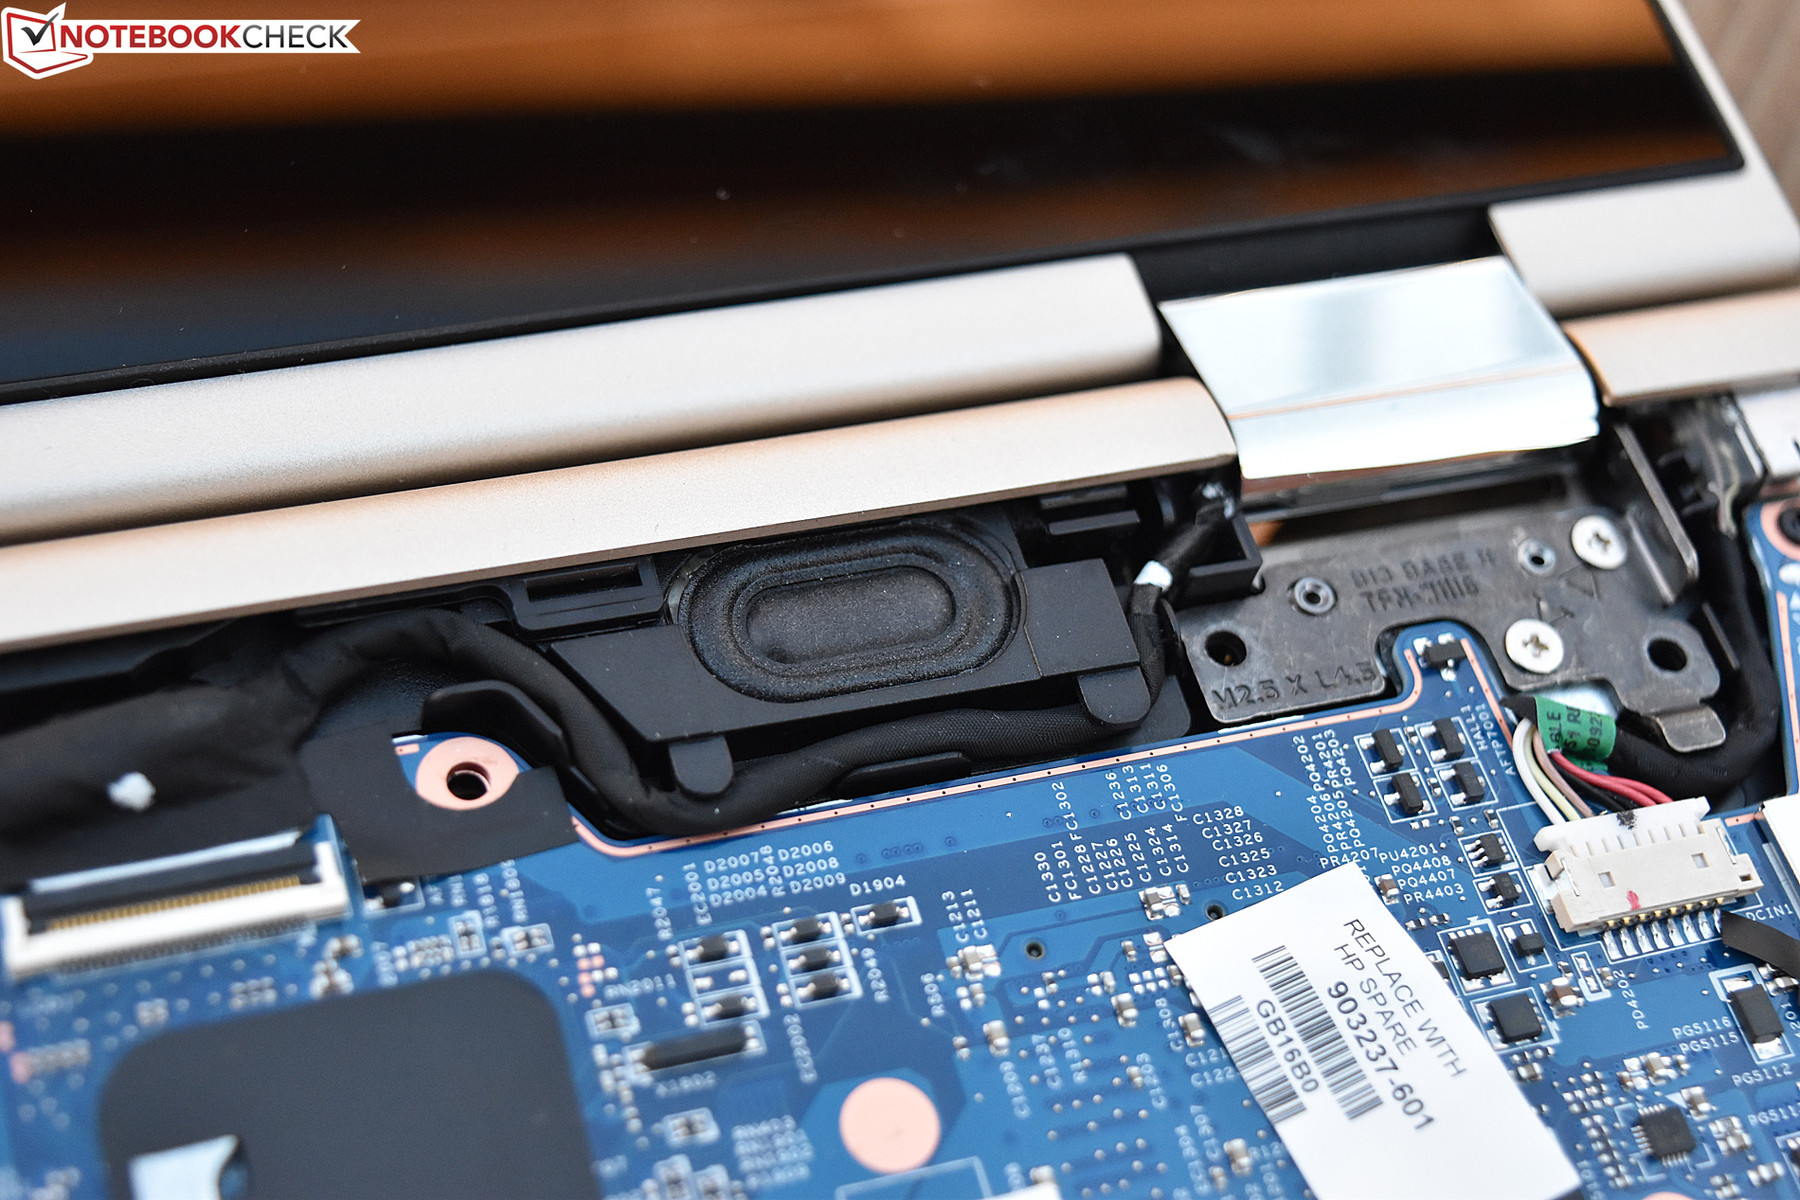
Speakers
The Pavilion x360’s speakers perform squarely within the parameters of the budget category. As usual, we experience essentially no low-frequency reproduction, so those hoping for some bass will need to have an external audio solution handy (speakers or headphones—at least we have Bluetooth support to make that easier). Volume levels are merely average as well—enough to fill a medium-sized room without notable distortion.
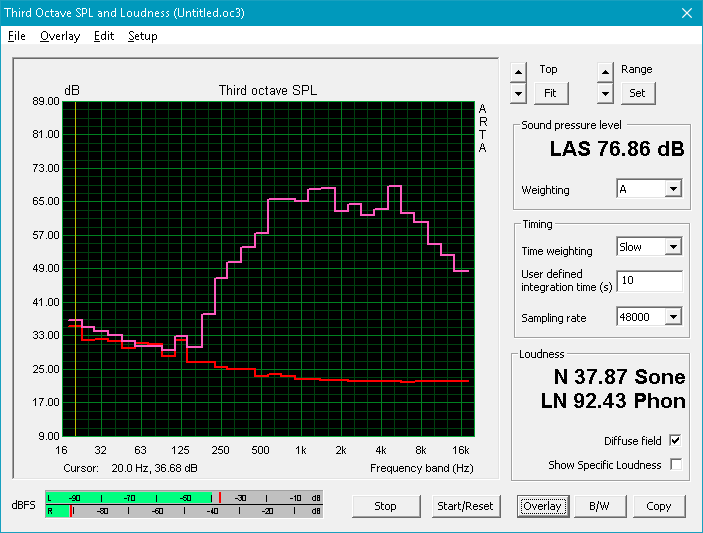
HP Pavilion x360 13t-u100 audio analysis
(±) | speaker loudness is average but good (76.9 dB)
Bass 100 - 315 Hz
(-) | nearly no bass - on average 22.2% lower than median
(±) | linearity of bass is average (11.9% delta to prev. frequency)
Mids 400 - 2000 Hz
(±) | higher mids - on average 5.4% higher than median
(±) | linearity of mids is average (8% delta to prev. frequency)
Highs 2 - 16 kHz
(+) | balanced highs - only 3.6% away from median
(±) | linearity of highs is average (9.6% delta to prev. frequency)
Overall 100 - 16.000 Hz
(±) | linearity of overall sound is average (27.6% difference to median)
Compared to same class
» 84% of all tested devices in this class were better, 3% similar, 13% worse
» The best had a delta of 6%, average was 20%, worst was 57%
Compared to all devices tested
» 84% of all tested devices were better, 3% similar, 13% worse
» The best had a delta of 4%, average was 23%, worst was 134%
HP Spectre x360 13-w023dx audio analysis
(±) | speaker loudness is average but good (76.2 dB)
Bass 100 - 315 Hz
(-) | nearly no bass - on average 17% lower than median
(±) | linearity of bass is average (12.7% delta to prev. frequency)
Mids 400 - 2000 Hz
(+) | balanced mids - only 3.7% away from median
(+) | mids are linear (6.3% delta to prev. frequency)
Highs 2 - 16 kHz
(+) | balanced highs - only 2.4% away from median
(±) | linearity of highs is average (7.2% delta to prev. frequency)
Overall 100 - 16.000 Hz
(±) | linearity of overall sound is average (21.9% difference to median)
Compared to same class
» 63% of all tested devices in this class were better, 7% similar, 30% worse
» The best had a delta of 6%, average was 20%, worst was 57%
Compared to all devices tested
» 63% of all tested devices were better, 7% similar, 30% worse
» The best had a delta of 4%, average was 23%, worst was 134%
Frequency Comparison (Checkbox selectable!)
Graph 1: Pink Noise 100% Vol.; Graph 2: Audio off
Energy Management
Power Consumption
Thanks in part to its low-resolution display panel, the Pavilion x360 is relatively energy efficient. The Idle Average we measured was just 6 W, which is below all of the machines in our comparison field apart from the Asus VivoBook (the VivoBook does feature a 1080p panel, but it also uses TN LED technology versus IPS, which is more power efficient).
| Off / Standby | |
| Idle | |
| Load |
|
Key:
min: | |
| HP Pavilion x360 13t-u100 i5-7200U, HD Graphics 620, SanDisk Z400s SD8SNAT-128G, IPS, 1366x768, 13.3" | HP Spectre x360 13-w023dx i7-7500U, HD Graphics 620, Samsung PM951 NVMe MZVLV512, IPS, 1920x1080, 13.3" | Dell Inspiron 13 5368 6500U, HD Graphics 520, Toshiba THNSNK256GCS8, IPS, 1920x1080, 13.3" | Asus VivoBook Flip TP301UA-DW006T 6100U, HD Graphics 520, Samsung CM871 MZ7LF128HCHP, TN, 1920x1080, 13.3" | Lenovo Yoga 3 Pro 13 80HE004LGE 5Y70, HD Graphics 5300, Samsung SSD PM851 MZNTE512HMJH, IPS, 3200x1800, 13.3" | |
|---|---|---|---|---|---|
| Power Consumption | -25% | -11% | 7% | -25% | |
| Idle Minimum * (Watt) | 3.7 | 5.5 -49% | 4.4 -19% | 2.95 20% | 4.8 -30% |
| Idle Average * (Watt) | 6 | 6.7 -12% | 6.1 -2% | 5.6 7% | 10.7 -78% |
| Idle Maximum * (Watt) | 6.9 | 7.1 -3% | 6.8 1% | 7.7 -12% | 11.8 -71% |
| Load Average * (Watt) | 23.4 | 33.1 -41% | 29 -24% | 22.6 3% | 18.3 22% |
| Load Maximum * (Watt) | 28.8 | 35.2 -22% | 31.9 -11% | 23.5 18% | 19.7 32% |
* ... smaller is better
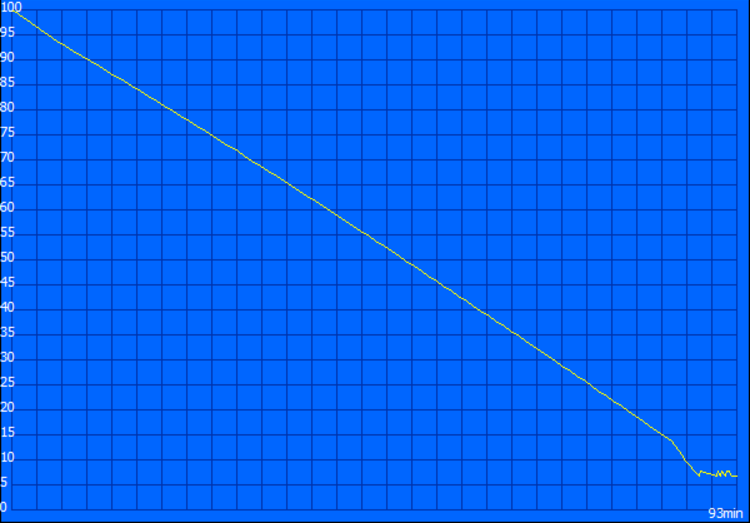
Battery Life
We’d expect battery runtimes on the Pavilion x360 to be somewhat of a challenge thanks to the rather small 43 Wh internal battery which is supplied with the machine. By comparison, the Spectre x360 13 packs a 57.8 Wh battery, and it sees correspondingly higher runtimes (roughly 37% higher overall—and the battery is 34.4% larger). However, the Dell Inspiron 13 5368 sees much shorter life per charge overall in spite of a nearly identical battery size (42 Wh), and the Asus VivoBook inexplicably performs far worse in our realistic Wi-Fi surfing benchmark (27% shorter runtime) even despite its 55 Wh battery.
In the aforementioned Wi-Fi Surfing test, which is perhaps the most applicable of all of the battery benchmarks we perform, the Pavilion x360 records 6 hours and 37 minutes of life—practically-speaking, a very usable performance, even though when taking into account its low-resolution screen we could potentially hope for quite a bit more. Again, from the perspective of the average user simply looking for an affordable but well-rounded budget convertible, the Pavilion x360 gets the job done well enough.
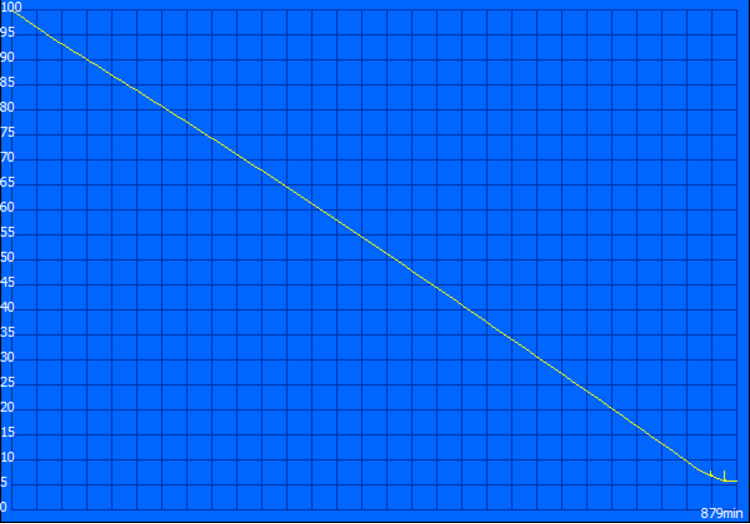
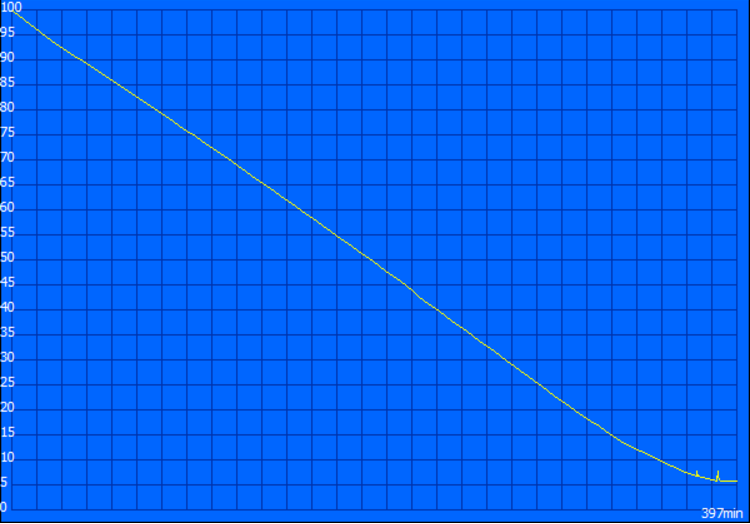
| HP Pavilion x360 13t-u100 i5-7200U, HD Graphics 620, 43 Wh | HP Spectre x360 13-w023dx i7-7500U, HD Graphics 620, 57.8 Wh | Dell Inspiron 13 5368 6500U, HD Graphics 520, 42 Wh | Asus VivoBook Flip TP301UA-DW006T 6100U, HD Graphics 520, 55 Wh | Lenovo Yoga 3 Pro 13 80HE004LGE 5Y70, HD Graphics 5300, 44 Wh | |
|---|---|---|---|---|---|
| Battery runtime | 35% | -25% | 39% | -33% | |
| Reader / Idle (h) | 14.7 | 20.6 40% | 11.2 -24% | 21 43% | |
| WiFi v1.3 (h) | 6.6 | 9.3 41% | 4 -39% | 4.8 -27% | 4.4 -33% |
| Load (h) | 1.6 | 2 25% | 1.4 -13% | 3.2 100% |
Pros
Cons
Verdict

The Pavilion x360 13t-u100 is a solid machine for a particular target user, but it is not without its compromises. Specifically, it’s worth considering for anyone not terribly concerned with case quality and durability, flexible maintenance and upgrades, or high-end Ultrabook-grade amenities (such as 1080p+ resolution screens, NVMe storage, and exceptionally long battery life). There are other significant shortcomings as well, such as the subpar wireless connectivity and the lack of an Ethernet alternative. It’s hardly the complete package, but again, that’s not what anyone should be expecting, especially for this price (currently $665 at Amazon).
But what you do get for that price is great CPU performance (from a Kaby Lake Core i5 in this case) without throttling, reasonable case temperatures and noise levels (apart from a conspicuously high-pitched fan), solid-state storage, and plenty of RAM for general use—all part of a somewhat practical convertible with manageable weight and size (especially as compared to the 15.6-inch Envy x360 we reviewed last month). So ultimately, those in the market for a no-frills convertible for general use but who are still savvy enough to appreciate the speed and reliability offered by an SSD may see some value here.
HP Pavilion x360 13t-u100
- 01/08/2017 v6 (old)
Steve Schardein
Price comparison
