Notebookcheck Logo

Intel SSD 600p 512 GB Review: The Entry-Level NVMe SSD

Faster than SATA? In our review, the Intel SSD 600p with 512 GB must prove itself against the competition. You will find out in this test report, how the entry-level NVMe-m.2-SSD with SM2260 controller fares.

For the original German review, see here.

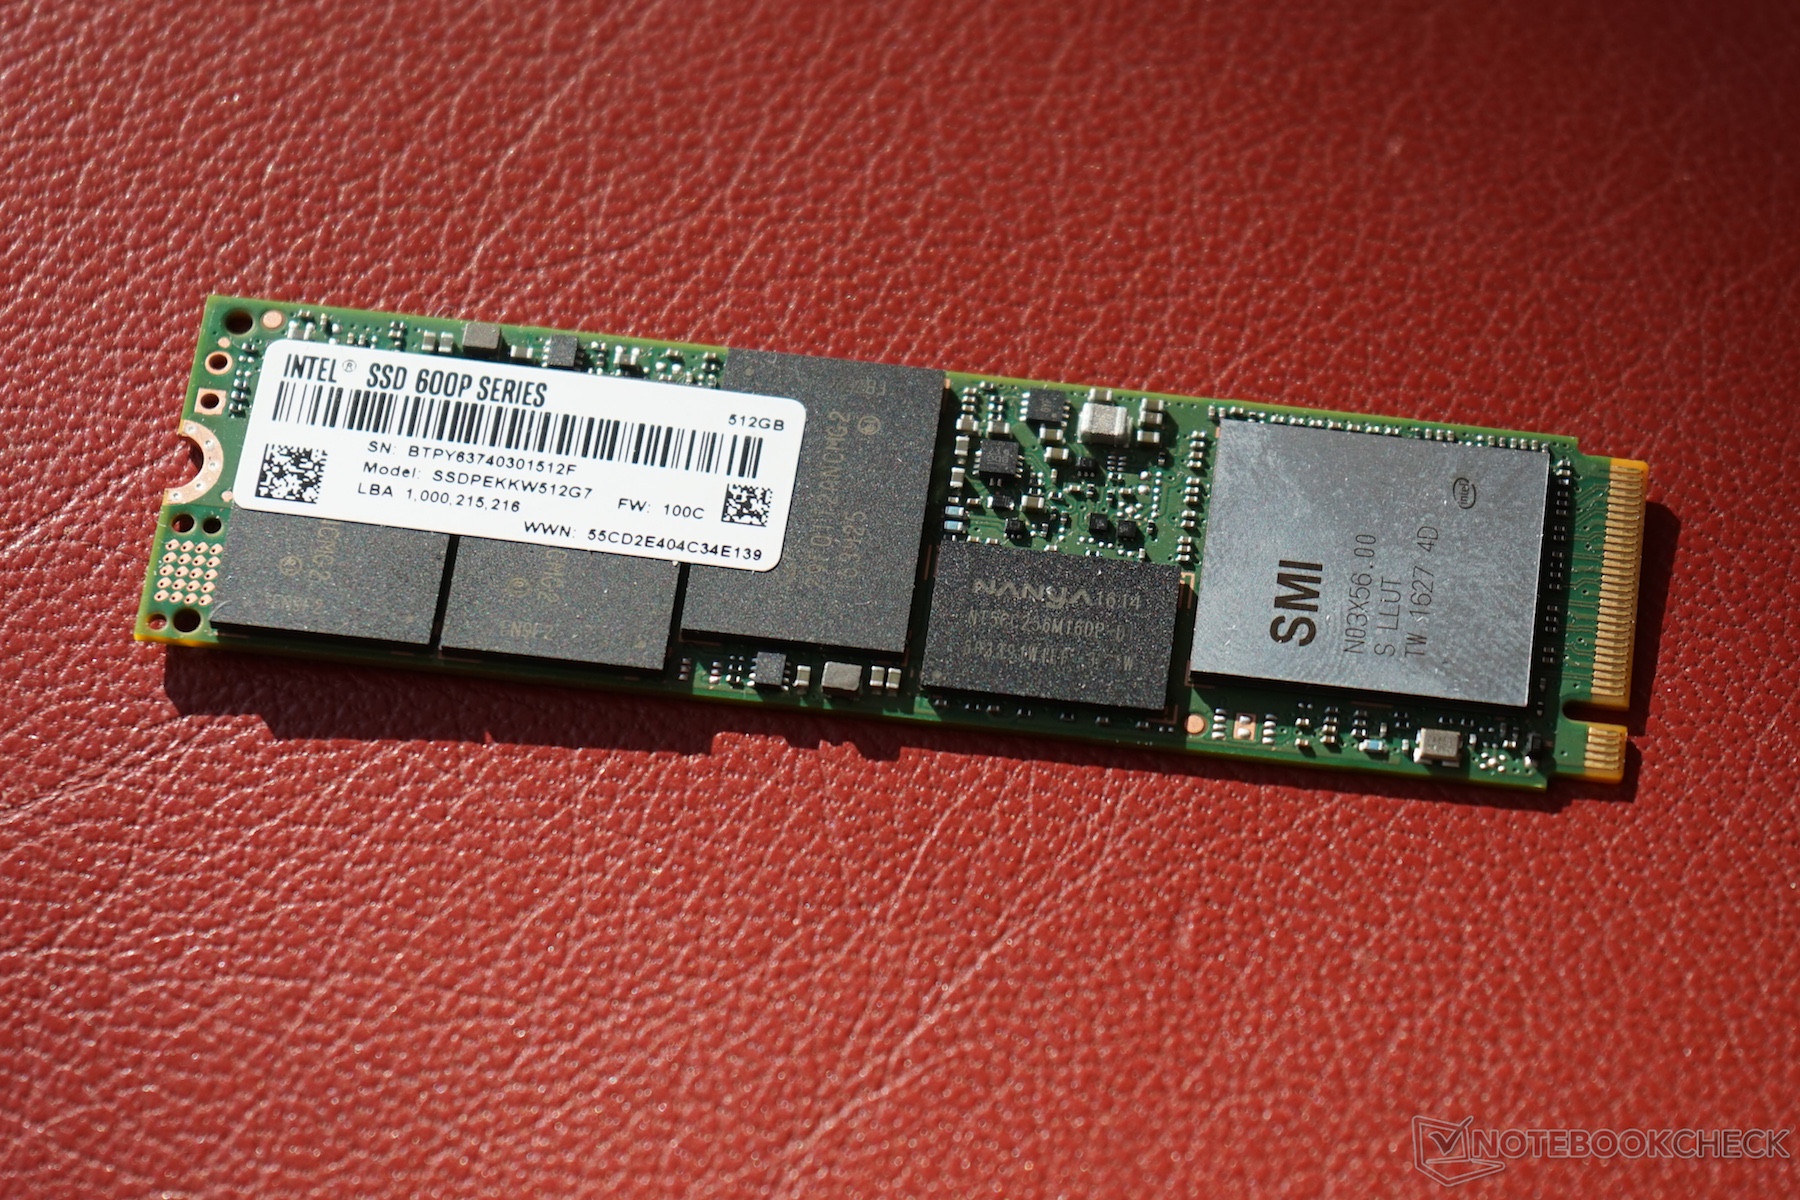
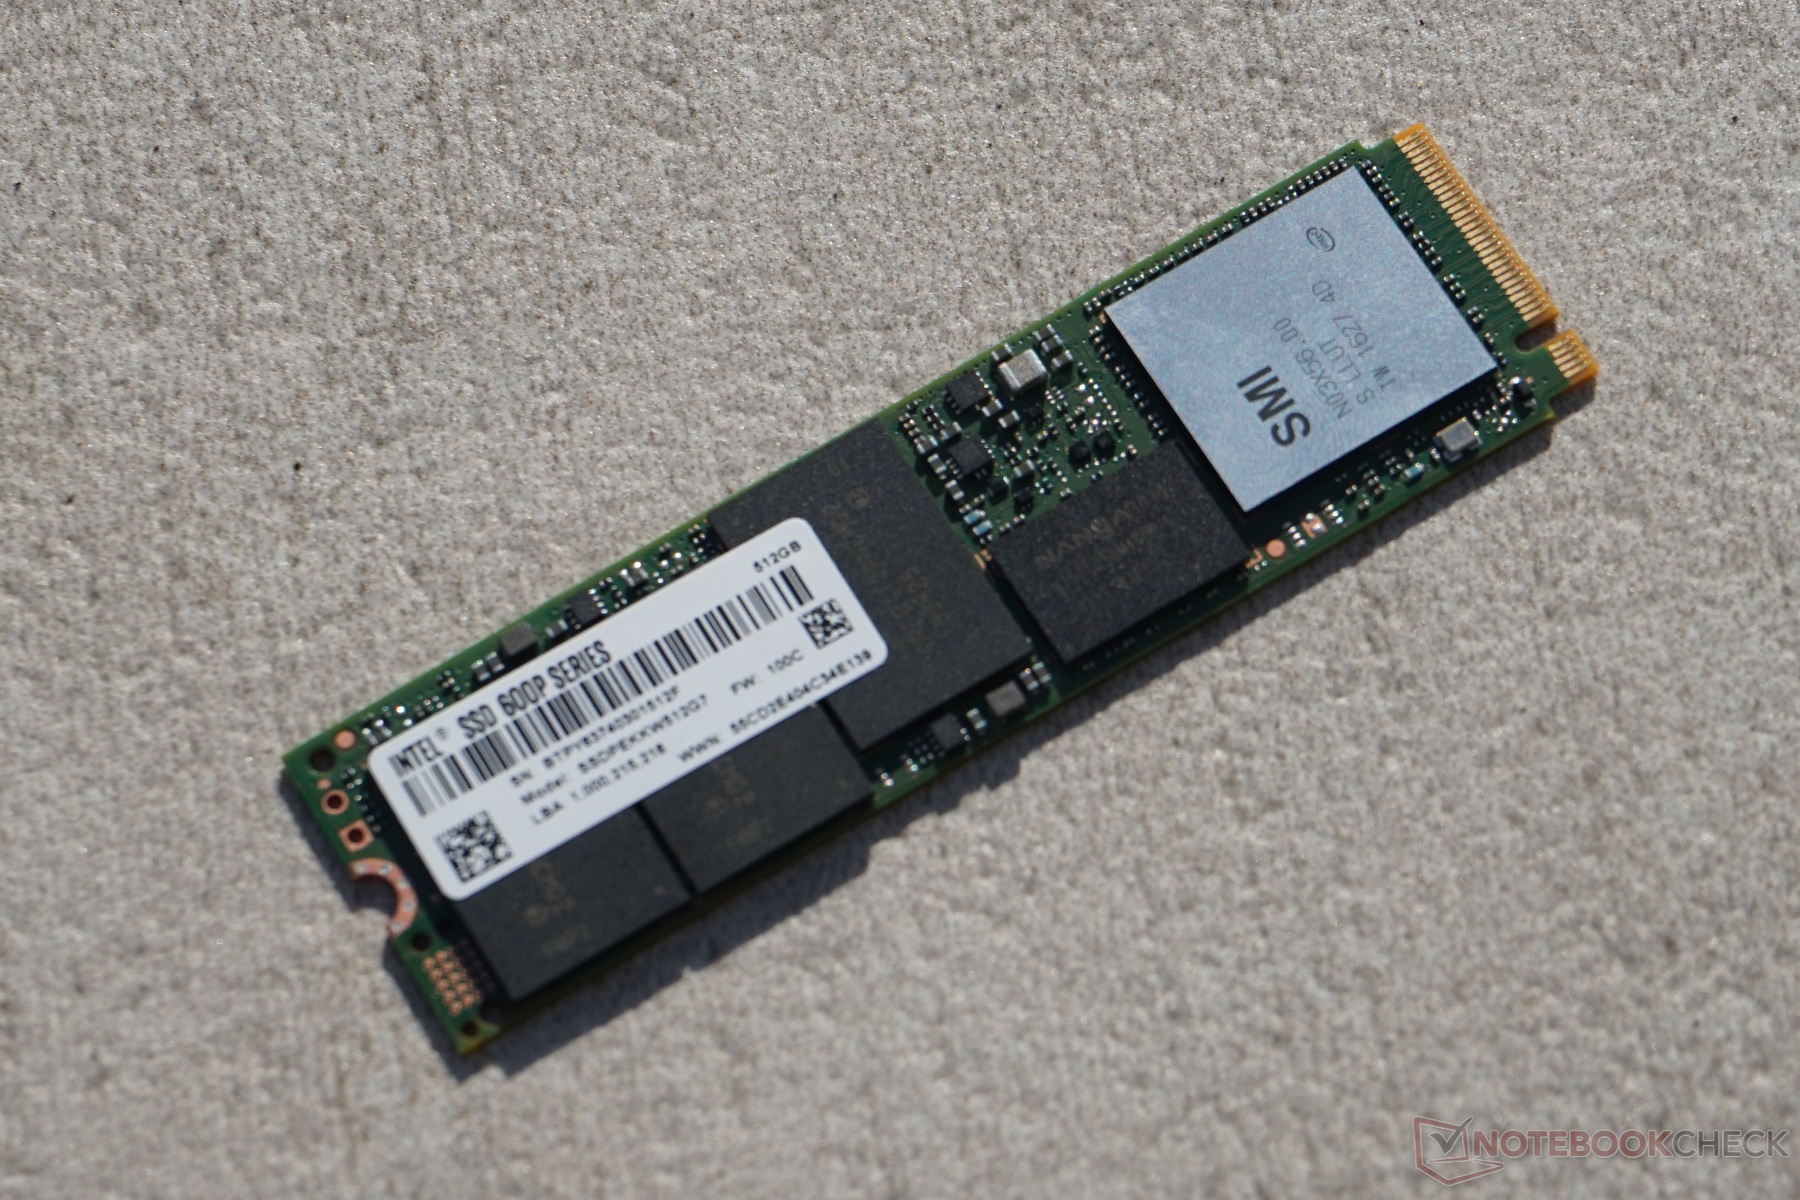
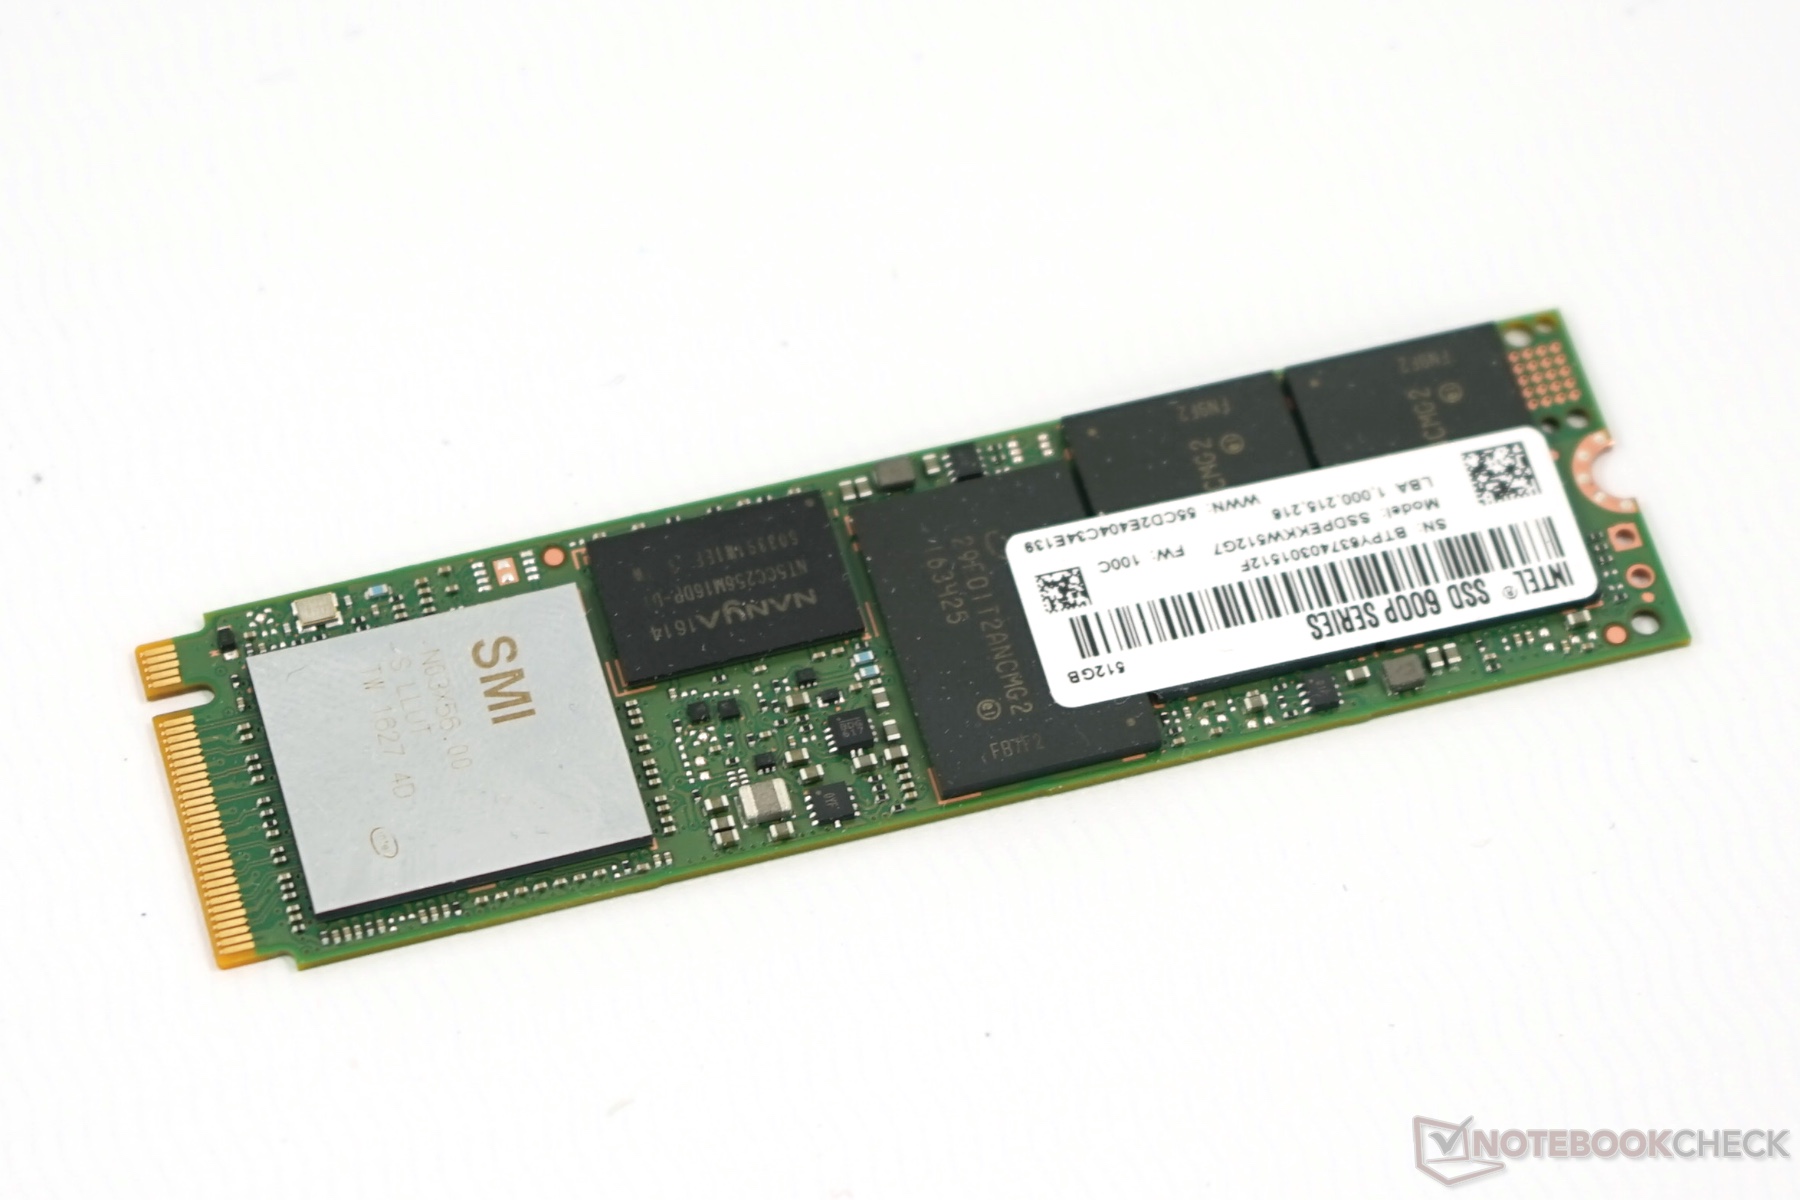
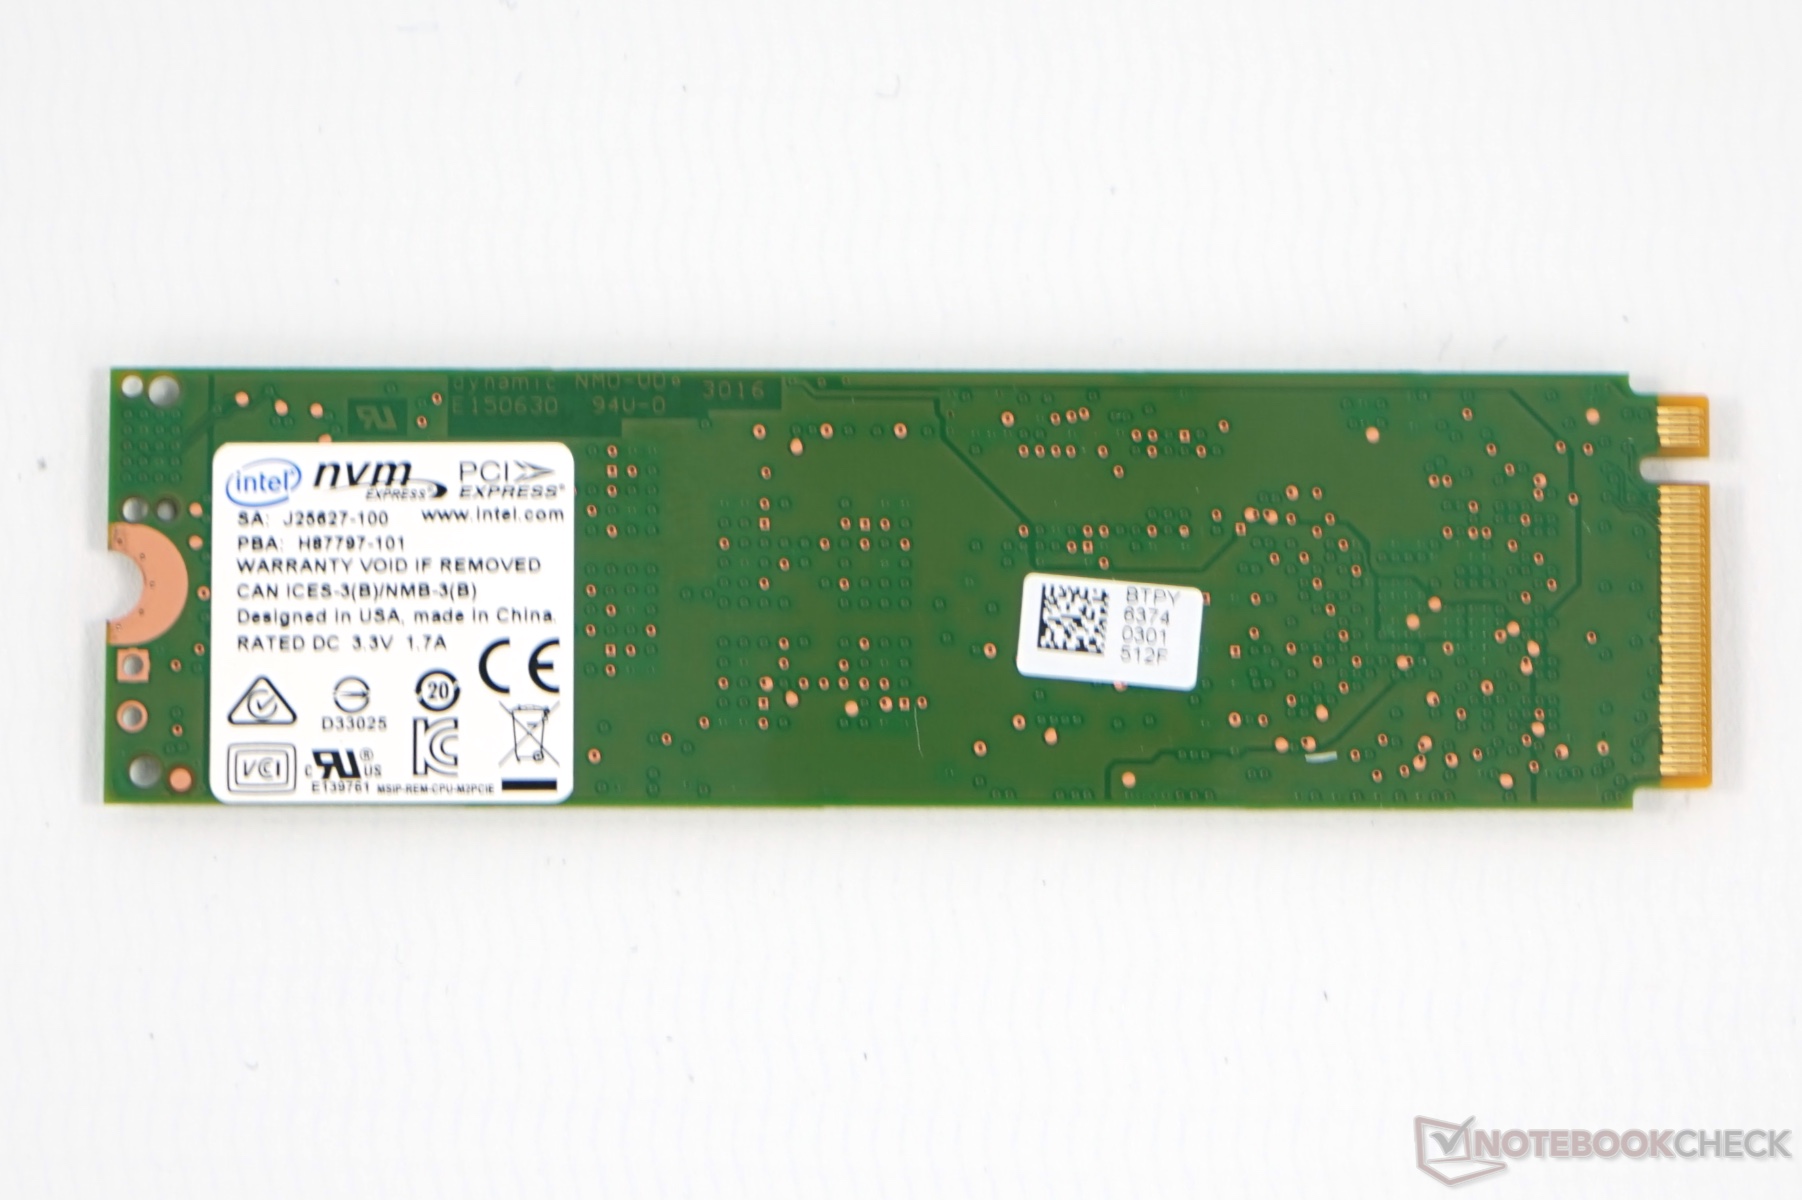
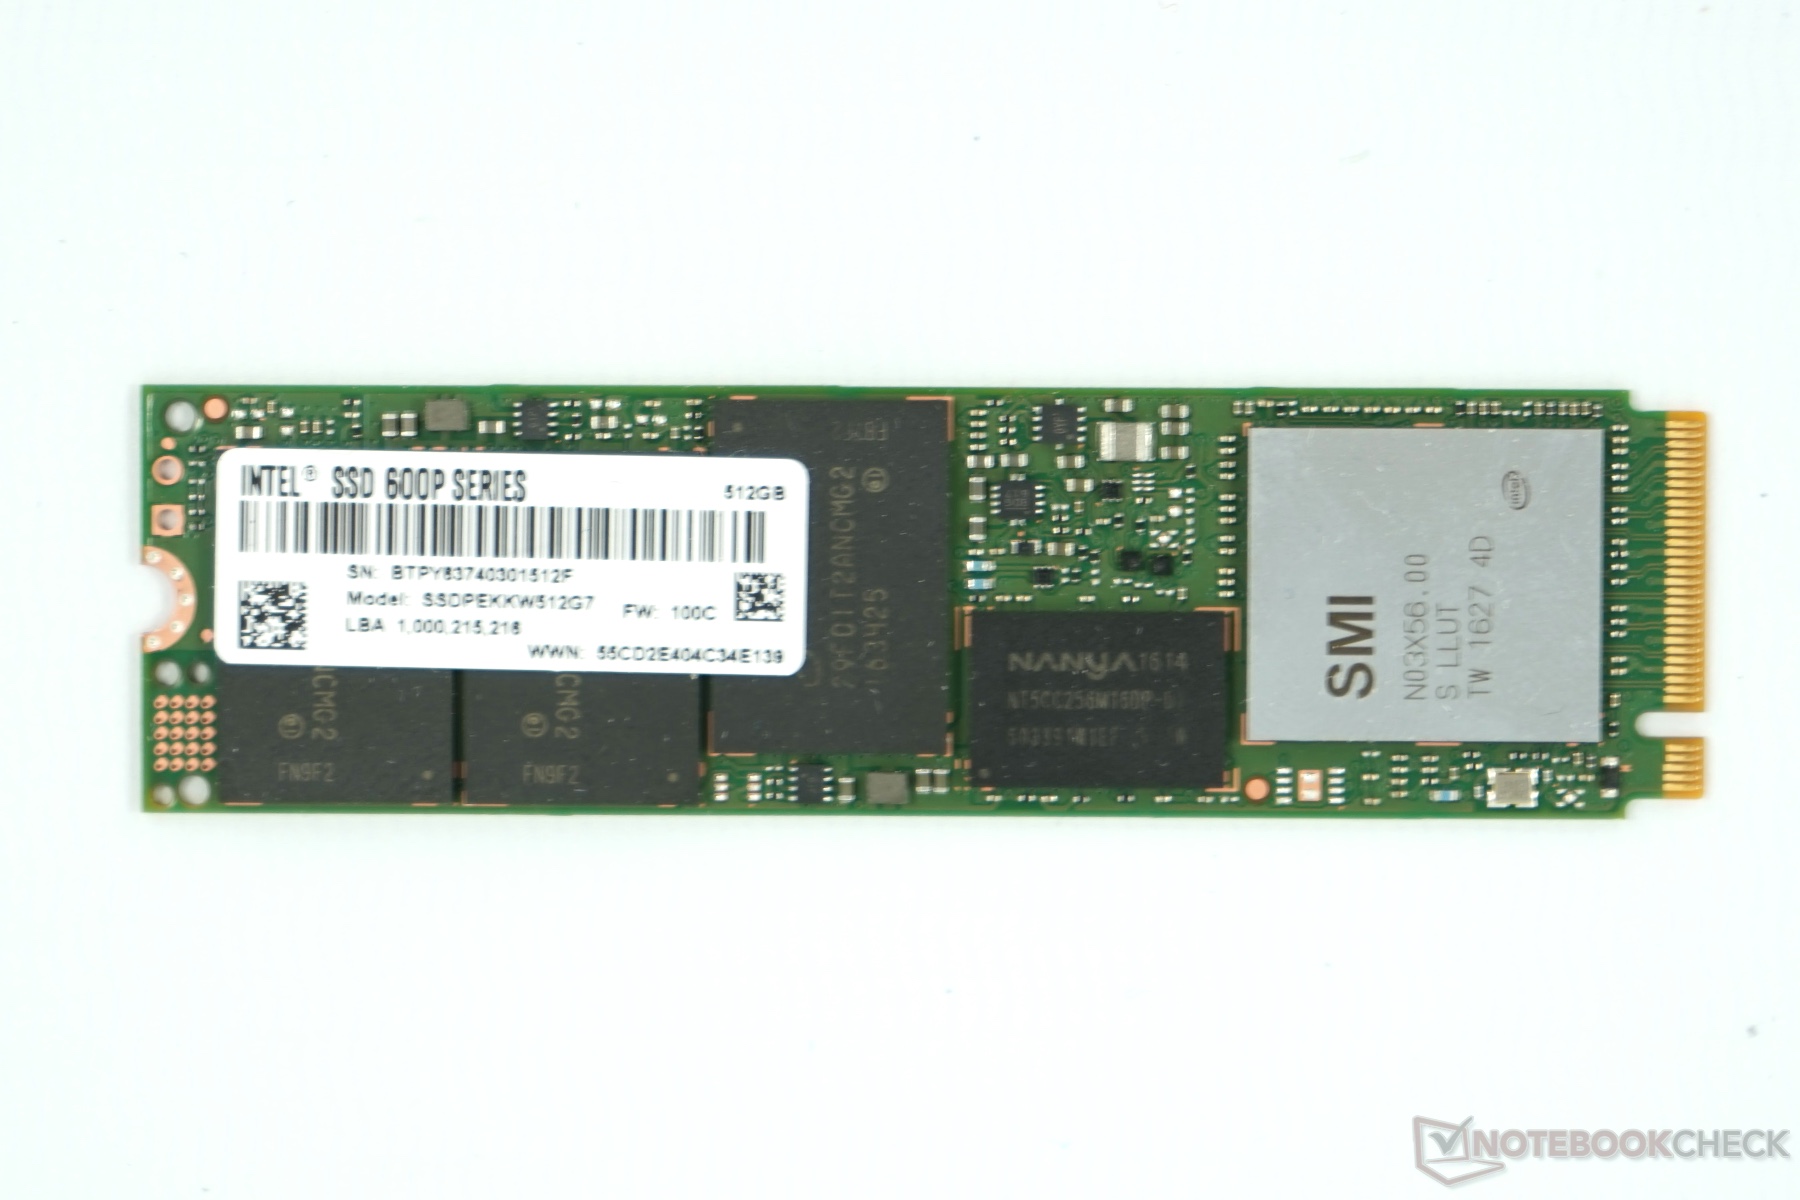
As an entry into the PCI Express 3.0 x4 SSD world, Intel introduced the SSD 600p Series in the summer of 2016. Unlike the 750 Series, the 600p is supposed to represent an affordable NVMe SSD. The 600p has the form factor M.2 2280 and uses a Silicone Motion SM2260 controller in connection with 3D NAND TLC Toggle by IMFT. The controller offers 8 NAND Channel and uses a 512 MB DDR3L 1600 cache. Currently, there are currently four variations ranging from 128 to 1024 GB, which differ slightly in terms of performance data. However, the data rates are considerably smaller in the 128 GB version. The data can be encrypted via AES 256 and the chip supports NCQ and TRIM. Intel offers a five-year warranty on the retail version (SSDPEKKW512G7). According to Intel, the power consumption is very small and is stated as 100 mW during operation and only 40 mW while idling. This clearly distinguishes it from more powerful SSDs such as the Samsung SSD 960 EVO 500 GB, which for example is specified as using 5.4 watts during operation.

Currently, the street price of the Intel SSD 600p with 512 GB ranges between 175 and 188 Euros (~$184 to $197). This makes it by far the most affordable M.2 PCle SSD on the market. It is currently followed by the WD Black SSD 512 GB, the Intel SSD Pro 6000p, and the Samsung SSD PM951 starting from 212 Euros (~$223).

Test Systems

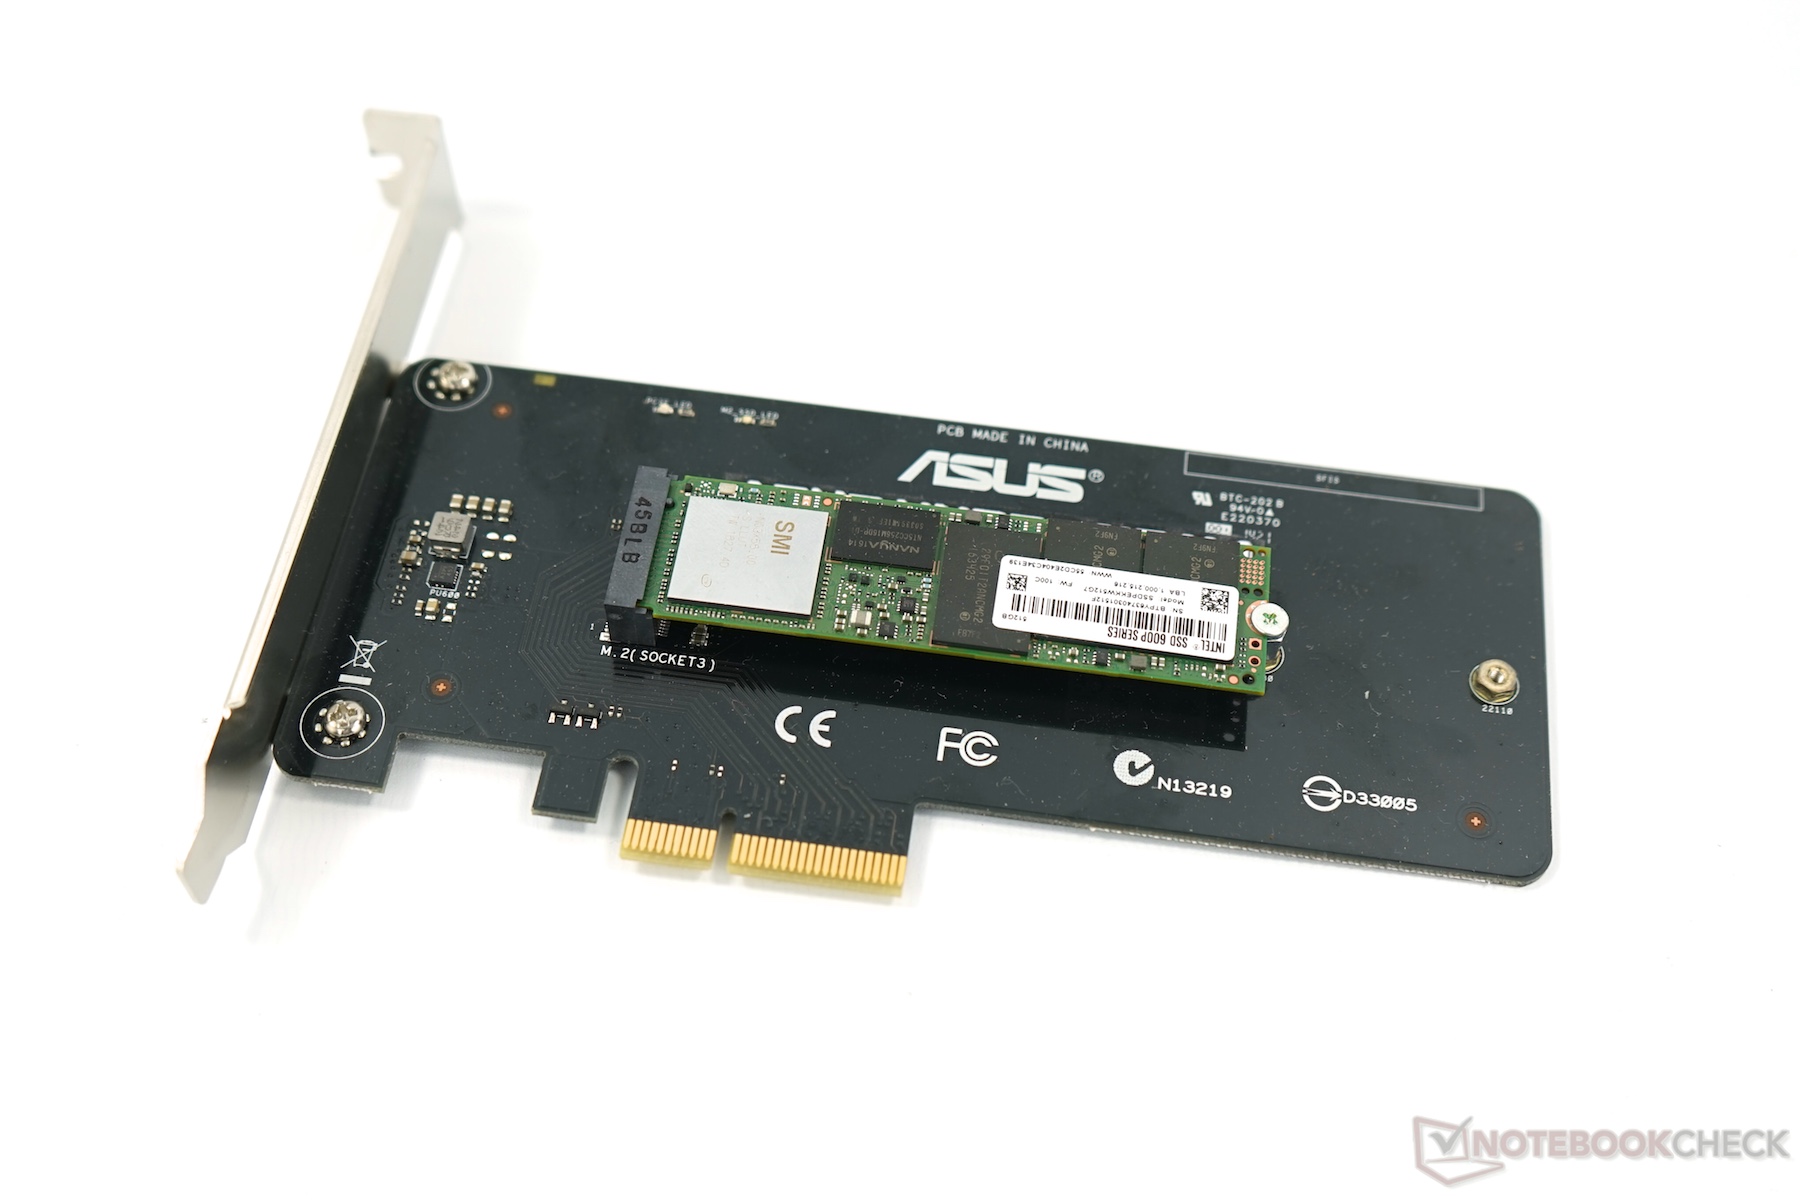
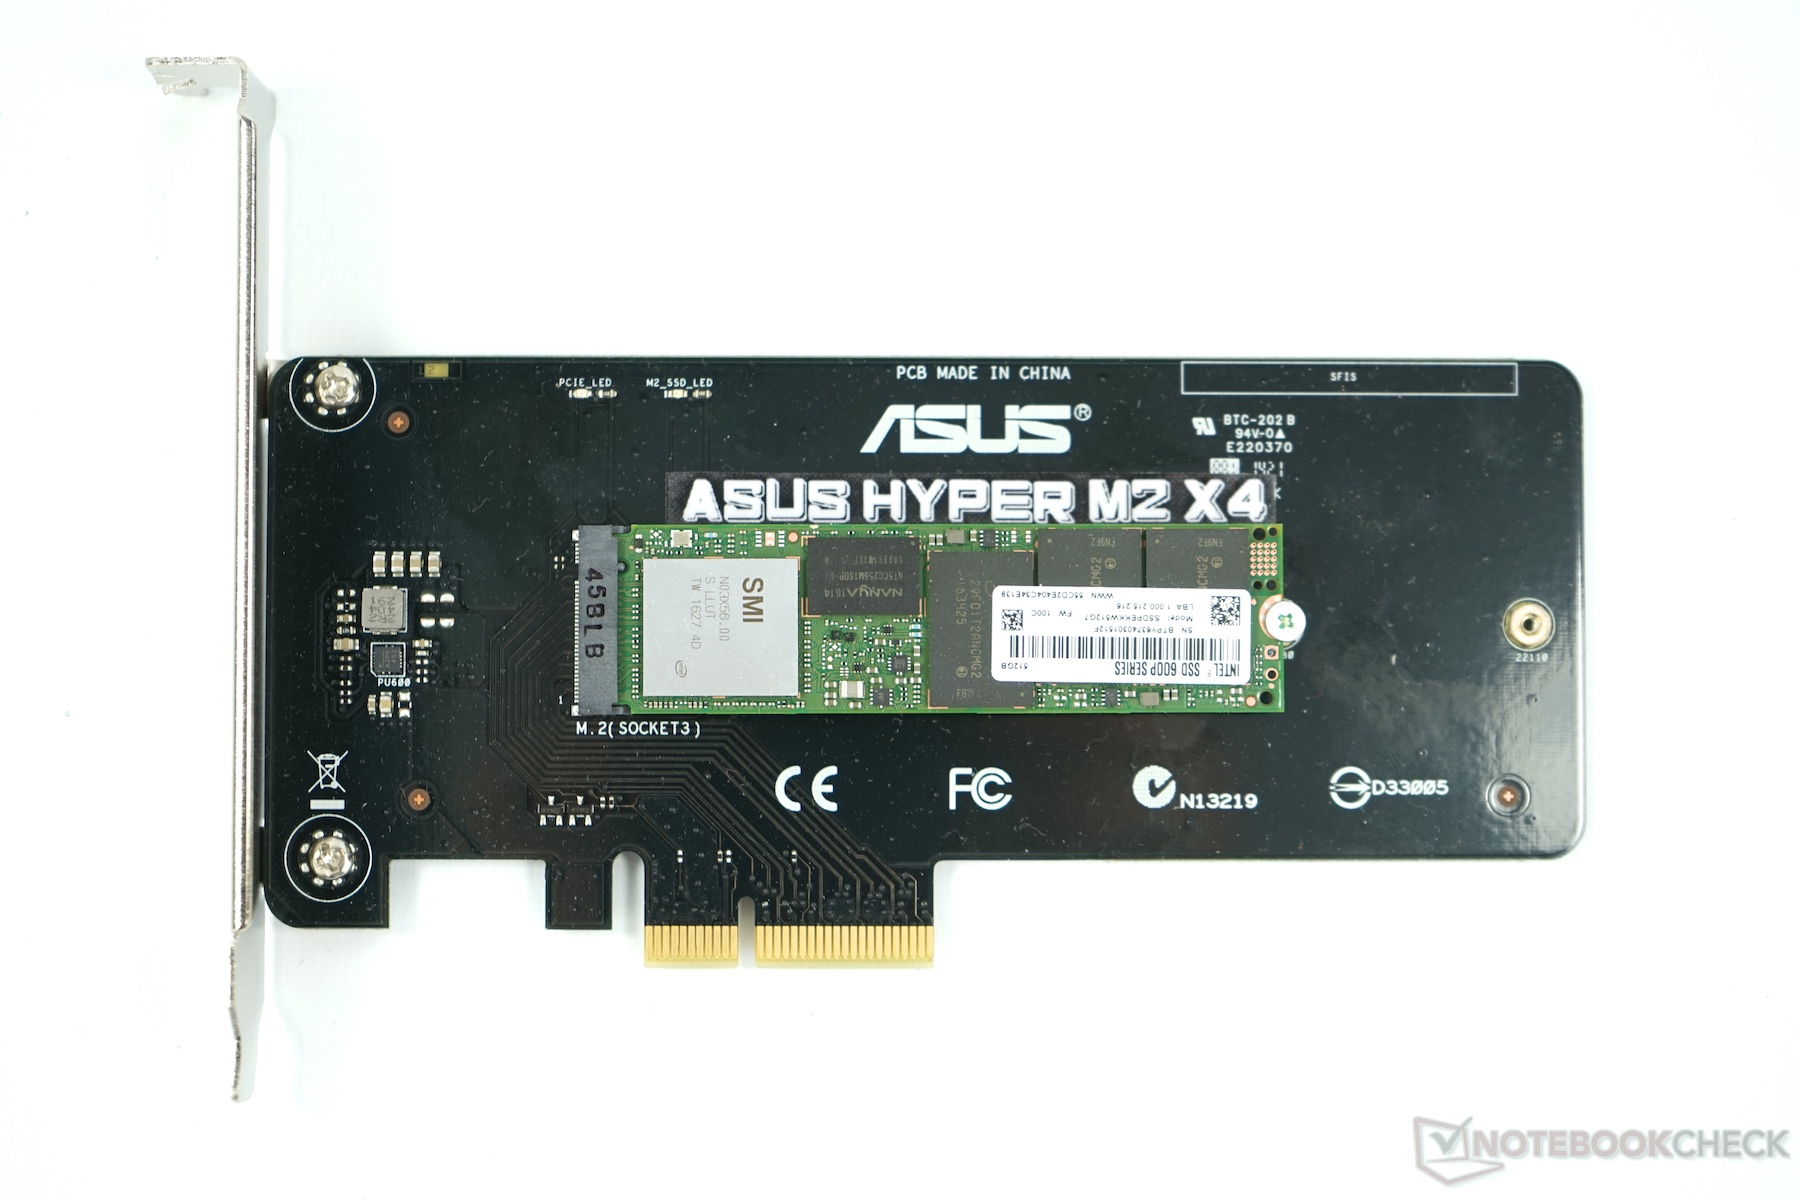
We tested the SSD using two desktop systems: a current Ryzen 1800X with an Asus Crosshair VI Hero motherboard and 16 GB of DDR4-3000 RAM, and an Intel Core i7-4790K in the Asus Z97 Deluxe (with Asus Hyper M2 X4 PCIe card for the M.2 connection) and 16 GB of DDR3-1600 RAM. For comparison we used some selected SSDs from notebooks we had tested. The test systems are linked in the charts. 

Sequential performance suits the 600p

In the sequential benchmarks the 600p comes in slightly ahead of the fastest SATA SSDs, mainly due to the good rates of sequential reads, which are not limited by SATA 3. Fast high-end NVMe SSDs such as the Samsung 960 Pro, however, play in a different league. Here, a more likely sparring partner is the Toshiba XG4 NVMe. 

Performance Rating - Percent
Samsung SSD 960 Pro 1TB m.2 NVMe
Samsung 960 Pro 1TB
99.3 pt
Samsung SSD 960 Pro 512 GB m.2
Eurocom Tornado F5
92 pt
Samsung SSD 950 Pro 512GB m.2 NVMe -2!
SCHENKER XMG U727
81.9 pt
Samsung SSD 960 Evo 500GB m.2 NVMe
SCHENKER XMG U507 2017
79.7 pt
Samsung PM961 NVMe MZVLW512HMJP -2!
Lenovo IdeaPad 710S Plus-13IKB
67.4 pt
Toshiba XG4 NVMe (THNSN5512GPUK)
HP Spectre x360 15-bl002xx
40.8 pt
Intel SSD 600p SSDPEKKW512G7
Nvidia GeForce GTX 1080 Ti Founders Edition Asus Crosshair VI Hero
38.6 pt
Intel SSD 600p SSDPEKKW512G7 -2!
Asus Z97-Deluxe, Asus Hyper M2 X4
38.5 pt
Samsung SSD 850 PRO 1TB
Eurocom X8
21.9 pt
Samsung SSD 850 EVO M.2 250 GB
MIFcom EG7
20.9 pt
CrystalDiskMark 3.0
Read Seq
Samsung SSD 960 Pro 1TB m.2 NVMe
Samsung 960 Pro 1TB
2452 MB/s +118%
Samsung SSD 950 Pro 512GB m.2 NVMe
SCHENKER XMG U727
2257 MB/s +100%
Samsung SSD 960 Pro 512 GB m.2
Eurocom Tornado F5
2145 MB/s +90%
Samsung SSD 960 Evo 500GB m.2 NVMe
SCHENKER XMG U507 2017
1665 MB/s +48%
Samsung PM961 NVMe MZVLW512HMJP
Lenovo IdeaPad 710S Plus-13IKB
1577 MB/s +40%
Toshiba XG4 NVMe (THNSN5512GPUK)
HP Spectre x360 15-bl002xx
1266 MB/s +12%
Intel SSD 600p SSDPEKKW512G7
Nvidia GeForce GTX 1080 Ti Founders Edition Asus Crosshair VI Hero
1127 MB/s
Samsung SSD 850 PRO 1TB
Eurocom X8
528 MB/s -53%
Samsung SSD 850 EVO M.2 250 GB
MIFcom EG7
502 MB/s -55%
Write Seq
Samsung SSD 960 Pro 1TB m.2 NVMe
Samsung 960 Pro 1TB
2087 MB/s +270%
Samsung SSD 960 Pro 512 GB m.2
Eurocom Tornado F5
1724 MB/s +206%
Samsung SSD 960 Evo 500GB m.2 NVMe
SCHENKER XMG U507 2017
1671 MB/s +196%
Samsung SSD 950 Pro 512GB m.2 NVMe
SCHENKER XMG U727
1499 MB/s +166%
Samsung PM961 NVMe MZVLW512HMJP
Lenovo IdeaPad 710S Plus-13IKB
1472 MB/s +161%
Toshiba XG4 NVMe (THNSN5512GPUK)
HP Spectre x360 15-bl002xx
982 MB/s +74%
Intel SSD 600p SSDPEKKW512G7
Nvidia GeForce GTX 1080 Ti Founders Edition Asus Crosshair VI Hero
564 MB/s
Samsung SSD 850 PRO 1TB
Eurocom X8
494 MB/s -12%
Samsung SSD 850 EVO M.2 250 GB
MIFcom EG7
455.6 MB/s -19%
AS SSD
Seq Read
Samsung SSD 960 Pro 512 GB m.2
Eurocom Tornado F5
2819 MB/s +80%
Samsung SSD 960 Pro 1TB m.2 NVMe
Samsung 960 Pro 1TB
2738 MB/s +75%
Samsung SSD 960 Evo 500GB m.2 NVMe
SCHENKER XMG U507 2017
2634 MB/s +69%
Toshiba XG4 NVMe (THNSN5512GPUK)
HP Spectre x360 15-bl002xx
1599 MB/s +2%
Intel SSD 600p SSDPEKKW512G7
Nvidia GeForce GTX 1080 Ti Founders Edition Asus Crosshair VI Hero
1563 MB/s
Intel SSD 600p SSDPEKKW512G7
Asus Z97-Deluxe, Asus Hyper M2 X4
1454 MB/s -7%
Samsung SSD 850 PRO 1TB
Eurocom X8
526 MB/s -66%
Samsung SSD 850 EVO M.2 250 GB
MIFcom EG7
510 MB/s -67%
Seq Write
Samsung SSD 960 Pro 1TB m.2 NVMe
Samsung 960 Pro 1TB
2092 MB/s +287%
Samsung SSD 960 Pro 512 GB m.2
Eurocom Tornado F5
2046 MB/s +278%
Samsung SSD 960 Evo 500GB m.2 NVMe
SCHENKER XMG U507 2017
1621 MB/s +200%
Intel SSD 600p SSDPEKKW512G7
Nvidia GeForce GTX 1080 Ti Founders Edition Asus Crosshair VI Hero
541 MB/s
Intel SSD 600p SSDPEKKW512G7
Asus Z97-Deluxe, Asus Hyper M2 X4
531 MB/s -2%
Samsung SSD 850 PRO 1TB
Eurocom X8
496 MB/s -8%
Samsung SSD 850 EVO M.2 250 GB
MIFcom EG7
488.6 MB/s -10%
Toshiba XG4 NVMe (THNSN5512GPUK)
HP Spectre x360 15-bl002xx
160.4 MB/s -70%

4K Tests - Rather Average

The Intel SSD 600p shows less strength in the 4K tests. Fast SATA SSDs like the Samsung SSD 850 Series are not restricted by the protocol and as a result show their capabilities. 

Performance Rating - Percent
Samsung SSD 960 Evo 500GB m.2 NVMe
SCHENKER XMG U507 2017
99.1 pt
Samsung SSD 960 Pro 512 GB m.2
Eurocom Tornado F5
91.8 pt
Samsung SSD 950 Pro 512GB m.2 NVMe -2!
SCHENKER XMG U727
86.1 pt
Samsung PM961 NVMe MZVLW512HMJP -2!
Lenovo IdeaPad 710S Plus-13IKB
76.4 pt
Intel SSD 600p SSDPEKKW512G7 -2!
Asus Z97-Deluxe, Asus Hyper M2 X4
61.9 pt
Samsung SSD 850 PRO 1TB
Eurocom X8
61.5 pt
Samsung SSD 850 EVO M.2 250 GB
MIFcom EG7
55.7 pt
Toshiba XG4 NVMe (THNSN5512GPUK)
HP Spectre x360 15-bl002xx
51.9 pt
Samsung SSD 960 Pro 1TB m.2 NVMe
Samsung 960 Pro 1TB
48.2 pt
Intel SSD 600p SSDPEKKW512G7
Nvidia GeForce GTX 1080 Ti Founders Edition Asus Crosshair VI Hero
46.9 pt
CrystalDiskMark 3.0
Read 4k
Samsung SSD 960 Evo 500GB m.2 NVMe
SCHENKER XMG U507 2017
59.1 MB/s +109%
Samsung SSD 960 Pro 512 GB m.2
Eurocom Tornado F5
55.9 MB/s +98%
Samsung PM961 NVMe MZVLW512HMJP
Lenovo IdeaPad 710S Plus-13IKB
54.8 MB/s +94%
Samsung SSD 950 Pro 512GB m.2 NVMe
SCHENKER XMG U727
53.6 MB/s +89%
Toshiba XG4 NVMe (THNSN5512GPUK)
HP Spectre x360 15-bl002xx
40.72 MB/s +44%
Samsung SSD 850 EVO M.2 250 GB
MIFcom EG7
39.25 MB/s +39%
Samsung SSD 850 PRO 1TB
Eurocom X8
38 MB/s +34%
Samsung SSD 960 Pro 1TB m.2 NVMe
Samsung 960 Pro 1TB
31.61 MB/s +12%
Intel SSD 600p SSDPEKKW512G7
Nvidia GeForce GTX 1080 Ti Founders Edition Asus Crosshair VI Hero
28.3 MB/s
Write 4k
Samsung SSD 960 Evo 500GB m.2 NVMe
SCHENKER XMG U507 2017
202.4 MB/s +130%
Samsung SSD 960 Pro 512 GB m.2
Eurocom Tornado F5
180.6 MB/s +105%
Samsung SSD 950 Pro 512GB m.2 NVMe
SCHENKER XMG U727
164.9 MB/s +87%
Toshiba XG4 NVMe (THNSN5512GPUK)
HP Spectre x360 15-bl002xx
139.4 MB/s +58%
Samsung PM961 NVMe MZVLW512HMJP
Lenovo IdeaPad 710S Plus-13IKB
121.5 MB/s +38%
Samsung SSD 850 PRO 1TB
Eurocom X8
116 MB/s +32%
Samsung SSD 850 EVO M.2 250 GB
MIFcom EG7
90.9 MB/s +3%
Intel SSD 600p SSDPEKKW512G7
Nvidia GeForce GTX 1080 Ti Founders Edition Asus Crosshair VI Hero
88 MB/s
Samsung SSD 960 Pro 1TB m.2 NVMe
Samsung 960 Pro 1TB
77.5 MB/s -12%
AS SSD
4K Read
Samsung SSD 960 Pro 512 GB m.2
Eurocom Tornado F5
51 MB/s +90%
Samsung SSD 960 Evo 500GB m.2 NVMe
SCHENKER XMG U507 2017
49.18 MB/s +84%
Samsung SSD 850 PRO 1TB
Eurocom X8
35 MB/s +31%
Toshiba XG4 NVMe (THNSN5512GPUK)
HP Spectre x360 15-bl002xx
35 MB/s +31%
Samsung SSD 850 EVO M.2 250 GB
MIFcom EG7
34.77 MB/s +30%
Samsung SSD 960 Pro 1TB m.2 NVMe
Samsung 960 Pro 1TB
31.74 MB/s +18%
Intel SSD 600p SSDPEKKW512G7
Asus Z97-Deluxe, Asus Hyper M2 X4
29.2 MB/s +9%
Intel SSD 600p SSDPEKKW512G7
Nvidia GeForce GTX 1080 Ti Founders Edition Asus Crosshair VI Hero
26.8 MB/s
4K Write
Samsung SSD 960 Evo 500GB m.2 NVMe
SCHENKER XMG U507 2017
180.9 MB/s +129%
Samsung SSD 960 Pro 512 GB m.2
Eurocom Tornado F5
150.5 MB/s +90%
Intel SSD 600p SSDPEKKW512G7
Asus Z97-Deluxe, Asus Hyper M2 X4
120.3 MB/s +52%
Samsung SSD 850 PRO 1TB
Eurocom X8
101 MB/s +28%
Intel SSD 600p SSDPEKKW512G7
Nvidia GeForce GTX 1080 Ti Founders Edition Asus Crosshair VI Hero
79.1 MB/s
Samsung SSD 850 EVO M.2 250 GB
MIFcom EG7
78 MB/s -1%
Samsung SSD 960 Pro 1TB m.2 NVMe
Samsung 960 Pro 1TB
70.4 MB/s -11%
Toshiba XG4 NVMe (THNSN5512GPUK)
HP Spectre x360 15-bl002xx
1.91 MB/s -98%

Data Copy

The copy tests vary quite a bit from run to run, and therefore the results would be better evaluated in classes. The 600p can join the game relatively well: 443 to 932 MB/s, depending on the test, are respectable results. Strong variations can also be seen with both Samsung SSD 960 Pros that were built into various notebooks. 

Performance Rating - Percent
Samsung SSD 960 Pro 512 GB m.2
Eurocom Tornado F5
100 pt
Samsung SSD 960 Pro 1TB m.2 NVMe
Samsung 960 Pro 1TB
69 pt
Toshiba XG4 NVMe (THNSN5512GPUK)
HP Spectre x360 15-bl002xx
66.7 pt
Intel SSD 600p SSDPEKKW512G7
Asus Z97-Deluxe, Asus Hyper M2 X4
63.5 pt
Intel SSD 600p SSDPEKKW512G7
Nvidia GeForce GTX 1080 Ti Founders Edition Asus Crosshair VI Hero
60.9 pt
Samsung SSD 850 PRO 1TB
Eurocom X8
40.8 pt
AS SSD
Copy Game MB/s
Samsung SSD 960 Pro 512 GB m.2
Eurocom Tornado F5
1310 MB/s +81%
Samsung SSD 960 Pro 1TB m.2 NVMe
Samsung 960 Pro 1TB
833 MB/s +15%
Intel SSD 600p SSDPEKKW512G7
Asus Z97-Deluxe, Asus Hyper M2 X4
757 MB/s +5%
Toshiba XG4 NVMe (THNSN5512GPUK)
HP Spectre x360 15-bl002xx
727 MB/s +1%
Intel SSD 600p SSDPEKKW512G7
Nvidia GeForce GTX 1080 Ti Founders Edition Asus Crosshair VI Hero
723 MB/s
Samsung SSD 850 PRO 1TB
Eurocom X8
462 MB/s -36%
Copy Program MB/s
Samsung SSD 960 Pro 512 GB m.2
Eurocom Tornado F5
635 MB/s +43%
Toshiba XG4 NVMe (THNSN5512GPUK)
HP Spectre x360 15-bl002xx
475.1 MB/s +7%
Intel SSD 600p SSDPEKKW512G7
Nvidia GeForce GTX 1080 Ti Founders Edition Asus Crosshair VI Hero
443 MB/s
Intel SSD 600p SSDPEKKW512G7
Asus Z97-Deluxe, Asus Hyper M2 X4
416 MB/s -6%
Samsung SSD 960 Pro 1TB m.2 NVMe
Samsung 960 Pro 1TB
401.8 MB/s -9%
Samsung SSD 850 PRO 1TB
Eurocom X8
366 MB/s -17%
Copy ISO MB/s
Samsung SSD 960 Pro 512 GB m.2
Eurocom Tornado F5
1614 MB/s +73%
Samsung SSD 960 Pro 1TB m.2 NVMe
Samsung 960 Pro 1TB
1292 MB/s +39%
Toshiba XG4 NVMe (THNSN5512GPUK)
HP Spectre x360 15-bl002xx
1126 MB/s +21%
Intel SSD 600p SSDPEKKW512G7
Asus Z97-Deluxe, Asus Hyper M2 X4
1086 MB/s +17%
Intel SSD 600p SSDPEKKW512G7
Nvidia GeForce GTX 1080 Ti Founders Edition Asus Crosshair VI Hero
932 MB/s
Samsung SSD 850 PRO 1TB
Eurocom X8
474 MB/s -49%

In the PCMark 8 storage test the Intel SSD 600p can score and comes in only just behind the fastest tested (SSD 950 Pro with 5100 points). The average of all tested lies at 4900 points and the slowest tested SATA SSDs manage about 4000 points.

PCMark 8 - Storage Score v2
Samsung SSD 960 Pro 512 GB m.2
Eurocom Tornado F5, Intel Core i7-7700K
5085 Points +2%
Samsung SSD 960 Pro 1TB m.2 NVMe
Samsung 960 Pro 1TB, Intel Xeon E5-2680 v4
5077 Points +2%
Intel SSD 600p SSDPEKKW512G7
Asus Z97-Deluxe, Asus Hyper M2 X4, Intel Core i7-4790K
5002 Points 0%
Intel SSD 600p SSDPEKKW512G7
Nvidia GeForce GTX 1080 Ti Founders Edition Asus Crosshair VI Hero, AMD Ryzen 7 1800X
4989 Points
IOMeter - IOMix, 5min, 10GB Partition
Intel SSD 600p SSDPEKKW512G7
Nvidia GeForce GTX 1080 Ti Founders Edition Asus Crosshair VI Hero, AMD Ryzen 7 1800X
327 MB/s

Verdict

The Intel SSD 600p is an affordable entry-level introduction into the NVMe SSD world. In the sequential read tests it can make use of the faster connection, and in the PCMark 8 storage test in particular that has more practical relevance, it comes out at the top end of the SSDs we tested. We are seeing slight weaknesses in the 4K performance, where it can "only" keep up with fast SATA SSDs. Overall therefore, we consider the Intel SSD to be slightly above a fast SATA SSD. 

The specified low power consumption should also benefit the deployment in a notebook. In addition, its 512 GB variant is listed on Amazon for around $175. This makes it also quite attractive in comparison to SATA M.2 drives (such as Samsung 850 EVO M.2 500 GB for around $168).

You can find all the benchmarks of the 600p (also from the notebooks), which are regularly updated, in the appendix. 

Intel SSD 600p SSDPEKKW512G7

The Intel SSD 600p SSDPEKKW512G7 is a solid state drive with a capacity of 512 GB.

TypeNVMe
SizeM.2
Capacity512 GB
InterfaceNVMe
Announced26.08.2016

Benchmarks

Performance Rating - DiskSpd
13.2 pt (20%)
64 GB eMMC Flash
2.27 -83%
...
Crucial P2 1TB CT1000P2SSD8
11.1 -16%
SK hynix HFB1M8MQ331C0MR
11.1 -16%
11.3 -14%
Kingston OM8SEP4256Q-A0
12.1 -8%
SK hynix BC501 HFM256GDGTNG
12.4 -6%
12.7 -4%
Apple SSD SM0512F
12.7 -4%
Apple SSD AP0512
12.8 -3%
13.2 0%
Intel SSD 600p SSDPEKKW512G7
13.2
13.3 1%
13.7 4%
13.8 5%
Toshiba KBG30ZMV256G
13.9 5%
256 GB NVMe
13.9 5%
Kingston RBUSNS8154P3512GJ
14.2 8%
Toshiba KBG30ZPZ128G
14.3 8%
SK Hynix BC711 HFM128GD3HX015N
14.3 8%
14.4 9%
...
66.5 404%
0%
100%
AS SSD - Copy Game
min: 231.8     avg: 518     median: 421.5 (7%)     max: 816 MB/s
AS SSD - Copy Program
min: 65.4     avg: 279.5     median: 287 (11%)     max: 443 MB/s
AS SSD - Copy ISO
min: 491.3     avg: 791     median: 924 (8%)     max: 1092 MB/s
AS SSD - Score Total
min: 1320     avg: 1646     median: 1591.5 (15%)     max: 2514 Points
AS SSD - Score Write
min: 377     avg: 667     median: 622 (11%)     max: 1572 Points
AS SSD - Score Read
min: 638     avg: 677     median: 683 (3%)     max: 723 Points
AS SSD - Access Time Write *
min: 0.028     avg: 0     median: 0 (0%)     max: 0.078 ms
AS SSD - Access Time Read *
min: 0.055     avg: 0.1     median: 0.1 (0%)     max: 0.141 ms
AS SSD - 4K-64 Write
min: 217.5     avg: 492     median: 454.6 (9%)     max: 1212.68 MB/s
AS SSD - 4K-64 Read
min: 405.55     avg: 494.8     median: 502 (15%)     max: 510 MB/s
AS SSD - 4K Write
min: 54     avg: 108.3     median: 113.5 (22%)     max: 138.03 MB/s
AS SSD - 4K Read
min: 20.36     avg: 32.3     median: 32.4 (10%)     max: 56.49 MB/s
AS SSD - Sequential Write
min: 531     avg: 598     median: 553.5 (5%)     max: 1210 MB/s
AS SSD - Sequential Read
min: 1124     avg: 1496     median: 1490 (12%)     max: 2606 MB/s
CrystalDiskMark 3.0 - 4K QD32 Write
min: 122.43     avg: 340.5     median: 377 (37%)     max: 496.9 MB/s
CrystalDiskMark 3.0 - 4K QD32 Read
min: 57.8     avg: 353.3     median: 448.4 (35%)     max: 462.9 MB/s
CrystalDiskMark 3.0 - 4K Write
min: 72     avg: 151.4     median: 126.9 (14%)     max: 494.79 MB/s
CrystalDiskMark 3.0 - 4K Read
min: 10.46     avg: 61.5     median: 34.6 (1%)     max: 436.28 MB/s
CrystalDiskMark 3.0 - 512K Write
min: 300.3     avg: 587     median: 509.2 (12%)     max: 1660 MB/s
CrystalDiskMark 3.0 - 512K Read
min: 580     avg: 856     median: 723.5 (21%)     max: 2154.12 MB/s
CrystalDiskMark 3.0 - Sequential Write
min: 179.9     avg: 628     median: 578 (10%)     max: 1613.8 MB/s
CrystalDiskMark 3.0 - Sequential Read
min: 880     avg: 1228     median: 1076 (21%)     max: 2595.88 MB/s
CrystalDiskMark 5.2 / 6 - CDM 5/6 Write 4K
min: 78.8     avg: 126.9     median: 140.3 (13%)     max: 152.6 MB/s
CrystalDiskMark 5.2 / 6 - CDM 5/6 Read 4K
min: 21     avg: 30.5     median: 29.5 (1%)     max: 36.93 MB/s
CrystalDiskMark 5.2 / 6 - CDM 5 Write Seq
min: 559     avg: 576     median: 581 (3%)     max: 587 MB/s
CrystalDiskMark 5.2 / 6 - CDM 5 Read Seq
min: 934     avg: 1061     median: 1066 (13%)     max: 1150 MB/s
CrystalDiskMark 5.2 / 6 - CDM 5/6 Write 4K Q32T1
min: 201     avg: 346.8     median: 365.8 (12%)     max: 482.5 MB/s
CrystalDiskMark 5.2 / 6 - CDM 5/6 Read 4K Q32T1
min: 270     avg: 388.2     median: 457 (7%)     max: 460.1 MB/s
CrystalDiskMark 5.2 / 6 - CDM 5/6 Write Seq Q32T1
min: 559     avg: 574     median: 573 (4%)     max: 584 MB/s
CrystalDiskMark 5.2 / 6 - CDM 5/6 Read Seq Q32T1
min: 1333     avg: 1512     median: 1404 (8%)     max: 1862 MB/s
PCMark 8 - PCMark 8 Storage v2
min: 4980     avg: 4997     median: 5002 (98%)     max: 5010 Points
HD Tune Transfer Rate Minimum - HD Tune Transfer Rate Minimum
57.3 MB/s (3%)
HD Tune Transfer Rate Average - HD Tune Transfer Rate Average
92.3 MB/s (4%)
HD Tune Transfer Rate Maximum - HD Tune Transfer Rate Maximum
118.7 MB/s (5%)
DiskSpd - DiskSpd 4k_q1t1_write
min: 102.7     avg: 112.5     median: 109 (25%)     max: 132.8 MB/s
DiskSpd - DiskSpd 4k_q1t1_read
min: 23.92     avg: 35.7     median: 33.3 (10%)     max: 55.4 MB/s
DiskSpd - DiskSpd 4k_q32t16_write
min: 407     avg: 479.2     median: 508 (10%)     max: 558 MB/s
DiskSpd - DiskSpd 4k_q32t16_read
min: 417     avg: 475     median: 475 (8%)     max: 535 MB/s
DiskSpd - DiskSpd seq_write
min: 460     avg: 776     median: 585 (6%)     max: 1675 MB/s
DiskSpd - DiskSpd seq_read
min: 1028     avg: 1338     median: 1124 (16%)     max: 2273 MB/s
DiskSpd - DiskSpd seq_q8t1_write
min: 566     avg: 793     median: 582 (4%)     max: 1662 MB/s
DiskSpd - DiskSpd seq_q8t1_read
min: 1370     avg: 1939     median: 1801 (11%)     max: 2901 MB/s
DiskSpd - DiskSpd Loop seq_q8t1_read
min: 1848     avg: 2355     median: 2355 (14%)     max: 2862 MB/s
010020030040050060070080090010001100120013001400150016001700180019002000210022002300240025002600270028002900Tooltip
- Range of benchmark values for this graphics card
- Average benchmark values for this graphics card
* Smaller numbers mean a higher performance

Add one or more devices and compare

In the following list you can select (and also search for) devices that should be added to the comparison. You can select more than one device.

restrict list:

show all (including archived), 2024, 2023
v1.26
log 17. 12:22:51

#0 no ids found in url (should be separated by "_") +0s ... 0s

#1 not redirecting to Ajax server +0s ... 0s

#2 did not recreate cache, as it is less than 5 days old! Created at Tue, 12 Mar 2024 16:12:25 +0100 +0.001s ... 0.001s

#3 composed specs +0.001s ... 0.002s

#4 did output specs +0s ... 0.002s

#5 getting avg benchmarks for device 968 +0.015s ... 0.016s

#6 got single benchmarks 968 +0.042s ... 0.058s

#7 got avg benchmarks for devices +0s ... 0.058s

#8 min, max, avg, median took s +1.073s ... 1.13s

#9 return log +0.011s ... 1.142s

static version load dynamic
Loading comments
Comment on this article
Please share our article, every link counts!
> Expert Reviews and News on Laptops, Smartphones and Tech Innovations > Reviews > Intel SSD 600p 512 GB Review: The Entry-Level NVMe SSD
Klaus Hinum, 2017-04- 5 (Update: 2020-05-19)