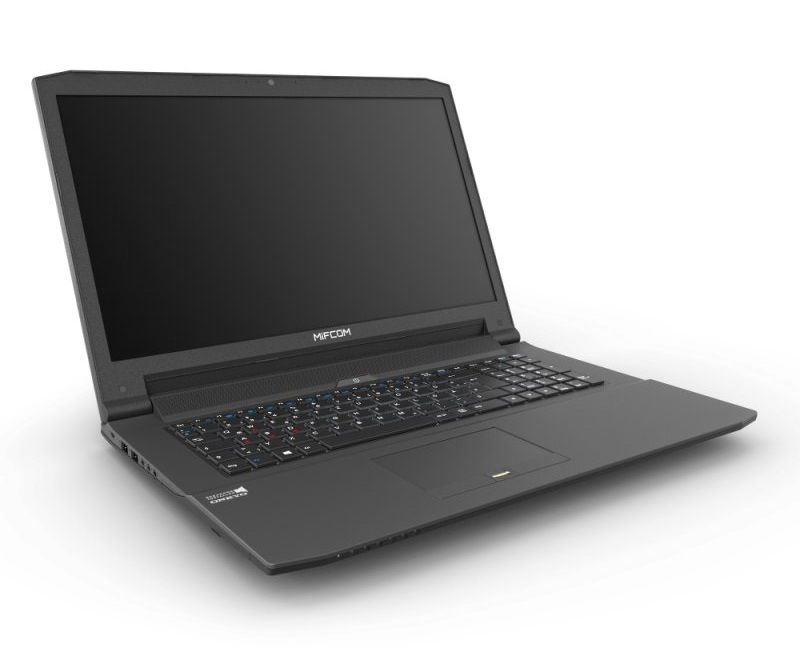
MIFcom EG7 (Clevo N170RF) Notebook Review

For the original German review, see here.
Unlike most notebook manufacturers with worldwide prominence like Acer, Asus and HP, the Barebone vendor MIFcom give the customers the option to choose the individual components that together form the inner life of their products. The company offers the 17-inch EG7 model in various basic configurations; for the most part, the buyer can customize the hardware as they see fit. While the cheaper variants are “only” equipped with a GeForce GTX 960M, the more expensive models have the powerful 2016 edition of the GTX 965M at their command.
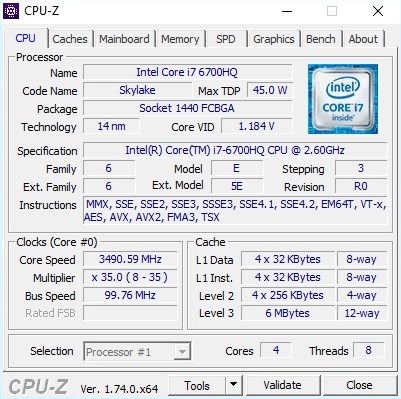
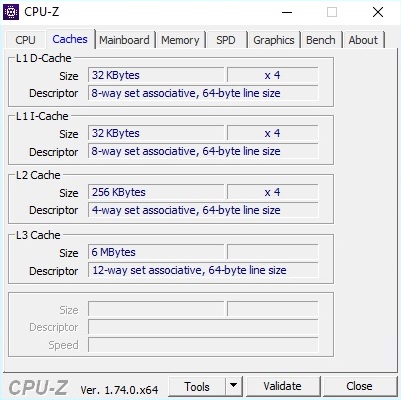
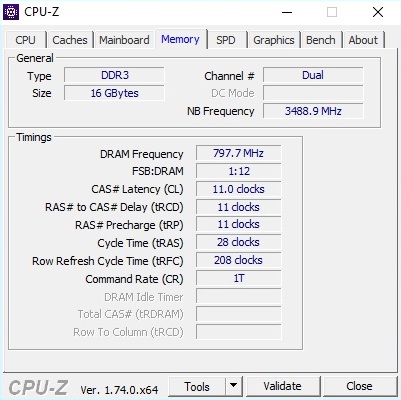
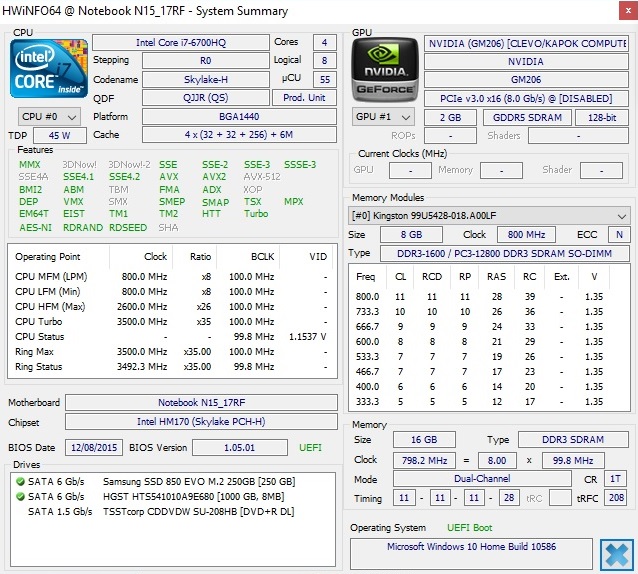
A dual or quad-core chip from Intel's Skylake generation serves as the system's processor. The Core i7-6700HQ at work in our test device clocks at 2.6 to 3.5 GHz under load and is the ideal companion for the computer's gaming GPU. The notebook is also equipped with a maximum of 16 GB of DDR3 RAM and a DVD or Blu-ray burner. The fact that the 17-inch device does not support DDR4 RAM is not too disastrous in our opinion: the performance should hardly be impacted by this minor deficiency.
A peek under the hood also reveals an M.2 slot for SATA III or PCIe SSDs and a 2.5-inch slot for conventional hard drives. Wireless network connections are established by either an Intel model (Wireless-AC 3165 or 8260) or a Qualcomm Atheros (Killer Wireless-AC 1535). The customer has no influence over the display. MIFcom integrates a matte IPS panel with a resolution of 1920x1080 pixels, which should meet most user needs.
Warning: An operating system does not come as a standard and costs between 100 and 150 Euros extra (~$110 to 160). Altogether, the configuration we used for our tests costs 1600 Euros (~$1730). Depending on the manufacturer, that kind of money can often buy a laptop with the substantially faster GeForce GTX 970M GPU.
Case
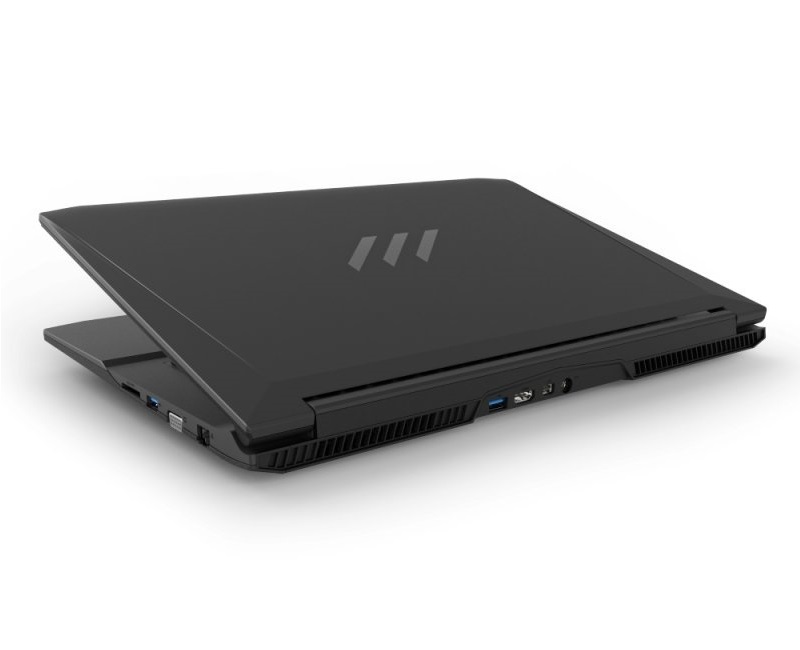
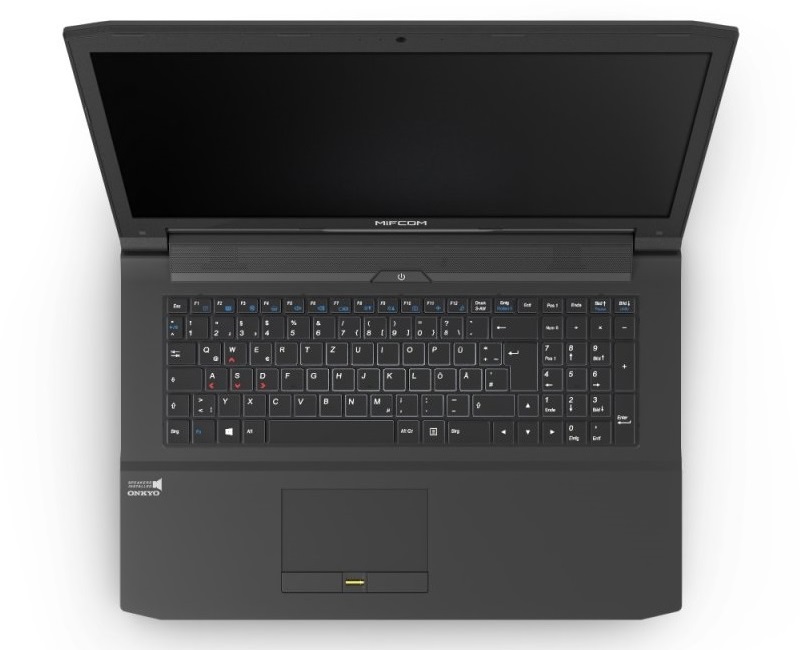
The casing MIFcom has selected for their EG7, the N170RF Barebone from Clevo, is identical to its two predecessors: the N170RD (Schenker XMG A706) and the N170SD (Schenker XMG A705). As a result, we will not cover the case, connectivity or input devices in detail in this review. For more information on these subjects, see this article.
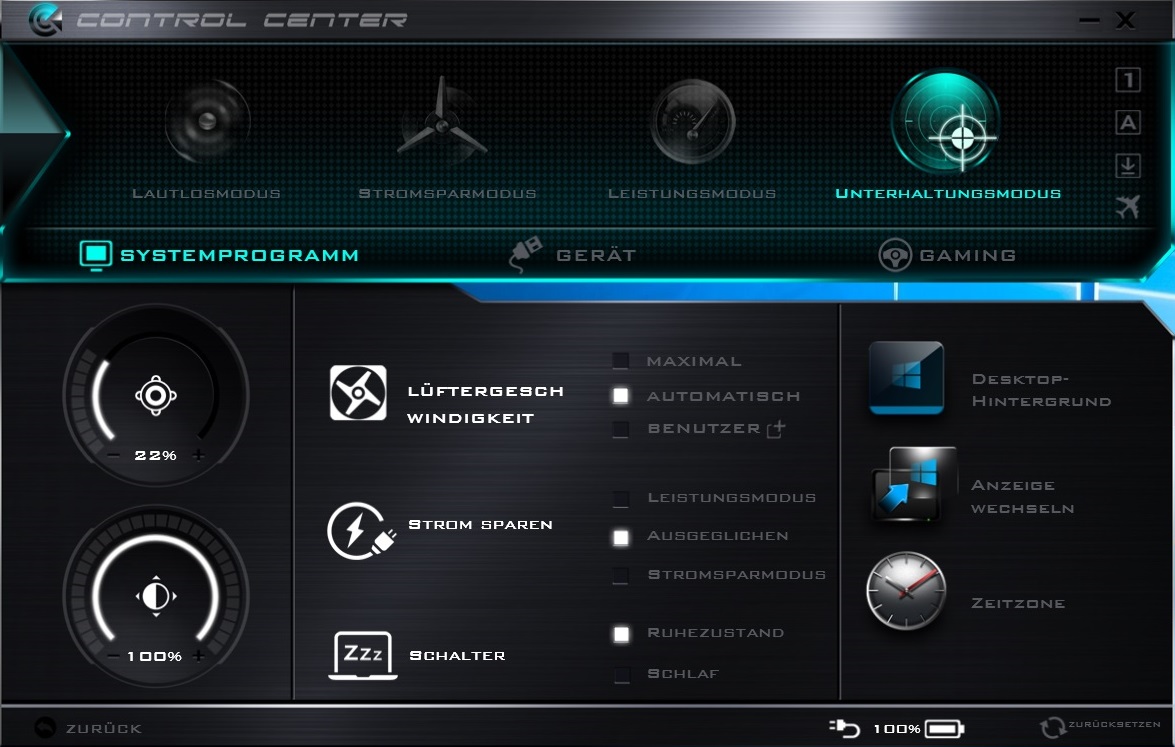
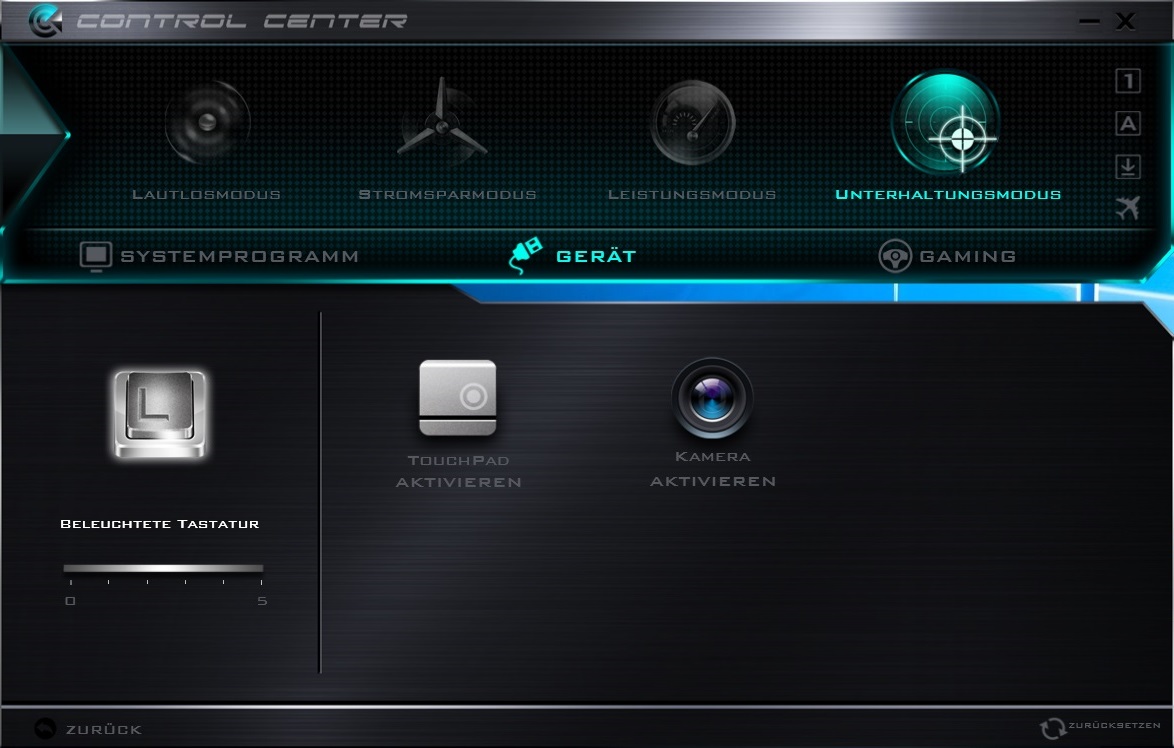
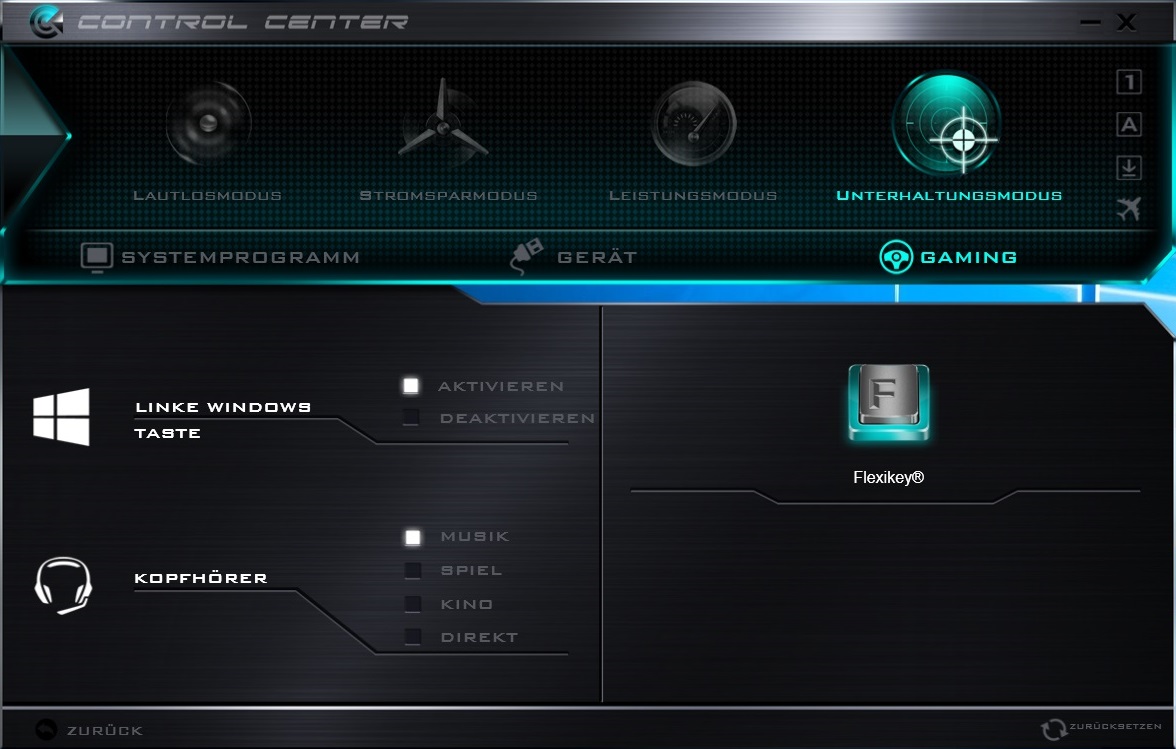
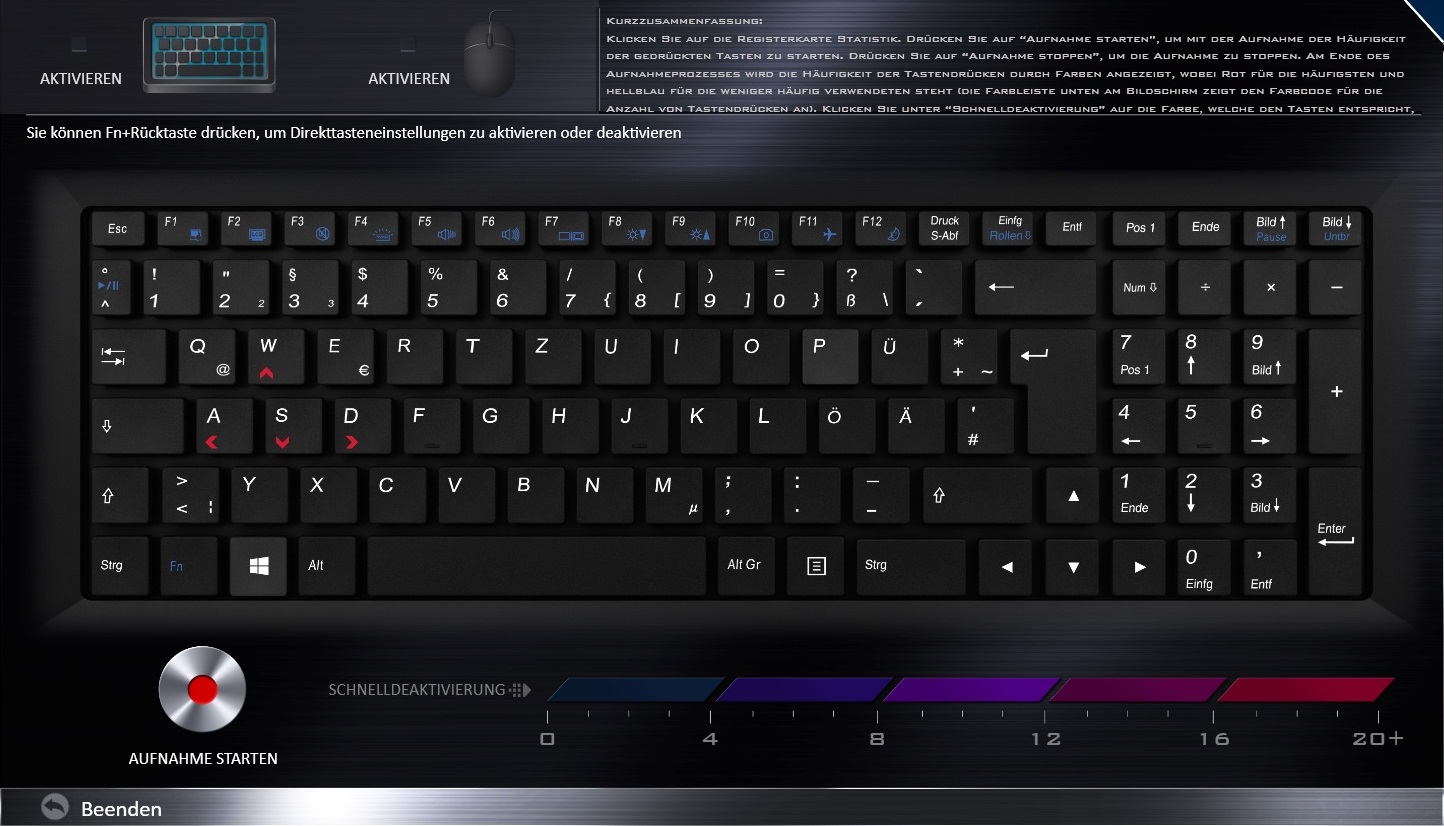
The pre-installed software is also very similar to that of its Schenker colleagues. The cornerstone proves to be the so-called Control Center, which gives the user access to many convenient functions and features. One of the major highlights is the manual fan control - now offered by almost every Clevo Barebone.
Display
The notebook's FHD display is identical to that of its predecessor. With a maximum display brightness of around 310 cd/m² and a contrast of more than 1000:1, the LG Philips LP173WF4-SPD1 is one of the best IPS panels on the market. The black value (0.3 cd/m²) and the brightness distribution (89% uniform across the screen) are good as well. We did not observe any irritating bright spots. We are particularly pleased that MIFcom - unlike most manufacturers - guarantees 0 pixel errors at no cost.
| |||||||||||||||||||||||||
Brightness Distribution: 89 %
Center on Battery: 330 cd/m²
Contrast: 1031:1 (Black: 0.32 cd/m²)
ΔE ColorChecker Calman: 4.98 | ∀{0.5-29.43 Ø4.72}
ΔE Greyscale Calman: 4.39 | ∀{0.09-98 Ø4.97}
83% sRGB (Argyll 1.6.3 3D)
55% AdobeRGB 1998 (Argyll 1.6.3 3D)
60.7% AdobeRGB 1998 (Argyll 3D)
83.1% sRGB (Argyll 3D)
66.1% Display P3 (Argyll 3D)
Gamma: 2.26
CCT: 6049 K
| MIFcom EG7 LG Philips LP173WF4-SPD1 (LGD046C) | Schenker XMG A706 LG Philips LP173WF4-SPD1 | Medion Erazer X7615-MD99293 CMN N173HGE-E11 (CMN1735) | Asus G752VT | Schenker XMG P706 LG LP173WF4-SPD1 | MSI GT72S 6QF Name: LG Philips LP173WF4-SPF1, ID: LGD0469 | |
|---|---|---|---|---|---|---|
| Display | 1% | 10% | 1% | 2% | 3% | |
| Display P3 Coverage (%) | 66.1 | 66.4 0% | 66.7 1% | 66.3 0% | 66.9 1% | 67.6 2% |
| sRGB Coverage (%) | 83.1 | 83.8 1% | 95.7 15% | 84.5 2% | 84.6 2% | 86.1 4% |
| AdobeRGB 1998 Coverage (%) | 60.7 | 61.3 1% | 68.5 13% | 61.8 2% | 61.8 2% | 63 4% |
| Response Times | 13% | -6% | ||||
| Response Time Grey 50% / Grey 80% * (ms) | 41 ? | 30.4 ? 26% | 43 ? -5% | |||
| Response Time Black / White * (ms) | 27 ? | 27.2 ? -1% | 29 ? -7% | |||
| PWM Frequency (Hz) | ||||||
| Screen | 2% | -37% | 6% | -3% | 12% | |
| Brightness middle (cd/m²) | 330 | 344 4% | 263 -20% | 357.2 8% | 306 -7% | 356.7 8% |
| Brightness (cd/m²) | 312 | 322 3% | 244 -22% | 339 9% | 302 -3% | 326 4% |
| Brightness Distribution (%) | 89 | 88 -1% | 83 -7% | 89 0% | 90 1% | 85 -4% |
| Black Level * (cd/m²) | 0.32 | 0.3 6% | 0.27 16% | 0.366 -14% | 0.34 -6% | 0.282 12% |
| Contrast (:1) | 1031 | 1147 11% | 974 -6% | 976 -5% | 900 -13% | 1265 23% |
| Colorchecker dE 2000 * | 4.98 | 4.8 4% | 12.24 -146% | 3.69 26% | 5.49 -10% | 4.16 16% |
| Greyscale dE 2000 * | 4.39 | 4.91 -12% | 12.17 -177% | 3.05 31% | 3.97 10% | 2.47 44% |
| Gamma | 2.26 97% | 2.37 93% | 3.55 62% | 2.21 100% | 2.15 102% | 2.29 96% |
| CCT | 6049 107% | 6796 96% | 15589 42% | 6164 105% | 6163 105% | 6860 95% |
| Color Space (Percent of AdobeRGB 1998) (%) | 55 | 55 0% | 62 13% | 55 0% | 55.5 1% | 56 2% |
| Color Space (Percent of sRGB) (%) | 83 | 84 1% | 96 16% | 84 1% | 84.5 2% | 85 2% |
| Total Average (Program / Settings) | 2% /
2% | -14% /
-25% | 7% /
6% | -1% /
-2% | 3% /
8% |
* ... smaller is better
In our further tests with the CalMAN software, the 17-inch display did reasonably well. The DeltaE 2000 values (Grayscale 4.39, Color Checker 4.98) are middle-of-the-road, as are the gamma and color temperatures.
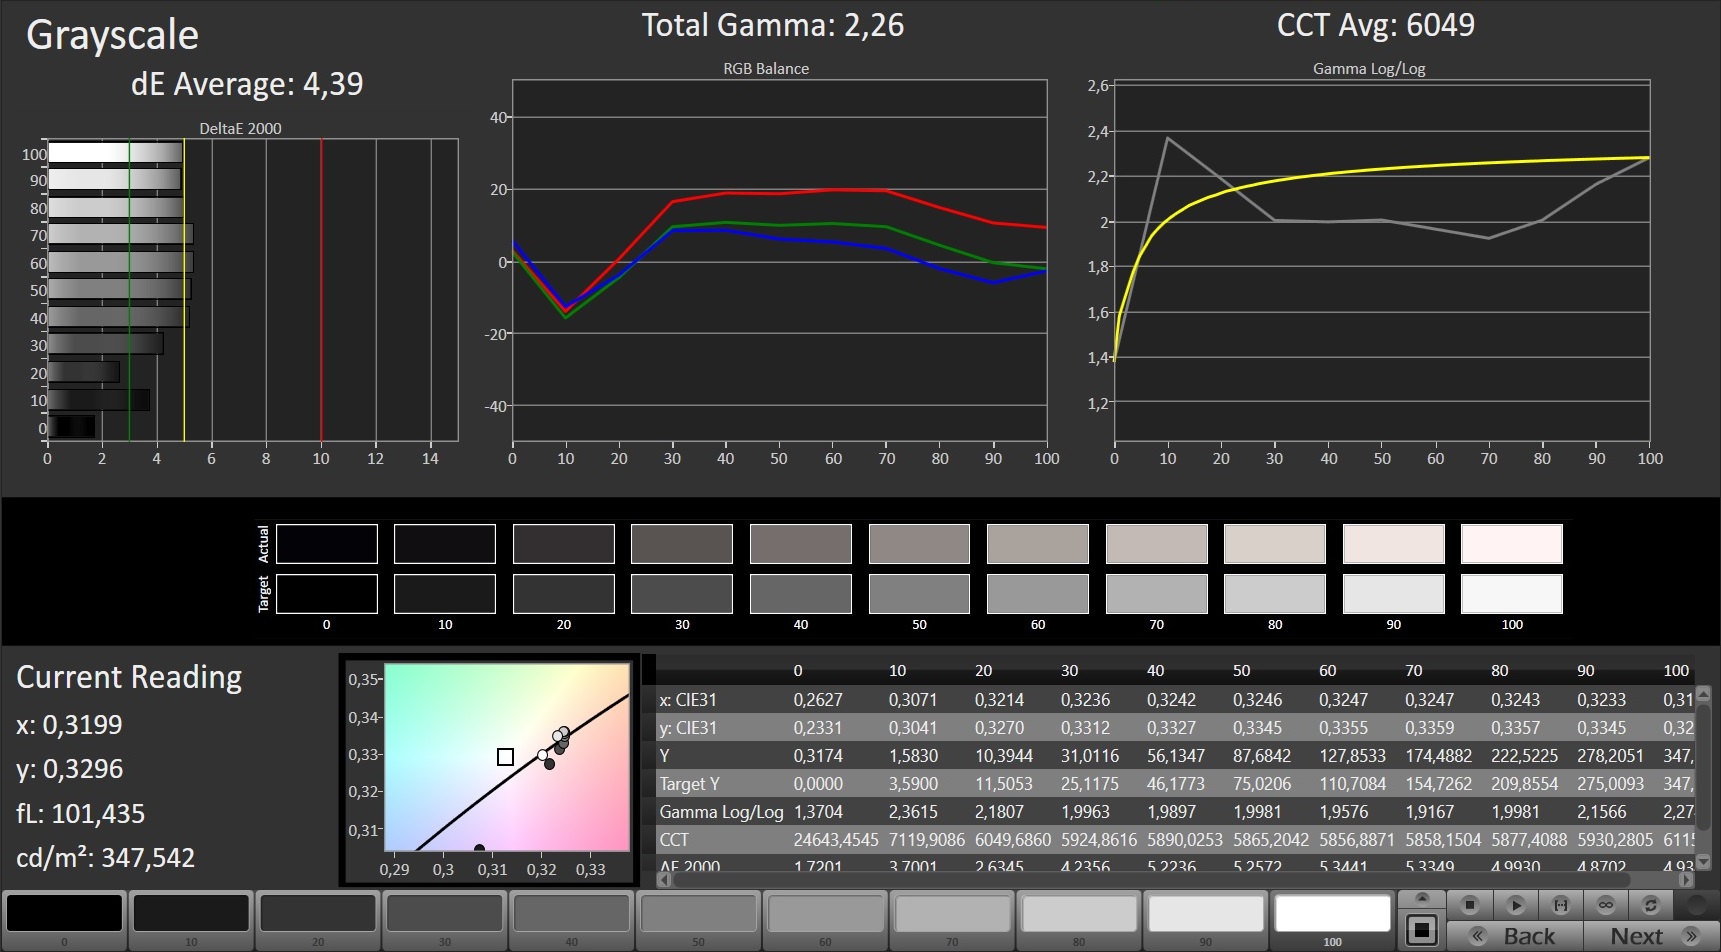
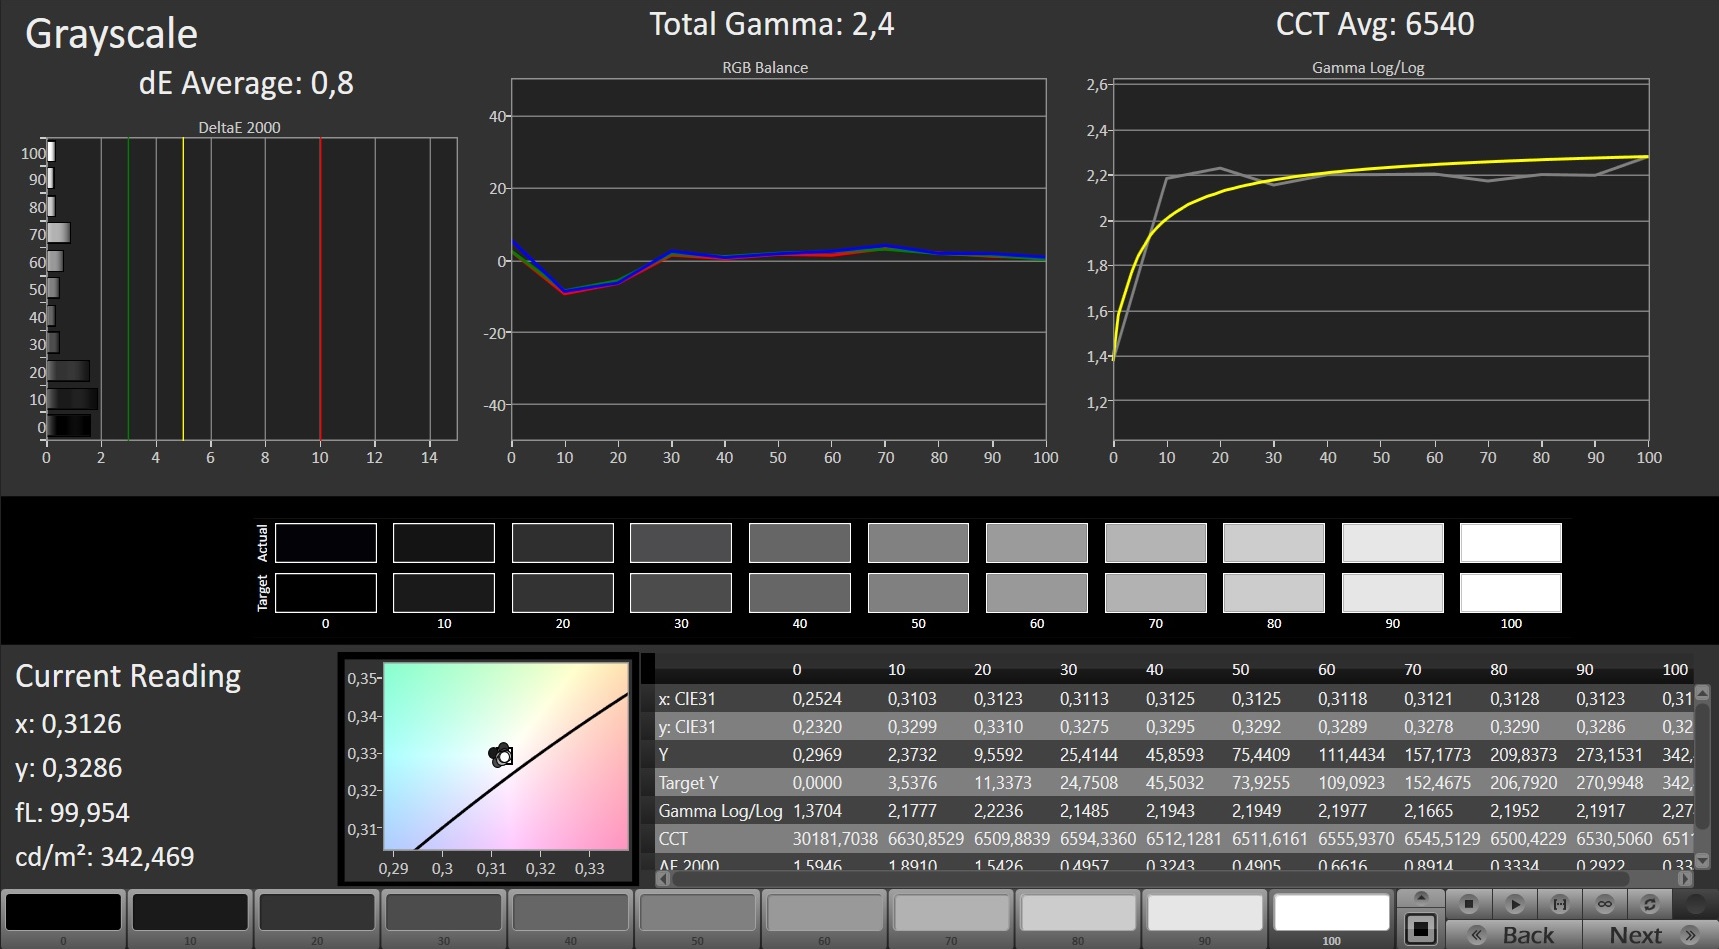
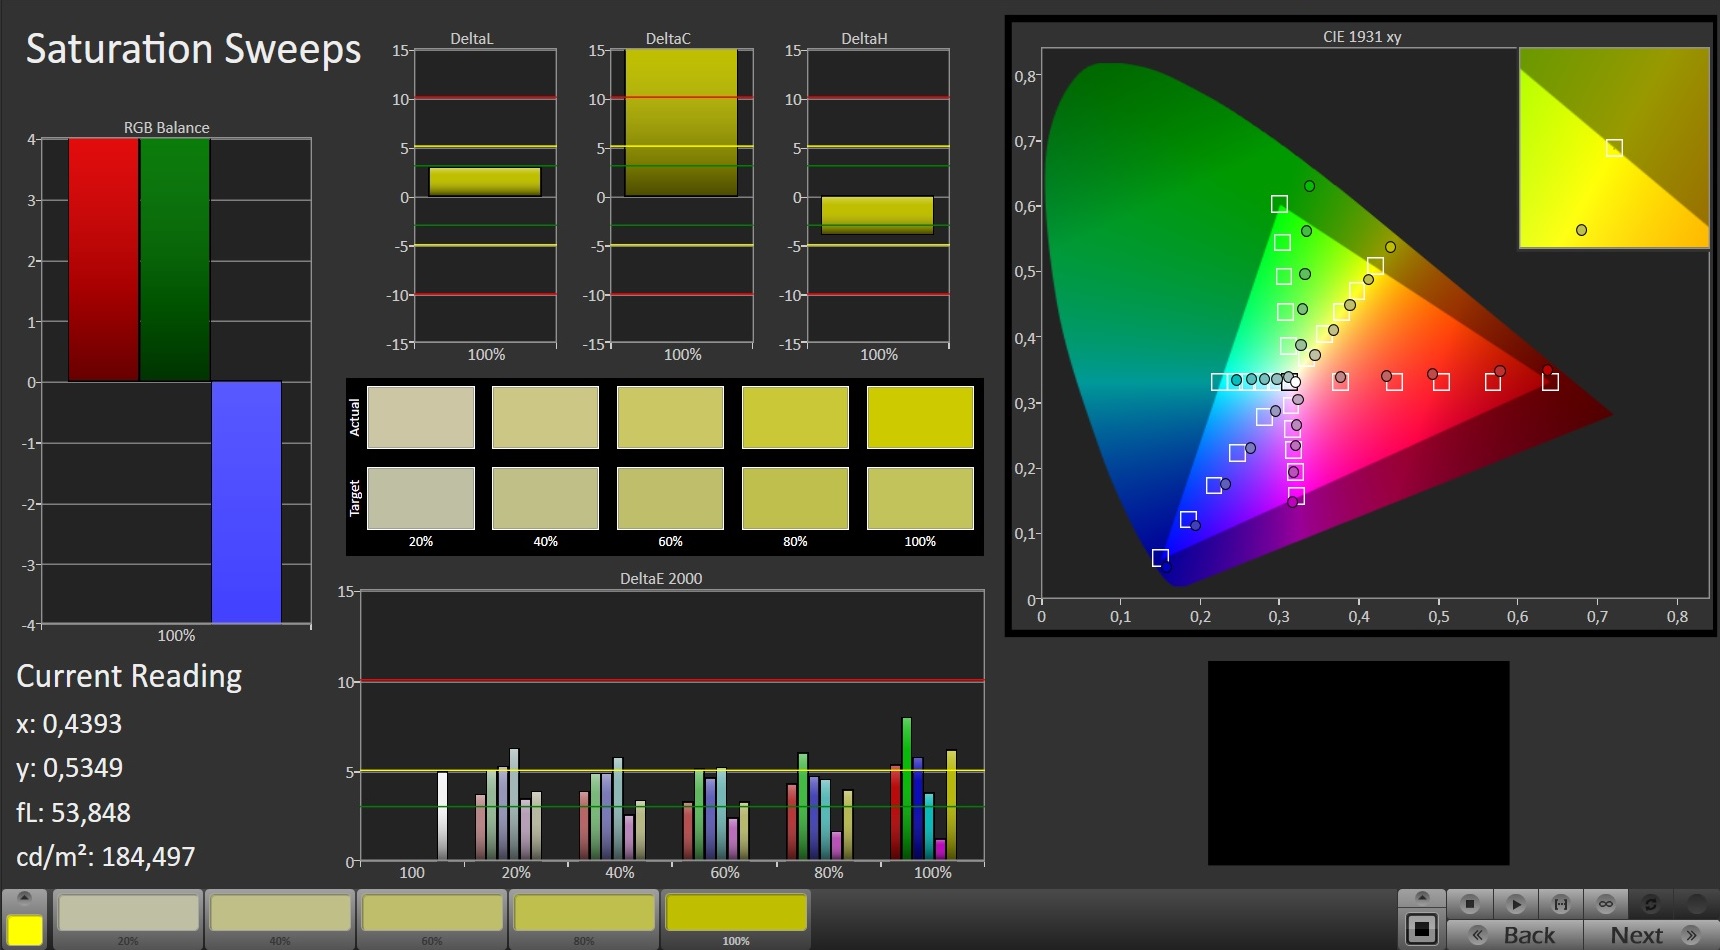
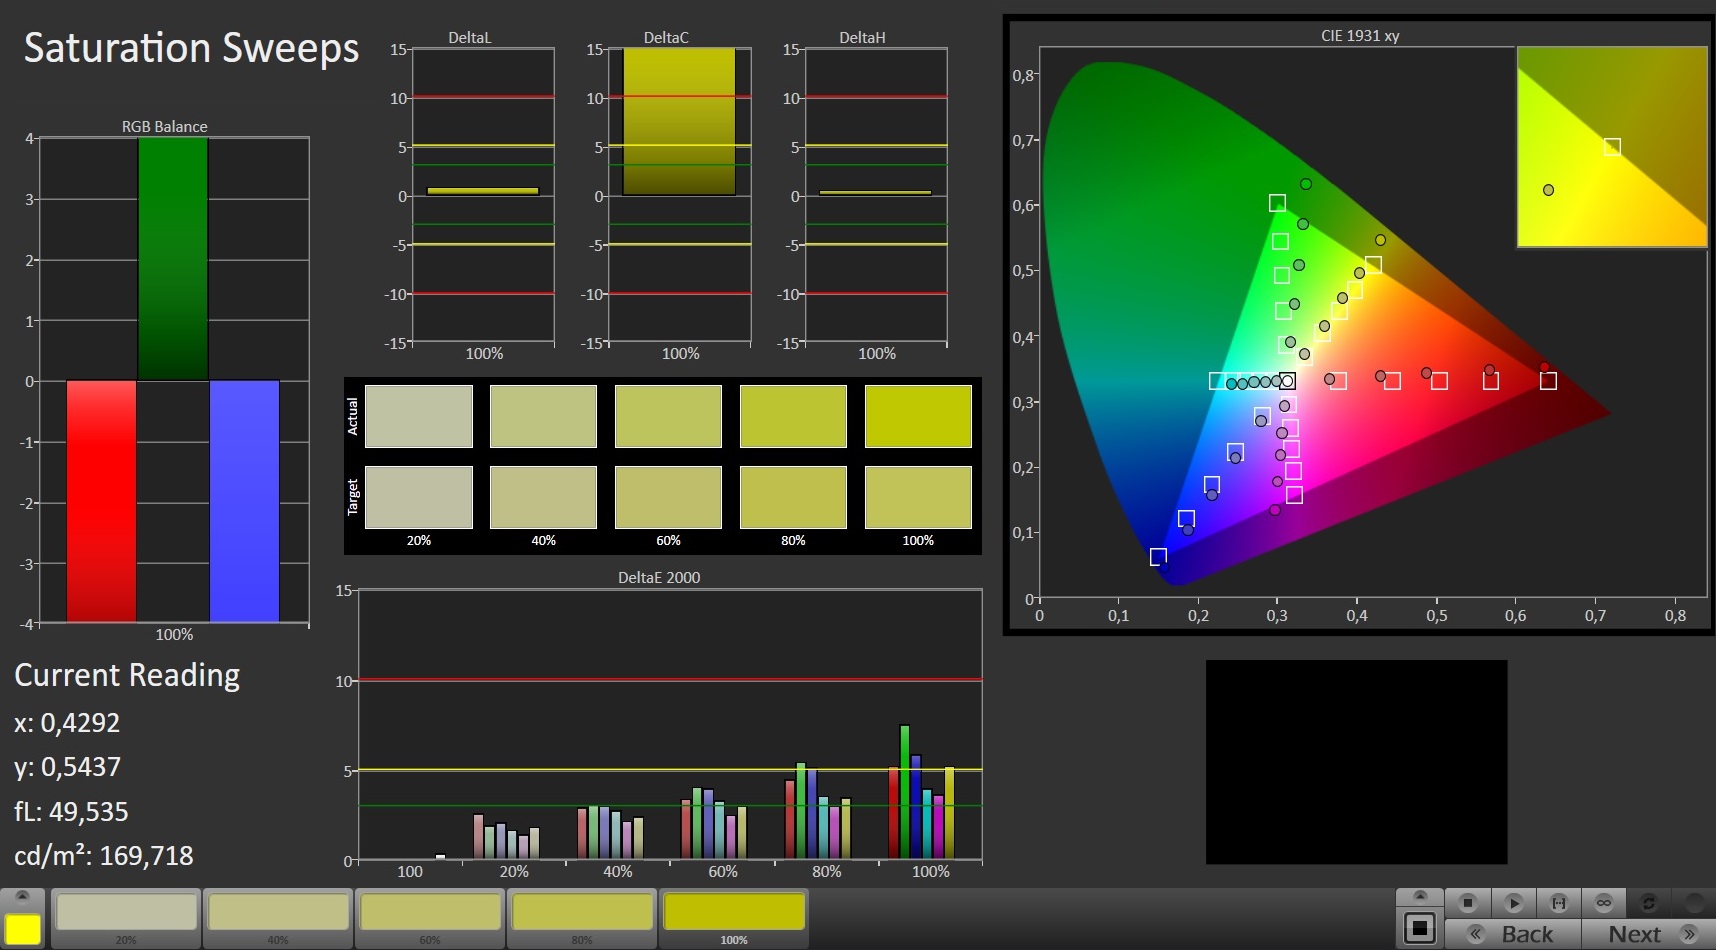
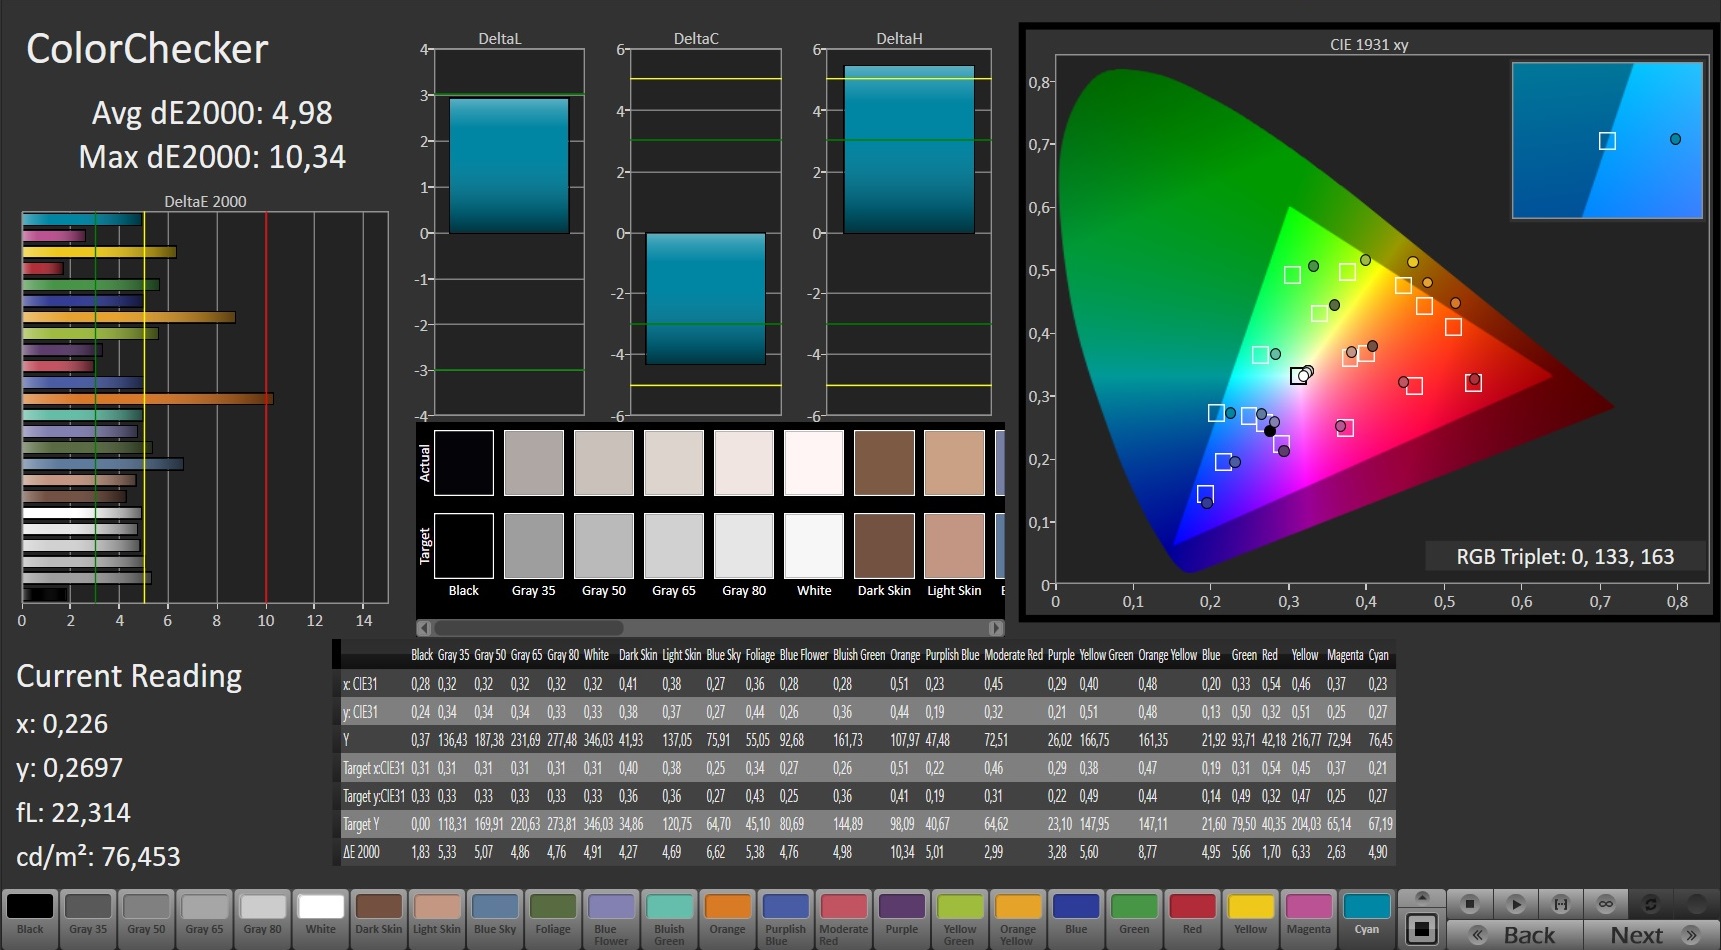
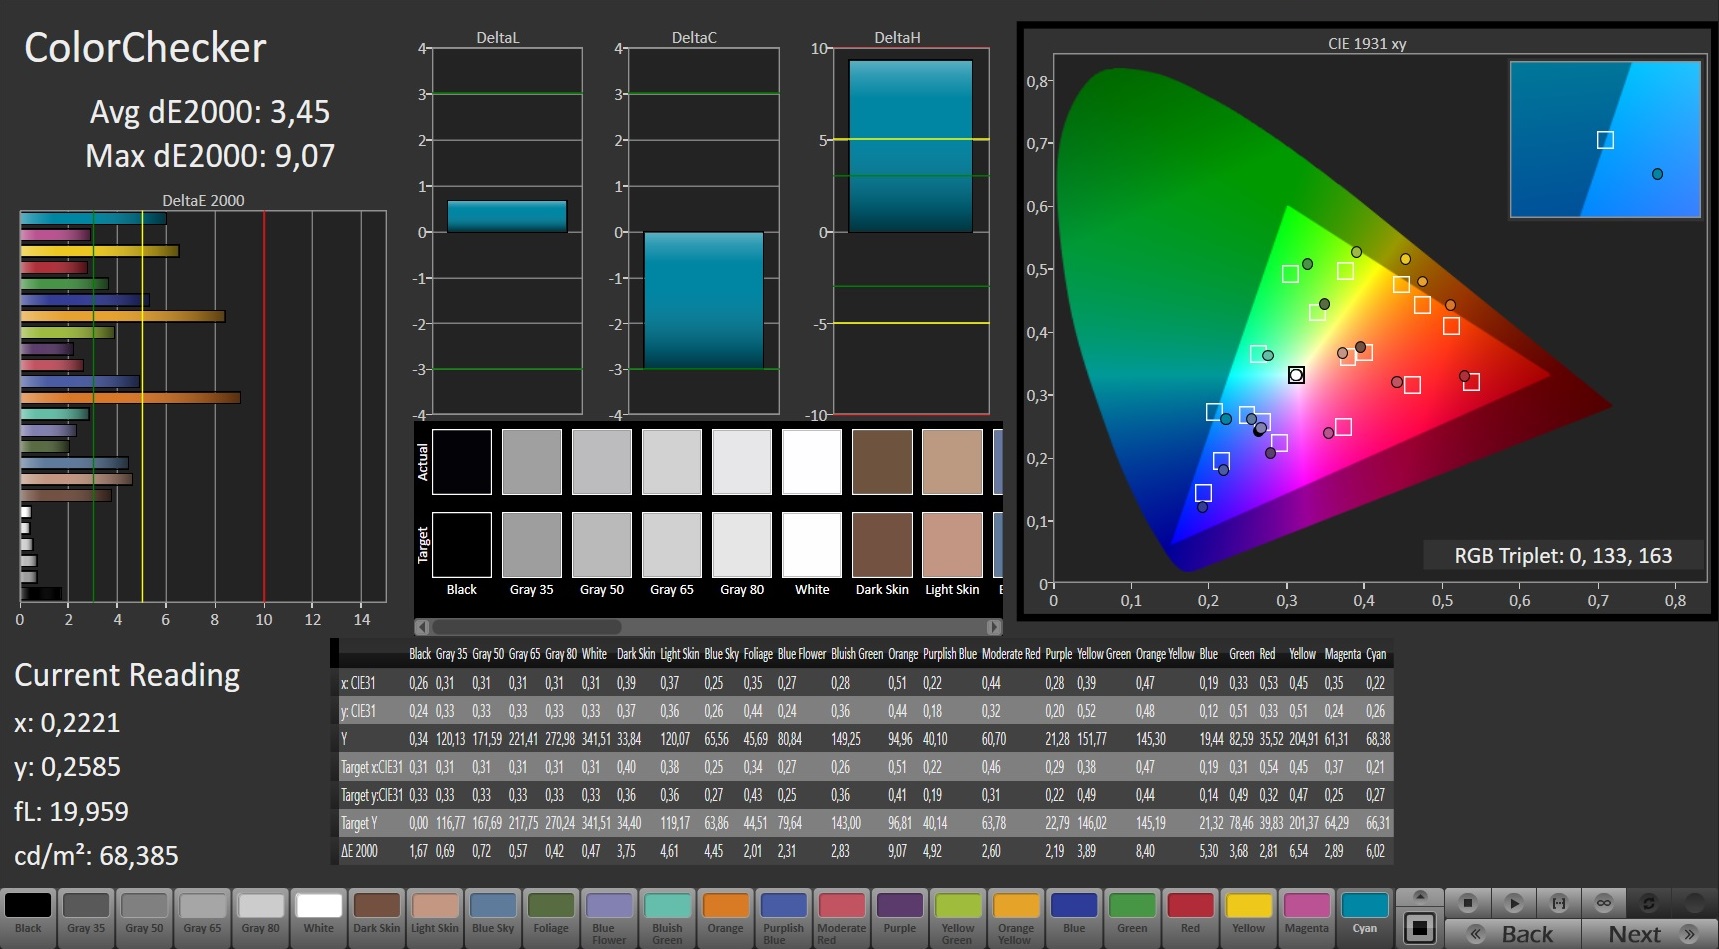
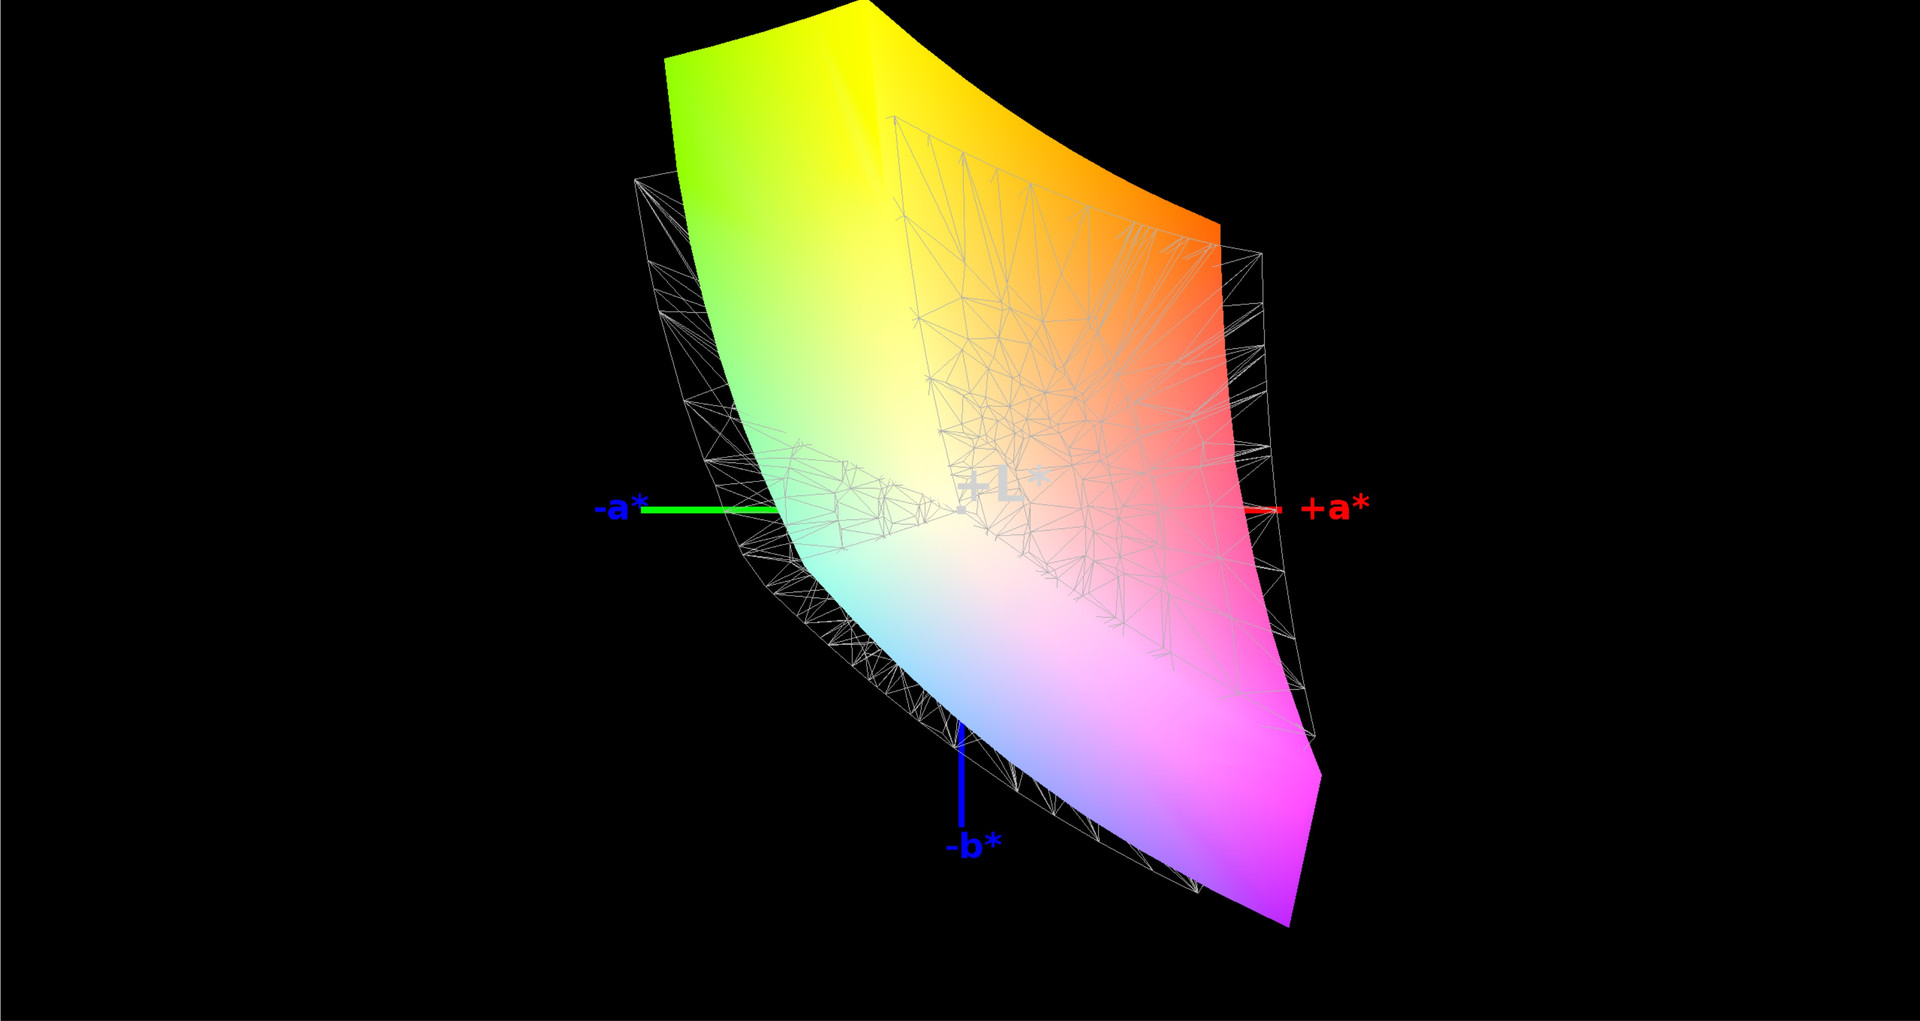
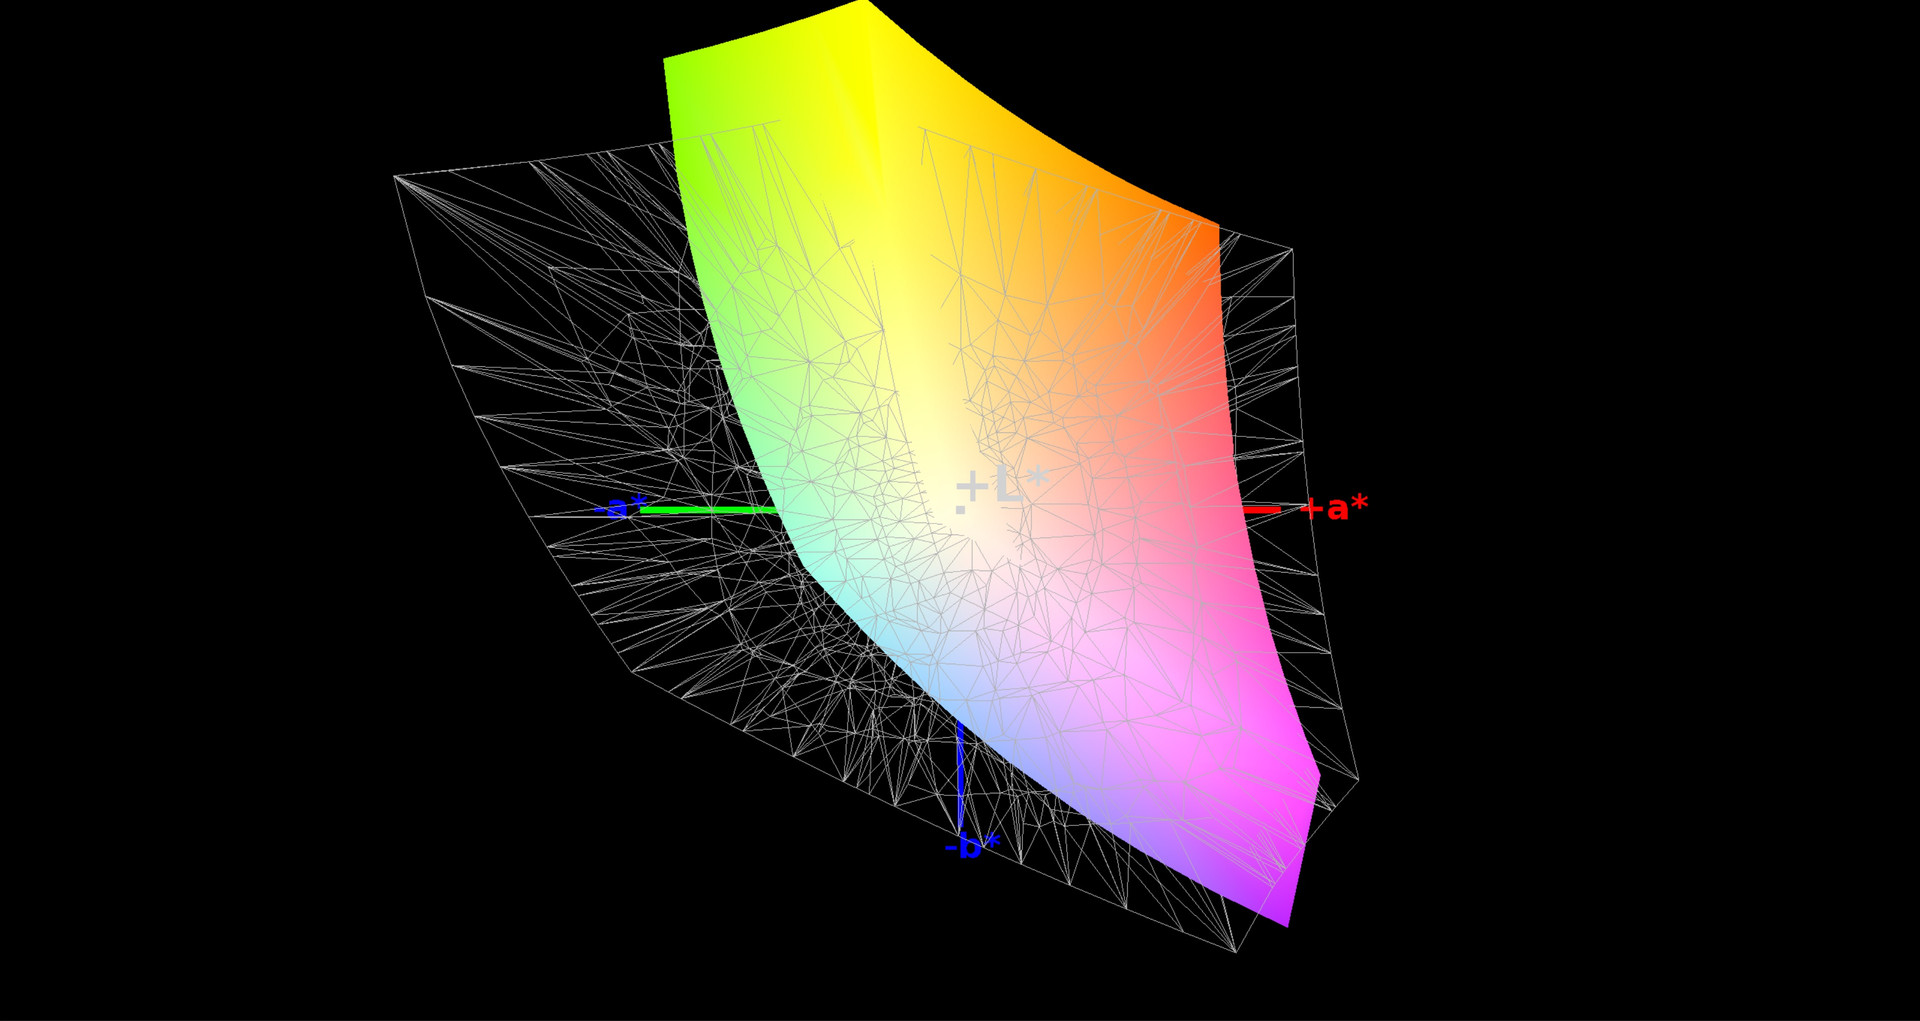
Those who like to edit photos or videos should calibrate the display. As the screenshots above show, some values improve significantly. Unfortunately, the end result still is not quite good enough for professional use. From a gaming standpoint, the color space coverage is sufficient: 83% sRGB and 55% AdobeRGB are typical for an IPS panel.
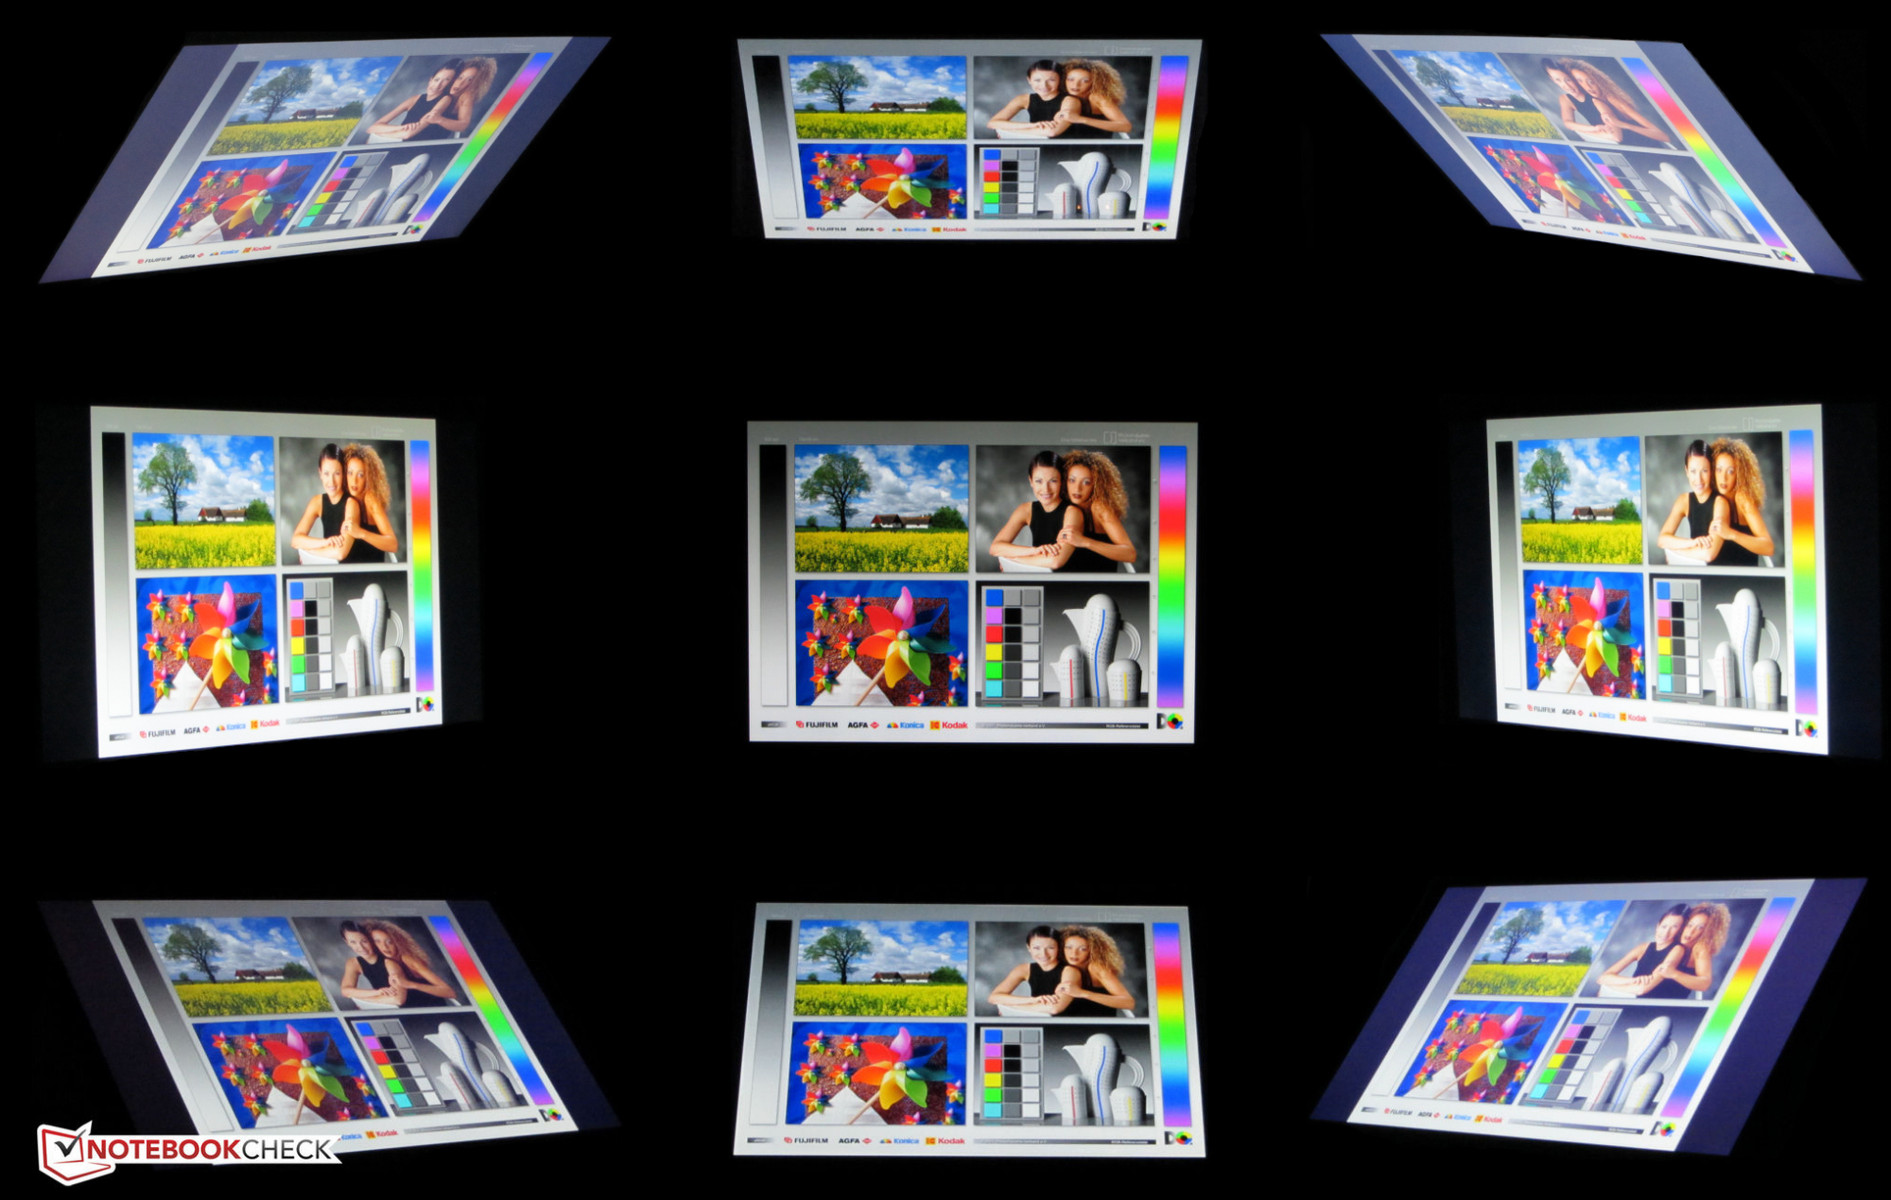
Also typical for this panel type are the excellent viewing angles. The screen content remains relatively undistorted even when the user angles the screen at a slant. Thanks to the display's ample brightness and anti-glare finish, the MIFcom EG7 is quite suitable for outdoor use.
Display Response Times
| ↔ Response Time Black to White | ||
|---|---|---|
| 27 ms ... rise ↗ and fall ↘ combined | ↗ 5 ms rise | 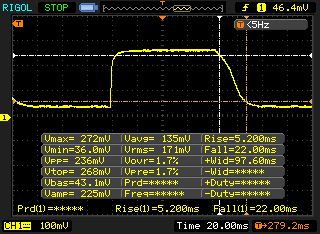 |
| ↘ 22 ms fall | ||
| The screen shows relatively slow response rates in our tests and may be too slow for gamers. In comparison, all tested devices range from 0.1 (minimum) to 240 (maximum) ms. » 67 % of all devices are better. This means that the measured response time is worse than the average of all tested devices (19.8 ms). | ||
| ↔ Response Time 50% Grey to 80% Grey | ||
| 41 ms ... rise ↗ and fall ↘ combined | ↗ 15 ms rise | 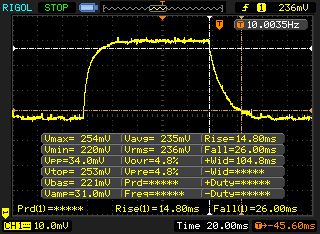 |
| ↘ 26 ms fall | ||
| The screen shows slow response rates in our tests and will be unsatisfactory for gamers. In comparison, all tested devices range from 0.165 (minimum) to 636 (maximum) ms. » 65 % of all devices are better. This means that the measured response time is worse than the average of all tested devices (31 ms). | ||
Screen Flickering / PWM (Pulse-Width Modulation)
| Screen flickering / PWM not detected | 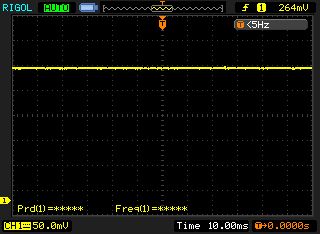 | ||
In comparison: 52 % of all tested devices do not use PWM to dim the display. If PWM was detected, an average of 7747 (minimum: 5 - maximum: 343500) Hz was measured. | |||
Performance
Although the graphics performance is not good enough to place the notebook within our Gaming Top 10 list, the MIFcom EG7 clearly makes the high-end laptop line-up. A quad-core processor with Hyperthreading technology and 16 GB of RAM ensure that the machine will not be obsolete anytime soon. When it comes to the storage device, once again, the manufacturer proves to know what they are doing. The test device is equipped with a combination of a 250 GB SSD and a 1000 GB HDD.
Processor
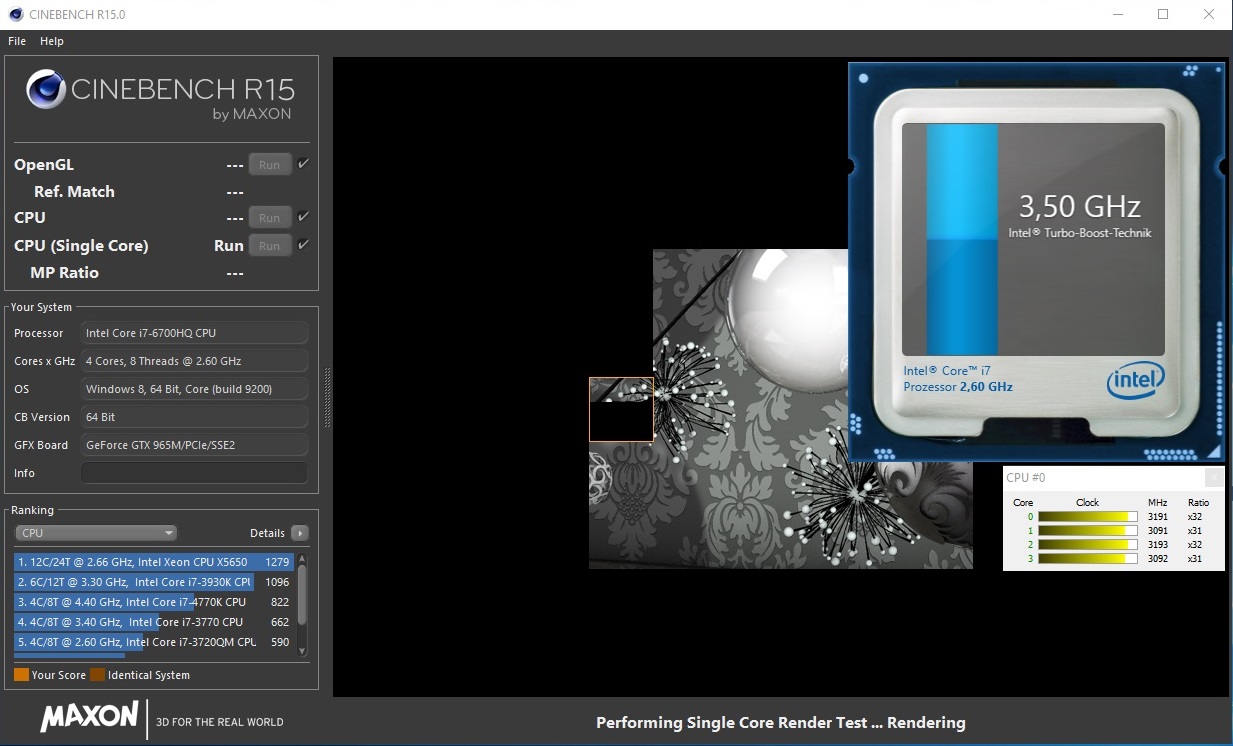
In the gaming sphere, Intel's Core i7-6700HQ is easily the most popular notebook CPU. No wonder, as the quad-core model offers very good performance alongside reasonable energy consumption. In terms of clock rates, the 17-inch device leaves us with mixed feelings. As long as only the processor is under load, the i7-6700HQ climbs to its maximum speed of 3.1 GHz (multi-core scenarios) to 3.5 GHz (single-core scenarios). But when the GPU is also under load, the turbo boost function is deactivated, leaving the CPU at the base clock frequency of 2.6 GHz in 3D applications.

Since most games are limited by the GPU and the GeForce GTX 965M often proves to be the limiting factor, the lack of CPU turbo is hardly noticeable in practice. At least on paper, only at low to medium resolutions and/or settings does our laptop lag slightly behind notebooks with active overclocking.
In the CPU benchmarks, the MIFcom EG7 looks its very best. Both Cinebench R11.5 and Cinebench R15 record a fantastic performance, similar to that of other notebooks with a Core i7-6700HQ (ex. the Asus G752VT). Older laptops based on the Core i7-4720HQ processor, which is now two generations past, come in 6 to 8% behind on average. Even the expensive Core i7-6820HK cannot always get ahead.
| Cinebench R15 | |
| CPU Single 64Bit (sort by value) | |
| MIFcom EG7 | |
| Schenker XMG A706 | |
| Medion Erazer X7615-MD99293 | |
| Asus G752VT | |
| Schenker XMG P706 | |
| MSI GT72S 6QF | |
| CPU Multi 64Bit (sort by value) | |
| MIFcom EG7 | |
| Schenker XMG A706 | |
| Medion Erazer X7615-MD99293 | |
| Asus G752VT | |
| Schenker XMG P706 | |
| MSI GT72S 6QF | |
| Cinebench R11.5 | |
| CPU Single 64Bit (sort by value) | |
| MIFcom EG7 | |
| Schenker XMG A706 | |
| Medion Erazer X7615-MD99293 | |
| Asus G752VT | |
| Schenker XMG P706 | |
| MSI GT72S 6QF | |
| CPU Multi 64Bit (sort by value) | |
| MIFcom EG7 | |
| Schenker XMG A706 | |
| Medion Erazer X7615-MD99293 | |
| Asus G752VT | |
| Schenker XMG P706 | |
| MSI GT72S 6QF | |
System Performance
Since our test configuration has to make do with a SATA III SSD, its results in the system benchmarks are somewhat lower than those of competitors with PCIe or NVM SSDs. 5974 points in PCMark 7 are reminiscent of the total score of the similarly equipped Schenker XMG A706. Subjectively, Windows 10 seems to run very smoothly and reacts to input quickly.
| PCMark 7 Score | 5974 points | |
Help | ||
| PCMark 7 - Score (sort by value) | |
| MIFcom EG7 | |
| Schenker XMG A706 | |
| Medion Erazer X7615-MD99293 | |
| Asus G752VT | |
| Schenker XMG P706 | |
| MSI GT72S 6QF | |
Storage Devices
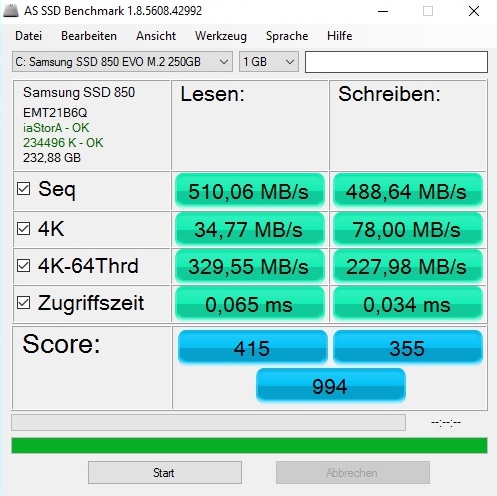
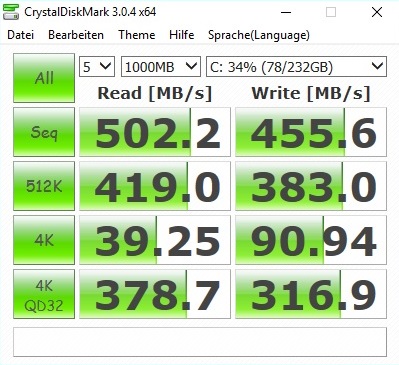
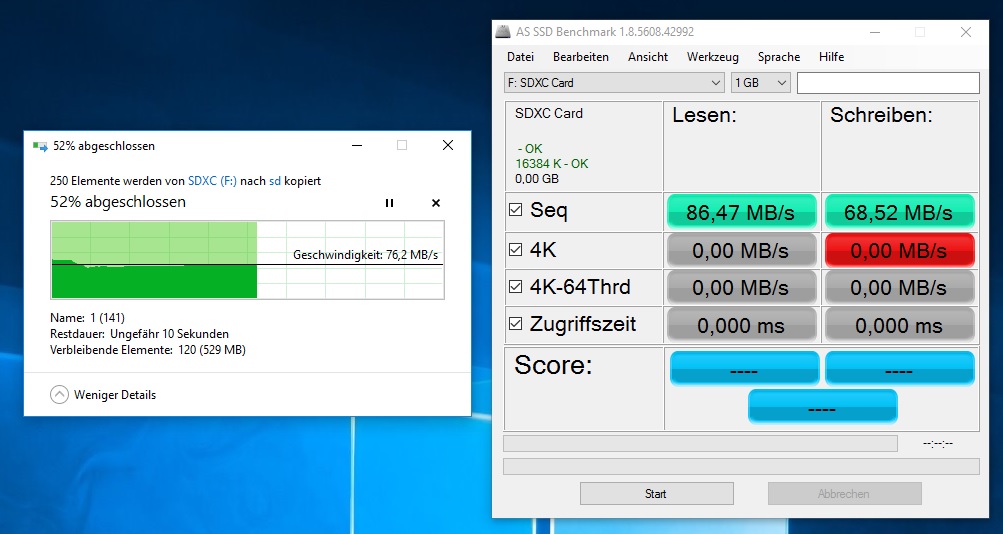
MIFcom has equipped our basic model with a generous 250 GB Samsung M.2 SSD and a 1000 GB 2.5-inch HDD from HGST. The AS SSD benchmark confirms that the Samsung 850 EVO performs well and is only impeded by the SATA III limit in the sequential portion of the test (maximum 500 to 550 MB/s). In ideal cases, solid-state drives with PCIe or NVMe technology reach over 1000 or even 2000 MB/s - though this only becomes apparent when transferring large quantities of data. For most gamers, a classic SATA III model should certainly be sufficient.
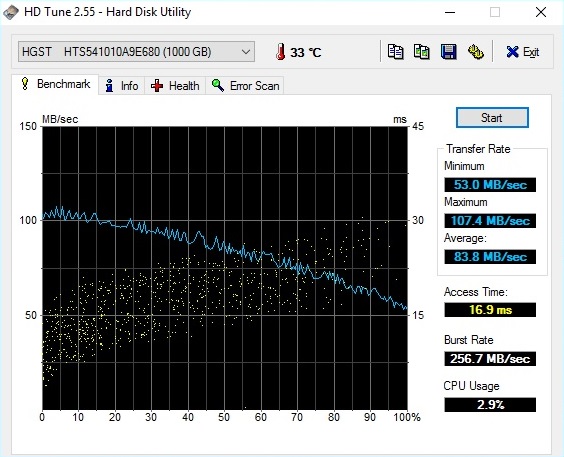
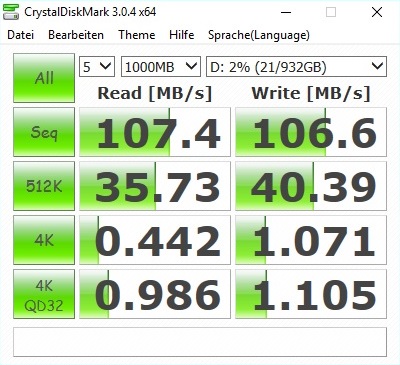
When it comes to the secondary hard drive, we recommend an upgrade. Due to the drive's relatively low rotational speed (5400 rpm), despite its acceptable benchmark scores, the HGST Travelstar 5K1000 is at times considerably slower than an HDD with 7200 rpm when loading games and game statuses.

| MIFcom EG7 Samsung SSD 850 EVO M.2 250 GB | Schenker XMG A706 Samsung SSD 850 EVO M.2 250 GB | Medion Erazer X7615-MD99293 Samsung SSD PM851 128 GB MZMTE128HMGR | Asus G752VT Samsung PM951 NVMe MZVLV128 | Schenker XMG P706 Samsung SM951 MZHPV512HDGL m.2 PCI-e | MSI GT72S 6QF 2x Micron M600 MTFDDAV128MBF NVMe (RAID 0) | |
|---|---|---|---|---|---|---|
| AS SSD | 0% | -17% | 118% | 154% | ||
| Seq Read (MB/s) | 510 | 504 -1% | 479.3 -6% | 1863 265% | 2544 399% | |
| Seq Write (MB/s) | 488.6 | 469.7 -4% | 132.9 -73% | 1273 161% | 1279 162% | |
| 4K Read (MB/s) | 34.77 | 35.54 2% | 32.6 -6% | 39.93 15% | 42.98 24% | |
| 4K Write (MB/s) | 78 | 77.7 0% | 90.7 16% | 95.3 22% | 97.8 25% | |
| Score Total (Points) | 994 | 1042 5% | 812 -18% | 2278 129% | 2568 158% |
Graphics Cards
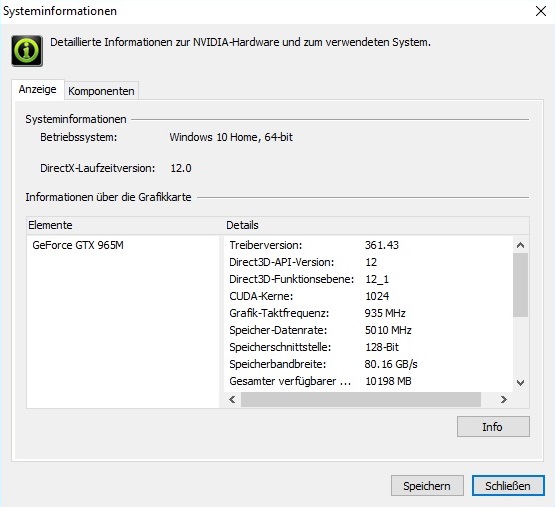
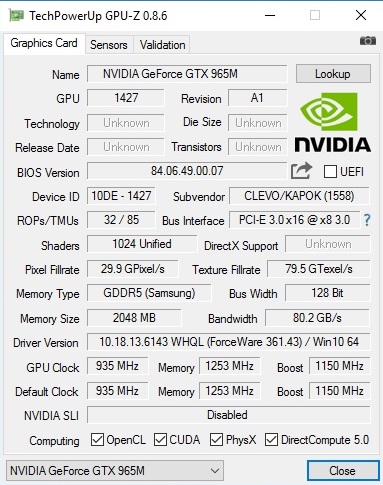
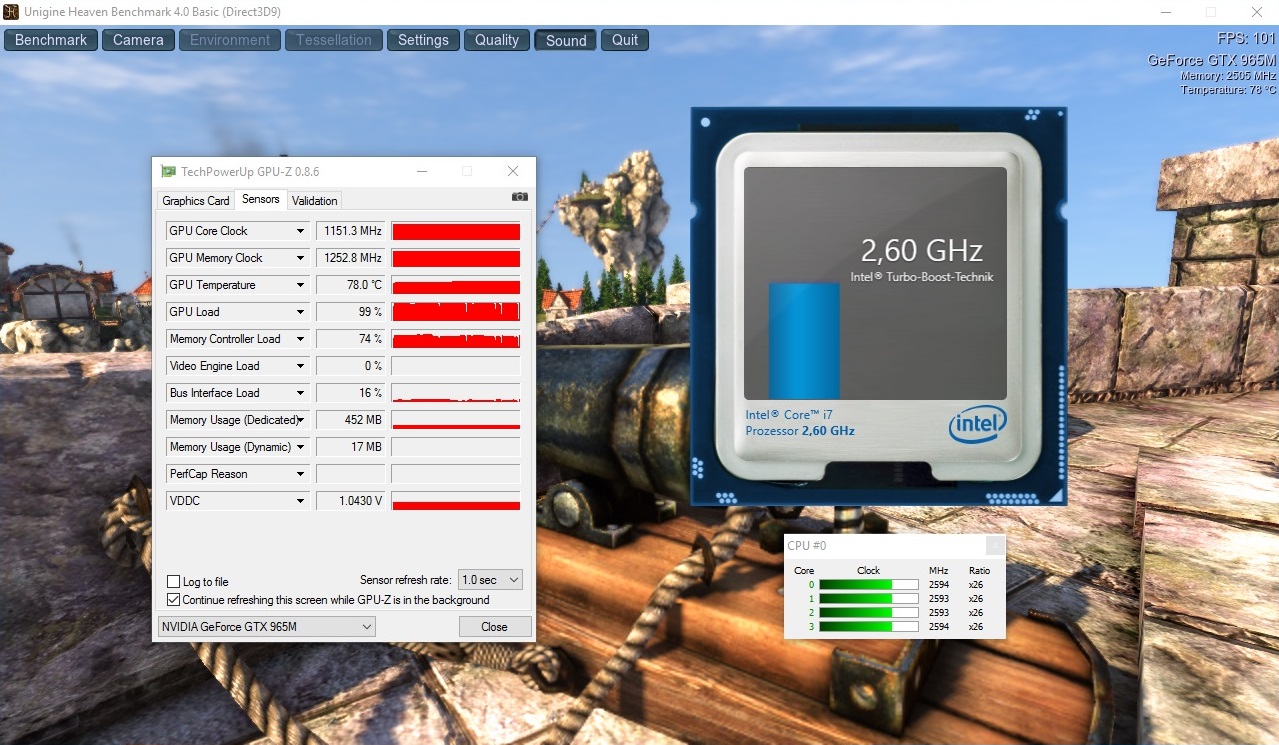
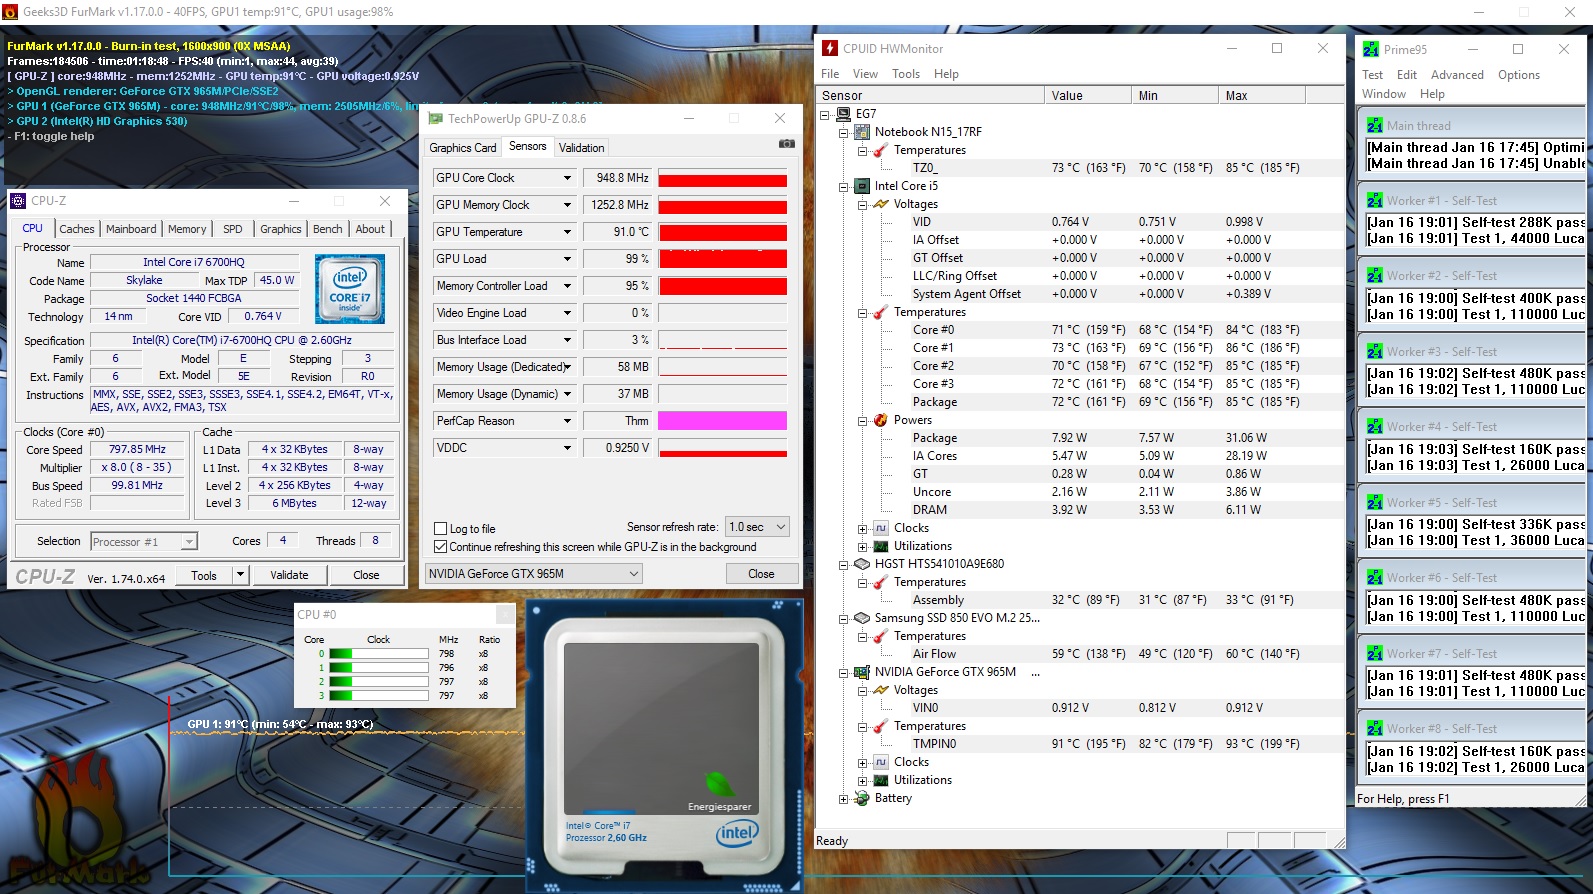
At a first glance, the newly upgraded GeForce GTX 965M has hardly changed at all. The 2016 edition still offers 1024 Shader units and 2048 MB of GDDR5 memory, which effectively clocks at 5000 MHz and is connected via a 128-bit bus. The most important difference is the higher clock rates. Instead of 950 MHz, Nvidia has designed the new model to run at up to 1150 MHz, which equates to a 21% increase (base clock frequency: 935 vs. 924 MHz). In the case MIFcom EG7, the GPU turbo is maintained in most 3D applications; only in the stress test with FurMark and Prime95 running simultaneously did the core speed sink to around 950 MHz. Much to our delight, the GPU never throttled.
| 3DMark 06 Standard Score | 23854 points | |
| 3DMark Vantage P Result | 23562 points | |
| 3DMark 11 Performance | 7939 points | |
| 3DMark Ice Storm Standard Score | 68957 points | |
| 3DMark Cloud Gate Standard Score | 18607 points | |
| 3DMark Fire Strike Score | 5243 points | |
Help | ||
In terms of performance, we can say that the GeForce GTX 965M deserves high marks. With a GPU score of 5973 points in 3DMark 13's Fire Strike test, the high-end model sprints past the GeForce GTX 960M by a margin of almost 40% (4353 points; Schenker XMG A706) and past the old GTX 965M by a margin of more than 10% (5380 points; Medion Erazer X7615). Our test model comes in about 20% behind the GTX 970M (7546 points; Asus G752VT). The MIFcom EG7 does not stand a chance against the top Nvidia models. The GTX 980 performs more than 60% faster, and the GTX 980M beats our GPU by over 120%. In order to save energy in idle mode and under low levels of load (office, video, web, etc.), the 17-inch device uses Nvidia's Optimus technology - an innovation that dynamically switches between the integrated and the dedicated graphics processors.
| 3DMark | |
| 1920x1080 Fire Strike Graphics (sort by value) | |
| MIFcom EG7 | |
| Schenker XMG A706 | |
| Medion Erazer X7615-MD99293 | |
| Asus G752VT | |
| Schenker XMG P706 | |
| MSI GT72S 6QF | |
| 3840x2160 Fire Strike Ultra Graphics (sort by value) | |
| MIFcom EG7 | |
| 3DMark 11 - 1280x720 Performance GPU (sort by value) | |
| MIFcom EG7 | |
| Schenker XMG A706 | |
| Medion Erazer X7615-MD99293 | |
| Asus G752VT | |
| Schenker XMG P706 | |
| MSI GT72S 6QF | |
Gaming Performance
MIFcom has installed the most current graphics driver on our test device (361.43), which in our experience fails to prevent bluescreens. Speaking purely of performance - with the exception of the “Assassin's Creed Syndicate” at maximum settings we did not get any unpleasant surprises. As expected, the GTX 965M settles in about halfway between the GTX 970M and the GTX 960M - an improvement over the old version, which strongly tended towards the GTX 960M range.
| Just Cause 3 | |
| 1920x1080 Very High / On AA:SM AF:16x (sort by value) | |
| MIFcom EG7 | |
| Schenker XMG A505 | |
| Schenker W504 | |
| Schenker W504 | |
| 1920x1080 High / On AA:FX AF:8x (sort by value) | |
| MIFcom EG7 | |
| Schenker XMG A505 | |
| Schenker W504 | |
| Schenker W504 | |
| Rainbow Six Siege | |
| 1920x1080 Ultra Preset AA:T AF:16x (sort by value) | |
| MIFcom EG7 | |
| Schenker XMG A505 | |
| Schenker W504 | |
| Schenker W504 | |
| 1920x1080 High Preset AA:T AF:4x (sort by value) | |
| MIFcom EG7 | |
| Schenker XMG A505 | |
| Schenker W504 | |
| Schenker W504 | |
| Assassin's Creed Syndicate - 1920x1080 High Preset AA:FX (sort by value) | |
| MIFcom EG7 | |
| Schenker XMG A505 | |
| Schenker W504 | |
| Schenker W504 | |
| Schenker XMG U716 | |
| Star Wars Battlefront | |
| 1920x1080 Ultra Preset AA:FX (sort by value) | |
| MIFcom EG7 | |
| Schenker XMG A505 | |
| Schenker W504 | |
| Schenker W504 | |
| Schenker XMG U716 | |
| 1920x1080 High Preset AA:FX (sort by value) | |
| MIFcom EG7 | |
| Schenker XMG A505 | |
| Schenker W504 | |
| Schenker W504 | |
| Schenker XMG U716 | |
| Fallout 4 | |
| 1920x1080 Ultra Preset AA:T AF:16x (sort by value) | |
| MIFcom EG7 | |
| Schenker XMG A505 | |
| Schenker W504 | |
| Schenker W504 | |
| Schenker XMG U716 | |
| 1920x1080 High Preset AA:T AF:16x (sort by value) | |
| MIFcom EG7 | |
| Schenker XMG A505 | |
| Schenker W504 | |
| Schenker W504 | |
| Schenker XMG U716 | |
| Call of Duty: Black Ops 3 | |
| 1920x1080 Extra / On AA:T2x SM (sort by value) | |
| MIFcom EG7 | |
| Schenker XMG A505 | |
| Schenker W504 | |
| Schenker W504 | |
| Schenker XMG U716 | |
| 1920x1080 High / On AA:FX (sort by value) | |
| MIFcom EG7 | |
| Schenker XMG A505 | |
| Schenker W504 | |
| Schenker W504 | |
| Schenker XMG U716 | |
| Anno 2205 | |
| 1920x1080 Ultra High Preset AA:8x (sort by value) | |
| MIFcom EG7 | |
| Schenker XMG A505 | |
| Schenker W504 | |
| Schenker W504 | |
| Schenker XMG U716 | |
| 1920x1080 High Preset AA:4x (sort by value) | |
| MIFcom EG7 | |
| Schenker XMG A505 | |
| Schenker W504 | |
| Schenker W504 | |
| Schenker XMG U716 | |
| FIFA 16 - 1920x1080 High Preset AA:4x MS (sort by value) | |
| MIFcom EG7 | |
| Schenker XMG A505 | |
| Schenker W504 | |
| Schenker W504 | |
| Schenker XMG U716 | |
| Mad Max | |
| 1920x1080 Very High Preset AF:12x (sort by value) | |
| MIFcom EG7 | |
| Schenker XMG A505 | |
| Schenker W504 | |
| Schenker W504 | |
| Schenker XMG U716 | |
| 1920x1080 High Preset AF:6x (sort by value) | |
| MIFcom EG7 | |
| Schenker XMG A505 | |
| Schenker W504 | |
| Schenker W504 | |
| Schenker XMG U716 | |
| Batman: Arkham Knight | |
| 1920x1080 High / On AA:SM AF:16x (sort by value) | |
| MIFcom EG7 | |
| Schenker XMG A505 | |
| Medion Erazer X7615-MD99293 | |
| Schenker W504 | |
| Schenker W504 | |
| Schenker XMG U716 | |
| 1920x1080 High / On (Interactive Smoke & Paper Debris Off) AA:SM AF:8x (sort by value) | |
| MIFcom EG7 | |
| Schenker XMG A505 | |
| Medion Erazer X7615-MD99293 | |
| Schenker W504 | |
| Schenker W504 | |
| Schenker XMG U716 | |
| The Witcher 3 | |
| 1920x1080 Ultra Graphics & Postprocessing (HBAO+) (sort by value) | |
| MIFcom EG7 | |
| Schenker XMG A505 | |
| Medion Erazer X7615-MD99293 | |
| Schenker W504 | |
| Schenker W504 | |
| Schenker XMG U716 | |
| 1920x1080 High Graphics & Postprocessing (Nvidia HairWorks Off) (sort by value) | |
| MIFcom EG7 | |
| Schenker XMG A505 | |
| Medion Erazer X7615-MD99293 | |
| Schenker W504 | |
| Schenker W504 | |
| Schenker XMG U716 | |
| Dirt Rally | |
| 1920x1080 Ultra Preset AA:4x MS (sort by value) | |
| MIFcom EG7 | |
| Schenker XMG A505 | |
| Medion Erazer X7615-MD99293 | |
| Schenker W504 | |
| Schenker W504 | |
| Schenker XMG U716 | |
| 1920x1080 High Preset (sort by value) | |
| MIFcom EG7 | |
| Schenker XMG A505 | |
| Medion Erazer X7615-MD99293 | |
| Schenker W504 | |
| Schenker W504 | |
| Schenker XMG U716 | |
| Dragon Age: Inquisition | |
| 1920x1080 Ultra Graphics Quality AA:2x MS (sort by value) | |
| MIFcom EG7 | |
| Schenker XMG A505 | |
| Medion Erazer X7615-MD99293 | |
| Schenker XMG P705 | |
| Schenker XMG U716 | |
| 1920x1080 High Graphics Quality (sort by value) | |
| MIFcom EG7 | |
| Schenker XMG A505 | |
| Medion Erazer X7615-MD99293 | |
| Schenker XMG P705 | |
| Schenker XMG U716 | |
| Far Cry 4 | |
| 1920x1080 Ultra Graphics Quality AA:SM (sort by value) | |
| MIFcom EG7 | |
| Schenker XMG A505 | |
| Schenker XMG P705 | |
| Schenker XMG U716 | |
| 1920x1080 High Graphics Quality AA:SM (sort by value) | |
| MIFcom EG7 | |
| Schenker XMG A505 | |
| Schenker XMG P705 | |
| Schenker XMG U716 | |
| Alien: Isolation | |
| 1920x1080 Ultra, On, Shadow Map 2048, HDAO AA:2x SM AF:16x (sort by value) | |
| MIFcom EG7 | |
| Schenker XMG A505 | |
| Medion Erazer X7615-MD99293 | |
| Schenker XMG P705 | |
| Schenker XMG P505 | |
| MSI GT72-2QE32SR311BW | |
| Schenker XMG U716 | |
| 1920x1080 High, On, Shadow Map 1536, Standard SSAO AA:FX AF:8x (sort by value) | |
| MIFcom EG7 | |
| Schenker XMG A505 | |
| Medion Erazer X7615-MD99293 | |
| Schenker XMG P705 | |
| Schenker XMG P505 | |
| MSI GT72-2QE32SR311BW | |
| Schenker XMG U716 | |
| Sims 4 | |
| 1920x1080 Ultra Preset (sort by value) | |
| MIFcom EG7 | |
| Schenker XMG A505 | |
| Medion Erazer X7615-MD99293 | |
| Schenker XMG P705 | |
| Schenker XMG P505 | |
| MSI GT72-2QE32SR311BW | |
| Schenker XMG U716 | |
| 1920x1080 High Preset (sort by value) | |
| MIFcom EG7 | |
| Schenker XMG A505 | |
| Medion Erazer X7615-MD99293 | |
| Schenker XMG P705 | |
| Schenker XMG P505 | |
| MSI GT72-2QE32SR311BW | |
| Schenker XMG U716 | |
| GRID: Autosport | |
| 1920x1080 Ultra Preset AA:4x MS (sort by value) | |
| MIFcom EG7 | |
| Schenker XMG A505 | |
| Medion Erazer X7615-MD99293 | |
| Schenker XMG P705 | |
| Schenker XMG P505 | |
| MSI GT72-2QE32SR311BW | |
| Schenker XMG U716 | |
| 1920x1080 High Preset (sort by value) | |
| MIFcom EG7 | |
| Schenker XMG A505 | |
| Medion Erazer X7615-MD99293 | |
| Schenker XMG P705 | |
| Schenker XMG P505 | |
| MSI GT72-2QE32SR311BW | |
| Schenker XMG U716 | |
| Watch Dogs | |
| 1920x1080 Ultra Overall Quality, Ultra Textures AA:4x MS (sort by value) | |
| MIFcom EG7 | |
| Schenker XMG A505 | |
| Medion Erazer X7615-MD99293 | |
| Schenker XMG P705 | |
| Schenker XMG P505 | |
| MSI GT72-2QE32SR311BW | |
| Schenker XMG U716 | |
| 1920x1080 High Overall Quality, High Textures AA:2x MS (sort by value) | |
| MIFcom EG7 | |
| Schenker XMG A505 | |
| Medion Erazer X7615-MD99293 | |
| Schenker XMG P705 | |
| Schenker XMG P505 | |
| MSI GT72-2QE32SR311BW | |
| Schenker XMG U716 | |
| Thief - 1920x1080 Very High Preset AA:FXAA & High SS AF:8x (sort by value) | |
| MIFcom EG7 | |
| Schenker XMG A505 | |
| Schenker XMG P705 | |
| Schenker XMG P505 | |
| MSI GT72-2QE32SR311BW | |
| Schenker XMG U716 | |
| Battlefield 4 - 1920x1080 Ultra Preset AA:4x MS (sort by value) | |
| MIFcom EG7 | |
| Schenker XMG A505 | |
| Schenker XMG P705 | |
| Schenker XMG P505 | |
| MSI GT72-2QE32SR311BW | |
| Schenker XMG U716 | |
| Metro: Last Light - 1920x1080 Very High (DX11) AF:16x (sort by value) | |
| MIFcom EG7 | |
| Schenker XMG A505 | |
| Schenker XMG P705 | |
| Schenker XMG P505 | |
| MSI GT72-2QE32SR311BW | |
| Schenker XMG U716 | |
| BioShock Infinite - 1920x1080 Ultra Preset, DX11 (DDOF) (sort by value) | |
| MIFcom EG7 | |
| Schenker XMG A505 | |
| Schenker XMG P705 | |
| Schenker XMG P505 | |
| MSI GT72-2QE32SR311BW | |
| Schenker XMG U716 | |
| Tomb Raider - 1920x1080 Ultra Preset AA:FX AF:16x (sort by value) | |
| MIFcom EG7 | |
| Schenker XMG A505 | |
| Schenker XMG P705 | |
| Schenker XMG P505 | |
| MSI GT72-2QE32SR311BW | |
| Schenker XMG U716 | |
| Crysis 3 - 1920x1080 Very High Preset AA:2xSM AF:16x (sort by value) | |
| MIFcom EG7 | |
| Schenker XMG A505 | |
| Schenker XMG P705 | |
| Schenker XMG P505 | |
| MSI GT72-2QE32SR311BW | |
| Schenker XMG U716 | |
Disregarding 4K resolution, the MIFcom EG7 is powerful enough to render games smoothly at high settings. It takes maximum details and multisample anti-aliasing to break the GeForce 965M into a sweat. Consequently: Anyone unwilling to make compromises and/or run games on a 4K display should purchase at a minimum, a GeForce GTX 970M. But for gamers who demand less of their system and have a more limited budget, the GTX 965M is ideal. More information on the new high-end chip is available in our GPU test.
Graphics card |
Overall performance (High/Ultra @FHD) GeForce GTX 960M |
-24% GeForce GTX 965M old |
-10% GeForce GTX 965M new |
base GeForce GTX 970M |
+26% GeForce GTX 980M |
+56% GeForce GTX 980 |
+116% |
|---|
| low | med. | high | ultra | 4K | |
|---|---|---|---|---|---|
| Crysis 3 (2013) | 125 | 97.9 | 70.1 | 27.1 | |
| Tomb Raider (2013) | 365.6 | 242.9 | 141.8 | 67.2 | |
| BioShock Infinite (2013) | 181.6 | 149.4 | 141.4 | 55.3 | |
| Metro: Last Light (2013) | 114.9 | 111.4 | 83.4 | 44.3 | |
| Battlefield 4 (2013) | 188.5 | 151.1 | 109.4 | 43.3 | 21.2 |
| Thief (2014) | 89.8 | 82 | 72.8 | 38.9 | |
| Watch Dogs (2014) | 83.7 | 73.9 | 38.4 | 23.4 | |
| GRID: Autosport (2014) | 189.3 | 120.4 | 103.1 | 66.2 | |
| Sims 4 (2014) | 192.3 | 127.6 | 87.1 | 74.4 | |
| Alien: Isolation (2014) | 194.6 | 165.5 | 87.4 | 62.2 | |
| Far Cry 4 (2014) | 93.4 | 91.2 | 49 | 38.2 | |
| Dragon Age: Inquisition (2014) | 124.7 | 107.5 | 43.6 | 29.6 | |
| Dirt Rally (2015) | 215.7 | 103.4 | 86.2 | 44.3 | 38.9 |
| The Witcher 3 (2015) | 115.7 | 67.9 | 37.3 | 20.8 | 13.1 |
| Batman: Arkham Knight (2015) | 96 | 84 | 39 | 21 | 10 |
| Mad Max (2015) | 139.3 | 69.9 | 63.8 | 20.9 | |
| FIFA 16 (2015) | 216.6 | 180.1 | 127.1 | 51 | |
| Anno 2205 (2015) | 129.2 | 98.7 | 44.2 | 15.4 | 15.5 |
| Call of Duty: Black Ops 3 (2015) | 121.4 | 98.6 | 49.8 | 38.6 | 13.3 |
| Fallout 4 (2015) | 124 | 77.6 | 41.8 | 35 | 13.9 |
| Star Wars Battlefront (2015) | 170.2 | 117.1 | 55.9 | 47.3 | 16.3 |
| Assassin's Creed Syndicate (2015) | 66.4 | 60.6 | 35.5 | 2.7 | 0 () |
| Rainbow Six Siege (2015) | 190 | 131 | 71.8 | 45.8 | 0 () |
| Just Cause 3 (2015) | 93.6 | 87.1 | 48.4 | 42.8 | 14.4 |
Emissions
System Noise
Compared to the predecessor Barebone N170RD, the EG7's noise level is only higher in certain situations. 36 to 41 dB(A) in 3DMark 06 and a maximum of 43 dB(A) under full load are very low sound pressure levels for a high-end notebook. One of the GTX 965M's competitors, the Medion Erazer X7615 reached up to 54 dB(A) in the stress test - a considerably higher decibel count. Headphones are not necessary in the case of the MIFcom EG7; gaming sounds are only drowned out during quieter scenes.
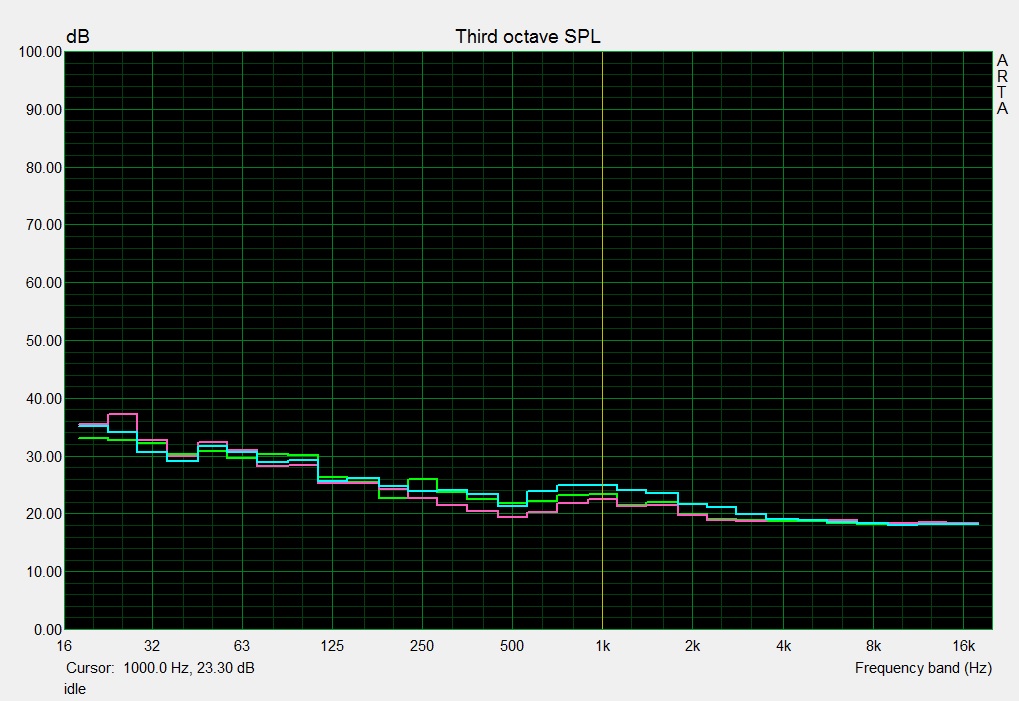
When the notebook has nothing to do, the fans are completely deactivated and the only audible sound is the reasonably quiet whir of the hard drive (32 to 33 dB(A)). Unfortunately, when the HDD is working hard, it generates a rattling noise that could irritate some users. On the positive side, the rotational speed is constant. In our test of the N170RD Barebone, the fans often turned on unnecessarily.
Noise level
| Idle |
| 32 / 33 / 34 dB(A) |
| HDD |
| 33 dB(A) |
| DVD |
| 37 / dB(A) |
| Load |
| 39 / 43 dB(A) |
 | ||
30 dB silent 40 dB(A) audible 50 dB(A) loud |
||
min: | ||
| MIFcom EG7 GeForce GTX 965M, 6700HQ | Schenker XMG A706 GeForce GTX 960M, 6700HQ | Medion Erazer X7615-MD99293 GeForce GTX 965M, 4720HQ | Asus G752VT GeForce GTX 970M, 6700HQ | Schenker XMG P706 GeForce GTX 980M, 6820HK | MSI GT72S 6QF GeForce GTX 980 (Laptop), 6820HK | |
|---|---|---|---|---|---|---|
| Noise | 1% | -11% | 0% | 1% | -7% | |
| Idle Minimum * (dB) | 32 | 29.2 9% | 29.5 8% | 32.9 -3% | 30.9 3% | 33.1 -3% |
| Idle Average * (dB) | 33 | 30.4 8% | 31 6% | 33 -0% | 31.2 5% | 33.3 -1% |
| Idle Maximum * (dB) | 34 | 37.3 -10% | 40.8 -20% | 33.1 3% | 31.2 8% | 37 -9% |
| Load Average * (dB) | 39 | 39.8 -2% | 47.6 -22% | 36.2 7% | 40.5 -4% | 39 -0% |
| Load Maximum * (dB) | 43 | 42.2 2% | 54.4 -27% | 45.8 -7% | 47 -9% | 52.2 -21% |
* ... smaller is better
Temperature
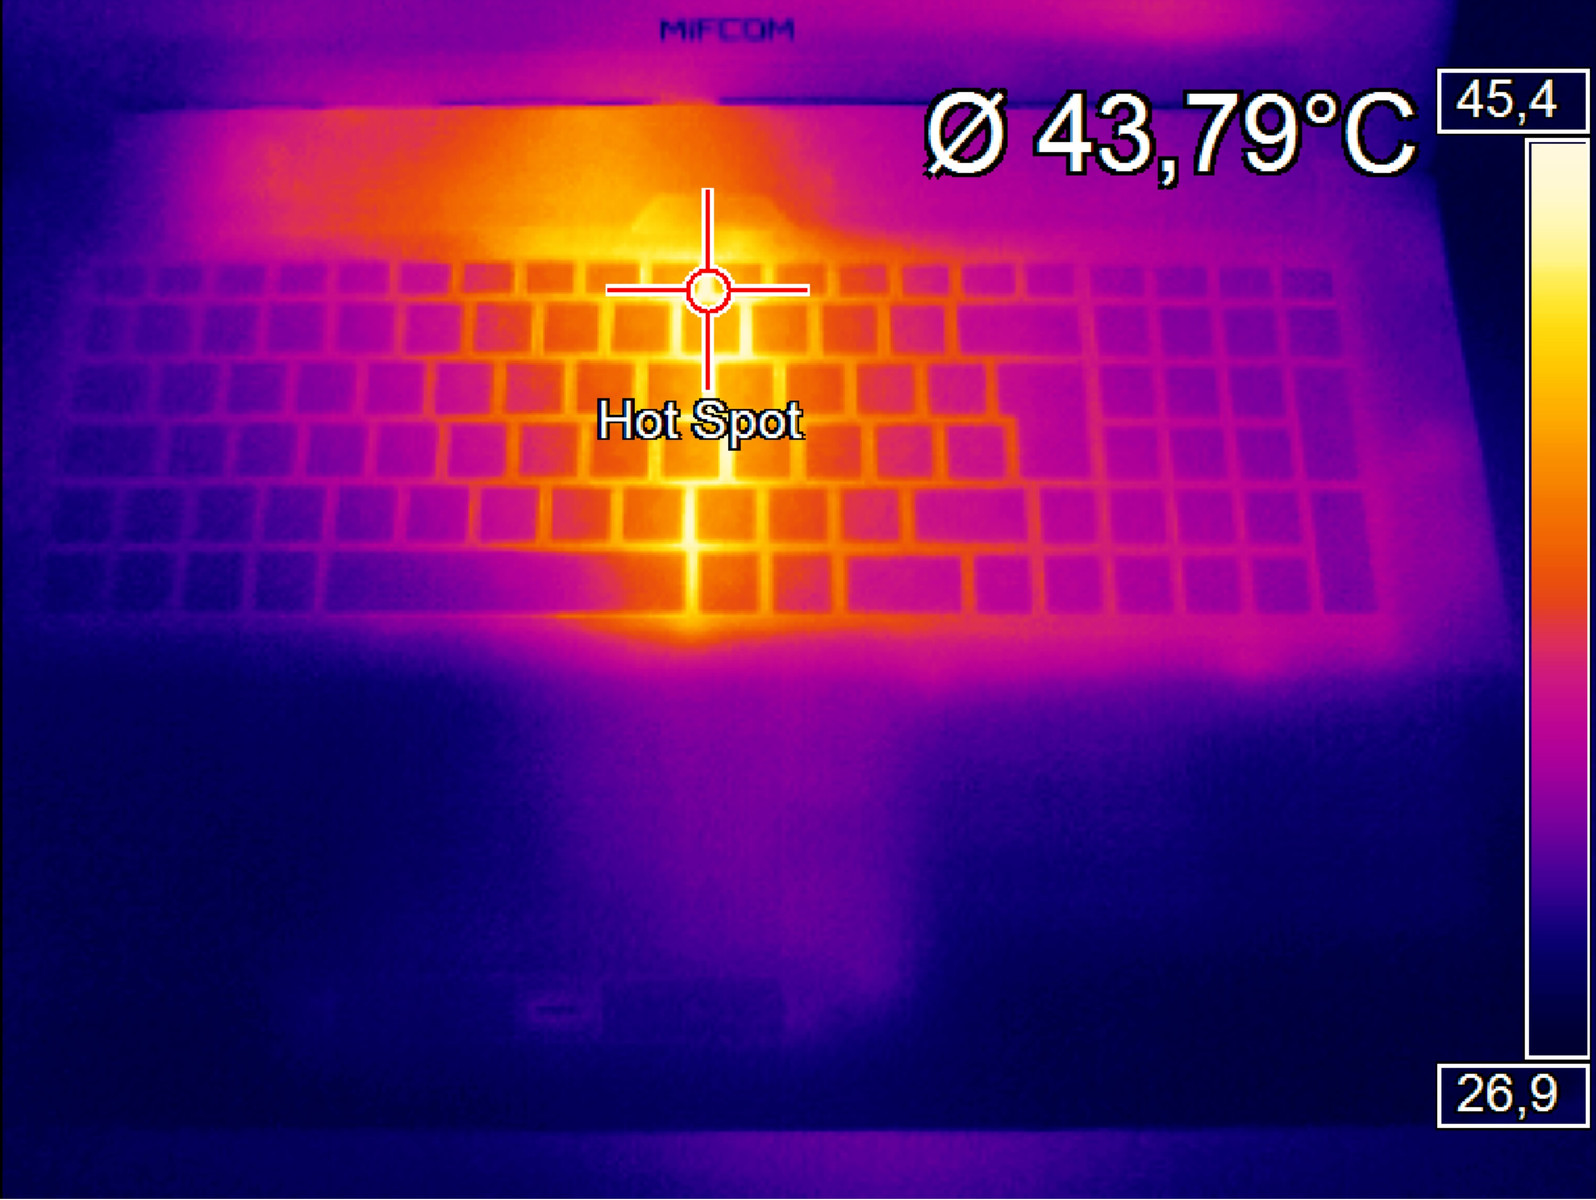
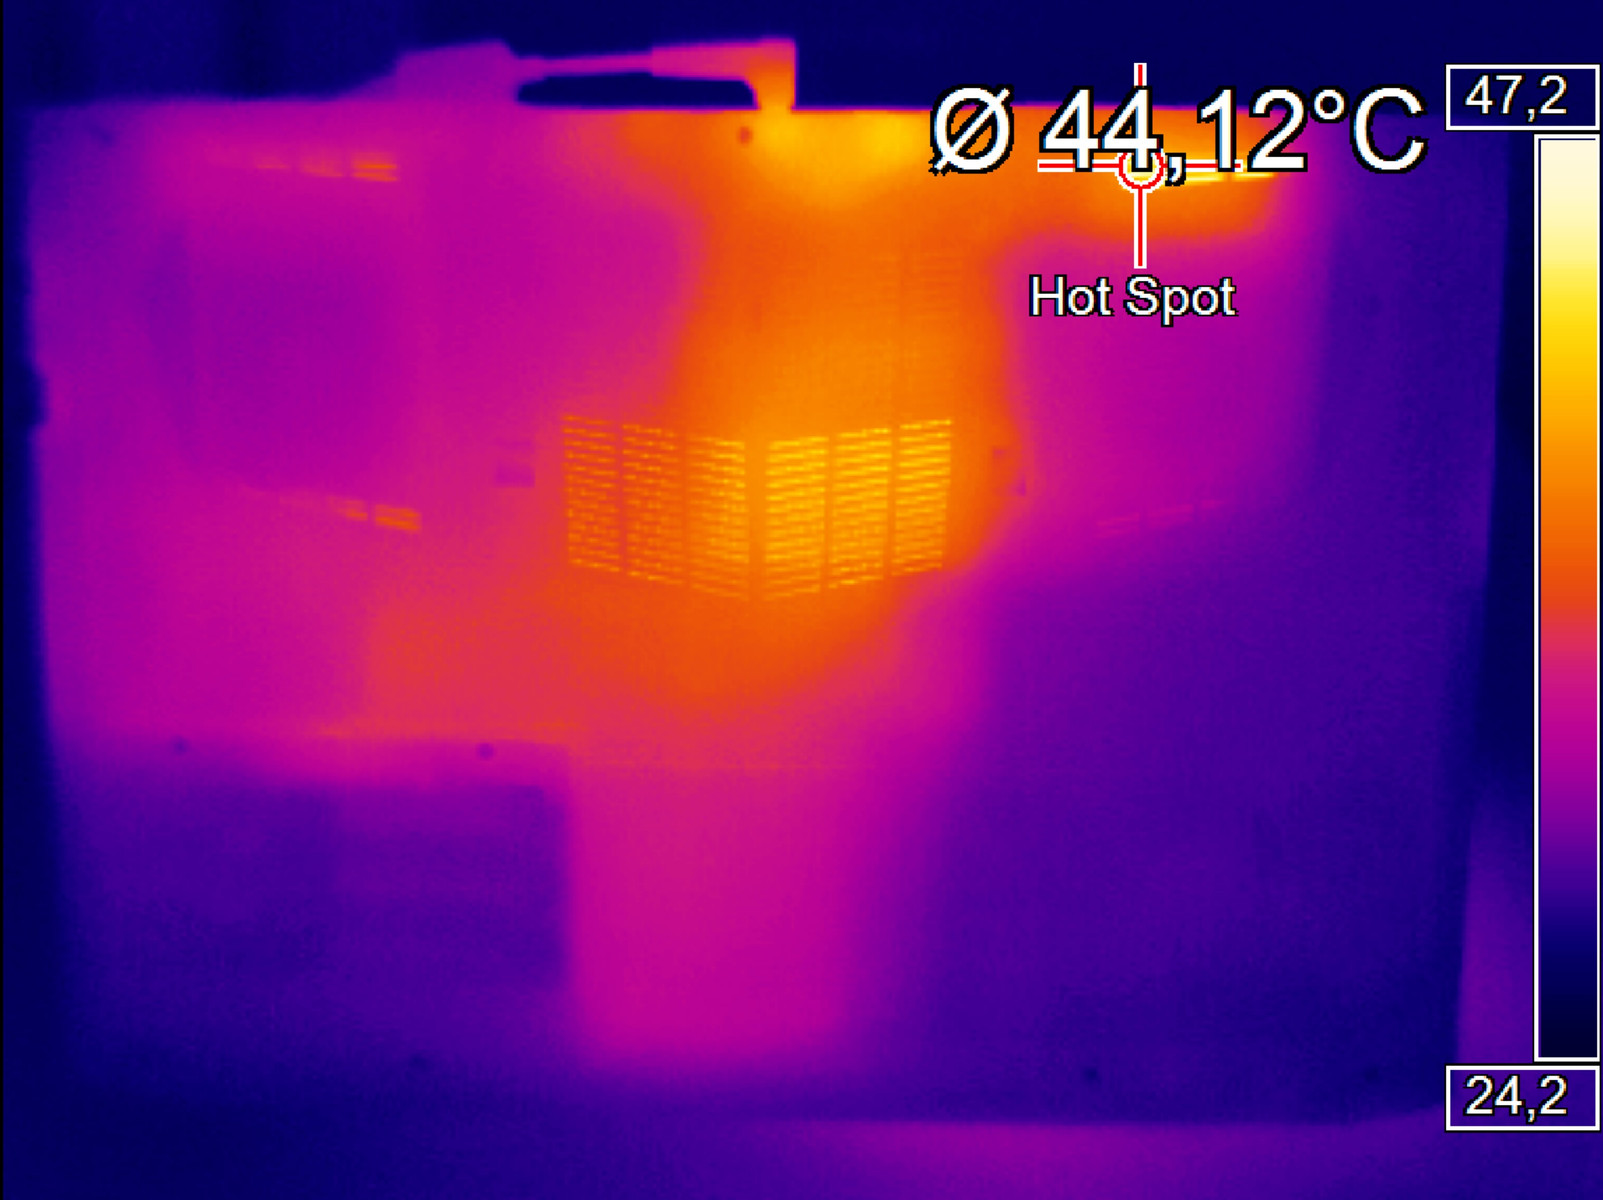
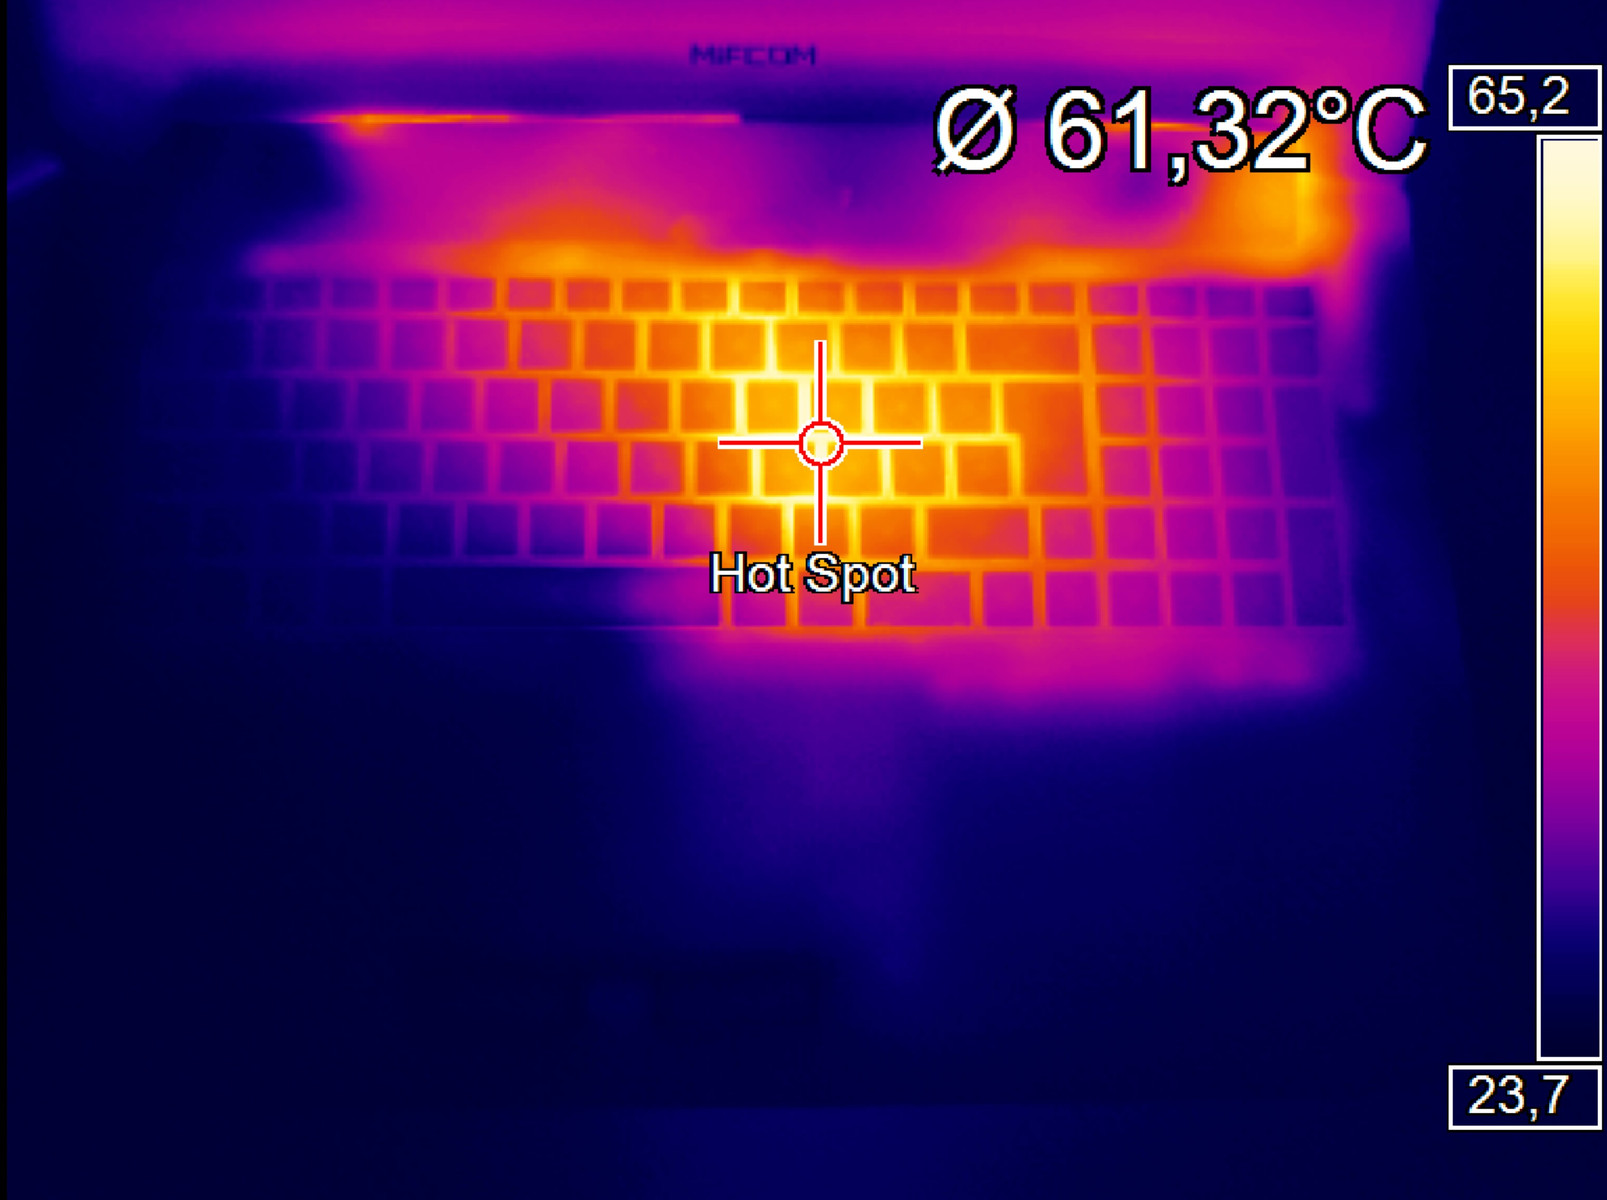
The computer's temperatures are also reasonable. The case did cross the 50 °C (122 °F) mark under full load in some spots, but the WASD area and the palm rest never grew uncomfortably warm. In idle mode, there is hardly anything to complain about. After two hours without load, at around 32 °C (~89.6 °F; top) and 34 °C (~93.2 °F; bottom), the case surface temperatures remain comfortable.
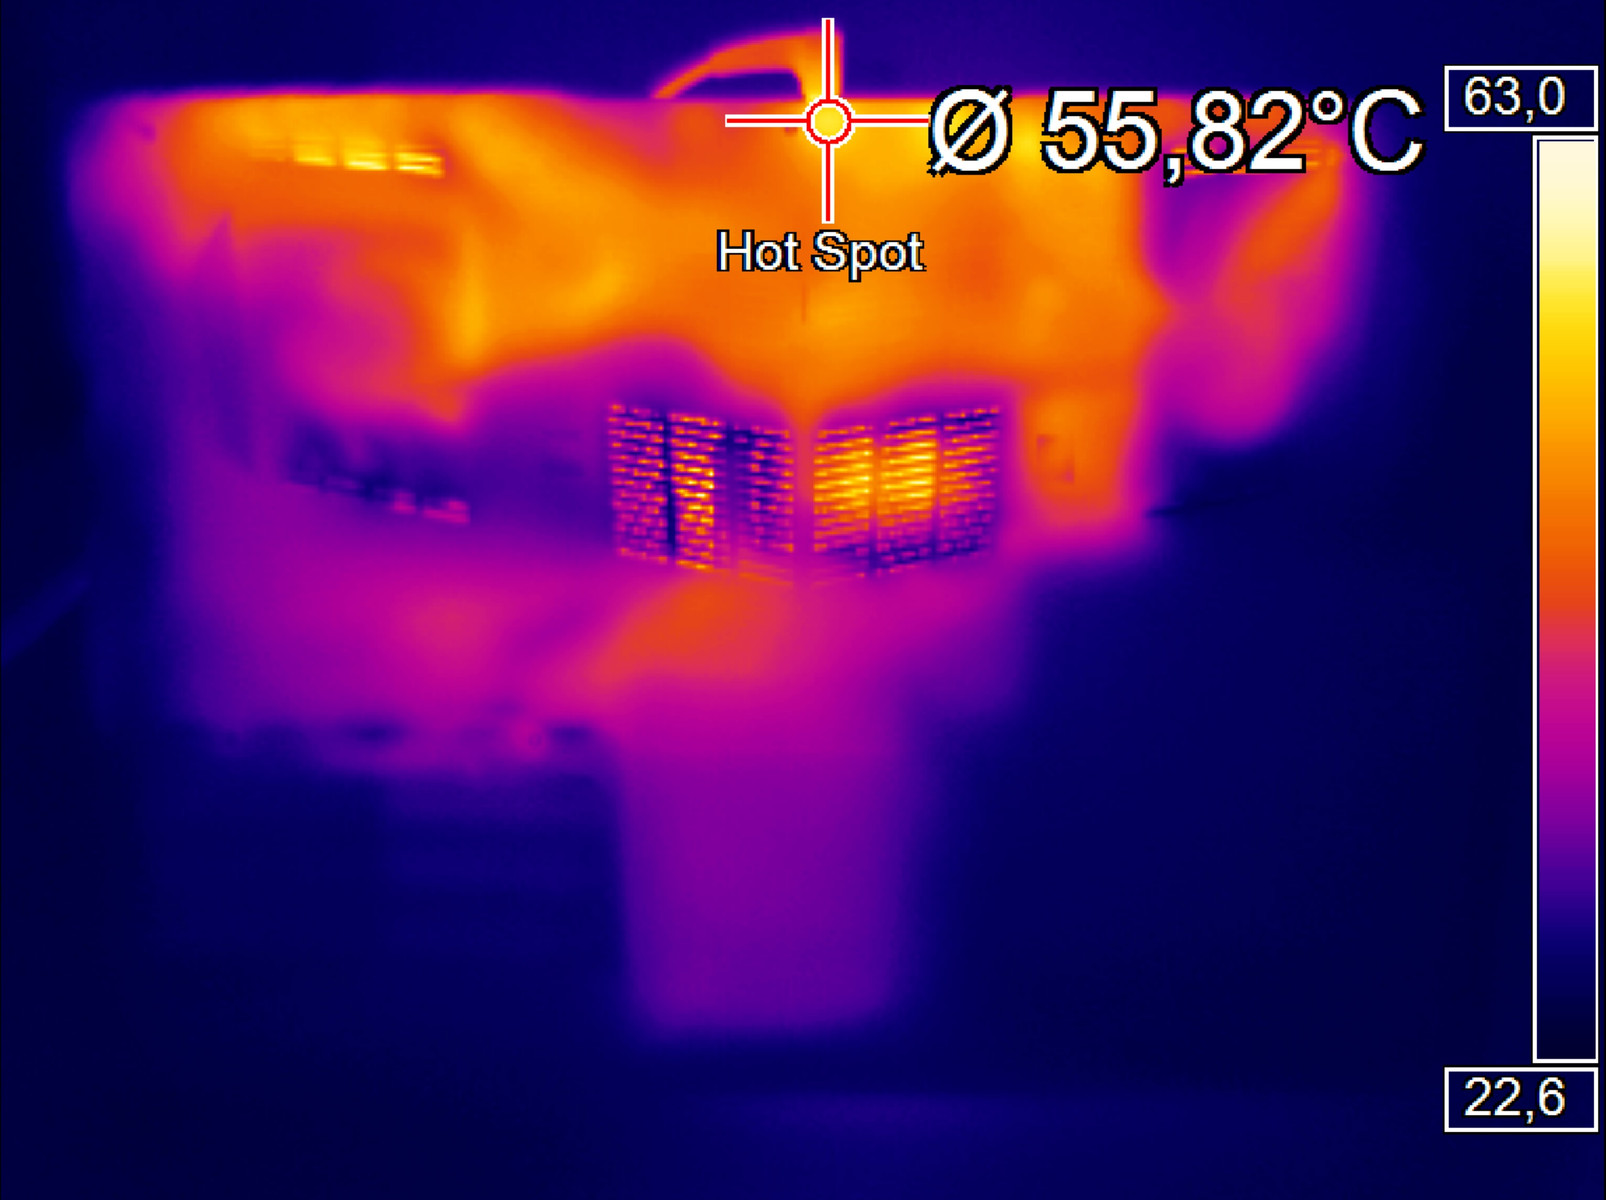
Let us take a look at the components that tend to reach much higher temperatures. While the GeForce GTX 965M heated to up to 93 °C (~199.4 °F), the Core i7 6700HQ only hit a maximum of 86 °C (~186.8 °F). However, the CPU clock rate temporarily dropped from 2.6 GHz to 800 MHz.
(-) The maximum temperature on the upper side is 56.2 °C / 133 F, compared to the average of 40.4 °C / 105 F, ranging from 21.2 to 68.8 °C for the class Gaming.
(-) The bottom heats up to a maximum of 52.4 °C / 126 F, compared to the average of 43.2 °C / 110 F
(+) In idle usage, the average temperature for the upper side is 31.8 °C / 89 F, compared to the device average of 33.9 °C / 93 F.
(+) The palmrests and touchpad are cooler than skin temperature with a maximum of 28.3 °C / 82.9 F and are therefore cool to the touch.
(±) The average temperature of the palmrest area of similar devices was 28.8 °C / 83.8 F (+0.5 °C / 0.9 F).
| MIFcom EG7 GeForce GTX 965M, 6700HQ | Schenker XMG A706 GeForce GTX 960M, 6700HQ | Medion Erazer X7615-MD99293 GeForce GTX 965M, 4720HQ | Asus G752VT GeForce GTX 970M, 6700HQ | Schenker XMG P706 GeForce GTX 980M, 6820HK | MSI GT72S 6QF GeForce GTX 980 (Laptop), 6820HK | |
|---|---|---|---|---|---|---|
| Heat | 1% | -5% | 26% | 21% | 25% | |
| Maximum Upper Side * (°C) | 56.2 | 53.7 4% | 58.8 -5% | 37.6 33% | 44 22% | 39.8 29% |
| Maximum Bottom * (°C) | 52.4 | 61.1 -17% | 69.2 -32% | 38 27% | 42.3 19% | 49 6% |
| Idle Upper Side * (°C) | 39.3 | 37.5 5% | 35.2 10% | 31.6 20% | 31.7 19% | 27.8 29% |
| Idle Bottom * (°C) | 39.8 | 35.5 11% | 36.5 8% | 30.6 23% | 29.9 25% | 26 35% |
* ... smaller is better
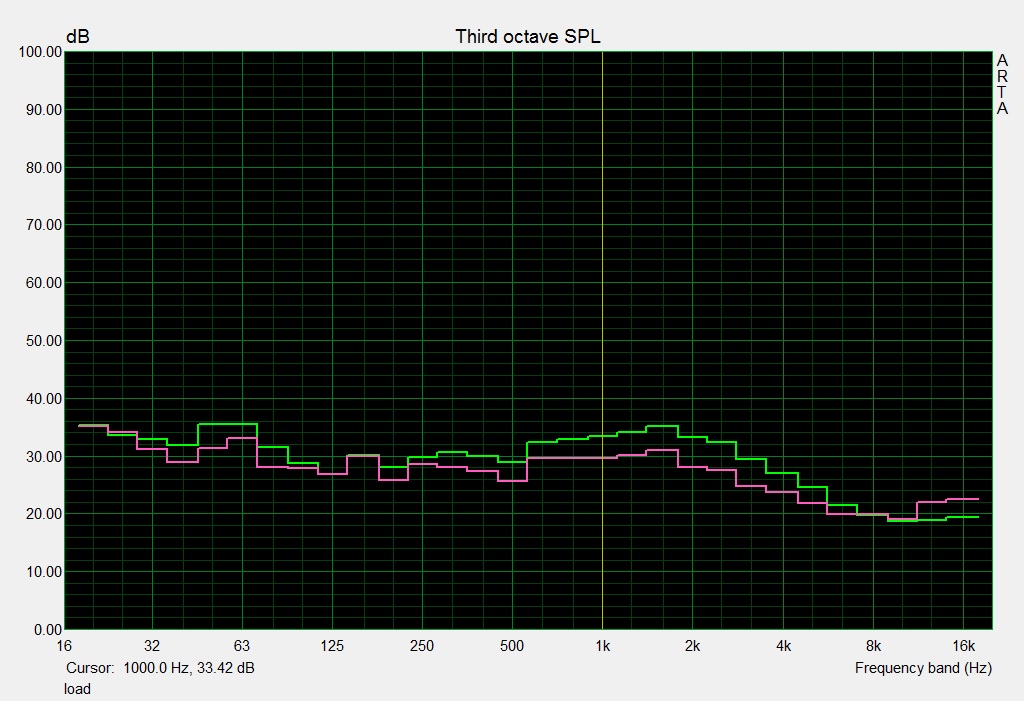
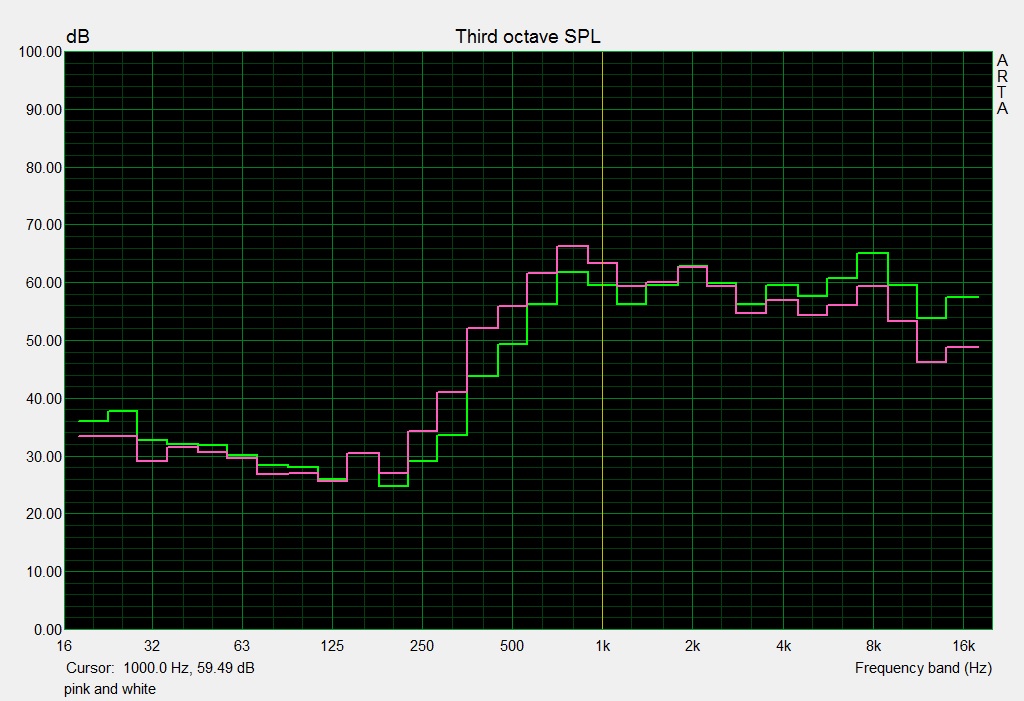
Speakers
For information about the EG7's speakers, see our review of the Schenker XMG A705.
Energy Management
At 11 to 24 watts in idle mode, the amount of energy the 17-inch device uses is similar to that of the Medion Erazer X7615, which is equipped with the old GTX 965M. Under load, the MIFcom EG7 proves to be quite frugal. A power draw of an average of 77 watts in the first scene of 3DMark 06 is lower than that of the Schenker XMG A706, even though the latter runs more than 20% slower. The computer reaches 155 watts under full load, which means that the Barebone producer has designed the power supply to be just barely large enough. In our opinion, a device with a GTX 965M should be provided with 150 rather than 120 watts.
| Off / Standby | |
| Idle | |
| Load |
|
Key:
min: | |
| MIFcom EG7 GeForce GTX 965M, 6700HQ | Schenker XMG A706 GeForce GTX 960M, 6700HQ | Medion Erazer X7615-MD99293 GeForce GTX 965M, 4720HQ | Asus G752VT GeForce GTX 970M, 6700HQ | Schenker XMG P706 GeForce GTX 980M, 6820HK | MSI GT72S 6QF GeForce GTX 980 (Laptop), 6820HK | |
|---|---|---|---|---|---|---|
| Power Consumption | 25% | -2% | -12% | |||
| Idle Minimum * (Watt) | 11 | 5.4 51% | 9 18% | 12 -9% | ||
| Idle Average * (Watt) | 17 | 11 35% | 15.2 11% | 17.9 -5% | ||
| Idle Maximum * (Watt) | 24 | 16.5 31% | 26.6 -11% | 19.3 20% | ||
| Load Average * (Watt) | 77 | 77.8 -1% | 99 -29% | 97.7 -27% | ||
| Load Maximum * (Watt) | 155 | 137.7 11% | 155.8 -1% | 213 -37% |
* ... smaller is better
Battery Life
Despite the battery's moderate size (62 Wh), the notebook's run times are quite good. The EG7 held out just over 7.5 hours in the Battery Eater Reader's Test (minimum brightness). In the Classic Test, which simulates a higher level of load, at maximum display brightness the battery still lasted two hours. Viewers can enjoy HD videos at reduced brightness for about 4.5 hours.
| MIFcom EG7 GeForce GTX 965M, 6700HQ, 62 Wh | Schenker XMG A706 GeForce GTX 960M, 6700HQ, 62 Wh | Medion Erazer X7615-MD99293 GeForce GTX 965M, 4720HQ, 56 Wh | Asus G752VT GeForce GTX 970M, 6700HQ, 67 Wh | Schenker XMG P706 GeForce GTX 980M, 6820HK, 60 Wh | MSI GT72S 6QF GeForce GTX 980 (Laptop), 6820HK, 83 Wh | |
|---|---|---|---|---|---|---|
| Battery runtime | 19% | -38% | -45% | -23% | -20% | |
| Reader / Idle (h) | 7.6 | 11.8 55% | 5.7 -25% | 3.8 -50% | 5 -34% | 6.5 -14% |
| H.264 (h) | 4.4 | 4.7 7% | 3.7 -16% | |||
| Load (h) | 2 | 1.9 -5% | 1 -50% | 1.2 -40% | 1.6 -20% | 1.5 -25% |
| WiFi v1.3 (h) | 5.5 | 3.3 | 3.1 | 3.7 | 4.9 | |
| Gaming (h) | 0.8 |
Pros
Cons
Verdict
With the EG7, MIFcom has designed a solid gaming notebook that, with the exception of the inactive CPU turbo under 3D load, does most things right. The input devices, connectivity options, display and cooling system are well-designed. The manufacturer could improve the relatively mediocre sound quality. The power supply could also provide more power.
Otherwise, the 17-inch notebook proves to offer strong performance and only moderate temperature and noise emissions. Other gaming notebooks grow warmer, and especially louder, under load. The new GeForce GTX 965M expands Nvidia's portfolio with an excellent high-end chip that substantially surpasses the GTX 960M, but otherwise does not threaten the current top models. 2 GB of GDDR5 VRAM prove to bottleneck the performance in some games. Even so, casual gamers will certainly be satisfied with this device.
The MIFcom EG7 is a well-designed and balanced package.
MIFcom EG7
- 01/18/2016 v4.1 (old)
Florian Glaser
Price comparison
