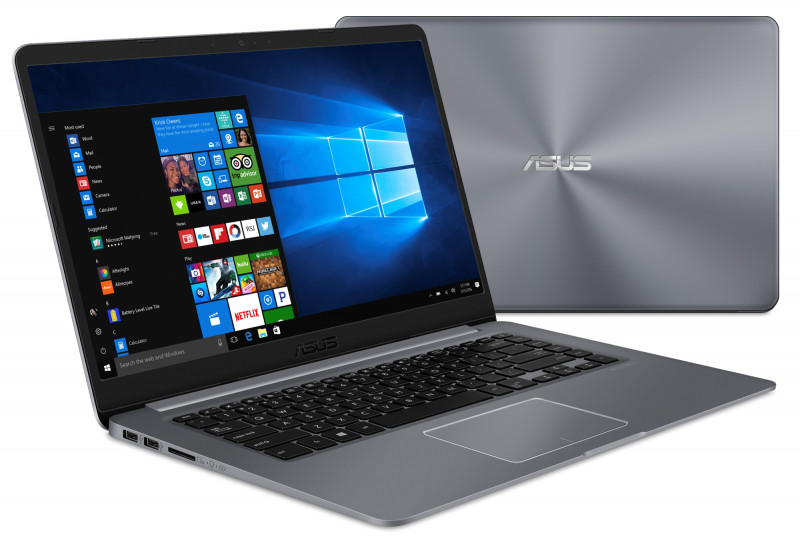
Asus VivoBook 15 Laptop (i5-8250U, GeForce 940MX, FHD) Review
"A notebook for all situations," this is exactly what Asus aims to achieve with the VivoBook. It is not the first time that we have seen a laptop of this series in our test lab. As an affordable alternative to the higher-quality ZenBook series, the VivoBook targets the price-range below 900 Euros (~$1124). Nonetheless, this everyday device should be equipped for all multimedia applications.
In order to prepare it for this vast application area, Asus has built-in a quad-core processor, 8 GB of working memory, a dedicated Nvidia graphics card, and a 1 TB HDD. The configuration of our test package costs around 750 Euros (~$937; note that the available configurations differ in the US).
It was only a few months ago that we tested the VivoBook S15 extensively. In terms of the visuals and equipment, the S15 model is similar to our test unit here. However, that model had a metal case and SSD storage in the configuration we tested. Despite that, we were not satisfied in our test at that time. In order to evaluate whether Asus has overcome the analyzed weaknesses with the VivoBook 15, we want to incorporate the VivoBook S15 into our current test comparison.
Other manufacturers also want to join the competition in this notebook category and price range. For this reason, we will include the following competitors. The HP Pavilion 15 is almost equipped similarly, aside from not only having a hard drive, and it currently costs around 800 Euros (~$999). The comparison to the Dell Vostro 15, which has to make do with merely a TN panel, is similarly interesting. Lenovo also offers a device which is similarly equipped: the IdeaPad 320 for 800 Euros (~$999).
Case and Features
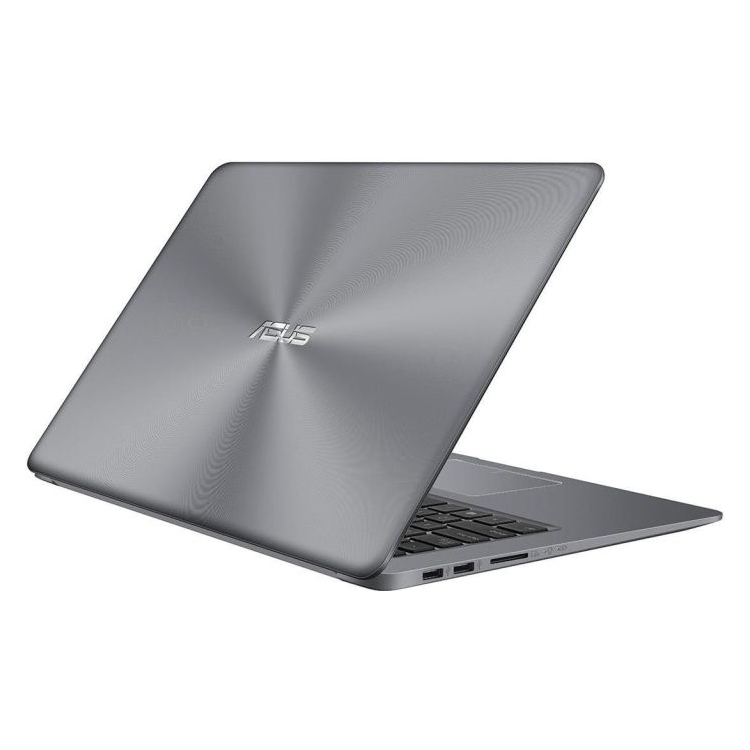
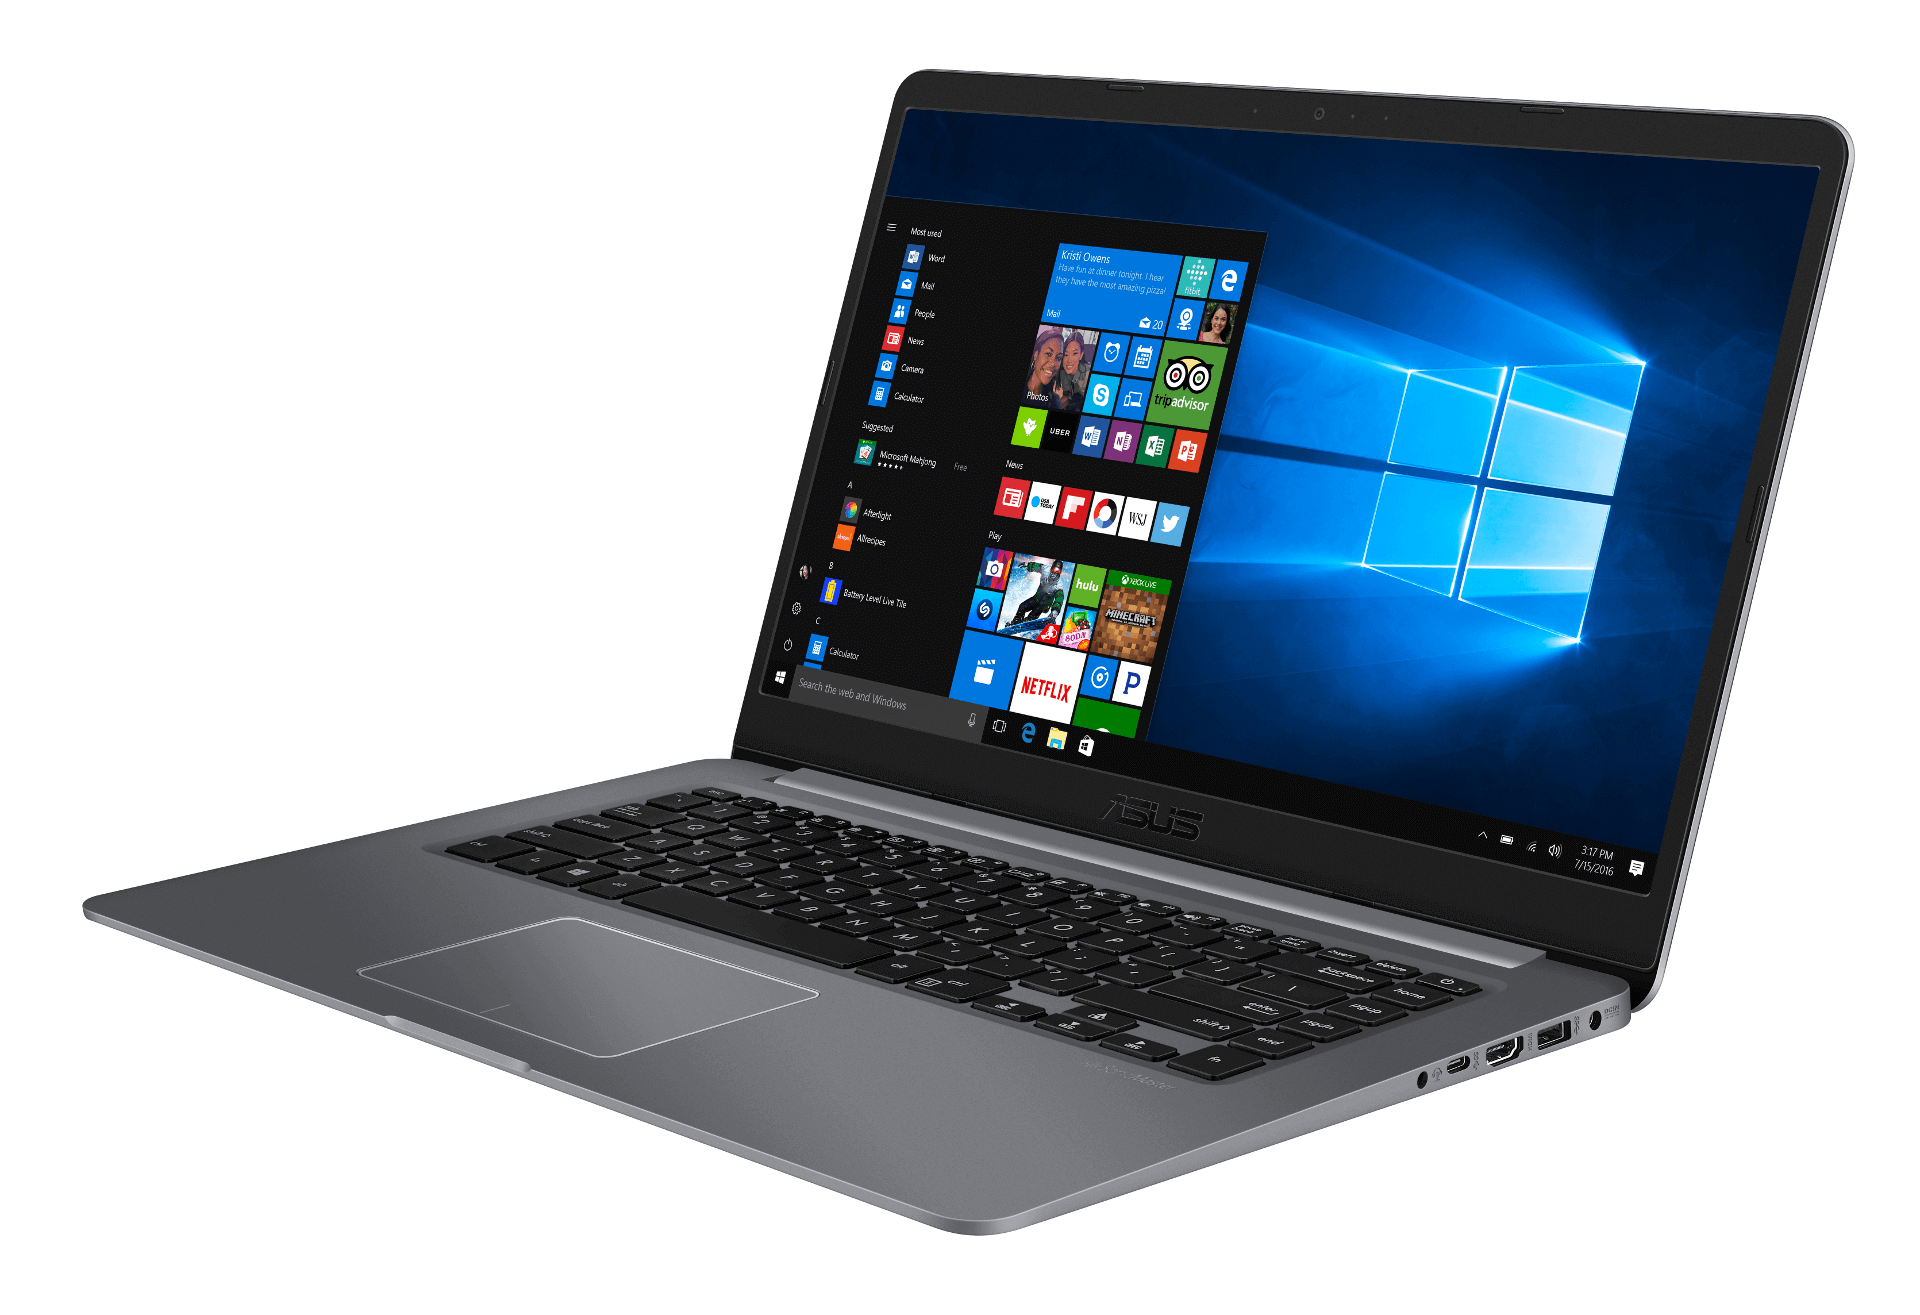
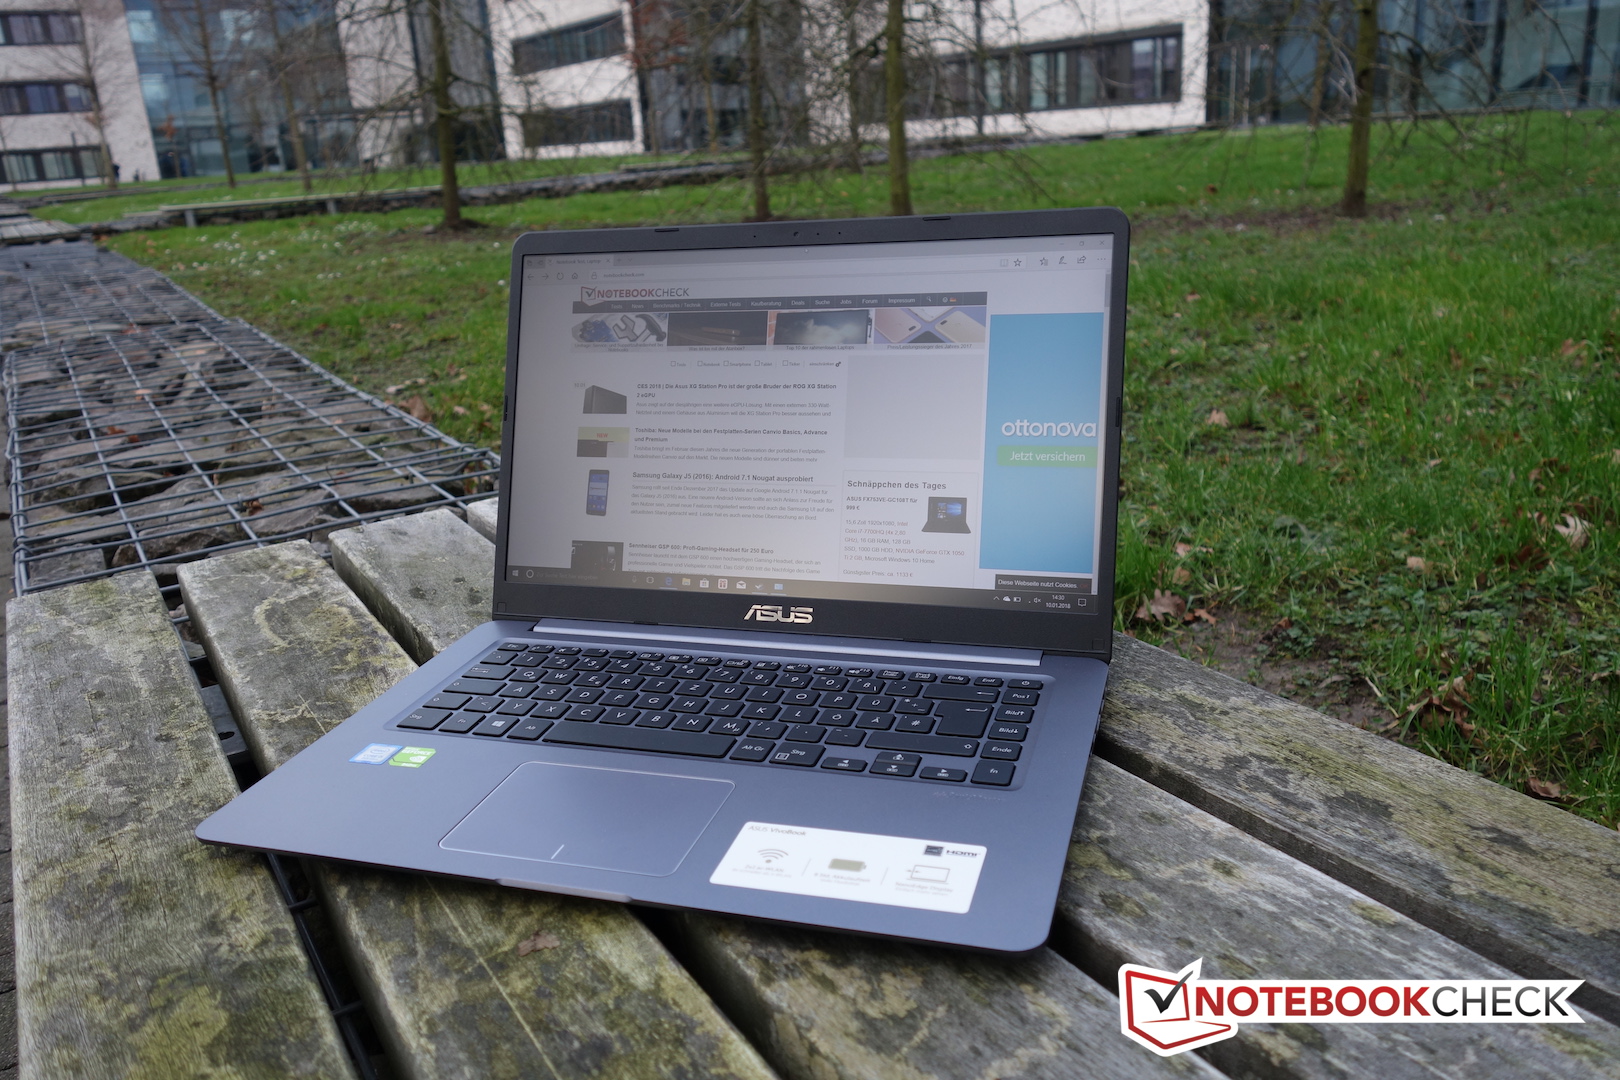
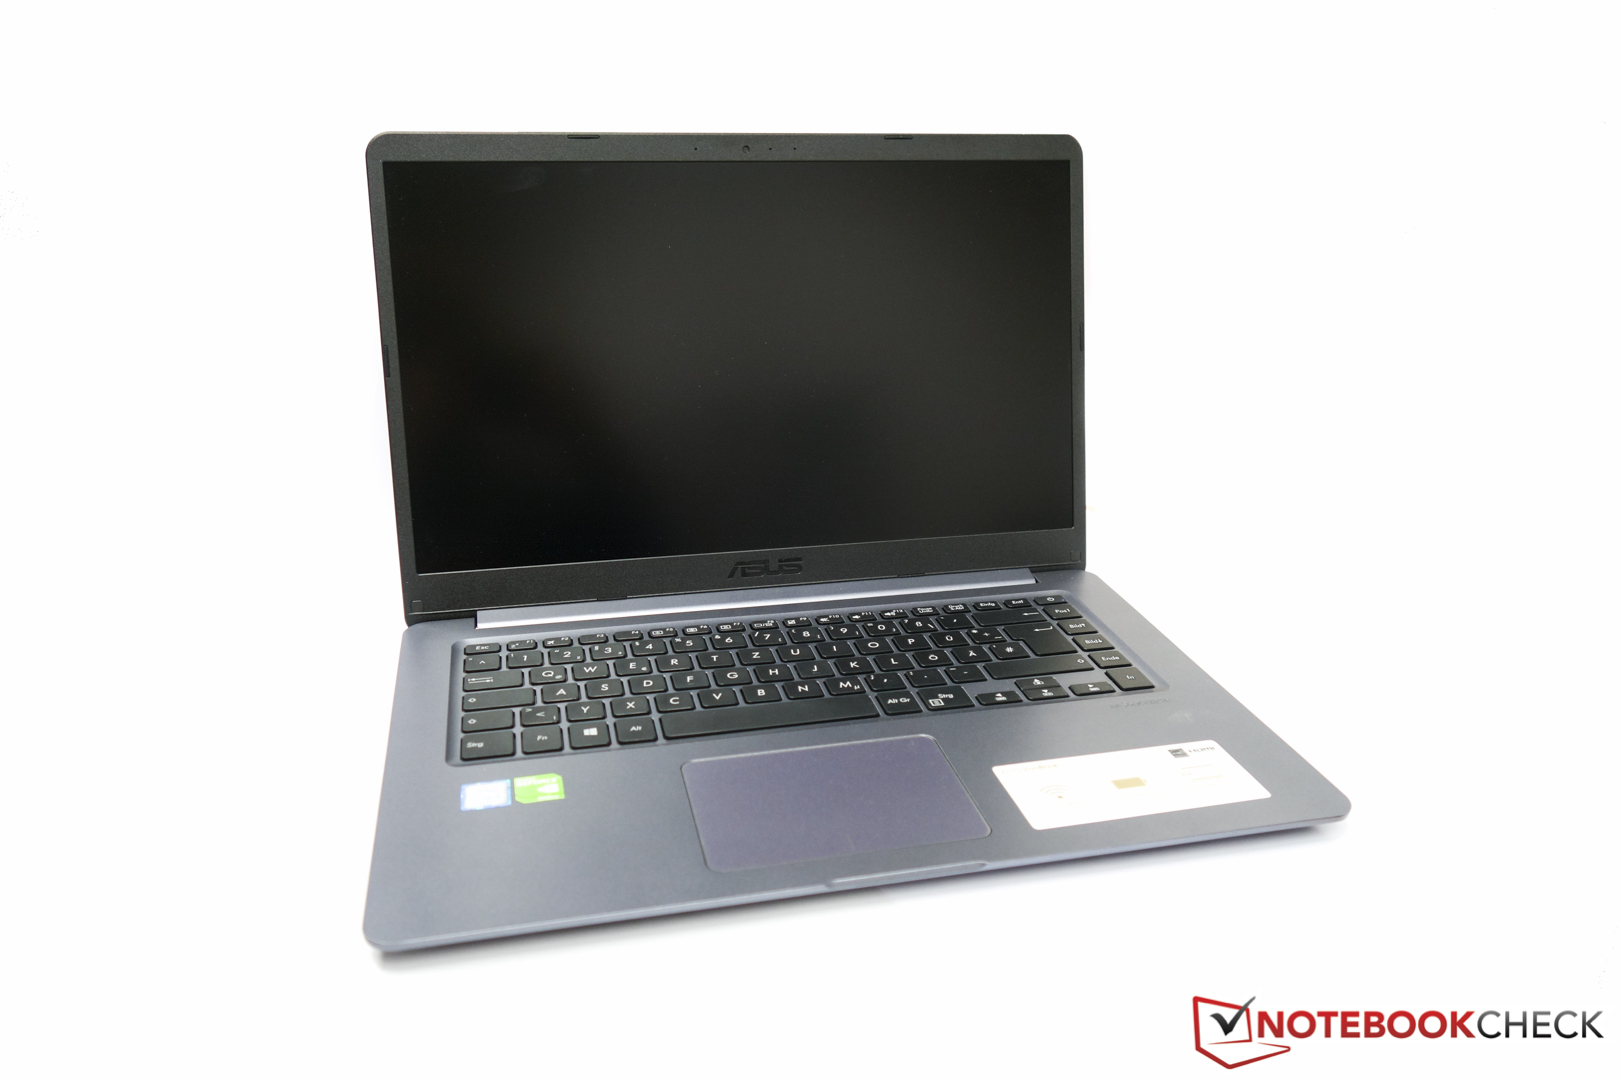
A distinguishing mark of the VivoBook series is the wedge-shaped case with a display lid that has a brushed aluminum look. Initially, all the visuals offer a premium and high-quality impression. The rounded edges and corners also give the impression of being a unibody metal case. However, this appearance is misleading, and the 2 kg case is made solely of plastic parts. This is a significant difference to the VivoBook S15, which is completely manufactured from metal.
The small display bezel, which is called NanoEdge, has remained unchanged. Despite the different choice of materials, the back of the display and top of the base continue to be pressed down easily. We were unable to replicate the creaking noises in the area of the palm rest which we had noticed in the VivoBook S15. The display hinge is comfortably easy to move and the display only wobbles briefly. Overall, the plastic case leaves a decent impression. The quality of the workmanship is also satisfactory. Unfortunately, the battery cannot be replaced without some amount of work. In order to take a look inside, the bottom of the case which is fastened with 10 screws has to be removed. In addition, the bottom unit is held by numerous clips. At that point, we had to abandon our attempt of opening the device (shop unit).
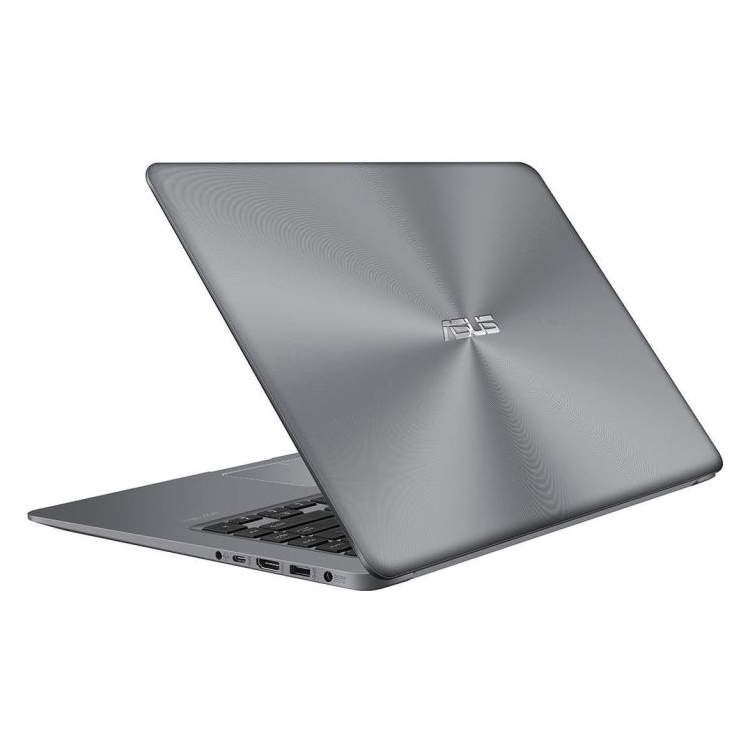
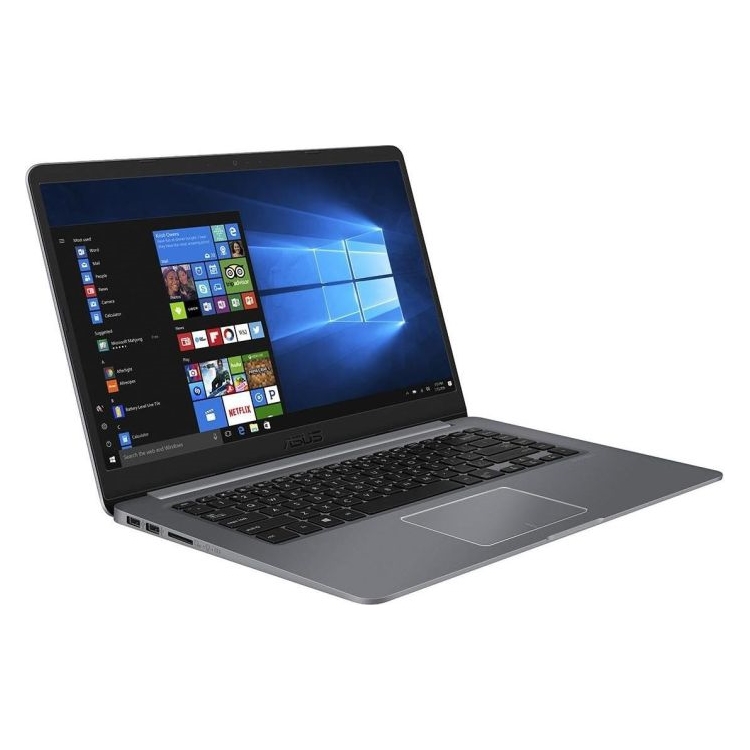
In terms of the amount of connections, Asus remains faithful to its previous position. In particular, we don't like the two slow USB-2.0 ports and it is especially annoying that the two ports are located at the left side. The faster USB-3 connections (1 x USB 3.1 Type-C) are on the right side of the notebook exclusively. Since accordingly, you have to connect the peripherals with the higher data throughput on the right side, this leads to the great disadvantage that your work space on the right side becomes very limited. An additional disadvantage is that the two fast USB connections are separated by an HDMI port in between. Not only does this interfere with the access to the USB-3 Type-A port when the display cable is connected, but larger plugs can even prevent access.
The built-in SD card slot achieves 34.8 MB/s when copying JPG files (around 5 MB each). To test this, we used a Toshiba Exceria Pro SDXC 64 GB UHS-II as our reference card. Compared to all the multimedia notebooks we have previously tested, this result is below their average of 54.5 MB/s.
An Intel Dual Band Wireless-AC 8265, which uses MIMO-2x2 technology, serves to connect to the Internet. It is supposed to transfer at gross data rates of up to 867 Mbit/s. However, in reality we measure an average of 531 Mbit/s as the client. On the server side, we get a better average of around 660 Mbit/s (715 Mbit/s maximum). Compared to the competition, our test unit does a decent job and is at the same level as the HP Pavilion 15 and the Acer Swift 3.
Connections


| SD Card Reader | |
| average JPG Copy Test (av. of 3 runs) | |
| HP Pavilion 15-cc107ng (Toshiba Exceria Pro SDXC 64 GB UHS-II) | |
| Asus VivoBook 15 X510UQ-BQ534T (Toshiba Exceria Pro SDXC 64 GB UHS-II) | |
| Asus Vivobook S15 S510UQ-BQ189T (Toshiba Exceria Pro SDXC 64 GB UHS-II) | |
| Lenovo IdeaPad 320-15IKB 80XL01NEGE (Toshiba Exceria Pro SDXC 64 GB UHS-II) | |
| Dell Vostro 15-5568 (Toshiba Exceria Pro SDXC 64 GB UHS-II) | |
| maximum AS SSD Seq Read Test (1GB) | |
| HP Pavilion 15-cc107ng (Toshiba Exceria Pro SDXC 64 GB UHS-II) | |
| Asus VivoBook 15 X510UQ-BQ534T (Toshiba Exceria Pro SDXC 64 GB UHS-II) | |
| Asus Vivobook S15 S510UQ-BQ189T (Toshiba Exceria Pro SDXC 64 GB UHS-II) | |
| Lenovo IdeaPad 320-15IKB 80XL01NEGE (Toshiba Exceria Pro SDXC 64 GB UHS-II) | |
| Dell Vostro 15-5568 (Toshiba Exceria Pro SDXC 64 GB UHS-II) | |
Input Devices
Keyboard
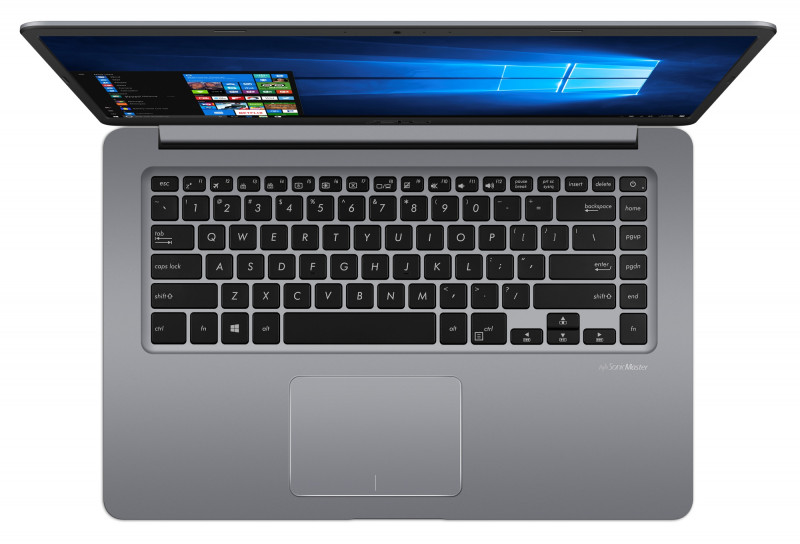
As in the VivoBook S15 before, we did not like the keyboard very much. The keys are sufficiently sized, and even the arrow keys were not reduced due to space limitations. The pressure point of the keys was also very even overall. However, besides these positive points, it lacks in every other regard. Due to the very soft and short stroke, the typing experience feels very spongy and imprecise. Despite their roughened surface, the keys do not offer any grip. In addition, the keyboard can be pressed down with only a little use of force. There is also no backlight.
In terms of the typing noise, the small keys produce a muffled and not too loud feedback. However, the space key mars this image, since you can hear a loud clattering during fast input.
Overall, we recommend an external keyboard for office work. For general surfing and social media usage, the built-in keyboard is sufficient.
Touchpad
The smooth surface of the 10.4 x 7.4 cm (~4.1 x 2.9 in) touchpad reacts to input precisely. Even in the corners, which often are considered problematic areas, input is recognized correctly. Multitouch gestures such as scrolling of websites mostly succeed without any problems. However, from time to time some problems occurred in our test unit, in particular during drag-and-drop input.
The invisible mouse keys are integrated below the touchpad. It looks strange to us that the touchpad sits lower in the case on the left back corner than on the right corner. The shallow stroke produces a clicking sound which is not too loud.
Display

The images are displayed on a Full HD IPS panel made by LG. The matte display has an average brightness of 250 cd/m², which is average considering the selected competitors. However, looking at all the multimedia notebooks we tested previously, the brightness could have been a bit higher. On the other hand, the VivoBook produces a quite saturated black value, which is noticeable particularly in dark movie sequences and images. However, the slight blue tint in the state of delivery is unpleasant. The CalMAN analysis confirms this with a Delta-E deviation of more than 6 in the grayscales and at about 5.31 in the colors.
| |||||||||||||||||||||||||
Brightness Distribution: 83 %
Center on Battery: 266 cd/m²
Contrast: 1214:1 (Black: 0.22 cd/m²)
ΔE ColorChecker Calman: 5.31 | ∀{0.5-29.43 Ø4.73}
ΔE Greyscale Calman: 6.24 | ∀{0.09-98 Ø4.97}
59% sRGB (Argyll 1.6.3 3D)
37% AdobeRGB 1998 (Argyll 1.6.3 3D)
40.55% AdobeRGB 1998 (Argyll 3D)
59% sRGB (Argyll 3D)
39.22% Display P3 (Argyll 3D)
Gamma: 2.7
CCT: 7619 K
| Asus VivoBook 15 X510UQ-BQ534T LG Philips LP156WF9-SPK2, , 1920x1080, 15.6" | Asus Vivobook S15 S510UQ-BQ189T AU Optronics B156W02 / AUO B156HAN02.1, , 1920x1080, 15.6" | HP Pavilion 15-cc107ng AU Optronics, , 1920x1080, 15.6" | Dell Vostro 15-5568 Chi Mei CMN15C4, , 1920x1080, 15.6" | Lenovo IdeaPad 320-15IKB 80XL01NEGE Chi Mei N156HGA-EAB, , 1920x1080, 15.6" | |
|---|---|---|---|---|---|
| Display | -1% | -5% | 2% | 1% | |
| Display P3 Coverage (%) | 39.22 | 38.94 -1% | 37.28 -5% | 40.14 2% | 39.47 1% |
| sRGB Coverage (%) | 59 | 58.5 -1% | 56.1 -5% | 60 2% | 59 0% |
| AdobeRGB 1998 Coverage (%) | 40.55 | 40.23 -1% | 38.51 -5% | 41.5 2% | 40.81 1% |
| Response Times | -82% | -12% | -16% | -13% | |
| Response Time Grey 50% / Grey 80% * (ms) | 43 ? | 47 ? -9% | 45 ? -5% | 41 ? 5% | 42 ? 2% |
| Response Time Black / White * (ms) | 11 ? | 28 ? -155% | 13 ? -18% | 15 ? -36% | 14 ? -27% |
| PWM Frequency (Hz) | 26000 ? | 25000 ? | |||
| Screen | 12% | -51% | -41% | -51% | |
| Brightness middle (cd/m²) | 267 | 293 10% | 234 -12% | 239 -10% | 227 -15% |
| Brightness (cd/m²) | 250 | 275 10% | 230 -8% | 219 -12% | 207 -17% |
| Brightness Distribution (%) | 83 | 86 4% | 76 -8% | 86 4% | 81 -2% |
| Black Level * (cd/m²) | 0.22 | 0.25 -14% | 0.34 -55% | 0.43 -95% | 0.44 -100% |
| Contrast (:1) | 1214 | 1172 -3% | 688 -43% | 556 -54% | 516 -57% |
| Colorchecker dE 2000 * | 5.31 | 3.81 28% | 12.19 -130% | 10.11 -90% | 11.52 -117% |
| Colorchecker dE 2000 max. * | 9.28 | 6.64 28% | 20.81 -124% | 17.33 -87% | 19.97 -115% |
| Greyscale dE 2000 * | 6.24 | 2.66 57% | 13.99 -124% | 10.88 -74% | 12.01 -92% |
| Gamma | 2.7 81% | 2.54 87% | 2.32 95% | 2.33 94% | 2.23 99% |
| CCT | 7619 85% | 6541 99% | 15863 41% | 11924 55% | 13330 49% |
| Color Space (Percent of AdobeRGB 1998) (%) | 37 | 37 0% | 36 -3% | 38 3% | 38 3% |
| Color Space (Percent of sRGB) (%) | 59 | 58 -2% | 56 -5% | 60 2% | 59 0% |
| Total Average (Program / Settings) | -24% /
-3% | -23% /
-37% | -18% /
-29% | -21% /
-36% |
* ... smaller is better
Display Response Times
| ↔ Response Time Black to White | ||
|---|---|---|
| 11 ms ... rise ↗ and fall ↘ combined | ↗ 6 ms rise | 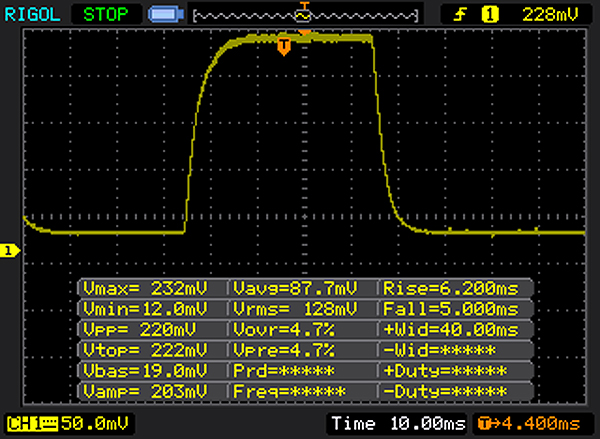 |
| ↘ 5 ms fall | ||
| The screen shows good response rates in our tests, but may be too slow for competitive gamers. In comparison, all tested devices range from 0.1 (minimum) to 240 (maximum) ms. » 29 % of all devices are better. This means that the measured response time is better than the average of all tested devices (19.9 ms). | ||
| ↔ Response Time 50% Grey to 80% Grey | ||
| 43 ms ... rise ↗ and fall ↘ combined | ↗ 22 ms rise | 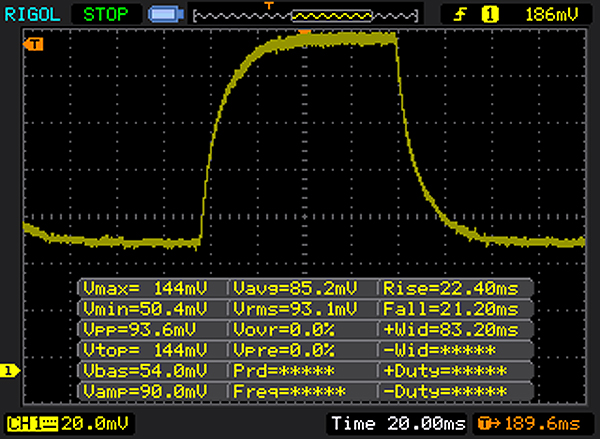 |
| ↘ 21 ms fall | ||
| The screen shows slow response rates in our tests and will be unsatisfactory for gamers. In comparison, all tested devices range from 0.165 (minimum) to 636 (maximum) ms. » 71 % of all devices are better. This means that the measured response time is worse than the average of all tested devices (31.1 ms). | ||
Screen Flickering / PWM (Pulse-Width Modulation)
| Screen flickering / PWM not detected | ||
In comparison: 52 % of all tested devices do not use PWM to dim the display. If PWM was detected, an average of 7794 (minimum: 5 - maximum: 343500) Hz was measured. | ||
Anyone who wants to work outdoors with the 15-inch device should avoid direct sunlight and the mid-day sun. However, the matte display can be used without any problems in slightly overcast surroundings.
Performance
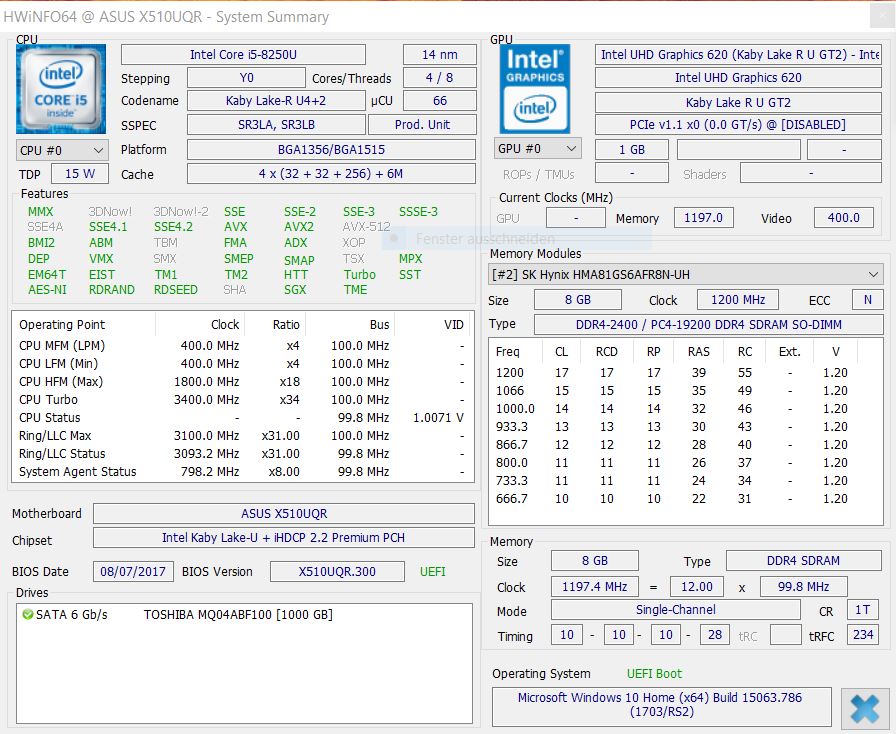
Our test unit is supposed to be equipped for usage in the multimedia area. The necessary performance is provided by a new quad-core processor of the Intel Kaby-Lake architecture, which is considered the successor of the well-known Intel Core i5-7200U/7260U series. The built-in Nvidia GeForce 940MX is not quite as current, since it was first introduced almost two years ago. However, the graphics unit should still be able to smoothly display the standard multimedia applications and some games.
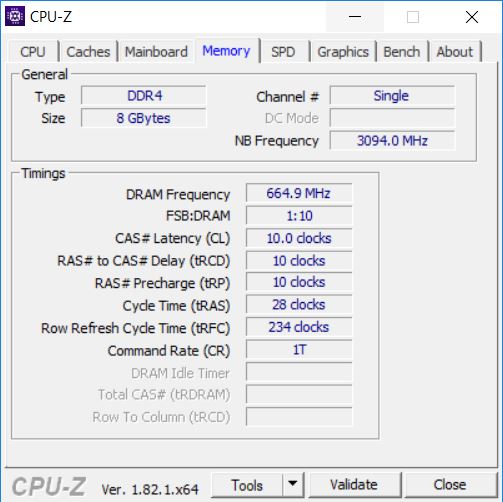
DDR4 storage, which unfortunately only works in single-channel mode, is used as storage equipment. Also there is no SSD, but only a 1 TB HDD. The whole package costs 750 Euros (~$937). For an additional 150 Euros (~$187), buyers will get 16 GB of working memory (dual-channel) and an additional 256 GB M.2 SSD. However, the VivoBook with a GeForce MX150 and a 256 GB 2.5-inch SSD, which costs just 100 Euros (~$124) more, is even more interesting.
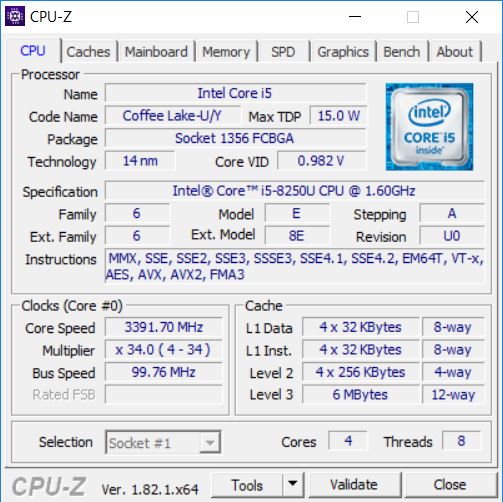

Processor
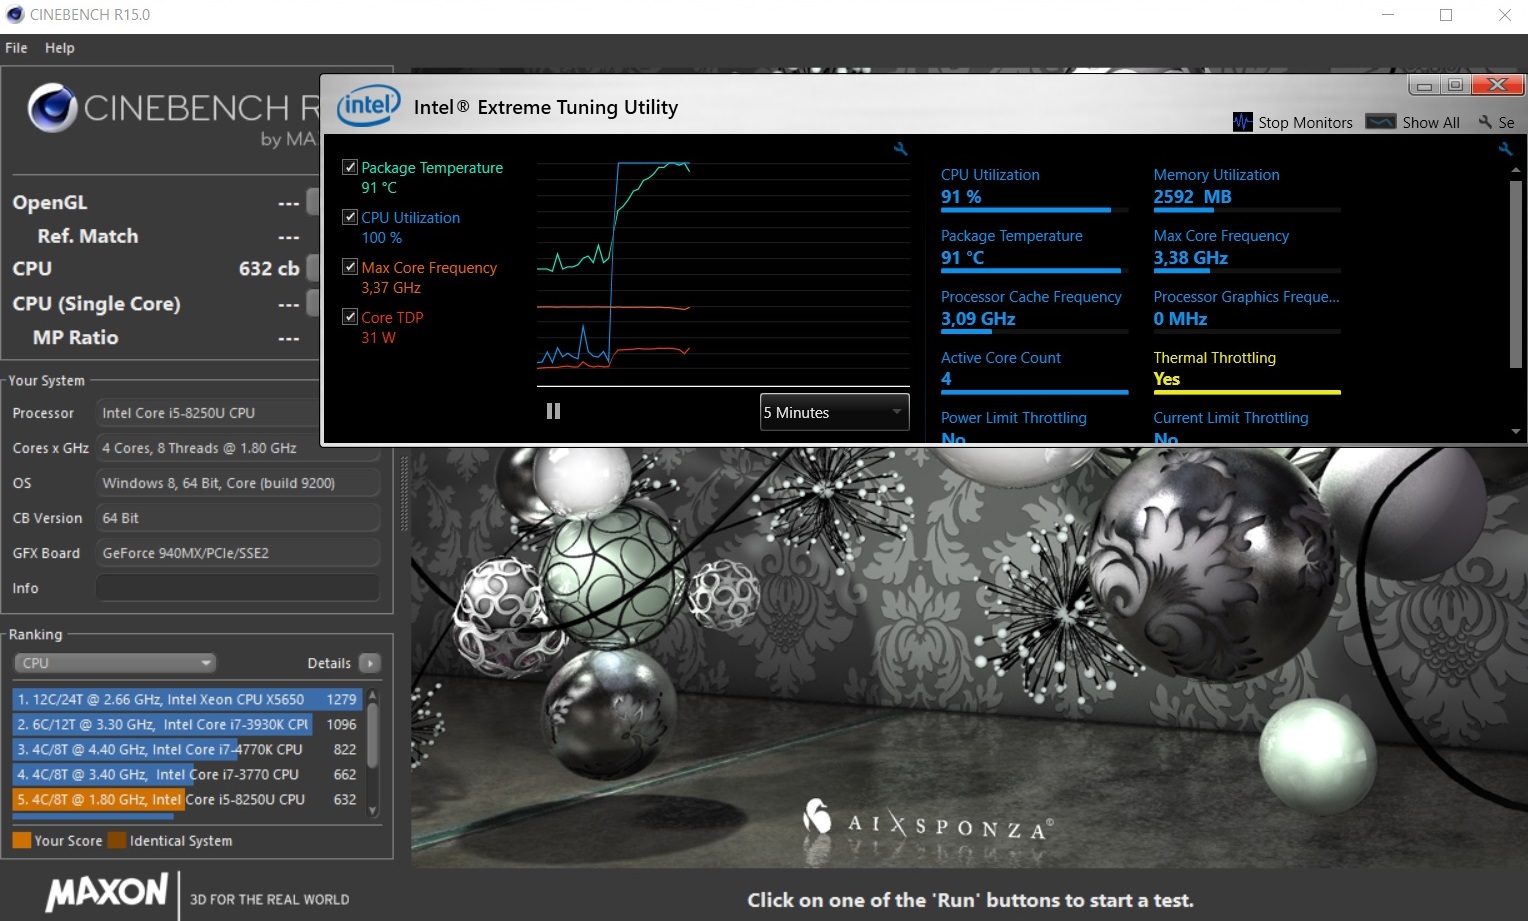
The heart of the VivoBook is an Intel Core i5-8250U, which is a Kaby-Lake Refresh of the well-known 7000 series. The largest difference compared to the VivoBooks of the previous generation is that there is now a quad-core processor inside. The separate cores each have a speed of 1.6 to 3.4 GHz. According to the spec-sheet, the maximum power consumption is 15 W (TDP) which is the same as in the older dual-core alternatives. We want to evaluate the additional performance compared to the predecessor CPU, the Intel Core i5-7200U, via Cinebench R15.
We noticed quickly that during the cold start, Cinebench R15 achieves a decent value of 720 points. However, as soon as the device reaches its operating temperature, the CPU temperature rises quickly, and thermal throttling of the processor speed becomes unavoidable. We notice this particularly in our Cinebench loop. After only one run, the performance of the CPU drops by 10 - 15%. However, the CPU still continues to run at a high speed level above the basic core speed. The comparison to similarly equipped competitors shows a large performance advantage of 160 points. The performance gap becomes even larger to the Lenovo IdeaPad 320, which is equipped with an Intel Core i5-7200U and it only reaches around 330 points.
It is also positive that the processor can command its full performance in battery operation.
Anyone looking for further comparisons between various processors or in particular a performance comparison between the new and old Kaby-Lake models can browse our benchmark chart of current notebook processors.
System Performance
Overall, we can see a sufficiently powerful system here, which is equipped for all the usual application areas. However, the slower hard drive storage creates a bottleneck which becomes particularly noticeable during general operation. We objectively evaluate this in the PCMark 8 Home system benchmark. But unexpectedly the VivoBook comes out at the level of the competitors that are equipped with SSD storage. However, we have to keep in mind here that we found a significant performance advantage of the CPU in the comparison above. Possibly due to the slower storage and single-channel working memory, this performance advantage could not be fully used.
| PCMark 8 - Home Score Accelerated v2 | |
| HP Pavilion 15-cc107ng | |
| Lenovo IdeaPad 320-15IKB 80XL01NEGE | |
| Dell Vostro 15-5568 | |
| Asus VivoBook 15 X510UQ-BQ534T | |
| Asus Vivobook S15 S510UQ-BQ189T | |
| PCMark 8 Home Score Accelerated v2 | 3592 points | |
Help | ||
Storage Solution
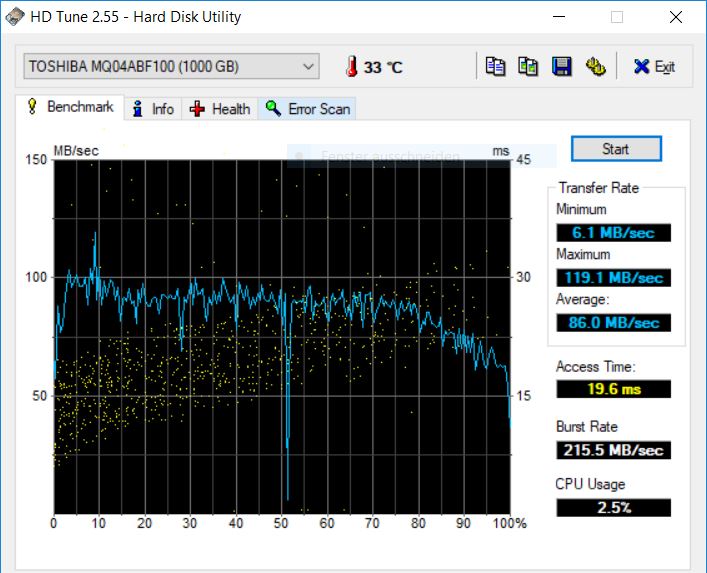
Data is stored on a 1 TB hard drive from Toshiba. The drive has a 2.5-inch format and spins at a speed of 5400 RPM. The transfer rates are in the range characteristic for this kind of storage. Since all of the competitors without exception use SSD storage, our test unit limps behind in the benchmarks. As already mentioned, Asus also offers various models with optional SSDs. Alternatively, you can also add a hard drive via an empty M.2 slot.
| Asus VivoBook 15 X510UQ-BQ534T | Asus Vivobook S15 S510UQ-BQ189T Toshiba SG5 THNSNK128GVN8 | HP Pavilion 15-cc107ng SanDisk SD8SN8U256G1006 | Dell Vostro 15-5568 Micron SSD 1100 (MTFDDAV256TBN) | Lenovo IdeaPad 320-15IKB 80XL01NEGE SK Hynix HFS256G3BTND | |
|---|---|---|---|---|---|
| CrystalDiskMark 3.0 | 6380% | 6727% | 5064% | 8822% | |
| Read Seq (MB/s) | 139.2 | 437.6 214% | 475.4 242% | 476.2 242% | 466.4 235% |
| Write Seq (MB/s) | 126 | 138.6 10% | 453.5 260% | 238.7 89% | 259.3 106% |
| Read 512 (MB/s) | 42.35 | 368.6 770% | 345.2 715% | 312.9 639% | 314.5 643% |
| Write 512 (MB/s) | 111.2 | 138.2 24% | 299.1 169% | 161.7 45% | 259.4 133% |
| Read 4k (MB/s) | 0.207 | 16.05 7654% | 27.8 13330% | 21.87 10465% | 31.47 15103% |
| Write 4k (MB/s) | 4.059 | 86.2 2024% | 54.2 1235% | 93.6 2206% | 78.3 1829% |
| Read 4k QD32 (MB/s) | 0.738 | 279.1 37718% | 250.9 33897% | 172.8 23315% | 346.1 46797% |
| Write 4k QD32 (MB/s) | 4.468 | 121.8 2626% | 181.8 3969% | 161.2 3508% | 260.4 5728% |

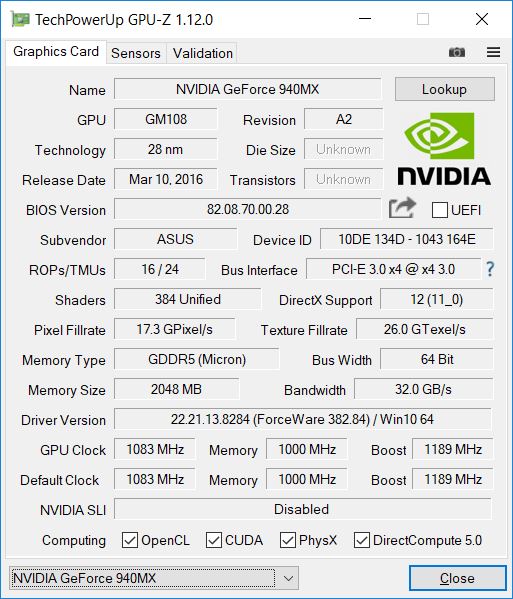
Graphics Card
An Nvidia GeForce 940MX is available as the dedicated graphics unit. At this point, this multimedia graphics card has aged and is now considered to belong to the entry-level segment. The GPU supports the DirectX12 standard and in our case has 2048 MB of the possible 4096 MB of DDR5 storage. In our graphics benchmarks, such as 3DMark 11, our test unit fares as expected. Anyone who also hopes for the full performance during mobile usage will be disappointed, since the graphics performance drops by about 13% during battery operation.
The comparison to the Acer Swift 3 shows that the Nvidia GeForce 940MX does not represent the current state of affairs anymore. While the Swift 3 has the same CPU as the VivoBook, the manufacturer has upgraded the GPU to a GeForce MX150. The MX150 belongs to the current entry-level segment and is able to produce a performance advantage of more than 50% in 3DMark 11. For this reason, those interested buyers who also like to get into the world of gaming should accept the additional premium of 100 Euros (~$124) for a VivoBook model with the MX150.
You can read up on comparisons to other graphics units in our benchmark chart.
| 3DMark 11 Performance | 3168 points | |
| 3DMark Ice Storm Standard Score | 53750 points | |
| 3DMark Cloud Gate Standard Score | 10605 points | |
| 3DMark Fire Strike Score | 2017 points | |
| 3DMark Time Spy Score | 710 points | |
Help | ||
Gaming Performance
Despite the built-in dedicated graphics unit, current games can often only be played smoothly in low settings. In order to be able to increase the graphics settings and FPS amount, you have to employ older games such as BioShock Infinite.
In order to analyze the performance differences of various graphics cards during gaming, we refer to our article on the gaming performance of current notebook graphics cards.
| low | med. | high | ultra | |
|---|---|---|---|---|
| BioShock Infinite (2013) | 86.4 | 50.8 | 44.7 | 18.7 |
Emissions and Power Management
Noise Emissions
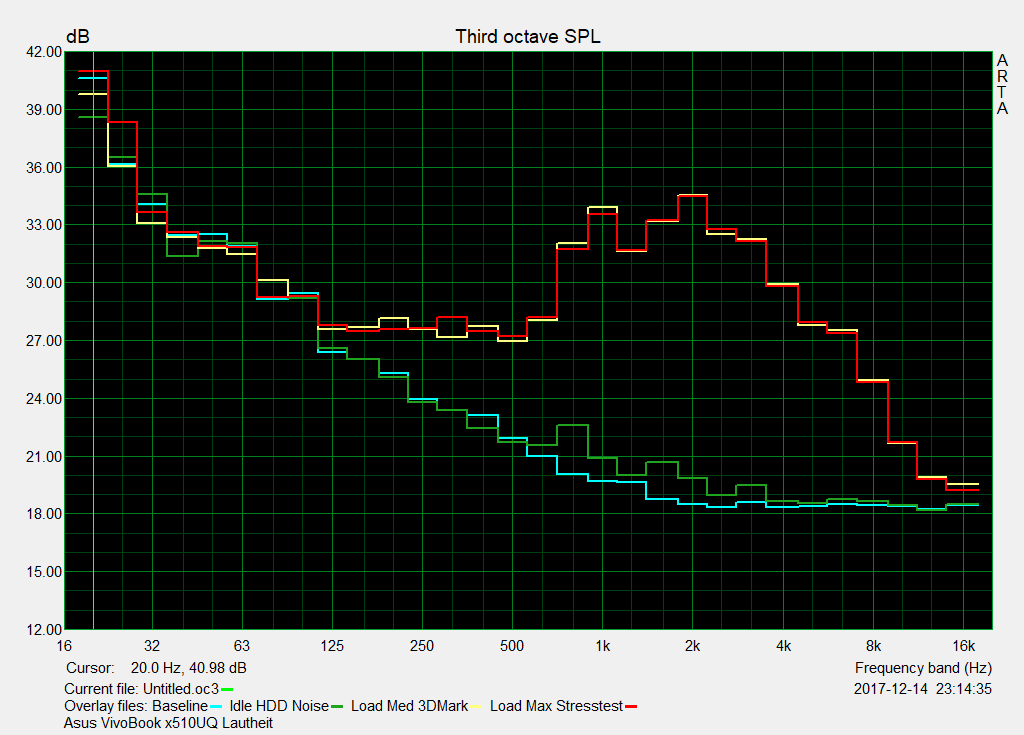
As long as our test unit does not change into the Windows High Performance profile and remains idle, it is hardly audible. You can only hear a slight HDD whirring. As soon as we demanded more performance, the notebook's noise becomes noticeable. The fans are relatively sensitive and immediately rev up during load. However, at up to 43 dB(A), the noise remains within acceptable limits. The background noises, some of which are high-frequency, are more annoying. A glance at the competitors shows that this can be done better, and all of the competitors do a better job. The HP Pavilion 15, which is almost similarly equipped, hardly reaches 37 dB(A).
Noise level
| Idle |
| 32.3 / 32.3 / 32.3 dB(A) |
| Load |
| 43.2 / 43.2 dB(A) |
 | ||
30 dB silent 40 dB(A) audible 50 dB(A) loud |
||
min: | ||
Temperature
Our test unit never warms up uncomfortably, neither during idle nor during load. The hottest spot is at the top at about 44 °C (111 °F) in the back area of the keyboard. During regular operation, you can hardly notice any warming. The Dell Vostro operates in a completely different realm. The competitor warms up to 56 °C (133 °F) at the bottom during load operation, which makes using it on your lap almost impossible.
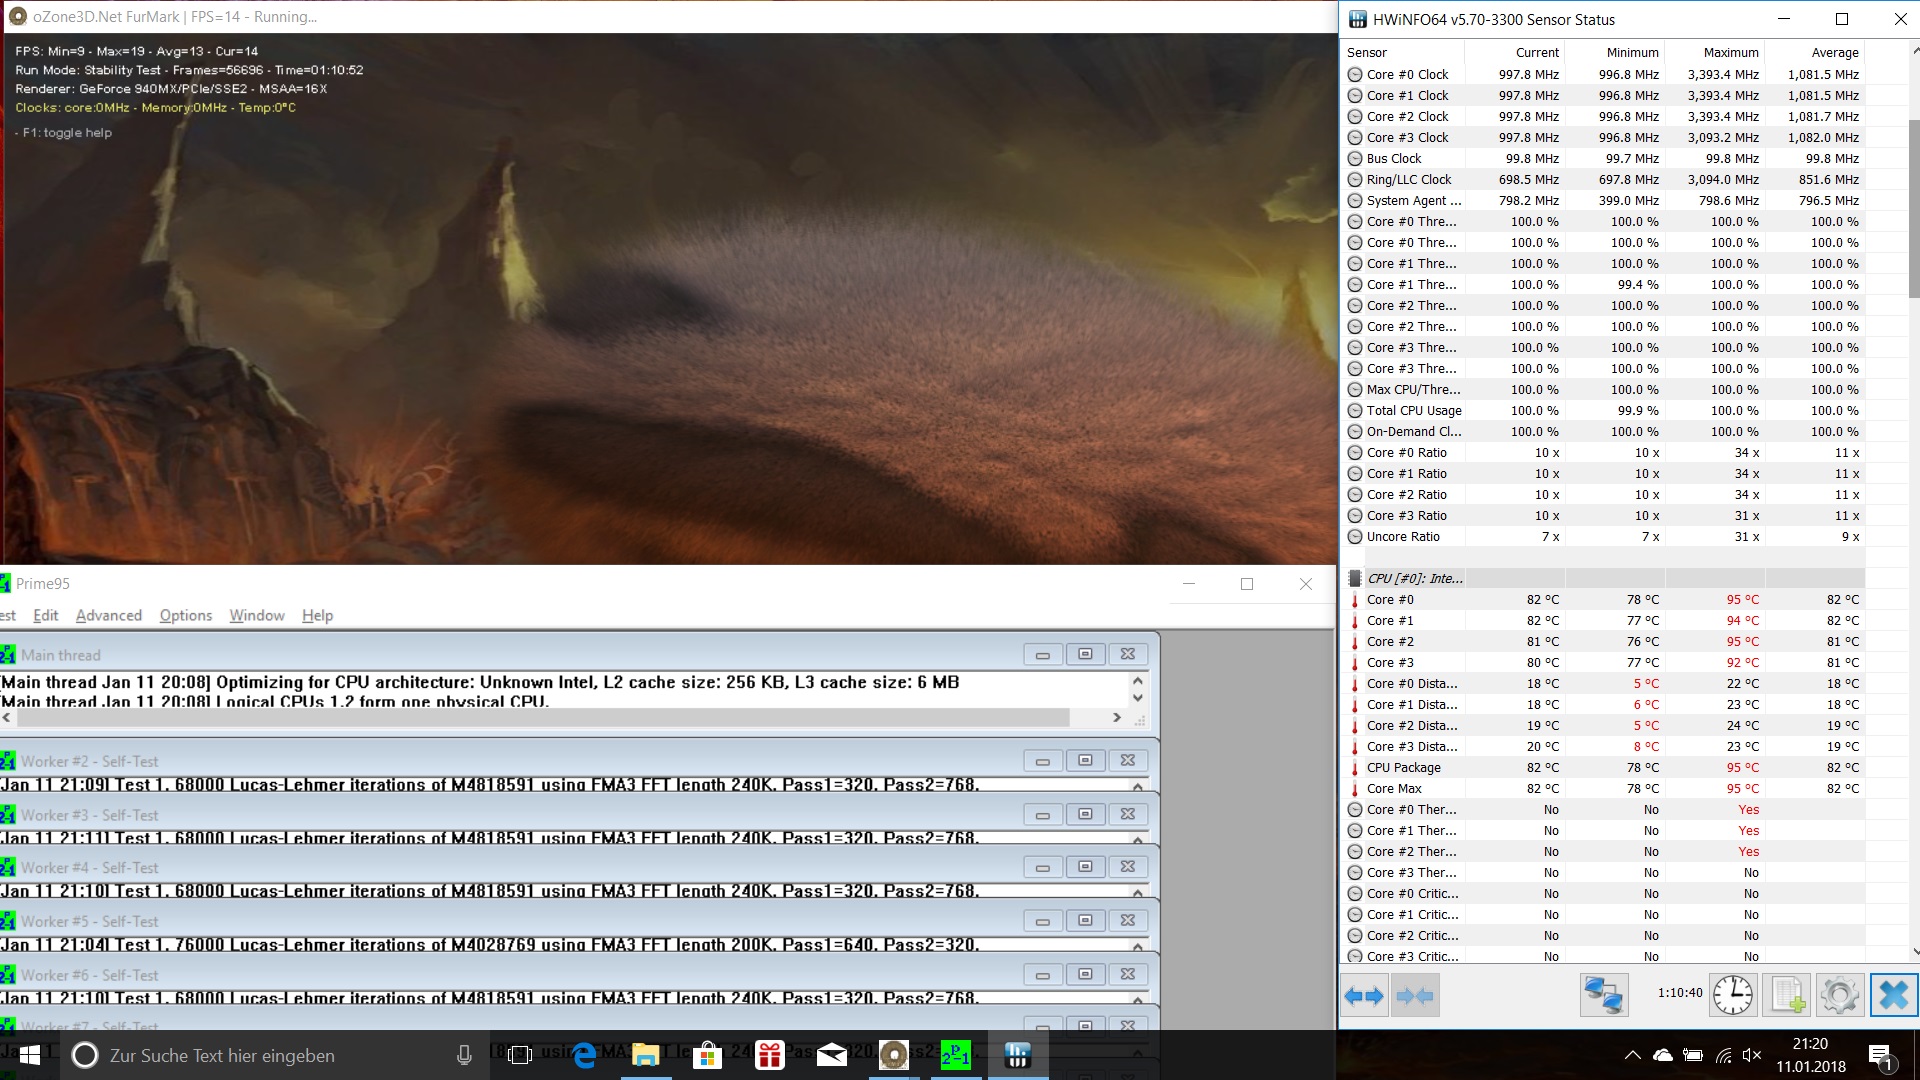
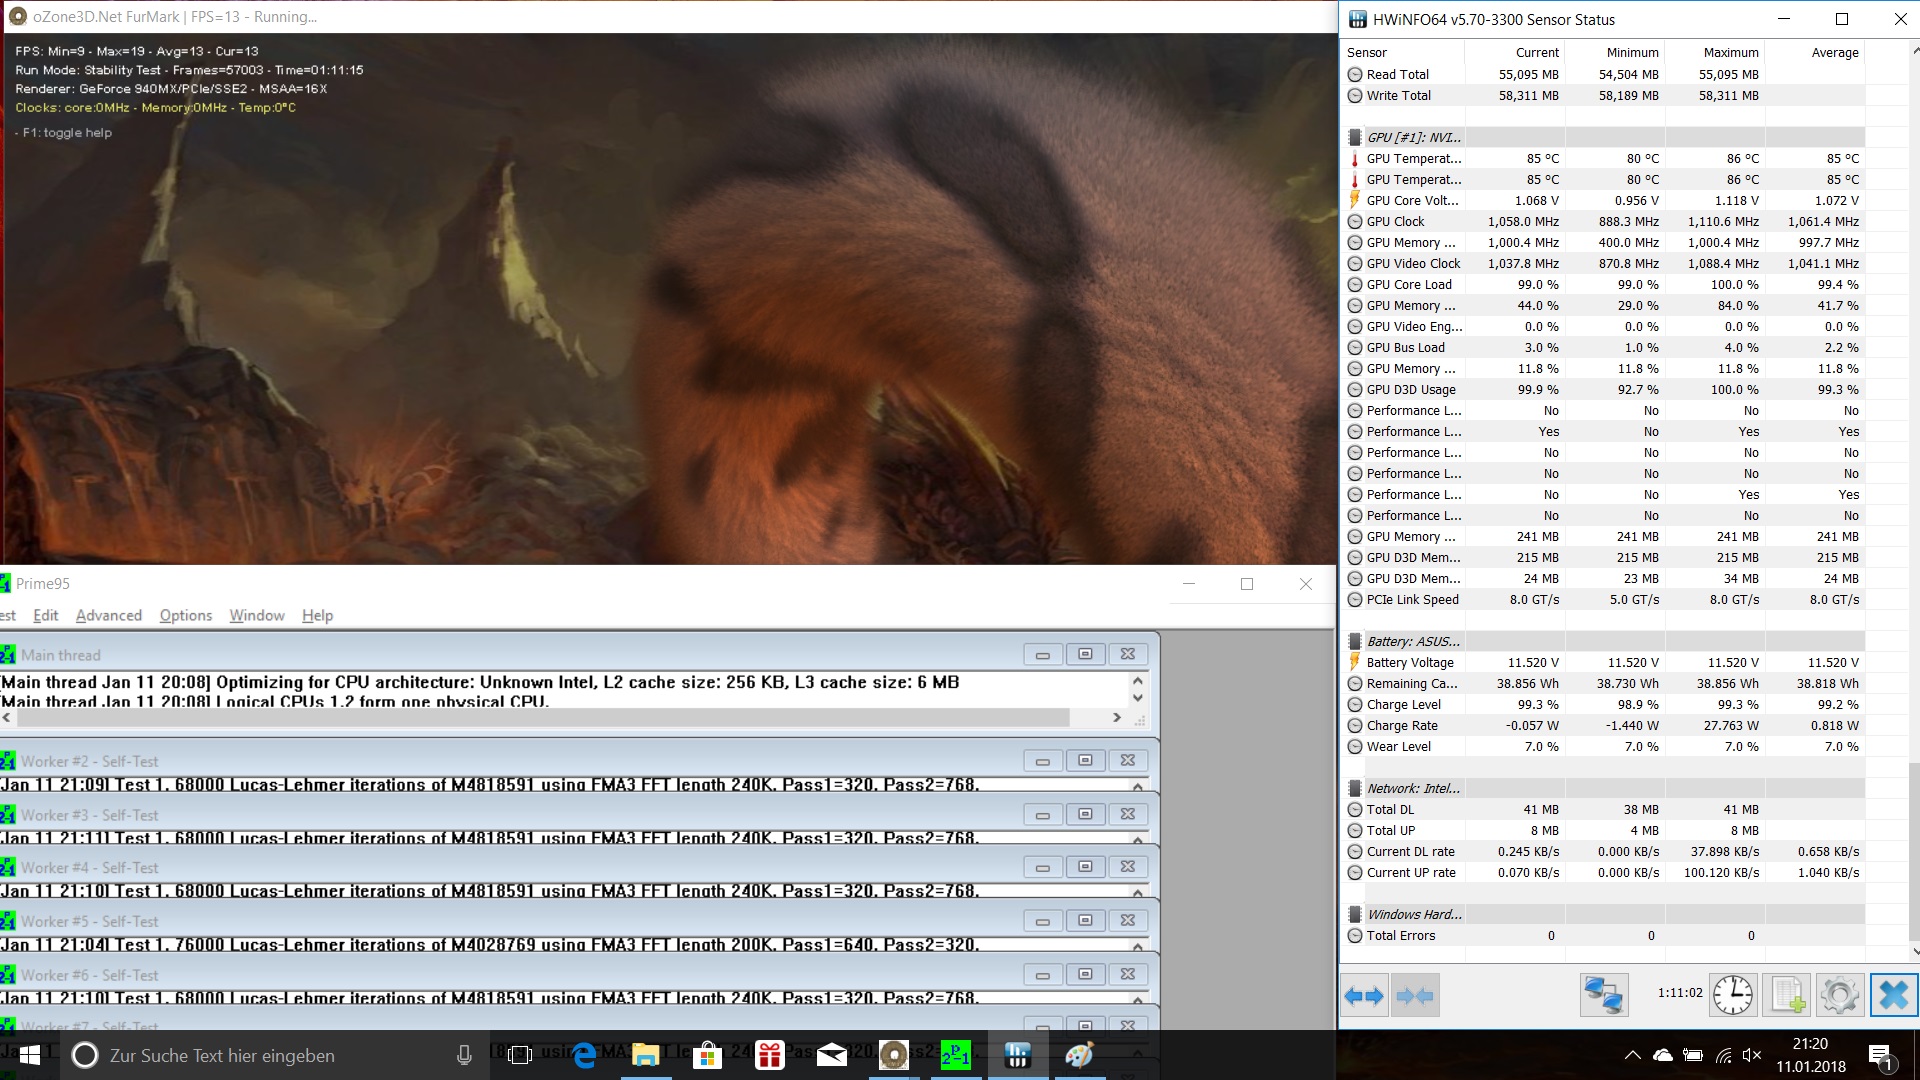
In order to analyze the temperature development inside, we apply a stress scenario to our test unit using the Prime95 and FurMark applications. Already at the start of running the software, the CPU temperature rises to 95 °C (203 °F) after a few seconds. The consequence is clear. The CPU has to control its speed. The processor has to throttle already after 30 seconds. In our case, this means that the CPU drops below its basic clock speed of 1.6 GHz. After one minute, the cores only operate at 1 GHz, and after about one hour of runtime, the CPU levels out at only 1.1 GHz. However, you will hardly ever encounter such immense loads on the processor and GPU under real conditions. As we saw during the Cinebench loop, the processor is able to command a good performance even over a longer time period. The performance drop we saw here may become noticeable during gaming, for example.
There is a small all-clear indication as soon as we complete our software run. Almost immediately, the clock speed of the processor increases to its maximum Turbo Boost. Also after the stress test, 3DMark 11 achieves the same points as during a cold start.
(±) The maximum temperature on the upper side is 40 °C / 104 F, compared to the average of 36.8 °C / 98 F, ranging from 21 to 71 °C for the class Multimedia.
(±) The bottom heats up to a maximum of 44 °C / 111 F, compared to the average of 39.1 °C / 102 F
(+) In idle usage, the average temperature for the upper side is 26.8 °C / 80 F, compared to the device average of 31.3 °C / 88 F.
(+) The palmrests and touchpad are cooler than skin temperature with a maximum of 31 °C / 87.8 F and are therefore cool to the touch.
(-) The average temperature of the palmrest area of similar devices was 28.7 °C / 83.7 F (-2.3 °C / -4.1 F).
Speakers
Neither the sound volume nor its quality are sufficient for an enjoyable music experience. On the other hand, voices are reproduced relatively clear for Skype conferences.

Asus VivoBook 15 X510UQ-BQ534T audio analysis
(-) | not very loud speakers (70.6 dB)
Bass 100 - 315 Hz
(±) | reduced bass - on average 12.7% lower than median
(+) | bass is linear (6.7% delta to prev. frequency)
Mids 400 - 2000 Hz
(+) | balanced mids - only 3.7% away from median
(+) | mids are linear (4.7% delta to prev. frequency)
Highs 2 - 16 kHz
(±) | higher highs - on average 6.5% higher than median
(+) | highs are linear (4.1% delta to prev. frequency)
Overall 100 - 16.000 Hz
(±) | linearity of overall sound is average (18.8% difference to median)
Compared to same class
» 58% of all tested devices in this class were better, 8% similar, 34% worse
» The best had a delta of 5%, average was 17%, worst was 45%
Compared to all devices tested
» 43% of all tested devices were better, 8% similar, 49% worse
» The best had a delta of 4%, average was 24%, worst was 134%
Apple MacBook 12 (Early 2016) 1.1 GHz audio analysis
(+) | speakers can play relatively loud (83.6 dB)
Bass 100 - 315 Hz
(±) | reduced bass - on average 11.3% lower than median
(±) | linearity of bass is average (14.2% delta to prev. frequency)
Mids 400 - 2000 Hz
(+) | balanced mids - only 2.4% away from median
(+) | mids are linear (5.5% delta to prev. frequency)
Highs 2 - 16 kHz
(+) | balanced highs - only 2% away from median
(+) | highs are linear (4.5% delta to prev. frequency)
Overall 100 - 16.000 Hz
(+) | overall sound is linear (10.2% difference to median)
Compared to same class
» 7% of all tested devices in this class were better, 2% similar, 91% worse
» The best had a delta of 5%, average was 18%, worst was 53%
Compared to all devices tested
» 5% of all tested devices were better, 1% similar, 94% worse
» The best had a delta of 4%, average was 24%, worst was 134%
HP Pavilion 15-cc107ng audio analysis
(-) | not very loud speakers (70.9 dB)
Bass 100 - 315 Hz
(-) | nearly no bass - on average 29.1% lower than median
(±) | linearity of bass is average (10.9% delta to prev. frequency)
Mids 400 - 2000 Hz
(+) | balanced mids - only 2.2% away from median
(±) | linearity of mids is average (7.9% delta to prev. frequency)
Highs 2 - 16 kHz
(+) | balanced highs - only 2.3% away from median
(+) | highs are linear (4.4% delta to prev. frequency)
Overall 100 - 16.000 Hz
(±) | linearity of overall sound is average (21.3% difference to median)
Compared to same class
» 74% of all tested devices in this class were better, 6% similar, 20% worse
» The best had a delta of 5%, average was 17%, worst was 45%
Compared to all devices tested
» 59% of all tested devices were better, 7% similar, 33% worse
» The best had a delta of 4%, average was 24%, worst was 134%
Lenovo IdeaPad 320-15IKB 80XL01NEGE audio analysis
(-) | not very loud speakers (68.1 dB)
Bass 100 - 315 Hz
(-) | nearly no bass - on average 21.7% lower than median
(±) | linearity of bass is average (13.7% delta to prev. frequency)
Mids 400 - 2000 Hz
(+) | balanced mids - only 3.4% away from median
(±) | linearity of mids is average (7% delta to prev. frequency)
Highs 2 - 16 kHz
(±) | higher highs - on average 5.3% higher than median
(±) | linearity of highs is average (8.8% delta to prev. frequency)
Overall 100 - 16.000 Hz
(±) | linearity of overall sound is average (24.4% difference to median)
Compared to same class
» 86% of all tested devices in this class were better, 5% similar, 9% worse
» The best had a delta of 5%, average was 17%, worst was 45%
Compared to all devices tested
» 74% of all tested devices were better, 6% similar, 20% worse
» The best had a delta of 4%, average was 24%, worst was 134%
Frequency comparison (checkboxes selectable!)
Power Consumption
Even during idle, our test unit is a few watts more power hungry than the competitors. During exclusive load of the CPU via Prime95, the power consumption rises to 60 W initially and then finally decreases to 42 W due to the thermal clock speed conditions. In combination with FurMark, the power requirements increase to 64 W.
| Off / Standby | |
| Idle | |
| Load |
|
Key:
min: | |
Battery Life
There is an ad sticker which promises a battery life of 8 hours on the keyboard of the Asus VivoBook. We wanted to test this using our WLAN scenario, which simulates surfing the web at a brightness of 150 cd/m². Unfortunately, our test unit went into sleep state after barely 4 hours. The HP Pavilion shows more endurance when it interrupts its operations only after 6.5 hours.
| Battery Runtime - WiFi Websurfing | |
| Asus VivoBook 15 X510UQ-BQ534T | |
Pros
Cons
Verdict
The goal of the new VivoBook is unambiguous: a multimedia notebook for everyday life. The manufacturer has focused on the core characteristics of this category but does not use the full potential in some areas. While Asus' new 15-inch notebook has premium and high-quality looks, it is unfortunate that only plastic parts are used. In terms of the input devices, we already complained about the spongy keyboard which is only suitable for occasional typing work in our last test of the VivoBook-S series.
Things are better with the Full HD display, which is okay for this price range. The manufacturer uses a matte IPS panel here, which does not appear to be obligatory if we take a look at the competitors. In the performance area, we can particularly praise the powerful CPU. However, this results in a quick increase of the processor temperature, starting up the fans easily. Finally, we are missing some endurance in the battery life, considering that this is supposed to be an "everyday notebook."
The envisioned goal of the new VivoBook has not been achieved yet. But it still does its work as a multimedia notebook.
Interested buyers should compare it with the competitors. If you still have some financial wiggle room, you should take a look at the significantly more powerful Acer Swift 3.
Asus VivoBook 15 X510UQ-BQ534T
- 01/18/2018 v6 (old)
Nino Ricchizzi
Price comparison
