Dell Vostro 15 5568 (i7-7500U, 940MX) Laptop Review
For the original German review, see here.
We already tested the Dell Vostro 15 5568 (i5-7200U, HD620) in January 2017. The device was able to score with a good system performance and a battery life suitable for everyday use. The data sheet at that time included the entry-level business laptop with a faster processor variant and a dedicated graphics card, but this configuration could not be ordered from Dell yet. Now we are testing the visually identical device with an Nvidia GeForce 940MX GPU and an Intel Core i7-7500U processor.
In our current tests, we are expecting benchmark results that correlate with the boost in performance. The upgraded version not only has to compete with the test model from January but also with equally equipped business rivals and a convertible which has almost identical hardware as well. We chose the HP Spectre x360 15, Lenovo's ThinkPad T570, the Acer TravelMate P658-G2 and the Huawei MateBook D for this.
Case
The Dell Vostro 15 5568 case remains unchanged. For more details, see our Vostro 15 5568 review from January 2017. It also includes additional pictures.

Regarding the weight and measurements, our test model is ahead of most competitors. It is very lightweight and easily portable. Only the Huawei MateBook D is even smaller and weighs less.
Connectivity
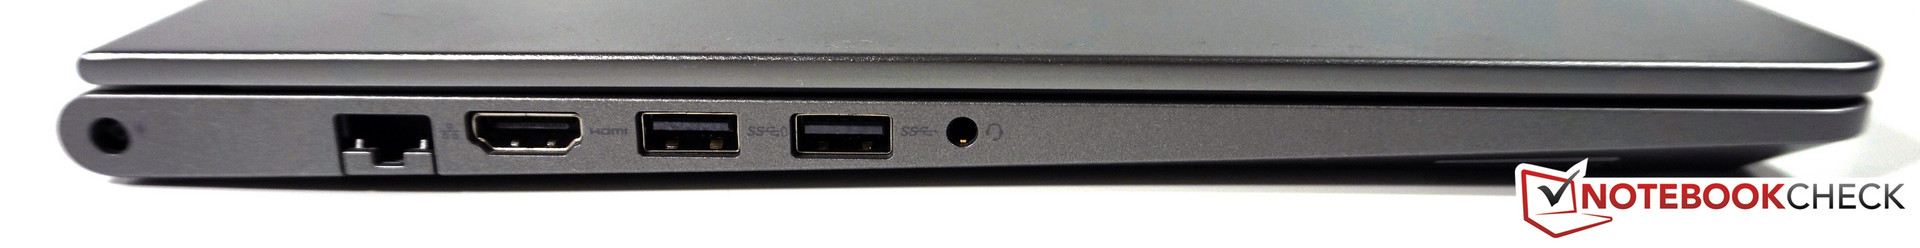
Dell did not change the connectivity options for the Vostro 15 5568. See our Vostro 15 5568 (i5-7200U, HD620) review to get an impression of the offered ports and their performance.
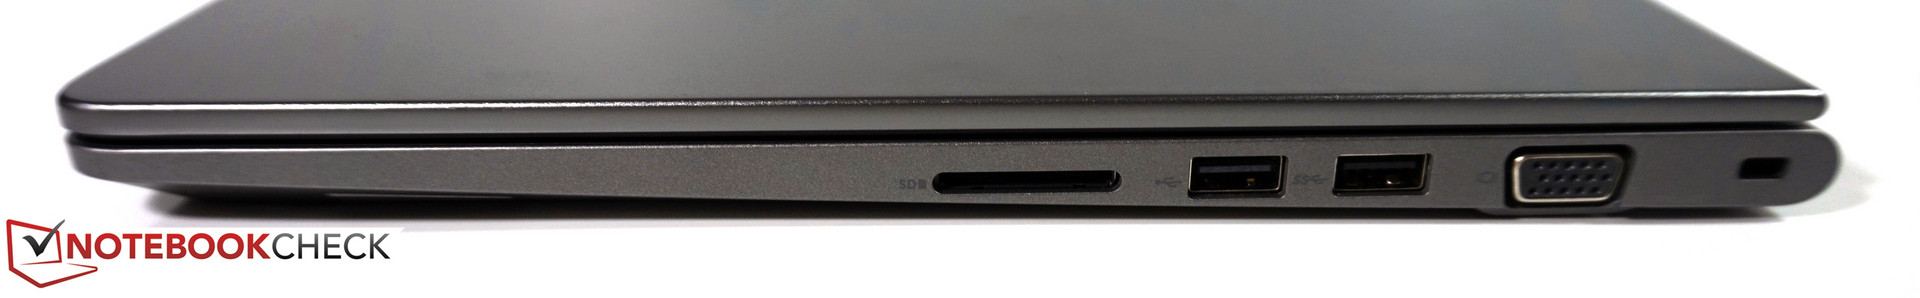
SD Card Reader
The Vostro 15 5568 reached only substandard transfer rates in our previous SD card reader test. The current test model does even worse. While the lower value for copying files using our reference memory card Toshiba Exceria Pro SDXC 64 GB UHS-II could be explained away with measuring inaccuracies, the extremely bad result for reading files can only be ascribed to the SD card reader's bad performance.
| SD Card Reader | |
| average JPG Copy Test (av. of 3 runs) | |
| HP Spectre x360 15-bl002xx (Toshiba Exceria Pro SDXC 64 GB UHS-II) | |
| Acer TravelMate P658-G2-MG-7327 (Toshiba Exceria Pro SDXC 64 GB UHS-II) | |
| Lenovo ThinkPad T570-20HAS01E00 (Toshiba Exceria Pro SDXC 64 GB UHS-II) | |
| Dell Vostro 15-5568 (Toshiba Exceria Pro SDXC 64 GB UHS-II) | |
| Dell Vostro 15-5568 (Toshiba Exceria Pro SDXC 64 GB UHS-II) | |
| maximum AS SSD Seq Read Test (1GB) | |
| HP Spectre x360 15-bl002xx (Toshiba Exceria Pro SDXC 64 GB UHS-II) | |
| Lenovo ThinkPad T570-20HAS01E00 (Toshiba Exceria Pro SDXC 64 GB UHS-II) | |
| Acer TravelMate P658-G2-MG-7327 (Toshiba Exceria Pro SDXC 64 GB UHS-II) | |
| Dell Vostro 15-5568 (Toshiba Exceria Pro SDXC 64 GB UHS-II) | |
| Dell Vostro 15-5568 (Toshiba Exceria Pro SDXC 64 GB UHS-II) | |
Communication
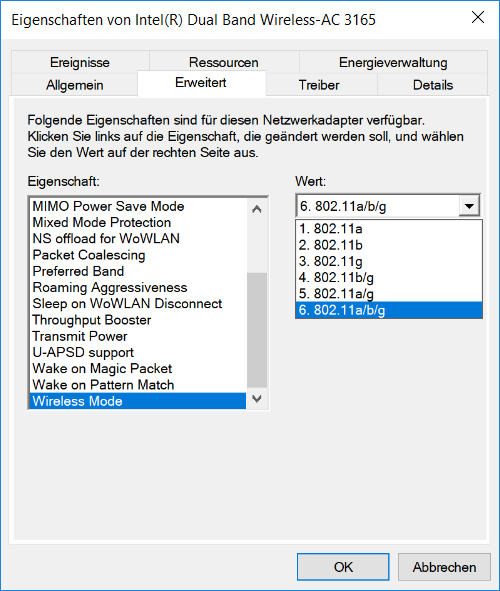
Dell equipped the Vostro 15 5568 with an Intel Dual Band Wireless-AC 3165 WLAN adapter which already did not perform very well in the predecessor model. But the module reaches a new low in our current test device. The data transfer rates are absolutely outdated. Even though Intel listed on their own website that the WLAN adapter supports the 802.11ac standard, we could only find the standards a, b, and g in the device manager of our test system. We were unable to figure out the reason for this constraint. An RJ45 port is included for a cabled network connection.
Security
In comparison to our January review of the Vostro 15 5568, the evaluation of the security features remains unchanged. See our review for further details. However, our current test device is equipped with an optional fingerprint-sensor which has very fast reaction times and unlocks the device in less than one second.
Accessories
Since our test device is equipped with a dedicated GPU, a 65-watt PSU (otherwise 45-watt) is included. There are no special accessories, but Dell does offer a few USB docking stations, external batteries, bags, and more in their store.
Maintenance
We discussed the maintenance options in detail in our previous review for the Dell Vostro 15 5568 in January, so we refer to that article again.
Warranty
Dell grants a one-year warranty for the Vostro 15 5568, including a collect & return service. It is possible to extend this warranty in a variety of ways for an additional charge. For example, an upgrade to a three-year on-site service costs about 40 Euros (~$47). Please see our Guarantees, Return Policies and Warranties FAQ for country-specific information.
Input Devices
Our assessment of the input devices can be found in our Dell Vostro 15 5568 review from January. In short: The keyboard is unsuitable for frequent writing and the touchpad stutters during drag & drop actions. Cursor movement is no problem, though, and multi-touch gestures, such as scrolling with two fingers, are executed very well.
Display
The display in our test model is slightly different from the one used in the Dell Vostro 15 5568 from our January test. The average brightness is a bit lower, but the response times are better. None of the competitors' displays could compare to such low values.
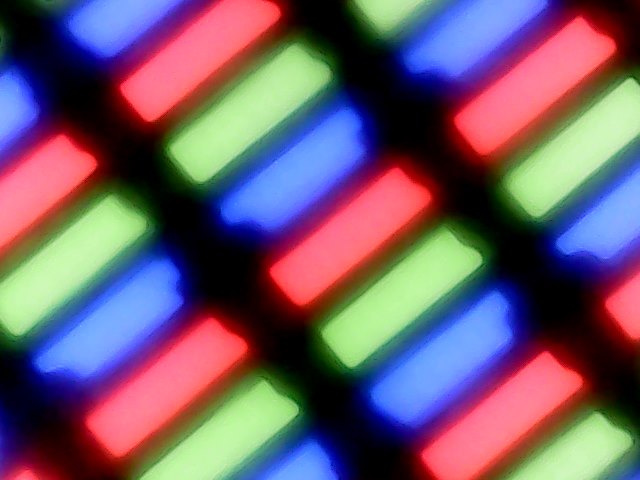
The Full HD TN panel has a resolution of 1920x1080 pixels. Alternatively, the Vostro 15 5568 is also available with a less expensive HD TN panel (1366x768 pixels).
| |||||||||||||||||||||||||
Brightness Distribution: 86 %
Center on Battery: 242 cd/m²
Contrast: 556:1 (Black: 0.43 cd/m²)
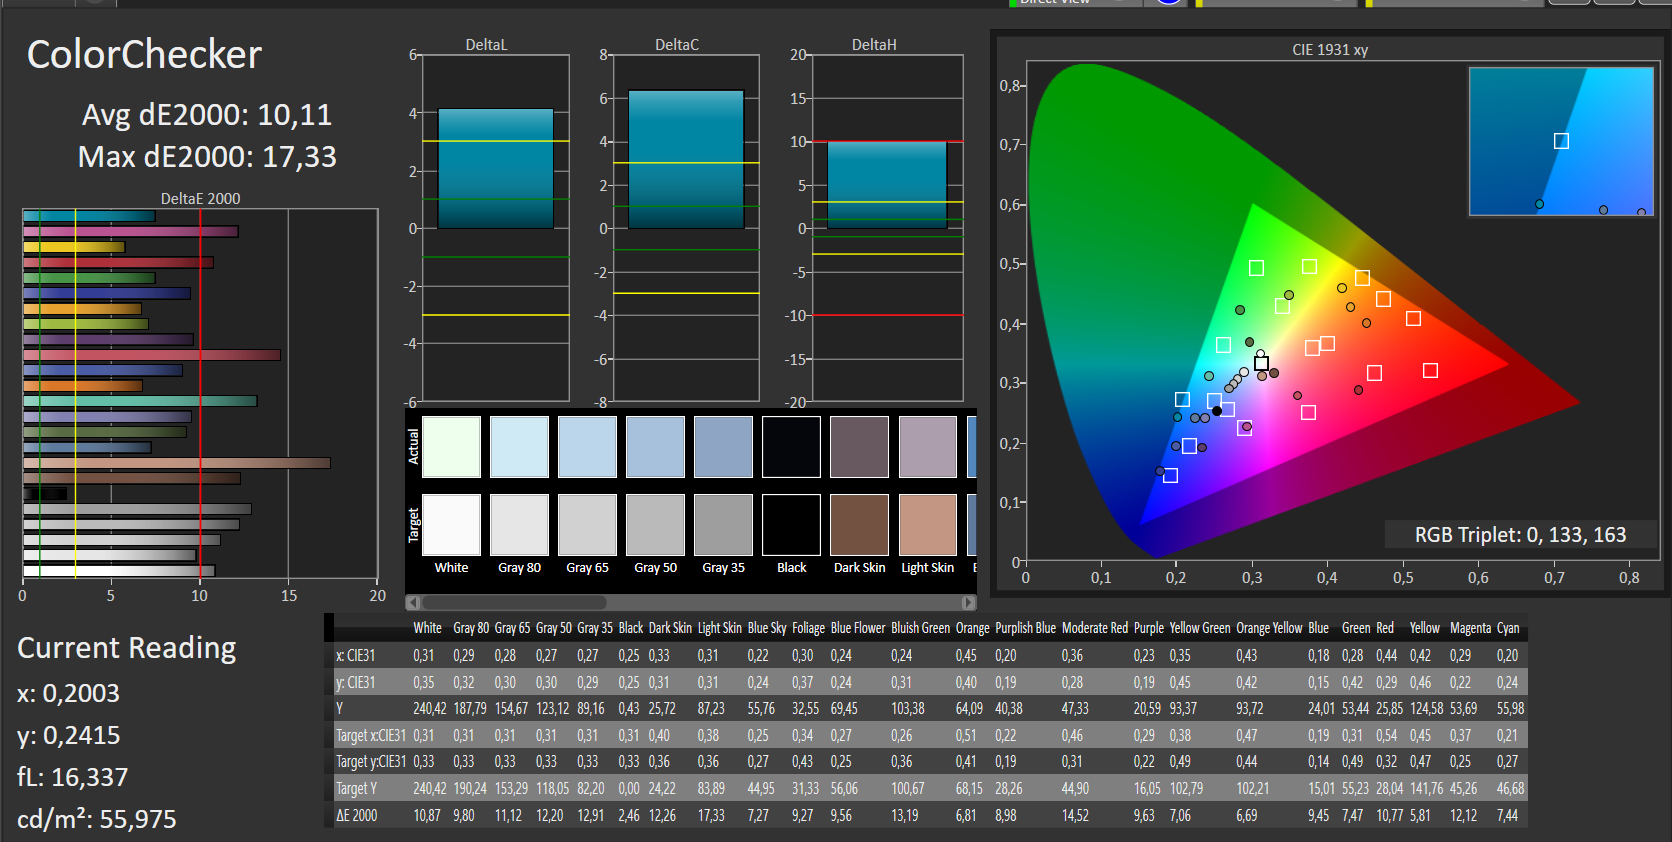
ΔE ColorChecker Calman: 10.11 | ∀{0.5-29.43 Ø4.71}
ΔE Greyscale Calman: 10.88 | ∀{0.09-98 Ø4.96}
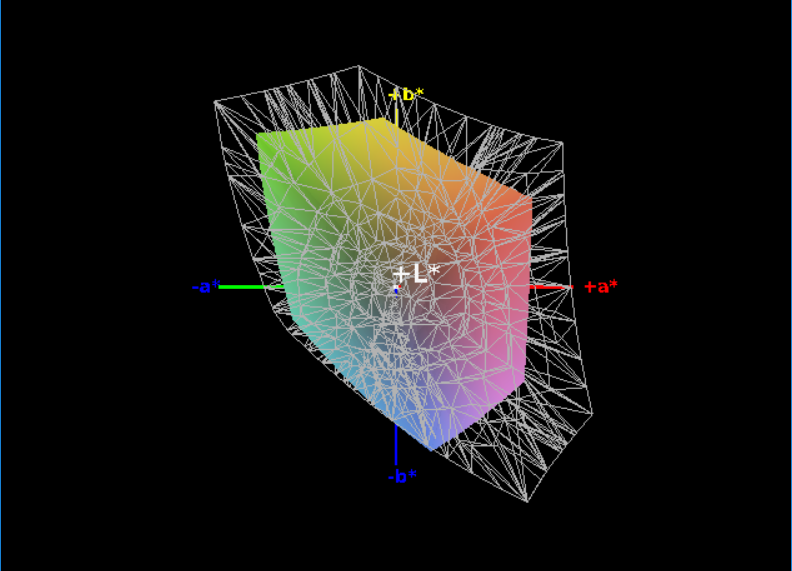
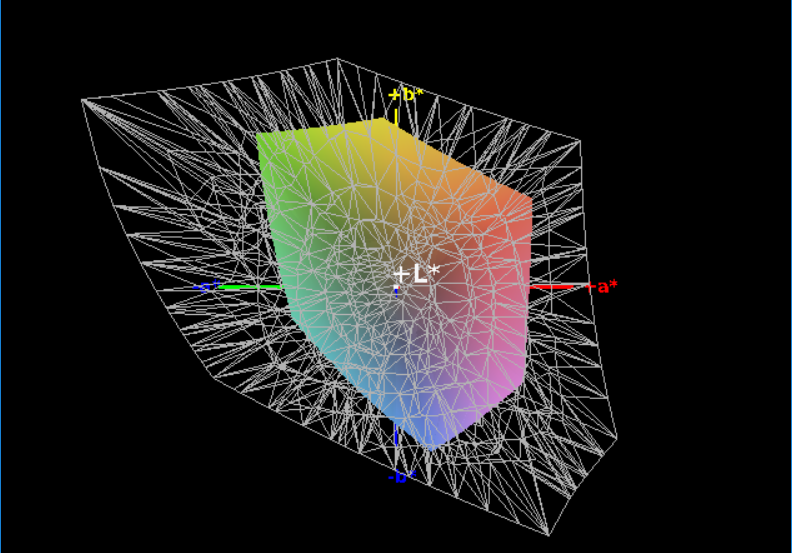
60% sRGB (Argyll 1.6.3 3D)
38% AdobeRGB 1998 (Argyll 1.6.3 3D)
41.5% AdobeRGB 1998 (Argyll 3D)
60% sRGB (Argyll 3D)
40.14% Display P3 (Argyll 3D)
Gamma: 2.33
CCT: 11924 K
| Dell Vostro 15-5568 Chi Mei CMN15C4, , 1920x1080, 15.6" | HP Spectre x360 15-bl002xx UHD UWVA eDP BrightView WLED-backlit , , 3840x2160, 15.6" | Acer TravelMate P658-G2-MG-7327 LG Philips LP156WF6-SPP1, , 1920x1080, 15.6" | Huawei MateBook D 15, i7-7500U 940MX BOE070C, , 1920x1080, 15.6" | Lenovo ThinkPad T570-20HAS01E00 BOE NV156QUM-N44, , 3840x2160, 15.6" | Dell Vostro 15-5568 Chi Mei CMN154C-8KV42 , , 1920x1080, 15.6" | |
|---|---|---|---|---|---|---|
| Display | 57% | 52% | 3% | 62% | ||
| Display P3 Coverage (%) | 40.14 | 67.9 69% | 64.9 62% | 41.79 4% | 70 74% | |
| sRGB Coverage (%) | 60 | 88.2 47% | 85.9 43% | 61.5 2% | 91.1 52% | |
| AdobeRGB 1998 Coverage (%) | 41.5 | 64.4 55% | 62.8 51% | 43.17 4% | 66.7 61% | |
| Response Times | -83% | -40% | -79% | -1% | -49% | |
| Response Time Grey 50% / Grey 80% * (ms) | 41 ? | 44 ? -7% | 38 ? 7% | 46.4 ? -13% | 41.6 ? -1% | 47.6 ? -16% |
| Response Time Black / White * (ms) | 15 ? | 38.8 ? -159% | 28 ? -87% | 36.8 ? -145% | 15.2 ? -1% | 27.2 ? -81% |
| PWM Frequency (Hz) | 26000 ? | 1000 ? | 21000 ? | 21190 | 926 ? | |
| Screen | 63% | 40% | 13% | 45% | -6% | |
| Brightness middle (cd/m²) | 239 | 351.5 47% | 284 19% | 268 12% | 339 42% | 229 -4% |
| Brightness (cd/m²) | 219 | 336 53% | 276 26% | 258 18% | 314 43% | 222 1% |
| Brightness Distribution (%) | 86 | 83 -3% | 82 -5% | 92 7% | 89 3% | 82 -5% |
| Black Level * (cd/m²) | 0.43 | 0.24 44% | 0.295 31% | 0.47 -9% | 0.36 16% | 0.56 -30% |
| Contrast (:1) | 556 | 1465 163% | 963 73% | 570 3% | 942 69% | 409 -26% |
| Colorchecker dE 2000 * | 10.11 | 3.3 67% | 4.07 60% | 5.7 44% | 4.2 58% | 10.36 -2% |
| Colorchecker dE 2000 max. * | 17.33 | 7.3 58% | 10.52 39% | 21.7 -25% | 7.8 55% | 14.95 14% |
| Greyscale dE 2000 * | 10.88 | 1.9 83% | 3.13 71% | 4.2 61% | 5.1 53% | 10.9 -0% |
| Gamma | 2.33 94% | 2.09 105% | 2.41 91% | 2.3 96% | 2.16 102% | 2.21 100% |
| CCT | 11924 55% | 6784 96% | 7082 92% | 6820 95% | 6569 99% | 10084 64% |
| Color Space (Percent of AdobeRGB 1998) (%) | 38 | 64.4 69% | 56 47% | 43.2 14% | 59.4 56% | 37.69 -1% |
| Color Space (Percent of sRGB) (%) | 60 | 88.2 47% | 86 43% | 61.5 2% | 91 52% | 57.92 -3% |
| Total Average (Program / Settings) | 12% /
42% | 17% /
32% | -21% /
-1% | 35% /
42% | -28% /
-13% |
* ... smaller is better
The brightness and contrast of the screen are subpar, causing the screen content to appear somewhat pale and colorless. The low black level adds to this impression and the color-space coverage is substandard in comparison to other devices. Additionally, we detected PWM-flickering during our measurements. The display flickers at 26,000 Hz with a brightness setting of 20%. This is a relatively high value, but working on this screen might still prove strenuous to users with sensitive eyes.


Regarding the viewing-angle stability and the outdoor usability, the current test model is comparable to the Vostro 15 5568 from our January 2017 article. So we again refer to the review of the Vostro 15 5568 with an i5-7200U CPU.
Display Response Times
| ↔ Response Time Black to White | ||
|---|---|---|
| 15 ms ... rise ↗ and fall ↘ combined | ↗ 11 ms rise | 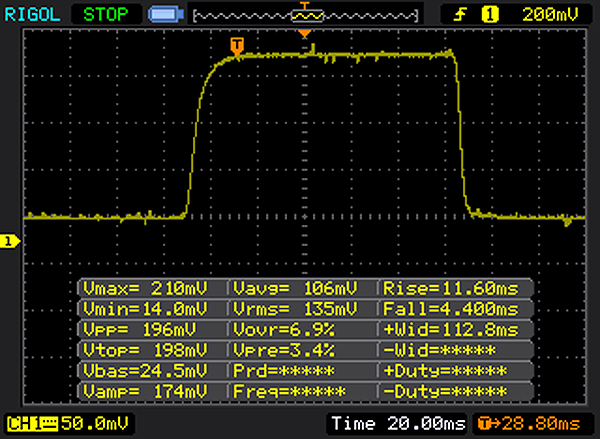 |
| ↘ 4 ms fall | ||
| The screen shows good response rates in our tests, but may be too slow for competitive gamers. In comparison, all tested devices range from 0.1 (minimum) to 240 (maximum) ms. » 36 % of all devices are better. This means that the measured response time is better than the average of all tested devices (19.8 ms). | ||
| ↔ Response Time 50% Grey to 80% Grey | ||
| 41 ms ... rise ↗ and fall ↘ combined | ↗ 24 ms rise | 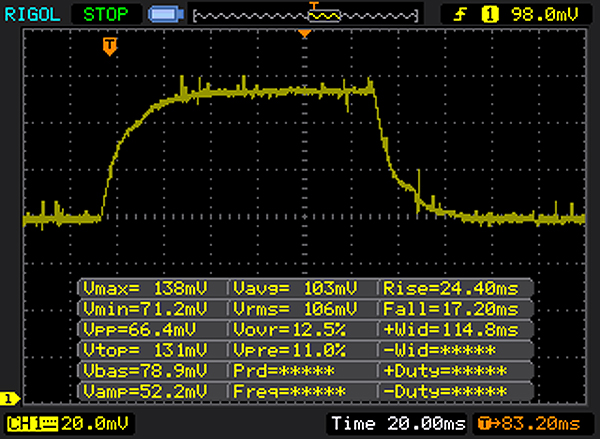 |
| ↘ 17 ms fall | ||
| The screen shows slow response rates in our tests and will be unsatisfactory for gamers. In comparison, all tested devices range from 0.165 (minimum) to 636 (maximum) ms. » 65 % of all devices are better. This means that the measured response time is worse than the average of all tested devices (30.9 ms). | ||
Screen Flickering / PWM (Pulse-Width Modulation)
| Screen flickering / PWM detected | 26000 Hz | ≤ 20 % brightness setting | 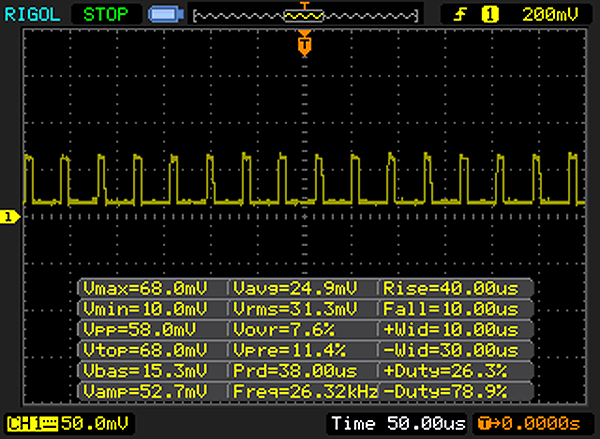 |
The display backlight flickers at 26000 Hz (worst case, e.g., utilizing PWM) Flickering detected at a brightness setting of 20 % and below. There should be no flickering or PWM above this brightness setting. The frequency of 26000 Hz is quite high, so most users sensitive to PWM should not notice any flickering. In comparison: 52 % of all tested devices do not use PWM to dim the display. If PWM was detected, an average of 7741 (minimum: 5 - maximum: 343500) Hz was measured. | |||
Performance
The Vostro series mainly caters to business users looking for an inexpensive entry-level device. Hence, it includes low-priced models for about 500 Euros (~$588) with a Kaby Lake Core i3 processor, 4 GB DDR4 RAM and a 500 GB HDD, but it also includes higher-priced models such as our test device with a dedicated graphics card for about 800 Euros (~$941). Further hardware upgrades are available via the Dell customer service.

Processor
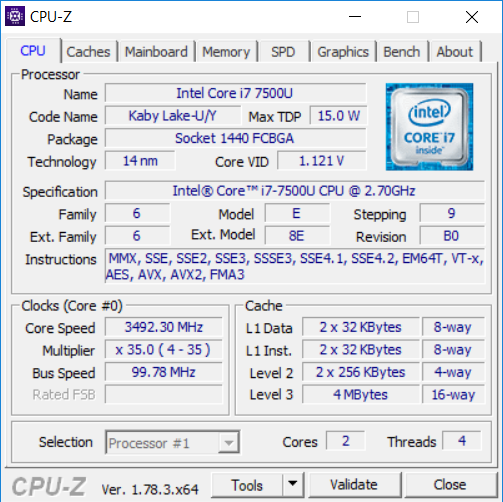
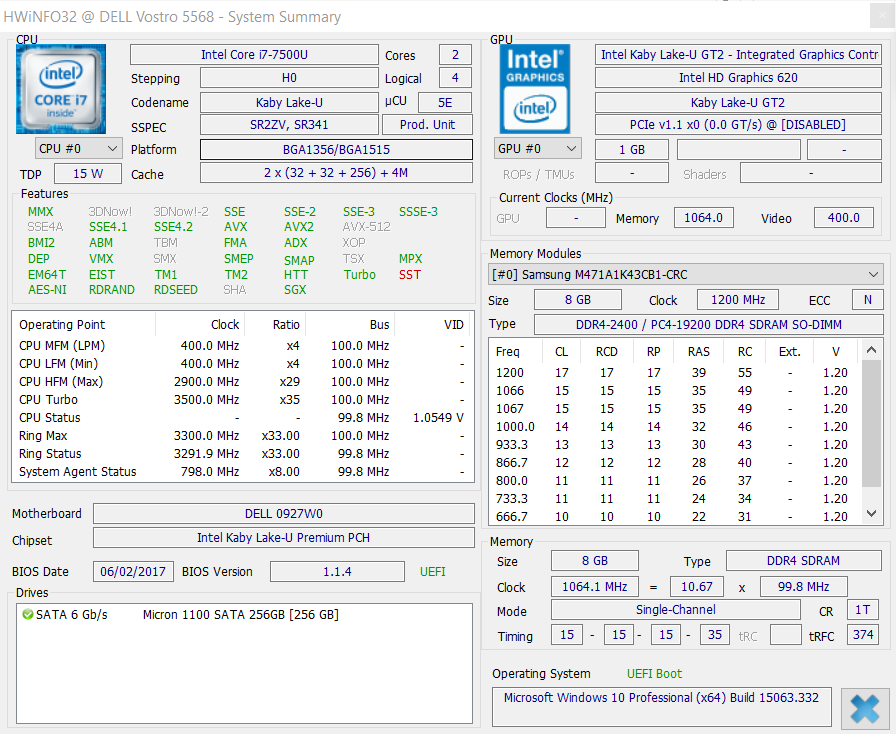
Our test device utilizes an Intel Core i7-7500U CPU. This processor stands out due to low power consumption and is suitable for a more challenging multi-tasking environment. It is possible to run even demanding 3D applications in combination with an appropriate graphics card.
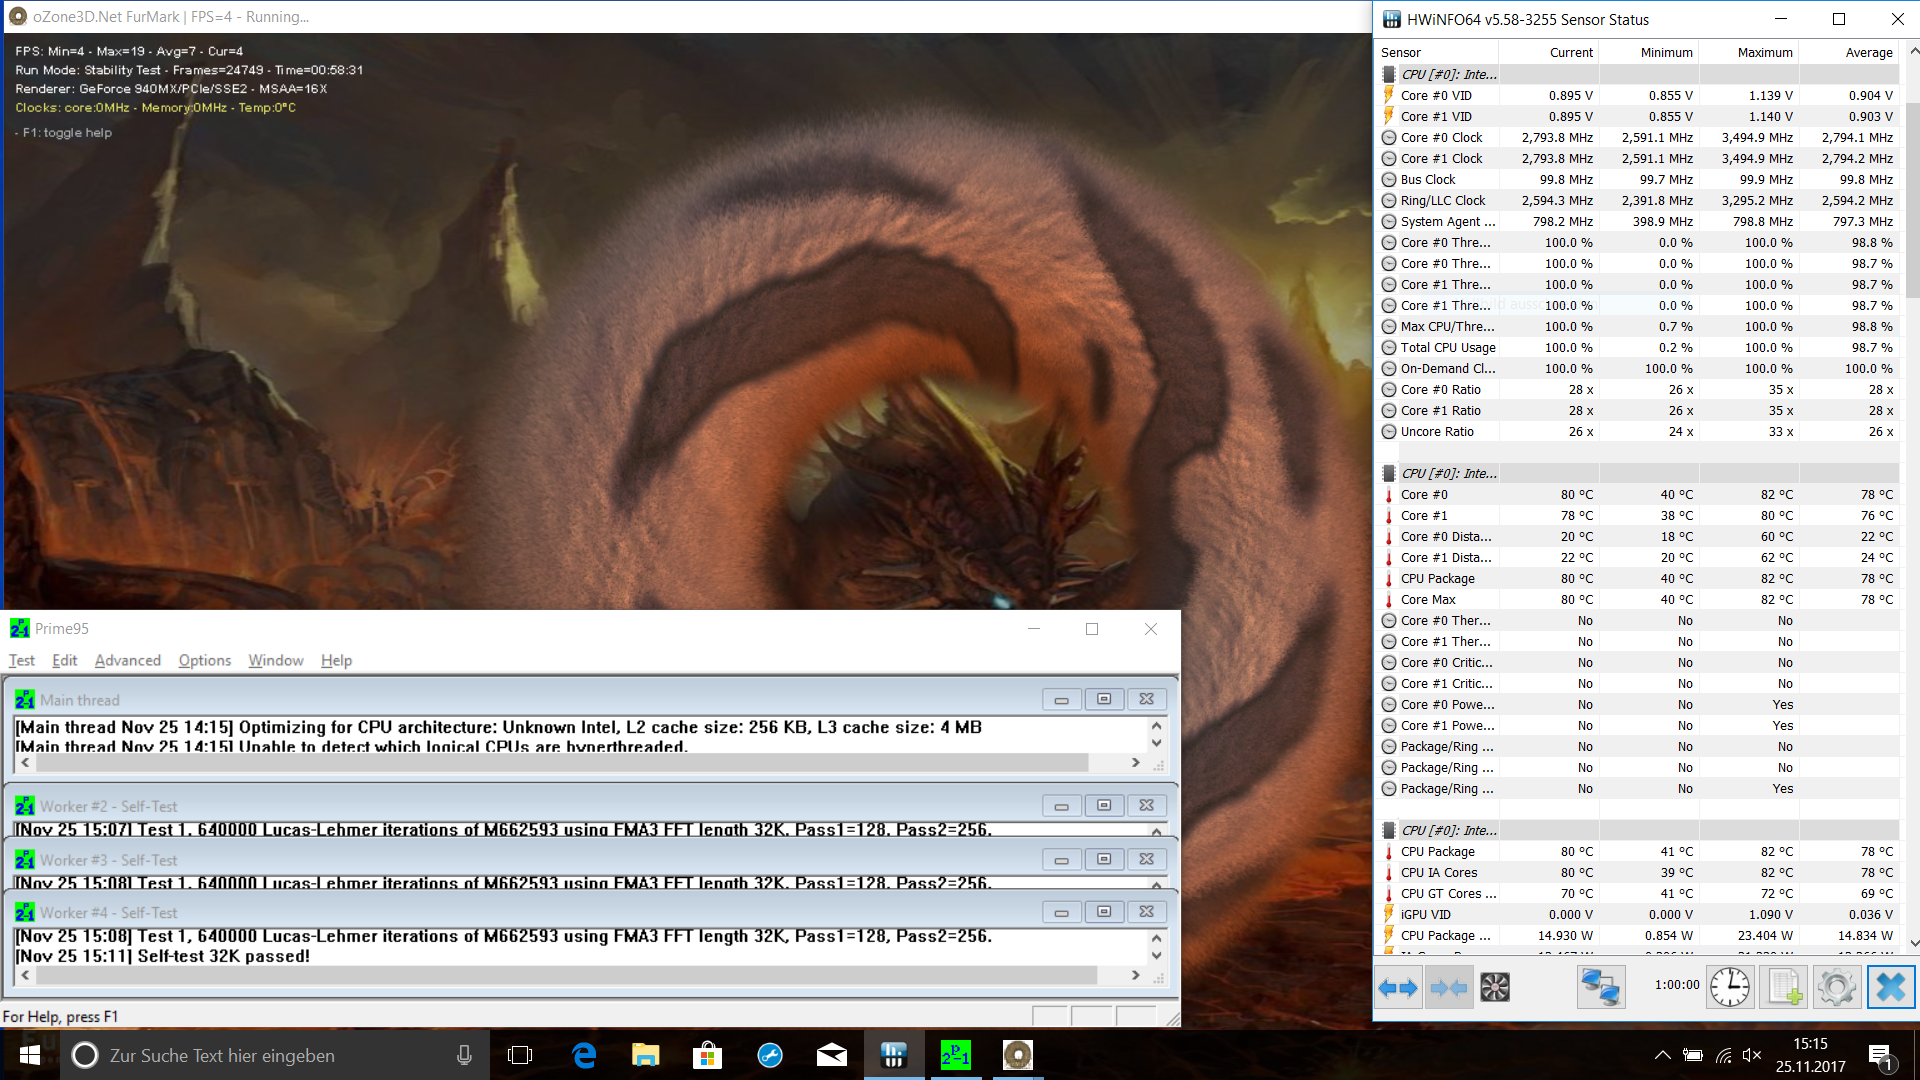
The processor of the Vostro 15 5568 placed in the midrange of the comparison devices in our tests. A prolonged test revealed that the CPU is able to sustain its performance constantly. However, the performance boost is relatively small in comparison to the Vostro 15 5568 with Intel Core i5-7200U CPU. So potential customers may also want to consider the less expensive i5 CPU.
Further results of the Core i7-7500U CPU can be found on our benchmark page.
System Performance
The Vostro 15 5568's system runs smoothly in everyday use. The benchmark results confirm, however, that the advantage over the Vostro 15 5568 with an i5-7200U CPU is limited. Our test device scored only slightly higher, probably not justifying the price for the supposedly faster CPU.
| PCMark 8 Home Score Accelerated v2 | 3672 points | |
| PCMark 8 Work Score Accelerated v2 | 4821 points | |
Help | ||
Storage Devices
Dell utilized a Micron SSD with 256 GB capacity for our test device. This SSD is considerably slower than the 256 GB SanDisk X400 which was used for the configuration of the Vostro 15 5568 with an i5-7200U CPU. This is the reason why our test device scored significantly lower and ended up in the last spot of our comparison list.
Our benchmark section shows how this SSD compares to other storage devices.
| Dell Vostro 15-5568 Micron SSD 1100 (MTFDDAV256TBN) | HP Spectre x360 15-bl002xx Toshiba XG4 NVMe (THNSN5512GPUK) | Acer TravelMate P658-G2-MG-7327 Liteonit CV3-8D512 | Huawei MateBook D 15, i7-7500U 940MX SanDisk SD8SN8U128G1027 | Lenovo ThinkPad T570-20HAS01E00 Samsung PM961 NVMe MZVLW512HMJP | Dell Vostro 15-5568 SanDisk X400 256GB, SATA (SD8SB8U-256G) | |
|---|---|---|---|---|---|---|
| CrystalDiskMark 3.0 | 184% | 24% | 24% | 222% | 44% | |
| Read Seq (MB/s) | 476.2 | 1266 166% | 526 10% | 478.4 0% | 1210 154% | 497.8 5% |
| Write Seq (MB/s) | 238.7 | 982 311% | 256.9 8% | 314.9 32% | 1134 375% | 466.8 96% |
| Read 512 (MB/s) | 312.9 | 834 167% | 227.1 -27% | 331.2 6% | 789 152% | 363.4 16% |
| Write 512 (MB/s) | 161.7 | 714 342% | 246.3 52% | 181.4 12% | 903 458% | 368.5 128% |
| Read 4k (MB/s) | 21.87 | 40.72 86% | 25.74 18% | 36.84 68% | 58.4 167% | 29.02 33% |
| Write 4k (MB/s) | 93.6 | 139.4 49% | 68.8 -26% | 82.7 -12% | 144.1 54% | 56 -40% |
| Read 4k QD32 (MB/s) | 172.8 | 527 205% | 354.8 105% | 368.5 113% | 559 223% | 296 71% |
| Write 4k QD32 (MB/s) | 161.2 | 395.2 145% | 248.8 54% | 123.2 -24% | 474.4 194% | 229.4 42% |

Graphics Card
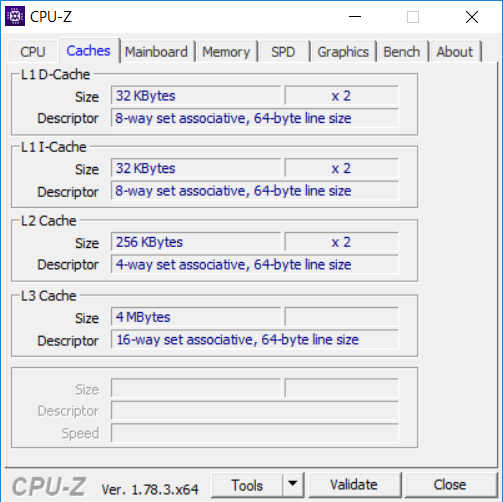
The Intel Core i7-7500U processor has an integrated HD Graphics 620 graphics card suitable for most office applications, basic image-editing and light 3D modeling. The actual performance of the HD Graphics 620 depends on the system's RAM, among other factors.
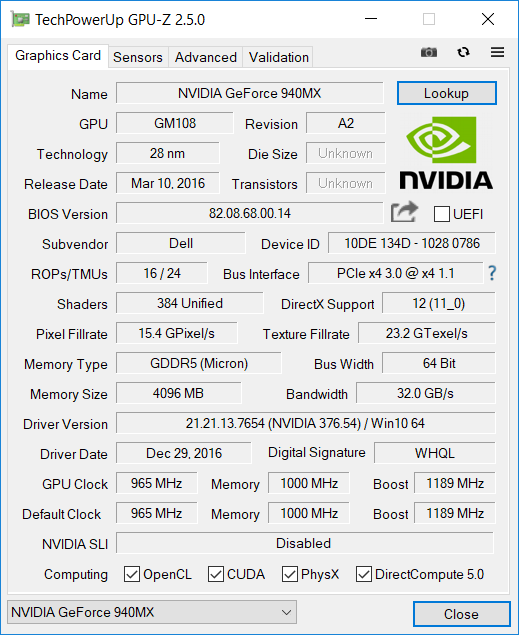
Additionally, our test device is equipped with a dedicated graphics card. Dell used an Nvidia GeForce 940MX with 4 GB GDDR5 RAM for the Vostro 15 5568. This is a mid-range graphics card which is only just able to display current games smoothly on lowest settings.
Our benchmark results clearly show the performance gain in comparison to the Vostro 15 5568 without dedicated GPU. However, most competitors that are also equipped with a GeForce 940MX score higher.
See our benchmark page for further comparisons of the Nvidia GeForce 940MX's performance in other devices.
| 3DMark 11 - 1280x720 Performance GPU | |
| Huawei MateBook D 15, i7-7500U 940MX | |
| Lenovo ThinkPad T570-20HAS01E00 | |
| Dell Vostro 15-5568 | |
| HP Spectre x360 15-bl002xx | |
| Acer TravelMate P658-G2-MG-7327 | |
| Dell Vostro 15-5568 | |
| 3DMark | |
| 1280x720 Cloud Gate Standard Graphics | |
| Huawei MateBook D 15, i7-7500U 940MX | |
| Lenovo ThinkPad T570-20HAS01E00 | |
| HP Spectre x360 15-bl002xx | |
| Dell Vostro 15-5568 | |
| Dell Vostro 15-5568 | |
| 1920x1080 Fire Strike Graphics | |
| Huawei MateBook D 15, i7-7500U 940MX | |
| Lenovo ThinkPad T570-20HAS01E00 | |
| HP Spectre x360 15-bl002xx | |
| Dell Vostro 15-5568 | |
| Dell Vostro 15-5568 | |
| 3DMark 11 Performance | 2769 points | |
| 3DMark Cloud Gate Standard Score | 8208 points | |
| 3DMark Fire Strike Score | 1905 points | |
Help | ||
Gaming Performance
Nvidia's GeForce 940MX is a solid graphics card for casual gamers or fans of older games. Even newer games ran smoothly on low settings in our gaming benchmarks. The performance even suffices for medium or high settings in older games. The test results meet the expected level, but some competitors manage to elicit a significantly higher graphics performance from the GeForce 940MX.
Find out on our benchmark page what performance to expect from Nvidia's dedicated graphics card in other games.
| low | med. | high | ultra | |
|---|---|---|---|---|
| BioShock Infinite (2013) | 112.1 | 61.9 | 52.4 | 20.29 |
| Thief (2014) | 43.3 | 24.3 | 17.2 | 12.5 |
| Dragon Age: Inquisition (2014) | 61.8 | 42.1 | 9.6 |
Emissions
System Noise
For an evaluation of the fan noise, we refer to our review of the Dell Vostro 15 5568 with Core i5-7200U CPU. The only difference is the noise under load. Due to the dedicated graphics card, a higher cooling performance is necessary. As a result, the fan noise becomes clearly audible, for example while running games. The steady buzzing is tolerable, though. Most competitors are much quieter under load, despite having dedicated GPUs.
Noise level
| Idle |
| 30.2 / 30.2 / 30.2 dB(A) |
| Load |
| 40.4 / 40.6 dB(A) |
 | ||
30 dB silent 40 dB(A) audible 50 dB(A) loud |
||
min: | ||
Temperature
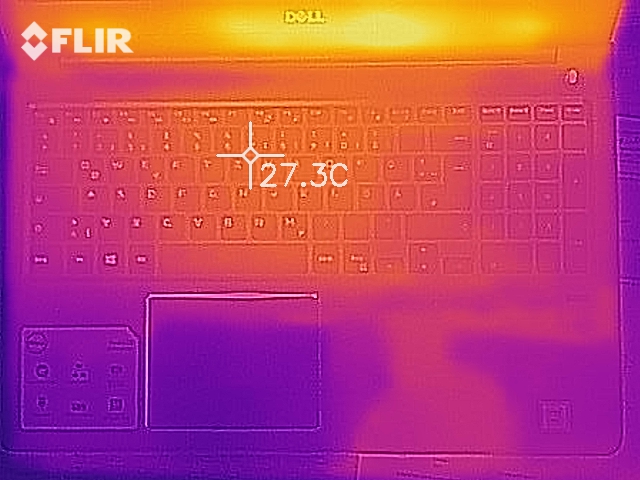
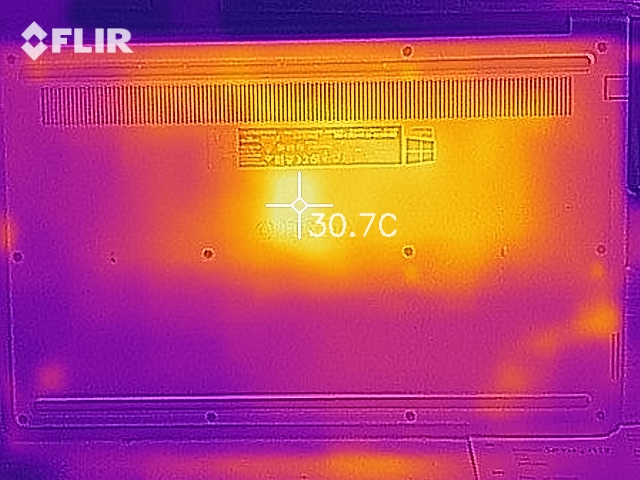
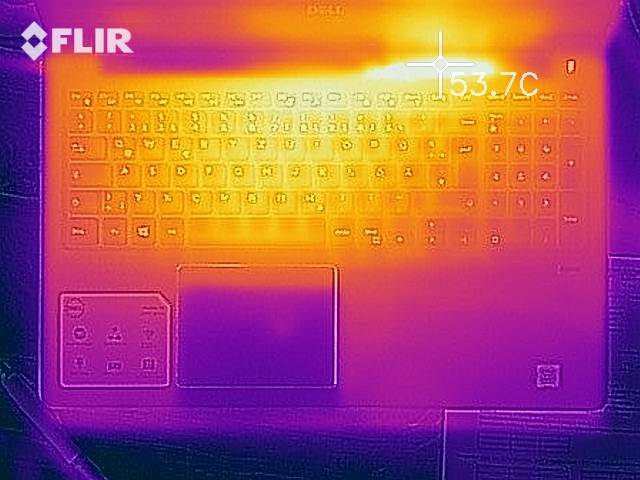
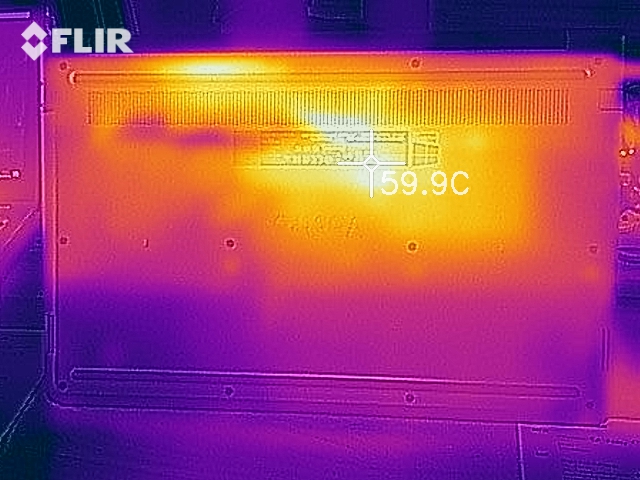
The dedicated graphics card is noticeable in regard to the temperatures as well. While idling, our test device heats up only slightly more than the model without an Nvidia GPU, but the surface temperatures rise significantly under load. They are up to 15 °C higher at some hot spots than for the Vostro 15 5569 with Intel HD Graphics 620. Nevertheless, the device can still be used on one's lap without any problems.
In our stress test scenario, the Vostro 15 5568 behaved the same way the January test model did. The core temperatures rose to over 80 °C while the processor's base frequency did not throttle, even after a full hour.
(±) The maximum temperature on the upper side is 43.5 °C / 110 F, compared to the average of 34.3 °C / 94 F, ranging from 21.2 to 62.5 °C for the class Office.
(-) The bottom heats up to a maximum of 56.2 °C / 133 F, compared to the average of 36.8 °C / 98 F
(+) In idle usage, the average temperature for the upper side is 25.2 °C / 77 F, compared to the device average of 29.5 °C / 85 F.
(+) The palmrests and touchpad are cooler than skin temperature with a maximum of 28.4 °C / 83.1 F and are therefore cool to the touch.
(±) The average temperature of the palmrest area of similar devices was 27.6 °C / 81.7 F (-0.8 °C / -1.4 F).
Speakers
For an evaluation of the speakers, we refer to the review of the Dell Vostro 15 5568 with Core i5-7200U CPU.
Dell Vostro 15-5568 audio analysis
(-) | not very loud speakers (67.5 dB)
Bass 100 - 315 Hz
(-) | nearly no bass - on average 19.3% lower than median
(±) | linearity of bass is average (12.6% delta to prev. frequency)
Mids 400 - 2000 Hz
(±) | higher mids - on average 7.9% higher than median
(±) | linearity of mids is average (8% delta to prev. frequency)
Highs 2 - 16 kHz
(+) | balanced highs - only 2.2% away from median
(±) | linearity of highs is average (7.5% delta to prev. frequency)
Overall 100 - 16.000 Hz
(±) | linearity of overall sound is average (26.8% difference to median)
Compared to same class
» 82% of all tested devices in this class were better, 6% similar, 11% worse
» The best had a delta of 7%, average was 21%, worst was 53%
Compared to all devices tested
» 82% of all tested devices were better, 4% similar, 14% worse
» The best had a delta of 4%, average was 23%, worst was 134%
Apple MacBook 12 (Early 2016) 1.1 GHz audio analysis
(+) | speakers can play relatively loud (83.6 dB)
Bass 100 - 315 Hz
(±) | reduced bass - on average 11.3% lower than median
(±) | linearity of bass is average (14.2% delta to prev. frequency)
Mids 400 - 2000 Hz
(+) | balanced mids - only 2.4% away from median
(+) | mids are linear (5.5% delta to prev. frequency)
Highs 2 - 16 kHz
(+) | balanced highs - only 2% away from median
(+) | highs are linear (4.5% delta to prev. frequency)
Overall 100 - 16.000 Hz
(+) | overall sound is linear (10.2% difference to median)
Compared to same class
» 7% of all tested devices in this class were better, 2% similar, 90% worse
» The best had a delta of 5%, average was 18%, worst was 53%
Compared to all devices tested
» 5% of all tested devices were better, 1% similar, 94% worse
» The best had a delta of 4%, average was 23%, worst was 134%
Frequency diagram in comparison (checkboxes are selectable!)
Energy Management
Power Consumption
In comparison to the competitors, the power consumption of the Vostro 15 5568 is lower than average. The results of the comparison devices prove that the dedicated graphics card cannot be the sole reason for this, since the competitors have considerably higher power consumptions than our test device. In comparison to the Vostro 15 5568 without dedicated GPU, our test device draws 15 watts more under load.
| Off / Standby | |
| Idle | |
| Load |
|
Key:
min: | |
| Dell Vostro 15-5568 i7-7500U, GeForce 940MX, Micron SSD 1100 (MTFDDAV256TBN), TN LED, 1920x1080, 15.6" | HP Spectre x360 15-bl002xx i7-7500U, GeForce 940MX, Toshiba XG4 NVMe (THNSN5512GPUK), IPS, 3840x2160, 15.6" | Acer TravelMate P658-G2-MG-7327 i7-7500U, GeForce 940MX, Liteonit CV3-8D512, IPS, 1920x1080, 15.6" | Huawei MateBook D 15, i7-7500U 940MX i7-7500U, GeForce 940MX, SanDisk SD8SN8U128G1027, IPS, 1920x1080, 15.6" | Lenovo ThinkPad T570-20HAS01E00 i7-7500U, GeForce 940MX, Samsung PM961 NVMe MZVLW512HMJP, IPS, 3840x2160, 15.6" | Dell Vostro 15-5568 i5-7200U, HD Graphics 620, SanDisk X400 256GB, SATA (SD8SB8U-256G), TN LED, 1920x1080, 15.6" | |
|---|---|---|---|---|---|---|
| Power Consumption | -73% | -28% | -27% | -48% | 5% | |
| Idle Minimum * (Watt) | 3.1 | 8.14 -163% | 3.9 -26% | 5.14 -66% | 4.7 -52% | 3.3 -6% |
| Idle Average * (Watt) | 6.3 | 10.91 -73% | 7.9 -25% | 9.07 -44% | 9.9 -57% | 6.8 -8% |
| Idle Maximum * (Watt) | 6.5 | 12.26 -89% | 11.3 -74% | 9.33 -44% | 10.9 -68% | 7.7 -18% |
| Load Average * (Watt) | 46 | 45.67 1% | 47 -2% | 46.76 -2% | 56.1 -22% | 30.9 33% |
| Load Maximum * (Watt) | 54 | 74.94 -39% | 62 -15% | 42.59 21% | 75 -39% | 40.3 25% |
| Witcher 3 ultra * (Watt) | 40.18 |
* ... smaller is better
Battery Runtime
It does not come as a surprise that the Vostro 15 5568 with GeForce 940MX has a shorter battery life than its counterpart without dedicated GPU. However, we would have liked a higher stamina, especially in WLAN. In comparison to the competitors, our test device ranks lowest, well behind the devices of other manufacturers which provide significantly longer battery runtimes.
| Dell Vostro 15-5568 i7-7500U, GeForce 940MX, 42 Wh | HP Spectre x360 15-bl002xx i7-7500U, GeForce 940MX, 79.2 Wh | Acer TravelMate P658-G2-MG-7327 i7-7500U, GeForce 940MX, 55 Wh | Huawei MateBook D 15, i7-7500U 940MX i7-7500U, GeForce 940MX, 43.3 Wh | Lenovo ThinkPad T570-20HAS01E00 i7-7500U, GeForce 940MX, 56 Wh | Dell Vostro 15-5568 i5-7200U, HD Graphics 620, 42 Wh | |
|---|---|---|---|---|---|---|
| Battery runtime | 69% | 95% | 38% | 61% | 35% | |
| Reader / Idle (h) | 13.3 | 14.4 8% | 15.9 20% | 13.3 0% | 16.9 27% | |
| WiFi v1.3 (h) | 4.3 | 8.9 107% | 8.4 95% | 7.4 72% | 6.9 60% | 6 40% |
| Load (h) | 1.3 | 2.5 92% | 1.6 23% | 2.9 123% | 1.8 38% | |
| H.264 (h) | 8.1 | 8.5 |
Verdict
Pros
Cons
The Vostro 15 5568 is still an inexpensive business laptop. The offered performance is appropriate for the low price. The low WLAN performance and the bad keyboard in particular might discourage interested customers. Whether the minimalistic security features should be taken into regard for the purchase decision is something prospective buyers have to decide for themselves.
With the Vostro 15 5568, Dell offers a low-priced and visually pleasing business laptop. The WLAN and security features have some flaws, though.
For interested customers looking for an inexpensive business laptop, the Vostro 15 5568 is certainly still suitable. The device can run standard office applications (presentations, spreadsheet analysis, and e-mails) without any problems. However, the bad display has to be taken into account, especially for 3D applications requiring a dedicated graphics card. If the offered viewing angles and color-space coverage are sufficient, then this laptop is a valid purchase option.
Dell Vostro 15-5568
- 12/04/2017 v6 (old)
Mike Wobker
Price comparison
