Dell Vostro 15 3568 (7200U, 256GB) Laptop Review
For the original German review, see here.
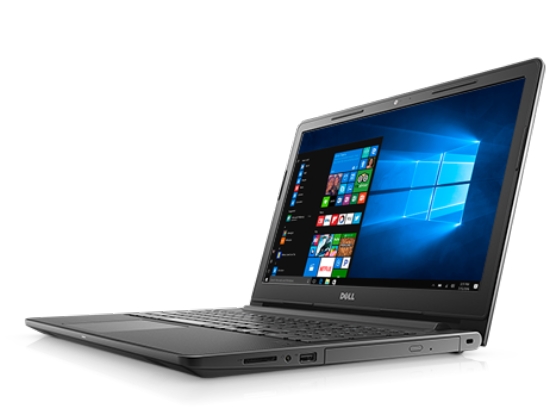
According to the manufacturer, Dell's latest Vostro 15 3568 is targeted towards small businesses, but might also be interesting for private office users. It is an affordable and therefore, simply designed office notebook in the 15-inch format. The tested configuration with i5-7200U, Intel HD graphics 620, 8 GB of RAM, Full HD TN display, 256 GB SSD, and Windows 10 Pro was available for around 700 Euros (~$825) at the time of our testing, while the most affordable configuration was available for about 200 Euros (~$235) less. Fans of optical media are served with a DVD burner. Among other things, Dell also points out its essential security features which are implemented in the TPM-2.0 chip. The last time we had a direct predecessor of the Vostro 15 3558 in our test was the year before last. Dell does not offer any hardware configuration options on its webpage for the device.
Office laptops in this price range are quite common. When selecting the comparison notebooks for this test, we looked at the format, class, chip, our own test results as well as the price. This time, we have included the following office notebooks in our comparison that like our test unit house the Intel Core i5-7200U:
Case
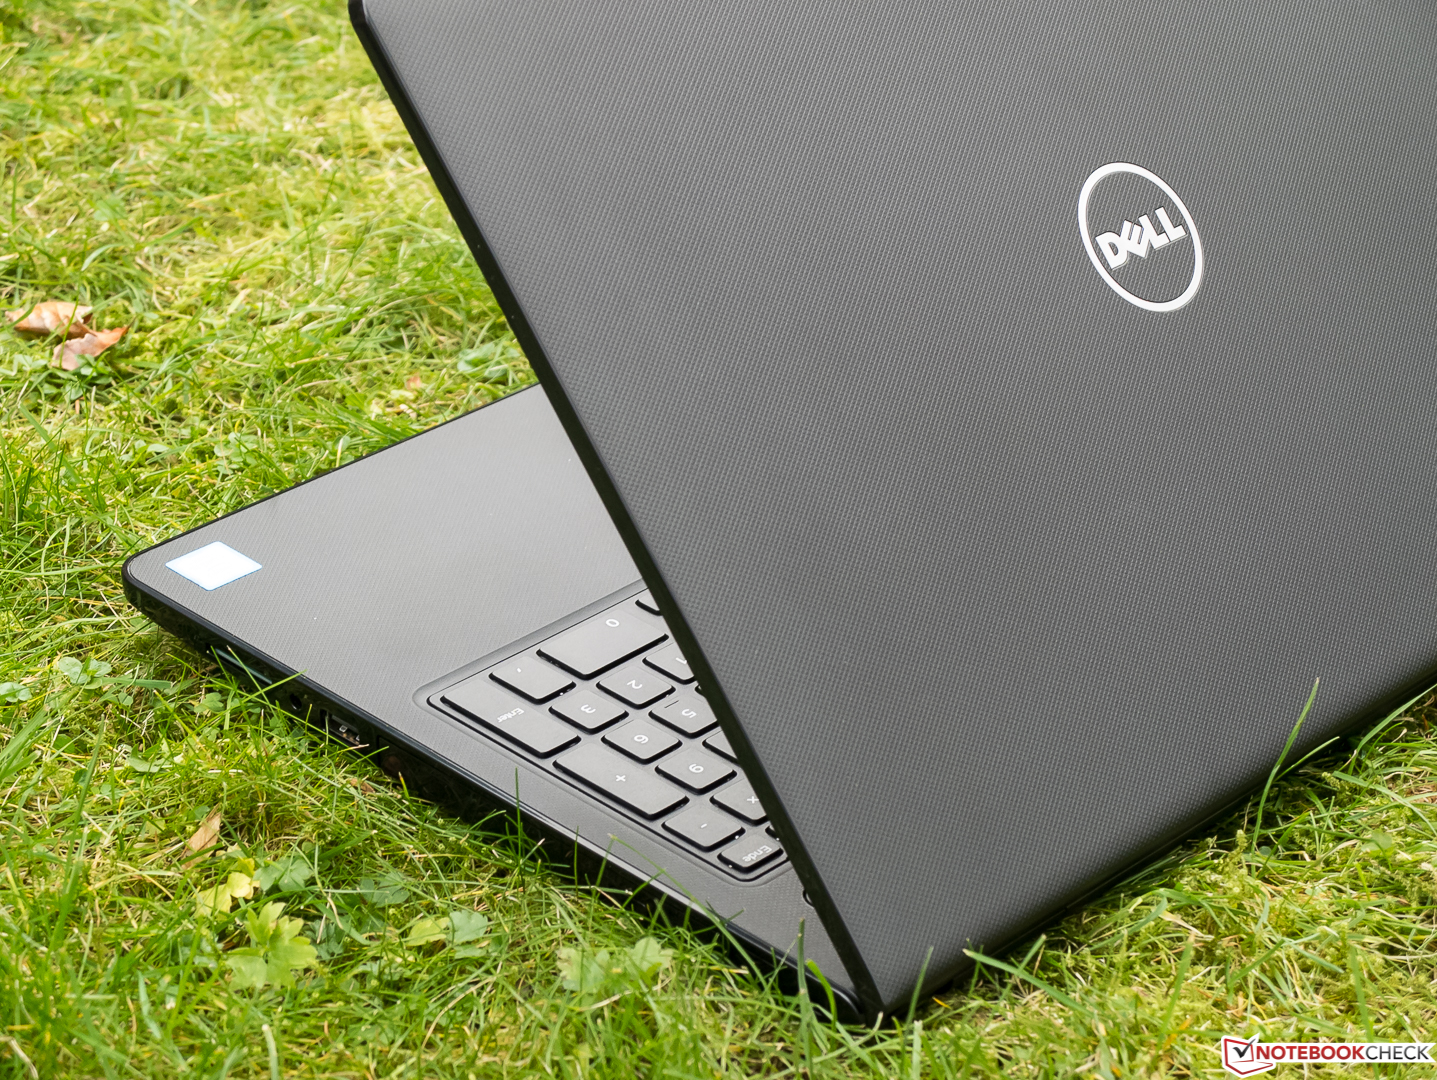
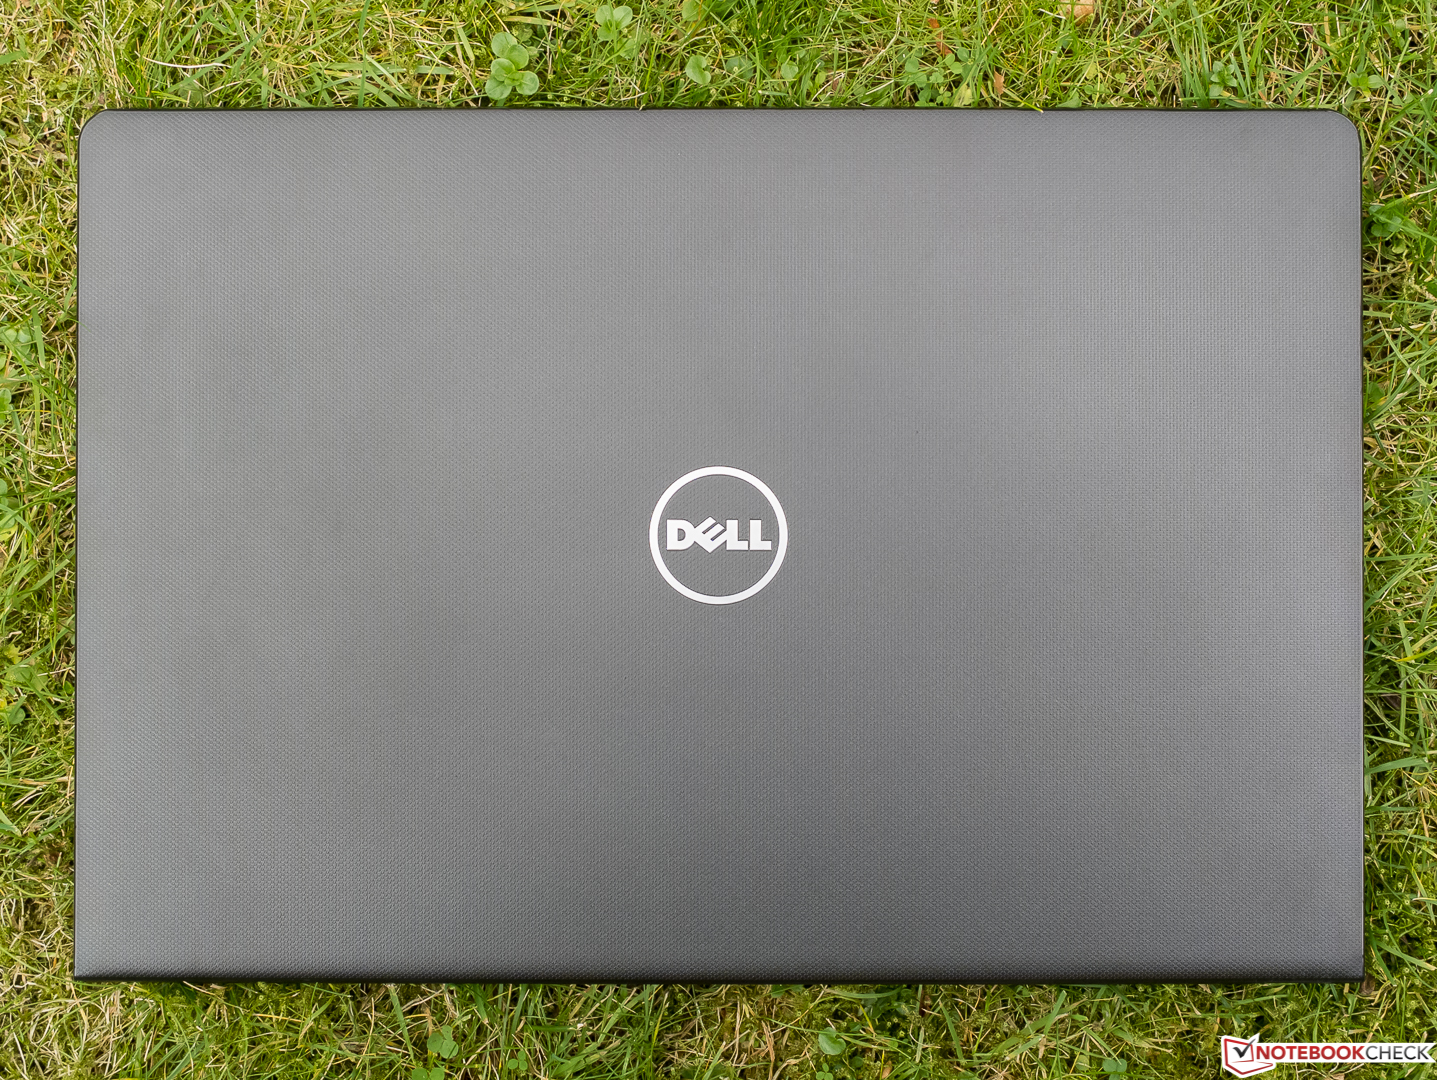
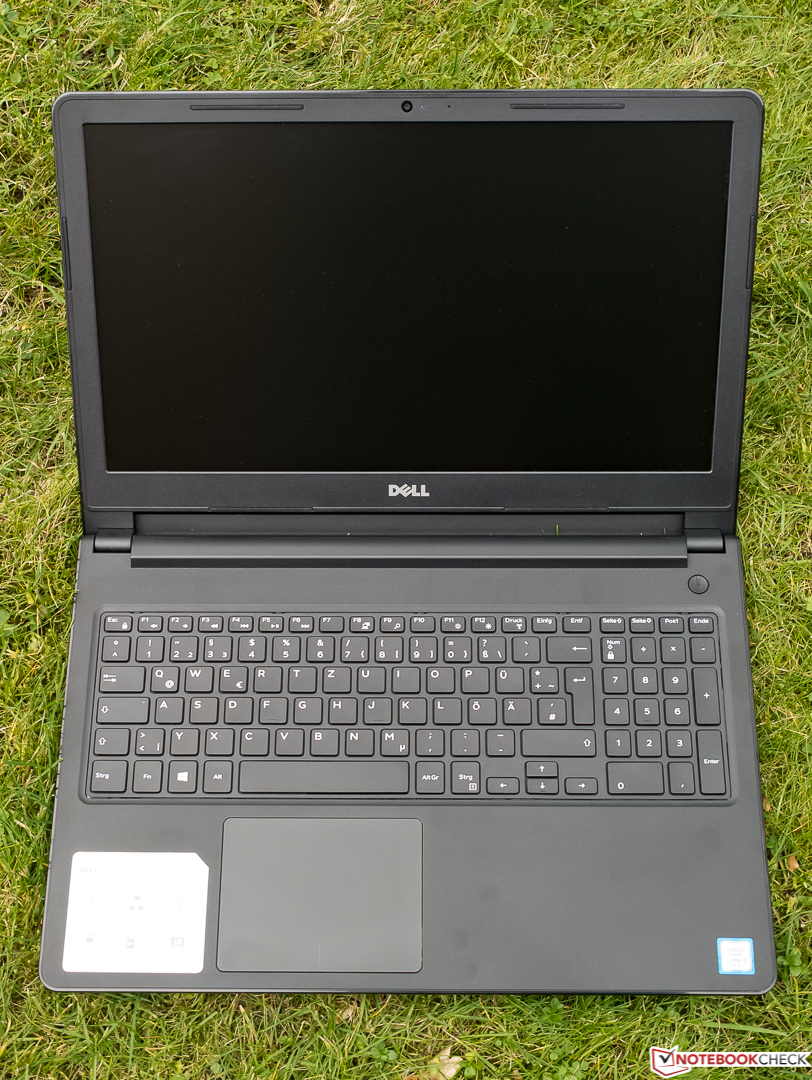
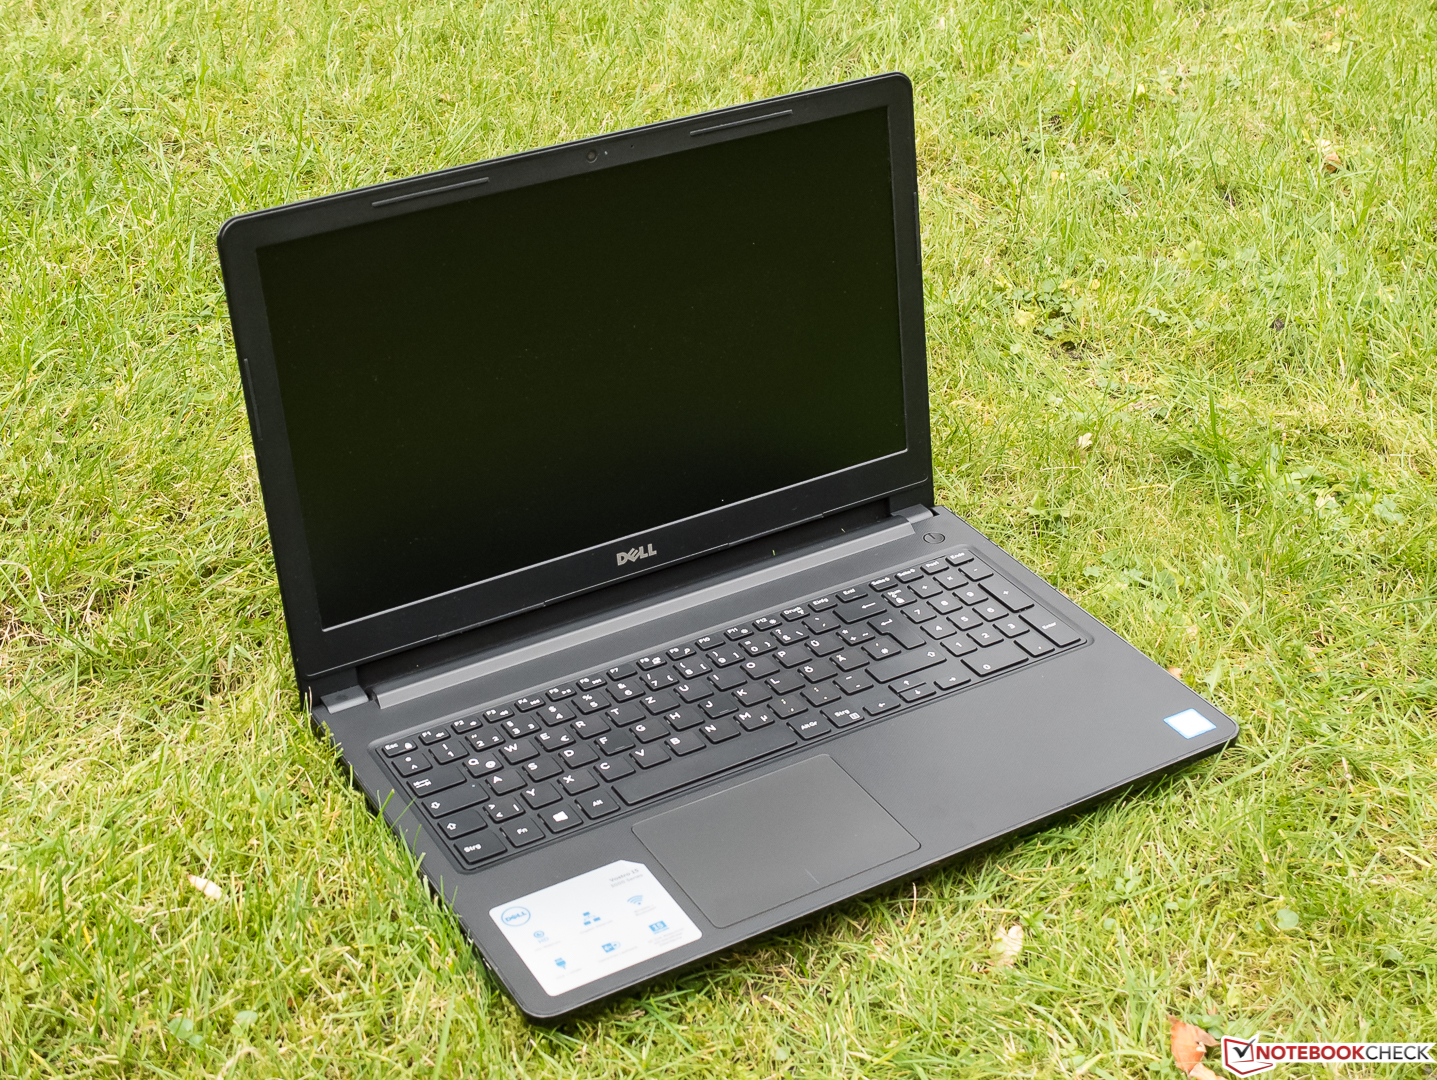
You are not doing any injustice to the Vostro by calling it a "plastic bomber." The casing is entirely black while the lid and the base unit have a very tactile, rubbery, textured surface. On the one hand, it is not very susceptible to fingerprints, but on the other hand it is also not easy to clean after you have handled the device with very sweaty hands. The design is otherwise modest, and the only visual accent, if any, is the silver Dell logo on the back.
The base, which resists pressure to a large extent, can be twisted somewhat when using some force, producing some harmless sounding creaking noises. The quite thick lid is relatively solid. However, even slight pressure on the back causes some display distortions in front. While you cannot open the lid with one hand, it bounces for about two seconds after jarring it. For the (potentially) low price, the workmanship is quite decent. Even though the gaps are not always quite even, we noticed this only because we were looking for it. Overall, there are no complaints in terms of workmanship worth the mention.

Among our test devices, only the relatively expensive Asus VivoBook makes an effort in being light and compact. With a weight of just 1.6 kg (~3.5 lb), it is significantly lighter than the three competitors, which are not only similar in not being exactly compact, but also bringing between 2.2 and 2.4 kg (~4.85 - 5.3 lb) onto the scale.
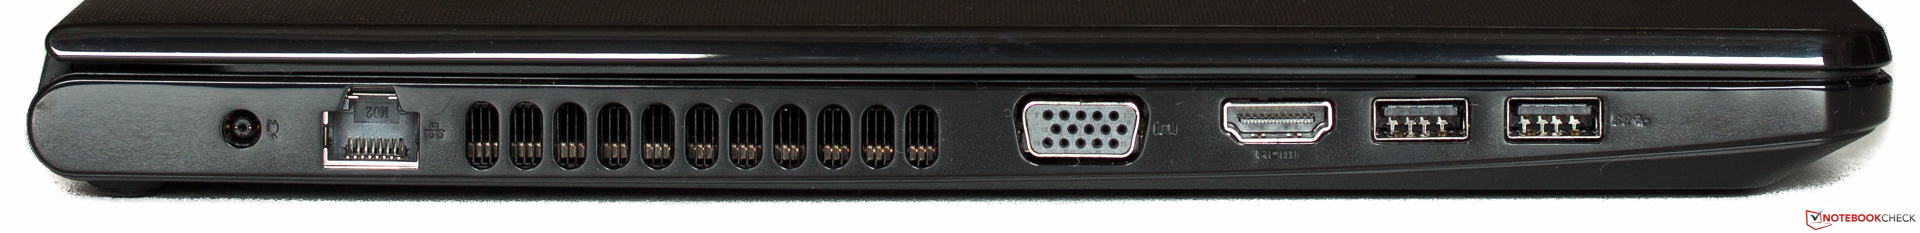
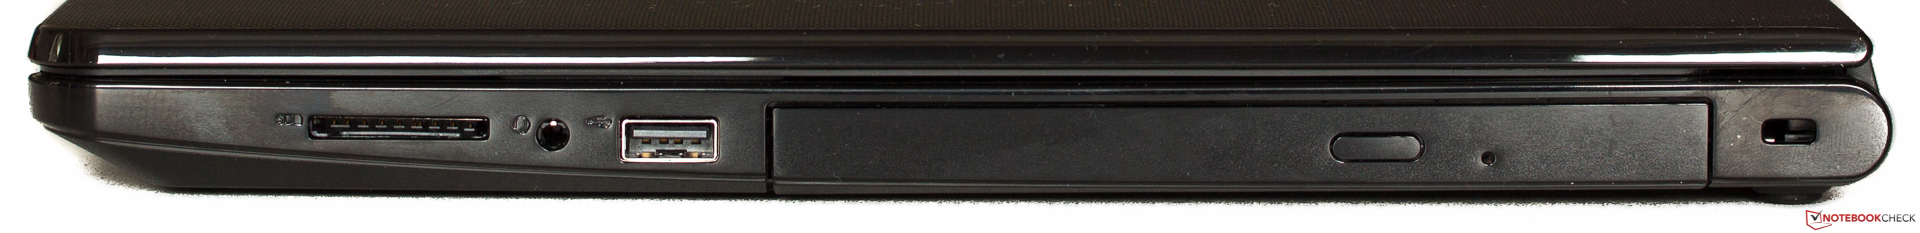
Connectivity
The connectivity features are typical for an affordable office notebook. Of the three USB ports, one still works according to the 2.0 standard. VGA and HDMI are available, but Thunderbolt 3, DisplayPort, and USB Type-C are all missing. The positioning of the ports is likewise typical: apart from the Ethernet port, all of them are on both sides in the area towards the front, where they can easily interfere with plugged-in cables and sticks.
SD Card Reader
Those who frequently move large amounts of data such as a large number of photos from the storage card to the laptop might soon curse the Dell Votro 15 3568 due to its lame USB-2.0 speed. In contrast, the users of the Acer Aspire 3 will be pleased with their USB-3.0 speed which is about two-and-a-half times faster. And the Asus VivoBook proves that it can go even faster within the limits of the USB-2.0 specifications. But as we will see later, the test unit is not suitable for photo processing anyway
| SD Card Reader | |
| average JPG Copy Test (av. of 3 runs) | |
| Acer Aspire 3 A315-51-55E4 (Toshiba Exceria Pro SDXC 64 GB UHS-II) | |
| Asus VivoBook S15 S510UA (Toshiba Exceria Pro SDXC 64 GB UHS-II) | |
| Dell Vostro 15 3568 (Toshiba Exceria Pro SDXC 64 GB UHS-II) | |
| maximum AS SSD Seq Read Test (1GB) | |
| Acer Aspire 3 A315-51-55E4 (Toshiba Exceria Pro SDXC 64 GB UHS-II) | |
| Asus VivoBook S15 S510UA (Toshiba Exceria Pro SDXC 64 GB UHS-II) | |
| Dell Vostro 15 3568 (Toshiba Exceria Pro SDXC 64 GB UHS-II) | |
Communication
Dell has chosen a Qualcomm WLAN module with Bluetooth 4.1. Even though it can handle the current IEEE 802.11ac standard in the less frequented 5 GHz band, thanks to MIMO 1x1, it achieves a maximum gross data rate of "only" 433 MBit/s, thus sharing the fate of the Acer Aspire 3 module. On the other hand, the throughput in combination with our Linksys EA8500 reference router (1 meter/~3 ft distance) is okay. The slightly patchy values of the Asus and the Lenovo show what is possible with MIMO 2x2 (867 MBit/s max).
| Networking | |
| iperf3 transmit AX12 | |
| Lenovo ThinkPad E570-20H6S02M00 | |
| Asus VivoBook S15 S510UA | |
| Acer Aspire 3 A315-51-55E4 | |
| Dell Vostro 15 3568 | |
| iperf3 receive AX12 | |
| Asus VivoBook S15 S510UA | |
| Lenovo ThinkPad E570-20H6S02M00 | |
| Dell Vostro 15 3568 | |
| Acer Aspire 3 A315-51-55E4 | |
Security
TPM 2.0 wherever you look. Apparently this feature, which is now commonly found in more affordable office notebooks such as our test unit and even in gaming laptops, is not such a huge cost factor anymore. In any case, it cannot hurt. However, you will have to do without a fingerprint sensor to increase your ease of access and comfort, but no one expects it anyway.
Accessories
With notebooks as affordable as this, you will always find only the bare essentials such as a power supply, cable, quick-start and setup instructions, and warranty papers in the box.
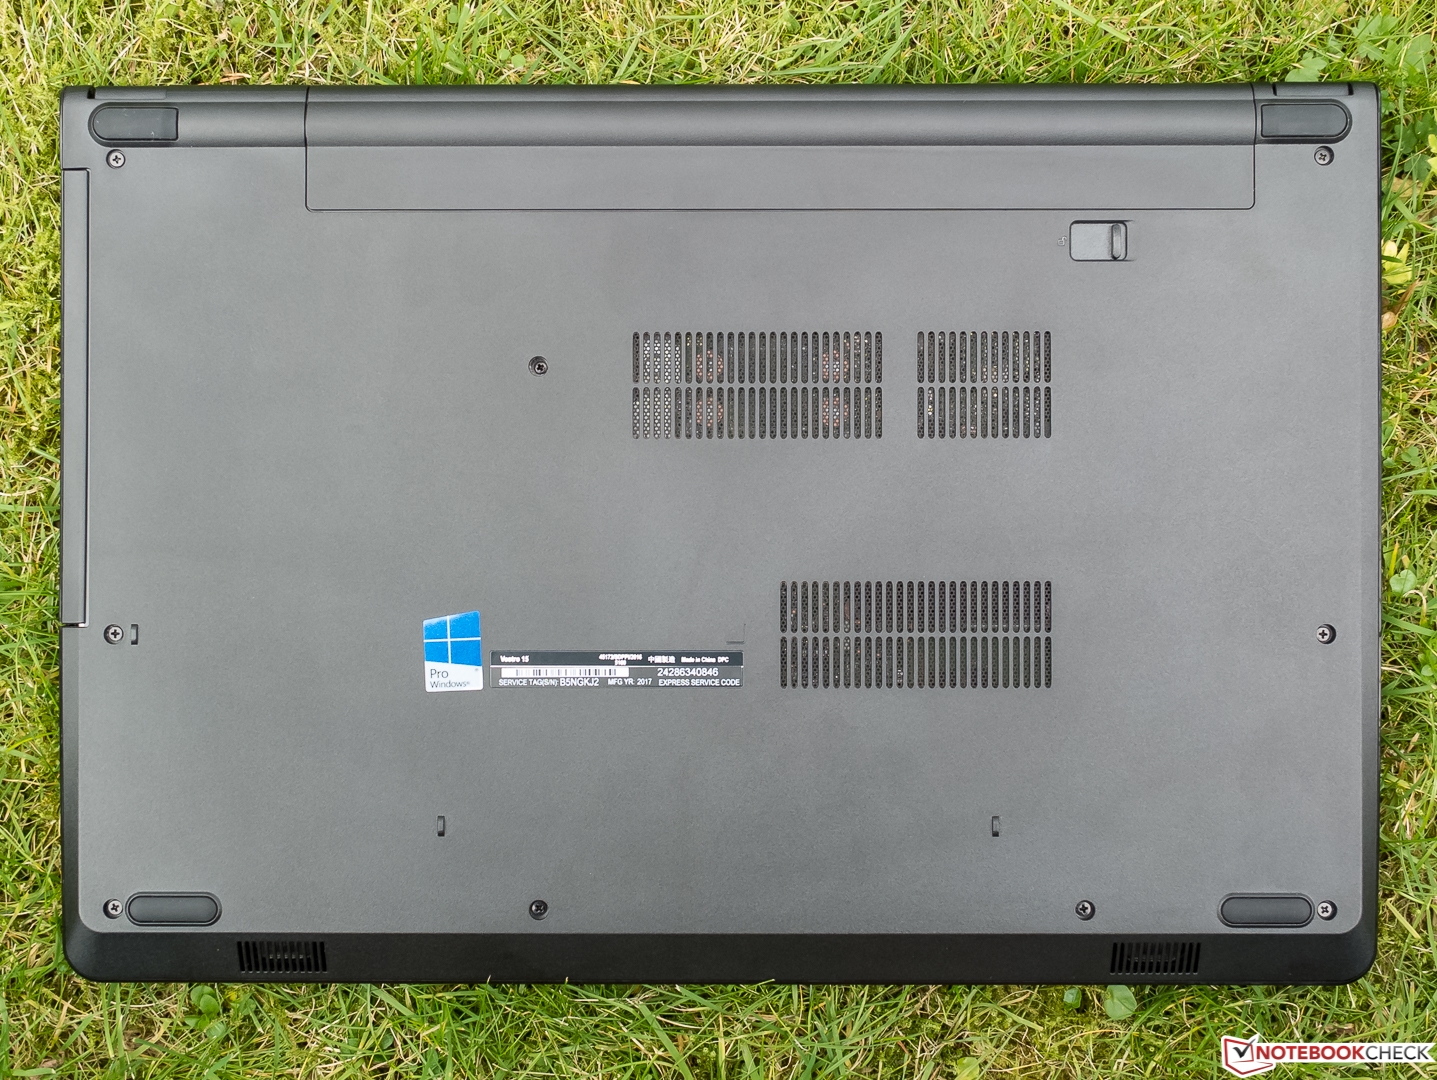
Maintenance
Unfortunately a rarity nowadays, the battery of the Vostro 15 3568 can really be removed from the outside. For maintenance, you will have to take off the entire bottom plate, which is secured with nine conventional Philips screws and should not be much of a problem.
Warranty
Dell offers a one-year warranty for the Vostro (collect and return). For a relatively low extra charge, you can increase the duration and extent of the service. In addition, the manufacturer's warranty of two years required by law with the reversal of the burden of proof after six month is also valid (Note that this applies only in Germany).
Please see our Guarantees, Return Policies and Warranties FAQ for country-specific information.
Input Devices
Keyboard
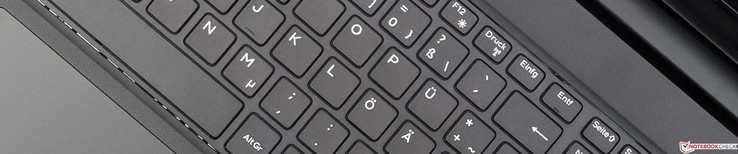
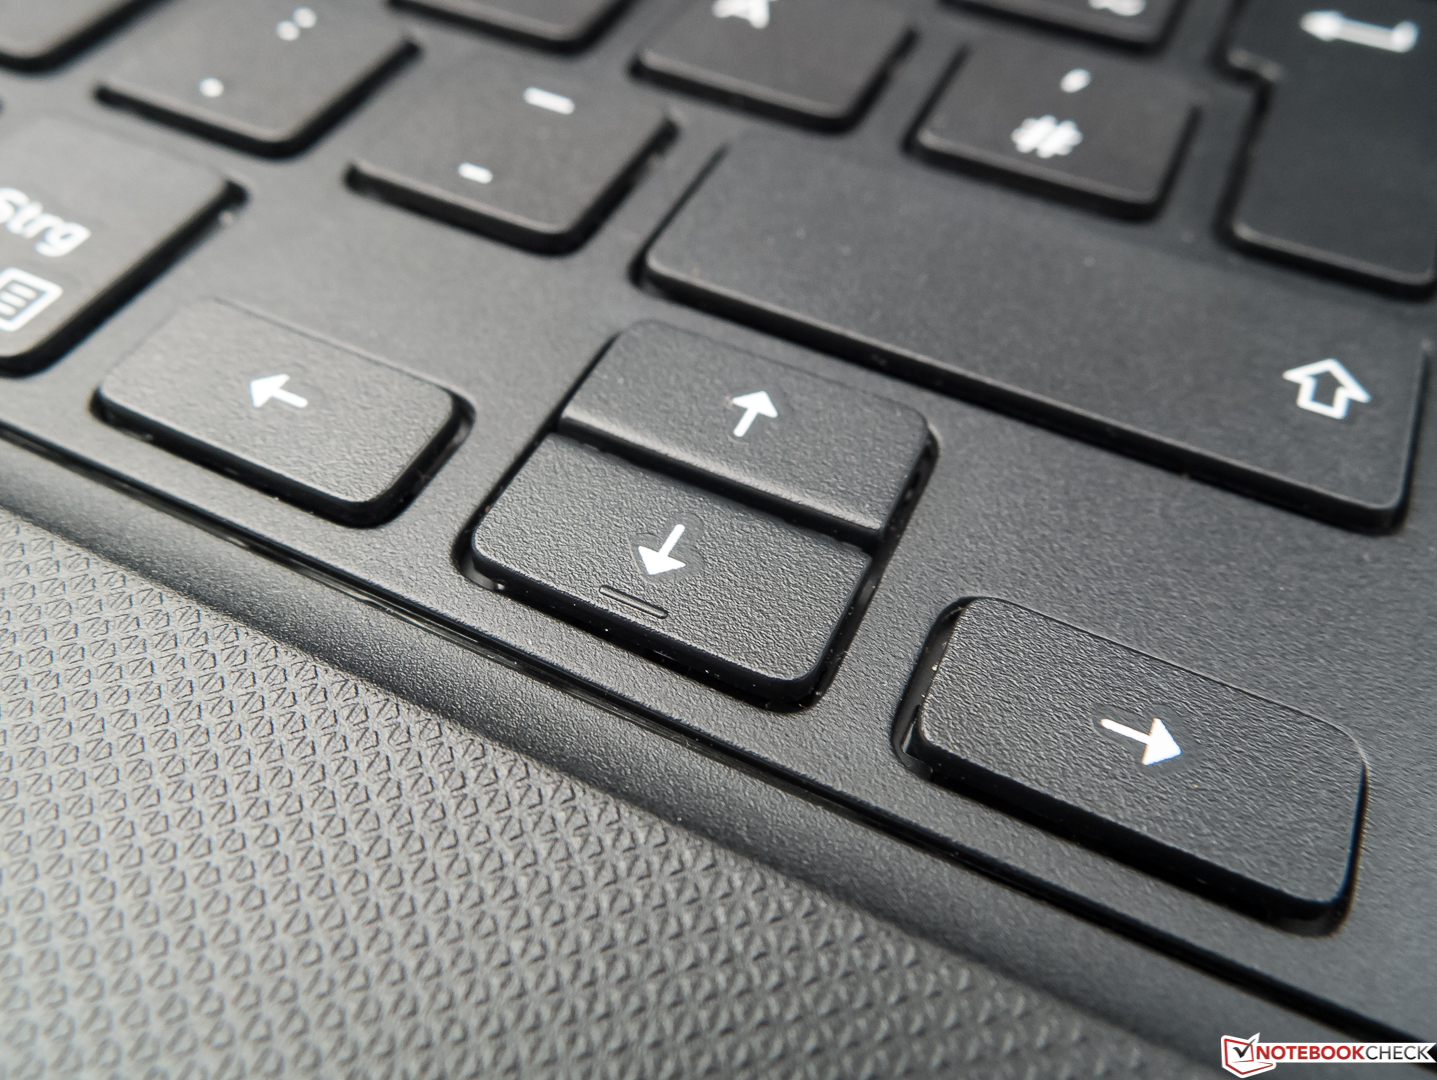
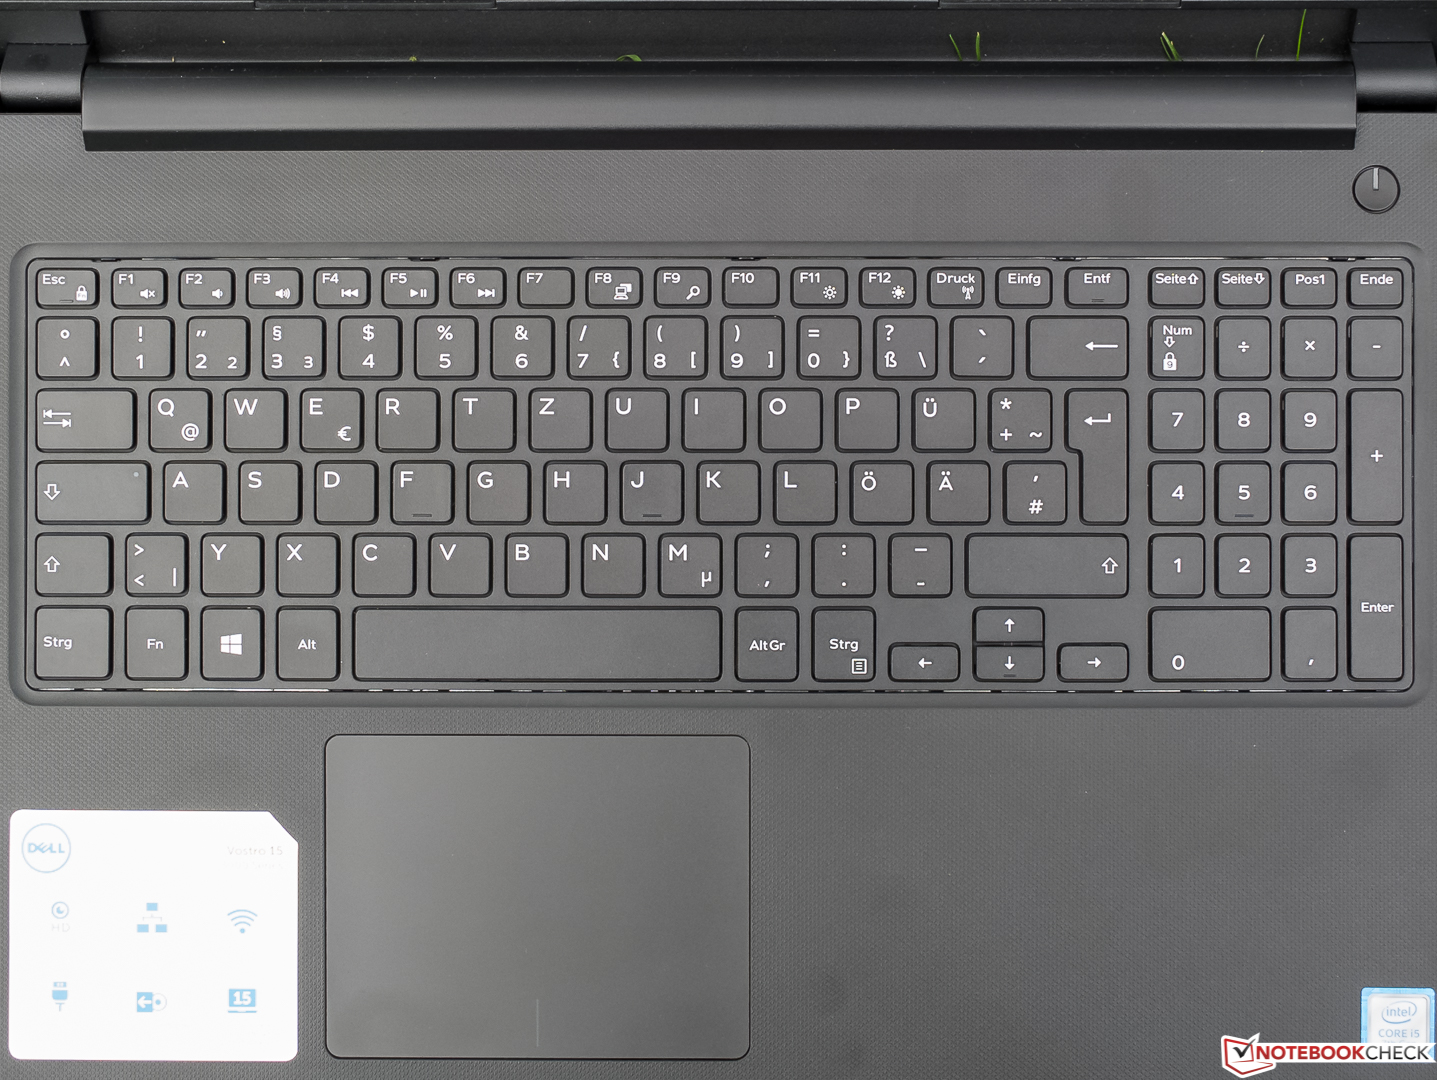
Apparently, Dell has made some effort with the input devices, which naturally will accommodate the targeted audience. While we have seen keyboards that are more pressure resistant, there were no problems during regular typing. The flat, flawlessly labeled keys have a roughened surface, but cannot be illuminated. They stand out with a good size and sufficient distance from one another. In terms of the width compared to a standard desktop keyboard, the main keyboard and the number block are each about half a centimeter smaller. Except for the Return key which is too small, we have nothing to complain about the layout, which to a large extent conforms to the standard, even if it lacks some rarely used keys such as Pause and Scroll-Lock.
The key stroke is short, the pressure point easily noticeable, and the stroke is only slightly damped, but unfortunately it does not feel the same for all keys. While the quality of the keyboard is far from a ThinkPad keyboard, even prolific writers should get their money's worth with the Vostro 15 3568 and not be impeded too much. Since the larger keys such as Space draw significant attention with their noise, the usage in noise sensitive environments is limited.
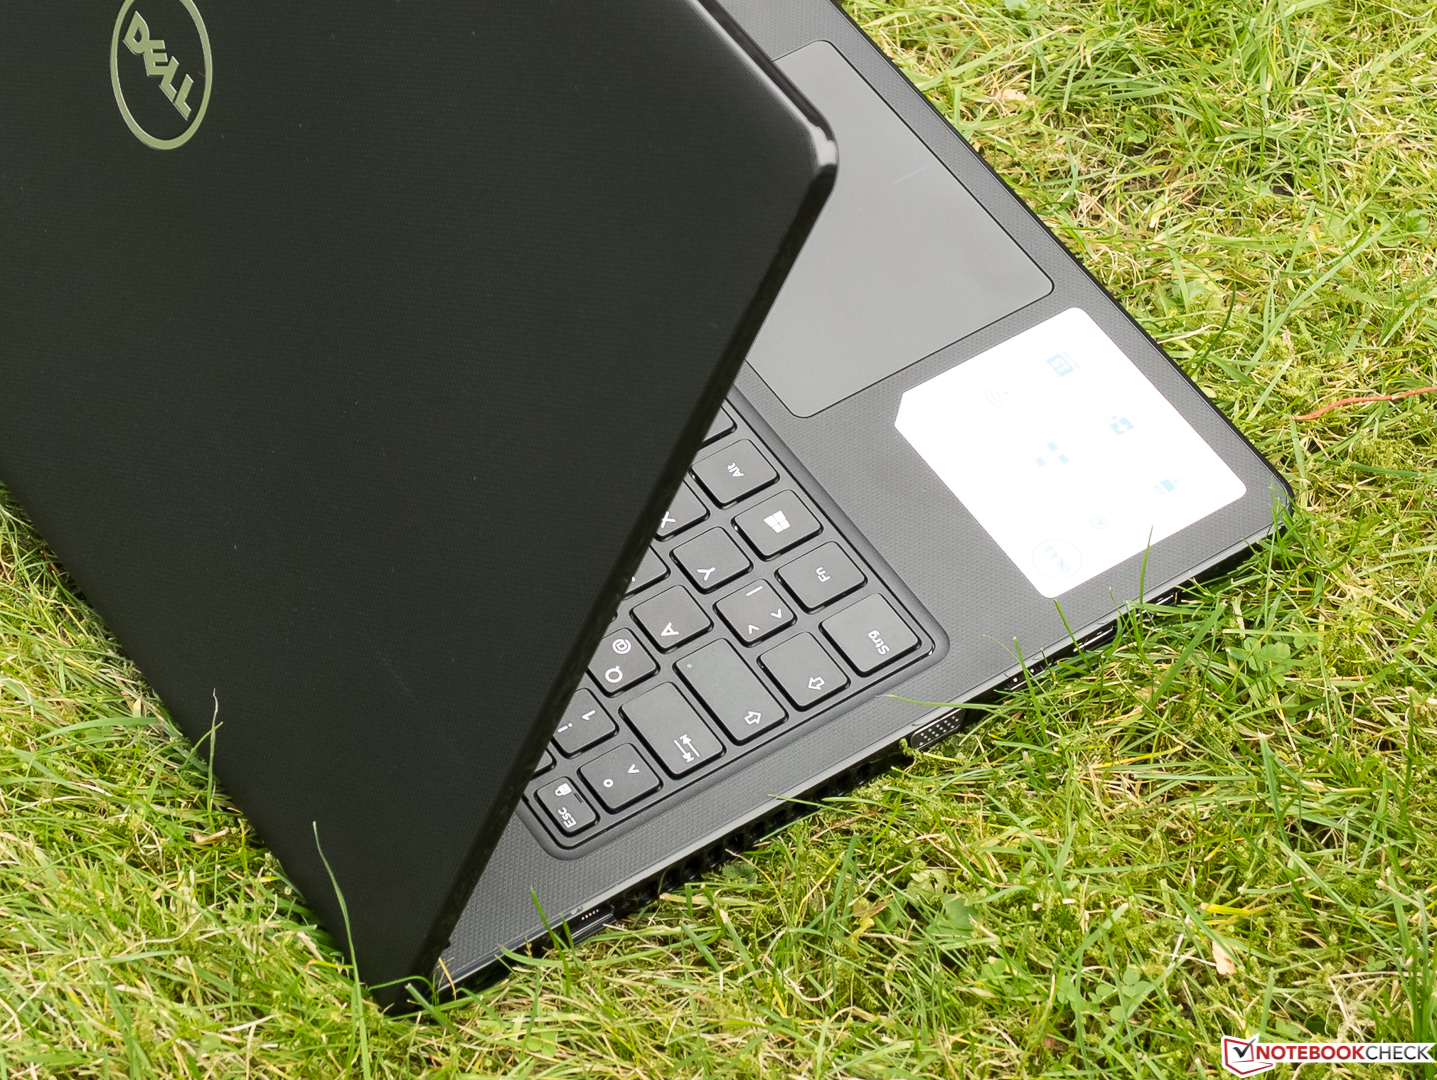
Touchpad
The large ClickPad without separate keys also knows how to please. At the outermost edges, the touch is not always recognized reliably. But otherwise there are no problems with the responsiveness and precision, and even very fast movements are recognized. Drag & Drop via double tap works reliably. The surface is slightly roughed and offers good sliding characteristics, even with moist fingers. Gestures with up to four fingers can "only" be configured via standard Windows methods.
Unfortunately, the quality of the construction does not leave the best impression. The touchpad does not quite fit cleanly and clacks when touched, since the surface is not set down tightly. The two substitute mouse keys have a short stroke but a well-adjusted resistance and offer a crisp pressure point together with a good acoustic feedback, even though they make a slightly rattly and low-quality impression.
Display
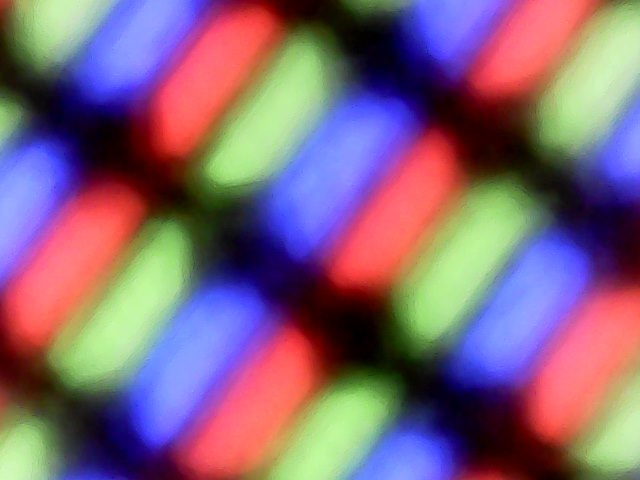
Even though IPS panels are becoming more affordable, we mostly still find TN-based displays in 500-Euro (~$585) notebooks. Of the laptops in our test, only the VivoBook S15 has an IPS display with stable viewing angles. The users of the ThinkPad E570 (TN) even have to be content with 1366x768 pixels. With a screen-size of 15.6 inches, the Full HD resolution of the matte screen of our test unit results in a pixel density of 141 PPI, which is not very high and can leave a slightly pixelated impression for users with good eyesight upon a closer look. Otherwise there are no complaints about the image sharpness. Dell does not offer any alternate displays.
As we can already guess from the brightness values of the competitors in our test, at only 195 cd/m², the measured average brightness of our Dell is less than poor and even below average for the price range. However, there should not be any problems indoors in rooms that are not too bright. Due to the inadequate stability of the viewing angles among other reasons, a black image will not appear saturated, and depending on the viewing angle, only part of the screen will appear dark. As far as we can judge under these circumstances, the good measured brightness distribution of 89% corresponds to an image which subjectively appears to a large extent homogeneous. We did not notice any screen bleeding or clouding.
| |||||||||||||||||||||||||
Brightness Distribution: 89 %
Center on Battery: 195 cd/m²
Contrast: 443:1 (Black: 0.44 cd/m²)
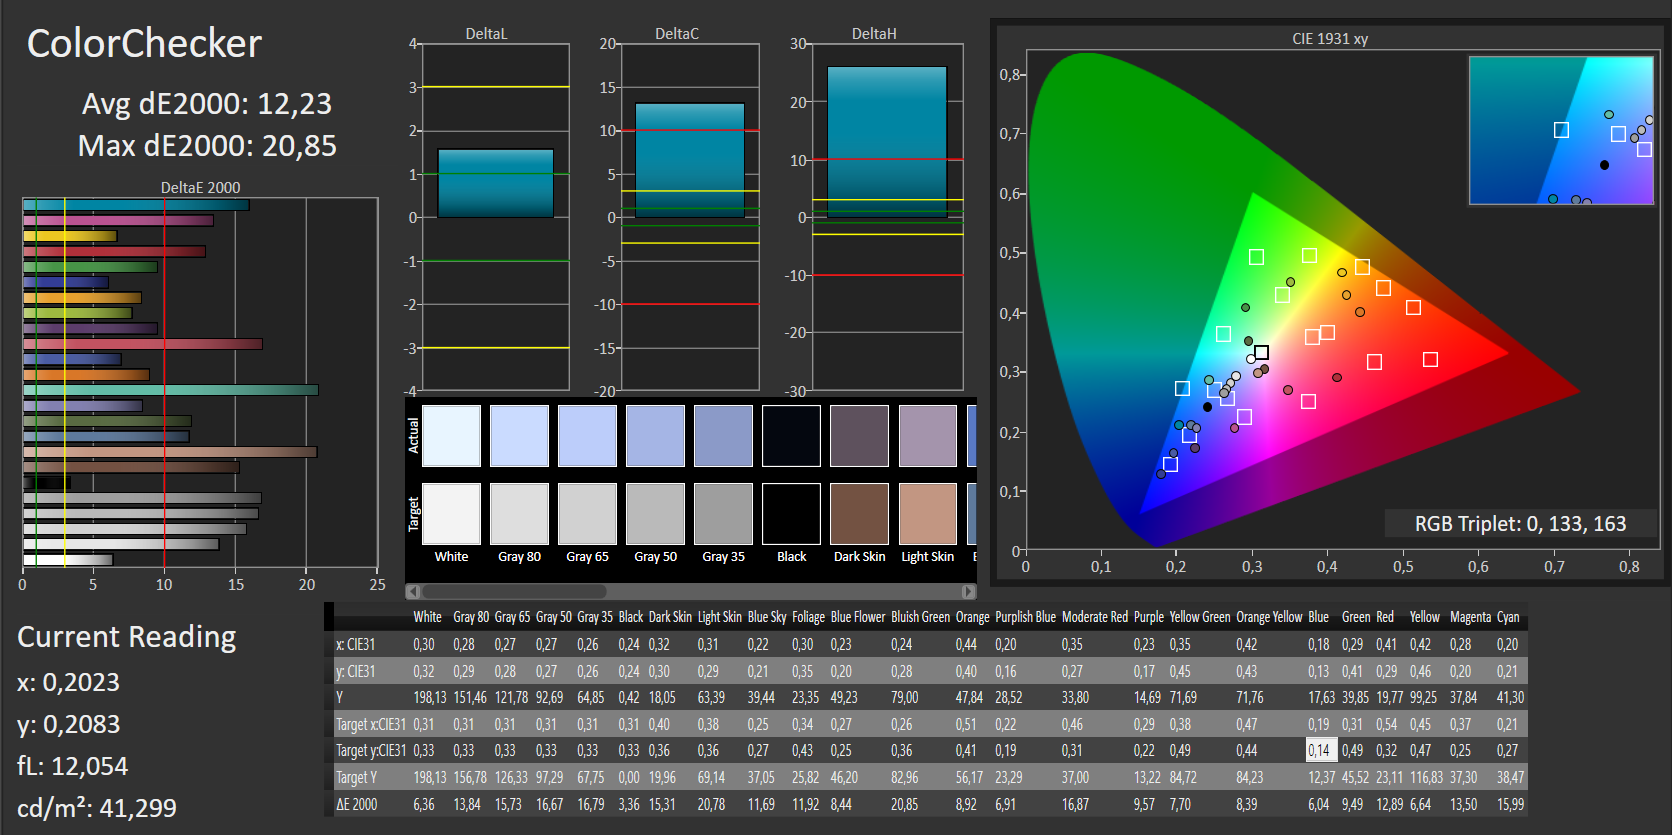
ΔE ColorChecker Calman: 12.23 | ∀{0.5-29.43 Ø4.71}
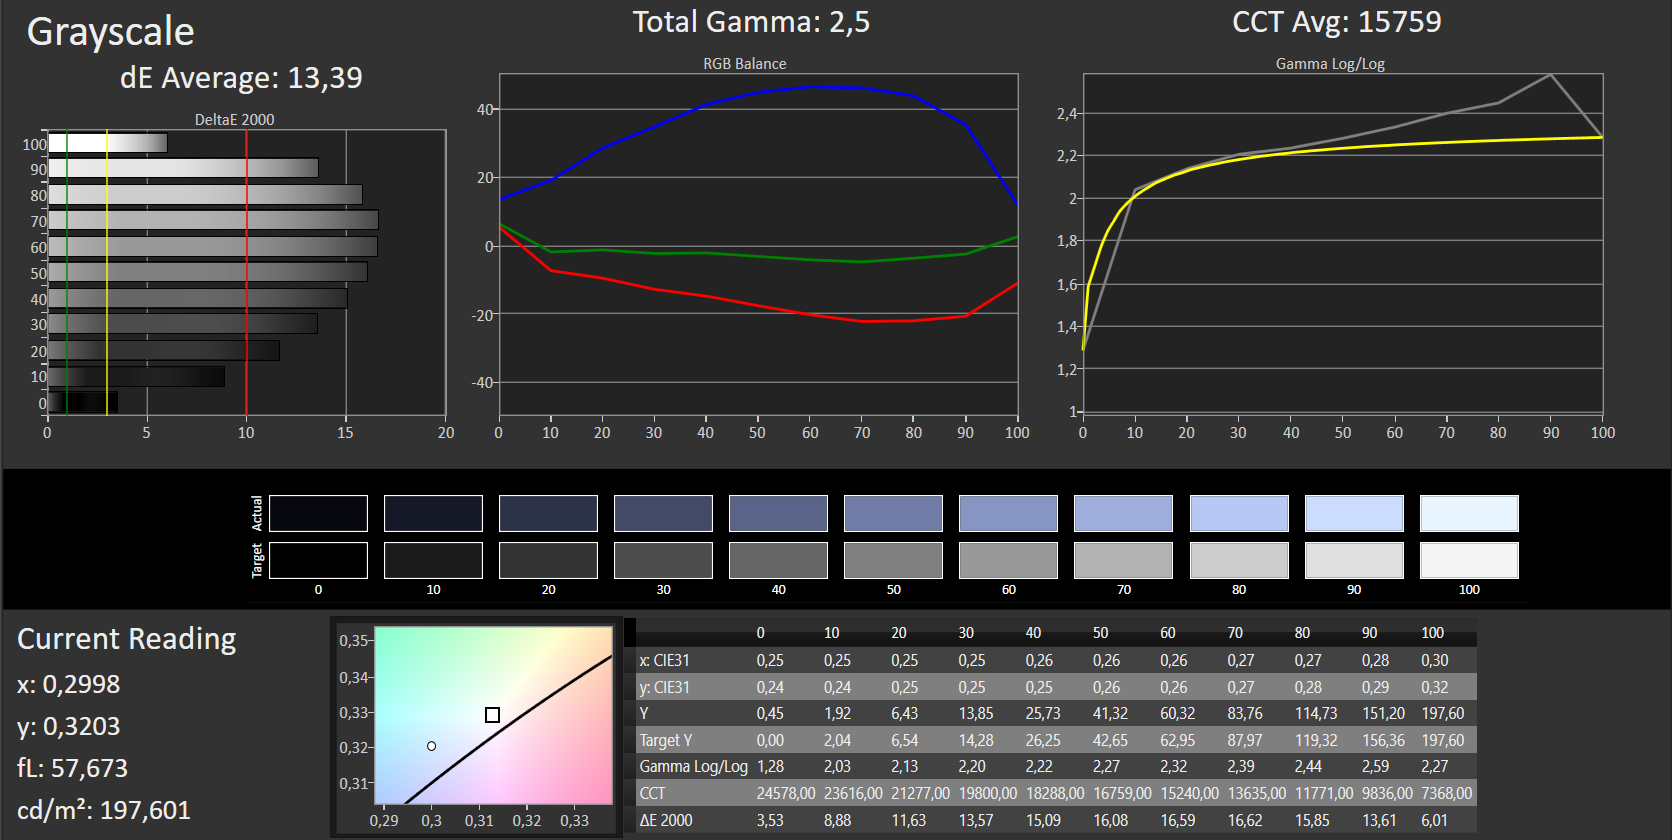
ΔE Greyscale Calman: 13.39 | ∀{0.09-98 Ø4.96}
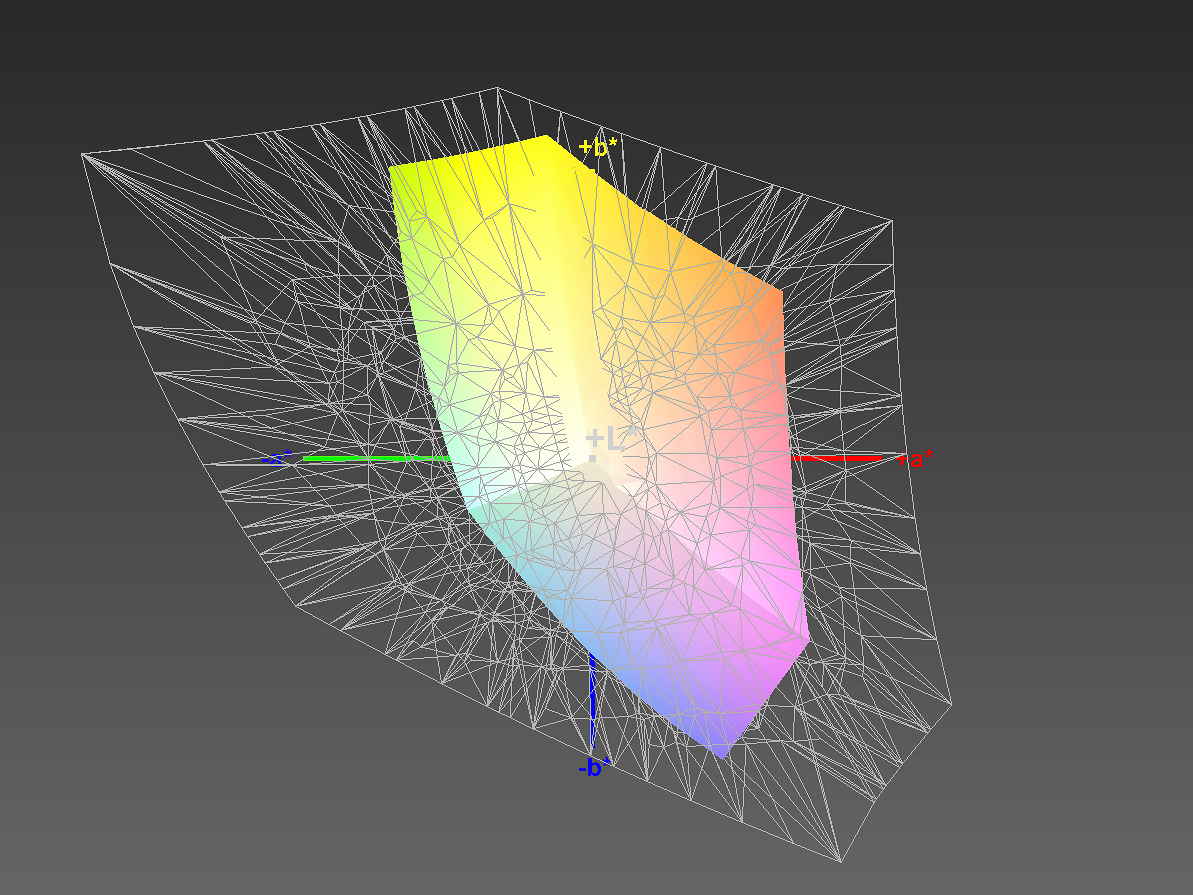
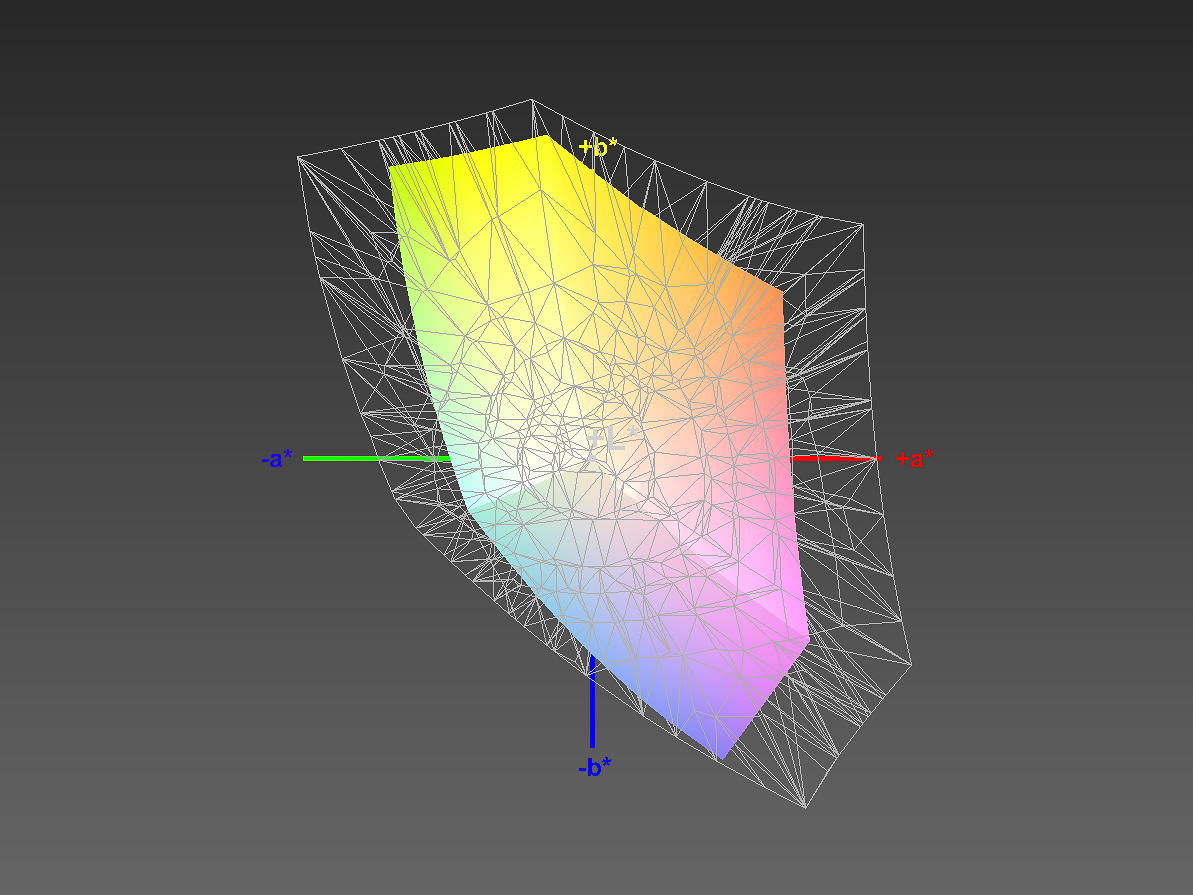
59% sRGB (Argyll 1.6.3 3D)
38% AdobeRGB 1998 (Argyll 1.6.3 3D)
40.69% AdobeRGB 1998 (Argyll 3D)
59.3% sRGB (Argyll 3D)
39.39% Display P3 (Argyll 3D)
Gamma: 2.5
CCT: 15759 K
| Dell Vostro 15 3568 BOE0690 / NT15N41 / Dell C1JFR, , 1920x1080, 15.6" | Acer Aspire 3 A315-51-55E4 AU Optronics AUO38ED, , 1920x1080, 15.6" | Lenovo ThinkPad E570-20H6S02M00 Lenovo NT156WHM-N42, , 1366x768, 15.6" | Asus VivoBook S15 S510UA ID: LGD0573, Name: LG Display LP156WF9-SPK2, , 1920x1080, 15.6" | |
|---|---|---|---|---|
| Display | -9% | -7% | 1% | |
| Display P3 Coverage (%) | 39.39 | 35.97 -9% | 36.79 -7% | 39.9 1% |
| sRGB Coverage (%) | 59.3 | 54.1 -9% | 55.4 -7% | 59.5 0% |
| AdobeRGB 1998 Coverage (%) | 40.69 | 37.17 -9% | 38.01 -7% | 41.11 1% |
| Response Times | -11% | -18% | -69% | |
| Response Time Grey 50% / Grey 80% * (ms) | 39 ? | 44 ? -13% | 46 ? -18% | 38.4 ? 2% |
| Response Time Black / White * (ms) | 11 ? | 12 ? -9% | 13 ? -18% | 26.4 ? -140% |
| PWM Frequency (Hz) | 28410 ? | 200 ? | ||
| Screen | 26% | -2% | 35% | |
| Brightness middle (cd/m²) | 195 | 241 24% | 242 24% | 277.5 42% |
| Brightness (cd/m²) | 195 | 229 17% | 233 19% | 265 36% |
| Brightness Distribution (%) | 89 | 87 -2% | 73 -18% | 89 0% |
| Black Level * (cd/m²) | 0.44 | 0.46 -5% | 0.59 -34% | 0.35 20% |
| Contrast (:1) | 443 | 524 18% | 410 -7% | 793 79% |
| Colorchecker dE 2000 * | 12.23 | 3.4 72% | 10.9 11% | 4.8 61% |
| Colorchecker dE 2000 max. * | 20.85 | 7.61 64% | 20.84 -0% | 17.8 15% |
| Greyscale dE 2000 * | 13.39 | 1.7 87% | 13.07 2% | 3 78% |
| Gamma | 2.5 88% | 2.36 93% | 2.37 93% | 2.39 92% |
| CCT | 15759 41% | 6750 96% | 13123 50% | 6854 95% |
| Color Space (Percent of AdobeRGB 1998) (%) | 38 | 34 -11% | 35 -8% | 37.7 -1% |
| Color Space (Percent of sRGB) (%) | 59 | 54 -8% | 55 -7% | 69.3 17% |
| Total Average (Program / Settings) | 2% /
14% | -9% /
-5% | -11% /
14% |
* ... smaller is better
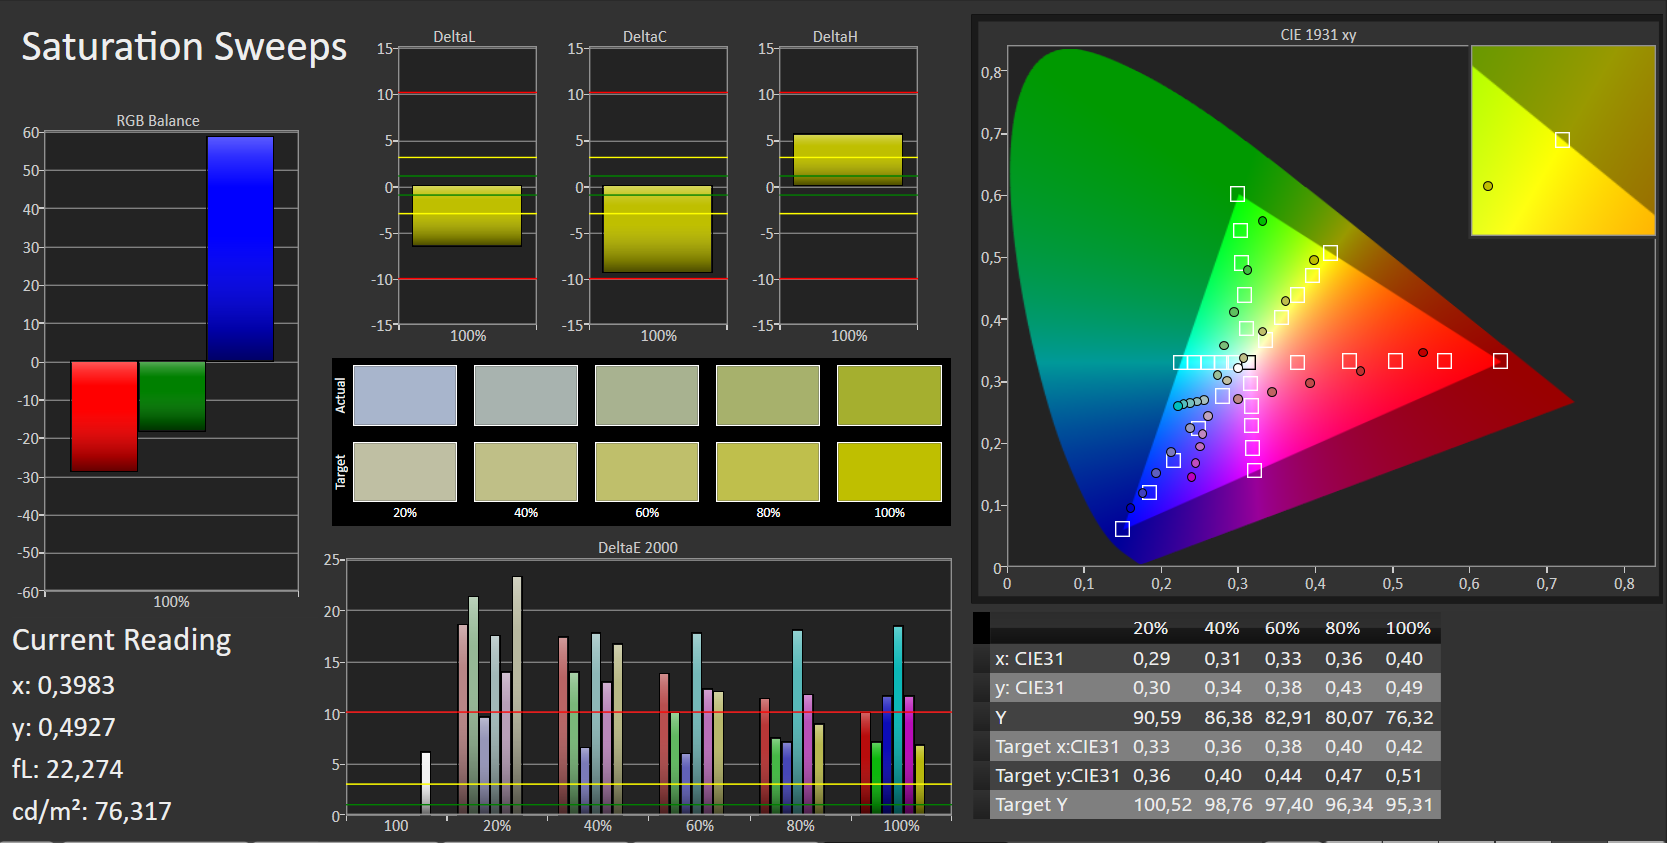
The combination of limited brightness, mainly the black values of up to 0.59 cd/m², which are too high, are responsible for the measly contrast ratios of the Dell, the Acer, and the Lenovo. With its lower black value, the relatively (!) bright Asus can push ahead here, yet it still only achieves a suitable 793:1. In this price range of the entry level configurations, you cannot expect much more in general. In terms of color space coverage, the candidates also do not cover themselves in glory, and coverages of the small standard sRGB color space from 54% (Acer) to 69% (Asus) prohibit even halfway ambitious image processing.
It continues with a disastrous color deviation of 12 (ColorChecker) and 13 (Grayscale) Delta-E, which are similarly bad in the ThinkPad E570 and very far from the targeted ideal values of Delta-E < 3. In this respect, the Aspire and the VivoBook do very well. But anyone thinking that it cannot get any worse is wrong. You can almost call a color temperature of 15759 a crime when the target is 6500, and our tester has never seen a notebook with such an extreme blue tint. The improvement by installing the color profile linked in the box should be huge. In our opinion, this extreme failure could even be a reason for returning the device and getting a refund.
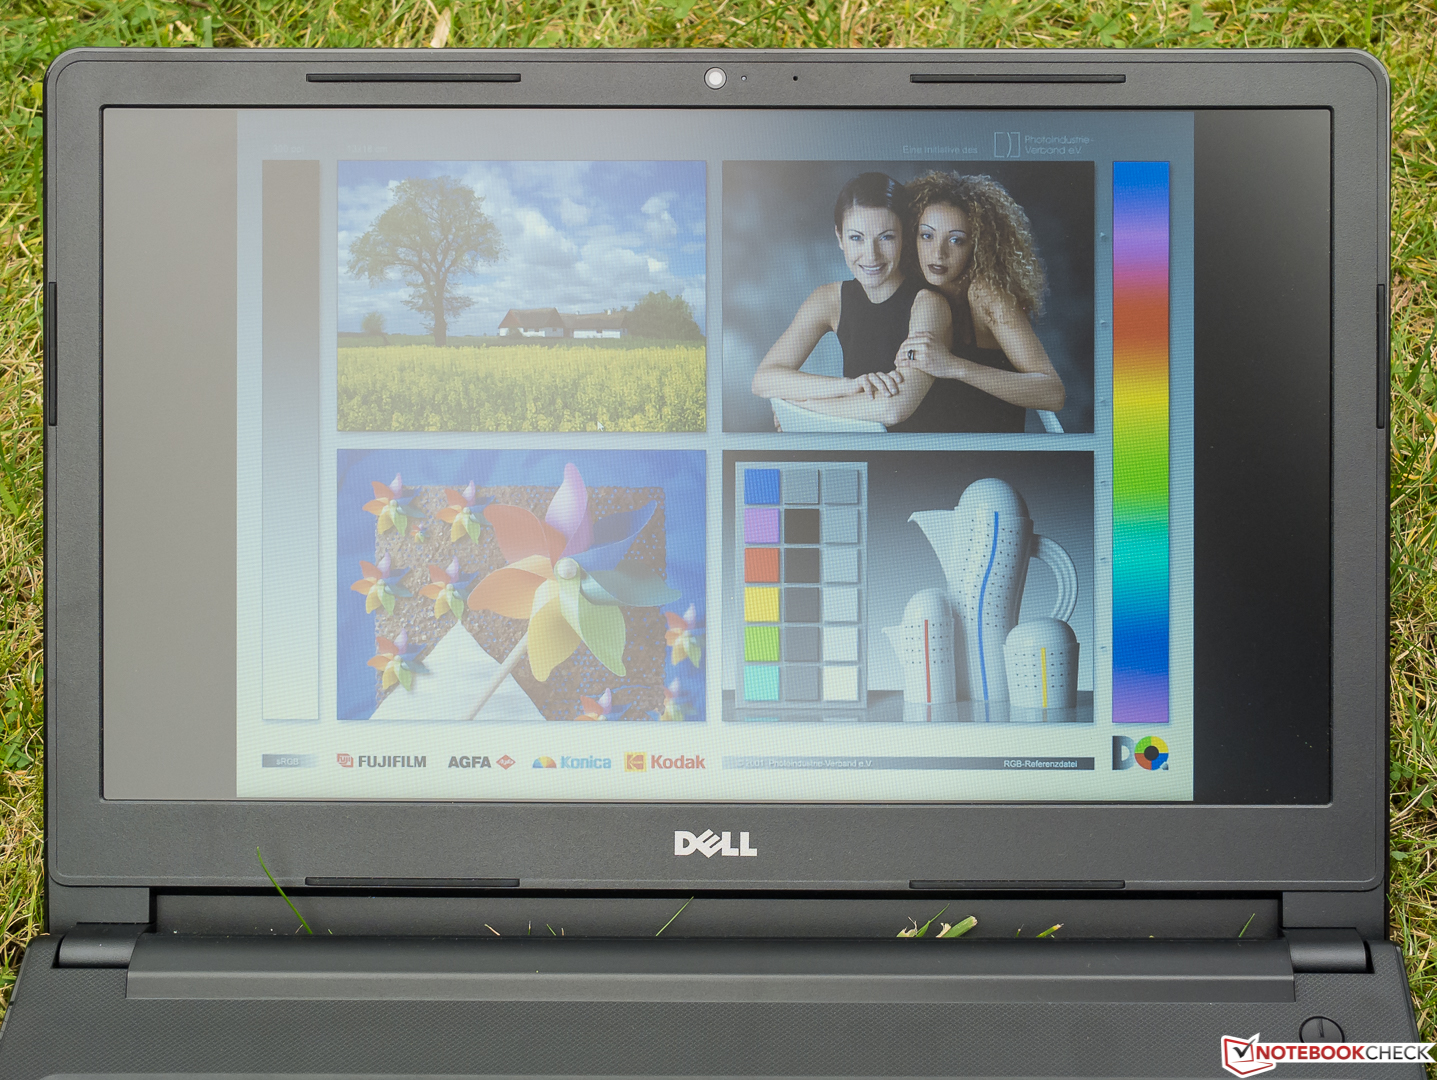
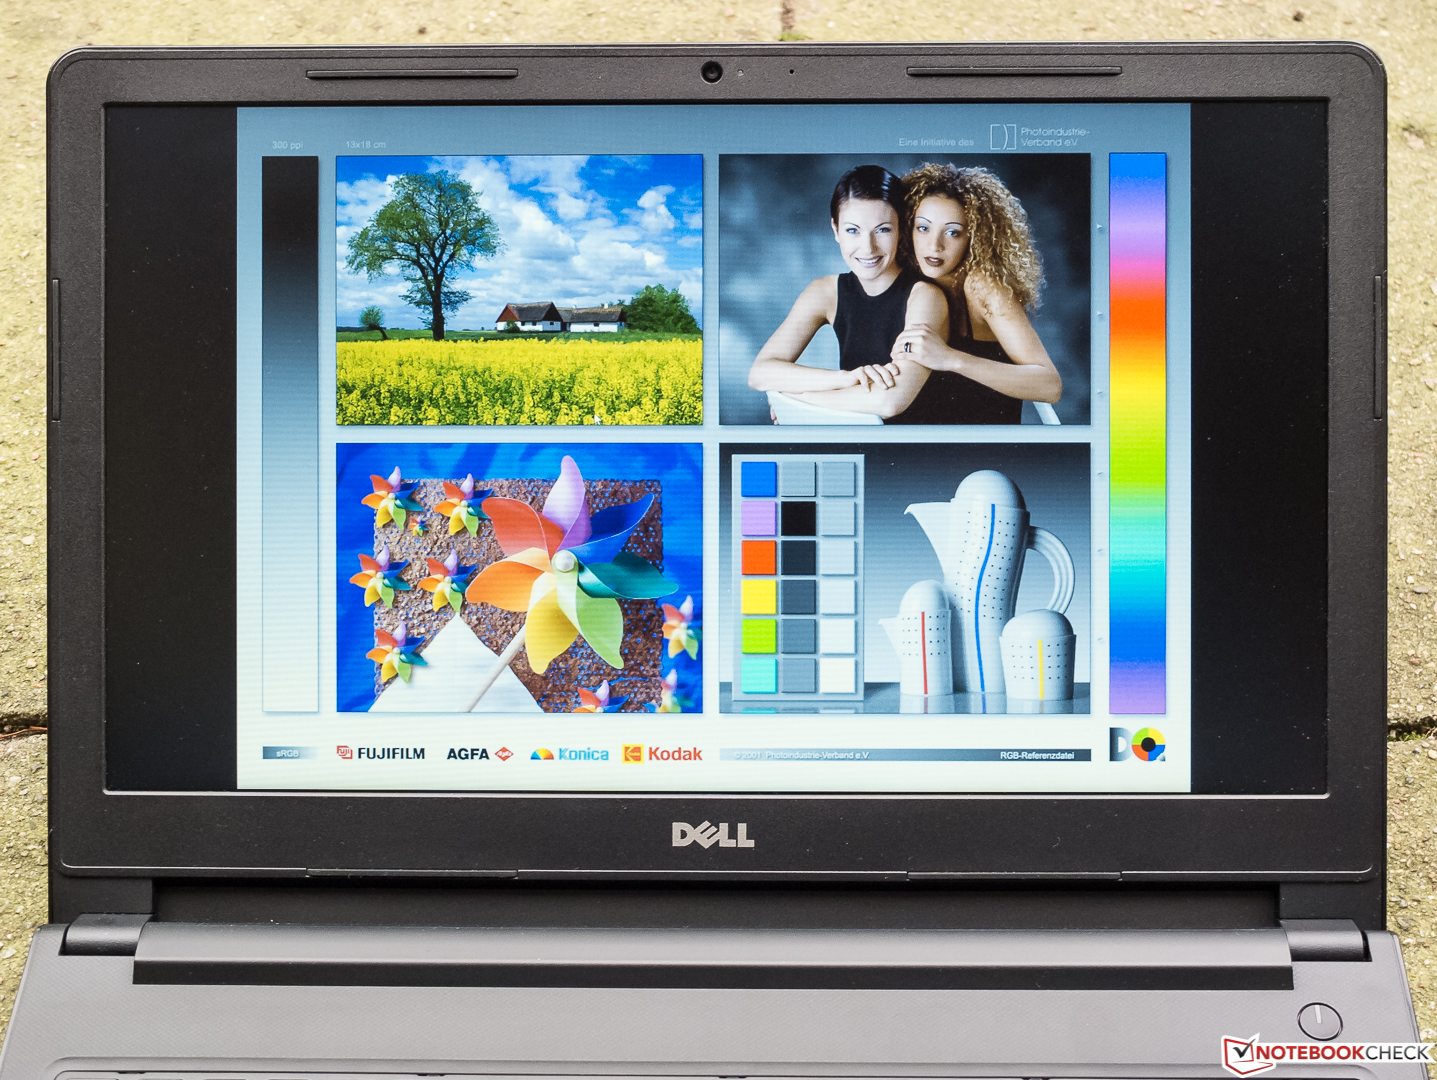
Due to its low brightness, the outdoor suitability of the Dell Vostro 15 3568 is quite limited. We took the photos to the right on a dark day with a cloudy sky and thus under very easy conditions. The only reason that you can still see something on the left image is that we pointed the screen towards the sky. On brighter days, it is absolutely necessary to look for a shady place with the notebook, and even then the low contrast should have some negative effects. The right photo shows ideal conditions with a doorway in the back.
Display Response Times
| ↔ Response Time Black to White | ||
|---|---|---|
| 11 ms ... rise ↗ and fall ↘ combined | ↗ 7 ms rise | 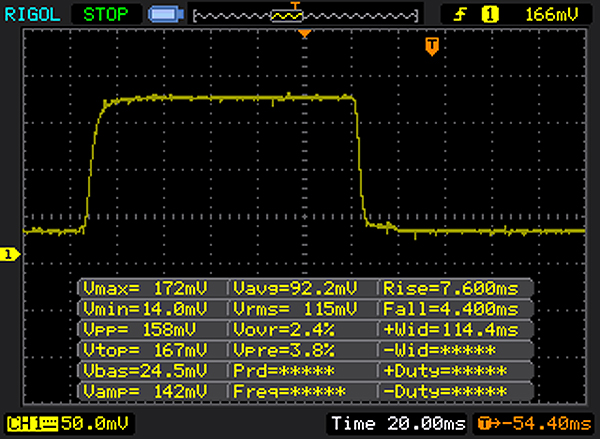 |
| ↘ 4 ms fall | ||
| The screen shows good response rates in our tests, but may be too slow for competitive gamers. In comparison, all tested devices range from 0.1 (minimum) to 240 (maximum) ms. » 30 % of all devices are better. This means that the measured response time is better than the average of all tested devices (19.8 ms). | ||
| ↔ Response Time 50% Grey to 80% Grey | ||
| 39 ms ... rise ↗ and fall ↘ combined | ↗ 21 ms rise | 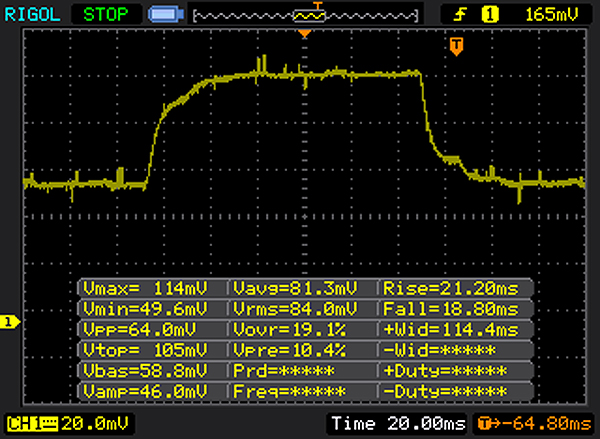 |
| ↘ 18 ms fall | ||
| The screen shows slow response rates in our tests and will be unsatisfactory for gamers. In comparison, all tested devices range from 0.165 (minimum) to 636 (maximum) ms. » 59 % of all devices are better. This means that the measured response time is worse than the average of all tested devices (30.9 ms). | ||
Screen Flickering / PWM (Pulse-Width Modulation)
| Screen flickering / PWM detected | 28410 Hz | ≤ 90 % brightness setting | 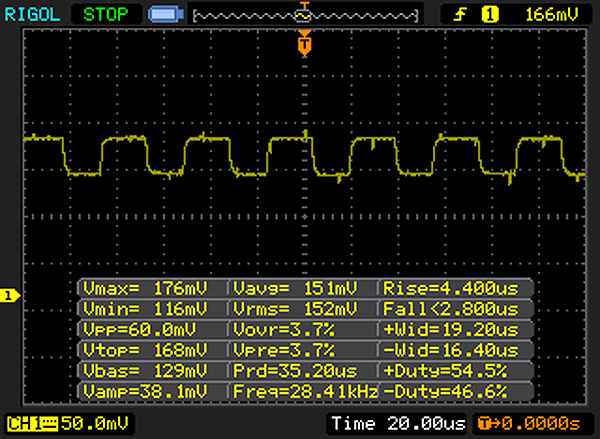 |
The display backlight flickers at 28410 Hz (worst case, e.g., utilizing PWM) Flickering detected at a brightness setting of 90 % and below. There should be no flickering or PWM above this brightness setting. The frequency of 28410 Hz is quite high, so most users sensitive to PWM should not notice any flickering. In comparison: 52 % of all tested devices do not use PWM to dim the display. If PWM was detected, an average of 7741 (minimum: 5 - maximum: 343500) Hz was measured. | |||
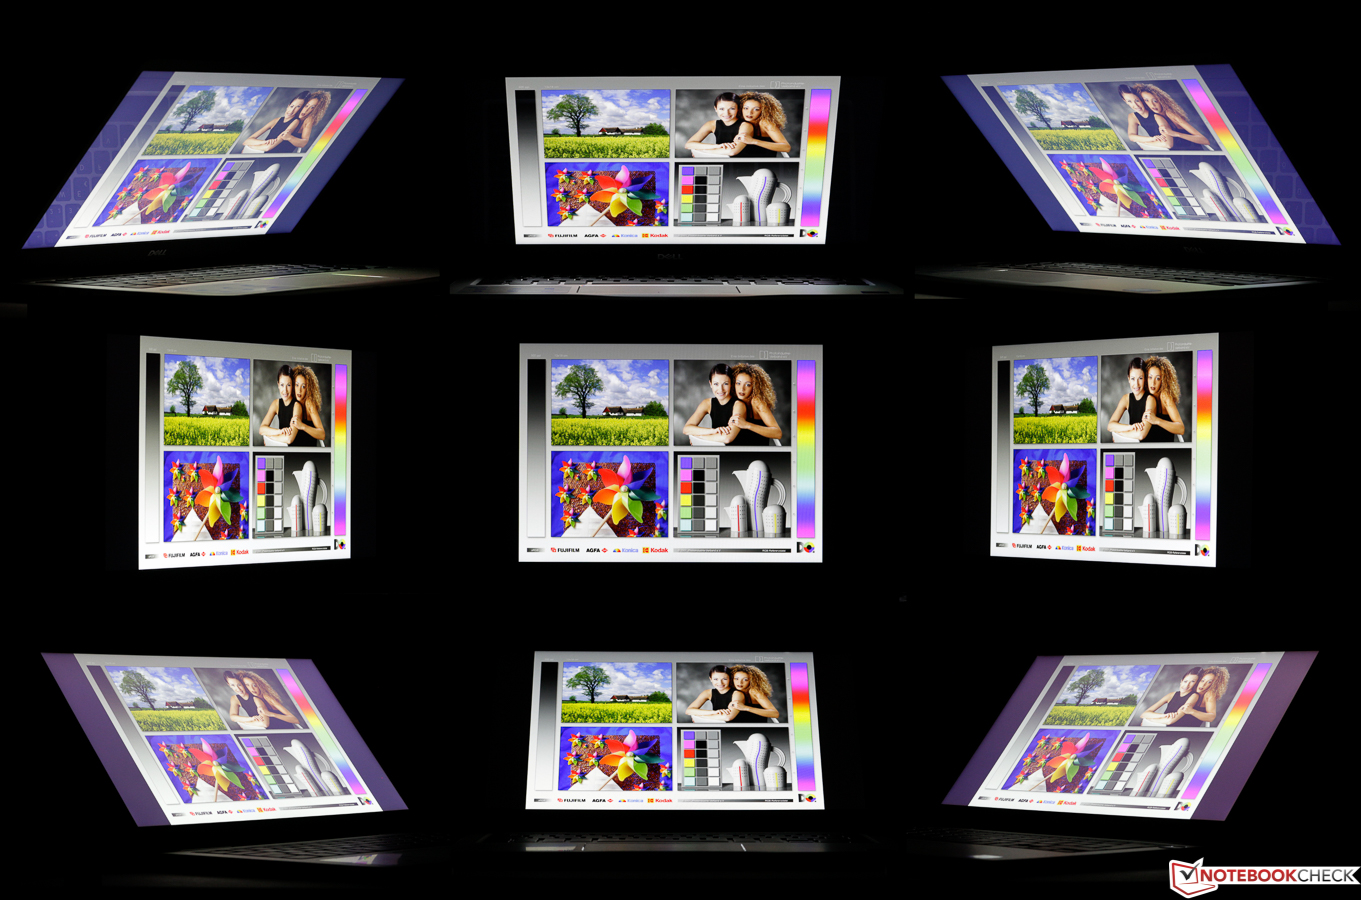
TN displays always offer a much lower stability of the viewing angles than their IPS counterparts. The vertical freedom of movement in front of the screen of the Dell Vostro in particular is severely restricted, and even from slight angles, the usual display problems such as a milky image (looking from the top) or a strong inversion effect (looking from the bottom) occur. The range on the sides is much larger, and you are spared any significant color distortions from viewing angles up to 45°, but there is still a visible loss of brightness and contrast. However, this is only the case if the vertical viewing angle is exactly 90°.
Performance
Processor
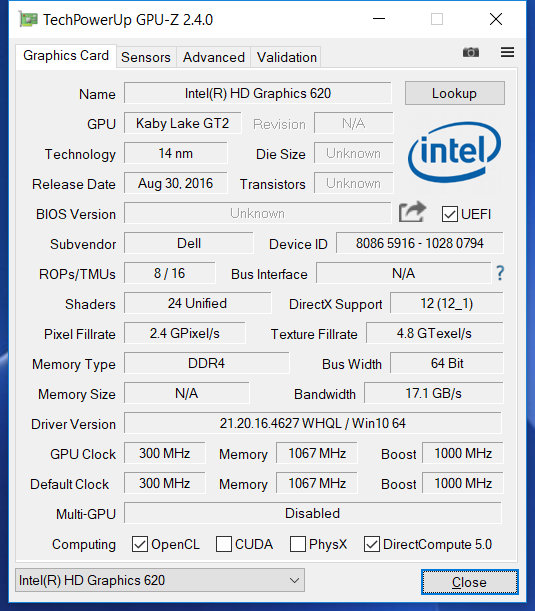
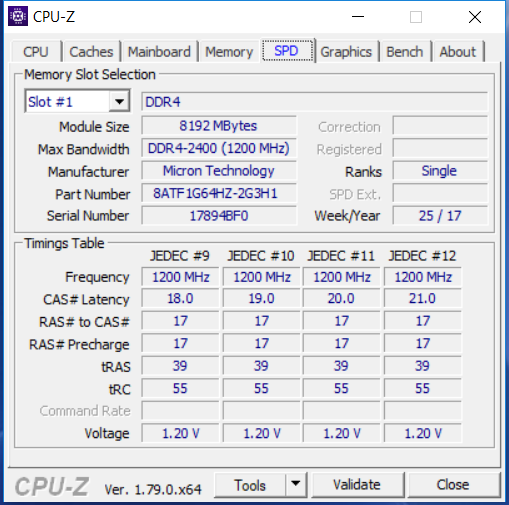
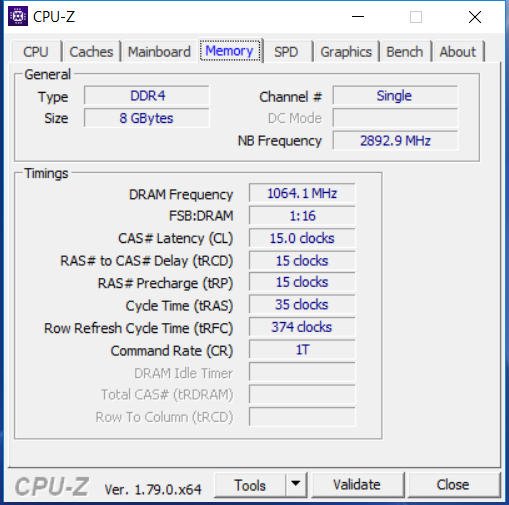
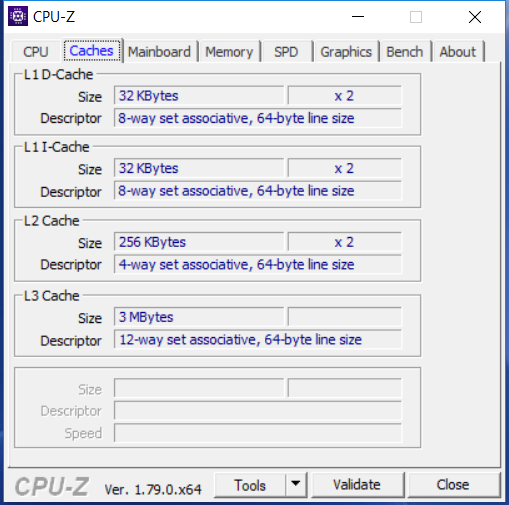
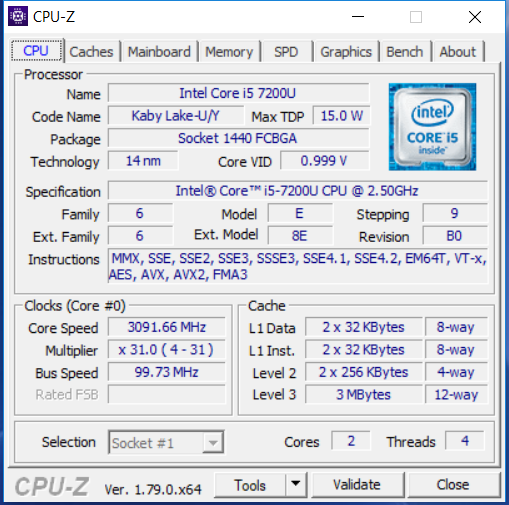
The Intel Core i5-7200U (2x 2.5 to 3.1 MHz, TDP 15 W) is an energy efficient ULV dual-core processor with Hyper-Threading from the current Kaby Lake generation, which like its direct predecessors can be found in numerous laptops, Ultrabooks, and convertibles of the office and multimedia types. The Turbo runs at 3.1 GHz even during load of both cores. A DDR4 storage controller and the Intel HD Graphics 620 GPU, which shares the main memory and the low TDP with the CPU, are integrated. The processor can handle the standard office software up to more demanding programs such as Adobe Photoshop and multimedia applications without any problems, but reaches its limits with software that would benefit from four or more physical cores, such as the current games.
Even though the Asus VivoBook fares slightly better in Cinebench R15, we can attest the i5-7200U with the performance one would expect. The CPU cannot maintain the two-core Turbo for long, and already in the second run, the clock speed falls below 3.1 GHz from time to time, and the Cinebench score drops from 321 to about 315 points which corresponds to a minus of almost 2%. Away from the power grid, the core speed behavior does not change.
System Performance
The fact that the Vostro is beaten by the ThinkPad by 7% to 9% in PCMark 8 can be traced back to a much faster NVMe SSD in the Lenovo. This explanation is not valid for the VivoBook, which is up to 12% faster and also has a relatively slow SSD. Instead, the higher Cinebench multicore score is probably relevant here, which points towards a much better Turbo usage of the i5-7200U in the Asus.
Even though there is a subjective difference to the much more expensive (gaming) notebooks with Quadcore, 16 GB of dual-channel RAM and NVMe-SSD, the operation of the Dell appears smooth. The OS and programs start without any delay worth mentioning, and the Vostro also handles some not too extensive multitasking (only 8 GB of RAM) without any problems.
| PCMark 8 | |
| Home Score Accelerated v2 | |
| Asus VivoBook S15 S510UA | |
| Lenovo ThinkPad E570-20H6S02M00 | |
| Dell Vostro 15 3568 | |
| Acer Aspire 3 A315-51-55E4 | |
| Work Score Accelerated v2 | |
| Lenovo ThinkPad E570-20H6S02M00 | |
| Asus VivoBook S15 S510UA | |
| Dell Vostro 15 3568 | |
| Acer Aspire 3 A315-51-55E4 | |
| PCMark 8 Home Score Accelerated v2 | 3417 points | |
| PCMark 8 Work Score Accelerated v2 | 4544 points | |
Help | ||
Storage Solution
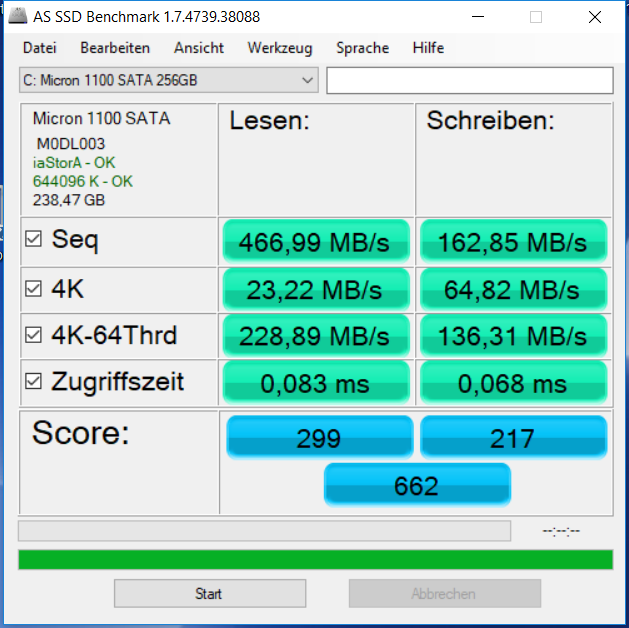
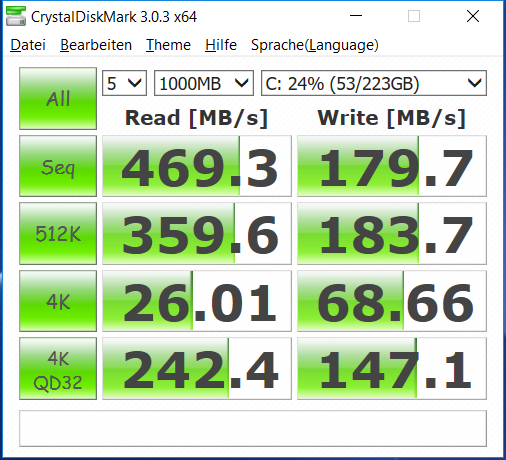
Despite the affordable price, the Vostro comes with an SSD, which even has 256 GB capacity. Instead, Dell foregoes an additional HDD. The overall AS-SSD score of the Micron storage, which is connected via SATA III, is very low. The less important write speed in particular remains significantly behind the faster SSDs, and even the 23 MB/s when reading small distributed data blocks remain significantly below the 30 MB/s, a point from which you could call it a decent performance. In terms of the very limited budget, you can be happy that there is an SSD at all, and the effects that are noticeable in practice remain mostly within tight limits.
| Dell Vostro 15 3568 Micron 1100 MTFDDAV256TBN | Acer Aspire 3 A315-51-55E4 Micron 1100 MTFDDAV256TBN | Lenovo ThinkPad E570-20H6S02M00 Samsung PM961 MZVLW256HEHP | Asus VivoBook S15 S510UA Toshiba HG6 THNSNJ128G8NY | |
|---|---|---|---|---|
| CrystalDiskMark 3.0 | 53% | 237% | 21% | |
| Read Seq (MB/s) | 469.3 | 485.8 4% | 1589 239% | 503 7% |
| Write Seq (MB/s) | 179.7 | 456.1 154% | 1217 577% | 396 120% |
| Read 512 (MB/s) | 359.6 | 328 -9% | 1155 221% | 417.7 16% |
| Write 512 (MB/s) | 183.7 | 446.8 143% | 783 326% | 342 86% |
| Read 4k (MB/s) | 26.01 | 26.95 4% | 59.7 130% | 19.48 -25% |
| Write 4k (MB/s) | 68.7 | 86.7 26% | 148.8 117% | 64.6 -6% |
| Read 4k QD32 (MB/s) | 242.4 | 245.9 1% | 473.6 95% | 250.3 3% |
| Write 4k QD32 (MB/s) | 147.1 | 300.2 104% | 428.7 191% | 94.3 -36% |

Graphics Card
We would like to spare the reader longer explanations on the well-known Intel HD 620 shared memory processor graphics here, pointing instead to our corresponding FAQ article on the GPU. The HD 620 handles all the 2D tasks that come up during office operation effortlessly and efficiently, and H.265/HEVC can now be decoded via hardware. As all the current Intel-HD graphics, the GPU benefits from fast dual-channel RAM, but the Vostro only uses one storage channel.
You can easily see the difference in the comparison with the only dual-channel competitor in the test in the form of the Asus VivoBook. Overall, the performance is within the expected limits and also remains constant in battery operation.
| 3DMark 11 - 1280x720 Performance GPU | |
| Asus VivoBook S15 S510UA | |
| Dell Vostro 15 3568 | |
| Lenovo ThinkPad E570-20H6S02M00 | |
| Acer Aspire 3 A315-51-55E4 | |
| 3DMark | |
| 1280x720 Cloud Gate Standard Graphics | |
| Asus VivoBook S15 S510UA | |
| Lenovo ThinkPad E570-20H6S02M00 | |
| Dell Vostro 15 3568 | |
| Acer Aspire 3 A315-51-55E4 | |
| 1920x1080 Fire Strike Graphics | |
| Asus VivoBook S15 S510UA | |
| Lenovo ThinkPad E570-20H6S02M00 | |
| Acer Aspire 3 A315-51-55E4 | |
| 3DMark 11 Performance | 1532 points | |
| 3DMark Cloud Gate Standard Score | 5611 points | |
Help | ||
Gaming Performance
As you can see in the small table below, the Intel HD Graphics 620 completely fails in graphically demanding 3D games. In the visually not very demanding "Farming Simulator 17," in medium settings it still achieves 43 FPS, which corresponds to about the average for this GPU. Laptops where the same GPU can use dual-channel RAM manage up to 61 and 25 FPS, which does not make much of a difference though. The GPU has less problems with isometric games such as "Diablo III" or "StarCraft II," where in parts even high presets are displayed smoothly.
| low | med. | high | ultra | |
|---|---|---|---|---|
| The Witcher 3 (2015) | 13.3 | |||
| Rise of the Tomb Raider (2016) | 13.1 | |||
| Farming Simulator 17 (2016) | 42.7 | 16.6 |
Emissions
Noise Emissions
At the beginning of the test, with the system cooling guideline active (high performance power profile), we were wondering why the fan would turn on from time to time even during idling situations or during low loads, but that might have been due to updates in the background. When we continued the test, some light peaks such as those when opening programs did not always lead to the fan revving up, but a run through the Kraken 1.1 browser benchmark did. If you activate the power saving mode with the system cooling guideline passive, the likelihood of an unnecessary revving up is significantly lowered according to our observations.
The fan does not produce a high volume of noise. It remains a gentle whirring which can be heard from at most 3 to 4 meters (~10 to ~13 ft), depending on the speed, which is adjusted smoothly. Unfortunately, at higher speeds this is accompanied by a slight high-pitched noise. The tests were performed in a quiet single office with a PC running.
Noise level
| Idle |
| 30.2 / 30.2 / 30.2 dB(A) |
| DVD |
| 35.2 / dB(A) |
| Load |
| 36.4 / 36.5 dB(A) |
 | ||
30 dB silent 40 dB(A) audible 50 dB(A) loud |
||
min: | ||
Temperature
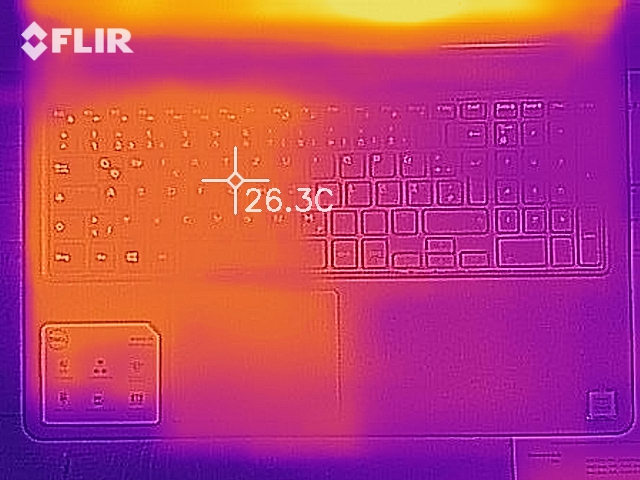
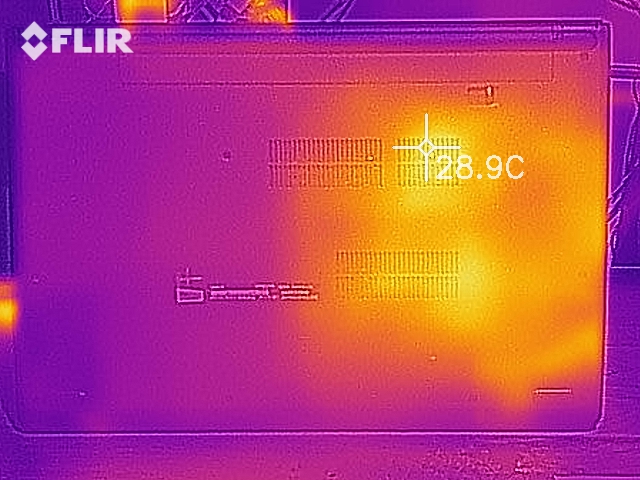
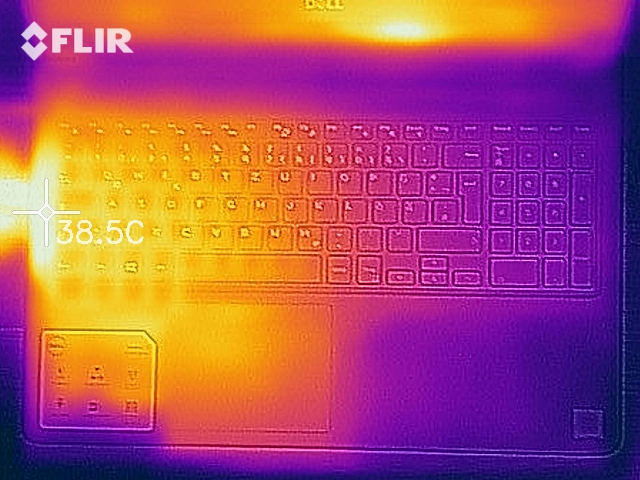
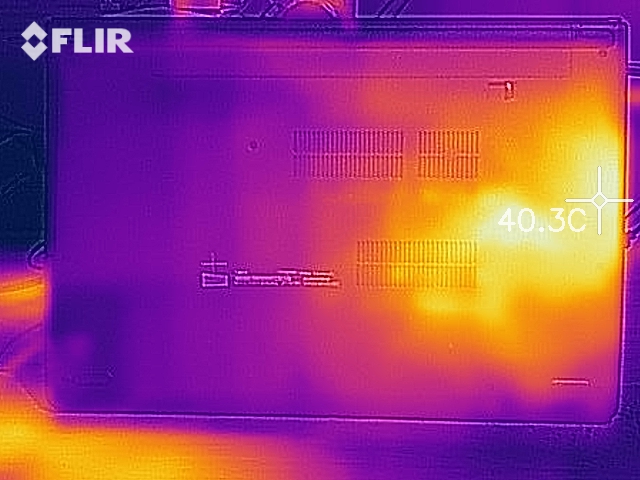
There is no need for concern at all in terms of the surface temperatures of the Vostro 15. Even during constant high load, the laptop does not reach body temperature anywhere.
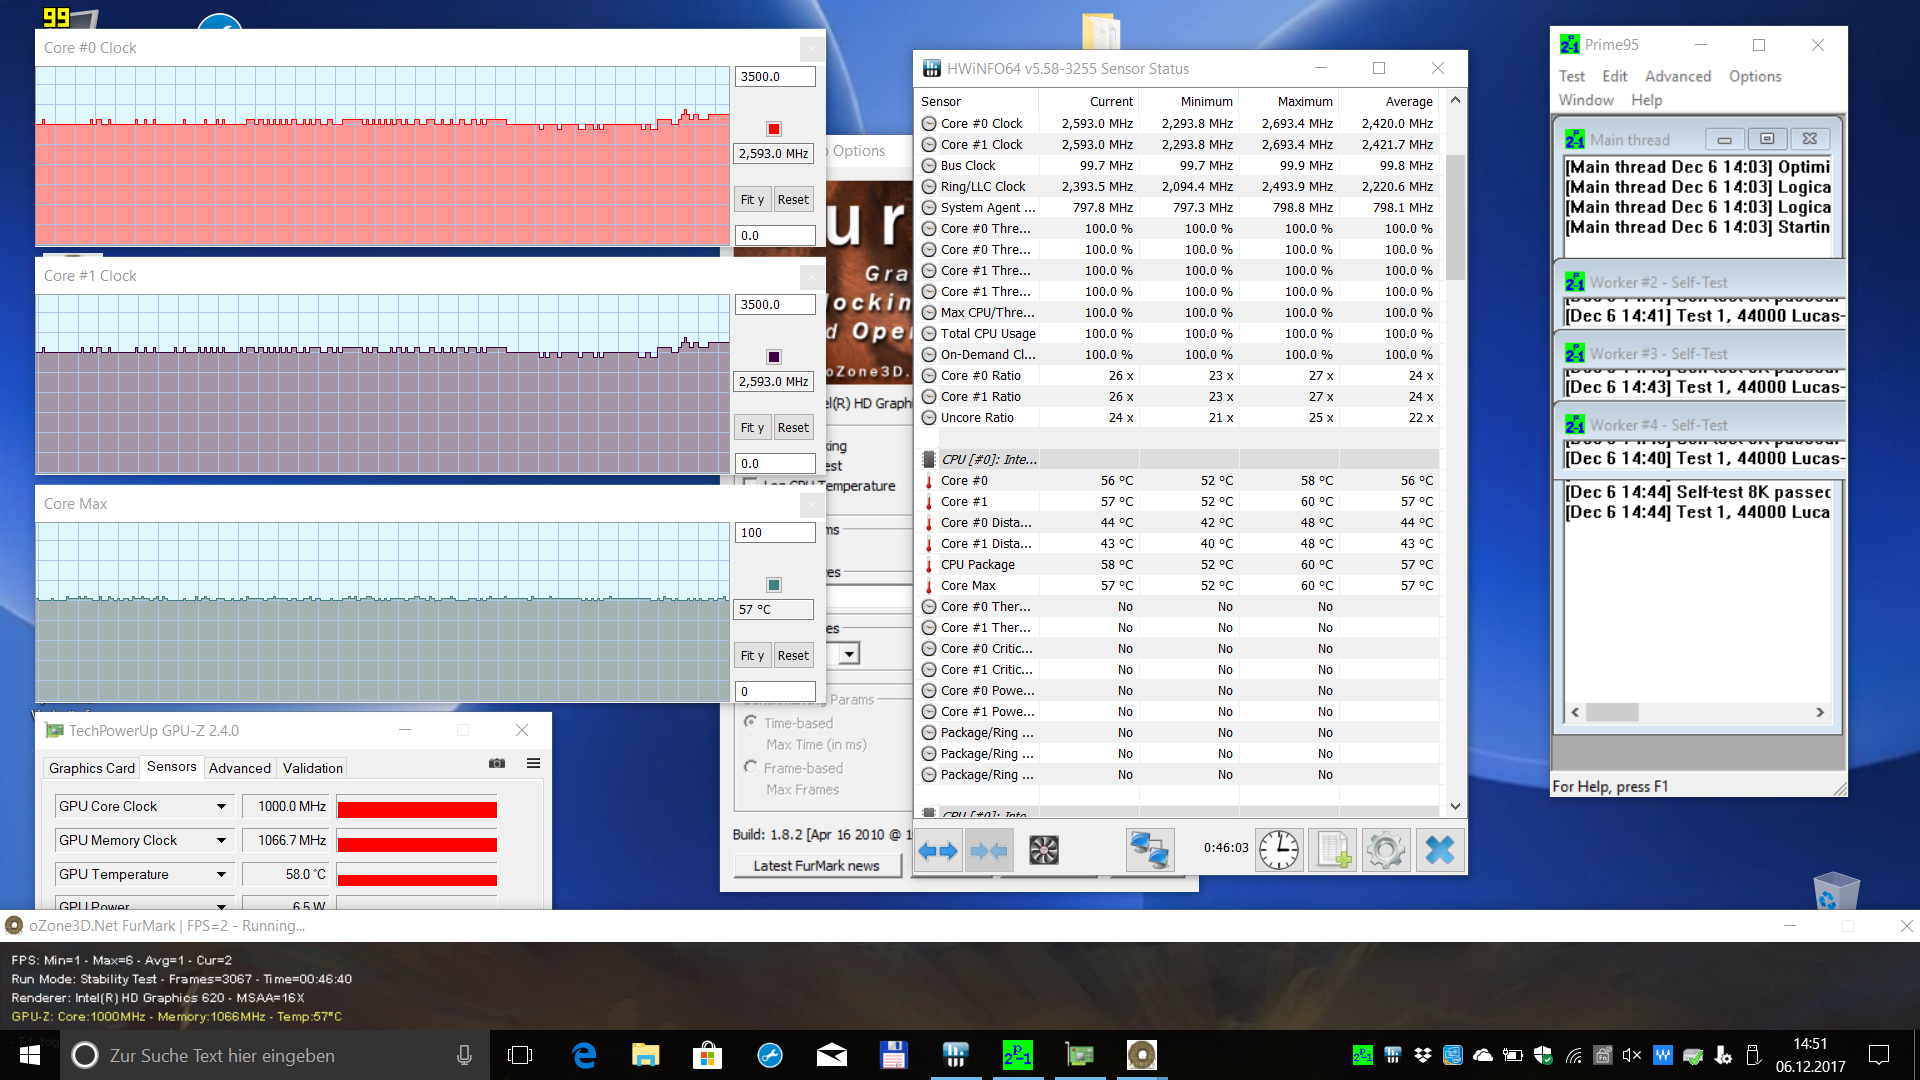
Now for the stress test: after the start of Prime95 + FurMark, the i5-7200U was able to maintain its Turbo for only a few seconds, after which it quickly leveled out at frequencies between 2.3 and 2.7 GHz (2.4 GHz average). So in terms of the basic clock speed, there can be some minimal throttling in this practically irrelevant scenario. The CPU never got warmer than 60 °C (140 °F). In contrast, the Intel HD 620 was able to maintain its maximum speed of 1000 MHz consistently. However, in practice you can count on unthrottled performance.
(+) The maximum temperature on the upper side is 35.6 °C / 96 F, compared to the average of 34.3 °C / 94 F, ranging from 21.2 to 62.5 °C for the class Office.
(+) The bottom heats up to a maximum of 35.3 °C / 96 F, compared to the average of 36.8 °C / 98 F
(+) In idle usage, the average temperature for the upper side is 24.1 °C / 75 F, compared to the device average of 29.5 °C / 85 F.
(+) The palmrests and touchpad are cooler than skin temperature with a maximum of 30.2 °C / 86.4 F and are therefore cool to the touch.
(-) The average temperature of the palmrest area of similar devices was 27.6 °C / 81.7 F (-2.6 °C / -4.7 F).
Speakers
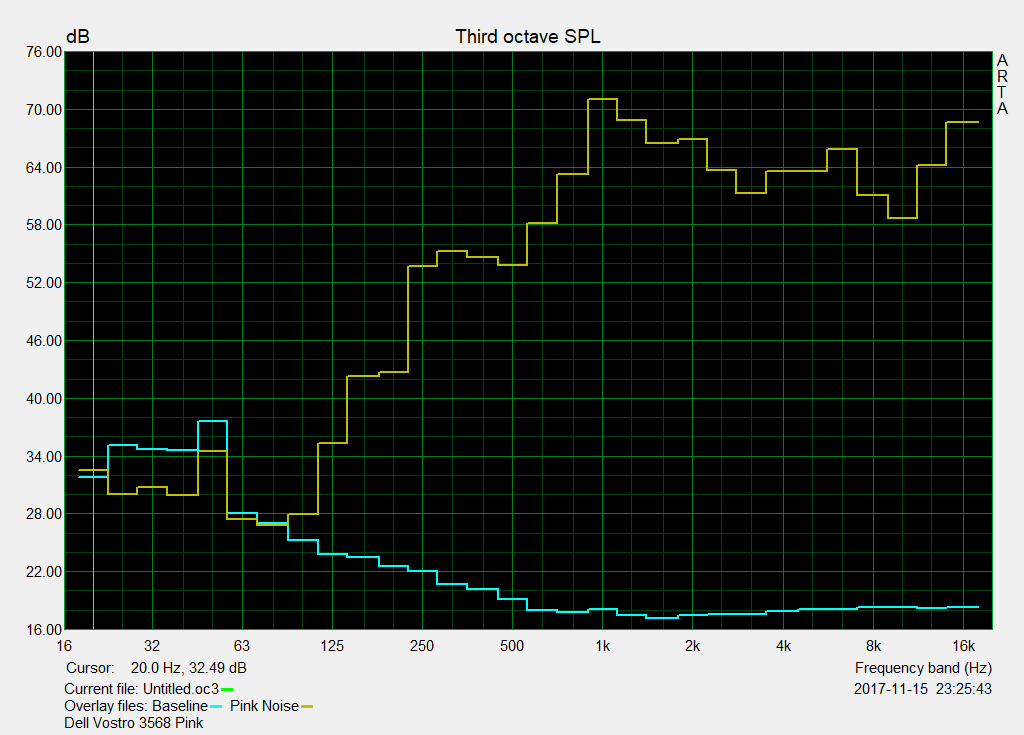
We cannot attest a very high maximum volume of the sound system with its two small speakers which point downward at an angle, but it should be sufficient for medium-sized rooms. The mid-heavy sound is completely lacking any bass and tends to sound flat, slightly tinny, and not so clean, depending on the track. In high-volume music such as Metal, the instruments tend to sound muddy, and the beginnings of any dynamic that are present disappear completely.
However, you are spared any shrill distortions and volume fluctuations. At lower volumes, the situation becomes more relaxed, as is often the case. Apart from what is offered by Windows, there are no other configuration options. Overall, we have heard worse even in more expensive devices, and you simply cannot expect more for the price.
Dell Vostro 15 3568 audio analysis
(-) | not very loud speakers (71.1 dB)
Bass 100 - 315 Hz
(-) | nearly no bass - on average 18.4% lower than median
(±) | linearity of bass is average (11% delta to prev. frequency)
Mids 400 - 2000 Hz
(±) | higher mids - on average 5.9% higher than median
(+) | mids are linear (6.9% delta to prev. frequency)
Highs 2 - 16 kHz
(+) | balanced highs - only 2% away from median
(+) | highs are linear (5.8% delta to prev. frequency)
Overall 100 - 16.000 Hz
(±) | linearity of overall sound is average (20.5% difference to median)
Compared to same class
» 46% of all tested devices in this class were better, 10% similar, 44% worse
» The best had a delta of 7%, average was 21%, worst was 53%
Compared to all devices tested
» 54% of all tested devices were better, 8% similar, 38% worse
» The best had a delta of 4%, average was 23%, worst was 134%
Acer Aspire 3 A315-51-55E4 audio analysis
(±) | speaker loudness is average but good (72 dB)
Bass 100 - 315 Hz
(-) | nearly no bass - on average 23.3% lower than median
(±) | linearity of bass is average (9.3% delta to prev. frequency)
Mids 400 - 2000 Hz
(±) | higher mids - on average 7.4% higher than median
(±) | linearity of mids is average (13.3% delta to prev. frequency)
Highs 2 - 16 kHz
(+) | balanced highs - only 3.6% away from median
(±) | linearity of highs is average (7.5% delta to prev. frequency)
Overall 100 - 16.000 Hz
(±) | linearity of overall sound is average (27.9% difference to median)
Compared to same class
» 87% of all tested devices in this class were better, 3% similar, 10% worse
» The best had a delta of 7%, average was 21%, worst was 53%
Compared to all devices tested
» 85% of all tested devices were better, 3% similar, 12% worse
» The best had a delta of 4%, average was 23%, worst was 134%
Lenovo ThinkPad E570-20H6S02M00 audio analysis
(-) | not very loud speakers (71.4 dB)
Bass 100 - 315 Hz
(-) | nearly no bass - on average 17.1% lower than median
(±) | linearity of bass is average (10.9% delta to prev. frequency)
Mids 400 - 2000 Hz
(+) | balanced mids - only 3.9% away from median
(±) | linearity of mids is average (8.2% delta to prev. frequency)
Highs 2 - 16 kHz
(+) | balanced highs - only 3.4% away from median
(±) | linearity of highs is average (7% delta to prev. frequency)
Overall 100 - 16.000 Hz
(±) | linearity of overall sound is average (20.3% difference to median)
Compared to same class
» 45% of all tested devices in this class were better, 10% similar, 45% worse
» The best had a delta of 7%, average was 21%, worst was 53%
Compared to all devices tested
» 53% of all tested devices were better, 8% similar, 39% worse
» The best had a delta of 4%, average was 23%, worst was 134%
Asus VivoBook S15 S510UA audio analysis
(-) | not very loud speakers (66.4 dB)
Bass 100 - 315 Hz
(-) | nearly no bass - on average 15.3% lower than median
(±) | linearity of bass is average (12.2% delta to prev. frequency)
Mids 400 - 2000 Hz
(+) | balanced mids - only 1.6% away from median
(+) | mids are linear (6.8% delta to prev. frequency)
Highs 2 - 16 kHz
(+) | balanced highs - only 3.8% away from median
(±) | linearity of highs is average (10.6% delta to prev. frequency)
Overall 100 - 16.000 Hz
(±) | linearity of overall sound is average (19.8% difference to median)
Compared to same class
» 65% of all tested devices in this class were better, 6% similar, 28% worse
» The best had a delta of 5%, average was 17%, worst was 45%
Compared to all devices tested
» 51% of all tested devices were better, 7% similar, 42% worse
» The best had a delta of 4%, average was 23%, worst was 134%
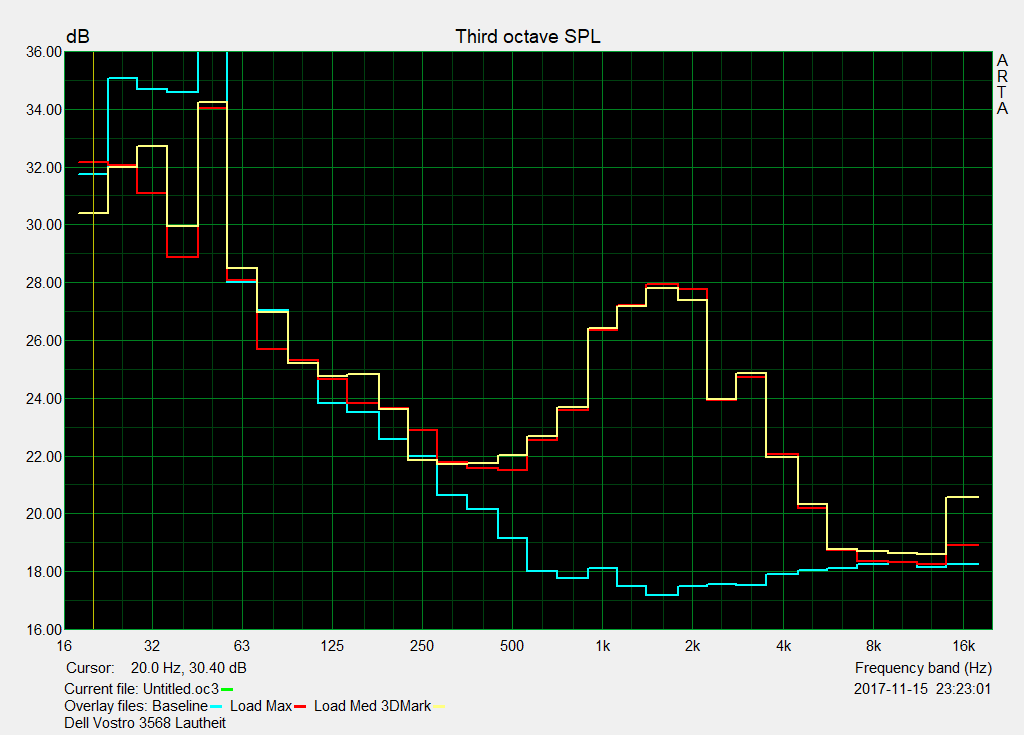
Frequency comparison (Checkboxes selectable!)
Power Management
Power Consumption
In the test comparison with the competitors that have a similar form format and are equipped with identical or similar core components, the Dell Vostro 15 3568 turns out to be the efficiency king in every single partial discipline. If we filter our database for 15-inchers with the i5-7200U, the test unit is also one of the most efficient laptops, at least in the load states from maximum idle to maximum load. That is great! The 45-watt power supply is equal to its task in any situation and offers sufficient reserves to charge the device on the side even under load. We have collected some tips on the right treatment of Lithium-Ion batteries in our special article on the subject.
| Off / Standby | |
| Idle | |
| Load |
|
Key:
min: | |
| Dell Vostro 15 3568 i5-7200U, HD Graphics 620, Micron 1100 MTFDDAV256TBN, TN LED, 1920x1080, 15.6" | Acer Aspire 3 A315-51-55E4 i5-7200U, HD Graphics 620, Micron 1100 MTFDDAV256TBN, TN LED, 1920x1080, 15.6" | Lenovo ThinkPad E570-20H6S02M00 i5-7200U, HD Graphics 620, Samsung PM961 MZVLW256HEHP, TN LED, 1366x768, 15.6" | Asus VivoBook S15 S510UA i5-7200U, HD Graphics 620, Toshiba HG6 THNSNJ128G8NY, IPS, 1920x1080, 15.6" | |
|---|---|---|---|---|
| Power Consumption | -27% | -6% | -38% | |
| Idle Minimum * (Watt) | 3 | 4.1 -37% | 2.9 3% | 4.6 -53% |
| Idle Average * (Watt) | 5.5 | 7.5 -36% | 5.8 -5% | 7.6 -38% |
| Idle Maximum * (Watt) | 5.7 | 8.9 -56% | 6.6 -16% | 7.7 -35% |
| Load Average * (Watt) | 27 | 28.1 -4% | 29 -7% | 35.1 -30% |
| Load Maximum * (Watt) | 27.4 | 28.3 -3% | 29.4 -7% | 36.2 -32% |
* ... smaller is better
Battery Life
In practice, the battery life of all the test candidates can be compared easily, since at 40 (test unit), 37, 42, and 42 Wh, the battery capacities of all the involved devices are very similar. Apparently, our Dell benefits from its low power consumption and lasts the longest overall, together with the Lenovo, while the Asus is clearly weaker. In the practically relevant WLAN test (how we test), the Vostro 15 3568 lasts a good 6 hours, and with this remains 13% behind the ThinkPad E570 which has a marginally larger battery.
| Dell Vostro 15 3568 i5-7200U, HD Graphics 620, 40 Wh | Acer Aspire 3 A315-51-55E4 i5-7200U, HD Graphics 620, 37 Wh | Lenovo ThinkPad E570-20H6S02M00 i5-7200U, HD Graphics 620, 42 Wh | Asus VivoBook S15 S510UA i5-7200U, HD Graphics 620, 42 Wh | |
|---|---|---|---|---|
| Battery runtime | -11% | 9% | -32% | |
| Reader / Idle (h) | 14.6 | 14.3 -2% | 18.1 24% | 10.2 -30% |
| WiFi v1.3 (h) | 6.3 | 5.8 -8% | 7.2 14% | 4.3 -32% |
| Load (h) | 1.8 | 1.4 -22% | 1.6 -11% | 1.2 -33% |
| H.264 (h) | 6.5 |
Verdict
Pros
Cons
The really crummy display with its extreme blue tint in the delivery state, the likes of which we have not seen before, is the only component of the new Dell Vostro 15 3568 which we can hold against the manufacturer even considering the very low price of the entry-level configuration. The best part of the display is really the matte surface. All the other disadvantages we collected in our contra list carry much less weight.
If you can ignore the display (as surprisingly many users can do), you get a simple office notebook with limited mobility, which handles its tasks suitably. The battery can be switched easily, a TPM module is built-in for security, and Windows 10 Pro levels the path towards hard drive encryption and expanded administrative options in the company network. On the positive side, we should also mention the decent input devices and the cool and normally quiet operation.
The highlights of our version of the Dell Vostro 15 3568, which is to a large extent successful, are its 256 GB SSD and W10 Pro, which can make up for the bad screen in the eyes of some users.
An SSD and the Pro version of Windows 10 are only available at an extra charge, which drives the price more towards that of the competitors in the test. Anyone who chooses the minimum variant will still have enough performance for the office. Because of the display alone, we are unable to bring ourselves to give a purchase recommendation.
Dell Vostro 15 3568
- 12/12/2017 v6 (old)
Sven Kloevekorn
Price comparison
