Lenovo ThinkPad E570 (7200U, HD Display) Laptop Review
For the original German review, see here.
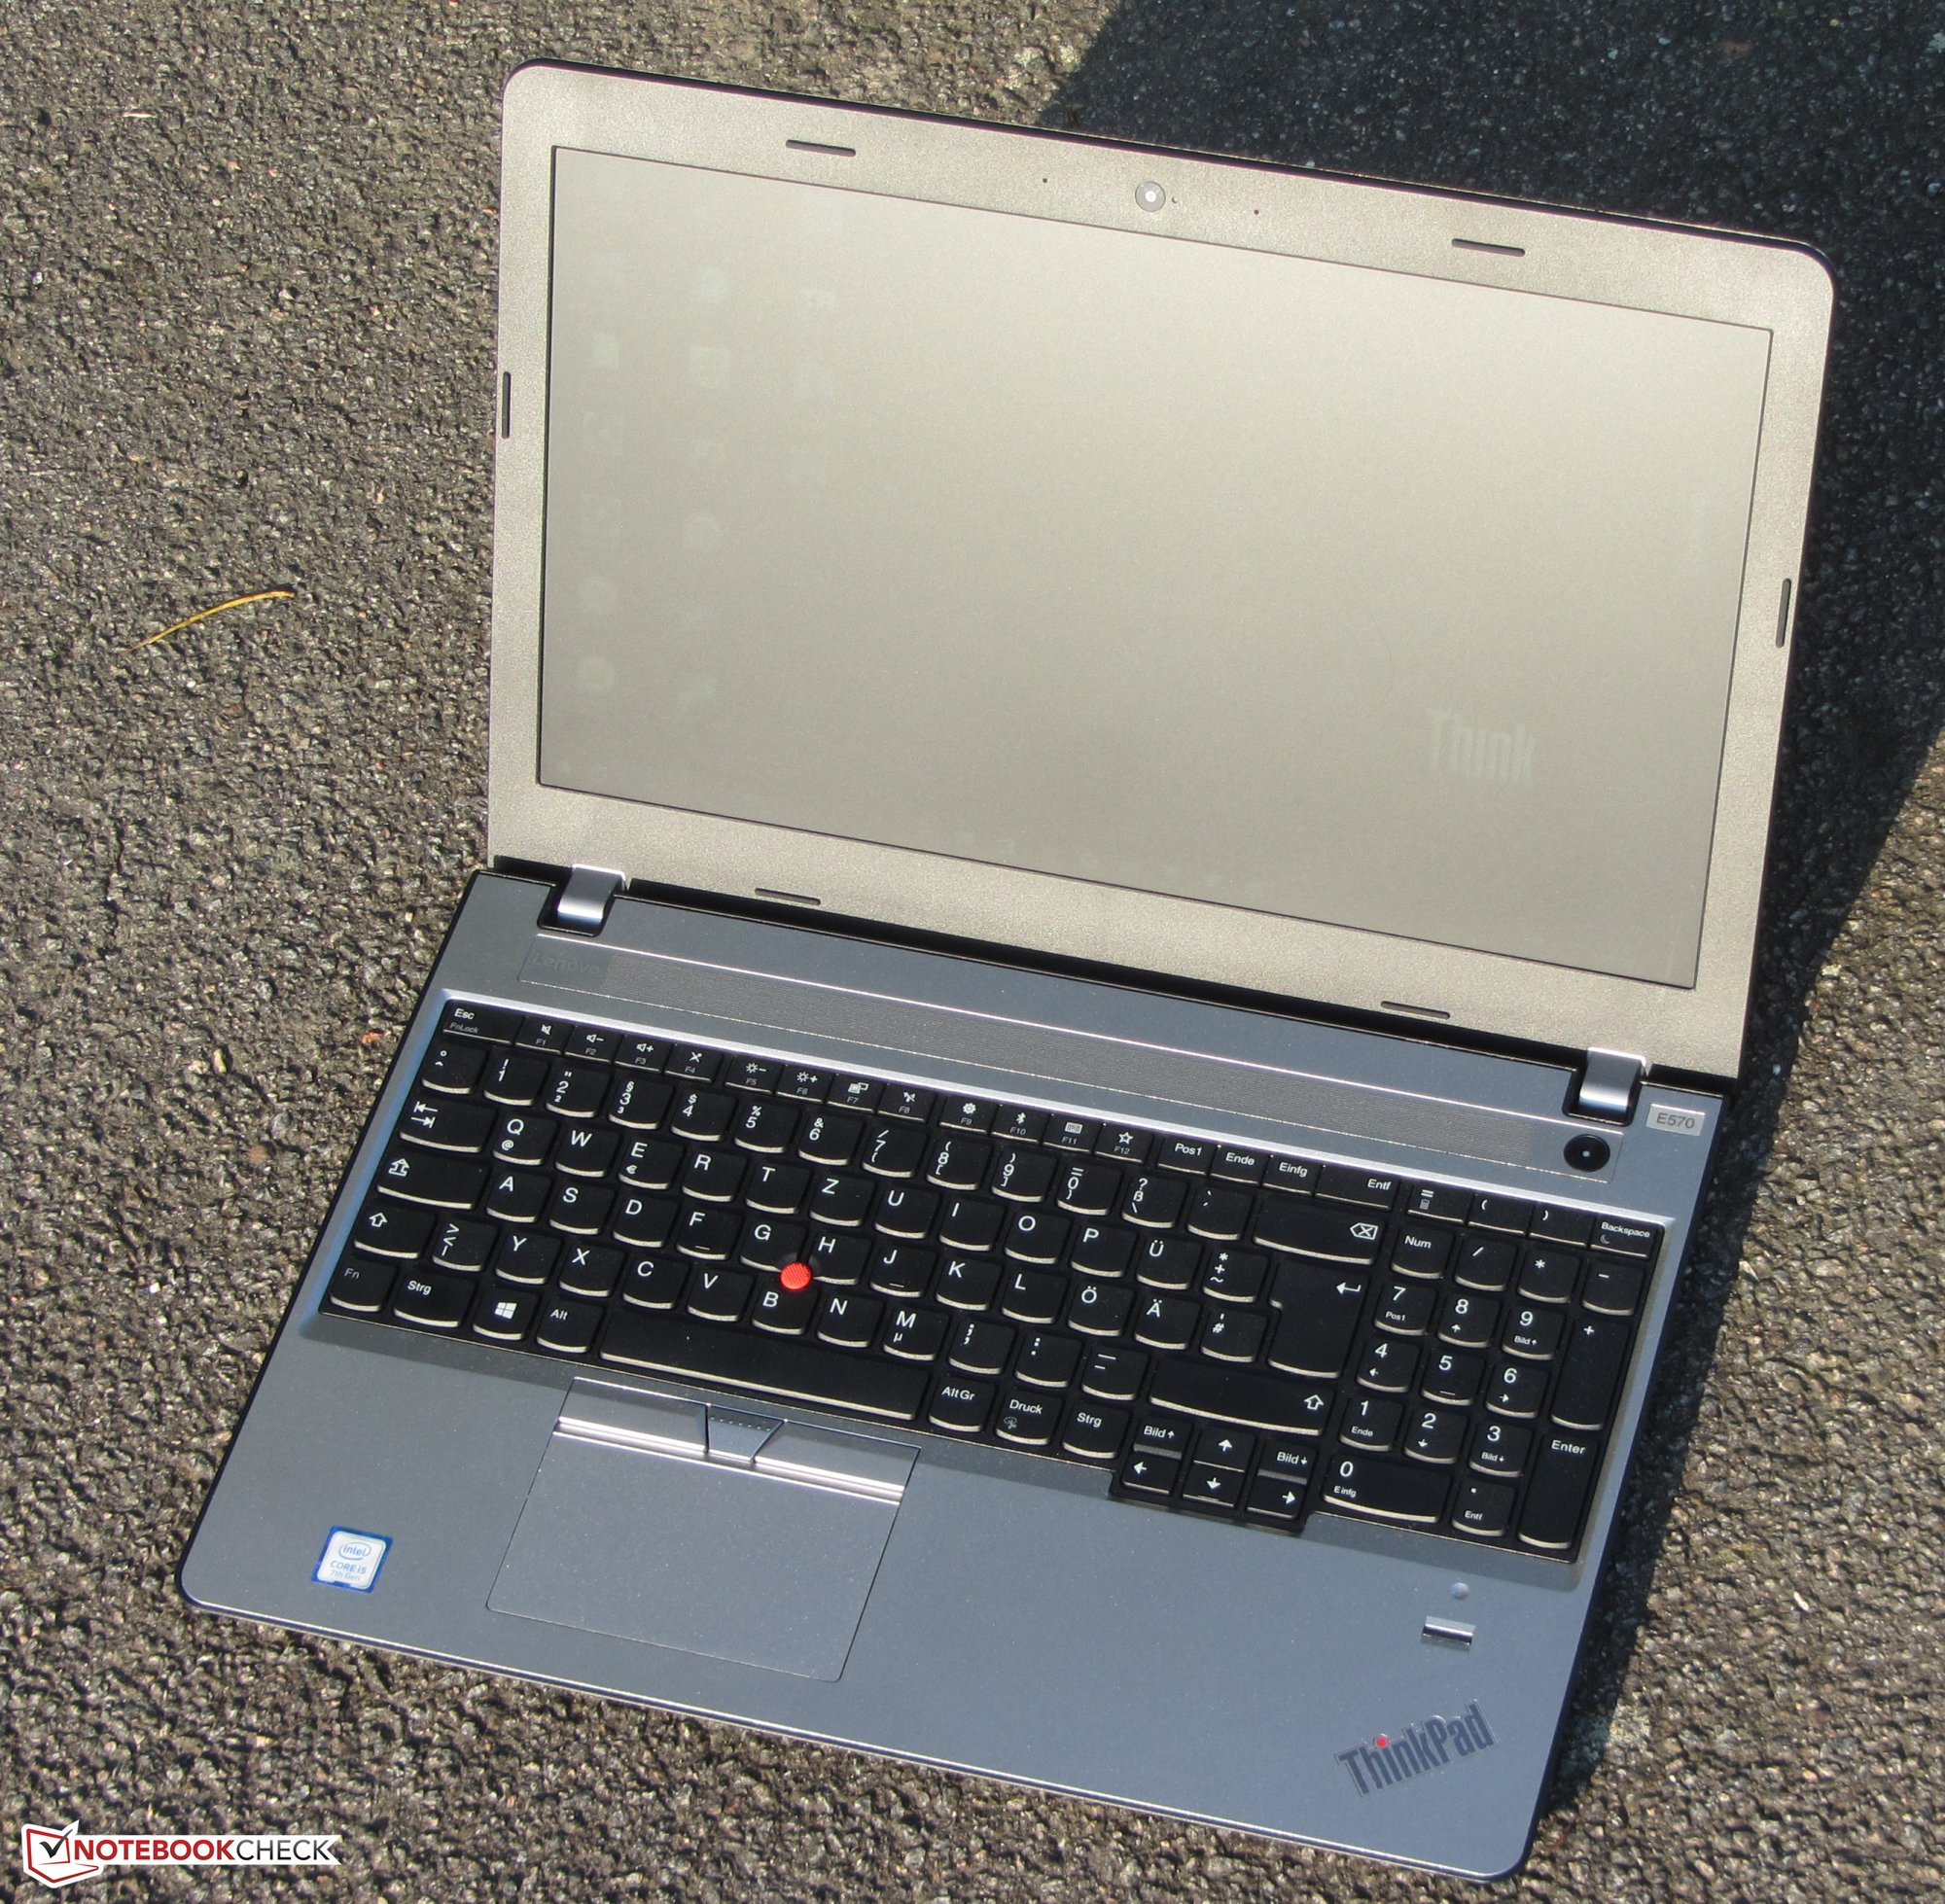
Lenovo offers entry-level business laptops within its ThinkPad E lineup. After testing a ThinkPad E570 model with a GeForce GTX 950M graphics unit and IPS Full HD panel a few months ago, we are now facing a model without a dedicated GPU and with an HD screen. Its competitors are found in devices such as HP's ProBook 450 G4, Acer's TravelMate P259-MG, Dell's Latitude 15 3570, and Fujitsu's LifeBook A557.
Since both ThinkPad models are built identically, we will not go into details about casing, connectivity, input devices or speakers. The relevant information can be found in our review of the E570 Full HD model.
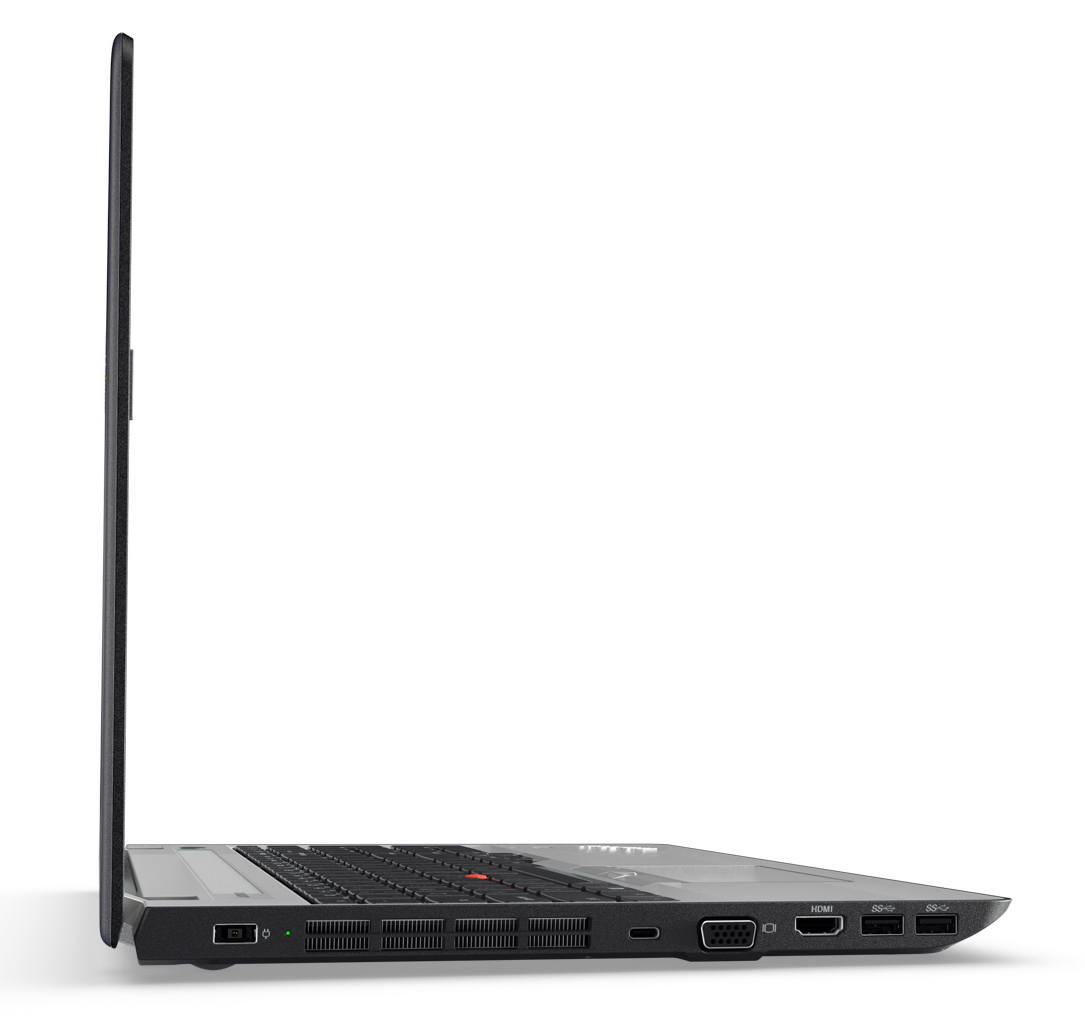
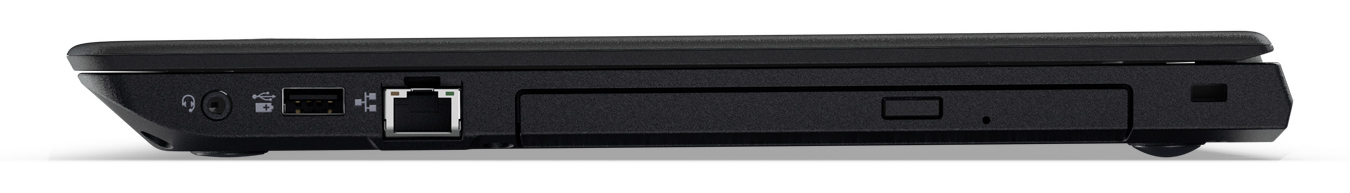
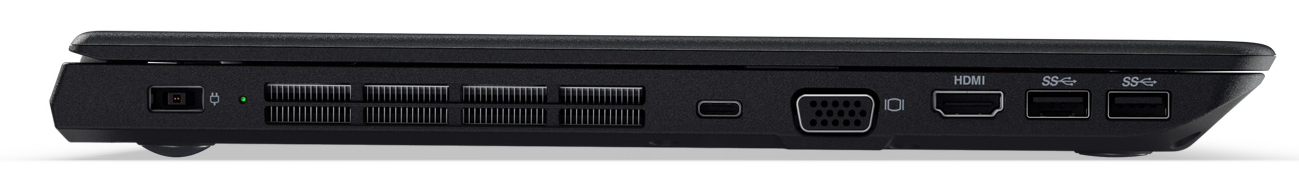
Connectivity
In terms of interfaces, our present review sample deviates from the previously tested model. The current model has an additional USB Type-C port (USB 3.1 Gen1).
| SD Card Reader | |
| average JPG Copy Test (av. of 3 runs) | |
| HP ProBook 450 G4 Y8B60EA | |
| Acer TravelMate P259-MG-71UU (Toshiba Exceria Pro SDXC 64 GB UHS-II) | |
| Lenovo ThinkPad E570-20H6S00000 (Toshiba Exceria Pro SDXC 64 GB UHS-II) | |
| Dell Latitude 15-3570 | |
| maximum AS SSD Seq Read Test (1GB) | |
| HP ProBook 450 G4 Y8B60EA | |
| Lenovo ThinkPad E570-20H6S00000 (Toshiba Exceria Pro SDXC 64 GB UHS-II) | |
| Dell Latitude 15-3570 | |
| Networking | |
| iperf3 transmit AX12 | |
| Lenovo ThinkPad E570-20H6S02M00 | |
| Acer TravelMate P259-MG-71UU | |
| Lenovo ThinkPad E570-20H6S00000 | |
| iperf3 receive AX12 | |
| Acer TravelMate P259-MG-71UU | |
| Lenovo ThinkPad E570-20H6S02M00 | |
| Lenovo ThinkPad E570-20H6S00000 | |
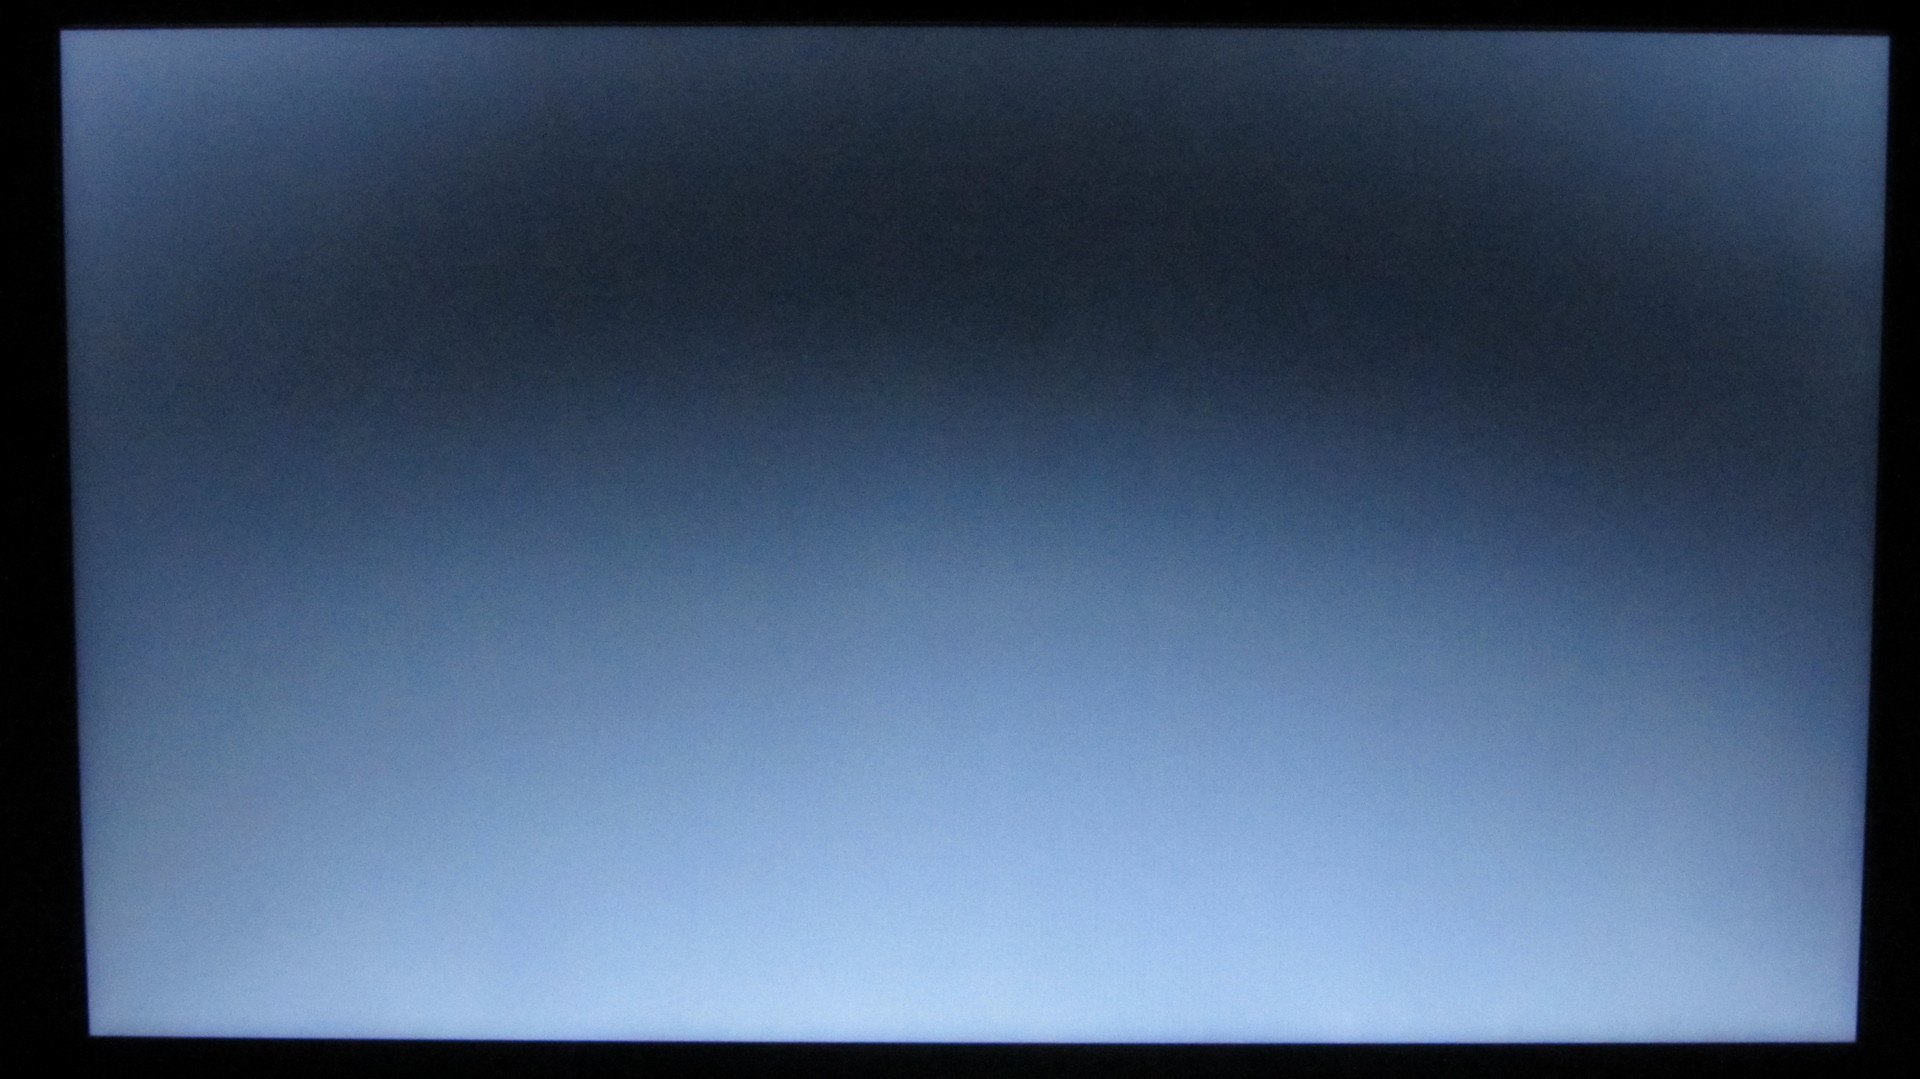
Display
The matte, 15.6-inch panel has a native resolution of 1366x768 pixels. Its brightness (233 cd/m²) and contrast (410:1) are far too low. We expect rates beyond 300 cd/m² and 1000:1. At least, the Full HD panel fulfills our expectations in terms of contrast. However, its brightness is not that much better than that of the HD screen.
Unfortunately, the screen installed here displays PWM flickering at a frequency of 200 Hz in brightness levels of 90% and lower. This can cause headaches and/or eye problems in sensitive users.

| |||||||||||||||||||||||||
Brightness Distribution: 73 %
Center on Battery: 242 cd/m²
Contrast: 410:1 (Black: 0.59 cd/m²)
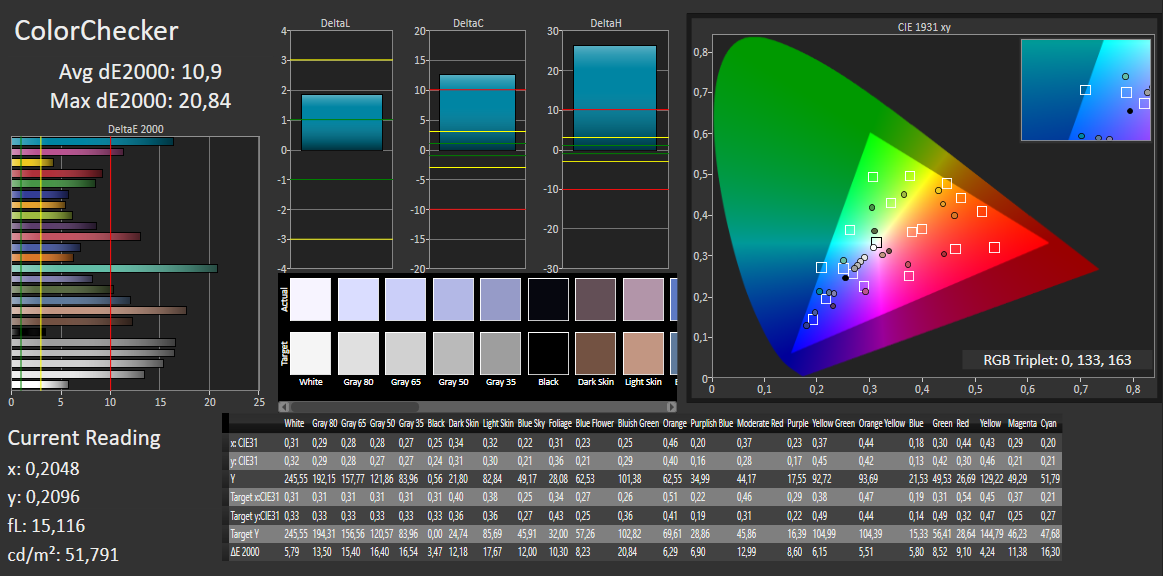
ΔE ColorChecker Calman: 10.9 | ∀{0.5-29.43 Ø4.73}
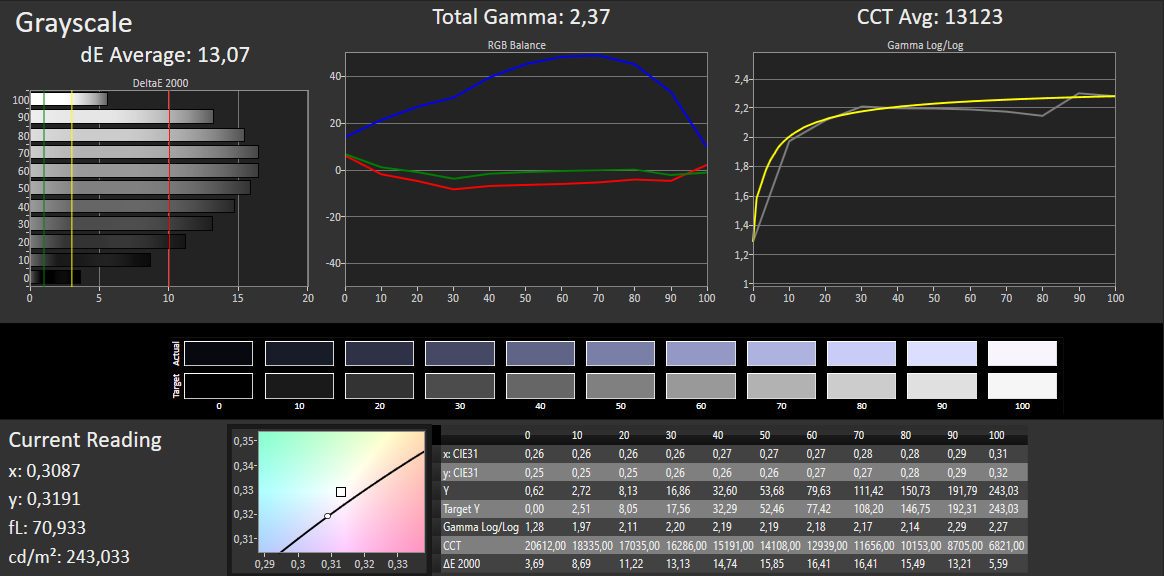
ΔE Greyscale Calman: 13.07 | ∀{0.09-98 Ø4.97}
55% sRGB (Argyll 1.6.3 3D)
35% AdobeRGB 1998 (Argyll 1.6.3 3D)
38.01% AdobeRGB 1998 (Argyll 3D)
55.4% sRGB (Argyll 3D)
36.79% Display P3 (Argyll 3D)
Gamma: 2.37
CCT: 13123 K
| Lenovo ThinkPad E570-20H6S02M00 TN LED, 1366x768, 15.6" | Lenovo ThinkPad E570-20H6S00000 IPS LED, 1920x1080, 15.6" | HP ProBook 450 G4 Y8B60EA TN LED, 1920x1080, 15.6" | Dell Latitude 15-3570 TN LED, 1366x768, 15.6" | Acer TravelMate P259-MG-71UU TN LED, 1920x1080, 15.6" | Fujitsu LifeBook A557 PL IPS, 1920x1080, 15.6" | |
|---|---|---|---|---|---|---|
| Display | 5% | 8% | 10% | 5% | 19% | |
| Display P3 Coverage (%) | 36.79 | 38.65 5% | 39.89 8% | 40.61 10% | 38.58 5% | 44.13 20% |
| sRGB Coverage (%) | 55.4 | 58 5% | 59.5 7% | 61.1 10% | 58 5% | 65.2 18% |
| AdobeRGB 1998 Coverage (%) | 38.01 | 39.94 5% | 41.24 8% | 41.96 10% | 39.85 5% | 45.72 20% |
| Response Times | -47% | -71% | -83% | -31% | ||
| Response Time Grey 50% / Grey 80% * (ms) | 46 ? | 44.8 ? 3% | 51 ? -11% | 37 ? 20% | 43 ? 7% | |
| Response Time Black / White * (ms) | 13 ? | 25.6 ? -97% | 30 ? -131% | 37 ? -185% | 22 ? -69% | |
| PWM Frequency (Hz) | 200 ? | 50 ? | ||||
| Screen | 41% | 7% | -2% | 5% | 52% | |
| Brightness middle (cd/m²) | 242 | 242 0% | 214 -12% | 202 -17% | 180 -26% | 239.5 -1% |
| Brightness (cd/m²) | 233 | 243 4% | 201 -14% | 211 -9% | 178 -24% | 216 -7% |
| Brightness Distribution (%) | 73 | 75 3% | 77 5% | 88 21% | 93 27% | 80 10% |
| Black Level * (cd/m²) | 0.59 | 0.24 59% | 0.43 27% | 0.62 -5% | 0.45 24% | 0.2 66% |
| Contrast (:1) | 410 | 1008 146% | 498 21% | 326 -20% | 400 -2% | 1198 192% |
| Colorchecker dE 2000 * | 10.9 | 4.65 57% | 10.68 2% | 12.35 -13% | 9.91 9% | |
| Colorchecker dE 2000 max. * | 20.84 | 9.64 54% | 18.07 13% | 19.9 5% | 18.19 13% | |
| Greyscale dE 2000 * | 13.07 | 3.39 74% | 11.32 13% | 13.46 -3% | 11.25 14% | |
| Gamma | 2.37 93% | 2.7 81% | 2.26 97% | 2.44 90% | 2.35 94% | |
| CCT | 13123 50% | 6246 104% | 12204 53% | 15217 43% | 12115 54% | |
| Color Space (Percent of AdobeRGB 1998) (%) | 35 | 36.69 5% | 38 9% | 39 11% | 37 6% | |
| Color Space (Percent of sRGB) (%) | 55 | 57.66 5% | 59 7% | 61 11% | 58 5% | |
| Total Average (Program / Settings) | -0% /
22% | -19% /
-3% | -25% /
-10% | -7% /
-0% | 36% /
40% |
* ... smaller is better
Screen Flickering / PWM (Pulse-Width Modulation)
| Screen flickering / PWM detected | 200 Hz | ≤ 90 % brightness setting | 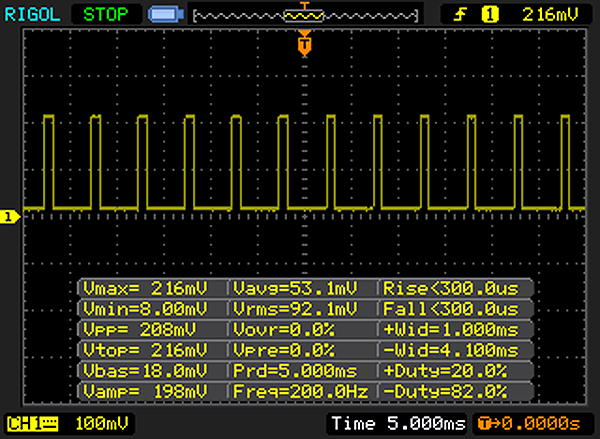 |
The display backlight flickers at 200 Hz (worst case, e.g., utilizing PWM) Flickering detected at a brightness setting of 90 % and below. There should be no flickering or PWM above this brightness setting. The frequency of 200 Hz is relatively low, so sensitive users will likely notice flickering and experience eyestrain at the stated brightness setting and below. In comparison: 52 % of all tested devices do not use PWM to dim the display. If PWM was detected, an average of 7798 (minimum: 5 - maximum: 343500) Hz was measured. | |||
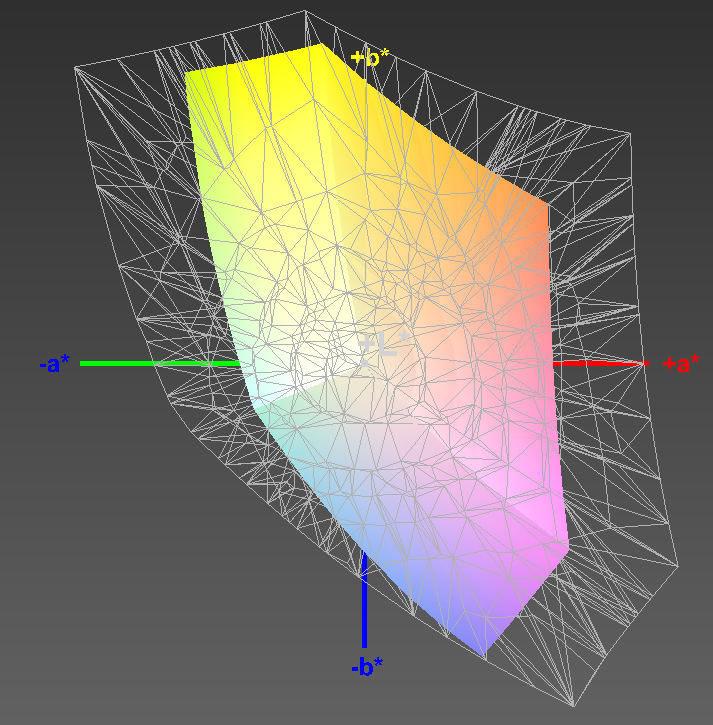
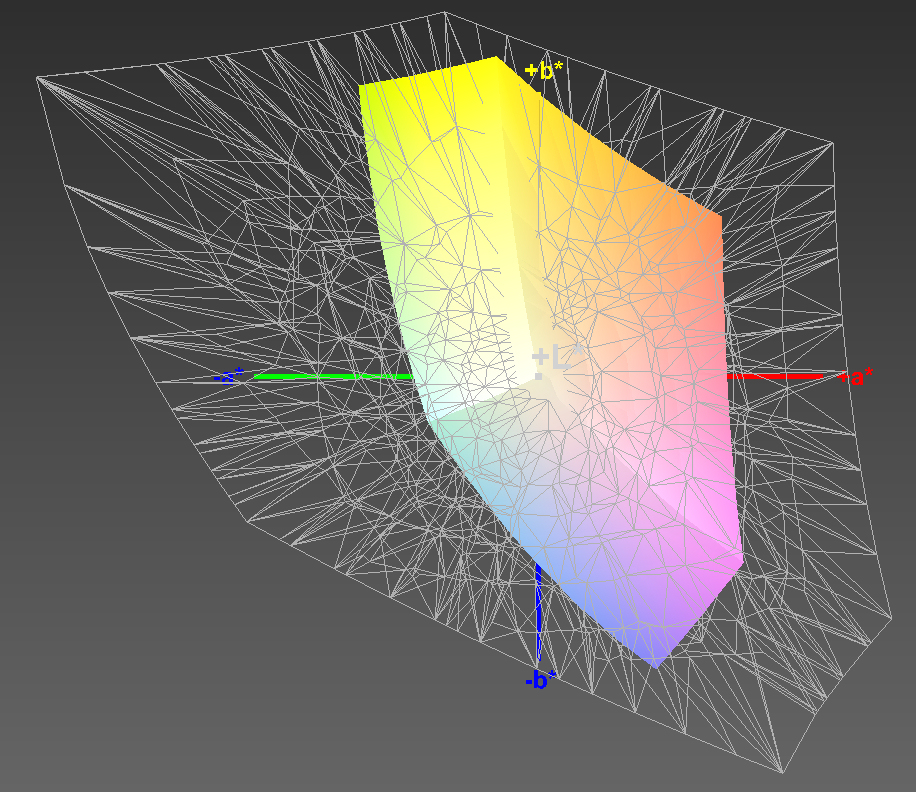
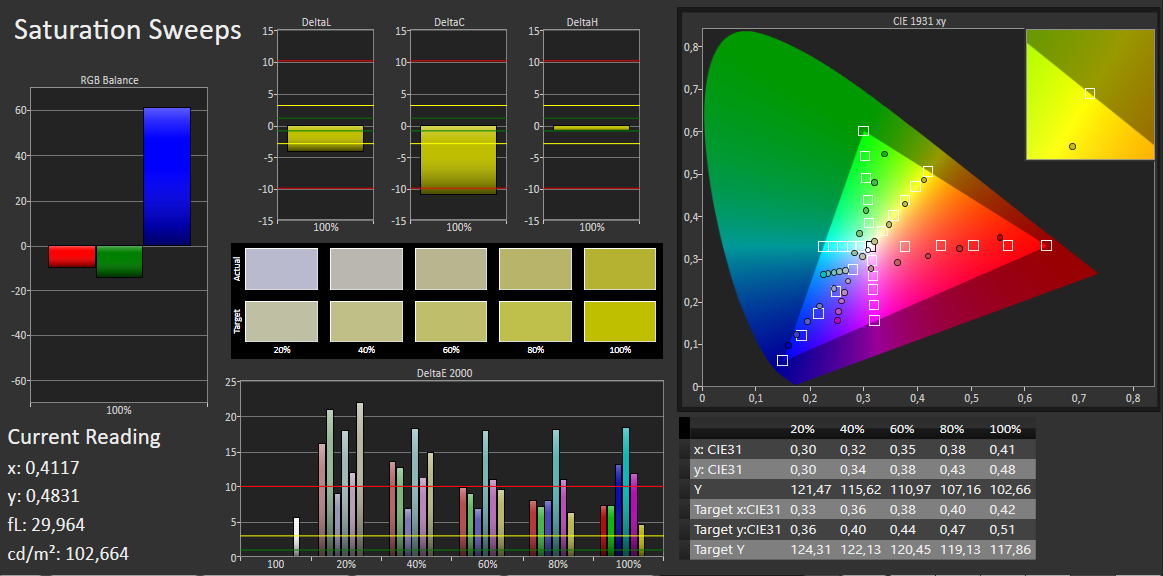
The color reproduction in the state of delivery is not convincing. The DeltaE 2000 color deviation of 10.9 is far from the target range (DeltaE less than 3). Furthermore, the screen exhibits a visible bluish tint. The panel cannot reproduce either the sRGB or the AdobeRGB color spaces. Their coverage rates are 55% (sRGB) and 35% (AdobeRGB).
The screen's color reproduction can be improved slightly with our color profile. However, it must be certain that the same screen model (manufacturer + model number) is installed as in our review sample. Otherwise, the color reproduction could become even worse. Screens from different manufacturers are often used within a laptop model lineup.
Display Response Times
| ↔ Response Time Black to White | ||
|---|---|---|
| 13 ms ... rise ↗ and fall ↘ combined | ↗ 8 ms rise | 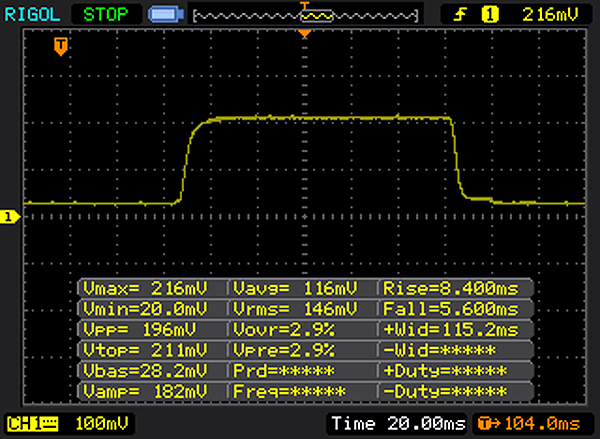 |
| ↘ 5 ms fall | ||
| The screen shows good response rates in our tests, but may be too slow for competitive gamers. In comparison, all tested devices range from 0.1 (minimum) to 240 (maximum) ms. » 33 % of all devices are better. This means that the measured response time is better than the average of all tested devices (19.9 ms). | ||
| ↔ Response Time 50% Grey to 80% Grey | ||
| 46 ms ... rise ↗ and fall ↘ combined | ↗ 24 ms rise | 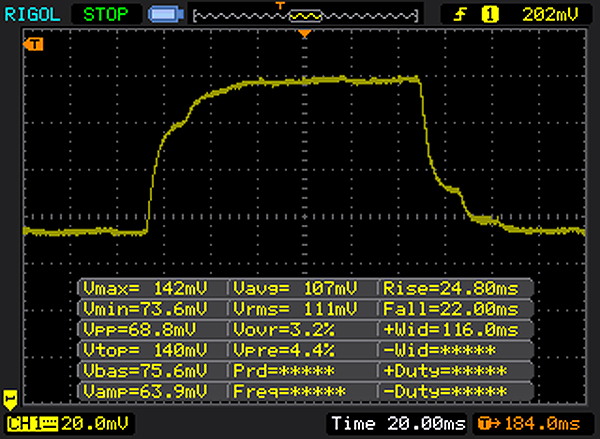 |
| ↘ 22 ms fall | ||
| The screen shows slow response rates in our tests and will be unsatisfactory for gamers. In comparison, all tested devices range from 0.165 (minimum) to 636 (maximum) ms. » 79 % of all devices are better. This means that the measured response time is worse than the average of all tested devices (31.1 ms). | ||
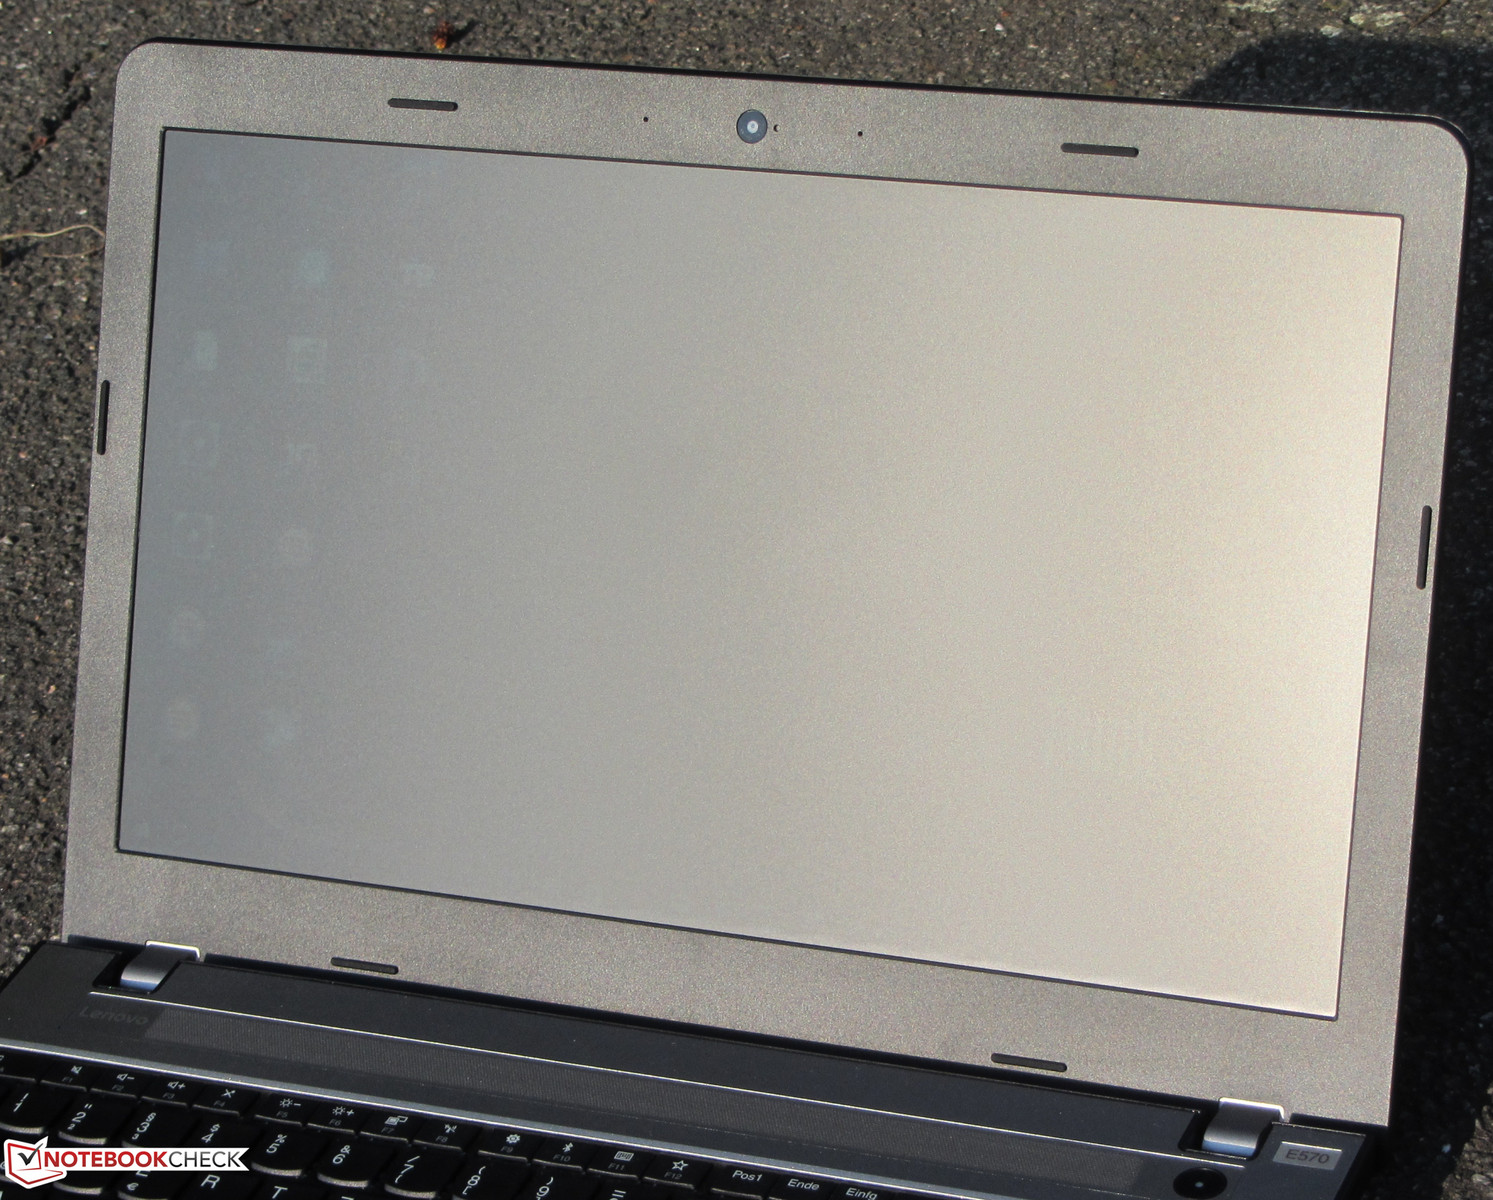
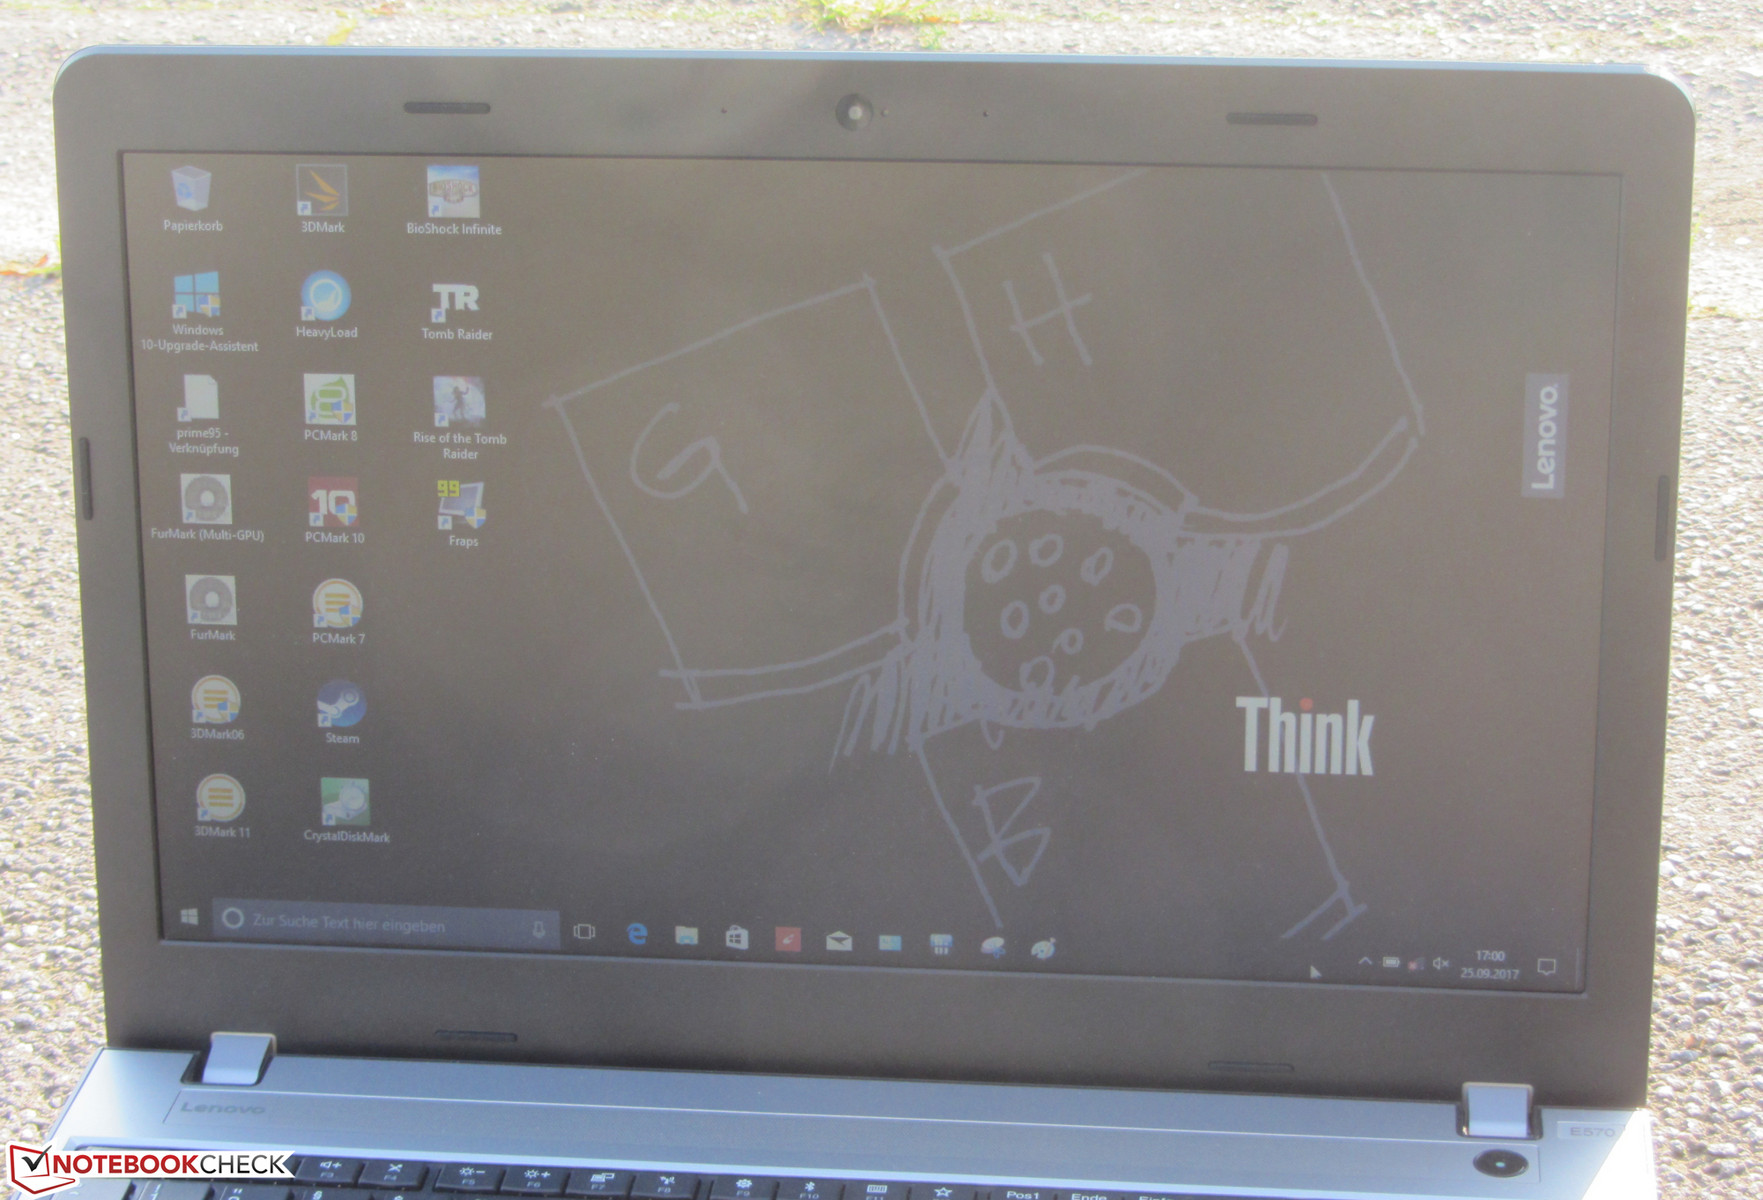
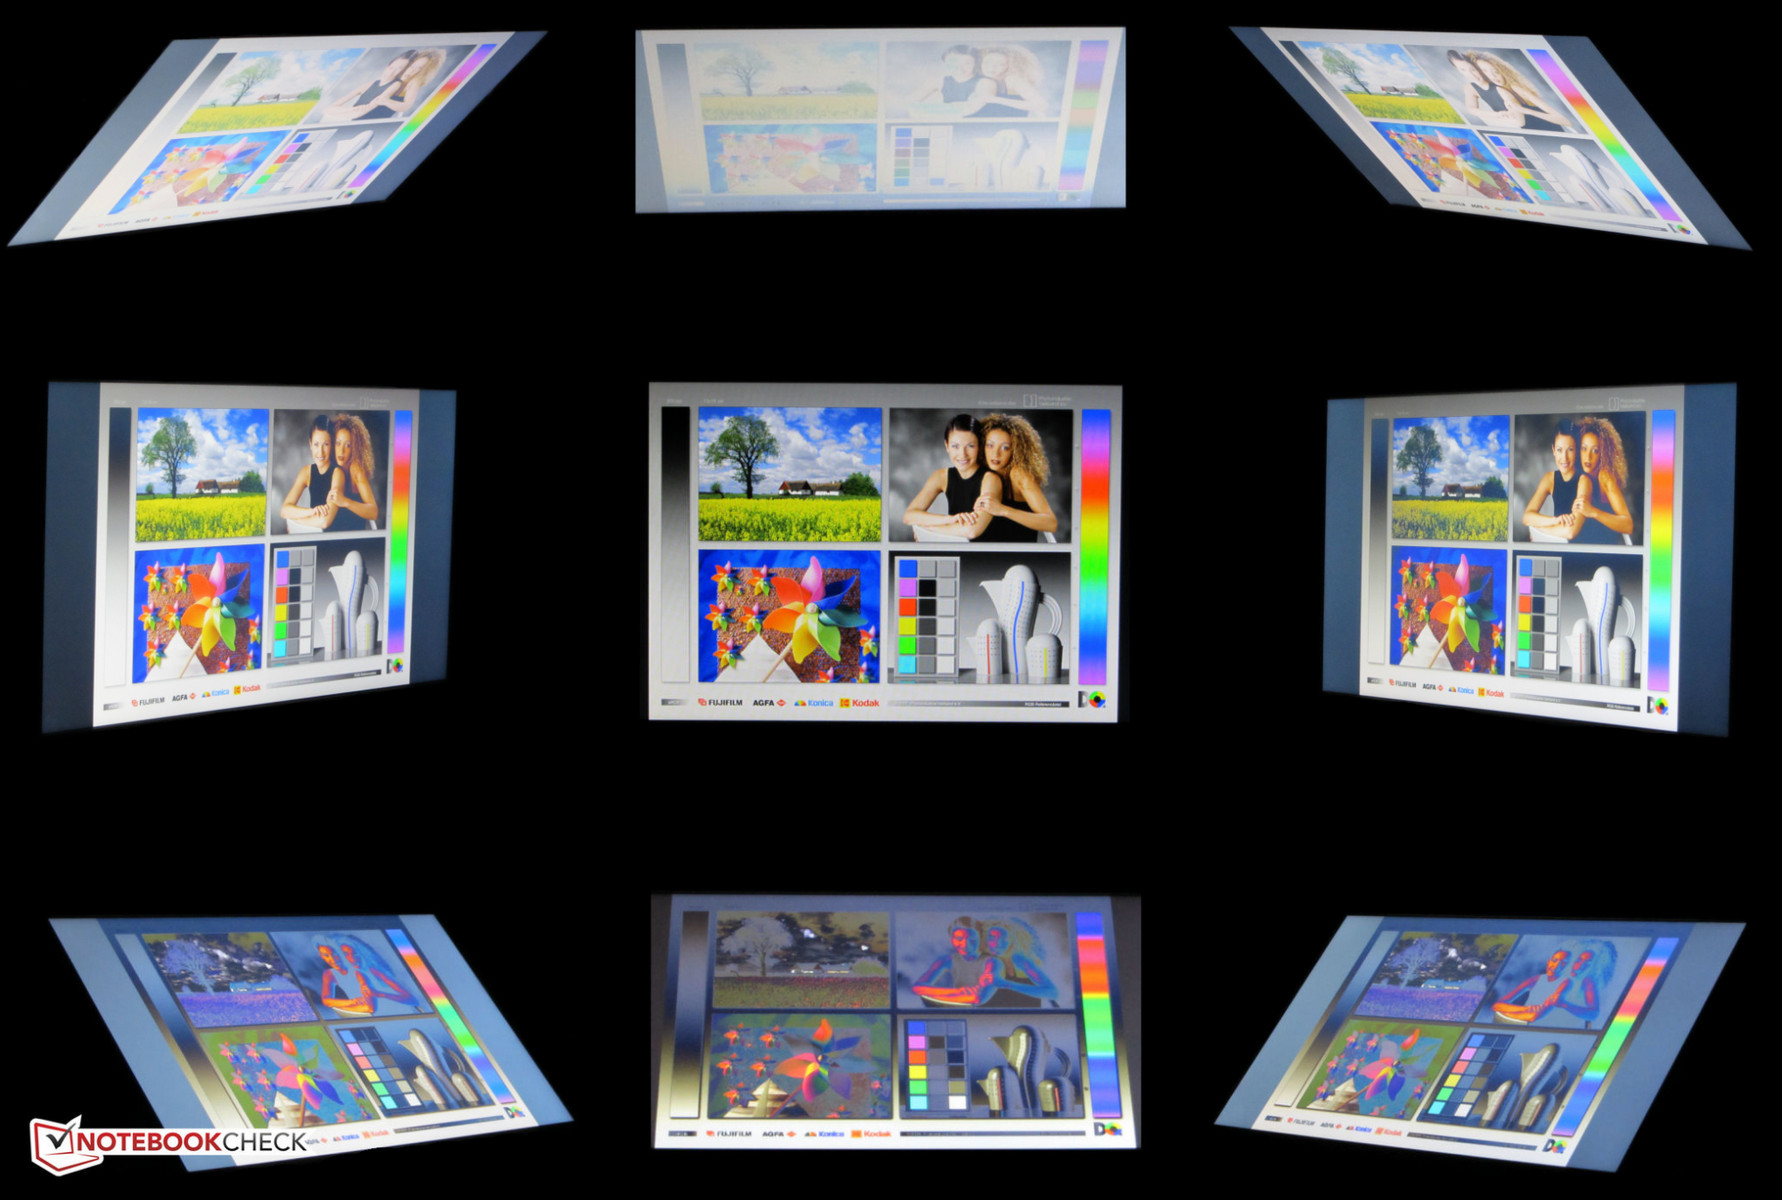
Lenovo furnishes the ThinkPad with a viewing angle dependent TN panel. Thus, the screen is not legible from every position. The laptop can at most be used in a shadowy environment outdoors. The screen's low brightness and low contrast thwart this intention otherwise.
Performance
Lenovo's ThinkPad E570 is an entry-level model in the business laptop sector. It has enough computing power for all common application scenarios. Furthermore, it has features such as TPM 2.0 and a fingerprint scanner. Lenovo has omitted the docking port (OneLink) that was still present in the previous model. We do not have a price for our review sample since an HD model of the ThinkPad was not listed in German online shops at the time of testing (~$770 in Lenovo's web store).


Processor
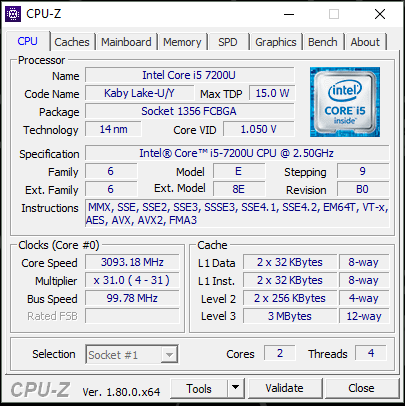
A Core i5-7200U (Kaby Lake) dual-core processor is installed into the ThinkPad. This ULV all-rounder (TDP: 15 watts) looks good in all application scenarios and should completely satisfy the needs of most users. Buying a Core i7 will not be worthwhile for most users: A considerably higher price versus a small performance gain.
The Core i5 processor clocks at a base speed of 2.5 GHz, which can be boosted up to 3.1 GHz (both cores) via Turbo. Turbo is utilized in both AC and battery mode. However, it was not completely exhausted in our Multithread tests and clocked at "only" 3 to 3.1 GHz. Consequently, the corresponding test outcomes are slightly lower than those of comparable laptops.
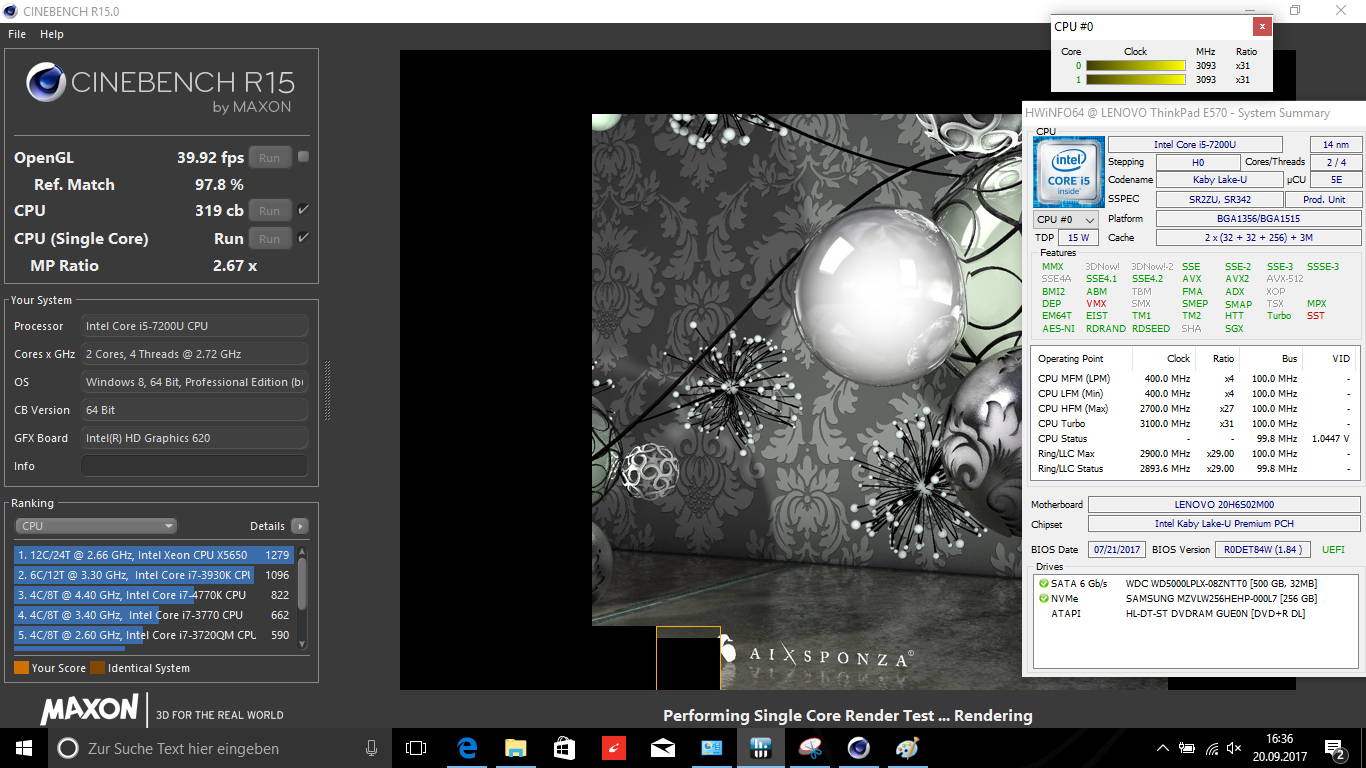
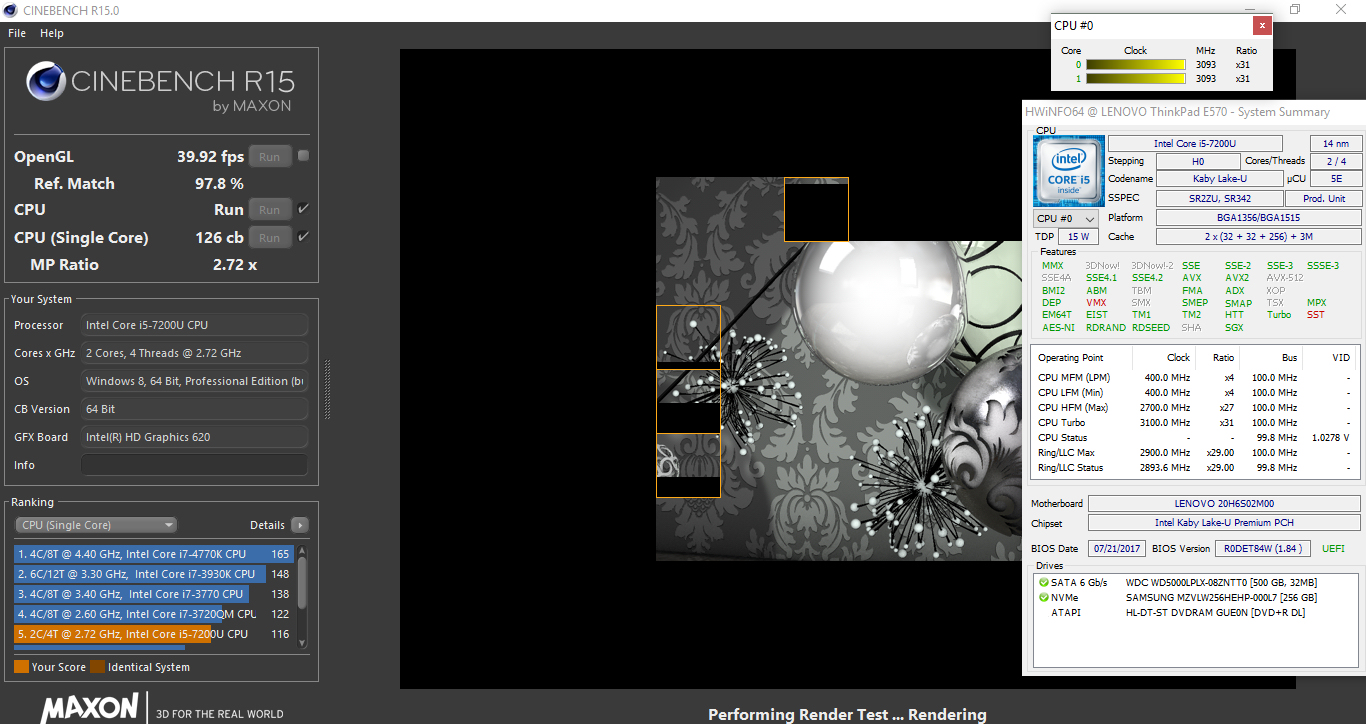
We check whether Turbo can be utilized over prolonged periods of time by looping the Cinebench R15 Multithread test for approximately 30 minutes. The ThinkPad's scores are consistently on the same level. Thus, performance is not lost.
| Cinebench R15 | |
| CPU Single 64Bit | |
| HP ProBook 450 G4 Y8B60EA | |
| Acer TravelMate P259-MG-71UU | |
| Lenovo ThinkPad E570-20H6S00000 | |
| Fujitsu LifeBook A557 PL | |
| Lenovo ThinkPad E570-20H6S02M00 | |
| Dell Latitude 15-3570 | |
| CPU Multi 64Bit | |
| HP ProBook 450 G4 Y8B60EA | |
| Lenovo ThinkPad E570-20H6S00000 | |
| Acer TravelMate P259-MG-71UU | |
| Fujitsu LifeBook A557 PL | |
| Lenovo ThinkPad E570-20H6S02M00 | |
| Dell Latitude 15-3570 | |
| Cinebench R11.5 | |
| CPU Multi 64Bit | |
| Lenovo ThinkPad E570-20H6S02M00 | |
| Acer TravelMate P259-MG-71UU | |
| CPU Single 64Bit | |
| Acer TravelMate P259-MG-71UU | |
| Lenovo ThinkPad E570-20H6S02M00 | |
| Cinebench R10 | |
| Rendering Multiple CPUs 32Bit | |
| Acer TravelMate P259-MG-71UU | |
| Lenovo ThinkPad E570-20H6S02M00 | |
| Rendering Single 32Bit | |
| Lenovo ThinkPad E570-20H6S02M00 | |
| Acer TravelMate P259-MG-71UU | |
| Geekbench 3 | |
| 32 Bit Multi-Core Score | |
| Acer TravelMate P259-MG-71UU | |
| Lenovo ThinkPad E570-20H6S02M00 | |
| 32 Bit Single-Core Score | |
| Acer TravelMate P259-MG-71UU | |
| Lenovo ThinkPad E570-20H6S02M00 | |
| Geekbench 4.0 | |
| 64 Bit Multi-Core Score | |
| Acer TravelMate P259-MG-71UU | |
| Lenovo ThinkPad E570-20H6S02M00 | |
| 64 Bit Single-Core Score | |
| Acer TravelMate P259-MG-71UU | |
| Lenovo ThinkPad E570-20H6S02M00 | |
| Geekbench 4.4 | |
| 64 Bit Multi-Core Score | |
| Lenovo ThinkPad E570-20H6S02M00 | |
| 64 Bit Single-Core Score | |
| Lenovo ThinkPad E570-20H6S02M00 | |
| JetStream 1.1 - 1.1 Total | |
| HP ProBook 450 G4 Y8B60EA | |
| Lenovo ThinkPad E570-20H6S02M00 | |
| Lenovo ThinkPad E570-20H6S00000 | |
| Acer TravelMate P259-MG-71UU | |
System Performance
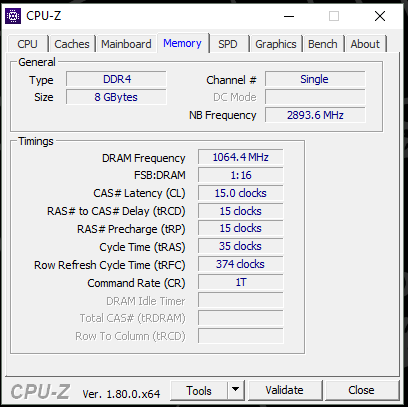
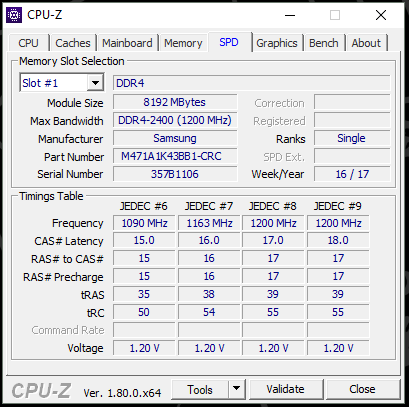
The system's performance does not give any reason for complaint. The strong hardware ensures a fast-running system. This is also reflected in the very good PCMark scores. They confirm that the laptop has more than enough computing power for office and Internet applications. It would be possible to increase the performance slightly. A second working memory module would have to be installed into the laptop for this.
| PCMark 7 Score | 5232 points | |
| PCMark 8 Home Score Accelerated v2 | 3714 points | |
| PCMark 8 Creative Score Accelerated v2 | 4456 points | |
| PCMark 8 Work Score Accelerated v2 | 4857 points | |
| PCMark 10 Score | 3235 points | |
Help | ||
Storage Devices
The system drive is a solid-state drive from Samsung. It is an NVMe model (M.2 2280) that has a total capacity of 256 GB. The SSD is connected via PCI Express. This allows much higher transfer rates than a SATA III connection. The SSD's transfer rates are superb.
The ThinkPad also houses a conventional 2.5-inch hard drive that serves as data storage. It has a storage capacity of 500 GB and spins at 7200 revolutions per minute.

| Lenovo ThinkPad E570-20H6S02M00 Samsung PM961 MZVLW256HEHP | Dell Latitude 15-3570 Samsung CM871 MZNLF128HCHP | Acer TravelMate P259-MG-71UU Liteonit CV3-8D256 | Fujitsu LifeBook A557 PL Samsung CM871a MZNTY256HDHP | Lenovo ThinkPad E570-20H6S00000 Toshiba THNSF5256GPUK | |
|---|---|---|---|---|---|
| CrystalDiskMark 3.0 | -81% | -58% | -55% | -31% | |
| Read Seq (MB/s) | 1589 | 453.2 -71% | 478.5 -70% | 520 -67% | 1140 -28% |
| Write Seq (MB/s) | 1217 | 137.7 -89% | 258.2 -79% | 337 -72% | 468.1 -62% |
| Read 512 (MB/s) | 1155 | 308.5 -73% | 254.3 -78% | 400.8 -65% | 759 -34% |
| Write 512 (MB/s) | 783 | 134.1 -83% | 264.8 -66% | 240.7 -69% | 414 -47% |
| Read 4k (MB/s) | 59.7 | 19.06 -68% | 28.32 -53% | 34.16 -43% | 34.3 -43% |
| Write 4k (MB/s) | 148.8 | 21.31 -86% | 76.3 -49% | 95.4 -36% | 123.4 -17% |
| Read 4k QD32 (MB/s) | 473.6 | 93.5 -80% | 346.2 -27% | 293.9 -38% | 530 12% |
| Write 4k QD32 (MB/s) | 428.7 | 23.3 -95% | 240.2 -44% | 225.1 -47% | 319.2 -26% |
Graphics Card
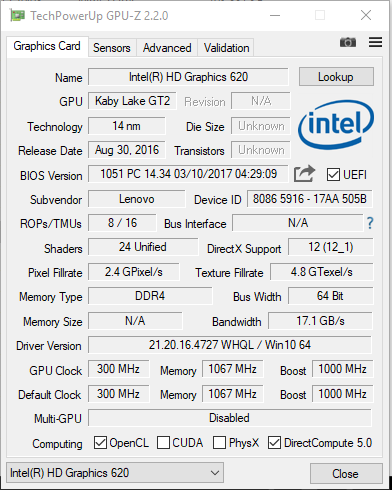
Intel's HD Graphics 620 graphics unit support DirectX 12 and clocks at speeds of up to 1000 MHz. The 3DMark benchmark scores are at a normal level for this GPU. However, more is still possible. Installing a second working memory would increase the graphics performance. Then the enabled dual-channel mode would better utilize the graphics core.
Users who want considerably more graphics power should opt for a ThinkPad model that is equipped with a GeForce GTX 950M graphics unit.
| 3DMark 11 Performance | 1518 points | |
| 3DMark Ice Storm Standard Score | 55340 points | |
| 3DMark Cloud Gate Standard Score | 5776 points | |
| 3DMark Fire Strike Score | 763 points | |
Help | ||
| 3DMark 11 - 1280x720 Performance GPU | |
| Lenovo ThinkPad E570-20H6S00000 | |
| Acer TravelMate P259-MG-71UU | |
| HP ProBook 450 G4 Y8B60EA | |
| Fujitsu LifeBook A557 PL | |
| Lenovo ThinkPad E570-20H6S02M00 | |
| Dell Latitude 15-3570 | |
| 3DMark | |
| 1280x720 Cloud Gate Standard Graphics | |
| Lenovo ThinkPad E570-20H6S00000 | |
| Acer TravelMate P259-MG-71UU | |
| HP ProBook 450 G4 Y8B60EA | |
| Lenovo ThinkPad E570-20H6S02M00 | |
| Fujitsu LifeBook A557 PL | |
| Dell Latitude 15-3570 | |
| 1920x1080 Fire Strike Graphics | |
| Lenovo ThinkPad E570-20H6S00000 | |
| Acer TravelMate P259-MG-71UU | |
| HP ProBook 450 G4 Y8B60EA | |
| Lenovo ThinkPad E570-20H6S02M00 | |
| Fujitsu LifeBook A557 PL | |
Gaming Performance
The ThinkPad's CPU-GPU combination can display some games smoothly in low resolutions and low quality settings. This is primarily true for games with low hardware requirements. Installing a second working memory module (= dual-channel mode enabled) would increase the frame rates. Performance-driven games such as “Ark Survival Evolved” will never be playable. If the laptop is not intended just for work but also for play, a ThinkPad model with a GeForce GTX 950M GPU would be more suitable.
| low | med. | high | ultra | |
|---|---|---|---|---|
| Tomb Raider (2013) | 63.6 | 33.8 | 19.2 | |
| BioShock Infinite (2013) | 41.8 | 24.5 | 20.2 | |
| Rise of the Tomb Raider (2016) | 16.7 | 10.4 |
| BioShock Infinite - 1280x720 Very Low Preset | |
| Lenovo ThinkPad E570-20H6S00000 | |
| Acer TravelMate P259-MG-71UU | |
| HP ProBook 450 G4 Y8B60EA | |
| Lenovo ThinkPad E570-20H6S02M00 | |
| Dell Latitude 15-3570 | |
Emissions
System Noise
The ThinkPad does not produce any noise over the entire load range. The fan is often inactive while idling, and only access noises on the 2.5-inch hard drive are at most audible. The fan hardly speeds up during load. We measured a maximum noise level of 31.9 dB(A). Our review sample did not produce any side noises.
Noise level
| Idle |
| 30.6 / 30.6 / 30.6 dB(A) |
| HDD |
| 31.4 dB(A) |
| DVD |
| 33.1 / dB(A) |
| Load |
| 31.8 / 31.3 dB(A) |
 | ||
30 dB silent 40 dB(A) audible 50 dB(A) loud |
||
min: | ||
| Lenovo ThinkPad E570-20H6S02M00 i5-7200U, HD Graphics 620 | Lenovo ThinkPad E570-20H6S00000 i5-7200U, GeForce GTX 950M | HP ProBook 450 G4 Y8B60EA i7-7500U, GeForce 930MX | Dell Latitude 15-3570 6200U, HD Graphics 520 | Acer TravelMate P259-MG-71UU 6500U, GeForce 940MX | Fujitsu LifeBook A557 PL i5-7200U, HD Graphics 620 | |
|---|---|---|---|---|---|---|
| Noise | -3% | -12% | -4% | -8% | -13% | |
| off / environment * (dB) | 30.6 | 29 5% | 31.6 -3% | 31 -1% | 30.5 -0% | |
| Idle Minimum * (dB) | 30.6 | 29 5% | 32.6 -7% | 31 -1% | 31.6 -3% | 30 2% |
| Idle Average * (dB) | 30.6 | 29 5% | 32.6 -7% | 31 -1% | 31.6 -3% | 32.5 -6% |
| Idle Maximum * (dB) | 30.6 | 29 5% | 33 -8% | 31 -1% | 32 -5% | 35 -14% |
| Load Average * (dB) | 31.8 | 34.3 -8% | 38.9 -22% | 34.2 -8% | 35.5 -12% | 37.5 -18% |
| Load Maximum * (dB) | 31.3 | 40.1 -28% | 38.9 -24% | 34.3 -10% | 38.3 -22% | 40.3 -29% |
* ... smaller is better
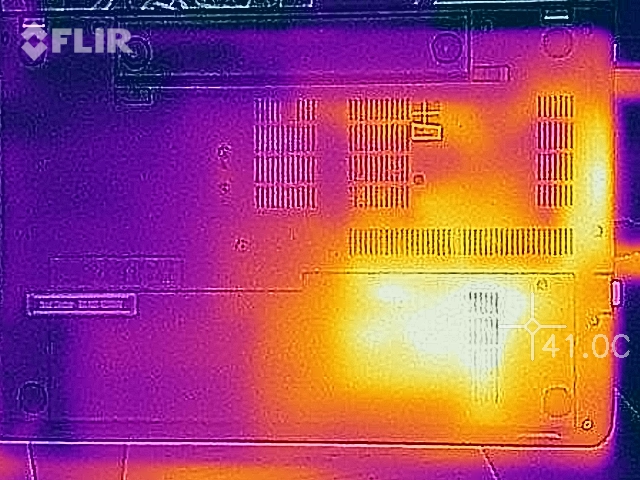
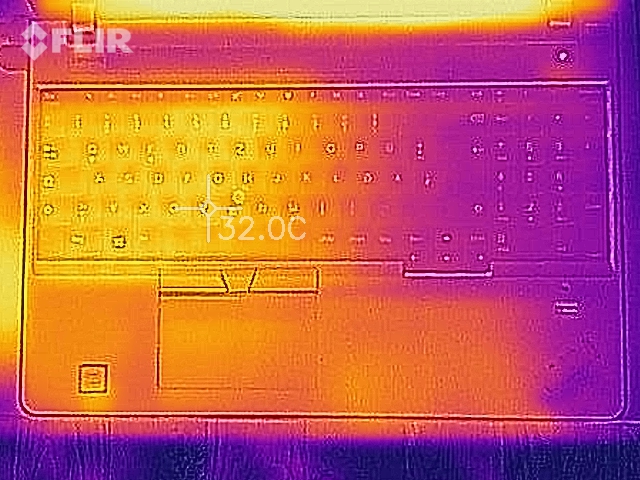
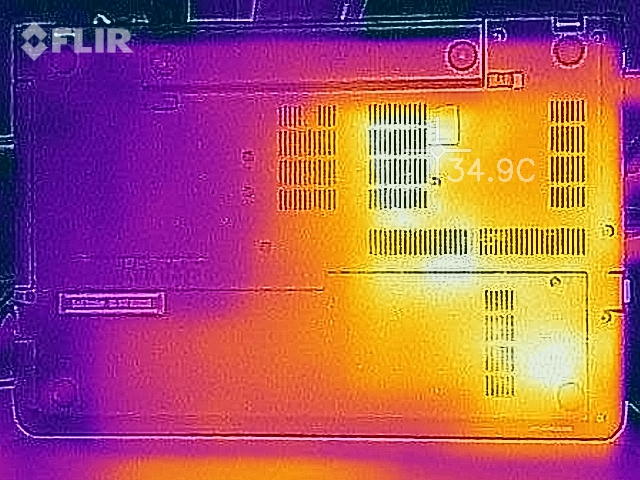
Temperature
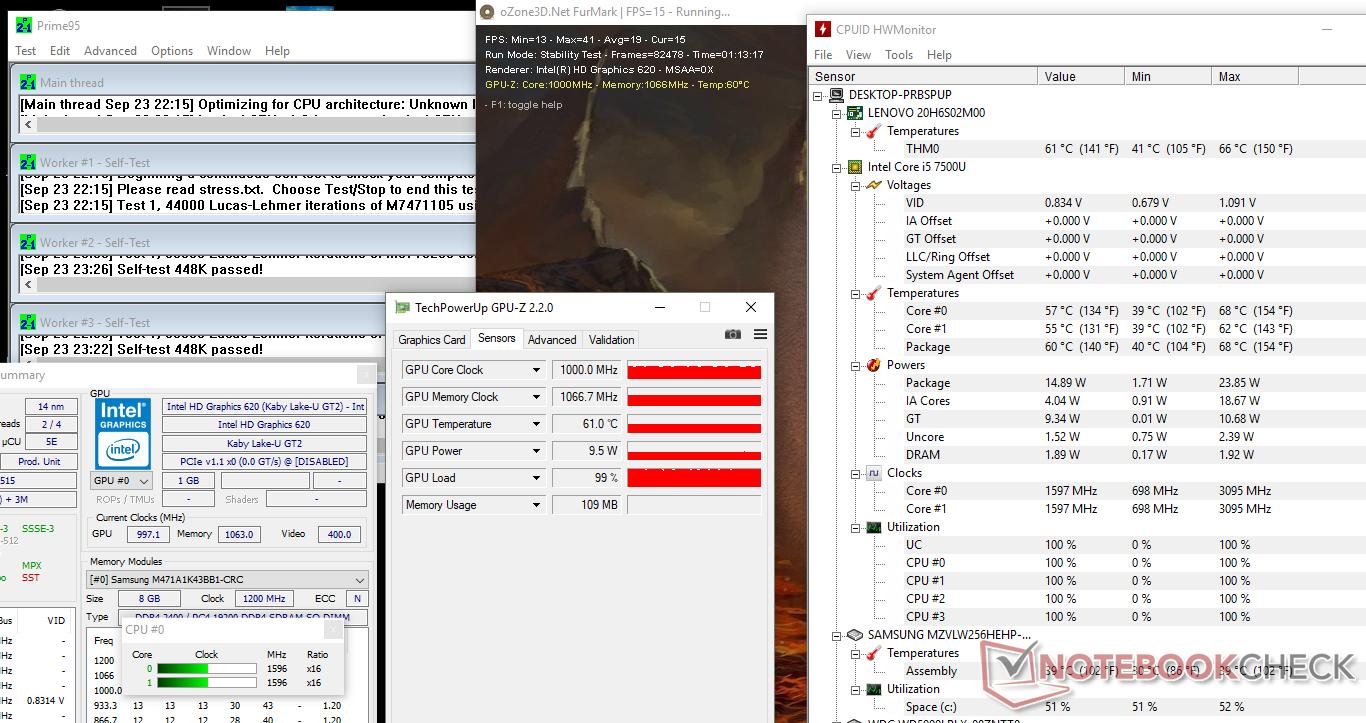
The ThinkPad performed our stress test (Prime95 and FurMark run for at least one hour) in the same manner in both AC and battery mode. The processor clocks at 1.5 to 1.7 GHz. The graphics unit fluctuates from 900 to 1000 MHz.
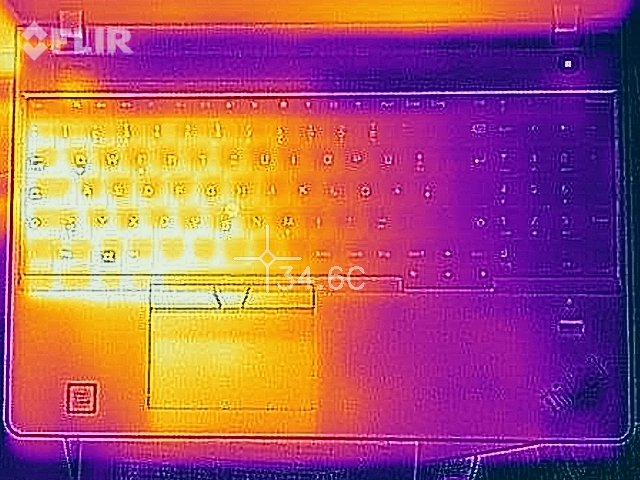
The laptop does not heat up excessively. The temperatures remained below 40 degrees Celsius (~104 degrees Fahrenheit) on all measuring points during the stress test.
(+) The maximum temperature on the upper side is 33.2 °C / 92 F, compared to the average of 34.3 °C / 94 F, ranging from 21.2 to 62.5 °C for the class Office.
(+) The bottom heats up to a maximum of 39.4 °C / 103 F, compared to the average of 36.8 °C / 98 F
(+) In idle usage, the average temperature for the upper side is 24.7 °C / 76 F, compared to the device average of 29.5 °C / 85 F.
(+) The palmrests and touchpad are reaching skin temperature as a maximum (32.1 °C / 89.8 F) and are therefore not hot.
(-) The average temperature of the palmrest area of similar devices was 27.5 °C / 81.5 F (-4.6 °C / -8.3 F).
| Lenovo ThinkPad E570-20H6S02M00 i5-7200U, HD Graphics 620 | Lenovo ThinkPad E570-20H6S00000 i5-7200U, GeForce GTX 950M | HP ProBook 450 G4 Y8B60EA i7-7500U, GeForce 930MX | Dell Latitude 15-3570 6200U, HD Graphics 520 | Acer TravelMate P259-MG-71UU 6500U, GeForce 940MX | Fujitsu LifeBook A557 PL i5-7200U, HD Graphics 620 | |
|---|---|---|---|---|---|---|
| Heat | -13% | -15% | -17% | -7% | 1% | |
| Maximum Upper Side * (°C) | 33.2 | 46.6 -40% | 44.3 -33% | 36.1 -9% | 35.1 -6% | 34.8 -5% |
| Maximum Bottom * (°C) | 39.4 | 49.1 -25% | 46.3 -18% | 47 -19% | 46.7 -19% | 38.1 3% |
| Idle Upper Side * (°C) | 25.9 | 24.6 5% | 27.8 -7% | 31.7 -22% | 27 -4% | 25.9 -0% |
| Idle Bottom * (°C) | 27.8 | 25.1 10% | 27.7 -0% | 32.9 -18% | 27.4 1% | 26.6 4% |
* ... smaller is better
Speakers
Lenovo ThinkPad E570-20H6S02M00 audio analysis
(-) | not very loud speakers (71.4 dB)
Bass 100 - 315 Hz
(-) | nearly no bass - on average 17.1% lower than median
(±) | linearity of bass is average (10.9% delta to prev. frequency)
Mids 400 - 2000 Hz
(+) | balanced mids - only 3.9% away from median
(±) | linearity of mids is average (8.2% delta to prev. frequency)
Highs 2 - 16 kHz
(+) | balanced highs - only 3.4% away from median
(±) | linearity of highs is average (7% delta to prev. frequency)
Overall 100 - 16.000 Hz
(±) | linearity of overall sound is average (20.3% difference to median)
Compared to same class
» 44% of all tested devices in this class were better, 10% similar, 46% worse
» The best had a delta of 7%, average was 21%, worst was 53%
Compared to all devices tested
» 53% of all tested devices were better, 8% similar, 39% worse
» The best had a delta of 4%, average was 24%, worst was 134%
Apple MacBook 12 (Early 2016) 1.1 GHz audio analysis
(+) | speakers can play relatively loud (83.6 dB)
Bass 100 - 315 Hz
(±) | reduced bass - on average 11.3% lower than median
(±) | linearity of bass is average (14.2% delta to prev. frequency)
Mids 400 - 2000 Hz
(+) | balanced mids - only 2.4% away from median
(+) | mids are linear (5.5% delta to prev. frequency)
Highs 2 - 16 kHz
(+) | balanced highs - only 2% away from median
(+) | highs are linear (4.5% delta to prev. frequency)
Overall 100 - 16.000 Hz
(+) | overall sound is linear (10.2% difference to median)
Compared to same class
» 7% of all tested devices in this class were better, 2% similar, 91% worse
» The best had a delta of 5%, average was 18%, worst was 53%
Compared to all devices tested
» 5% of all tested devices were better, 1% similar, 94% worse
» The best had a delta of 4%, average was 24%, worst was 134%
Frequency diagram comparison (checkboxes above can be turned on/off!)
Energy Management
Power Consumption
The ThinkPad is satisfied with little power. We measured a maximum idle power consumption of 6.6 watts. Thus, it is on par with its Full HD sister model. The requirement climbed to 29.4 watts during the stress test. This rate would be higher if the CPU clocked at full speed. The 45-watt power supply is never pushed to its limits.
| Off / Standby | |
| Idle | |
| Load |
|
Key:
min: | |
| Lenovo ThinkPad E570-20H6S02M00 i5-7200U, HD Graphics 620 | Lenovo ThinkPad E570-20H6S00000 i5-7200U, GeForce GTX 950M | HP ProBook 450 G4 Y8B60EA i7-7500U, GeForce 930MX | Dell Latitude 15-3570 6200U, HD Graphics 520 | Acer TravelMate P259-MG-71UU 6500U, GeForce 940MX | Fujitsu LifeBook A557 PL i5-7200U, HD Graphics 620 | |
|---|---|---|---|---|---|---|
| Power Consumption | -45% | -40% | -18% | -71% | -44% | |
| Idle Minimum * (Watt) | 2.9 | 2.8 3% | 3.8 -31% | 4.9 -69% | 7 -141% | 6.3 -117% |
| Idle Average * (Watt) | 5.8 | 6.3 -9% | 6.6 -14% | 7.2 -24% | 8 -38% | 8.1 -40% |
| Idle Maximum * (Watt) | 6.6 | 6.9 -5% | 11.3 -71% | 7.5 -14% | 10.6 -61% | 12.7 -92% |
| Load Average * (Watt) | 29 | 51.6 -78% | 38 -31% | 25.4 12% | 39.7 -37% | 20.7 29% |
| Load Maximum * (Watt) | 29.4 | 69.7 -137% | 45 -53% | 28 5% | 51.9 -77% | 28.9 2% |
* ... smaller is better
Battery Runtime
The ThinkPad achieved a runtime of 7:10 hours on one charged battery in our practical Wi-Fi test. We simulate the load needed for opening websites via a script. The "Balanced" profile is enabled, the energy-saving features are disabled, and the screen's brightness is set to approximately 150 cd/m². We loop the short movie Big Buck Bunny (H.264 encoding, 1920x1080 pixels) to determine the video playback time. The wireless modules and energy-saving features are disabled, and the screen is dimmed to 150 cd/m². The E570 stopped the video test after 6:27 hours.
Our current review sample is equipped with the same 41-Wh battery that is in the previously tested Full HD model. However, the laptop usually lags behind the runtimes of the Full HD model. The latter is only defeated in the maximum runtime.
| Lenovo ThinkPad E570-20H6S02M00 i5-7200U, HD Graphics 620, 42 Wh | Lenovo ThinkPad E570-20H6S00000 i5-7200U, GeForce GTX 950M, 41 Wh | HP ProBook 450 G4 Y8B60EA i7-7500U, GeForce 930MX, 45 Wh | Dell Latitude 15-3570 6200U, HD Graphics 520, 65 Wh | Acer TravelMate P259-MG-71UU 6500U, GeForce 940MX, 41 Wh | Fujitsu LifeBook A557 PL i5-7200U, HD Graphics 620, 49 Wh | |
|---|---|---|---|---|---|---|
| Battery runtime | 9% | 6% | 27% | -40% | -10% | |
| Reader / Idle (h) | 18.1 | 14.7 -19% | 12.4 -31% | 17.1 -6% | 10.3 -43% | 16.3 -10% |
| H.264 (h) | 6.5 | 4.1 -37% | ||||
| WiFi v1.3 (h) | 7.2 | 7.7 7% | 8.6 19% | 9 25% | 4.7 -35% | |
| Load (h) | 1.6 | 2.2 38% | 2.1 31% | 2.6 63% | 0.9 -44% | |
| WiFi (h) | 7.4 |
Verdict
Pros
Cons
The ThinkPad comes with a Core i5 processor from the Kaby Lake generation, which has more than enough power for office and Internet applications. The laptop runs quietly over the entire load range and hardly heats up.
A fast NVMe SSD ensures a fast-running system. A 500 GB hard drive in the 2.5-inch format provides additional storage. Both drives can be replaced easily thanks to a large maintenance hatch. Like its predecessor, the ThinkPad E570 also comes with a good keyboard. And the battery life is superb.
Lenovo has made the wrong decision in terms of screen. We recommend the IPS FHD model.
As well as the color reproduction inaccuracy and the lack of a dedicated graphics unit, the main difference between our review sample and the previously tested E570 model is the screen. Lenovo has installed an HD panel that is not convincing. It is dark, viewing angle dependent, and exhibits PWM flickering. Users who are interested in the ThinkPad should definitely opt for an IPS FHD model.
As well as the screen, there are more things that have to be criticized about the ThinkPad. The E570's casing is not particularly robust. This is a step backwards compared with the predecessor. Another backward step is the omission of the docking port (OneLink). Existing OneLink docking stations cannot be used and will have to be replaced with USB models when required. The batteries of the ThinkPad E560 cannot be used either. Furthermore, Lenovo only includes a one-year warranty on the laptop.
Lenovo ThinkPad E570-20H6S02M00
- 10/02/2017 v6 (old)
Sascha Mölck
Price comparison
