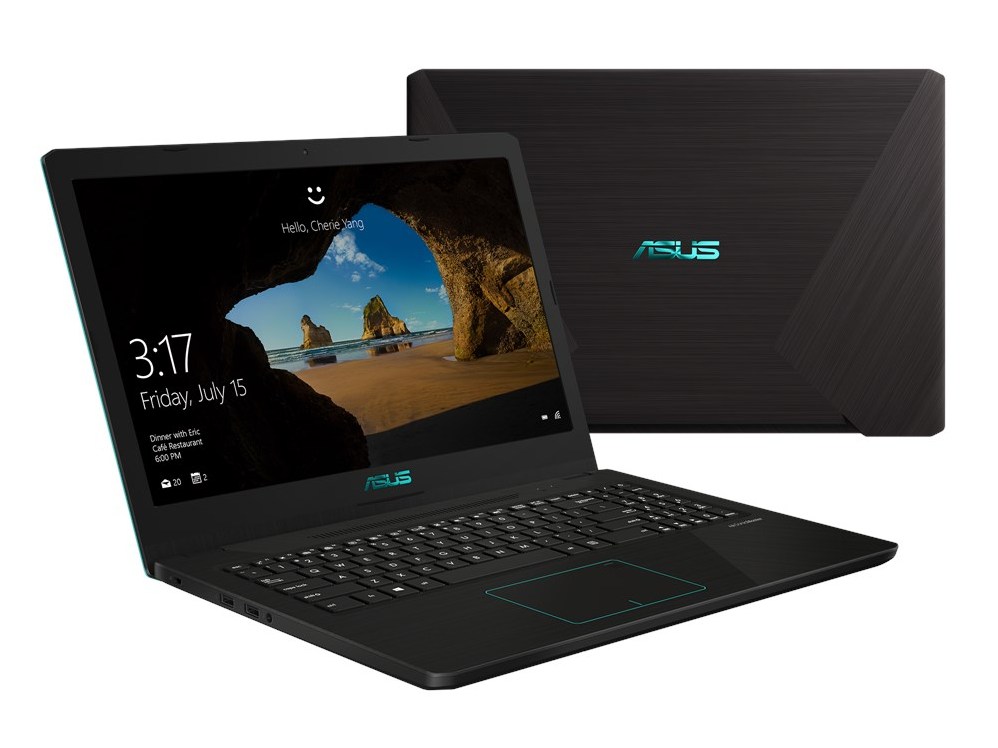
Asus VivoBook 15 K570UD (i7-8550U, GTX 1050) Laptop Review
Unlike the premium Zenbook series or gaming-centric ROG series, the affordable Vivobook series appeals to multimedia users on tighter budgets not unlike the Dell Inspiron, HP Pavilion, Lenovo Ideapad, or Acer Aspire. The latest Vivobook is the X570UD that combines an 8th gen Intel U-class CPU with a GeForce GTX 1050 GPU for about $1000 USD.
Current SKUs include the i5-8250U or i7-8550U with FHD or 4K UHD panels, HDD and SSD storage options, and 4 GB to 32 GB of DDR4 RAM. Direct competitors are numerous in the 15.6-inch category such as the MSI GL63, HP Envy 15, Dell G5, Lenovo Ideapad 720, Gigabyte Sabre 15, and Asus' own TUF FX504 series.
Depending on the region, this model may be listed as the Vivobook X570UD or Vivobook K570UD.
Case
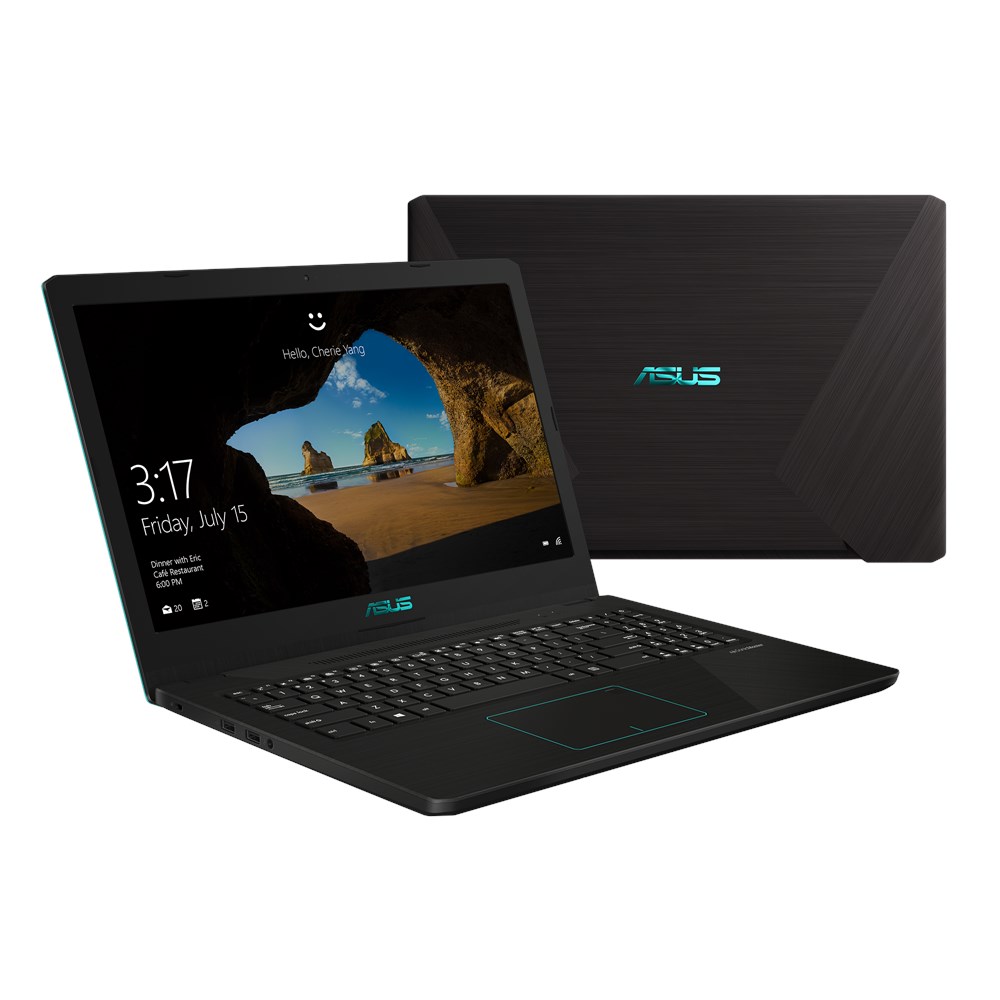
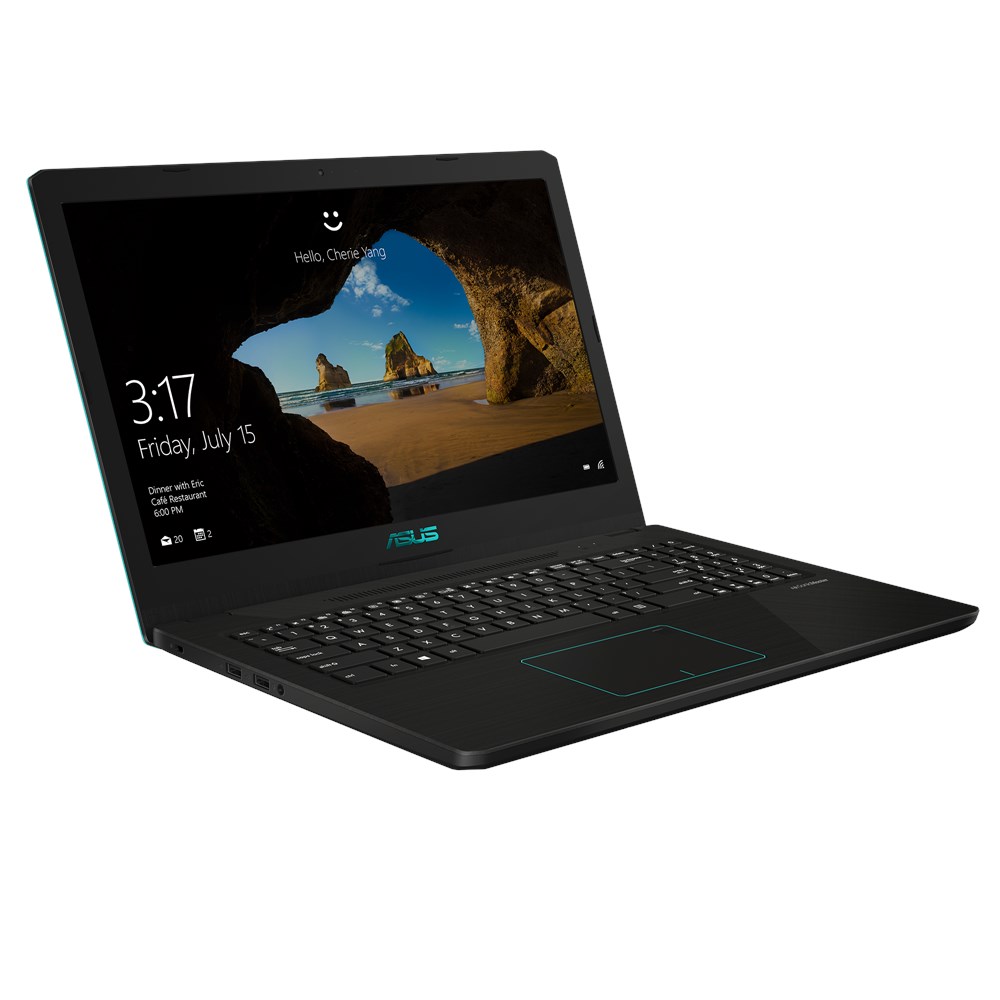
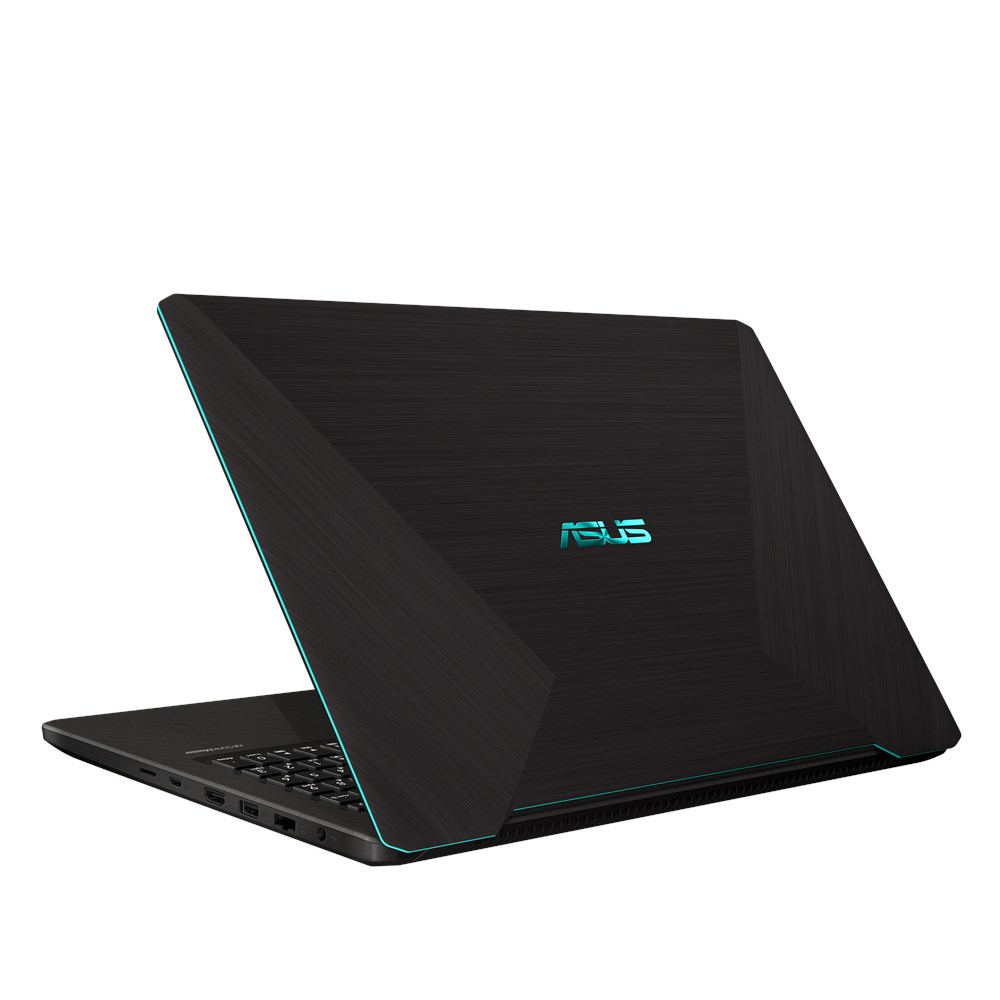
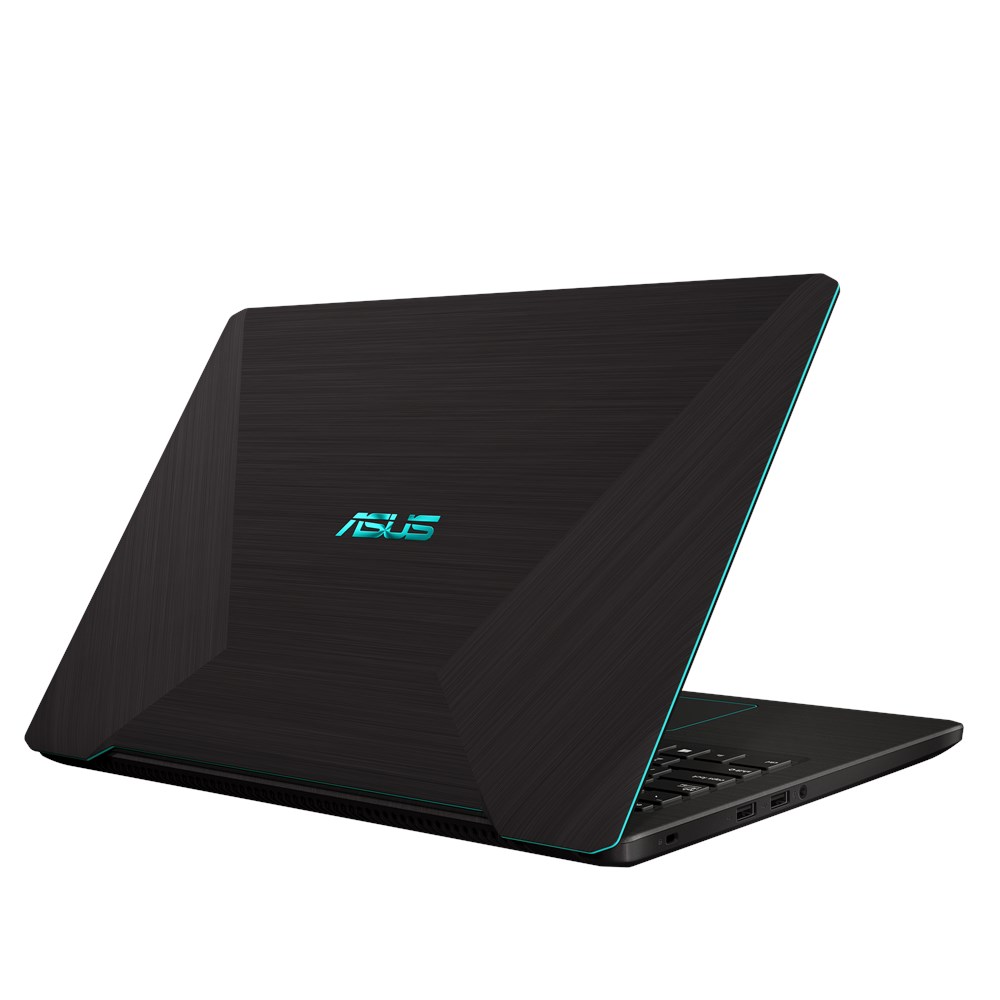
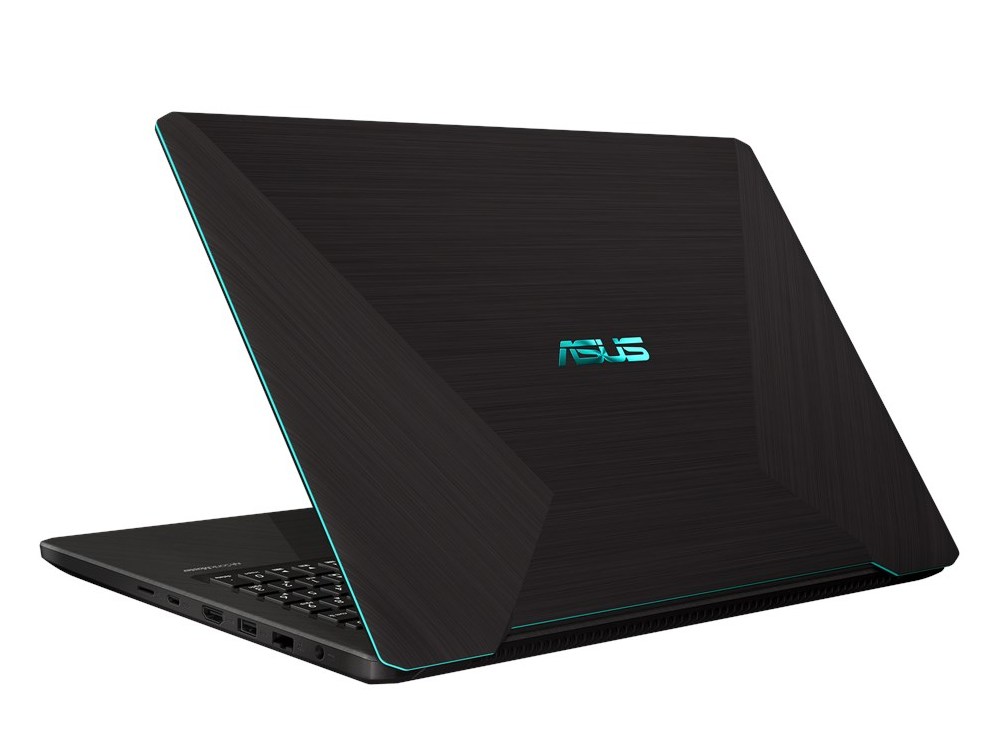
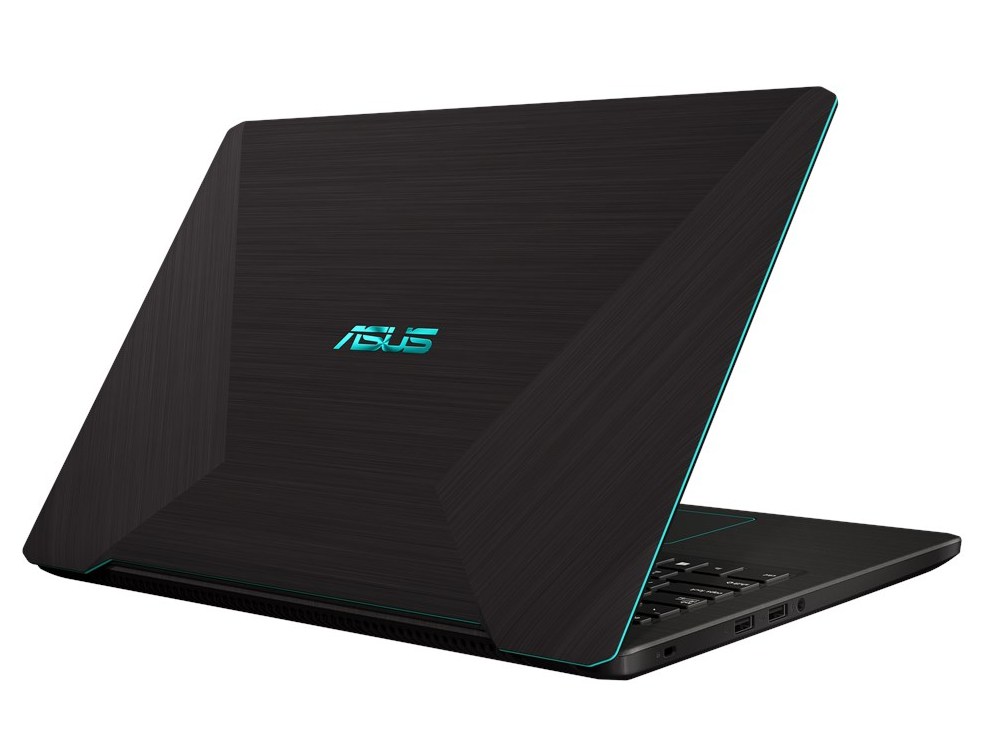
The chassis design is a derivative of the higher-end Zephyrus series. The rear ventilation grilles and sharp corners along the lid are reminiscent to the pricier ROG GX501 or GU501 series. For our Vivobook, however, expect plastic from top to bottom for a budget impression more in line with what one would expect from a Pavilion 15 or Ideapad 530 series. Both the base and hinges are sufficiently rigid while the lid is more susceptible to warping from its corners and down the center. The "Lightning Blue" accent marks along the perimeter is a nice visual touch to help distinguish the Vivobook from the more powerful red and orange ROG alternatives.
Build quality is excellent with no creaking or unintended gaps between materials. The rough faux brushed aluminum surfaces help in hiding fingerprints and scratches.
The Vivobook is relatively small and light for a 15-inch notebook with GTX 1050 graphics. Competing systems like the Legion Y520 and Gigabyte Sabre 15G are thicker and a few hundred grams heavier without necessarily being any faster.
Connectivity
Ports are easy to reach and evenly distributed along the left and right edges. It's interesting to see a MicroSD reader instead of a full-size SD reader given the screen size, though it's certainly better than having no card reader at all. Note that native 4k60 output is not possible because of the lack of both HDMI 2.0 and mini-DisplayPort features.
SD Card Reader
Average transfer rates from the MicroSD reader are about 80 MB/s when using our Toshiba UHS-II test card. It's important to note that the card reader is not spring-loaded and a fully inserted card will still protrude by about 2 mm. Bending is a possibility if the card is not removed before transporting.
| SD Card Reader | |
| average JPG Copy Test (av. of 3 runs) | |
| Dell XPS 15 2018 i5 FHD 97Wh | |
| Gigabyte Sabre 15G (Toshiba Exceria Pro SDXC 64 GB UHS-II) | |
| Asus VivoBook 15 X570UD (Toshiba Exceria Pro M501 UHS-II) | |
| Lenovo Legion Y520-15IKBA-80WY001VGE (Toshiba Exceria Pro SDXC 64 GB UHS-II) | |
| maximum AS SSD Seq Read Test (1GB) | |
| Dell XPS 15 2018 i5 FHD 97Wh | |
| Gigabyte Sabre 15G (Toshiba Exceria Pro SDXC 64 GB UHS-II) | |
| Asus VivoBook 15 X570UD (Toshiba Exceria Pro M501 UHS-II) | |
| Lenovo Legion Y520-15IKBA-80WY001VGE (Toshiba Exceria Pro SDXC 64 GB UHS-II) | |
Communication
We experienced no issues with the wireless when connected to an 802.11ac network. More info on the Realtek RTL8822BE can be found here.
| Networking | |
| iperf3 transmit AX12 | |
| Asus VivoBook 15 X570UD | |
| Dell G5 15 5587 | |
| Dell XPS 15 2018 i5 FHD 97Wh | |
| Gigabyte Sabre 15G | |
| iperf3 receive AX12 | |
| Asus VivoBook 15 X570UD | |
| Dell XPS 15 2018 i5 FHD 97Wh | |
| Dell G5 15 5587 | |
| Gigabyte Sabre 15G | |
Maintenance
The bottom panel is secured by a set of 11 Philips screws. Unfortunately, The X570UD is designed in such a way that some motherboard components are also attached to the bottom panel with multiple ribbon cables connecting the panel to the rest of the laptop. Serviceability is not easy because the fragile cables must be detached and then reattached with additional tools.
The poor serviceability is a shame since there are 2x expandabile SODIMM slots and 2x storage bays available.
Warranty
The standard one-year limited manufacturer warranty applies when purchased in North America. Please see our Guarantees, Return policies and Warranties FAQ for country-specific information.
Input Devices
Keyboard and Touchpad
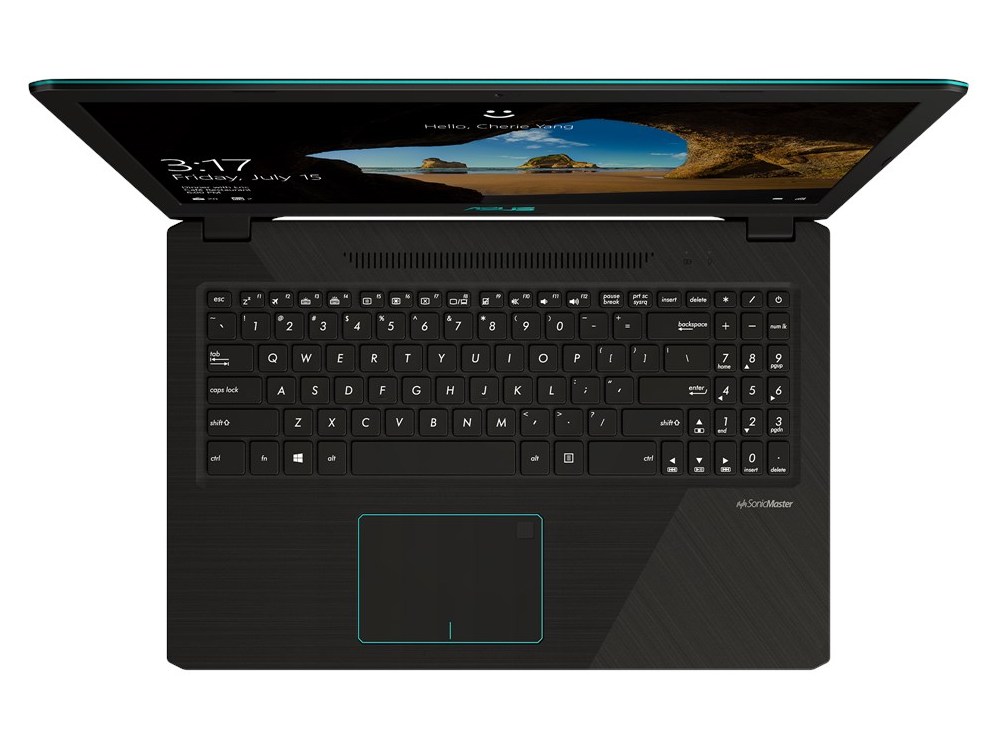
The keyboard could have been better in terms of feedback. Keys are light, shallow in travel, and have a cheap plastic impression. The Space and Enter keys in particular are spongy and could have been firmer.
The integrated NumPad is very small and far too cramped for comfortable use. We would have preferred omitting it altogether in return for a better overall typing experience on the main QWERTY keys.
The smooth plastic trackpad (10.5 x 7.5 cm) feels very similar to the ones found on the FX503 or FX504. Glide is uniform when moving at moderate speeds while the finger tends to stick when moving more slowly. Unlike the rest of the notebook, the matte surface is more susceptible to grease buildup over time. Performing mouse clicks on the integrated keys is on the spongy side as well.
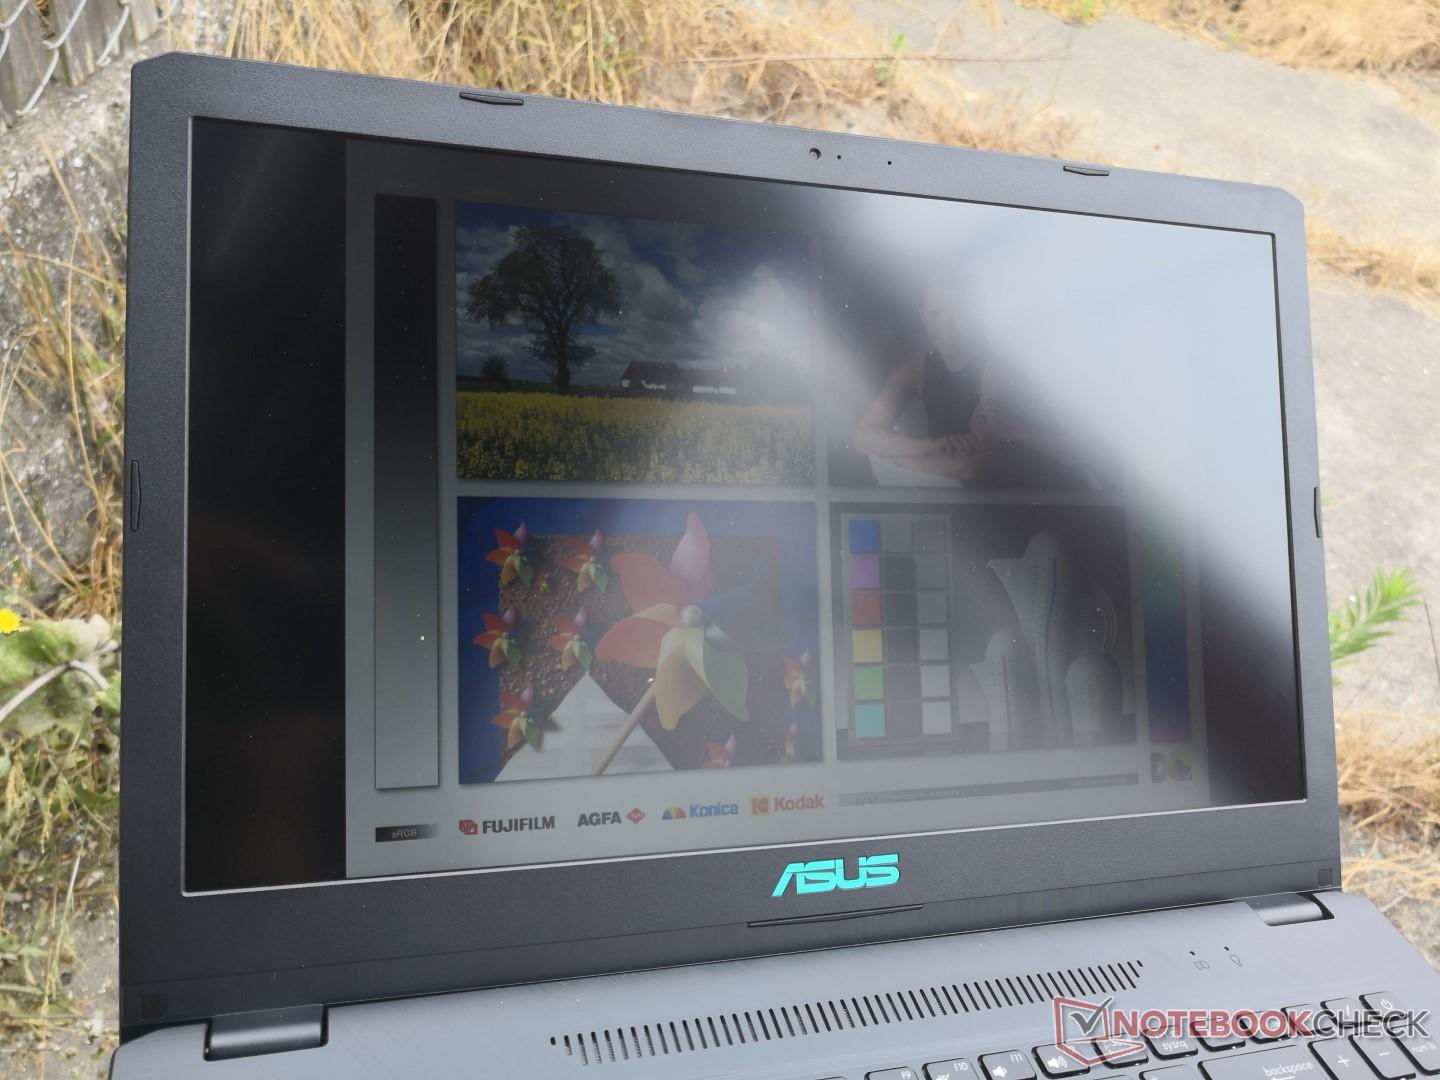
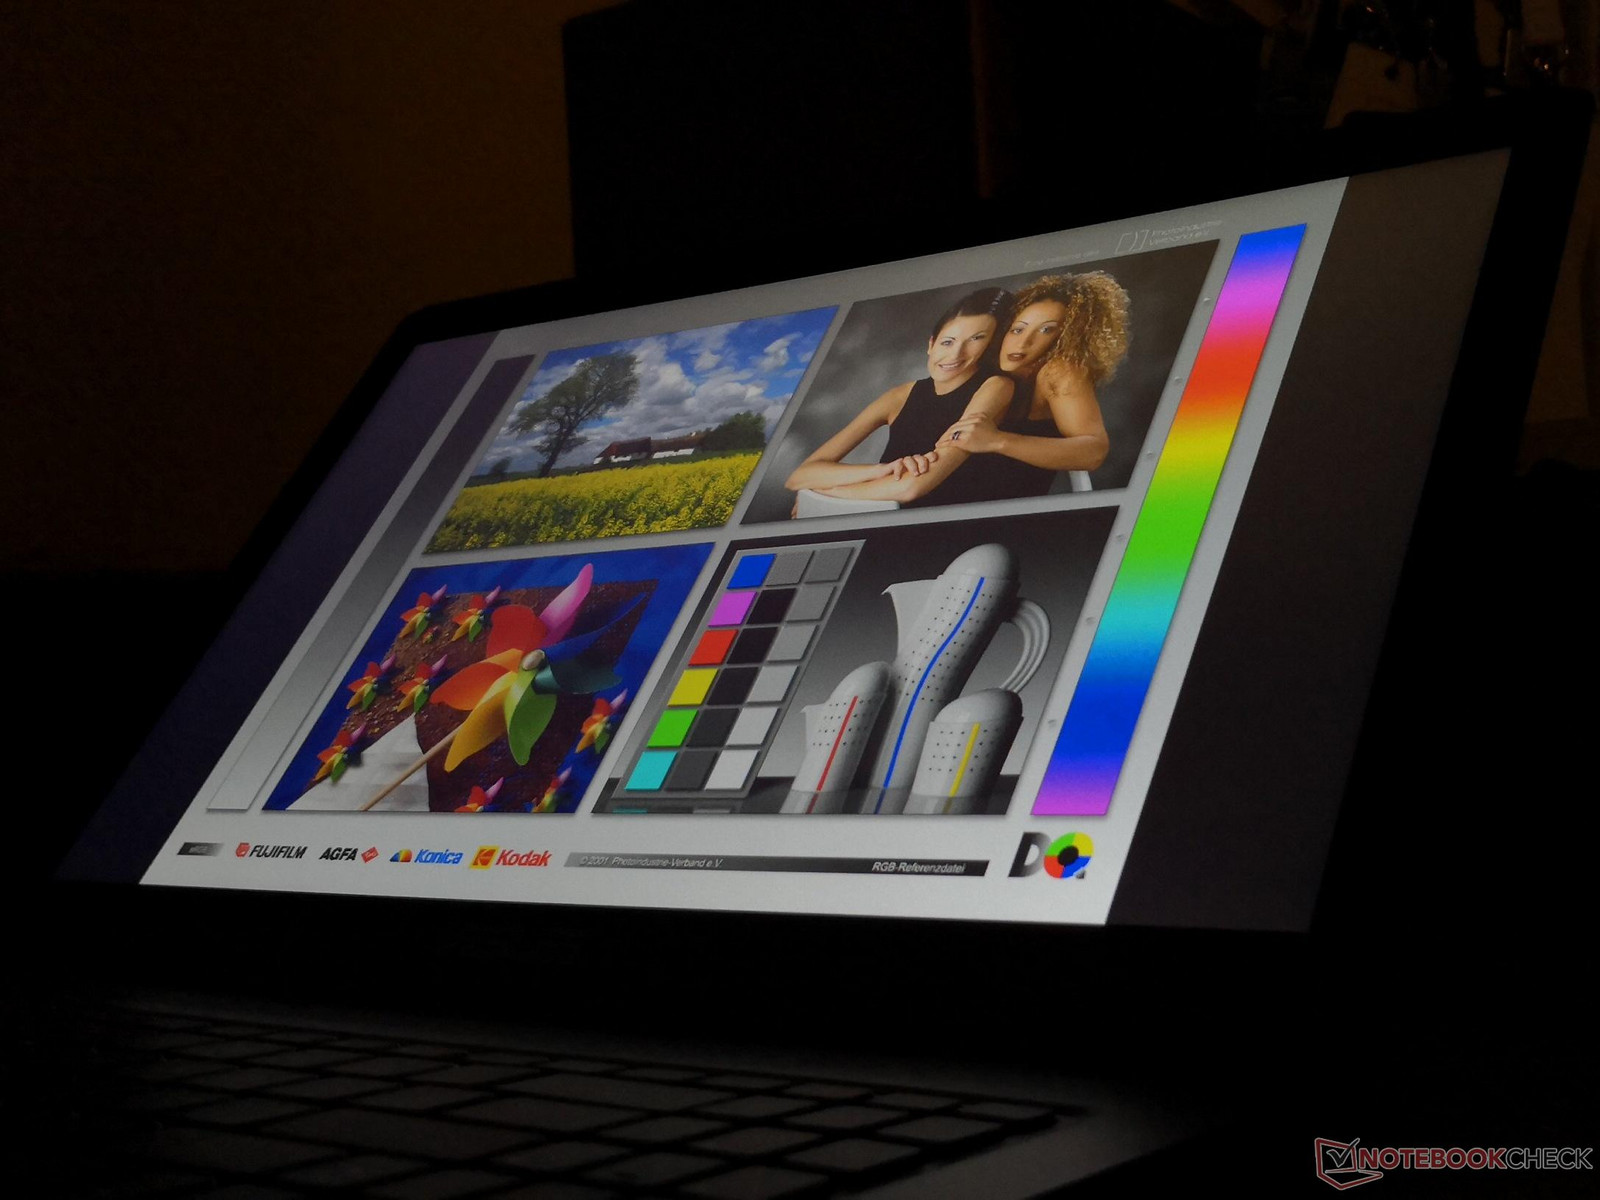
Display
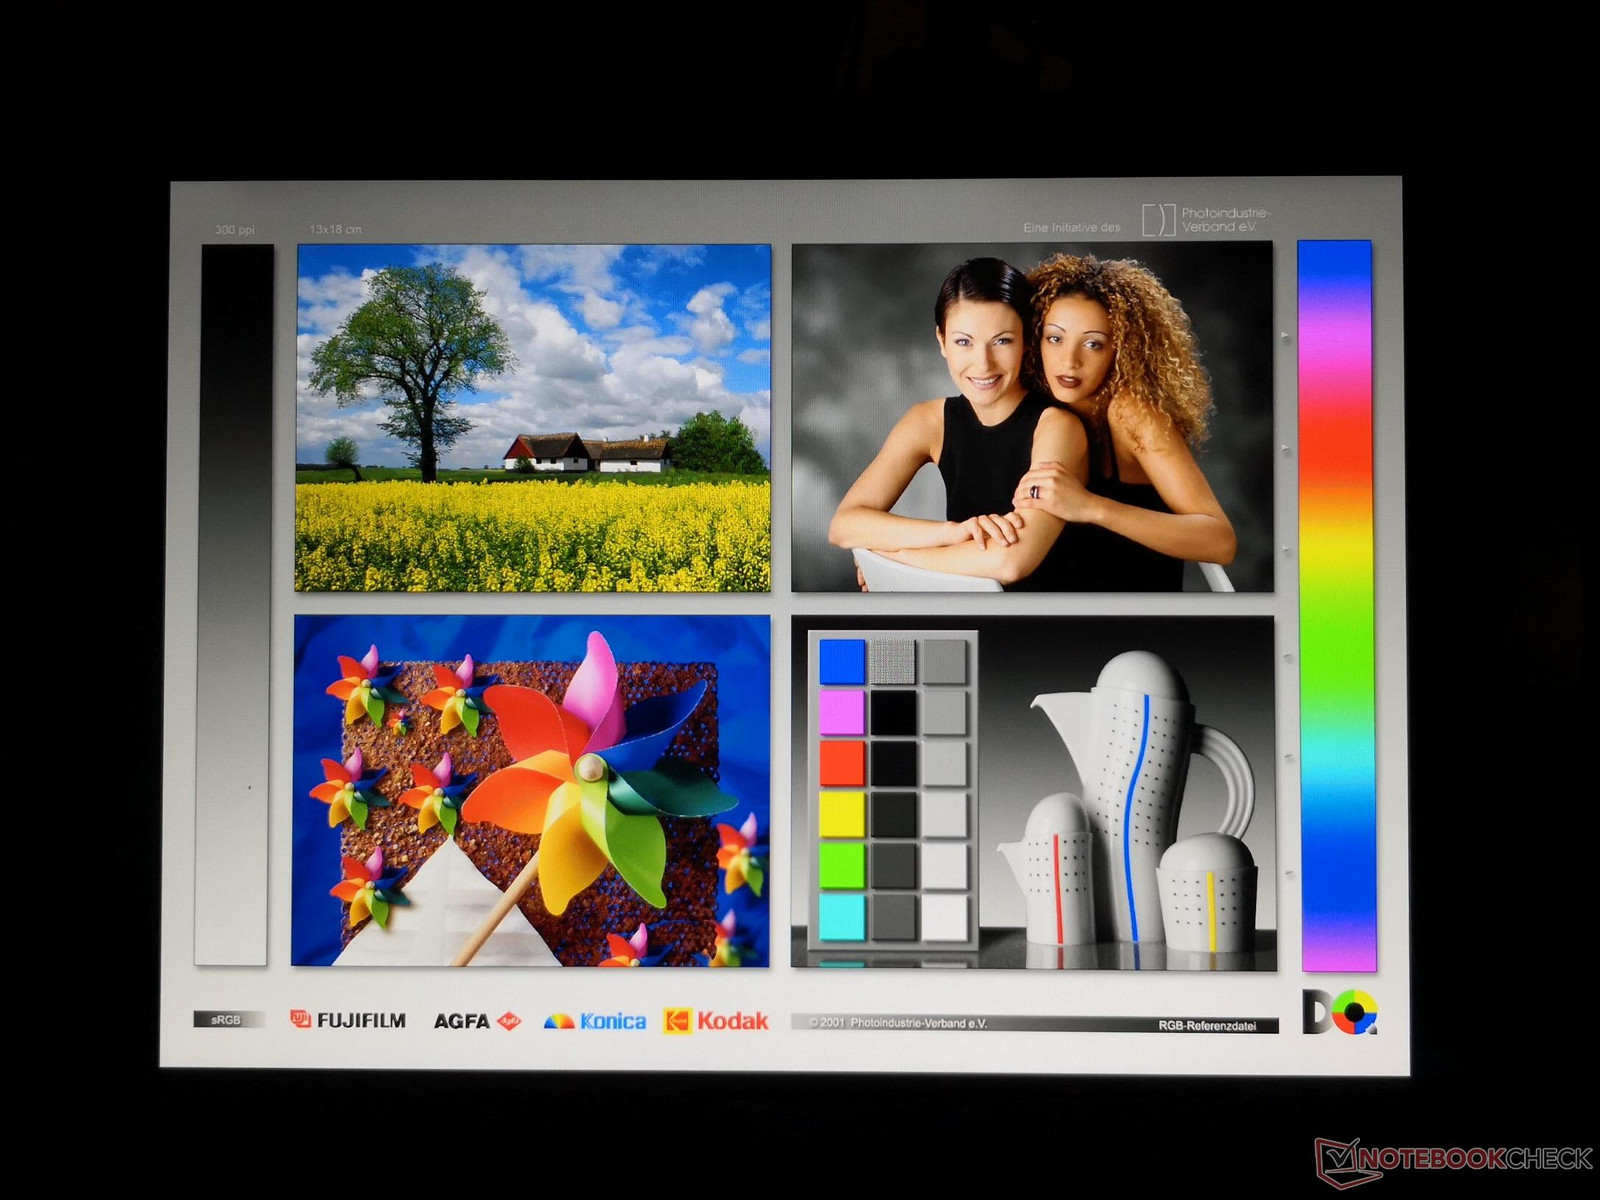
The 1080p matte display is crisp without any major graininess issues. Its AU Optronics B156HAN06.1 IPS panel can also be found on the Asus FX503VM and a number of budget Acer laptops like the Spin 5 SP515. Consequently, our Vivobook shares many of the same display characteristics as the aforementioned laptops. Contrast is good albeit with average brightness levels and black-white response times.
Our unit exhibits minor uneven backlight bleeding on the bottom corners that is fortunately unnoticeable during day-to-day loads.
| |||||||||||||||||||||||||
Brightness Distribution: 91 %
Center on Battery: 240.1 cd/m²
Contrast: 1044:1 (Black: 0.23 cd/m²)
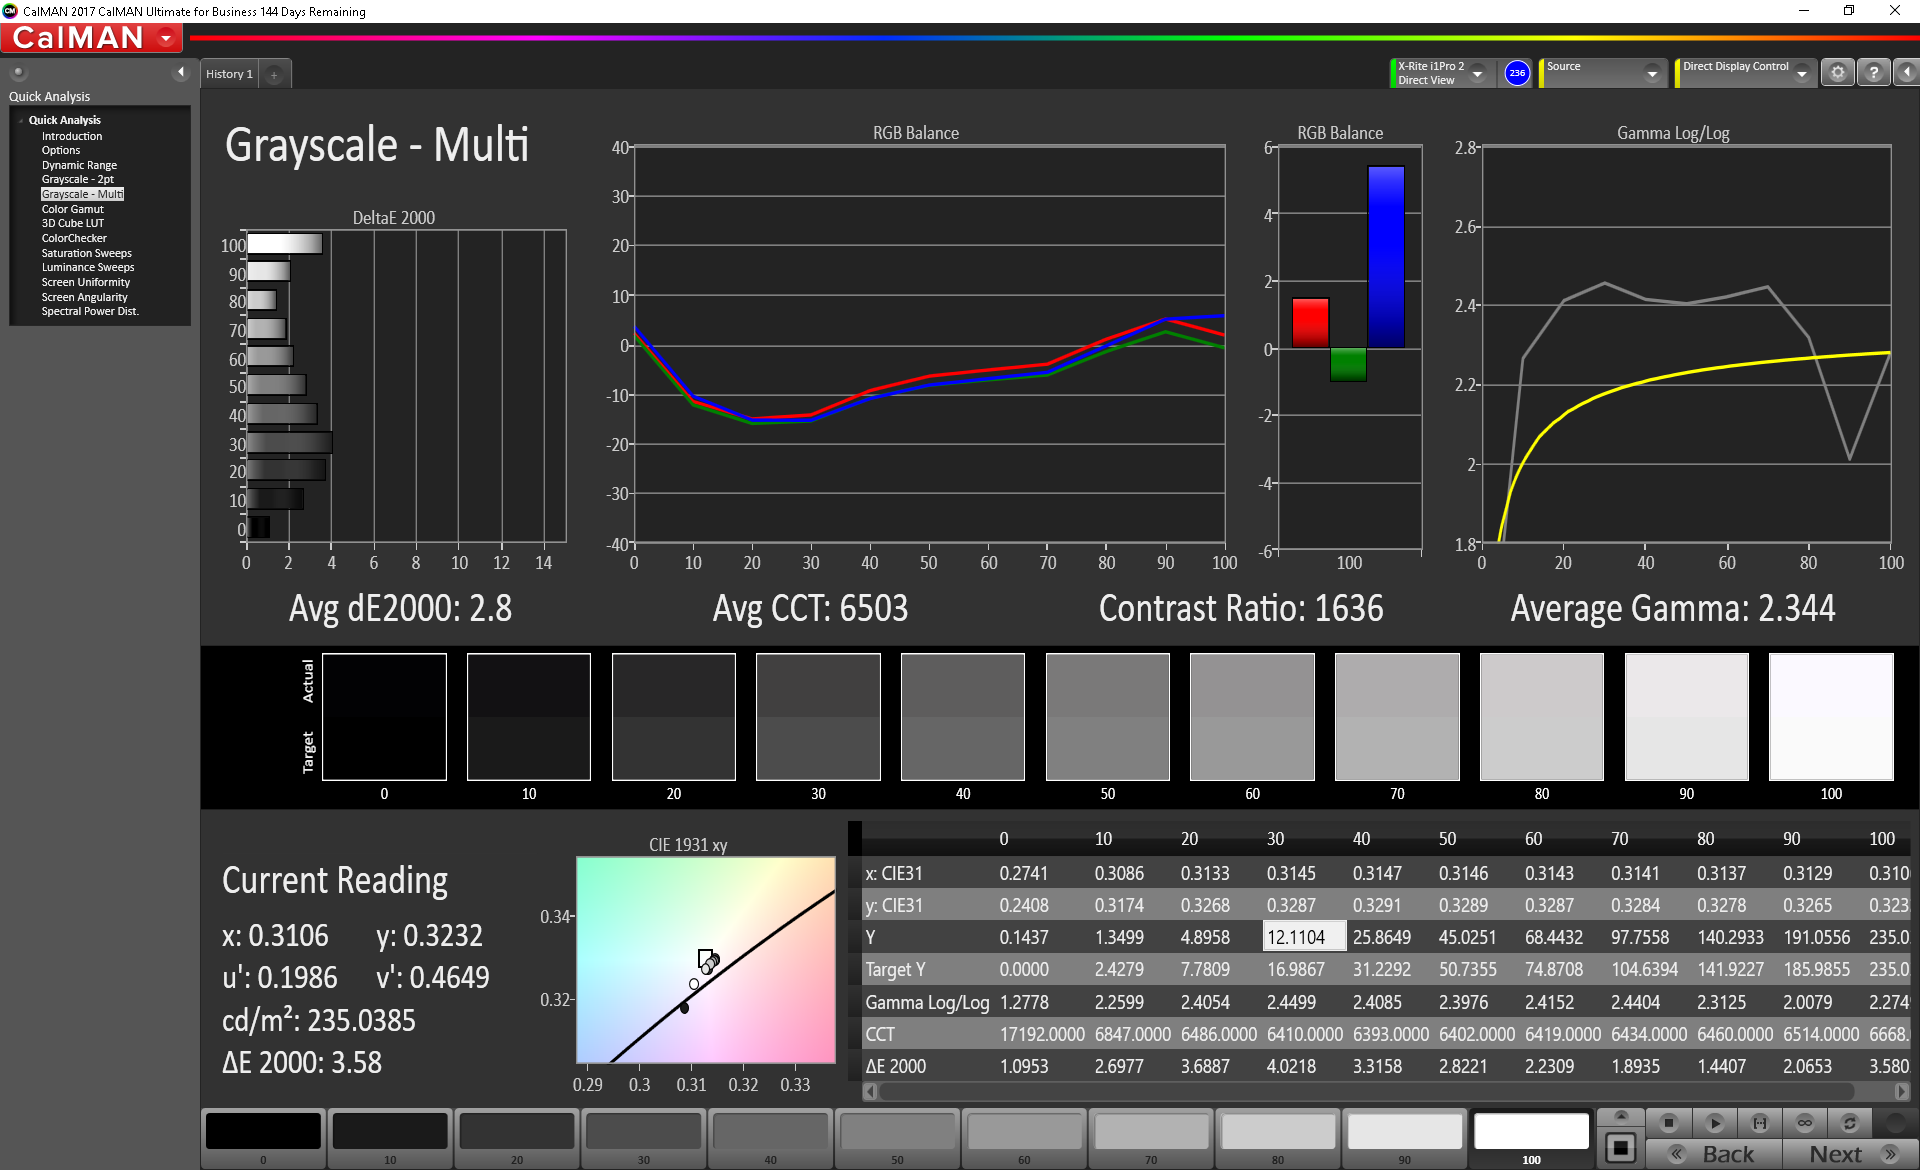
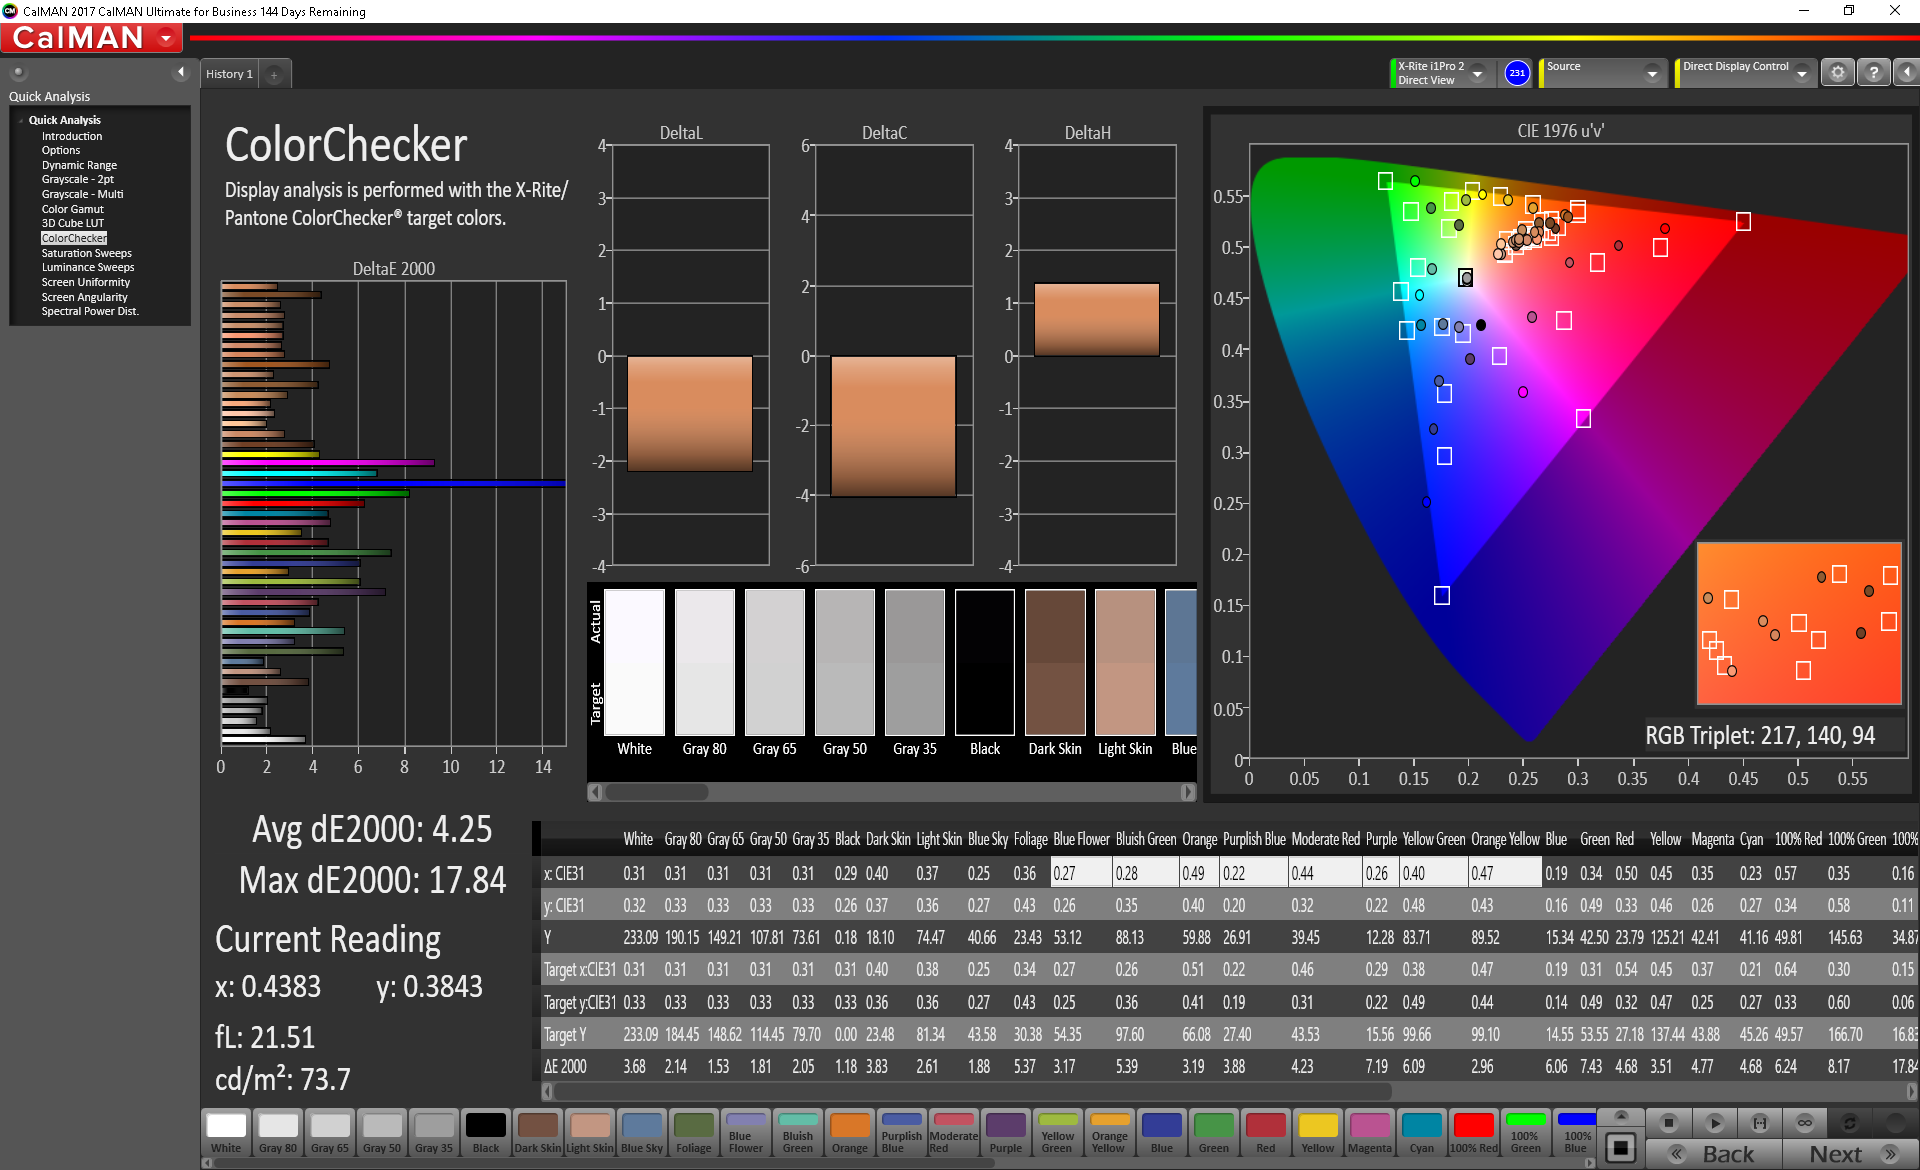
ΔE ColorChecker Calman: 4.25 | ∀{0.5-29.43 Ø4.73}
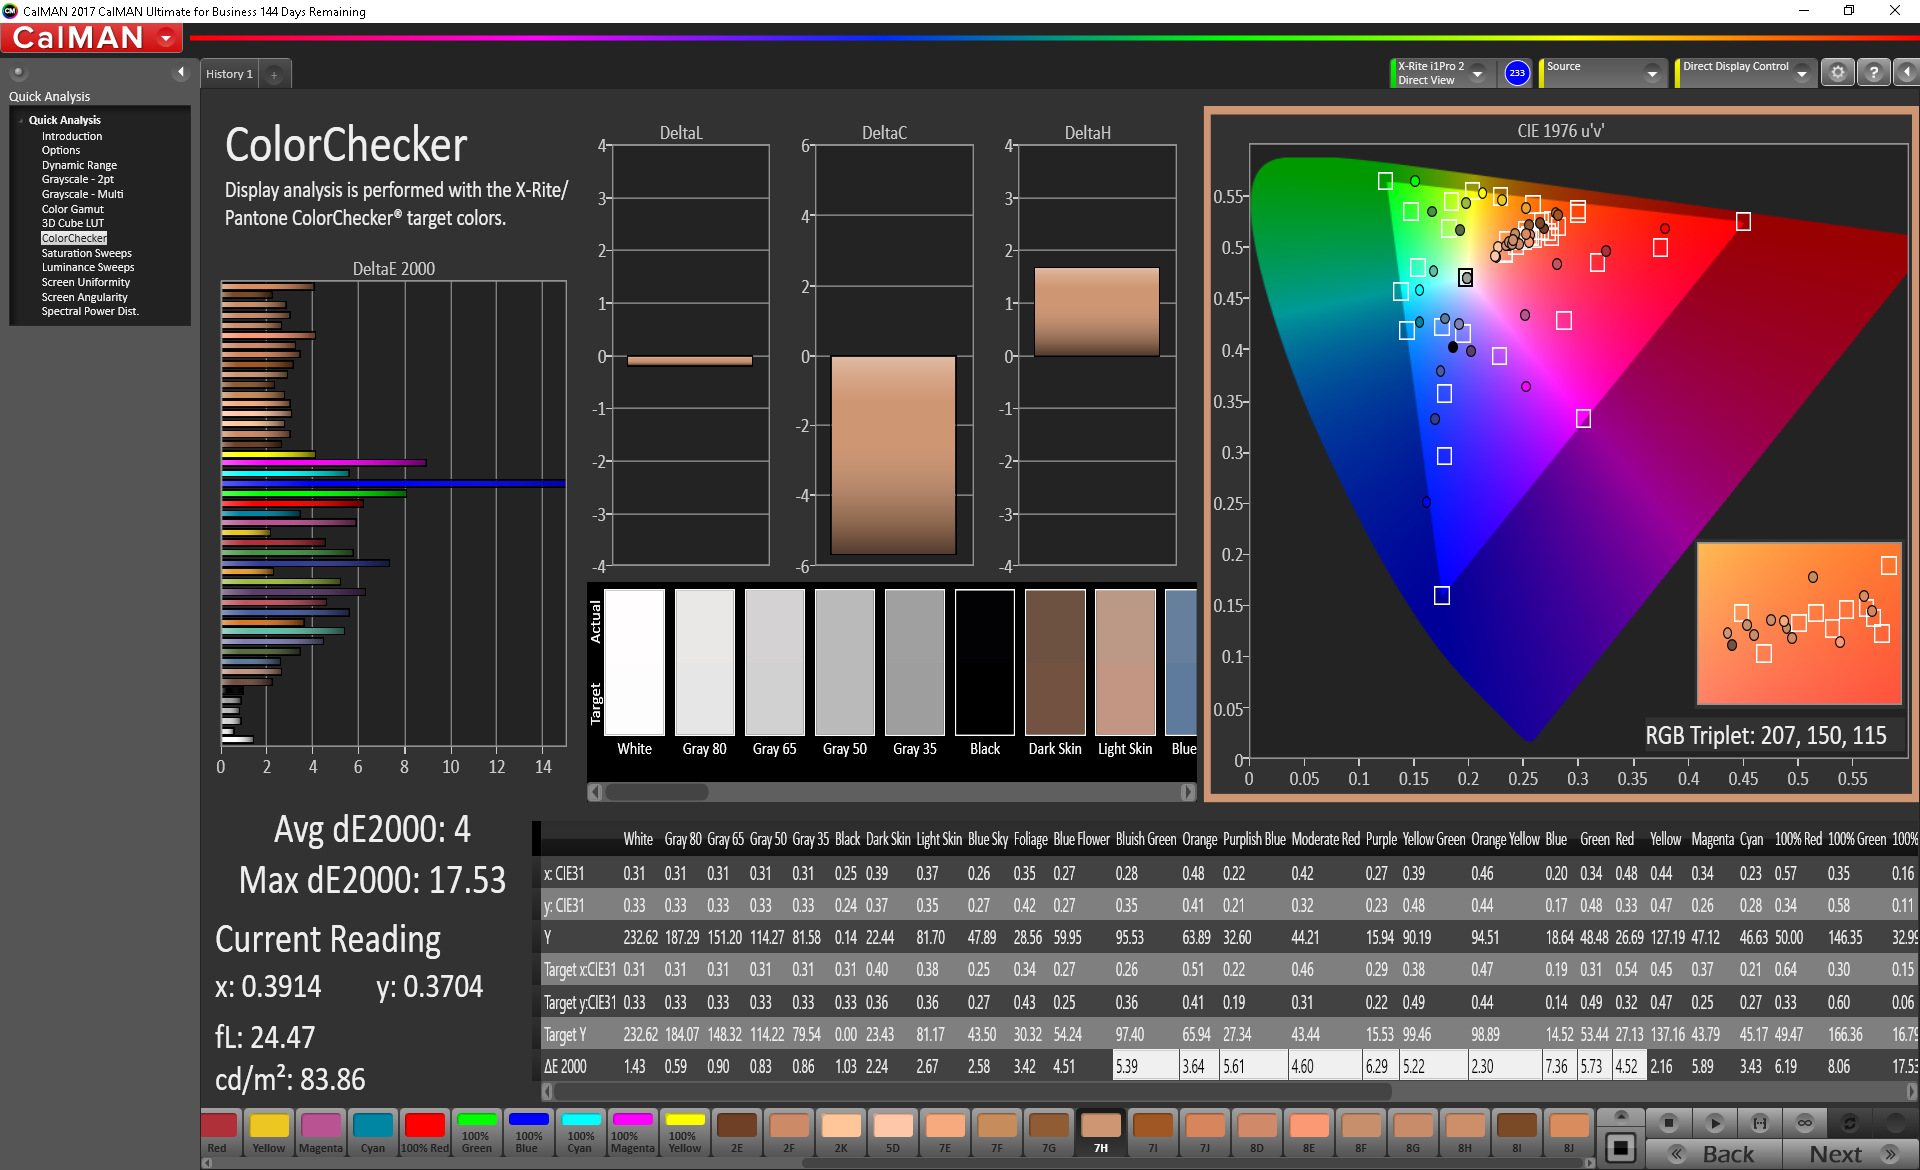
calibrated: 4
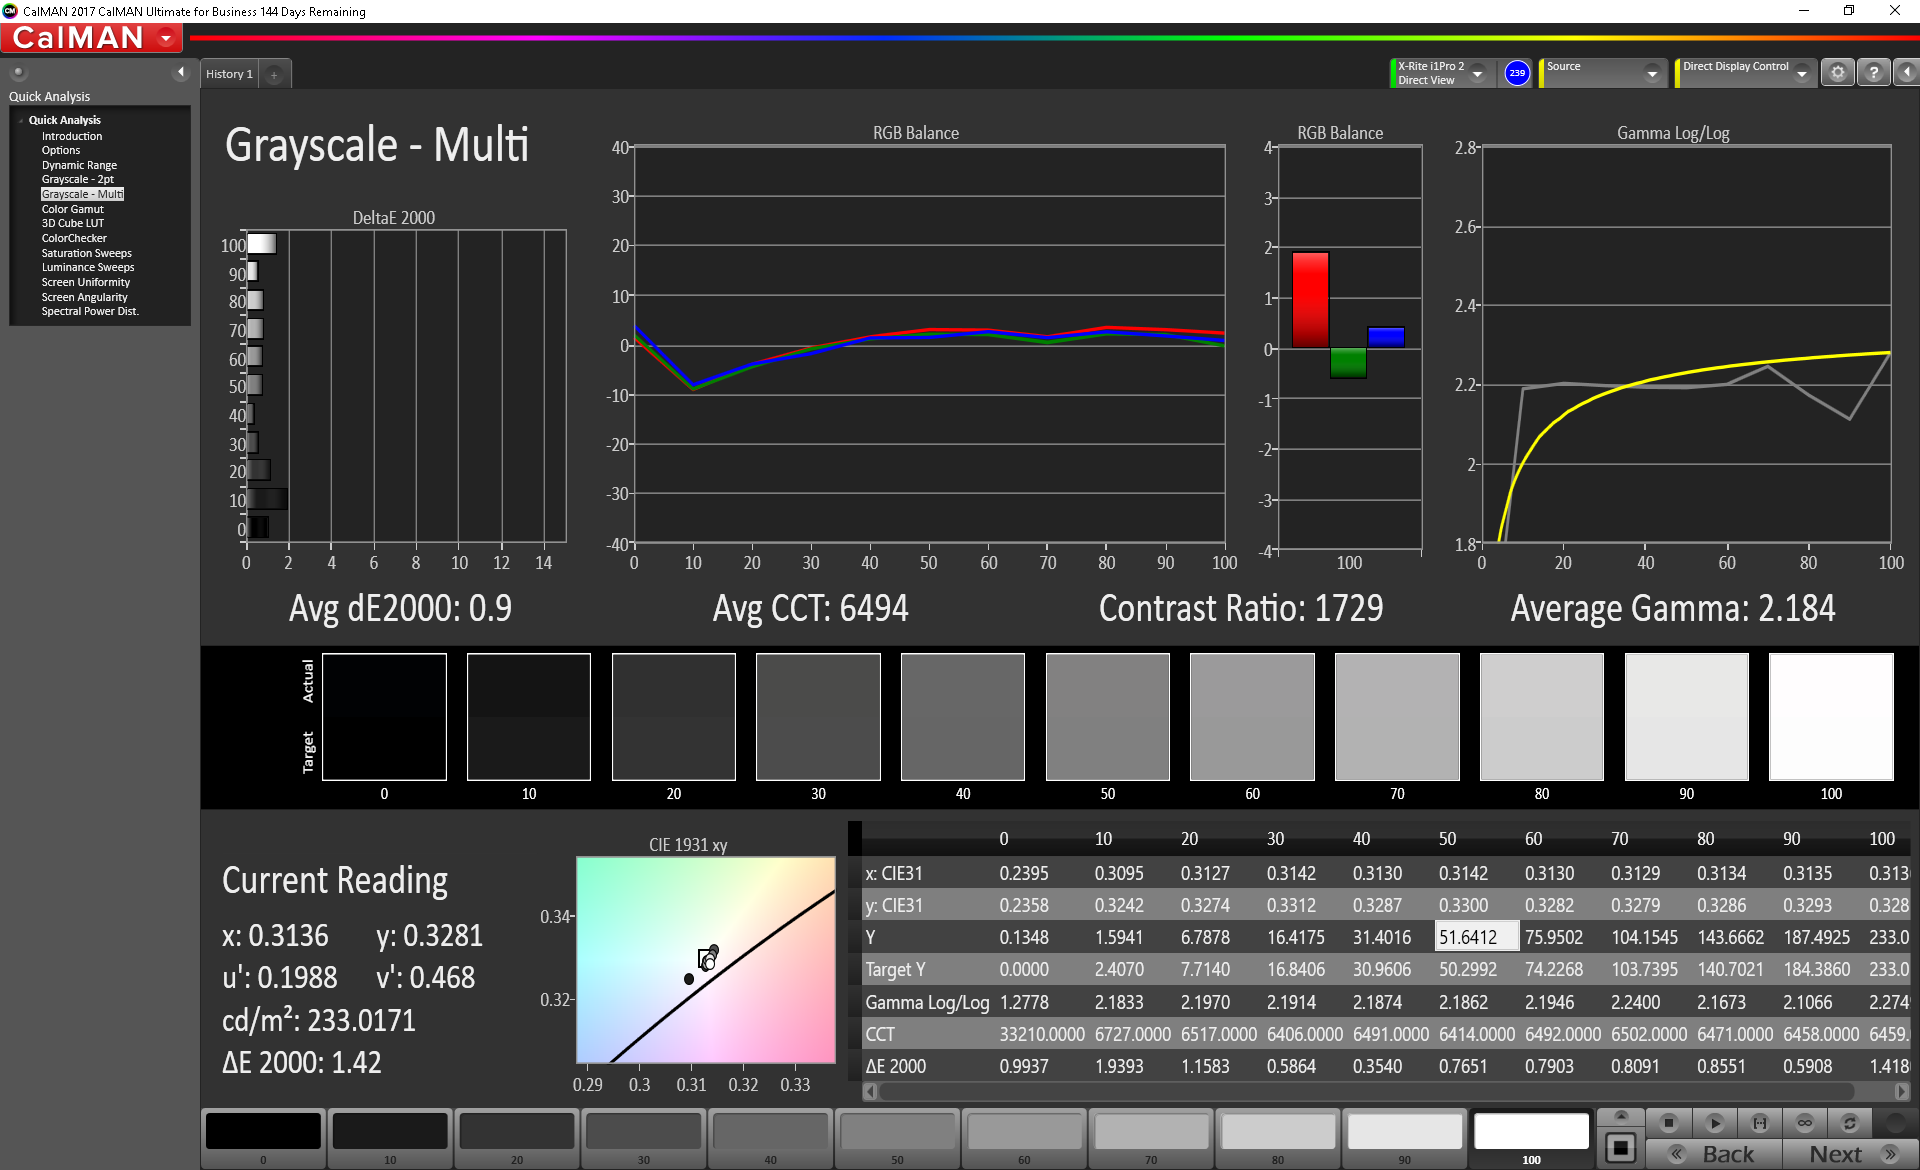
ΔE Greyscale Calman: 2.8 | ∀{0.09-98 Ø4.97}
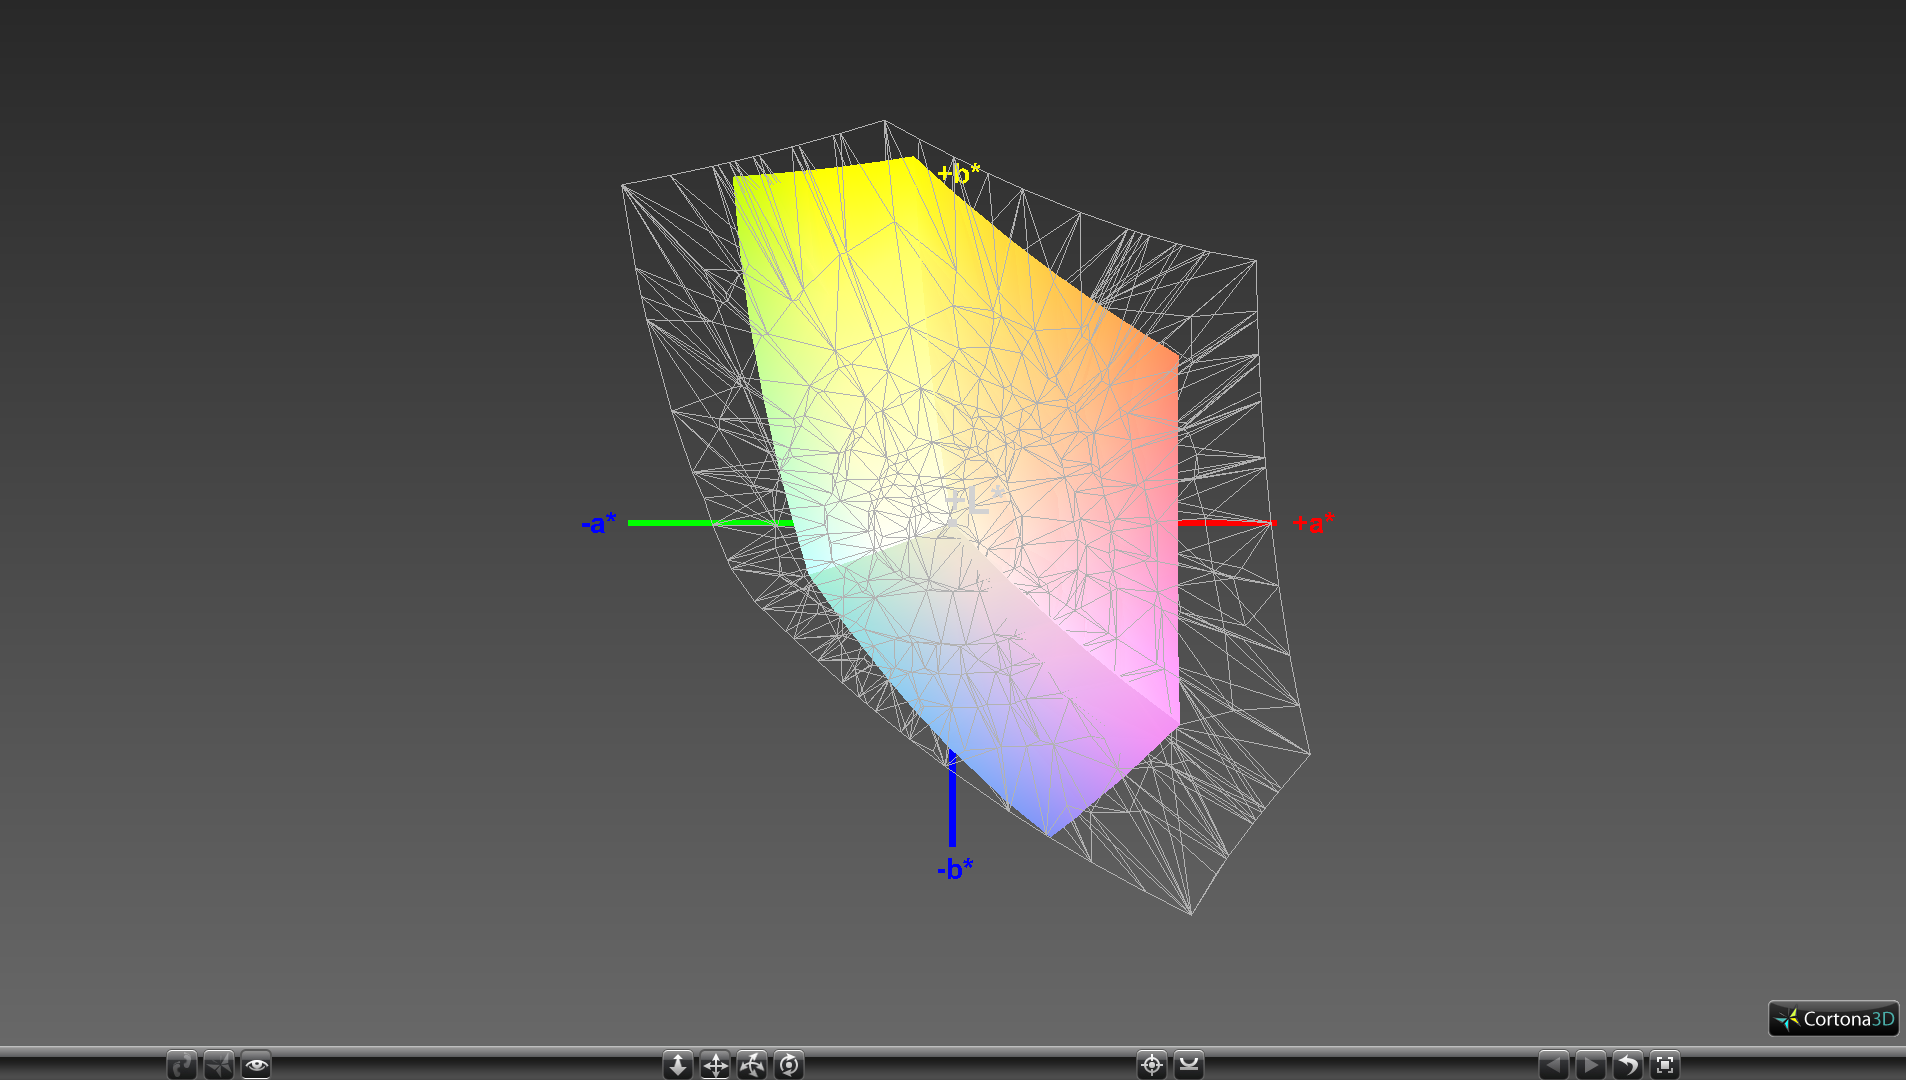
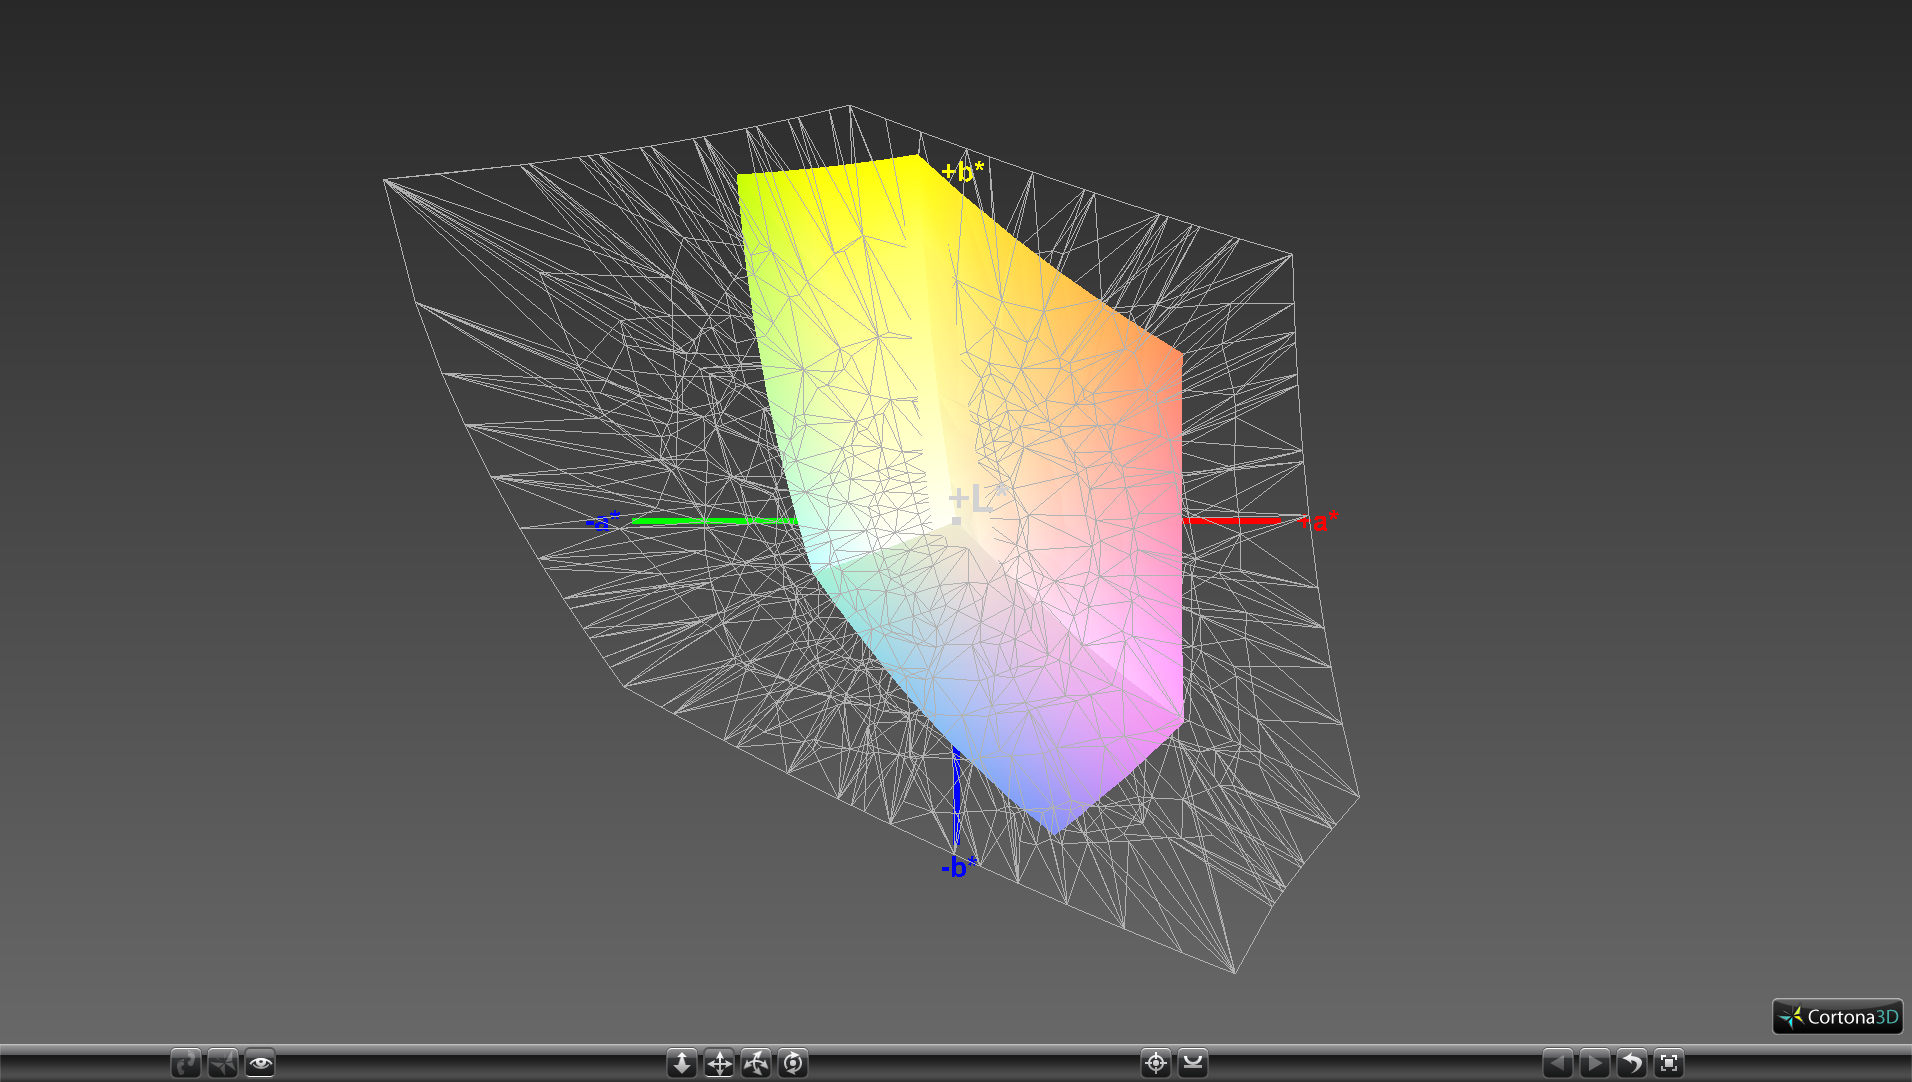
57.8% sRGB (Argyll 1.6.3 3D)
36.8% AdobeRGB 1998 (Argyll 1.6.3 3D)
39.94% AdobeRGB 1998 (Argyll 3D)
57.9% sRGB (Argyll 3D)
38.66% Display P3 (Argyll 3D)
Gamma: 2.3
CCT: 6503 K
| Asus VivoBook 15 X570UD AU Optronics B156HAN06.1, IPS, 15.6", 1920x1080 | Dell G5 15 5587 LGD053F, 156WF6, IPS, 15.6", 1920x1080 | Gigabyte Sabre 15G ID: LGD0533, Name: LG Display LP156WF6-SPK3, IPS, 15.6", 1920x1080 | MSI GL63 8RC-069US LG Philips LP156WF6-SPK6, IPS, 15.6", 1920x1080 | Lenovo Legion Y520-15IKBA-80WY001VGE LG Philips LGD0533, IPS, 15.6", 1920x1080 | |
|---|---|---|---|---|---|
| Display | -1% | 1% | 2% | 2% | |
| Display P3 Coverage (%) | 38.66 | 38.13 -1% | 38.97 1% | 39.4 2% | 39.53 2% |
| sRGB Coverage (%) | 57.9 | 56.8 -2% | 58.2 1% | 59.2 2% | 59.2 2% |
| AdobeRGB 1998 Coverage (%) | 39.94 | 39.47 -1% | 40.3 1% | 40.72 2% | 40.86 2% |
| Response Times | 8% | 6% | 7% | -12% | |
| Response Time Grey 50% / Grey 80% * (ms) | 32 ? | 33 ? -3% | 32 ? -0% | 33.6 ? -5% | 42 ? -31% |
| Response Time Black / White * (ms) | 29.2 ? | 24 ? 18% | 25.6 ? 12% | 24 ? 18% | 27 ? 8% |
| PWM Frequency (Hz) | 20000 ? | 24900 ? | |||
| Screen | -21% | -30% | -12% | -17% | |
| Brightness middle (cd/m²) | 240.1 | 229 -5% | 248.4 3% | 286.5 19% | 243 1% |
| Brightness (cd/m²) | 233 | 224 -4% | 241 3% | 258 11% | 231 -1% |
| Brightness Distribution (%) | 91 | 87 -4% | 84 -8% | 82 -10% | 87 -4% |
| Black Level * (cd/m²) | 0.23 | 0.28 -22% | 0.3 -30% | 0.34 -48% | 0.24 -4% |
| Contrast (:1) | 1044 | 818 -22% | 828 -21% | 843 -19% | 1013 -3% |
| Colorchecker dE 2000 * | 4.25 | 6.1 -44% | 7.5 -76% | 5.57 -31% | 6.36 -50% |
| Colorchecker dE 2000 max. * | 17.84 | 12.2 32% | 25.2 -41% | 16.8 6% | 12.76 28% |
| Colorchecker dE 2000 calibrated * | 4 | 6.12 -53% | 4.16 -4% | 6.51 -63% | |
| Greyscale dE 2000 * | 2.8 | 5.68 -103% | 6.5 -132% | 4.6 -64% | 5.63 -101% |
| Gamma | 2.3 96% | 2.4 92% | 2.19 100% | 2.15 102% | 2.47 89% |
| CCT | 6503 100% | 6989 93% | 7852 83% | 7564 86% | 7411 88% |
| Color Space (Percent of AdobeRGB 1998) (%) | 36.8 | 36 -2% | 37 1% | 37.4 2% | 38 3% |
| Color Space (Percent of sRGB) (%) | 57.8 | 57 -1% | 57.9 0% | 58.9 2% | 59 2% |
| Total Average (Program / Settings) | -5% /
-14% | -8% /
-19% | -1% /
-7% | -9% /
-13% |
* ... smaller is better
Color space is only 58 percent and 37 percent of the sRGB and AdobeRGB standards, respectively, which is representative of a budget panel. Users who want deeper and more accurate colors may want to consider the ZenBook series instead where 100 percent sRGB options are common.
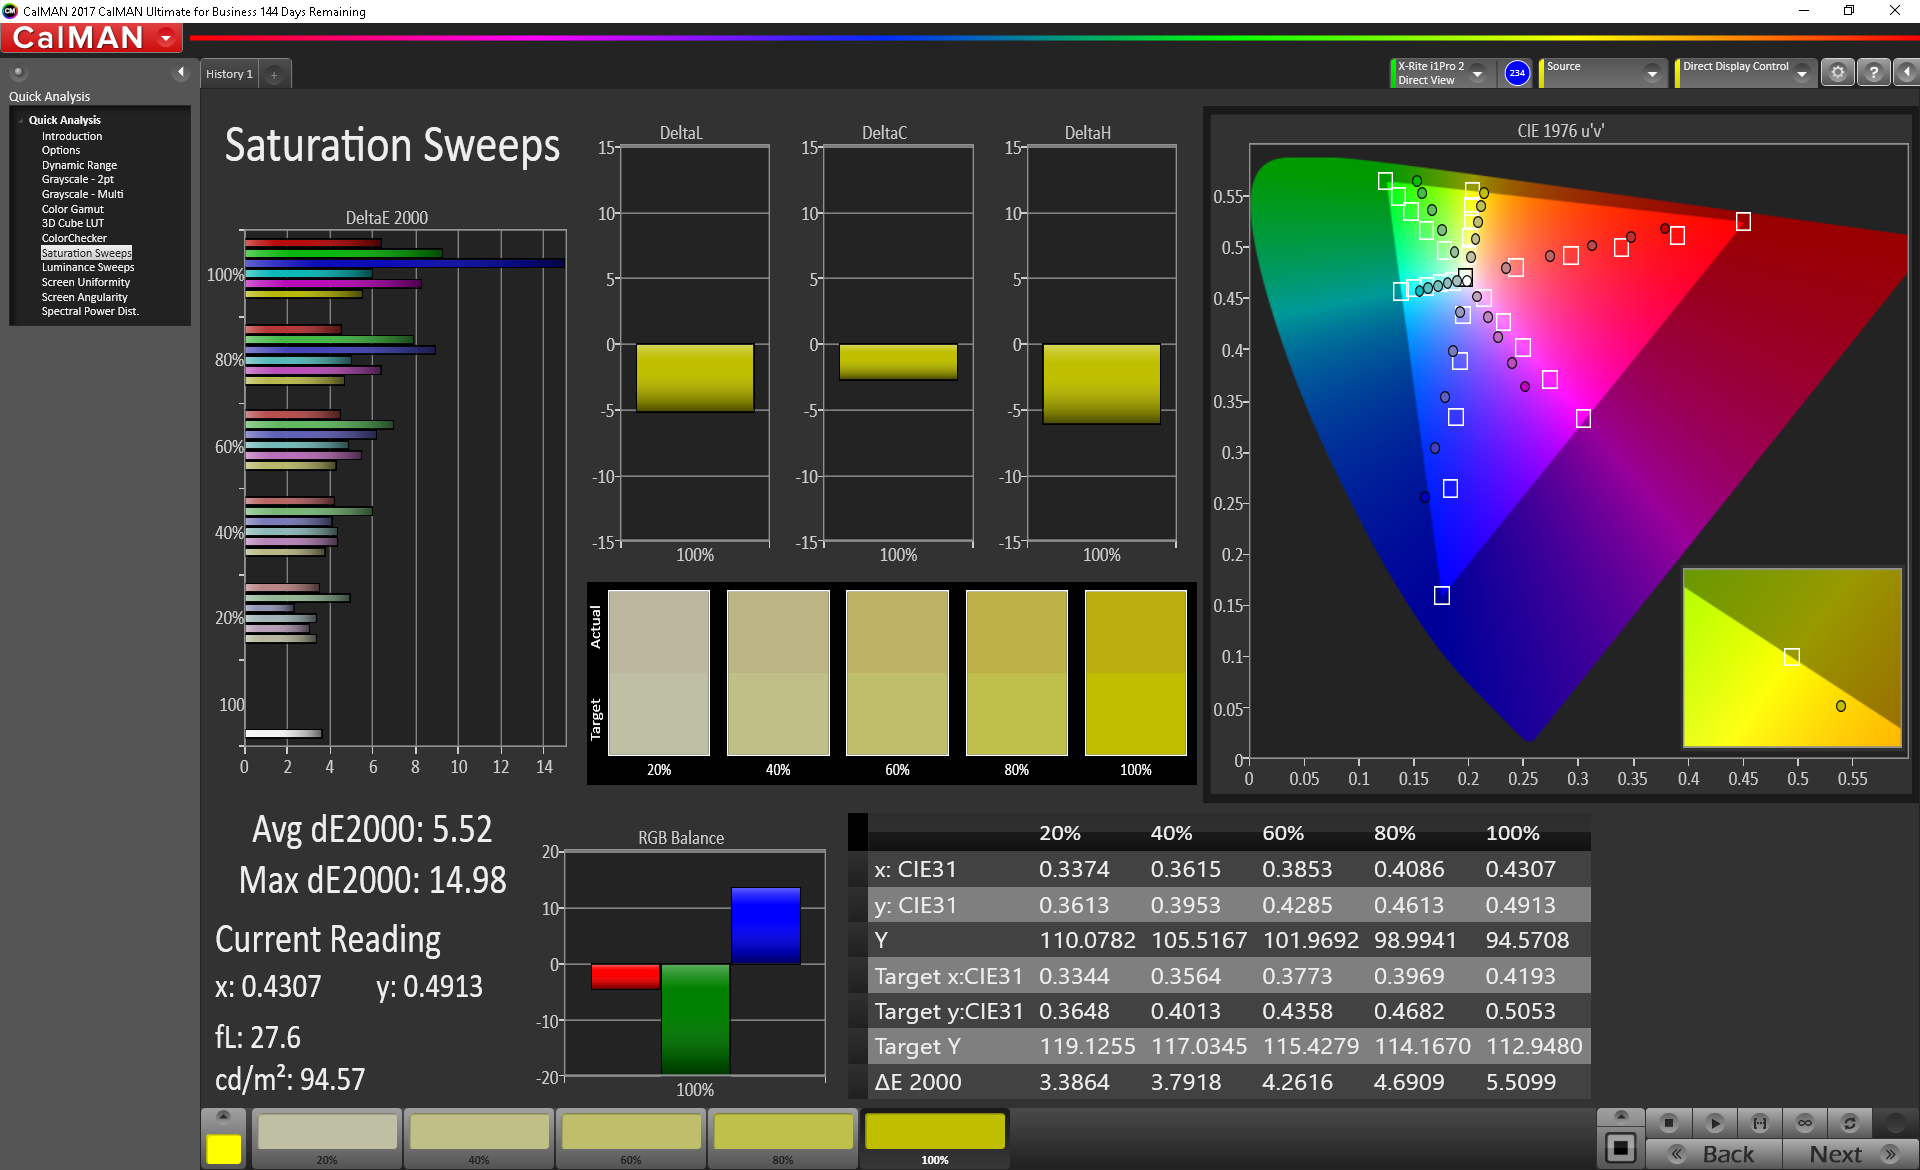
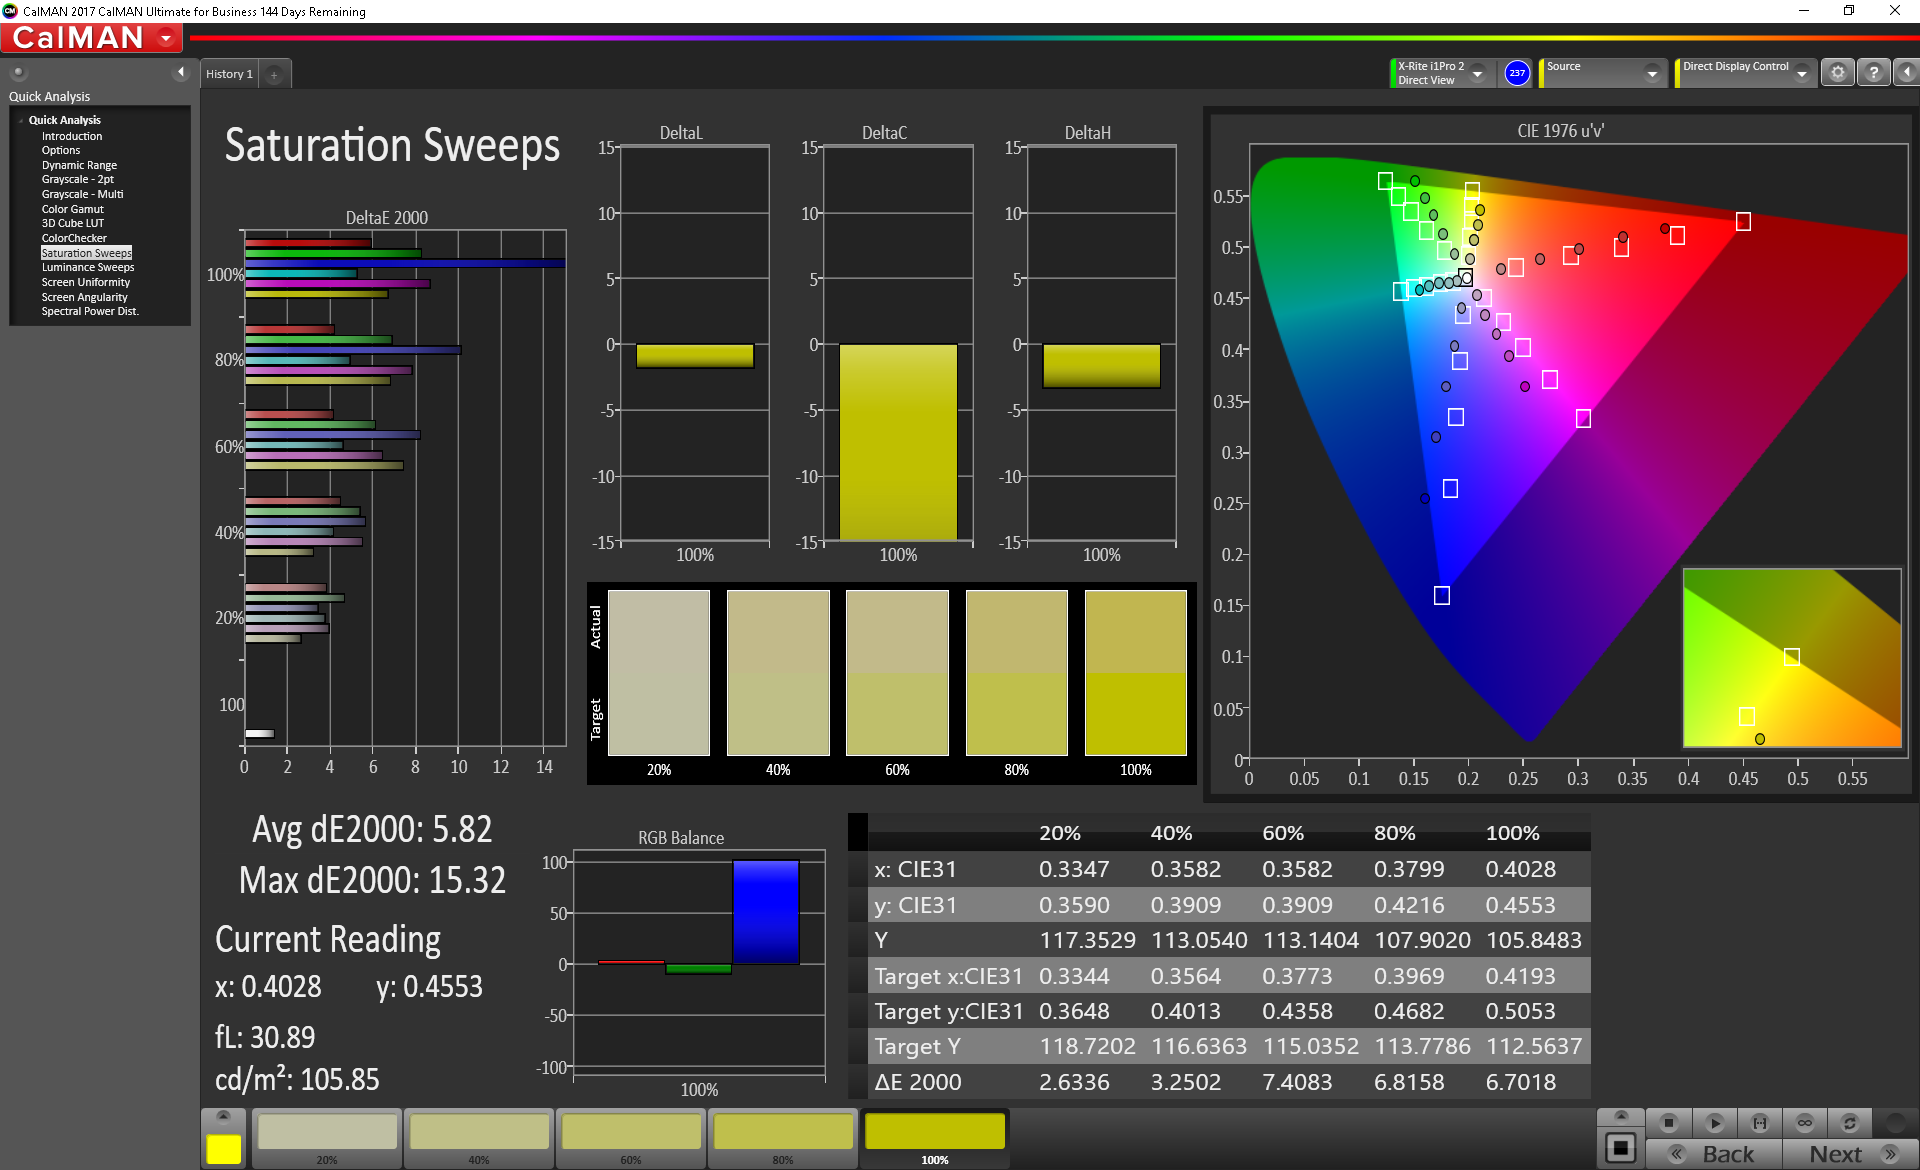
Further measurements with an X-Rite spectrophotometer reveal generally accurate colors and grayscale. Nonetheless, color accuracy is limited by the narrow gamut and we can observe that colors become increasingly inaccurate at higher saturation levels. Our calibration attempts improve the display just marginally.
Display Response Times
| ↔ Response Time Black to White | ||
|---|---|---|
| 29.2 ms ... rise ↗ and fall ↘ combined | ↗ 17.2 ms rise | 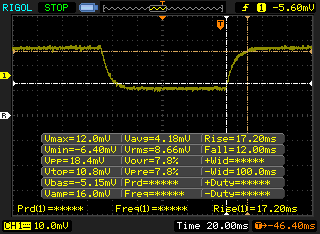 |
| ↘ 12 ms fall | ||
| The screen shows relatively slow response rates in our tests and may be too slow for gamers. In comparison, all tested devices range from 0.1 (minimum) to 240 (maximum) ms. » 78 % of all devices are better. This means that the measured response time is worse than the average of all tested devices (19.9 ms). | ||
| ↔ Response Time 50% Grey to 80% Grey | ||
| 32 ms ... rise ↗ and fall ↘ combined | ↗ 19.2 ms rise | 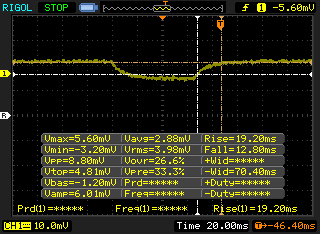 |
| ↘ 12.8 ms fall | ||
| The screen shows slow response rates in our tests and will be unsatisfactory for gamers. In comparison, all tested devices range from 0.165 (minimum) to 636 (maximum) ms. » 43 % of all devices are better. This means that the measured response time is similar to the average of all tested devices (31.1 ms). | ||
Screen Flickering / PWM (Pulse-Width Modulation)
| Screen flickering / PWM not detected | 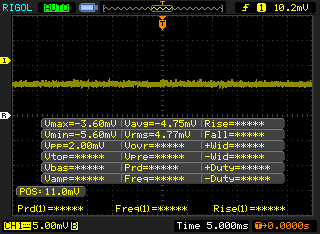 | ||
In comparison: 52 % of all tested devices do not use PWM to dim the display. If PWM was detected, an average of 7798 (minimum: 5 - maximum: 343500) Hz was measured. | |||
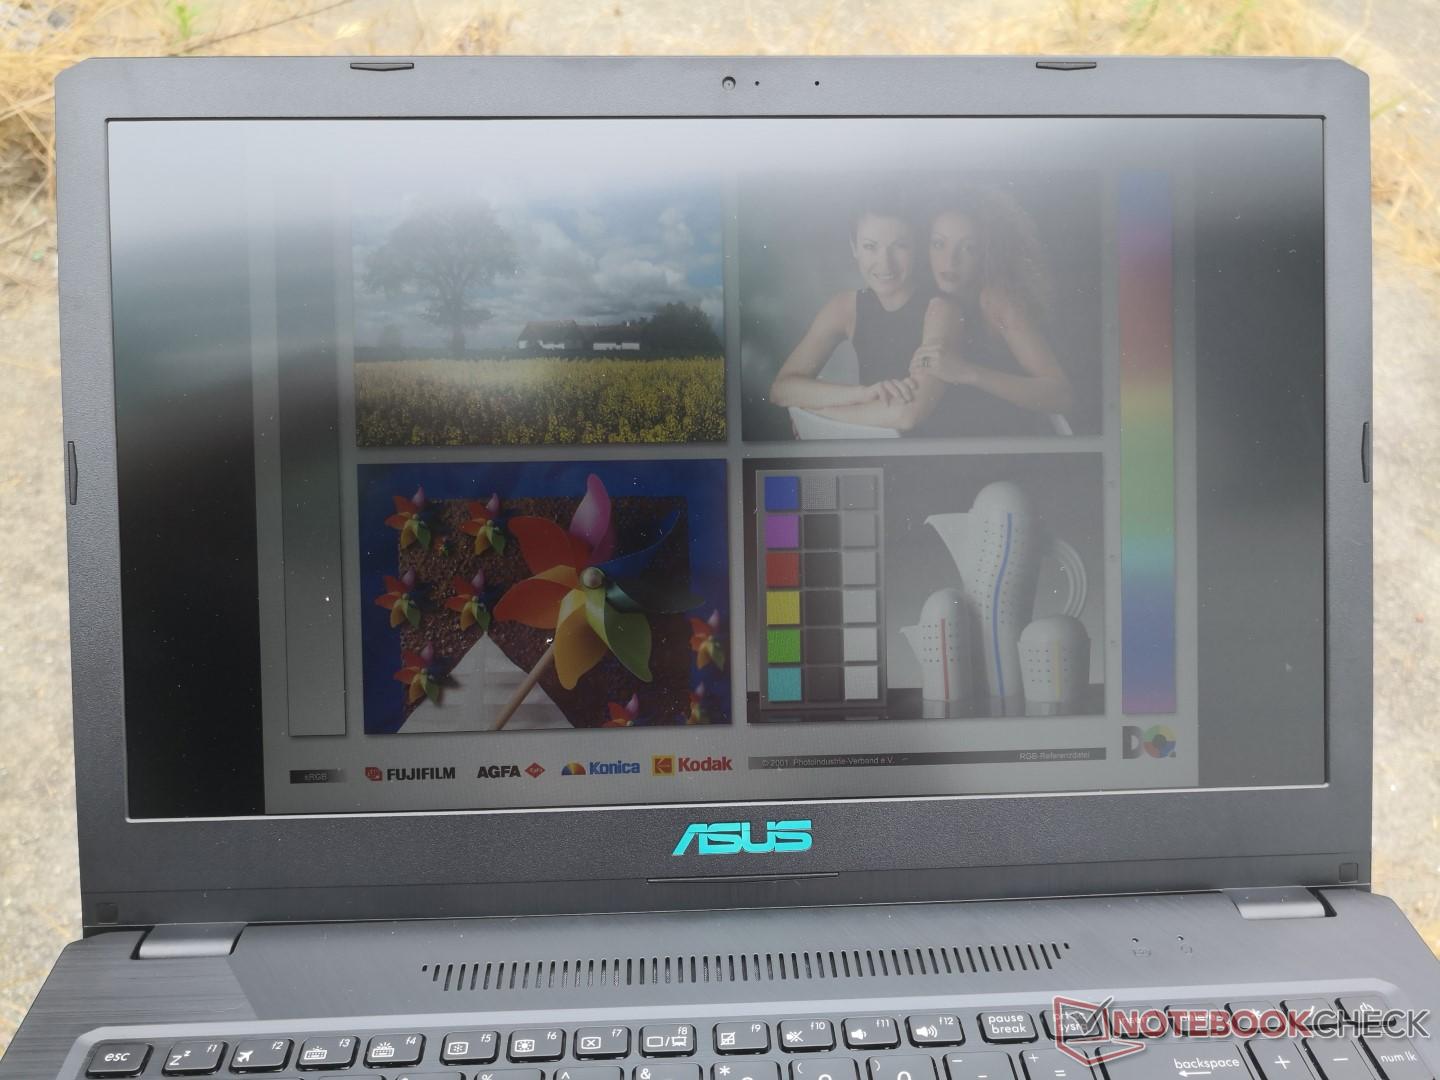
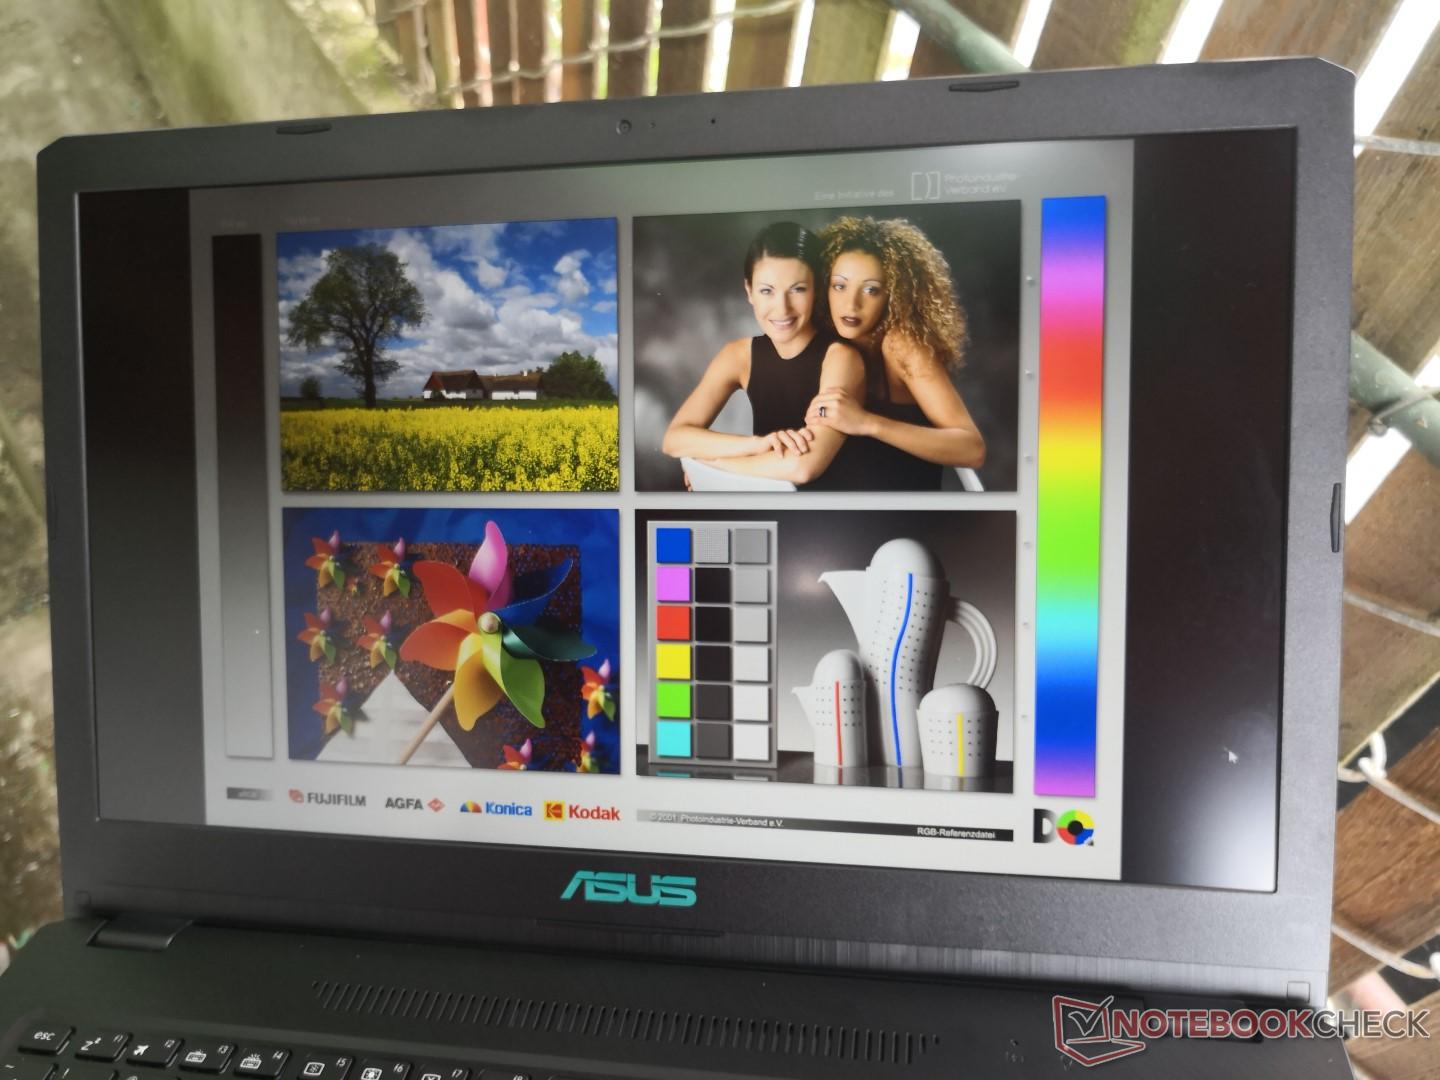
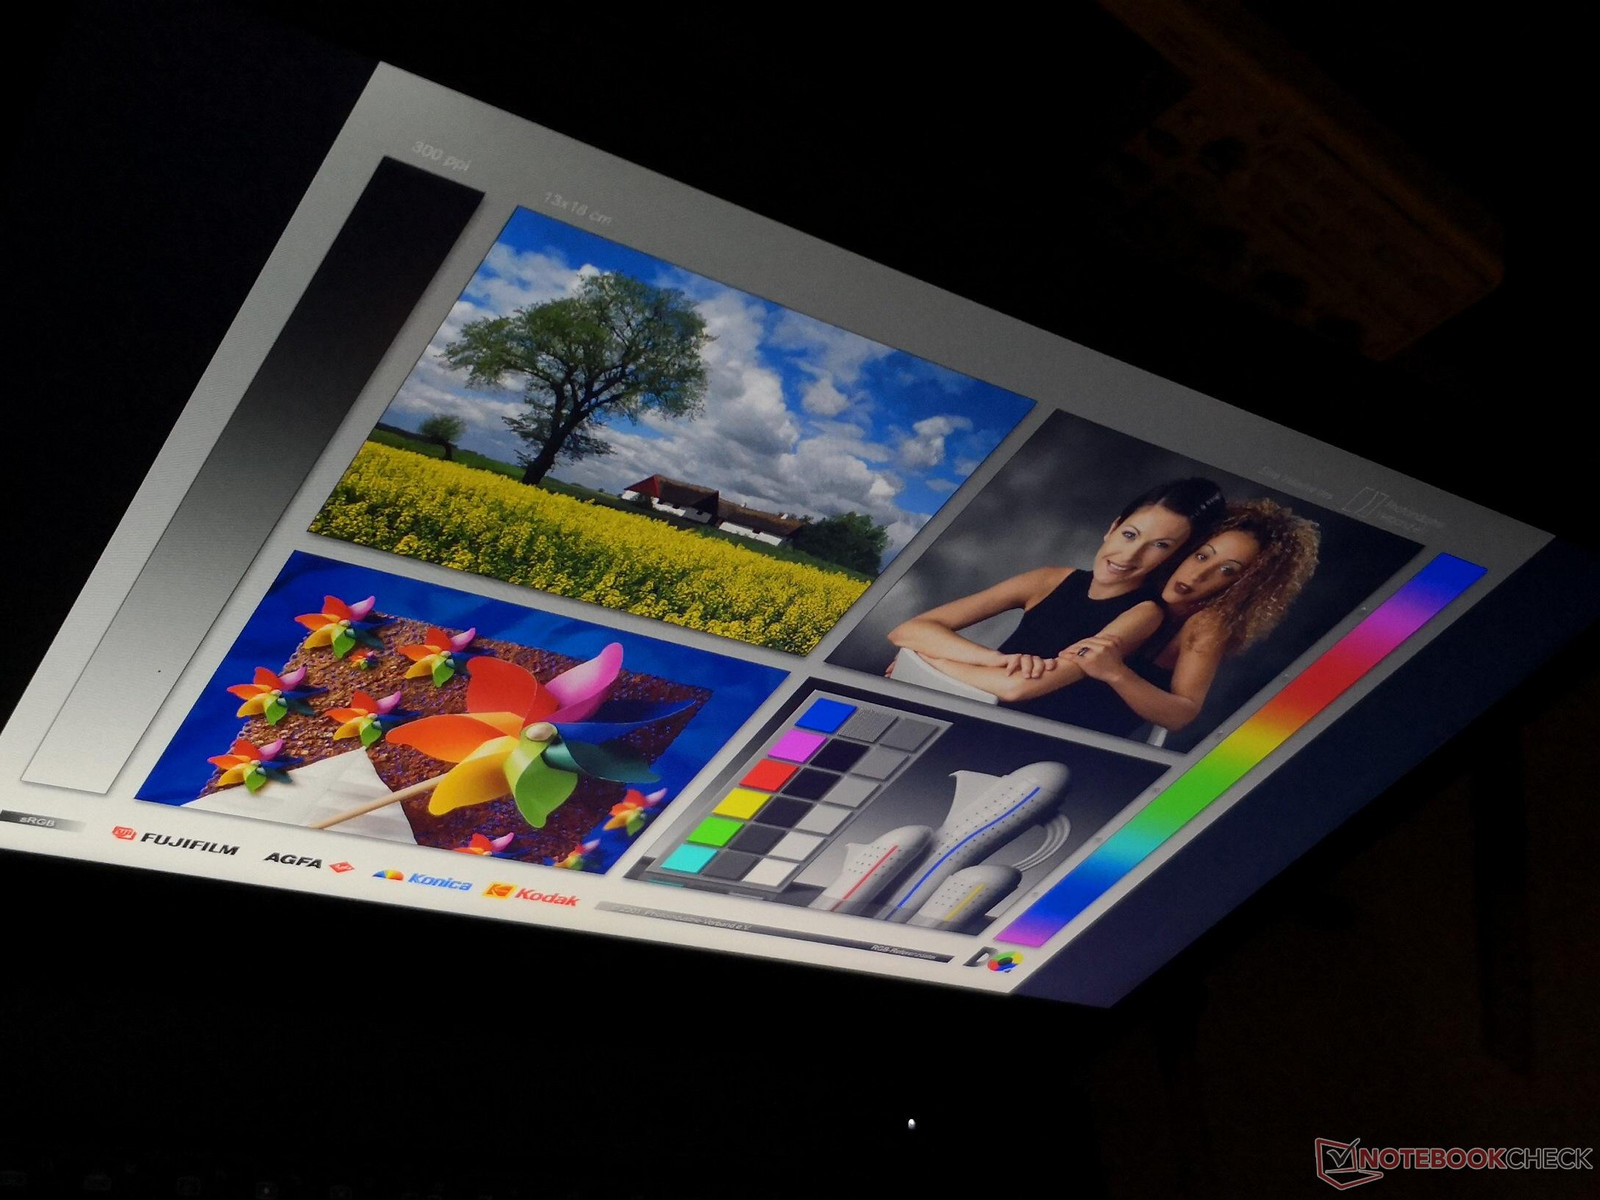
Outdoor visibility is below average because of the mediocre display backlight. The wide IPS viewing angles and matte display do little to alleviate the dim screen and washed out colors.
Performance
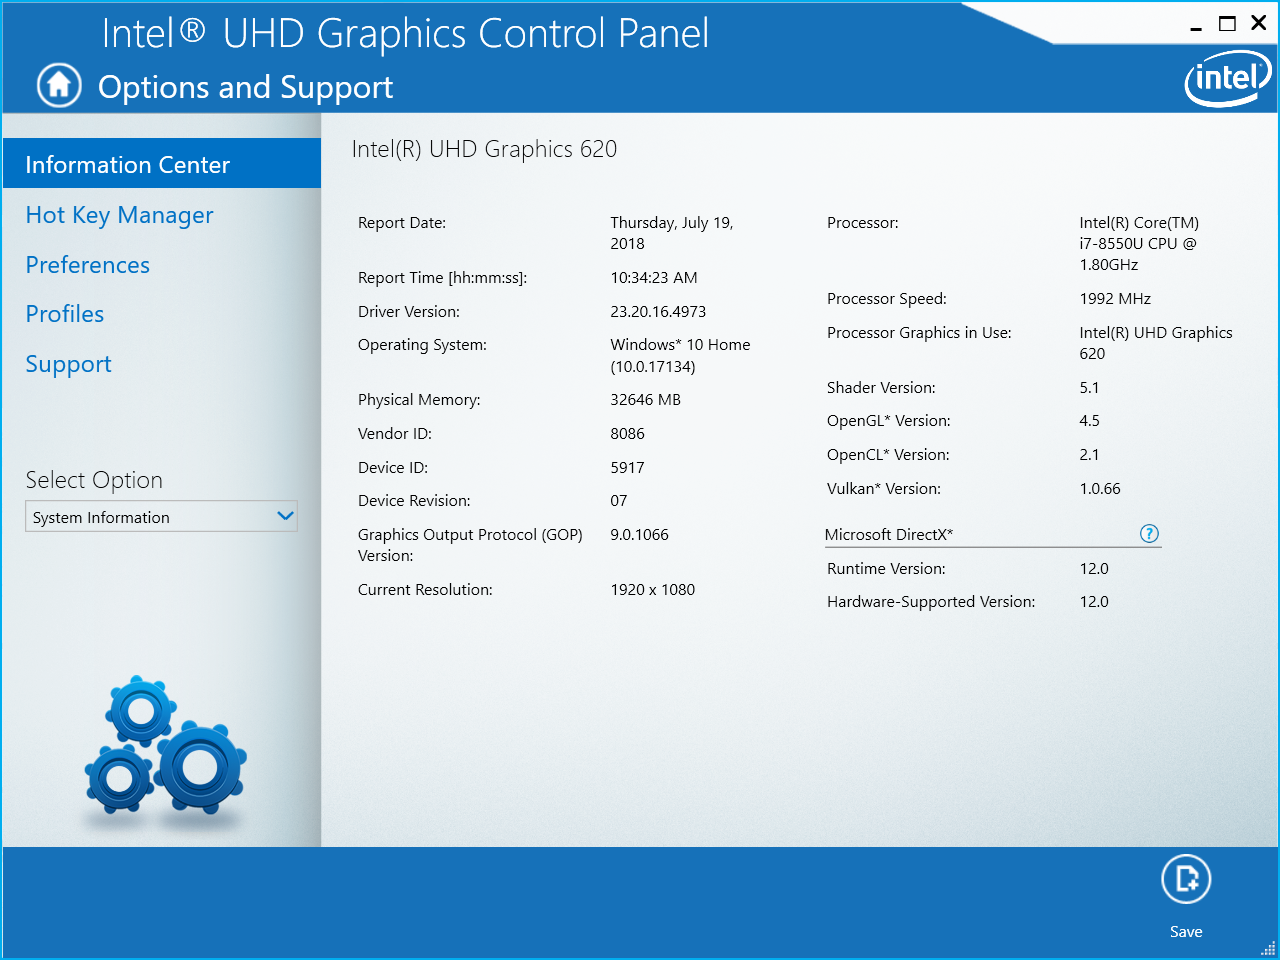
The X570UD is rather unique because of its combination of a U-class i7-8550U CPU and a GeForce GTX 1050 GPU. While both processors are common, they are not often found together because most notebooks prefer to pair GTX graphics with Intel HQ-class processors instead. Optimus is included by default for switching to the UHD Graphics 620 when desired.
No other GPU options are available for now other than the GeForce GTX 1050.
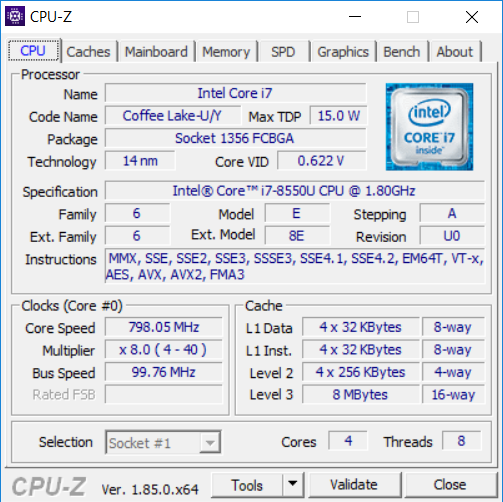
Processor
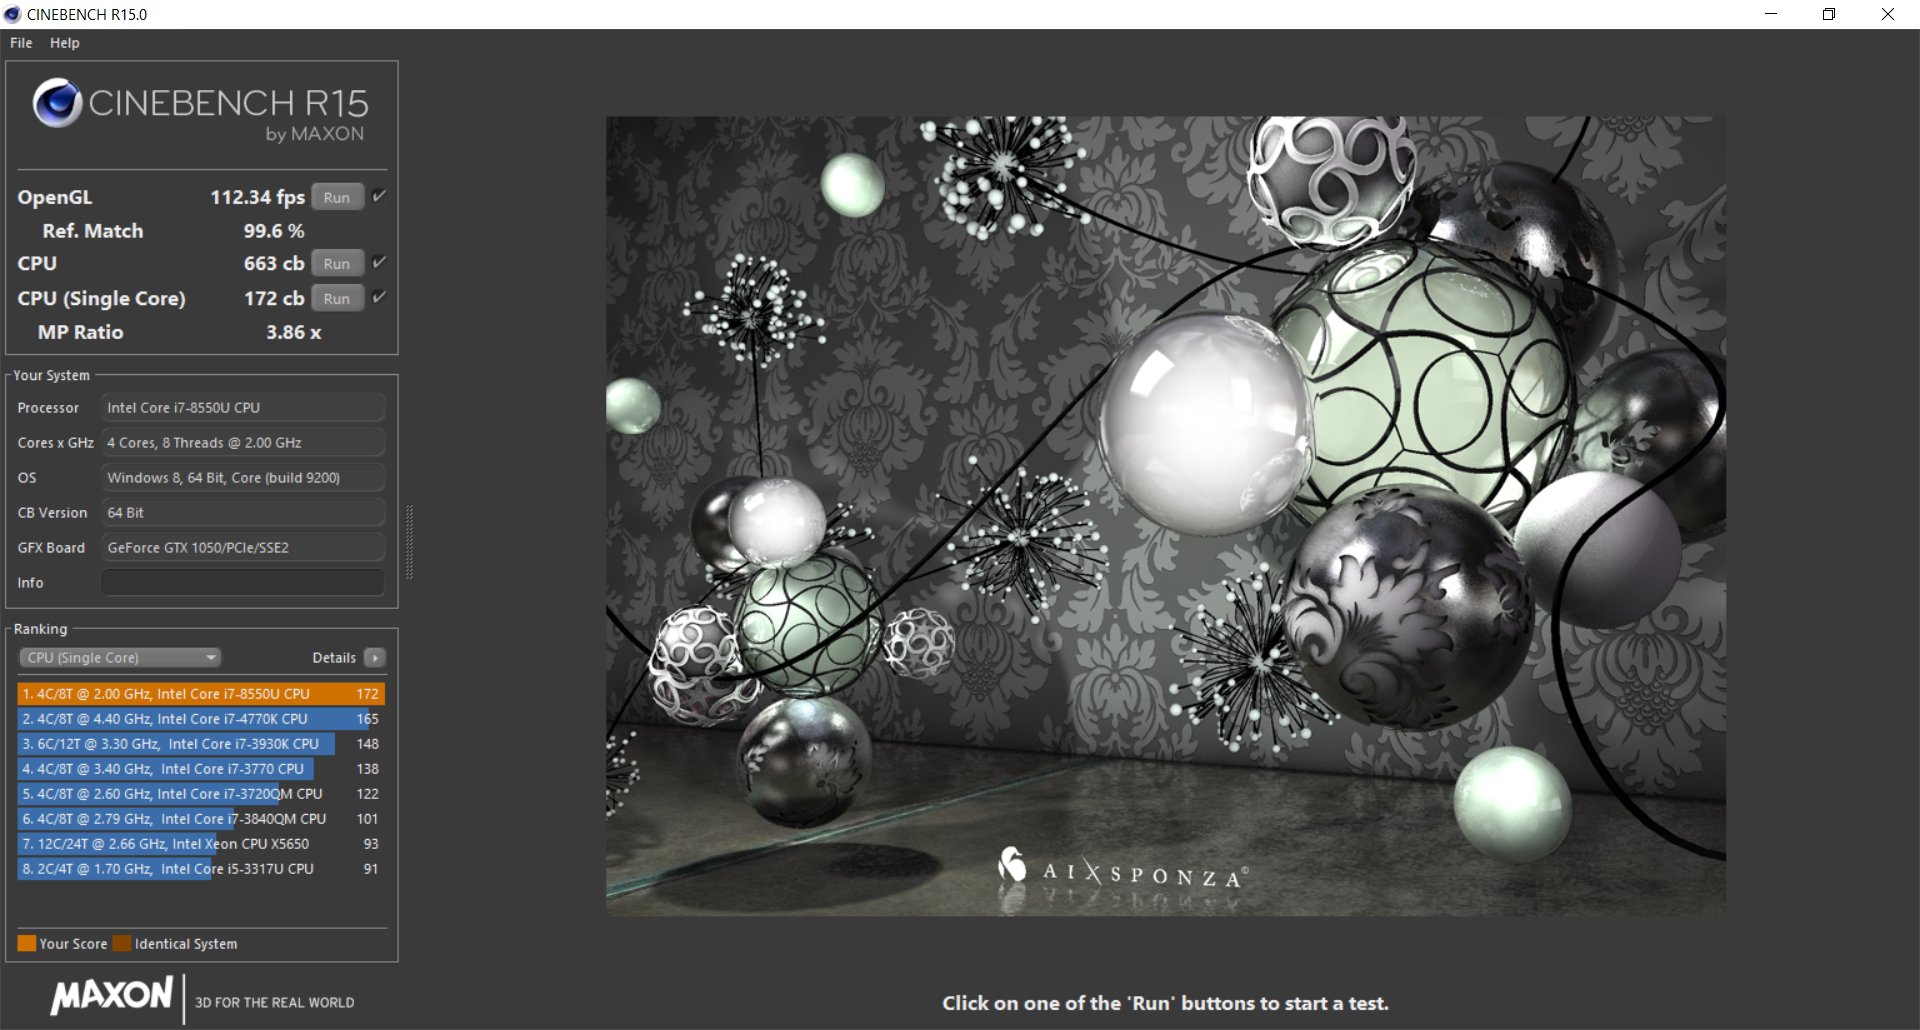
CPU performance is good but not perfect. When running CineBench R15 Multi-Thread in a loop, the initial high score of 708 points is unsustainable because subsequent runs return lower scores in the 550 range as shown in our graph below. While the 22 percent performance drop is disappointing, users can still expect a rough 50 percent increase over the last generation i7-7500U.
See our dedicated Core i7-8550U CPU page for more technical information and benchmark comparisons.
| wPrime 2.10 - 1024m | |
| Lenovo ThinkPad 13 20J1005TPB | |
| Average Intel Core i7-8550U (258 - 435, n=11) | |
| Acer Swift 3 SF315-41-R6J9 | |
| Asus FX503VM-EH73 | |
| MSI GV62 8RE-016US | |
* ... smaller is better
System Performance
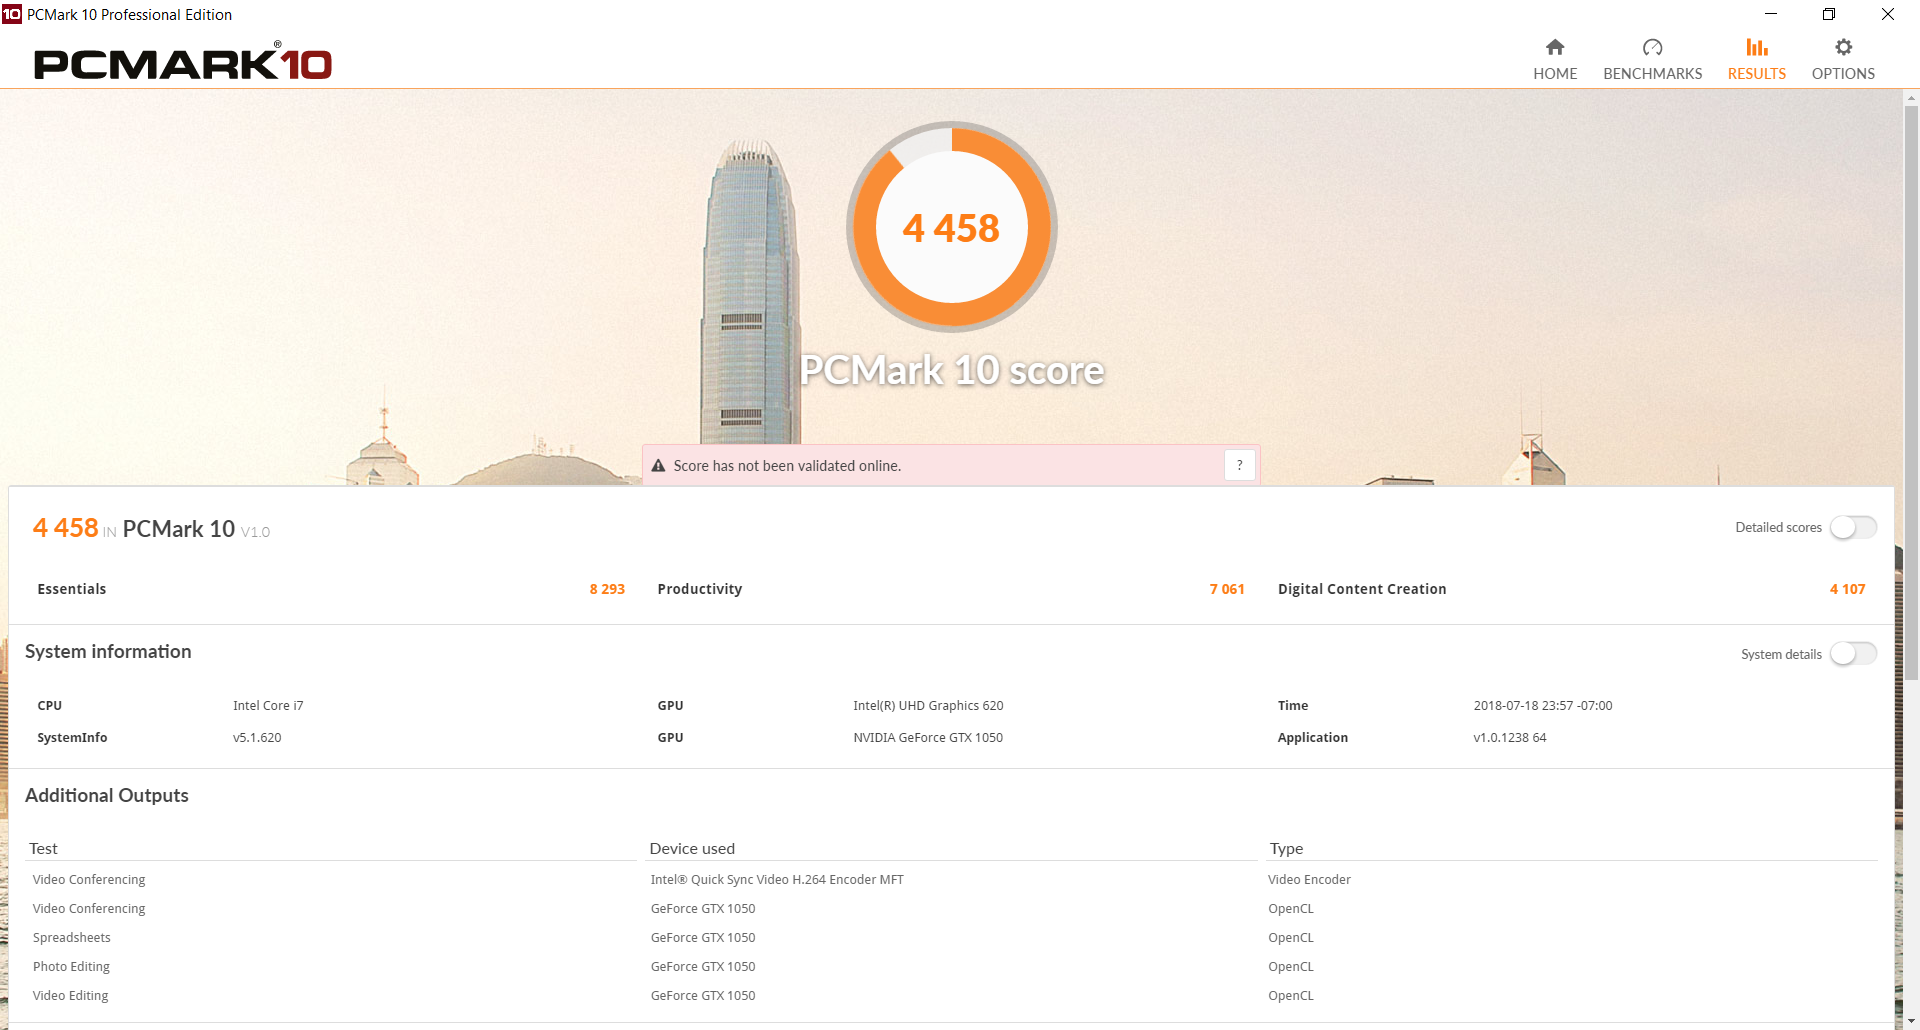
PCMark scores are within single-digit percentages from entry-level gaming notebooks like the MSI GL63 and Gigabyte Sabre 15G. We experienced no software or hardware hiccups during our time with the test unit.
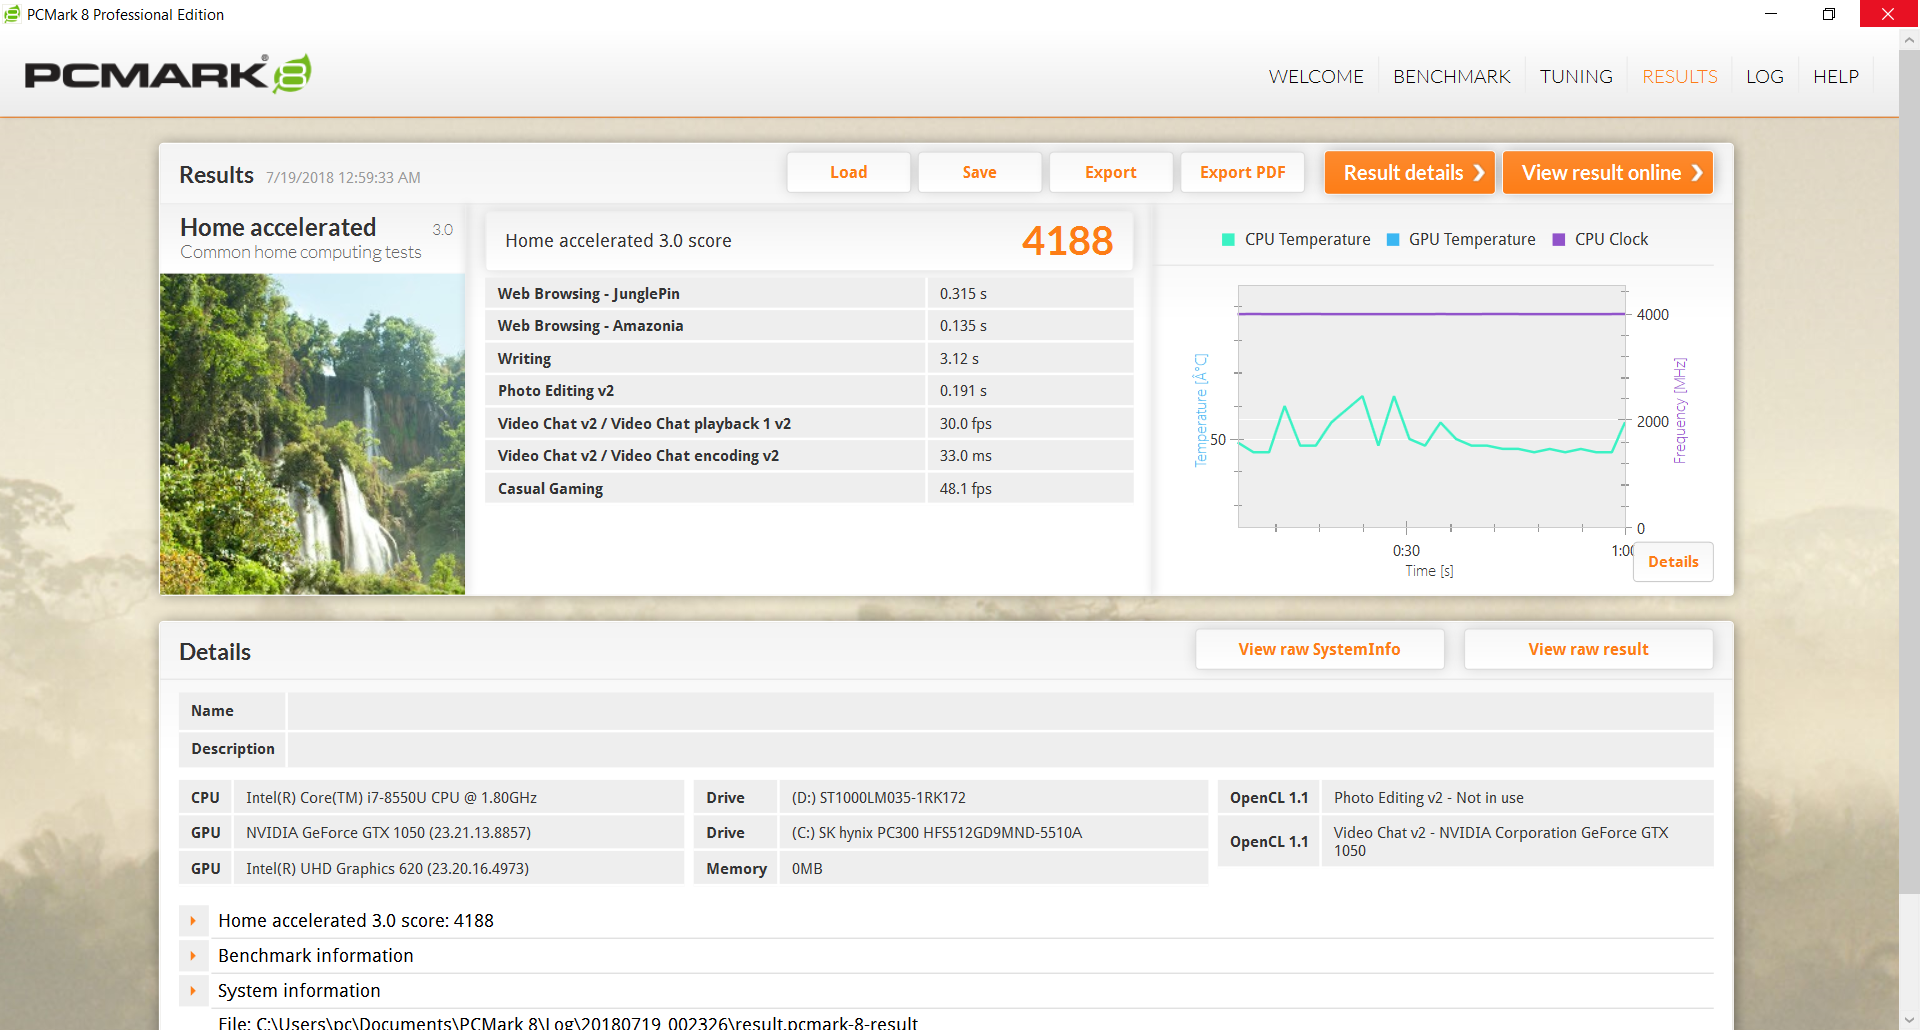
| PCMark 8 Home Score Accelerated v2 | 4188 points | |
| PCMark 10 Score | 4458 points | |
Help | ||
Storage Devices
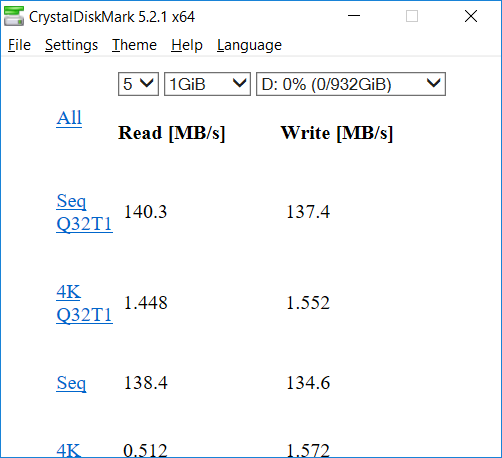
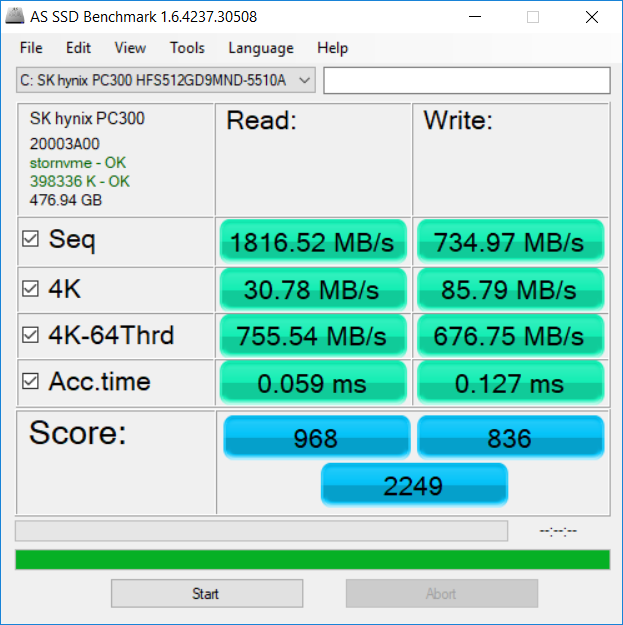
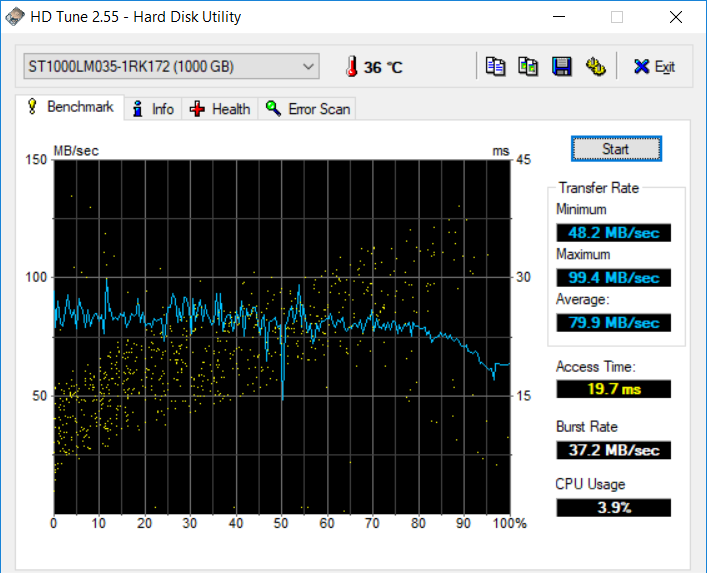
Internal storage options include M.2 2280 and a 2.5-inch SATA III bay. The PCIe x2 SK Hynix PC300 primary M.2 SSD in our test unit returns much faster transfer rates when compared to SATA III solutions as expected, but the drive still pales in comparison to PCIe x4 Samsung solutions like the PM961. Our secondary 1 TB Seagate HDD shows an average transfer rate of 80 MB/s which is typical of a 5400 RPM drive.
See our table of HDDs and SSDs for more benchmark comparisons.
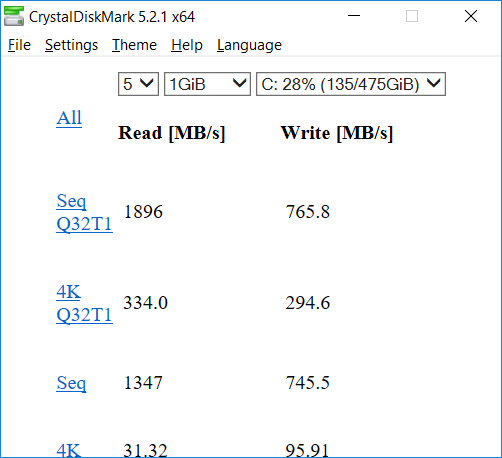
| Asus VivoBook 15 X570UD SK hynix PC300 HFS512GD9MND | Dell G5 15 5587 SK hynix SC311 M.2 | Gigabyte Sabre 15G Liteonit CV3-8D128 | MSI GL63 8RC-069US Toshiba HG6 THNSNJ256G8NY | Razer Blade 15 2018 Samsung PM961 NVMe MZVLW512HMJP | |
|---|---|---|---|---|---|
| AS SSD | -63% | -55% | -66% | 58% | |
| Copy Game MB/s (MB/s) | 792 | 130.9 -83% | 323.5 -59% | 202.6 -74% | |
| Copy Program MB/s (MB/s) | 334.3 | 95.7 -71% | 195.3 -42% | 84.8 -75% | |
| Copy ISO MB/s (MB/s) | 1265 | 146.6 -88% | 446.8 -65% | 325.6 -74% | |
| Score Total (Points) | 2249 | 557 -75% | 752 -67% | 850 -62% | 3806 69% |
| Score Write (Points) | 836 | 199 -76% | 234 -72% | 230 -72% | 1450 73% |
| Score Read (Points) | 968 | 240 -75% | 337 -65% | 410 -58% | 1584 64% |
| Access Time Write * (ms) | 0.127 | 0.066 48% | 0.073 43% | 0.061 52% | 0.038 70% |
| Access Time Read * (ms) | 0.059 | 0.128 -117% | 0.141 -139% | 0.197 -234% | 0.051 14% |
| 4K-64 Write (MB/s) | 677 | 112.4 -83% | 132.2 -80% | 127.3 -81% | 1204 78% |
| 4K-64 Read (MB/s) | 756 | 164.1 -78% | 257 -66% | 342.3 -55% | 1300 72% |
| 4K Write (MB/s) | 85.8 | 62.2 -28% | 53.8 -37% | 57.1 -33% | 93.6 9% |
| 4K Read (MB/s) | 30.78 | 24.44 -21% | 28.3 -8% | 16.18 -47% | 46.45 51% |
| Seq Write (MB/s) | 735 | 243.7 -67% | 479.8 -35% | 456.4 -38% | 1521 107% |
| Seq Read (MB/s) | 1817 | 511 -72% | 516 -72% | 512 -72% | 2376 31% |
* ... smaller is better

GPU Performance
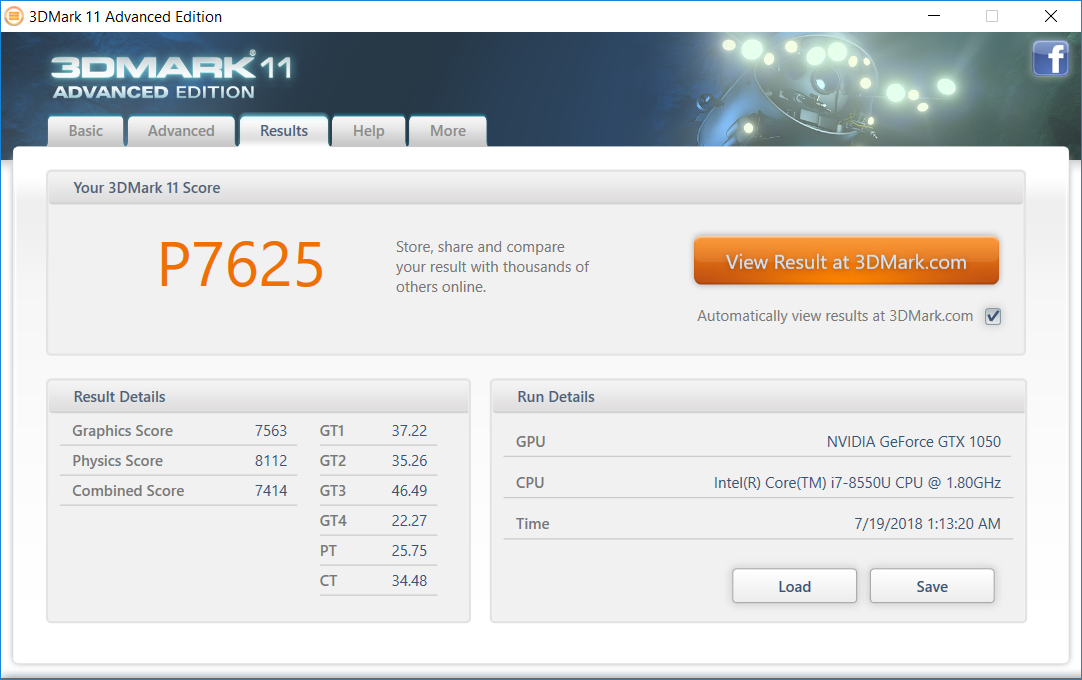
The GTX 1050 in the VivoBook is performing exactly where we expect it to be when compared to the average GTX 1050 in our database to indicate no throttling behavior. Users can expect a 50 to 60 percent raw performance increase from the GTX 960M or up to 70 to 80 percent from the GeForce MX150 commonly found on newer Ultrabooks. Demanding titles are playable in 1080p with graphical settings tuned down.
See our GeForce GTX 1050 GPU page for more technical information and benchmark comparisons.
| 3DMark 11 Performance | 7625 points | |
Help | ||
| low | med. | high | ultra | |
|---|---|---|---|---|
| BioShock Infinite (2013) | 227 | 172.2 | 152.9 | 61.3 |
| The Witcher 3 (2015) | 19 |
Stress Test
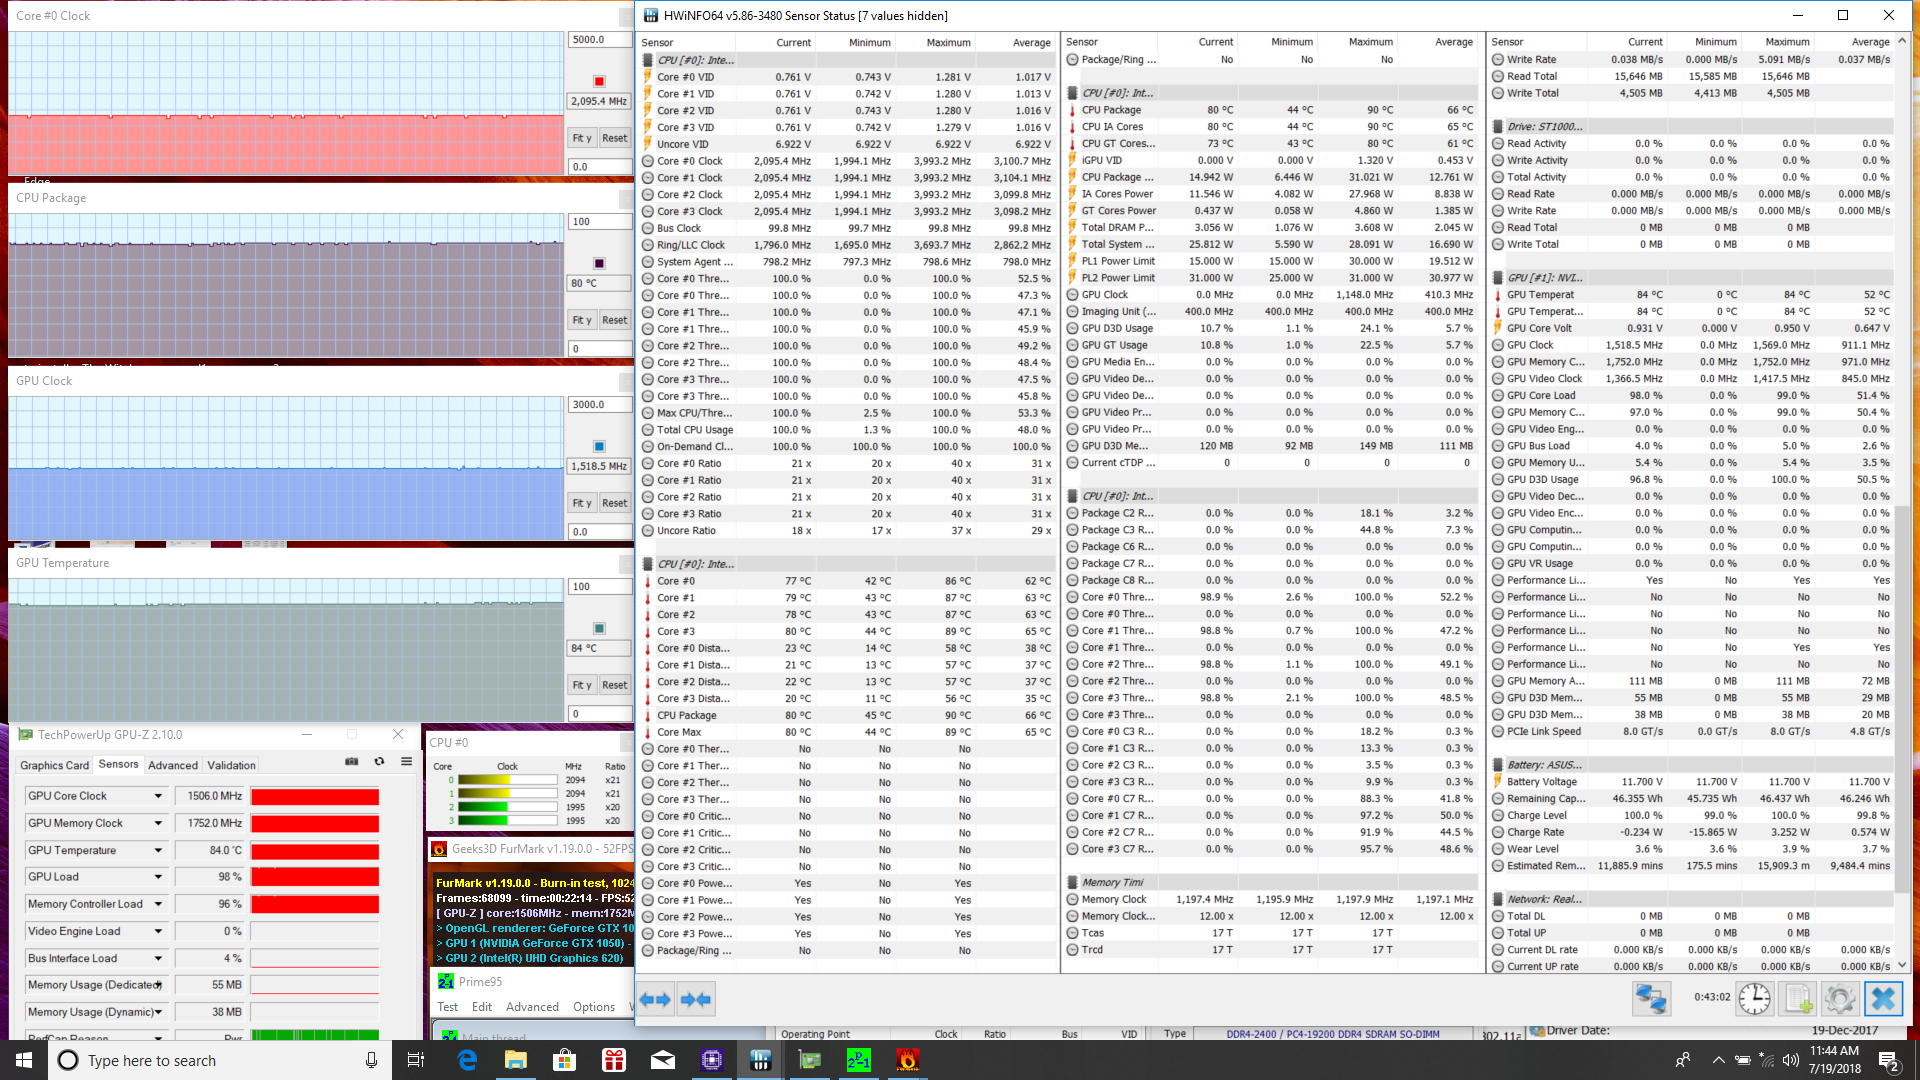
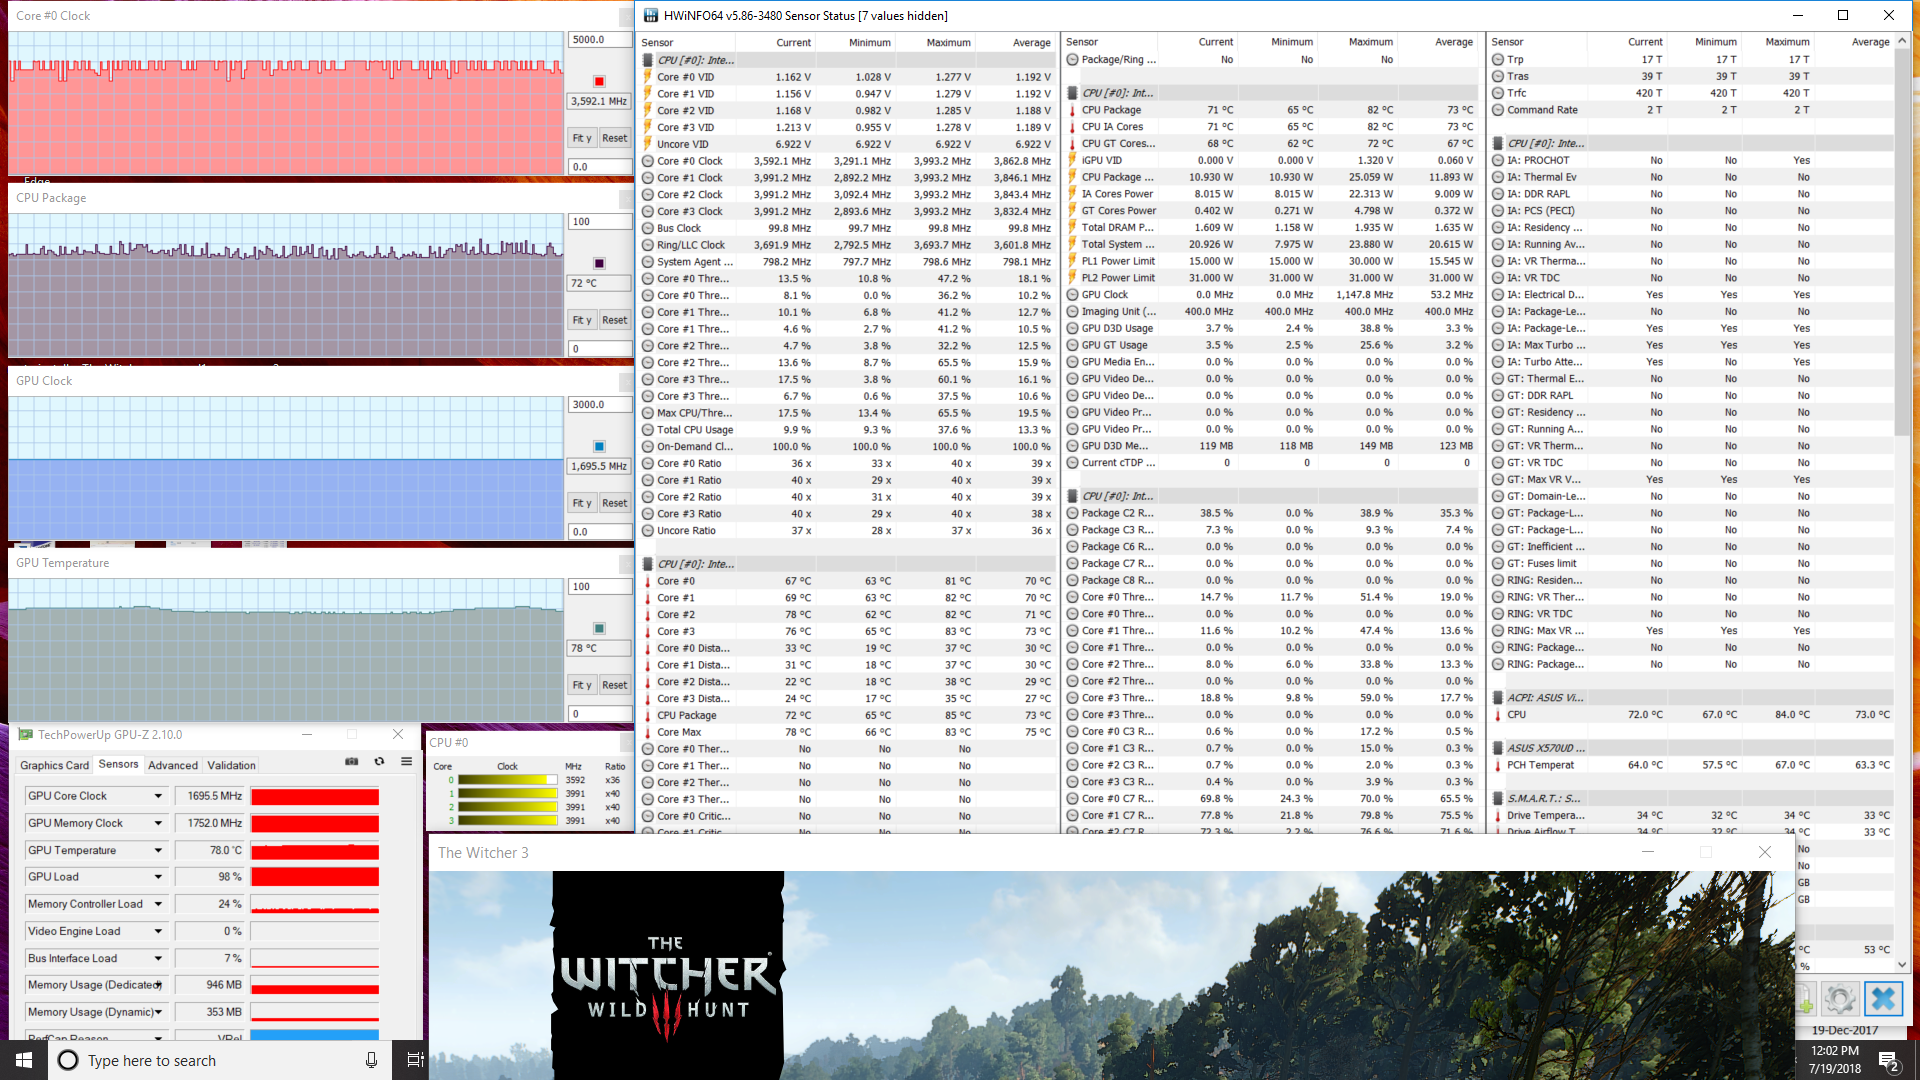
We stress the notebook with synthetic benchmarks to identify for any potential throttling issues. When subjected to Prime95 stress, the CPU can be observed running at 3.2 GHz for the first few seconds before reaching 82 C. Once this temperature threshold is reached, the clock rate will throttle down to 2.3 GHz in order to maintain a cooler core temperature. This behavior mirrors our CineBench loop test results from above. When under Prime95 and FurMark stress, core temperatures will settle in the mid 80 C range.
Running Witcher 3 is more representative of real-world gaming loads. CPU and GPU temperatures stabilize in the 70 C range each with steady performance throughout.
Running on battery power will limit both CPU and GPU performance. A 3DMark 11 run on batteries returns Physics and Graphics scores of 6689 and 5097 points, respectively, compared to 8112 and 7563 points when on mains.
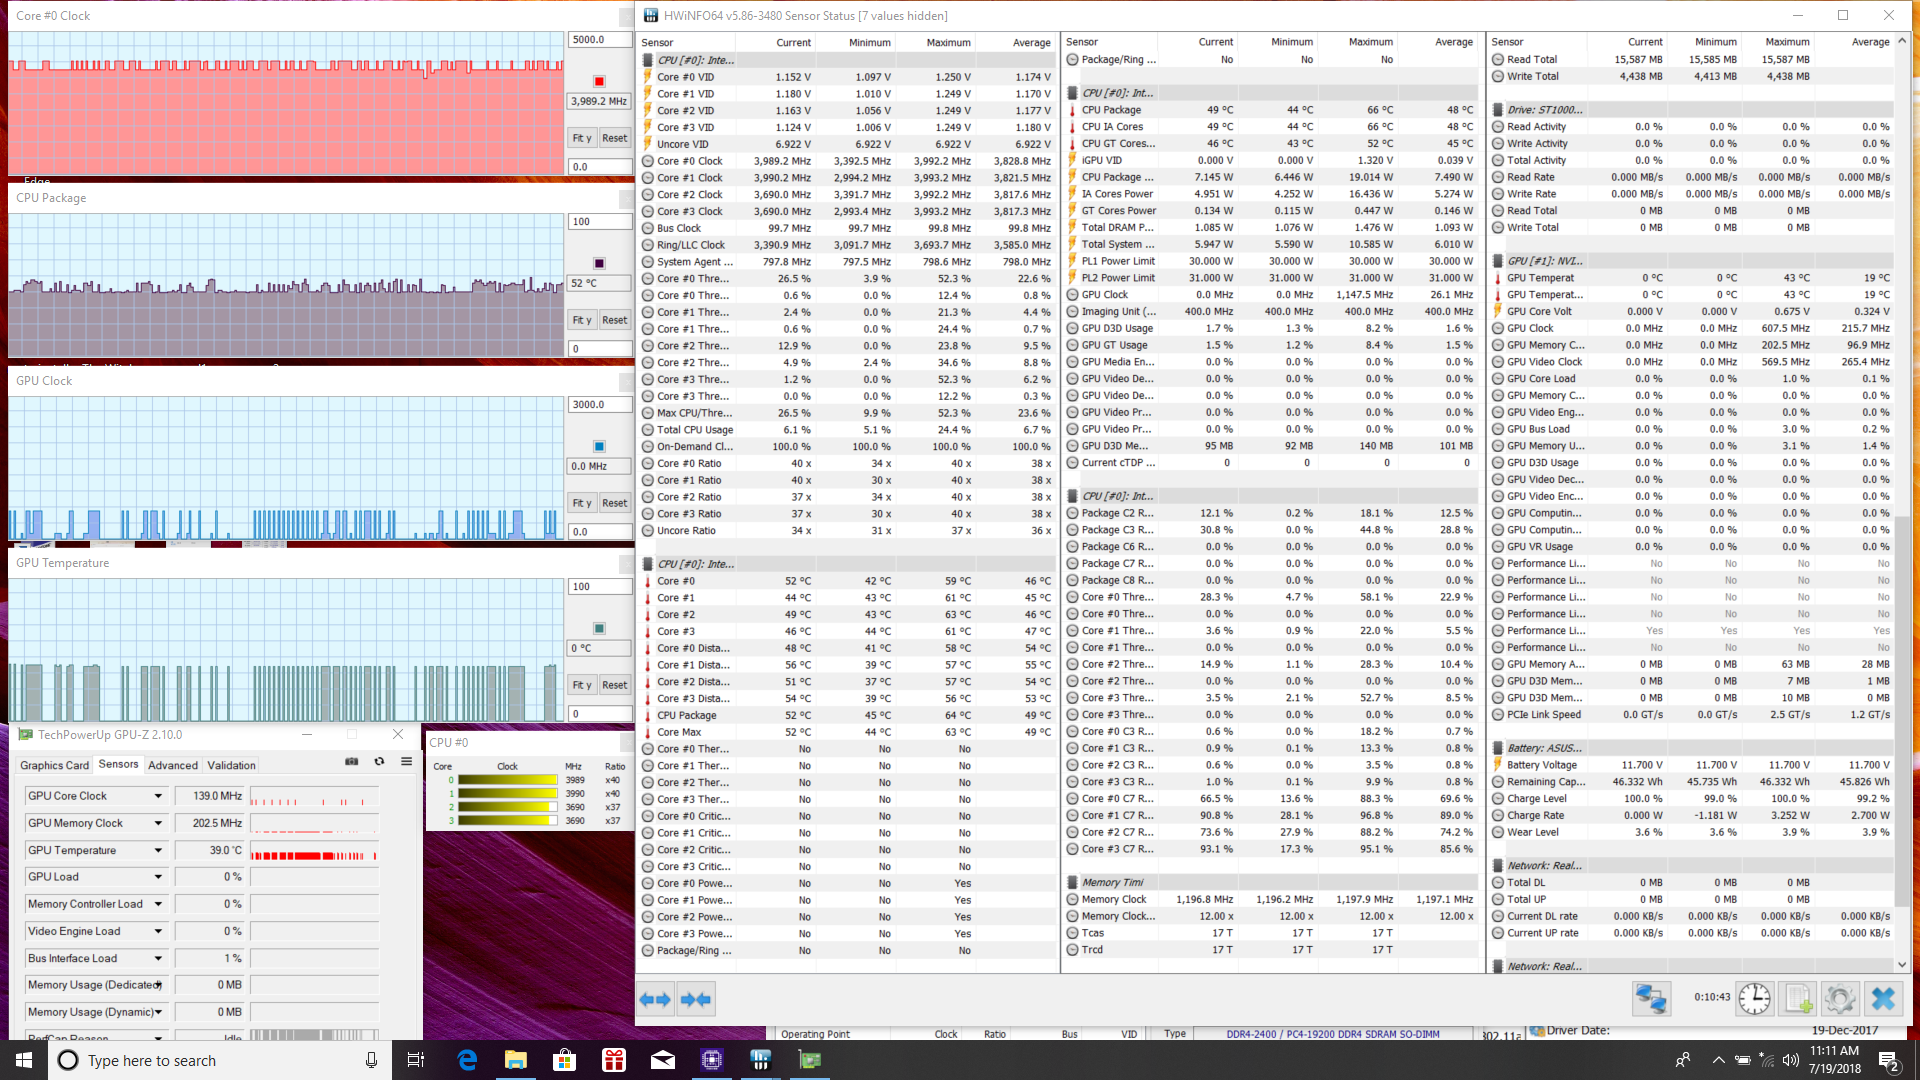
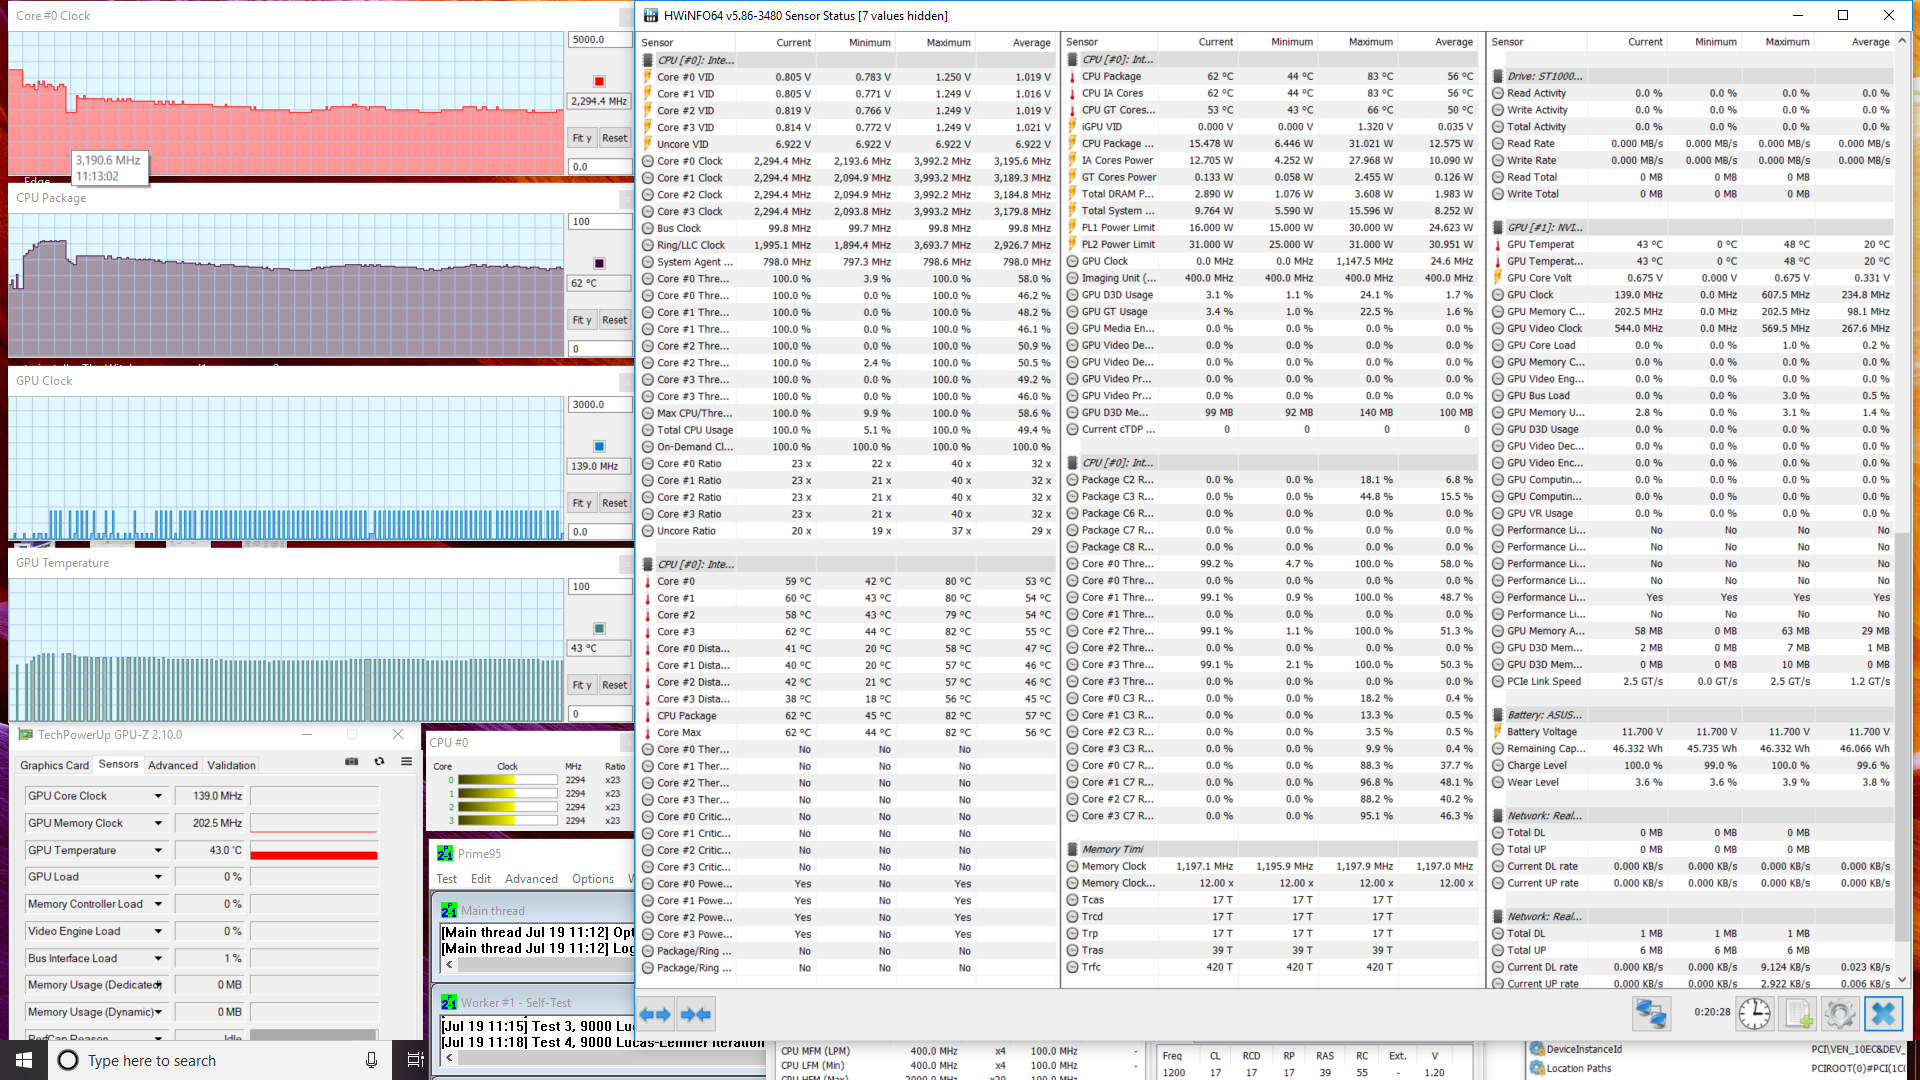
| CPU Clock (GHz) | GPU Clock (MHz) | Average CPU Temperature (°C) | Average GPU Temperature (°C) | |
| Prime95 Stress | 2.3 | -- | 62 | -- |
| FurMark Stress | -- | 1519 | 72 | 81 |
| Prime95 + FurMark Stress | 2.1 | 1519 | 80 | 84 |
| Witcher 3 Stress | 3.6 - 3.9 | 1696 | 72 | 78 |
Emissions
System Noise
The cooling solution consists of one fan and two heat pipes for both the CPU and GPU. When idling, fan noise is essentially unnoticeable in even quiet environments. Unfortunately, the fan can be sensitive to onscreen loads and so we recommend the Power Saver profile if streaming or browsing.
Higher loads like gaming can be as loud as 44 dB(A) to be louder than the MSI GL63 but comparable to the old Pavilion 15 Power. Despite not being advertised as a gaming notebook, the X570UD can certainly sound like one.
We can notice no electronic noise or coil whine on our test unit.
Noise level
| Idle |
| 29.3 / 29.5 / 30.5 dB(A) |
| Load |
| 41.2 / 47.2 dB(A) |
 | ||
30 dB silent 40 dB(A) audible 50 dB(A) loud |
||
min: | ||
| Asus VivoBook 15 X570UD GeForce GTX 1050 Mobile, i5-8550U, SK hynix PC300 HFS512GD9MND | Dell G5 15 5587 GeForce GTX 1060 Max-Q, i5-8300H, SK hynix SC311 M.2 | HP Pavilion 15 Power 1GK62AV GeForce GTX 1050 Mobile, i7-7700HQ, SK Hynix HFS256G39TND-N210A | Gigabyte Sabre 15G GeForce GTX 1050 Mobile, i7-7700HQ, Liteonit CV3-8D128 | Asus FX503VM-EH73 GeForce GTX 1060 Mobile, i7-7700HQ, SanDisk SD8SN8U128G1002 | MSI GL63 8RC-069US GeForce GTX 1050 Mobile, i5-8300H, Toshiba HG6 THNSNJ256G8NY | |
|---|---|---|---|---|---|---|
| Noise | -0% | -5% | -10% | -2% | -2% | |
| off / environment * (dB) | 29.2 | 30.3 -4% | 27.8 5% | 28.2 3% | 27.8 5% | 28.6 2% |
| Idle Minimum * (dB) | 29.3 | 31.1 -6% | 32.1 -10% | 33 -13% | 29.6 -1% | 28.6 2% |
| Idle Average * (dB) | 29.5 | 31.1 -5% | 32.2 -9% | 33.3 -13% | 29.6 -0% | 31.6 -7% |
| Idle Maximum * (dB) | 30.5 | 34.2 -12% | 32.2 -6% | 34.7 -14% | 29.6 3% | 31.6 -4% |
| Load Average * (dB) | 41.2 | 34.9 15% | 43.3 -5% | 44.5 -8% | 37.3 9% | 38.6 6% |
| Witcher 3 ultra * (dB) | 44 | 42.7 3% | 45 -2% | 49.2 -12% | 49.8 -13% | 40.6 8% |
| Load Maximum * (dB) | 47.2 | 44 7% | 49.6 -5% | 52.8 -12% | 53.7 -14% | 56.8 -20% |
* ... smaller is better
Temperature
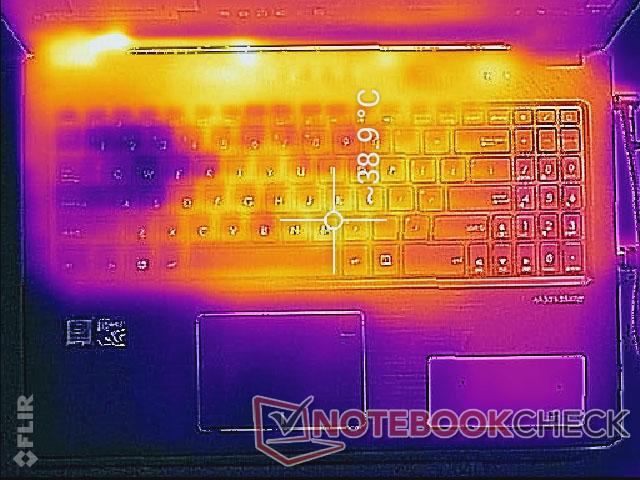
When idling, the keyboard and palm rests are cool while the bottom rear of the notebook can be noticeably warmer by several degrees. The right palm rest in particular will always be warmer than the left because the 2.5-inch drive is installed directly underneath.
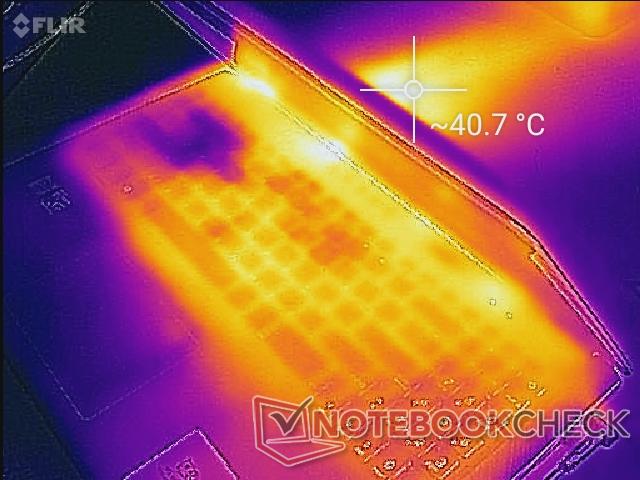
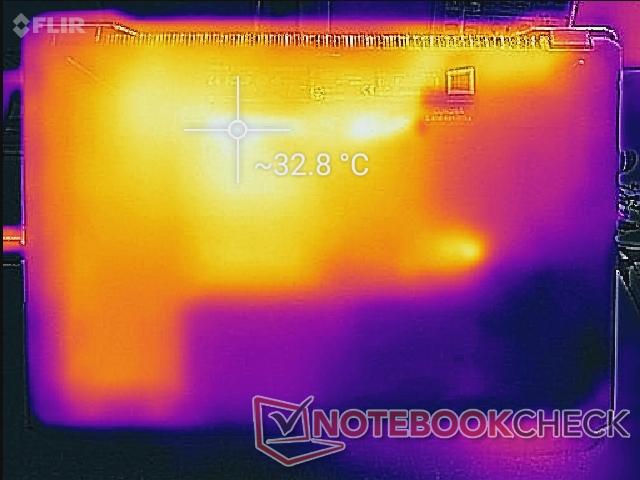
When under heavy load, the center keyboard and bottom surfaces can be as warm as 40 C and 50 C, respectively. Fortunately, the WASD keys remain relatively cool and the bottom hot spot is towards the rear of the unit as illustrated by our temperature maps below. The warm surfaces never become uncomfortable when typing or gaming on a flat desk.
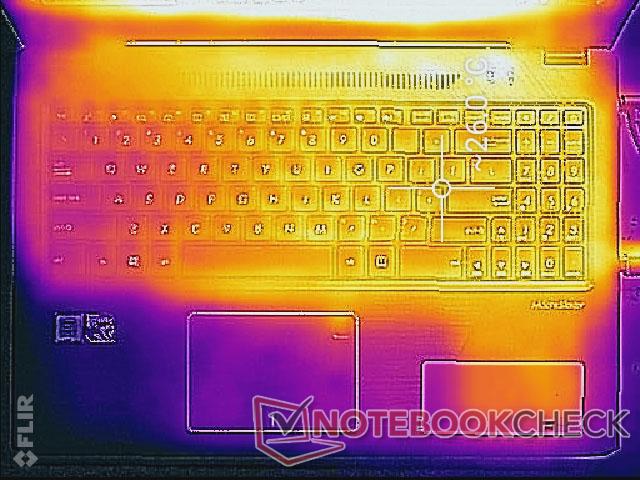
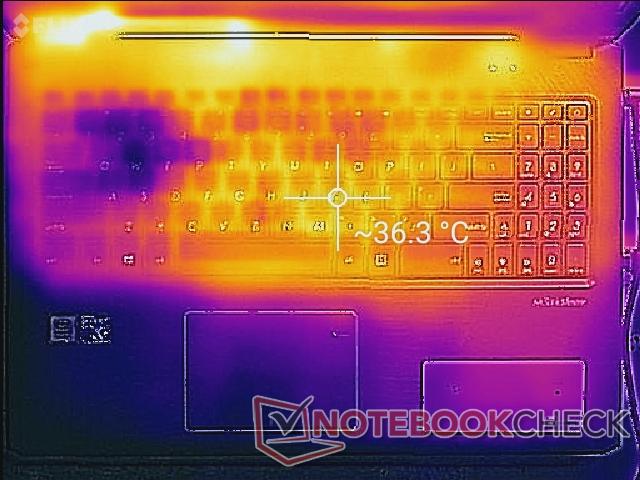

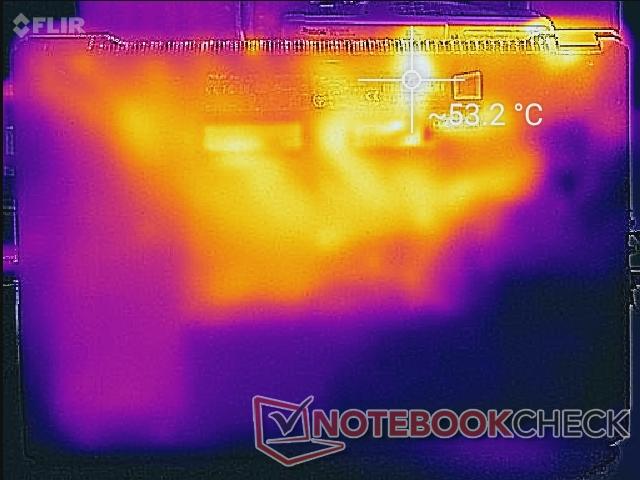
(+) The maximum temperature on the upper side is 39.8 °C / 104 F, compared to the average of 36.8 °C / 98 F, ranging from 21 to 71 °C for the class Multimedia.
(-) The bottom heats up to a maximum of 53.4 °C / 128 F, compared to the average of 39.1 °C / 102 F
(+) In idle usage, the average temperature for the upper side is 24.7 °C / 76 F, compared to the device average of 31.3 °C / 88 F.
(+) Playing The Witcher 3, the average temperature for the upper side is 30.5 °C / 87 F, compared to the device average of 31.3 °C / 88 F.
(+) The palmrests and touchpad are cooler than skin temperature with a maximum of 28 °C / 82.4 F and are therefore cool to the touch.
(±) The average temperature of the palmrest area of similar devices was 28.7 °C / 83.7 F (+0.7 °C / 1.3 F).
Speakers

The stereo 2 W speakers offer decent sound quality when considering the price. Bass is average, but the palm rests reverberate more noticeably when on higher volume settings compared to other laptops. Expect to bump up the volume for videos and movies since the maximum output is on the modest side.
Asus VivoBook 15 X570UD audio analysis
(-) | not very loud speakers (68.5 dB)
Bass 100 - 315 Hz
(±) | reduced bass - on average 12.7% lower than median
(±) | linearity of bass is average (14.7% delta to prev. frequency)
Mids 400 - 2000 Hz
(+) | balanced mids - only 3.9% away from median
(±) | linearity of mids is average (9.3% delta to prev. frequency)
Highs 2 - 16 kHz
(±) | higher highs - on average 5.5% higher than median
(±) | linearity of highs is average (11% delta to prev. frequency)
Overall 100 - 16.000 Hz
(±) | linearity of overall sound is average (23.5% difference to median)
Compared to same class
» 83% of all tested devices in this class were better, 6% similar, 12% worse
» The best had a delta of 5%, average was 17%, worst was 45%
Compared to all devices tested
» 70% of all tested devices were better, 6% similar, 24% worse
» The best had a delta of 4%, average was 24%, worst was 134%
Apple MacBook 12 (Early 2016) 1.1 GHz audio analysis
(+) | speakers can play relatively loud (83.6 dB)
Bass 100 - 315 Hz
(±) | reduced bass - on average 11.3% lower than median
(±) | linearity of bass is average (14.2% delta to prev. frequency)
Mids 400 - 2000 Hz
(+) | balanced mids - only 2.4% away from median
(+) | mids are linear (5.5% delta to prev. frequency)
Highs 2 - 16 kHz
(+) | balanced highs - only 2% away from median
(+) | highs are linear (4.5% delta to prev. frequency)
Overall 100 - 16.000 Hz
(+) | overall sound is linear (10.2% difference to median)
Compared to same class
» 7% of all tested devices in this class were better, 2% similar, 91% worse
» The best had a delta of 5%, average was 18%, worst was 53%
Compared to all devices tested
» 5% of all tested devices were better, 1% similar, 94% worse
» The best had a delta of 4%, average was 24%, worst was 134%
Energy Management
Power Consumption
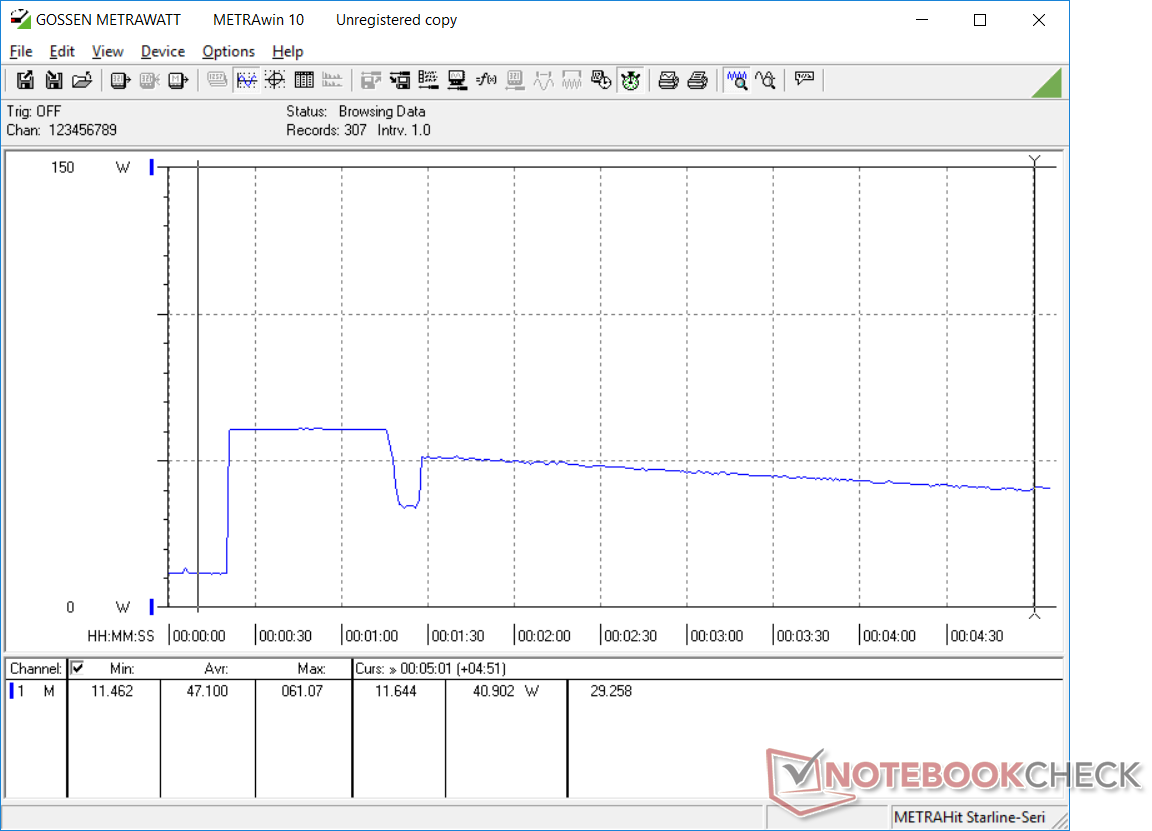
Power consumption is slightly below the Sabre 15G and GL63 when under load since these competing systems utilize more demanding 45 W HQ-class CPUs. Maximum load demands 103 W from a medium-sized (~15.8 x 7.5 x 2.8 cm) 120 W AC adapter.
When running Prime95, the system will draw as much as 61 W before gradually falling to 41 W as shown by our graph on the right. The results indicate unsustainable Turbo Boost potential to reflect our stress tests and CineBench loop tests above.
| Off / Standby | |
| Idle | |
| Load |
|
Key:
min: | |
| Asus VivoBook 15 X570UD i5-8550U, GeForce GTX 1050 Mobile, SK hynix PC300 HFS512GD9MND, IPS, 1920x1080, 15.6" | Dell G5 15 5587 i5-8300H, GeForce GTX 1060 Max-Q, SK hynix SC311 M.2, IPS, 1920x1080, 15.6" | Gigabyte Sabre 15G i7-7700HQ, GeForce GTX 1050 Mobile, Liteonit CV3-8D128, IPS, 1920x1080, 15.6" | MSI GL63 8RC-069US i5-8300H, GeForce GTX 1050 Mobile, Toshiba HG6 THNSNJ256G8NY, IPS, 1920x1080, 15.6" | Asus FX503VM-EH73 i7-7700HQ, GeForce GTX 1060 Mobile, SanDisk SD8SN8U128G1002, IPS, 1920x1080, 15.6" | Razer Blade 15 GTX 1060 i7-8750H, GeForce GTX 1060 Max-Q, Samsung SSD PM981 MZVLB512HAJQ, IPS, 1920x1080, 15.6" | |
|---|---|---|---|---|---|---|
| Power Consumption | -16% | -24% | -23% | -68% | -92% | |
| Idle Minimum * (Watt) | 5.1 | 4.9 4% | 8 -57% | 7.1 -39% | 12.8 -151% | 14.9 -192% |
| Idle Average * (Watt) | 6.3 | 8.5 -35% | 10.9 -73% | 9.8 -56% | 15.4 -144% | 17.5 -178% |
| Idle Maximum * (Watt) | 10.5 | 9.1 13% | 11 -5% | 10.4 1% | 15.9 -51% | 19.2 -83% |
| Load Average * (Watt) | 82.2 | 90.7 -10% | 76.7 7% | 88.8 -8% | 78 5% | 103.2 -26% |
| Witcher 3 ultra * (Watt) | 85.9 | 110 -28% | 94.9 -10% | 93.3 -9% | 107.3 -25% | 123.1 -43% |
| Load Maximum * (Watt) | 103.2 | 144 -40% | 106.4 -3% | 132.5 -28% | 143.4 -39% | 132.7 -29% |
* ... smaller is better
Battery Life
Expect just under 5.5 hours of real-world WLAN use when set to the Balanced profile. Runtimes are generally longer than a traditional gaming laptop while being a few hours shorter than the latest Ultrabooks with slower integrated graphics.
| Asus VivoBook 15 X570UD i5-8550U, GeForce GTX 1050 Mobile, 48 Wh | Dell G5 15 5587 i5-8300H, GeForce GTX 1060 Max-Q, 56 Wh | Gigabyte Sabre 15G i7-7700HQ, GeForce GTX 1050 Mobile, 47 Wh | MSI GL63 8RC-069US i5-8300H, GeForce GTX 1050 Mobile, 41 Wh | Acer Swift 3 SF315-41-R6J9 R7 2700U, Vega 10, 49 Wh | Asus ZenBook UX530UX-FY070T i7-7500U, GeForce GTX 950M, 50 Wh | |
|---|---|---|---|---|---|---|
| Battery runtime | 23% | -17% | -19% | 0% | 17% | |
| WiFi v1.3 (h) | 5.3 | 6.5 23% | 4.4 -17% | 4.3 -19% | 5.3 0% | 6.2 17% |
| Reader / Idle (h) | 11.8 | 8.2 | 7.3 | 13.3 | 8.8 | |
| Load (h) | 2.2 | 1.3 | 0.7 | 1.3 | 1.8 |
Pros
Cons
Verdict

The Asus X570UD proves that you don't need an Intel HQ-class CPU to play the latest games. The 15 W Kaby Lake-R series offers a performance level in between that of the 45 W Core i5-7300HQ and i7-7700HQ commonly found on inexpensive gaming laptops. The lower cooling requirements mean a lighter and more portable system without sacrificing gaming performance or uncomfortably high core temperatures. The i7-8550U and GTX 1050 pairing is something we'd love to see on more thin-and-light gaming laptops not unlike the older Blade 14 and its i7-7500U and GTX 960M.
Of course, there are some cut corners to be aware of since the Vivobook is a budget-mainstream offering. The weak keyboard and trackpad leave a cheap impression and the poor serviceability is a hindrance to users who want to upgrade storage or RAM. Other than these drawbacks, the X570UD/K570UD is a good balance for on-the-go students who want something affordable, lightweight, and also capable of playing the latest games.
Lighter than the Dell G5, Lenovo Legion Y520, and Gigabyte Sabre 15 while being just as powerful and inexpensive. The Asus Vivobook K570UD/X570UD skips the luxuries for an adequate core experience and respectable gaming prowess.
Asus VivoBook 15 X570UD
- 07/22/2018 v6 (old)
Allen Ngo
Price comparison
