Schenker VIA 15 Laptop Review: a lightweight AMD notebook

At CES 2020, Schenker announced their business notebook VIA 15 - the manufacturer's first AMD model in over a decade. The device is currently equipped with chips from AMD's Raven Ridge series, but there might be an overhauled version of the device featuring Renoir CPUs if the model is a success.
Our configuration of the Schenker VIA 15 is available for around 900 Euro (~$990), which makes it slightly more expensive than similarly equipped notebooks. Any device in our database can be added to the comparison devices below every section.
Rating | Date | Model | Weight | Height | Size | Resolution | Price |
|---|---|---|---|---|---|---|---|
| 83.3 % v7 (old) | 04 / 2020 | Schenker VIA 15 R5 3500U, Vega 8 | 1.4 kg | 17 mm | 15.60" | 1920x1080 | |
| 81.8 % v7 (old) | 02 / 2020 | Lenovo ThinkBook 15 i5-10210U, UHD Graphics 620 | 1.9 kg | 18.9 mm | 15.60" | 1920x1080 | |
| 79.5 % v7 (old) | 09 / 2019 | HP ProBook 455R G6 R5 3500U, Vega 8 | 2 kg | 19 mm | 15.60" | 1920x1080 | |
| 85.2 % v7 (old) | 03 / 2020 | Huawei MateBook D 15-53010TUY R5 3500U, Vega 8 | 1.5 kg | 16.9 mm | 15.60" | 1920x1080 | |
| 78.4 % v7 (old) | 11 / 2019 | Acer Aspire 5 A515-43-R6WW R5 3500U, Vega 8 | 1.8 kg | 18 mm | 15.60" | 1920x1080 |
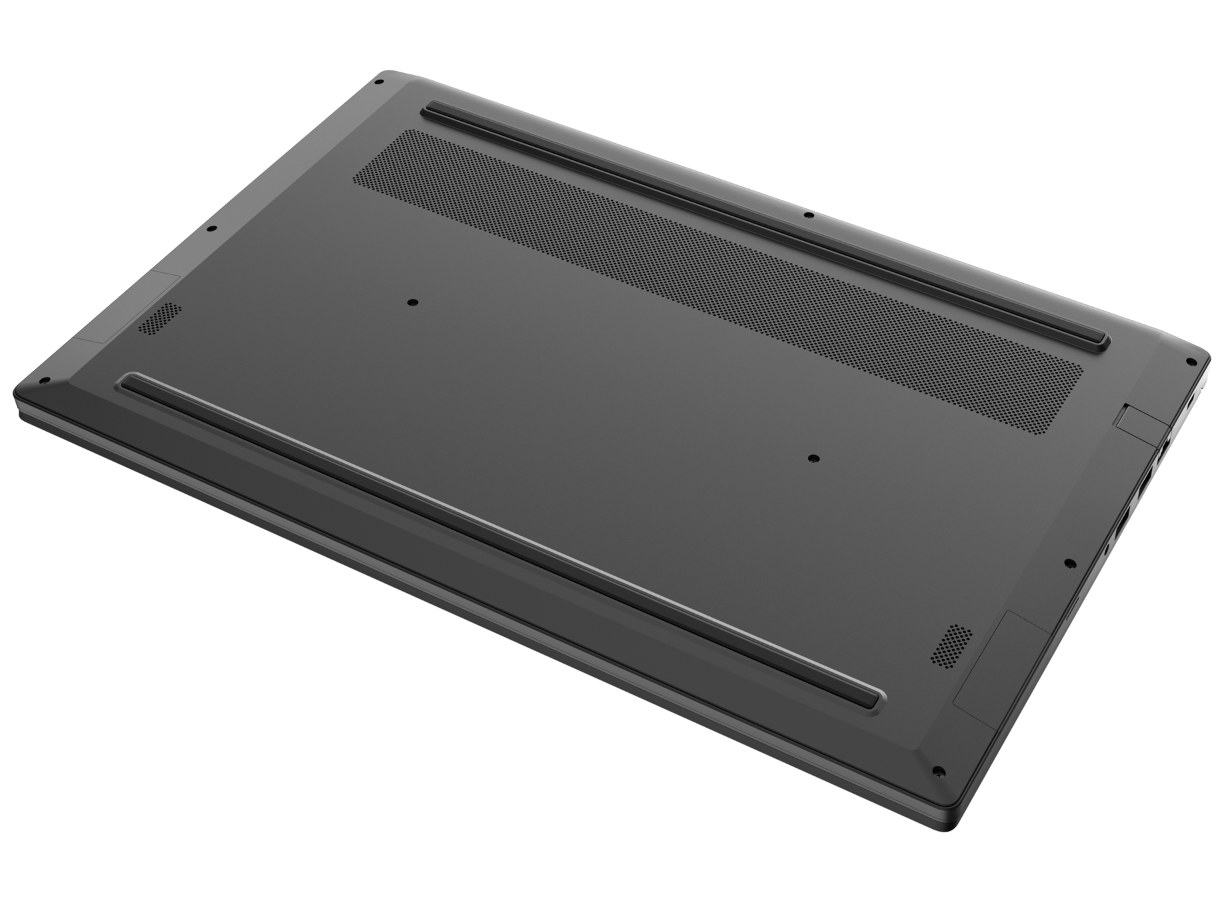
Case & Connectivity - fast Wi-Fi with the VIA 15
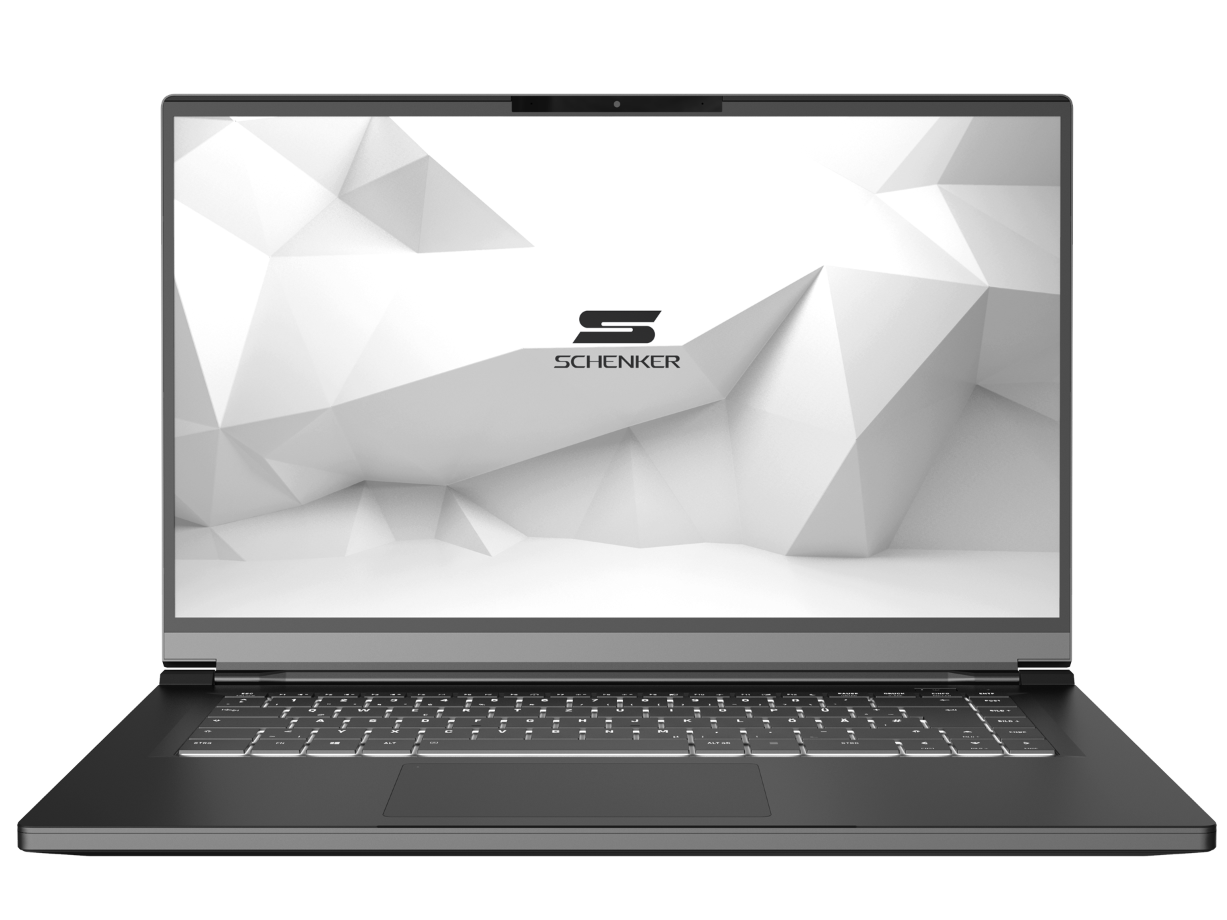
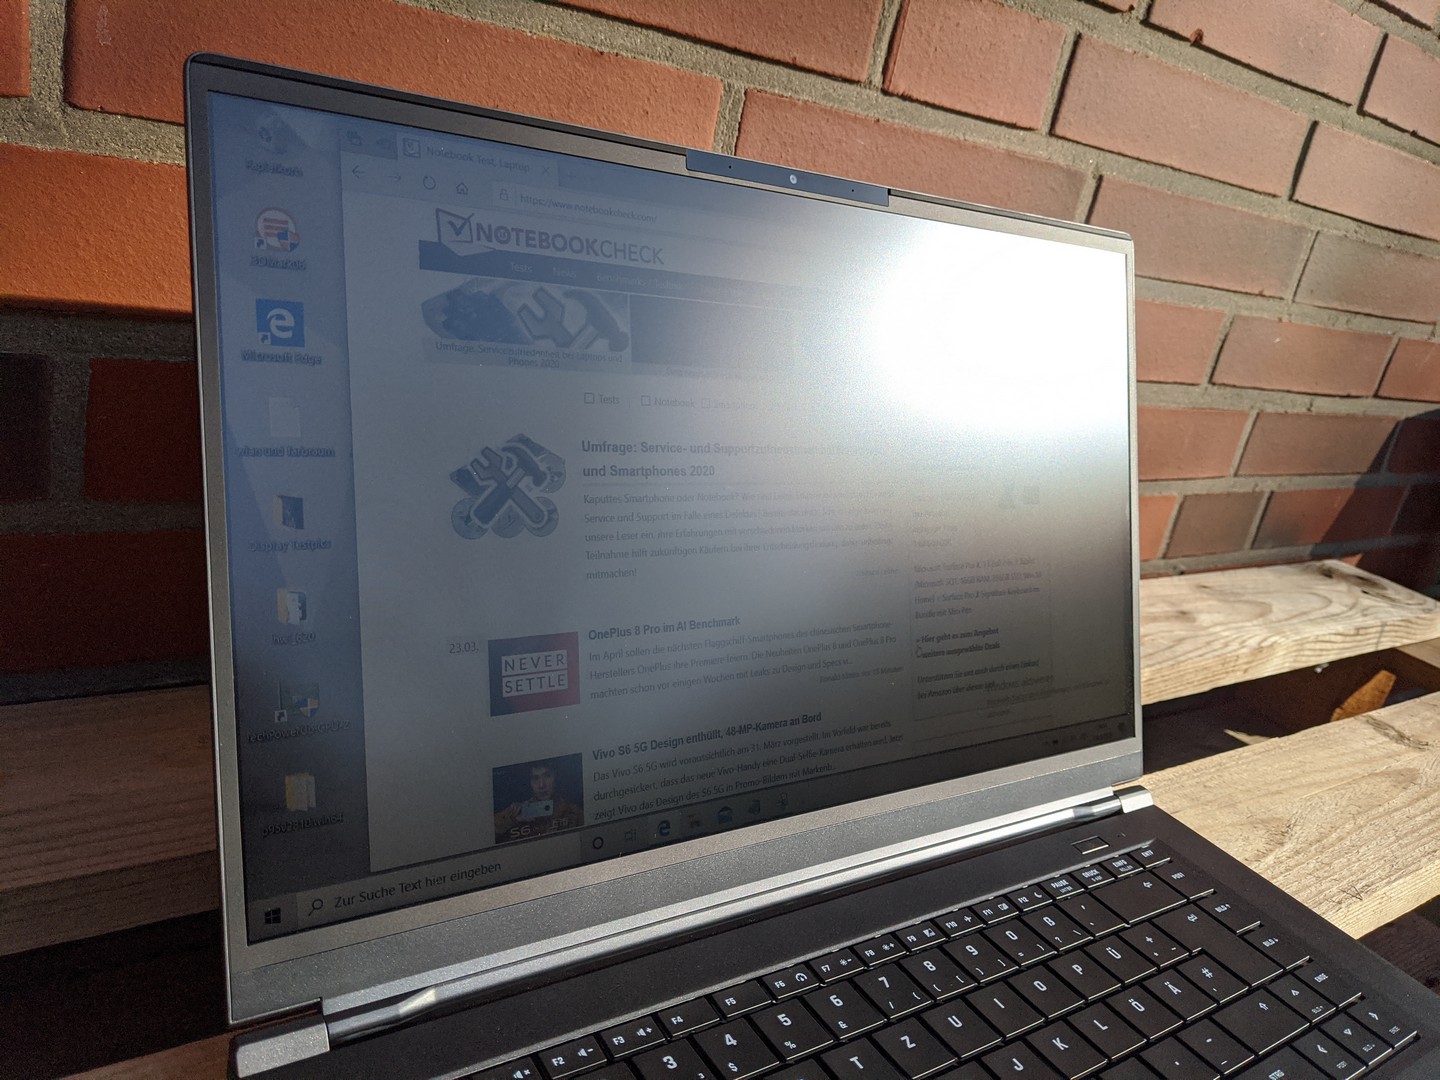
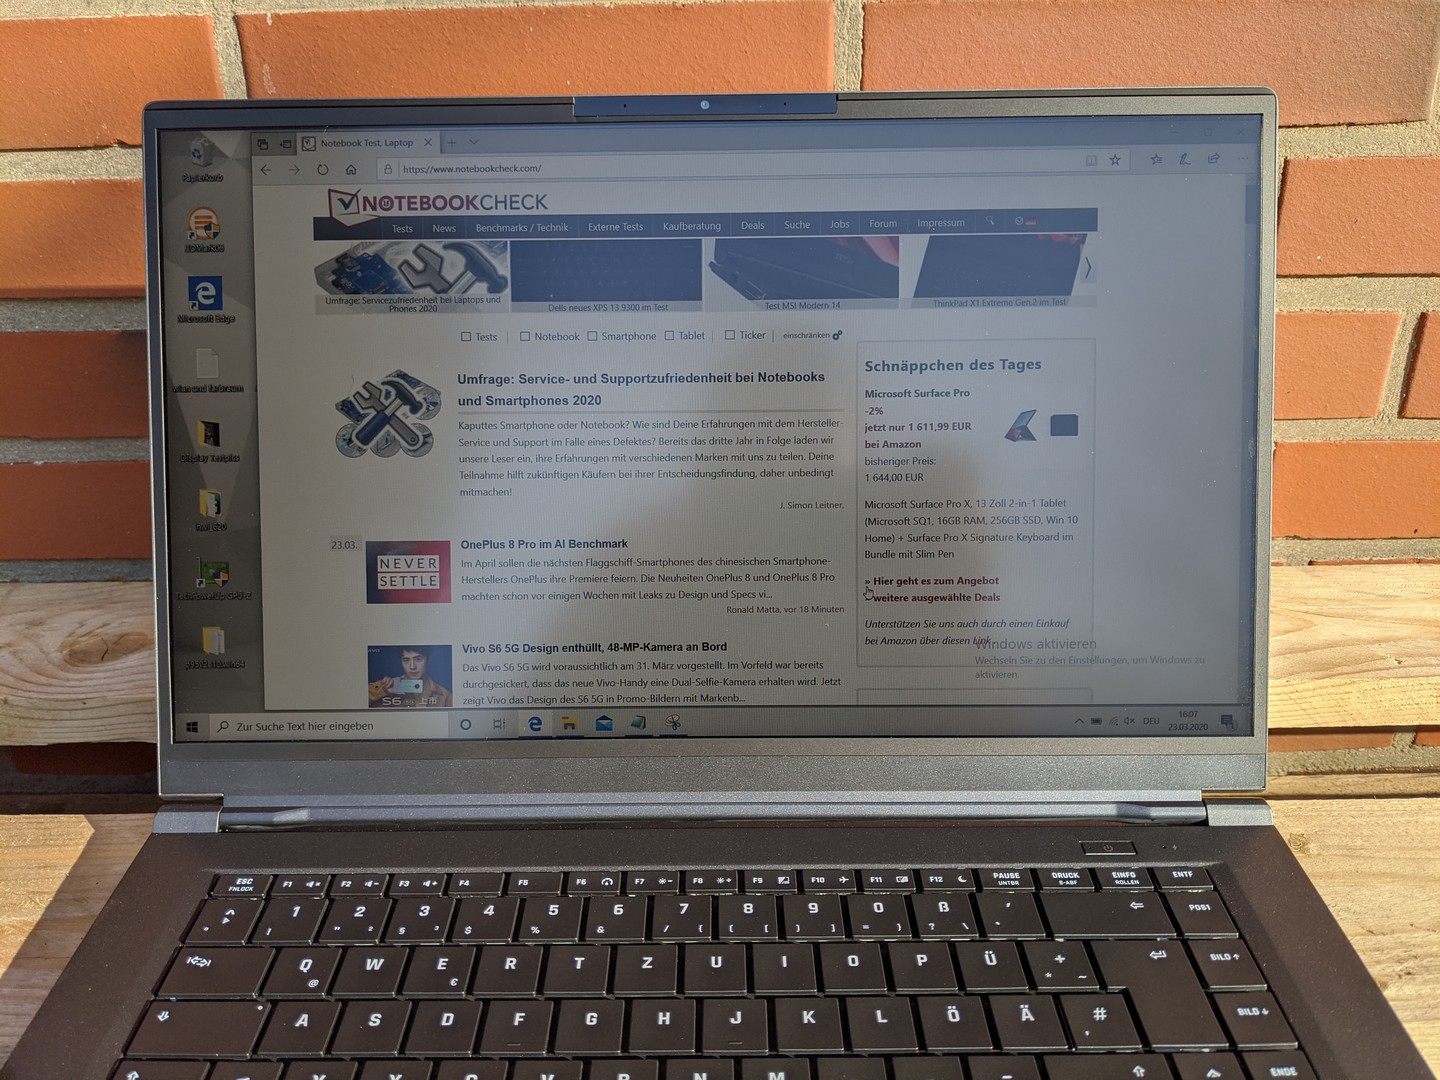
Schenker has chosen a magnesium alloy case, which makes the 15-inch notebook light and solid. The design is simple and functional but attractive nonetheless. We did not notice any issues in terms of the workmanship, which seems to be of high quality. The device weighs 1.4 kg (~3.1 lbs), which makes it the lightest notebook in our comparison field. Its narrow bezels also make it slimmer than the HP ProBook 455R G6 and Acer Aspire 5 A515, for example. The hinges are fairly tight and you will need two hands to open the notebook.
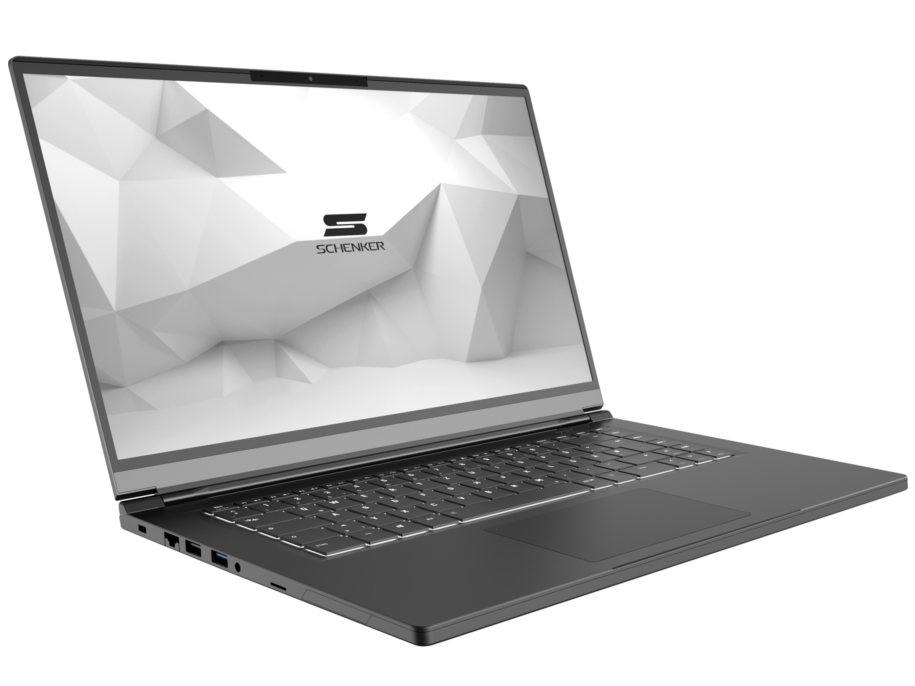
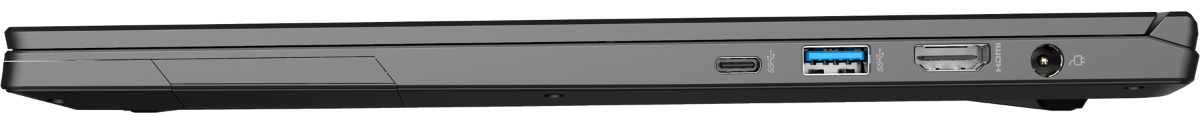
Apart from its decent basic port selection, the VIA 15 also includes a microSD card slot. This only reaches low transfer rates in our test with our reference card Toshiba Exceria Pro SDXC 64 GB UHS-II. The opposite can be said for the Wi-Fi module, which positions our test unit at the top of the comparison field in our test with the reference router Netgear Nighthawk AX12 thanks to its fast Wi-Fi 6 standard (802.11 ax).
However, a bug occurred during our tests which prevented Wi-Fi from working when the laptop was activated from standby. We managed to fix the issue with a BIOS update and by installing the newest Intel drivers. According to Schenker, models that are delivered now should not have this issue any more.
The included webcam offers the usual 0.9 MP with a resolution of 1280 x 720 pixels. Colors are displayed brighter than they should be and our test chart is rather blurry with noticeable difficulties displaying details.
Port Selection


| SD Card Reader | |
| average JPG Copy Test (av. of 3 runs) | |
| HP ProBook 455R G6 (Toshiba Exceria Pro SDXC 64 GB UHS-II) | |
| Lenovo ThinkBook 15 (Toshiba Exceria Pro SDXC 64 GB UHS-II) | |
| Average of class Office (22.4 - 198.5, n=22, last 2 years) | |
| Schenker VIA 15 | |
| maximum AS SSD Seq Read Test (1GB) | |
| HP ProBook 455R G6 (Toshiba Exceria Pro SDXC 64 GB UHS-II) | |
| Lenovo ThinkBook 15 (Toshiba Exceria Pro SDXC 64 GB UHS-II) | |
| Average of class Office (27.4 - 249, n=20, last 2 years) | |
| Schenker VIA 15 (Toshiba Exceria Pro M501 64 GB UHS-II) | |


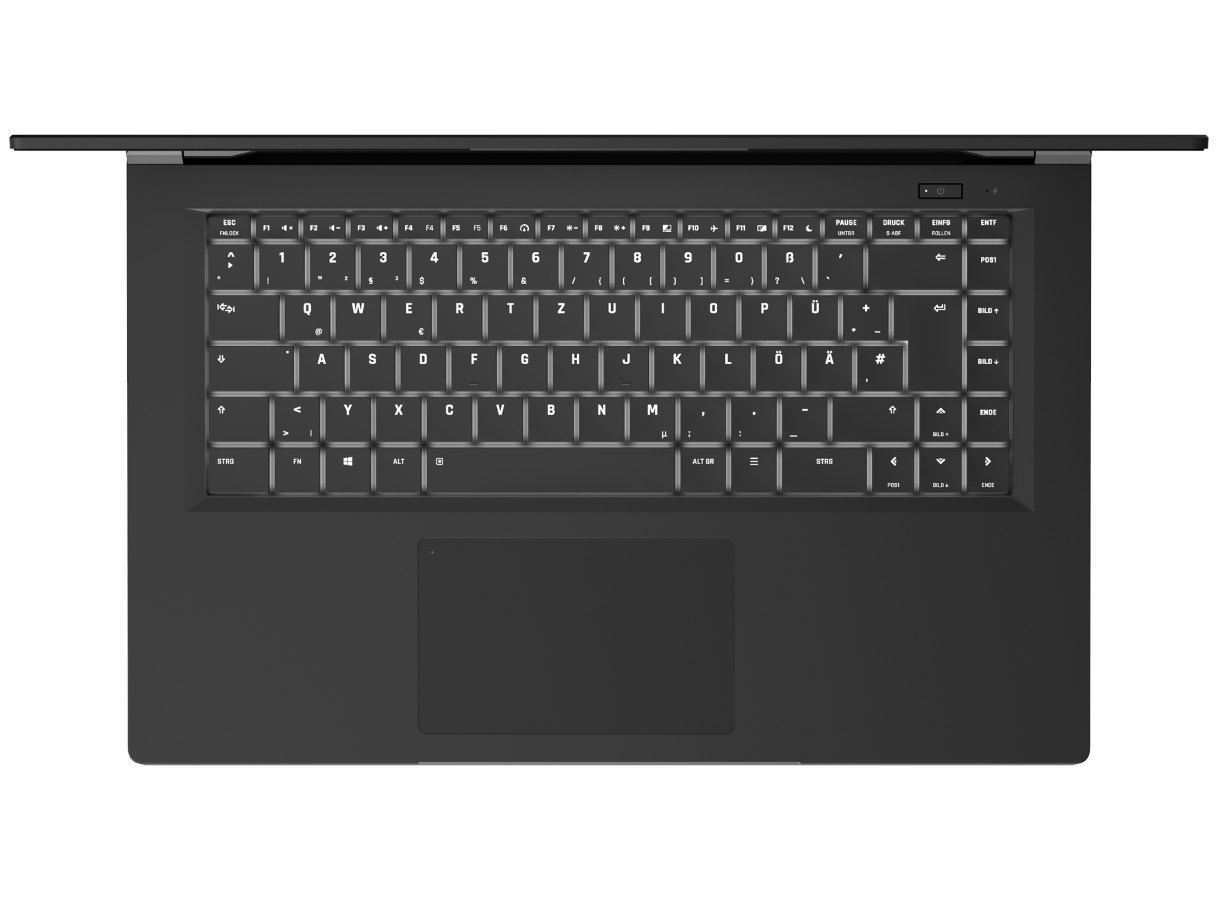
Input Devices - the Schenker notebook has a backlit keyboard
The keyboard of the Schenker VIA 15 has a comfortable pressure point and enables fast and easy typing. The arrow keys are just as large as the main keys and the keys pos1, end, delete and page up and down are all available as primary functions. Only the row of f keys is a little narrower than the rest. The keyboard has two-level backlighting, which works well.
Schenker uses a Clickpad with a smooth surface. The cursor moves across the screen evenly and clicks are actuated reliably. Only long drag-and-drop movements occasionally require a second try.
Display - high contrast and good brightness
The display Schenker has chosen for its VIA 15 is a matte IPS panel with a resolution of 1920 x 1080 pixels. It has an average brightness of 273 cd/m², which places it at the top of our comparison field. The display remains this bright when running on battery. The brightness distribution is only average at 81 percent. We measured PWM flickering at a brightness level below 30 percent. The frequency is fairly high at 25,910 Hz, which means that even sensitive users should not have any issues with it.
Schenker does not offer any alternative display options.
| |||||||||||||||||||||||||
Brightness Distribution: 81 %
Center on Battery: 296 cd/m²
Contrast: 1184:1 (Black: 0.25 cd/m²)
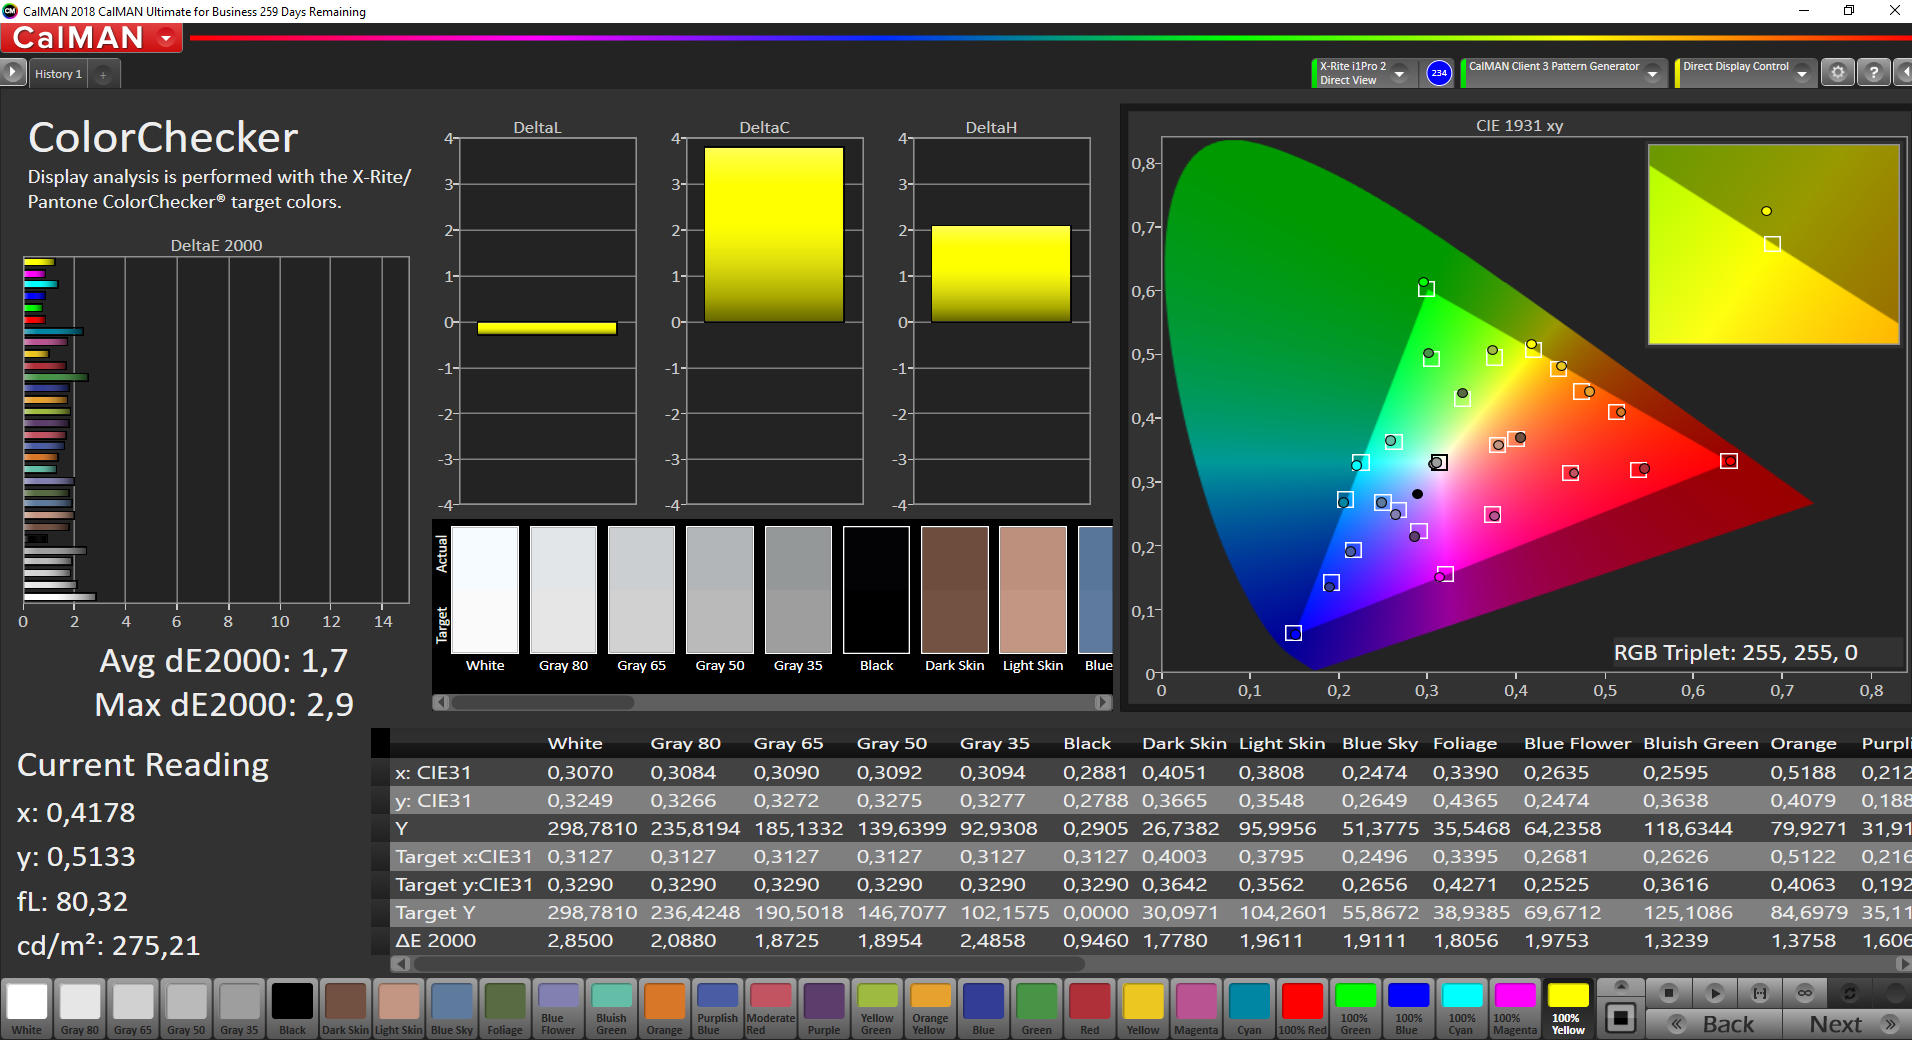
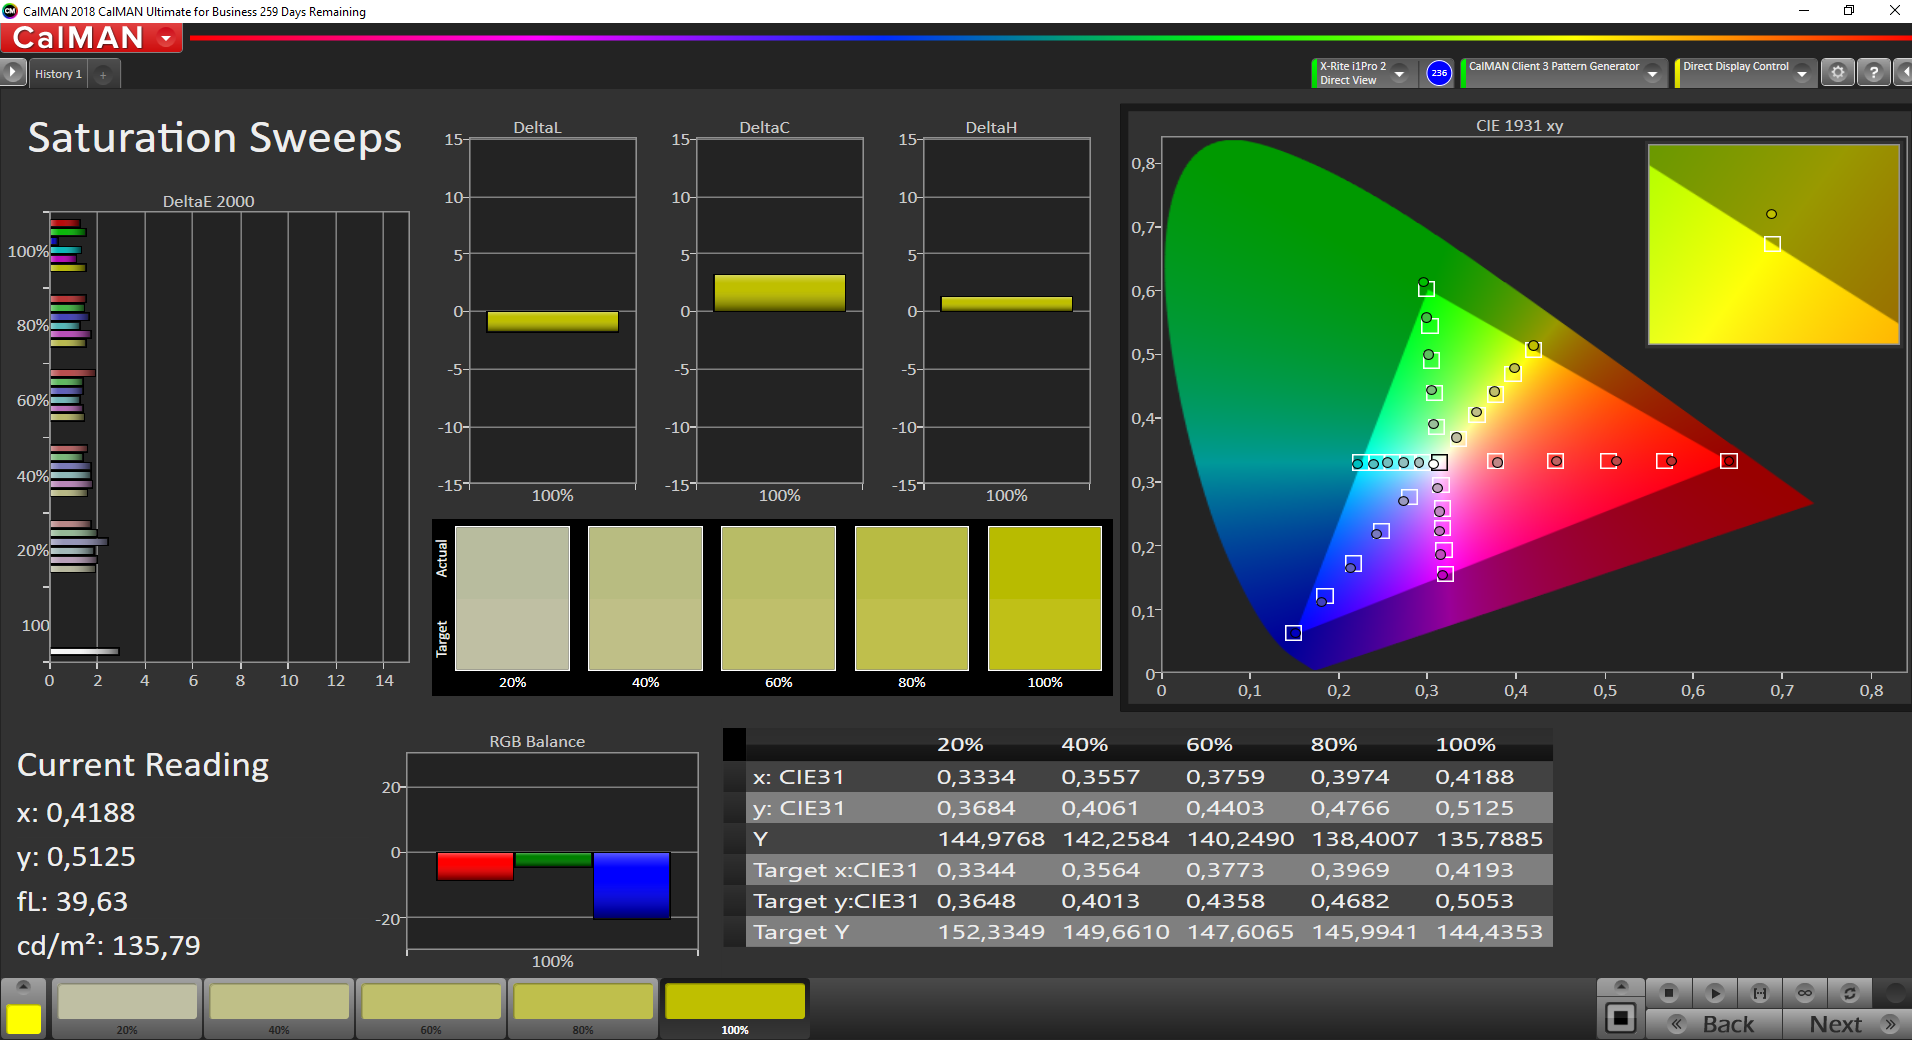
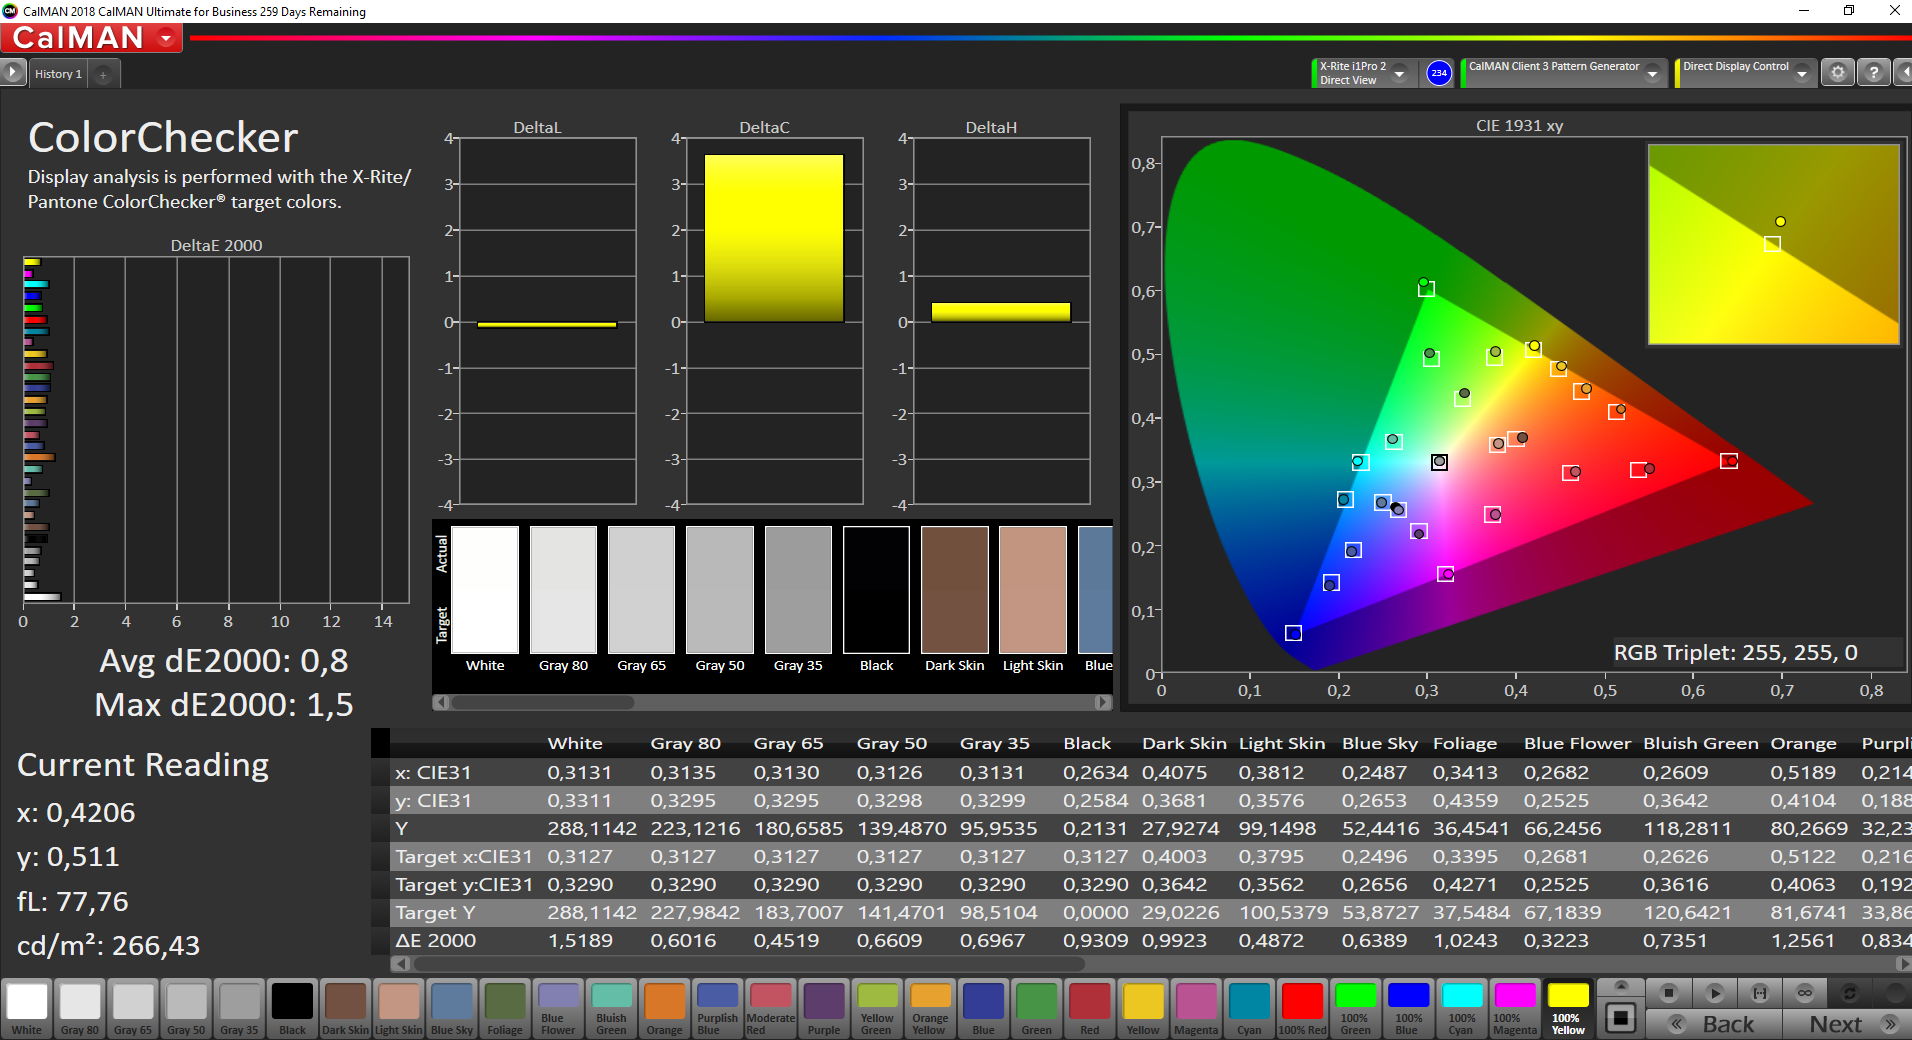
ΔE ColorChecker Calman: 1.7 | ∀{0.5-29.43 Ø4.73}
calibrated: 0.8
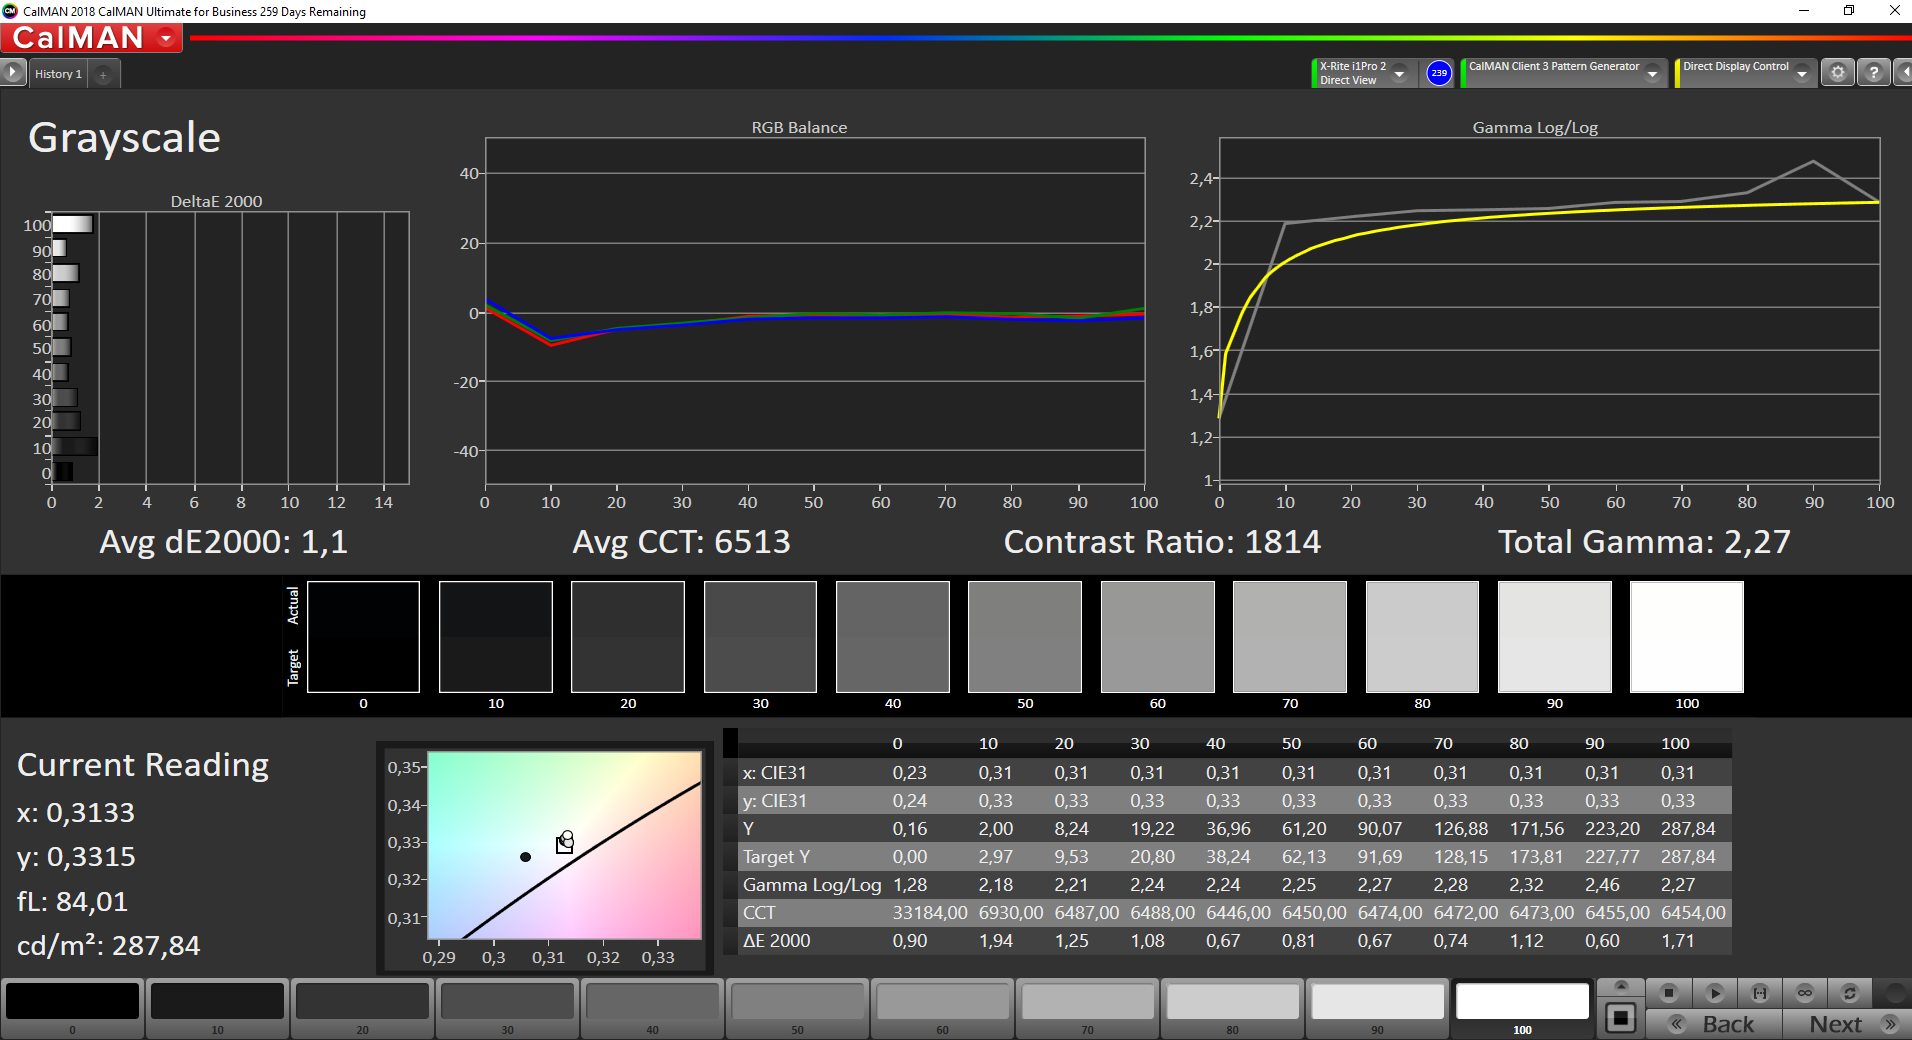
ΔE Greyscale Calman: 2.1 | ∀{0.09-98 Ø4.97}
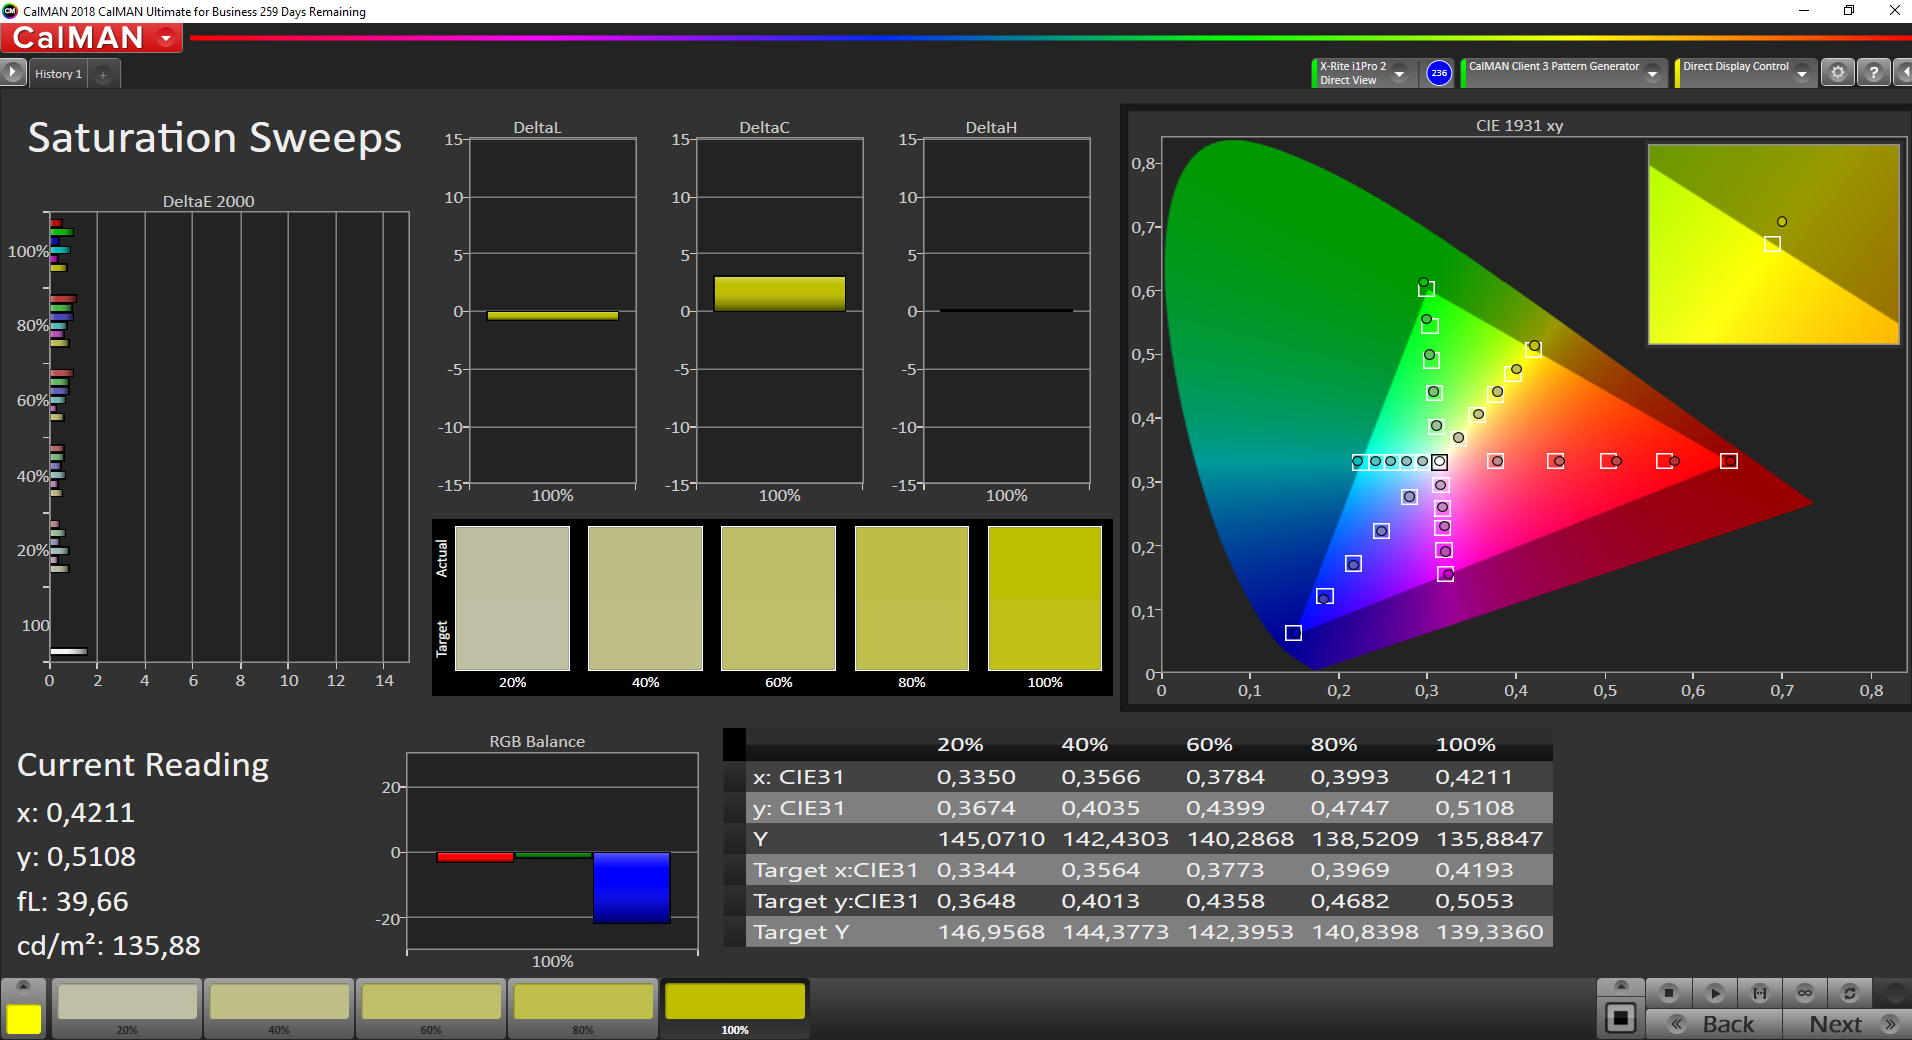
99.8% sRGB (Argyll 1.6.3 3D)
64.7% AdobeRGB 1998 (Argyll 1.6.3 3D)
70.9% AdobeRGB 1998 (Argyll 3D)
99.8% sRGB (Argyll 3D)
68.7% Display P3 (Argyll 3D)
Gamma: 2.31
CCT: 6759 K
| Schenker VIA 15 Chi Mei CMN15E8, IPS, 1920x1080, 15.6" | Lenovo ThinkBook 15 LP156WFC-SPD1, IPS, 1920x1080, 15.6" | HP ProBook 455R G6 LG Philips LGD05CE, IPS, 1920x1080, 15.6" | Huawei MateBook D 15-53010TUY AU Optronics AUO28ED, IPS, 1920x1080, 15.6" | Acer Aspire 5 A515-43-R6WW CEC PANDA LM156LF-CL07, IPS, 1920x1080, 15.6" | |
|---|---|---|---|---|---|
| Display | -43% | -45% | -40% | -41% | |
| Display P3 Coverage (%) | 68.7 | 38.38 -44% | 37.44 -46% | 40.49 -41% | 39.53 -42% |
| sRGB Coverage (%) | 99.8 | 57.7 -42% | 56.3 -44% | 60.9 -39% | 59.5 -40% |
| AdobeRGB 1998 Coverage (%) | 70.9 | 39.67 -44% | 38.71 -45% | 41.84 -41% | 40.84 -42% |
| Response Times | -1% | 11% | -15% | 7% | |
| Response Time Grey 50% / Grey 80% * (ms) | 38.4 ? | 37.6 ? 2% | 34 ? 11% | 43.6 ? -14% | 36 ? 6% |
| Response Time Black / White * (ms) | 26.8 ? | 28 ? -4% | 24 ? 10% | 31.2 ? -16% | 25 ? 7% |
| PWM Frequency (Hz) | 25910 ? | 178 ? | |||
| Screen | -124% | -113% | -111% | -90% | |
| Brightness middle (cd/m²) | 296 | 245 -17% | 262 -11% | 271 -8% | 250 -16% |
| Brightness (cd/m²) | 273 | 239 -12% | 235 -14% | 256 -6% | 228 -16% |
| Brightness Distribution (%) | 81 | 82 1% | 83 2% | 90 11% | 83 2% |
| Black Level * (cd/m²) | 0.25 | 0.25 -0% | 0.27 -8% | 0.15 40% | 0.205 18% |
| Contrast (:1) | 1184 | 980 -17% | 970 -18% | 1807 53% | 1220 3% |
| Colorchecker dE 2000 * | 1.7 | 5.6 -229% | 6.34 -273% | 4.7 -176% | 5.65 -232% |
| Colorchecker dE 2000 max. * | 2.9 | 15.6 -438% | 9.28 -220% | 20.4 -603% | 13.7 -372% |
| Colorchecker dE 2000 calibrated * | 0.8 | 4.8 -500% | 4.82 -503% | 4.6 -475% | |
| Greyscale dE 2000 * | 2.1 | 3.4 -62% | 4.33 -106% | 1.6 24% | 6.32 -201% |
| Gamma | 2.31 95% | 2.3 96% | 2.06 107% | 2.17 101% | 2.45 90% |
| CCT | 6759 96% | 7156 91% | 7041 92% | 6649 98% | 7287 89% |
| Color Space (Percent of AdobeRGB 1998) (%) | 64.7 | 36.5 -44% | 36 -44% | 38.5 -40% | 38 -41% |
| Color Space (Percent of sRGB) (%) | 99.8 | 57.5 -42% | 56 -44% | 60.6 -39% | 59 -41% |
| Total Average (Program / Settings) | -56% /
-93% | -49% /
-85% | -55% /
-86% | -41% /
-67% |
* ... smaller is better
Display Response Times
| ↔ Response Time Black to White | ||
|---|---|---|
| 26.8 ms ... rise ↗ and fall ↘ combined | ↗ 15.2 ms rise | 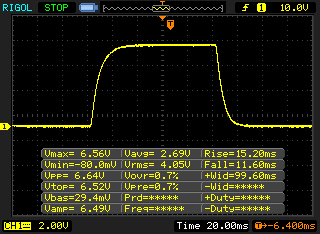 |
| ↘ 11.6 ms fall | ||
| The screen shows relatively slow response rates in our tests and may be too slow for gamers. In comparison, all tested devices range from 0.1 (minimum) to 240 (maximum) ms. » 67 % of all devices are better. This means that the measured response time is worse than the average of all tested devices (19.9 ms). | ||
| ↔ Response Time 50% Grey to 80% Grey | ||
| 38.4 ms ... rise ↗ and fall ↘ combined | ↗ 18.8 ms rise | 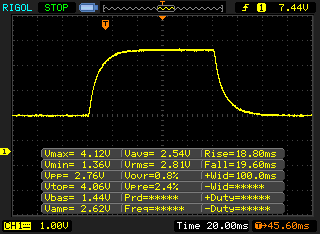 |
| ↘ 19.6 ms fall | ||
| The screen shows slow response rates in our tests and will be unsatisfactory for gamers. In comparison, all tested devices range from 0.165 (minimum) to 636 (maximum) ms. » 57 % of all devices are better. This means that the measured response time is worse than the average of all tested devices (31.1 ms). | ||
Screen Flickering / PWM (Pulse-Width Modulation)
| Screen flickering / PWM detected | 25910 Hz | ≤ 30 % brightness setting | 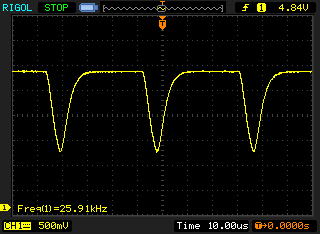 |
The display backlight flickers at 25910 Hz (worst case, e.g., utilizing PWM) Flickering detected at a brightness setting of 30 % and below. There should be no flickering or PWM above this brightness setting. The frequency of 25910 Hz is quite high, so most users sensitive to PWM should not notice any flickering. In comparison: 52 % of all tested devices do not use PWM to dim the display. If PWM was detected, an average of 7810 (minimum: 5 - maximum: 343500) Hz was measured. | |||
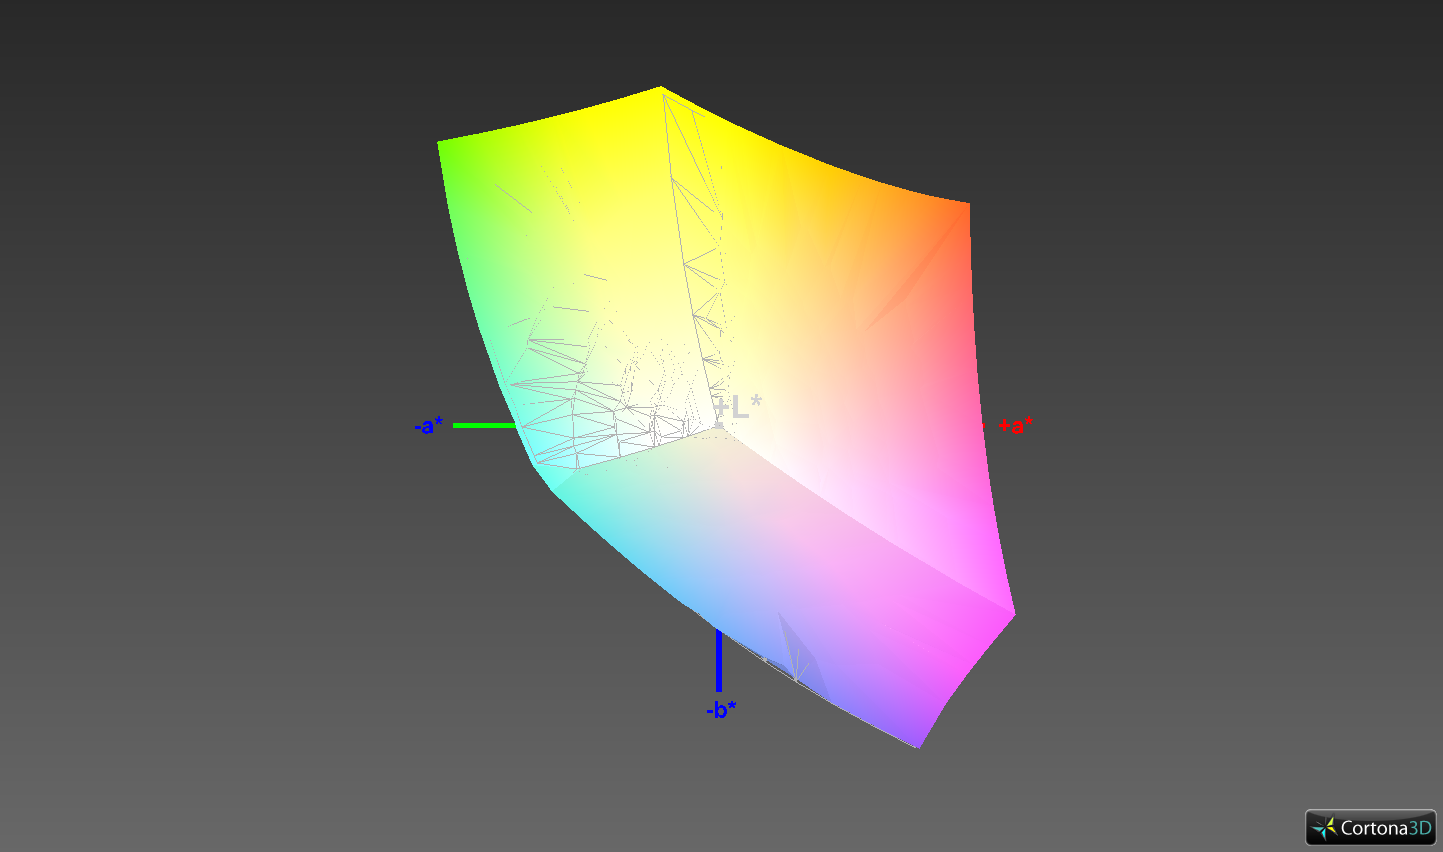
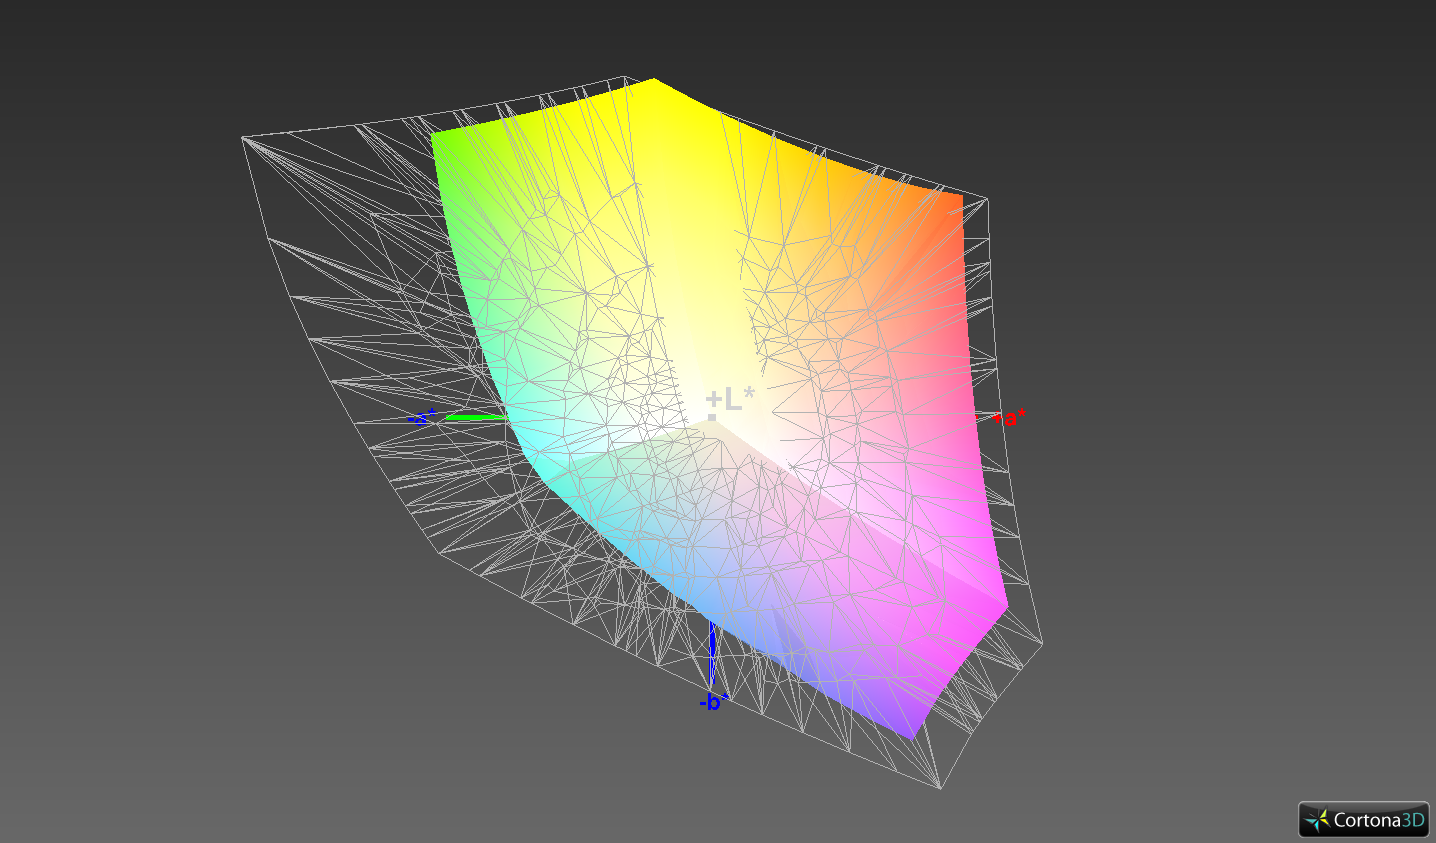
The VIA 15 has a good contrast ratio of 1184:1 and a good black value of 0.25 cd/m². Combined with a color space coverage of almost 100 percent (sRGB), this means vivid colors and deep blacks. Our analysis using the CalMAN software and X-Rite i1Pro2 show that the display only has a low color deviation ex-works. This can be further improved by calibrating the display.
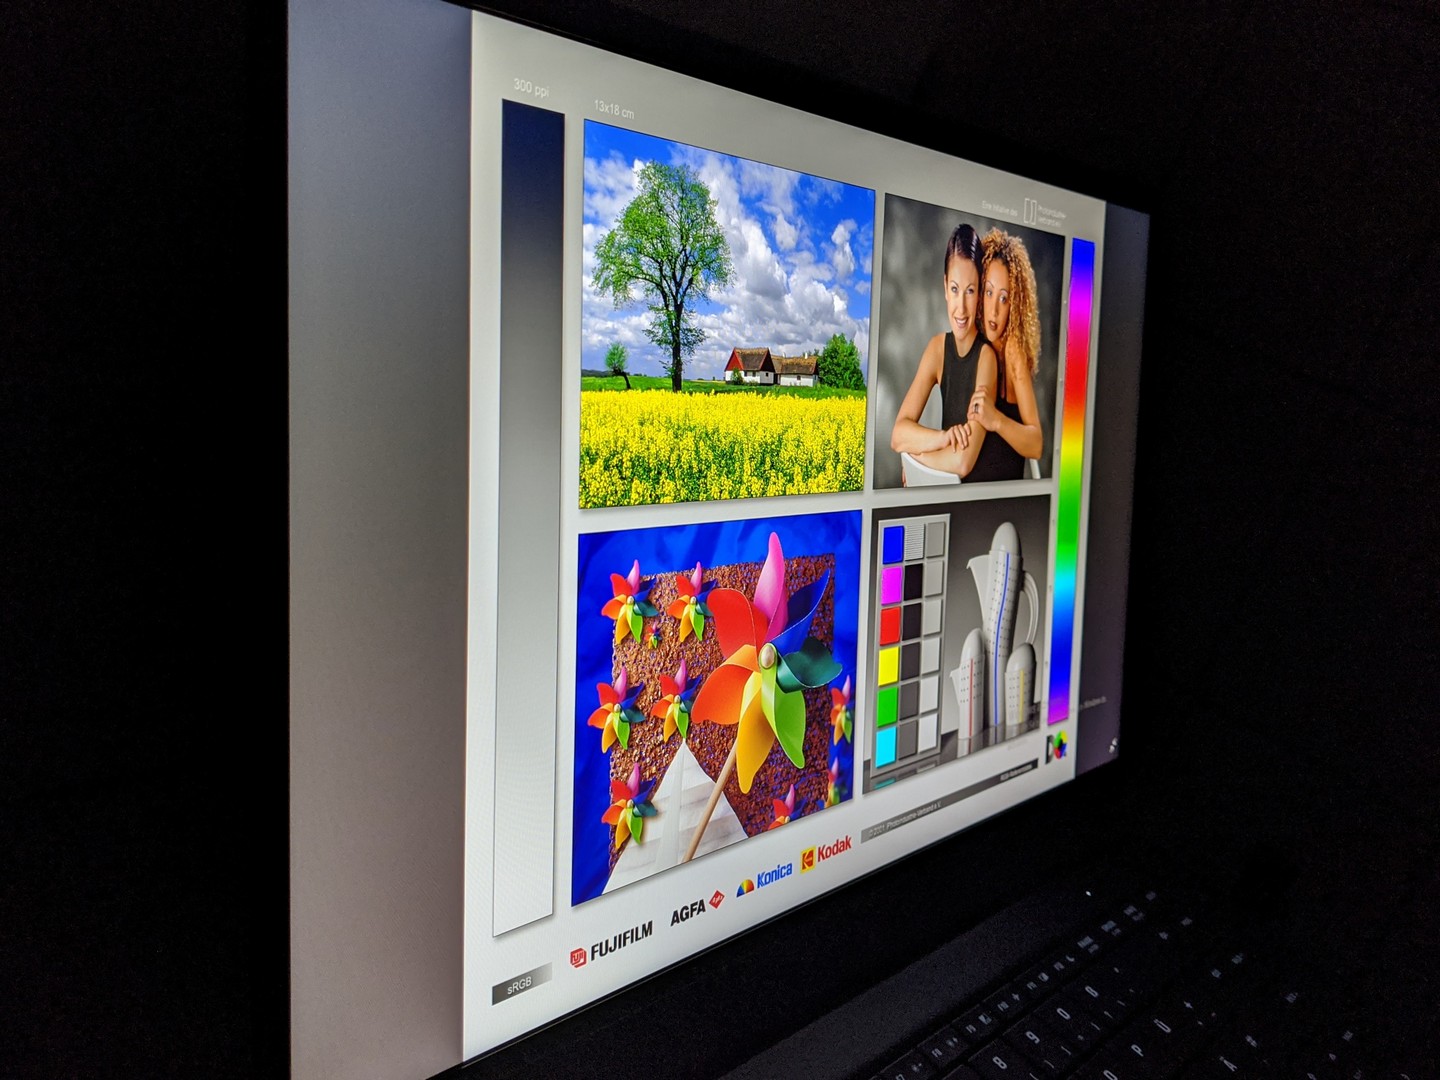
The Schenker VIA 15 is suitable to be used outdoors, although we would still recommend finding a shady spot as content can be difficult to read in direct sunlight. The panel also has stable viewing angles, which means that colors and content are not inverted or distorted when looking at the screen from an angle.

Performance - AMD processor without throttling
Schenker has directed its VIA 15 at business users who are looking for a notebook that is suitable for a variety of office applications. Its performance should also suffice for simple image and video processing. Apart from our configuration, the model should also be available with an AMD Ryzen 7 3700U and various shapes and sizes of storage devices and RAM.
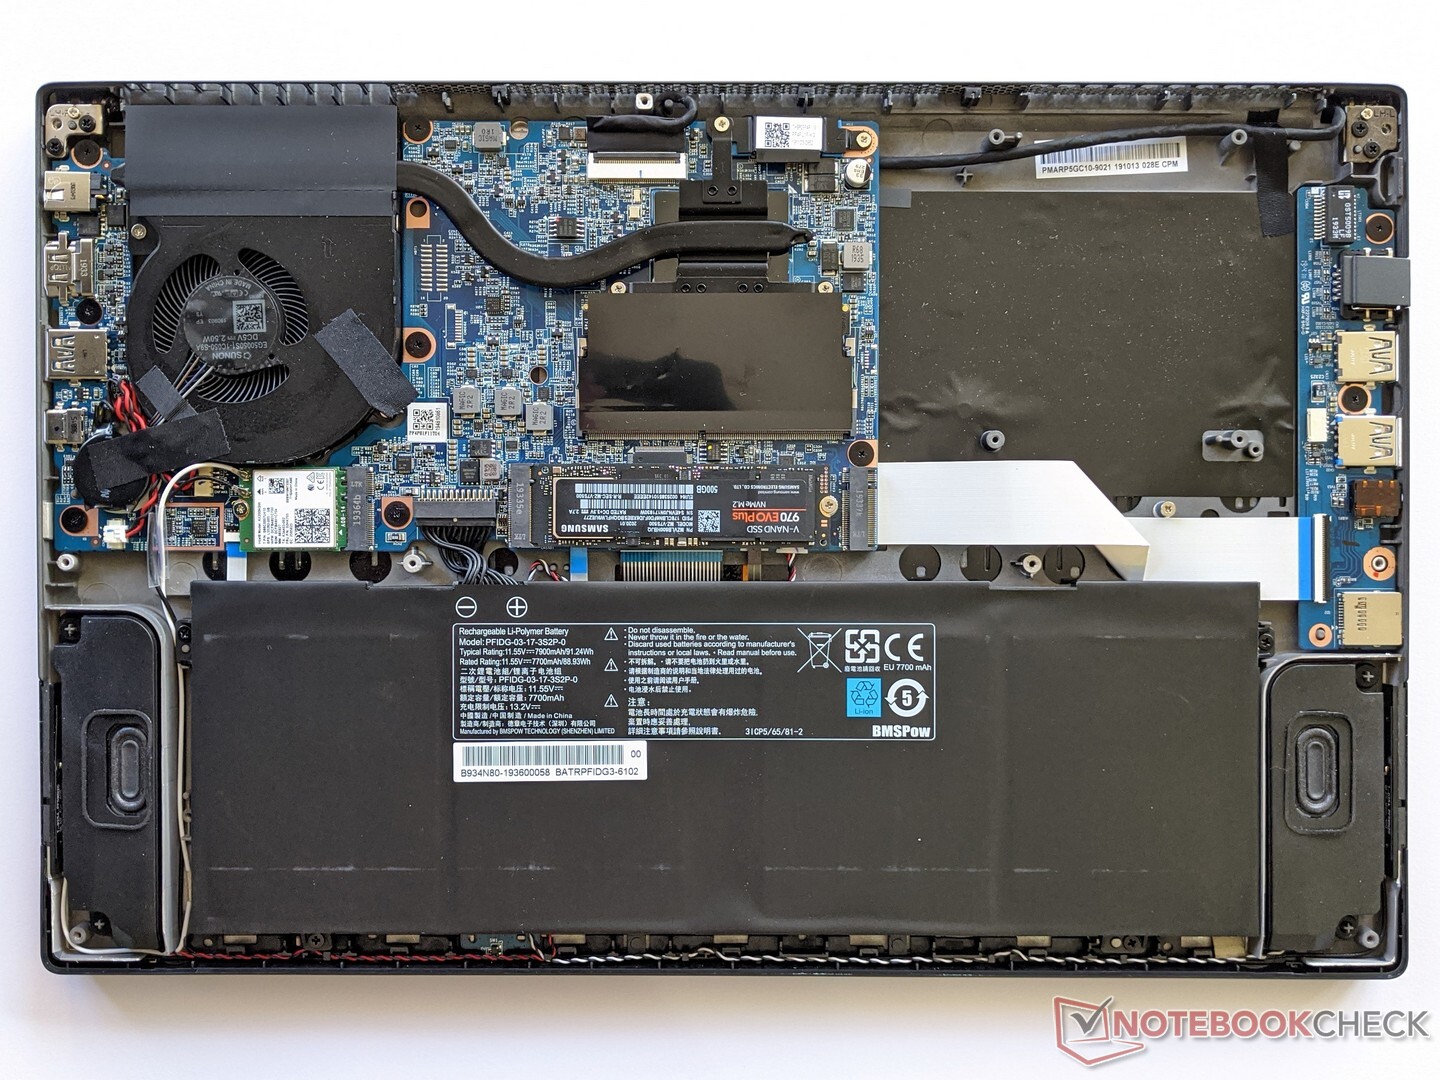
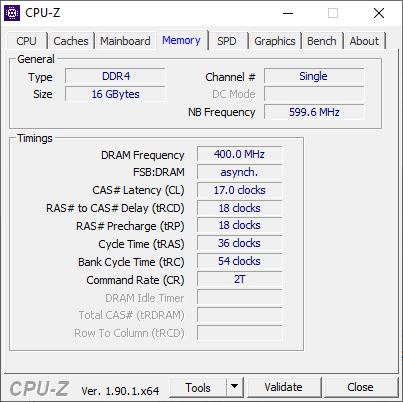
While users can only use RAM in single-channel mode and therefore only expand via a single RAM slot, they can install up to two SSDs in the VIA 15.


Processor
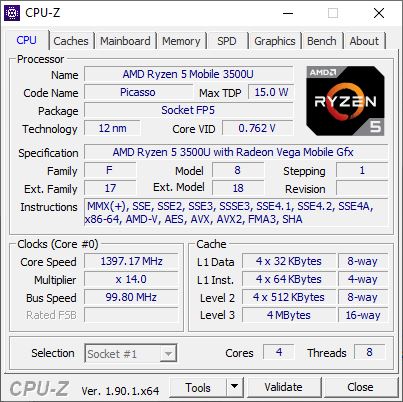
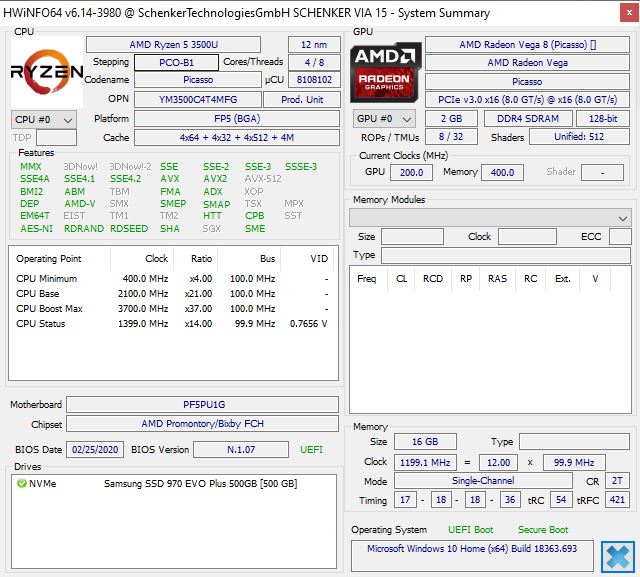
The installed AMD Ryzen 5 3500U is a quad-core processor with clock rates between 2.1 and 3.7 GHz. The CPU can work up to eight threads simultaneously, although its performance also depends on the notebook's cooling system. Our CineBench R15 loop shows that Schenker has done a good job. The processor's performance remains fairly constant even over a long period of time. This means that the VIA 15 offers the same performance as the Huawei MateBook D 15.
The Schenker VIA 15 reached a multi-core result of 586 points when running on battery.
The Schenker notebook also gets very good results in the individual single and multi-core benchmarks. Only the Intel Core i5-10210U in the Lenovo ThinkBook 15 reaches a higher result for a short period.
System Performance
The results of the PCMark 10 benchmarks position our test unit in the middle range of our comparison field. The results are all quite uniform and we calculated a maximum performance deviation of 5 percent to other Ryzen 5 3500U devices. The Lenovo ThinkBook 15 with its Intel CPU is the only outlier. Find out how the VIA 15 fares compared to other notebooks in our CPU benchmark list.
In general, the Schenker notebook offers a fast system. Applications start quickly and we did not encounter any judders or other issues during testing.
Storage Devices
Schenker has equipped our test unit with a 500-GB SSD from Samsung, which offers very good read and write rates according to our storage benchmarks, making second place in our comparison field.
Find out more about various storage devices on our HDD/SSD benchmark page.
| Schenker VIA 15 Samsung SSD 970 EVO Plus 500GB | Lenovo ThinkBook 15 Samsung SSD PM981 MZVLB512HAJQ | HP ProBook 455R G6 SK hynix BC501 HFM256GDHTNG | Huawei MateBook D 15-53010TUY Samsung SSD PM981 MZVLB256HAHQ | Acer Aspire 5 A515-43-R6WW Intel SSD 660p 1TB SSDPEKNW010T8 | Average Samsung SSD 970 EVO Plus 500GB | Average of class Office | |
|---|---|---|---|---|---|---|---|
| CrystalDiskMark 5.2 / 6 | 3% | -38% | -19% | -34% | 5% | 30% | |
| Write 4K (MB/s) | 164.5 | 176.3 7% | 126.4 -23% | 134.8 -18% | 114.9 -30% | 159.2 ? -3% | 151.4 ? -8% |
| Read 4K (MB/s) | 46.88 | 48.98 4% | 40.45 -14% | 41.68 -11% | 52.7 12% | 48.5 ? 3% | 72.8 ? 55% |
| Write Seq (MB/s) | 2659 | 1789 -33% | 702 -74% | 1651 -38% | 1361 -49% | 2114 ? -20% | 2558 ? -4% |
| Read Seq (MB/s) | 2623 | 1671 -36% | 1129 -57% | 2300 -12% | 1385 -47% | 2044 ? -22% | 3237 ? 23% |
| Write 4K Q32T1 (MB/s) | 310.9 | 433.5 39% | 298.6 -4% | 260 -16% | 181.1 -42% | 435 ? 40% | 424 ? 36% |
| Read 4K Q32T1 (MB/s) | 351.2 | 526 50% | 344 -2% | 335.1 -5% | 340.5 -3% | 508 ? 45% | 509 ? 45% |
| Write Seq Q32T1 (MB/s) | 3236 | 2983 -8% | 801 -75% | 1641 -49% | 1519 -53% | 3238 ? 0% | 3999 ? 24% |
| Read Seq Q32T1 (MB/s) | 3547 | 3555 0% | 1723 -51% | 3452 -3% | 1515 -57% | 3499 ? -1% | 5962 ? 68% |
| Write 4K Q8T8 (MB/s) | 1688 | 2067 ? | 901 ? | ||||
| Read 4K Q8T8 (MB/s) | 1036 | 1064 ? | 1317 ? | ||||
| AS SSD | 3% | -52% | -27% | -49% | 8% | -11% | |
| Seq Read (MB/s) | 2817 | 2564 -9% | 1503 -47% | 2613 -7% | 1358 -52% | 2640 ? -6% | 4258 ? 51% |
| Seq Write (MB/s) | 2392 | 2268 -5% | 712 -70% | 1549 -35% | 1300 -46% | 2500 ? 5% | 2707 ? 13% |
| 4K Read (MB/s) | 53.5 | 57 7% | 36.63 -32% | 47.15 -12% | 44.88 -16% | 54.8 ? 2% | 57.3 ? 7% |
| 4K Write (MB/s) | 129.4 | 141.4 9% | 89.3 -31% | 111.6 -14% | 77.5 -40% | 141.2 ? 9% | 163 ? 26% |
| 4K-64 Read (MB/s) | 1280 | 1175 -8% | 524 -59% | 748 -42% | 586 -54% | 1345 ? 5% | 924 ? -28% |
| 4K-64 Write (MB/s) | 1649 | 1665 1% | 334.3 -80% | 1275 -23% | 738 -55% | 2116 ? 28% | 1631 ? -1% |
| Access Time Read * (ms) | 0.041 | 0.032 22% | 0.057 -39% | 0.062 -51% | 0.0475 ? -16% | 0.08483 ? -107% | |
| Access Time Write * (ms) | 0.034 | 0.025 26% | 0.041 -21% | 0.042 -24% | 0.057 -68% | 0.02775 ? 18% | 0.05741 ? -69% |
| Score Read (Points) | 1616 | 1488 -8% | 711 -56% | 1057 -35% | 767 -53% | 1664 ? 3% | 1407 ? -13% |
| Score Write (Points) | 2018 | 2033 1% | 495 -75% | 1542 -24% | 945 -53% | 2507 ? 24% | 2065 ? 2% |
| Score Total (Points) | 4446 | 4279 -4% | 1540 -65% | 3097 -30% | 2115 -52% | 5023 ? 13% | 4127 ? -7% |
| Total Average (Program / Settings) | 3% /
3% | -45% /
-46% | -23% /
-24% | -42% /
-42% | 7% /
7% | 10% /
6% |
* ... smaller is better

Graphics
The AMD Radeon RX Vega 8 reached good results in the 3DMark 11 benchmark. As this GPU's performance strongly depends on the included RAM, the advantages of the device's 16 GB of RAM are clear. However, Schenker could have enabled an even better performance by making dual-channel mode available. Luckily this should not be a deciding factor for an office laptop such as this one. The VIA 15 reaches the same 3DMark 11 result when running on battery.
Find out more about the performance of other graphics units on our GPU benchmark page.
| 3DMark 11 Performance | 3214 points | |
Help | ||
Gaming Performance
AMD's Radeon RX Vega 8 can definitely be used to play occasional games, although users will have to stick to older titles or games with low demands in terms of graphics performance. Our test also showed that users will have to forego Full-HD resolution in favor of smooth frame rates. Current AAA games are hardly playable even at the lowest graphics settings
Find out what kind of performance to expect from various titles on our GPU games page.
| low | med. | high | ultra | |
|---|---|---|---|---|
| BioShock Infinite (2013) | 82.9 | 14.17 | ||
| Dota 2 Reborn (2015) | 72 | 54.9 | 28.5 | 26.5 |
| X-Plane 11.11 (2018) | 25.7 | 18.7 | 17.1 |
Emissions & Energy - fans only run occasionally
System Noise
The Schenker VIA 15 is very quiet throughout with the fans only turning on occasionally. And even then they are hardly audible, humming away evenly. The noise turns up under load but never becomes uncomfortably loud, although you might want to avoid this scenario in surroundings that are sensitive to noise.
Please note: Schenker has informed us that they are currently working on a BIOS update that will improve fan behavior under load. We will be testing the fan noise again as soon as this is available.
Noise level
| Idle |
| 29.6 / 29.6 / 29.6 dB(A) |
| Load |
| 33.4 / 38.1 dB(A) |
 | ||
30 dB silent 40 dB(A) audible 50 dB(A) loud |
||
min: | ||
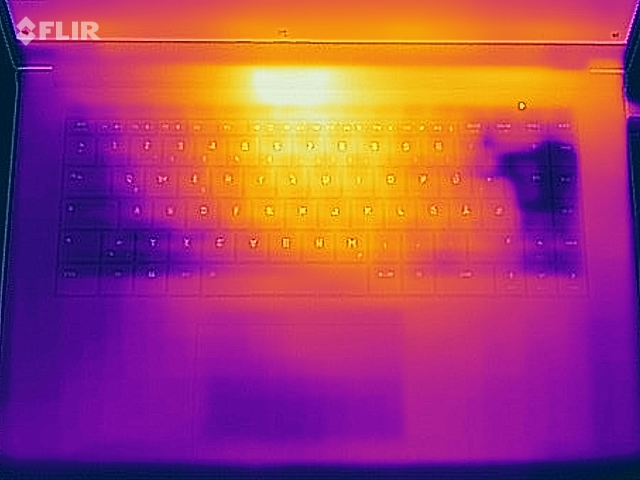
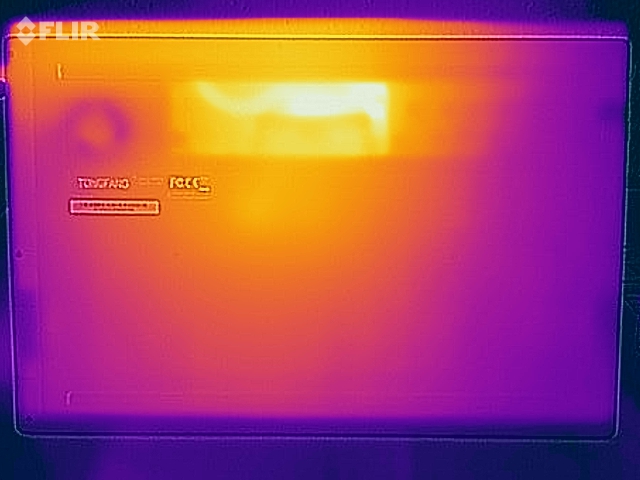
Temperature
Our measurements show that the VIA 15 reaches surface temperatures of up to 45.2 °C (113.36 °F) under load. This means that you can still use the device on your lap - although it might start getting a little warm. But remember that this temperature only occurs under strong load.
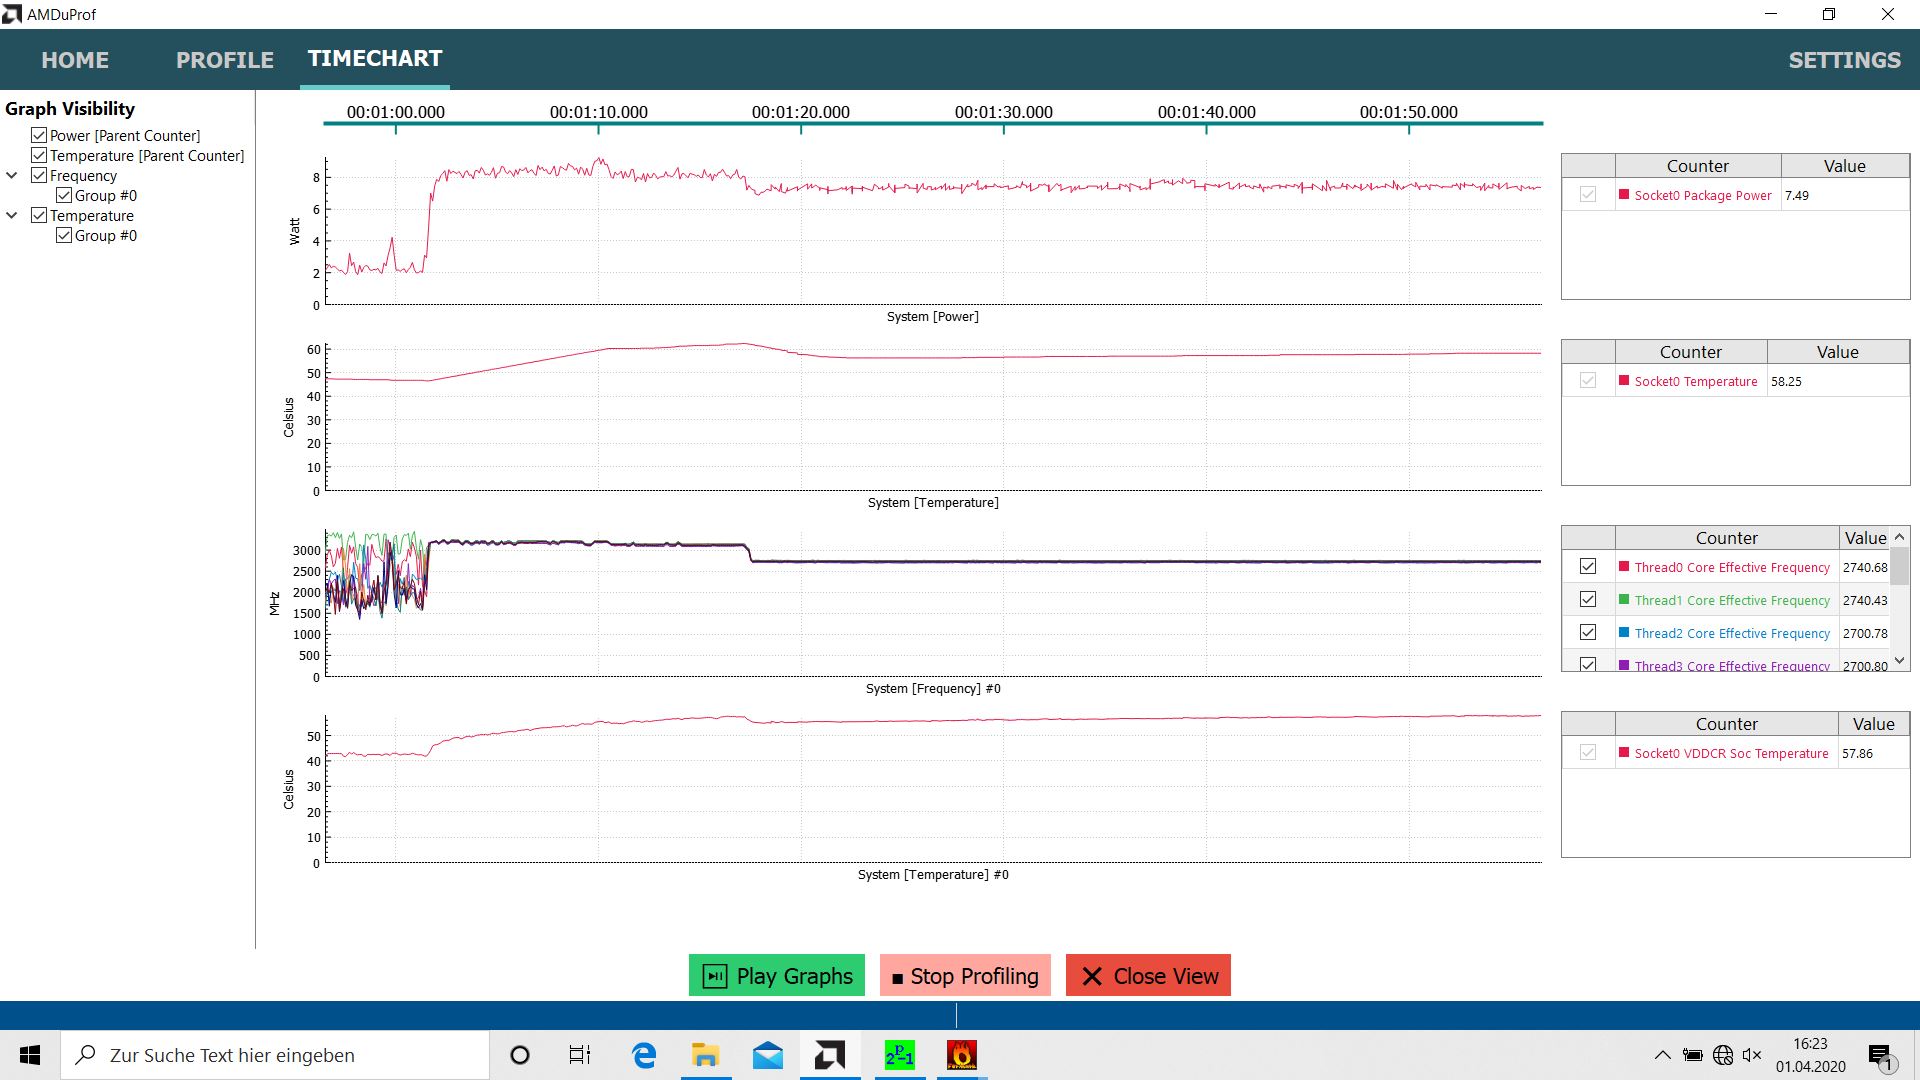
The VIA 15 reached clock rates above 3 GHz at the beginning of our stress test, but these soon dropped to 2.7 GHz. By the end of the one-hour test, the frequency had dropped to 2.5 GHz, which is still 0.4 GHz above the base clock rate of 2.1 GHz. The power consumption reached 63.6 W at first and then settled around 47.5 W.

(±) The maximum temperature on the upper side is 44.5 °C / 112 F, compared to the average of 34.3 °C / 94 F, ranging from 21.2 to 62.5 °C for the class Office.
(-) The bottom heats up to a maximum of 45.2 °C / 113 F, compared to the average of 36.8 °C / 98 F
(+) In idle usage, the average temperature for the upper side is 24.6 °C / 76 F, compared to the device average of 29.5 °C / 85 F.
(+) The palmrests and touchpad are cooler than skin temperature with a maximum of 26.6 °C / 79.9 F and are therefore cool to the touch.
(±) The average temperature of the palmrest area of similar devices was 27.5 °C / 81.5 F (+0.9 °C / 1.6 F).
Speakers
The speakers aren't particularly loud and have a fairly narrow sound spectrum. Both low and high frequencies are lost, which means that the AMD notebook is not really ideal for media consumption. We would recommend connecting external speakers or headphones.
Schenker VIA 15 audio analysis
(-) | not very loud speakers (71.7 dB)
Bass 100 - 315 Hz
(-) | nearly no bass - on average 15.4% lower than median
(±) | linearity of bass is average (9.7% delta to prev. frequency)
Mids 400 - 2000 Hz
(±) | higher mids - on average 10.7% higher than median
(±) | linearity of mids is average (13% delta to prev. frequency)
Highs 2 - 16 kHz
(±) | higher highs - on average 5.2% higher than median
(±) | linearity of highs is average (11.4% delta to prev. frequency)
Overall 100 - 16.000 Hz
(-) | overall sound is not linear (37.6% difference to median)
Compared to same class
» 98% of all tested devices in this class were better, 1% similar, 1% worse
» The best had a delta of 7%, average was 21%, worst was 53%
Compared to all devices tested
» 94% of all tested devices were better, 1% similar, 5% worse
» The best had a delta of 4%, average was 24%, worst was 134%
Apple MacBook 12 (Early 2016) 1.1 GHz audio analysis
(+) | speakers can play relatively loud (83.6 dB)
Bass 100 - 315 Hz
(±) | reduced bass - on average 11.3% lower than median
(±) | linearity of bass is average (14.2% delta to prev. frequency)
Mids 400 - 2000 Hz
(+) | balanced mids - only 2.4% away from median
(+) | mids are linear (5.5% delta to prev. frequency)
Highs 2 - 16 kHz
(+) | balanced highs - only 2% away from median
(+) | highs are linear (4.5% delta to prev. frequency)
Overall 100 - 16.000 Hz
(+) | overall sound is linear (10.2% difference to median)
Compared to same class
» 7% of all tested devices in this class were better, 2% similar, 91% worse
» The best had a delta of 5%, average was 18%, worst was 53%
Compared to all devices tested
» 5% of all tested devices were better, 1% similar, 94% worse
» The best had a delta of 4%, average was 24%, worst was 134%
Power Consumption
The VIA 15 has a minimum power consumption of 5.7 W while idling and up to 63.6 W under load.
The included AC adapter has a rated output of 65 W and is therefore large enough to cover the VIA 15's needs.
| Off / Standby | |
| Idle | |
| Load |
|
Key:
min: | |
| Schenker VIA 15 R5 3500U, Vega 8, Samsung SSD 970 EVO Plus 500GB, IPS, 1920x1080, 15.6" | Lenovo ThinkBook 15 i5-10210U, UHD Graphics 620, Samsung SSD PM981 MZVLB512HAJQ, IPS, 1920x1080, 15.6" | HP ProBook 455R G6 R5 3500U, Vega 8, SK hynix BC501 HFM256GDHTNG, IPS, 1920x1080, 15.6" | Huawei MateBook D 15-53010TUY R5 3500U, Vega 8, Samsung SSD PM981 MZVLB256HAHQ, IPS, 1920x1080, 15.6" | Acer Aspire 5 A515-43-R6WW R5 3500U, Vega 8, Intel SSD 660p 1TB SSDPEKNW010T8, IPS, 1920x1080, 15.6" | Average AMD Radeon RX Vega 8 (Ryzen 2000/3000) | Average of class Office | |
|---|---|---|---|---|---|---|---|
| Power Consumption | 12% | 12% | 3% | 24% | 2% | 5% | |
| Idle Minimum * (Watt) | 5.7 | 3.5 39% | 4.8 16% | 5.2 9% | 3.7 35% | 5.68 ? -0% | 4.4 ? 23% |
| Idle Average * (Watt) | 9.1 | 7.1 22% | 7.6 16% | 8.8 3% | 6.2 32% | 8.75 ? 4% | 7.32 ? 20% |
| Idle Maximum * (Watt) | 9.6 | 7.8 19% | 10.9 -14% | 10.2 -6% | 8.4 12% | 10.1 ? -5% | 8.56 ? 11% |
| Load Average * (Watt) | 33.3 | 38.9 -17% | 30.2 9% | 37.5 -13% | 31.1 7% | 37.8 ? -14% | 42.5 ? -28% |
| Load Maximum * (Watt) | 63.6 | 65.4 -3% | 42.2 34% | 50.9 20% | 43.1 32% | 46.2 ? 27% | 64.1 ? -1% |
* ... smaller is better
Battery Life
We measured a very good battery life of 13 hours and 23 minutes in our Wi-Fi test. This result is significantly better than that of the competition. This is mainly due to the very large 91-Wh battery, which required around 2.5 hours to recharge during our test.
Pros
Cons
Verdict - a very good AMD notebook with only minor weaknesses
Schenker has made a lot of good decisions for the VIA 15. The performance of its Ryzen 5 3500U remains high and steady under load and does not suffer from high temperatures. The device also offers a great battery life and very good Wi-Fi performance. This makes the VIA 15 a worthy competitor to the Huawei MateBook D 15.
The Schenker VIA 15 is a strong AMD notebook that offers good battery life and does not suffer from heat-related issues.
Our round of tests leaves little to criticize. The surface of the keyboard could offer a bit more grip and we would generally expect better webcams in notebooks nowadays - but that goes for all notebook manufacturers. One big disadvantage is the fact that RAM only runs in single-channel mode. This is a waste of potential performance that could have had a particularly positive impact on the graphics performance. But an office laptop such as this should be able to do without that anyway.
Schenker VIA 15
- 04/05/2020 v7 (old)
Mike Wobker
Price comparison

