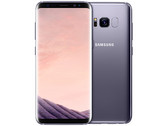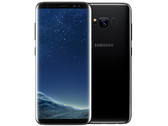


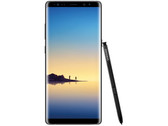
Samsung Galaxy Note 8 Smartphone Review
Back to being best. The Note 8 shines with a big, superb Infinity screen, high performance and, for the first time, with a dual-camera. As usual, the S-Pen that can be inserted into the casing is included. Whether Samsung has developed the ideal phablet after the Note 7 disaster will be clarified in the test.
Update: new update improves security and adds new Wi-Fi features.
Update: Information concerning PWM, display response times, temperatures and power consumption has been added.
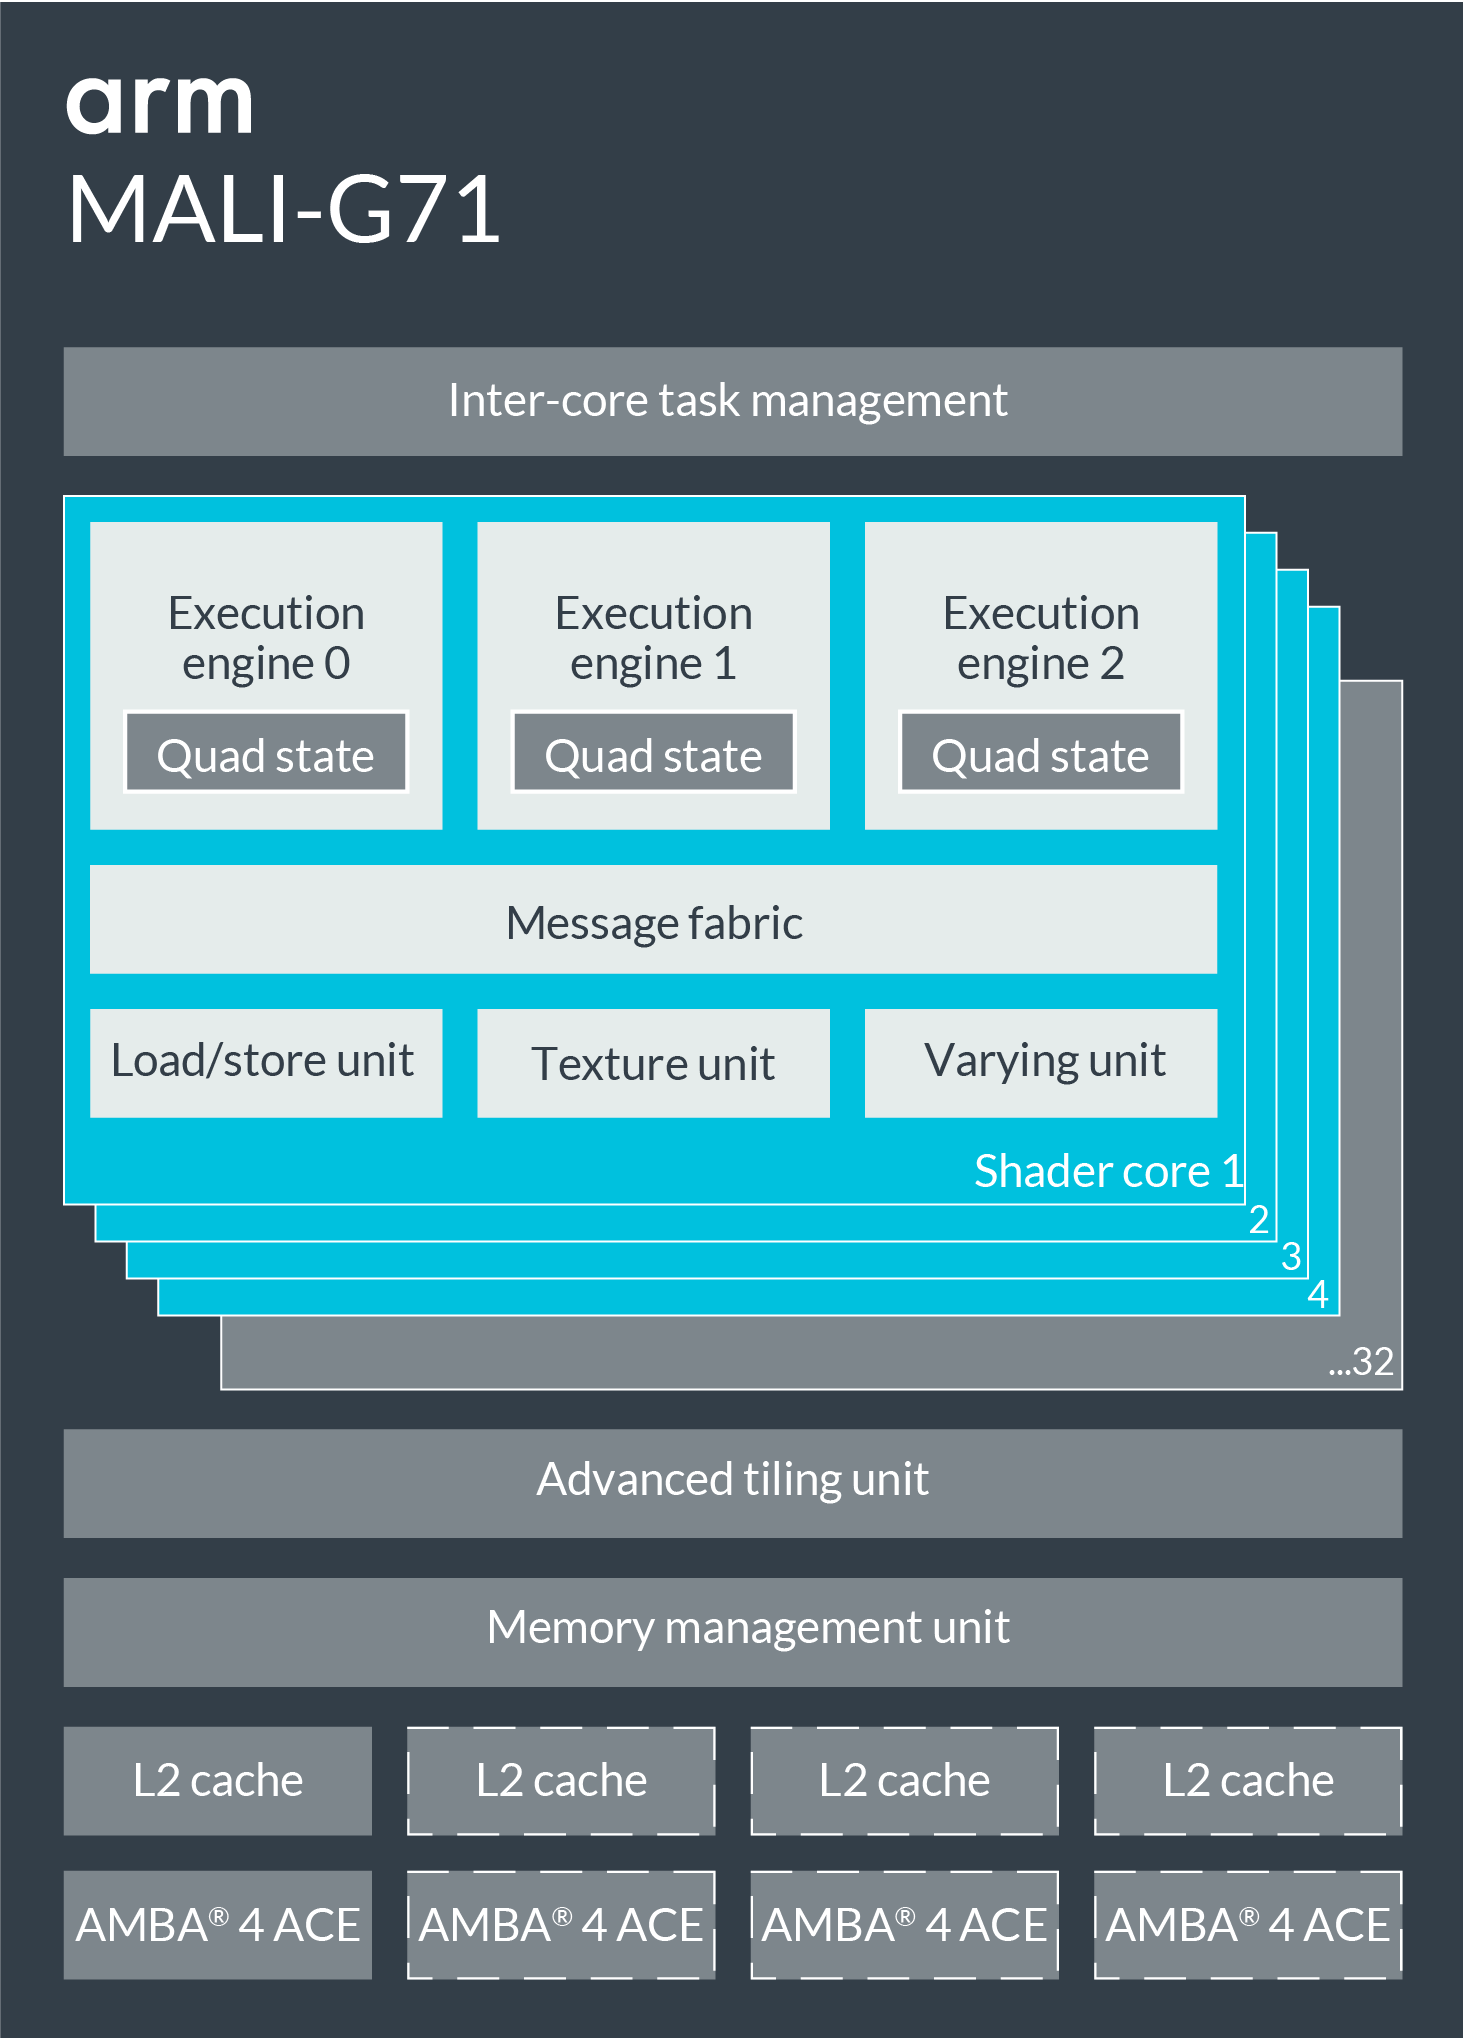
Samsung Exynos 8895 Octa, ARM Mali-G71 MP20, 6.3", 195 g