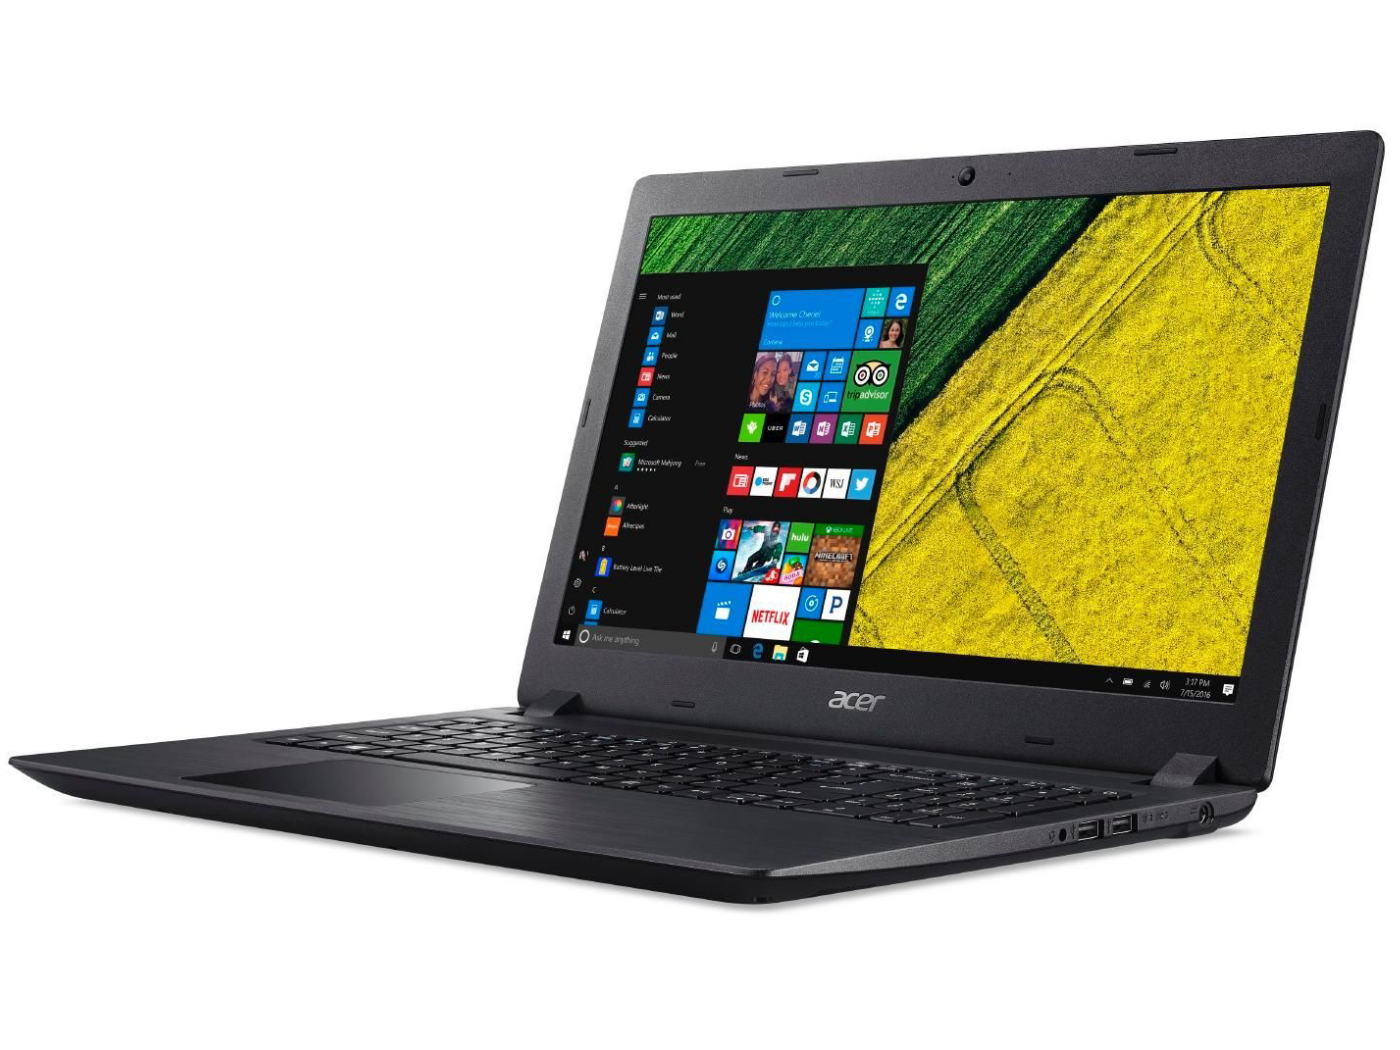
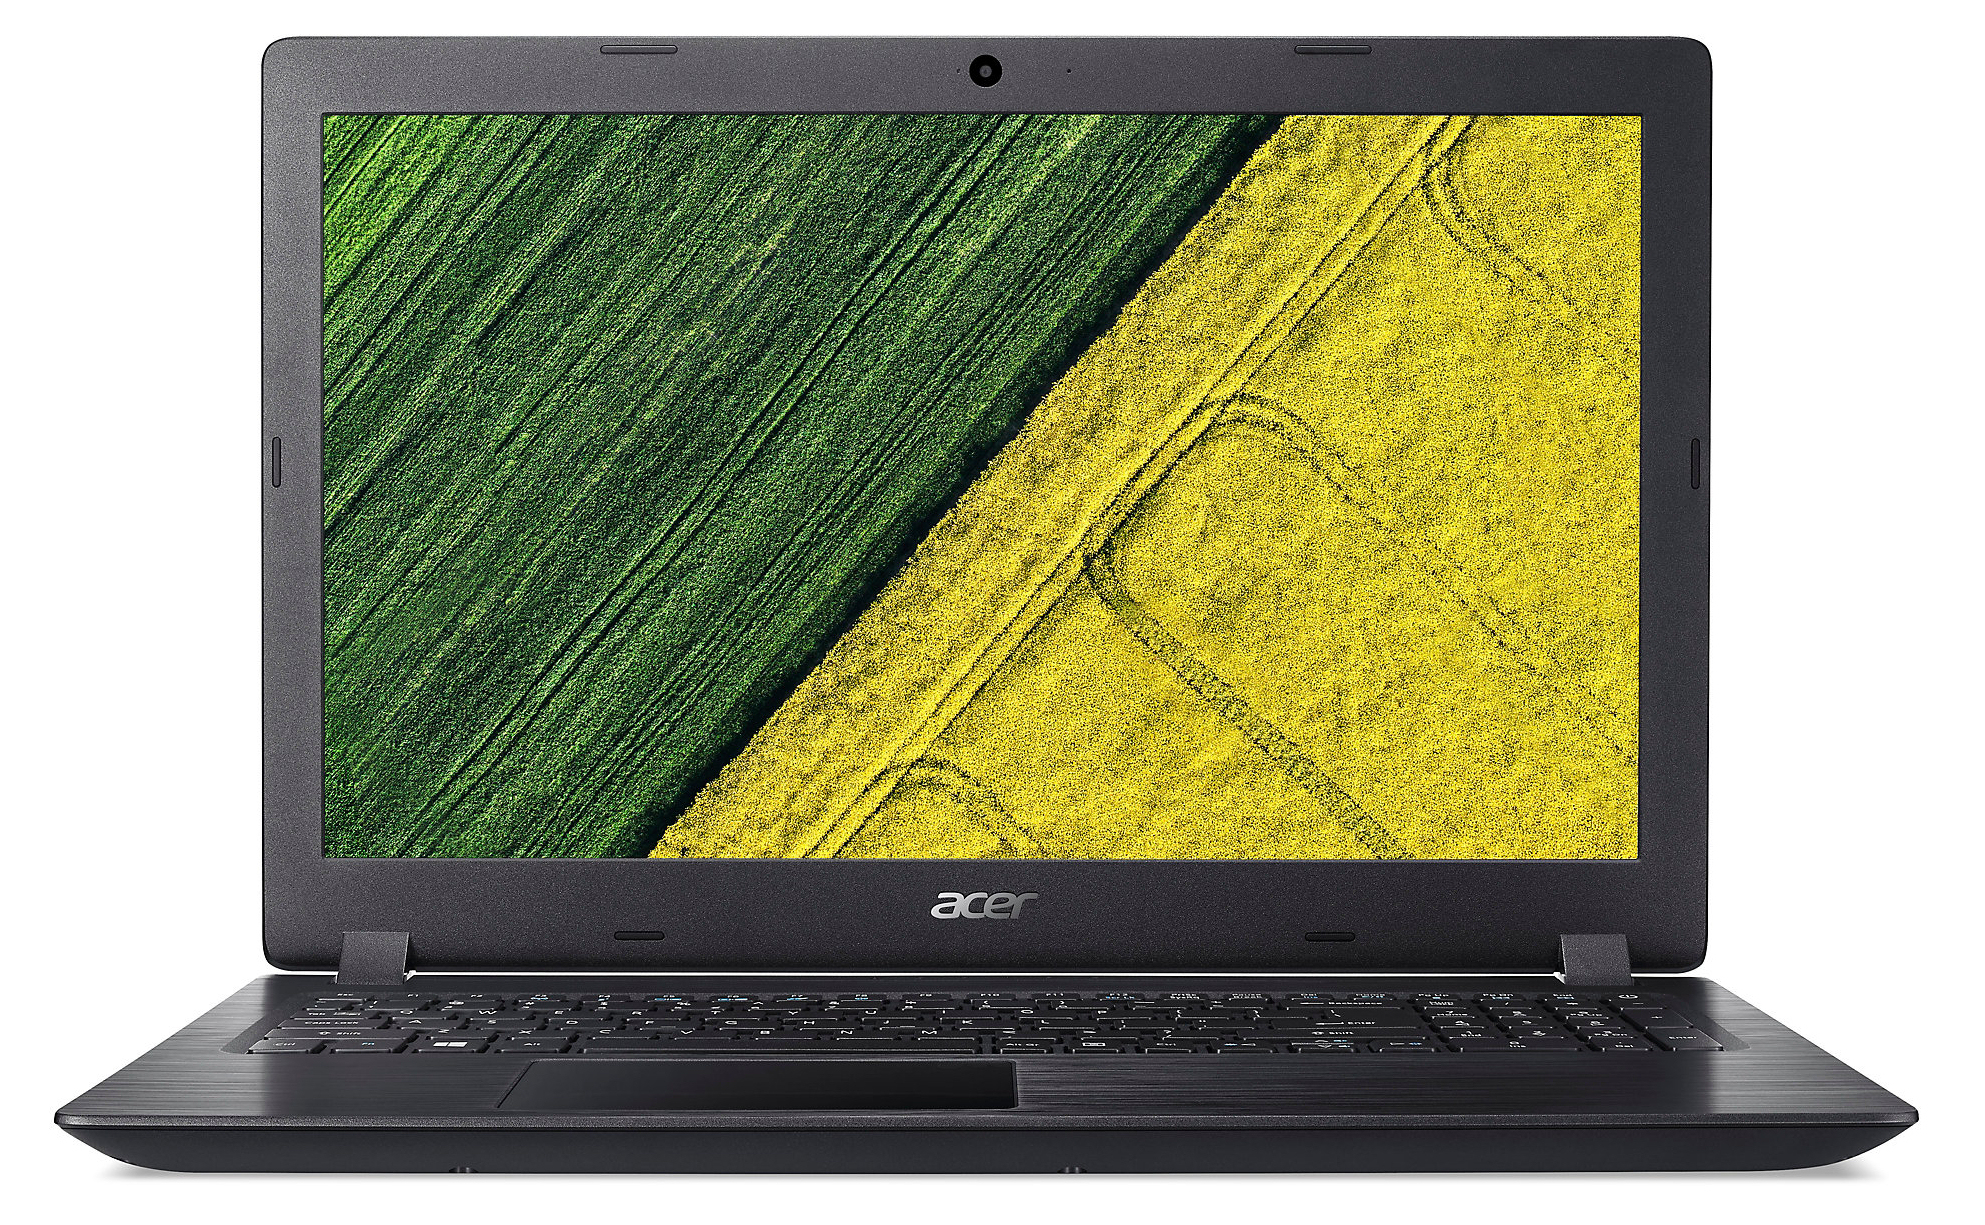
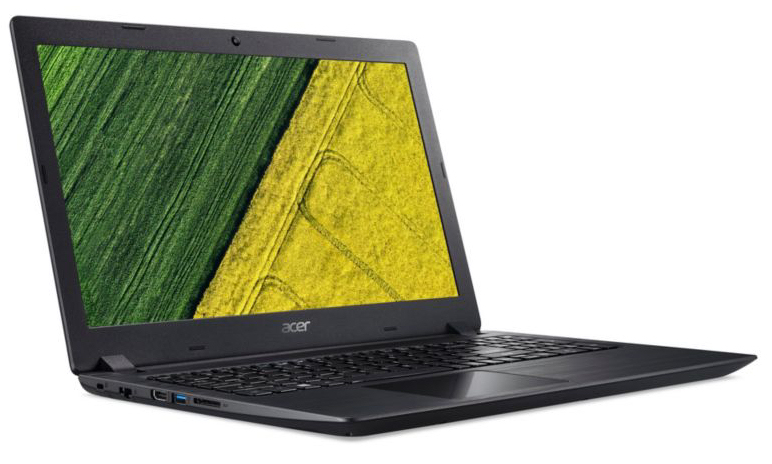
Acer Aspire 3 A315-21 (A6-9220, Radeon R4) Laptop Review
For the original German review, see here.
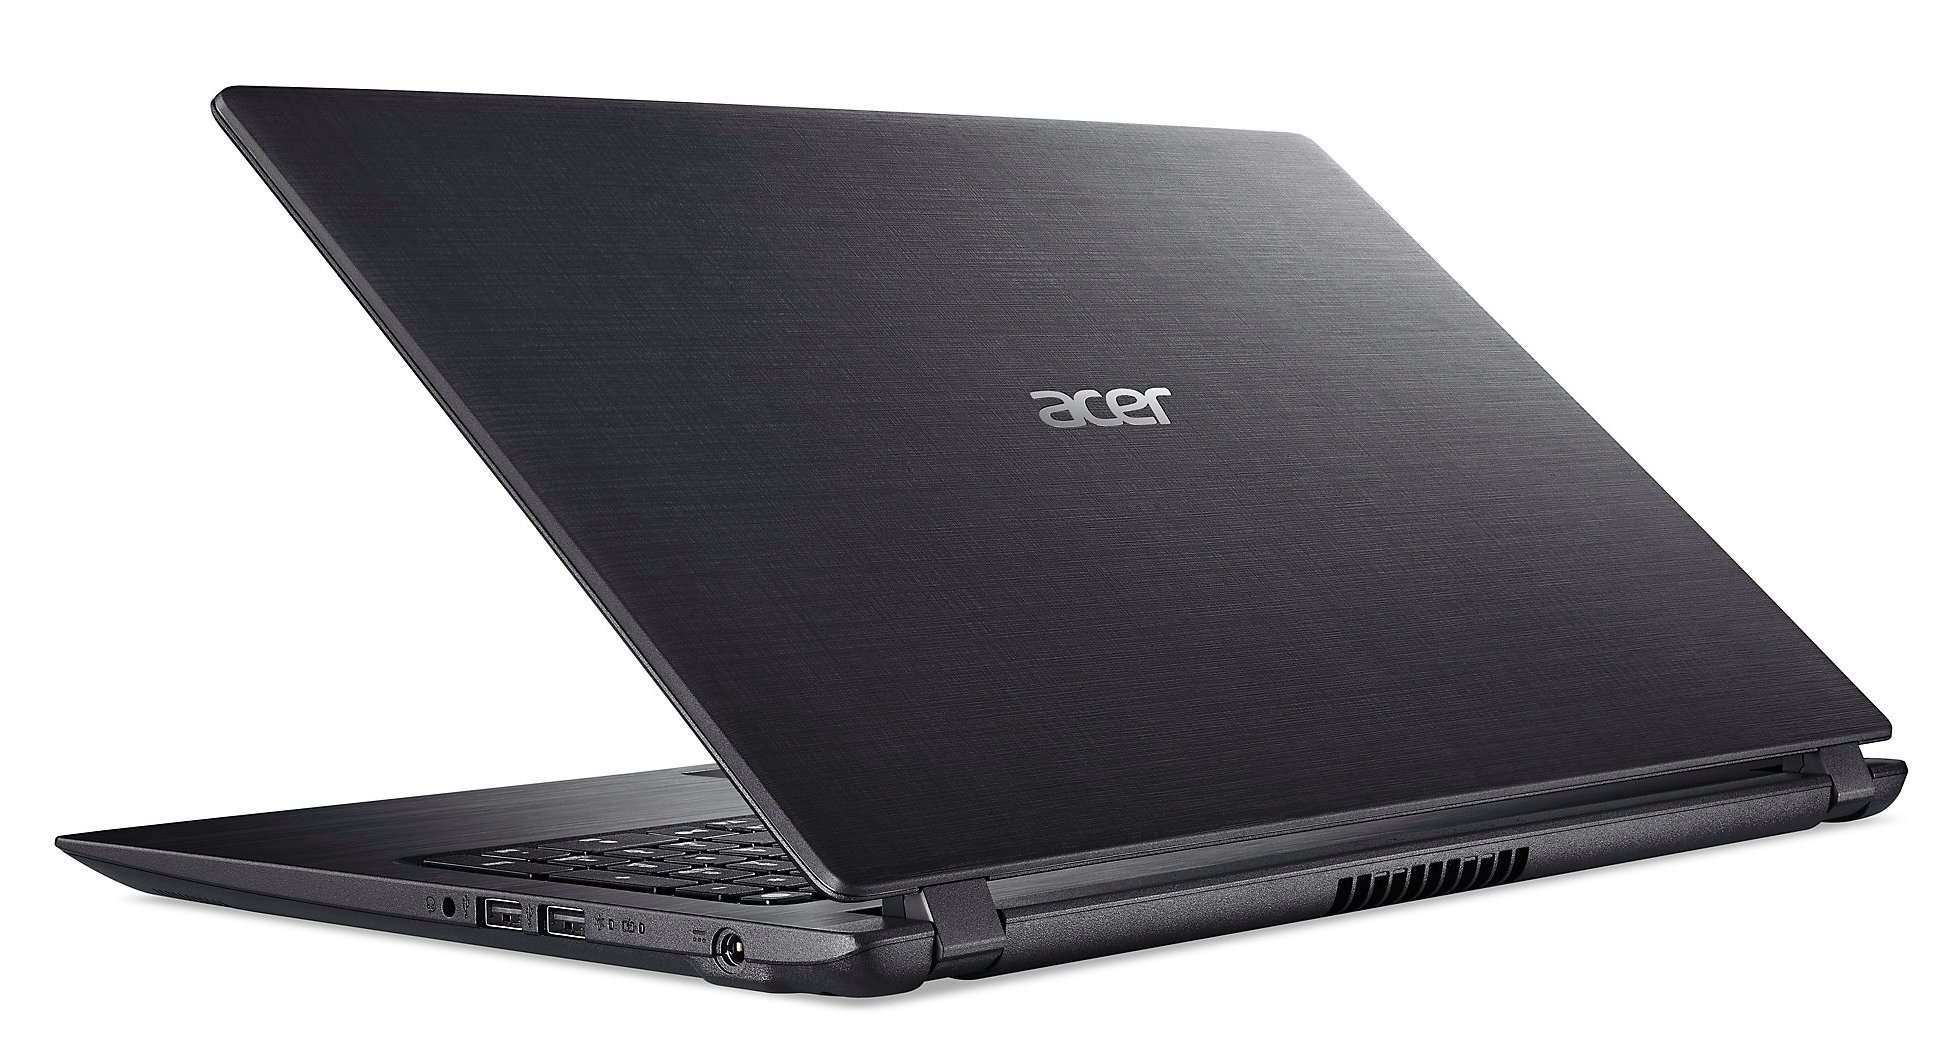
Acer's Aspire 3 A315-21 series represents a line of 15.6-inch laptops that run on Stoney Ridge APUs manufactured by AMD. The laptops are not unfamiliar to us, given that they are structurally identical to the Aspire 3 A315-51 line. The A315-51 line contains Intel processors. We recently reviewed one of the models from that line, the Aspire 3 A315-51-55E4. Our current test device's competition comprises of the Lenovo V110-15IKB, the Toshiba Satellite Pro R50-C, the HP 250 G5, the HP 15-ba077ng and similar devices.
Because the two Aspire 3 A315 models we've chosen to review are structurally identical, we will not cover the case, connectivity options, input devices or speakers in this article. For more information on these subjects, please see our review of the Aspire 3 A315-51-55E4.
Note: The Aspire 3's SSD (Kingston RBUSNS8180DS3128GH, 128 GB, M.2-2280, SATA III) died at the beginning of our testing process. In order to complete our tests, we replaced the SSD with one of ours (Transcend MTS400, 128 GB, M.2-2242, SATA III).
| SD Card Reader | |
| average JPG Copy Test (av. of 3 runs) | |
| Acer Aspire 3 A315-51-55E4 (Toshiba Exceria Pro SDXC 64 GB UHS-II) | |
| Acer Aspire 3 A315-21-651Y (Toshiba Exceria Pro SDXC 64 GB UHS-II) | |
| HP 15-ba077ng (Toshiba Exceria Pro SDXC 64 GB UHS-II) | |
| Lenovo IdeaPad V110-15IKB 80TH001SGE (Toshiba Exceria Pro SDXC 64 GB UHS-II) | |
| HP 250 G5 SP X0N33EA | |
| HP 250 G5 Y1V08UT (Toshiba Exceria Pro SDXC 64 GB UHS-II) | |
| Toshiba Satellite Pro R50-C-16V (Toshiba Exceria Pro SDXC 64 GB UHS-II) | |
| maximum AS SSD Seq Read Test (1GB) | |
| Acer Aspire 3 A315-51-55E4 (Toshiba Exceria Pro SDXC 64 GB UHS-II) | |
| Acer Aspire 3 A315-21-651Y (Toshiba Exceria Pro SDXC 64 GB UHS-II) | |
| HP 15-ba077ng (Toshiba Exceria Pro SDXC 64 GB UHS-II) | |
| Lenovo IdeaPad V110-15IKB 80TH001SGE (Toshiba Exceria Pro SDXC 64 GB UHS-II) | |
| HP 250 G5 Y1V08UT (Toshiba Exceria Pro SDXC 64 GB UHS-II) | |
| Toshiba Satellite Pro R50-C-16V (Toshiba Exceria Pro SDXC 64 GB UHS-II) | |
Display
The Aspire 3's 15.6-inch matte display has a native resolution of 1366x768 pixels. The brightness (219.8 cd/m2) and contrast (474:1) are too low.
At brightness levels of 20 percent and below, the display uses PWM-backlight flickering at a frequency of 25,000 Hz. A frequency in that high range should spare even sensitive users from eye problems and/or headaches.
| |||||||||||||||||||||||||
Brightness Distribution: 88 %
Center on Battery: 223 cd/m²
Contrast: 474:1 (Black: 0.47 cd/m²)
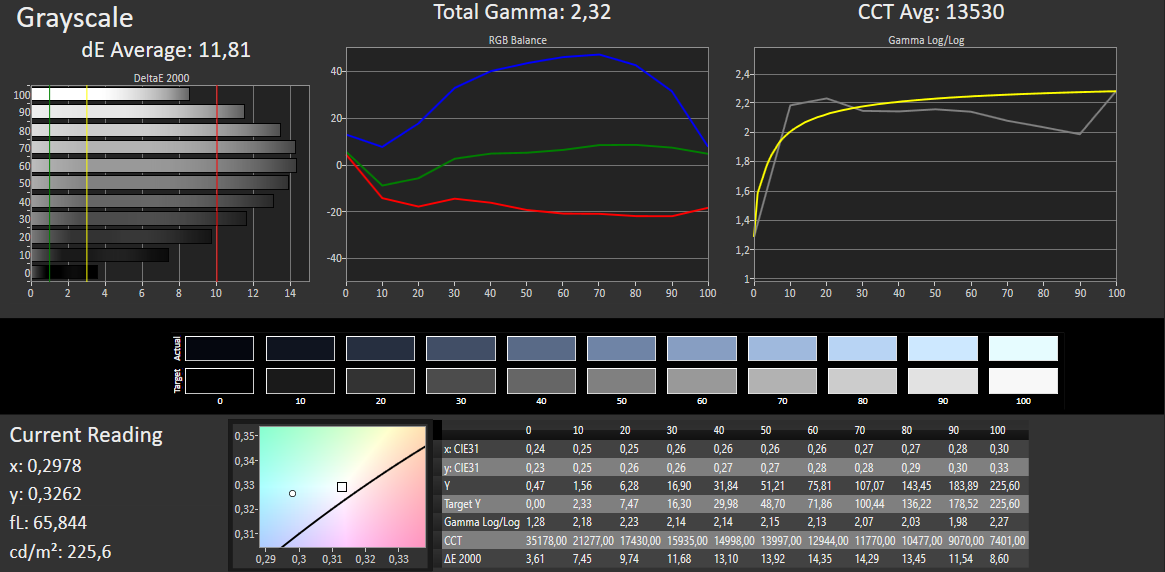
ΔE ColorChecker Calman: 10.72 | ∀{0.5-29.43 Ø4.71}
ΔE Greyscale Calman: 11.81 | ∀{0.09-98 Ø4.96}
59% sRGB (Argyll 1.6.3 3D)
38% AdobeRGB 1998 (Argyll 1.6.3 3D)
40.81% AdobeRGB 1998 (Argyll 3D)
59.2% sRGB (Argyll 3D)
39.48% Display P3 (Argyll 3D)
Gamma: 2.32
CCT: 13530 K
| Acer Aspire 3 A315-21-651Y TN LED, 1366x768, 15.6" | Lenovo IdeaPad V110-15IKB 80TH001SGE TN LED, 1366x768, 15.6" | Toshiba Satellite Pro R50-C-16V TN LED, 1366x768, 15.6" | HP 250 G5 SP X0N33EA TN, 1920x1080, 15.6" | HP 250 G5 Y1V08UT TN LED, 1366x768, 15.6" | HP 15-ba077ng TN LED, 1920x1080, 15.6" | Acer Aspire 3 A315-51-55E4 TN LED, 1920x1080, 15.6" | |
|---|---|---|---|---|---|---|---|
| Display | -1% | 3% | -8% | -10% | 1% | -9% | |
| Display P3 Coverage (%) | 39.48 | 38.91 -1% | 40.6 3% | 36.51 -8% | 35.43 -10% | 39.98 1% | 35.97 -9% |
| sRGB Coverage (%) | 59.2 | 58.6 -1% | 61.2 3% | 55 -7% | 53.3 -10% | 60.2 2% | 54.1 -9% |
| AdobeRGB 1998 Coverage (%) | 40.81 | 40.2 -1% | 41.95 3% | 37.72 -8% | 36.6 -10% | 41.31 1% | 37.17 -9% |
| Response Times | 17% | -30% | 9% | -10% | 6% | 27% | |
| Response Time Grey 50% / Grey 80% * (ms) | 48 ? | 39 ? 19% | 68 ? -42% | 40 ? 17% | 42.4 ? 12% | 42 ? 12% | 44 ? 8% |
| Response Time Black / White * (ms) | 22 ? | 19 ? 14% | 26 ? -18% | 22 ? -0% | 28.8 ? -31% | 22 ? -0% | 12 ? 45% |
| PWM Frequency (Hz) | 25000 ? | 10000 ? | 217 ? | 50 ? | |||
| Screen | -2% | -1% | -4% | -19% | -10% | 22% | |
| Brightness middle (cd/m²) | 223 | 243 9% | 226 1% | 219 -2% | 199.8 -10% | 209 -6% | 241 8% |
| Brightness (cd/m²) | 220 | 233 6% | 217 -1% | 222 1% | 199 -10% | 200 -9% | 229 4% |
| Brightness Distribution (%) | 88 | 75 -15% | 91 3% | 85 -3% | 85 -3% | 88 0% | 87 -1% |
| Black Level * (cd/m²) | 0.47 | 0.45 4% | 0.58 -23% | 0.39 17% | 0.712 -51% | 0.56 -19% | 0.46 2% |
| Contrast (:1) | 474 | 540 14% | 390 -18% | 562 19% | 281 -41% | 373 -21% | 524 11% |
| Colorchecker dE 2000 * | 10.72 | 11.69 -9% | 9.84 8% | 12.67 -18% | 13.24 -24% | 12.21 -14% | 3.4 68% |
| Colorchecker dE 2000 max. * | 17.7 | 20.08 -13% | 16.77 5% | 20.99 -19% | 21.52 -22% | 20.66 -17% | 7.61 57% |
| Greyscale dE 2000 * | 11.81 | 13.12 -11% | 11.1 6% | 13.82 -17% | 13.33 -13% | 13.48 -14% | 1.7 86% |
| Gamma | 2.32 95% | 2.24 98% | 2.35 94% | 2.63 84% | 1.69 130% | 2.34 94% | 2.36 93% |
| CCT | 13530 48% | 16905 38% | 11979 54% | 15633 42% | 15879 41% | 15364 42% | 6750 96% |
| Color Space (Percent of AdobeRGB 1998) (%) | 38 | 37 -3% | 39 3% | 35 -8% | 33.8 -11% | 38 0% | 34 -11% |
| Color Space (Percent of sRGB) (%) | 59 | 59 0% | 61 3% | 55 -7% | 53.4 -9% | 60 2% | 54 -8% |
| Total Average (Program / Settings) | 5% /
1% | -9% /
-4% | -1% /
-3% | -13% /
-16% | -1% /
-5% | 13% /
16% |
* ... smaller is better
Screen Flickering / PWM (Pulse-Width Modulation)
| Screen flickering / PWM detected | 25000 Hz | ≤ 20 % brightness setting | 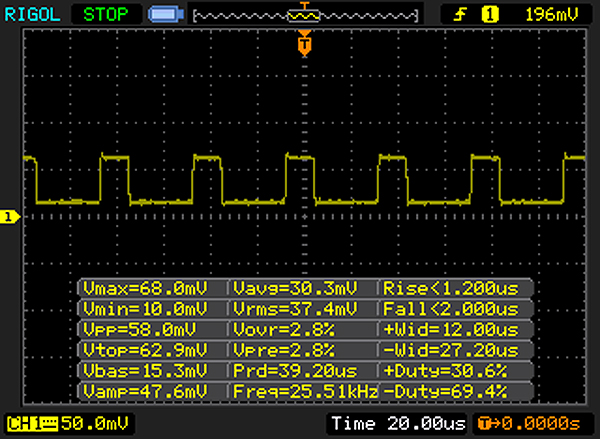 |
The display backlight flickers at 25000 Hz (worst case, e.g., utilizing PWM) Flickering detected at a brightness setting of 20 % and below. There should be no flickering or PWM above this brightness setting. The frequency of 25000 Hz is quite high, so most users sensitive to PWM should not notice any flickering. In comparison: 52 % of all tested devices do not use PWM to dim the display. If PWM was detected, an average of 7741 (minimum: 5 - maximum: 343500) Hz was measured. | |||
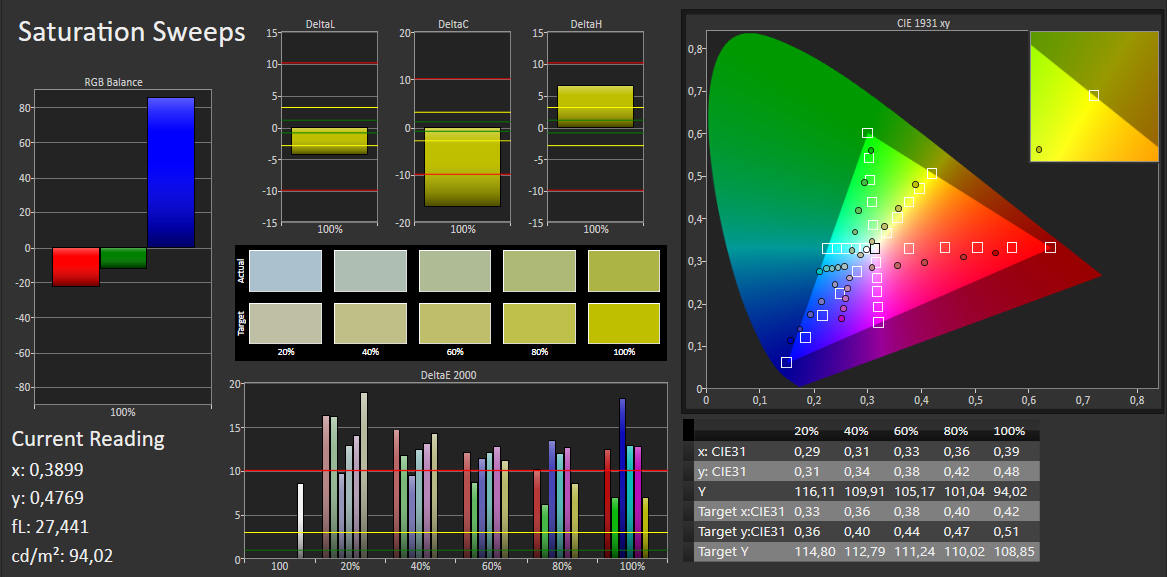
In factory default state, the display's DeltaE 2000 color deviation comes to 10.72. Manufacturers should strive for a difference of less than 3. The screen also suffers from a blue cast.

Display Response Times
| ↔ Response Time Black to White | ||
|---|---|---|
| 22 ms ... rise ↗ and fall ↘ combined | ↗ 18 ms rise | 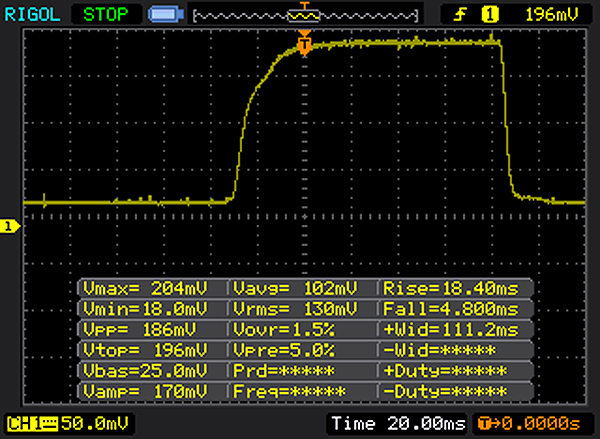 |
| ↘ 4 ms fall | ||
| The screen shows good response rates in our tests, but may be too slow for competitive gamers. In comparison, all tested devices range from 0.1 (minimum) to 240 (maximum) ms. » 49 % of all devices are better. This means that the measured response time is worse than the average of all tested devices (19.8 ms). | ||
| ↔ Response Time 50% Grey to 80% Grey | ||
| 48 ms ... rise ↗ and fall ↘ combined | ↗ 26 ms rise | 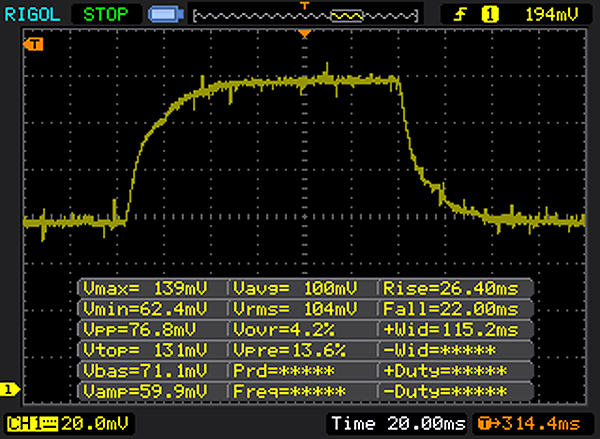 |
| ↘ 22 ms fall | ||
| The screen shows slow response rates in our tests and will be unsatisfactory for gamers. In comparison, all tested devices range from 0.165 (minimum) to 636 (maximum) ms. » 82 % of all devices are better. This means that the measured response time is worse than the average of all tested devices (30.9 ms). | ||
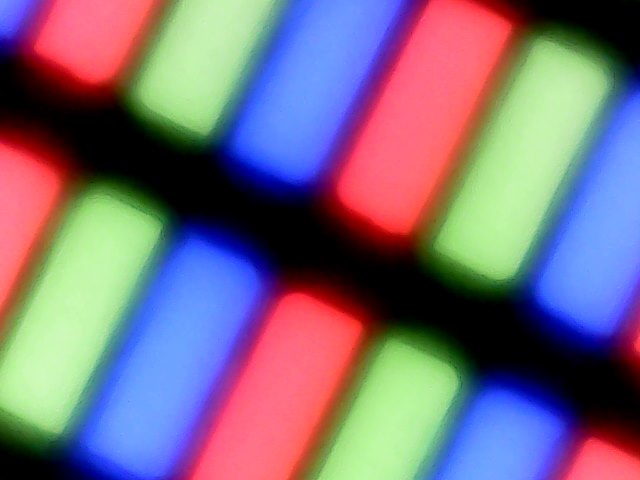
Unfortunately, Acer equipped the Aspire with a TN panel that does not offer stable viewing angles. As a result, the screen content does not look correct from every position. The laptop can be used outdoors when the sun is not shining too brightly.
Performance
The Aspire A315-21 is a simple 15.6-inch office laptop of Acer's creation. The computer offers enough processing power for office and Internet-related applications. Our test device is available for around 500 Euros (~$575; US model on the market for $418). Acer also offers other versions of the computer with different hardware components. These are joined by models from the structurally identical Aspire 3 A315-51 series.
Processor
The Aspire is equipped with an A6-9220 (Stoney Ridge) APU manufactured by AMD. With a TDP of 15 watts, the APU is on par with Intel's ULV processors. The CPU portion of the APU is a dual-core processor that runs at a frequency of 2.5 GHz. When using turbo, it is possible to increase the speed to up to 2.9 GHz. The system completed our CPU tests in the same way in both battery mode and AC power mode. The processor performed the single-thread tests at 2.7 to 2.9 GHz. Its behavior in the first run of the Cinebench R15 multithread test is representative of its behavior in multithread tests in general. It started the test at 2.9 GHz; shortly thereafter, the clock frequency fell to between 2.7 and 2.9 GHz. Later, it dropped to between 2.5 and 2.7 GHz.
To determine whether the CPU fully utilizes its turbo without interruption in AC power mode, we run the Cinebench R15 multithread test for about 30 minutes in a continuous loop. Between the first and second runs, the score dropped by a negligible margin to 110 points and remained there. This means the CPU does not experience a decline in performance.
The A6-9220 APU is suitable for running office and internet-related applications. Our comparison table reveals that the AMD CPU performs at more or less the same level as Intel's Pentium 3558U (Haswell) dual-core processor.
| Geekbench 4.4 | |
| 64 Bit Multi-Core Score | |
| Lenovo IdeaPad V110-15IKB 80TH001SGE | |
| HP 350 G1 F7Z01EA | |
| Acer Aspire 3 A315-21-651Y | |
| 64 Bit Single-Core Score | |
| Lenovo IdeaPad V110-15IKB 80TH001SGE | |
| HP 350 G1 F7Z01EA | |
| Acer Aspire 3 A315-21-651Y | |
System Performance
The system runs quickly and smoothly – we did not run into any problems. The results from the PCMark benchmark demonstrate that the device does not offer a high level of performance. The APU is designed for office and Internet-related applications. It is not possible to improve the computer's overall performance – Acer has already maximized the machine's performance power.
| PCMark 7 Score | 3558 points | |
| PCMark 8 Home Score Accelerated v2 | 2337 points | |
| PCMark 8 Creative Score Accelerated v2 | 2320 points | |
| PCMark 8 Work Score Accelerated v2 | 3483 points | |
| PCMark 10 Score | 1821 points | |
Help | ||
| PCMark 8 - Home Score Accelerated v2 | |
| HP 250 G5 SP X0N33EA | |
| Lenovo IdeaPad V110-15IKB 80TH001SGE | |
| Toshiba Satellite Pro R50-C-16V | |
| HP 15-ba077ng | |
| Acer Aspire 3 A315-21-651Y | |
| HP 250 G5 Y1V08UT | |
Storage Devices
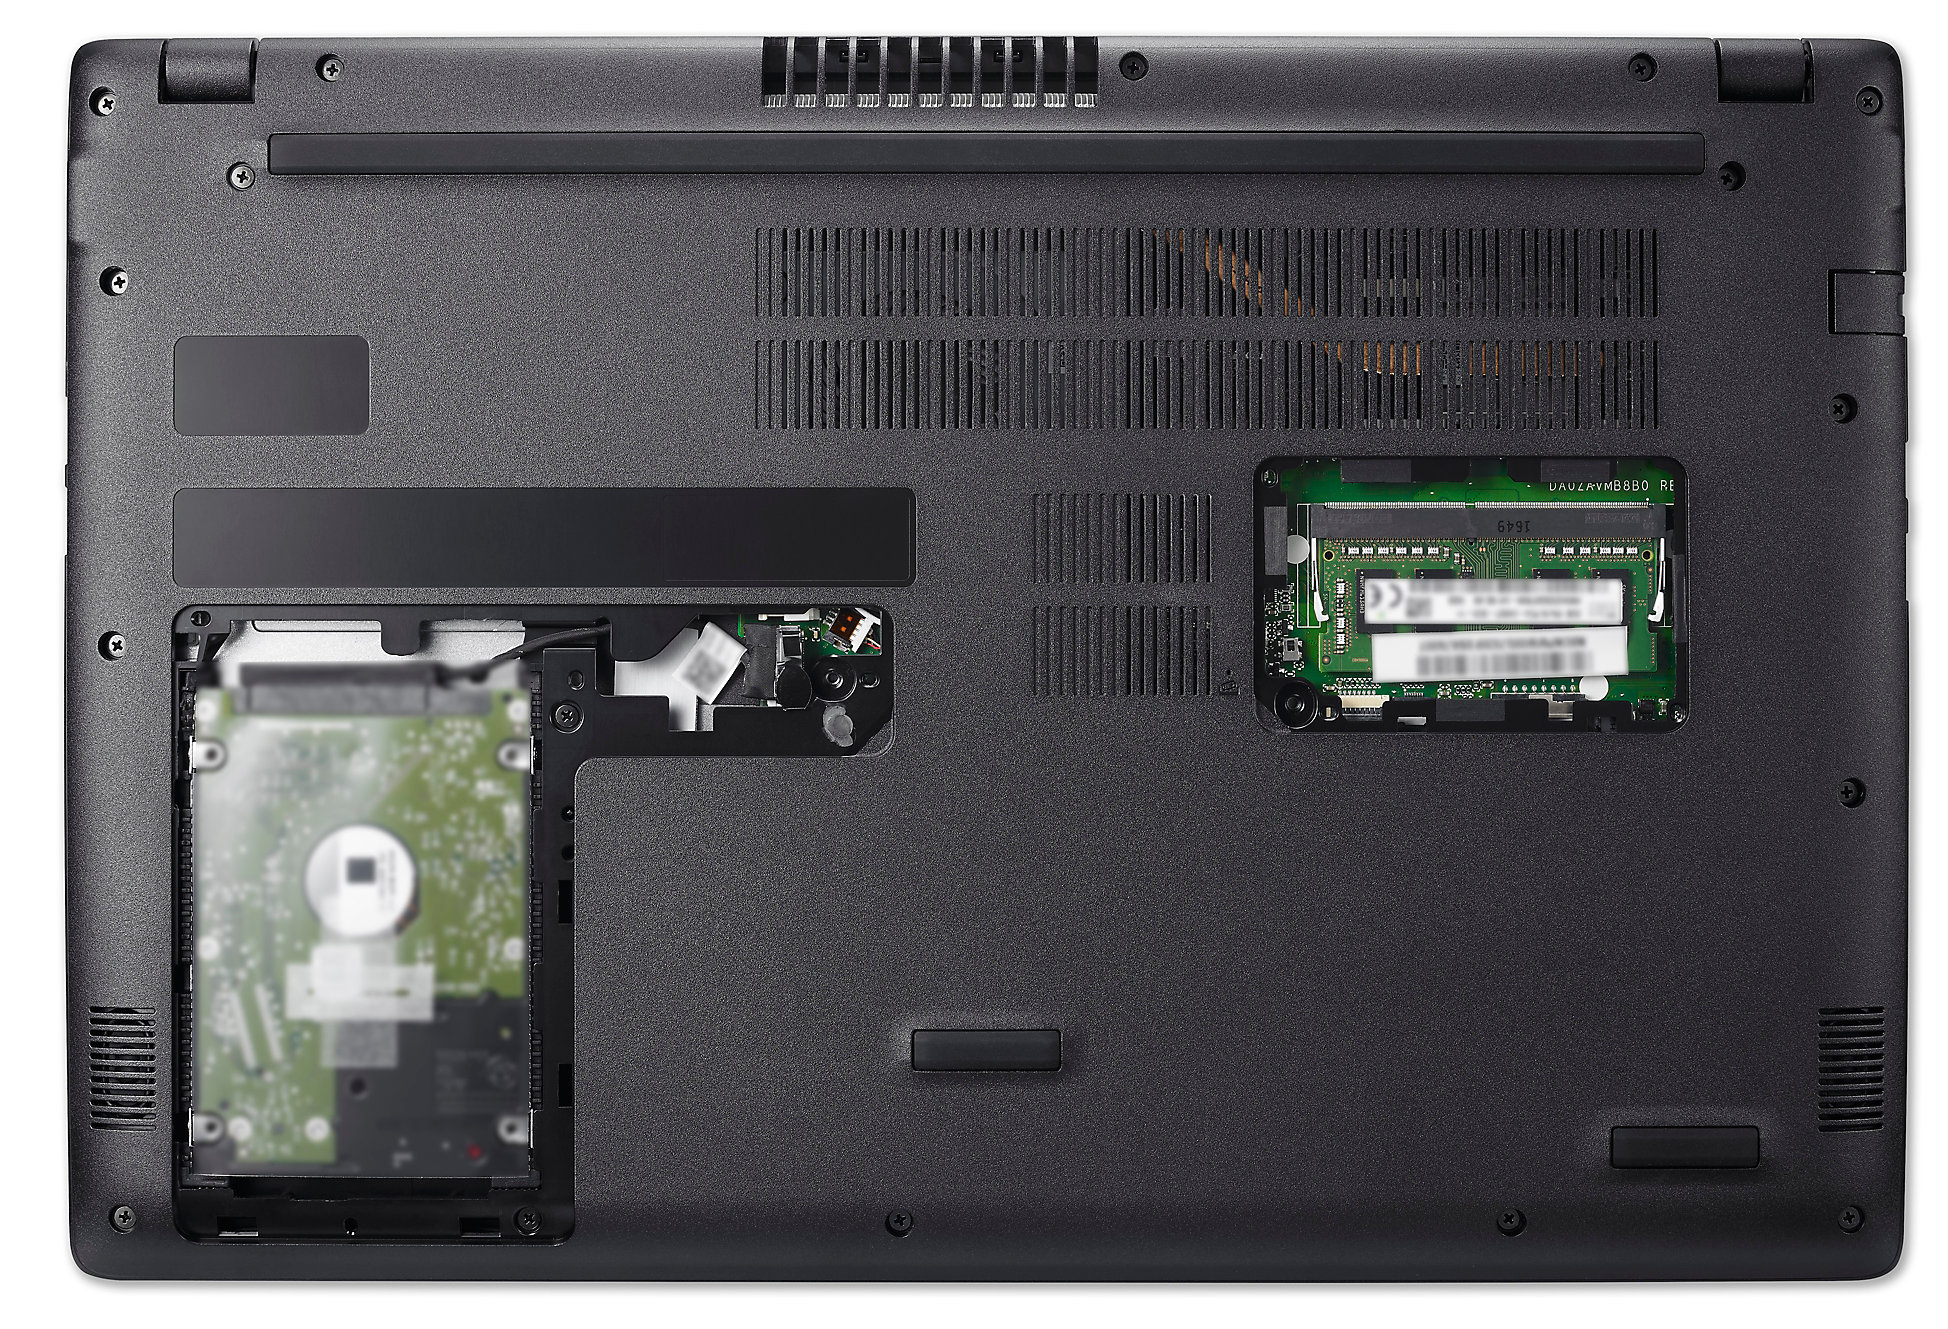
Acer chose to equip the computer with both an SSD and an HDD. The SSD serves as the system drive. This is an M.2-2280 SATA III model manufactured by Kingston (RBUSNS8180DS3128GH) and offers a total capacity of 128 GB. The 2.5-inch hard drive serves as the data storage center and provides 1 TB of storage space.
Since our test device's SSD died at the beginning of our testing process, we replaced it with one of our own (Transcend MTS400, 128 GB, M.2-2242, SATA III) in order to complete our tests. As a result, we cannot report on the Kingston SSD's transfer rates. However, we have encountered this SSD in other laptops. The transfer rates in those instances were somewhat higher than those of the Transcend SSD we used as a replacement.
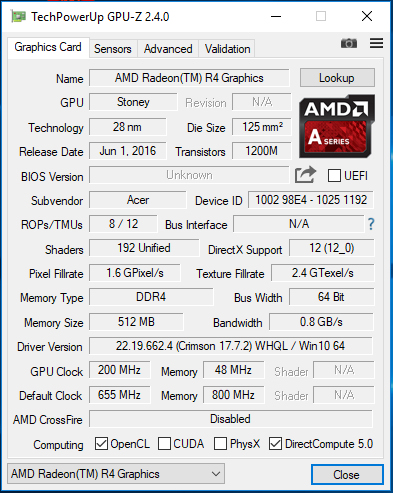
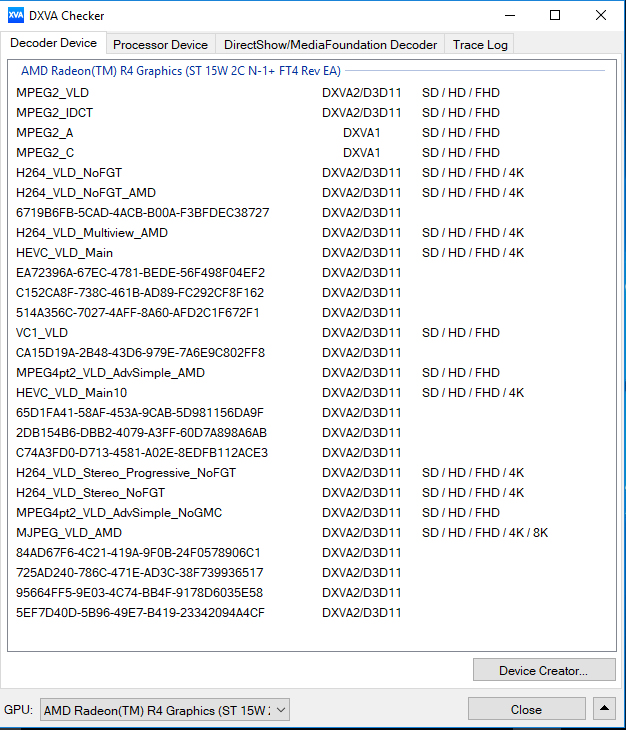
Graphics Card
AMD's Radeon R4 (Stoney Ridge) GPU is responsible for the laptop's graphics output. It supports DirectX 12 and reaches speeds of up to 655 MHz. The results in the 3D Mark benchmark are on par with those of Intel's HD Graphics 5500 graphics core. This is only true, however, when Intel's GPU has to rely on RAM running in single-channel mode. When dual-channel mode is active, Intel's GPU comes in ahead. The AMD graphics core's performance cannot be improved by activating dual-channel mode, since the laptop's memory controller only supports single-channel mode. The decoder integrated into the GPU can decode both H.264 and HEVC/H.265 material in up to 4K resolution.
| 3DMark 06 Standard Score | 3886 points | |
| 3DMark Vantage P Result | 2542 points | |
| 3DMark 11 Performance | 984 points | |
| 3DMark Ice Storm Standard Score | 30989 points | |
| 3DMark Cloud Gate Standard Score | 2458 points | |
| 3DMark Fire Strike Score | 545 points | |
| 3DMark Fire Strike Extreme Score | 273 points | |
| 3DMark Time Spy Score | 215 points | |
Help | ||
Gaming Performance
The Aspire 3 can run a few games smoothly – namely titles that have little in the way of hardware demands. However, the player is limited to low resolutions and low quality settings.
| low | med. | high | ultra | |
|---|---|---|---|---|
| Deus Ex Human Revolution (2011) | 47.7 | 21.9 | ||
| The Elder Scrolls V: Skyrim (2011) | 25.7 | 16.5 | 11.3 | |
| Anno 2070 (2011) | 53.8 | 23.7 | 15.5 | |
| Diablo III (2012) | 44.8 | 31.9 | 27.7 | |
| Counter-Strike: GO (2012) | 29.7 | 21.9 | 17.8 | |
| Dead Space 3 (2013) | 45.5 | 22.9 | 19.5 | |
| Tomb Raider (2013) | 39.4 | 19.9 | 13.2 | |
| BioShock Infinite (2013) | 34.6 | 20.8 | 17 | |
| GRID: Autosport (2014) | 57 | 24.5 | ||
| Sims 4 (2014) | 90 | 28.8 | ||
| F1 2014 (2014) | 30 | 26 | ||
| Dragon Age: Inquisition (2014) | 15.1 | 10.9 | ||
| Battlefield Hardline (2015) | 15.1 | 12 | ||
| Dirt Rally (2015) | 48.8 | 16.2 | ||
| Metal Gear Solid V (2015) | 26 | 17.9 | ||
| Dota 2 Reborn (2015) | 32.4 | 20.3 | ||
| World of Warships (2015) | 30 | 22.1 | ||
| Overwatch (2016) | 20.7 | 16.9 | ||
| Farming Simulator 17 (2016) | 38 | 24.8 | ||
| Rocket League (2017) | 31.3 | |||
| Team Fortress 2 (2017) | 23 | 22.6 | ||
| Middle-earth: Shadow of War (2017) | 15 |
Emissions & Energy
In idle mode, the Aspire's fan often stands still. In that case, the only audible sound is the quiet whirring of the 2.5-inch hard drive. The fan runs at a low speed under all levels of load – from low to maximum. The sound pressure level comes to 31.9 dB in both cases. However, the fan does increase its speed time and again – in which case the sound pressure level intensifies to up to 39 dB.
The fan revs up in this way under full load, in idle mode and under low levels of load. If we observe the temperatures of the various laptop components, we see that the fan does not in fact need to increase its speed. This behavior is especially bothersome in a simple office laptop. In fact, it is a strong argument against buying the device. Acer should fix this with a BIOS update.
Noise level
| Idle |
| 30.4 / 31.6 / 31.6 dB(A) |
| HDD |
| 31 dB(A) |
| Load |
| 31.9 / 31.9 dB(A) |
 | ||
30 dB silent 40 dB(A) audible 50 dB(A) loud |
||
min: | ||
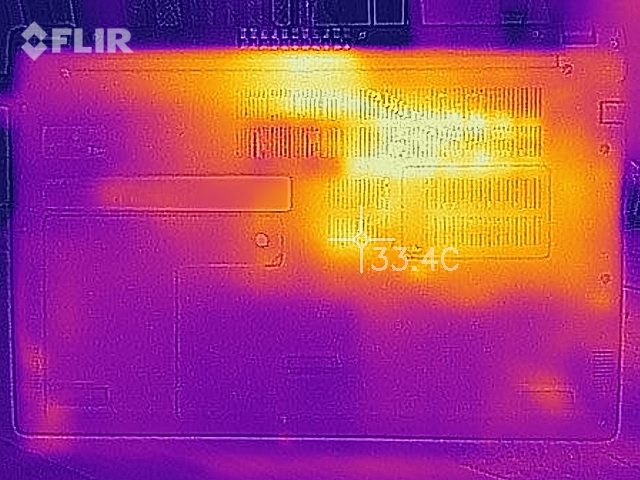
Temperature
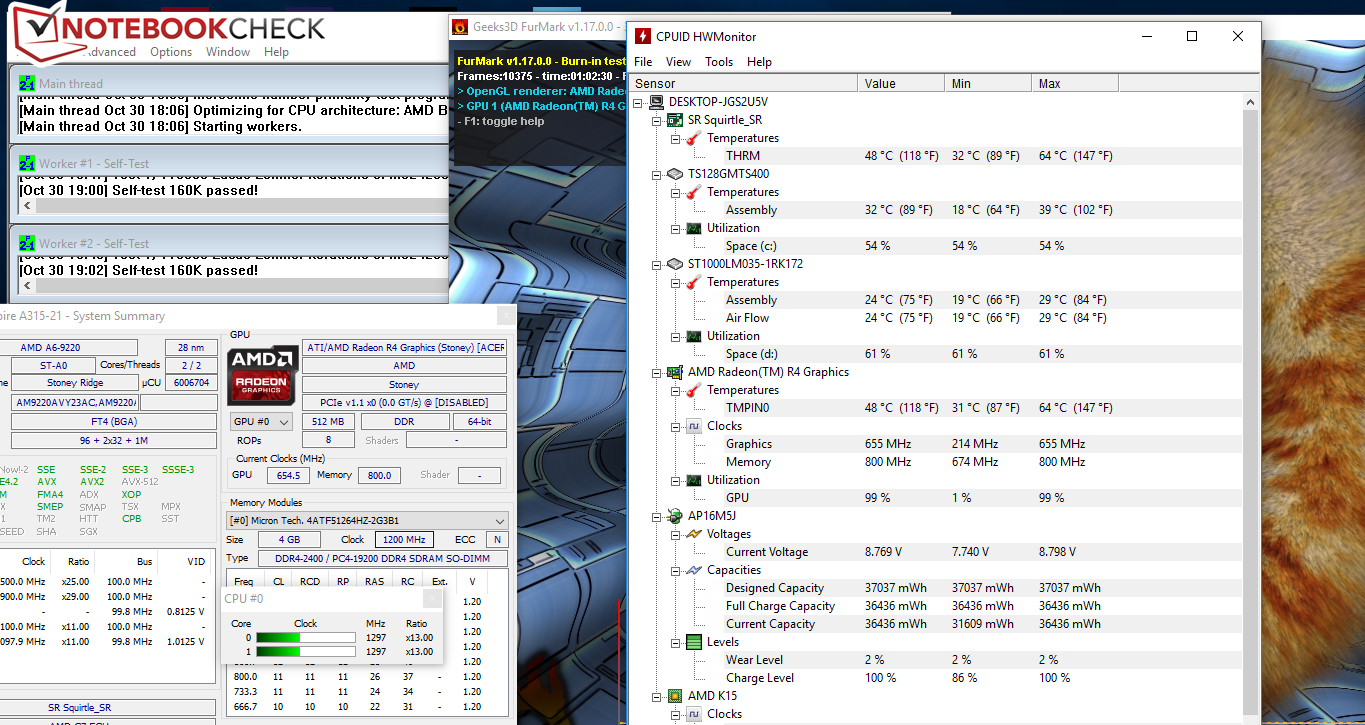
The Aspire completed our stress test (Prime95 and Furmark running simultaneously for at least an hour) in the same way in both AC power mode and battery mode. The processor ran at 1.3 GHz, while the graphics core went about its business at full speed (655 MHz). The computer hardly warmed up at all. During the stress test, the case temperature only exceeded 30 °C (86 °F) in two spots.
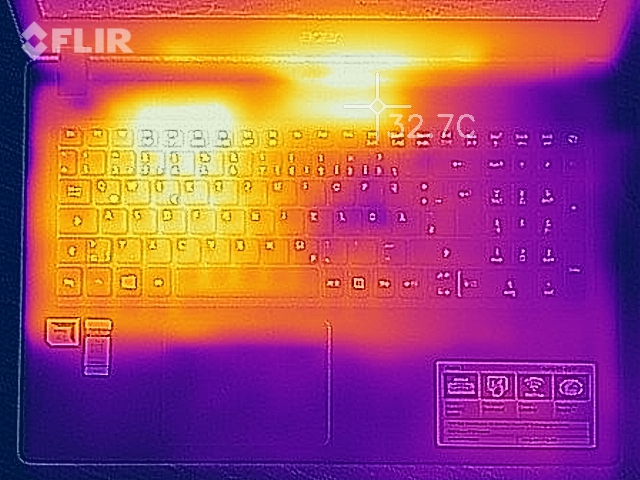
(+) The maximum temperature on the upper side is 30.5 °C / 87 F, compared to the average of 34.3 °C / 94 F, ranging from 21.2 to 62.5 °C for the class Office.
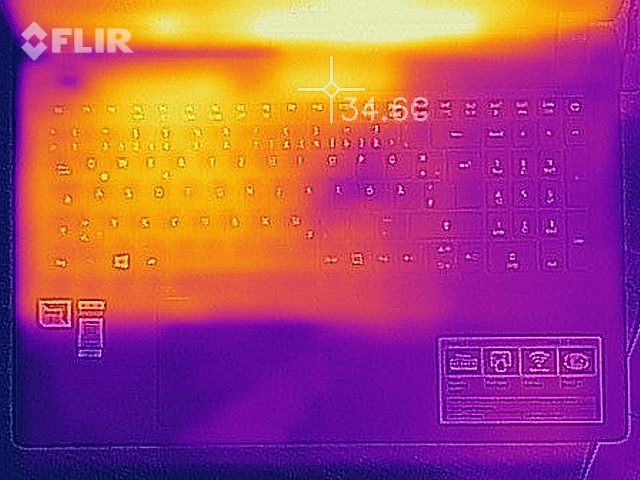
(+) The bottom heats up to a maximum of 33 °C / 91 F, compared to the average of 36.8 °C / 98 F
(+) In idle usage, the average temperature for the upper side is 25.8 °C / 78 F, compared to the device average of 29.5 °C / 85 F.
(+) The palmrests and touchpad are cooler than skin temperature with a maximum of 24 °C / 75.2 F and are therefore cool to the touch.
(+) The average temperature of the palmrest area of similar devices was 27.6 °C / 81.7 F (+3.6 °C / 6.5 F).

Speakers
Acer Aspire 3 A315-21-651Y audio analysis
(-) | not very loud speakers (71.9 dB)
Bass 100 - 315 Hz
(-) | nearly no bass - on average 22.4% lower than median
(±) | linearity of bass is average (8.6% delta to prev. frequency)
Mids 400 - 2000 Hz
(±) | higher mids - on average 6.5% higher than median
(±) | linearity of mids is average (13.1% delta to prev. frequency)
Highs 2 - 16 kHz
(+) | balanced highs - only 4% away from median
(+) | highs are linear (6.8% delta to prev. frequency)
Overall 100 - 16.000 Hz
(±) | linearity of overall sound is average (27.8% difference to median)
Compared to same class
» 87% of all tested devices in this class were better, 4% similar, 10% worse
» The best had a delta of 7%, average was 21%, worst was 53%
Compared to all devices tested
» 85% of all tested devices were better, 3% similar, 12% worse
» The best had a delta of 4%, average was 23%, worst was 134%
Apple MacBook 12 (Early 2016) 1.1 GHz audio analysis
(+) | speakers can play relatively loud (83.6 dB)
Bass 100 - 315 Hz
(±) | reduced bass - on average 11.3% lower than median
(±) | linearity of bass is average (14.2% delta to prev. frequency)
Mids 400 - 2000 Hz
(+) | balanced mids - only 2.4% away from median
(+) | mids are linear (5.5% delta to prev. frequency)
Highs 2 - 16 kHz
(+) | balanced highs - only 2% away from median
(+) | highs are linear (4.5% delta to prev. frequency)
Overall 100 - 16.000 Hz
(+) | overall sound is linear (10.2% difference to median)
Compared to same class
» 7% of all tested devices in this class were better, 2% similar, 90% worse
» The best had a delta of 5%, average was 18%, worst was 53%
Compared to all devices tested
» 5% of all tested devices were better, 1% similar, 94% worse
» The best had a delta of 4%, average was 23%, worst was 134%
Frequency diagram in comparison (checkboxes above selectable/deselectable!)
Energy Consumption
The Aspire does not need much energy under any level of load. In idle mode, we registered a maximum energy consumption rate of 8.7 watts. During the stress test, the rate rose to 21.6 watts. This figure would be higher if the CPU did not throttle so severely. The 45-watt power supply is able to provide the laptop with more than enough power.
| Off / Standby | |
| Idle | |
| Load |
|
Key:
min: | |
Battery Life
Our WLAN test – designed to simulate normal, everyday use – uses a script to load new websites at regular intervals. The "balanced" profile is active, the display brightness is set to about 150 cd/m², and the device's energy-saving functions are deactivated. The Aspire 3 lasted 4:03 hours – certainly not an astounding runtime. In comparison, the laptop's Intel-based sister model managed 5:50 hours out of the same battery.
Pros
Cons
Verdict
Acer's Aspire 3 A315-21-651Y is a simple 15.6-inch office laptop to use at home. The APU has sufficient performance power to handle office and Internet-related applications. The laptop hardly warms up at all. It could also run quietly under every level of load, but the unsatisfactory fan control ruins the whole thing.
The Aspire 3 A315-21 is a simple office laptop that can easily handle everyday tasks.
The SSD enables the system to run quickly. There is no shortage of storage space, given that the SSD is accompanied by a 1 TB 2.5-inch hard drive. The keyboard is reasonably good and fulfills all the requirements for home use. The matte 15.6-inch display will not win any prizes. It is dark, has poor contrast, and it does not provide stable viewing angles.
In our eyes, the Aspire's price is its biggest problem. At the time of publishing, the device is listed at just under 500 Euros (~$575; US version $418) on various price search engines. Some of the models from the structurally identical, Intel-based Aspire 3 A315-51 series are at a similar price point. The Intel CPUs in those machines are substantially more powerful than the AMD APU. Additionally, those models offer better battery life.
Acer Aspire 3 A315-21-651Y
- 11/02/2017 v6 (old)
Sascha Mölck
Price comparison
