Intel HD Graphics 4400 vs Intel HD Graphics 3000
Intel HD Graphics 4400 ► remove from comparison
The Intel HD Graphics 4400 (GT2) is a processor graphics card included in some of the ULV Haswell processors of 2013. The relatively low base clock can be automatically overclocked using Turbo Boost technology. Depending on the processor model, the turbo clock rates may differ, resulting in varying graphics performance between models.
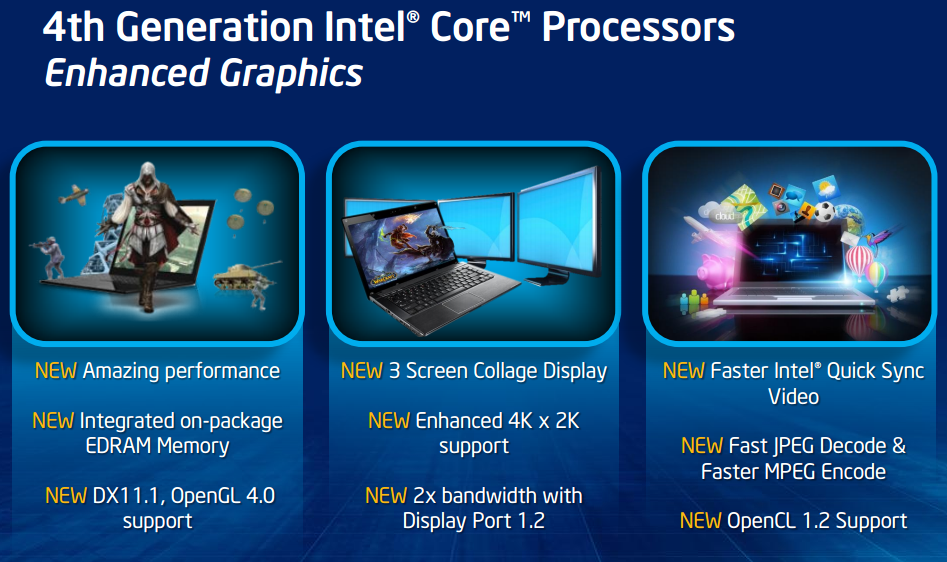
In comparison to the HD 4000, the HD 4400 graphics core has been modified extensively. The GPU now supports DirectX 11.1, OpenCL 1.2 and OpenGL 4.0. It also features an improved decoder for 4K videos and the fast Quick Sync encoder. Compared to the faster 4600, the 4400 offers the same amount of shaders, but lower clock speeds (see table of clock speeds of the different CPU models below).
The performance of the HD Graphics 4400 is somewhat below the HD 4600 , since the GPU is designed for ULV models. Therefore, the clock rates are relatively low. Furthermore, the reduced TDP limits the Turbo Boost. Compared to the ULV versions of the Ivy Bridge HD 4000 , the HD 4400 is about 20 - 30 percent faster. This performance boost is achieved by architectural improvements and an increased number of execution units: The GT2 version integrates 20 EUs, compared to 16 EUs for the old HD 4000. Depending on the clock rate, the HD 4400 matches the performance of a dedicated Radeon HD 7550M .
Due to the 22nm 3D Tri-Gate production process, the power consumption is relatively low. The HD Graphics 4400 can be found on ULV dual-core Haswell models with a TDP of 15 watts.
Intel HD Graphics 3000 ► remove from comparison
The Intel HD Graphics 3000 (or Intel Graphics Media Accelerator HD 3000, GMA HD 3000, Intel HD Graphics 200) is an integrated graphics card in the Sandy Bridge codenamed processors. The HD Graphics 3000 has no dedicated memory but shares the Level 3 / LLC Cache with the CPU cores and also part of the main memory. Due to TurboBoost, the GPU can be overclocked depending on the current CPU load and power consumption. The base speed and the turbo boost speed of the HD Graphics 3000 depend on the processor:
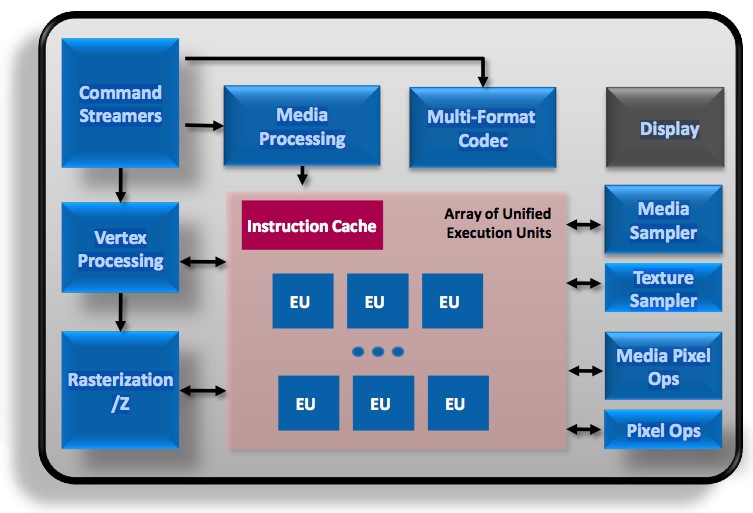
ULV processors Core ix-2xx7 (base 350MHz, Turbo 900-1000MHz) LV processors Core ix-2xx5 (base 500MHz, Turbo 1000MHz) Mainstream and high-end Dual und Quad-Core Core ix-2xx0 (base 650MHz, Turbo 1100-1300MHz) Desktop K processors (base 850, Turbo 1100-1350MHz) The HD 3000 offers 12 Execution Units (EUs) like the old Intel GMA HD but due to architectural changes each EU is now faster. The slower HD Graphics 2000 uses only 6 Execution Units. The EUs can be accessed using DirectX 10.1, OpenGL 3.0 and DirectCompute 4.1. OpenCL is not supported (the media SDK only uses the CPU).
Our performance tests with the high clocked mainstream version of the HD Graphics 3000 in quad-core processors showed a performance level on par with older entry level generations from NVIDIA (e.g. GeForce 310M ) and AMD (HD 5450 ). In comparison with AMD's APU models, the HD 3000 can only compete against the C-and E-series, but not the faster Llano and Trinity models. The quality of the Intel drivers has been improved over the years, so most games are flawlessly playable (if the minimum requirements are fullfilled).
We could measure smooth frame rates in games like Dead Space 3, World of Tanks, Fifa 13, Torchlight 2, Counter-Strike: GO reach, Diablo 3, and many older games, though usually only in minimal detail settings. For accurate performance analysis and gaming benchmarks, read our article "Intel HD Graphics 3000" or scroll down in this article.
Altought 2x Antialiasing (AA) is supported, the chip is as fast as when rendering 4x AA. In the Unigine Valley benchmark a i7-2637M for example reached the same score with 2x AA and 4x AA.
In addition to the GPU, the chip also houses some dedicated units for decoding and encoding HD videos . On the IDF Intel demonstrated the encoding of a 3 minute long 1080p video to an iPhone compatible format in 640x360 in only 14s. Another novelty of the Sandy Bridge GPU is the embedded DisplayPort eDP to connect internal Displays.
Due to the integration in the 32nm built CPU, the power consumption of the GPU should be quite low.
Intel HD Graphics 4400 Intel HD Graphics 3000 HD Graphics Series Codename Haswell GT2 Sandy Bridge Architecture Gen. 7.5 Haswell Gen. 6 Sandy Bridge Pipelines 20 - unified 12 - unified Core Speed 200 - 1100 (Boost) MHz 350 - 1350 (Boost) MHz Memory Bus Width 64/128 Bit 64/128 Bit Shared Memory yes yes API DirectX 11.1, Shader 5.0, OpenGL 4.0 DirectX 10.1, Shader 4.1, OpenGL 3.0 technology 22 nm 32 nm Features QuickSync Date of Announcement 05.06.2013 01.02.2011
CPU in HD Graphics 4400 GPU Base Speed GPU Boost / Turbo Intel Core i7-4600U 2 x 2100 MHz, 15 W 200 MHz 1100 MHz Intel Core i7-4510U 2 x 2000 MHz, 15 W 200 MHz 1100 MHz Intel Core i7-4500U 2 x 1800 MHz, 15 W 200 MHz 1100 MHz » show 10 more Intel Core i5-4310U 2 x 2000 MHz, 15 W 200 MHz 1100 MHz Intel Core i5-4300U 2 x 1900 MHz, 15 W 200 MHz 1100 MHz Intel Core i5-4210U 2 x 1700 MHz, 15 W 200 MHz 1000 MHz Intel Core i5-4200U 2 x 1600 MHz, 15 W 200 MHz 1000 MHz Intel Core i3-4120U 2 x 2000 MHz, 15 W 200 MHz 1000 MHz Intel Core i3-4030U 2 x 1900 MHz, 15 W 200 MHz 1000 MHz Intel Core i3-4025U 2 x 1900 MHz, 15 W 200 MHz 950 MHz Intel Core i3-4100U 2 x 1800 MHz, 15 W 200 MHz 1000 MHz Intel Core i3-4010U 2 x 1700 MHz, 15 W 200 MHz 1000 MHz Intel Core i3-4005U 2 x 1700 MHz, 15 W 200 MHz 950 MHz min. - max. 200 MHz 950 - 1100 MHz
CPU in HD Graphics 3000 GPU Base Speed GPU Boost / Turbo Intel Core i7-2700K 4 x 3500 MHz, 95 W 850 MHz 1350 MHz Intel Core i7-2600K 4 x 3400 MHz, 95 W 850 MHz 1350 MHz Intel Core i7-2960XM 4 x 2700 MHz, 55 W 650 MHz 1300 MHz » show 41 more Intel Core i7-2860QM 4 x 2500 MHz, 45 W 650 MHz 1300 MHz Intel Core i7-2920XM 4 x 2500 MHz, 55 W 650 MHz 1300 MHz Intel Core i5-2500K 4 x 3300 MHz, 95 W 850 MHz 1100 MHz Intel Core i7-2760QM 4 x 2400 MHz, 45 W 650 MHz 1300 MHz Intel Core i7-2820QM 4 x 2300 MHz, 45 W 650 MHz 1300 MHz Intel Core i7-2720QM 4 x 2200 MHz, 45 W 650 MHz 1300 MHz Intel Core i7-2675QM 4 x 2200 MHz, 45 W 650 MHz 1200 MHz Intel Core i7-2670QM 4 x 2200 MHz, 45 W 650 MHz 1100 MHz Intel Core i7-2635QM 4 x 2000 MHz, 45 W 650 MHz 1200 MHz Intel Core i7-2630QM 4 x 2000 MHz, 45 W 650 MHz 1100 MHz Intel Core i7-2640M 2 x 2800 MHz, 35 W 650 MHz 1300 MHz Intel Core i7-2620M 2 x 2700 MHz, 35 W 650 MHz 1300 MHz Intel Core i5-2540M 2 x 2600 MHz, 35 W 650 MHz 1300 MHz Intel Core i5-2520M 2 x 2500 MHz, 35 W 650 MHz 1300 MHz Intel Core i5-2450M 2 x 2500 MHz, 35 W 650 MHz 1300 MHz Intel Core i5-2435M 2 x 2400 MHz, 35 W 650 MHz 1300 MHz Intel Core i5-2430M 2 x 2400 MHz, 35 W 650 MHz 1200 MHz Intel Core i5-2415M 2 x 2300 MHz, 35 W 650 MHz 1300 MHz Intel Core i5-2410M 2 x 2300 MHz, 35 W 650 MHz 1200 MHz Intel Core i7-2649M 2 x 2300 MHz, 25 W 500 MHz 1100 MHz Intel Core i3-2370M 2 x 2400 MHz, 35 W 650 MHz 1150 MHz Intel Core i3-2350M 2 x 2300 MHz, 35 W 650 MHz 1150 MHz Intel Core i3-2348M 2 x 2300 MHz, 35 W 650 MHz 1150 MHz Intel Core i7-2629M 2 x 2100 MHz, 25 W 500 MHz 1100 MHz Intel Core i7-2677M 2 x 1800 MHz, 17 W 350 MHz 1200 MHz Intel Core i3-2330M 2 x 2200 MHz, 35 W 650 MHz 1100 MHz Intel Core i3-2328M 2 x 2200 MHz, 35 W 650 MHz 1100 MHz Intel Core i7-2637M 2 x 1700 MHz, 17 W 350 MHz 1200 MHz Intel Core i7-2657M 2 x 1600 MHz, 17 W 350 MHz 1000 MHz Intel Core i3-2312M 2 x 2100 MHz, 35 W 350 MHz 1100 MHz Intel Core i3-2310M 2 x 2100 MHz, 35 W 650 MHz 1100 MHz Intel Core i3-2308M 2 x 2100 MHz, 35 W 650 MHz 1100 MHz Intel Core i5-2557M 2 x 1700 MHz, 17 W 350 MHz 1200 MHz Intel Core i7-2617M 2 x 1500 MHz, 17 W 350 MHz 950 MHz Intel Core i5-2467M 2 x 1600 MHz, 17 W 350 MHz 1150 MHz Intel Core i5-2537M 2 x 1400 MHz, 17 W 350 MHz 900 MHz Intel Core i3-2377M 2 x 1500 MHz, 17 W 350 MHz 1000 MHz Intel Core i3-2375M 2 x 1500 MHz, 17 W 350 MHz 1000 MHz Intel Core i3-2367M 2 x 1400 MHz, 17 W 350 MHz 1000 MHz Intel Core i3-2365M 2 x 1400 MHz, 17 W 350 MHz 1000 MHz Intel Core i3-2357M 2 x 1300 MHz, 17 W 350 MHz 950 MHz min. - max. 200 - 850 MHz 900 - 1350 MHz
Benchmarks Performance Rating - 3DMark 11 + Fire Strike + Time Spy - HD Graphics 4400
0.3 pt (1%)
...
...
max:
3DMark - 3DMark Ice Storm Unlimited Graphics
37082 Points (4%)
3DMark - 3DMark Ice Storm Extreme Graphics
min: 19943 avg: 25546 median: 24573 (3%) max: 33095 Points
3DMark - 3DMark Cloud Gate Score
min: 1733 avg: 3980 median: 3940 (4%) max: 4989 Points
min: 2277 avg: 2642 median: 2656.5 (3%) max: 2979 Points
3DMark - 3DMark Cloud Gate Graphics
min: 1946 avg: 5040 median: 4953 (1%) max: 6547 Points
min: 2356 avg: 2593 median: 2502.5 (1%) max: 3011 Points
3DMark - 3DMark Fire Strike Standard Score
min: 352 avg: 543 median: 525 (1%) max: 700 Points
3DMark - 3DMark Fire Strike Standard Graphics
min: 369 avg: 592 median: 569 (1%) max: 778 Points
3DMark - 3DMark Ice Storm Graphics
min: 12866 avg: 38629 median: 38886.5 (5%) max: 58126 Points
min: 25494 avg: 29036 median: 27124 (3%) max: 36403 Points
3DMark 11 - 3DM11 Performance Score
min: 460 avg: 843 median: 828 (1%) max: 1032 Points
3DMark 11 - 3DM11 Performance GPU
min: 399 avg: 755 median: 735.5 (1%) max: 962 Points
3DMark Vantage + Intel HD Graphics 4400 3DMark Vantage - 3DM Vant. Perf. total
min: 2450 avg: 3559 median: 3583 (1%) max: 4820 Points
3DM Vant. Perf. total + Intel HD Graphics 3000
min: 1135 avg: 1560 median: 1568 (0%) max: 2164 Points
3DM Vant. Perf. GPU no PhysX + Intel HD Graphics 4400 3DMark Vantage - 3DM Vant. Perf. GPU no PhysX
min: 2083 avg: 3005 median: 2986.5 (2%) max: 4123 Points
3DM Vant. Perf. GPU no PhysX + Intel HD Graphics 3000
min: 927 avg: 1331 median: 1240 (1%) max: 8858 Points
3DMark 2001SE - 3DMark 2001 - Standard
20486 Points (21%)
min: 7796 avg: 12752 median: 11654 (12%) max: 19742 Points
3DMark 03 - 3DMark 03 - Standard
min: 9129 avg: 12378 median: 13244 (7%) max: 16040 Points
min: 5162 avg: 8577 median: 7751 (4%) max: 12358 Points
3DMark 05 - 3DMark 05 - Standard
min: 6313 avg: 8674 median: 8802 (10%) max: 10495 Points
min: 3498 avg: 6355 median: 5968 (7%) max: 9344 Points
3DMark 06 3DMark 06 - Standard 1280x1024 + Intel HD Graphics 4400
min: 4074 avg: 5110 median: 5164 (7%) max: 6293 Points
3DMark 06 - Standard 1280x1024 + Intel HD Graphics 3000
min: 1392 avg: 3451 median: 3286.5 (4%) max: 5853 Points
3DMark 06 - Score Unknown Settings + Intel HD Graphics 3000
min: 3508 avg: 3847 median: 3617 (5%) max: 5041 Points
3DMark 06 - Standard 1280x800 + Intel HD Graphics 3000
min: 2550 avg: 3176 median: 3224 (4%) max: 3753 Points
3DMark 06 - Standard 1280x768 + Intel HD Graphics 3000
min: 2788 avg: 3293 median: 3308 (4%) max: 3942 Points
Unigine Heaven 3.0 - Unigine Heaven 3.0 DX 11
min: 6.5 avg: 7.7 median: 8.2 (3%) max: 8.4 fps
Unigine Heaven 3.0 - Unigine Heaven 3.0 OpenGL
min: 7 avg: 8.2 median: 8.6 (4%) max: 9.1 fps
Unigine Heaven 2.1 - Heaven 2.1 high
min: 7.9 avg: 10.9 median: 10.9 (2%) max: 15.9 fps
min: 4 avg: 7.7 median: 7.8 (1%) max: 9.3 fps
SPECviewperf 11 + Intel HD Graphics 4400 SPECviewperf 11 - specvp11 snx-01
min: 1.06 avg: 1.6 median: 1.7 (1%) max: 2.09 fps
specvp11 snx-01 + Intel HD Graphics 3000 min: 0.18 avg: 0.3 median: 0.2 (0%) max: 0.75 fps
specvp11 tcvis-02 + Intel HD Graphics 4400 SPECviewperf 11 - specvp11 tcvis-02
min: 1.47 avg: 2.2 median: 2.2 (1%) max: 2.94 fps
specvp11 tcvis-02 + Intel HD Graphics 3000 min: 0.12 avg: 0.3 median: 0.2 (0%) max: 0.86 fps
specvp11 sw-02 + Intel HD Graphics 4400 SPECviewperf 11 - specvp11 sw-02
min: 6.04 avg: 9.7 median: 9.6 (7%) max: 12.19 fps
specvp11 sw-02 + Intel HD Graphics 3000
min: 2.55 avg: 3.6 median: 3.6 (3%) max: 4.61 fps
specvp11 proe-05 + Intel HD Graphics 4400 SPECviewperf 11 - specvp11 proe-05
min: 1.39 avg: 1.8 median: 1.9 (2%) max: 2.28 fps
specvp11 proe-05 + Intel HD Graphics 3000
min: 0.26 avg: 0.5 median: 0.5 (1%) max: 0.65 fps
specvp11 maya-03 + Intel HD Graphics 4400 SPECviewperf 11 - specvp11 maya-03
min: 7.81 avg: 12.6 median: 12.2 (9%) max: 16.81 fps
specvp11 maya-03 + Intel HD Graphics 3000
min: 1.07 avg: 4.6 median: 5 (4%) max: 7.63 fps
specvp11 lightwave-01 + Intel HD Graphics 4400 SPECviewperf 11 - specvp11 lightwave-01
min: 9.88 avg: 13.6 median: 13.2 (14%) max: 17.4 fps
specvp11 lightwave-01 + Intel HD Graphics 3000
min: 3.63 avg: 5.5 median: 5.5 (6%) max: 7.35 fps
specvp11 ensight-04 + Intel HD Graphics 4400 SPECviewperf 11 - specvp11 ensight-04
min: 1.29 avg: 1.9 median: 2 (1%) max: 2.47 fps
specvp11 ensight-04 + Intel HD Graphics 3000
min: 0.1 avg: 0.4 median: 0.1 (0%) max: 1.29 fps
SPECviewperf 12 + Intel HD Graphics 4400 SPECviewperf 12 - specvp12 sw-03
min: 6.92 avg: 9.3 median: 9.3 (2%) max: 11.62 fps
specvp12 snx-02 + Intel HD Graphics 4400 SPECviewperf 12 - specvp12 snx-02
min: 1.99 avg: 2 median: 2 (0%) max: 2.08 fps
specvp12 showcase-01 + Intel HD Graphics 4400 SPECviewperf 12 - specvp12 showcase-01
min: 4.19 avg: 4.3 median: 4.3 (1%) max: 4.48 fps
specvp12 mediacal-01 + Intel HD Graphics 4400 SPECviewperf 12 - specvp12 mediacal-01
min: 1.24 avg: 1.5 median: 1.5 (0%) max: 1.84 fps
specvp12 maya-04 + Intel HD Graphics 4400 SPECviewperf 12 - specvp12 maya-04
min: 2.36 avg: 2.5 median: 2.5 (1%) max: 2.54 fps
specvp12 energy-01 + Intel HD Graphics 4400 SPECviewperf 12 - specvp12 energy-01
min: 0.07 avg: 0.1 median: 0.1 (0%) max: 0.22 fps
specvp12 creo-01 + Intel HD Graphics 4400 SPECviewperf 12 - specvp12 creo-01
min: 6.08 avg: 6.6 median: 6.6 (3%) max: 7.02 fps
specvp12 catia-04 + Intel HD Graphics 4400 SPECviewperf 12 - specvp12 catia-04
min: 7.96 avg: 8.3 median: 8.3 (1%) max: 8.54 fps
Windows 7 Experience Index - Win7 Gaming graphics
min: 5.2 avg: 6.2 median: 6.5 (82%) max: 6.5 Points
min: 5.5 avg: 6.1 median: 6.1 (77%) max: 6.4 Points
Windows 7 Experience Index - Win7 Graphics
min: 5.2 avg: 5.5 median: 5.2 (66%) max: 6.5 Points
min: 4.1 avg: 5.1 median: 4.7 (59%) max: 6.4 Points
Cinebench R10 Cinebench R10 Shading (32bit) + Intel HD Graphics 4400 Cinebench R10 - Cinebench R10 Shading (32bit)
min: 4094 avg: 6063 median: 6130 (4%) max: 8532 Points
Cinebench R10 Shading (32bit) + Intel HD Graphics 3000
min: 1712 avg: 4274 median: 4414 (3%) max: 7038 Points
Cinebench R11.5 Cinebench R11.5 OpenGL 64 Bit + Intel HD Graphics 4400 Cinebench R11.5 - Cinebench R11.5 OpenGL 64 Bit
min: 9.45 avg: 16.8 median: 16.4 (6%) max: 24 fps
Cinebench R11.5 OpenGL 64 Bit + Intel HD Graphics 3000
min: 4.75 avg: 8.7 median: 8.4 (3%) max: 13.02 fps
Cinebench R15 + Intel HD Graphics 4400 Cinebench R15 - Cinebench R15 OpenGL 64 Bit
min: 12.87 avg: 20.3 median: 20.4 (1%) max: 26.49 fps
Cinebench R15 OpenGL 64 Bit + Intel HD Graphics 3000 0 fps (0%)
Cinebench R15 OpenGL Ref. Match 64 Bit + Intel HD Graphics 4400 Cinebench R15 - Cinebench R15 OpenGL Ref. Match 64 Bit
min: 2.87 avg: 88.2 median: 98 (98%) max: 98 %
Cinebench R15 OpenGL Ref. Match 64 Bit + Intel HD Graphics 3000
min: 32.2 avg: 32.6 median: 32.6 (33%) max: 32.9 %
GFXBench 3.0 - GFXBench 3.0 Manhattan Offscreen
16.2 fps (1%)
GFXBench (DX / GLBenchmark) 2.7 + Intel HD Graphics 4400 GFXBench (DX / GLBenchmark) 2.7 - GFXBench T-Rex HD Offscreen C24Z16
min: 57 avg: 60.5 median: 60.5 (0%) max: 64 fps
LuxMark v2.0 64Bit - LuxMark v2.0 Room GPU
min: 117 avg: 154.1 median: 150 (1%) max: 222 Samples/s
LuxMark v2.0 64Bit - LuxMark v2.0 Sala GPU
min: 143 avg: 227.5 median: 234 (0%) max: 293 Samples/s
ComputeMark v2.1 - ComputeMark v2.1 Result
min: 384 avg: 542 median: 575 (1%) max: 613 Points
Average Benchmarks Intel HD Graphics 4400 → 100% n=23 Average Benchmarks Intel HD Graphics 3000 → 48% n=23
- Range of benchmark values for this graphics card
- Average benchmark values for this graphics card
* Smaller numbers mean a higher performance
1 This benchmark is not used for the average calculation
Game Benchmarks The following benchmarks stem from our benchmarks of review laptops. The performance depends on the used graphics memory, clock rate, processor, system settings, drivers, and operating systems. So the results don't have to be representative for all laptops with this GPU. For detailed information on the benchmark results, click on the fps number.
100%
HD Graphics 4400:
9 [X] HP Probook 470 G2 G6W69EA Intel Core i7-4510U 2GHz
HD Graphics 4400
fps
100%
HD Graphics 4400:
8.1 [X] HP Probook 470 G2 G6W69EA Intel Core i7-4510U 2GHz
HD Graphics 4400
fps
100%
HD Graphics 4400:
8.8 [X] HP Probook 470 G2 G6W69EA Intel Core i7-4510U 2GHz
HD Graphics 4400
fps
100%
HD Graphics 4400:
4.1 [X] HP Probook 470 G2 G6W69EA Intel Core i7-4510U 2GHz
HD Graphics 4400
fps
100%
HD Graphics 4400:
7.9 [X] HP Probook 470 G2 G6W69EA Intel Core i7-4510U 2GHz
HD Graphics 4400
fps
100%
HD Graphics 4400:
25.3 [X] HP Probook 470 G2 G6W69EA Intel Core i7-4510U 2GHz
HD Graphics 4400
fps
100%
HD Graphics 4400:
8 [X] HP Probook 470 G2 G6W69EA Intel Core i7-4510U 2GHz
HD Graphics 4400
fps
100%
HD Graphics 4400:
7.4 [X] HP Probook 470 G2 G6W69EA Intel Core i7-4510U 2GHz
HD Graphics 4400
fps
100%
HD Graphics 4400:
11 [X] HP Probook 470 G2 G6W69EA Intel Core i7-4510U 2GHz
HD Graphics 4400
fps
100%
HD Graphics 4400:
10.3 [X] HP Probook 470 G2 G6W69EA Intel Core i7-4510U 2GHz
HD Graphics 4400
min:
9 fps, max:
11 fps
fps
100%
HD Graphics 4400:
8.3 [X] HP Probook 470 G2 G6W69EA Intel Core i7-4510U 2GHz
HD Graphics 4400
fps
100%
HD Graphics 4400:
10 [X] HP Probook 470 G2 G6W69EA Intel Core i7-4510U 2GHz
HD Graphics 4400
fps
100%
HD Graphics 4400:
20 [X] HP Probook 470 G2 G6W69EA Intel Core i7-4510U 2GHz
HD Graphics 4400
fps
100%
HD Graphics 4400:
4 [X] HP Probook 470 G2 G6W69EA Intel Core i7-4510U 2GHz
HD Graphics 4400
fps
100%
HD Graphics 4400:
8 [X] HP Probook 470 G2 G6W69EA Intel Core i7-4510U 2GHz
HD Graphics 4400
fps
100%
HD Graphics 4400:
4 [X] HP Probook 470 G2 G6W69EA Intel Core i7-4510U 2GHz
HD Graphics 4400
fps
100%
HD Graphics 4400:
15 [X] HP Probook 470 G2 G6W69EA Intel Core i7-4510U 2GHz
HD Graphics 4400
fps
100%
HD Graphics 4400:
7.4 [X] HP Probook 470 G2 G6W69EA Intel Core i7-4510U 2GHz
HD Graphics 4400
fps
100%
HD Graphics 4400:
15 [X] HP Probook 470 G2 G6W69EA Intel Core i7-4510U 2GHz
HD Graphics 4400
fps
100%
HD Graphics 4400:
10.4 [X] HP Probook 470 G2 G6W69EA Intel Core i7-4510U 2GHz
HD Graphics 4400
fps
100%
HD Graphics 4400:
28.8 [X] HP Probook 470 G2 G6W69EA Intel Core i7-4510U 2GHz
HD Graphics 4400
fps
100%
HD Graphics 4400:
10.3 [X] HP Probook 470 G2 G6W69EA Intel Core i7-4510U 2GHz
HD Graphics 4400
fps
100%
HD Graphics 4400:
9.2 [X] HP Probook 470 G2 G6W69EA Intel Core i7-4510U 2GHz
HD Graphics 4400
fps
100%
HD Graphics 4400:
7.1 [X] HP Probook 470 G2 G6W69EA Intel Core i7-4510U 2GHz
HD Graphics 4400
fps
100%
HD Graphics 4400:
10.1 [X] HP Probook 470 G2 G6W69EA Intel Core i7-4510U 2GHz
HD Graphics 4400
fps
100%
HD Graphics 4400:
4 [X] HP Probook 470 G2 G6W69EA Intel Core i7-4510U 2GHz
HD Graphics 4400
fps
100%
HD Graphics 4400:
5 [X] HP Probook 470 G2 G6W69EA Intel Core i7-4510U 2GHz
HD Graphics 4400
fps
100%
HD Graphics 4400:
30.4 [X] HP Probook 470 G2 G6W69EA Intel Core i7-4510U 2GHz
HD Graphics 4400
fps
100%
HD Graphics 4400:
7 [X] HP Probook 470 G2 G6W69EA Intel Core i7-4510U 2GHz
HD Graphics 4400
fps
100%
HD Graphics 4400:
12 [X] HP Probook 470 G2 G6W69EA Intel Core i7-4510U 2GHz
HD Graphics 4400
fps
100%
HD Graphics 4400:
7.9 [X] HP Probook 470 G2 G6W69EA Intel Core i7-4510U 2GHz
HD Graphics 4400
fps
100%
HD Graphics 4400:
6.9 [X] HP Probook 470 G2 G6W69EA Intel Core i7-4510U 2GHz
HD Graphics 4400
fps
100%
HD Graphics 4400:
5 [X] HP Probook 470 G2 G6W69EA Intel Core i7-4510U 2GHz
HD Graphics 4400
fps
100%
HD Graphics 4400:
84.2 [X] HP Probook 470 G2 G6W69EA Intel Core i7-4510U 2GHz
HD Graphics 4400
fps
100%
HD Graphics 4400:
9.6 [X] HP Probook 470 G2 G6W69EA Intel Core i7-4510U 2GHz
HD Graphics 4400
fps
100%
HD Graphics 4400:
13.6 [X] HP Probook 470 G2 G6W69EA Intel Core i7-4510U 2GHz
HD Graphics 4400
fps
100%
HD Graphics 4400:
10.8 [X] HP Probook 470 G2 G6W69EA Intel Core i7-4510U 2GHz
HD Graphics 4400
fps
100%
HD Graphics 4400:
9.1 [X] HP Probook 470 G2 G6W69EA Intel Core i7-4510U 2GHz
HD Graphics 4400
fps
100%
HD Graphics 4400:
46.5 [X] HP Probook 470 G2 G6W69EA Intel Core i7-4510U 2GHz
HD Graphics 4400
fps
100%
HD Graphics 4400:
11 [X] HP Probook 470 G2 G6W69EA Intel Core i7-4510U 2GHz
HD Graphics 4400
fps
100%
HD Graphics 4400:
9.6 [X] HP Probook 470 G2 G6W69EA Intel Core i7-4510U 2GHz
HD Graphics 4400
fps
100%
HD Graphics 4400:
11.5 [X] HP Probook 470 G2 G6W69EA Intel Core i7-4510U 2GHz
HD Graphics 4400
fps
100%
HD Graphics 4400:
5 [X] HP Probook 470 G2 G6W69EA Intel Core i7-4510U 2GHz
HD Graphics 4400
fps
100%
HD Graphics 4400:
10 [X] HP Probook 470 G2 G6W69EA Intel Core i7-4510U 2GHz
HD Graphics 4400
fps
100%
HD Graphics 4400:
8 [X] HP Probook 470 G2 G6W69EA Intel Core i7-4510U 2GHz
HD Graphics 4400
fps
100%
HD Graphics 4400:
7 [X] HP Probook 470 G2 G6W69EA Intel Core i7-4510U 2GHz
HD Graphics 4400
fps
100%
HD Graphics 4400:
13 [X] HP Probook 470 G2 G6W69EA Intel Core i7-4510U 2GHz
HD Graphics 4400
fps
100%
HD Graphics 4400:
38.9 [X] HP Probook 470 G2 G6W69EA Intel Core i7-4510U 2GHz
HD Graphics 4400
fps
100%
HD Graphics 4400:
7 [X] HP Probook 470 G2 G6W69EA Intel Core i7-4510U 2GHz
HD Graphics 4400
fps
100%
HD Graphics 4400:
18 [X] HP Probook 470 G2 G6W69EA Intel Core i7-4510U 2GHz
HD Graphics 4400
fps
100%
HD Graphics 4400:
13 [X] HP Probook 470 G2 G6W69EA Intel Core i7-4510U 2GHz
HD Graphics 4400
fps
100%
HD Graphics 4400:
22.6 [X] HP Probook 470 G2 G6W69EA Intel Core i7-4510U 2GHz
HD Graphics 4400
fps
100%
HD Graphics 4400:
45 [X] HP Probook 470 G2 G6W69EA Intel Core i7-4510U 2GHz
HD Graphics 4400
fps
108%
HD Graphics 3000:
48.4 [X] Acer Aspire M3-581TG Intel Core i7-2637M 1.7GHz
HD Graphics 3000
min:
40 fps
fps
100%
HD Graphics 4400:
40 [X] HP Probook 470 G2 G6W69EA Intel Core i7-4510U 2GHz
HD Graphics 4400
fps
100%
HD Graphics 4400:
21.2 [X] HP Probook 470 G2 G6W69EA Intel Core i7-4510U 2GHz
HD Graphics 4400
fps
100%
HD Graphics 4400:
8 [X] HP Probook 470 G2 G6W69EA Intel Core i7-4510U 2GHz
HD Graphics 4400
fps
100%
HD Graphics 4400:
65.3 [X] HP Probook 470 G2 G6W69EA Intel Core i7-4510U 2GHz
HD Graphics 4400
fps
100%
HD Graphics 4400:
19.3 [X] HP Probook 470 G2 G6W69EA Intel Core i7-4510U 2GHz
HD Graphics 4400
fps
100%
HD Graphics 4400:
12.9 [X] HP Probook 470 G2 G6W69EA Intel Core i7-4510U 2GHz
HD Graphics 4400
fps
100%
HD Graphics 4400:
5.6 [X] HP Probook 470 G2 G6W69EA Intel Core i7-4510U 2GHz
HD Graphics 4400
fps
100%
HD Graphics 4400:
13.4 [X] HP Probook 470 G2 G6W69EA Intel Core i7-4510U 2GHz
HD Graphics 4400
fps
100%
HD Graphics 4400:
10 [X] HP Probook 470 G2 G6W69EA Intel Core i7-4510U 2GHz
HD Graphics 4400
fps
100%
HD Graphics 4400:
10.1 [X] HP Probook 470 G2 G6W69EA Intel Core i7-4510U 2GHz
HD Graphics 4400
fps
100%
HD Graphics 4400:
13.1 [X] HP Probook 470 G2 G6W69EA Intel Core i7-4510U 2GHz
HD Graphics 4400
fps
100%
HD Graphics 4400:
22.1 [X] HP Probook 470 G2 G6W69EA Intel Core i7-4510U 2GHz
HD Graphics 4400
fps
100%
HD Graphics 4400:
9.6 [X] HP Probook 470 G2 G6W69EA Intel Core i7-4510U 2GHz
HD Graphics 4400
fps
100%
HD Graphics 4400:
8.4 [X] HP Probook 470 G2 G6W69EA Intel Core i7-4510U 2GHz
HD Graphics 4400
fps
100%
HD Graphics 4400:
19.5 [X] HP Probook 470 G2 G6W69EA Intel Core i7-4510U 2GHz
HD Graphics 4400
fps
100%
HD Graphics 4400:
12.7 [X] HP Probook 470 G2 G6W69EA Intel Core i7-4510U 2GHz
HD Graphics 4400
fps
100%
HD Graphics 4400:
49.3 [X] HP Probook 470 G2 G6W69EA Intel Core i7-4510U 2GHz
HD Graphics 4400
fps
45%
HD Graphics 3000:
22.1 [X] Acer Aspire M3-581TG Intel Core i7-2637M 1.7GHz
HD Graphics 3000
min:
13 fps, max:
27 fps
fps
100%
HD Graphics 4400:
27.1 [X] HP Probook 470 G2 G6W69EA Intel Core i7-4510U 2GHz
HD Graphics 4400
fps
49%
HD Graphics 3000:
13.2 [X] Acer Aspire M3-581TG Intel Core i7-2637M 1.7GHz
HD Graphics 3000
min:
6 fps, max:
17 fps
fps
100%
HD Graphics 4400:
8.2 [X] HP Probook 470 G2 G6W69EA Intel Core i7-4510U 2GHz
HD Graphics 4400
fps
100%
HD Graphics 4400:
14.1 [X] HP Probook 470 G2 G6W69EA Intel Core i7-4510U 2GHz
HD Graphics 4400
fps
100%
HD Graphics 4400:
9 [X] HP Probook 470 G2 G6W69EA Intel Core i7-4510U 2GHz
HD Graphics 4400
fps
100%
HD Graphics 4400:
20.3 [X] HP Probook 470 G2 G6W69EA Intel Core i7-4510U 2GHz
HD Graphics 4400
fps
100%
HD Graphics 4400:
7.5 [X] HP Probook 470 G2 G6W69EA Intel Core i7-4510U 2GHz
HD Graphics 4400
fps
100%
HD Graphics 4400:
3.8 [X] HP Probook 470 G2 G6W69EA Intel Core i7-4510U 2GHz
HD Graphics 4400
fps
100%
HD Graphics 4400:
33.9 [X] HP Probook 470 G2 G6W69EA Intel Core i7-4510U 2GHz
HD Graphics 4400
fps
100%
HD Graphics 4400:
22.3 [X] HP Probook 470 G2 G6W69EA Intel Core i7-4510U 2GHz
HD Graphics 4400
fps
100%
HD Graphics 4400:
12.8 [X] HP Probook 470 G2 G6W69EA Intel Core i7-4510U 2GHz
HD Graphics 4400
fps
100%
HD Graphics 4400:
8.2 [X] HP Probook 470 G2 G6W69EA Intel Core i7-4510U 2GHz
HD Graphics 4400
fps
100%
HD Graphics 4400:
20.7 [X] Lenovo B50-70 MCC2GGE Intel Core i3-4030U 1.9GHz
HD Graphics 4400
fps
100%
HD Graphics 4400:
10.3 [X] Lenovo B50-70 MCC2GGE Intel Core i3-4030U 1.9GHz
HD Graphics 4400
fps
100%
HD Graphics 4400:
31.3 [X] HP Probook 470 G2 G6W69EA Intel Core i7-4510U 2GHz
HD Graphics 4400
fps
0%
HD Graphics 3000:
0 (!) [X] Acer Aspire M3-581TG Intel Core i7-2637M 1.7GHz
HD Graphics 3000
fps
100%
HD Graphics 4400:
20.4 [X] HP Probook 470 G2 G6W69EA Intel Core i7-4510U 2GHz
HD Graphics 4400
fps
100%
HD Graphics 4400:
8.5 [X] Lenovo B50-70 MCC2GGE Intel Core i3-4030U 1.9GHz
HD Graphics 4400
fps
100%
HD Graphics 4400:
5.9 [X] Lenovo B50-70 MCC2GGE Intel Core i3-4030U 1.9GHz
HD Graphics 4400
fps
100%
HD Graphics 4400:
14.2 [X] Lenovo B50-70 MCC2GGE Intel Core i3-4030U 1.9GHz
HD Graphics 4400
fps
100%
HD Graphics 4400:
7.9 [X] Lenovo B50-70 MCC2GGE Intel Core i3-4030U 1.9GHz
HD Graphics 4400
fps
100%
HD Graphics 4400:
12 [X] Lenovo B50-70 MCC2GGE Intel Core i3-4030U 1.9GHz
HD Graphics 4400
fps
100%
HD Graphics 4400:
13.1 [X] Lenovo B50-70 MCC2GGE Intel Core i3-4030U 1.9GHz
HD Graphics 4400
fps
100%
HD Graphics 4400:
13.1 [X] Lenovo B50-70 MCC2GGE Intel Core i3-4030U 1.9GHz
HD Graphics 4400
fps
100%
HD Graphics 4400:
7.6 [X] Lenovo B50-70 MCC2GGE Intel Core i3-4030U 1.9GHz
HD Graphics 4400
fps
100%
HD Graphics 4400:
20.2 [X] Lenovo B50-70 MCC2GGE Intel Core i3-4030U 1.9GHz
HD Graphics 4400
fps
100%
HD Graphics 4400:
12.6 [X] Lenovo B50-70 MCC2GGE Intel Core i3-4030U 1.9GHz
HD Graphics 4400
fps
100%
HD Graphics 4400:
17.6 [X] Lenovo B50-70 MCC2GGE Intel Core i3-4030U 1.9GHz
HD Graphics 4400
fps
100%
HD Graphics 4400:
14.5 [X] Lenovo B50-70 MCC2GGE Intel Core i3-4030U 1.9GHz
HD Graphics 4400
fps
100%
HD Graphics 4400:
24.9 [X] Lenovo B50-70 MCC2GGE Intel Core i3-4030U 1.9GHz
HD Graphics 4400
fps
100%
HD Graphics 4400:
14.3 [X] Lenovo B50-70 MCC2GGE Intel Core i3-4030U 1.9GHz
HD Graphics 4400
fps
100%
HD Graphics 4400:
4.7 [X] HP Probook 470 G2 G6W69EA Intel Core i7-4510U 2GHz
HD Graphics 4400
fps
100%
HD Graphics 4400:
20.3 [X] Lenovo B50-70 MCC2GGE Intel Core i3-4030U 1.9GHz
HD Graphics 4400
fps
100%
HD Graphics 4400:
12.1 [X] Lenovo B50-70 MCC2GGE Intel Core i3-4030U 1.9GHz
HD Graphics 4400
fps
100%
HD Graphics 4400:
21 [X] Lenovo B50-70 MCC2GGE Intel Core i3-4030U 1.9GHz
HD Graphics 4400
fps
100%
HD Graphics 4400:
9.2 [X] Lenovo B50-70 MCC2GGE Intel Core i3-4030U 1.9GHz
HD Graphics 4400
fps
100%
HD Graphics 4400:
49.7 [X] Lenovo B50-70 MCC2GGE Intel Core i3-4030U 1.9GHz
HD Graphics 4400
fps
0%
HD Graphics 3000:
0 (!) [X] Acer Aspire M3-581TG Intel Core i7-2637M 1.7GHz
HD Graphics 3000
fps
100%
HD Graphics 4400:
25.3 [X] Lenovo B50-70 MCC2GGE Intel Core i3-4030U 1.9GHz
HD Graphics 4400
fps
100%
HD Graphics 4400:
43.6 [X] Lenovo B50-70 MCC2GGE Intel Core i3-4030U 1.9GHz
HD Graphics 4400
fps
73%
HD Graphics 3000:
25.1 [X] Acer Aspire M3-581TG Intel Core i7-2637M 1.7GHz
HD Graphics 3000
38 [X] Compal Barebone Intel Core i7-2860QM 2.5GHz
HD Graphics 3000
min:
29 fps, max:
49 fps
~ 32 fps
100%
HD Graphics 4400:
31.2 [X] Lenovo B50-70 MCC2GGE Intel Core i3-4030U 1.9GHz
HD Graphics 4400
fps
61%
HD Graphics 3000:
15.6 [X] Acer Aspire M3-581TG Intel Core i7-2637M 1.7GHz
HD Graphics 3000
min:
11 fps, max:
21 fps
21.7 [X] Compal Barebone Intel Core i7-2860QM 2.5GHz
HD Graphics 3000
min:
14 fps, max:
31 fps
~ 19 fps
100%
HD Graphics 4400:
35.2 [X] Lenovo B50-70 MCC2GGE Intel Core i3-4030U 1.9GHz
HD Graphics 4400
fps
100%
HD Graphics 4400:
23.5 [X] Lenovo B50-70 MCC2GGE Intel Core i3-4030U 1.9GHz
HD Graphics 4400
fps
100%
HD Graphics 4400:
60.3 [X] HP Probook 470 G2 G6W69EA Intel Core i7-4510U 2GHz
HD Graphics 4400
fps
83%
HD Graphics 3000:
48.1 [X] Compal Barebone Intel Core i7-2860QM 2.5GHz
HD Graphics 3000
min:
41.1 fps
50.9 [X] Acer Aspire M3-581TG Intel Core i7-2637M 1.7GHz
HD Graphics 3000
min:
42 fps
~ 50 fps
100%
HD Graphics 4400:
31.5 [X] HP Probook 470 G2 G6W69EA Intel Core i7-4510U 2GHz
HD Graphics 4400
fps
63%
HD Graphics 3000:
19.4 [X] Acer Aspire M3-581TG Intel Core i7-2637M 1.7GHz
HD Graphics 3000
min:
17 fps
21.3 [X] Compal Barebone Intel Core i7-2860QM 2.5GHz
HD Graphics 3000
min:
19.8 fps
~ 20 fps
100%
HD Graphics 4400:
14.5 [X] HP Probook 470 G2 G6W69EA Intel Core i7-4510U 2GHz
HD Graphics 4400
fps
57%
HD Graphics 3000:
8.3 [X] Compal Barebone Intel Core i7-2860QM 2.5GHz
HD Graphics 3000
min:
7.9 fps
fps
HD Graphics 3000:
7.4 [X] Compal Barebone Intel Core i7-2860QM 2.5GHz
HD Graphics 3000
min:
7.1 fps
fps
100%
HD Graphics 4400:
10.7 [X] Lenovo B50-70 MCC2GGE Intel Core i3-4030U 1.9GHz
HD Graphics 4400
fps
100%
HD Graphics 4400:
6.9 [X] Lenovo B50-70 MCC2GGE Intel Core i3-4030U 1.9GHz
HD Graphics 4400
fps
100%
HD Graphics 4400:
77.8 [X] Lenovo B50-70 MCC2GGE Intel Core i3-4030U 1.9GHz
HD Graphics 4400
fps
0%
HD Graphics 3000:
0 (!) [X] Acer Aspire M3-581TG Intel Core i7-2637M 1.7GHz
HD Graphics 3000
fps
100%
HD Graphics 4400:
19.6 [X] Lenovo B50-70 MCC2GGE Intel Core i3-4030U 1.9GHz
HD Graphics 4400
fps
100%
HD Graphics 4400:
22.8 [X] HP Probook 470 G2 G6W69EA Intel Core i7-4510U 2GHz
HD Graphics 4400
fps
33%
HD Graphics 3000:
7.5 [X] Acer Aspire M3-581TG Intel Core i7-2637M 1.7GHz
HD Graphics 3000
min:
4 fps, max:
17 fps
fps
100%
HD Graphics 4400:
17.8 [X] HP Probook 470 G2 G6W69EA Intel Core i7-4510U 2GHz
HD Graphics 4400
fps
100%
HD Graphics 4400:
29.3 [X] Lenovo B50-70 MCC2GGE Intel Core i3-4030U 1.9GHz
HD Graphics 4400
fps
100%
HD Graphics 4400:
20.7 [X] Lenovo B50-70 MCC2GGE Intel Core i3-4030U 1.9GHz
HD Graphics 4400
fps
100%
HD Graphics 4400:
13.8 [X] Lenovo B50-70 MCC2GGE Intel Core i3-4030U 1.9GHz
HD Graphics 4400
fps
0%
HD Graphics 3000:
0 (!) [X] Acer Aspire M3-581TG Intel Core i7-2637M 1.7GHz
HD Graphics 3000
fps
100%
HD Graphics 4400:
10.1 [X] Lenovo B50-70 MCC2GGE Intel Core i3-4030U 1.9GHz
HD Graphics 4400
fps
100%
HD Graphics 4400:
13.4 [X] Acer Travelmate P276-MG-56FU Intel Core i5-4210U 1.7GHz
HD Graphics 4400
14.8 [X] Lenovo ThinkPad T440s 20AQ-0069GE Intel Core i7-4600U 2.1GHz
HD Graphics 4400
~ 14 fps
100%
HD Graphics 4400:
10.2 [X] Acer Travelmate P276-MG-56FU Intel Core i5-4210U 1.7GHz
HD Graphics 4400
11 [X] Lenovo ThinkPad T440s 20AQ-0069GE Intel Core i7-4600U 2.1GHz
HD Graphics 4400
~ 11 fps
100%
HD Graphics 4400:
5.9 [X] Lenovo ThinkPad T440s 20AQ-0069GE Intel Core i7-4600U 2.1GHz
HD Graphics 4400
fps
100%
HD Graphics 4400:
13.1 14.6 16.1 [X] Lenovo ThinkPad T440s 20AQ-0069GE Intel Core i7-4600U 2.1GHz
HD Graphics 4400
19.7 ~ 16 fps
100%
HD Graphics 4400:
6 8.1 10.9 [X] Lenovo ThinkPad T440s 20AQ-0069GE Intel Core i7-4600U 2.1GHz
HD Graphics 4400
12 ~ 9 fps
100%
HD Graphics 4400:
3.4 4.2 [X] Lenovo ThinkPad T440s 20AQ-0069GE Intel Core i7-4600U 2.1GHz
HD Graphics 4400
~ 4 fps
100%
HD Graphics 4400:
1.4 fps
100%
HD Graphics 4400:
13 [X] Acer Travelmate P276-MG-56FU Intel Core i5-4210U 1.7GHz
HD Graphics 4400
14 (!) [X] Lenovo ThinkPad T440s 20AQ-0069GE Intel Core i7-4600U 2.1GHz
HD Graphics 4400
~ 14 fps
0%
HD Graphics 3000:
0 (!) [X] Acer Aspire M3-581TG Intel Core i7-2637M 1.7GHz
HD Graphics 3000
fps
100%
HD Graphics 4400:
9.9 [X] Acer Travelmate P276-MG-56FU Intel Core i5-4210U 1.7GHz
HD Graphics 4400
9.9 (!) [X] Lenovo ThinkPad T440s 20AQ-0069GE Intel Core i7-4600U 2.1GHz
HD Graphics 4400
~ 10 fps
100%
HD Graphics 4400:
6.1 [X] Lenovo ThinkPad T440s 20AQ-0069GE Intel Core i7-4600U 2.1GHz
HD Graphics 4400
6.5 [X] Acer Travelmate P276-MG-56FU Intel Core i5-4210U 1.7GHz
HD Graphics 4400
~ 6 fps
100%
HD Graphics 4400:
3.9 [X] Lenovo ThinkPad T440s 20AQ-0069GE Intel Core i7-4600U 2.1GHz
HD Graphics 4400
fps
100%
HD Graphics 4400:
20.9 [X] Lenovo ThinkPad T440s 20AQ-0069GE Intel Core i7-4600U 2.1GHz
HD Graphics 4400
21.8 [X] Acer Travelmate P276-MG-56FU Intel Core i5-4210U 1.7GHz
HD Graphics 4400
~ 21 fps
100%
HD Graphics 4400:
11.6 [X] Acer Travelmate P276-MG-56FU Intel Core i5-4210U 1.7GHz
HD Graphics 4400
13.1 [X] Lenovo ThinkPad T440s 20AQ-0069GE Intel Core i7-4600U 2.1GHz
HD Graphics 4400
~ 12 fps
100%
HD Graphics 4400:
23.5 [X] Acer Travelmate P276-MG-56FU Intel Core i5-4210U 1.7GHz
HD Graphics 4400
fps
40%
HD Graphics 3000:
9.5 [X] Acer Aspire M3-581TG Intel Core i7-2637M 1.7GHz
HD Graphics 3000
min:
4 fps, max:
15 fps
fps
100%
HD Graphics 4400:
10 [X] Acer Travelmate P276-MG-56FU Intel Core i5-4210U 1.7GHz
HD Graphics 4400
fps
100%
HD Graphics 4400:
40 49 [X] Lenovo ThinkPad T440s 20AQ-0069GE Intel Core i7-4600U 2.1GHz
HD Graphics 4400
~ 45 fps
100%
HD Graphics 4400:
26 31 [X] Lenovo ThinkPad T440s 20AQ-0069GE Intel Core i7-4600U 2.1GHz
HD Graphics 4400
~ 29 fps
100%
HD Graphics 4400:
18 [X] Lenovo ThinkPad T440s 20AQ-0069GE Intel Core i7-4600U 2.1GHz
HD Graphics 4400
fps
100%
HD Graphics 4400:
14 [X] Lenovo ThinkPad T440s 20AQ-0069GE Intel Core i7-4600U 2.1GHz
HD Graphics 4400
fps
100%
HD Graphics 4400:
10.4 [X] Lenovo ThinkPad T440s 20AQ-0069GE Intel Core i7-4600U 2.1GHz
HD Graphics 4400
fps
100%
HD Graphics 4400:
6.2 [X] Lenovo ThinkPad T440s 20AQ-0069GE Intel Core i7-4600U 2.1GHz
HD Graphics 4400
fps
100%
HD Graphics 4400:
12.1 [X] Lenovo ThinkPad T440s 20AQ-0069GE Intel Core i7-4600U 2.1GHz
HD Graphics 4400
15.8 ~ 14 fps
100%
HD Graphics 4400:
8.1 [X] Lenovo ThinkPad T440s 20AQ-0069GE Intel Core i7-4600U 2.1GHz
HD Graphics 4400
9.8 ~ 9 fps
100%
HD Graphics 4400:
20 29.3 [X] Lenovo ThinkPad T440s 20AQ-0069GE Intel Core i7-4600U 2.1GHz
HD Graphics 4400
33.3 ~ 28 fps
100%
HD Graphics 4400:
15.1 [X] Lenovo ThinkPad T440s 20AQ-0069GE Intel Core i7-4600U 2.1GHz
HD Graphics 4400
18.5 20.6 ~ 18 fps
100%
HD Graphics 4400:
10 [X] Lenovo ThinkPad T440s 20AQ-0069GE Intel Core i7-4600U 2.1GHz
HD Graphics 4400
10.8 ~ 10 fps
100%
HD Graphics 4400:
16 16.5 17.1 [X] Lenovo ThinkPad T440s 20AQ-0069GE Intel Core i7-4600U 2.1GHz
HD Graphics 4400
21.4 ~ 18 fps
100%
HD Graphics 4400:
10 10.2 10.8 11.7 [X] Lenovo ThinkPad T440s 20AQ-0069GE Intel Core i7-4600U 2.1GHz
HD Graphics 4400
~ 11 fps
100%
HD Graphics 4400:
6.5 6.5 [X] Lenovo ThinkPad T440s 20AQ-0069GE Intel Core i7-4600U 2.1GHz
HD Graphics 4400
~ 7 fps
100%
HD Graphics 4400:
3.1 fps
100%
HD Graphics 4400:
29.1 [X] Acer Aspire V 15 Nitro VN7-571G-56NX Intel Core i5-4210U 1.7GHz
HD Graphics 4400
30.1 [X] Lenovo ThinkPad T440s 20AQ-0069GE Intel Core i7-4600U 2.1GHz
HD Graphics 4400
32 ~ 30 fps
100%
HD Graphics 4400:
18.1 [X] Acer Aspire V 15 Nitro VN7-571G-56NX Intel Core i5-4210U 1.7GHz
HD Graphics 4400
20.8 23.7 [X] Lenovo ThinkPad T440s 20AQ-0069GE Intel Core i7-4600U 2.1GHz
HD Graphics 4400
~ 21 fps
100%
HD Graphics 4400:
12.5 [X] Acer Aspire V 15 Nitro VN7-571G-56NX Intel Core i5-4210U 1.7GHz
HD Graphics 4400
15.2 [X] Lenovo ThinkPad T440s 20AQ-0069GE Intel Core i7-4600U 2.1GHz
HD Graphics 4400
~ 14 fps
100%
HD Graphics 4400:
121 140.3 152.8 [X] Acer Aspire V 15 Nitro VN7-571G-56NX Intel Core i5-4210U 1.7GHz
HD Graphics 4400
180 [X] Lenovo ThinkPad T440s 20AQ-0069GE Intel Core i7-4600U 2.1GHz
HD Graphics 4400
~ 149 fps
100%
HD Graphics 4400:
26 27 29.9 [X] Acer Aspire V 15 Nitro VN7-571G-56NX Intel Core i5-4210U 1.7GHz
HD Graphics 4400
33 [X] Lenovo ThinkPad T440s 20AQ-0069GE Intel Core i7-4600U 2.1GHz
HD Graphics 4400
~ 29 fps
100%
HD Graphics 4400:
11.6 [X] Acer Aspire V 15 Nitro VN7-571G-56NX Intel Core i5-4210U 1.7GHz
HD Graphics 4400
13.2 [X] Lenovo ThinkPad T440s 20AQ-0069GE Intel Core i7-4600U 2.1GHz
HD Graphics 4400
~ 12 fps
100%
HD Graphics 4400:
21 21.2 25 ~ 22 fps
77%
HD Graphics 3000:
17 [X] Acer Aspire M3-581TG Intel Core i7-2637M 1.7GHz
HD Graphics 3000
min:
13 fps, max:
22 fps
fps
63%
HD Graphics 3000:
9.5 [X] Acer Aspire M3-581TG Intel Core i7-2637M 1.7GHz
HD Graphics 3000
min:
6 fps, max:
14 fps
fps
HD Graphics 3000:
4.3 [X] Acer Aspire M3-581TG Intel Core i7-2637M 1.7GHz
HD Graphics 3000
fps
HD Graphics 3000:
3.4 [X] Acer Aspire M3-581TG Intel Core i7-2637M 1.7GHz
HD Graphics 3000
fps
100%
HD Graphics 4400:
56 60.7 65 66.4 97.2 [X] Lenovo ThinkPad T440s 20AQ-0069GE Intel Core i7-4600U 2.1GHz
HD Graphics 4400
98.3 ~ 74 fps
89%
HD Graphics 3000:
50 [X] Acer Aspire M3-581TG Intel Core i7-2637M 1.7GHz
HD Graphics 3000
min:
37 fps, max:
65 fps
82.5 [X] i7-2600K HD Graphics 3000 Intel Core i7-2600K 3.4GHz
HD Graphics 3000
min:
59 fps, max:
109 fps
~ 66 fps
100%
HD Graphics 4400:
21 21 22.1 24.4 27.8 [X] Lenovo ThinkPad T440s 20AQ-0069GE Intel Core i7-4600U 2.1GHz
HD Graphics 4400
34.2 ~ 25 fps
92%
HD Graphics 3000:
17.8 [X] Acer Aspire M3-581TG Intel Core i7-2637M 1.7GHz
HD Graphics 3000
min:
14 fps, max:
25 fps
27.2 [X] i7-2600K HD Graphics 3000 Intel Core i7-2600K 3.4GHz
HD Graphics 3000
min:
22 fps, max:
36 fps
~ 23 fps
100%
HD Graphics 4400:
12.9 13 14 [X] Lenovo ThinkPad T440s 20AQ-0069GE Intel Core i7-4600U 2.1GHz
HD Graphics 4400
15.8 ~ 14 fps
93%
HD Graphics 3000:
12.5 [X] Acer Aspire M3-581TG Intel Core i7-2637M 1.7GHz
HD Graphics 3000
min:
12.5 fps, max:
14 fps
13.2 [X] i7-2600K HD Graphics 3000 Intel Core i7-2600K 3.4GHz
HD Graphics 3000
min:
13 fps, max:
16 fps
~ 13 fps
100%
HD Graphics 4400:
12 12.5 12.5 [X] Lenovo ThinkPad T440s 20AQ-0069GE Intel Core i7-4600U 2.1GHz
HD Graphics 4400
~ 12 fps
104%
HD Graphics 3000:
12.5 [X] Acer Aspire M3-581TG Intel Core i7-2637M 1.7GHz
HD Graphics 3000
min:
12.5 fps, max:
12.5 fps
fps
100%
HD Graphics 4400:
12.2 15.2 15.8 [X] Lenovo ThinkPad T440s 20AQ-0069GE Intel Core i7-4600U 2.1GHz
HD Graphics 4400
~ 14 fps
0%
HD Graphics 3000:
0 (!) [X] Acer Aspire M3-581TG Intel Core i7-2637M 1.7GHz
HD Graphics 3000
fps
100%
HD Graphics 4400:
9.2 9.6 [X] Lenovo ThinkPad T440s 20AQ-0069GE Intel Core i7-4600U 2.1GHz
HD Graphics 4400
12.3 ~ 10 fps
100%
HD Graphics 4400:
1.5 3.2 ~ 2 fps
100%
HD Graphics 4400:
23.9 25.9 ~ 25 fps
0%
HD Graphics 3000:
0 (!) [X] Acer Aspire M3-581TG Intel Core i7-2637M 1.7GHz
HD Graphics 3000
fps
100%
HD Graphics 4400:
20.6 22.8 ~ 22 fps
100%
HD Graphics 4400:
38.1 fps
59%
HD Graphics 3000:
22.5 [X] Acer Aspire M3-581TG Intel Core i7-2637M 1.7GHz
HD Graphics 3000
min:
17 fps, max:
26 fps
fps
100%
HD Graphics 4400:
20.6 fps
72%
HD Graphics 3000:
14.8 [X] Acer Aspire M3-581TG Intel Core i7-2637M 1.7GHz
HD Graphics 3000
min:
12 fps, max:
19 fps
fps
100%
HD Graphics 4400:
12.4 fps
100%
HD Graphics 4400:
30.1 fps
0%
HD Graphics 3000:
0 (!) [X] Acer Aspire M3-581TG Intel Core i7-2637M 1.7GHz
HD Graphics 3000
fps
100%
HD Graphics 4400:
16 fps
100%
HD Graphics 4400:
10.9 fps
100%
HD Graphics 4400:
6 7 7 7.3 7.5 7.6 7.7 [X] Asus B551LA-CF361G Intel Core i5-4210U 1.7GHz
HD Graphics 4400
7.8 7.8 7.9 7.9 8.3 8.3 [X] Dell Vostro 3546 JAN15HSW1601_1K9_Win Intel Core i3-4005U 1.7GHz
HD Graphics 4400
8.5 8.5 8.7 9 9 [X] Lenovo ThinkPad T440s 20AQ-0069GE Intel Core i7-4600U 2.1GHz
HD Graphics 4400
9.3 [X] Lenovo B50-70 59-407828 Intel Core i5-4210U 1.7GHz
HD Graphics 4400
~ 8 fps
100%
HD Graphics 4400:
3.9 4 4.8 5.5 5.9 6 6.2 6.2 6.5 [X] Asus B551LA-CF361G Intel Core i5-4210U 1.7GHz
HD Graphics 4400
6.8 [X] Dell Vostro 3546 JAN15HSW1601_1K9_Win Intel Core i3-4005U 1.7GHz
HD Graphics 4400
7 7.1 7.2 7.2 7.5 [X] Lenovo ThinkPad T440s 20AQ-0069GE Intel Core i7-4600U 2.1GHz
HD Graphics 4400
7.8 [X] Lenovo B50-70 59-407828 Intel Core i5-4210U 1.7GHz
HD Graphics 4400
~ 6 fps
100%
HD Graphics 4400:
1.2 3.1 [X] Asus B551LA-CF361G Intel Core i5-4210U 1.7GHz
HD Graphics 4400
3.2 3.3 3.6 [X] Lenovo B50-70 59-407828 Intel Core i5-4210U 1.7GHz
HD Graphics 4400
3.8 3.9 4.3 ~ 3 fps
100%
HD Graphics 4400:
20.2 [X] HP Pavilion TouchSmart 15-n010sg Intel Core i7-4500U 1.8GHz
HD Graphics 4400
23.4 ~ 22 fps
42%
HD Graphics 3000:
9.2 [X] Acer Aspire M3-581TG Intel Core i7-2637M 1.7GHz
HD Graphics 3000
min:
5 fps, max:
18 fps
fps
100%
HD Graphics 4400:
14.2 [X] HP Pavilion TouchSmart 15-n010sg Intel Core i7-4500U 1.8GHz
HD Graphics 4400
16.3 ~ 15 fps
100%
HD Graphics 4400:
12.8 fps
100%
HD Graphics 4400:
6.4 fps
100%
HD Graphics 4400:
30.2 fps
60%
HD Graphics 3000:
14.6 [X] Acer Aspire M3-581TG Intel Core i7-2637M 1.7GHz
HD Graphics 3000
21.5 [X] Compal Barebone Intel Core i7-2860QM 2.5GHz
HD Graphics 3000
~ 18 fps
100%
HD Graphics 4400:
18.4 fps
54%
HD Graphics 3000:
8 [X] Acer Aspire M3-581TG Intel Core i7-2637M 1.7GHz
HD Graphics 3000
11.3 [X] Compal Barebone Intel Core i7-2860QM 2.5GHz
HD Graphics 3000
~ 10 fps
100%
HD Graphics 4400:
8.8 fps
57%
HD Graphics 3000:
4 [X] Acer Aspire M3-581TG Intel Core i7-2637M 1.7GHz
HD Graphics 3000
5.7 [X] Compal Barebone Intel Core i7-2860QM 2.5GHz
HD Graphics 3000
~ 5 fps
HD Graphics 3000:
2.9 [X] Acer Aspire M3-581TG Intel Core i7-2637M 1.7GHz
HD Graphics 3000
3.9 [X] Compal Barebone Intel Core i7-2860QM 2.5GHz
HD Graphics 3000
~ 3 fps
100%
HD Graphics 4400:
16.7 [X] HP Pavilion TouchSmart 15-n010sg Intel Core i7-4500U 1.8GHz
HD Graphics 4400
fps
100%
HD Graphics 4400:
13.2 [X] HP Pavilion TouchSmart 15-n010sg Intel Core i7-4500U 1.8GHz
HD Graphics 4400
fps
100%
HD Graphics 4400:
42 fps
100%
HD Graphics 4400:
28 fps
100%
HD Graphics 4400:
12 fps
0%
HD Graphics 3000:
0 (!) [X] Acer Aspire M3-581TG Intel Core i7-2637M 1.7GHz
HD Graphics 3000
fps
100%
HD Graphics 4400:
9 fps
100%
HD Graphics 4400:
29 fps
110%
HD Graphics 3000:
32 [X] Schenker Xesia M501 Intel Core i7-2630QM 2GHz
HD Graphics 3000
fps
100%
HD Graphics 4400:
17 fps
124%
HD Graphics 3000:
21 [X] Schenker Xesia M501 Intel Core i7-2630QM 2GHz
HD Graphics 3000
fps
100%
HD Graphics 4400:
23 25 29 35 38 [X] Medion Akoya S6212T Intel Core i3-4010U 1.7GHz
HD Graphics 4400
41 51 58 ~ 38 fps
79%
HD Graphics 3000:
26 [X] Acer Aspire M3-581TG Intel Core i7-2637M 1.7GHz
HD Graphics 3000
min:
19 fps
34 [X] Schenker Xesia M501 Intel Core i7-2630QM 2GHz
HD Graphics 3000
~ 30 fps
100%
HD Graphics 4400:
16 16 19 22 22 25 [X] Medion Akoya S6212T Intel Core i3-4010U 1.7GHz
HD Graphics 4400
33 34 ~ 23 fps
96%
HD Graphics 3000:
19 [X] Acer Aspire M3-581TG Intel Core i7-2637M 1.7GHz
HD Graphics 3000
min:
14 fps
24 [X] Schenker Xesia M501 Intel Core i7-2630QM 2GHz
HD Graphics 3000
~ 22 fps
100%
HD Graphics 4400:
15 15 17 18 18 21 [X] Medion Akoya S6212T Intel Core i3-4010U 1.7GHz
HD Graphics 4400
26 ~ 19 fps
84%
HD Graphics 3000:
15 [X] Acer Aspire M3-581TG Intel Core i7-2637M 1.7GHz
HD Graphics 3000
min:
12 fps
17 [X] Schenker Xesia M501 Intel Core i7-2630QM 2GHz
HD Graphics 3000
~ 16 fps
100%
HD Graphics 4400:
12 12 12 12 ~ 12 fps
100%
HD Graphics 3000:
12 [X] Schenker Xesia M501 Intel Core i7-2630QM 2GHz
HD Graphics 3000
fps
98%
HD Graphics 3000:
124.9 [X] Schenker Xesia M501 Intel Core i7-2630QM 2GHz
HD Graphics 3000
fps
82%
HD Graphics 3000:
58 [X] Acer Aspire M3-581TG Intel Core i7-2637M 1.7GHz
HD Graphics 3000
min:
46 fps
63.6 [X] Schenker Xesia M501 Intel Core i7-2630QM 2GHz
HD Graphics 3000
~ 61 fps
57%
HD Graphics 3000:
30.5 [X] Acer Aspire M3-581TG Intel Core i7-2637M 1.7GHz
HD Graphics 3000
min:
25 fps
34.2 [X] Schenker Xesia M501 Intel Core i7-2630QM 2GHz
HD Graphics 3000
~ 32 fps
49%
HD Graphics 3000:
17 [X] Schenker Xesia M501 Intel Core i7-2630QM 2GHz
HD Graphics 3000
18 [X] Acer Aspire M3-581TG Intel Core i7-2637M 1.7GHz
HD Graphics 3000
~ 18 fps
58%
HD Graphics 3000:
18.4 [X] Acer Aspire M3-581TG Intel Core i7-2637M 1.7GHz
HD Graphics 3000
min:
15 fps
19.2 [X] Schenker Xesia M501 Intel Core i7-2630QM 2GHz
HD Graphics 3000
~ 19 fps
100%
HD Graphics 4400:
13 20.7 22 22.5 22.7 [X] Dell Vostro 3546 JAN15HSW1601_1K9_Win Intel Core i3-4005U 1.7GHz
HD Graphics 4400
23.3 23.5 [X] Asus B551LA-CF361G Intel Core i5-4210U 1.7GHz
HD Graphics 4400
26 26.1 [X] Asus PU551LA-XO359G Intel Core i3-4030U 1.9GHz
HD Graphics 4400
26.7 27.4 27.5 27.9 28.3 31 ~ 25 fps
56%
HD Graphics 3000:
14 [X] Acer Aspire M3-581TG Intel Core i7-2637M 1.7GHz
HD Graphics 3000
min:
12 fps
14.2 [X] Schenker Xesia M501 Intel Core i7-2630QM 2GHz
HD Graphics 3000
~ 14 fps
100%
HD Graphics 4400:
11 16 16.4 16.5 17 17.1 [X] Dell Vostro 3546 JAN15HSW1601_1K9_Win Intel Core i3-4005U 1.7GHz
HD Graphics 4400
17.3 [X] Asus B551LA-CF361G Intel Core i5-4210U 1.7GHz
HD Graphics 4400
17.5 19.9 19.9 [X] Asus PU551LA-XO359G Intel Core i3-4030U 1.9GHz
HD Graphics 4400
20.1 20.2 20.5 21.1 24 ~ 18 fps
100%
HD Graphics 4400:
4 5.1 [X] Asus B551LA-CF361G Intel Core i5-4210U 1.7GHz
HD Graphics 4400
5.3 6.3 6.8 7 ~ 6 fps
100%
HD Graphics 4400:
13.5 17.9 [X] Medion Akoya S6212T Intel Core i3-4010U 1.7GHz
HD Graphics 4400
~ 16 fps
81%
HD Graphics 3000:
11.5 [X] Acer Aspire M3-581TG Intel Core i7-2637M 1.7GHz
HD Graphics 3000
14 [X] Schenker Xesia M501 Intel Core i7-2630QM 2GHz
HD Graphics 3000
~ 13 fps
100%
HD Graphics 4400:
9.5 13.3 [X] Medion Akoya S6212T Intel Core i3-4010U 1.7GHz
HD Graphics 4400
~ 11 fps
86%
HD Graphics 3000:
9.5 [X] Schenker Xesia M501 Intel Core i7-2630QM 2GHz
HD Graphics 3000
fps
100%
HD Graphics 4400:
6.8 [X] Medion Akoya S6212T Intel Core i3-4010U 1.7GHz
HD Graphics 4400
fps
96%
HD Graphics 3000:
6.5 [X] Schenker Xesia M501 Intel Core i7-2630QM 2GHz
HD Graphics 3000
fps
HD Graphics 3000:
4.1 [X] Schenker Xesia M501 Intel Core i7-2630QM 2GHz
HD Graphics 3000
fps
100%
HD Graphics 4400:
16.4 fps
110%
HD Graphics 3000:
16.8 [X] Acer Aspire M3-581TG Intel Core i7-2637M 1.7GHz
HD Graphics 3000
19.4 [X] Schenker Xesia M501 Intel Core i7-2630QM 2GHz
HD Graphics 3000
~ 18 fps
100%
HD Graphics 4400:
10.8 fps
100%
HD Graphics 4400:
17.6 fps
124%
HD Graphics 3000:
21.9 [X] Schenker Xesia M501 Intel Core i7-2630QM 2GHz
HD Graphics 3000
fps
95%
HD Graphics 3000:
47.8 [X] Acer Aspire M3-581TG Intel Core i7-2637M 1.7GHz
HD Graphics 3000
63.8 [X] Schenker Xesia M501 Intel Core i7-2630QM 2GHz
HD Graphics 3000
~ 56 fps
88%
HD Graphics 3000:
24.9 [X] Acer Aspire M3-581TG Intel Core i7-2637M 1.7GHz
HD Graphics 3000
33.4 [X] Schenker Xesia M501 Intel Core i7-2630QM 2GHz
HD Graphics 3000
~ 29 fps
69%
HD Graphics 3000:
11.2 [X] Acer Aspire M3-581TG Intel Core i7-2637M 1.7GHz
HD Graphics 3000
11.5 [X] Schenker Xesia M501 Intel Core i7-2630QM 2GHz
HD Graphics 3000
~ 11 fps
74%
HD Graphics 3000:
8.9 [X] Schenker Xesia M501 Intel Core i7-2630QM 2GHz
HD Graphics 3000
fps
73%
HD Graphics 3000:
6.6 [X] Schenker Xesia M501 Intel Core i7-2630QM 2GHz
HD Graphics 3000
fps
100%
HD Graphics 4400:
5 6 ~ 6 fps
65%
HD Graphics 3000:
3.9 [X] Schenker Xesia M501 Intel Core i7-2630QM 2GHz
HD Graphics 3000
fps
100%
HD Graphics 4400:
2 3 ~ 3 fps
97%
HD Graphics 3000:
39.9 [X] Schenker Xesia M501 Intel Core i7-2630QM 2GHz
HD Graphics 3000
fps
106%
HD Graphics 3000:
24.4 [X] Schenker Xesia M501 Intel Core i7-2630QM 2GHz
HD Graphics 3000
fps
88%
HD Graphics 3000:
14.9 [X] Schenker Xesia M501 Intel Core i7-2630QM 2GHz
HD Graphics 3000
fps
100%
HD Graphics 4400:
12.5 13 ~ 13 fps
55%
HD Graphics 3000:
10.6 (!) [X] Acer Aspire M3-581TG Intel Core i7-2637M 1.7GHz
HD Graphics 3000
11.2 [X] Schenker Xesia M501 Intel Core i7-2630QM 2GHz
HD Graphics 3000
~ 11 fps
100%
HD Graphics 4400:
13 13.6 15 ~ 14 fps
53%
HD Graphics 3000:
7.4 [X] Schenker Xesia M501 Intel Core i7-2630QM 2GHz
HD Graphics 3000
fps
100%
HD Graphics 4400:
8.8 9.9 12 ~ 10 fps
77%
HD Graphics 3000:
22.8 [X] Acer Aspire M3-581TG Intel Core i7-2637M 1.7GHz
HD Graphics 3000
23.3 [X] Schenker Xesia M501 Intel Core i7-2630QM 2GHz
HD Graphics 3000
~ 23 fps
69%
HD Graphics 3000:
10.6 [X] Schenker Xesia M501 Intel Core i7-2630QM 2GHz
HD Graphics 3000
10.7 [X] Acer Aspire M3-581TG Intel Core i7-2637M 1.7GHz
HD Graphics 3000
~ 11 fps
69%
HD Graphics 3000:
9.2 [X] Schenker Xesia M501 Intel Core i7-2630QM 2GHz
HD Graphics 3000
9.3 [X] Acer Aspire M3-581TG Intel Core i7-2637M 1.7GHz
HD Graphics 3000
~ 9 fps
93%
HD Graphics 3000:
71 107 [X] Acer Aspire M3-581TG Intel Core i7-2637M 1.7GHz
HD Graphics 3000
138 [X] Schenker Xesia M501 Intel Core i7-2630QM 2GHz
HD Graphics 3000
~ 105 fps
67%
HD Graphics 3000:
19.4 [X] Acer Aspire M3-581TG Intel Core i7-2637M 1.7GHz
HD Graphics 3000
20 27 [X] Schenker Xesia M501 Intel Core i7-2630QM 2GHz
HD Graphics 3000
~ 22 fps
73%
HD Graphics 3000:
10 12.4 [X] Schenker Xesia M501 Intel Core i7-2630QM 2GHz
HD Graphics 3000
~ 11 fps
100%
HD Graphics 4400:
2 fps
210%
HD Graphics 3000:
4.2 [X] Schenker Xesia M501 Intel Core i7-2630QM 2GHz
HD Graphics 3000
fps
100%
HD Graphics 4400:
27 30 33 46 ~ 34 fps
46%
HD Graphics 3000:
15.8 [X] Schenker Xesia M501 Intel Core i7-2630QM 2GHz
HD Graphics 3000
fps
56%
HD Graphics 3000:
8.4 [X] Schenker Xesia M501 Intel Core i7-2630QM 2GHz
HD Graphics 3000
fps
100%
HD Graphics 4400:
8 9 11 ~ 9 fps
71%
HD Graphics 3000:
6.4 [X] Schenker Xesia M501 Intel Core i7-2630QM 2GHz
HD Graphics 3000
fps
62%
HD Graphics 3000:
26 [X] Schenker Xesia M501 Intel Core i7-2630QM 2GHz
HD Graphics 3000
fps
65%
HD Graphics 3000:
13.7 [X] Schenker Xesia M501 Intel Core i7-2630QM 2GHz
HD Graphics 3000
fps
83%
HD Graphics 3000:
9.9 [X] Schenker Xesia M501 Intel Core i7-2630QM 2GHz
HD Graphics 3000
fps
100%
HD Graphics 4400:
5 5 5 5.6 [X] Toshiba Satellite M50-A-11L (HD Graphics 4400) Intel Core i5-4200U 1.6GHz
HD Graphics 4400
5.9 5.9 6 6.2 7.6 7.8 7.9 ~ 6 fps
100%
HD Graphics 4400:
13.4 fps
100%
HD Graphics 4400:
8.6 fps
91%
HD Graphics 3000:
48 [X] Acer Aspire M3-581TG Intel Core i7-2637M 1.7GHz
HD Graphics 3000
54.3 [X] Schenker Xesia M501 Intel Core i7-2630QM 2GHz
HD Graphics 3000
~ 51 fps
81%
HD Graphics 3000:
21 [X] Acer Aspire M3-581TG Intel Core i7-2637M 1.7GHz
HD Graphics 3000
22.7 [X] Schenker Xesia M501 Intel Core i7-2630QM 2GHz
HD Graphics 3000
~ 22 fps
84%
HD Graphics 3000:
16.7 [X] Schenker Xesia M501 Intel Core i7-2630QM 2GHz
HD Graphics 3000
fps
100%
HD Graphics 4400:
11 14 ~ 13 fps
70%
HD Graphics 3000:
9.1 [X] Schenker Xesia M501 Intel Core i7-2630QM 2GHz
HD Graphics 3000
fps
100%
HD Graphics 4400:
20.1 fps
101%
HD Graphics 3000:
20.4 [X] Schenker Xesia M501 Intel Core i7-2630QM 2GHz
HD Graphics 3000
fps
100%
HD Graphics 4400:
14.2 fps
89%
HD Graphics 3000:
12.6 [X] Schenker Xesia M501 Intel Core i7-2630QM 2GHz
HD Graphics 3000
fps
100%
HD Graphics 4400:
11.4 fps
105%
HD Graphics 3000:
10.7 [X] Acer Aspire M3-581TG Intel Core i7-2637M 1.7GHz
HD Graphics 3000
13.9 [X] Schenker Xesia M501 Intel Core i7-2630QM 2GHz
HD Graphics 3000
~ 12 fps
HD Graphics 3000:
12 [X] Schenker Xesia M501 Intel Core i7-2630QM 2GHz
HD Graphics 3000
fps
100%
HD Graphics 4400:
17.5 19.8 ~ 19 fps
84%
HD Graphics 3000:
16 [X] Schenker Xesia M501 Intel Core i7-2630QM 2GHz
HD Graphics 3000
fps
100%
HD Graphics 4400:
13.6 fps
91%
HD Graphics 3000:
12.4 [X] Schenker Xesia M501 Intel Core i7-2630QM 2GHz
HD Graphics 3000
fps
HD Graphics 3000:
1.9 [X] Schenker Xesia M501 Intel Core i7-2630QM 2GHz
HD Graphics 3000
fps
100%
HD Graphics 4400:
23.2 38 ~ 31 fps
55%
HD Graphics 3000:
16.4 [X] Acer Aspire M3-581TG Intel Core i7-2637M 1.7GHz
HD Graphics 3000
16.9 [X] Schenker Xesia M501 Intel Core i7-2630QM 2GHz
HD Graphics 3000
~ 17 fps
100%
HD Graphics 4400:
18.6 26 ~ 22 fps
55%
HD Graphics 3000:
12.2 [X] Schenker Xesia M501 Intel Core i7-2630QM 2GHz
HD Graphics 3000
fps
100%
HD Graphics 4400:
10 fps
44%
HD Graphics 3000:
4.4 [X] Schenker Xesia M501 Intel Core i7-2630QM 2GHz
HD Graphics 3000
fps
100%
HD Graphics 4400:
21.7 fps
88%
HD Graphics 3000:
16.7 [X] Acer Aspire M3-581TG Intel Core i7-2637M 1.7GHz
HD Graphics 3000
20.6 [X] Schenker Xesia M501 Intel Core i7-2630QM 2GHz
HD Graphics 3000
~ 19 fps
100%
HD Graphics 4400:
15.6 fps
81%
HD Graphics 3000:
12.6 [X] Schenker Xesia M501 Intel Core i7-2630QM 2GHz
HD Graphics 3000
fps
HD Graphics 3000:
7.7 [X] Schenker Xesia M501 Intel Core i7-2630QM 2GHz
HD Graphics 3000
fps
100%
HD Graphics 4400:
21 22 32 ~ 25 fps
70%
HD Graphics 3000:
17.4 [X] Schenker Xesia M501 Intel Core i7-2630QM 2GHz
HD Graphics 3000
fps
100%
HD Graphics 4400:
16 21 ~ 19 fps
58%
HD Graphics 3000:
11 [X] Schenker Xesia M501 Intel Core i7-2630QM 2GHz
HD Graphics 3000
fps
100%
HD Graphics 4400:
13 16.6 ~ 15 fps
59%
HD Graphics 3000:
8.8 [X] Schenker Xesia M501 Intel Core i7-2630QM 2GHz
HD Graphics 3000
fps
100%
HD Graphics 4400:
6 fps
69%
HD Graphics 3000:
16.4 24.4 [X] Acer Aspire M3-581TG Intel Core i7-2637M 1.7GHz
HD Graphics 3000
29.7 [X] Schenker Xesia M501 Intel Core i7-2630QM 2GHz
HD Graphics 3000
~ 24 fps
81%
HD Graphics 3000:
19.9 [X] Acer Aspire M3-581TG Intel Core i7-2637M 1.7GHz
HD Graphics 3000
23.5 [X] Schenker Xesia M501 Intel Core i7-2630QM 2GHz
HD Graphics 3000
~ 22 fps
80%
HD Graphics 3000:
18.3 [X] Acer Aspire M3-581TG Intel Core i7-2637M 1.7GHz
HD Graphics 3000
21.1 [X] Schenker Xesia M501 Intel Core i7-2630QM 2GHz
HD Graphics 3000
~ 20 fps
100%
HD Graphics 4400:
15.4 fps
75%
HD Graphics 3000:
11.6 [X] Schenker Xesia M501 Intel Core i7-2630QM 2GHz
HD Graphics 3000
fps
HD Graphics 3000:
51 [X] Acer Aspire M3-581TG Intel Core i7-2637M 1.7GHz
HD Graphics 3000
64.3 [X] Schenker Xesia M501 Intel Core i7-2630QM 2GHz
HD Graphics 3000
~ 58 fps
HD Graphics 3000:
19.2 [X] Acer Aspire M3-581TG Intel Core i7-2637M 1.7GHz
HD Graphics 3000
19.4 [X] Schenker Xesia M501 Intel Core i7-2630QM 2GHz
HD Graphics 3000
~ 19 fps
HD Graphics 3000:
14.6 [X] Schenker Xesia M501 Intel Core i7-2630QM 2GHz
HD Graphics 3000
fps
HD Graphics 3000:
7.6 [X] Schenker Xesia M501 Intel Core i7-2630QM 2GHz
HD Graphics 3000
fps
100%
HD Graphics 4400:
34 38 44 ~ 39 fps
44%
HD Graphics 3000:
16.6 [X] Schenker Xesia M501 Intel Core i7-2630QM 2GHz
HD Graphics 3000
16.6 [X] Acer Aspire M3-581TG Intel Core i7-2637M 1.7GHz
HD Graphics 3000
~ 17 fps
100%
HD Graphics 4400:
40 42 53 54 ~ 47 fps
77%
HD Graphics 3000:
23 49 [X] Schenker Xesia M501 Intel Core i7-2630QM 2GHz
HD Graphics 3000
~ 36 fps
100%
HD Graphics 4400:
29 31 34 36 ~ 33 fps
64%
HD Graphics 3000:
15 27 [X] Schenker Xesia M501 Intel Core i7-2630QM 2GHz
HD Graphics 3000
~ 21 fps
100%
HD Graphics 4400:
22 23 28 28 ~ 25 fps
60%
HD Graphics 3000:
12 17 [X] Schenker Xesia M501 Intel Core i7-2630QM 2GHz
HD Graphics 3000
~ 15 fps
100%
HD Graphics 4400:
13 14 16 ~ 14 fps
86%
HD Graphics 3000:
12 [X] Schenker Xesia M501 Intel Core i7-2630QM 2GHz
HD Graphics 3000
fps
100%
HD Graphics 4400:
49 fps
49%
HD Graphics 3000:
20.9 [X] Schenker Xesia M501 Intel Core i7-2630QM 2GHz
HD Graphics 3000
27 ~ 24 fps
100%
HD Graphics 4400:
25 fps
60%
HD Graphics 3000:
13 17 [X] Schenker Xesia M501 Intel Core i7-2630QM 2GHz
HD Graphics 3000
~ 15 fps
100%
HD Graphics 4400:
15 fps
82%
HD Graphics 3000:
12.3 [X] Schenker Xesia M501 Intel Core i7-2630QM 2GHz
HD Graphics 3000
fps
HD Graphics 3000:
6.4 [X] Schenker Xesia M501 Intel Core i7-2630QM 2GHz
HD Graphics 3000
fps
100%
HD Graphics 4400:
75 79 91 ~ 82 fps
65%
HD Graphics 3000:
42 56.5 [X] Acer Aspire M3-581TG Intel Core i7-2637M 1.7GHz
HD Graphics 3000
61.9 [X] Schenker Xesia M501 Intel Core i7-2630QM 2GHz
HD Graphics 3000
~ 53 fps
100%
HD Graphics 4400:
34 40 52 ~ 42 fps
62%
HD Graphics 3000:
19.8 26.6 [X] Acer Aspire M3-581TG Intel Core i7-2637M 1.7GHz
HD Graphics 3000
32.8 [X] Schenker Xesia M501 Intel Core i7-2630QM 2GHz
HD Graphics 3000
~ 26 fps
100%
HD Graphics 4400:
16 17 21 ~ 18 fps
89%
HD Graphics 3000:
15.7 [X] Acer Aspire M3-581TG Intel Core i7-2637M 1.7GHz
HD Graphics 3000
16.8 [X] Schenker Xesia M501 Intel Core i7-2630QM 2GHz
HD Graphics 3000
~ 16 fps
100%
HD Graphics 4400:
17 31 45 ~ 31 fps
84%
HD Graphics 3000:
20 22 22.6 [X] Acer Aspire M3-581TG Intel Core i7-2637M 1.7GHz
HD Graphics 3000
37.5 [X] Schenker Xesia M501 Intel Core i7-2630QM 2GHz
HD Graphics 3000
~ 26 fps
100%
HD Graphics 4400:
3 9 15 ~ 9 fps
89%
HD Graphics 3000:
7 8 8.1 [X] Acer Aspire M3-581TG Intel Core i7-2637M 1.7GHz
HD Graphics 3000
9.2 [X] Schenker Xesia M501 Intel Core i7-2630QM 2GHz
HD Graphics 3000
~ 8 fps
100%
HD Graphics 4400:
1 fps
310%
HD Graphics 3000:
3.1 [X] Acer Aspire M3-581TG Intel Core i7-2637M 1.7GHz
HD Graphics 3000
fps
80%
HD Graphics 3000:
50.4 70.8 [X] Schenker Xesia M501 Intel Core i7-2630QM 2GHz
HD Graphics 3000
~ 61 fps
100%
HD Graphics 4400:
23.3 56 71 ~ 50 fps
74%
HD Graphics 3000:
33.4 41.4 [X] Schenker Xesia M501 Intel Core i7-2630QM 2GHz
HD Graphics 3000
~ 37 fps
52%
HD Graphics 3000:
13.6 19.7 [X] Schenker Xesia M501 Intel Core i7-2630QM 2GHz
HD Graphics 3000
~ 17 fps
HD Graphics 3000:
10.6 [X] Schenker Xesia M501 Intel Core i7-2630QM 2GHz
HD Graphics 3000
fps
100%
HD Graphics 4400:
26 fps
73%
HD Graphics 3000:
18.4 [X] Acer Aspire M3-581TG Intel Core i7-2637M 1.7GHz
HD Graphics 3000
18.6 [X] Schenker Xesia M501 Intel Core i7-2630QM 2GHz
HD Graphics 3000
~ 19 fps
100%
HD Graphics 4400:
14 fps
71%
HD Graphics 3000:
10 [X] Schenker Xesia M501 Intel Core i7-2630QM 2GHz
HD Graphics 3000
10 [X] Acer Aspire M3-581TG Intel Core i7-2637M 1.7GHz
HD Graphics 3000
~ 10 fps
78%
HD Graphics 3000:
21 [X] Schenker Xesia M501 Intel Core i7-2630QM 2GHz
HD Graphics 3000
fps
100%
HD Graphics 4400:
14.8 24 26 ~ 22 fps
68%
HD Graphics 3000:
15 [X] Schenker Xesia M501 Intel Core i7-2630QM 2GHz
HD Graphics 3000
fps
100%
HD Graphics 4400:
8.4 10 10 ~ 9 fps
76%
HD Graphics 3000:
6.8 [X] Schenker Xesia M501 Intel Core i7-2630QM 2GHz
HD Graphics 3000
fps
HD Graphics 3000:
13.7 [X] Schenker Xesia M501 Intel Core i7-2630QM 2GHz
HD Graphics 3000
fps
HD Graphics 3000:
11.3 [X] Schenker Xesia M501 Intel Core i7-2630QM 2GHz
HD Graphics 3000
fps
100%
HD Graphics 4400:
13.5 fps
67%
HD Graphics 3000:
8.7 [X] Acer Aspire M3-581TG Intel Core i7-2637M 1.7GHz
HD Graphics 3000
9.4 [X] Schenker Xesia M501 Intel Core i7-2630QM 2GHz
HD Graphics 3000
~ 9 fps
100%
HD Graphics 4400:
17.6 fps
100%
HD Graphics 3000:
17.6 [X] Schenker Xesia M501 Intel Core i7-2630QM 2GHz
HD Graphics 3000
fps
100%
HD Graphics 4400:
14.5 fps
88%
HD Graphics 3000:
12.7 [X] Schenker Xesia M501 Intel Core i7-2630QM 2GHz
HD Graphics 3000
fps
100%
HD Graphics 4400:
33.1 49 ~ 41 fps
76%
HD Graphics 3000:
24.8 24.8 31.1 33.8 [X] Acer Aspire M3-581TG Intel Core i7-2637M 1.7GHz
HD Graphics 3000
40.6 [X] Schenker XMG A501 Intel Core i7-2630QM 2GHz
HD Graphics 3000
~ 31 fps
100%
HD Graphics 4400:
19.6 30 ~ 25 fps
72%
HD Graphics 3000:
15.1 15.1 17.2 19 [X] Acer Aspire M3-581TG Intel Core i7-2637M 1.7GHz
HD Graphics 3000
25.3 [X] Schenker XMG A501 Intel Core i7-2630QM 2GHz
HD Graphics 3000
~ 18 fps
100%
HD Graphics 4400:
17 fps
65%
HD Graphics 3000:
8.6 9.5 9.5 13 [X] Acer Aspire M3-581TG Intel Core i7-2637M 1.7GHz
HD Graphics 3000
13.1 [X] Schenker XMG A501 Intel Core i7-2630QM 2GHz
HD Graphics 3000
~ 11 fps
100%
HD Graphics 4400:
5 fps
70%
HD Graphics 3000:
24.6 25.6 27 30.4 31.3 39 41 [X] Acer Aspire M3-581TG Intel Core i7-2637M 1.7GHz
HD Graphics 3000
44 [X] Schenker XMG A501 Intel Core i7-2630QM 2GHz
HD Graphics 3000
56 ~ 35 fps
50%
HD Graphics 3000:
14.8 15 15.7 [X] Schenker XMG A501 Intel Core i7-2630QM 2GHz
HD Graphics 3000
16 [X] Acer Aspire M3-581TG Intel Core i7-2637M 1.7GHz
HD Graphics 3000
18 18.7 19.6 21.2 ~ 17 fps
39%
HD Graphics 3000:
7 8.2 [X] Schenker XMG A501 Intel Core i7-2630QM 2GHz
HD Graphics 3000
8.5 [X] Acer Aspire M3-581TG Intel Core i7-2637M 1.7GHz
HD Graphics 3000
8.5 [X] Acer Aspire M3-581TG Intel Core i7-2637M 1.7GHz
HD Graphics 3000
12.9 13 15.8 18 ~ 11 fps
75%
HD Graphics 3000:
6.3 [X] Schenker XMG A501 Intel Core i7-2630QM 2GHz
HD Graphics 3000
17 ~ 12 fps
100%
HD Graphics 4400:
13.4 fps
127%
HD Graphics 3000:
16.3 [X] Acer Aspire M3-581TG Intel Core i7-2637M 1.7GHz
HD Graphics 3000
17.6 [X] Schenker XMG A501 Intel Core i7-2630QM 2GHz
HD Graphics 3000
~ 17 fps
100%
HD Graphics 4400:
9.8 fps
122%
HD Graphics 3000:
11.3 [X] Acer Aspire M3-581TG Intel Core i7-2637M 1.7GHz
HD Graphics 3000
11.9 [X] Schenker XMG A501 Intel Core i7-2630QM 2GHz
HD Graphics 3000
~ 12 fps
HD Graphics 3000:
8.5 [X] Schenker XMG A501 Intel Core i7-2630QM 2GHz
HD Graphics 3000
8.6 [X] Acer Aspire M3-581TG Intel Core i7-2637M 1.7GHz
HD Graphics 3000
~ 9 fps
100%
HD Graphics 4400:
41 fps
61%
HD Graphics 3000:
21.2 21.4 31 [X] Schenker XMG A501 Intel Core i7-2630QM 2GHz
HD Graphics 3000
~ 25 fps
100%
HD Graphics 4400:
29 fps
66%
HD Graphics 3000:
15.8 21.7 [X] Schenker XMG A501 Intel Core i7-2630QM 2GHz
HD Graphics 3000
~ 19 fps
HD Graphics 3000:
12.3 [X] Schenker XMG A501 Intel Core i7-2630QM 2GHz
HD Graphics 3000
fps
100%
HD Graphics 4400:
17 fps
35%
HD Graphics 3000:
4 4 9.1 [X] Schenker XMG A501 Intel Core i7-2630QM 2GHz
HD Graphics 3000
~ 6 fps
100%
HD Graphics 4400:
11.7 fps
53%
HD Graphics 3000:
6.2 [X] Schenker XMG A501 Intel Core i7-2630QM 2GHz
HD Graphics 3000
fps
100%
HD Graphics 4400:
5 fps
HD Graphics 3000:
41.3 [X] Schenker Xesia M501 Intel Core i5-2430M 2.4GHz
HD Graphics 3000
fps
HD Graphics 3000:
11 [X] Schenker Xesia M501 Intel Core i5-2430M 2.4GHz
HD Graphics 3000
fps
63%
HD Graphics 3000:
21 21.5 22 24 29.3 [X] Dell Inspiron N411z (C0425821) Intel Core i3-2330M 2.2GHz
HD Graphics 3000
29.3 29.6 30 30 30.2 30.3 30.6 30.7 31.1 31.4 31.6 32 [X] Sony Vaio VPCCA290X Intel Core i5-2410M 2.3GHz
HD Graphics 3000
32 32 32.7 33.4 34 [X] Acer Aspire 3830TG-6431 Intel Core i5-2410M 2.3GHz
HD Graphics 3000
35 35.2 35.3 [X] Asus X501A-XX381H Intel Core i3-2328M 2.2GHz
HD Graphics 3000
36.7 [X] Schenker XMG A501 Intel Core i7-2630QM 2GHz
HD Graphics 3000
39.2 [X] Asus B33E PL Intel Core i7-2620M 2.7GHz
HD Graphics 3000
42 [X] no model Intel Core i7-2860QM 2.5GHz
HD Graphics 3000
47.4 ~ 32 fps
53%
HD Graphics 3000:
6 6.1 7 7 7.4 [X] Dell Inspiron N411z (C0425821) Intel Core i3-2330M 2.2GHz
HD Graphics 3000
7.7 8 [X] Sony Vaio VPCCA290X Intel Core i5-2410M 2.3GHz
HD Graphics 3000
8.1 8.6 8.8 9 9 9.6 [X] Asus B33E PL Intel Core i7-2620M 2.7GHz
HD Graphics 3000
~ 8 fps
100%
HD Graphics 4400:
5.8 5.9 5.9 6.1 [X] Toshiba Satellite M50-A-11L (HD Graphics 4400) Intel Core i5-4200U 1.6GHz
HD Graphics 4400
6.7 6.9 6.9 7.1 7.7 7.8 8 8.8 9.8 [X] Fujitsu LifeBook U904 M0010PL Intel Core i7-4600U 2.1GHz
HD Graphics 4400
56 ~ 11 fps
27%
HD Graphics 3000:
3 [X] Sony Vaio VPCCA290X Intel Core i5-2410M 2.3GHz
HD Graphics 3000
fps
61%
HD Graphics 3000:
12 [X] Sony Vaio VPCCA290X Intel Core i5-2410M 2.3GHz
HD Graphics 3000
17 17 18 [X] Acer Aspire 3830TG-6431 Intel Core i5-2410M 2.3GHz
HD Graphics 3000
18 18 18.7 19.4 19.7 21.1 22.5 25 [X] no model Intel Core i7-2860QM 2.5GHz
HD Graphics 3000
25.2 [X] Schenker XMG A501 Intel Core i7-2630QM 2GHz
HD Graphics 3000
~ 19 fps
63%
HD Graphics 3000:
8 [X] Sony Vaio VPCCA290X Intel Core i5-2410M 2.3GHz
HD Graphics 3000
8 9 [X] Acer Aspire 3830TG-6431 Intel Core i5-2410M 2.3GHz
HD Graphics 3000
9 9 9.2 9.6 9.9 10 10.5 11.2 13 [X] no model Intel Core i7-2860QM 2.5GHz
HD Graphics 3000
~ 10 fps
80%
HD Graphics 3000:
7 [X] Acer Aspire 3830TG-6431 Intel Core i5-2410M 2.3GHz
HD Graphics 3000
8.5 ~ 8 fps
100%
HD Graphics 4400:
94 fps
75%
HD Graphics 3000:
70.9 [X] Schenker XMG A501 Intel Core i7-2630QM 2GHz
HD Graphics 3000
fps
100%
HD Graphics 4400:
53 fps
60%
HD Graphics 3000:
31.9 [X] Schenker XMG A501 Intel Core i7-2630QM 2GHz
HD Graphics 3000
fps
HD Graphics 3000:
13.4 [X] Schenker XMG A501 Intel Core i7-2630QM 2GHz
HD Graphics 3000
fps
HD Graphics 3000:
6.9 [X] Schenker XMG A501 Intel Core i7-2630QM 2GHz
HD Graphics 3000
fps
100%
HD Graphics 4400:
17 fps
65%
HD Graphics 3000:
7 (!) [X] Acer Aspire 3830TG-6431 Intel Core i5-2410M 2.3GHz
HD Graphics 3000
7 (!) [X] no model Intel Core i7-2860QM 2.5GHz
HD Graphics 3000
13.8 16.6 [X] Schenker XMG A501 Intel Core i7-2630QM 2GHz
HD Graphics 3000
~ 11 fps
100%
HD Graphics 4400:
11.7 fps
100%
HD Graphics 4400:
9.7 fps
100%
HD Graphics 4400:
27 39 ~ 33 fps
91%
HD Graphics 3000:
23 23 45 [X] no model Intel Core i7-2860QM 2.5GHz
HD Graphics 3000
~ 30 fps
100%
HD Graphics 4400:
22 28 ~ 25 fps
92%
HD Graphics 3000:
18 18 32 [X] no model Intel Core i7-2860QM 2.5GHz
HD Graphics 3000
~ 23 fps
100%
HD Graphics 4400:
10 12 ~ 11 fps
HD Graphics 3000:
49.9 49.9 55 63 66.5 67 69 76 76.3 79 80.4 81 84 [X] Acer Aspire 3830TG-6431 Intel Core i5-2410M 2.3GHz
HD Graphics 3000
94 [X] Asus X501A-XX381H Intel Core i3-2328M 2.2GHz
HD Graphics 3000
106.5 108.6 [X] Dell Inspiron N411z (C0425821) Intel Core i3-2330M 2.2GHz
HD Graphics 3000
118.6 [X] Asus B33E PL Intel Core i7-2620M 2.7GHz
HD Graphics 3000
120.4 185 [X] no model Intel Core i7-2860QM 2.5GHz
HD Graphics 3000
~ 86 fps
HD Graphics 3000:
22.9 22.9 29.5 33 34 37 42 42.7 47 47.1 48 49.2 [X] Asus X501A-XX381H Intel Core i3-2328M 2.2GHz
HD Graphics 3000
53.4 54.1 57 [X] Acer Aspire 3830TG-6431 Intel Core i5-2410M 2.3GHz
HD Graphics 3000
61.7 [X] Dell Inspiron N411z (C0425821) Intel Core i3-2330M 2.2GHz
HD Graphics 3000
65.1 86.5 [X] Asus B33E PL Intel Core i7-2620M 2.7GHz
HD Graphics 3000
91 [X] no model Intel Core i7-2860QM 2.5GHz
HD Graphics 3000
~ 49 fps
HD Graphics 3000:
18 18 19 19.9 21 25 25.5 26.6 27 27 27.8 28 [X] Acer Aspire 3830TG-6431 Intel Core i5-2410M 2.3GHz
HD Graphics 3000
28 30.2 30.6 [X] Schenker XMG A501 Intel Core i7-2630QM 2GHz
HD Graphics 3000
30.9 46 [X] no model Intel Core i7-2860QM 2.5GHz
HD Graphics 3000
47.7 [X] Asus B33E PL Intel Core i7-2620M 2.7GHz
HD Graphics 3000
~ 28 fps
HD Graphics 3000:
19 [X] Acer Aspire 3830TG-6431 Intel Core i5-2410M 2.3GHz
HD Graphics 3000
19 27 [X] no model Intel Core i7-2860QM 2.5GHz
HD Graphics 3000
~ 22 fps
HD Graphics 3000:
30 33 38.5 48 [X] Acer Aspire 3830TG-6431 Intel Core i5-2410M 2.3GHz
HD Graphics 3000
70 [X] no model Intel Core i7-2860QM 2.5GHz
HD Graphics 3000
~ 44 fps
HD Graphics 3000:
16 18 20 22 [X] Acer Aspire 3830TG-6431 Intel Core i5-2410M 2.3GHz
HD Graphics 3000
30 [X] Schenker XMG A501 Intel Core i7-2630QM 2GHz
HD Graphics 3000
35 [X] no model Intel Core i7-2860QM 2.5GHz
HD Graphics 3000
~ 24 fps
100%
HD Graphics 4400:
64 fps
56%
HD Graphics 3000:
24 26.7 28 31.2 33 42 [X] Acer Aspire 3830TG-6431 Intel Core i5-2410M 2.3GHz
HD Graphics 3000
51 [X] no model Intel Core i7-2860QM 2.5GHz
HD Graphics 3000
53 [X] Alienware M18x Intel Core i7-2920XM @4GHz
HD Graphics 3000
~ 36 fps
100%
HD Graphics 4400:
31.7 fps
35%
HD Graphics 3000:
11 fps
100%
HD Graphics 4400:
13.8 fps
51%
HD Graphics 3000:
7 fps
100%
HD Graphics 4400:
79 fps
100%
HD Graphics 4400:
44.6 fps
58%
HD Graphics 3000:
12.3 21.6 22 23 25.1 29 29 30.6 [X] no model Intel Core i7-2820QM 2.3GHz
HD Graphics 3000
31 31 31.8 [X] Schenker XMG A501 Intel Core i7-2630QM 2GHz
HD Graphics 3000
~ 26 fps
100%
HD Graphics 4400:
24.4 fps
70%
HD Graphics 3000:
8.3 16 18 18 18 18 19.9 [X] no model Intel Core i7-2820QM 2.3GHz
HD Graphics 3000
~ 17 fps
100%
HD Graphics 4400:
12.8 fps
102%
HD Graphics 3000:
12.9 [X] no model Intel Core i7-2820QM 2.3GHz
HD Graphics 3000
13 13 ~ 13 fps
HD Graphics 3000:
13 [X] Acer Aspire 3830TG-6431 Intel Core i5-2410M 2.3GHz
HD Graphics 3000
fps
HD Graphics 3000:
27 [X] MSI CX640-i547W7P Intel Core i5-2410M 2.3GHz
HD Graphics 3000
30 30 33 [X] no model Intel Core i7-2820QM 2.3GHz
HD Graphics 3000
~ 30 fps
HD Graphics 3000:
18 [X] MSI CX640-i547W7P Intel Core i5-2410M 2.3GHz
HD Graphics 3000
18.5 [X] Schenker XMG A501 Intel Core i7-2630QM 2GHz
HD Graphics 3000
19 19 20 [X] no model Intel Core i7-2820QM 2.3GHz
HD Graphics 3000
~ 19 fps
HD Graphics 3000:
13 [X] MSI CX640-i547W7P Intel Core i5-2410M 2.3GHz
HD Graphics 3000
15 15 16 [X] no model Intel Core i7-2820QM 2.3GHz
HD Graphics 3000
~ 15 fps
HD Graphics 3000:
4 [X] MSI CX640-i547W7P Intel Core i5-2410M 2.3GHz
HD Graphics 3000
4 4 ~ 4 fps
100%
HD Graphics 4400:
50.2 93.6 ~ 72 fps
100%
HD Graphics 3000:
59.1 62.7 79 [X] Acer Aspire 3830TG-6431 Intel Core i5-2410M 2.3GHz
HD Graphics 3000
88 [X] Alienware M18x Intel Core i7-2920XM @4GHz
HD Graphics 3000
~ 72 fps
HD Graphics 3000:
5 (!) [X] Toshiba Portégé Z830-10N Intel Core i3-2367M 1.4GHz
HD Graphics 3000
6 [X] Alienware M18x Intel Core i7-2920XM @4GHz
HD Graphics 3000
6.2 [X] Acer Aspire 3830TG-6431 Intel Core i5-2410M 2.3GHz
HD Graphics 3000
15.7 ~ 8 fps
HD Graphics 3000:
-1 [X] Alienware M18x Intel Core i7-2920XM @4GHz
HD Graphics 3000
fps
HD Graphics 3000:
20.9 [X] Asus U30SD-XA1 Intel HD 3000 Intel Core i5-2410M 2.3GHz
HD Graphics 3000
21 21 22.7 [X] Asus N53SV HD3000 Intel Core i7-2720QM 2.2GHz
HD Graphics 3000
24.4 25 26 27 27 29 [X] no model Intel Core i7-2820QM 2.3GHz
HD Graphics 3000
32 [X] no model Intel Core i5-2500K 3.3GHz
HD Graphics 3000
32 [X] no model Intel Core i7-2600K 3.4GHz
HD Graphics 3000
~ 26 fps
HD Graphics 3000:
15 15.6 [X] Asus U30SD-XA1 Intel HD 3000 Intel Core i5-2410M 2.3GHz
HD Graphics 3000
16 16.5 18 18 18 18.3 [X] Asus N53SV HD3000 Intel Core i7-2720QM 2.2GHz
HD Graphics 3000
19 [X] no model Intel Core i7-2820QM 2.3GHz
HD Graphics 3000
22 [X] no model Intel Core i5-2500K 3.3GHz
HD Graphics 3000
27 [X] Schenker XMG A501 Intel Core i7-2630QM 2GHz
HD Graphics 3000
~ 18 fps
HD Graphics 3000:
9.3 [X] Asus U30SD-XA1 Intel HD 3000 Intel Core i5-2410M 2.3GHz
HD Graphics 3000
10.2 13 13 14 [X] no model Intel Core i5-2500K 3.3GHz
HD Graphics 3000
14 17.9 [X] Asus N53SV HD3000 Intel Core i7-2720QM 2.2GHz
HD Graphics 3000
~ 13 fps
HD Graphics 3000:
5.7 6 6 ~ 6 fps
HD Graphics 3000:
53 [X] Samsung 350U2A-A01PL Intel Core i3-2357M 1.3GHz
HD Graphics 3000
80.7 [X] MSI CR640-048XPL Intel Core i3-2310M 2.1GHz
HD Graphics 3000
88.3 [X] Toshiba Satellite Pro R850-122 Intel Core i3-2310M 2.1GHz
HD Graphics 3000
97.7 [X] HP ProBook 6360b LG632EA Intel Core i5-2410M 2.3GHz
HD Graphics 3000
98 98 98 99.8 [X] Fujitsu LifeBook P771 (VFY:P7710MF011PL) Intel Core i7-2617M 1.5GHz
HD Graphics 3000
101 101 101.8 [X] HP Folio 13 (B0N00AA) Intel Core i5-2467M 1.6GHz
HD Graphics 3000
107.3 [X] Samsung QX311-A01PL Intel Core i5-2410M 2.3GHz
HD Graphics 3000
117 127 [X] Chiligreen Platin TS Intel Core i3-2330M 2.2GHz
HD Graphics 3000
132.8 ~ 100 fps
HD Graphics 3000:
31.1 [X] Samsung 350U2A-A01PL Intel Core i3-2357M 1.3GHz
HD Graphics 3000
48.2 [X] Asus K53E-SX058V Intel Core i3-2310M 2.1GHz
HD Graphics 3000
49.3 [X] MSI CR640-048XPL Intel Core i3-2310M 2.1GHz
HD Graphics 3000
54 54 54 55.1 [X] Fujitsu LifeBook P771 (VFY:P7710MF011PL) Intel Core i7-2617M 1.5GHz
HD Graphics 3000
55.8 [X] HP Folio 13 (B0N00AA) Intel Core i5-2467M 1.6GHz
HD Graphics 3000
55.9 [X] Toshiba Satellite Pro R850-122 Intel Core i3-2310M 2.1GHz
HD Graphics 3000
56 56 57 [X] HP ProBook 6360b LG632EA Intel Core i5-2410M 2.3GHz
HD Graphics 3000
61 [X] Chiligreen Platin TS Intel Core i3-2330M 2.2GHz
HD Graphics 3000
62.6 [X] Asus Zenbook UX21E-KX004V Intel Core i5-2467M 1.6GHz
HD Graphics 3000
63 63.5 [X] Samsung QX311-A01PL Intel Core i5-2410M 2.3GHz
HD Graphics 3000
65.7 ~ 55 fps
HD Graphics 3000:
21.4 [X] MSI CR640-048XPL Intel Core i3-2310M 2.1GHz
HD Graphics 3000
21.7 [X] HP ProBook 6360b LG632EA Intel Core i5-2410M 2.3GHz
HD Graphics 3000
24 [X] Asus K53E-SX058V Intel Core i3-2310M 2.1GHz
HD Graphics 3000
26.2 [X] Toshiba Satellite Pro R850-122 Intel Core i3-2310M 2.1GHz
HD Graphics 3000
29.4 [X] HP Folio 13 (B0N00AA) Intel Core i5-2467M 1.6GHz
HD Graphics 3000
32 32 32 32 32 32 32 [X] Chiligreen Platin TS Intel Core i3-2330M 2.2GHz
HD Graphics 3000
35.9 [X] Samsung QX311-A01PL Intel Core i5-2410M 2.3GHz
HD Graphics 3000
36.2 [X] Asus Zenbook UX21E-KX004V Intel Core i5-2467M 1.6GHz
HD Graphics 3000
41.4 44 [X] no model Intel Core i5-2500K 3.3GHz
HD Graphics 3000
46 [X] no model Intel Core i7-2820QM 2.3GHz
HD Graphics 3000
~ 32 fps
HD Graphics 3000:
21 23 [X] no model Intel Core i7-2820QM 2.3GHz
HD Graphics 3000
23 23 25 [X] no model Intel Core i5-2500K 3.3GHz
HD Graphics 3000
~ 23 fps
100%
HD Graphics 4400:
21.5 fps
70%
HD Graphics 3000:
9.8 16.9 [X] Alienware M18x Intel Core i7-2920XM @4GHz
HD Graphics 3000
16.9 [X] Acer Aspire 3830TG-6431 Intel Core i5-2410M 2.3GHz
HD Graphics 3000
~ 15 fps
HD Graphics 3000:
5 (!) [X] Alienware M18x Intel Core i7-2920XM @4GHz
HD Graphics 3000
fps
100%
HD Graphics 4400:
26.5 [X] Asus B551LA-CF361G Intel Core i5-4210U 1.7GHz
HD Graphics 4400
28 [X] Dell Vostro 3546 JAN15HSW1601_1K9_Win Intel Core i3-4005U 1.7GHz
HD Graphics 4400
32.5 [X] Lenovo B50-70 59-407828 Intel Core i5-4210U 1.7GHz
HD Graphics 4400
34.2 [X] Asus PU551LA-XO359G Intel Core i3-4030U 1.9GHz
HD Graphics 4400
46 50 ~ 36 fps
36%
HD Graphics 3000:
7 7 7.7 9 9 20.5 20.8 23 [X] MSI CX640-i547W7P Intel Core i5-2410M 2.3GHz
HD Graphics 3000
~ 13 fps
100%
HD Graphics 4400:
20.5 [X] Asus B551LA-CF361G Intel Core i5-4210U 1.7GHz
HD Graphics 4400
20.8 [X] Dell Vostro 3546 JAN15HSW1601_1K9_Win Intel Core i3-4005U 1.7GHz
HD Graphics 4400
23 [X] Asus PU551LA-XO359G Intel Core i3-4030U 1.9GHz
HD Graphics 4400
25.2 [X] Lenovo B50-70 59-407828 Intel Core i5-4210U 1.7GHz
HD Graphics 4400
30 32 ~ 25 fps
68%
HD Graphics 3000:
5.8 17.4 [X] Schenker XMG A501 Intel Core i7-2630QM 2GHz
HD Graphics 3000
17.6 19 [X] MSI CX640-i547W7P Intel Core i5-2410M 2.3GHz
HD Graphics 3000
19 19 19 19 19 ~ 17 fps
100%
HD Graphics 4400:
17.2 [X] Dell Vostro 3546 JAN15HSW1601_1K9_Win Intel Core i3-4005U 1.7GHz
HD Graphics 4400
17.3 [X] Asus B551LA-CF361G Intel Core i5-4210U 1.7GHz
HD Graphics 4400
19.2 [X] Asus PU551LA-XO359G Intel Core i3-4030U 1.9GHz
HD Graphics 4400
20.9 [X] Lenovo B50-70 59-407828 Intel Core i5-4210U 1.7GHz
HD Graphics 4400
23 26 ~ 21 fps
67%
HD Graphics 3000:
4.8 14.4 15 [X] MSI CX640-i547W7P Intel Core i5-2410M 2.3GHz
HD Graphics 3000
15 15 15 15 15 ~ 14 fps
100%
HD Graphics 4400:
10.5 [X] Asus B551LA-CF361G Intel Core i5-4210U 1.7GHz
HD Graphics 4400
12 12.3 [X] Lenovo B50-70 59-407828 Intel Core i5-4210U 1.7GHz
HD Graphics 4400
13 ~ 12 fps
75%
HD Graphics 3000:
8.5 9 [X] MSI CX640-i547W7P Intel Core i5-2410M 2.3GHz
HD Graphics 3000
9 9 ~ 9 fps
60%
HD Graphics 3000:
12 13.3 14 14 15 15 16 16 16 16.3 16.6 17 17 17.8 18 19 [X] no model Intel Core i5-2500K 3.3GHz
HD Graphics 3000
19 19 19.5 [X] Schenker XMG A501 Intel Core i7-2630QM 2GHz
HD Graphics 3000
20 20.4 [X] Asus N53SV HD3000 Intel Core i7-2720QM 2.2GHz
HD Graphics 3000
21 [X] no model Intel Core i7-2820QM 2.3GHz
HD Graphics 3000
21 [X] MSI CX640-i547W7P Intel Core i5-2410M 2.3GHz
HD Graphics 3000
21 22 23 [X] no model Intel Core i7-2600K 3.4GHz
HD Graphics 3000
31.4 ~ 18 fps
58%
HD Graphics 3000:
7 7 8 9 10 10 10 10.1 10.2 10.6 11 [X] no model Intel Core i7-2820QM 2.3GHz
HD Graphics 3000
11 11 11 12 [X] no model Intel Core i5-2500K 3.3GHz
HD Graphics 3000
12 [X] MSI CX640-i547W7P Intel Core i5-2410M 2.3GHz
HD Graphics 3000
12 13 13 13.1 [X] Asus N53SV HD3000 Intel Core i7-2720QM 2.2GHz
HD Graphics 3000
14 15 [X] no model Intel Core i7-2600K 3.4GHz
HD Graphics 3000
21.8 ~ 11 fps
80%
HD Graphics 3000:
5 7 [X] MSI CX640-i547W7P Intel Core i5-2410M 2.3GHz
HD Graphics 3000
7 8 [X] no model Intel Core i7-2600K 3.4GHz
HD Graphics 3000
8 8 8.8 9 [X] no model Intel Core i5-2500K 3.3GHz
HD Graphics 3000
~ 8 fps
HD Graphics 3000:
2.7 [X] Acer Aspire 3830TG-6431 Intel Core i5-2410M 2.3GHz
HD Graphics 3000
fps
100%
HD Graphics 4400:
34 [X] Fujitsu LifeBook U904 M0010PL Intel Core i7-4600U 2.1GHz
HD Graphics 4400
35.5 [X] Lenovo ThinkPad T440 20B6A002PB Intel Core i5-4200U 1.6GHz
HD Graphics 4400
36 ~ 35 fps
66%
HD Graphics 3000:
18.2 [X] Asus K53E-SX058V Intel Core i3-2310M 2.1GHz
HD Graphics 3000
19.4 [X] Samsung 400B2B-H01PL Intel Core i5-2410M 2.3GHz
HD Graphics 3000
21.1 [X] Fujitsu LifeBook P771 (VFY:P7710MF011PL) Intel Core i7-2617M 1.5GHz
HD Graphics 3000
24 25 [X] no model Intel Core i5-2500K 3.3GHz
HD Graphics 3000
26 [X] no model Intel Core i7-2820QM 2.3GHz
HD Graphics 3000
30.3 [X] Schenker XMG A501 Intel Core i7-2630QM 2GHz
HD Graphics 3000
~ 23 fps
100%
HD Graphics 4400:
16.7 18.2 [X] Lenovo ThinkPad T440 20B6A002PB Intel Core i5-4200U 1.6GHz
HD Graphics 4400
22.6 22.7 [X] Fujitsu LifeBook U904 M0010PL Intel Core i7-4600U 2.1GHz
HD Graphics 4400
~ 20 fps
60%
HD Graphics 3000:
11 12 [X] no model Intel Core i5-2500K 3.3GHz
HD Graphics 3000
13 [X] no model Intel Core i7-2820QM 2.3GHz
HD Graphics 3000
~ 12 fps
100%
HD Graphics 4400:
9.6 [X] Fujitsu LifeBook U904 M0010PL Intel Core i7-4600U 2.1GHz
HD Graphics 4400
11.5 [X] Lenovo ThinkPad T440 20B6A002PB Intel Core i5-4200U 1.6GHz
HD Graphics 4400
12.3 ~ 11 fps
100%
HD Graphics 4400:
3.8 [X] Fujitsu LifeBook U904 M0010PL Intel Core i7-4600U 2.1GHz
HD Graphics 4400
6.3 ~ 5 fps
HD Graphics 3000:
31.1 39 [X] Acer Aspire 3830TG-6431 Intel Core i5-2410M 2.3GHz
HD Graphics 3000
41 [X] Alienware M18x Intel Core i7-2920XM @4GHz
HD Graphics 3000
~ 37 fps
HD Graphics 3000:
12.4 16.3 [X] Acer Aspire 3830TG-6431 Intel Core i5-2410M 2.3GHz
HD Graphics 3000
16.6 [X] Alienware M18x Intel Core i7-2920XM @4GHz
HD Graphics 3000
~ 15 fps
100%
HD Graphics 4400:
54 fps
61%
HD Graphics 3000:
12.1 28 34 [X] no model Intel Core i5-2500K 3.3GHz
HD Graphics 3000
34 [X] MSI CX640-i547W7P Intel Core i5-2410M 2.3GHz
HD Graphics 3000
38 41 [X] no model Intel Core i7-2820QM 2.3GHz
HD Graphics 3000
44 [X] no model Intel Core i7-2600K 3.4GHz
HD Graphics 3000
~ 33 fps
100%
HD Graphics 4400:
41 fps
44%
HD Graphics 3000:
7.6 14.6 18 22 [X] no model Intel Core i7-2820QM 2.3GHz
HD Graphics 3000
22 [X] MSI CX640-i547W7P Intel Core i5-2410M 2.3GHz
HD Graphics 3000
25.4 [X] Asus N53SV HD3000 Intel Core i7-2720QM 2.2GHz
HD Graphics 3000
~ 18 fps
100%
HD Graphics 4400:
26 fps
46%
HD Graphics 3000:
4.6 10.5 14 [X] no model Intel Core i7-2820QM 2.3GHz
HD Graphics 3000
14 [X] MSI CX640-i547W7P Intel Core i5-2410M 2.3GHz
HD Graphics 3000
15.5 [X] Asus N53SV HD3000 Intel Core i7-2720QM 2.2GHz
HD Graphics 3000
~ 12 fps
HD Graphics 3000:
5 [X] no model Intel Core i5-2500K 3.3GHz
HD Graphics 3000
6 [X] MSI CX640-i547W7P Intel Core i5-2410M 2.3GHz
HD Graphics 3000
~ 6 fps
HD Graphics 3000:
55 [X] no model Intel Core i5-2500K 3.3GHz
HD Graphics 3000
61.7 [X] Asus N53SV HD3000 Intel Core i7-2720QM 2.2GHz
HD Graphics 3000
~ 58 fps
HD Graphics 3000:
16 [X] no model Intel Core i5-2500K 3.3GHz
HD Graphics 3000
fps
HD Graphics 3000:
12 [X] no model Intel Core i5-2500K 3.3GHz
HD Graphics 3000
fps
100%
HD Graphics 4400:
48.4 fps
79%
HD Graphics 3000:
19.5 [X] MSI CR640-048XPL Intel Core i3-2310M 2.1GHz
HD Graphics 3000
25.4 [X] Lenovo ThinkPad Edge E420s NWD2QPB Intel Core i3-2310M 2.1GHz
HD Graphics 3000
30 [X] Asus K53E-SX058V Intel Core i3-2310M 2.1GHz
HD Graphics 3000
31.1 [X] Dell Inspiron N411z (C0425821) Intel Core i3-2330M 2.2GHz
HD Graphics 3000
37.7 [X] HP ProBook 6360b LG632EA Intel Core i5-2410M 2.3GHz
HD Graphics 3000
37.9 [X] Fujitsu LifeBook P771 (VFY:P7710MF011PL) Intel Core i7-2617M 1.5GHz
HD Graphics 3000
38 39 [X] Asus B33E PL Intel Core i7-2620M 2.7GHz
HD Graphics 3000
39.5 57 [X] no model Intel Core i5-2500K 3.3GHz
HD Graphics 3000
60 [X] no model Intel Core i7-2820QM 2.3GHz
HD Graphics 3000
~ 38 fps
100%
HD Graphics 4400:
18.4 fps
87%
HD Graphics 3000:
9.7 [X] MSI CR640-048XPL Intel Core i3-2310M 2.1GHz
HD Graphics 3000
14.9 [X] Dell Inspiron N411z (C0425821) Intel Core i3-2330M 2.2GHz
HD Graphics 3000
15 [X] HP ProBook 6360b LG632EA Intel Core i5-2410M 2.3GHz
HD Graphics 3000
15.7 [X] Asus K53E-SX058V Intel Core i3-2310M 2.1GHz
HD Graphics 3000
16 16.1 [X] Fujitsu LifeBook P771 (VFY:P7710MF011PL) Intel Core i7-2617M 1.5GHz
HD Graphics 3000
16.3 [X] Lenovo ThinkPad Edge E420s NWD2QPB Intel Core i3-2310M 2.1GHz
HD Graphics 3000
17.4 18.4 [X] Asus B33E PL Intel Core i7-2620M 2.7GHz
HD Graphics 3000
19 [X] no model Intel Core i5-2500K 3.3GHz
HD Graphics 3000
22 [X] no model Intel Core i7-2820QM 2.3GHz
HD Graphics 3000
~ 16 fps
HD Graphics 3000:
7.7 [X] MSI CR640-048XPL Intel Core i3-2310M 2.1GHz
HD Graphics 3000
9.7 [X] HP ProBook 6360b LG632EA Intel Core i5-2410M 2.3GHz
HD Graphics 3000
10.1 [X] Dell Inspiron N411z (C0425821) Intel Core i3-2330M 2.2GHz
HD Graphics 3000
12.3 [X] Asus B33E PL Intel Core i7-2620M 2.7GHz
HD Graphics 3000
14 [X] no model Intel Core i5-2500K 3.3GHz
HD Graphics 3000
~ 11 fps
100%
HD Graphics 4400:
45.8 fps
120%
HD Graphics 3000:
37 40.6 [X] Asus U30SD-XA1 Intel HD 3000 Intel Core i5-2410M 2.3GHz
HD Graphics 3000
48.7 50.7 58.4 [X] Asus N53SV HD3000 Intel Core i7-2720QM 2.2GHz
HD Graphics 3000
60.5 [X] no model Intel Core i7-2820QM 2.3GHz
HD Graphics 3000
71.1 [X] no model Intel Core i7-2600K 3.4GHz
HD Graphics 3000
72.1 [X] no model Intel Core i5-2500K 3.3GHz
HD Graphics 3000
~ 55 fps
100%
HD Graphics 4400:
17.8 fps
107%
HD Graphics 3000:
14.7 15.3 [X] Asus U30SD-XA1 Intel HD 3000 Intel Core i5-2410M 2.3GHz
HD Graphics 3000
15.9 20.2 20.8 [X] no model Intel Core i7-2820QM 2.3GHz
HD Graphics 3000
20.9 [X] Asus N53SV HD3000 Intel Core i7-2720QM 2.2GHz
HD Graphics 3000
21.6 [X] no model Intel Core i5-2500K 3.3GHz
HD Graphics 3000
23.4 [X] no model Intel Core i7-2600K 3.4GHz
HD Graphics 3000
~ 19 fps
HD Graphics 3000:
5.7 [X] Asus U30SD-XA1 Intel HD 3000 Intel Core i5-2410M 2.3GHz
HD Graphics 3000
7.8 8.4 9.5 [X] no model Intel Core i5-2500K 3.3GHz
HD Graphics 3000
10 [X] no model Intel Core i7-2820QM 2.3GHz
HD Graphics 3000
10.8 [X] no model Intel Core i7-2600K 3.4GHz
HD Graphics 3000
~ 9 fps
100%
HD Graphics 4400:
45.1 fps
71%
HD Graphics 3000:
24.9 [X] HP ProBook 6360b LG632EA Intel Core i5-2410M 2.3GHz
HD Graphics 3000
33.8 [X] MSI CR640-048XPL Intel Core i3-2310M 2.1GHz
HD Graphics 3000
37.1 [X] Asus N53SV HD3000 Intel Core i7-2720QM 2.2GHz
HD Graphics 3000
~ 32 fps
100%
HD Graphics 4400:
20.3 fps
84%
HD Graphics 3000:
11.5 [X] HP ProBook 6360b LG632EA Intel Core i5-2410M 2.3GHz
HD Graphics 3000
14.9 [X] MSI CR640-048XPL Intel Core i3-2310M 2.1GHz
HD Graphics 3000
23.6 [X] Asus N53SV HD3000 Intel Core i7-2720QM 2.2GHz
HD Graphics 3000
~ 17 fps
HD Graphics 3000:
8.7 [X] HP ProBook 6360b LG632EA Intel Core i5-2410M 2.3GHz
HD Graphics 3000
9.3 [X] MSI CR640-048XPL Intel Core i3-2310M 2.1GHz
HD Graphics 3000
19.4 [X] Asus N53SV HD3000 Intel Core i7-2720QM 2.2GHz
HD Graphics 3000
~ 12 fps
HD Graphics 3000:
18.7 [X] MSI CR640-048XPL Intel Core i3-2310M 2.1GHz
HD Graphics 3000
19.7 [X] Toshiba Satellite Pro R850-122 Intel Core i3-2310M 2.1GHz
HD Graphics 3000
21.2 [X] HP ProBook 6360b LG632EA Intel Core i5-2410M 2.3GHz
HD Graphics 3000
22.4 [X] Samsung 350U2A-A01PL Intel Core i3-2357M 1.3GHz
HD Graphics 3000
28.7 [X] Asus K53E-SX058V Intel Core i3-2310M 2.1GHz
HD Graphics 3000
29.7 [X] Fujitsu LifeBook P771 (VFY:P7710MF011PL) Intel Core i7-2617M 1.5GHz
HD Graphics 3000
31.4 [X] Lenovo ThinkPad Edge E420s NWD2QPB Intel Core i3-2310M 2.1GHz
HD Graphics 3000
32.9 [X] Asus Zenbook UX21E-KX004V Intel Core i5-2467M 1.6GHz
HD Graphics 3000
33.4 [X] HP Folio 13 (B0N00AA) Intel Core i5-2467M 1.6GHz
HD Graphics 3000
34.2 [X] Samsung 400B2B-H01PL Intel Core i5-2410M 2.3GHz
HD Graphics 3000
34.5 [X] HP ProBook 4340s (B6M41EA) Intel Core i3-2370M 2.4GHz
HD Graphics 3000
35.4 38.2 [X] no model Intel Core i5-2500K 3.3GHz
HD Graphics 3000
38.7 [X] Samsung QX311-A01PL Intel Core i5-2410M 2.3GHz
HD Graphics 3000
40.9 [X] no model Intel Core i7-2820QM 2.3GHz
HD Graphics 3000
45.1 [X] no model Intel Core i7-2600K 3.4GHz
HD Graphics 3000
~ 32 fps
HD Graphics 3000:
13.3 [X] Samsung 350U2A-A01PL Intel Core i3-2357M 1.3GHz
HD Graphics 3000
16 [X] MSI CR640-048XPL Intel Core i3-2310M 2.1GHz
HD Graphics 3000
16.6 [X] Toshiba Satellite Pro R850-122 Intel Core i3-2310M 2.1GHz
HD Graphics 3000
17.8 [X] HP ProBook 6360b LG632EA Intel Core i5-2410M 2.3GHz
HD Graphics 3000
19.2 [X] Asus K53E-SX058V Intel Core i3-2310M 2.1GHz
HD Graphics 3000
19.6 [X] Lenovo ThinkPad Edge E420s NWD2QPB Intel Core i3-2310M 2.1GHz
HD Graphics 3000
19.8 [X] Fujitsu LifeBook P771 (VFY:P7710MF011PL) Intel Core i7-2617M 1.5GHz
HD Graphics 3000
21.1 21.7 [X] Samsung 400B2B-H01PL Intel Core i5-2410M 2.3GHz
HD Graphics 3000
21.7 [X] HP Folio 13 (B0N00AA) Intel Core i5-2467M 1.6GHz
HD Graphics 3000
22.2 [X] Asus Zenbook UX21E-KX004V Intel Core i5-2467M 1.6GHz
HD Graphics 3000
24.1 [X] Samsung QX311-A01PL Intel Core i5-2410M 2.3GHz
HD Graphics 3000
24.2 [X] Dell Vostro 3450 (Vostro0150) Intel Core i3-2310M 2.1GHz
HD Graphics 3000
24.2 [X] HP ProBook 4340s (B6M41EA) Intel Core i3-2370M 2.4GHz
HD Graphics 3000
26.2 [X] no model Intel Core i5-2500K 3.3GHz
HD Graphics 3000
30 [X] no model Intel Core i7-2600K 3.4GHz
HD Graphics 3000
30.6 [X] no model Intel Core i7-2820QM 2.3GHz
HD Graphics 3000
~ 22 fps
HD Graphics 3000:
12.7 [X] MSI CR640-048XPL Intel Core i3-2310M 2.1GHz
HD Graphics 3000
12.7 [X] HP Folio 13 (B0N00AA) Intel Core i5-2467M 1.6GHz
HD Graphics 3000
12.7 [X] HP ProBook 4340s (B6M41EA) Intel Core i3-2370M 2.4GHz
HD Graphics 3000
12.8 13.2 [X] Toshiba Satellite Pro R850-122 Intel Core i3-2310M 2.1GHz
HD Graphics 3000
13.6 [X] HP ProBook 6360b LG632EA Intel Core i5-2410M 2.3GHz
HD Graphics 3000
14.5 [X] Asus K53E-SX058V Intel Core i3-2310M 2.1GHz
HD Graphics 3000
15.9 [X] no model Intel Core i5-2500K 3.3GHz
HD Graphics 3000
17.7 [X] no model Intel Core i7-2820QM 2.3GHz
HD Graphics 3000
18.8 [X] no model Intel Core i7-2600K 3.4GHz
HD Graphics 3000
~ 14 fps
HD Graphics 3000:
12.7 [X] no model Intel Core i5-2500K 3.3GHz
HD Graphics 3000
12.7 [X] no model Intel Core i7-2600K 3.4GHz
HD Graphics 3000
12.7 [X] no model Intel Core i7-2820QM 2.3GHz
HD Graphics 3000
~ 13 fps
100%
HD Graphics 4400:
96 fps
52%
HD Graphics 3000:
37.6 [X] Samsung 350U2A-A01PL Intel Core i3-2357M 1.3GHz
HD Graphics 3000
40 [X] no model Intel Core i5-2500K 3.3GHz
HD Graphics 3000
45.7 [X] Asus N53SV HD3000 Intel Core i7-2720QM 2.2GHz
HD Graphics 3000
45.9 [X] Lenovo ThinkPad Edge E420s NWD2QPB Intel Core i3-2310M 2.1GHz
HD Graphics 3000
46.3 [X] Chiligreen Platin TS Intel Core i3-2330M 2.2GHz
HD Graphics 3000
51.2 [X] Asus K53E-SX058V Intel Core i3-2310M 2.1GHz
HD Graphics 3000
53.1 [X] Samsung 400B2B-H01PL Intel Core i5-2410M 2.3GHz
HD Graphics 3000
58.6 [X] HP Folio 13 (B0N00AA) Intel Core i5-2467M 1.6GHz
HD Graphics 3000
70.5 [X] Fujitsu LifeBook P771 (VFY:P7710MF011PL) Intel Core i7-2617M 1.5GHz
HD Graphics 3000
~ 50 fps
100%
HD Graphics 4400:
18 fps
50%
HD Graphics 3000:
7 [X] no model Intel Core i5-2500K 3.3GHz
HD Graphics 3000
7.2 [X] Fujitsu LifeBook P771 (VFY:P7710MF011PL) Intel Core i7-2617M 1.5GHz
HD Graphics 3000
8.8 [X] Asus N53SV HD3000 Intel Core i7-2720QM 2.2GHz
HD Graphics 3000
9.3 [X] HP Folio 13 (B0N00AA) Intel Core i5-2467M 1.6GHz
HD Graphics 3000
10.3 [X] Samsung 400B2B-H01PL Intel Core i5-2410M 2.3GHz
HD Graphics 3000
~ 9 fps
HD Graphics 3000:
3 (!) [X] Alienware M18x Intel Core i7-2920XM @4GHz
HD Graphics 3000
fps
100%
HD Graphics 4400:
222 fps
49%
HD Graphics 3000:
63 93 111 164 [X] no model Intel Core i5-2500K 3.3GHz
HD Graphics 3000
~ 108 fps
100%
HD Graphics 4400:
31.8 fps
110%
HD Graphics 3000:
25.9 33 [X] no model Intel Core i5-2500K 3.3GHz
HD Graphics 3000
38 45 ~ 35 fps
HD Graphics 3000:
18 [X] no model Intel Core i5-2500K 3.3GHz
HD Graphics 3000
23 ~ 21 fps
HD Graphics 3000:
59.4 84 [X] no model Intel Core i7-2820QM 2.3GHz
HD Graphics 3000
~ 72 fps
HD Graphics 3000:
18.1 32 [X] no model Intel Core i7-2820QM 2.3GHz
HD Graphics 3000
~ 25 fps
HD Graphics 3000:
11.2 fps
HD Graphics 3000:
-1 [X] no model Intel Core i5-2500K 3.3GHz
HD Graphics 3000
-1 ~ -1 fps
HD Graphics 3000:
117.1 [X] Asus N53SV HD3000 Intel Core i7-2720QM 2.2GHz
HD Graphics 3000
fps
HD Graphics 3000:
55 [X] no model Intel Core i7-2820QM 2.3GHz
HD Graphics 3000
69.3 [X] Asus N53SV HD3000 Intel Core i7-2720QM 2.2GHz
HD Graphics 3000
72 [X] no model Intel Core i7-2600K 3.4GHz
HD Graphics 3000
~ 65 fps
HD Graphics 3000:
62.7 [X] Asus N53SV HD3000 Intel Core i7-2720QM 2.2GHz
HD Graphics 3000
fps
HD Graphics 3000:
18.8 [X] Asus N53SV HD3000 Intel Core i7-2720QM 2.2GHz
HD Graphics 3000
fps
HD Graphics 3000:
25.7 31.8 35.5 [X] Toshiba Satellite Pro R850-122 Intel Core i3-2310M 2.1GHz
HD Graphics 3000
~ 31 fps
HD Graphics 3000:
21.6 [X] Toshiba Satellite Pro R850-122 Intel Core i3-2310M 2.1GHz
HD Graphics 3000
22.3 26.1 ~ 23 fps
100%
HD Graphics 4400:
122 fps
99%
HD Graphics 3000:
99 125 127 127 128 [X] MSI CX640-i547W7P Intel Core i5-2410M 2.3GHz
HD Graphics 3000
~ 121 fps
100%
HD Graphics 4400:
44 fps
89%
HD Graphics 3000:
21.2 36.6 41 [X] MSI CX640-i547W7P Intel Core i5-2410M 2.3GHz
HD Graphics 3000
42 42 49.5 [X] no model Intel Core i5-2500K 3.3GHz
HD Graphics 3000
~ 39 fps
HD Graphics 3000:
11 (!) [X] Toshiba Portégé Z830-10N Intel Core i3-2367M 1.4GHz
HD Graphics 3000
13 [X] MSI CX640-i547W7P Intel Core i5-2410M 2.3GHz
HD Graphics 3000
14.2 [X] no model Intel Core i5-2500K 3.3GHz
HD Graphics 3000
~ 13 fps
HD Graphics 3000:
62.3 [X] MSI CR640-048XPL Intel Core i3-2310M 2.1GHz
HD Graphics 3000
63.2 [X] Toshiba Satellite Pro R850-122 Intel Core i3-2310M 2.1GHz
HD Graphics 3000
83 [X] no model Intel Core i5-2500K 3.3GHz
HD Graphics 3000
~ 70 fps
HD Graphics 3000:
30.4 [X] MSI CR640-048XPL Intel Core i3-2310M 2.1GHz
HD Graphics 3000
30.6 [X] Toshiba Satellite Pro R850-122 Intel Core i3-2310M 2.1GHz
HD Graphics 3000
35 [X] no model Intel Core i5-2500K 3.3GHz
HD Graphics 3000
~ 32 fps
HD Graphics 3000:
12 [X] no model Intel Core i5-2500K 3.3GHz
HD Graphics 3000
fps
HD Graphics 3000:
16.9 19 28.2 34.7 [X] no model Intel Core i7-2820QM 2.3GHz
HD Graphics 3000
38.1 54.9 [X] no model Intel Core i5-2500K 3.3GHz
HD Graphics 3000
~ 32 fps
HD Graphics 3000:
5.1 11.1 13 18.5 [X] no model Intel Core i5-2500K 3.3GHz
HD Graphics 3000
~ 12 fps
100%
HD Graphics 4400:
21 42.5 ~ 32 fps
113%
HD Graphics 3000:
24.8 35 [X] MSI CX640-i547W7P Intel Core i5-2410M 2.3GHz
HD Graphics 3000
35.3 42.2 [X] no model Intel Core i7-2820QM 2.3GHz
HD Graphics 3000
44 [X] no model Intel Core i5-2500K 3.3GHz
HD Graphics 3000
~ 36 fps
100%
HD Graphics 4400:
23.7 fps
80%
HD Graphics 3000:
17 [X] MSI CX640-i547W7P Intel Core i5-2410M 2.3GHz
HD Graphics 3000
17.4 18 [X] no model Intel Core i7-2820QM 2.3GHz
HD Graphics 3000
24.8 [X] no model Intel Core i5-2500K 3.3GHz
HD Graphics 3000
~ 19 fps
HD Graphics 3000:
10.6 11.6 [X] no model Intel Core i5-2500K 3.3GHz
HD Graphics 3000
12 [X] MSI CX640-i547W7P Intel Core i5-2410M 2.3GHz
HD Graphics 3000
~ 11 fps
HD Graphics 3000:
3.1 [X] no model Intel Core i5-2500K 3.3GHz
HD Graphics 3000
fps
100%
HD Graphics 4400:
37.9 fps
92%
HD Graphics 3000:
26 34.2 36 [X] MSI CX640-i547W7P Intel Core i5-2410M 2.3GHz
HD Graphics 3000
44.1 [X] no model Intel Core i7-2820QM 2.3GHz
HD Graphics 3000
~ 35 fps
100%
HD Graphics 4400:
19.9 fps
80%
HD Graphics 3000:
15 [X] MSI CX640-i547W7P Intel Core i5-2410M 2.3GHz
HD Graphics 3000
15.6 [X] no model Intel Core i7-2820QM 2.3GHz
HD Graphics 3000
16.2 ~ 16 fps
HD Graphics 3000:
9.4 11 [X] MSI CX640-i547W7P Intel Core i5-2410M 2.3GHz
HD Graphics 3000
~ 10 fps
HD Graphics 3000:
33 40 41 69 [X] MSI CX640-i547W7P Intel Core i5-2410M 2.3GHz
HD Graphics 3000
71 88 [X] no model Intel Core i7-2820QM 2.3GHz
HD Graphics 3000
~ 57 fps
HD Graphics 3000:
11 12 14 22 26 [X] MSI CX640-i547W7P Intel Core i5-2410M 2.3GHz
HD Graphics 3000
32 [X] no model Intel Core i7-2820QM 2.3GHz
HD Graphics 3000
~ 20 fps
HD Graphics 3000:
4 9 10 11 [X] MSI CX640-i547W7P Intel Core i5-2410M 2.3GHz
HD Graphics 3000
14 [X] no model Intel Core i7-2820QM 2.3GHz
HD Graphics 3000
~ 10 fps
HD Graphics 3000:
4 [X] no model Intel Core i7-2820QM 2.3GHz
HD Graphics 3000
4 [X] MSI CX640-i547W7P Intel Core i5-2410M 2.3GHz
HD Graphics 3000
4 ~ 4 fps
HD Graphics 3000:
9.1 [X] Toshiba Satellite Pro R850-122 Intel Core i3-2310M 2.1GHz
HD Graphics 3000
10 ~ 10 fps
HD Graphics 3000:
107 [X] MSI CX640-i547W7P Intel Core i5-2410M 2.3GHz
HD Graphics 3000
123 [X] no model Intel Core i7-2820QM 2.3GHz
HD Graphics 3000
140.5 [X] no model Intel Core i5-2500K 3.3GHz
HD Graphics 3000
~ 124 fps
HD Graphics 3000:
49 [X] no model Intel Core i5-2500K 3.3GHz
HD Graphics 3000
fps
60%
HD Graphics 3000:
61 73 93 103 [X] MSI CX640-i547W7P Intel Core i5-2410M 2.3GHz
HD Graphics 3000
125 129 [X] no model Intel Core i7-2820QM 2.3GHz
HD Graphics 3000
~ 97 fps
56%
HD Graphics 3000:
32 39 [X] MSI CX640-i547W7P Intel Core i5-2410M 2.3GHz
HD Graphics 3000
47 48 [X] no model Intel Core i7-2820QM 2.3GHz
HD Graphics 3000
58 74 ~ 50 fps
45%
HD Graphics 3000:
6 8 12 [X] MSI CX640-i547W7P Intel Core i5-2410M 2.3GHz
HD Graphics 3000
12 13 [X] no model Intel Core i7-2820QM 2.3GHz
HD Graphics 3000
~ 10 fps
100%
HD Graphics 4400:
7 8 9 9 11 ~ 9 fps
67%
HD Graphics 3000:
6 fps
HD Graphics 3000:
75 110 [X] no model Intel Core i7-2820QM 2.3GHz
HD Graphics 3000
~ 93 fps
HD Graphics 3000:
23.5 fps
HD Graphics 3000:
22 37.6 46.8 [X] no model Intel Core i7-2820QM 2.3GHz
HD Graphics 3000
48.6 [X] no model Intel Core i5-2500K 3.3GHz
HD Graphics 3000
~ 39 fps
HD Graphics 3000:
203 241.7 [X] no model Intel Core i7-2820QM 2.3GHz
HD Graphics 3000
~ 222 fps
Average Gaming Intel HD Graphics 4400 → 100% Average Gaming 30-70 fps → 100%
Average Gaming Intel HD Graphics 3000 → 71% Average Gaming 30-70 fps → 80%
For more games that might be playable and a list of all games and graphics cards visit our Gaming List
v1.26
log 19. 06:08:08
#0 checking url part for id 4575 +0s ... 0s
#1 checking url part for id 1956 +0s ... 0s
#2 not redirecting to Ajax server +0s ... 0s
#3 did not recreate cache, as it is less than 5 days old! Created at Fri, 19 Apr 2024 05:40:26 +0200 +0.001s ... 0.001s
#4 composed specs +0.097s ... 0.098s
#5 did output specs +0s ... 0.099s
#6 start showIntegratedCPUs +0s ... 0.099s
#7 getting avg benchmarks for device 4575 +0.076s ... 0.175s
#8 got single benchmarks 4575 +0.302s ... 0.477s
#9 getting avg benchmarks for device 1956 +0.004s ... 0.48s
#10 got single benchmarks 1956 +0.511s ... 0.992s
#11 got avg benchmarks for devices +0s ... 0.992s
#12 No cached benchmark found, getting uncached values +0.476s ... 1.468s
#13 min, max, avg, median took s +0.022s ... 1.49s
#14 before gaming benchmark output +0s ... 1.49s
#15 Got 2336 rows for game benchmarks. +0.202s ... 1.692s
#16 composed SQL query for gamebenchmarks +0s ... 1.692s
#17 got data and put it in $dataArray +0.135s ... 1.827s
#18 benchmarks composed for output. +0.494s ... 2.321s
#19 calculated avg scores. +0s ... 2.321s
#20 return log +0.049s ... 2.37s
Please share our article, every link counts!
Redaktion, 2017-09- 8 (Update: 2023-07- 1)
 Deutsch
 English
 Español
 Français
 Italiano
 Nederlands
 Polski
 Português
 Русский
 Türkçe
 Svenska
 Chinese
 Magyar