Microsoft Surface Book (Core i7, 940M) Convertible Review
For the original German review, see here.
We had a chance to review the Microsoft Surface Book (Core i5, 940M) in the beginning of November 2015. The author was impressed by the unusual design, but there were some points of criticism. This included the rather mediocre runtime and the high heat development – also at the keyboard with the GeForce GPU. Can the super-expensive i7 version with a 512 GB SSD change that?
The other issues can hardly be improved since the ports are obviously identical and the 13.5-inch device is also thick as well as heavy. The positive aspects apply as well, like the sophisticated chassis made of a magnesium alloy, the high display resolution and the comfortable input devices.
This update will only cover the performance sections: Is the Wi-Fi runtime shorter or longer with the Core i7? Can the latter utilize its full performance without throttling on battery like the i5 model? Does it consume more power and is there even more heat? You will find the answers in the following article. All the other information is available in the review of the Surface Book (Core i5, 940M).
Display
We once again measured the 3000x2000 pixels and could not find any significant differences. The deviations are within measuring tolerances. The big advantage of the panel is once again the extremely high luminance, which is not reduced on battery power. A high contrast and the DeltaE below 3.0 (without calibration) support the impression of a high-end display.
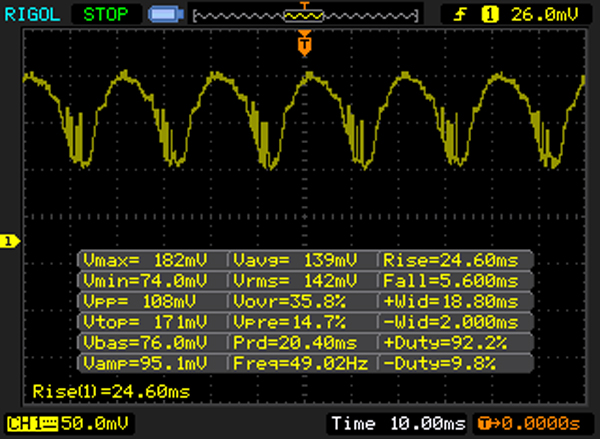
The unnoticeable brightness fluctuations determined by our oscilloscope do not affect that. We therefore performed our PWM and reaction times measurements without the attached power adaptor.
| |||||||||||||||||||||||||
Brightness Distribution: 88 %
Center on Battery: 438 cd/m²
Contrast: 1752:1 (Black: 0.25 cd/m²)
ΔE ColorChecker Calman: 2.06 | ∀{0.5-29.43 Ø4.73}
ΔE Greyscale Calman: 2.87 | ∀{0.09-98 Ø4.97}
96% sRGB (Argyll 1.6.3 3D)
64% AdobeRGB 1998 (Argyll 1.6.3 3D)
68% AdobeRGB 1998 (Argyll 3D)
96% sRGB (Argyll 3D)
66.3% Display P3 (Argyll 3D)
Gamma: 2.44
CCT: 6820 K
| Microsoft Surface Book Core i7 13.5", 3000x2000 | Apple MacBook Pro Retina 13 inch 2015-03 13.3", 2560x1600 | Toshiba KIRA-10D 13.3", 1920x1080 | Microsoft Surface Pro 4, Core i5, 128GB 12.3", 2736x1824 | Dell XPS 13 9343 Core i7 13.3", 3200x1800 | HP Spectre x360 13-4104ng 13.3", 2560x1440 | HP Spectre x2 12-a003ng K3D42EA 12", 1920x1080 | |
|---|---|---|---|---|---|---|---|
| Display | -0% | 3% | -1% | -6% | -1% | -23% | |
| Display P3 Coverage (%) | 66.3 | 65.9 -1% | 69.1 4% | 65 -2% | 62.6 -6% | 66.8 1% | 52.9 -20% |
| sRGB Coverage (%) | 96 | 97 1% | 98.2 2% | 96.5 1% | 89.8 -6% | 92.8 -3% | 71.8 -25% |
| AdobeRGB 1998 Coverage (%) | 68 | 67.4 -1% | 71 4% | 67 -1% | 64.2 -6% | 67.3 -1% | 52.6 -23% |
| Response Times | -5% | 41% | 2% | ||||
| Response Time Grey 50% / Grey 80% * (ms) | 39 ? | 46 ? -18% | 24 ? 38% | 47 ? -21% | |||
| Response Time Black / White * (ms) | 34 ? | 31.2 ? 8% | 19 ? 44% | 26 ? 24% | |||
| PWM Frequency (Hz) | 50 ? | ||||||
| Screen | -9% | -11% | -20% | -28% | -34% | -59% | |
| Brightness middle (cd/m²) | 438 | 361 -18% | 334 -24% | 413 -6% | 232 -47% | 324 -26% | 353 -19% |
| Brightness (cd/m²) | 414 | 342 -17% | 316 -24% | 396 -4% | 231 -44% | 324 -22% | 347 -16% |
| Brightness Distribution (%) | 88 | 81 -8% | 92 5% | 87 -1% | 82 -7% | 90 2% | 91 3% |
| Black Level * (cd/m²) | 0.25 | 0.361 -44% | 0.29 -16% | 0.36 -44% | 0.25 -0% | 0.34 -36% | 0.44 -76% |
| Contrast (:1) | 1752 | 1000 -43% | 1152 -34% | 1147 -35% | 928 -47% | 953 -46% | 802 -54% |
| Colorchecker dE 2000 * | 2.06 | 1.82 12% | 2.27 -10% | 3.09 -50% | 3.63 -76% | 4.36 -112% | 6.09 -196% |
| Greyscale dE 2000 * | 2.87 | 1.8 37% | 2.47 14% | 3.92 -37% | 2.57 10% | 4.62 -61% | 6.24 -117% |
| Gamma | 2.44 90% | 2.49 88% | 2.36 93% | 2.3 96% | 2.17 101% | 2.18 101% | 2.41 91% |
| CCT | 6820 95% | 6417 101% | 6872 95% | 7333 89% | 6422 101% | 6857 95% | 7238 90% |
| Color Space (Percent of AdobeRGB 1998) (%) | 64 | 61.9 -3% | 64 0% | 61 -5% | 58 -9% | 60 -6% | 46 -28% |
| Color Space (Percent of sRGB) (%) | 96 | 96.9 1% | 97 1% | 93 -3% | 71 -26% | ||
| Colorchecker dE 2000 max. * | 3.26 | ||||||
| Total Average (Program / Settings) | -5% /
-7% | -4% /
-7% | -9% /
-14% | -17% /
-22% | 2% /
-17% | -27% /
-42% |
* ... smaller is better
Display Response Times
| ↔ Response Time Black to White | ||
|---|---|---|
| 34 ms ... rise ↗ and fall ↘ combined | ↗ 10 ms rise | 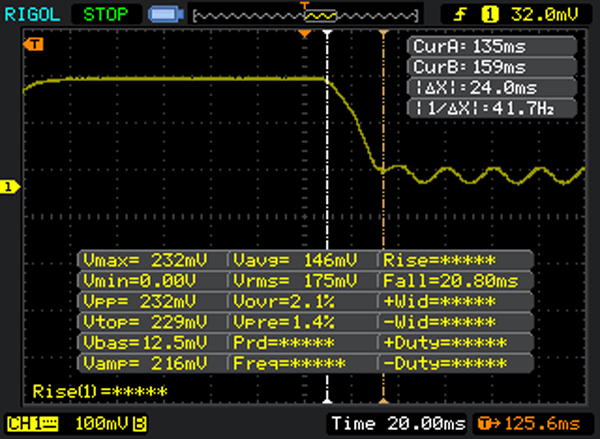 |
| ↘ 24 ms fall | ||
| The screen shows slow response rates in our tests and will be unsatisfactory for gamers. In comparison, all tested devices range from 0.1 (minimum) to 240 (maximum) ms. » 91 % of all devices are better. This means that the measured response time is worse than the average of all tested devices (19.9 ms). | ||
| ↔ Response Time 50% Grey to 80% Grey | ||
| 39 ms ... rise ↗ and fall ↘ combined | ↗ 24 ms rise | 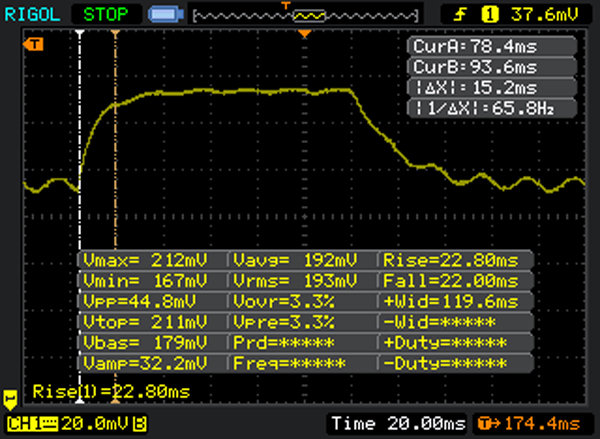 |
| ↘ 15 ms fall | ||
| The screen shows slow response rates in our tests and will be unsatisfactory for gamers. In comparison, all tested devices range from 0.165 (minimum) to 636 (maximum) ms. » 59 % of all devices are better. This means that the measured response time is worse than the average of all tested devices (31.1 ms). | ||
Screen Flickering / PWM (Pulse-Width Modulation)
| Screen flickering / PWM not detected | ||
In comparison: 52 % of all tested devices do not use PWM to dim the display. If PWM was detected, an average of 7798 (minimum: 5 - maximum: 343500) Hz was measured. | ||
Performance
Intel Core i7-6600U besides 512 GB SSD and 16 GB RAM (DDR4) – Microsoft charges a pretty hefty 2,900 Euros (~$3189) for that. Users can therefore expect high performance without compromises, but is this really the case?
Processor
The Core i7-6600U (2.6 GHz, Turbo 3.4 GHz) performs well in our benchmarks. The Surface Pro 4 Core i7 (6650U 2.2 GHz, Turbo 3.4 GHz) is coincidentally 2% faster in the Single and Multi-Core tests of CB R11.5 & 15. The Surface Book i5 falls behind, even though we are only talking about a disadvantage of 6 up to 12%, and the single performance, which is more relevant in practice, falls behind by 6/7%. You should therefore definitely get the i7 version if you want the highest possible performance in this form factor, but it is questionable whether the additional charge is worth it.
We can confirm one thing though: The i7-6600U can utilize its full Turbo Boost without any restrictions. This was also the case for the i5 version. This also applies for battery operation, where the R11.5 benchmark actually determined slightly higher scores (Single: 1.62 points, Multi: 3.73 points).
System Performance
The PCMarks do not rank the Book at the top in terms of application performance, but the sibling Microsoft Surface Pro 4 Core i7 with 11 and 15% more points, respectively. It seems the Surface Book cannot benefit from the 940M GPU at all in this case; the Accelerated scores do not seem to benefit from the hardware support of the GeForce, which was already the case for the i5 model. Our i7 model is only 2-5% ahead in PCMark 8. This is somewhat disappointing when you consider that there is twice the amount of RAM.
However, potential buyers should not overestimate the relevance of the PCMarks and have a look at some usage scenarios instead: Virtual machines will love the 16 GB model, video rendering via Quick Sync will hardly differ between i5/i7. The biggest difference will probably be the iGPU-only version. You can waive the docking GPU if you don't need the GeForce support and just get the entry-level model for 1,600 Euros (~$1759).
The Surface Book i7 is 30% faster than the rivals Lenovo Miix 700 (Core m3), HP Spectre X2 (Core m7) and Microsoft Surface Pro 3 (Haswell Core i5) in the Power Director Render test with Quick Sync. The performance advantage should be even bigger with tools like Adobe Creative Cloud, AutoCAD or Visual Studio that use the shaders of the GeForce GPU for complex calculations.
| PCMark 7 Score | 5178 points | |
| PCMark 8 Home Score Accelerated v2 | 2947 points | |
| PCMark 8 Creative Score Accelerated v2 | 3755 points | |
| PCMark 8 Work Score Accelerated v2 | 3782 points | |
Help | ||
Storage Devices
The PCIe-3.0 Samsung SSD (MZFLV512 V5MOQ) performs slightly better than the 256 GB model (MZFLV256) inside the Surface Book i5. However, we only have the AS SSD score for a comparison, where the 512 GB model is 12% ahead. This does not say much though; much more striking is the sequential write and the 4K-64 write result, where the review unit is almost 50% faster. We can therefore say that the write performance of the 512 GB model MZFLV512 is better.
More important than this detail is a look at the comparison: All the rivals including Apple, HP and Toshiba, get much lower scores with their SSDs. All Microsoft devices use the new NVMe interface, which is attached via PCI Express.
| Microsoft Surface Book Core i7 13.5", 3000x2000 | Microsoft Surface Book Core i5 13.5", 3000x2000 | Microsoft Surface Pro 4 Core i7 12.3", 2736x1824 | HP EliteBook Folio 1040 G2 14", 1920x1080 | Apple MacBook Pro Retina 13 inch 2015-03 13.3", 2560x1600 | Toshiba KIRA-10D 13.3", 1920x1080 | Dell XPS 13 9343 Core i7 13.3", 3200x1800 | HP Spectre x2 12-a003ng K3D42EA 12", 1920x1080 | |
|---|---|---|---|---|---|---|---|---|
| AS SSD | -14% | -15% | -50% | -29% | -47% | -48% | -60% | |
| Seq Read (MB/s) | 1342 | 1223 -9% | 1312 -2% | 480.7 -64% | 1233 -8% | 515 -62% | 515 -62% | 439.1 -67% |
| Seq Write (MB/s) | 545 | 275.2 -50% | 274.8 -50% | 250.1 -54% | 616 13% | 467.6 -14% | 233.4 -57% | 216.9 -60% |
| 4K Read (MB/s) | 37.25 | 34.31 -8% | 33.47 -10% | 25.98 -30% | 20.6 -45% | 21.74 -42% | 26.28 -29% | 23.12 -38% |
| 4K Write (MB/s) | 109 | 85 -22% | 89.2 -18% | 84.4 -23% | 30.2 -72% | 78.8 -28% | 91.7 -16% | 49.2 -55% |
| 4K-64 Read (MB/s) | 919 | 1409 53% | 1280 39% | 356.1 -61% | 891 -3% | 352.6 -62% | 359 -61% | 265.6 -71% |
| 4K-64 Write (MB/s) | 520 | 281.4 -46% | 268.7 -48% | 182.7 -65% | 221.2 -57% | 149.7 -71% | 181 -65% | 151.8 -71% |
| CrystalDiskMark 3.0 | -27% | -39% | -1% | -31% | -40% | -52% | ||
| Read Seq (MB/s) | 953 | 834 -12% | 499.9 -48% | 1403 47% | 530 -44% | 527 -45% | 410.1 -57% | |
| Write Seq (MB/s) | 592 | 304 -49% | 264.3 -55% | 657 11% | 474.3 -20% | 237.2 -60% | 316 -47% | |
| Read 512 (MB/s) | 520 | 396.7 -24% | 418.9 -19% | 810 56% | 426.1 -18% | 420.5 -19% | 260.8 -50% | |
| Write 512 (MB/s) | 591 | 304.3 -49% | 264.6 -55% | 648 10% | 445.8 -25% | 241.6 -59% | 241.6 -59% | |
| Read 4k (MB/s) | 42.66 | 40.75 -4% | 28.4 -33% | 20.95 -51% | 23.27 -45% | 28.29 -34% | 27.4 -36% | |
| Write 4k (MB/s) | 136.3 | 106.3 -22% | 101.2 -26% | 32.43 -76% | 90.1 -34% | 103.7 -24% | 53.5 -61% | |
| Total Average (Program / Settings) | -14% /
-14% | -21% /
-21% | -45% /
-44% | -15% /
-15% | -39% /
-39% | -44% /
-44% | -56% /
-56% |

GPU Performance
The Nvidia Maxwell GPU (940M, GDDR5) in the keyboard dock manages similar results compared to the Core i5 model with the same dedicated GPU. We also tested the iGPU HD Graphics 520 and the results are listed in the second column. The performance with the iGPU falls behind by around 50% in all sub-scores. The only exception is the Physics score, which uses the CPU cores. The i7 is usually ahead in this case. The graphics benchmarks of the i5 and i7 models are similar when you consider all relevant sub-scores. The iGPU is 37% slower in the synthetic benchmarks. The difference will be even bigger in games, which is confirmed by the review of the i5 model. The GeForce drivers are better optimized for games compared to their Intel counterparts.
The competitors with the integrated GPU do not really stand a chance; HD Graphics 5500, HD 520 or Iris Graphics 6100 fall behind by 30-45%. The slowest device is the Surface Pro 4 (Core m3) with HD Graphics 515.
More information about the GeForce 940m inside the Surface Book is available in our in-depth review of the i5 model, where we also evaluate the gaming performance.
| Microsoft Surface Book Core i7 13.5", 3000x2000 | Microsoft Surface Book i7 Heat Keyboard iGPU 13.5", 3000x2000 | Microsoft Surface Book Core i5 13.5", 3000x2000 | Microsoft Surface Pro 4, Core m3 12.3", 2736x1824 | Microsoft Surface Pro 4, Core i5, 128GB 12.3", 2736x1824 | Microsoft Surface Pro 4 Core i7 12.3", 2736x1824 | HP EliteBook Folio 1040 G2 14", 1920x1080 | Apple MacBook Pro Retina 13 inch 2015-03 13.3", 2560x1600 | Dell XPS 13 9343 Core i7 13.3", 3200x1800 | HP Spectre x2 12-a003ng K3D42EA 12", 1920x1080 | |
|---|---|---|---|---|---|---|---|---|---|---|
| 3DMark 11 | -32% | -5% | -47% | -35% | -3% | -47% | -28% | -44% | -56% | |
| 1280x720 Performance Physics (Points) | 4760 | 4765 0% | 4199 -12% | 3067 -36% | 3984 -16% | 4919 3% | 3692 -22% | 4084 -14% | 3845 -19% | 2604 -45% |
| 1280x720 Performance GPU (Points) | 2606 | 1319 -49% | 2548 -2% | 1206 -54% | 1402 -46% | 2450 -6% | 1011 -61% | 1706 -35% | 1115 -57% | 996 -62% |
| 1280x720 Performance (Points) | 2761 | 1480 -46% | 2711 -2% | 1344 -51% | 1565 -43% | 2624 -5% | 1133 -59% | 1828 -34% | 1252 -55% | 1098 -60% |
| 3DMark | -34% | -2% | -36% | -19% | 12% | -11% | -14% | -21% | -36% | |
| 1280x720 Cloud Gate Standard Physics (Points) | 3745 | 3701 -1% | 3362 -10% | 2238 -40% | 3342 -11% | 3639 -3% | 3185 -15% | 3527 -6% | 3362 -10% | 2304 -38% |
| 1280x720 Ice Storm Standard Physics (Points) | 36360 | 31340 -14% | 38206 5% | 25720 -29% | 38764 7% | 44259 22% | 37081 2% | 38688 6% | 38854 7% | 27821 -23% |
| 1280x720 Ice Storm Standard Graphics (Points) | 54706 | 22709 -58% | 54088 -1% | 51362 -6% | 56071 2% | 91565 67% | 60003 10% | 60636 11% | 54695 0% | 50126 -8% |
| 1280x720 Cloud Gate Standard Graphics (Points) | 11420 | 6274 -45% | 11340 -1% | 6597 -42% | 7455 -35% | 11650 2% | 6585 -42% | 7894 -31% | 6475 -43% | 6298 -45% |
| 1920x1080 Fire Strike Graphics (Points) | 2120 | 1010 -52% | 2031 -4% | 810 -62% | 905 -57% | 1477 -30% | 1020 -52% | 834 -61% | 725 -66% | |
| Total Average (Program / Settings) | -33% /
-33% | -4% /
-3% | -42% /
-40% | -27% /
-25% | 5% /
6% | -29% /
-27% | -21% /
-19% | -33% /
-30% | -46% /
-43% |
| 3DMark 11 Performance | 2761 points | |
| 3DMark Ice Storm Standard Score | 50418 points | |
| 3DMark Cloud Gate Standard Score | 7505 points | |
| 3DMark Fire Strike Score | 1952 points | |
Help | ||
Emissions
System Noise
The noise development does not differ between the i5/i7 versions. The maximum noise during the stress test is almost 41 dB(A). The active cooling is completely deactivated while idling. The different measurement is only a result of the different base level, 31.3 dB(A) represents the ambient noise in this case.
| Microsoft Surface Book Core i7 13.5", 3000x2000 | Microsoft Surface Book Core i5 13.5", 3000x2000 | Microsoft Surface Pro 4 Core i7 12.3", 2736x1824 | HP EliteBook Folio 1040 G2 14", 1920x1080 | Apple MacBook Pro Retina 13 inch 2015-03 13.3", 2560x1600 | Toshiba KIRA-10D 13.3", 1920x1080 | Dell XPS 13 9343 Core i7 13.3", 3200x1800 | HP Spectre x360 13-4104ng 13.3", 2560x1440 | |
|---|---|---|---|---|---|---|---|---|
| Noise | 3% | 3% | 4% | -1% | -2% | -3% | 3% | |
| off / environment * (dB) | 31.3 | |||||||
| Idle Minimum * (dB) | 31.3 | 29.5 6% | 28.4 9% | 29.6 5% | 29 7% | 29.6 5% | 29.6 5% | 29.6 5% |
| Idle Average * (dB) | 31.3 | 29.6 5% | 28.6 9% | 29.6 5% | 29 7% | 29.6 5% | 29.6 5% | 29.6 5% |
| Idle Maximum * (dB) | 31.3 | 29.7 5% | 28.7 8% | 32.2 -3% | 29 7% | 30.7 2% | 33.2 -6% | 34.6 -11% |
| Load Average * (dB) | 38 | 37.5 1% | 40.8 -7% | 36.4 4% | 42.5 -12% | 43.9 -16% | 43.2 -14% | 34.7 9% |
| Load Maximum * (dB) | 40.5 | 40.9 -1% | 41.4 -2% | 36.4 10% | 45.6 -13% | 43.9 -8% | 43.2 -7% | 37.9 6% |
* ... smaller is better
Noise level
| Idle |
| 31.3 / 31.3 / 31.3 dB(A) |
| Load |
| 38 / 40.5 dB(A) |
 | ||
30 dB silent 40 dB(A) audible 50 dB(A) loud |
||
min: | ||
Temperature
The i5 model of the Surface Book is a bit cooler than the i7 model in respect of the surface temperatures. This could be caused by the different processors, but also the ambient temperatures when we performed the measurements. One noticeable aspect is the significantly higher temperature of 50 °C under load at the back of the tablet.
We use our stress test to create the highest possible heat. The Turbo cannot be fully utilized in this case (3.6 @ Single), but it does not drop below the nominal clock of 2.6 GHz.
The second picture shows that the palm rest warms up to around 40 °C (top) and 41 °C (bottom), respectively. Underneath the keyboard are the battery and the Maxwell GeForce GPU. This means the palm rest stays comfortably cool and the keyboard does not get very warm, either.
| Microsoft Surface Book Core i7 13.5", 3000x2000 | Microsoft Surface Book Core i5 13.5", 3000x2000 | Microsoft Surface Pro 4, Core i5, 128GB 12.3", 2736x1824 | Microsoft Surface Pro 4 Core i7 12.3", 2736x1824 | HP EliteBook Folio 1040 G2 14", 1920x1080 | Apple MacBook Pro Retina 13 inch 2015-03 13.3", 2560x1600 | Toshiba KIRA-10D 13.3", 1920x1080 | Dell XPS 13 9343 Core i7 13.3", 3200x1800 | HP Spectre x2 12-a003ng K3D42EA 12", 1920x1080 | |
|---|---|---|---|---|---|---|---|---|---|
| Heat | 13% | -21% | 12% | 10% | 7% | 13% | 14% | 2% | |
| Maximum Upper Side * (°C) | 47.4 | 44.2 7% | 52.3 -10% | 45.4 4% | 35.9 24% | 45.1 5% | 42.2 11% | 43.4 8% | 43.5 8% |
| Maximum Bottom * (°C) | 50.2 | 41.2 18% | 51.4 -2% | 43.2 14% | 42.4 16% | 39.6 21% | 34.4 31% | 37 26% | 42 16% |
| Idle Upper Side * (°C) | 30.4 | 26 14% | 43.2 -42% | 25.2 17% | 28.5 6% | 28.5 6% | 26.2 14% | 25.9 15% | 33 -9% |
| Idle Bottom * (°C) | 27.4 | 23.8 13% | 36 -31% | 24 12% | 29 -6% | 28.3 -3% | 28.5 -4% | 25.1 8% | 29.3 -7% |
* ... smaller is better
Heat Tablet
(-) The maximum temperature on the upper side is 47.4 °C / 117 F, compared to the average of 35.4 °C / 96 F, ranging from 19.6 to 60 °C for the class Convertible.
(-) The bottom heats up to a maximum of 50.2 °C / 122 F, compared to the average of 36.9 °C / 98 F
(+) In idle usage, the average temperature for the upper side is 26.6 °C / 80 F, compared to the device average of 30.3 °C / 87 F.
(-) The palmrests and touchpad can get very hot to the touch with a maximum of 47.35 °C / 117.2 F.
(-) The average temperature of the palmrest area of similar devices was 28 °C / 82.4 F (-19.4 °C / -34.8 F).
Heat Keyboard with Maxwell Geforce
(+) The maximum temperature on the upper side is 39.6 °C / 103 F, compared to the average of 35.4 °C / 96 F, ranging from 19.6 to 60 °C for the class Convertible.
(±) The bottom heats up to a maximum of 40.7 °C / 105 F, compared to the average of 36.9 °C / 98 F
(+) The palmrests and touchpad are cooler than skin temperature with a maximum of 28.6 °C / 83.5 F and are therefore cool to the touch.
(±) The average temperature of the palmrest area of similar devices was 28 °C / 82.4 F (-0.6 °C / -1.1 F).
Energy Management
Power Consumption
We did not measure the power consumption of the i5 model, so the measurements of the i7 version are the first results for the Surface Book. We can see similarities to the Microsoft Surface Pro 4, at least while idling. The 12 Watts are probably a result of the very high luminance as well as the keyboard illumination. It is brighter than the Surface Pro 4 and the screen is bigger at 13.5-inches as well.
All the rivals are more frugal, but this is only a sign of their integrated GPUs. Those devices consume significantly less power due to the missing dedicated graphics card, and some models also tend to throttle. The high consumption under load is actually a good sign if you want high performance figures. The Surface Book does not suffer from throttling, not even in the impractical stress test.
| Microsoft Surface Book Core i7 13.5", 3000x2000 | Microsoft Surface Pro 4, Core i5, 128GB 12.3", 2736x1824 | HP EliteBook Folio 1040 G2 14", 1920x1080 | Apple MacBook Pro Retina 13 inch 2015-03 13.3", 2560x1600 | Toshiba KIRA-10D 13.3", 1920x1080 | Dell XPS 13 9343 Core i7 13.3", 3200x1800 | HP Spectre x360 13-4104ng 13.3", 2560x1440 | HP Spectre x2 12-a003ng K3D42EA 12", 1920x1080 | |
|---|---|---|---|---|---|---|---|---|
| Power Consumption | 29% | 40% | 13% | 41% | 8% | 30% | 35% | |
| Idle Minimum * (Watt) | 4.5 | 4.4 2% | 3.2 29% | 2.8 38% | 2.6 42% | 6.6 -47% | 3.9 13% | 4.5 -0% |
| Idle Average * (Watt) | 9.8 | 9 8% | 6.5 34% | 7.8 20% | 6.3 36% | 9.3 5% | 7.4 24% | 7.7 21% |
| Idle Maximum * (Watt) | 12.2 | 10.7 12% | 7.4 39% | 8.1 34% | 6.5 47% | 11 10% | 9.2 25% | 8.3 32% |
| Load Average * (Watt) | 46 | 19.6 57% | 25.6 44% | 52.4 -14% | 30.9 33% | 32.2 30% | 28.1 39% | 19.8 57% |
| Load Maximum * (Watt) | 56 | 19.9 64% | 26.1 53% | 62.8 -12% | 30.9 45% | 33.2 41% | 27.6 51% | 20.6 63% |
* ... smaller is better
| Off / Standby | |
| Idle | |
| Load |
|
Key:
min: | |
Battery Runtime
We did not expect this. Despite the same battery capacity, our Wi-Fi test (display @150cd/m², power profile Balanced, browser script) determines 10:46 hours (648 minutes). This is 61% longer compared to the sibling with the i5. We only had a very limited time with the test model due to the video review, so we could only perform the Wi-Fi test once. However, the runtime of 10 hours corresponds with the idle consumption between 4.5-12 Watts. In theory, the device will last 10:30 hours at a consumption of 6.5 Watts (18 Wh + 51 Wh = 69 Wh / 6.5 h).
Our i5 version from the initial review falls clearly behind with 6:42 hours, even though it ran for up to 17:50 hours in our idle test. Microsoft advertises "up to 12 hours video playback" with the i5 Book. The measurement of our i5 version was either not perfect or the device suffered from outdated drivers/BIOS revision. The measurements of other editorial offices were also in the range between 6 and 7.5 all the way up to 13 and 14:30 hours (Computerbild, PC Welt, Chip). Our result of 10 hours is therefore realistic.
Pros
Cons
Verdict
It tries really hard and can score one point more than its Core i5 sibling from our first review of the Surface Book. The decisive factor was the longer runtime, because we could only find very small – if at all – advantages of the i7/512 GB version in respect of processor and application performance. The large SSD manages higher write speeds, which is at least one aspect. The heat development is higher compared to the i5 model, but the palm rest stays comfortably cool. Our consumption measurements were performed for the Surface Book for the first time in this review.
Chippy from our video editorial staff showed in his Power Director Renders Test (Intel Quick Sync) that the Surface Book i7 is almost 30% faster than the rivals Lenovo Miix 700 (core m3), HP Spectre X2 (Core m7) and Microsoft Surface Pro 3 (Haswell Core i5). The reason: The active cooling ensures a high Turbo utilization even during the stress test, while the fanless systems have to reduce their clocks. The powerful Surface Book – it does not matter if Core i5 or i7 – is therefore suited for special and processor-focused applications that also have to be performed on the road from time to time (full performance on battery power).
If you want to save every minute during rendering, then the Surface Book is certainly the best choice. It provides the CPU performance of a small multimedia laptop and can beat similarly sized competitors like the MacBook Pro 13 or Dell’s XPS 13. You will have to decide for yourself if this is worth 2,000 up to almost 3,000 Euros (~$2198 to $3298). But the Surface Book is definitely a good choice for technology enthusiasts.
All details of the Surface Book are available in the review of the Core i5 version: Microsoft Surface Book Core i5.
Note: We adjusted the rating of the Surface Book i5 due to a new rating version. Thanks to the higher connectivity sub-rating, the final rating is increased from 85 to 86%.
Microsoft Surface Book Core i7
- 04/27/2016 v5.1 (old)
Sebastian Jentsch
Price comparison

