Microsoft Surface Book 2 (13.5", i7, GTX 1050) Convertible Review
For the original German review, see here.
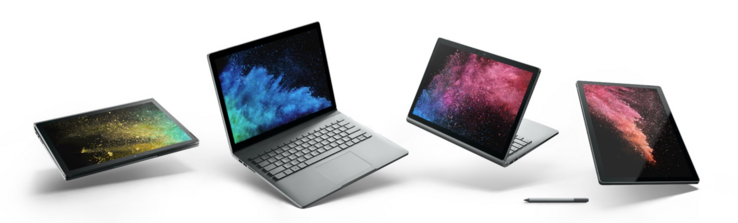
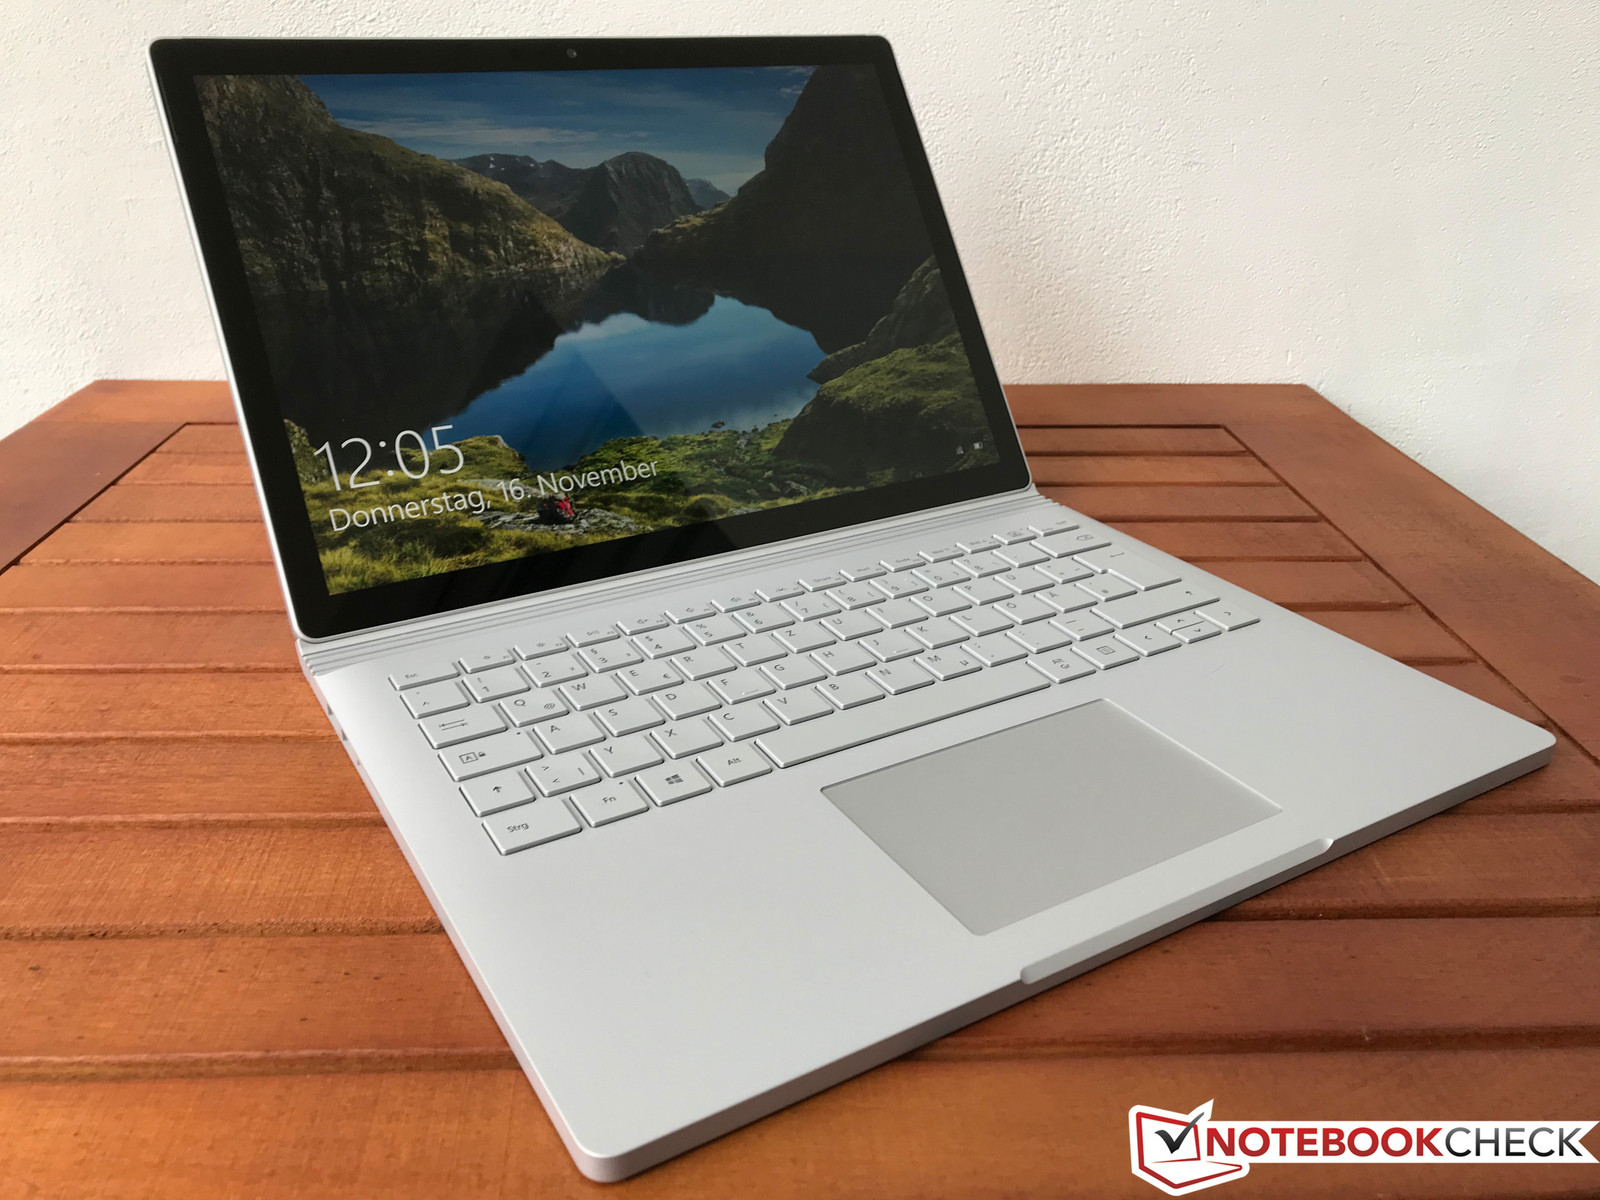
It was a surprise when Microsoft announced a new version of the Surface Book with the launch of the Windows Creators Update. The new model, which is released two years after the original, is fittingly named Surface Book 2. Besides the 13.5-inch display, you can also order a larger 15-inch version.
The design itself has not changed, even though Microsoft claims that it changed quite a lot, especially for the Fulcrum hinge. The more important changes are listed on the specification sheet, because the manufacturer from Redmond uses modern components from Intel and Nvidia, respectively. The highlight is Intel's new Kaby Lake-R chip with four cores, which promises a lot of performance in combination with Nvidia's GTX 1050 GPU. The following table shows all four 13.5" SKUs available at launch.
| Processor | Core i5-7300U (two cores) | Core i7-8650U (four cores) | Core i7-8650U (four cores) | Core i7-8650U (four cores) |
| Graphics card | Intel HD Graphics 620 | Intel UHD Graphics 620 + Nvidia GeForce GTX 1050 (2 GB GDDR5-VRAM) | Intel UHD Graphics 620 + Nvidia GeForce GTX 1050 (2 GB GDDR5-VRAM) | Intel UHD Graphics 620 + Nvidia GeForce GTX 1050 (2 GB GDDR5-VRAM) |
| Display | 13.5" PixelSense 3000 x 2000 pixels | 13.5" PixelSense 3000 x 2000 pixels | 13.5" PixelSense 3000 x 2000 pixels | 13.5" PixelSense 3000 x 2000 pixels |
| RAM | 8 GB | 8 GB | 16 GB | 16 GB |
| SSD | 256 GB | 256 GB | 512 GB | 1 TB |
| Dimensions | 312 x 232 x 13-23 mm | 312 x 232 x 15-23 mm | 312 x 232 x 15-23 mm | 312 x 232 x 15-23 mm |
| Price | $1499 | $1999 | $2499 | $2999 |
There are basically two different models. The least expensive Surface Book 2 with the older Core i5-7300U (Kaby Lake) has two native processor cores and is easier to cool, so the tablet is a bit slimmer (2 mm/~0.08 in) and lighter (~100 grams/~3.5 oz). It also lacks the discrete GPU inside the keyboard unit, so all the graphics are handled by the integrated processor GPU HD Graphics 620. The three more expensive SKUs use a combination of the new Core i7-8650U (Kaby Lake-Refresh) with four processor cores and the dedicated GeForce GTX 1050 with 2 GB GDDR5-VRAM inside the keyboard unit, which is actively cooled via fan. Otherwise, the three SKUs differ only in terms of memory and storage, but the additional charges are substantial.
Our test model is the SKU with the new Kaby Lake-R processor and the GTX 1050 GPU for 2249 Euros ($1999). We will obviously check how the new version compares to the first Surface Book with the GTX 965M. Searching for other competitors is still a problem, especially in this price range. Similarly sized convertibles use the same processors, but are usually limited to integrated graphics solutions. Lenovo's Yoga 920 is such a device. Alternatives with less GPU power are Microsoft's own Surface Pro 4 or Surface Laptop. The Apple MacBook Pro 13 is certainly on the short list of potential buyers as well. If you require more GPU performance in a convertible, you will usually have to end up with a 15-inch system. Both the Razer Blade as well as the Gigabyte Aero 14 are exceptions with 14-inch screens, but they are conventional laptops with a bigger focus on gaming capabilities. We also include the brand-new Eve V in the comparison charts.
Case
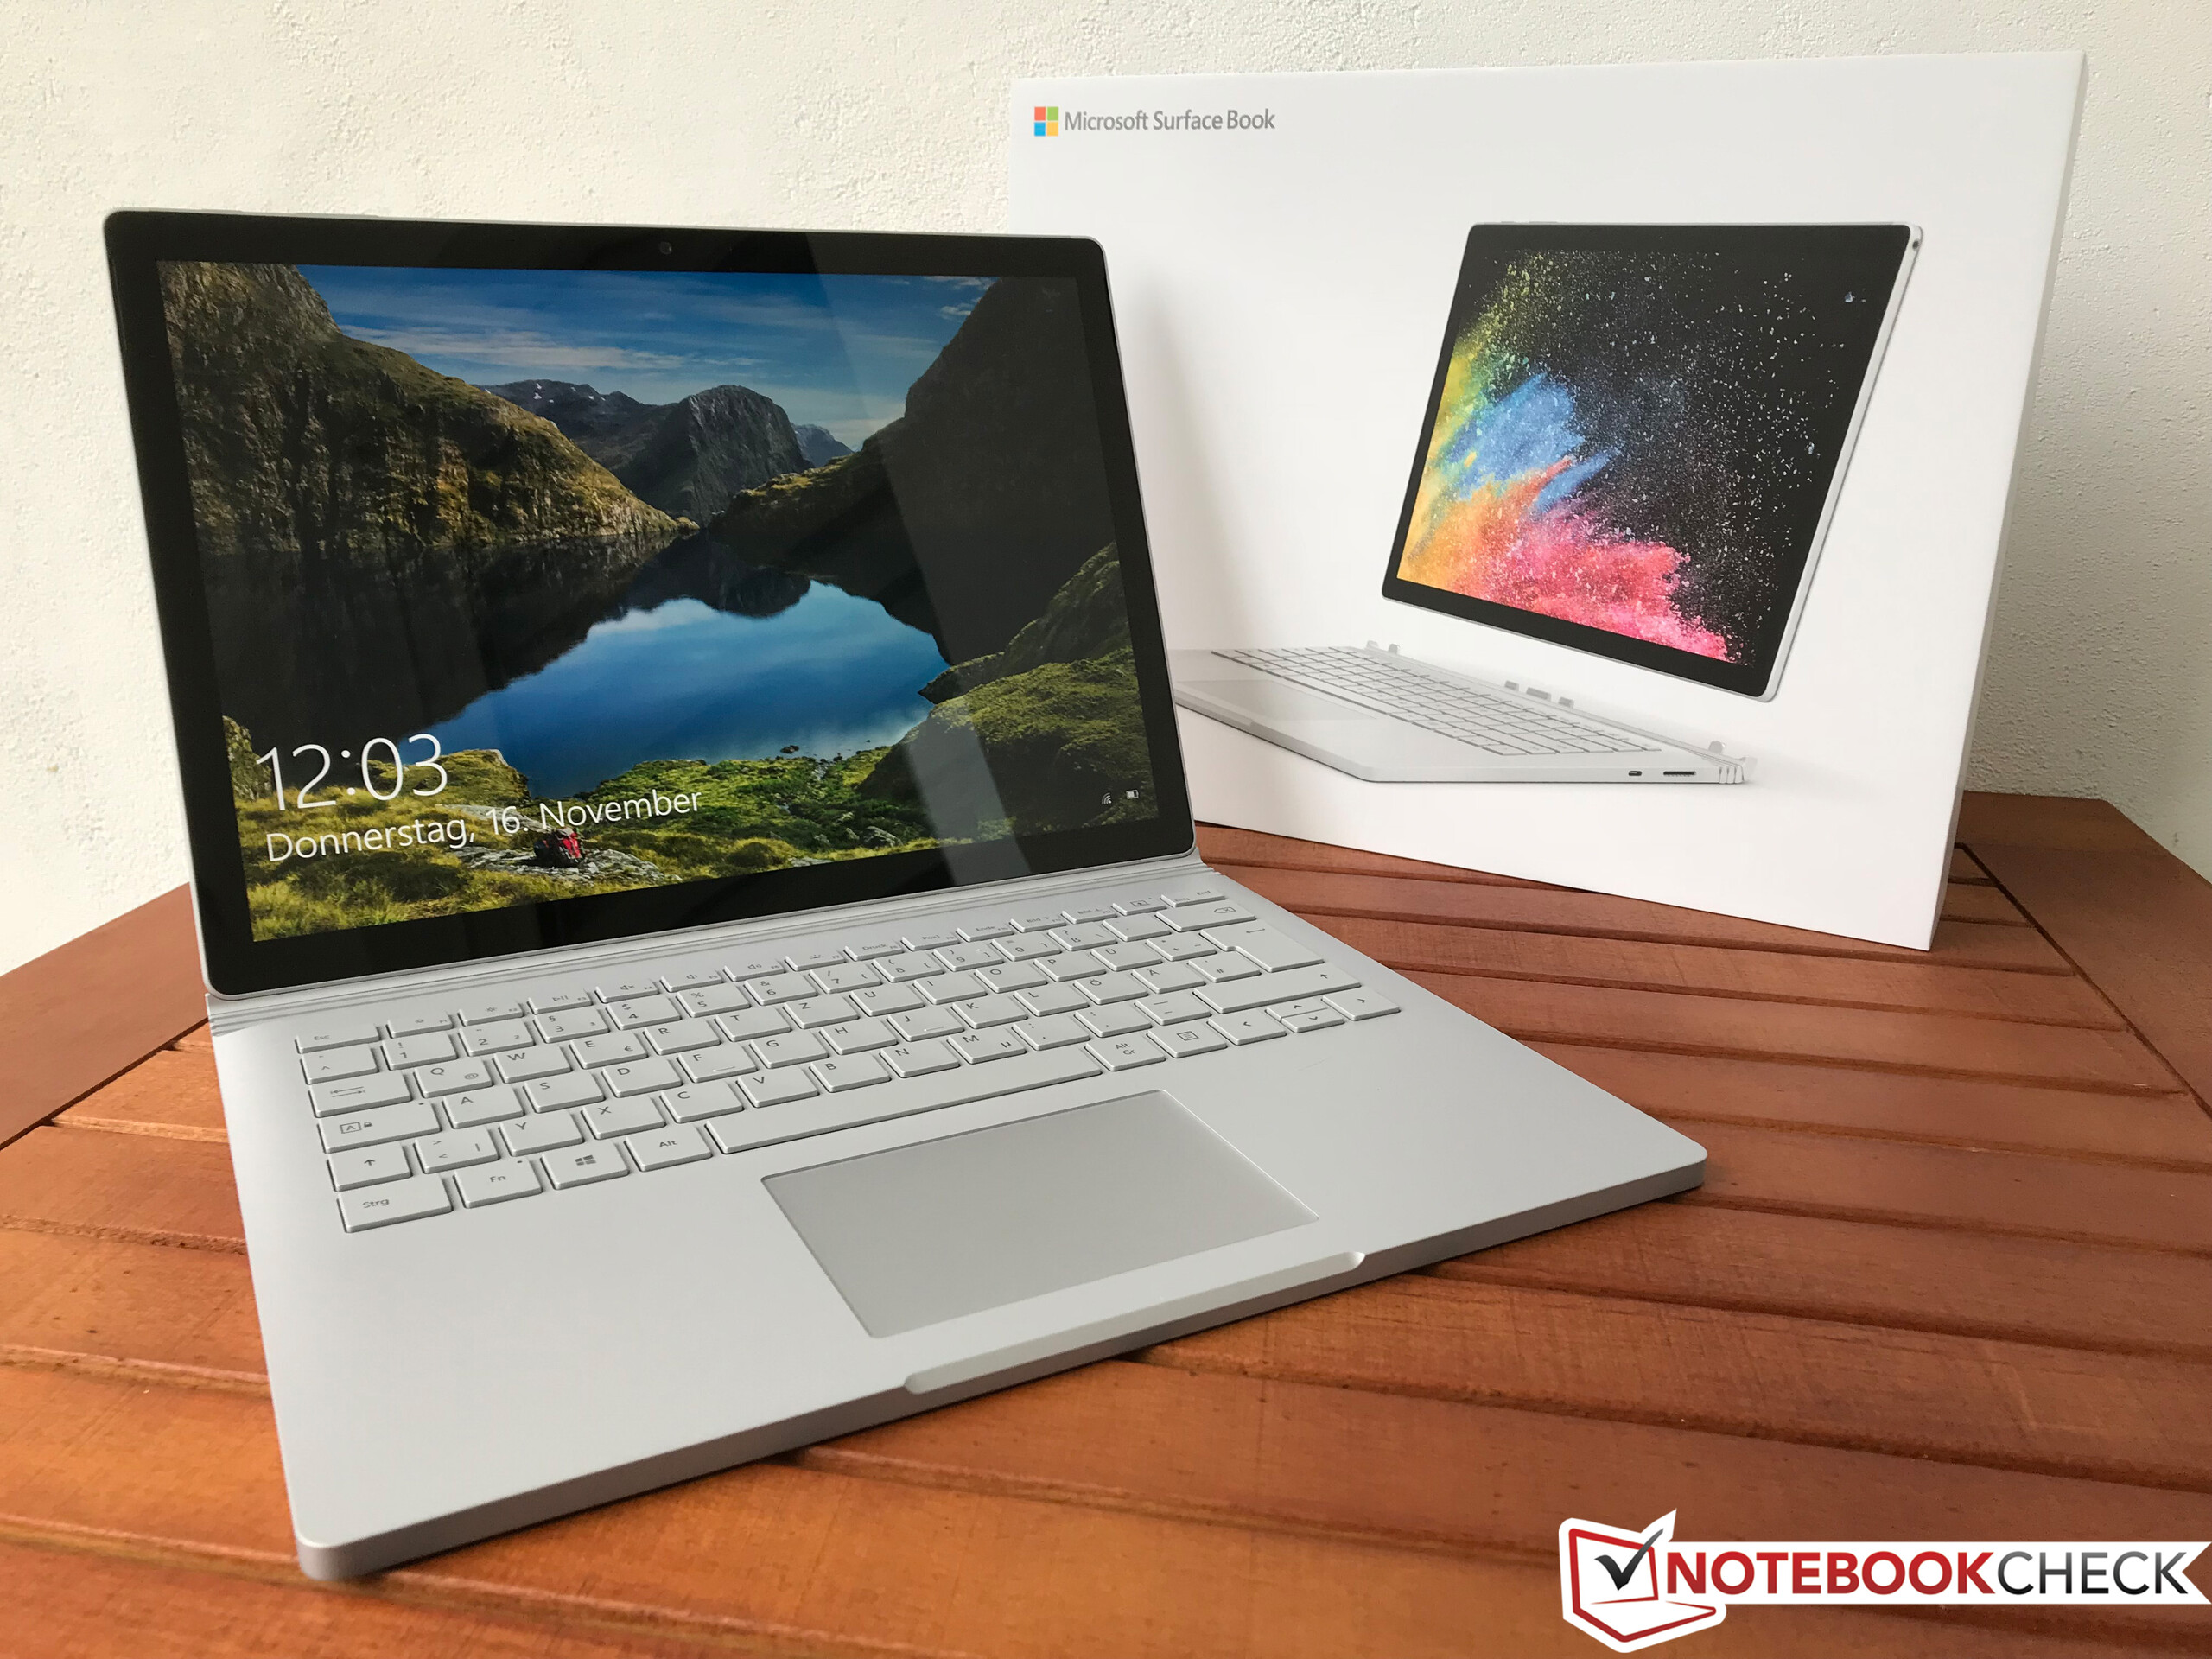
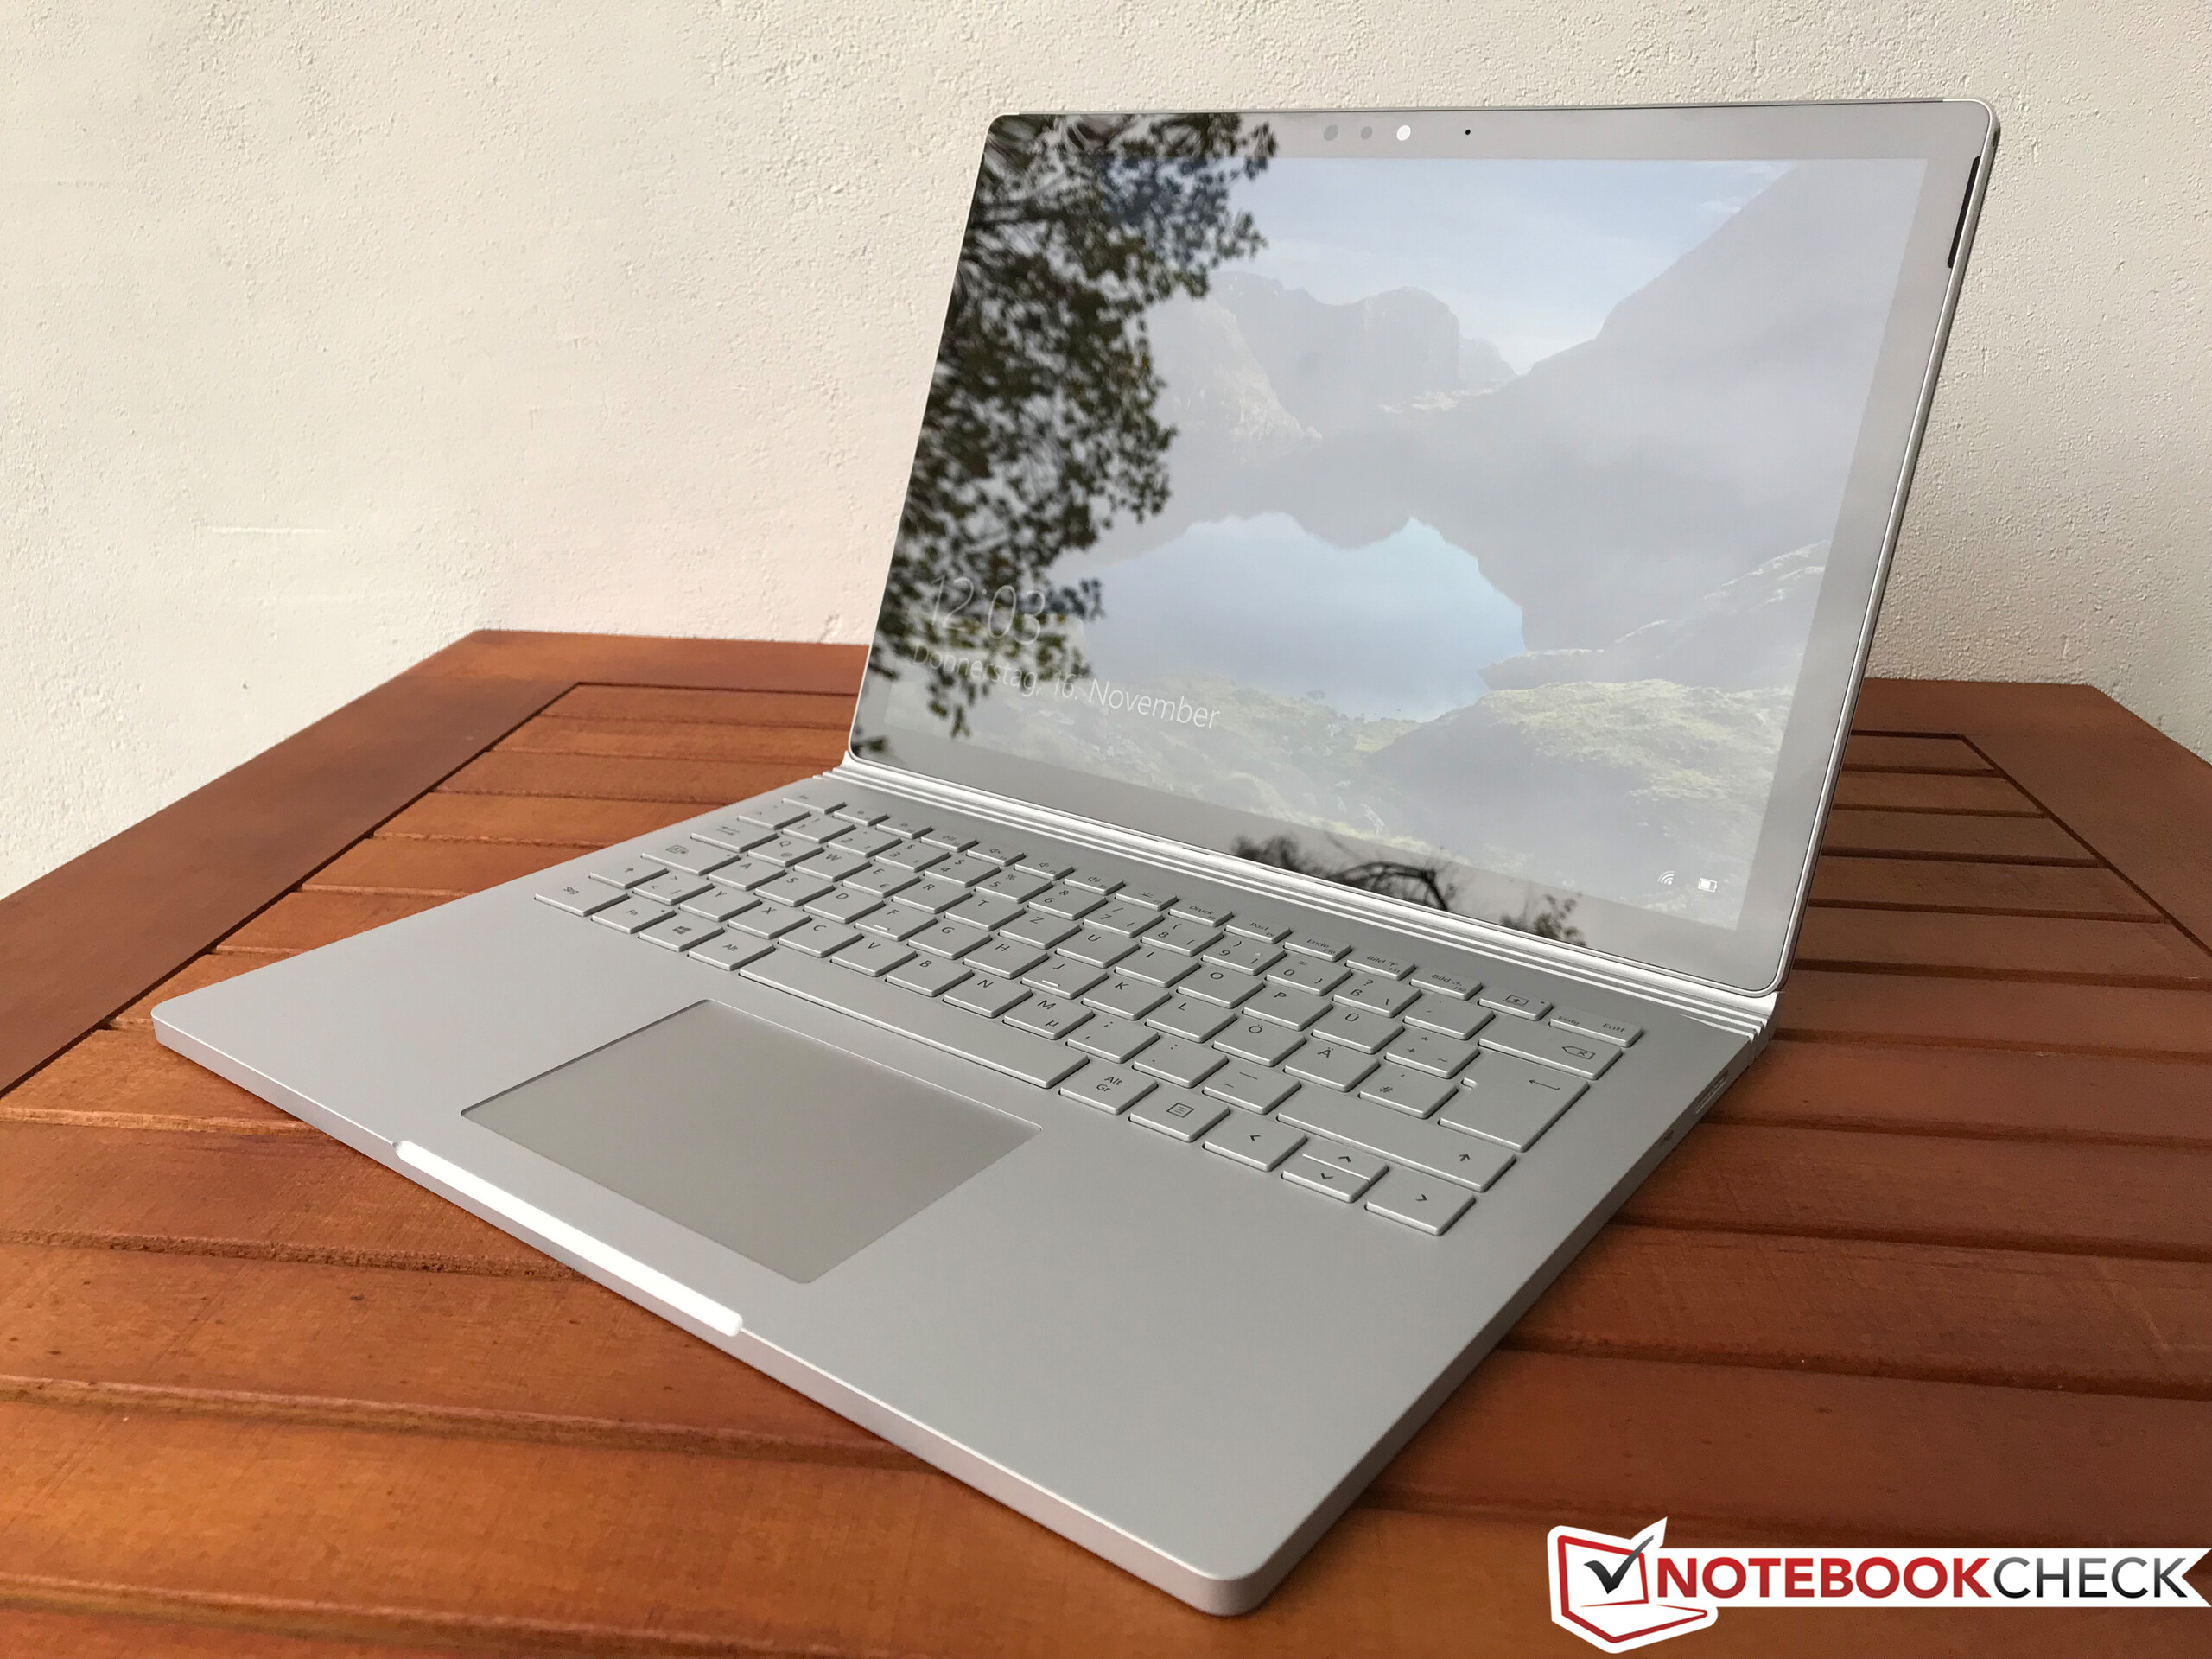
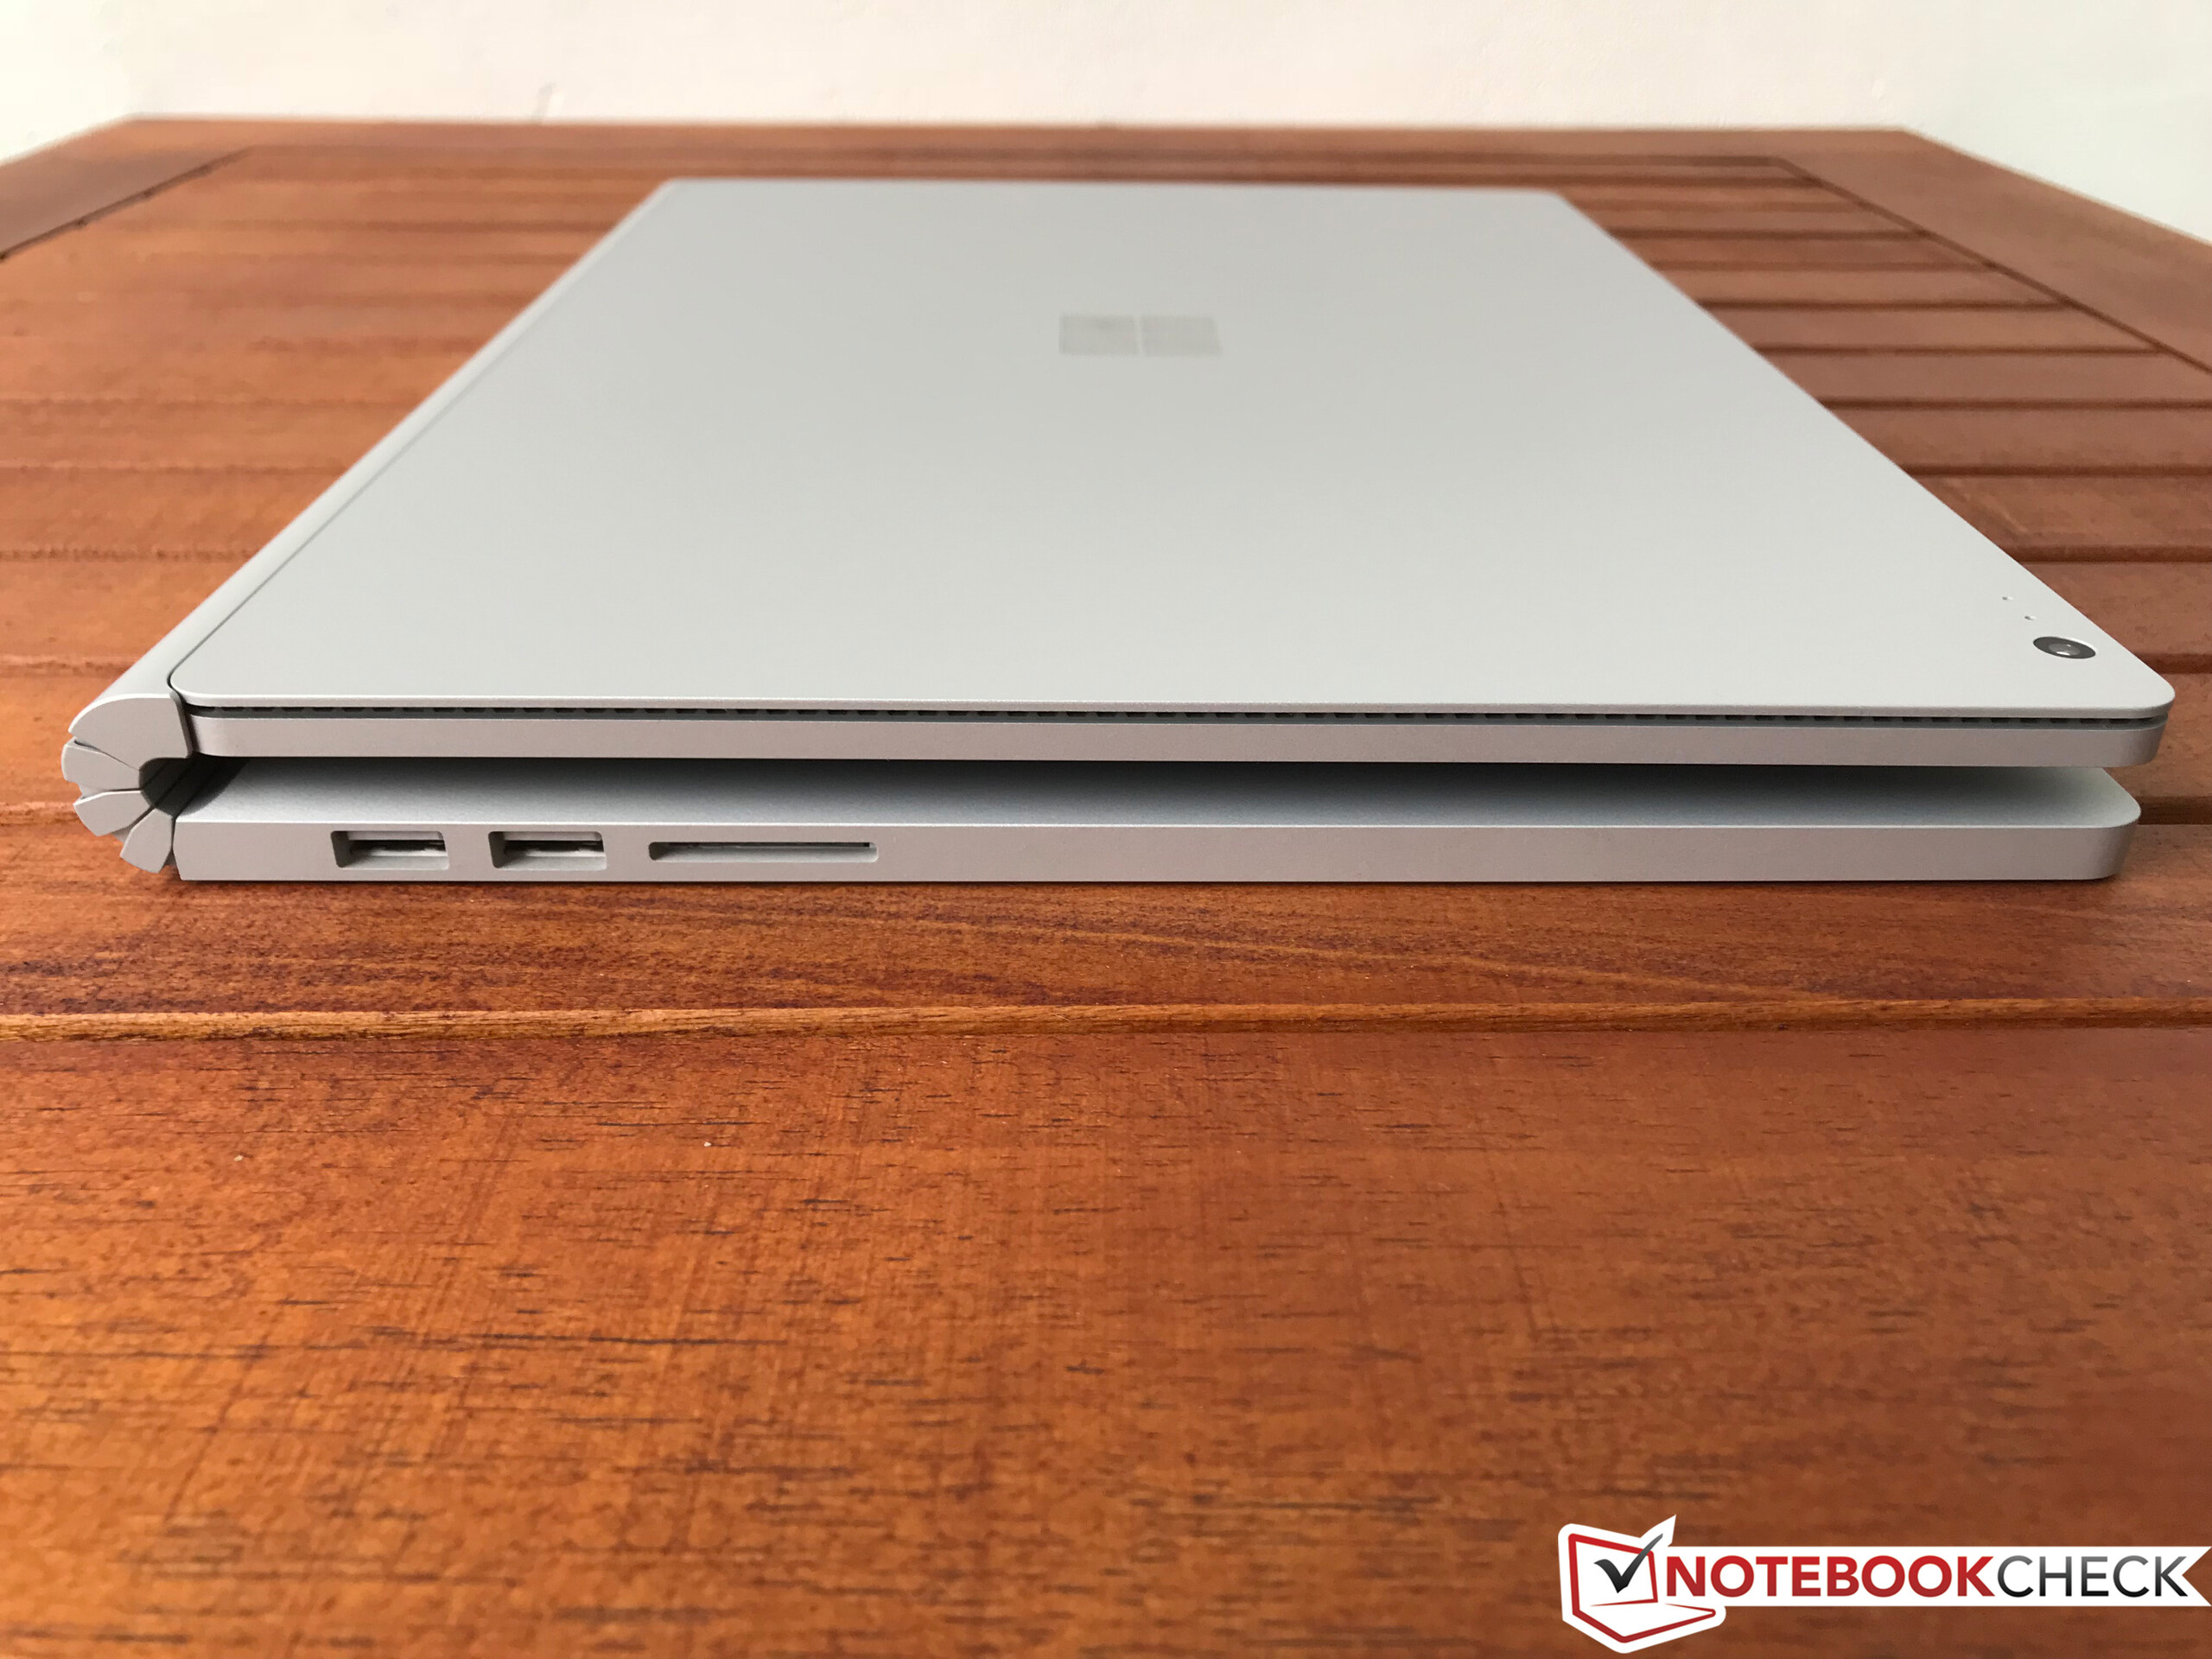
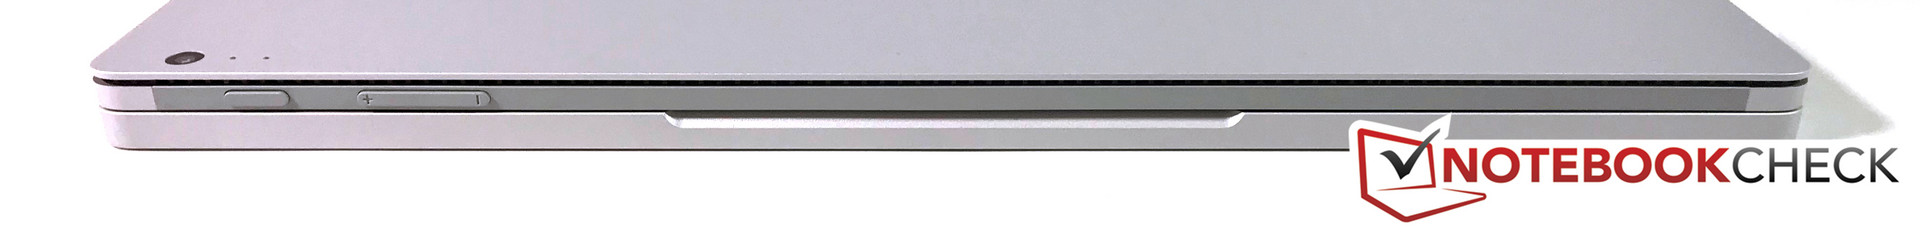
It is hard to spot a difference when the Surface Book 2 is sitting next to its predecessor. The changes are mostly limited to the internals, including the so-called Fulcrum hinge. The device is great to touch thanks to plenty of metal (magnesium alloy). This is definitely a premium product, which is supported by the stability and build quality. We did not find any flaws in our particular test model.
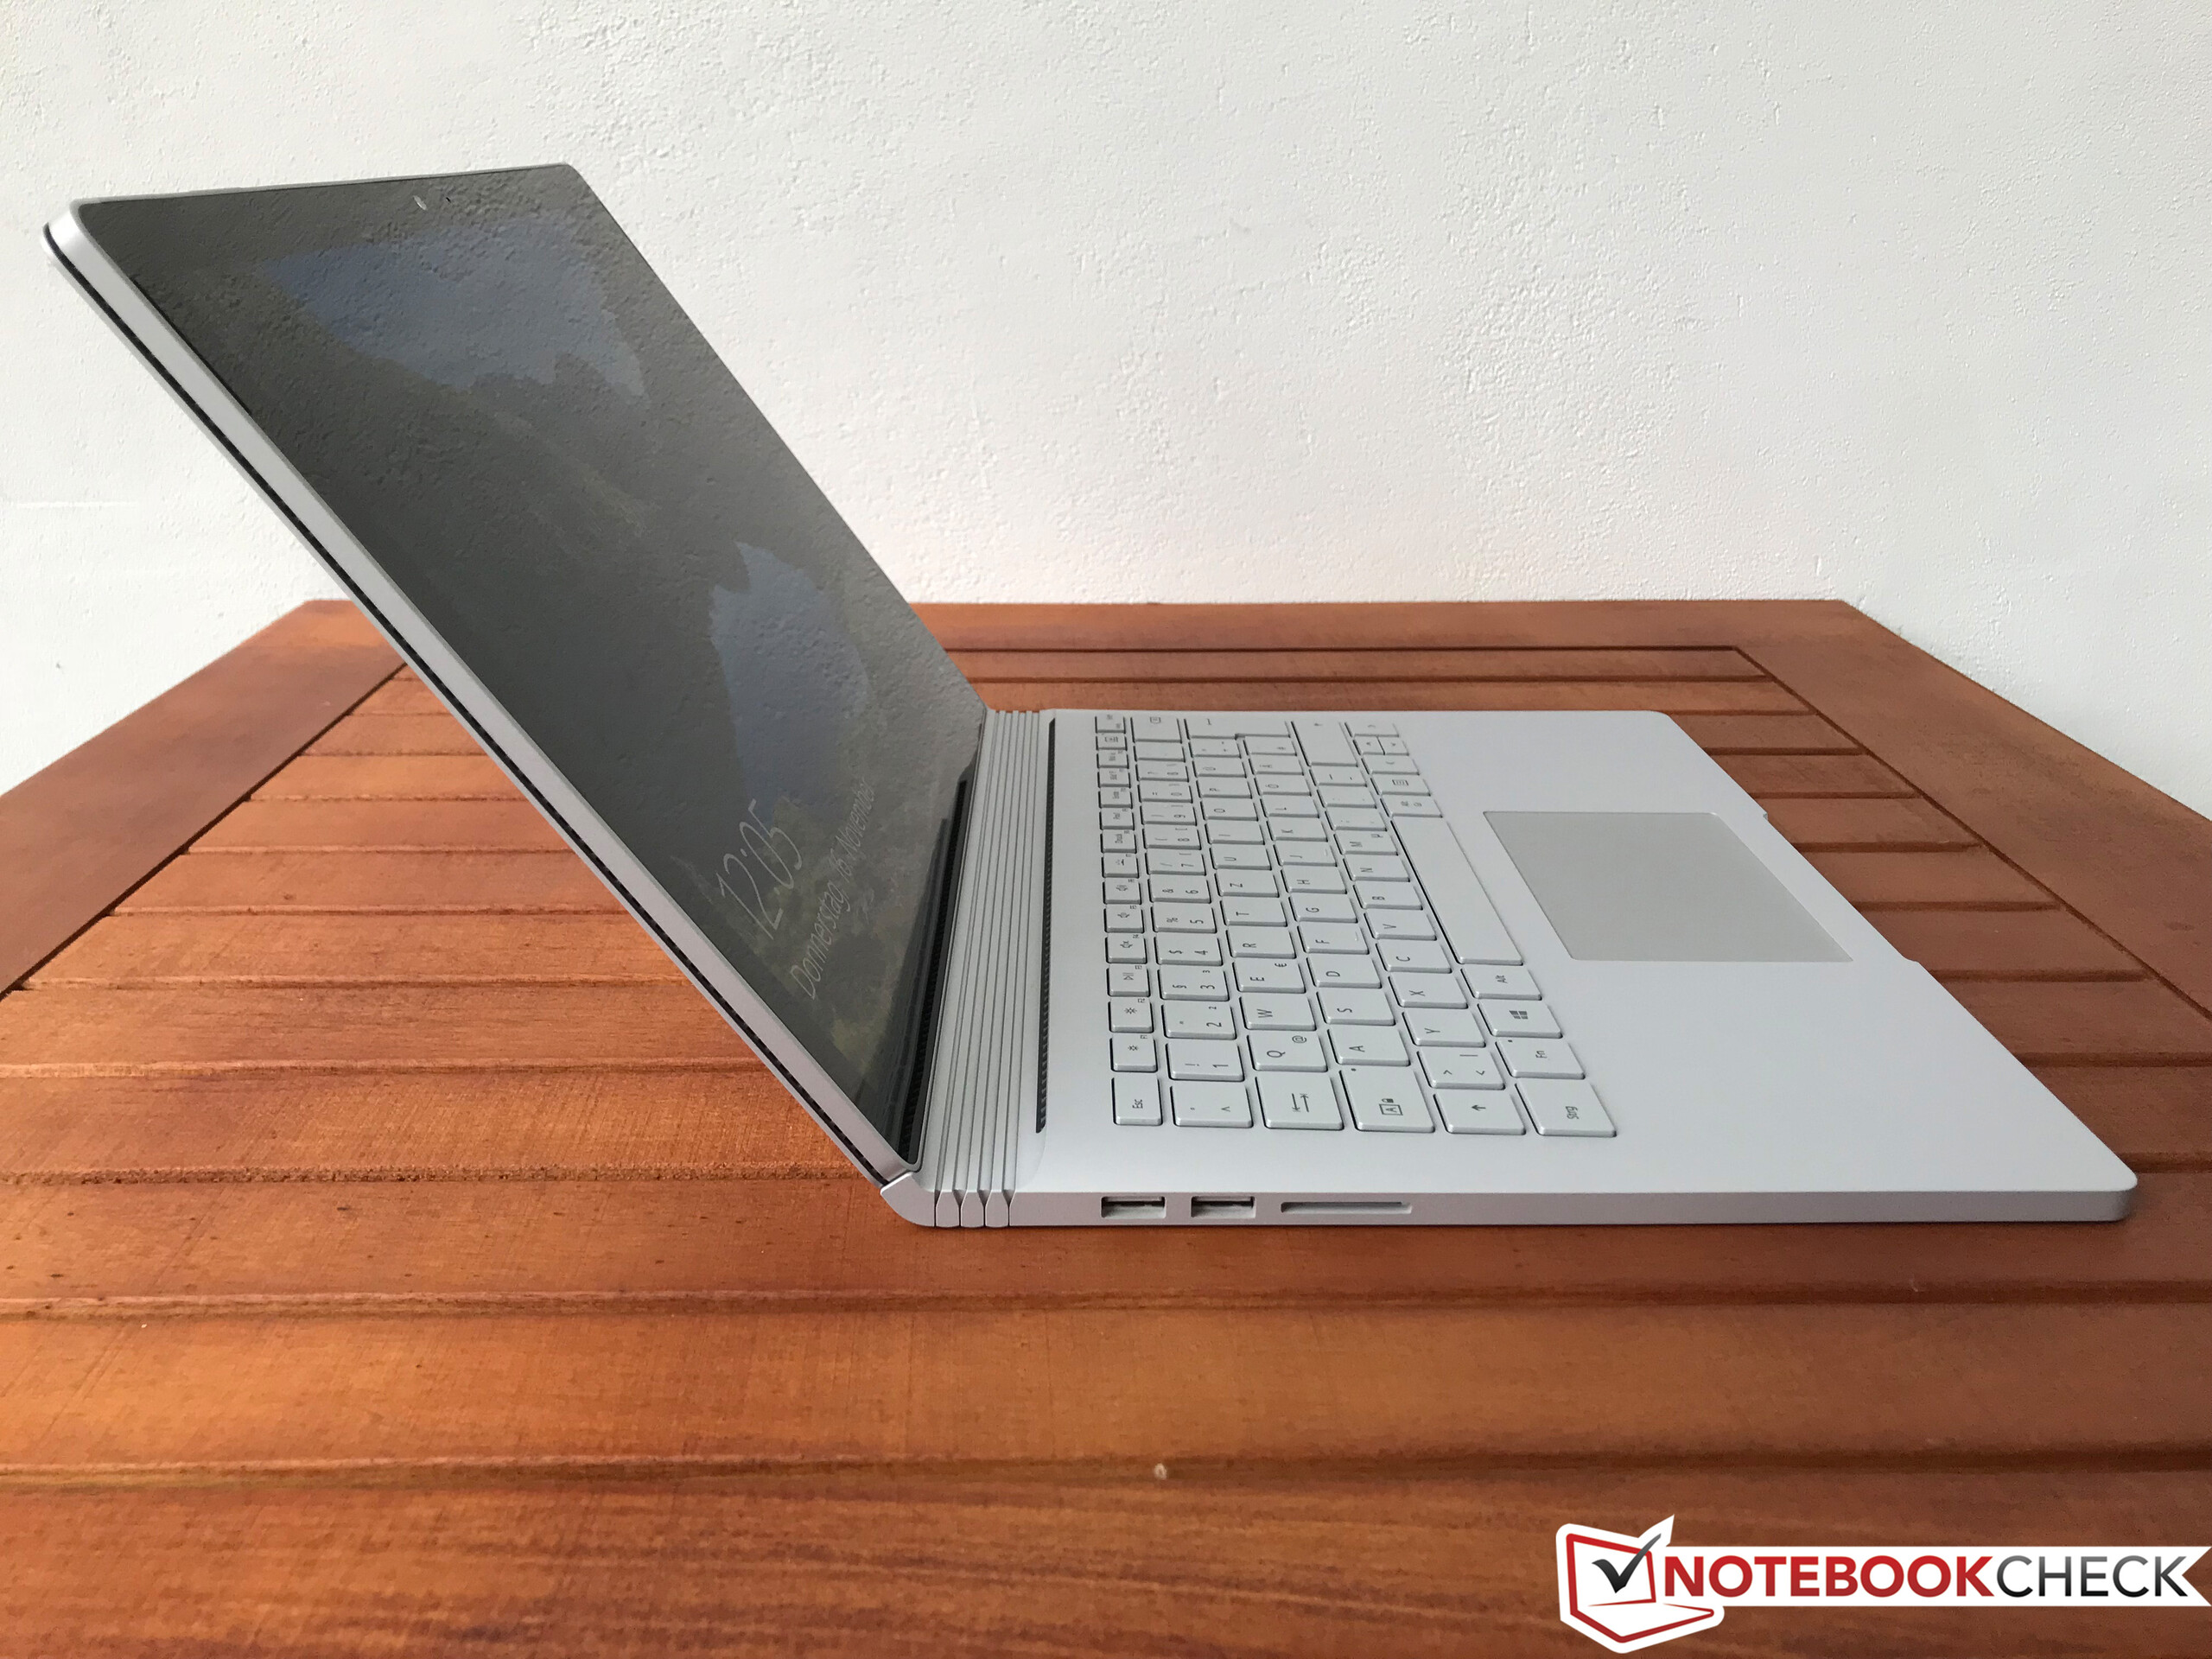
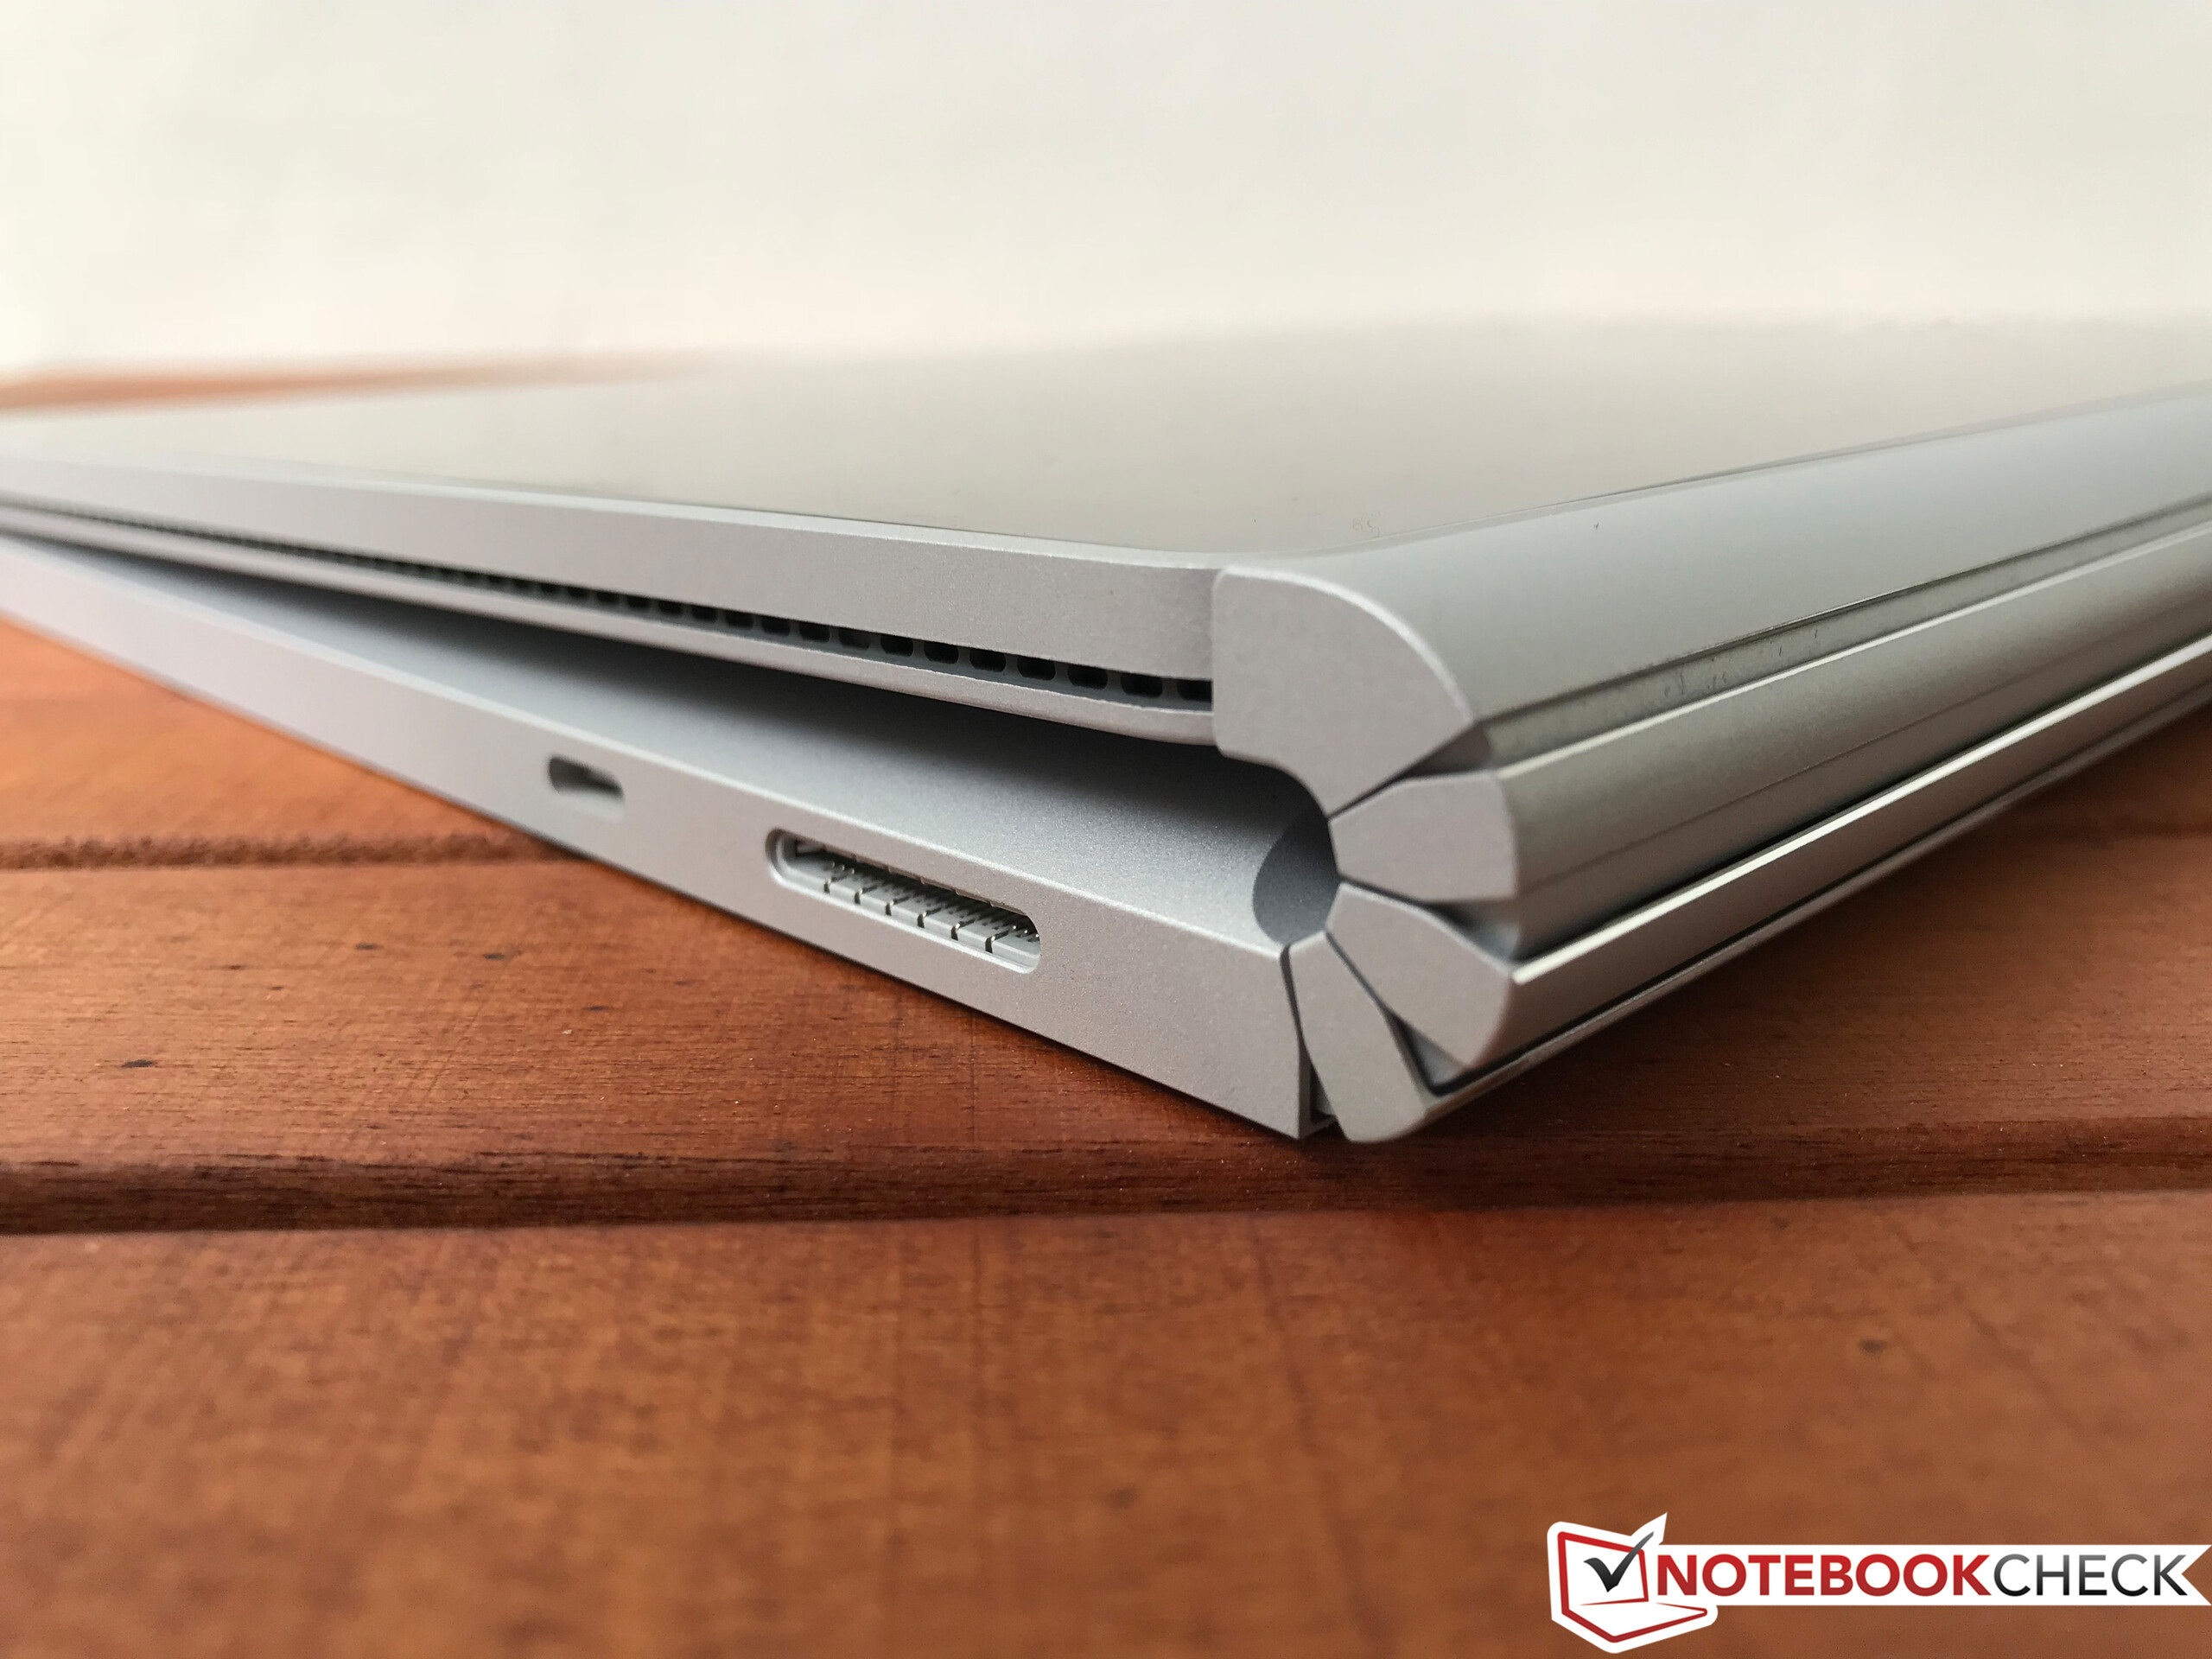
The most important part of a convertible is the hinge, which is surprisingly firm. It can even hold the tablet in place at very small angles (see picture below). However, the weight of the tablet still takes its toll, because it bounces quite a lot when you make touch inputs. The hinge also produces a slight mechanical sound when the individual parts touch. It is not a creaking or squeaking sound, so it is not really annoying.
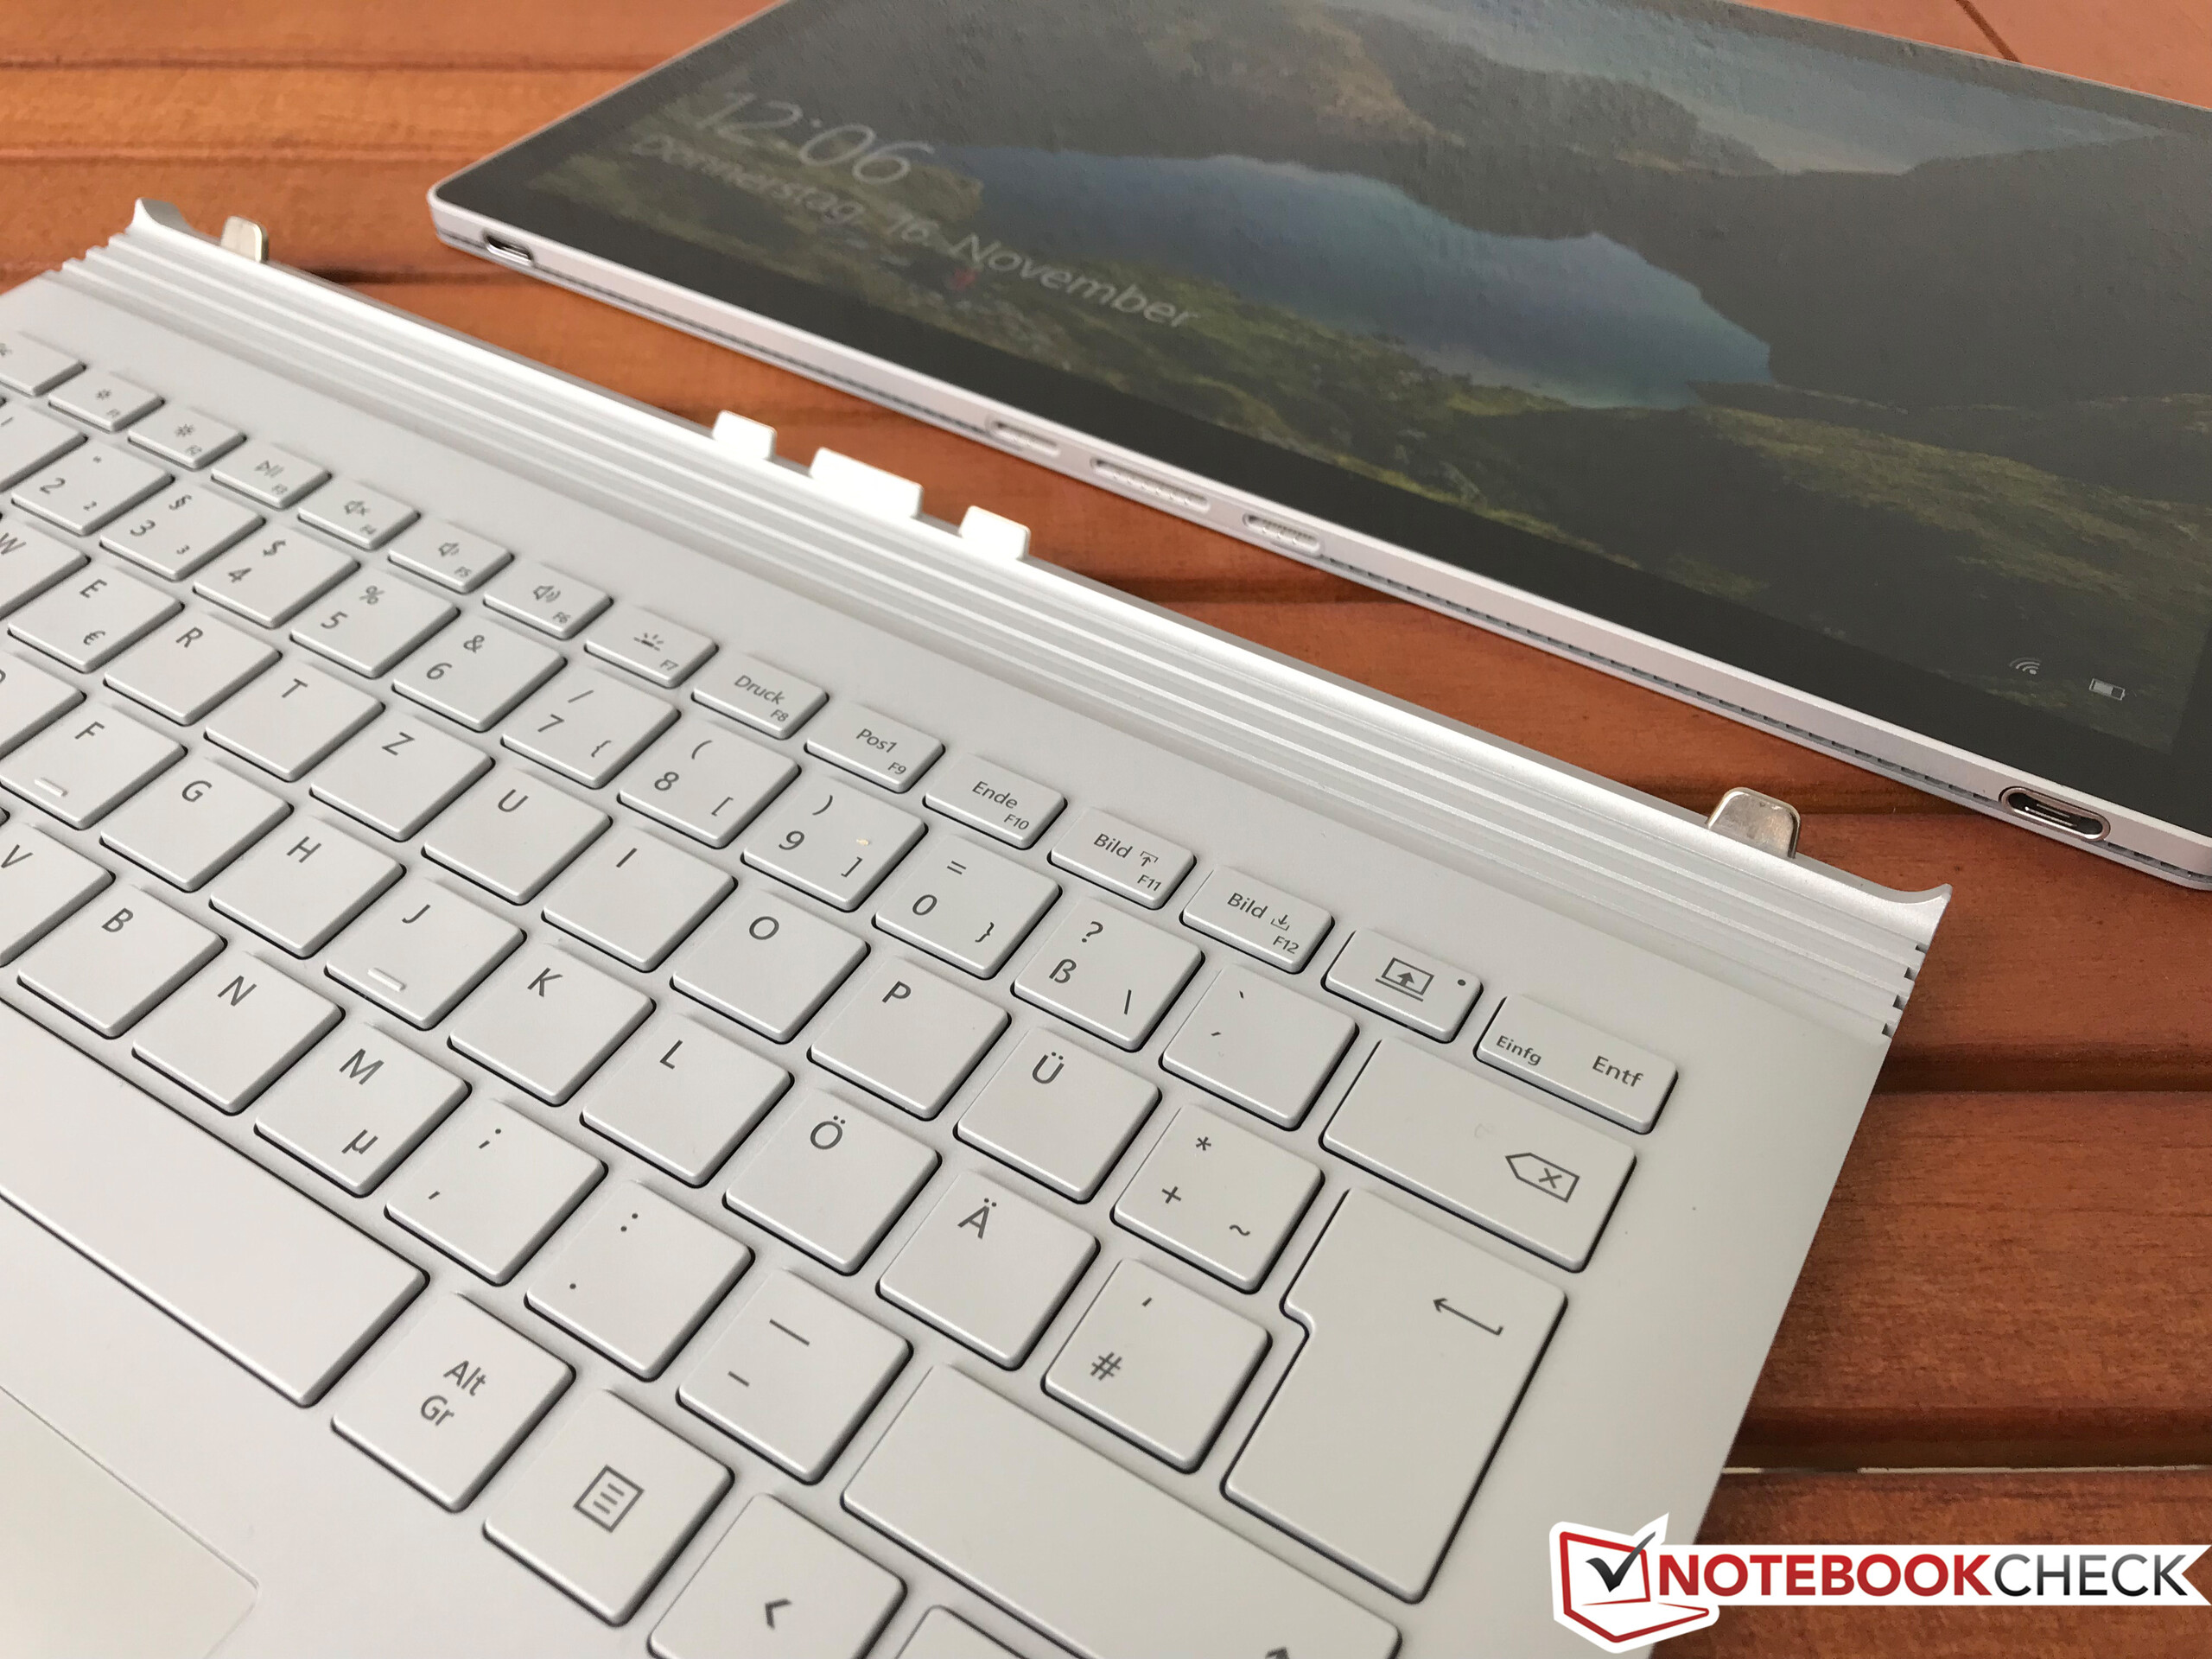
The connection between the tablet and the keyboard unit is extremely solid, and can only be disengaged via a button. Once you press the button, a wire is heated and the connection disengages. This results in an audible clicking sound, but it is quieter than before. There is still a gap between the tablet and the keyboard when the display is closed, so dirt or objects could enter during transport. It is, however, unlikely that the display opens accidentally. There is a magnetic connection between the two parts, and you also need both hands to open the lid.
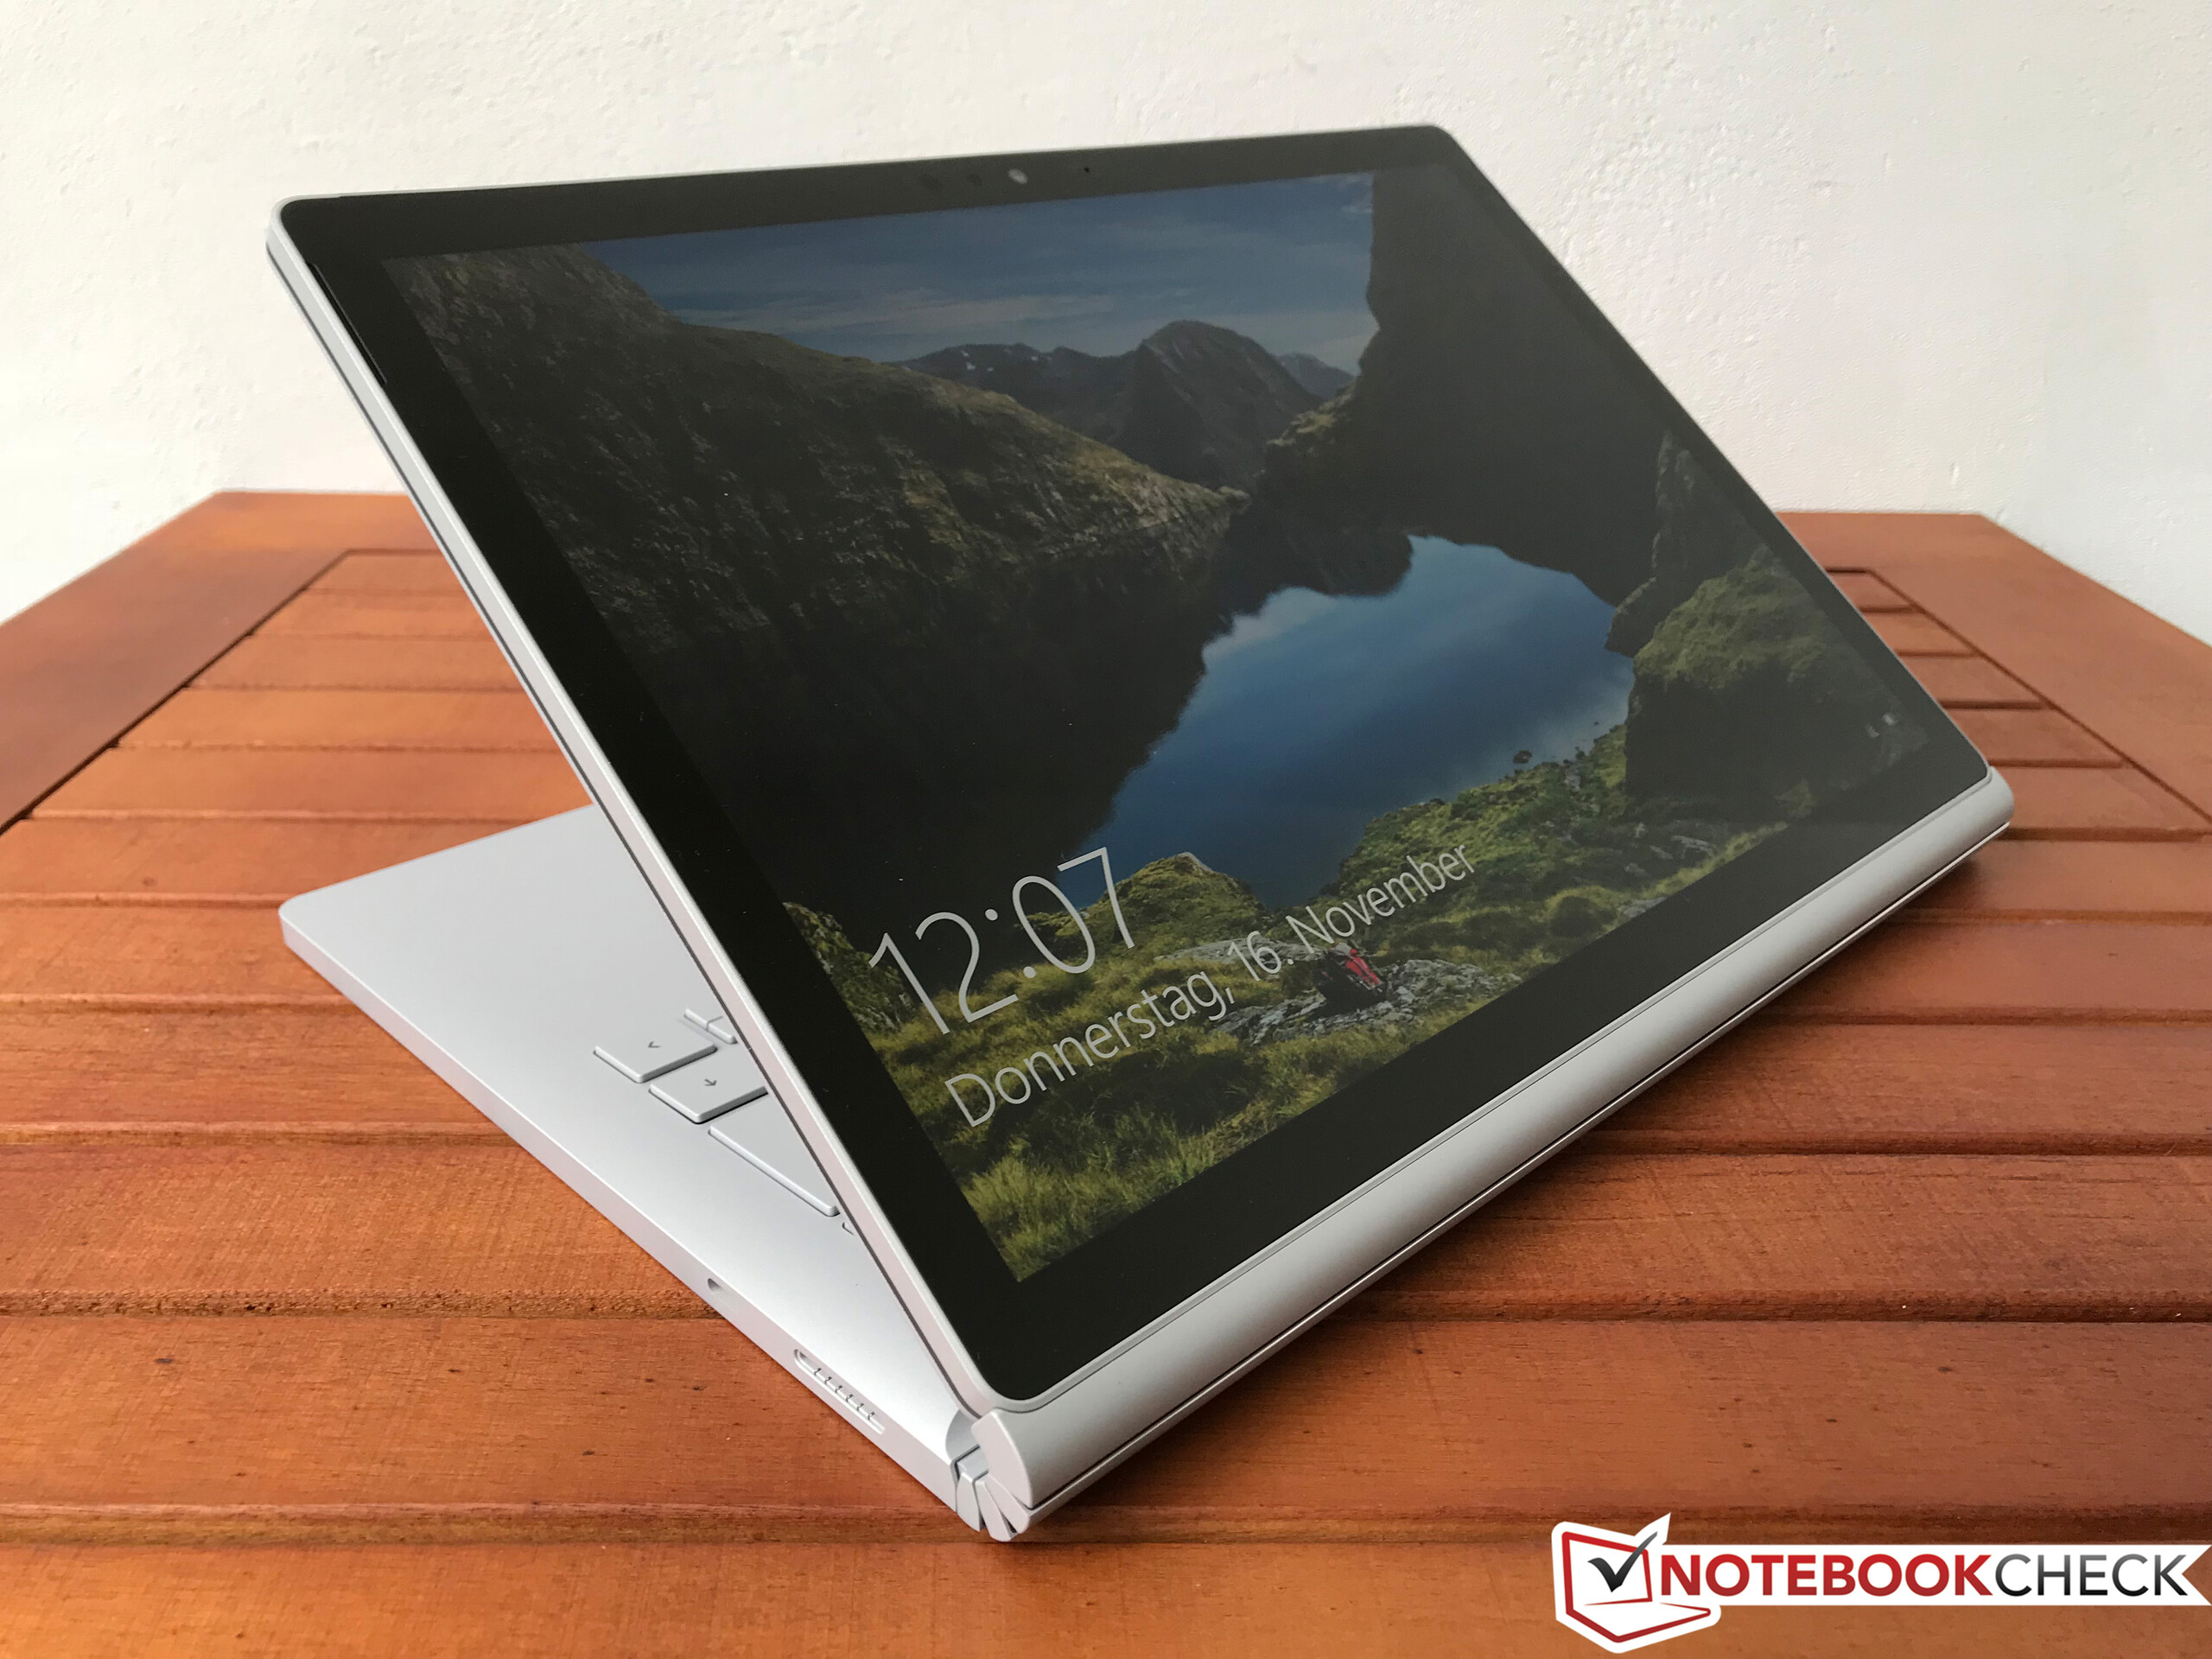
Unlike other convertibles, the maximum opening angle is limited. You have to remove the tablet section and turn it if you want to turn the display by 360 degrees. The system is a bit top heavy as a laptop, but the situation is not as bad as on the Porsche Design Book One, for example. It is still comfortable to use on the lap. The tablet itself is comparatively light at just 711 grams (~1.6 lb), and you will be pleasantly surprised when you hold it for the first time.
Connectivity
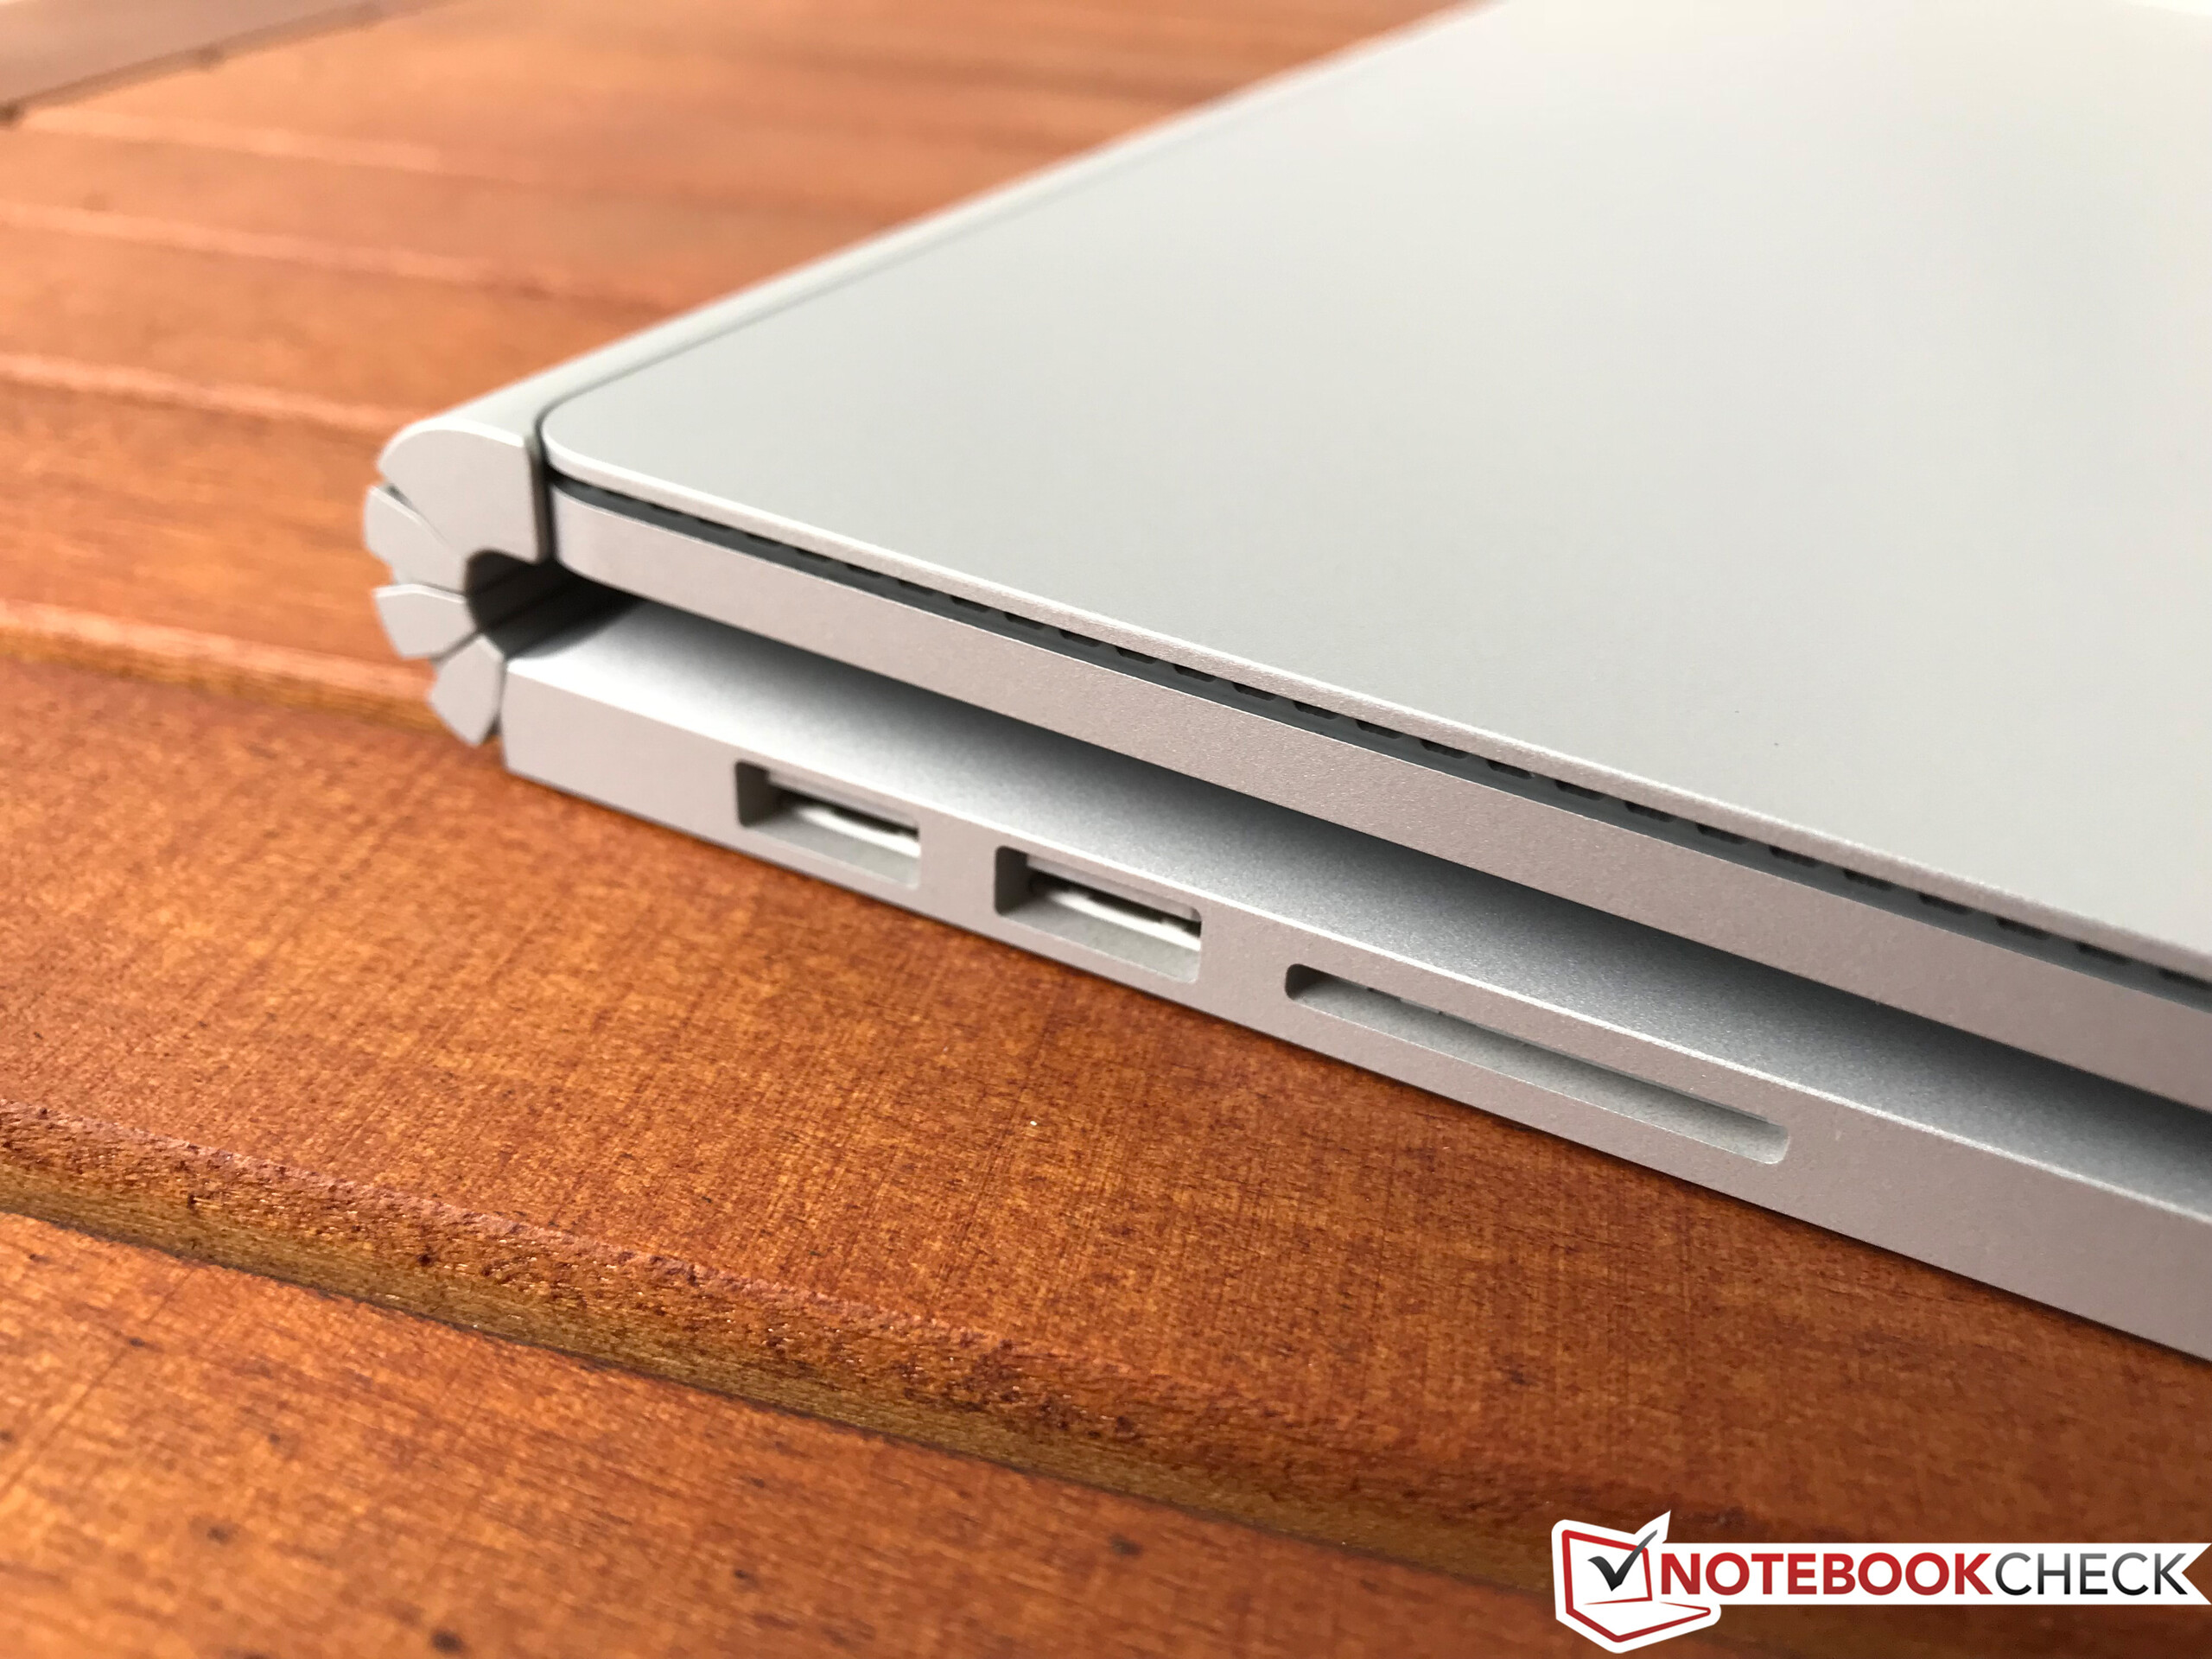
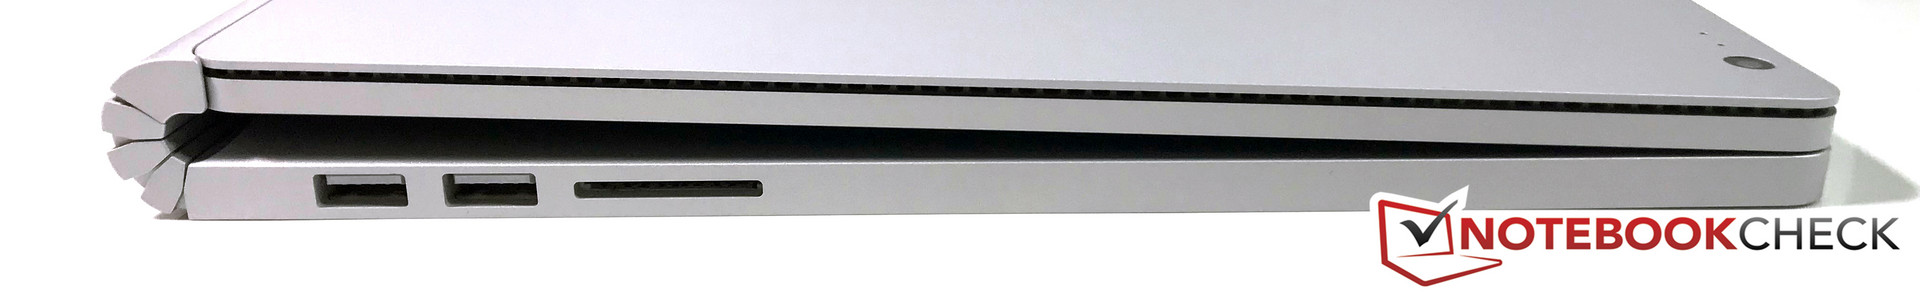
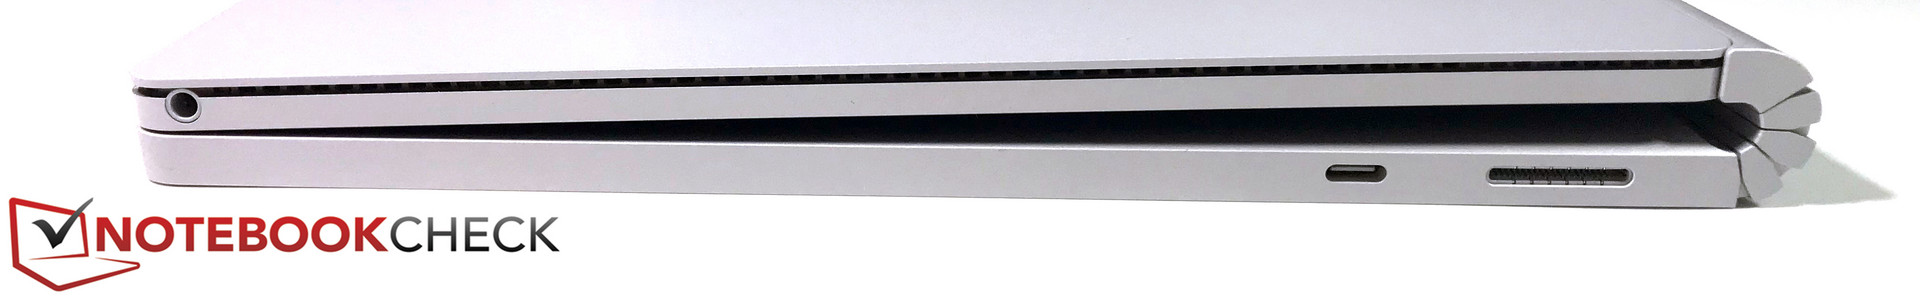
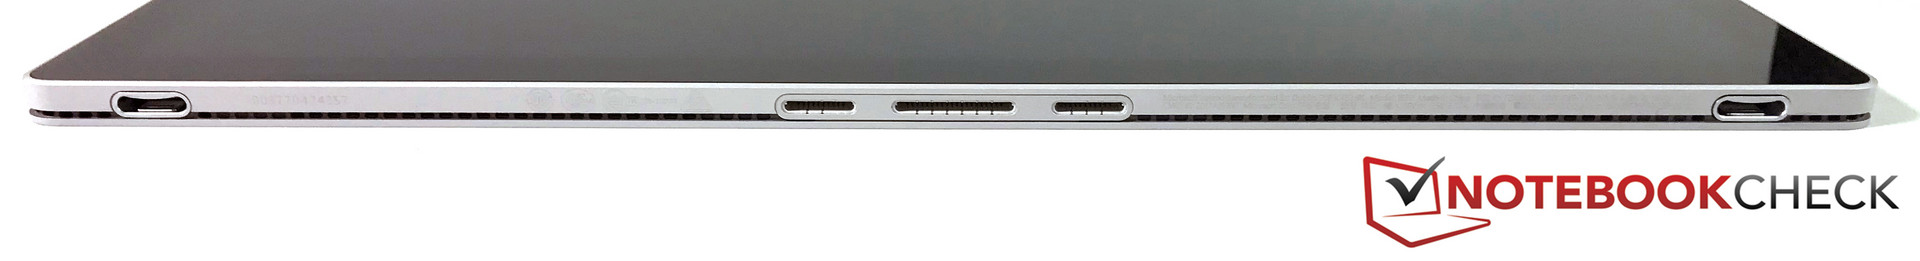
The port selection is very similar to the previous model. The Mini DisplayPort at the right side has been replaced by a USB Type-C port, but unfortunately Microsoft has not implemented a Thunderbolt 3 (there might be technical limitations because of the Surface Connector) or at least a fast USB port (3.1 Gen.2 up to 10 Gbps). We only get a conventional USB 3.1 Gen.1 port (up to 5 Gbps) with a modern connector. Video output requires a corresponding adapter; our USB-C/HDMI adapter worked flawlessly.
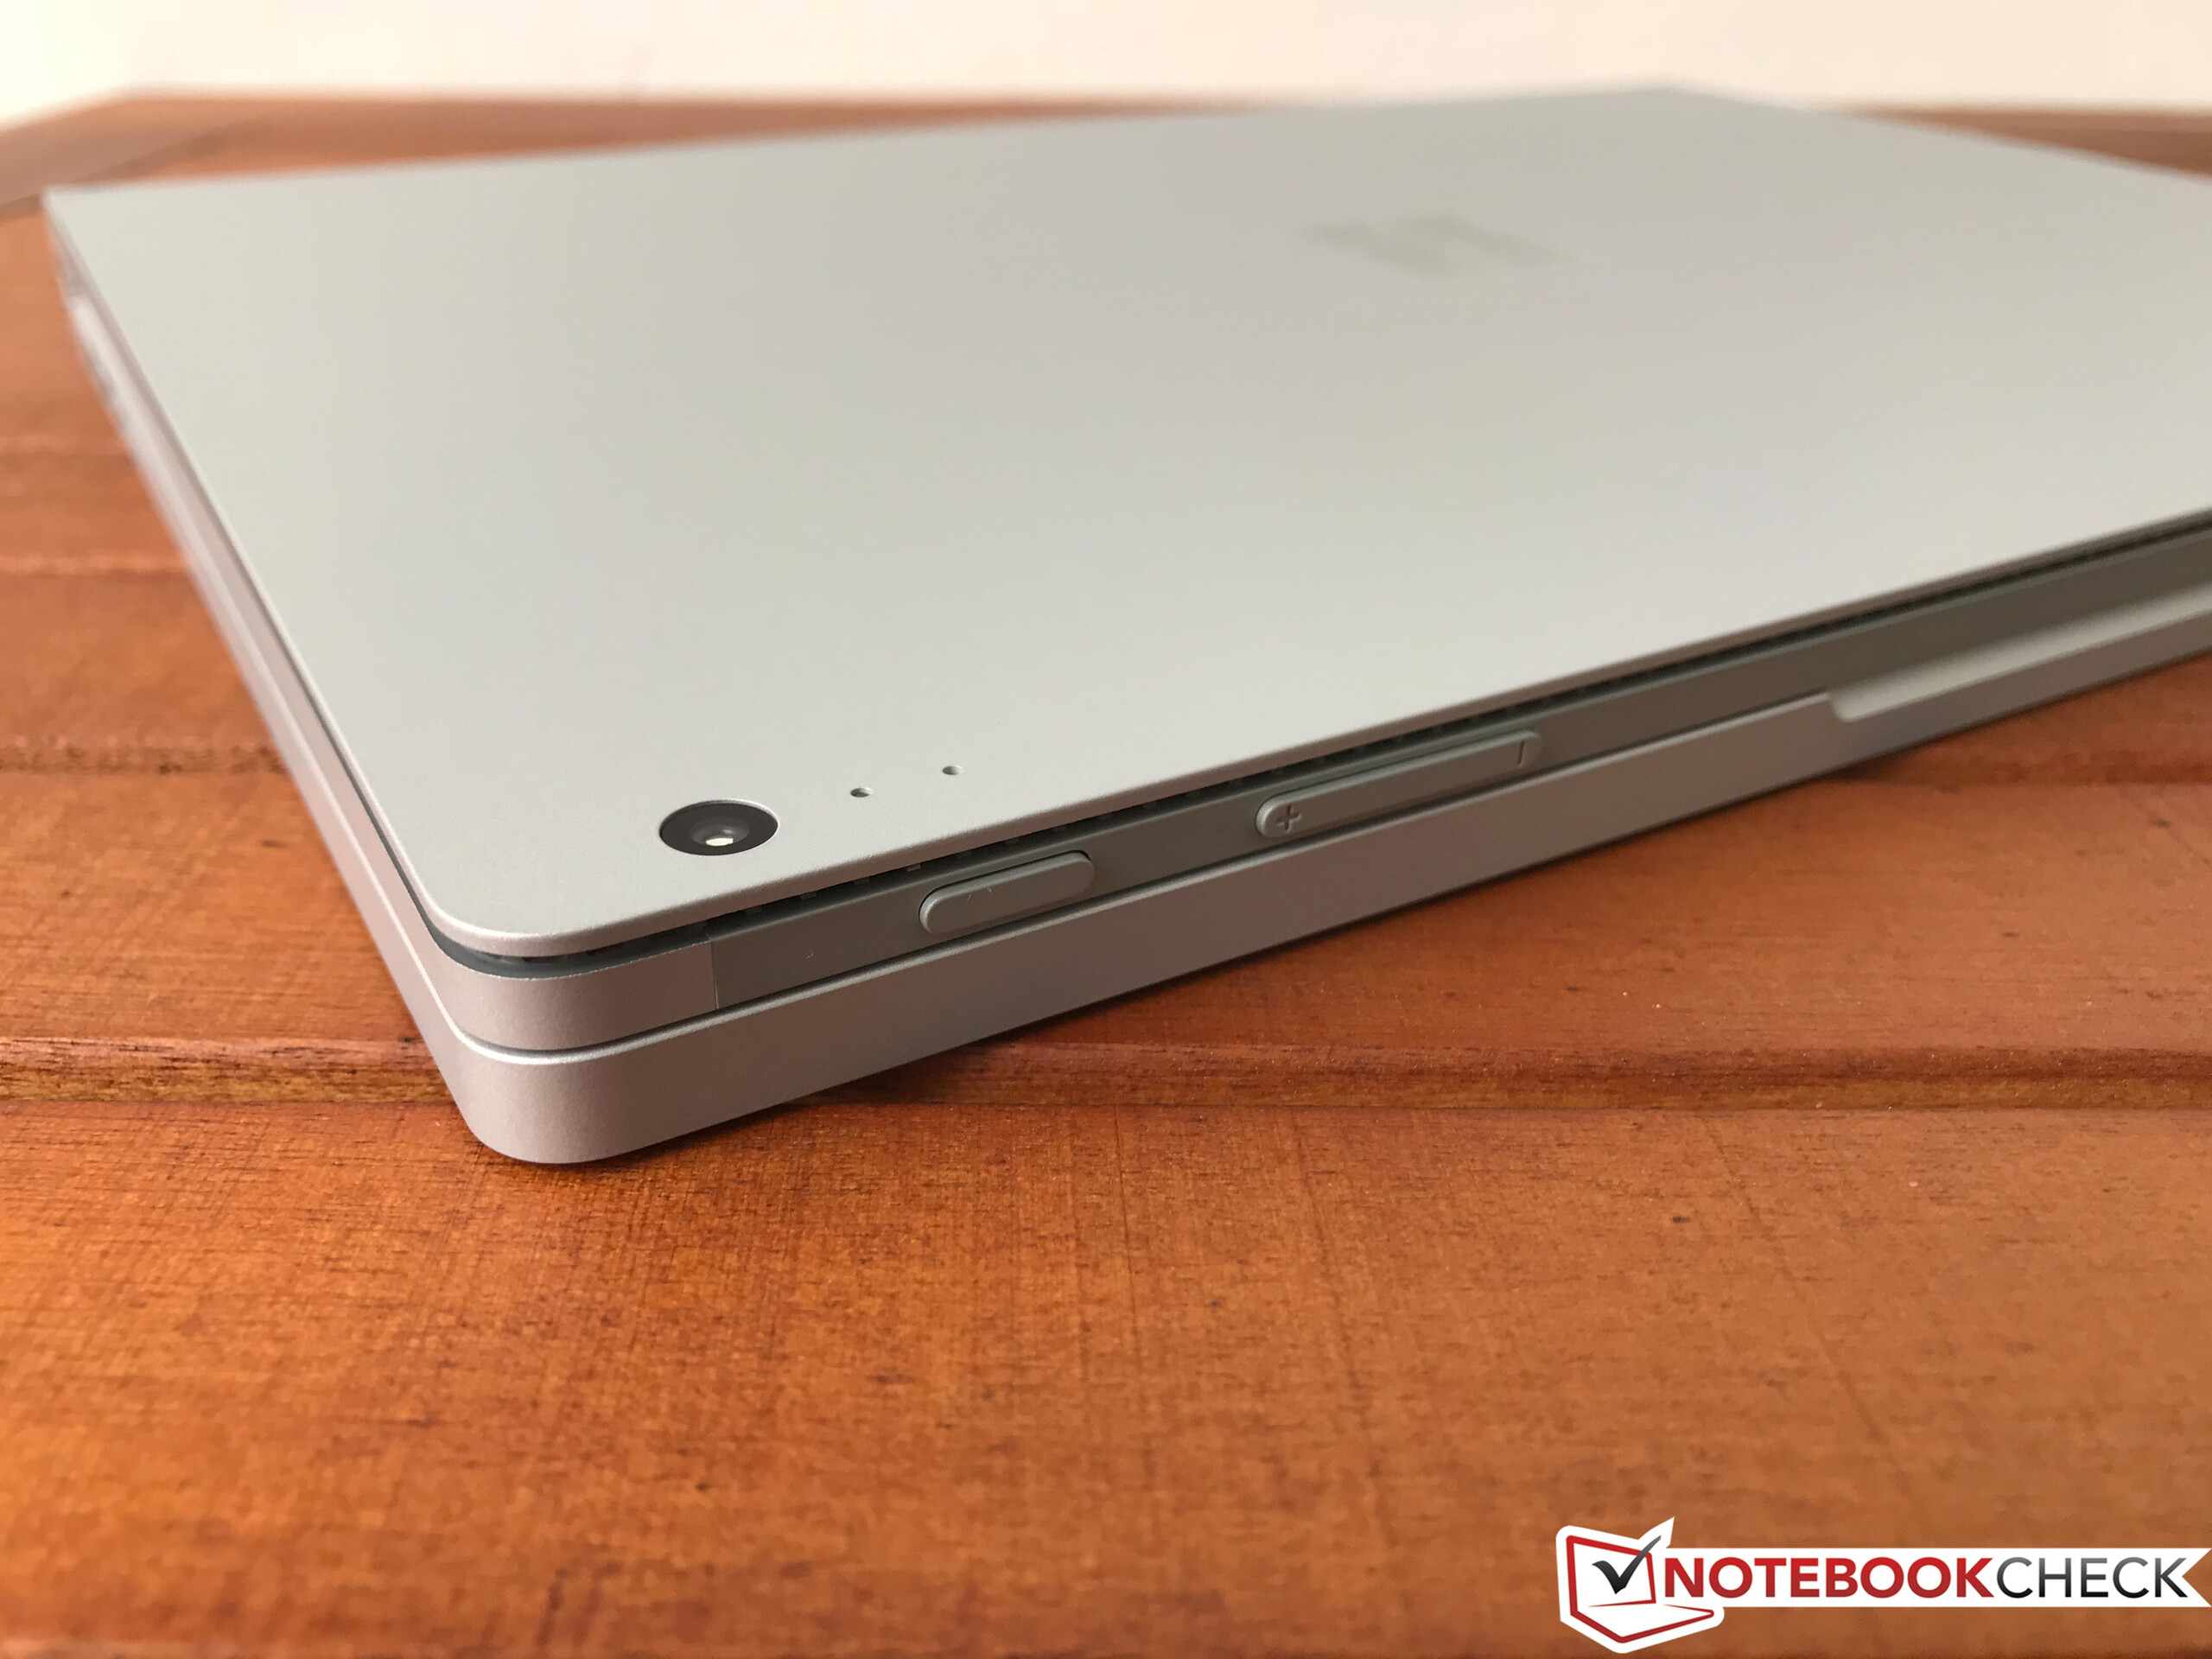
You also get two regular USB 3.0 Type-A ports as well as the SD-reader. The tablet itself provides only a regular 3.5 mm stereo jack as well as the Surface Connector at the bottom edge. We are pretty sure there would have been some space for a USB Type port (even with TB3).
Unfortunately, Microsoft has waived the Xbox Wireless support for the smaller 13.5-inch model, so you need a corresponding adapter or a Bluetooth connection. We tested the latter with a current Xbox One S controller and it worked well.
SD Card Reader
Many modern and slim devices are often equipped with microSD readers or even waive card reader completely. Unfortunately, Microsoft has equipped the Surface Book 2 with a full-size SD reader, and it is also a very fast module. Photographers will be happy, because we determine transfer rates of more than 230 MB/s in combination with our reference card from Toshiba (Exceria Pro UHS-II SDXC 64 GB), and pictures are copied at about 160 MB/s to the laptop. About one third of the memory card sticks out of the chassis, so it is not really suitable as a permanent storage expansion.
| SD Card Reader | |
| average JPG Copy Test (av. of 3 runs) | |
| Microsoft Surface Book 2 (Toshiba Exceria Pro SDXC 64 GB UHS-II) | |
| Dell XPS 13 i5-8250U (Toshiba Exceria Pro SDXC 64 GB UHS-II) | |
| Eve-Tech Eve V i5 (Toshiba Exceria microSDHC 32GB UHS-I) | |
| maximum AS SSD Seq Read Test (1GB) | |
| Microsoft Surface Book 2 (Toshiba Exceria Pro SDXC 64 GB UHS-II) | |
| Dell XPS 13 i5-8250U (Toshiba Exceria Pro SDXC 64 GB UHS-II) | |
| Eve-Tech Eve V i5 (Toshiba Exceria microSDHC 32GB UHS-I) | |
Communication
Microsoft once again uses a dual-band wireless module from Marvell (Avastar Wireless-AC). The 2x2 adapter has a maximum transfer rate of 867 Mbps and supports all common standards such as 802.11ac as well as Bluetooth 4.1. Our practical test with the router Linksys EA8500 determines ~500 Mbps. This is okay, but the Surface Book 2 is at the bottom of our comparison group. Still, we did not experience any problems during our review period; the connection was always stable and we did not notice any range issues either. Integrated LTE is unfortunately still not available.
The camera equipment has not changed compared to the predecessor. The quality of the two lenses is decent, and you will only notice picture noise in low-light situations.
Security
The security equipment is rather basic with a Trusted Platform Module (2.0) and Windows Hello for the login, but it is entirely sufficient for a consumer device.
Accessories
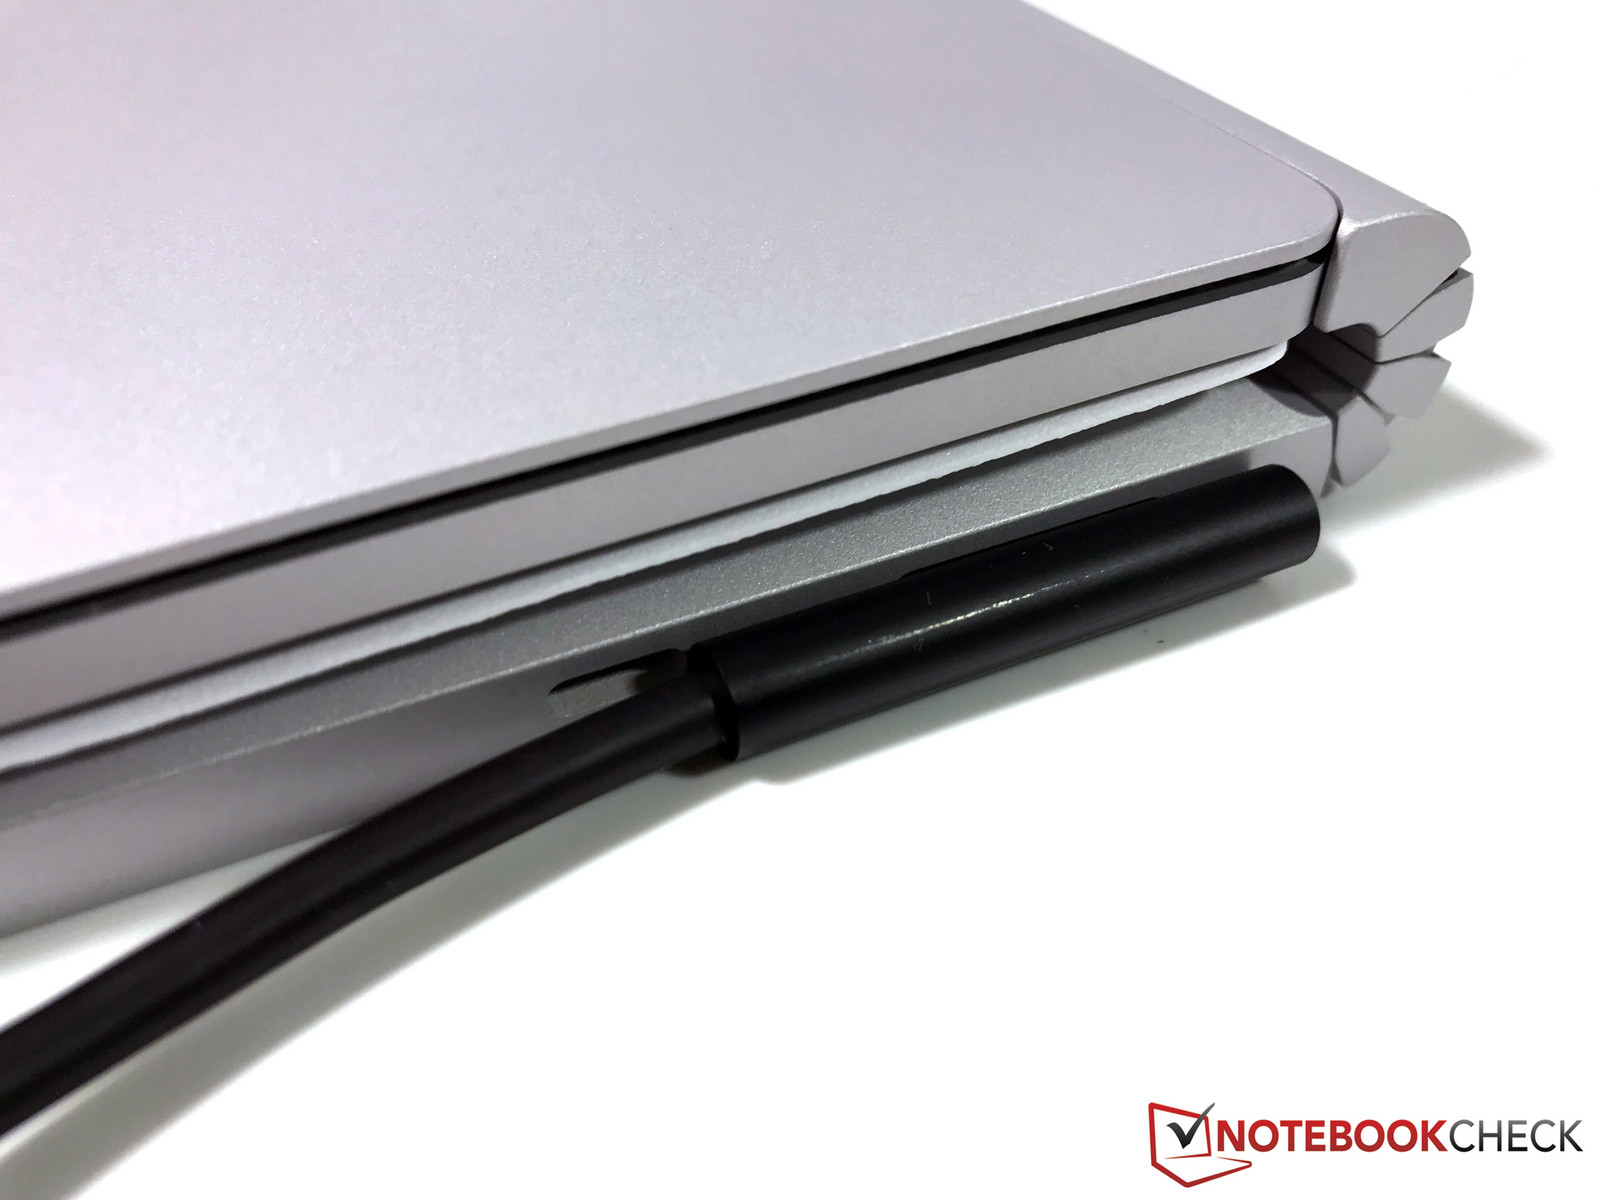
We were surprised by the box content, because you only get the convertible, a 102-W power adapter as well as some service leaflets. The first generation was shipped with the Surface Pen, which is now an optional extra. It is a new version with 4096 pressure levels and other improvements, but you will have to pay 110 Euros ($99.99). Both the Surface Dial for 110 Euros ($99.99) and the Surface Dock for 230 Euros ($199.99) are already familiar. Unfortunately, Microsoft limits the choice of accessories due to the absence of Thunderbolt 3.
Maintenance
It is basically impossible to maintain the Microsoft Surface Book 2. The SSD is a regular M.2-2280 drive, which could be replaced, but the iFixit teardown showed that this is a very complicated procedure for private users and requires special tools. You should consider how much storage space you need before you purchase the Surface Book 2.
Warranty
Despite the high price, Microsoft offers only a one-year warranty period with a Bring-In service. Please see our Guarantees, Return Policies & Warranties FAQ for country-specific information.
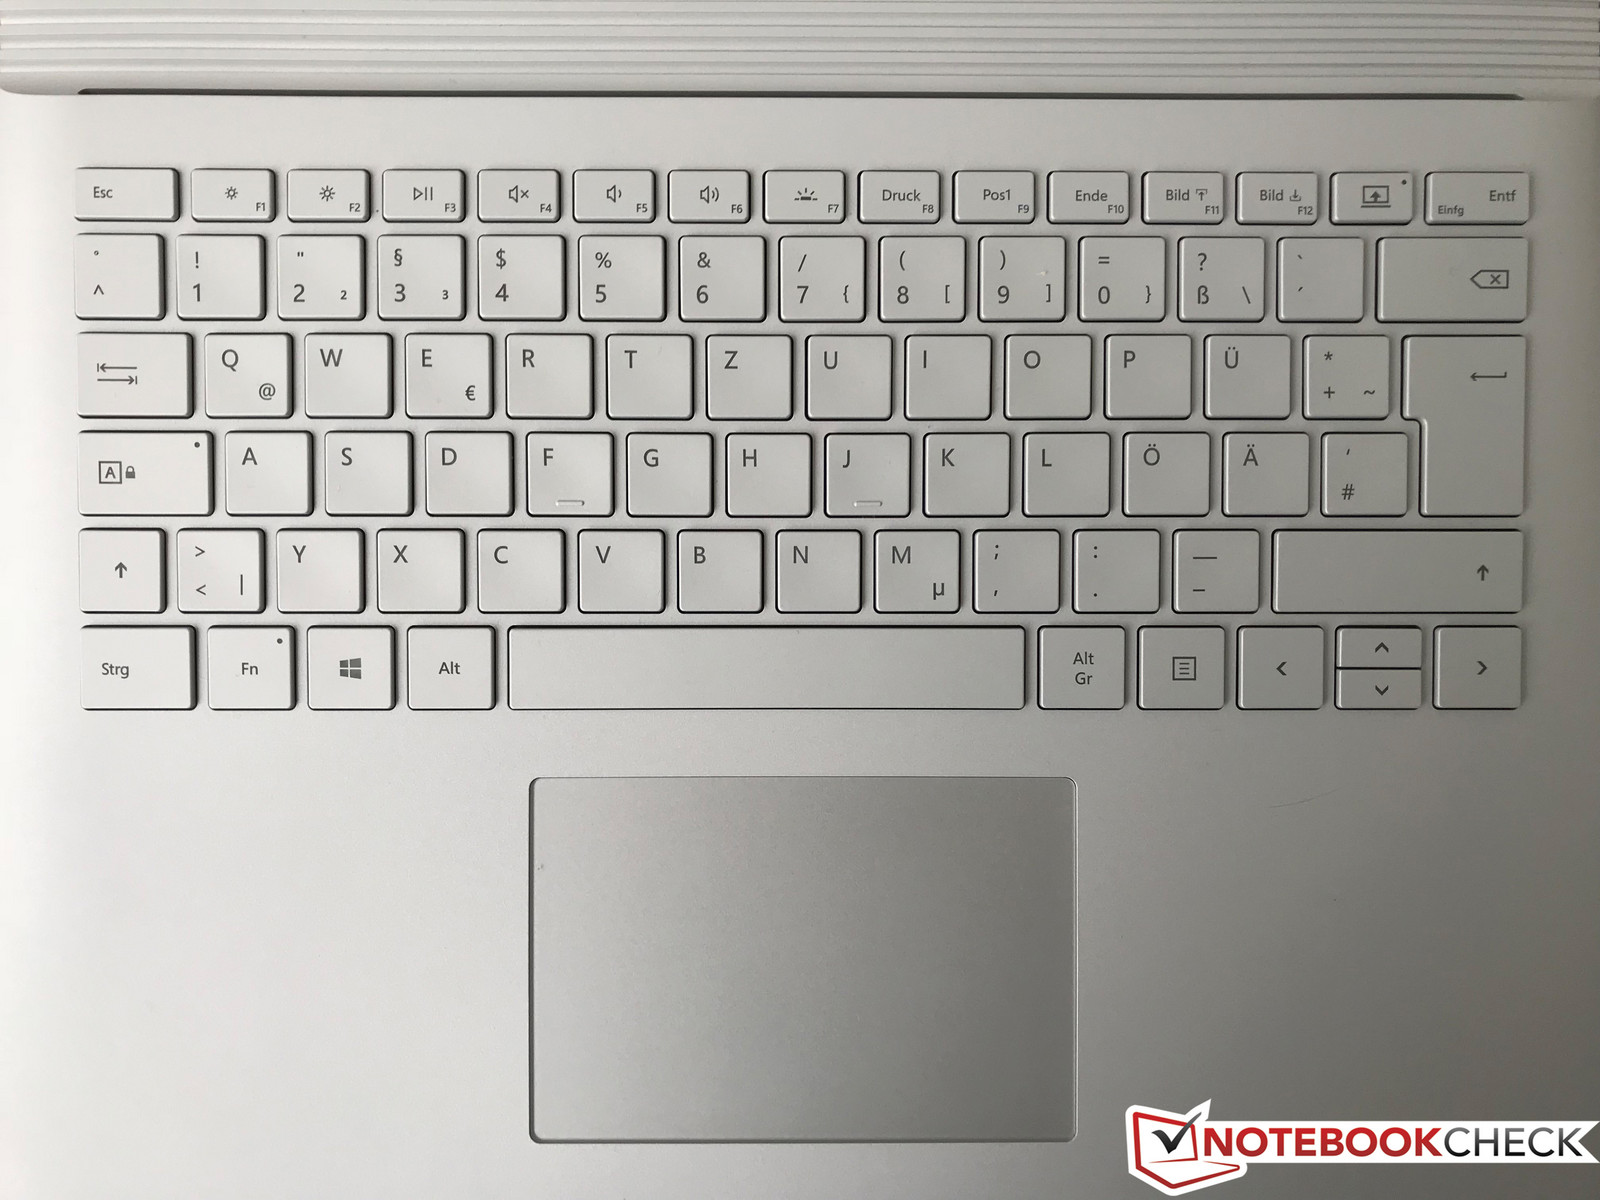
Input Devices
Keyboard
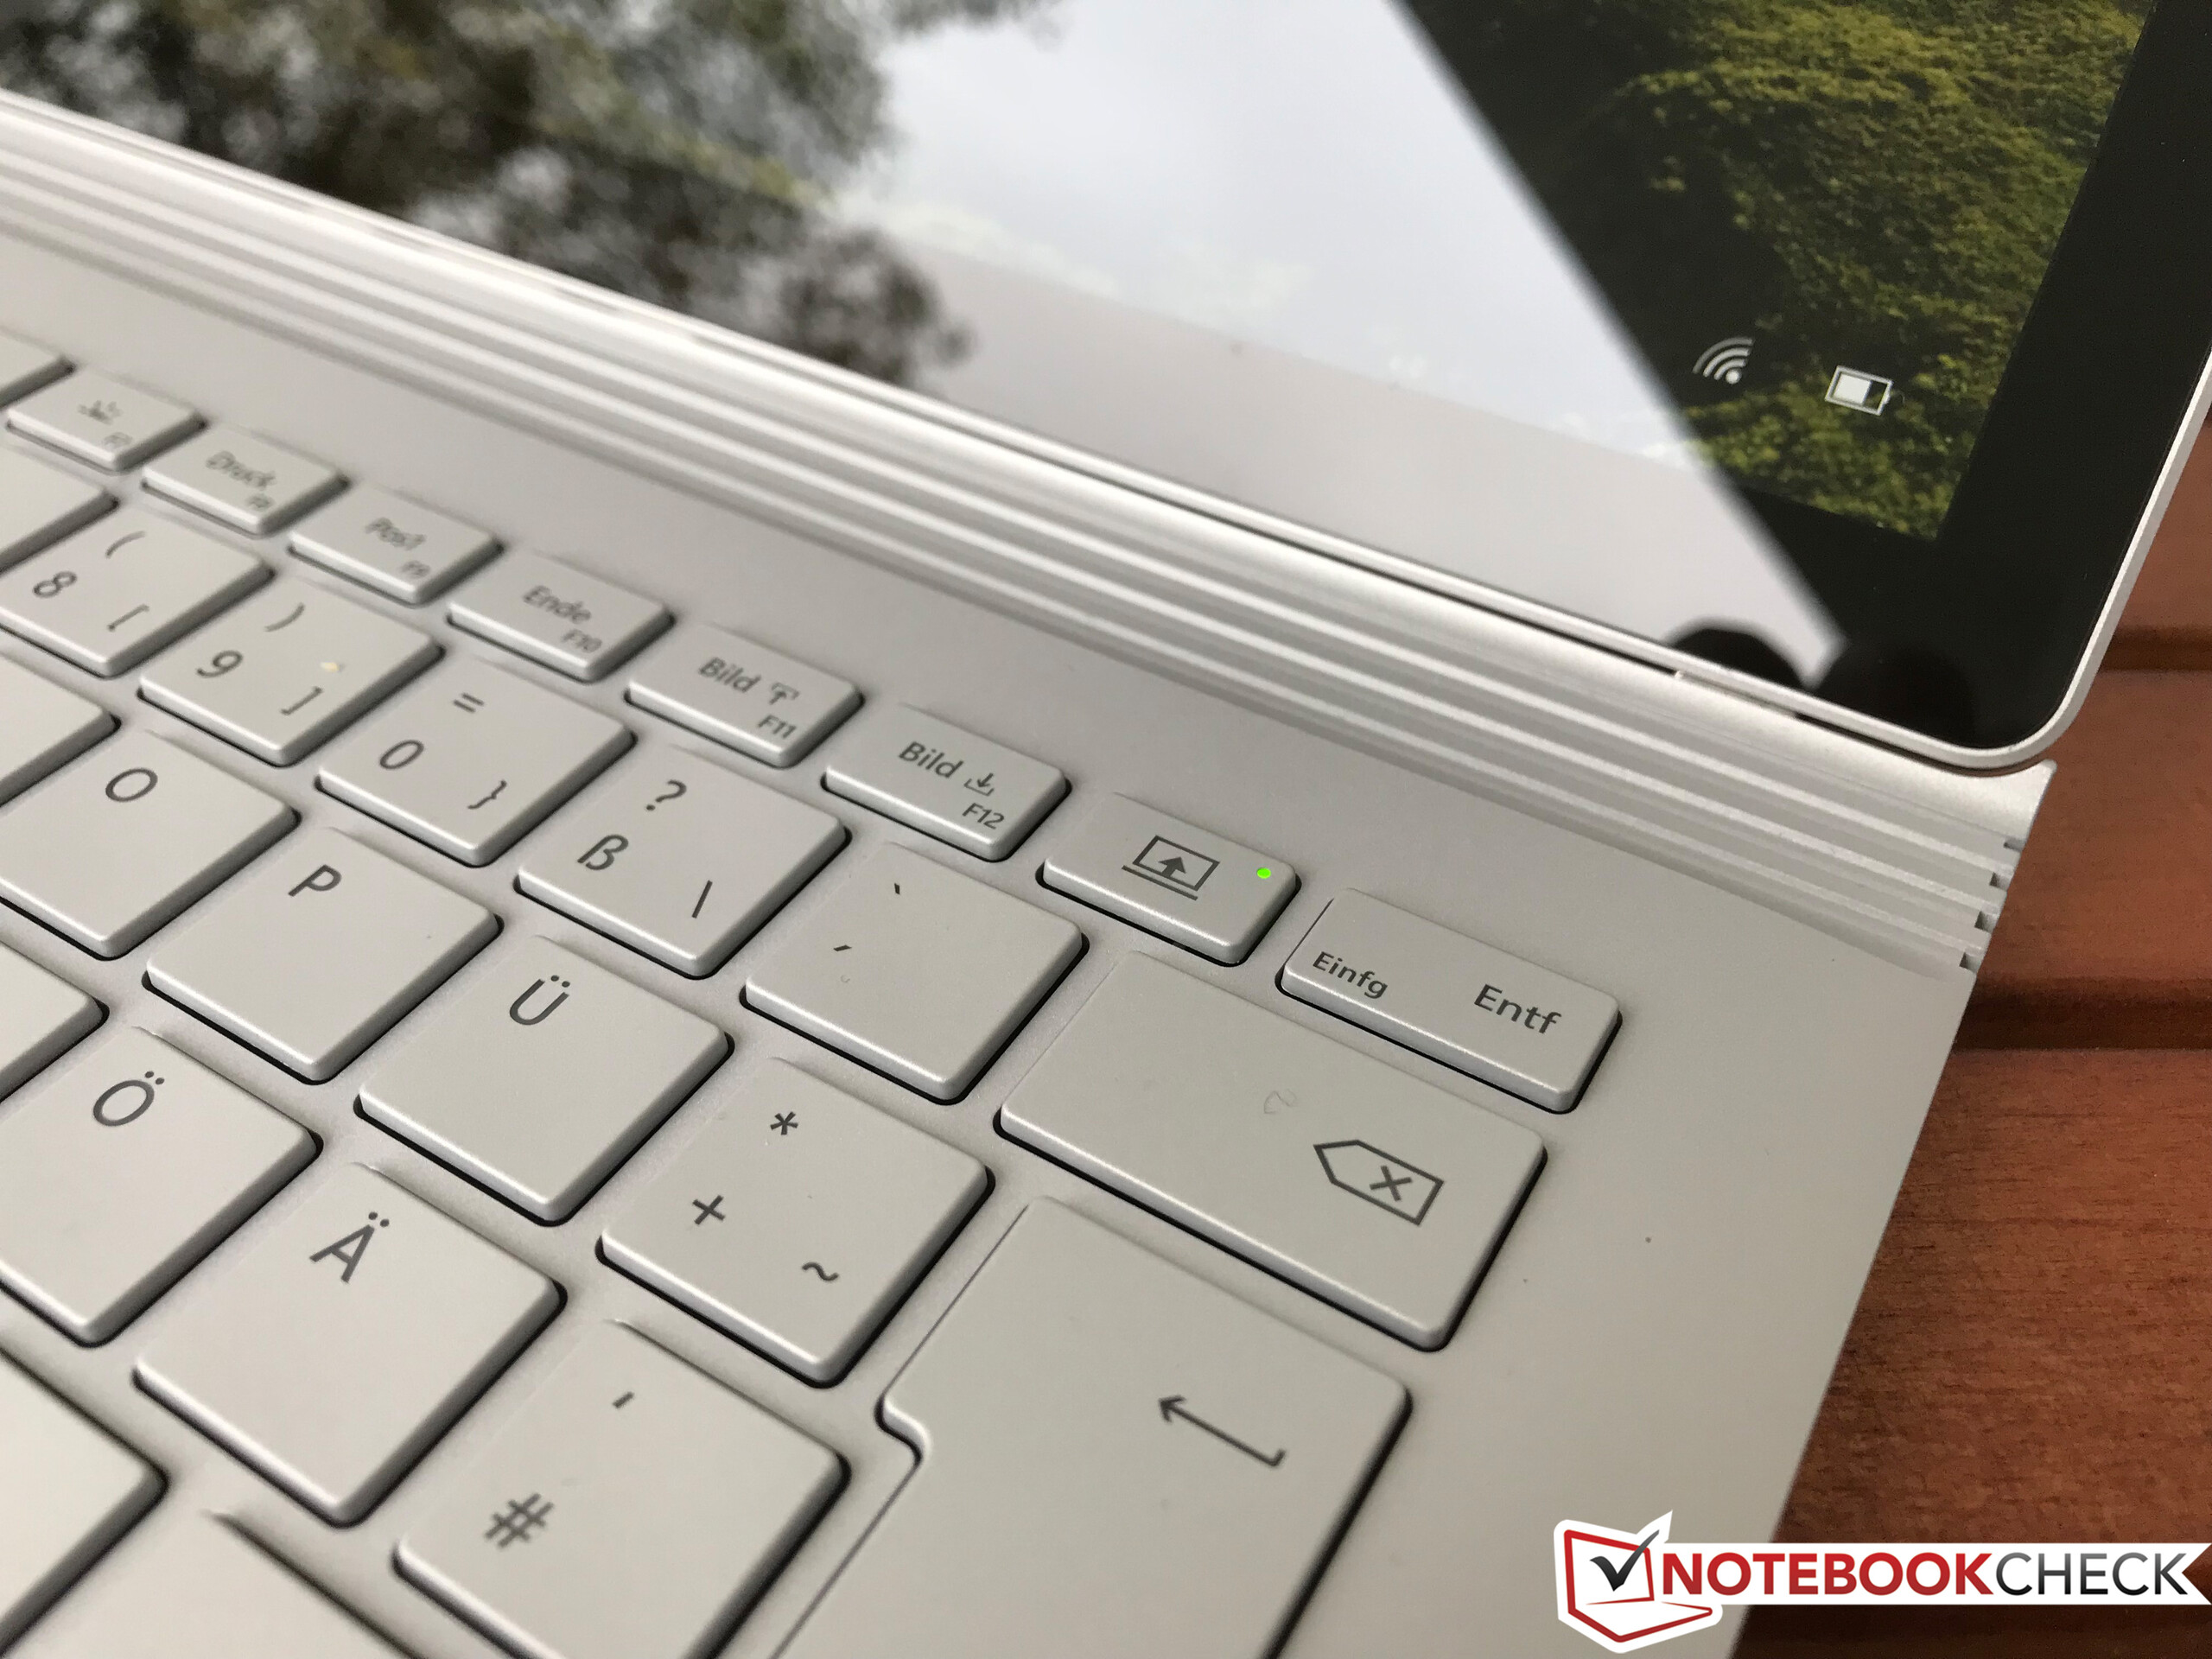
The silver colored chiclet keyboard looks identical to that of the previous model, but Microsoft has worked on the mechanics. As with the Surface Laptop, the key travel is now slightly shallower at 1.5 mm (~0.06 in), but it does not affect the comfortable typing experience. The keys are solid, provide decent feedback and the clatter is not too loud except for the space bar. We had criticized the position of the power button on the Surface Laptop (next to F12), but this spot is now occupied by the docking release. The layout is pretty standard, but the vertical arrow keys are very small. The function keys are assigned with special functions (brightness, volume, etc.) by default, but they can be changed with a push on the Fn key.
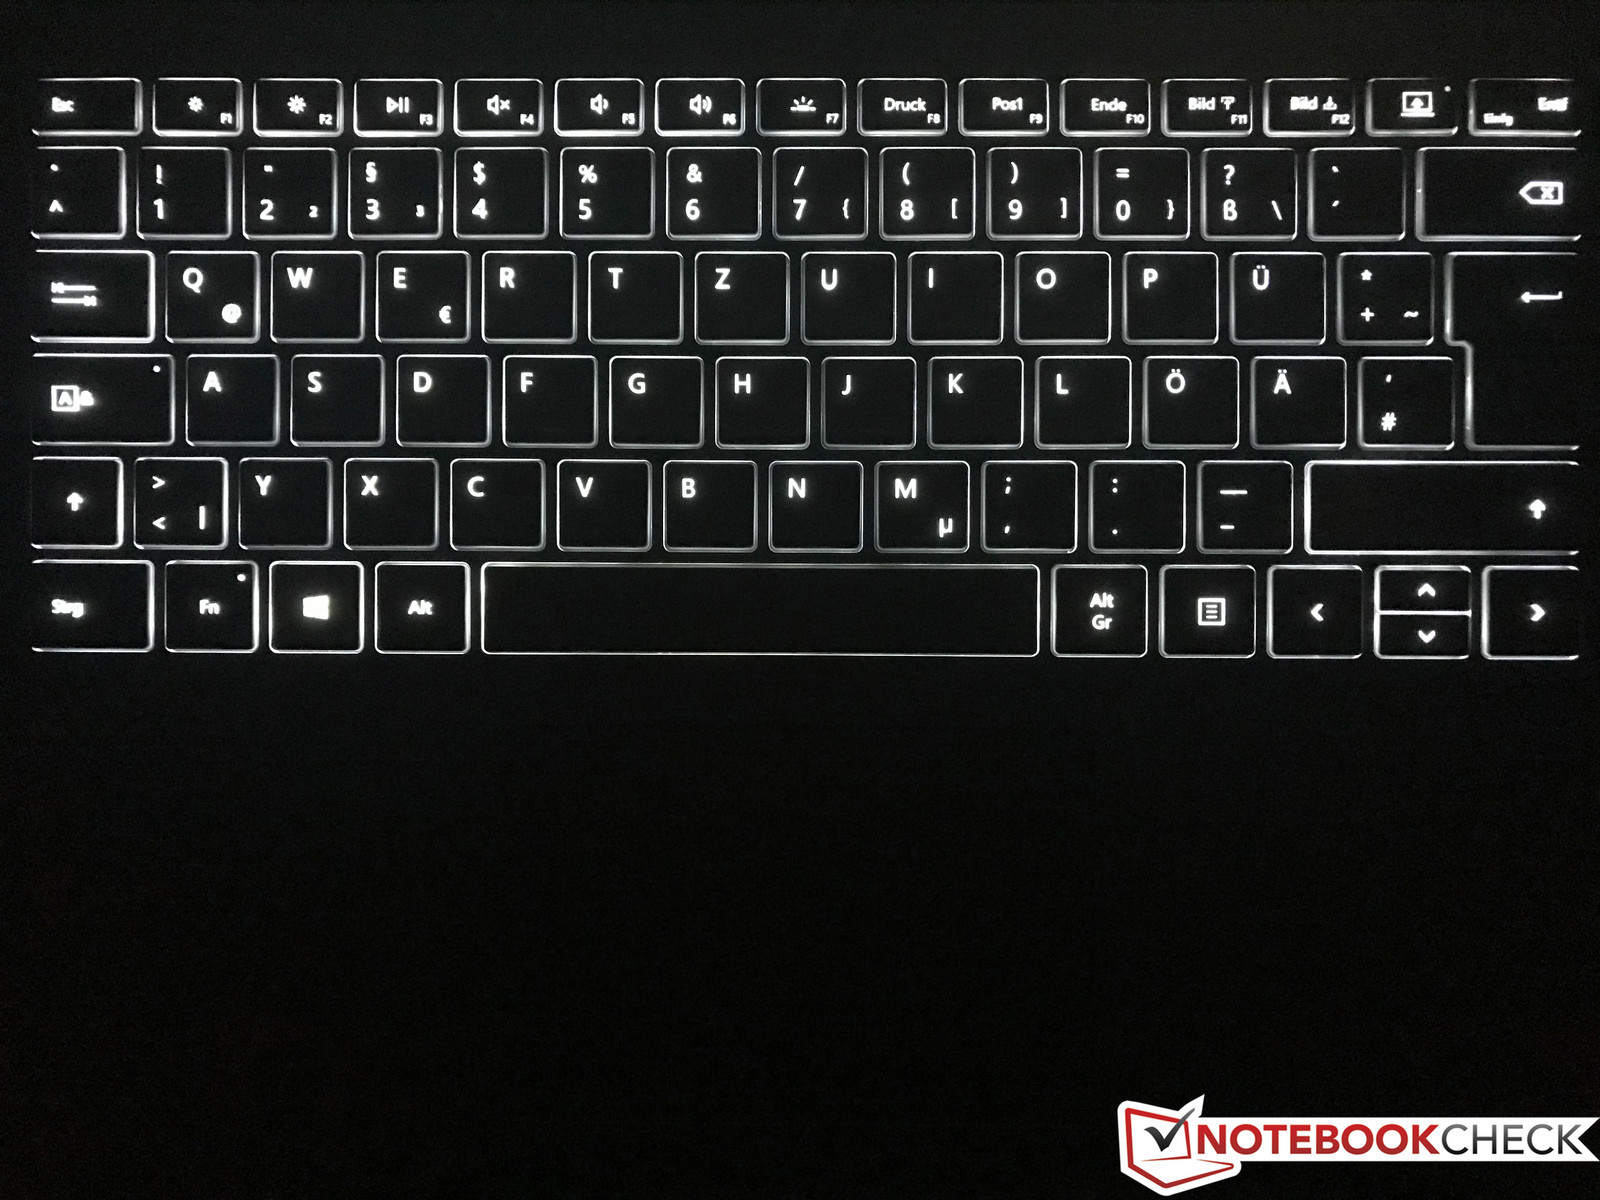
The keyboard has a white background illumination with three intensities. The Surface Book 2 shares a common problem when a keyboard has silver/bright keys. There is hardly any contrast between the keys and the illuminated lettering in low-light situations, so it is very hard to see them. We recommend the highest brightness setting when you use the illumination during the day.
Touchpad & Touchscreen
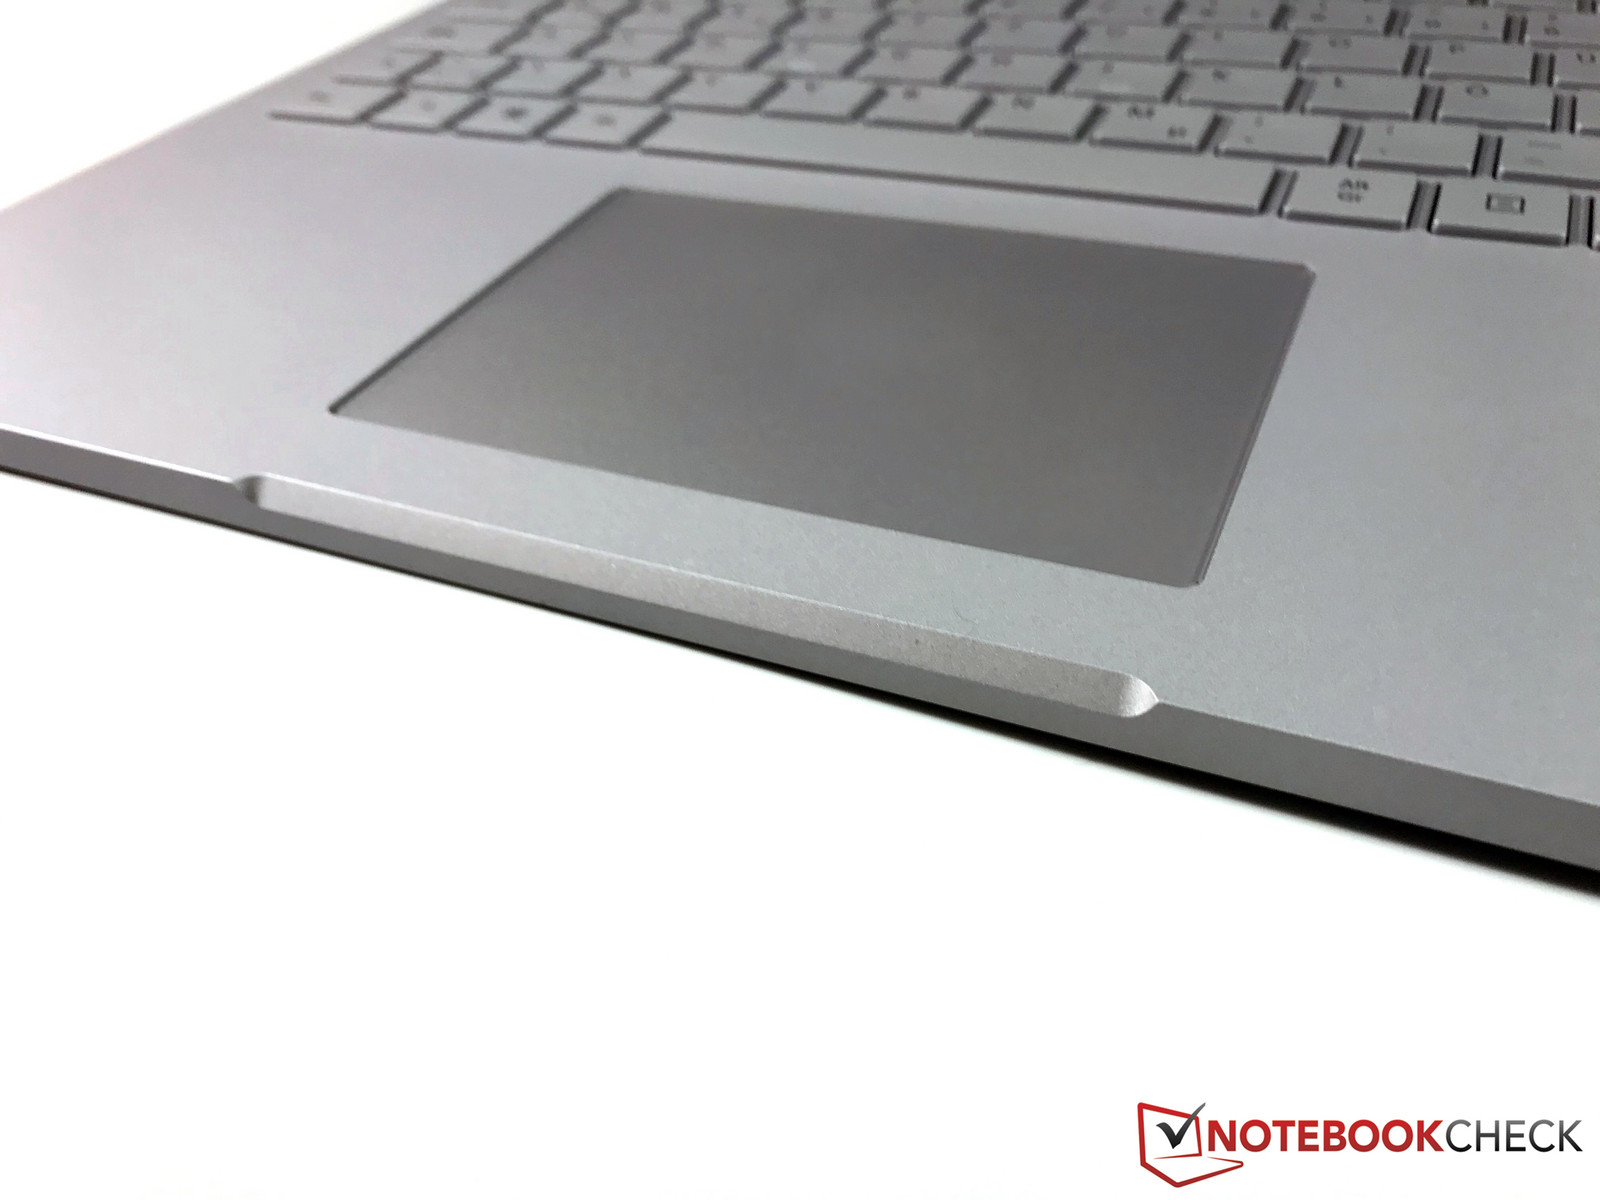
The touchpad (10.5 x 7 cm/~4.1 x 2.8 in) with its glass surface is also similar to the current Surface Laptop and we really like it. The smooth surface provides good gliding capabilities and all inputs as well as gestures are executed accurately. You can click the lower half of the pad, but travel is shallow and it creates a loud noise. However, the feedback is very good and even across the whole width. The whole handling was very comfortable during our review and we never missed an external mouse.
Finally, we want to talk about the capacitive touchscreen, which recognizes up to ten inputs simultaneously. As you would expect from an expensive convertible/tablet, there are no limitations here. One thing we noticed though is that the touchscreen is not very susceptible to fingerprints.
Display
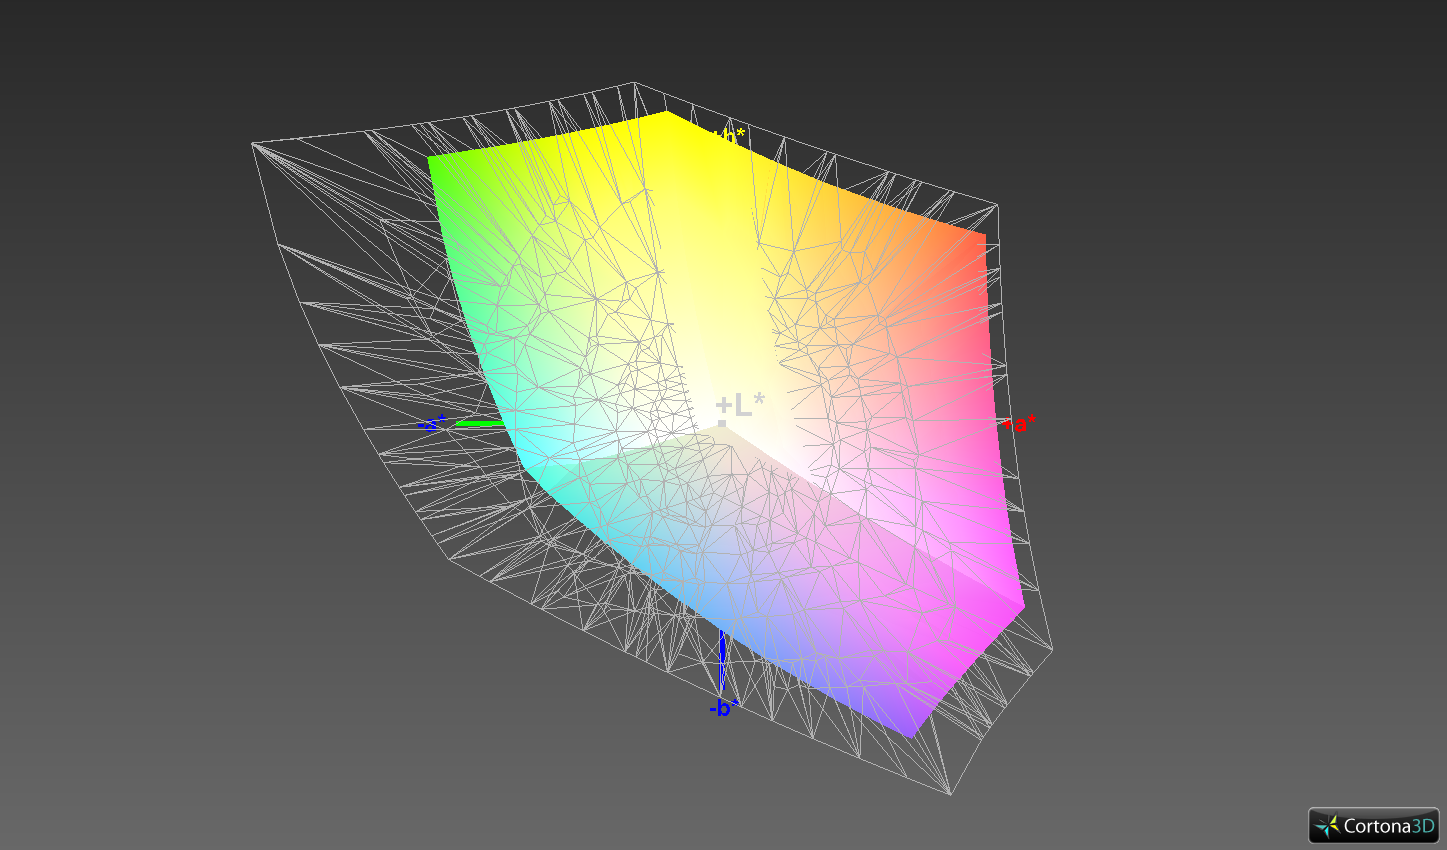
The 3:2 touchscreen has not changed and is still provided by Panasonic (MEI96A2, TDM13O56). The resolution of 3000x2000 pixels results in a pixel density of 267 PPI. Subjectively, the picture is very sharp and convinces with vivid colors.
Among others, this is a result of the high contrast ratio at more than 1800:1. This value also exceeds the old Surface Book (same panel) as well as the Surface Laptop. We can see a small shift since the screen of the new Surface Book 2 is not quite as bright, but manages a much lower black value in return (0.21).
The brightness can be automatically adjusted to the ambient light thanks to the light sensor. We think the operating range is a bit too narrow though, and stays too close to the pre-set value. We often had to manually adjust the luminance.
Microsoft has implemented a high-quality panel without PWM – there is no screen flickering at any brightness level. Backlight bleeding is not a big issue either. You can only see minor spots at the top and bottom edge at the maximum luminance on dark pictures.
Screen Flickering / PWM (Pulse-Width Modulation)
| Screen flickering / PWM not detected |  | ||
In comparison: 53 % of all tested devices do not use PWM to dim the display. If PWM was detected, an average of 8073 (minimum: 5 - maximum: 343500) Hz was measured. | |||
| |||||||||||||||||||||||||
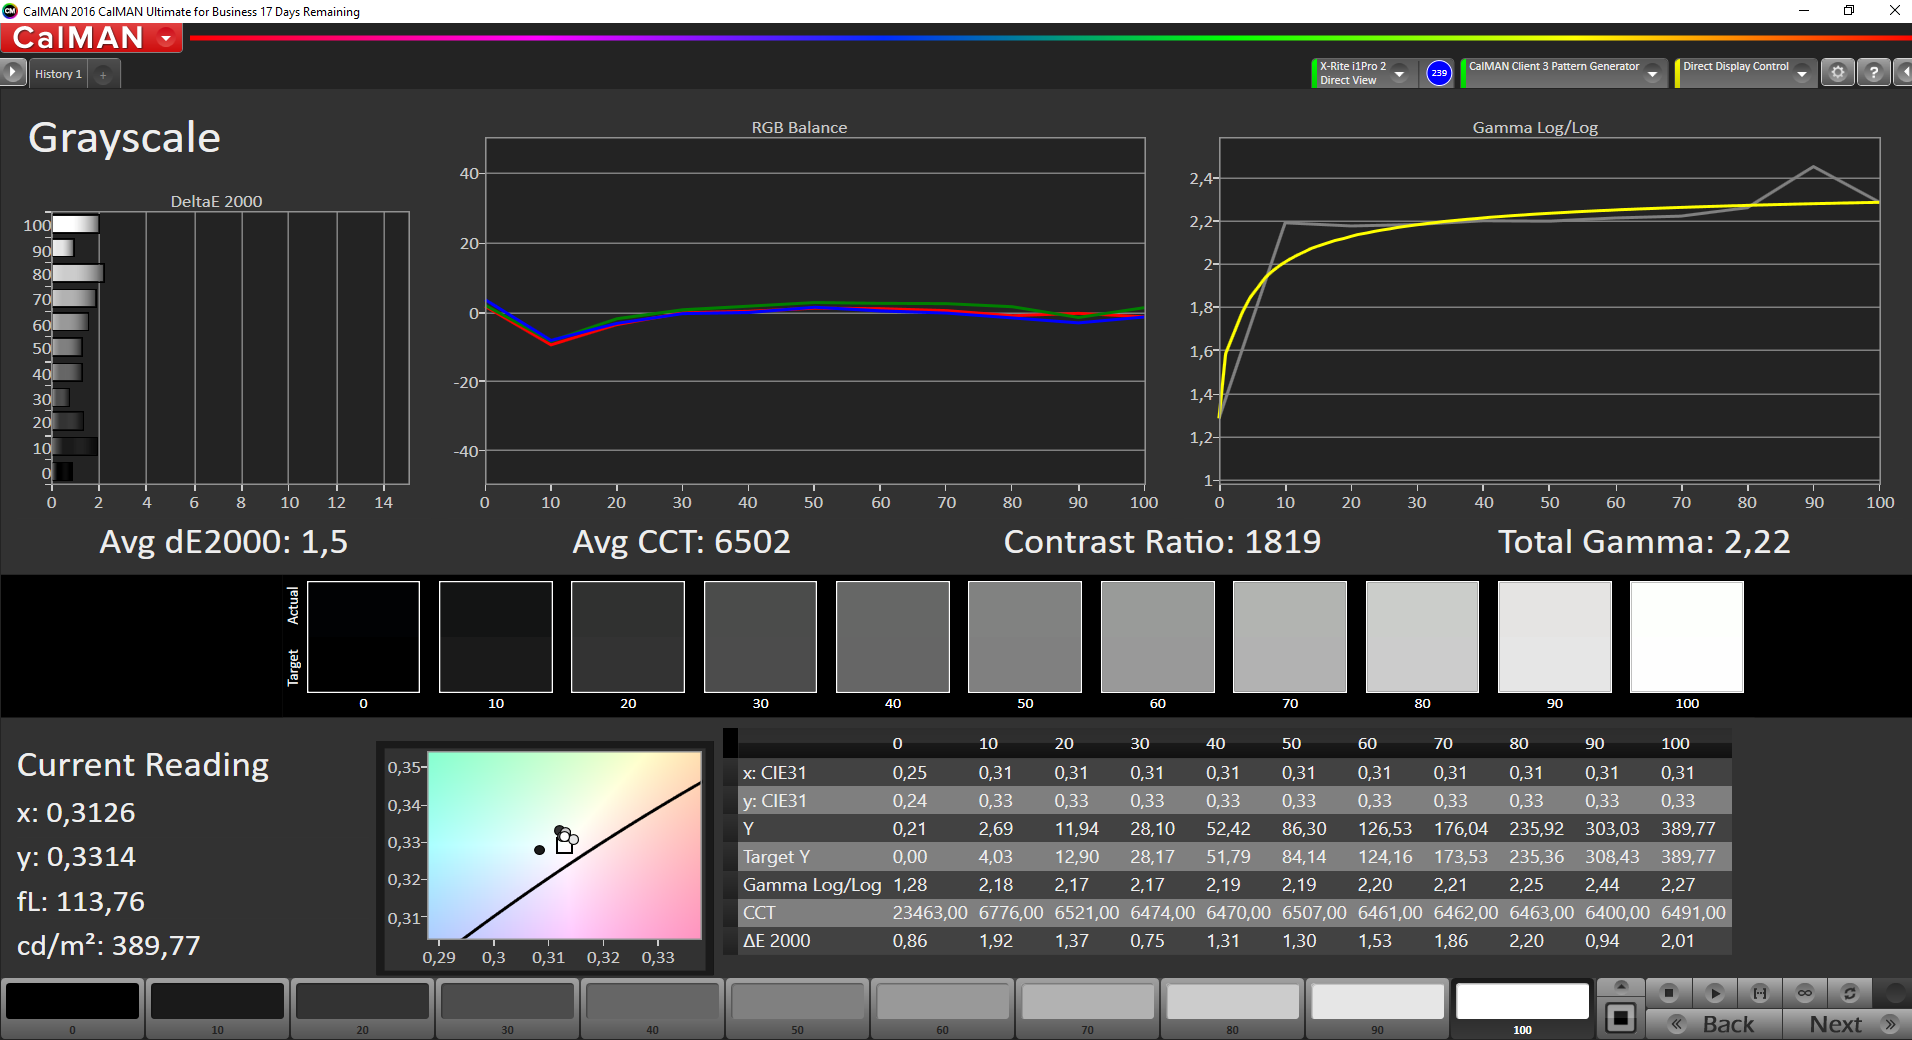
Brightness Distribution: 89 %
Center on Battery: 385 cd/m²
Contrast: 1833:1 (Black: 0.21 cd/m²)
ΔE ColorChecker Calman: 1.6 | ∀{0.5-29.43 Ø4.77}
ΔE Greyscale Calman: 1.5 | ∀{0.09-98 Ø5}
95.9% sRGB (Argyll 1.6.3 3D)
64% AdobeRGB 1998 (Argyll 1.6.3 3D)
69.4% AdobeRGB 1998 (Argyll 3D)
95.7% sRGB (Argyll 3D)
67.9% Display P3 (Argyll 3D)
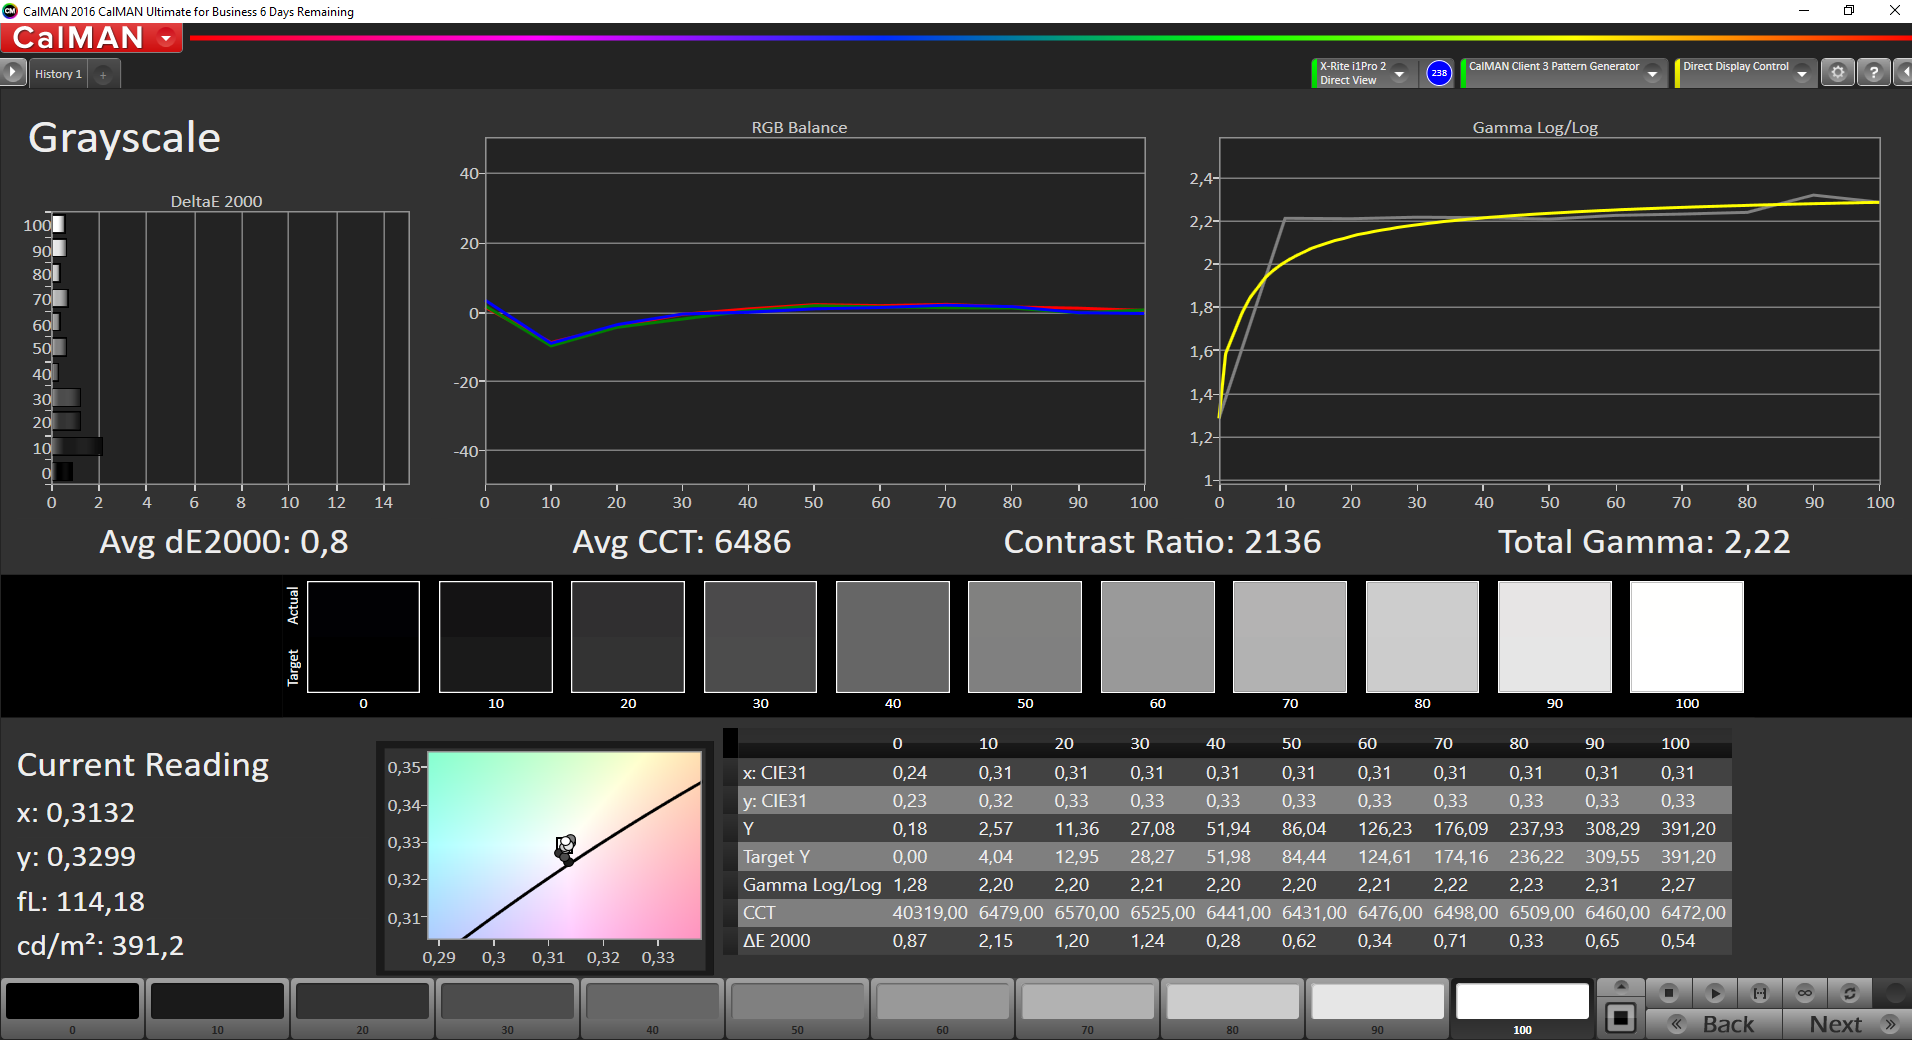
Gamma: 2.22
CCT: 6502 K
| Microsoft Surface Book 2 Panasonic MEI96A2 , , 3000x2000, 13.5" | Microsoft Surface Book with Performance Base Panasonic MEI96A2, , 3000x2000, 13.5" | Lenovo Yoga 920-13IKB-80Y7 AU Optronics B139HAN03.0, , 1920x1080, 13.9" | Microsoft Surface Pro 4 Core i7 Samsung 123YL01-001 ID: SDC3853, , 2736x1824, 12.3" | Microsoft Surface Laptop i5 ID: MEI96A2, Name: Panasonic VVX14T092N00, , 2256x1504, 13.5" | Apple MacBook Pro 13 2017 Touchbar i5 APPA034, , 2560x1600, 13.3" | Razer Blade (2017) LP140WF3-SPD1, , 1920x1080, 14" | Gigabyte Aero 14-K7 LG Philips LP140QH1-SPF1 (LGD049A), , 2560x1440, 14" | Eve-Tech Eve V i5 Sharp LQ123Z1JX3X, , 2880x1920, 12.3" | |
|---|---|---|---|---|---|---|---|---|---|
| Display | -2% | -7% | 0% | -0% | 25% | -5% | 2% | ||
| Display P3 Coverage (%) | 67.9 | 66.4 -2% | 62.5 -8% | 66.9 -1% | 67.8 0% | 98.6 45% | 65.1 -4% | 68.2 0% | |
| sRGB Coverage (%) | 95.7 | 95.4 0% | 91.7 -4% | 97.5 2% | 94.3 -1% | 100 4% | 91.2 -5% | 99.8 4% | |
| AdobeRGB 1998 Coverage (%) | 69.4 | 67.6 -3% | 64.1 -8% | 68.6 -1% | 69.5 0% | 86.5 25% | 65.9 -5% | 70 1% | |
| Response Times | -20% | 4% | -6% | -10% | -2% | 35% | 20% | -3% | |
| Response Time Grey 50% / Grey 80% * (ms) | 52.8 ? | 61 ? -16% | 46 ? 13% | 48.4 ? 8% | 50.8 ? 4% | 48 ? 9% | 25.2 ? 52% | 40 ? 24% | 49.1 ? 7% |
| Response Time Black / White * (ms) | 30 ? | 37 ? -23% | 31.6 ? -5% | 35.6 ? -19% | 37.2 ? -24% | 33.6 ? -12% | 24.8 ? 17% | 25.2 ? 16% | 33.6 ? -12% |
| PWM Frequency (Hz) | 10420 | 119000 ? | 21370 | 130 ? | 985 ? | ||||
| Screen | -17% | -94% | -7% | -10% | 8% | -62% | -59% | -22% | |
| Brightness middle (cd/m²) | 385 | 459 19% | 297.9 -23% | 436.7 13% | 384.2 0% | 551 43% | 272 -29% | 277 -28% | 471 22% |
| Brightness (cd/m²) | 372 | 423 14% | 278 -25% | 433 16% | 378 2% | 514 38% | 277 -26% | 252 -32% | 433 16% |
| Brightness Distribution (%) | 89 | 86 -3% | 81 -9% | 87 -2% | 90 1% | 88 -1% | 84 -6% | 84 -6% | 85 -4% |
| Black Level * (cd/m²) | 0.21 | 0.37 -76% | 0.44 -110% | 0.326 -55% | 0.36 -71% | 0.48 -129% | 0.26 -24% | 0.27 -29% | 0.32 -52% |
| Contrast (:1) | 1833 | 1241 -32% | 677 -63% | 1340 -27% | 1067 -42% | 1148 -37% | 1046 -43% | 1026 -44% | 1472 -20% |
| Colorchecker dE 2000 * | 1.6 | 2.28 -43% | 5.1 -219% | 1.82 -14% | 1.8 -13% | 0.8 50% | 4.59 -187% | 4.26 -166% | 2.2 -38% |
| Colorchecker dE 2000 max. * | 4.5 | 3.61 20% | 11 -144% | 4.2 7% | 1.4 69% | 8.49 -89% | 8.37 -86% | 5.6 -24% | |
| Greyscale dE 2000 * | 1.5 | 2.48 -65% | 6.7 -347% | 1.44 4% | 1.2 20% | 1 33% | 4.28 -185% | 4.32 -188% | 3.4 -127% |
| Gamma | 2.22 99% | 2.5 88% | 2.9 76% | 2.1 105% | 2.21 100% | 2.16 102% | 2.23 99% | 2.37 93% | 2.2 100% |
| CCT | 6502 100% | 8602 76% | 6839 95% | 6560 99% | 6708 97% | 6672 97% | 6848 95% | 7298 89% | 6270 104% |
| Color Space (Percent of AdobeRGB 1998) (%) | 64 | 62 -3% | 64.1 0% | 62.3 -3% | 63.7 0% | 55 -14% | 59 -8% | 70 9% | |
| Color Space (Percent of sRGB) (%) | 95.9 | 96 0% | 91.7 -4% | 97.5 2% | 94.2 -2% | 83 -13% | 91 -5% | 92.99 -3% | |
| Total Average (Program / Settings) | -13% /
-14% | -32% /
-64% | -4% /
-6% | -7% /
-8% | 10% /
11% | -14% /
-46% | -15% /
-38% | -8% /
-15% |
* ... smaller is better
The measurement results for the Surface Book 2 are already excellent ex-works. Only some colors deviate a bit, but only red exceeds the important DeltaE-2000 mark of 3. A calibration is not really necessary in this case. The Surface Book 2 also performs well within our comparison group; only the Apple MacBook Pro 13 manages better results out of the box, but suffers a bit from the higher black value in return.
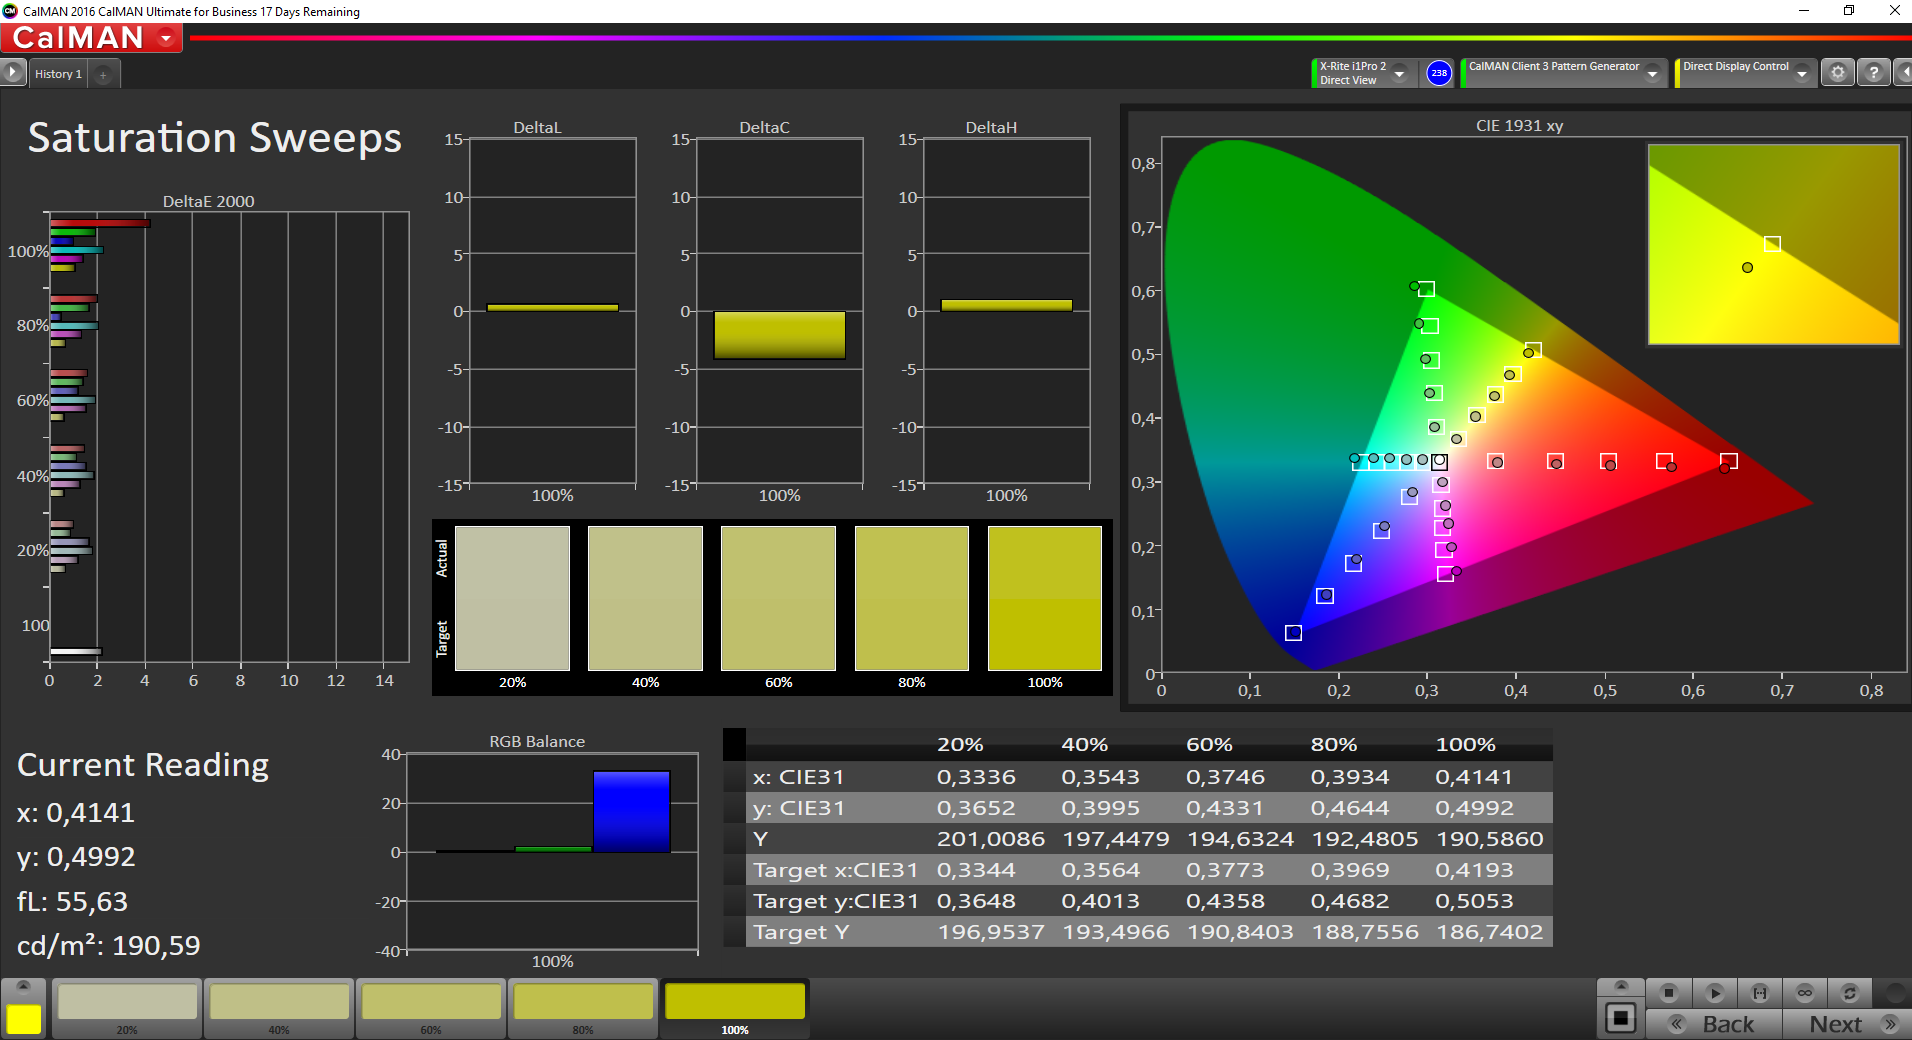
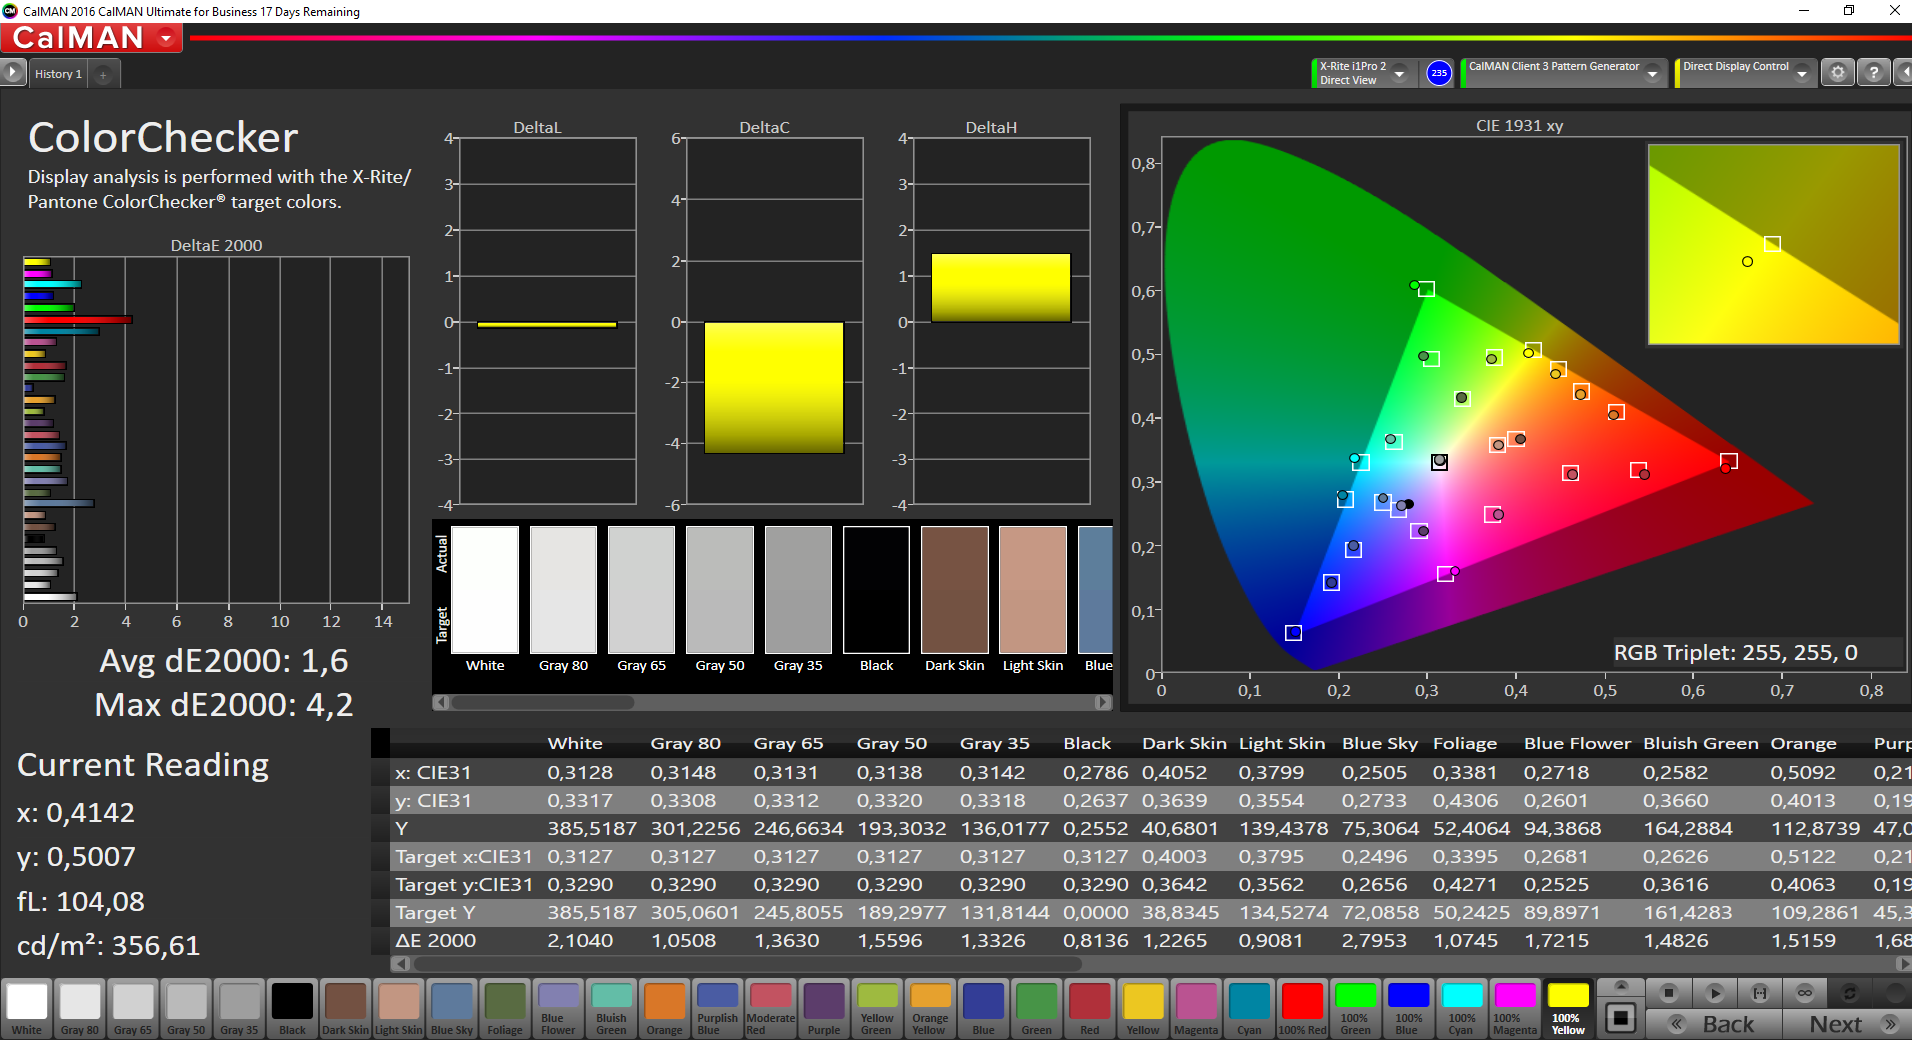
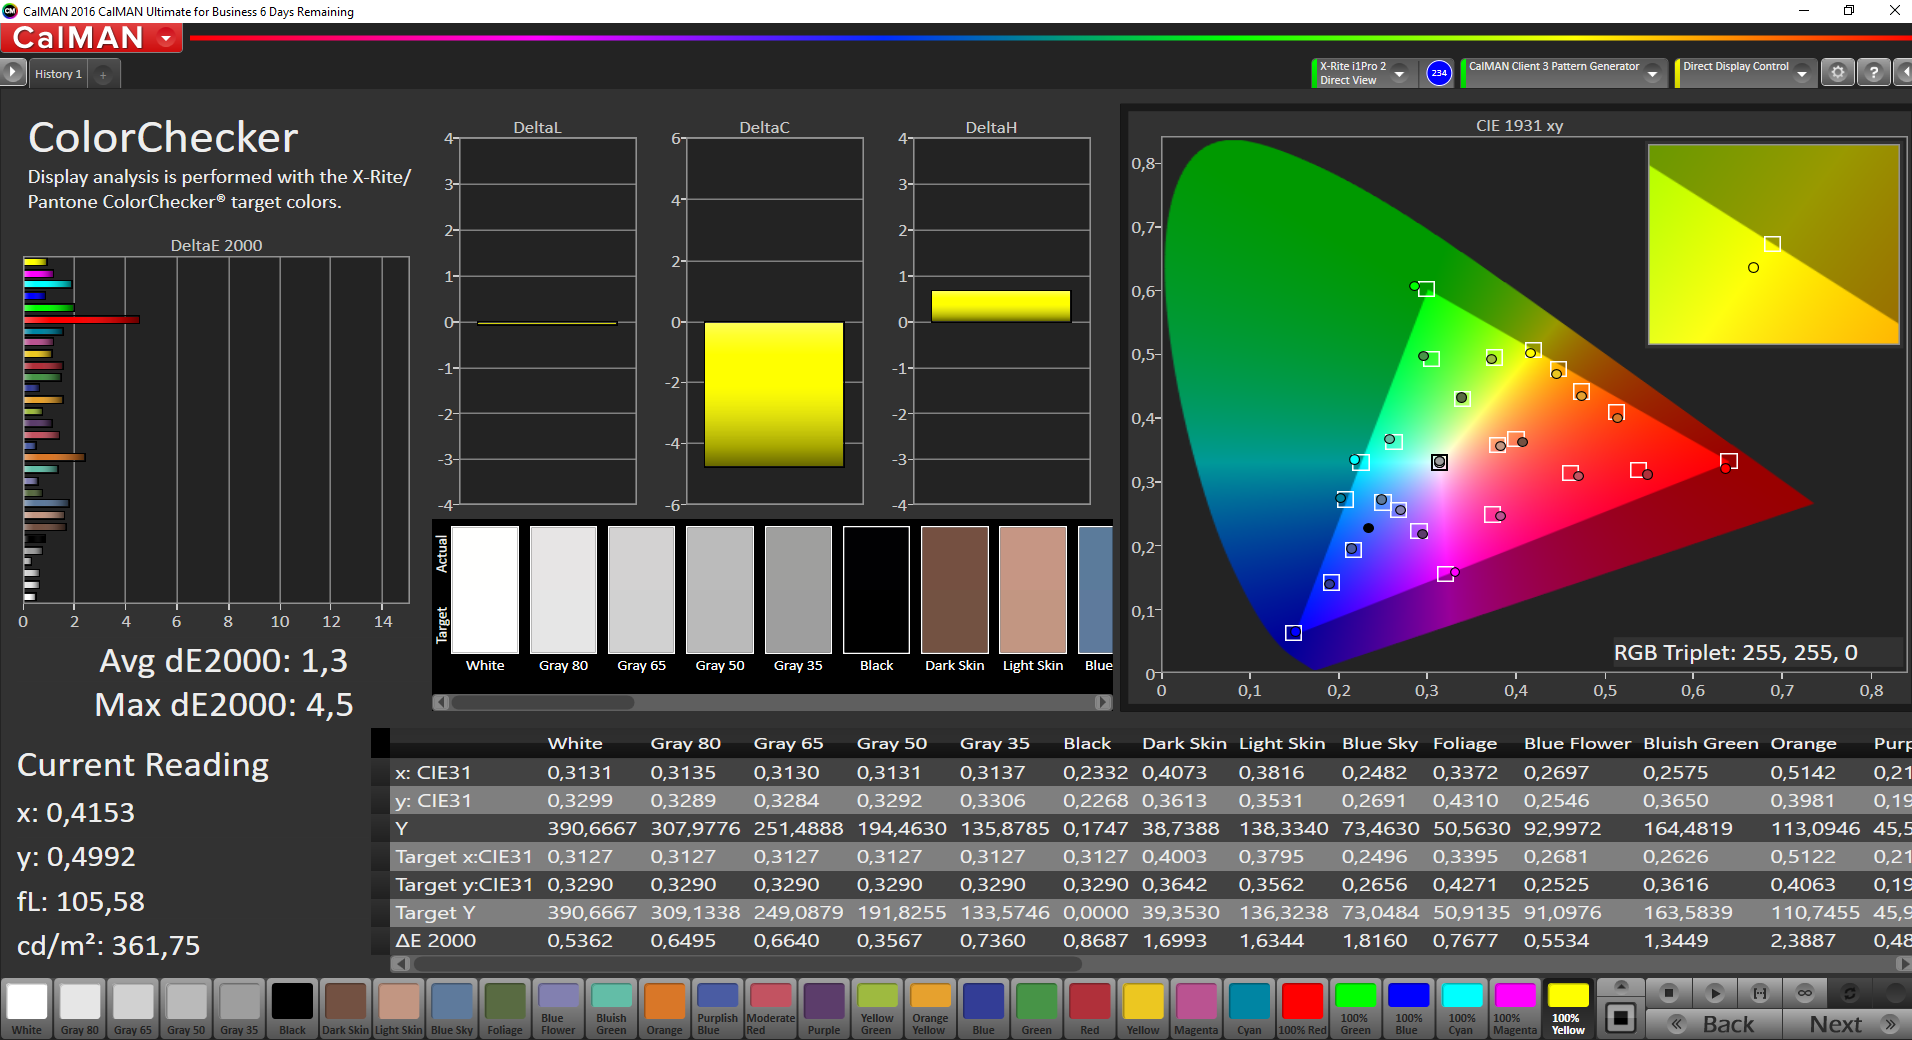
Our calibration with the X-Rite i1Pro2 spectrophotometer improves the results. The average grayscale deviation drops to just 0.8 – an excellent result. The black value is also a bit lower, which has a positive effect on the contrast ratio (>2100:1). The colors, however, show the limitations of the panel and there is only a minor improvement, while the deviations of red is even a bit higher.

It is not a surprise that the color gamut of the Surface Book 2 is on par with the predecessor at 95.9% sRGB and 64% AdobeRGB, respectively. This, in combination with the small color deviations, makes it interesting for digital artists. You will only require an external display if you work in the AdobeRGB color space.
Display Response Times
| ↔ Response Time Black to White | ||
|---|---|---|
| 30 ms ... rise ↗ and fall ↘ combined | ↗ 16.4 ms rise | 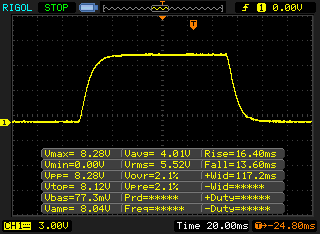 |
| ↘ 13.6 ms fall | ||
| The screen shows slow response rates in our tests and will be unsatisfactory for gamers. In comparison, all tested devices range from 0.1 (minimum) to 240 (maximum) ms. » 79 % of all devices are better. This means that the measured response time is worse than the average of all tested devices (20.2 ms). | ||
| ↔ Response Time 50% Grey to 80% Grey | ||
| 52.8 ms ... rise ↗ and fall ↘ combined | ↗ 25.2 ms rise | 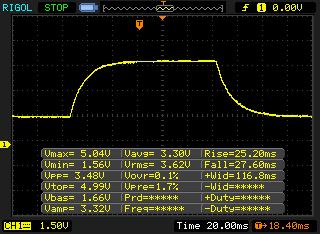 |
| ↘ 27.6 ms fall | ||
| The screen shows slow response rates in our tests and will be unsatisfactory for gamers. In comparison, all tested devices range from 0.165 (minimum) to 636 (maximum) ms. » 89 % of all devices are better. This means that the measured response time is worse than the average of all tested devices (31.5 ms). | ||
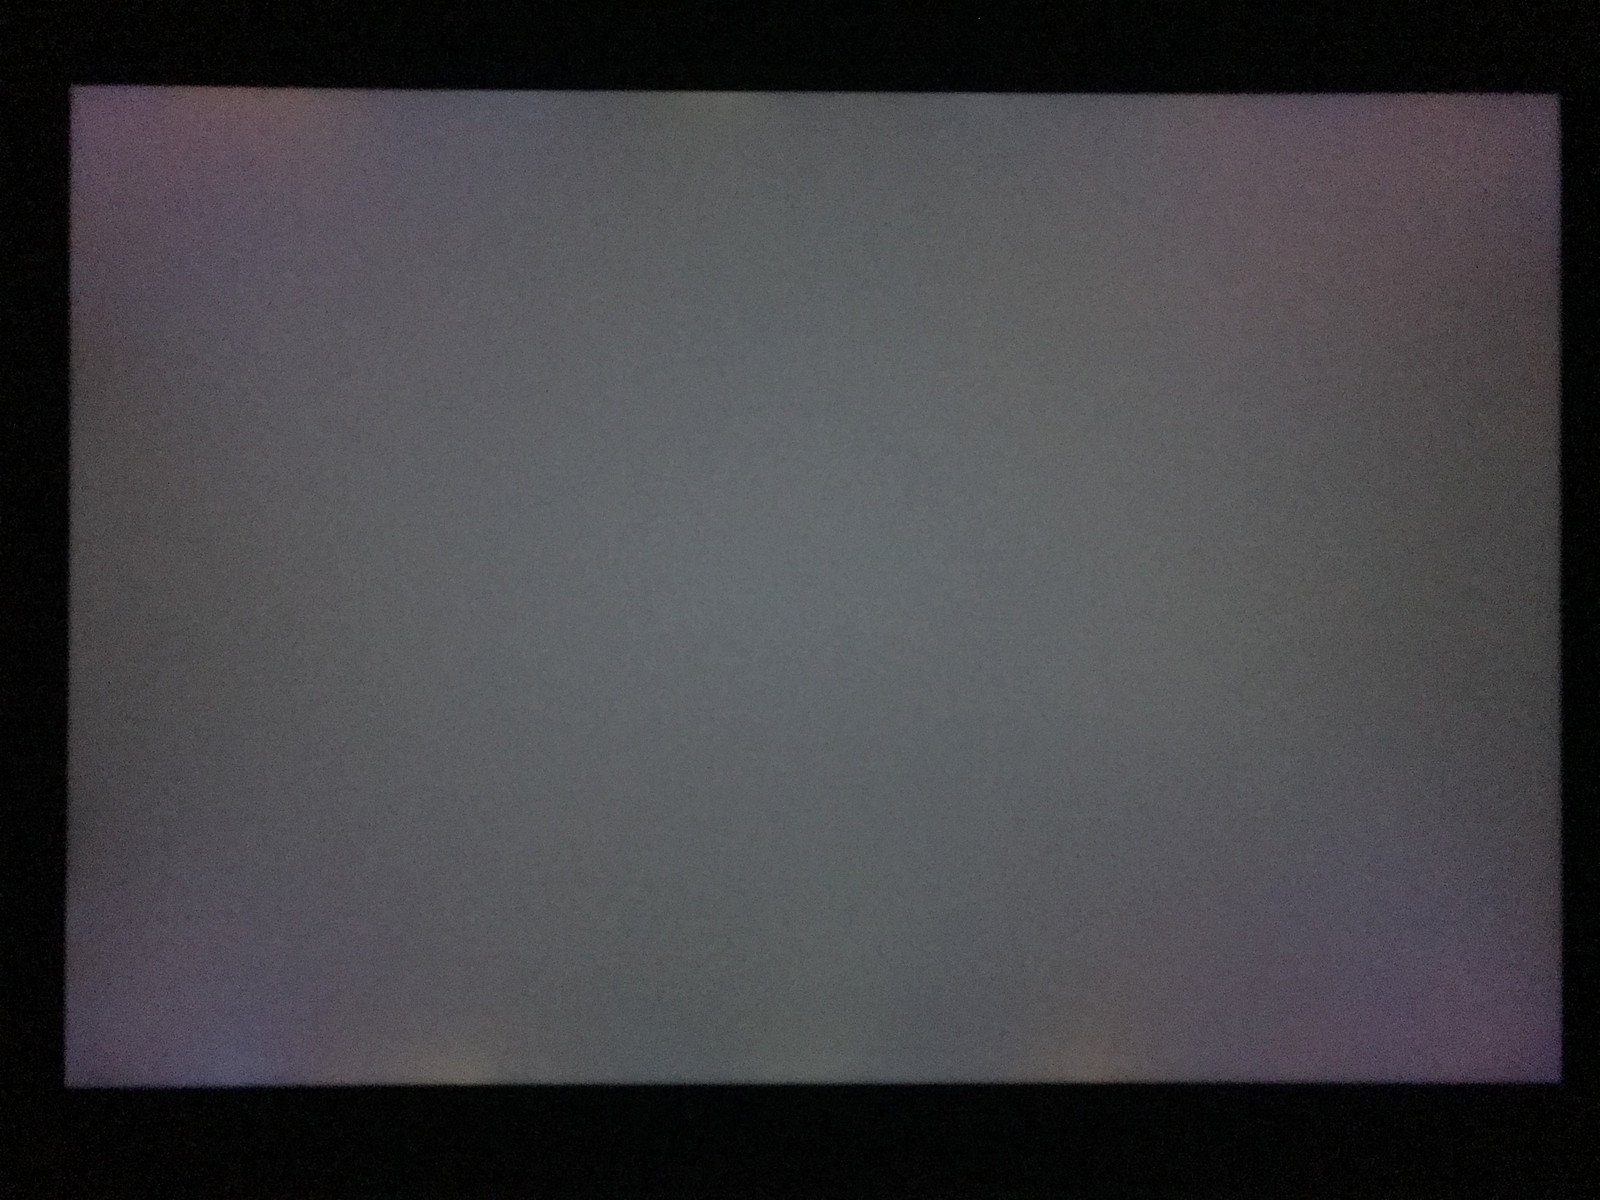
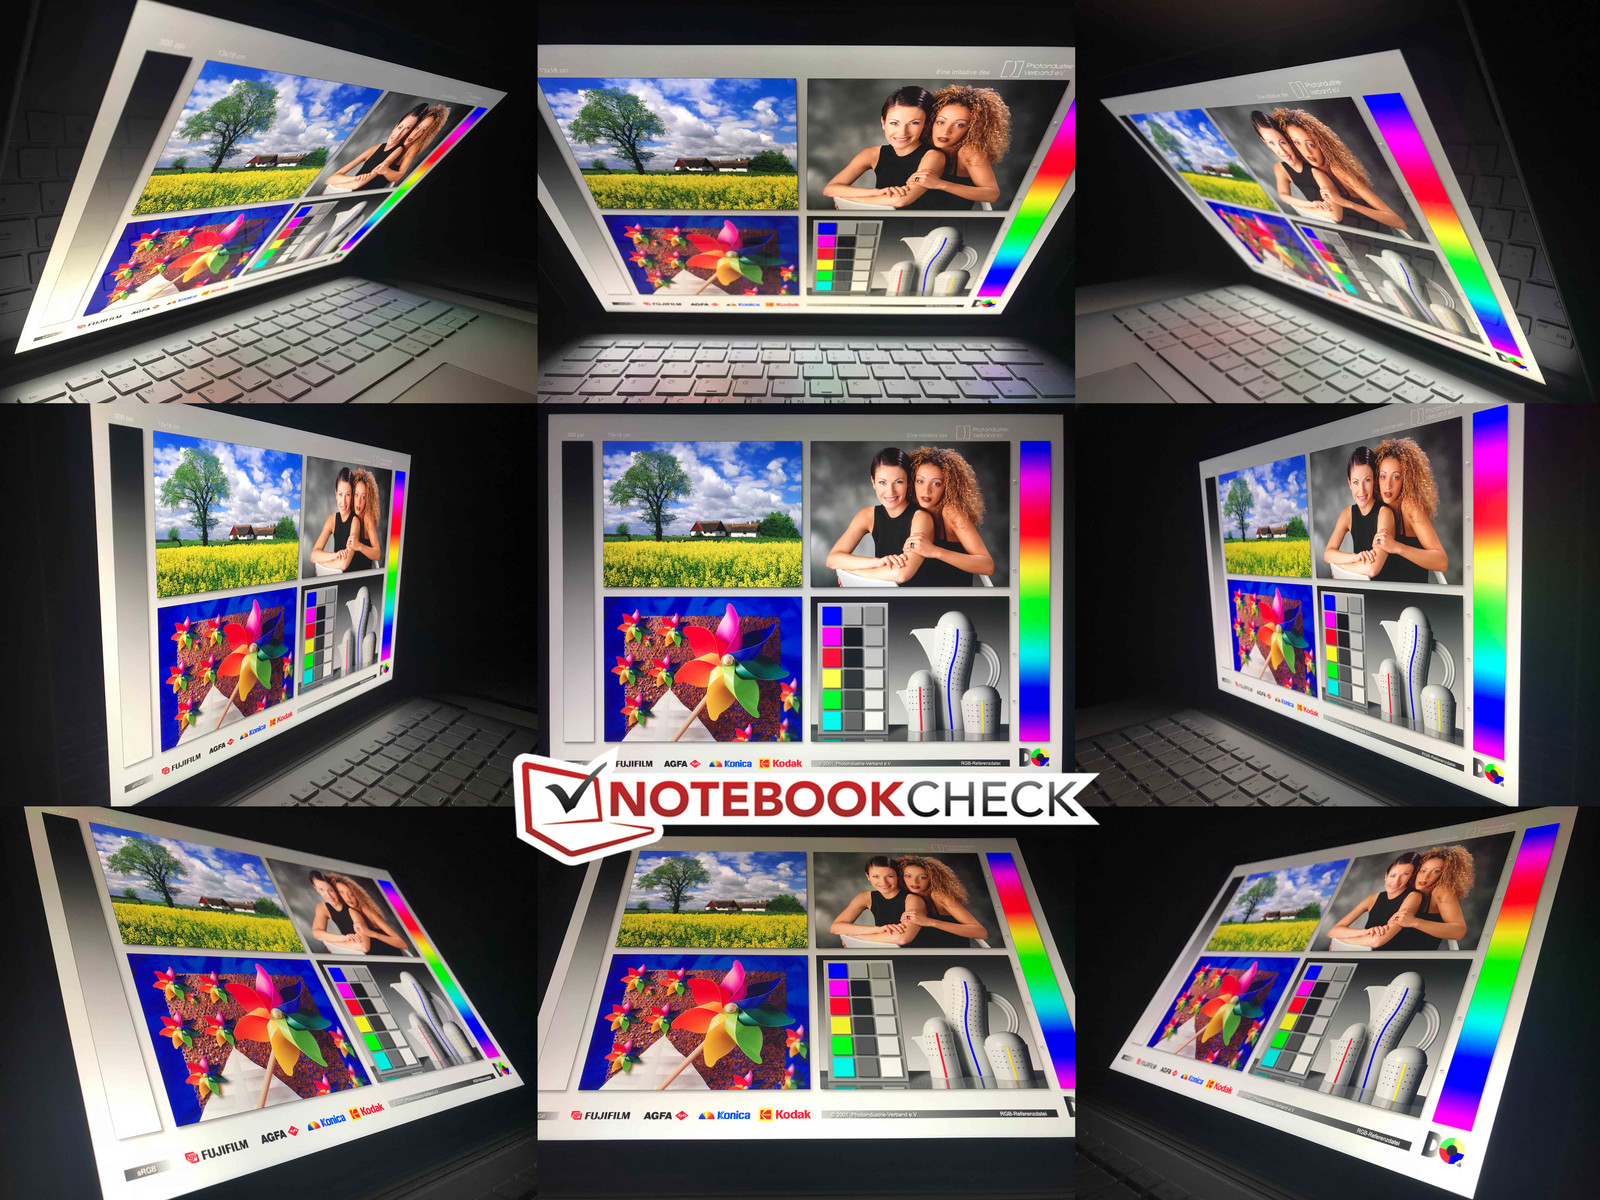
The glossy touchscreen struggles outdoors. The brightness is not bad, but would have to be much higher to compensate for the reflections. The picture below was taken on an overcast day.
There is no criticism for the viewing angles; the picture is undistorted from every angle. Reflections from very flat angles will probably be a bigger issue.

Performance
Processor
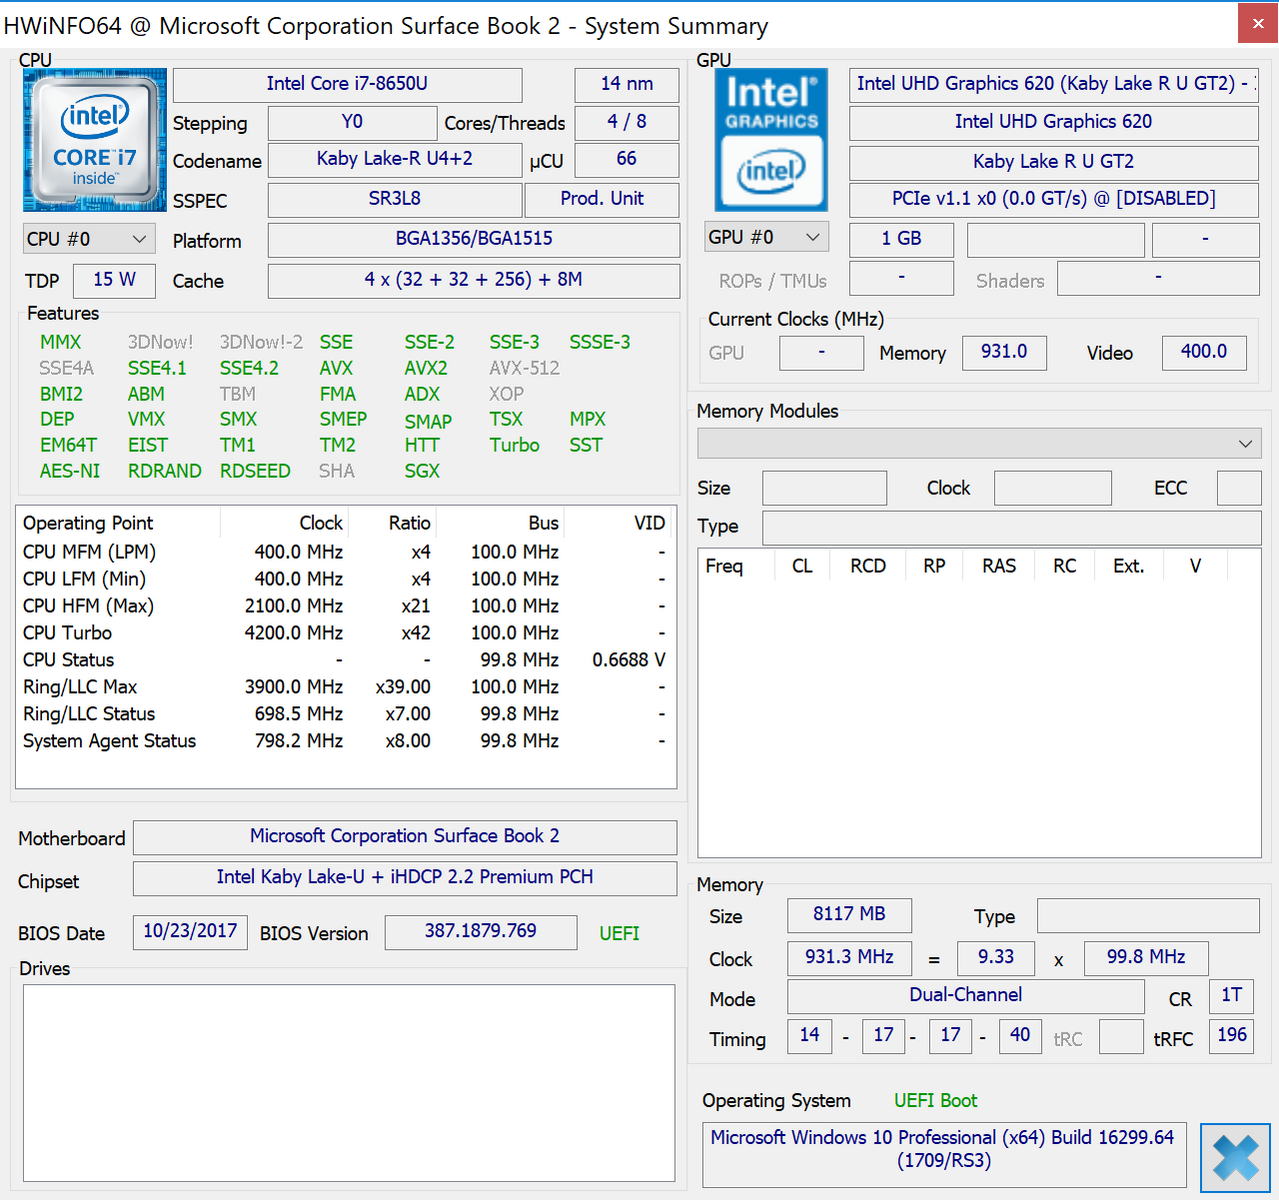
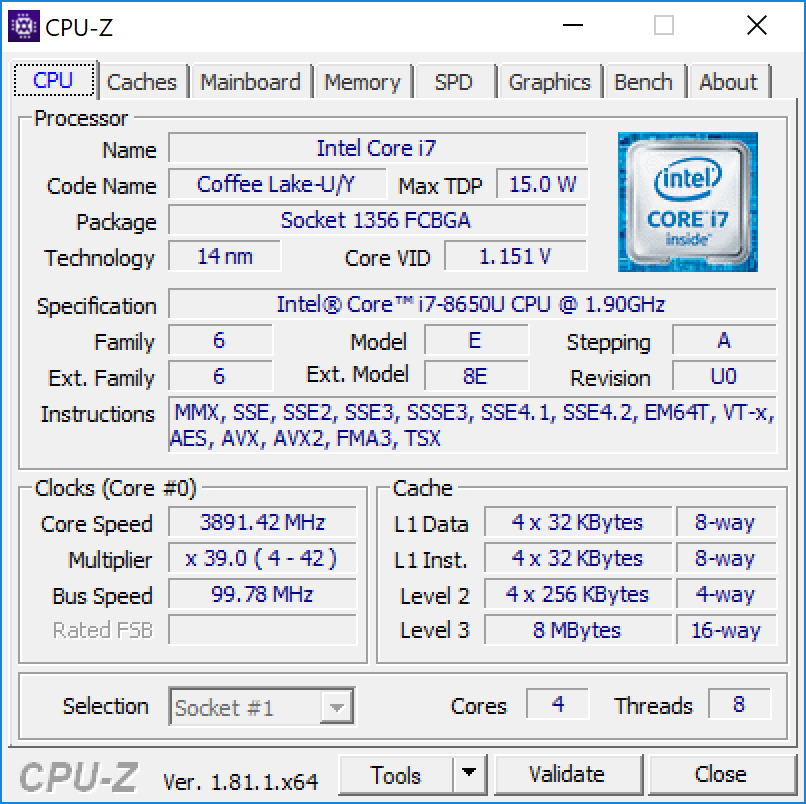
The Core i7-8650U is part of Intel's latest Kaby Lake Refresh lineup. It is manufactured in an improved 14nm+ process, but the basic architecture has not changed. There is still a major performance advantage compared to previous ULV chips thanks to the two additional cores. The i7-8650U is currently the fastest ULV quad-core with a base frequency of 1.9 GHz. This does not sound like much, but the maximum Turbo Boost frequency is 4.2 GHz (1 & 2 active cores) or 3.9 GHz (3 & 4 active cores), respectively. However, these values cannot be realized with a specified TDP of 15W.
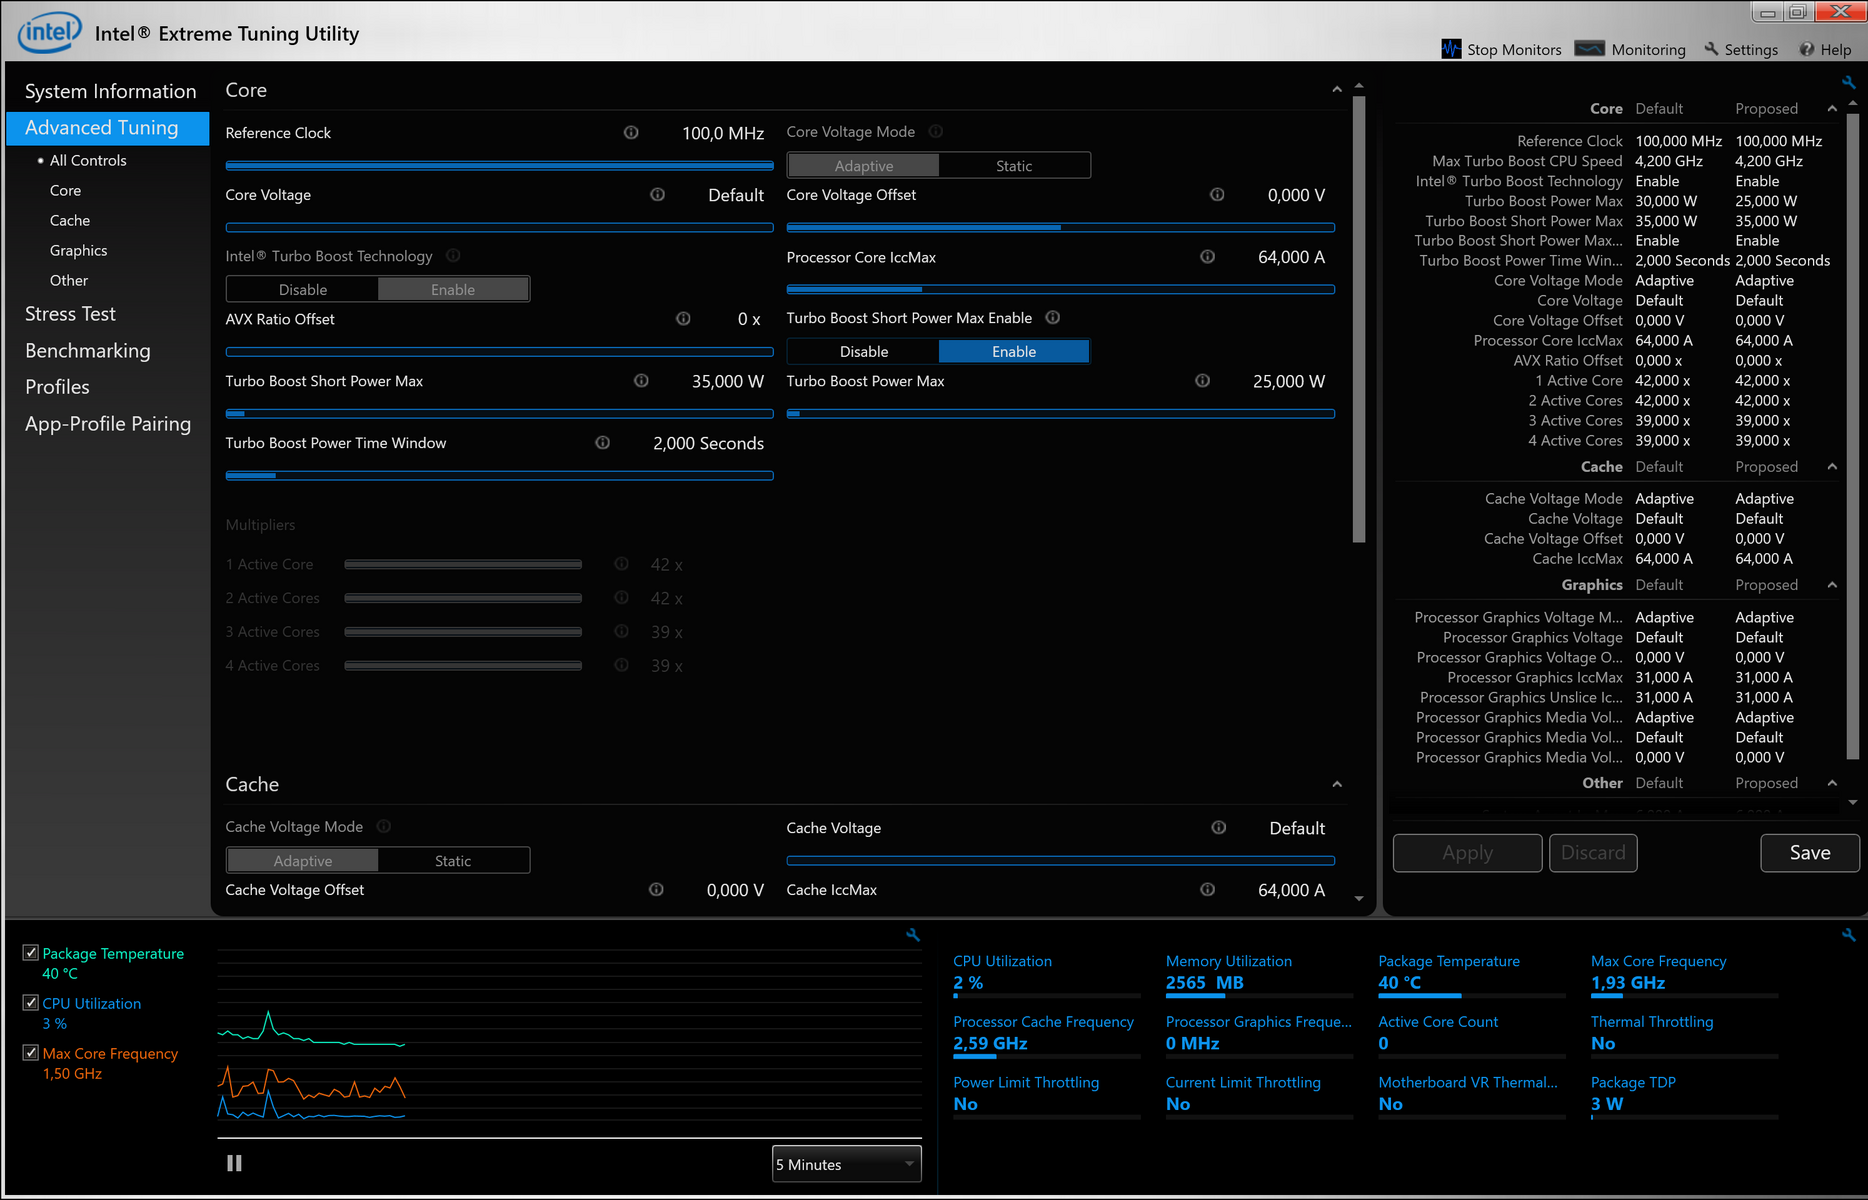
Contrary to previous assumptions, the processor in the smaller Surface Book 2 is not limited to 15W. According to the tool Intel XTU, the power limits are 35W for short workloads and even up to 25W for the long term. The system can make use of that, at least for a limited time, which explains the good Cinebench multi score of 673 points. However, the temperatures will quickly rise (up to 99 °C/~210 °F), which results in a performance reduction. The result quickly drops to the range between 500 and 540 points, which is a drop between 20 and 25%. The average clock over the course of the one-hour test is 2.5 GHz for all four cores (clearly above the base frequency of 1.9 GHz) with an average power consumption of ~16W. This means that there is room for improvements, but the Surface Book 2 still performs better than some laptops, despite the passive cooling.
Ideally, the i7-8650U in the Surface Book 2 is only 10% slower than the popular Core i7-7700HQ in the Multi test. The dual-core predecessors are easily beaten, even considering the performance drop under sustained workloads. However, the new Core i7 benefits from the high Turbo Boost (up to 4.2 GHz) in the Single test and takes the lead within the comparison group.
The CPU performance is considerably lower running on battery, independent of the power settings. The CB Multi test is only executed with 4x 1.8 GHz, which results in just 317 points. It is even worse in the Single test, because 1.4 to 1.6 GHz scores just 62 points.
System Performance
The Surface Book 2 gets average scores in the PCMark 8 Work & Home tests, but it performs really well in the Creative test as well as the new PCMark 10. All comparison devices are equipped with capable processor and fast SSDs, so there is not a big difference when it comes to the subjective performance impression. We were still impressed by the quick boot times of the Surface Book 2, because you can start to work after a few seconds.
We experienced only one issue during our time with the device. The touchscreen did not work after we undocked the tablet. However, we could just reattach the tablet and restart the system. Everything else worked just fine, including the graphics switching between the tablet and the discrete GeForce GPU inside the keyboard unit.
| PCMark 8 Home Score Accelerated v2 | 3694 points | |
| PCMark 8 Creative Score Accelerated v2 | 6165 points | |
| PCMark 8 Work Score Accelerated v2 | 4522 points | |
| PCMark 10 Score | 4119 points | |
Help | ||
Storage Devices
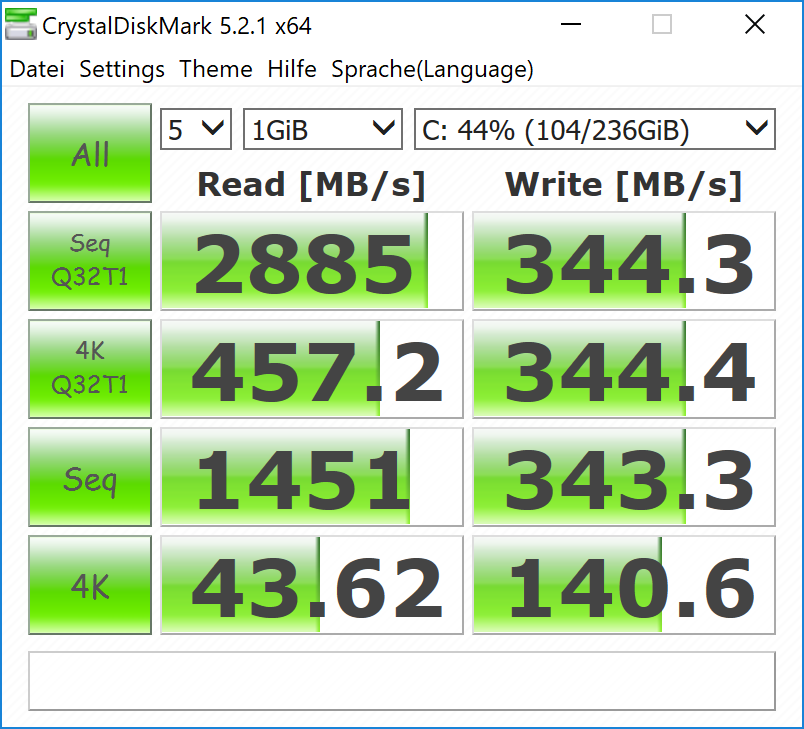
Microsoft uses fast NVMe-SSDs for the Surface Book 2 and our model is shipped with the 256 GB version of Samsung's PM961. So far so good, but there seems to be a driver/firmware issue. The write performance is limited to about 340 MB/s in the benchmarks, and we could "only" determine ~330 MB/s when we copied a file from our external SSD (usually ~380 to 390 MB/s).
Benchmarks often have problems with fast NVMe drives, but the NVMe drivers from Samsung usually help. Not in this case though, because the limitation still applies. The tool AS SSD did not determine any useful data in the first place. The read performance on the other hand is normal, so we assume this is a software related issue. You can use 206 GB after the initial set-up on the 256 GB SKU.
| Microsoft Surface Book 2 Samsung PM961 MZVLW256HEHP | Lenovo Yoga 920-13IKB-80Y7 Samsung PM961 MZVLW256HEHP | Microsoft Surface Laptop i7 Samsung PM971 KUS040202M | Dell XPS 13 i5-8250U Toshiba XG5 KXG50ZNV256G | Eve-Tech Eve V i7 Intel SSD 600p SSDPEKKW512G7 | Apple MacBook Pro 13 2017 Touchbar i5 Apple SSD AP0256 | |
|---|---|---|---|---|---|---|
| CrystalDiskMark 5.2 / 6 | 82% | 37% | -19% | 4% | 61% | |
| Write 4K (MB/s) | 140.6 | 142.1 1% | 129.6 -8% | 114 -19% | 152 8% | 32.94 -77% |
| Read 4K (MB/s) | 43.62 | 44.19 1% | 42.74 -2% | 25.45 -42% | 21 -52% | 23.77 -46% |
| Write Seq (MB/s) | 343.3 | 1112 224% | 971 183% | 319.4 -7% | 559 63% | 1345 292% |
| Read Seq (MB/s) | 1452 | 1884 30% | 989 -32% | 1151 -21% | 1066 -27% | 1509 4% |
| Write 4K Q32T1 (MB/s) | 344.4 | 747 117% | 384.4 12% | 349.8 2% | 444 29% | 365.5 6% |
| Read 4K Q32T1 (MB/s) | 457.2 | 446.8 -2% | 466.7 2% | 341.2 -25% | 457 0% | 528 15% |
| Write Seq Q32T1 (MB/s) | 344.3 | 1255 265% | 977 184% | 352.2 2% | 559 62% | 1354 293% |
| Read Seq Q32T1 (MB/s) | 2885 | 3400 18% | 1682 -42% | 1787 -38% | 1404 -51% | 2963 3% |

GPU Performance
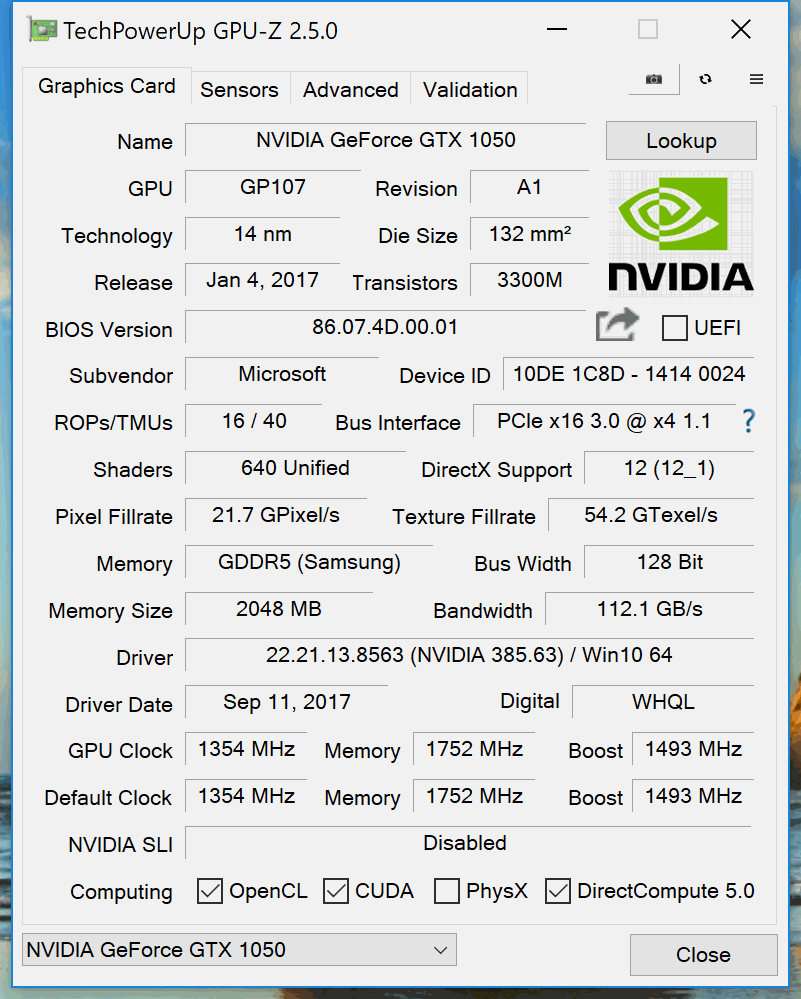
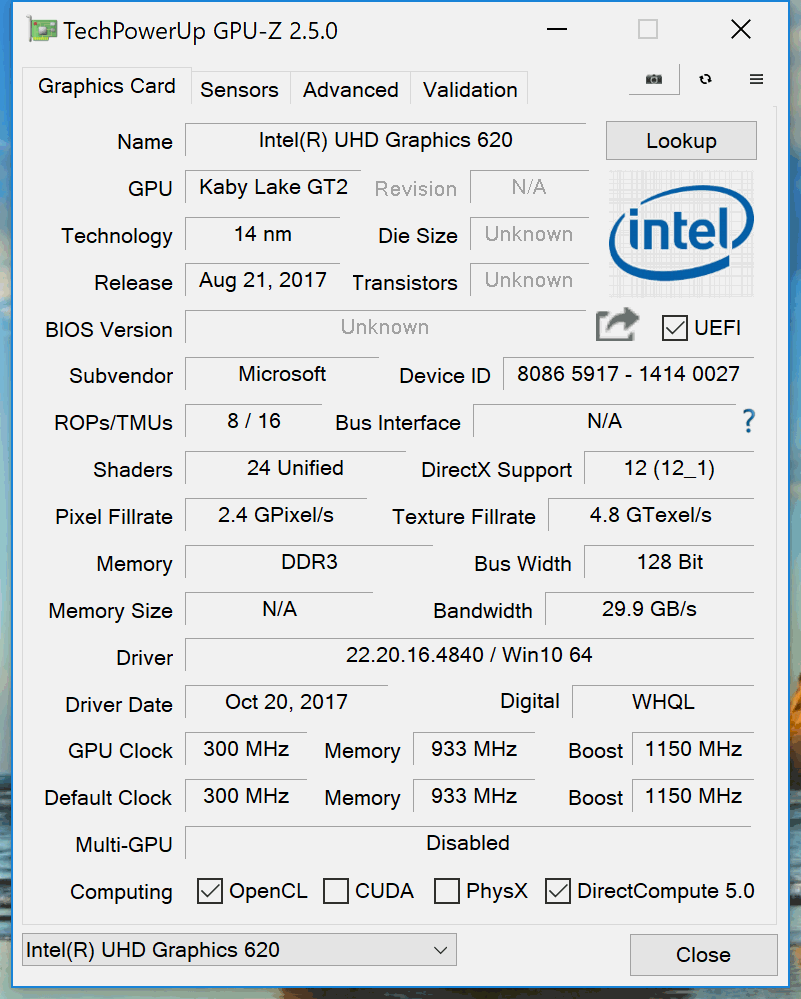
The graphics are handled by the integrated UHD Graphics 620 of the processor when you only use the tablet or perform normal tasks (including high-resolution video playback). The dedicated GeForce GTX 1050 in the keyboard unit takes care of more demanding tasks. It seems to be the regular version of the GTX 1050, but only with 2 GB of GDDR5-VRAM.
The GTX 1050 is ~12 to 15% ahead of the GeForce GTX 965M of the first Surface Book in the synthetic 3DMarks. The performance is still decent for a GTX 1050 in the older 3DMark 11, but you start to notice the smaller amount of VRAM in the more demanding 3DMark Fire Strike test.
As with the CPU, the performance drops on battery power. However, the deficit is much smaller at about 15%.
| 3DMark 06 Standard Score | 28314 points | |
| 3DMark 11 Performance | 7645 points | |
| 3DMark Ice Storm Standard Score | 32414 points | |
| 3DMark Cloud Gate Standard Score | 17718 points | |
| 3DMark Fire Strike Score | 5293 points | |
| 3DMark Time Spy Score | 1783 points | |
Help | ||
Gaming Performance
Benchmarks are one thing, but the actual gaming tests are obviously more important. The GTX 1050 is a mainstream GPU and can handle modern games at medium up to high details. You have to experiment a bit with the resolution though. The native resolution is usually too challenging, and the 3:2 aspect ratio either results in a stretched picture or black bars in the 1080p setting. Many modern games support suitable resolutions, so you have to check how they perform. We start the section with our “Witcher 3” test (one hour). There is no performance drop, so prolonged gaming sessions should not be a problem.
So how does the GTX 1050 perform compared to other GPUs, especially the 4 GB version of the GTX 1050? Not bad, because the Asus ROG Strix GL703VD is usually only a couple of percent ahead and the more powerful processor has to be considered as well. The Asus ZenBook Pro UX550VD on the other hand falls behind the Surface Book 2, so the smaller VRAM is currently not a big constraint.
All in all, there are no surprises here and you can usually play all modern games at high settings. Only very challenging or poorly optimized games such as “Assassin's Creed Origins” require lower settings. More benchmarks for the GTX 1050 are listed in our tech section.
| The Witcher 3 | |
| 1920x1080 Ultra Graphics & Postprocessing (HBAO+) | |
| Razer Blade (2017) | |
| Gigabyte Aero 14-K7 | |
| Asus ROG Strix GL703VD-DB74 | |
| Microsoft Surface Book 2 | |
| Asus ZenBook Pro UX550VD | |
| Asus VivoBook Pro 15 N580VD-DM028T | |
| Microsoft Surface Book with Performance Base | |
| 1920x1080 High Graphics & Postprocessing (Nvidia HairWorks Off) | |
| Razer Blade (2017) | |
| Gigabyte Aero 14-K7 | |
| Asus ROG Strix GL703VD-DB74 | |
| Microsoft Surface Book 2 | |
| Asus ZenBook Pro UX550VD | |
| Microsoft Surface Book with Performance Base | |
| Asus VivoBook Pro 15 N580VD-DM028T | |
| HP Envy x360 15m-bq121dx | |
| For Honor | |
| 1920x1080 Extreme Preset AA:T AF:16x | |
| Razer Blade (2017) | |
| Microsoft Surface Book 2 | |
| Asus ZenBook Pro UX550VD | |
| 1920x1080 High Preset AA:T AF:8x | |
| Razer Blade (2017) | |
| Microsoft Surface Book 2 | |
| Asus ZenBook Pro UX550VD | |
| Ghost Recon Wildlands | |
| 1920x1080 Ultra Preset AA:T AF:16x | |
| Microsoft Surface Book 2 | |
| Asus ZenBook Pro UX550VD | |
| 1920x1080 High Preset AA:T AF:4x | |
| Asus ZenBook Pro UX550VD | |
| Microsoft Surface Book 2 | |
| low | med. | high | ultra | |
|---|---|---|---|---|
| BioShock Infinite (2013) | 246.6 | 168.3 | 149.1 | 59.4 |
| Dota 2 (2013) | 116.6 | 97.3 | 87.5 | |
| The Witcher 3 (2015) | 110.6 | 67.1 | 38.3 | 21 |
| Rise of the Tomb Raider (2016) | 95.3 | 66.4 | 37.8 | 32.4 |
| For Honor (2017) | 147.9 | 54.9 | 51.6 | 39 |
| Ghost Recon Wildlands (2017) | 73.8 | 35.9 | 28.8 | 26.2 |
| Assassin´s Creed Origins (2017) | 55 | 30 | 22 | 15 |
Performance vs. System Noise
We have added a little extra section here, because the Windows power settings have a major effect on the fan noise of the Surface Books 2. There is only one power plan left since the Creators Update: Balanced. However, there is a new performance slider in the battery options. It has three levels on mains: Recommended (left), Better Performance (middle), Best Performance (right). We obviously perform our benchmarks and gaming tests with the Best Performance setting. However, as soon as you stress the GPU, the fan in the keyboard unit will be very audible at up to 49 dB(A). This is annoying and hard to tolerate without headphones. We wanted to see how the Surface Book 2 performs with the other two profiles and recorded both the frame rates as well as the noise levels.
| Low Setting | Med Setting | High Setting | Ultra Setting | |
| Rise of the Tomb Raider "Recommended" (36 dB) | 84.3 | 64.2 | 37.8 | 30.7 |
| Rise of the Tomb Raider "Better Performance" (37.8 dB) | 87.1 | 65.1 | 37.3 | 31.5 |
| Rise of the Tomb Raider "Best Performance" (49 dB) | 95.3 | 66.4 | 37.8 | 32.4 |
| Assassin's Creed Origins "Recommended" (36 dB) | 43 | 23 | 18 | 14 |
| Assassin's Creed Origins "Better Performance" (37.8 dB) | 53 | 25 | 21 | 14 |
| Assassin's Creed Origins "Best Performance" (49 dB) | 55 | 30 | 22 | 15 |
| Witcher 3 "Recommended" (36 dB) | 83.5 | 48.2 | 28.4 | 18.6 |
| Witcher 3 "Better Performance" (37.8 dB) | 107.7 | 66.6 | 35.6 | 21 |
| Witcher 3 "Best Performance" (49 dB) | 110.6 | 67.1 | 38.3 | 21 |
| For Honor "Recommended" (33.4 dB) | 135.4 | 46 | 43 | 37,8 |
| For Honor "Better Performance" (36 dB) | 141.5 | 53.3 | 51.1 | 39.2 |
| For Honor "Best Performance" (49 dB) | 147.9 | 54.9 | 51.6 | 39 |
| Ghost Recon Wildlands "Recommended" (33.4 dB) | 66.1 | 31.3 | 27.1 | 20.9 |
| Ghost Recon Wildlands "Better Performance" (36 dB) | 75.7 | 35.1 | 28.1 | 24.8 |
| Ghost Recon Wildlands "Best Performance" (49 dB) | 73.8 | 35.9 | 28.8 | 26.2 |
The two lower power levels have a significant effect on the noise levels. 36 or 37.8 dB(A) and sometimes even less is much more tolerable, and the fan murmur is very even. The performance reduction is very small at the same time, and you can only really notice a difference in low or medium settings depending on the game. Our benchmarks are running for only a few minutes at a time, so we also checked whether there are any long term effects. The “Witcher 3” test (see Gaming Performance) run for an hour was fine with the Best Performance setting, so we repeated it with the quieter Recommended setting:
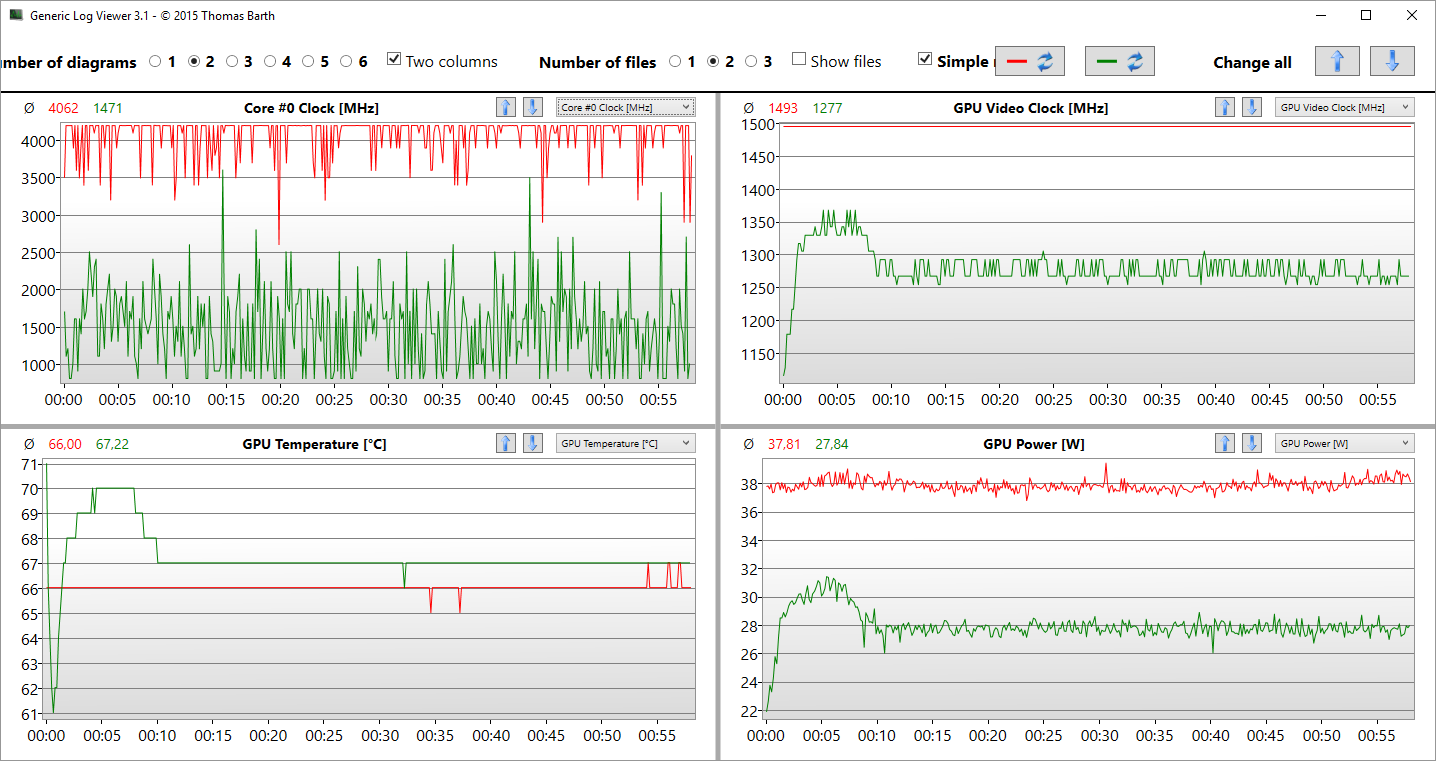
We see a significantly lower CPU clock (~4 GHz vs. ~1.4 GHz on average) as well as a slightly lower GPU clock (1493 vs. 1277 MHz on average), but they only have a small effect on the average frame rate (18.6 vs. 17.1). Most games depend mainly on the GPU performance, so there is no reason to listen to loud fan since the performance is also steady with the lower power settings.
Emissions
System Noise
We have already talked about the massive effect of the power settings on the noise levels when you stress the dedicated GPU. It almost instantly spins up to 49 dB(A) with the Best Performance setting during benchmarks and when you play games, which is extremely annoying thanks to the high frequency of the small fan. The situation is much more pleasant with the other two power modes. We were able to record five different levels: 30.2 dB(A), 31.4 dB(A), 33.4 dB(A), 36 dB(A), and 37.8 dB(A). You are usually within the last three levels during gaming (as long as you avoid Best Performance). This is obviously audible, but the fan murmur is very steady and not annoying. Even prolonged gaming sessions are possible without headphones.
The passive cooling solution of the tablet usually enables an almost silent system in practice as long as you do not stress the dedicated graphics card. There is coil whine at 30.2 dB(A), but there are once again differences between the performance settings. The coil whine is much quieter on battery as well as the two lower performance settings (Recommended, Better Performance).
Noise level
| Idle |
| 29.4 / 29.4 / 29.4 dB(A) |
| Load |
| 31.4 / 49 dB(A) |
 | ||
30 dB silent 40 dB(A) audible 50 dB(A) loud |
||
min: | ||
Temperature
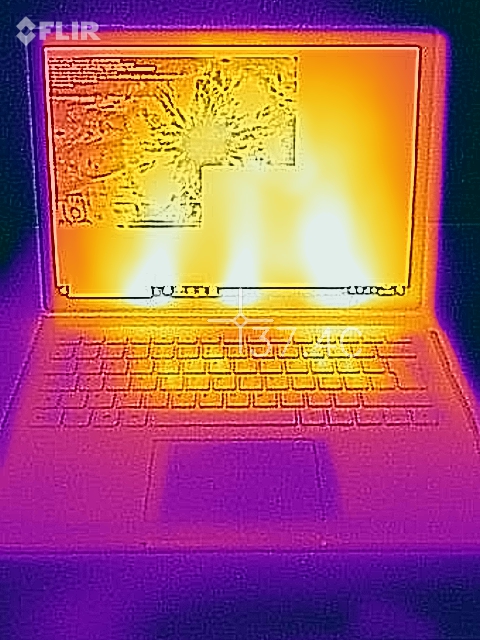
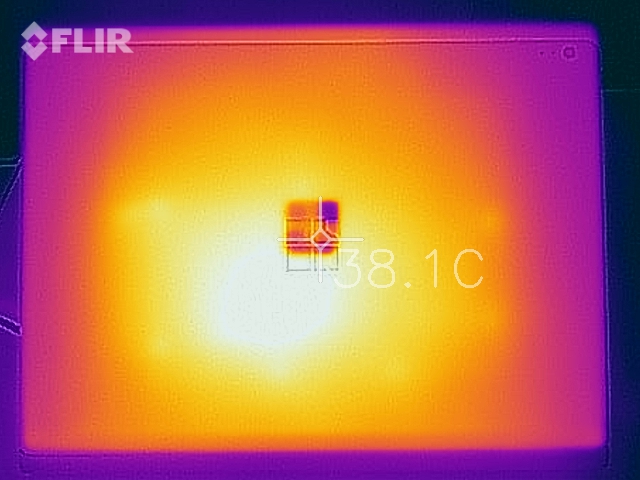
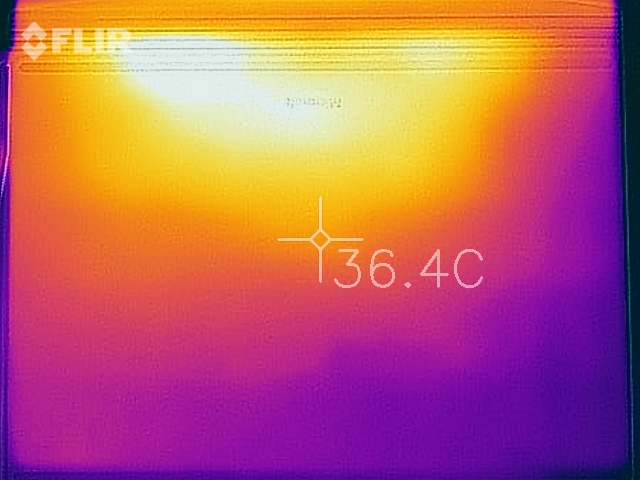
Passive cooling in combination with decent performance utilization of the processor – we expected very high surface temperatures. However, that is not the case. Basically, the case does not warm up at all while idling, and it depends on whether you stress the CPU or the GPU (or both) under load. The rear of the tablet warms up only slightly during everyday tasks, and the keyboard unit stays cool. We can never measure more than 40 °C (~104 °F) during gaming, and about 43 °C (~109 °F) during the stress test. Overall a really good performance considering the passive cooling solution. The first diagram shows the tablet, the second one the keyboard unit.
(±) The maximum temperature on the upper side is 40.8 °C / 105 F, compared to the average of 35.3 °C / 96 F, ranging from 19.6 to 60 °C for the class Convertible.
(±) The bottom heats up to a maximum of 43.7 °C / 111 F, compared to the average of 36.8 °C / 98 F
(+) In idle usage, the average temperature for the upper side is 23.8 °C / 75 F, compared to the device average of 30.3 °C / 87 F.
(±) Playing The Witcher 3, the average temperature for the upper side is 37.1 °C / 99 F, compared to the device average of 30.3 °C / 87 F.
(-) The palmrests and touchpad can get very hot to the touch with a maximum of 40.8 °C / 105.4 F.
(-) The average temperature of the palmrest area of similar devices was 27.9 °C / 82.2 F (-12.9 °C / -23.2 F).
(+) The maximum temperature on the upper side is 38.5 °C / 101 F, compared to the average of 35.3 °C / 96 F, ranging from 19.6 to 60 °C for the class Convertible.
(+) The bottom heats up to a maximum of 39.7 °C / 103 F, compared to the average of 36.8 °C / 98 F
(+) In idle usage, the average temperature for the upper side is 21.3 °C / 70 F, compared to the device average of 30.3 °C / 87 F.
(+) Playing The Witcher 3, the average temperature for the upper side is 31.6 °C / 89 F, compared to the device average of 30.3 °C / 87 F.
(+) The palmrests and touchpad are cooler than skin temperature with a maximum of 26.1 °C / 79 F and are therefore cool to the touch.
(±) The average temperature of the palmrest area of similar devices was 27.9 °C / 82.2 F (+1.8 °C / 3.2 F).
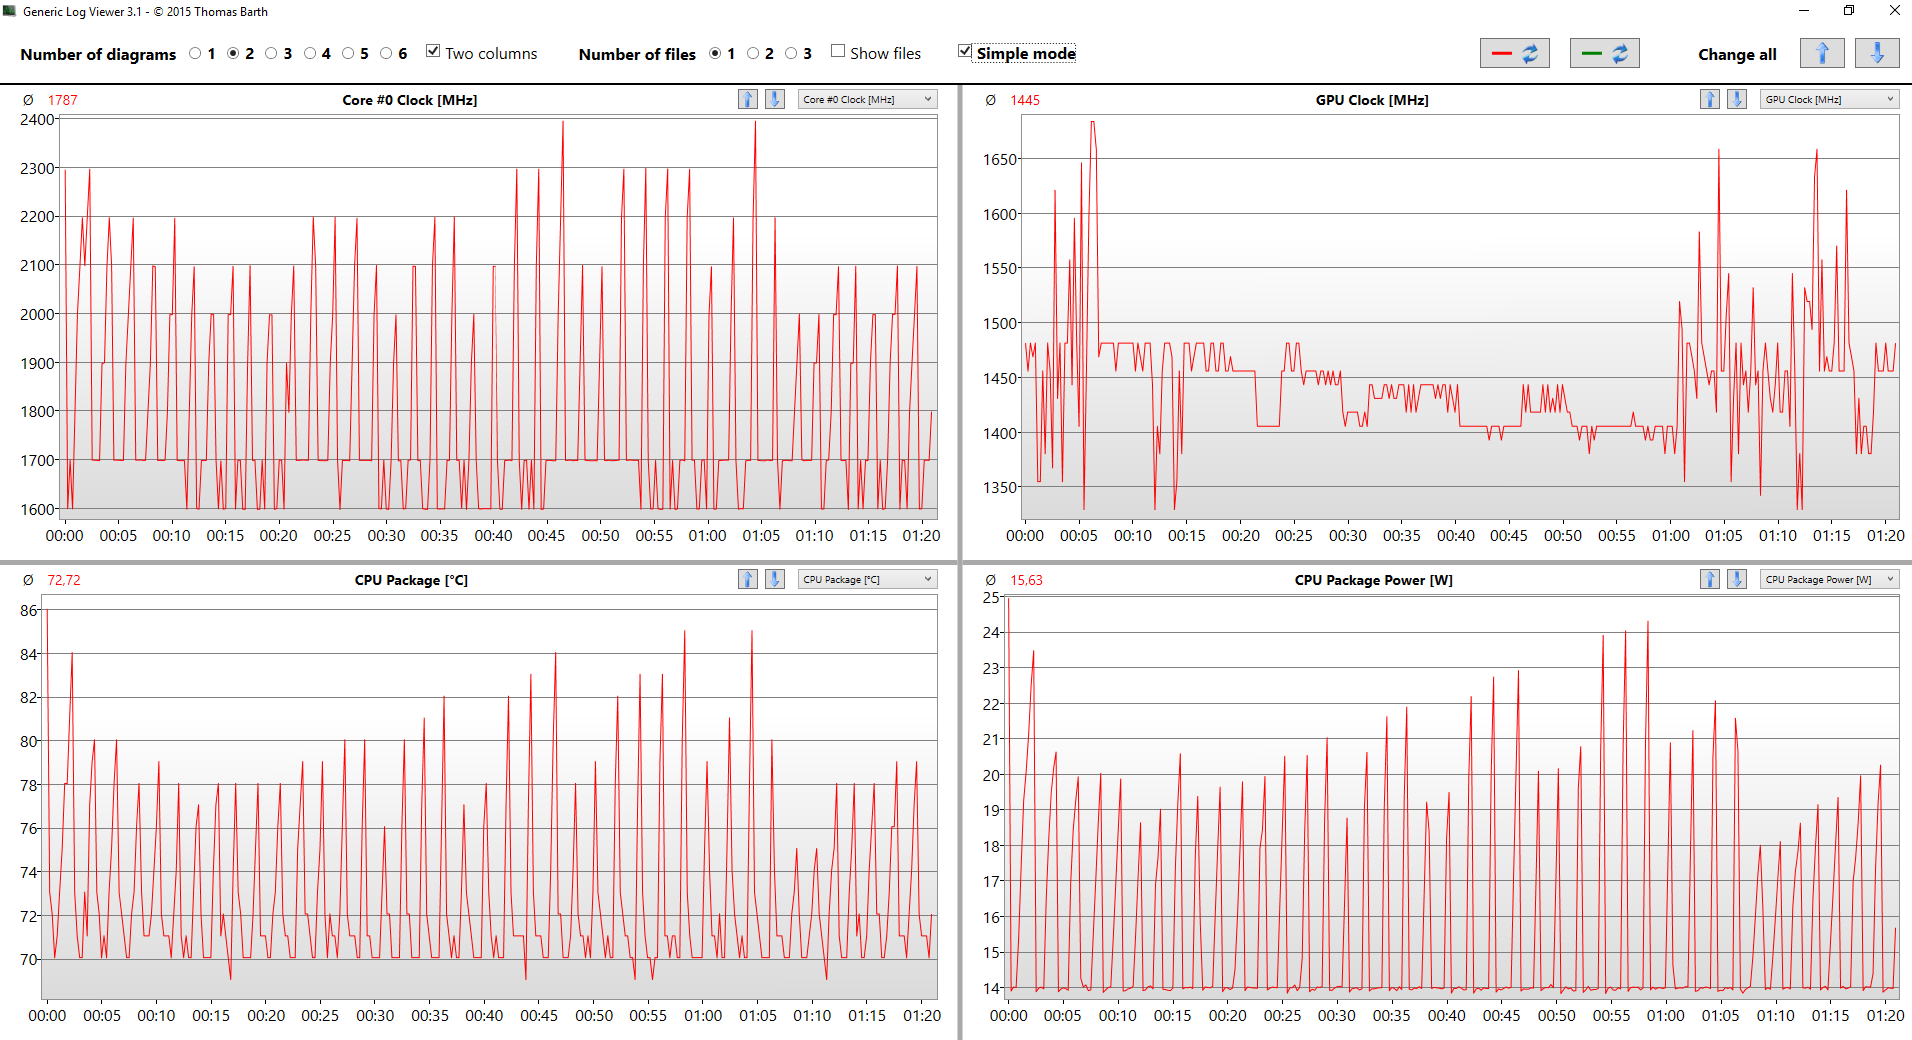
Stress test
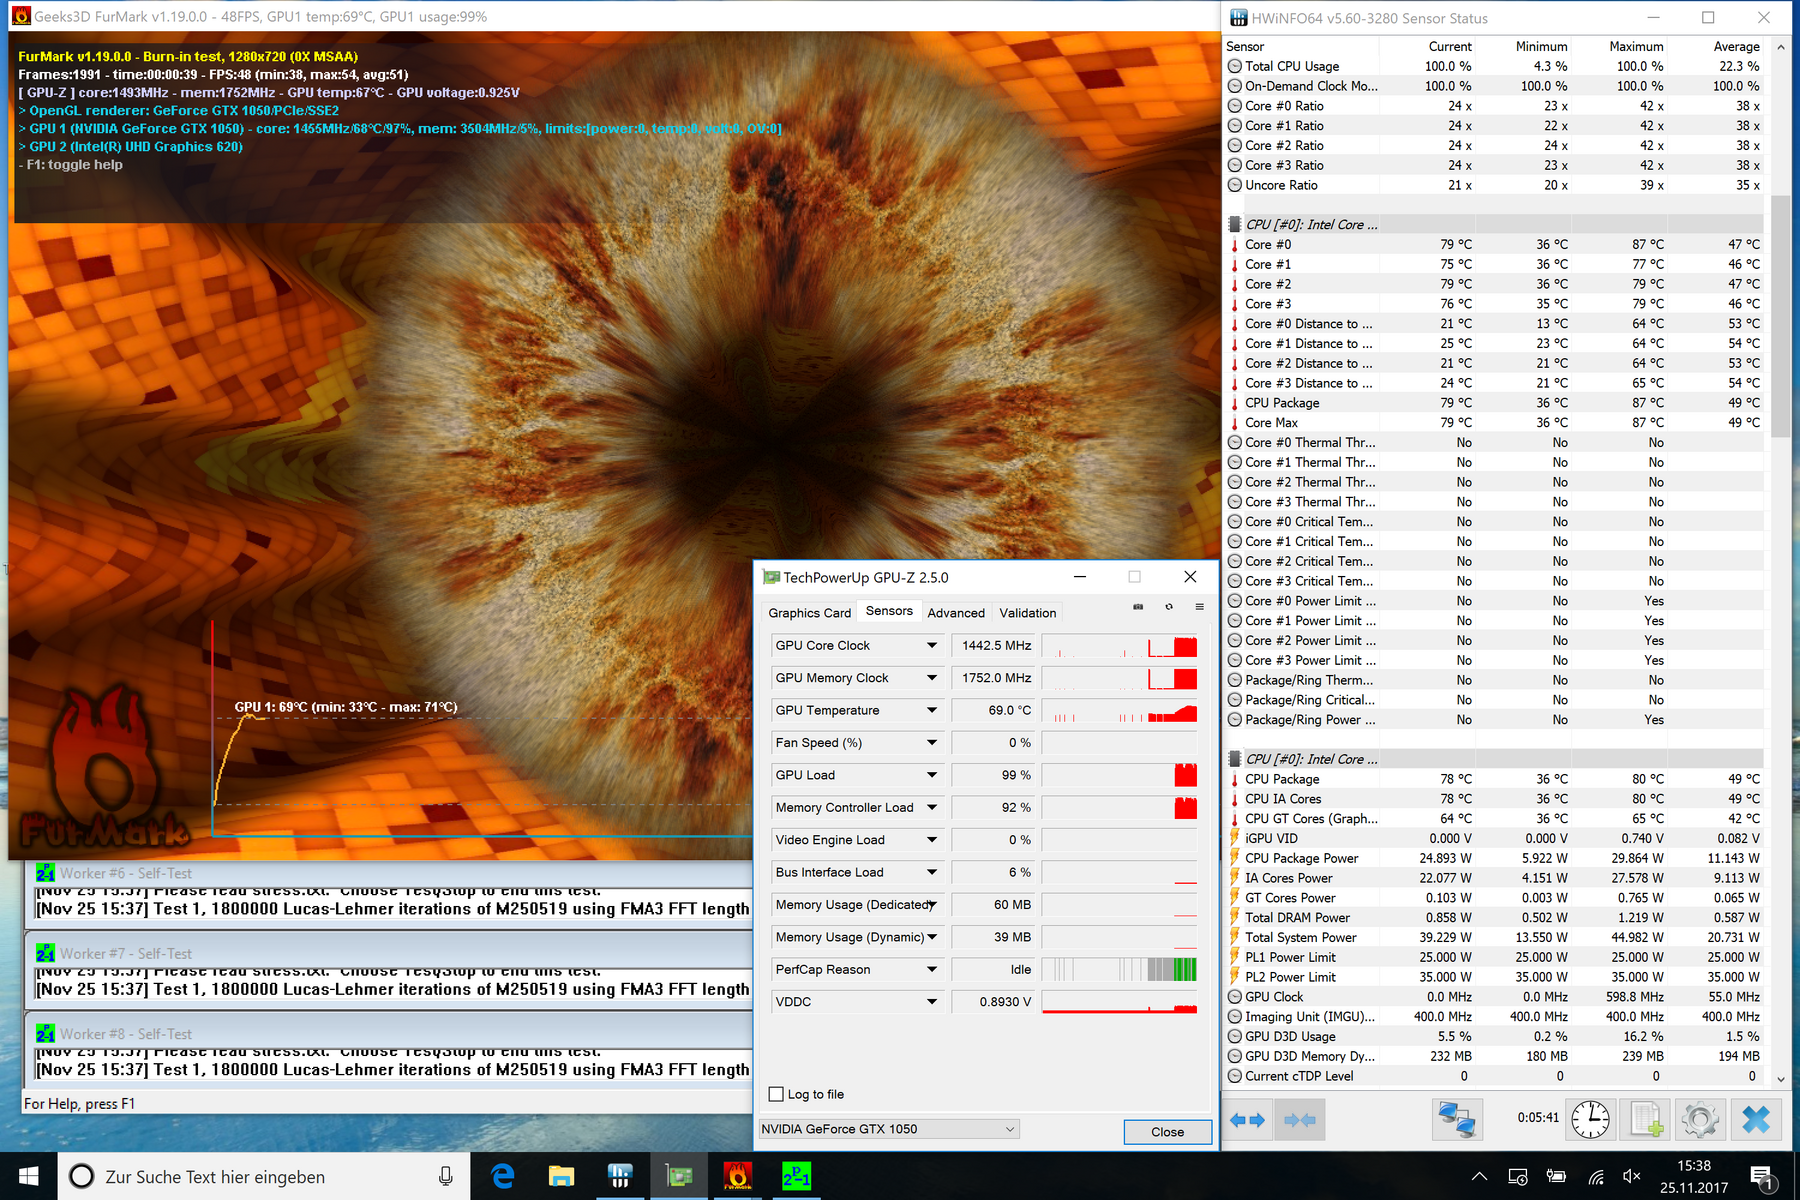
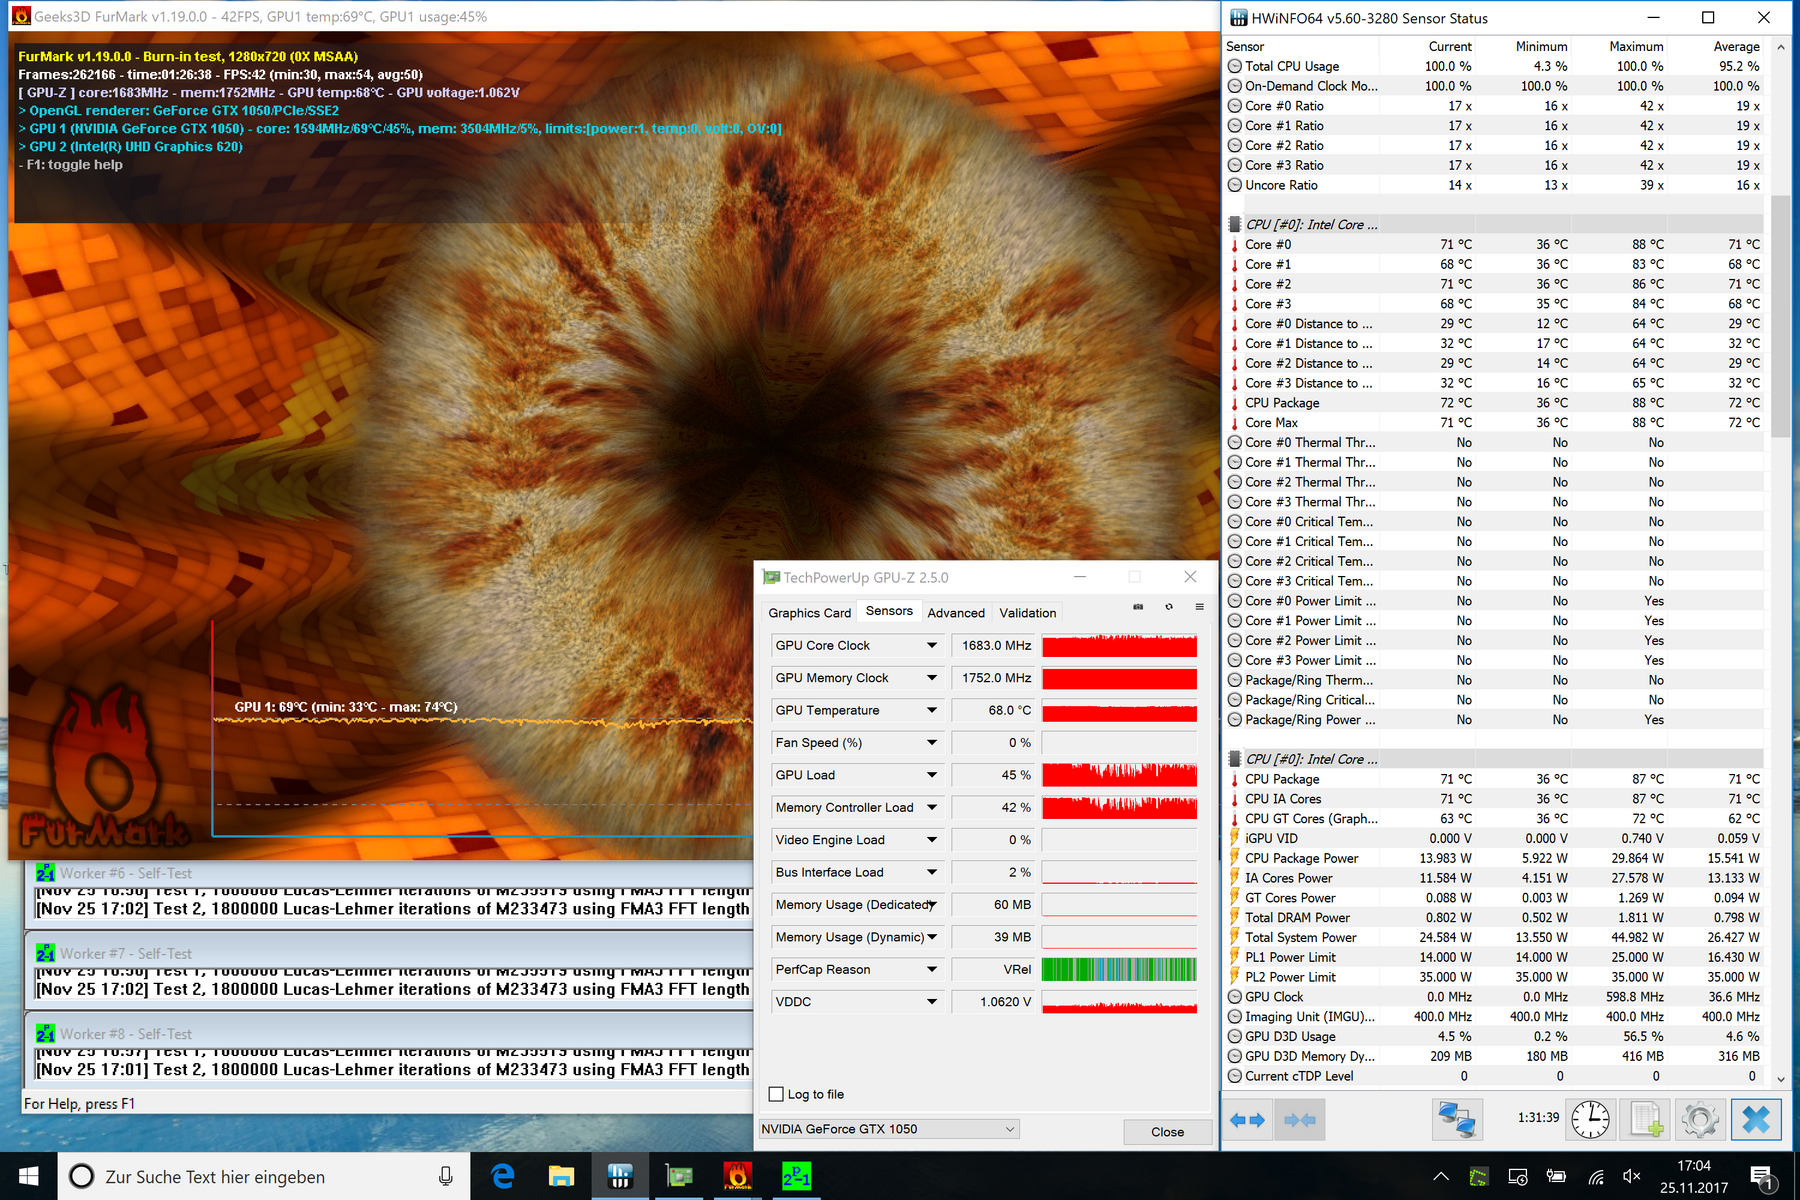
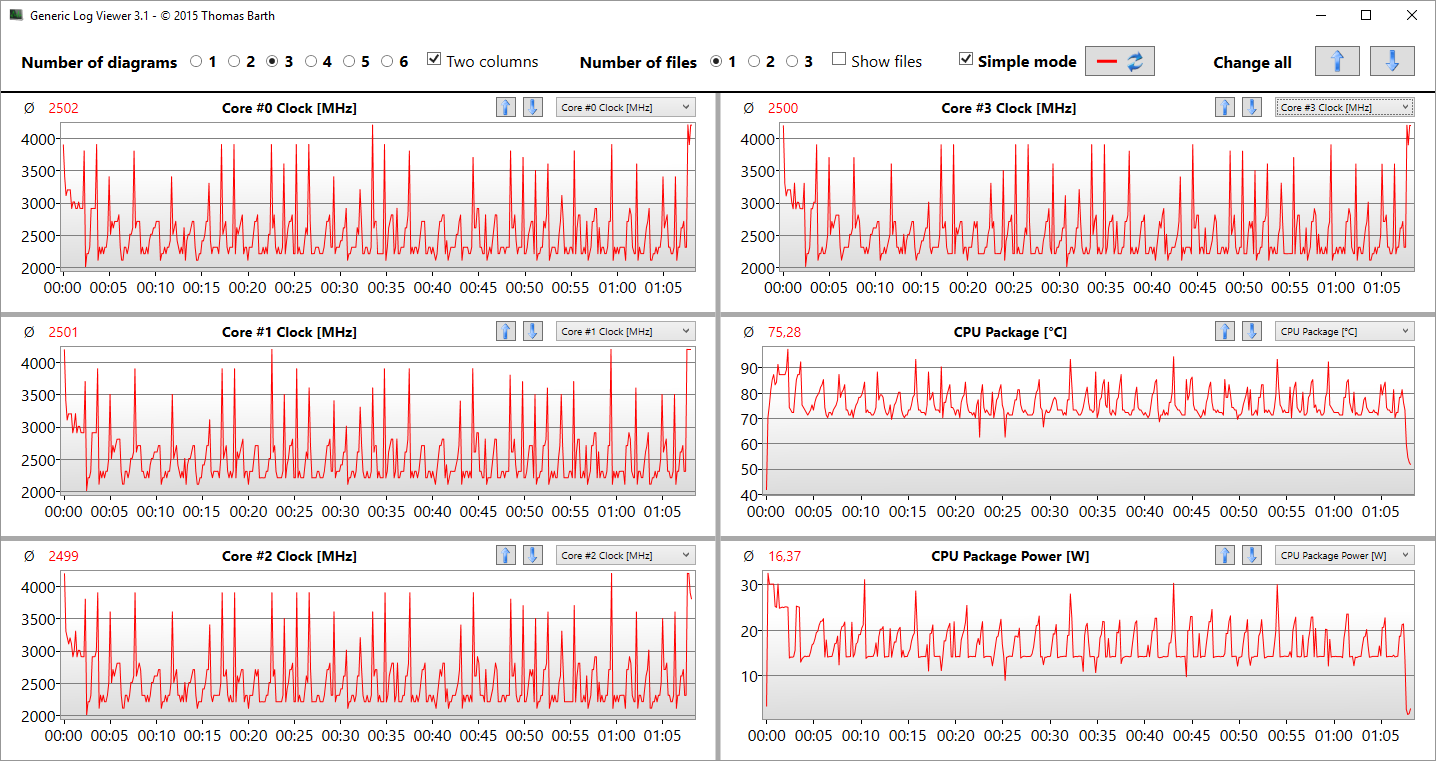
Our stress test is a big challenge, especially for passively cooled devices, but the Surface Book 2 once again performs very well. The processor initially fluctuates between 2.4 and 2.9 GHz, which corresponds with a consumption of 30 W. The limitation at 25 W sets in after a little while and the processor runs at 4x 2.4 GHz, which is once again clearly above the specified 15 W limit. The CPU follows a loop over the course of the stress test, which is always quite similar. As soon as the processor temperature reaches about 85 °C (~185 °F), the TDP will drop to 13 W (4x 1.6 to 1.7 GHz) and slowly increase again until the CPU once again reaches about 85 °C (~185 °F). The threshold is not always the same, the drop sometimes starts to set in at 80 °C (~176 °F; see chart below). The average results after 90 minutes are 15.63 W and ~1.8 GHz. Technically speaking, this is minor throttling (base frequency of 1.9 GHz), but we expected much worse.
The graphics card has its own cooling system, so it is independent of the processor. The GPU clock fluctuates a bit over the course of the stress test, but 1445 MHz and ~70 °C (~158 °F) on average are good results. We repeated 3DMark 11 immediately after the stress test and did not determine a lower score.
Speakers
The two stereo speakers are sitting at the upper two corners of the tablet and direct the sound towards the user. The quality is decent, even though the maximum volume is not very high at 74 dB(A). Still, this is entirely sufficient for some video or web radio playback. The measurements also show a decent performance for the Surface Book 2 with balanced mids and high tones. The lack of bass is not surprising, so action movies and music lack power.
The headphone jack provides an almost noise-free signal, but the position is not perfect. The cable will always hang around in front of the display or above the keyboard when you use the Surface Book 2 as a laptop. We also connected our Bluetooth headphones and did not experience any problems.
Microsoft Surface Book 2 audio analysis
(±) | speaker loudness is average but good (74.2 dB)
Bass 100 - 315 Hz
(±) | reduced bass - on average 12.4% lower than median
(±) | linearity of bass is average (12.3% delta to prev. frequency)
Mids 400 - 2000 Hz
(+) | balanced mids - only 1.9% away from median
(+) | mids are linear (3.6% delta to prev. frequency)
Highs 2 - 16 kHz
(+) | balanced highs - only 4.8% away from median
(±) | linearity of highs is average (9.3% delta to prev. frequency)
Overall 100 - 16.000 Hz
(±) | linearity of overall sound is average (18.2% difference to median)
Compared to same class
» 39% of all tested devices in this class were better, 7% similar, 54% worse
» The best had a delta of 6%, average was 20%, worst was 57%
Compared to all devices tested
» 38% of all tested devices were better, 8% similar, 54% worse
» The best had a delta of 4%, average was 24%, worst was 134%
Lenovo Yoga 920-13IKB-80Y7 audio analysis
(-) | not very loud speakers (65.7 dB)
Bass 100 - 315 Hz
(±) | reduced bass - on average 14.7% lower than median
(-) | bass is not linear (15.7% delta to prev. frequency)
Mids 400 - 2000 Hz
(+) | balanced mids - only 2.3% away from median
(+) | mids are linear (5.5% delta to prev. frequency)
Highs 2 - 16 kHz
(+) | balanced highs - only 2.9% away from median
(+) | highs are linear (6.8% delta to prev. frequency)
Overall 100 - 16.000 Hz
(±) | linearity of overall sound is average (18.5% difference to median)
Compared to same class
» 40% of all tested devices in this class were better, 8% similar, 52% worse
» The best had a delta of 6%, average was 20%, worst was 57%
Compared to all devices tested
» 41% of all tested devices were better, 8% similar, 51% worse
» The best had a delta of 4%, average was 24%, worst was 134%
Frequency Comparison (Checkboxes select/deselectable!)
Energy Management
Power Consumption
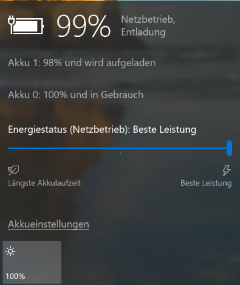
There have been multiple reports about problems with the power delivery of the larger 15-inch model, because the power adapter cannot provide sufficient power under load, so the batteries discharge. Microsoft seems to be aware of the problem and mentions the new performance slider. However, there is supposed to be an internal control to avoid a full discharge of the batteries. We were very eager to see whether the smaller Surface Book 2 has similar problems.
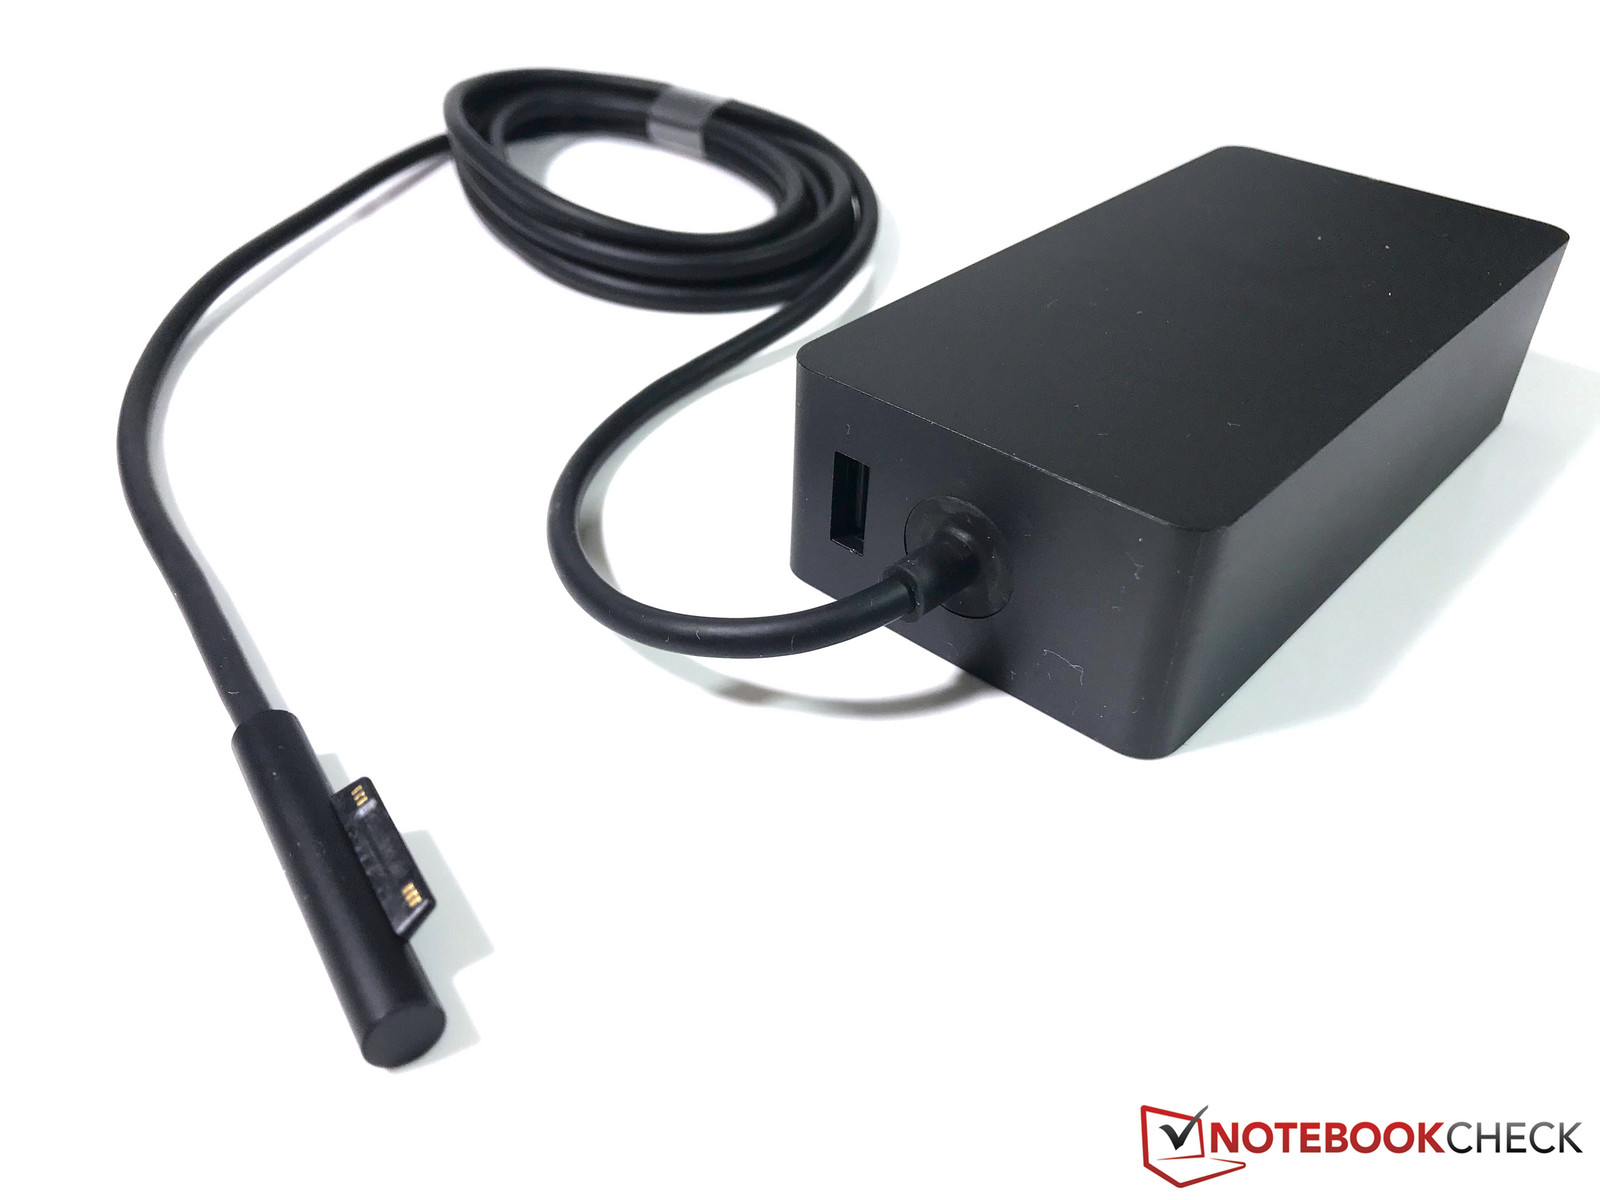
Unfortunately, the answer is yes. We were surprised to find a 102-W power adapter in the box (similar to the previous generation) since the official specifications from Microsoft list a 95-W adapter. We measure up to 100.3 W during gaming and the stress test, so the power adapter should just be sufficient. However, the batteries repeatedly discharged and recharged again during the benchmarks, because the power consumption always fluctuates a bit. This continuous discharging/charging cannot be healthy for the batteries. The solution is – as with the emissions – the new performance slider in the battery options:
| Recommend | Better Performance | Best Performance | |
| Witcher 3 ultra | 52 - 59 W | 87 - 93 W | 94 - 99 W |
The power delivery might be restricted by the Surface Connector, but this should not happen. The more powerful 15-inch with the faster GTX 1060 graphics will probably have bigger problems. We recommend avoiding the Best Performance setting with the loud fan in general, so this is at least not a deal breaker for the Surface Book 2 13.5".
The Surface Book 2 consumes more power than the previous generation, but you have to consider the new quad-core processor as well. The convertible is average in idle scenarios; the bright and high-resolution display takes its toll. We were surprised by the fluctuation between 0.006 W and 4.8 W during standby, which results in a high average consumption of 0.76 W. The fluctuation is also noticeable when the device is turned off, but the range is smaller at 0.005 to 0.5 W (0.15 W on average).
| Off / Standby | |
| Idle | |
| Load |
|
Key:
min: | |
| Microsoft Surface Book 2 i7-8650U, GeForce GTX 1050 Mobile, Samsung PM961 MZVLW256HEHP, IPS, 3000x2000, 13.5" | Microsoft Surface Book with Performance Base 6600U, GeForce GTX 965M, Toshiba NVMe THNSN5256GPU7, IPS, 3000x2000, 13.5" | Lenovo Yoga 920-13IKB-80Y7 i5-8550U, UHD Graphics 620, Samsung PM961 MZVLW256HEHP, IPS, 1920x1080, 13.9" | Microsoft Surface Laptop i7 i7-7660U, Iris Plus Graphics 640, Samsung PM971 KUS040202M, IPS, 2256x1504, 13.5" | Apple MacBook Pro 13 2017 Touchbar i5 i5-7267U, Iris Plus Graphics 650, Apple SSD AP0256, IPS, 2560x1600, 13.3" | Razer Blade (2017) i7-7700HQ, GeForce GTX 1060 Mobile, Samsung PM951 NVMe MZVLV256, IPS, 1920x1080, 14" | Gigabyte Aero 14-K7 i7-7700HQ, GeForce GTX 1050 Ti Mobile, Samsung SM961 MZVPW256HEGL, IPS, 2560x1440, 14" | Eve-Tech Eve V i7 i7-7Y75, HD Graphics 615, Intel SSD 600p SSDPEKKW512G7, IPS, 2880x1920, 12.3" | |
|---|---|---|---|---|---|---|---|---|
| Power Consumption | 20% | 48% | 48% | 24% | -17% | -38% | 41% | |
| Idle Minimum * (Watt) | 4.7 | 4.15 12% | 3.1 34% | 2.7 43% | 2.8 40% | 7.5 -60% | 9 -91% | 4.5 4% |
| Idle Average * (Watt) | 10.6 | 8 25% | 6.6 38% | 7.6 28% | 10.9 -3% | 12.1 -14% | 14 -32% | 7.6 28% |
| Idle Maximum * (Watt) | 12.3 | 11.9 3% | 7 43% | 7.8 37% | 11.4 7% | 14.3 -16% | 19 -54% | 8.1 34% |
| Load Average * (Watt) | 81 | 67 17% | 35.2 57% | 37.5 54% | 55.4 32% | 73.5 9% | 84 -4% | 22 73% |
| Witcher 3 ultra * (Watt) | 97 | 58 40% | 31.7 67% | 108 -11% | 95 2% | |||
| Load Maximum * (Watt) | 100.3 | 76 24% | 34.6 66% | 41.6 59% | 57.5 43% | 110.2 -10% | 149 -49% | 33.1 67% |
* ... smaller is better
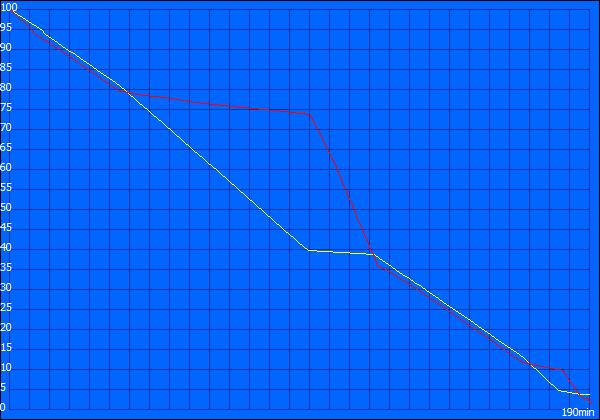
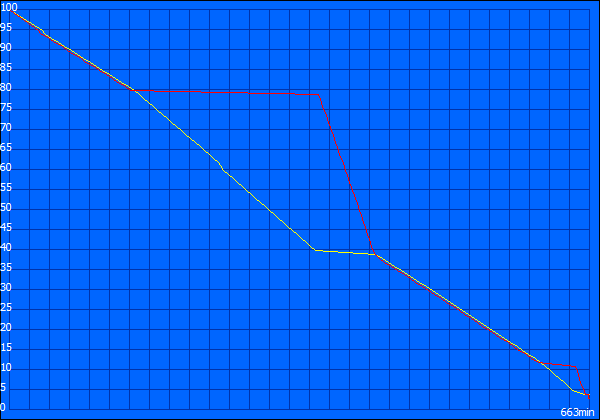
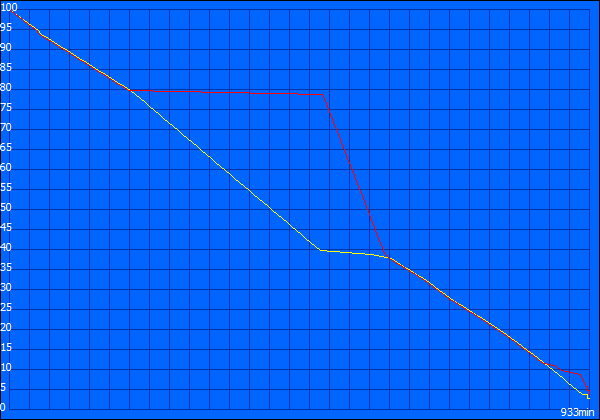
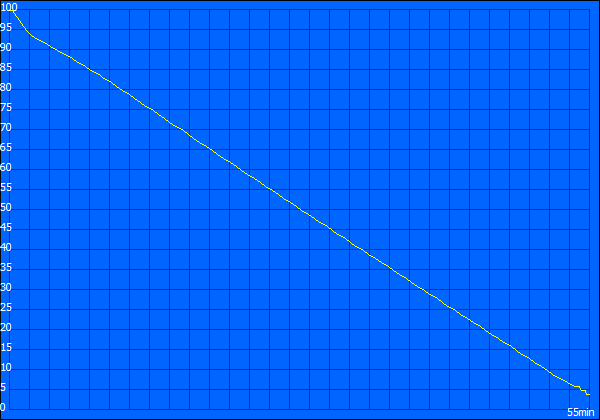
Battery Runtime
Microsoft advertises a total battery capacity of 70 Wh for the smaller Surface Book 2. The tablet battery is still rated at 18 Wh, and we can confirm that. However, there are discrepancies for the battery inside the keyboard unit. Several tools (AIDA, HWMonitor, etc.) show a Design Capacity of 57 Wh and a current charge to more than 61 Wh. We therefore take the Design Capacity for our database (75 Wh in total).
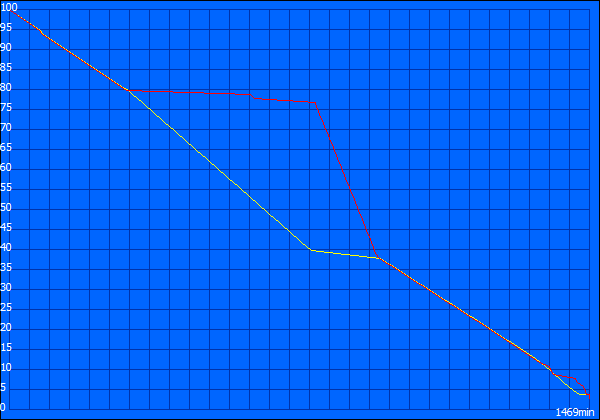
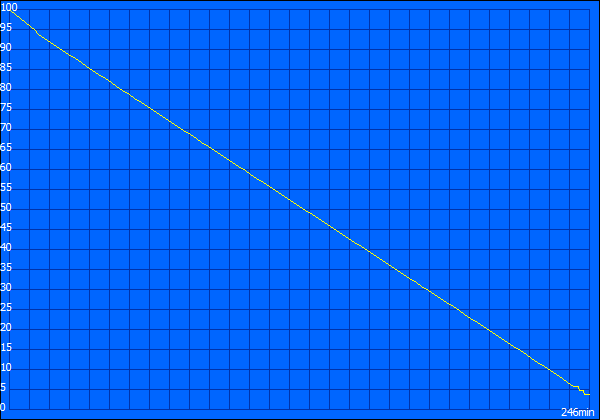
We start with the laptop runtimes and both batteries in use. We have already talked about the WLAN test in the preview, where the Surface Book 2 beats its predecessor at more than 11 hours. It also performs very well within the comparison group. This trend continues in the other test, especially the video runtime at an adjusted luminance of 150 nits (wireless modules turned off). More than 15 hours is a very good result, and this should be sufficient even for long bus or train rides. The minimum runtime is little more than three hours thanks to the reduced performance on battery.
| Microsoft Surface Book 2 i7-8650U, GeForce GTX 1050 Mobile, 75 Wh | Microsoft Surface Book with Performance Base 6600U, GeForce GTX 965M, 78 Wh | Lenovo Yoga 920-13IKB-80Y7 i5-8550U, UHD Graphics 620, 70 Wh | Microsoft Surface Pro 4 Core i7 6650U, Iris Graphics 540, 38 Wh | Microsoft Surface Laptop i7 i7-7660U, Iris Plus Graphics 640, 45 Wh | Apple MacBook Pro 13 2017 Touchbar i5 i5-7267U, Iris Plus Graphics 650, 49.2 Wh | Razer Blade (2017) i7-7700HQ, GeForce GTX 1060 Mobile, 70 Wh | Gigabyte Aero 14-K7 i7-7700HQ, GeForce GTX 1050 Ti Mobile, 94.24 Wh | |
|---|---|---|---|---|---|---|---|---|
| Battery runtime | -21% | -4% | -57% | -30% | -47% | -18% | -33% | |
| Reader / Idle (h) | 24.5 | 25.5 4% | 27.6 13% | 10.9 -56% | 15.9 -35% | |||
| H.264 (h) | 15.6 | 12.8 -18% | 6.9 -56% | 7.8 -50% | ||||
| WiFi v1.3 (h) | 11.1 | 9.6 -14% | 11.4 3% | 4.9 -56% | 7.6 -32% | 8.7 -22% | 9.1 -18% | 8.9 -20% |
| Witcher 3 ultra (h) | 3.8 | |||||||
| Load (h) | 3.2 | 1.5 -53% | 2.3 -28% | 1.3 -59% | 1.9 -41% | 1.2 -62% | 2.4 -25% |
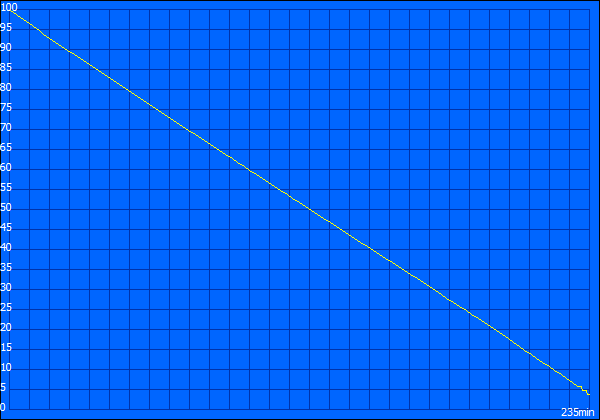
The tablet unit of the Surface Book 2 is comparatively light and perfect for web browsing or video playback on the couch, so we performed additional runtime tests with the tablet. Besides our usual WLAN and video scenarios, we also checked the runtime when you stream a video via Netflix. We used the Windows app in Fullscreen mode and adjusted the luminance to 150 nits. All in all, you cannot expect a lot from the small battery inside the tablet: It only lasts for about 2.5 hours in the web browsing test, and about 4 hours in the two video scenarios.

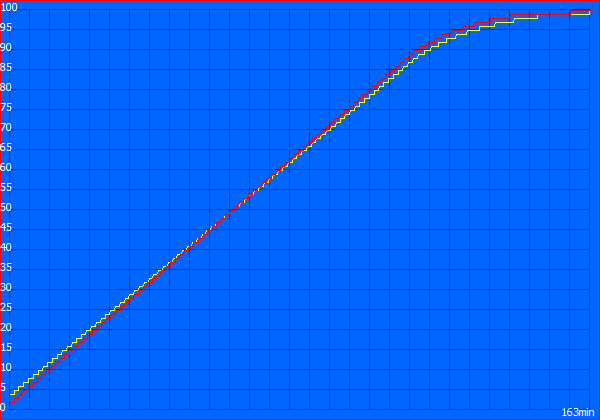
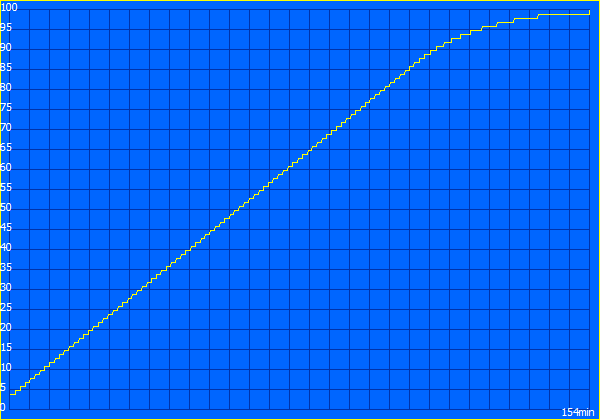
The charging time is interesting, because it always takes about 2.5 hours before the battery is fully charged. Strangely, this also applies when you only charge the tablet, and it does not matter if you attach the power adapter to the tablet or the keyboard unit. We think this is unnecessarily long, especially since the tablet cannot be charged by the secondary battery in the keyboard unit. You must use the power adapter.
Verdict
Pros
Cons
Microsoft promises a lot with the new Surface Book 2. The 13.5-inch convertible is a really good device in some respects, but we are sometimes wondering why the manufacturer ignores known issues or waives modern standards.
Let us begin with the good things. Microsoft says the new device is twice as powerful as before. This is true as long as you focus on the CPU performance. The new ULV quad-core from Intel is much faster compared to the previous dual-core models. We can only praise Microsoft for the performance utilization, which is very decent, despite the passive cooling. Some laptops with actively cooled CPUs perform worse. However, not much has changed in terms of the graphics card. Yes, the GTX 1050 performs well, but it is not much faster than the previous GTX 965M. The new Surface Book 2 also lasts longer on battery, still uses an excellent display, and has a nice chassis with comfortable input devices.
The Surface Book 2 13.5" is once again almost unrivaled thanks to the good performance. However, there are some compromises (no Thunderbolt 3!), which are hard to swallow considering the high price.
The biggest problem is revealed when you stress the dedicated GeForce GPU, because the fan is really loud. We showed how you can easily bypass this issue with the new performance settings of Windows without sacrificing much performance.
A bigger issue, which seems to be acceptable for Microsoft, is the power delivery. The power adapter is not always sufficient during gaming, so the batteries are slightly discharged and charged again. This cannot be good for the battery health. It might be related to a limitation of the Surface Connector since the power adapter of our test model should be sufficient. This brings us to the next problem, the ports. Microsoft probably sticks to the Surface Connector to ensure compatibility with the old Surface Dock. This is unfortunately a big limitation. A modern Thunderbolt 3 port would be more practical and future-proof. An additional USB Type-C port on the tablet would have been nice as well.
The battery situation is not perfect either. There is a connector for the power adapter on the tablet, but it still takes almost 2.5 hours to charge the small battery. This can probably be fixed via a software update. An "empty" tablet can unfortunately not be charged by the battery in the keyboard unit either.
You can easily avoid the loud fan in this case and the power delivery should not be a big deal in practice as long as you avoid the Best Performance setting. The missing Thunderbolt 3 support is a bigger issue for a price tag of more than 2200 Euros ($1999) though. The Surface Pen is not included anymore and has to be purchased separately. The 13.5-inch convertible is still almost unrivaled on the market thanks to the high performance and leaves a positive overall impression.
Microsoft Surface Book 2
- 11/28/2017 v6 (old)
Andreas Osthoff
Price comparison
