Core i7-1265U vs. Core i5-1250P: Lenovo ThinkPad X1 Carbon Gen 10 laptop review
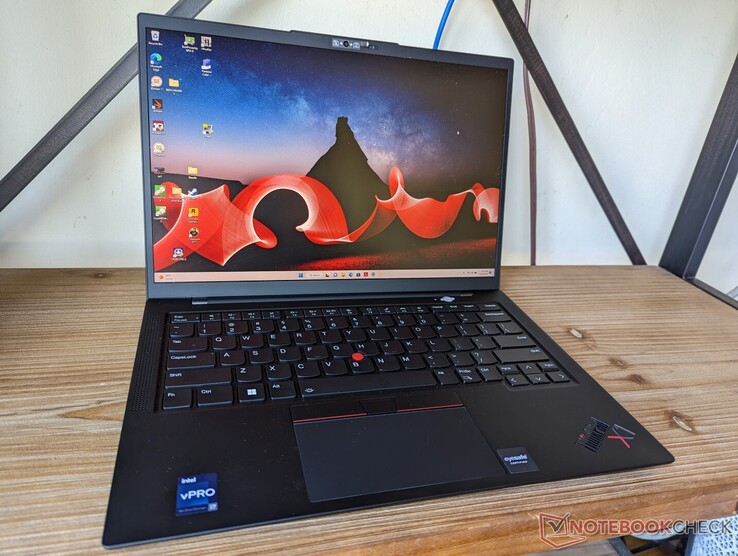
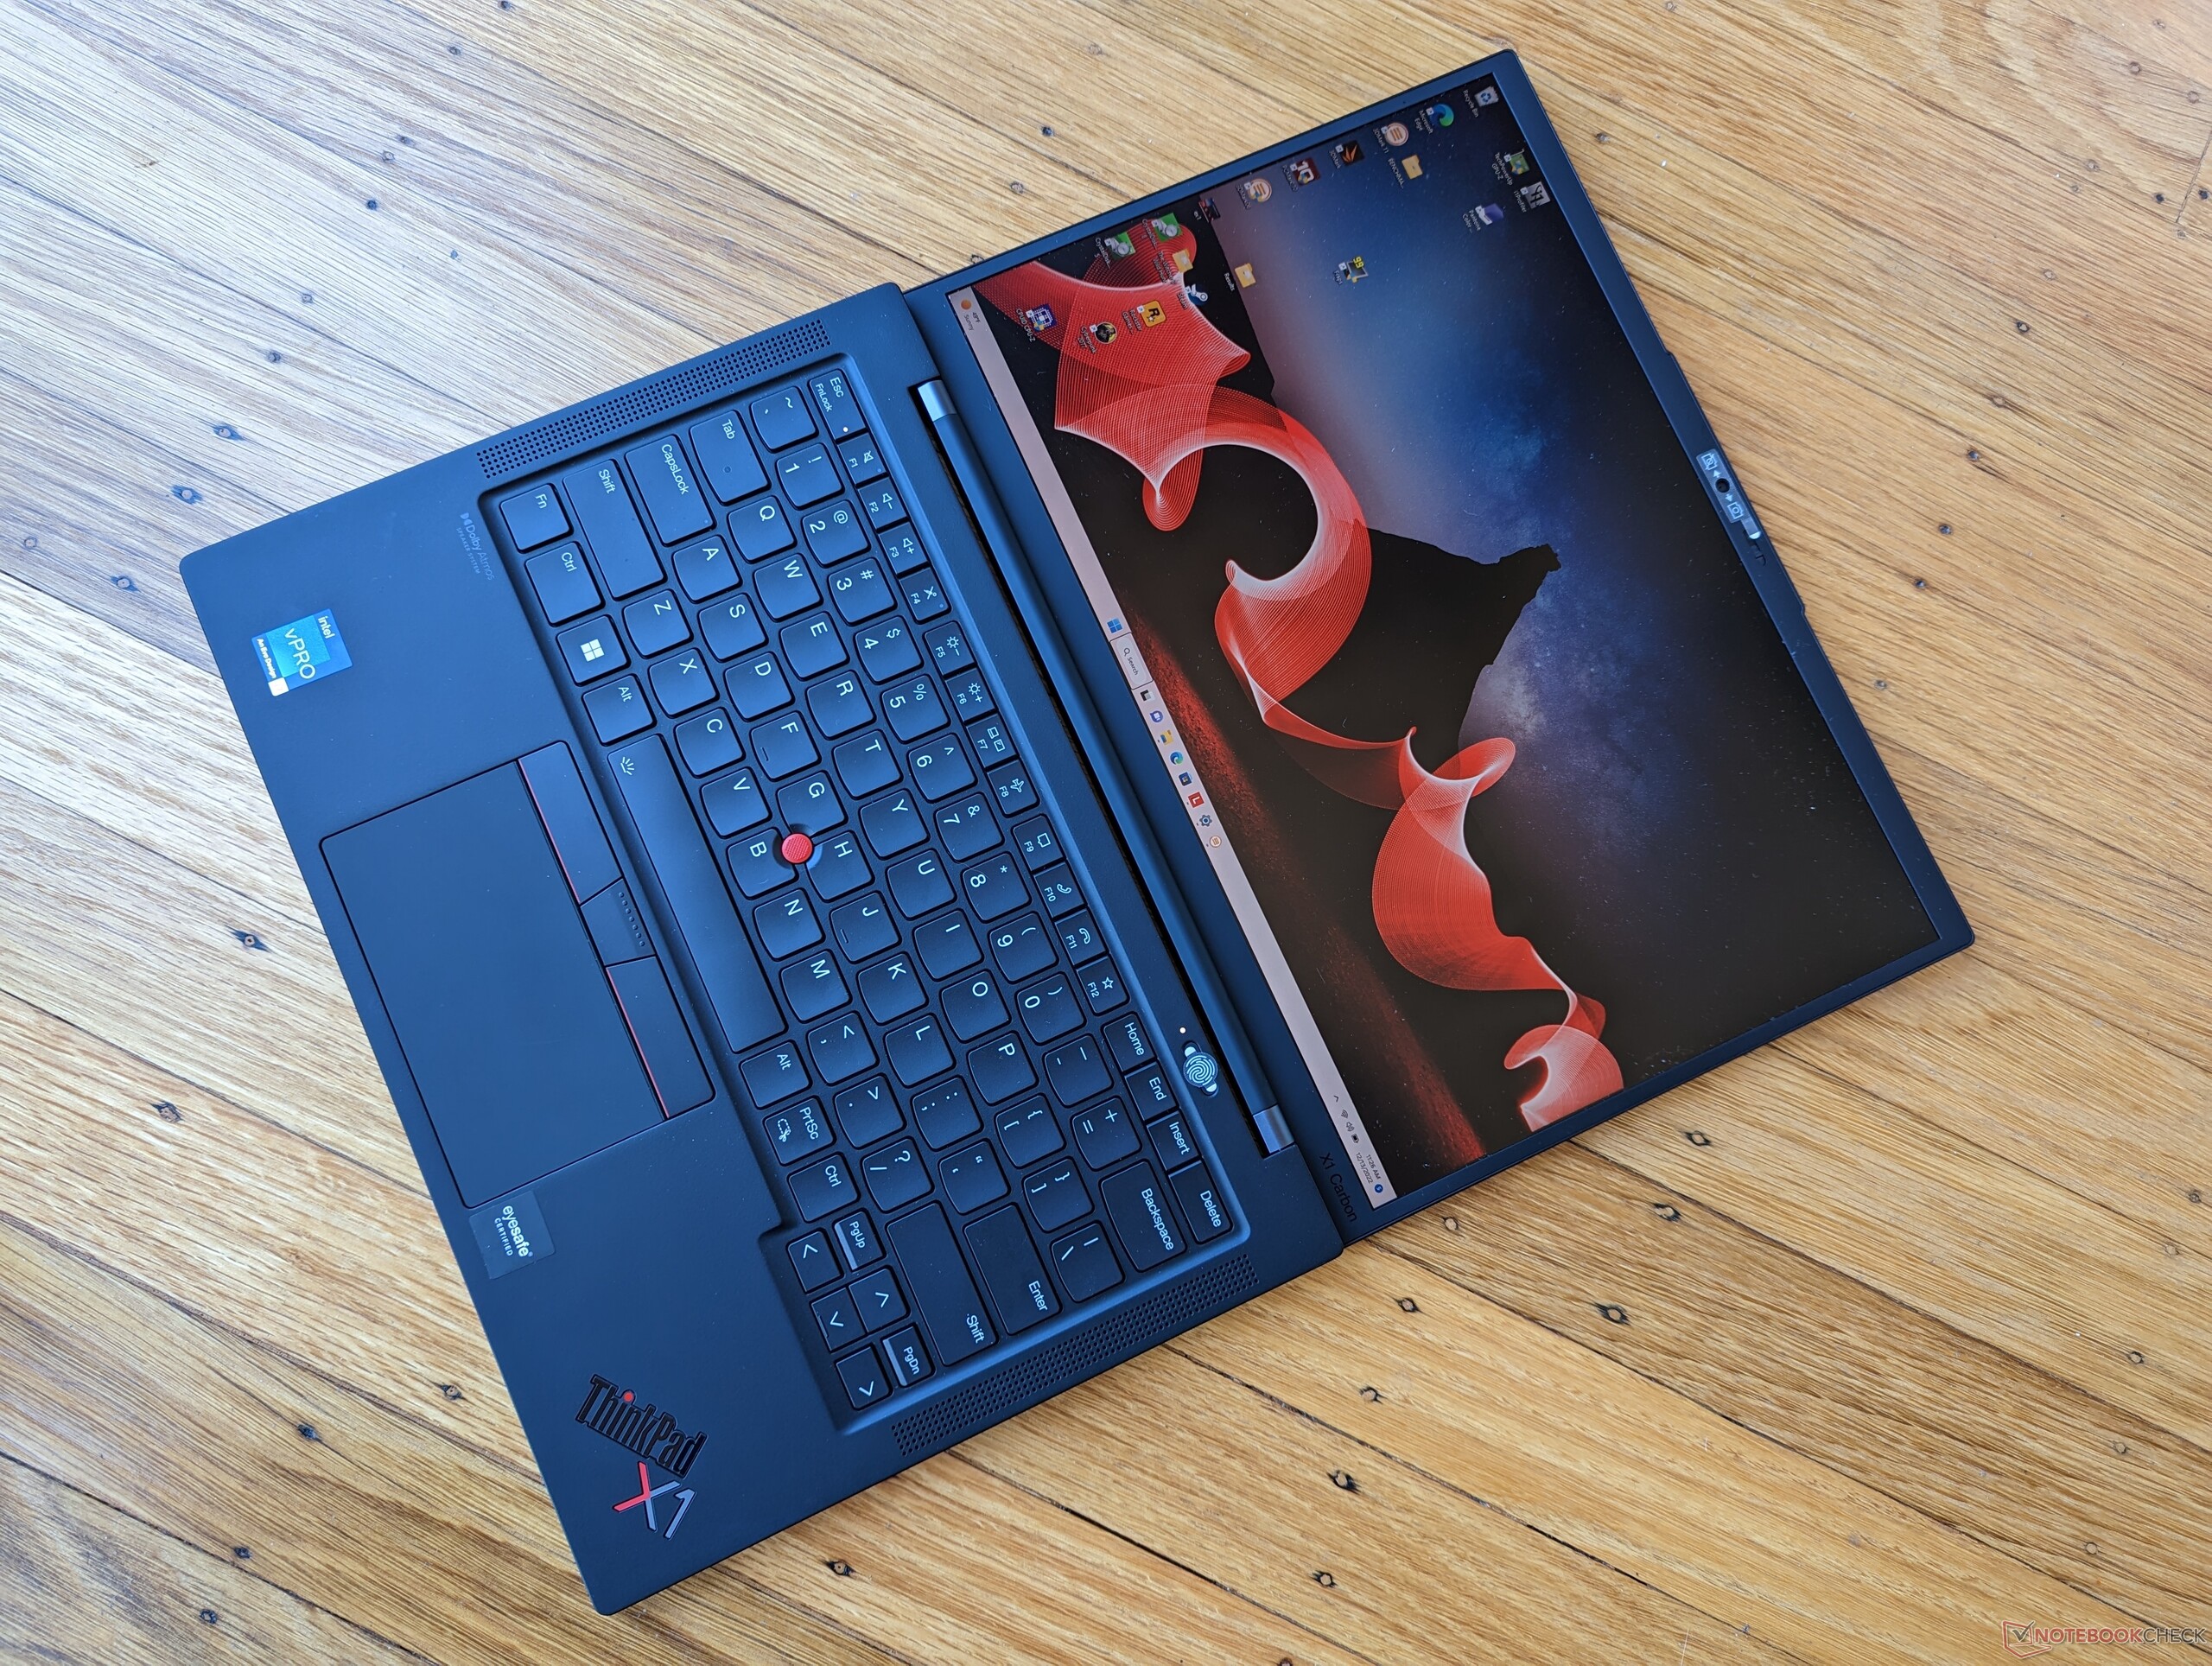
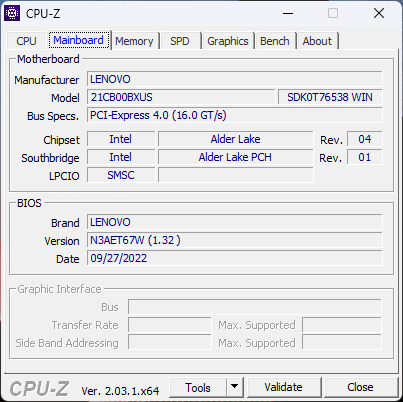
The ThinkPad X1 Carbon G10 is the latest ultralight business laptop from Lenovo sporting 12th gen Intel Core-U and Core-P CPUs. Options range from the Core i5-1240P to the Core i7-1280P or the Core i5-1235U to the Core i7-1265U.
We recently reviewed the Core i5-1250P version and now our focus for this review will be the Core i7-1265U version of the same ThinkPad X1 Carbon G10 model. Check out our existing on the Core-P version to learn more about the chassis, ports, keyboard, and other physical features of the model.
Competitors to the ThinkPad X1 Carbon G10 include other high-end business subnotebooks like the Dell Latitude 7420, Asus ExpertBook B1, HP EliteBook 845 G9, or the MSI Summit series.
More Lenovo reviews:
Potential Competitors in Comparison
Rating | Date | Model | Weight | Height | Size | Resolution | Price |
|---|---|---|---|---|---|---|---|
| 90.2 % v7 (old) | 12 / 2022 | Lenovo ThinkPad X1 Carbon G10 Core i7-1265U i7-1265U, Iris Xe G7 96EUs | 1.2 kg | 15.36 mm | 14.00" | 1920x1200 | |
| 90.2 % v7 (old) | 06 / 2022 | Lenovo ThinkPad X1 Carbon G10 21CC001RGE i5-1250P, Iris Xe G7 80EUs | 1.2 kg | 15.36 mm | 14.00" | 1920x1200 | |
| 88.6 % v7 (old) | 11 / 2022 | HP EliteBook 845 G9 6F6H9EA R5 PRO 6650U, Radeon 660M | 1.4 kg | 19 mm | 14.00" | 1920x1200 | |
| 86.6 % v7 (old) | 10 / 2022 | LG Gram 14Z90Q i5-1240P, Iris Xe G7 80EUs | 980 g | 16.8 mm | 14.00" | 1920x1200 | |
| 90.1 % v7 (old) | 04 / 2022 | Dell Latitude 7420 JW6MH i5-1145G7, Iris Xe G7 80EUs | 1.3 kg | 17.3 mm | 14.00" | 1920x1080 | |
| 83.9 % v7 (old) | 11 / 2021 | Asus ExpertBook B1 B1400CEAE, i5-1135G7 i5-1135G7, Iris Xe G7 80EUs | 1.5 kg | 19.2 mm | 14.00" | 1920x1080 |
Case
Communication
| Networking | |
| iperf3 transmit AX12 | |
| Asus ExpertBook B1 B1400CEAE, i5-1135G7 | |
| Dell Latitude 7420 JW6MH | |
| iperf3 receive AX12 | |
| Dell Latitude 7420 JW6MH | |
| Asus ExpertBook B1 B1400CEAE, i5-1135G7 | |
| iperf3 receive AXE11000 6GHz | |
| LG Gram 14Z90Q | |
| Lenovo ThinkPad X1 Carbon G10 21CC001RGE | |
| Lenovo ThinkPad X1 Carbon G10 Core i7-1265U | |
| iperf3 receive AXE11000 | |
| HP EliteBook 845 G9 6F6H9EA | |
| Lenovo ThinkPad X1 Carbon G10 Core i7-1265U | |
| iperf3 transmit AXE11000 | |
| Lenovo ThinkPad X1 Carbon G10 Core i7-1265U | |
| iperf3 transmit AXE11000 6GHz | |
| Lenovo ThinkPad X1 Carbon G10 21CC001RGE | |
| Lenovo ThinkPad X1 Carbon G10 Core i7-1265U | |
Webcam


Accessories and Warranty
There are no extras in the box other than the AC adapter. A one-year on-site manufacturer warranty applies if purchased in the US.
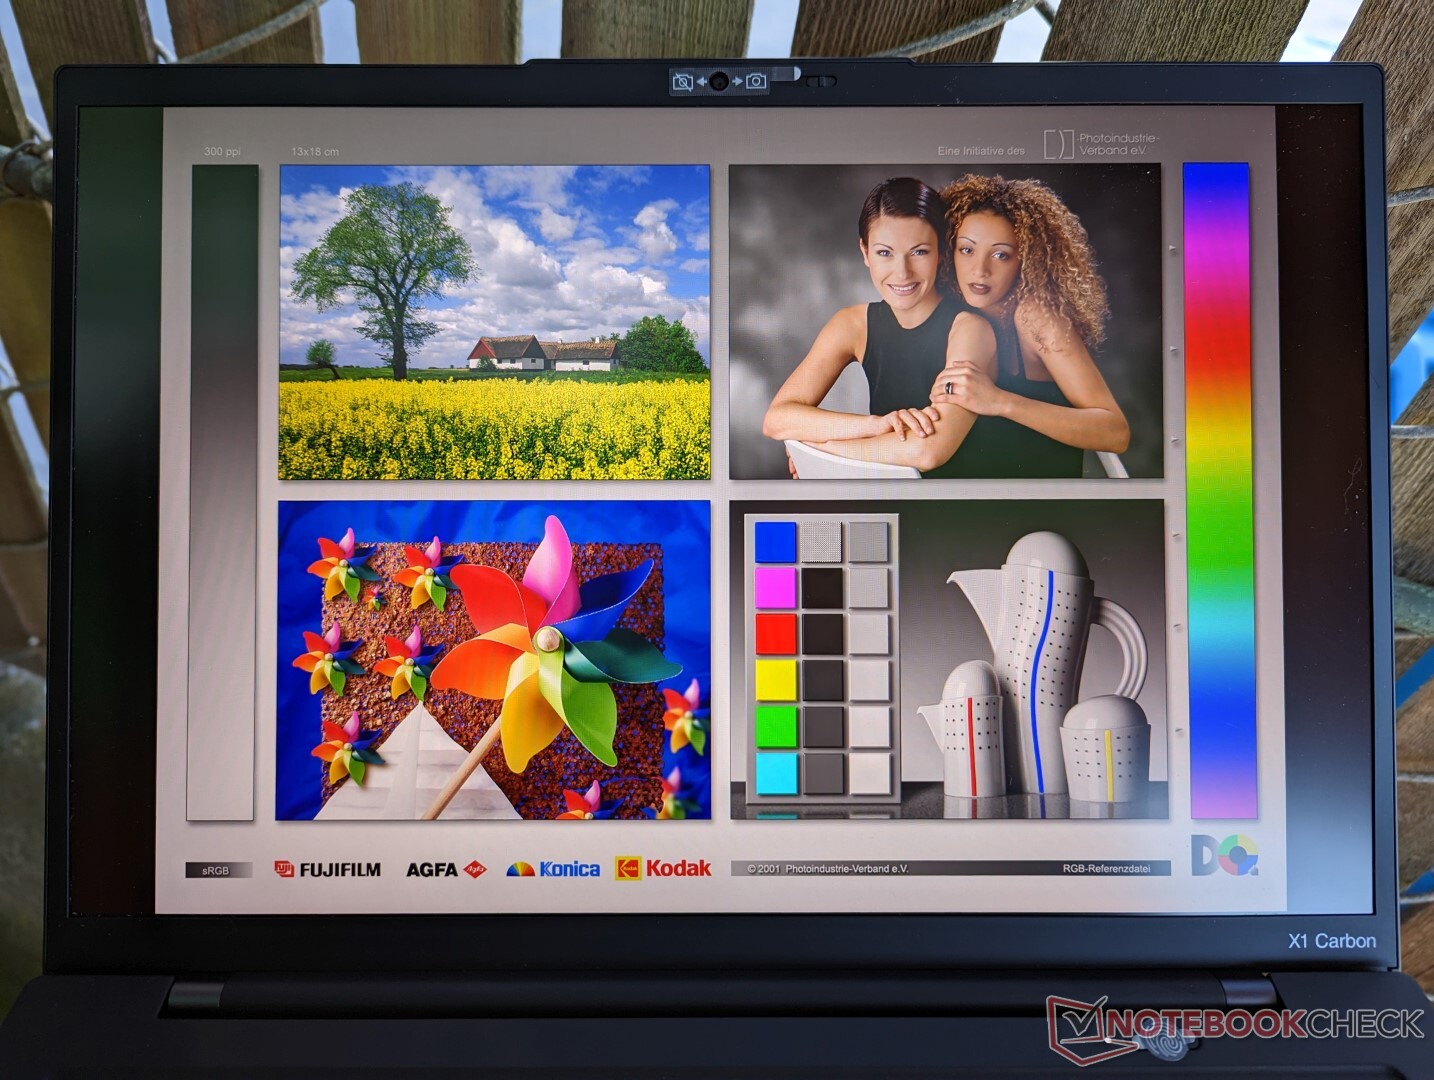
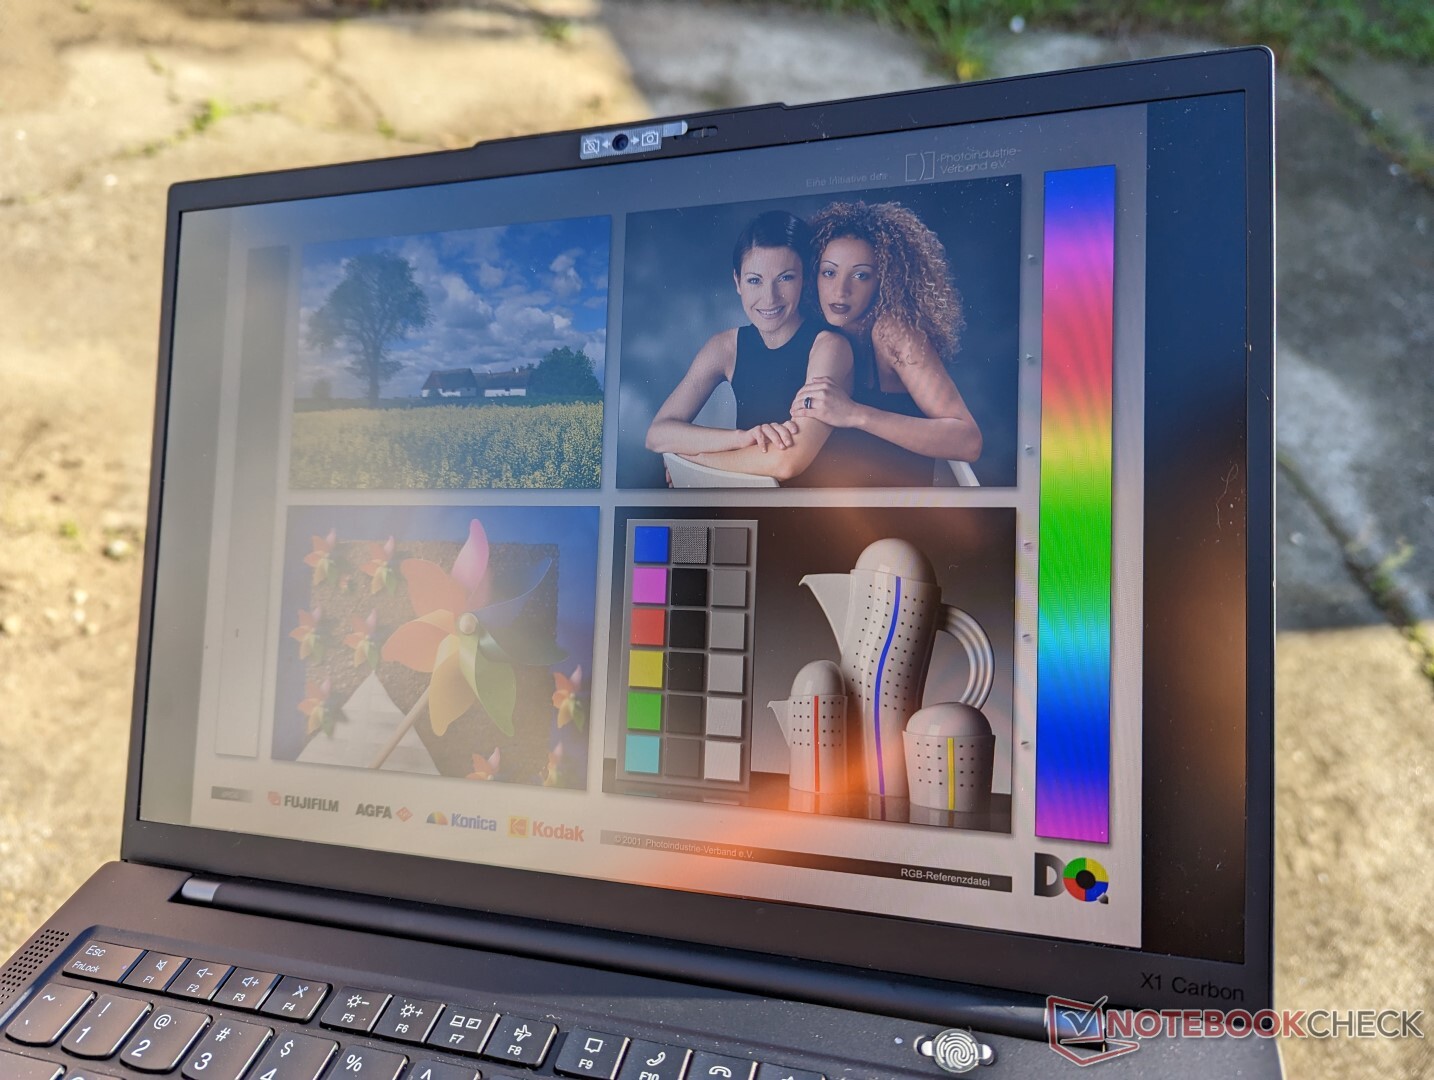
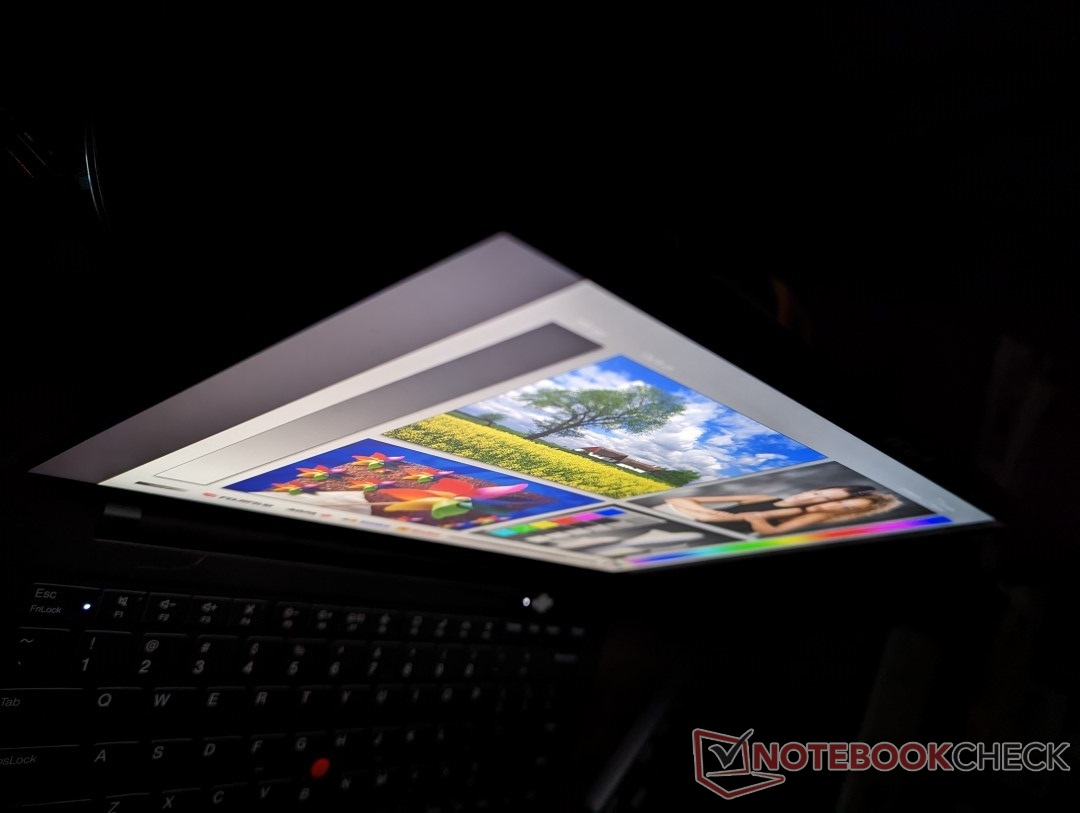
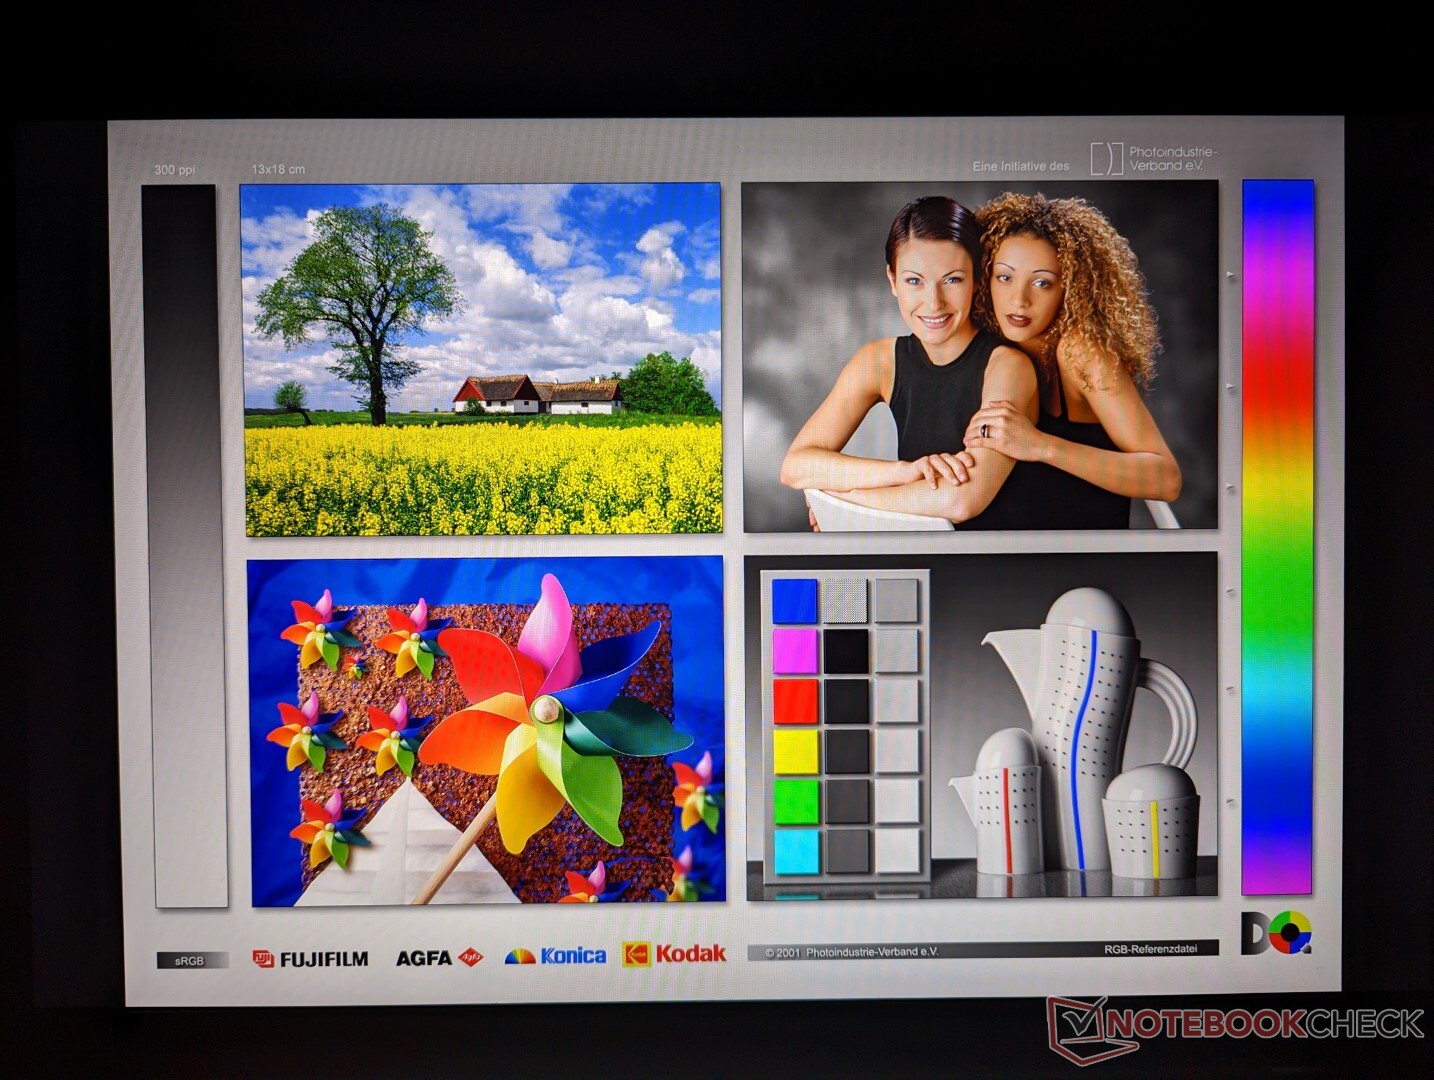
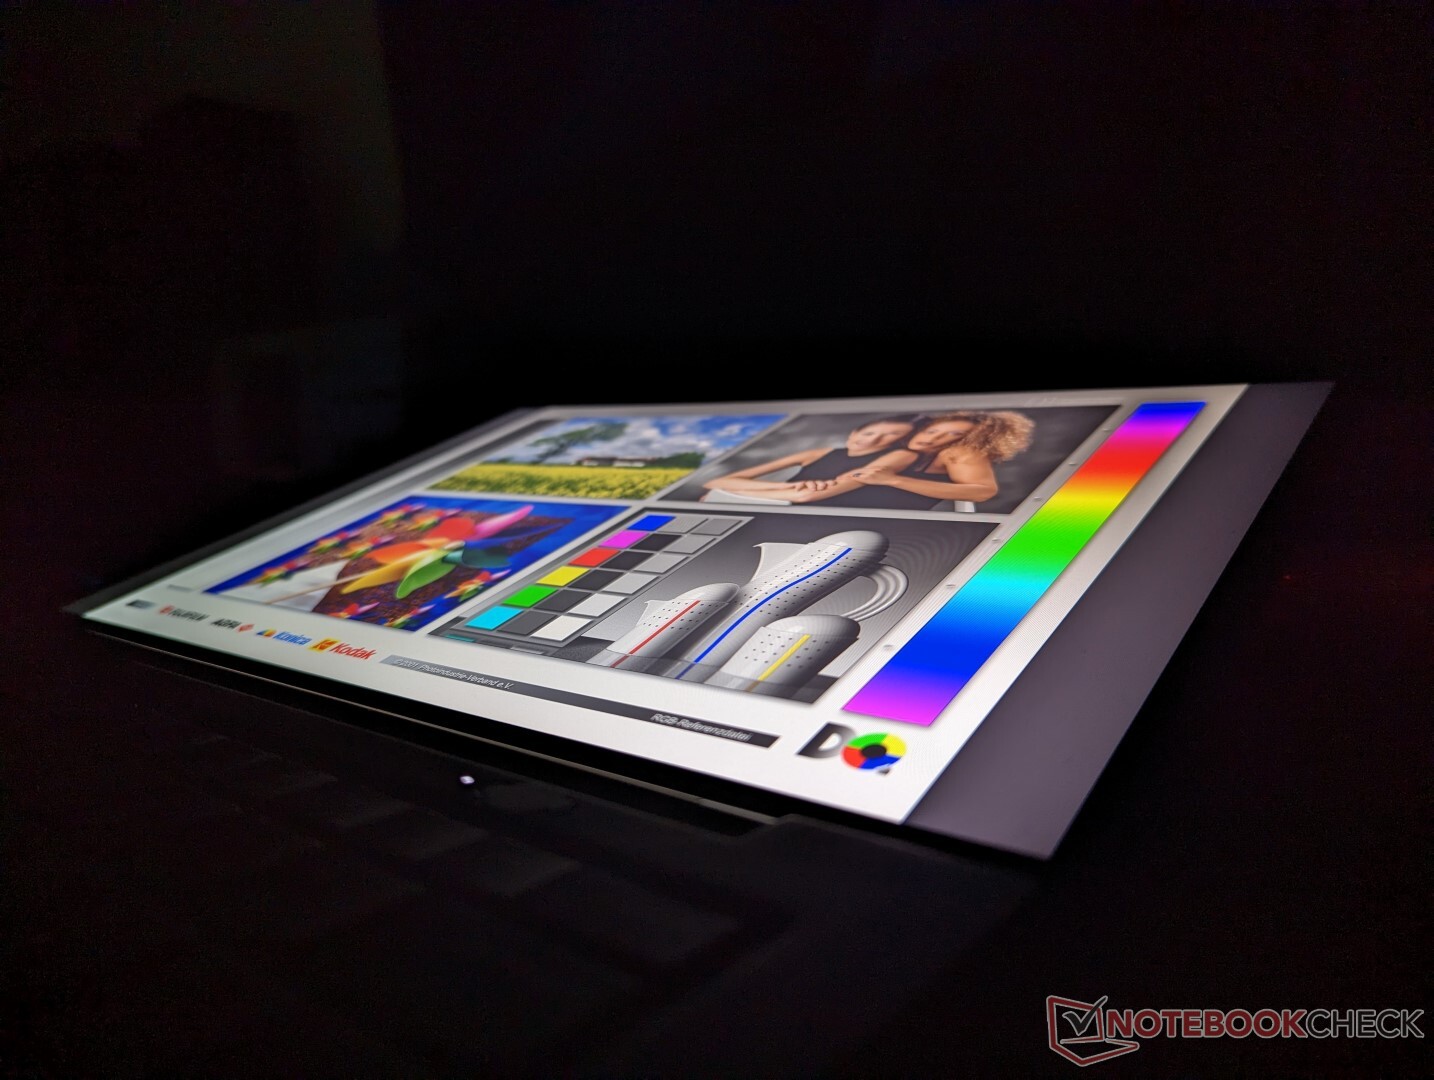
Display
Interestingly, our Core-U unit uses a 1200p IPS panel from IVO instead of the B140UAN02.1 panel from AU Optronics as found on our Core-P unit. Though they both cover the sRGB standard completely, the IVO panel appears to offer slower response times and an inferior contrast ratio than the AUO panel as shown by our measurements below. Ghosting is more apparent on the IVO panel as a result.
There are a couple of benefits with the IVO panel, however. The backlight on our review unit is slightly brighter on average and it exhibits no pulse-width modulation unlike on the AUO panel of our Core-P configuration. Users who might be sensitive to screen flickering may prefer the IVO panel as a result. Unfortunately, there is no way of knowing or guaranteeing which of the two panels you will get if ordering online.
| |||||||||||||||||||||||||
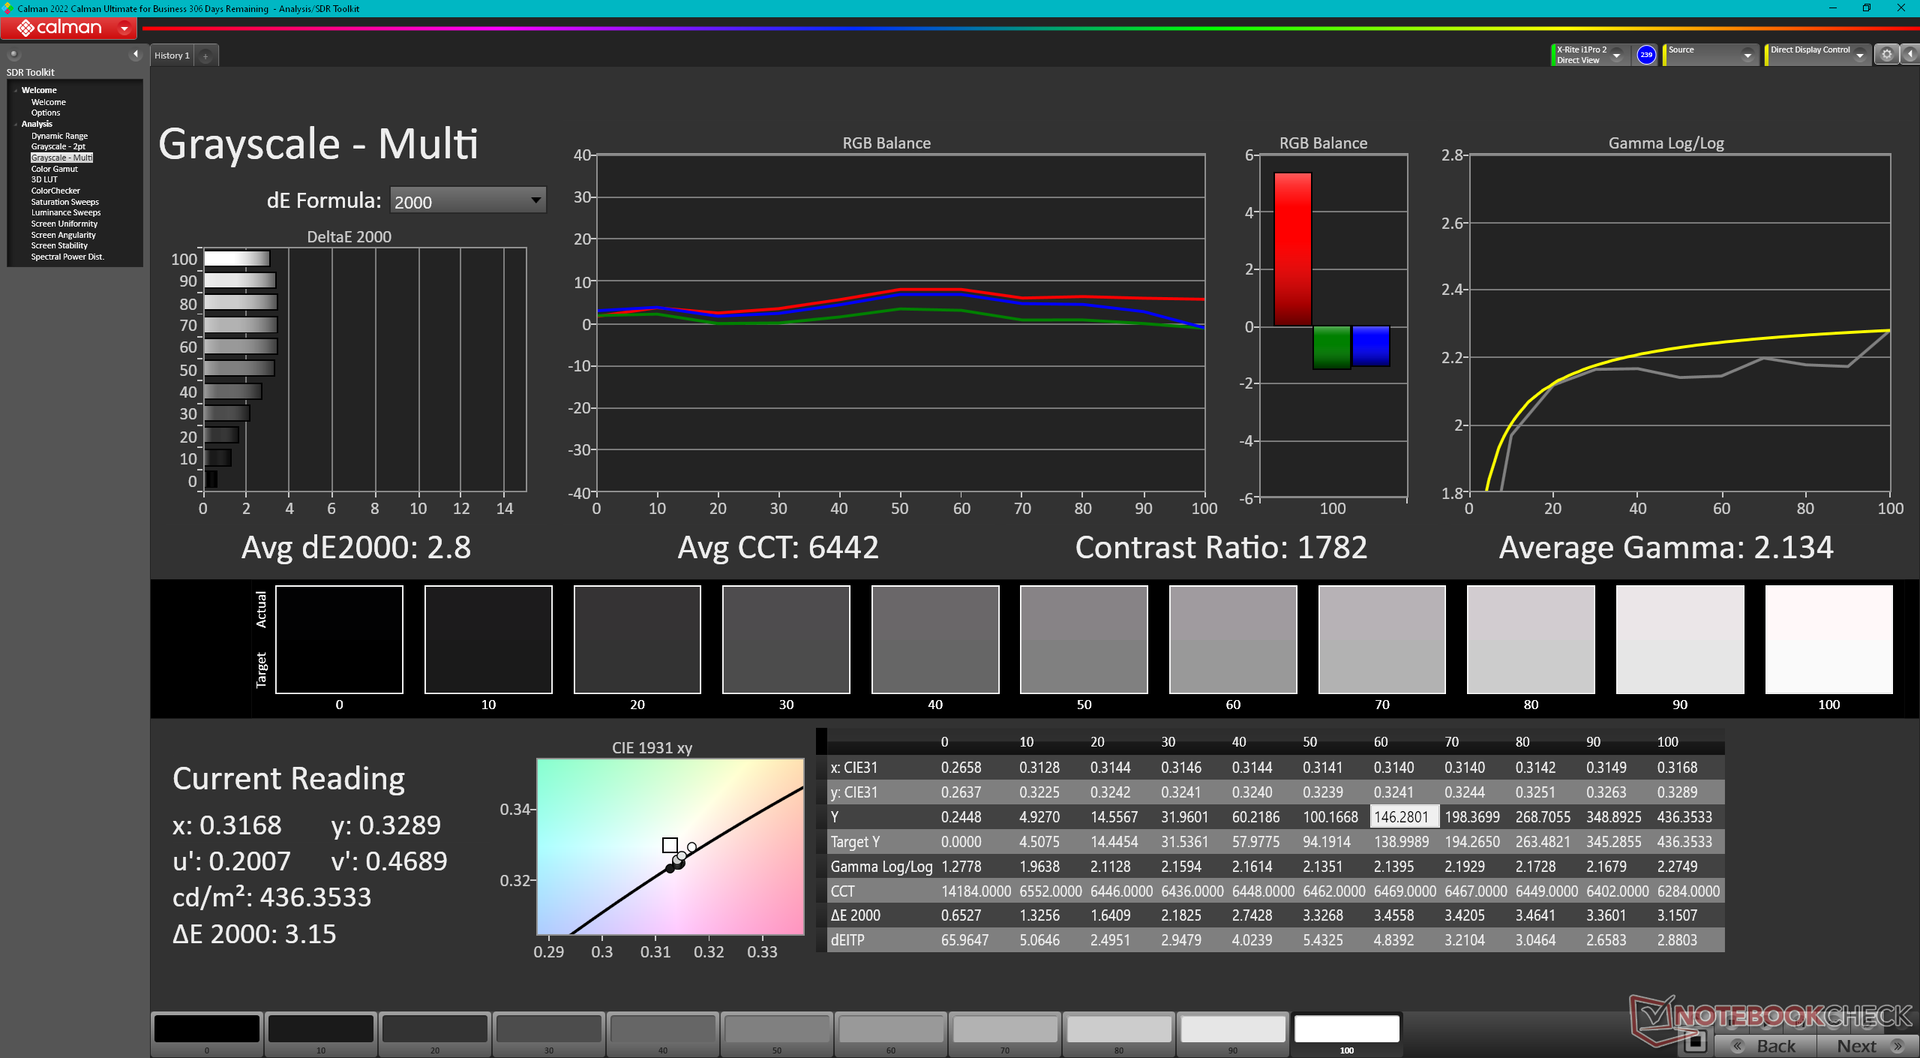
Brightness Distribution: 87 %
Center on Battery: 421.9 cd/m²
Contrast: 1455:1 (Black: 0.29 cd/m²)
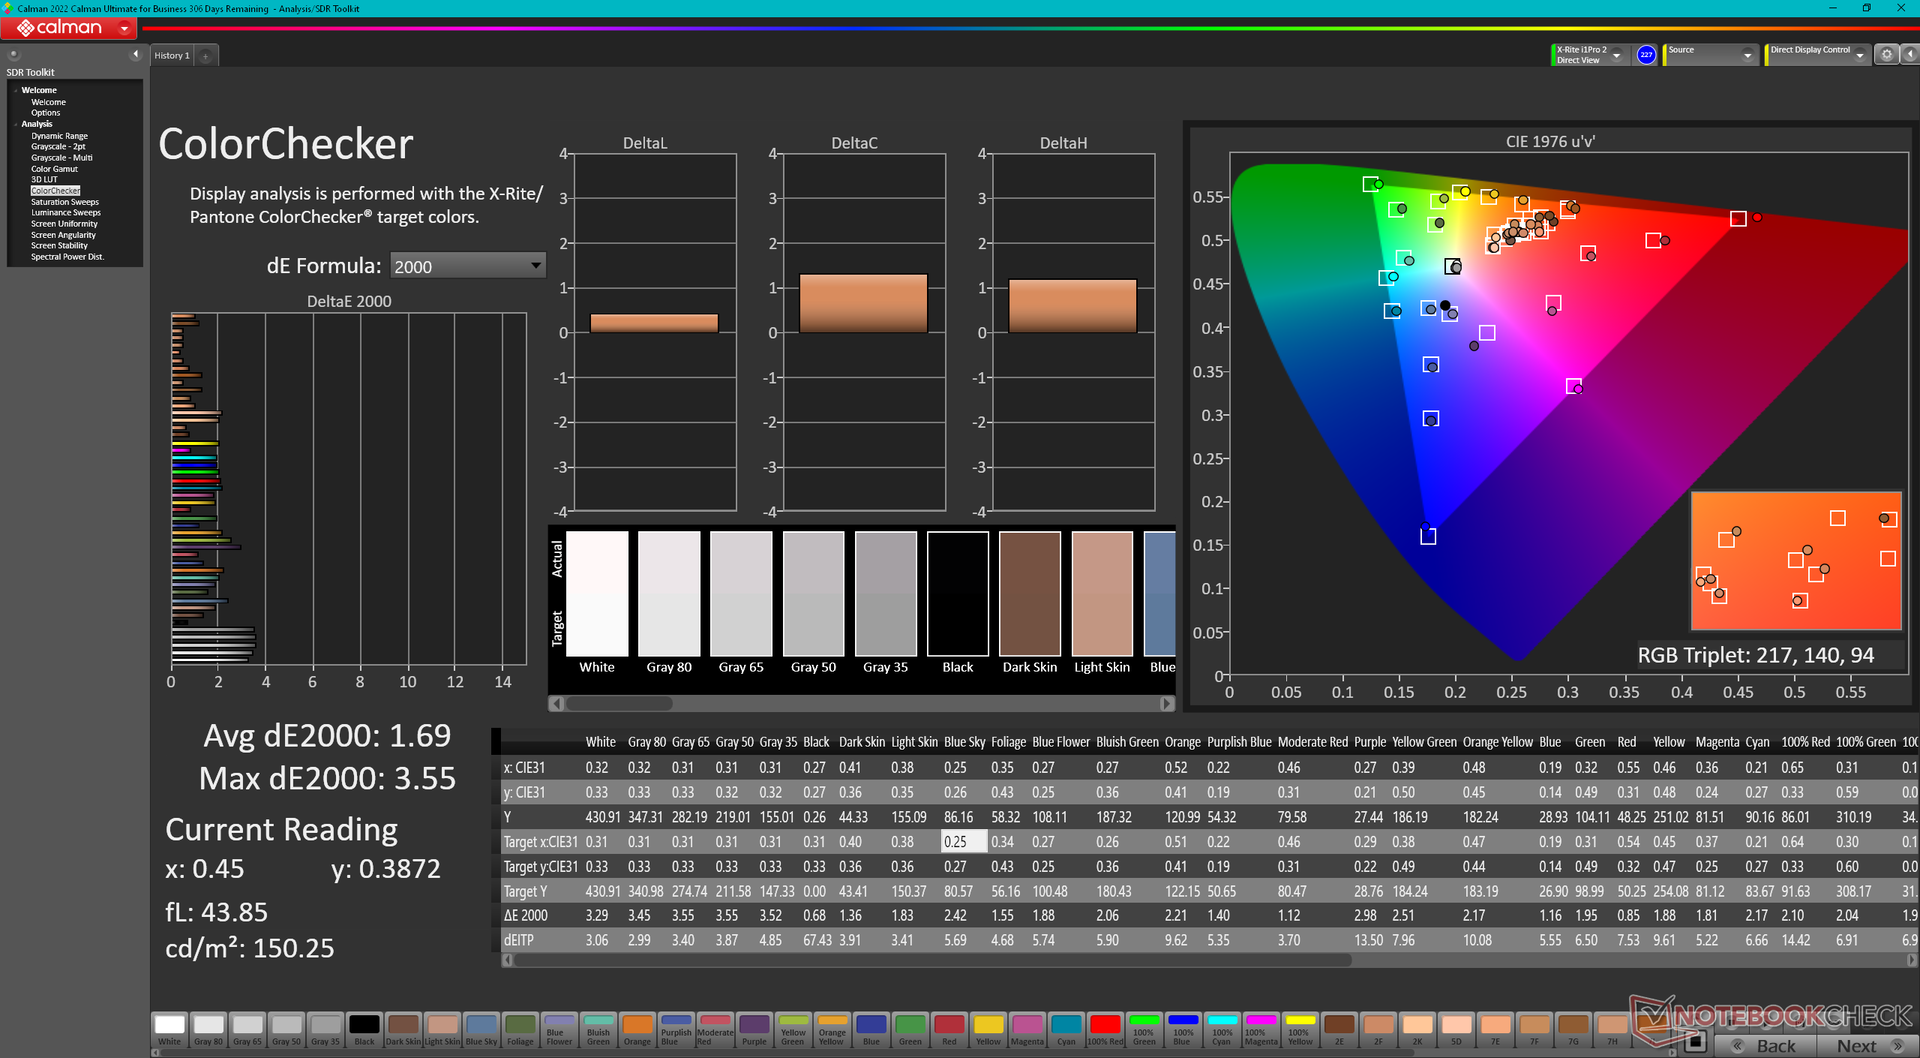
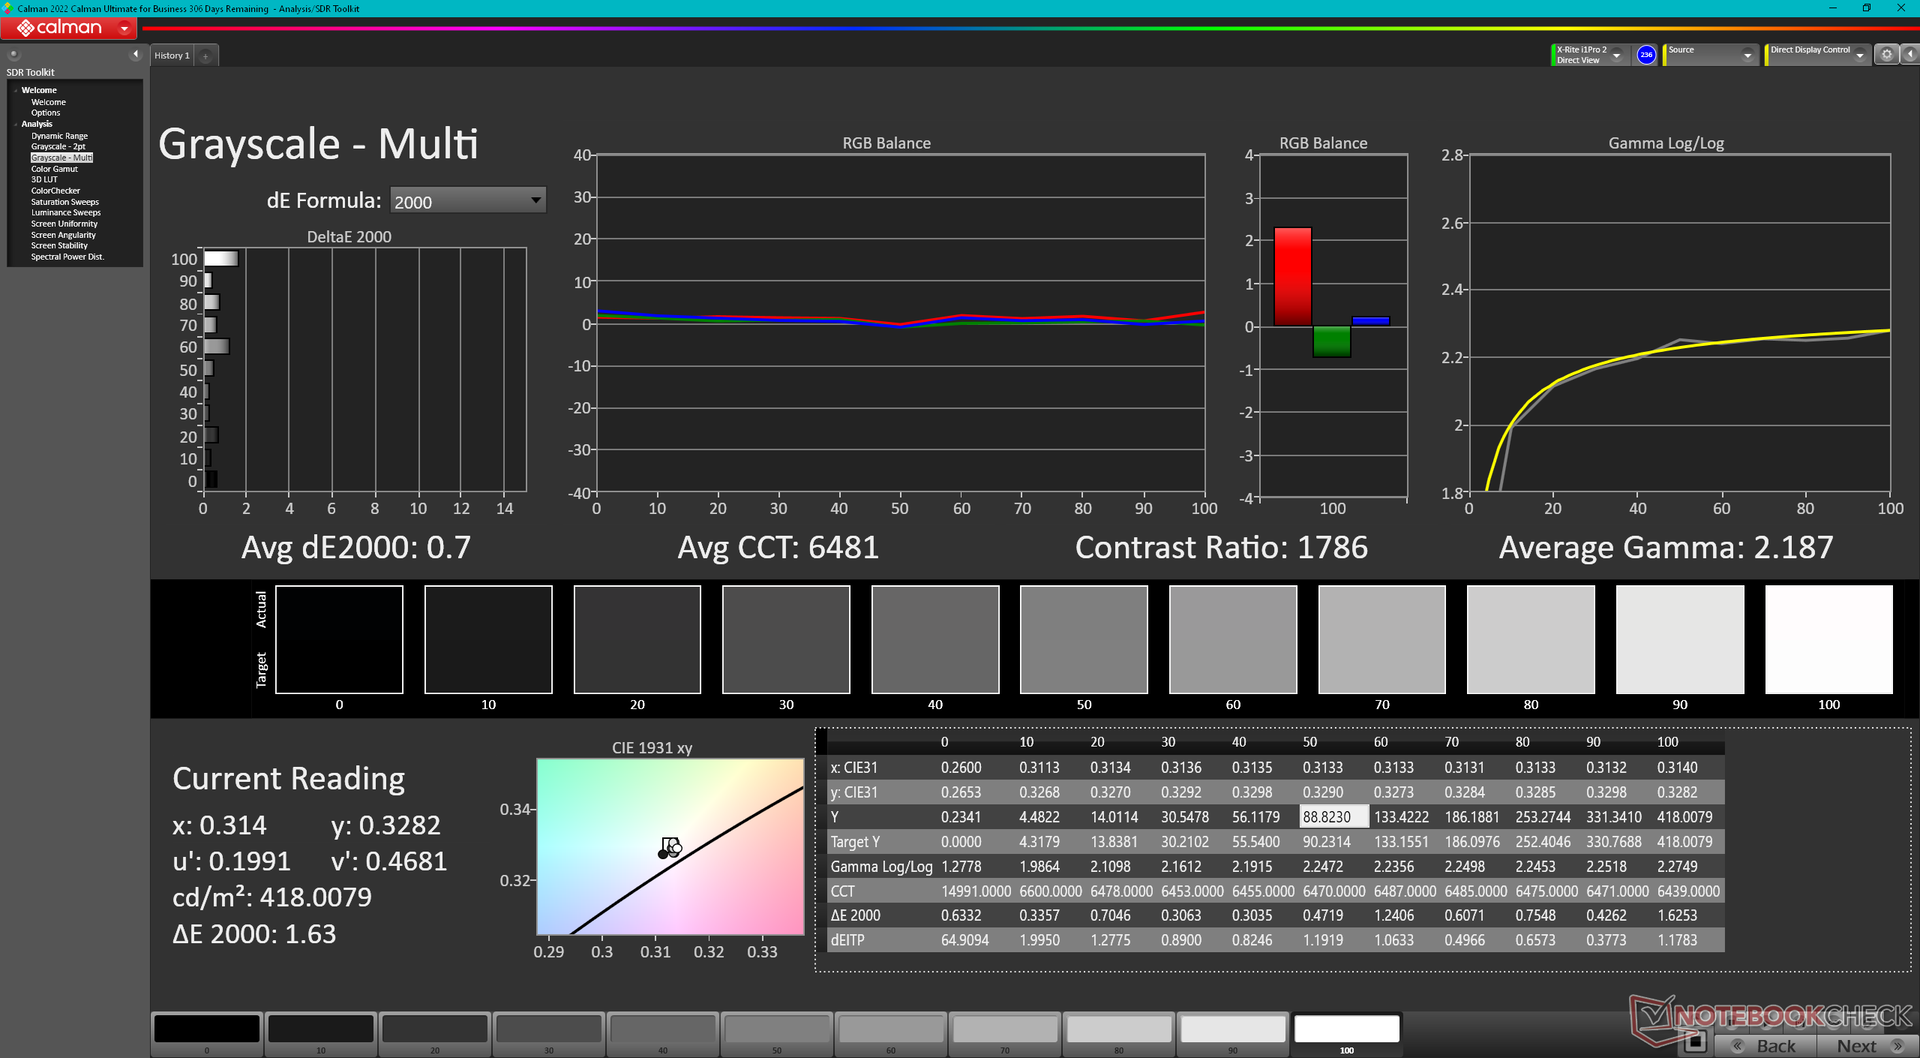
ΔE ColorChecker Calman: 1.69 | ∀{0.5-29.43 Ø4.71}
calibrated: 0.5
ΔE Greyscale Calman: 2.8 | ∀{0.09-98 Ø4.96}
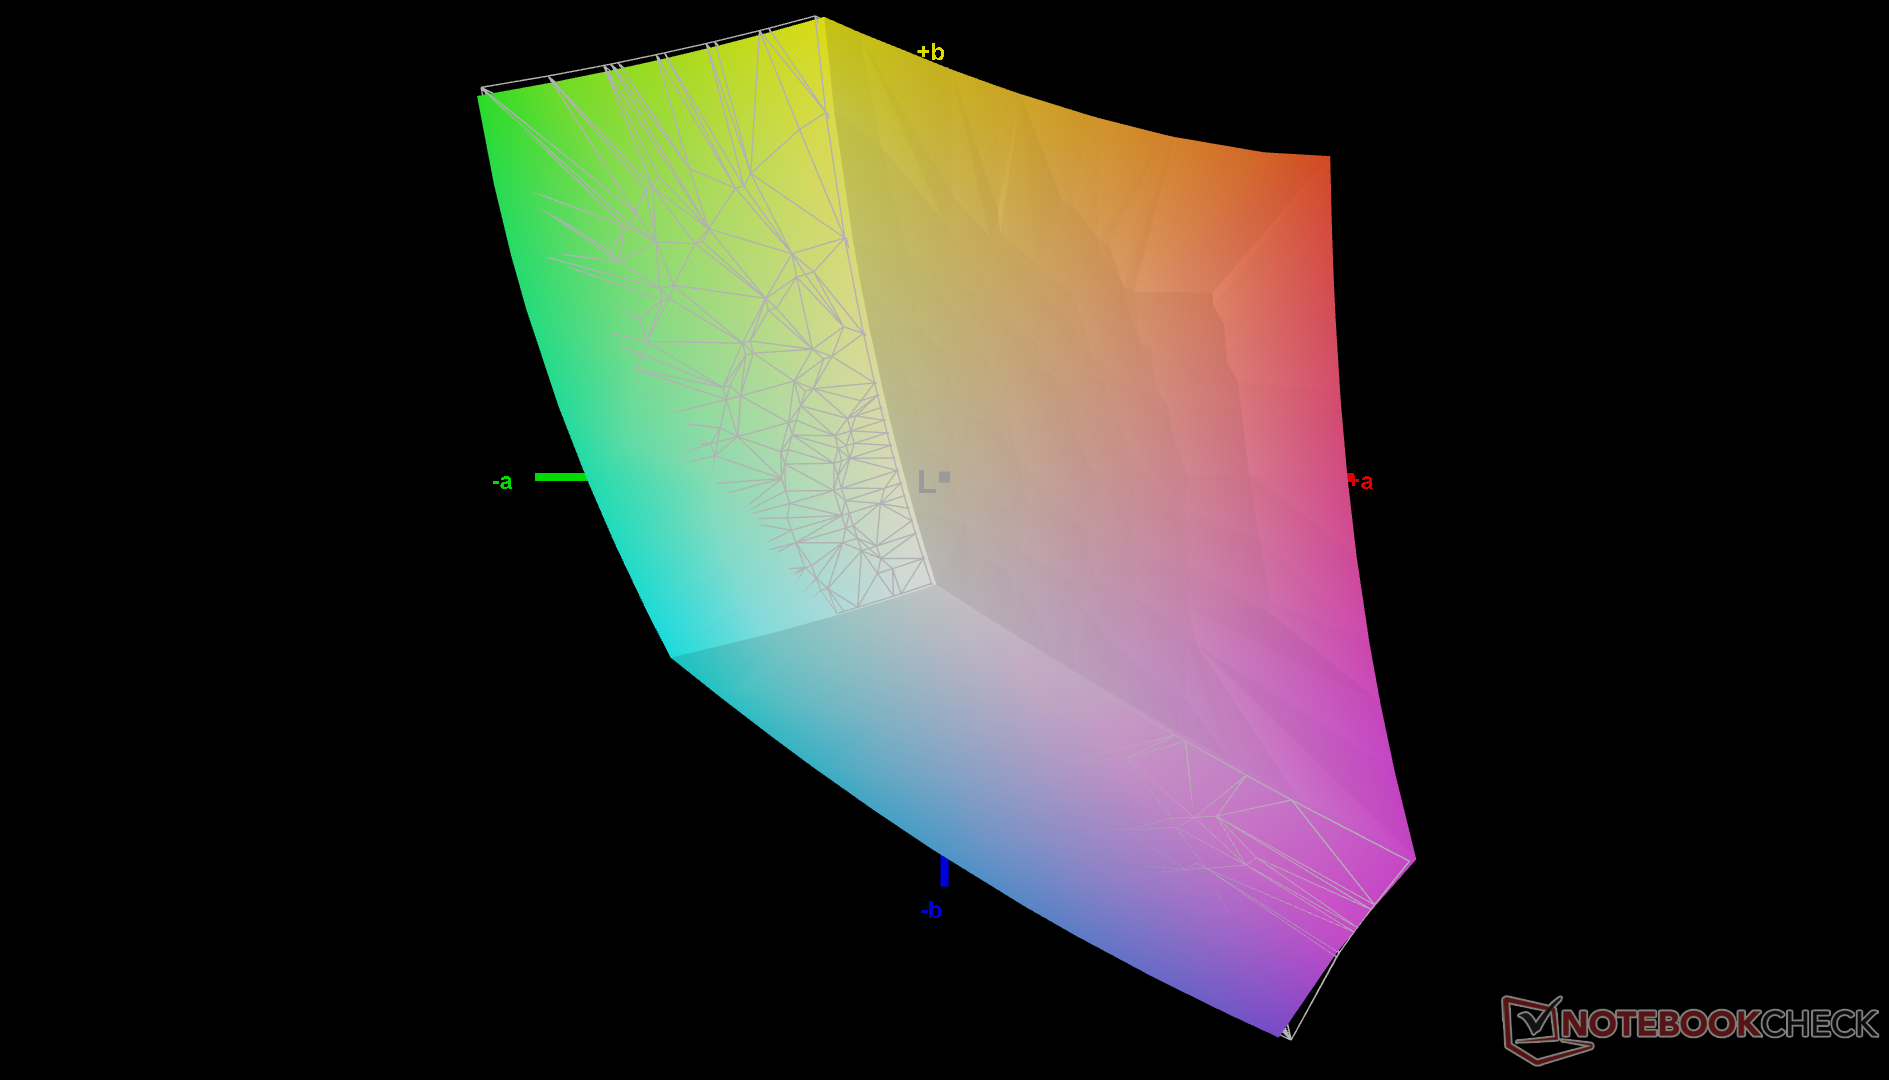
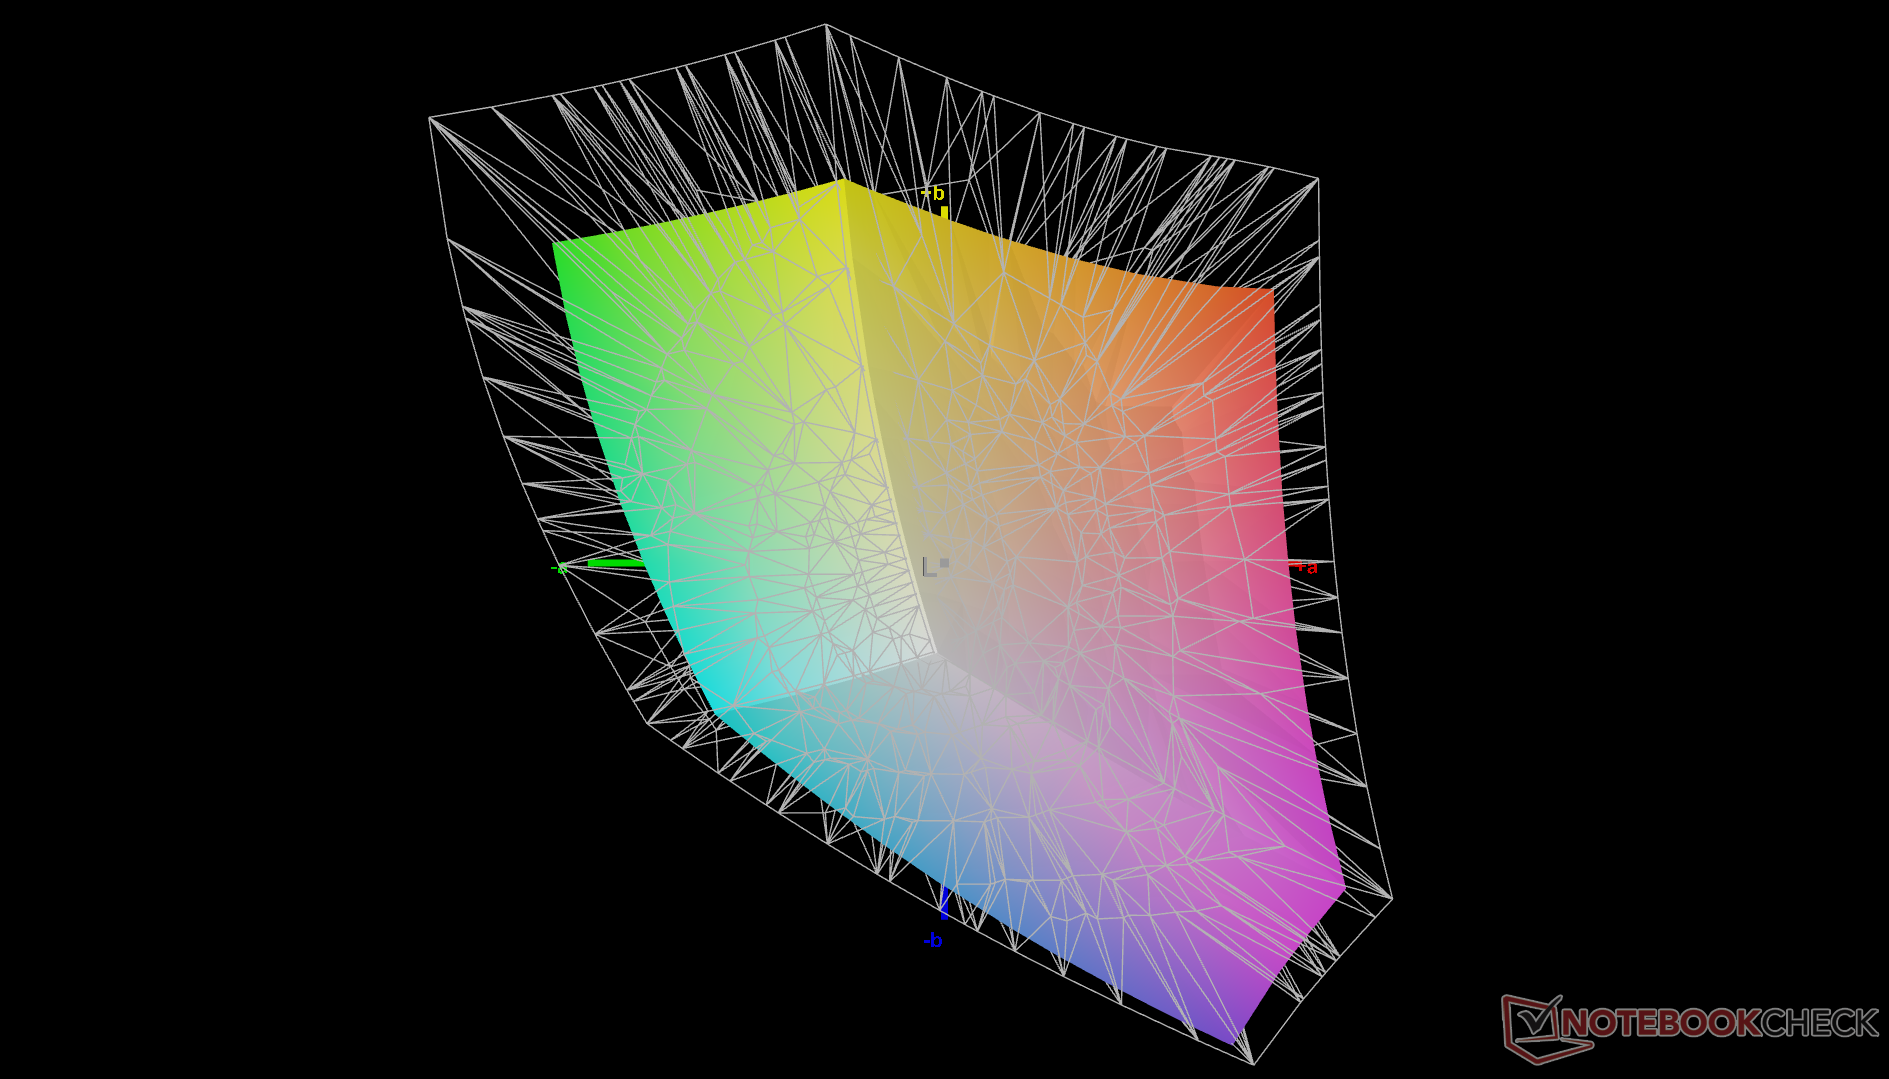
70.2% AdobeRGB 1998 (Argyll 3D)
99.5% sRGB (Argyll 3D)
68.7% Display P3 (Argyll 3D)
Gamma: 2.13
CCT: 6442 K
| Lenovo ThinkPad X1 Carbon G10 Core i7-1265U R140NW4D R0, IPS, 1920x1200, 14" | Lenovo ThinkPad X1 Carbon G10 21CC001RGE B140UAN02.1, IPS LED, 1920x1200, 14" | HP EliteBook 845 G9 6F6H9EA AUOA49A, IPS, 1920x1200, 14" | LG Gram 14Z90Q LG LP140WU1-SPF1, IPS, 1920x1200, 14" | Dell Latitude 7420 JW6MH Chi Mei CMN1416 CHF07 140HCG, IPS, 1920x1080, 14" | Asus ExpertBook B1 B1400CEAE, i5-1135G7 Chi Mei CMN14D4, IPS, 1920x1080, 14" | |
|---|---|---|---|---|---|---|
| Display | 6% | 7% | 22% | -1% | -37% | |
| Display P3 Coverage (%) | 68.7 | 74.6 9% | 75.4 10% | 98.4 43% | 68 -1% | 42.8 -38% |
| sRGB Coverage (%) | 99.5 | 98.6 -1% | 100 1% | 99.9 0% | 99 -1% | 63.9 -36% |
| AdobeRGB 1998 Coverage (%) | 70.2 | 76.5 9% | 76.6 9% | 85.9 22% | 70 0% | 44.3 -37% |
| Response Times | 31% | 16% | 29% | 20% | 41% | |
| Response Time Grey 50% / Grey 80% * (ms) | 55.2 ? | 45.5 ? 18% | 58.8 ? -7% | 47.5 ? 14% | 55 ? -0% | 35.2 ? 36% |
| Response Time Black / White * (ms) | 43.2 ? | 24 ? 44% | 26.7 ? 38% | 24.5 ? 43% | 26 ? 40% | 23.2 ? 46% |
| PWM Frequency (Hz) | 53050 ? | 25000 ? | ||||
| Screen | -49% | -23% | -47% | -2% | -168% | |
| Brightness middle (cd/m²) | 421.9 | 372 -12% | 408 -3% | 341 -19% | 408 -3% | 256 -39% |
| Brightness (cd/m²) | 420 | 362 -14% | 402 -4% | 305 -27% | 378 -10% | 239 -43% |
| Brightness Distribution (%) | 87 | 94 8% | 92 6% | 87 0% | 86 -1% | 83 -5% |
| Black Level * (cd/m²) | 0.29 | 0.18 38% | 0.24 17% | 0.26 10% | 0.22 24% | 0.23 21% |
| Contrast (:1) | 1455 | 2067 42% | 1700 17% | 1312 -10% | 1855 27% | 1113 -24% |
| Colorchecker dE 2000 * | 1.69 | 3.4 -101% | 2.09 -24% | 3.11 -84% | 1.54 9% | 6.2 -267% |
| Colorchecker dE 2000 max. * | 3.55 | 6.7 -89% | 5.09 -43% | 8.29 -134% | 2.72 23% | 18.2 -413% |
| Colorchecker dE 2000 calibrated * | 0.5 | 1.8 -260% | 1.56 -212% | 0.83 -66% | 1.08 -116% | 3.8 -660% |
| Greyscale dE 2000 * | 2.8 | 4.3 -54% | 1.7 39% | 5.3 -89% | 1.95 30% | 5 -79% |
| Gamma | 2.13 103% | 2.13 103% | 2.138 103% | 2.037 108% | 2.33 94% | 1.97 112% |
| CCT | 6442 101% | 6158 106% | 6628 98% | 7571 86% | 6806 96% | 7364 88% |
| Total Average (Program / Settings) | -4% /
-26% | 0% /
-11% | 1% /
-21% | 6% /
2% | -55% /
-110% |
* ... smaller is better
The panel is already well-calibrated out of the box with average grayscale and color deltaE values of only 2.8 and 1.69, respectively. Our own X-Rite colorimeter calibration would improve these averages even further to <1 each, but this won't be necessary for most users. Our calibrated ICM profile is available above for free for owners who want to try.

Display Response Times
| ↔ Response Time Black to White | ||
|---|---|---|
| 43.2 ms ... rise ↗ and fall ↘ combined | ↗ 22 ms rise | 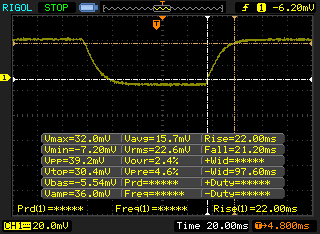 |
| ↘ 21.2 ms fall | ||
| The screen shows slow response rates in our tests and will be unsatisfactory for gamers. In comparison, all tested devices range from 0.1 (minimum) to 240 (maximum) ms. » 98 % of all devices are better. This means that the measured response time is worse than the average of all tested devices (19.8 ms). | ||
| ↔ Response Time 50% Grey to 80% Grey | ||
| 55.2 ms ... rise ↗ and fall ↘ combined | ↗ 28.4 ms rise | 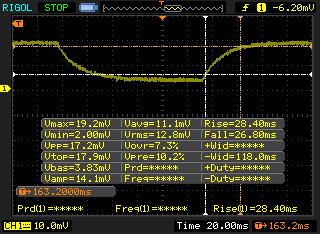 |
| ↘ 26.8 ms fall | ||
| The screen shows slow response rates in our tests and will be unsatisfactory for gamers. In comparison, all tested devices range from 0.165 (minimum) to 636 (maximum) ms. » 92 % of all devices are better. This means that the measured response time is worse than the average of all tested devices (31 ms). | ||
Screen Flickering / PWM (Pulse-Width Modulation)
| Screen flickering / PWM not detected | 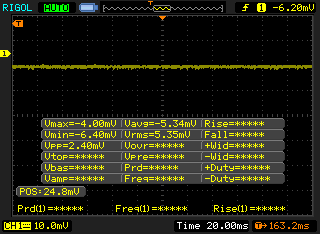 | ||
In comparison: 52 % of all tested devices do not use PWM to dim the display. If PWM was detected, an average of 7754 (minimum: 5 - maximum: 343500) Hz was measured. | |||

Performance — Intel 12th Gen
Testing Conditions
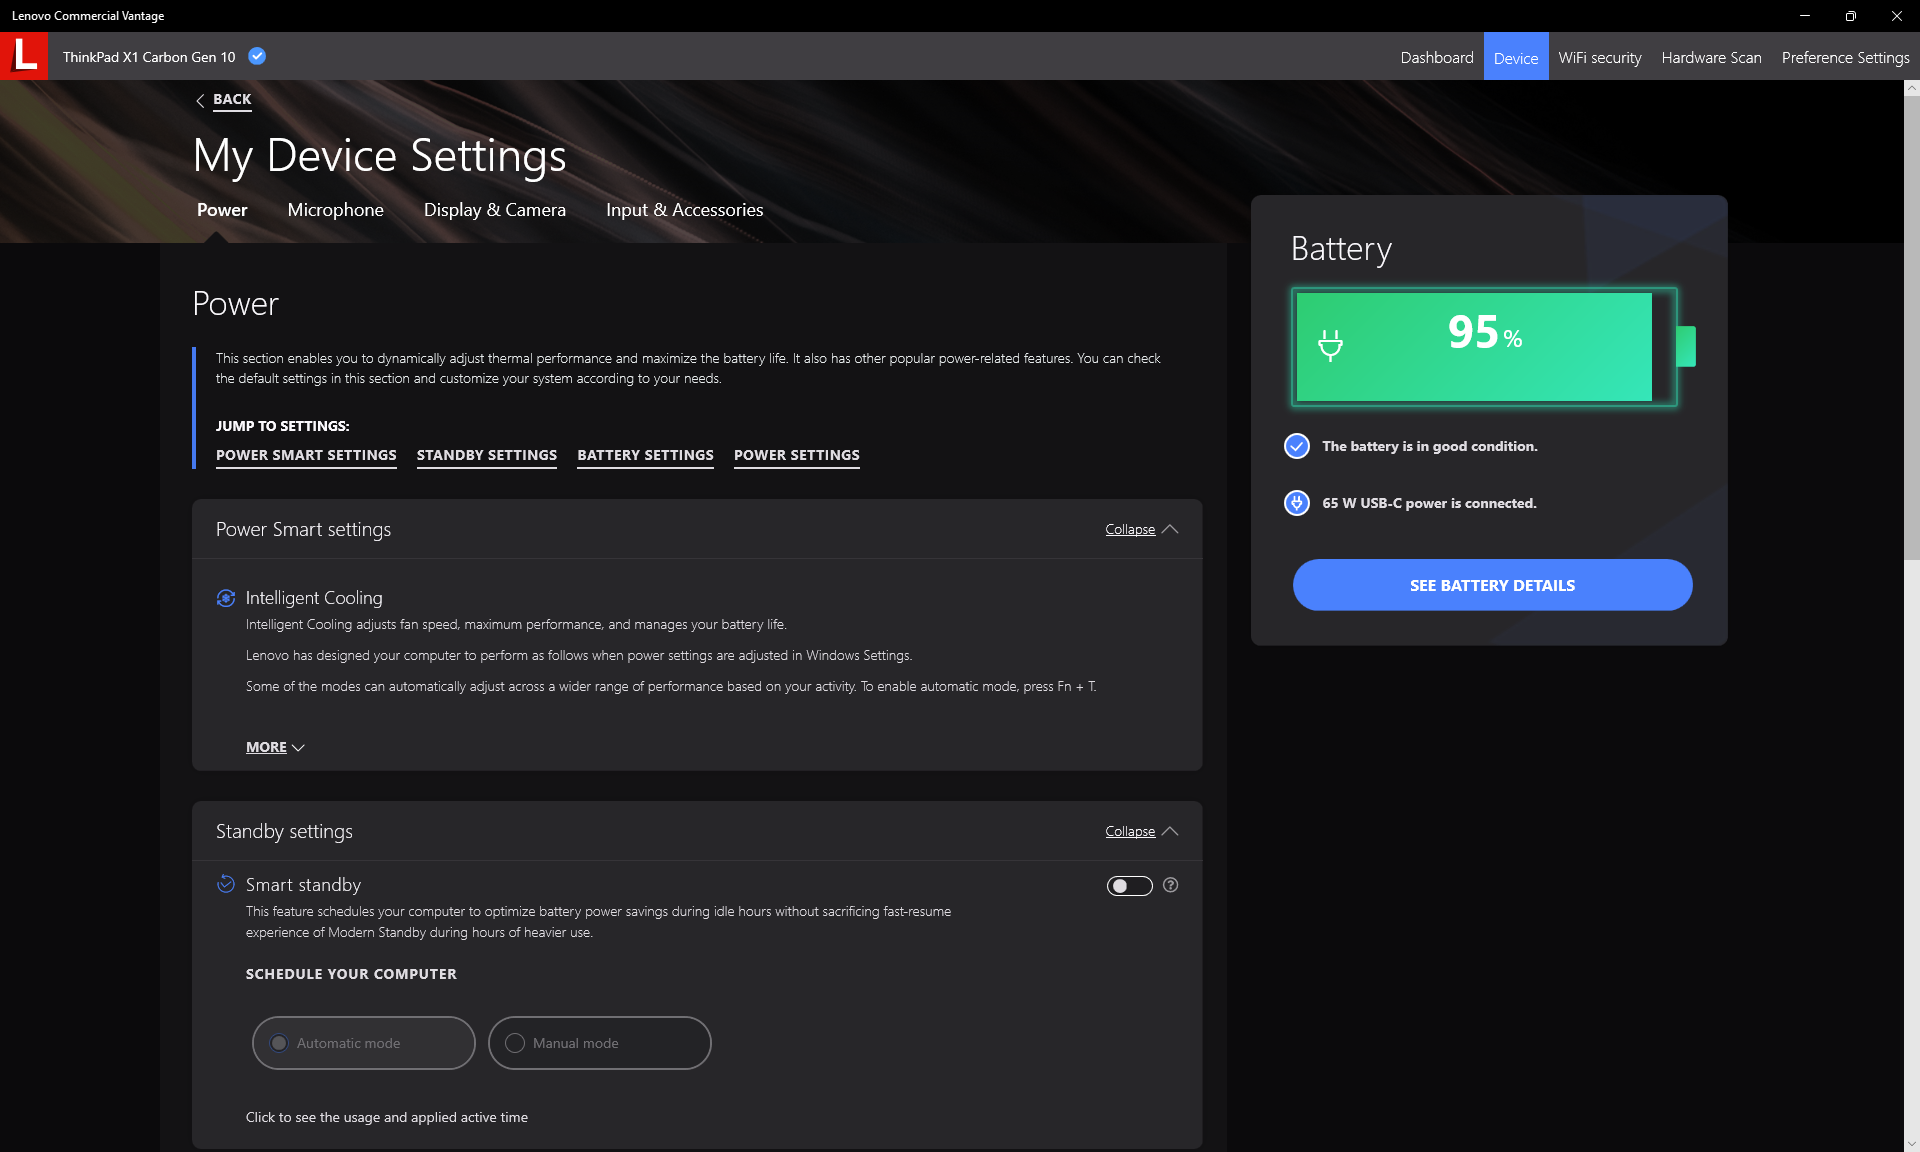
We set our unit to 'Best performance' mode via Windows prior to running any benchmarks below. The pre-installed Vantage software includes no power profile options with Intelligent Cooling enabled by default as shown by the screenshot below.
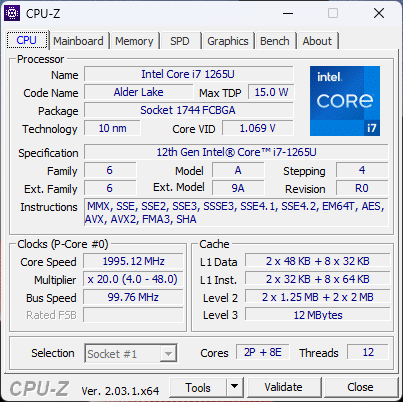
Processor
When running CineBench R15 xT in a loop, our Core i7-1265U would be slightly slower than the Core i5-1250P during the start of the test. As the looping benchmark progresses, however, the i7-1265U would overtake the i5-1250P as shown by our comparison graph below. These results suggest that the Core i5-1250P can have higher initial Turbo Boost performance than our i7-1265U, but that the gains are short-lived.
This isn't to say that the Core-P SKUs should be avoided. Upgrading to the highest-end Core i7-1280P configuration, for example, may boost multi-thread performance by 50 to 60 percent over our Core i7-1265U based on our experience with the Yoga Slim 9 14.
Cinebench R15 Multi Loop
Cinebench R23: Multi Core | Single Core
Cinebench R15: CPU Multi 64Bit | CPU Single 64Bit
Blender: v2.79 BMW27 CPU
7-Zip 18.03: 7z b 4 | 7z b 4 -mmt1
Geekbench 5.5: Multi-Core | Single-Core
HWBOT x265 Benchmark v2.2: 4k Preset
LibreOffice : 20 Documents To PDF
R Benchmark 2.5: Overall mean
Cinebench R23: Multi Core | Single Core
Cinebench R15: CPU Multi 64Bit | CPU Single 64Bit
Blender: v2.79 BMW27 CPU
7-Zip 18.03: 7z b 4 | 7z b 4 -mmt1
Geekbench 5.5: Multi-Core | Single-Core
HWBOT x265 Benchmark v2.2: 4k Preset
LibreOffice : 20 Documents To PDF
R Benchmark 2.5: Overall mean
* ... smaller is better
* ... smaller is better
AIDA64: FP32 Ray-Trace | FPU Julia | CPU SHA3 | CPU Queen | FPU SinJulia | FPU Mandel | CPU AES | CPU ZLib | FP64 Ray-Trace | CPU PhotoWorxx
| AIDA64 / FP32 Ray-Trace | |
| HP EliteBook 845 G9 6F6H9EA | |
| Asus ExpertBook B1 B1400CEAE, i5-1135G7 | |
| Lenovo ThinkPad X1 Carbon G10 Core i7-1265U | |
| Dell Latitude 7420 JW6MH | |
| Average Intel Core i7-1265U (2619 - 8178, n=10) | |
| LG Gram 14Z90Q | |
| Lenovo ThinkPad X1 Carbon G10 21CC001RGE | |
| AIDA64 / FPU SinJulia | |
| HP EliteBook 845 G9 6F6H9EA | |
| Lenovo ThinkPad X1 Carbon G10 21CC001RGE | |
| Dell Latitude 7420 JW6MH | |
| Lenovo ThinkPad X1 Carbon G10 Core i7-1265U | |
| Asus ExpertBook B1 B1400CEAE, i5-1135G7 | |
| Average Intel Core i7-1265U (3105 - 5135, n=10) | |
| LG Gram 14Z90Q | |
| AIDA64 / FP64 Ray-Trace | |
| HP EliteBook 845 G9 6F6H9EA | |
| Lenovo ThinkPad X1 Carbon G10 Core i7-1265U | |
| Asus ExpertBook B1 B1400CEAE, i5-1135G7 | |
| Dell Latitude 7420 JW6MH | |
| Average Intel Core i7-1265U (1473 - 4376, n=10) | |
| LG Gram 14Z90Q | |
| Lenovo ThinkPad X1 Carbon G10 21CC001RGE | |
| AIDA64 / CPU PhotoWorxx | |
| Lenovo ThinkPad X1 Carbon G10 Core i7-1265U | |
| Dell Latitude 7420 JW6MH | |
| Average Intel Core i7-1265U (20213 - 47031, n=10) | |
| Lenovo ThinkPad X1 Carbon G10 21CC001RGE | |
| LG Gram 14Z90Q | |
| HP EliteBook 845 G9 6F6H9EA | |
| Asus ExpertBook B1 B1400CEAE, i5-1135G7 | |
System Performance
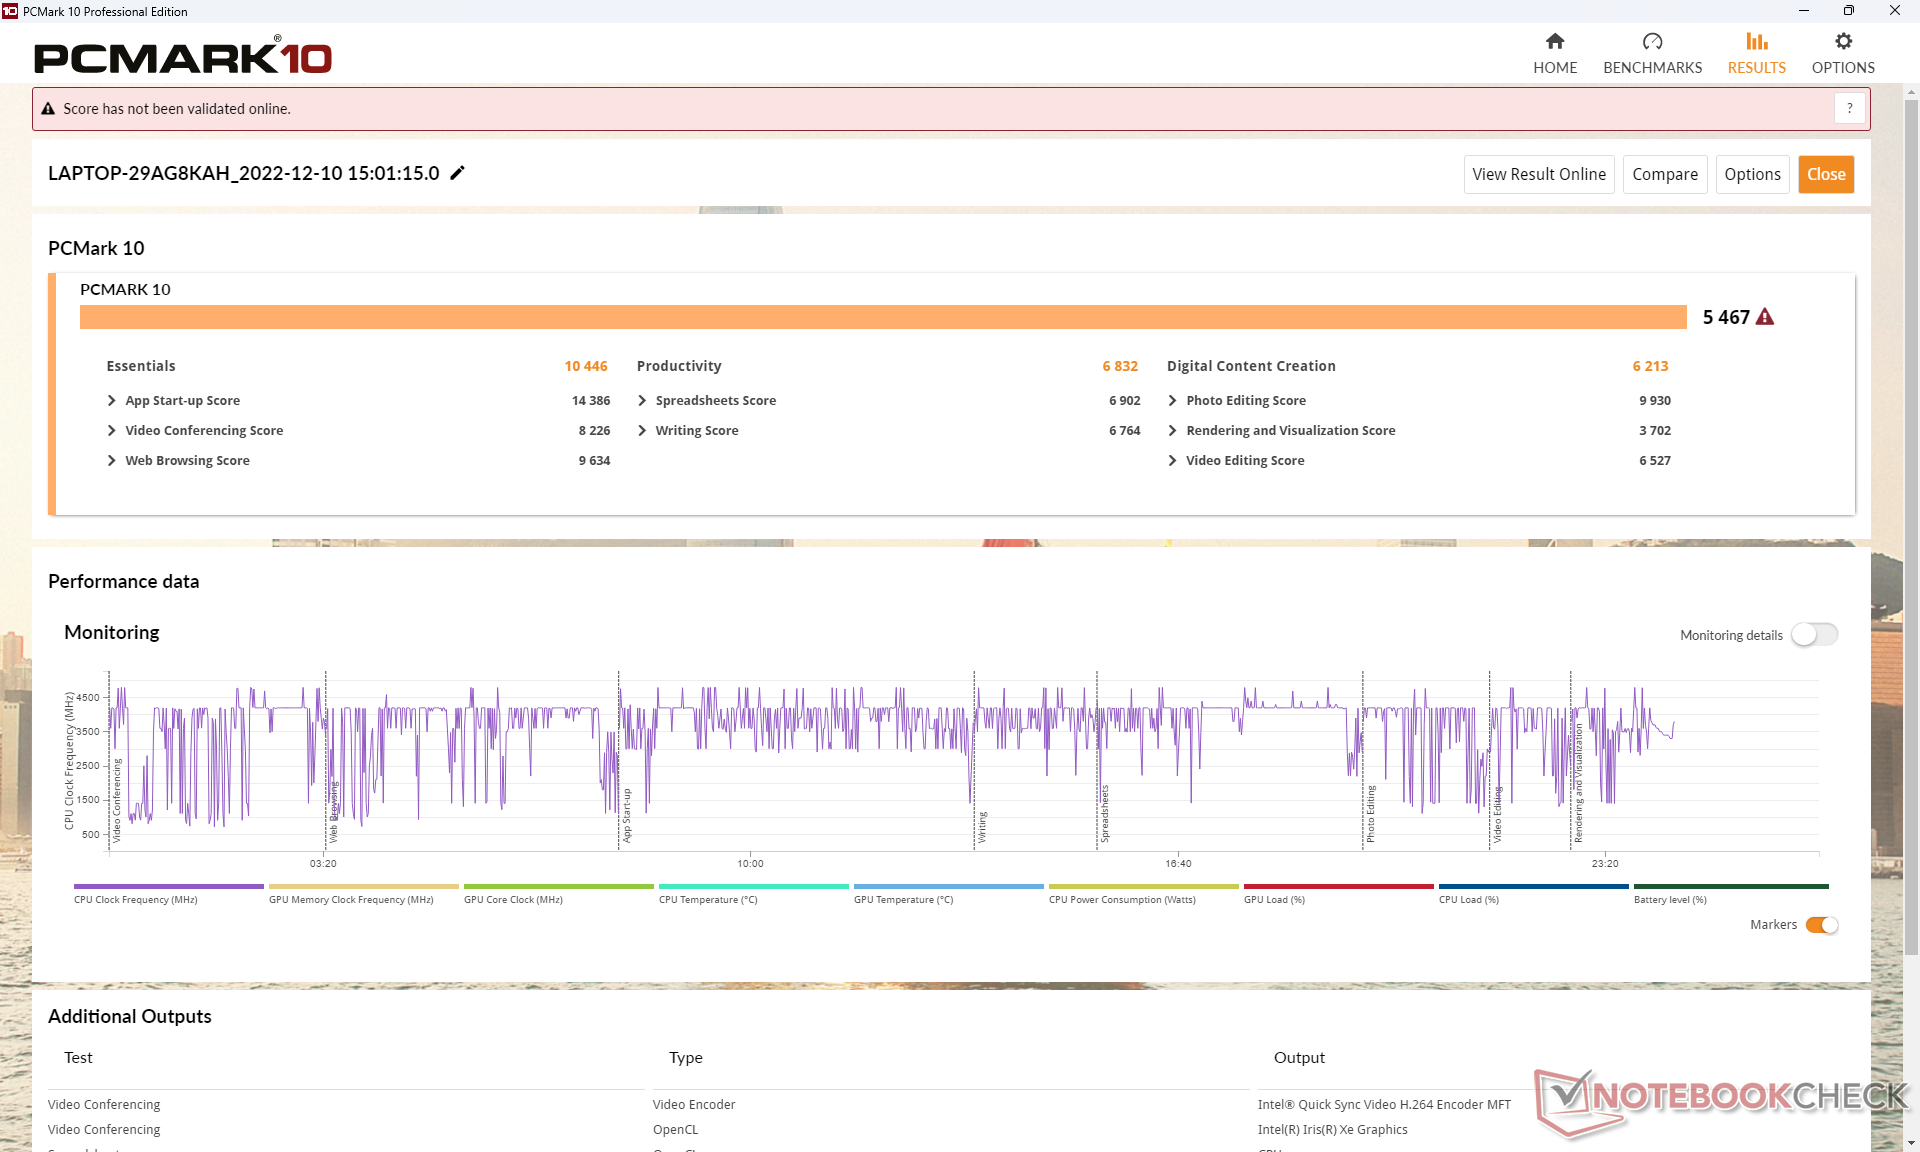
PCMark 10 results are consistently higher than our Core-i5-P powered ThinkPad X1 Carbon G10 especially in the Digital Contention Creation subtest where graphics performance matters most.
CrossMark: Overall | Productivity | Creativity | Responsiveness
| PCMark 10 / Score | |
| HP EliteBook 845 G9 6F6H9EA | |
| Lenovo ThinkPad X1 Carbon G10 Core i7-1265U | |
| Average Intel Core i7-1265U, Intel Iris Xe Graphics G7 96EUs (4753 - 5766, n=7) | |
| Lenovo ThinkPad X1 Carbon G10 21CC001RGE | |
| LG Gram 14Z90Q | |
| Dell Latitude 7420 JW6MH | |
| Asus ExpertBook B1 B1400CEAE, i5-1135G7 | |
| PCMark 10 / Essentials | |
| Average Intel Core i7-1265U, Intel Iris Xe Graphics G7 96EUs (9278 - 11418, n=7) | |
| Lenovo ThinkPad X1 Carbon G10 Core i7-1265U | |
| Lenovo ThinkPad X1 Carbon G10 21CC001RGE | |
| Dell Latitude 7420 JW6MH | |
| HP EliteBook 845 G9 6F6H9EA | |
| LG Gram 14Z90Q | |
| Asus ExpertBook B1 B1400CEAE, i5-1135G7 | |
| PCMark 10 / Productivity | |
| HP EliteBook 845 G9 6F6H9EA | |
| Lenovo ThinkPad X1 Carbon G10 Core i7-1265U | |
| Average Intel Core i7-1265U, Intel Iris Xe Graphics G7 96EUs (5828 - 7311, n=7) | |
| Lenovo ThinkPad X1 Carbon G10 21CC001RGE | |
| Dell Latitude 7420 JW6MH | |
| LG Gram 14Z90Q | |
| Asus ExpertBook B1 B1400CEAE, i5-1135G7 | |
| PCMark 10 / Digital Content Creation | |
| Lenovo ThinkPad X1 Carbon G10 Core i7-1265U | |
| HP EliteBook 845 G9 6F6H9EA | |
| Average Intel Core i7-1265U, Intel Iris Xe Graphics G7 96EUs (5127 - 6330, n=7) | |
| LG Gram 14Z90Q | |
| Lenovo ThinkPad X1 Carbon G10 21CC001RGE | |
| Dell Latitude 7420 JW6MH | |
| Asus ExpertBook B1 B1400CEAE, i5-1135G7 | |
| CrossMark / Overall | |
| Lenovo ThinkPad X1 Carbon G10 Core i7-1265U | |
| Lenovo ThinkPad X1 Carbon G10 21CC001RGE | |
| Average Intel Core i7-1265U, Intel Iris Xe Graphics G7 96EUs (1301 - 1615, n=7) | |
| Dell Latitude 7420 JW6MH | |
| CrossMark / Productivity | |
| Lenovo ThinkPad X1 Carbon G10 Core i7-1265U | |
| Lenovo ThinkPad X1 Carbon G10 21CC001RGE | |
| Average Intel Core i7-1265U, Intel Iris Xe Graphics G7 96EUs (1230 - 1586, n=7) | |
| Dell Latitude 7420 JW6MH | |
| CrossMark / Creativity | |
| Lenovo ThinkPad X1 Carbon G10 21CC001RGE | |
| Lenovo ThinkPad X1 Carbon G10 Core i7-1265U | |
| Average Intel Core i7-1265U, Intel Iris Xe Graphics G7 96EUs (1413 - 1706, n=7) | |
| Dell Latitude 7420 JW6MH | |
| CrossMark / Responsiveness | |
| Lenovo ThinkPad X1 Carbon G10 Core i7-1265U | |
| Lenovo ThinkPad X1 Carbon G10 21CC001RGE | |
| Average Intel Core i7-1265U, Intel Iris Xe Graphics G7 96EUs (1193 - 1521, n=7) | |
| Dell Latitude 7420 JW6MH | |
| PCMark 10 Score | 5467 points | |
Help | ||
| AIDA64 / Memory Write | |
| Lenovo ThinkPad X1 Carbon G10 Core i7-1265U | |
| LG Gram 14Z90Q | |
| Lenovo ThinkPad X1 Carbon G10 21CC001RGE | |
| Average Intel Core i7-1265U (41382 - 76027, n=10) | |
| Dell Latitude 7420 JW6MH | |
| HP EliteBook 845 G9 6F6H9EA | |
| Asus ExpertBook B1 B1400CEAE, i5-1135G7 | |
* ... smaller is better
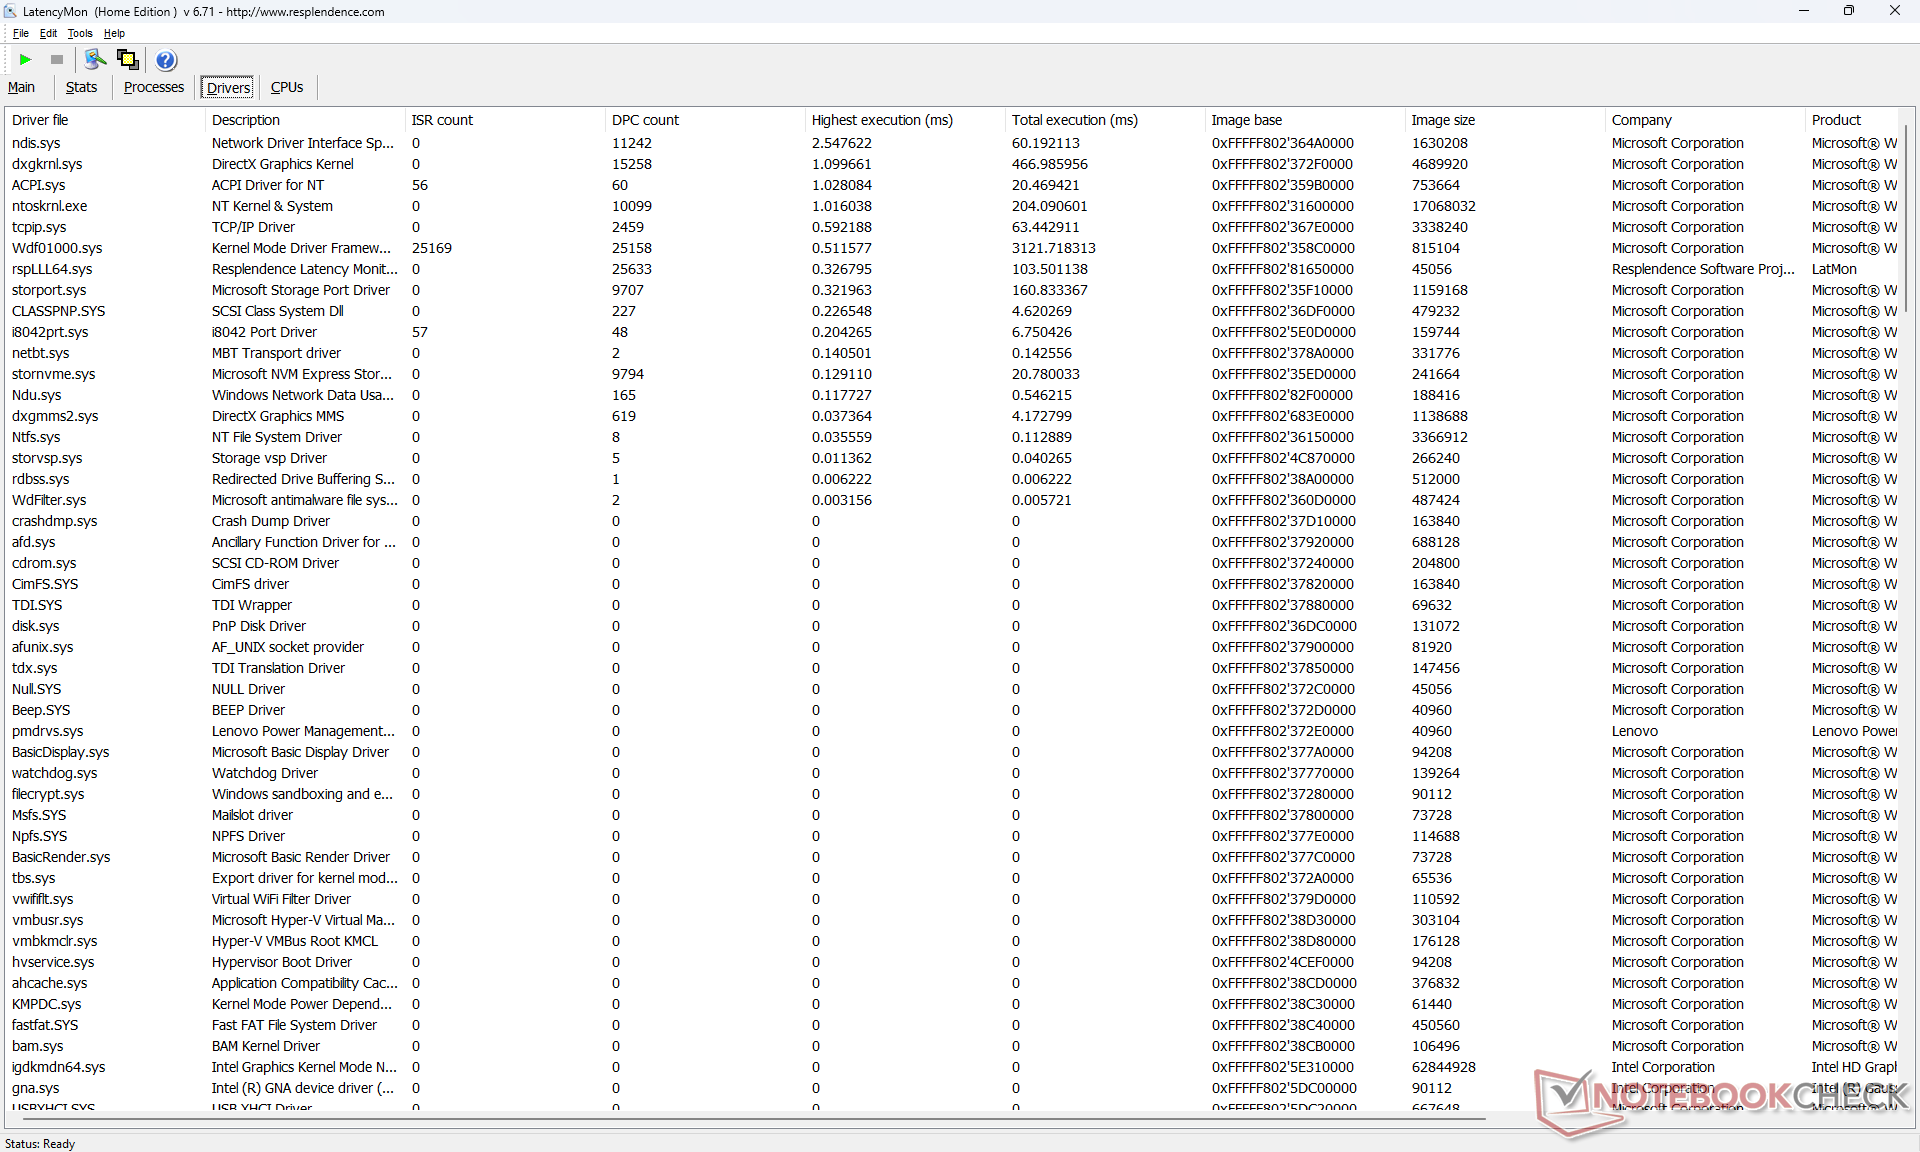
DPC Latency
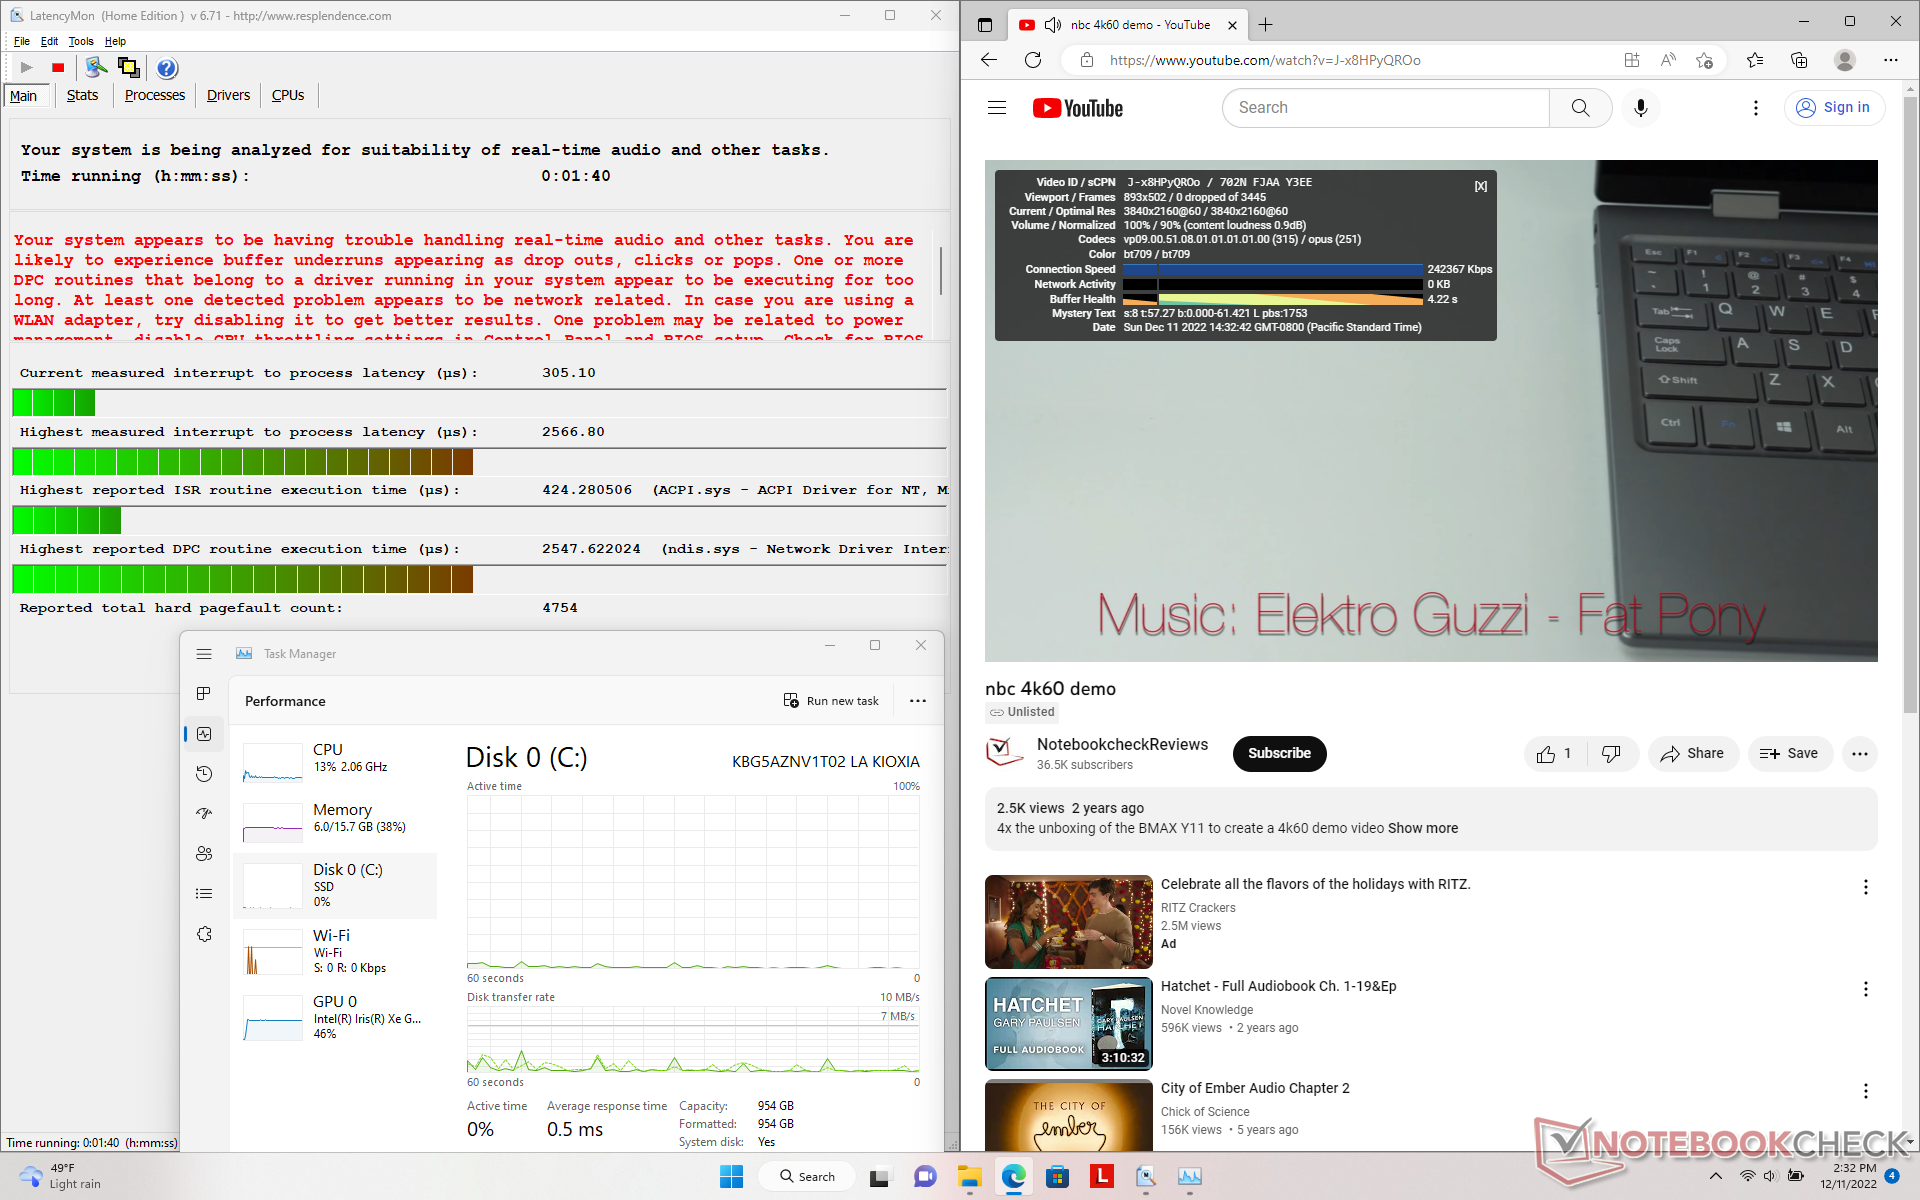
LatencyMon reveals DPC issues when opening multiple browser tabs of our homepage. 4K video playback at 60 FPS is otherwise perfect with low CPU utilization and no dropped frames.
| DPC Latencies / LatencyMon - interrupt to process latency (max), Web, Youtube, Prime95 | |
| Lenovo ThinkPad X1 Carbon G10 Core i7-1265U | |
| Lenovo ThinkPad X1 Carbon G10 21CC001RGE | |
| HP EliteBook 845 G9 6F6H9EA | |
| Asus ExpertBook B1 B1400CEAE, i5-1135G7 | |
| LG Gram 14Z90Q | |
| Dell Latitude 7420 JW6MH | |
* ... smaller is better
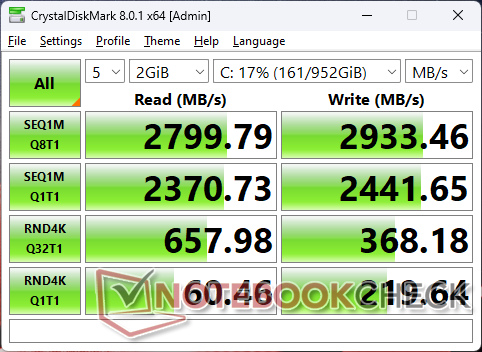
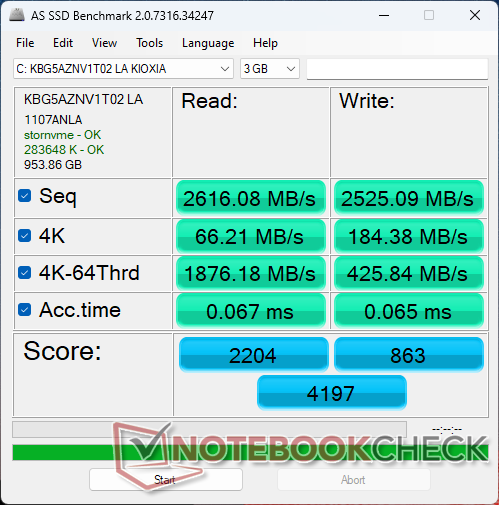
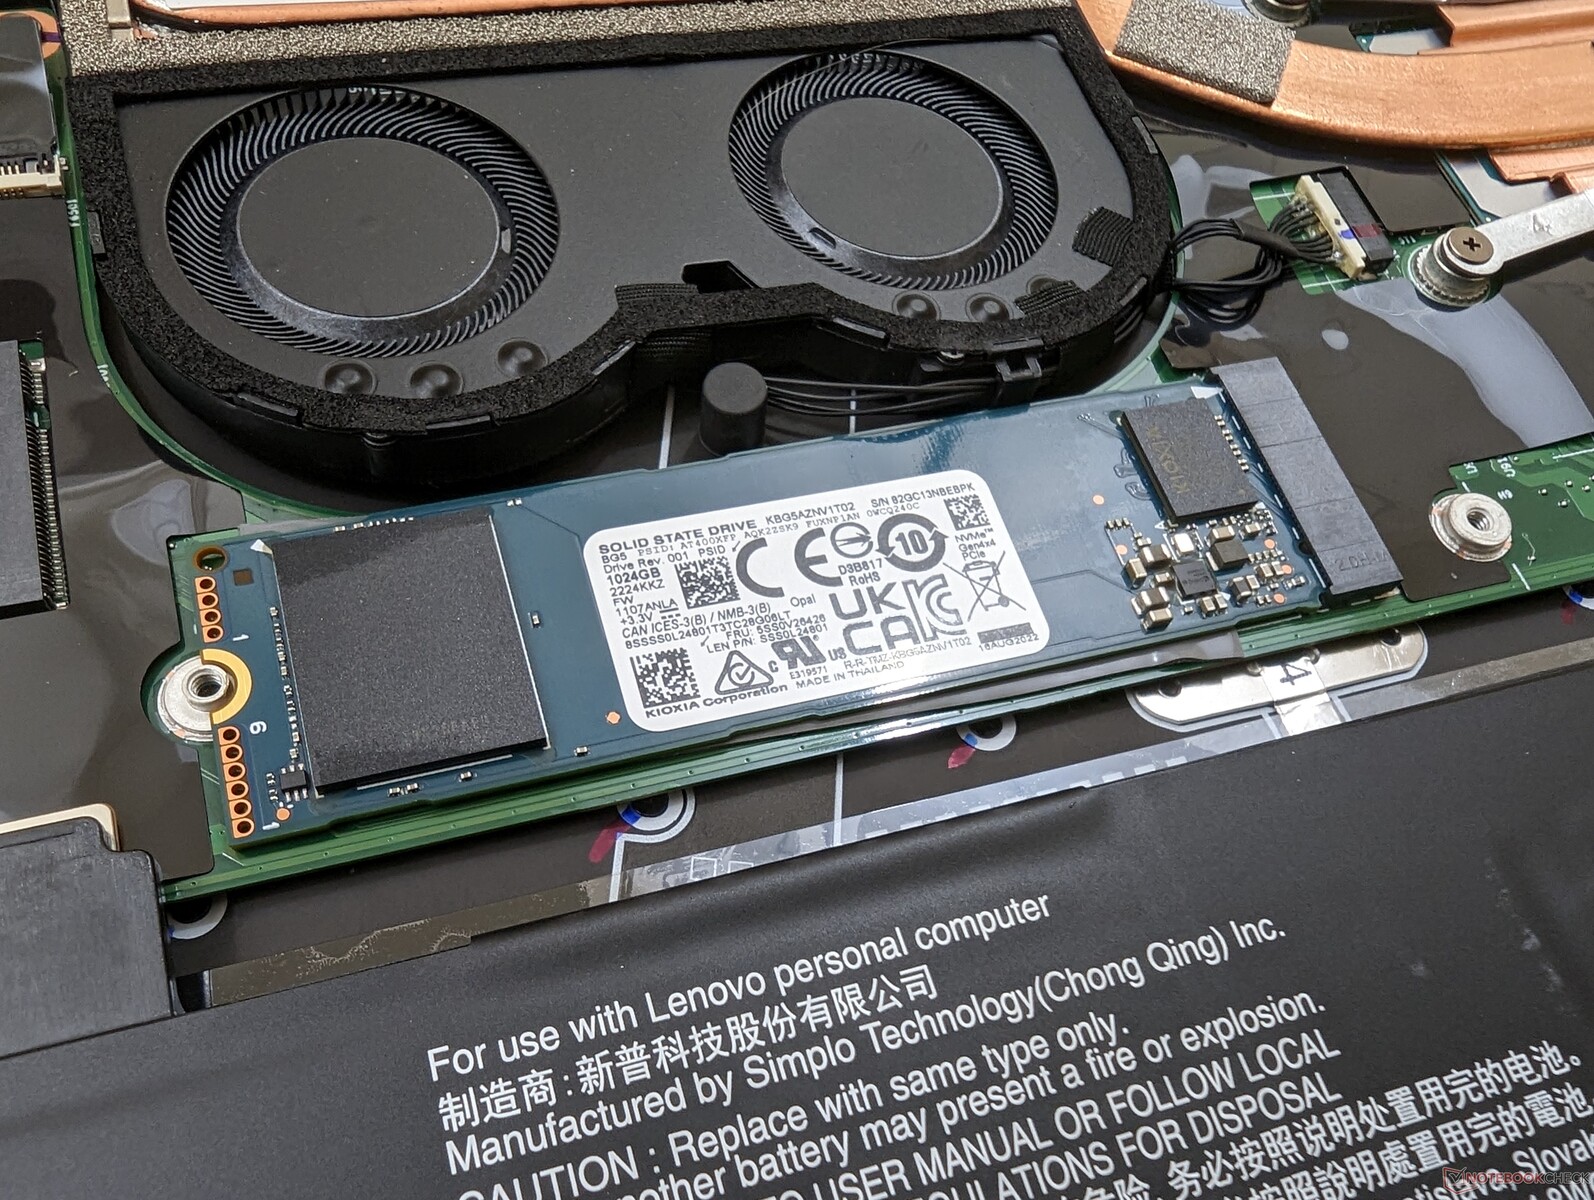
Storage Devices — One Drive Only
Our unit ships with a 512 GB PCIe3 x4 Kioxia NVMe SSD even though the system supports PCie4 x4 drives. Transfer rates are steady and without any major performance throttling unlike what we observed on the PCIe4 x4 Samsung drive in our Core-P configuration. This suggests that most PCIe4 x4 NVMe SSDs won't be able to run at their highest speeds for long periods inside of this ThinkPad anyway due to temperature concerns.

* ... smaller is better
Disk Throttling: DiskSpd Read Loop, Queue Depth 8
GPU Performance
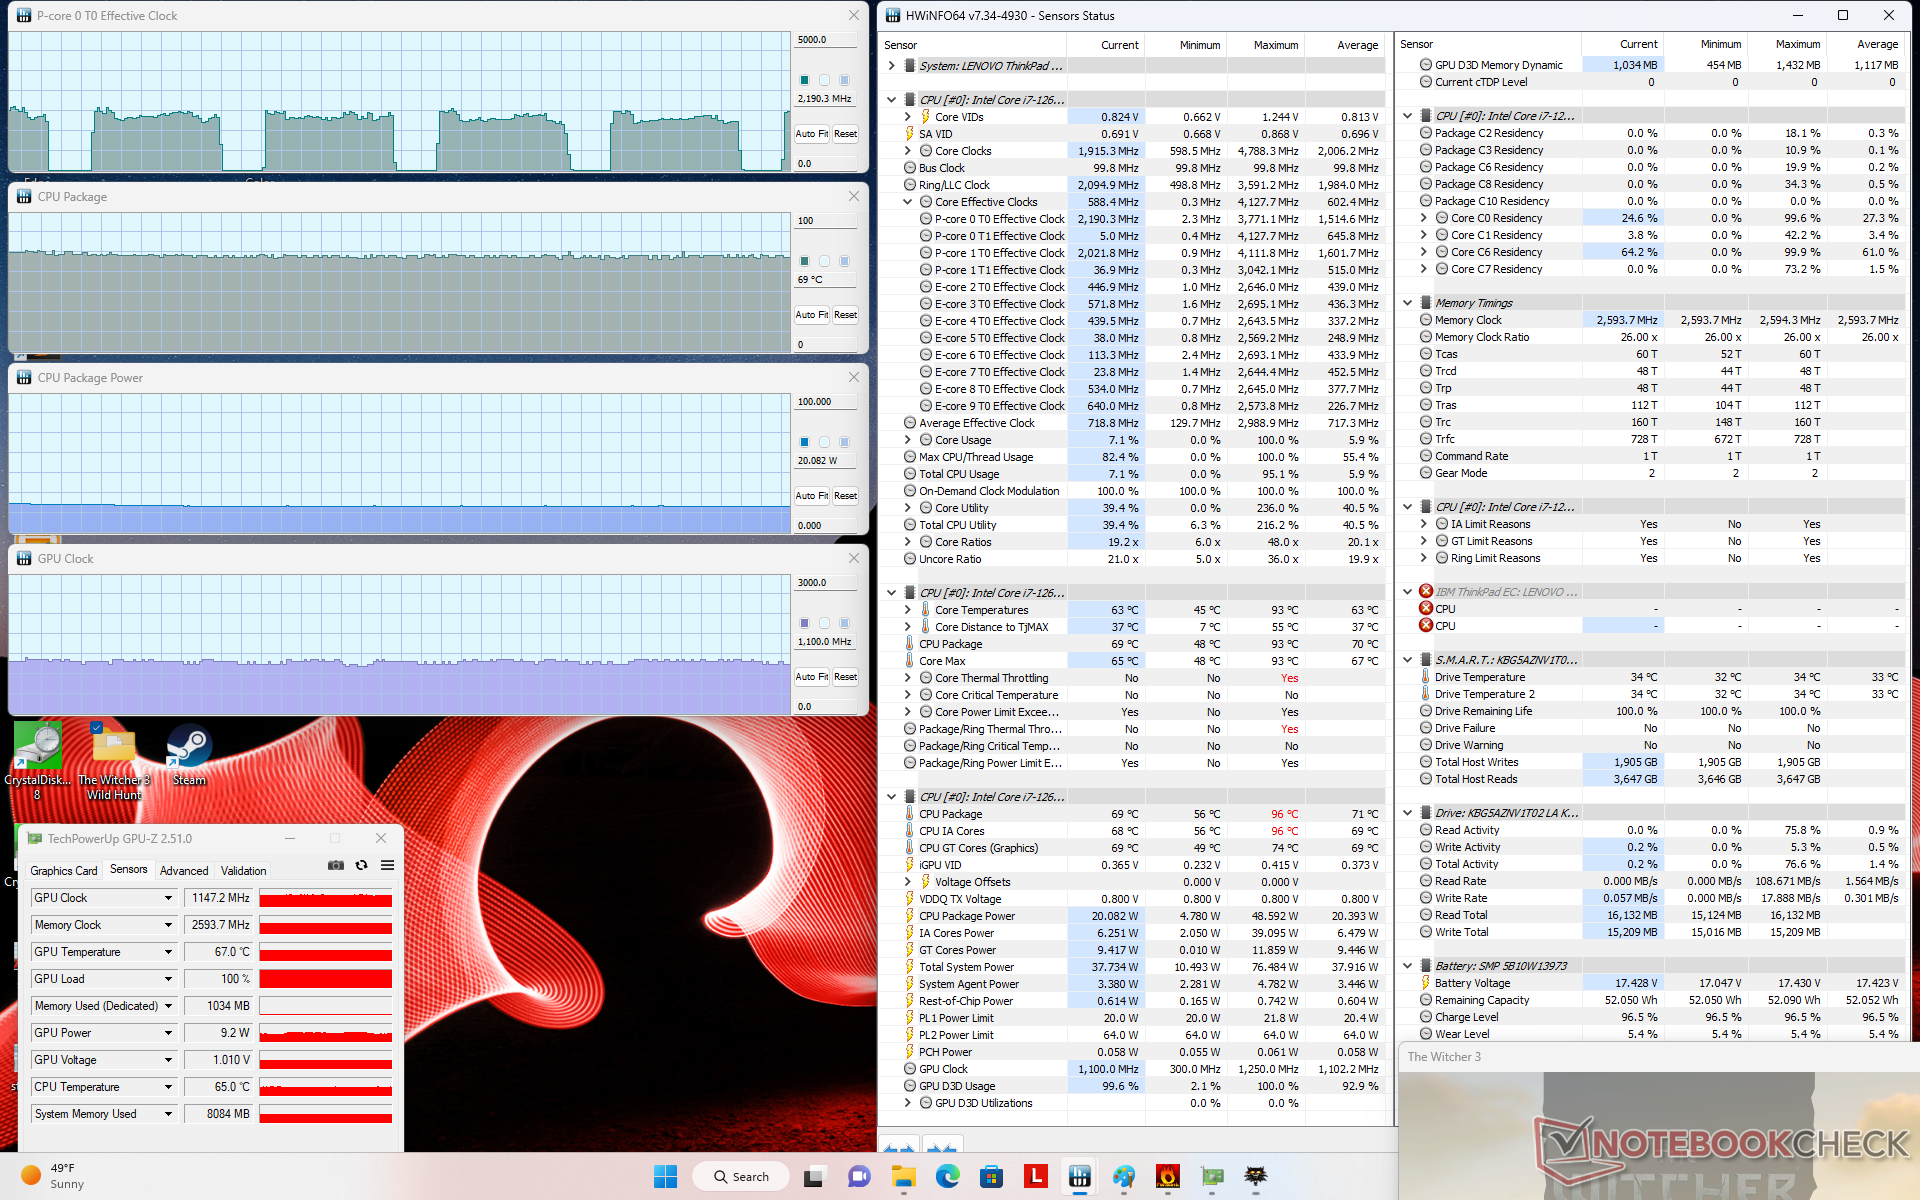
Graphics performance can be 20 to 40 percent faster than the Iris Xe 80 EUs in the Core i5-1250P SKU of the same ThinkPad X1 Carbon G10 model.
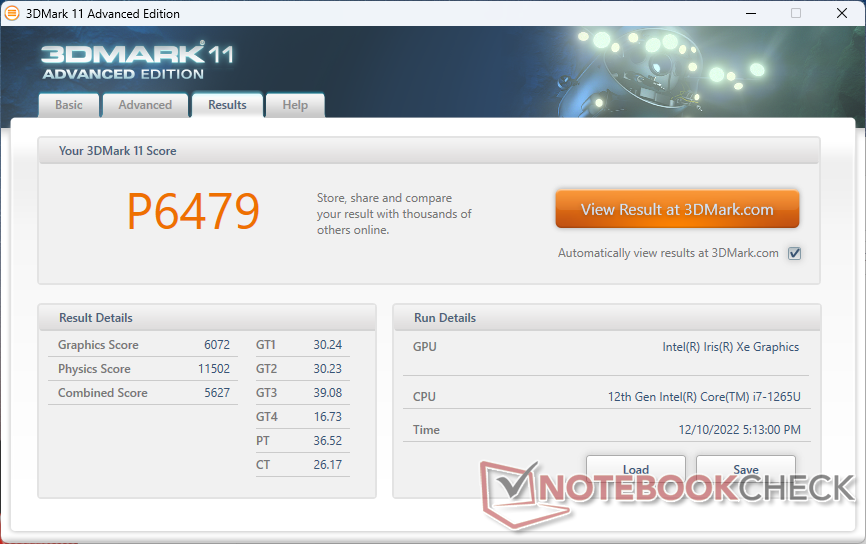
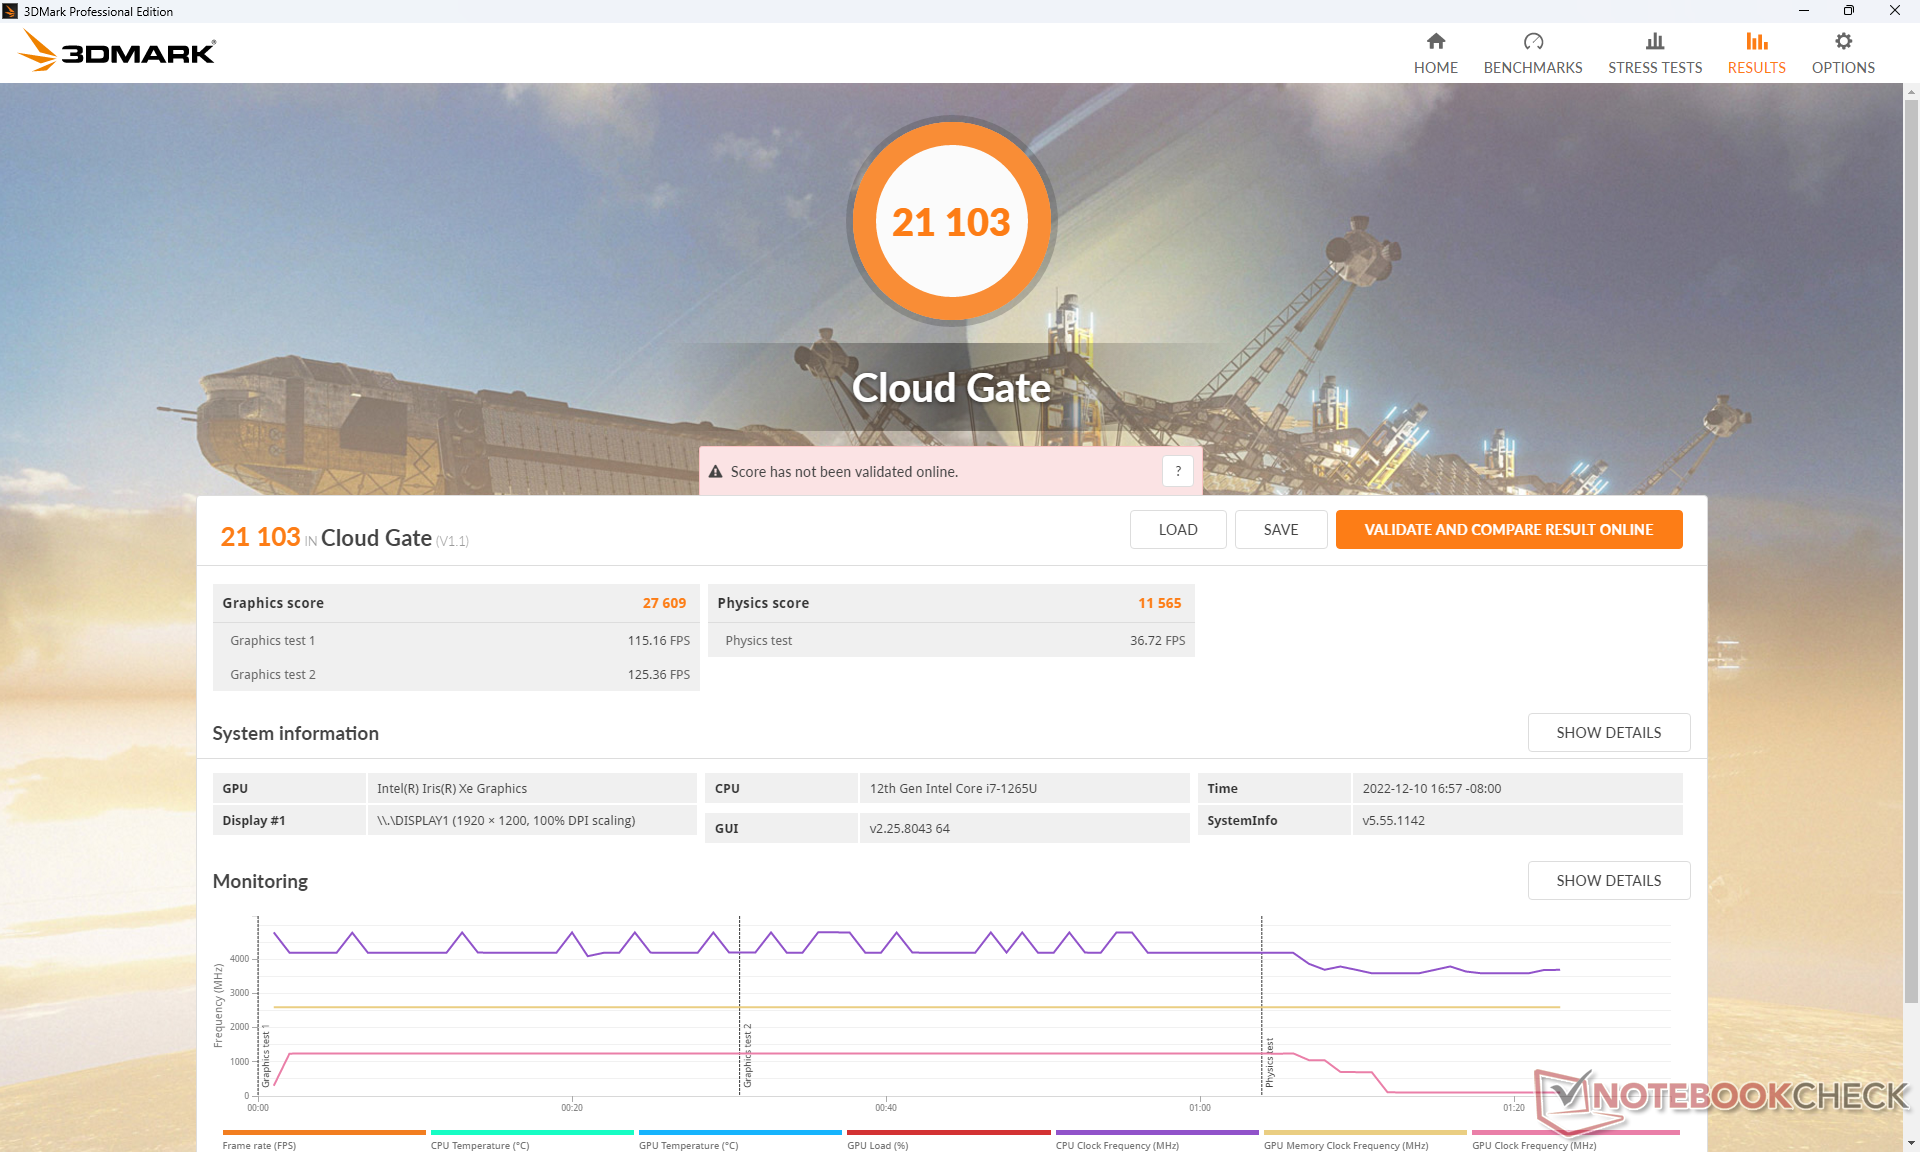
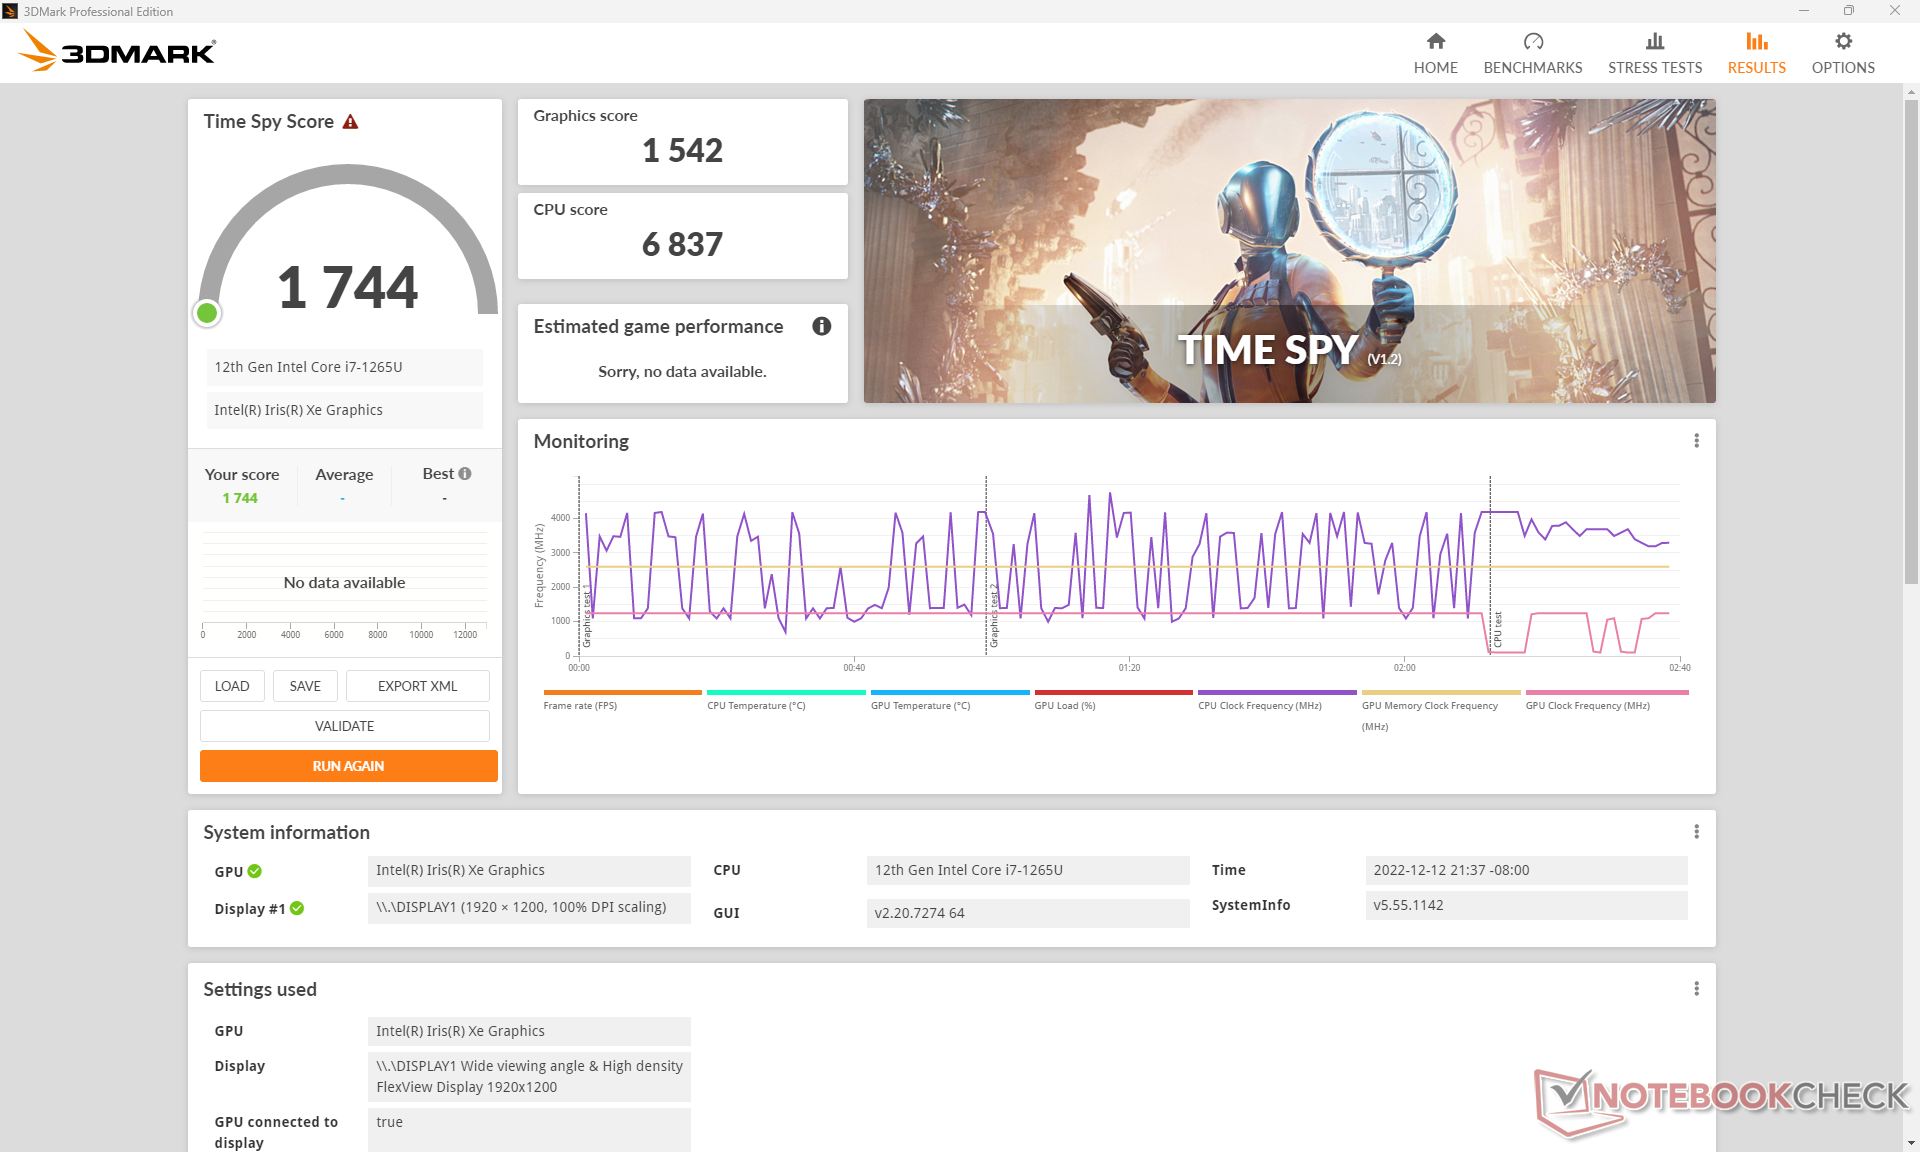
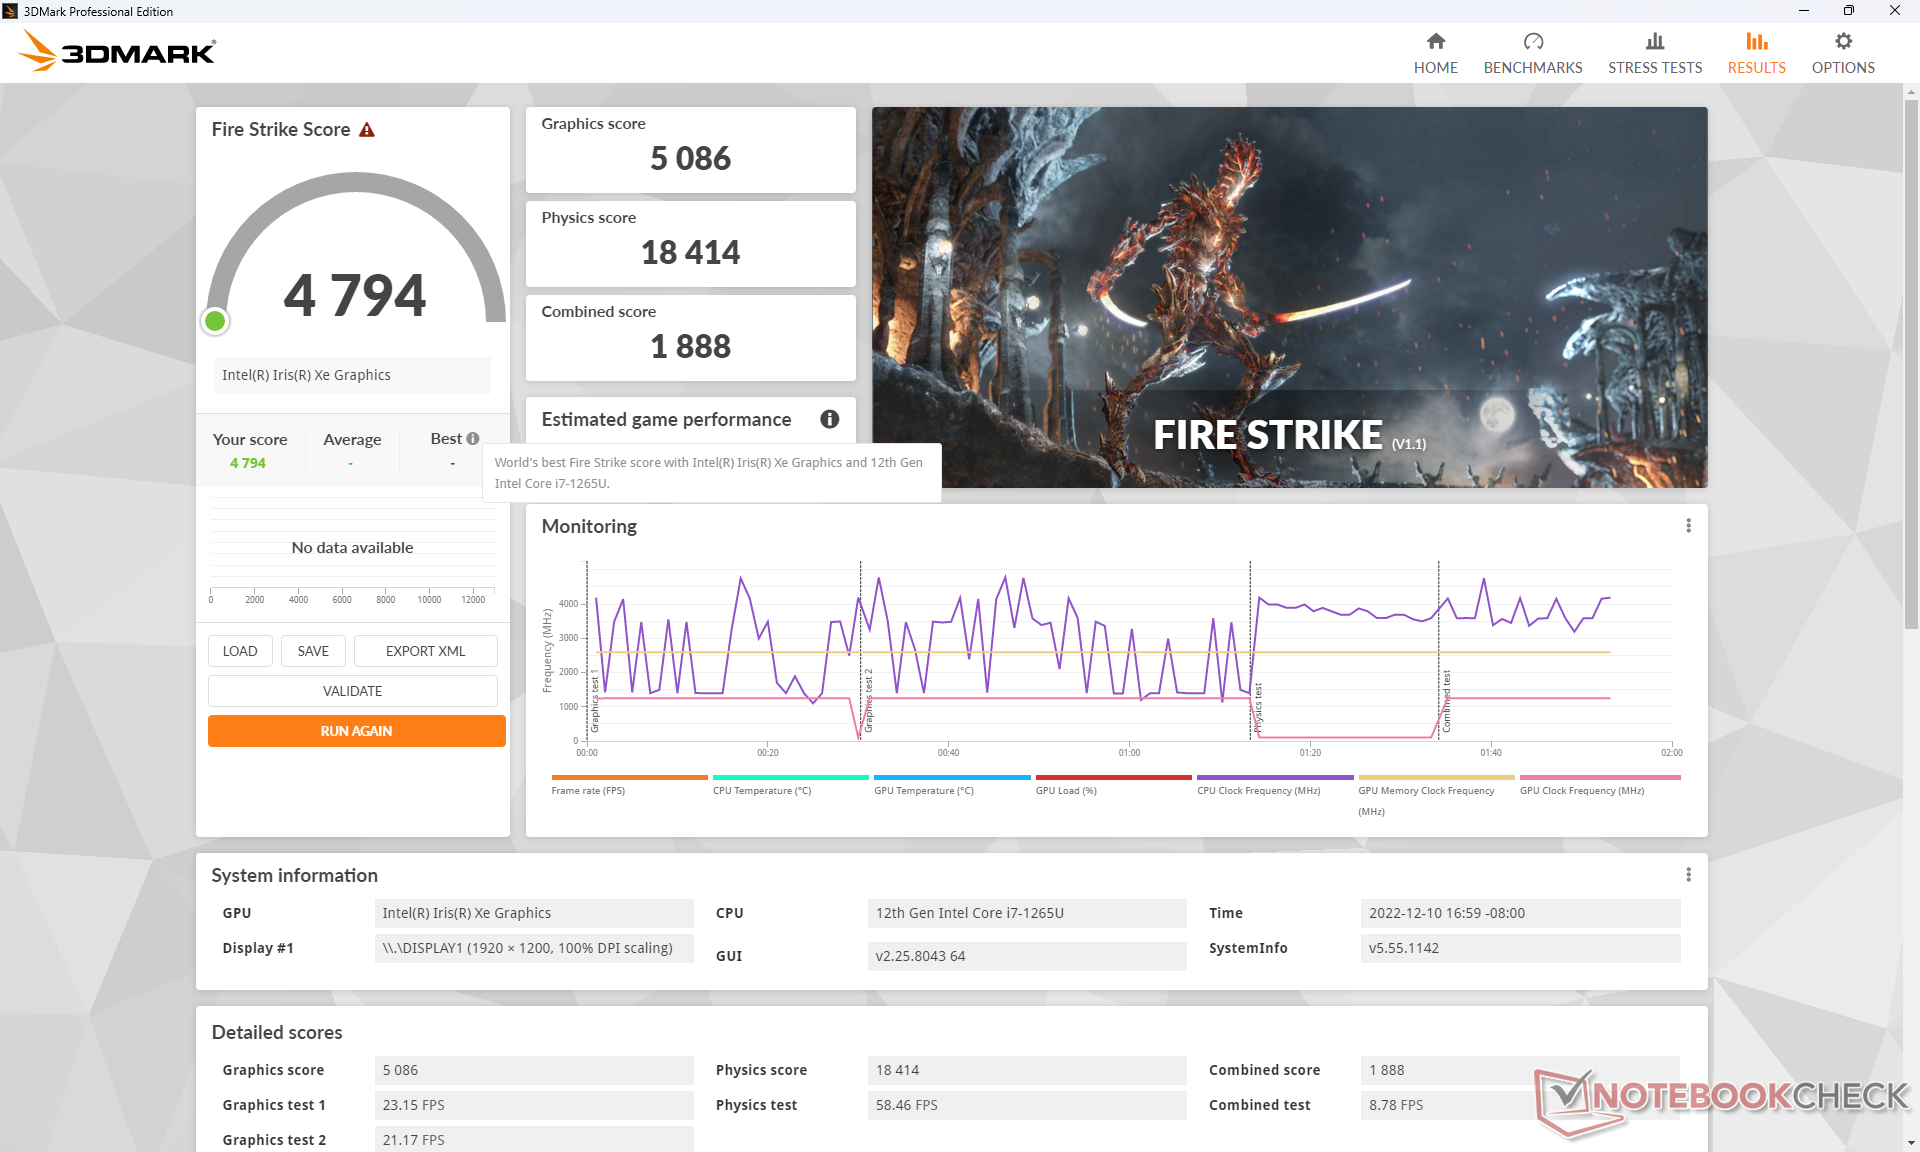
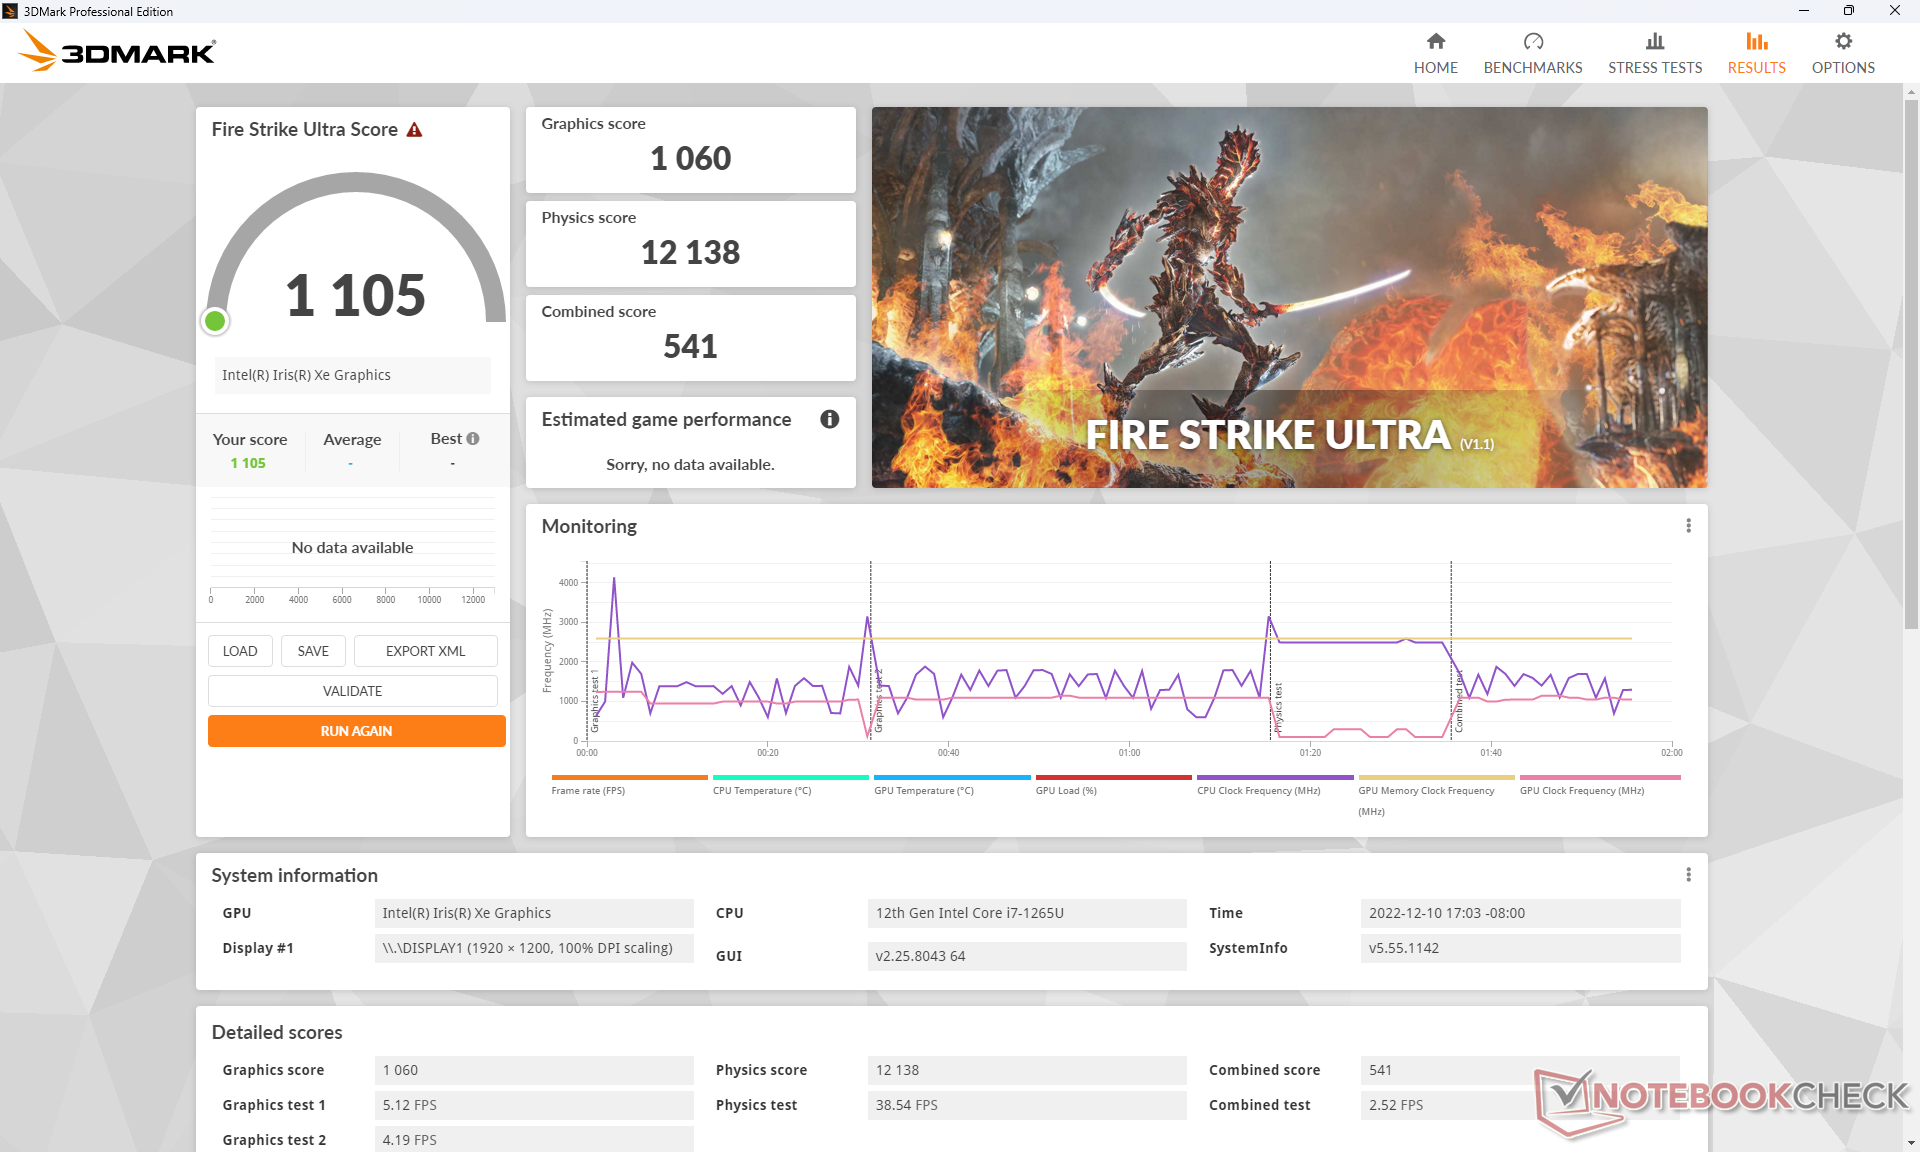
| 3DMark 11 Performance | 6479 points | |
| 3DMark Cloud Gate Standard Score | 21103 points | |
| 3DMark Fire Strike Score | 4794 points | |
| 3DMark Time Spy Score | 1744 points | |
Help | ||
Witcher 3 FPS Chart
| low | med. | high | ultra | |
|---|---|---|---|---|
| GTA V (2015) | 108.4 | 88 | 22.2 | 9.7 |
| The Witcher 3 (2015) | 95.6 | 60.3 | 33.9 | 15.4 |
| Dota 2 Reborn (2015) | 106.8 | 82 | 65.9 | 59.8 |
| Final Fantasy XV Benchmark (2018) | 43.7 | 23.6 | 16.5 | |
| X-Plane 11.11 (2018) | 40.4 | 35 | 31.3 | |
| Strange Brigade (2018) | 89.6 | 38.5 | 30.3 | 24.3 |
| Cyberpunk 2077 1.6 (2022) | 21.9 | 18 | 13.6 | 10.9 |
Emissions
System Noise — A Bit Louder
Overall fan noise is louder than what we recorded on the Core i5 Core-P configuration. Though the system does a great job at remaining quiet when under lower loads, the twin internal fans tend to ramp up more quickly when higher loads like 3DMark 06 are introduced. We're able to record a maximum fan noise of almost 39 dB(A) when running 3DMark 06 or Witcher 3 compared to 36 dB(A) on the Core-P SKU.
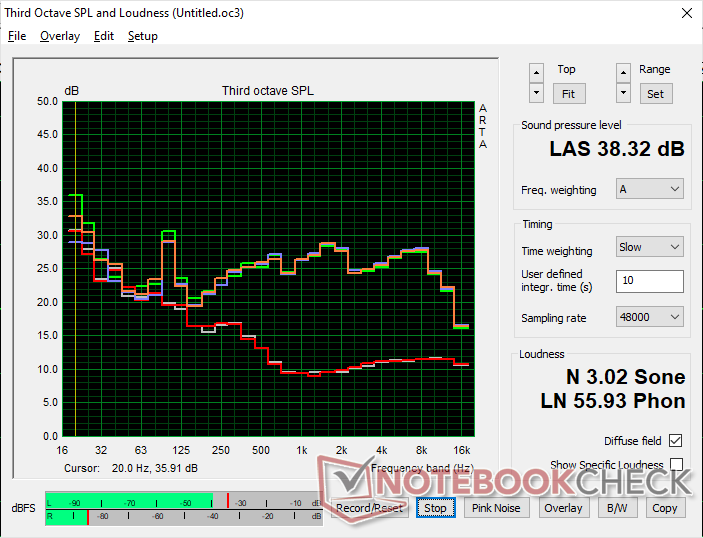
Noise level
| Idle |
| 23.2 / 23.2 / 23.2 dB(A) |
| Load |
| 38.6 / 38.3 dB(A) |
 | ||
30 dB silent 40 dB(A) audible 50 dB(A) loud |
||
min: | ||
| Lenovo ThinkPad X1 Carbon G10 Core i7-1265U Iris Xe G7 96EUs, i7-1265U, Kioxia BG5 KBG5AZNV1T02 | Lenovo ThinkPad X1 Carbon G10 21CC001RGE Iris Xe G7 80EUs, i5-1250P, Samsung PM9A1 MZVL2512HCJQ | HP EliteBook 845 G9 6F6H9EA Radeon 660M, R5 PRO 6650U, Samsung PM991 MZVLQ512HBLU | LG Gram 14Z90Q Iris Xe G7 80EUs, i5-1240P, Samsung PM9A1 MZVL2512HCJQ | Dell Latitude 7420 JW6MH Iris Xe G7 80EUs, i5-1145G7, SK Hynix BC711 HFM512GD3HX015N | Asus ExpertBook B1 B1400CEAE, i5-1135G7 Iris Xe G7 80EUs, i5-1135G7, WDC PC SN530 SDBPNPZ-512G | |
|---|---|---|---|---|---|---|
| Noise | 6% | -2% | -5% | -12% | 4% | |
| off / environment * (dB) | 23.2 | 22.81 2% | 24 -3% | 25 -8% | 25.3 -9% | 23.8 -3% |
| Idle Minimum * (dB) | 23.2 | 22.81 2% | 24 -3% | 26 -12% | 25.3 -9% | 23.8 -3% |
| Idle Average * (dB) | 23.2 | 22.81 2% | 25 -8% | 27 -16% | 25.3 -9% | 23.8 -3% |
| Idle Maximum * (dB) | 23.2 | 22.81 2% | 26 -12% | 28 -21% | 25.3 -9% | 26.5 -14% |
| Load Average * (dB) | 38.6 | 31.59 18% | 34 12% | 35 9% | 44.9 -16% | 28.6 26% |
| Witcher 3 ultra * (dB) | 38.5 | 35.59 8% | 38 1% | 36 6% | 30.6 21% | |
| Load Maximum * (dB) | 38.3 | 35.47 7% | 38 1% | 36 6% | 44.9 -17% | 37.4 2% |
* ... smaller is better
Temperature
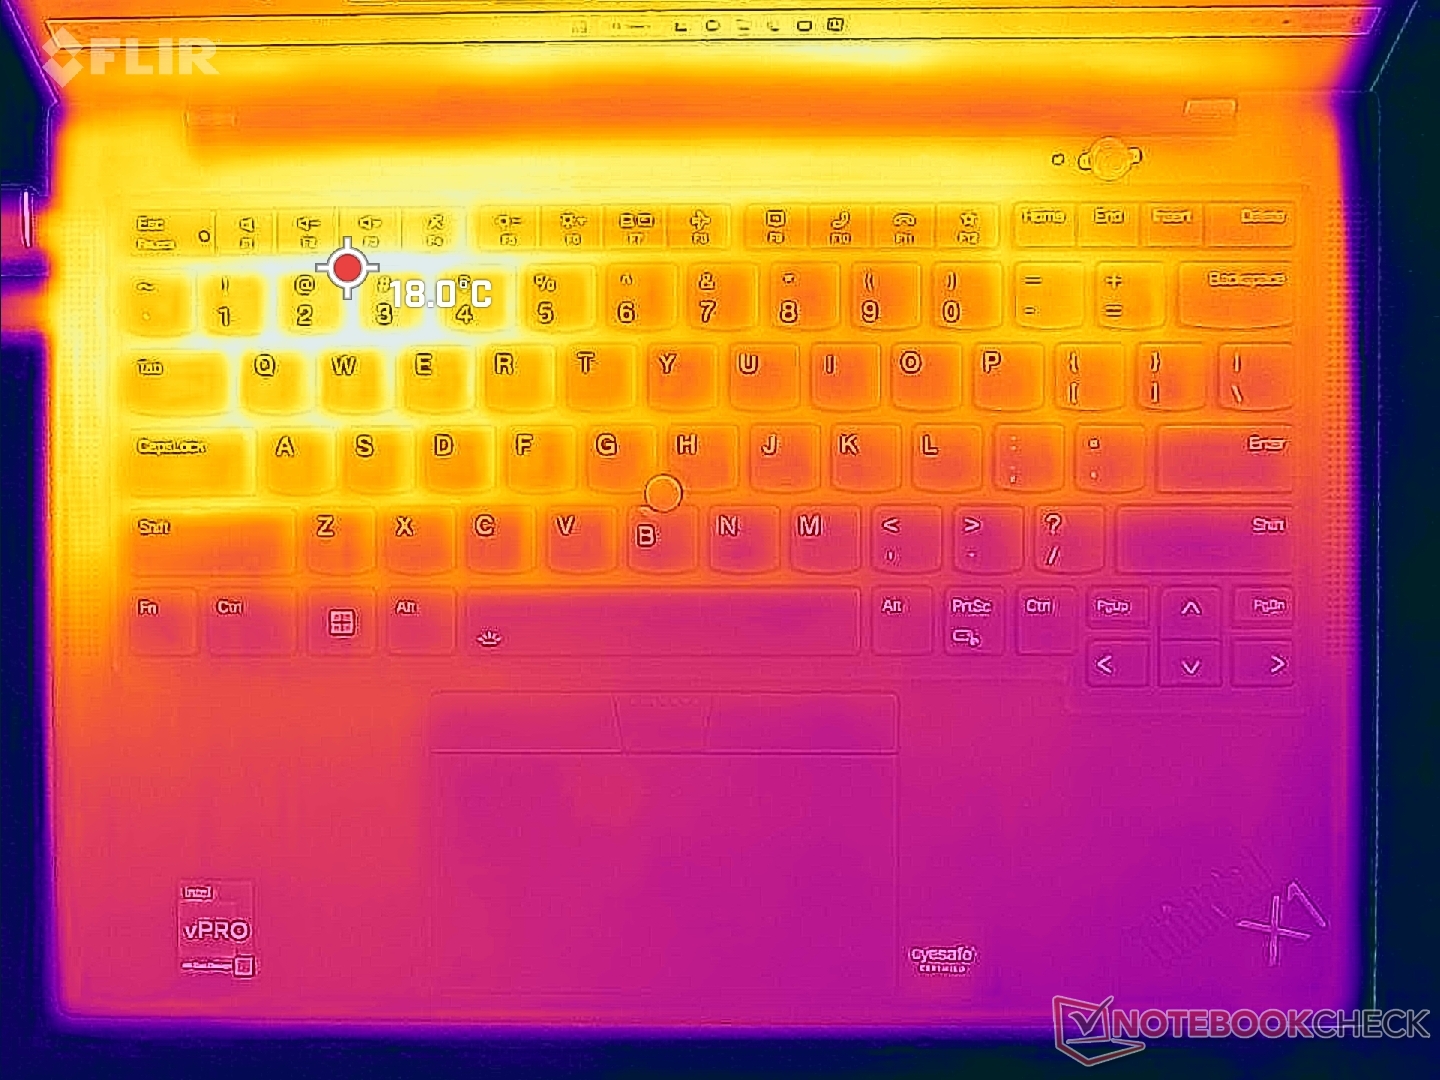
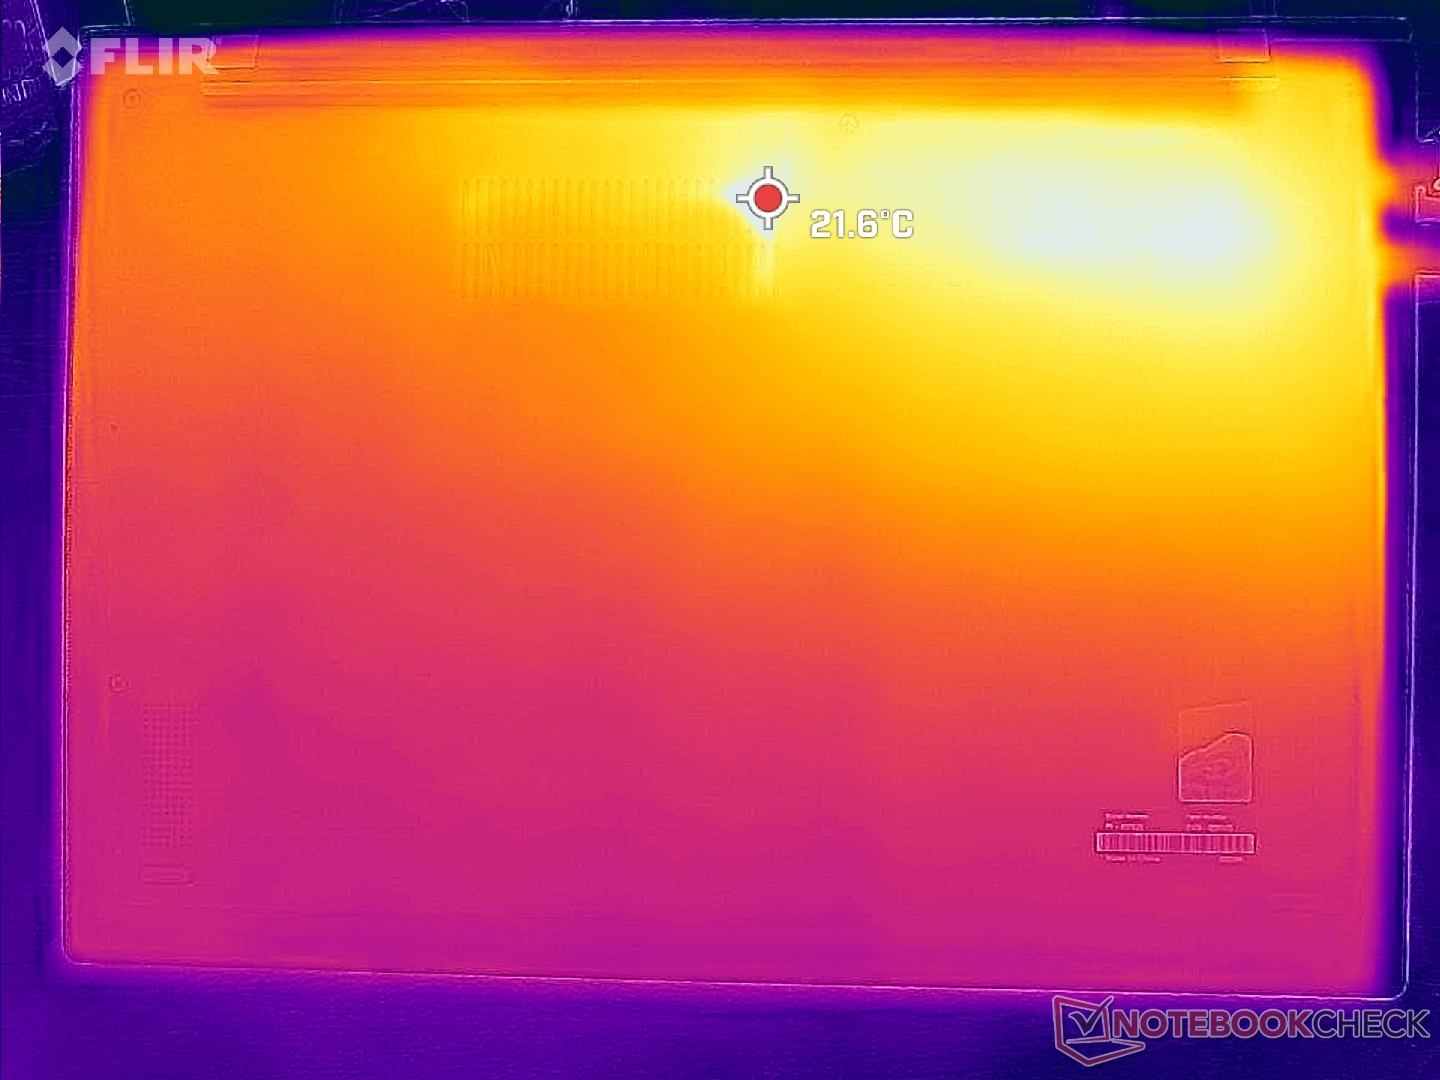
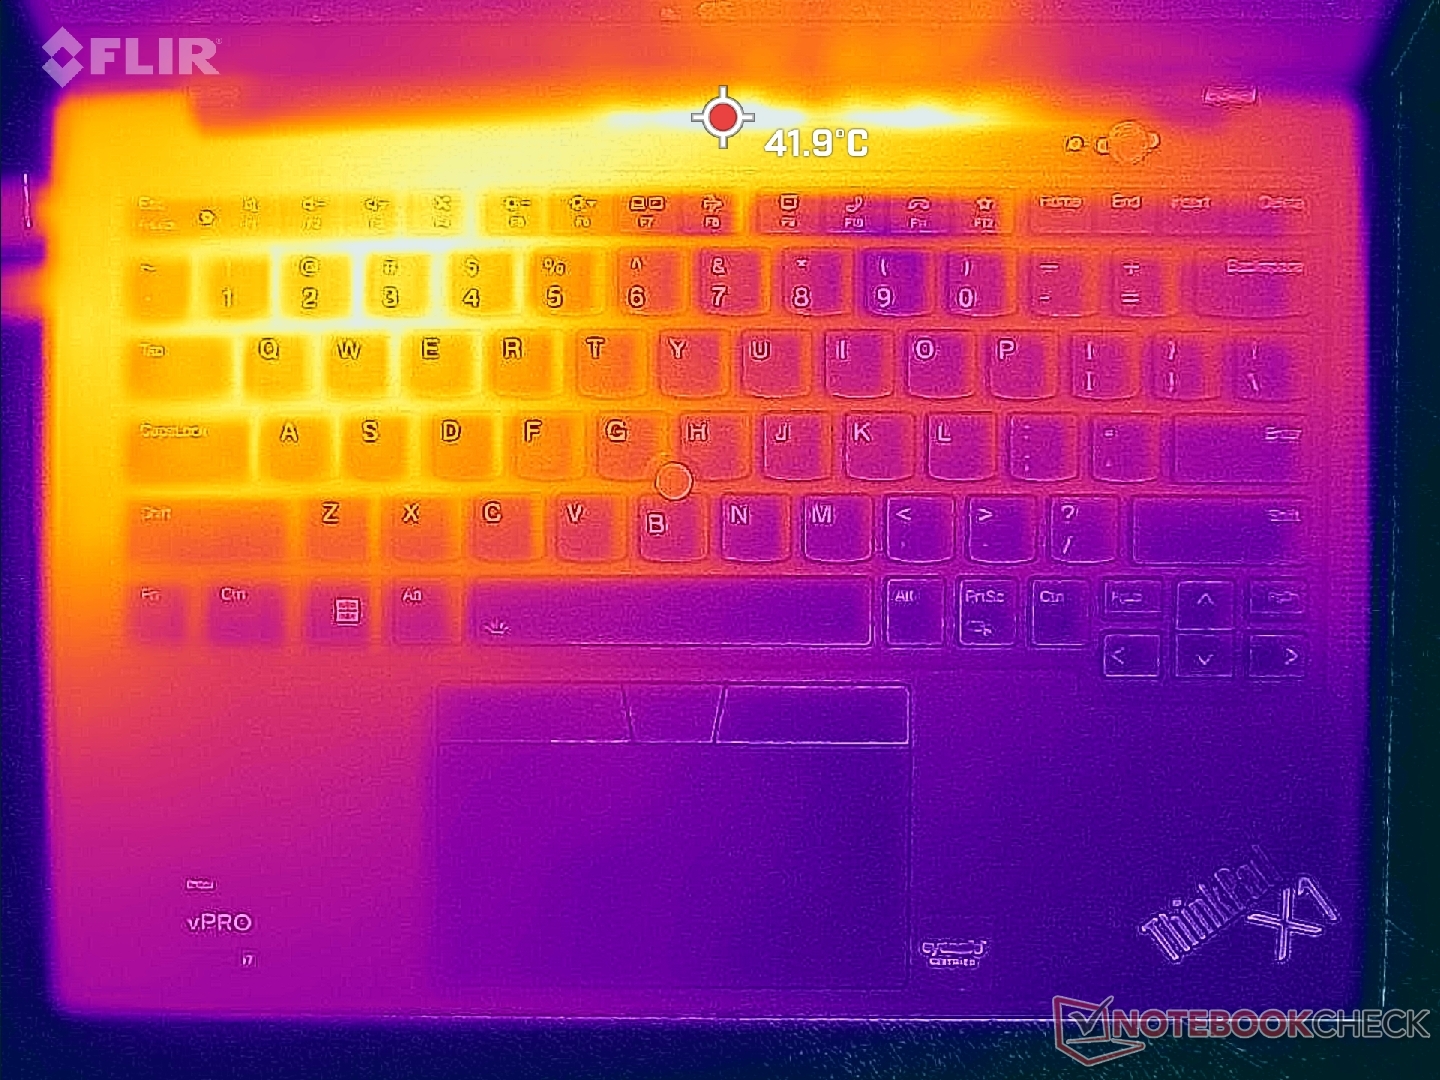
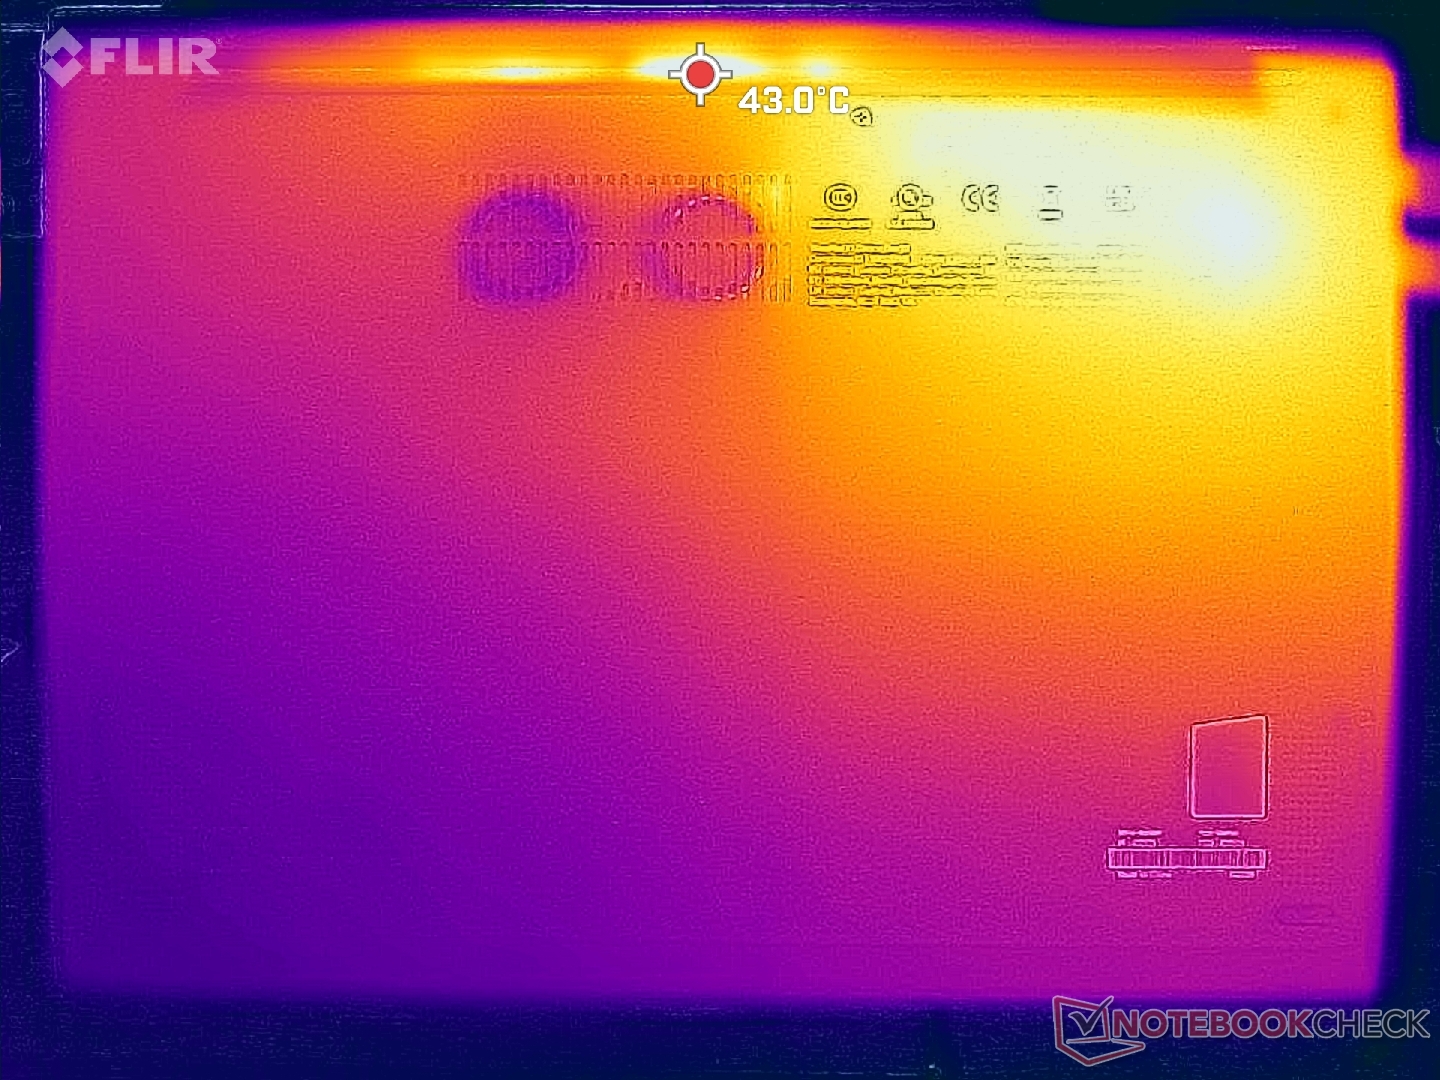
Surface temperatures are always warmer on the left half of the laptop than the right due to the positioning of the cooling solution and processor. In fact, the hot spot on the keyboard deck can be as warm as 42 C compared to just 20 C on the palm rest. Temperatures are still comparable to the Core-P-powered X1 Carbon G10, however, despite the performance dfferences.
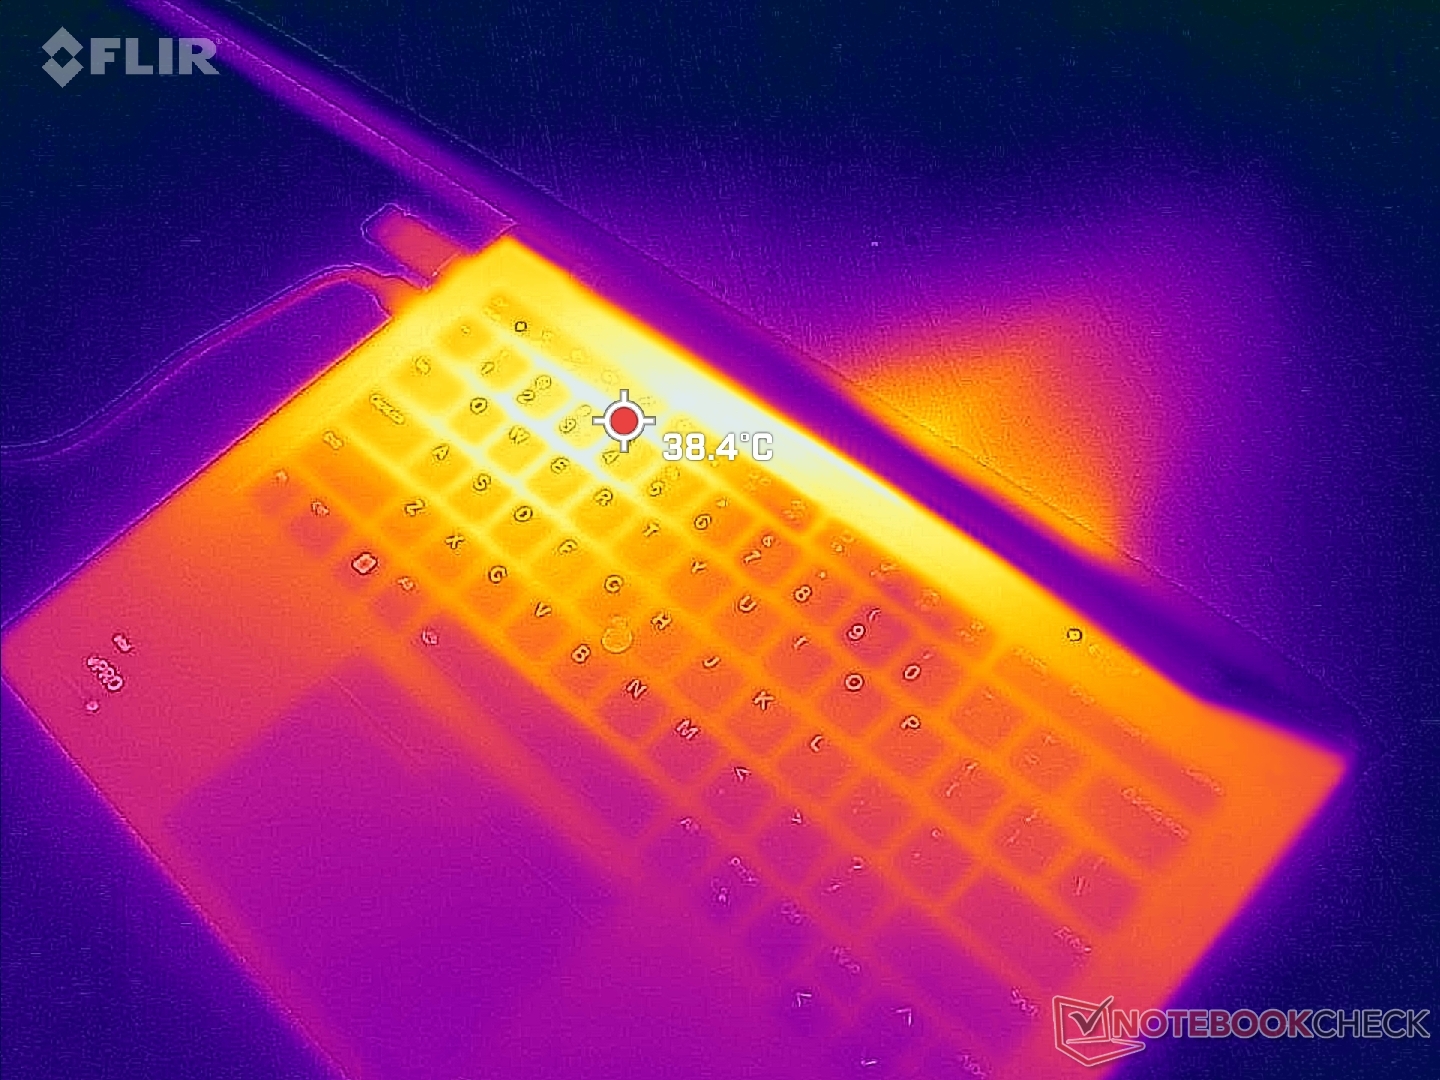
(±) The maximum temperature on the upper side is 41.2 °C / 106 F, compared to the average of 34.3 °C / 94 F, ranging from 21.2 to 62.5 °C for the class Office.
(±) The bottom heats up to a maximum of 41 °C / 106 F, compared to the average of 36.8 °C / 98 F
(+) In idle usage, the average temperature for the upper side is 21.4 °C / 71 F, compared to the device average of 29.5 °C / 85 F.
(+) The palmrests and touchpad are cooler than skin temperature with a maximum of 25.2 °C / 77.4 F and are therefore cool to the touch.
(+) The average temperature of the palmrest area of similar devices was 27.5 °C / 81.5 F (+2.3 °C / 4.1 F).
| Lenovo ThinkPad X1 Carbon G10 Core i7-1265U Intel Core i7-1265U, Intel Iris Xe Graphics G7 96EUs | Lenovo ThinkPad X1 Carbon G10 21CC001RGE Intel Core i5-1250P, Intel Iris Xe Graphics G7 80EUs | HP EliteBook 845 G9 6F6H9EA AMD Ryzen 5 PRO 6650U, AMD Radeon 660M | LG Gram 14Z90Q Intel Core i5-1240P, Intel Iris Xe Graphics G7 80EUs | Dell Latitude 7420 JW6MH Intel Core i5-1145G7, Intel Iris Xe Graphics G7 80EUs | Asus ExpertBook B1 B1400CEAE, i5-1135G7 Intel Core i5-1135G7, Intel Iris Xe Graphics G7 80EUs | |
|---|---|---|---|---|---|---|
| Heat | -23% | -12% | -13% | -6% | -15% | |
| Maximum Upper Side * (°C) | 41.2 | 45 -9% | 44 -7% | 43 -4% | 37.1 10% | 41.7 -1% |
| Maximum Bottom * (°C) | 41 | 44 -7% | 45 -10% | 45 -10% | 38.7 6% | 54.3 -32% |
| Idle Upper Side * (°C) | 23.2 | 31.2 -34% | 27 -16% | 27 -16% | 27.3 -18% | 26 -12% |
| Idle Bottom * (°C) | 23.4 | 33.2 -42% | 27 -15% | 28 -20% | 28.1 -20% | 27.1 -16% |
* ... smaller is better
Stress Test
When stressed under Prime95, the CPU would boost to 3.7 GHz, 51 W, and 98 C for only a couple of seconds. Clock rate and power draw would then drop to 2.7 GHz and 35 W, respectively, until finally stabilizing at 2.3 GHz, 24 W, and 82 C after a few minutes. The spike in core temperature to almost 100 C shows that the cooling solution is insufficient at maximizing Turbo Boost performance.
Running on battery power does not appear to impact CPU or GPU performance significantly. A 3DMark 11 test on mains and then on batteries would show almost no differences in final scores.
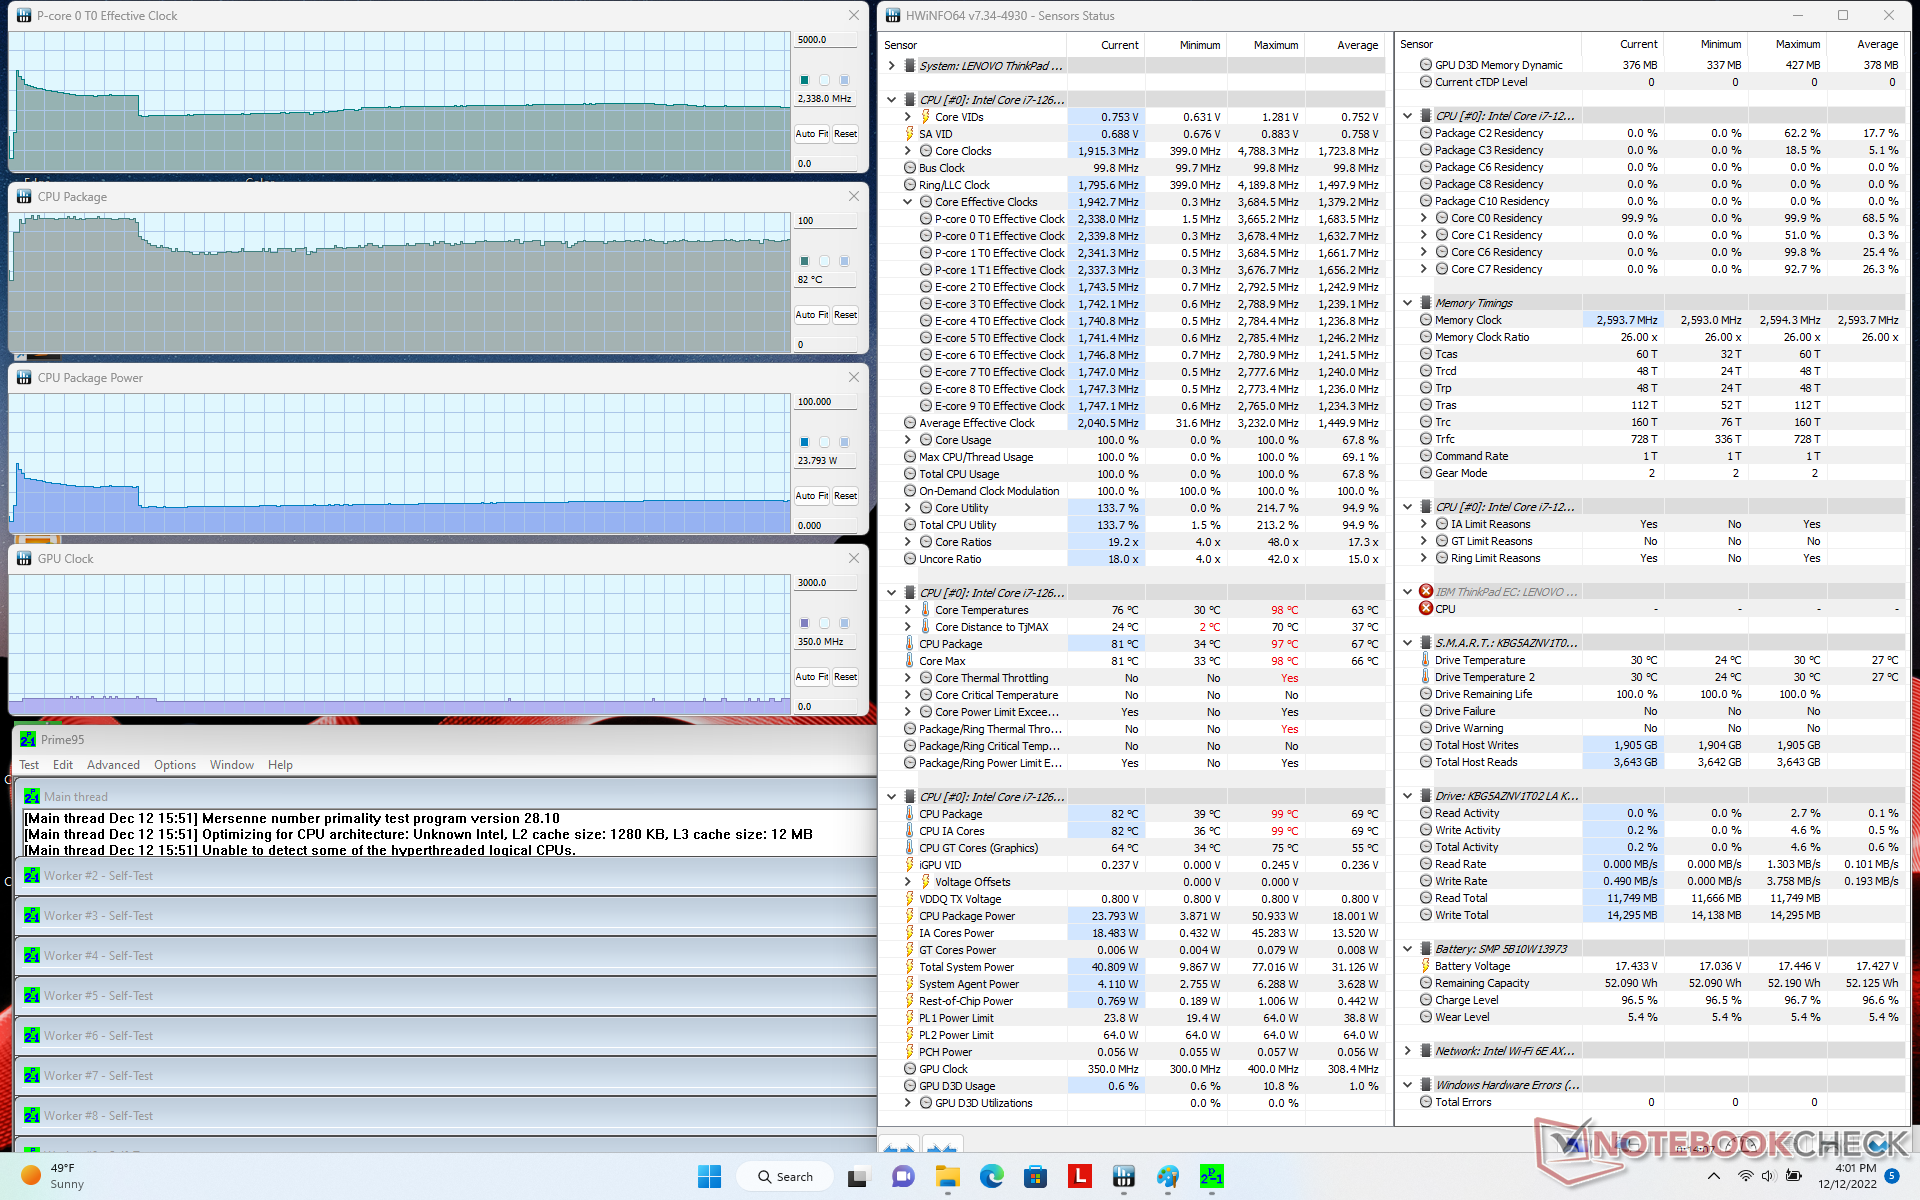
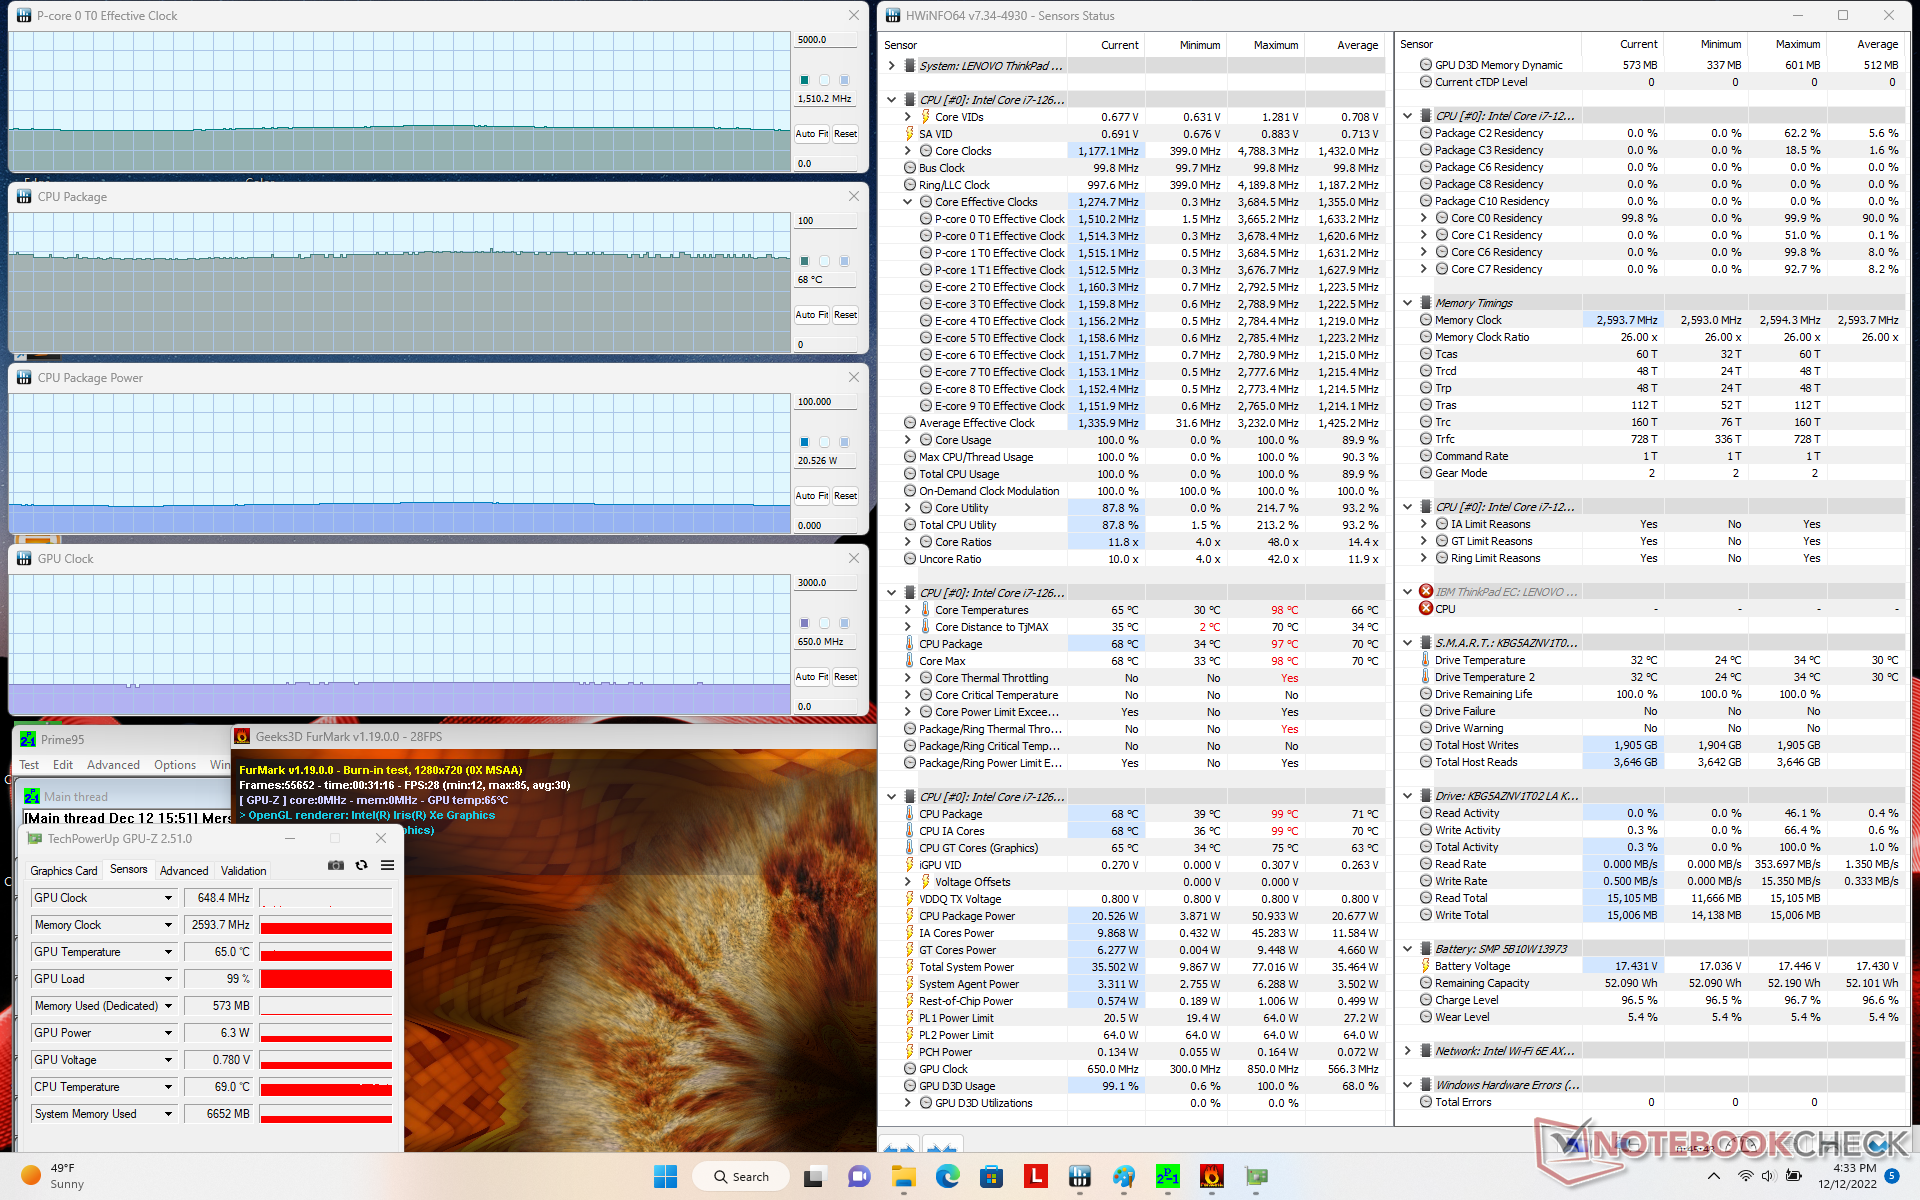
| CPU Clock (GHz) | GPU Clock (MHz) | Average CPU Temperature (°C) | |
| System Idle | -- | -- | 46 |
| Prime95 Stress | 2.3 | -- | 82 |
| Prime95 + FurMark Stress | 1.5 | 648 | 68 |
| Witcher 3 Stress | ~2.2 | 1147 | 69 |
Speakers
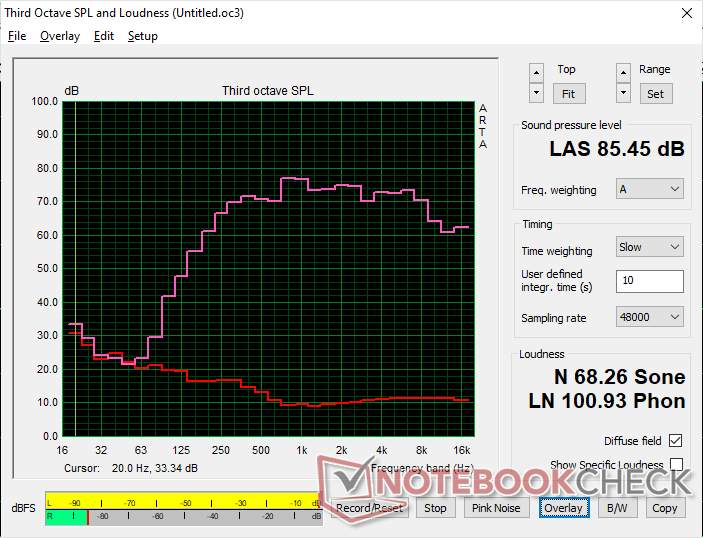
Lenovo ThinkPad X1 Carbon G10 Core i7-1265U audio analysis
(+) | speakers can play relatively loud (85.5 dB)
Bass 100 - 315 Hz
(±) | reduced bass - on average 13.4% lower than median
(±) | linearity of bass is average (11.3% delta to prev. frequency)
Mids 400 - 2000 Hz
(+) | balanced mids - only 3.2% away from median
(+) | mids are linear (3.3% delta to prev. frequency)
Highs 2 - 16 kHz
(+) | balanced highs - only 2.7% away from median
(+) | highs are linear (4.4% delta to prev. frequency)
Overall 100 - 16.000 Hz
(+) | overall sound is linear (10.8% difference to median)
Compared to same class
» 2% of all tested devices in this class were better, 1% similar, 97% worse
» The best had a delta of 7%, average was 21%, worst was 53%
Compared to all devices tested
» 6% of all tested devices were better, 2% similar, 92% worse
» The best had a delta of 4%, average was 23%, worst was 134%
Apple MacBook Pro 16 2021 M1 Pro audio analysis
(+) | speakers can play relatively loud (84.7 dB)
Bass 100 - 315 Hz
(+) | good bass - only 3.8% away from median
(+) | bass is linear (5.2% delta to prev. frequency)
Mids 400 - 2000 Hz
(+) | balanced mids - only 1.3% away from median
(+) | mids are linear (2.1% delta to prev. frequency)
Highs 2 - 16 kHz
(+) | balanced highs - only 1.9% away from median
(+) | highs are linear (2.7% delta to prev. frequency)
Overall 100 - 16.000 Hz
(+) | overall sound is linear (4.6% difference to median)
Compared to same class
» 0% of all tested devices in this class were better, 0% similar, 100% worse
» The best had a delta of 5%, average was 17%, worst was 45%
Compared to all devices tested
» 0% of all tested devices were better, 0% similar, 100% worse
» The best had a delta of 4%, average was 23%, worst was 134%
Energy Management
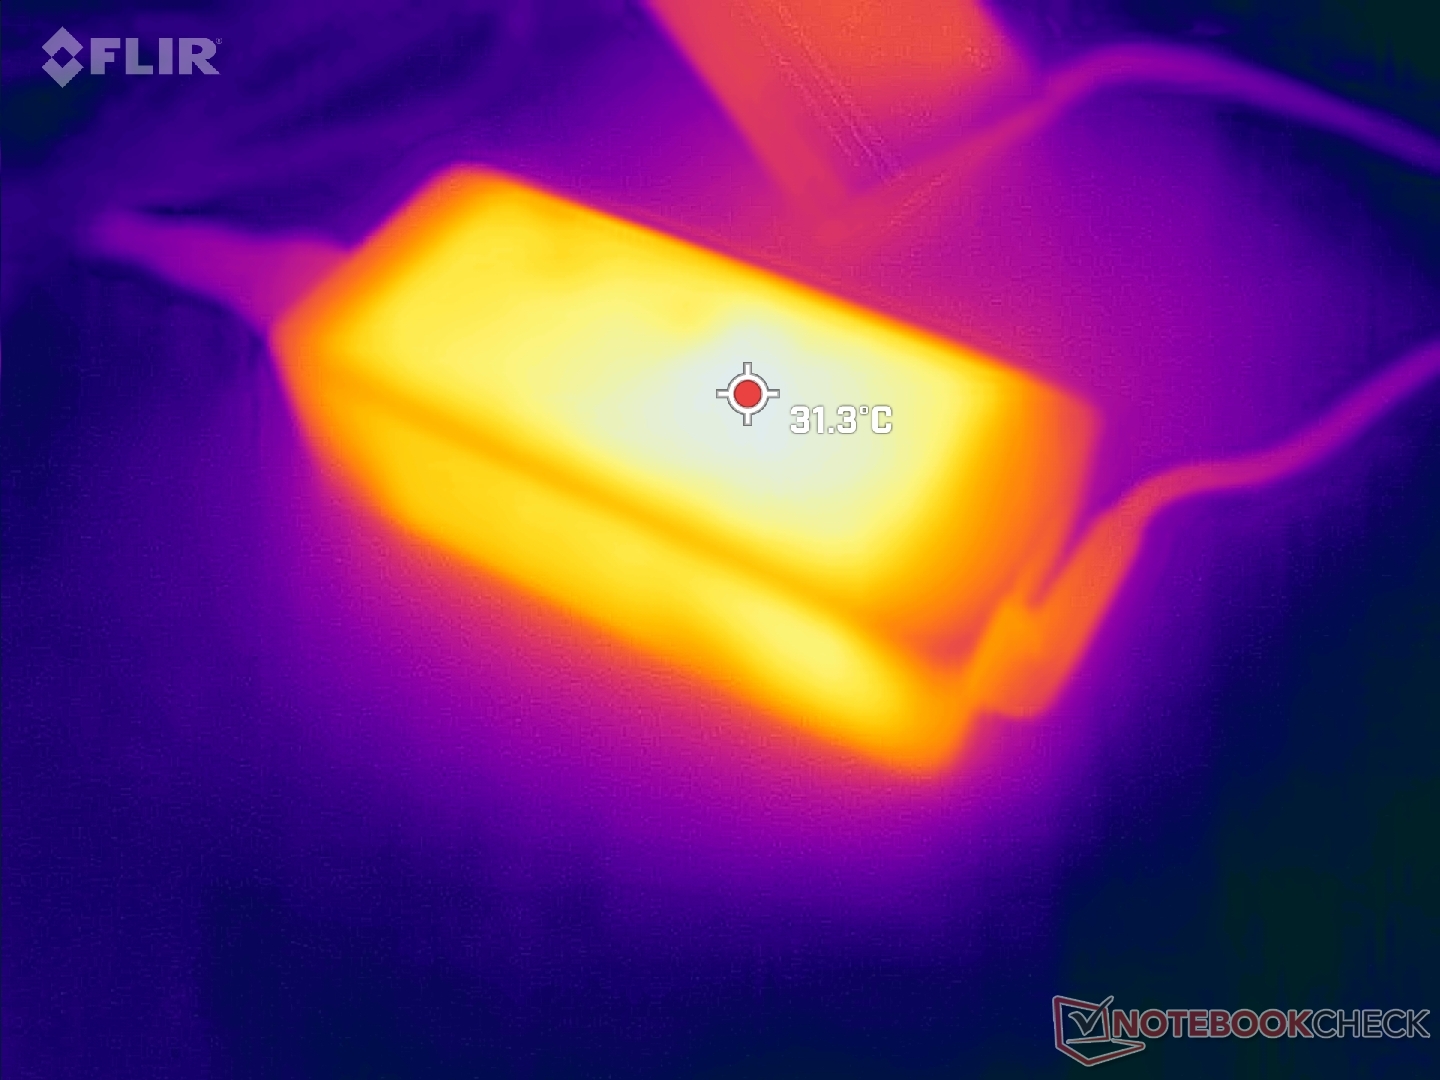
Power Consumption — More Demanding
Our Core i7-1265U unit is more demanding than our Core i5-1250P unit by about 40 to 80 percent when running higher loads which aligns with our faster CPU and GPU results recorded above. In fact, this particular Core-i7-U configuration can be more demanding than most 14-inch business laptops with no discrete graphics.
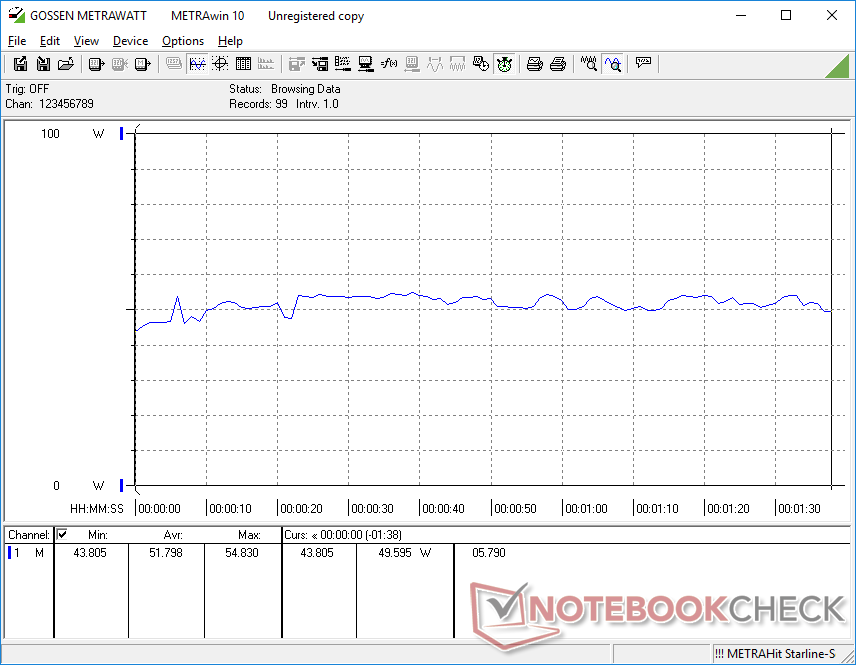
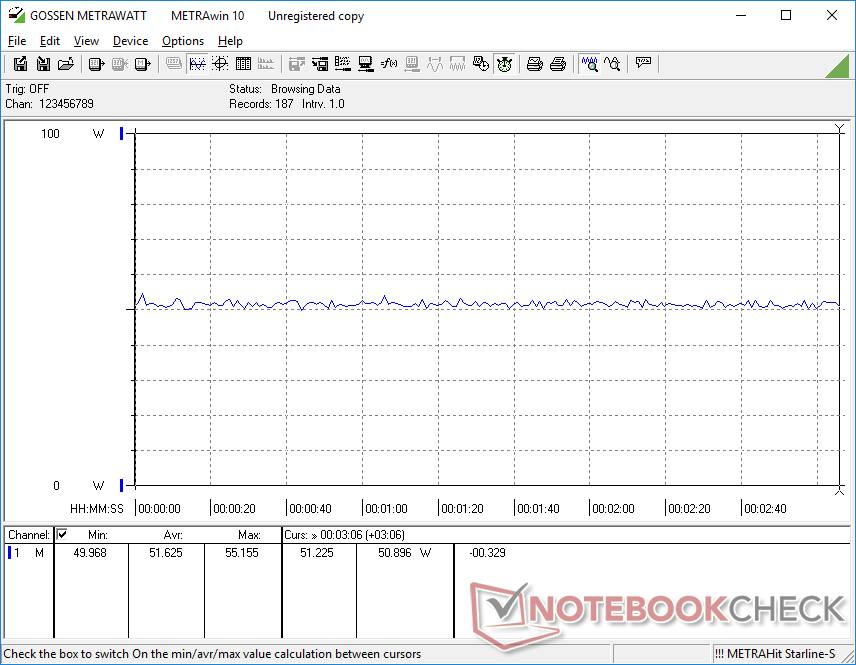
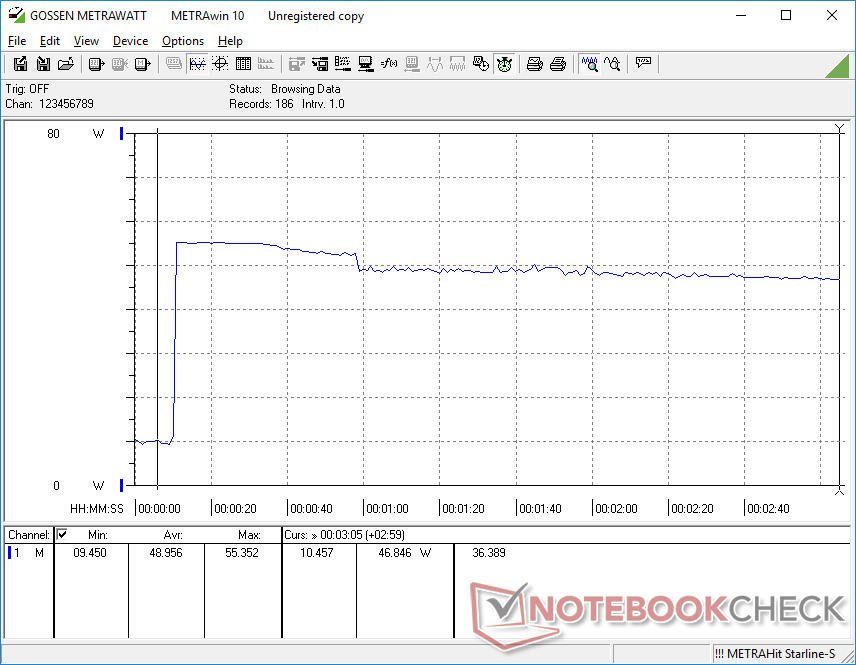
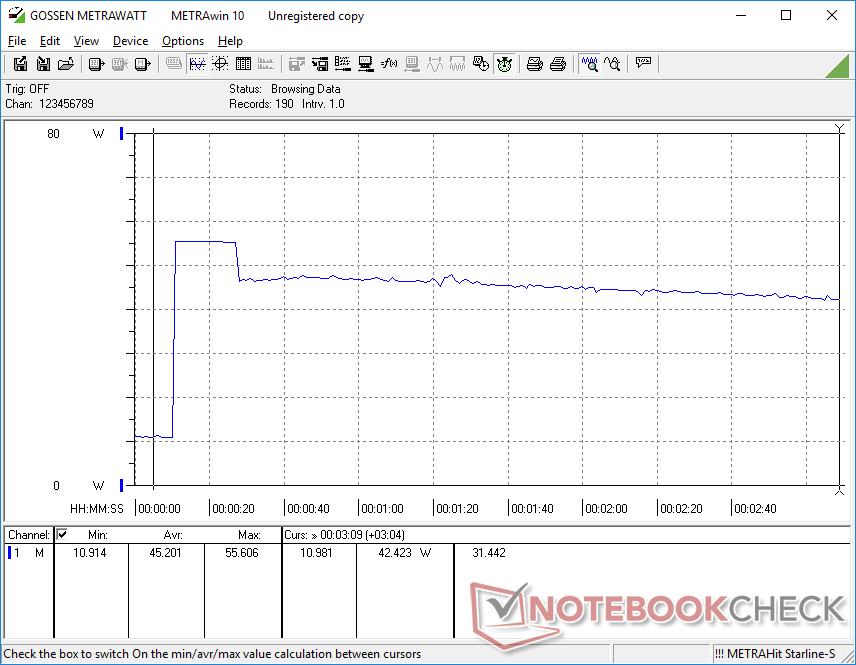
We're able to record a maximum draw of 56 W from the small (~10.8 x 4.7 x 3 cm) 65 W USB-C AC adapter when initiating Prime95 stress as shown by our screenshots below. This is lower than the 63 W that we recorded on the Core i5-1250P configuration since the latter benefits from higher initial Turbo Boost performance as exemplified by our CineBench results above.
| Off / Standby | |
| Idle | |
| Load |
|
Key:
min: | |
| Lenovo ThinkPad X1 Carbon G10 Core i7-1265U i7-1265U, Iris Xe G7 96EUs, Kioxia BG5 KBG5AZNV1T02, IPS, 1920x1200, 14" | Lenovo ThinkPad X1 Carbon G10 21CC001RGE i5-1250P, Iris Xe G7 80EUs, Samsung PM9A1 MZVL2512HCJQ, IPS LED, 1920x1200, 14" | HP EliteBook 845 G9 6F6H9EA R5 PRO 6650U, Radeon 660M, Samsung PM991 MZVLQ512HBLU, IPS, 1920x1200, 14" | LG Gram 14Z90Q i5-1240P, Iris Xe G7 80EUs, Samsung PM9A1 MZVL2512HCJQ, IPS, 1920x1200, 14" | Dell Latitude 7420 JW6MH i5-1145G7, Iris Xe G7 80EUs, SK Hynix BC711 HFM512GD3HX015N, IPS, 1920x1080, 14" | Asus ExpertBook B1 B1400CEAE, i5-1135G7 i5-1135G7, Iris Xe G7 80EUs, WDC PC SN530 SDBPNPZ-512G, IPS, 1920x1080, 14" | |
|---|---|---|---|---|---|---|
| Power Consumption | 20% | 16% | 4% | 14% | 21% | |
| Idle Minimum * (Watt) | 2.8 | 2.9 -4% | 3 -7% | 3 -7% | 2.7 4% | 3.2 -14% |
| Idle Average * (Watt) | 6 | 4.9 18% | 5 17% | 6 -0% | 6 -0% | 5.2 13% |
| Idle Maximum * (Watt) | 10.9 | 6 45% | 9 17% | 12 -10% | 7.6 30% | 6.1 44% |
| Load Average * (Watt) | 51.8 | 29.3 43% | 41 21% | 40 23% | 37 29% | 25.2 51% |
| Witcher 3 ultra * (Watt) | 51.6 | 36.6 29% | 32.6 37% | 36.5 29% | 33.2 36% | 27.7 46% |
| Load Maximum * (Watt) | 55.6 | 63.3 -14% | 50 10% | 63 -13% | 65 -17% | 64.3 -16% |
* ... smaller is better
Power Consumption Witcher 3 / Stresstest
Power Consumption external Monitor
Battery Life — Shorter Runtime
WLAN runtime is significantly shorter than what we recorded on the Core-P version of the ThinkPad X1 Carbon G10 when both are set to similar Balanced power profile and 150-nit brightness conditions. We even repeated the test just to make sure, but results would not improve on our test unit. Expect just 6.5 hours of real-world browsing usage compared to over 10 hours on the Core-P SKU. The shorter runtime aligns with our overall higher power consumption readings above.
Charging from empty to full capacity is slower than expected at around 2.5 hours.
| Lenovo ThinkPad X1 Carbon G10 Core i7-1265U i7-1265U, Iris Xe G7 96EUs, 57 Wh | Lenovo ThinkPad X1 Carbon G10 21CC001RGE i5-1250P, Iris Xe G7 80EUs, 57 Wh | HP EliteBook 845 G9 6F6H9EA R5 PRO 6650U, Radeon 660M, 51 Wh | LG Gram 14Z90Q i5-1240P, Iris Xe G7 80EUs, 72 Wh | Dell Latitude 7420 JW6MH i5-1145G7, Iris Xe G7 80EUs, 63 Wh | Asus ExpertBook B1 B1400CEAE, i5-1135G7 i5-1135G7, Iris Xe G7 80EUs, 42 Wh | |
|---|---|---|---|---|---|---|
| Battery runtime | 55% | 83% | 80% | 114% | 5% | |
| WiFi v1.3 (h) | 6.6 | 10.2 55% | 12.1 83% | 11.9 80% | 14.1 114% | 6.9 5% |
| H.264 (h) | 10.9 | |||||
| Load (h) | 2.4 | 2.8 | 2.6 | |||
| Reader / Idle (h) | 28.9 | 23.5 |
Pros
Cons
Verdict — Core i7 U beats Core i5 P
The Core i7-1265U and Core i5-1250P configurations are each retailing for about $1900 USD when equipped with similar storage and RAM capacities. If you're looking for faster overall CPU and GPU performance, then the Core i7-1265U option is recommended. Its advantages aren't minor either as the integrated GPU alone can be up to 40 percent faster while the CPU throttles much less over time.
The Core i7-1265U version of the ThinkPad X1 Carbon G10 is faster than the Core i5-1250P version by noticeable margins, but it comes at the cost of a shorter battery life.
For longer battery life, lower power consumption, and potentially quieter fan noise, however, the Core i5-1250P option would be the way to go. The system can last for a couple of hours longer than the Core i7-1265U option which some users might appreciate. Otherwise, you'll be getting more bang for the buck by going with the Core i7-1265U option if battery life is less of a concern.
Price and Availability
Our exact configuration is currently shipping on Amazon for just under $1900 USD. Lenovo is not offering the Core i7-1265U configuration through its official website as of this writing.
Lenovo ThinkPad X1 Carbon G10 Core i7-1265U
- 12/14/2022 v7 (old)
Allen Ngo
Price comparison
