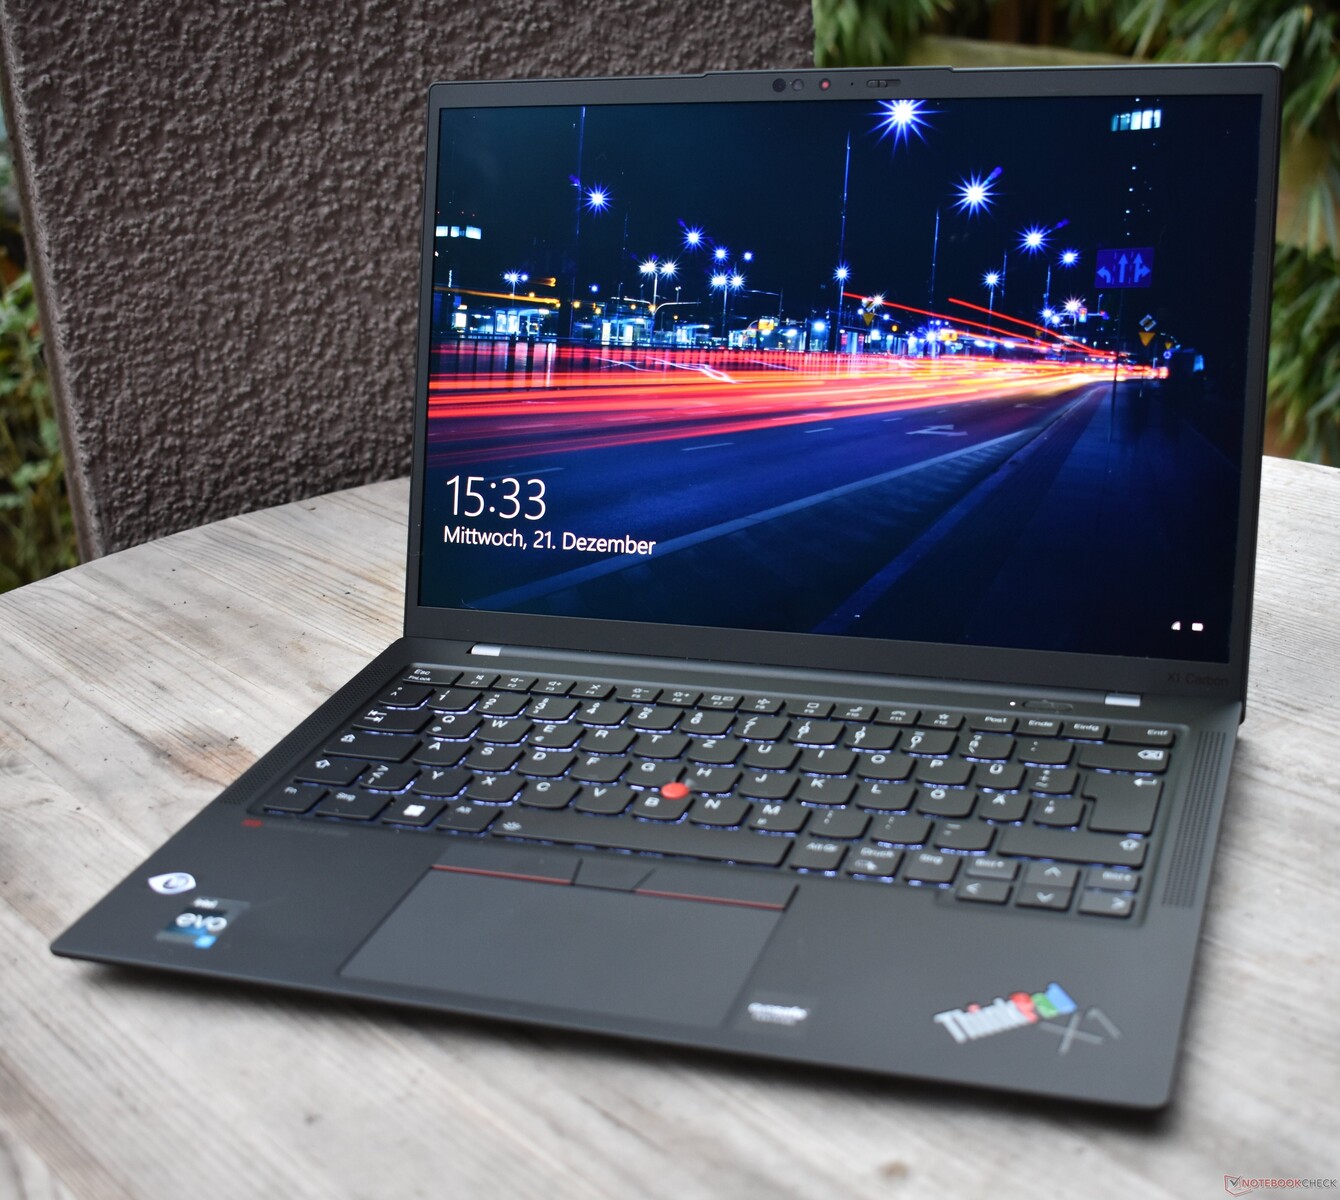
Lenovo ThinkPad X1 Carbon G10 30th Anniversary Laptop review: OLED edition with stamina issues
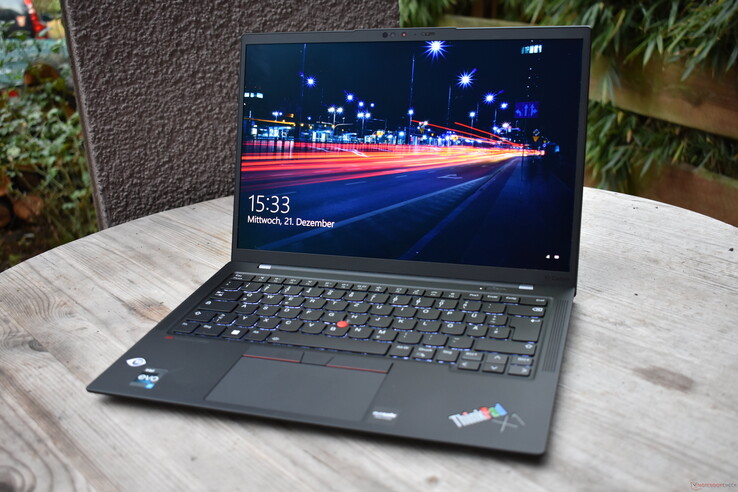
30 years is an eternity in the tech business and also a long time in a human lifespan. Lenovo is celebrating this milestone with a special model: The Lenovo ThinkPad X1 Carbon G10 30th Anniversary Edition, which is the subject of today's review.
Of course, this is not the first ThinkPad X1 Carbon Gen 10 to come under our magnifying glass, which is why this is a test update. In terms of specs, the model at hand is particularly interesting because of the OLED screen. It will also be exciting to see whether Lenovo has improved the performance of the Intel Alder Lake P28 CPUs since the first review of the ThinkPad X1 Carbon G10, then with an i5 processor.
Possible Competitors in Comparison
Rating | Date | Model | Weight | Height | Size | Resolution | Price |
|---|---|---|---|---|---|---|---|
| 88.9 % v7 (old) | 12 / 2022 | Lenovo ThinkPad X1 Carbon G10 21CB00DCGE i7-1260P, Iris Xe G7 96EUs | 1.2 kg | 15.36 mm | 14.00" | 2880x1800 | |
| 90.2 % v7 (old) | 06 / 2022 | Lenovo ThinkPad X1 Carbon G10 21CC001RGE i5-1250P, Iris Xe G7 80EUs | 1.2 kg | 15.36 mm | 14.00" | 1920x1200 | |
| 90.3 % v7 (old) | 05 / 2021 | Lenovo ThinkPad X1 Carbon G9-20XWCTO1WW i7-1165G7, Iris Xe G7 96EUs | 1.2 kg | 14.9 mm | 14.00" | 3840x2400 | |
| 88.8 % v7 (old) | 10 / 2022 | Lenovo ThinkPad Z13 G1-21D20016GE R7 PRO 6860Z, Radeon 680M | 1.3 kg | 14 mm | 13.30" | 2880x1800 | |
| 91 % v7 (old) | 08 / 2022 | HP Elite Dragonfly G3 i7-1265U, Iris Xe G7 96EUs | 1.2 kg | 16.3 mm | 13.50" | 1920x1280 | |
| 89.8 % v7 (old) | 08 / 2022 | Dell Latitude 9430 2-in-1 i7-1265U, Iris Xe G7 96EUs | 1.5 kg | 13.94 mm | 14.00" | 2560x1600 |
Differences to the regular model
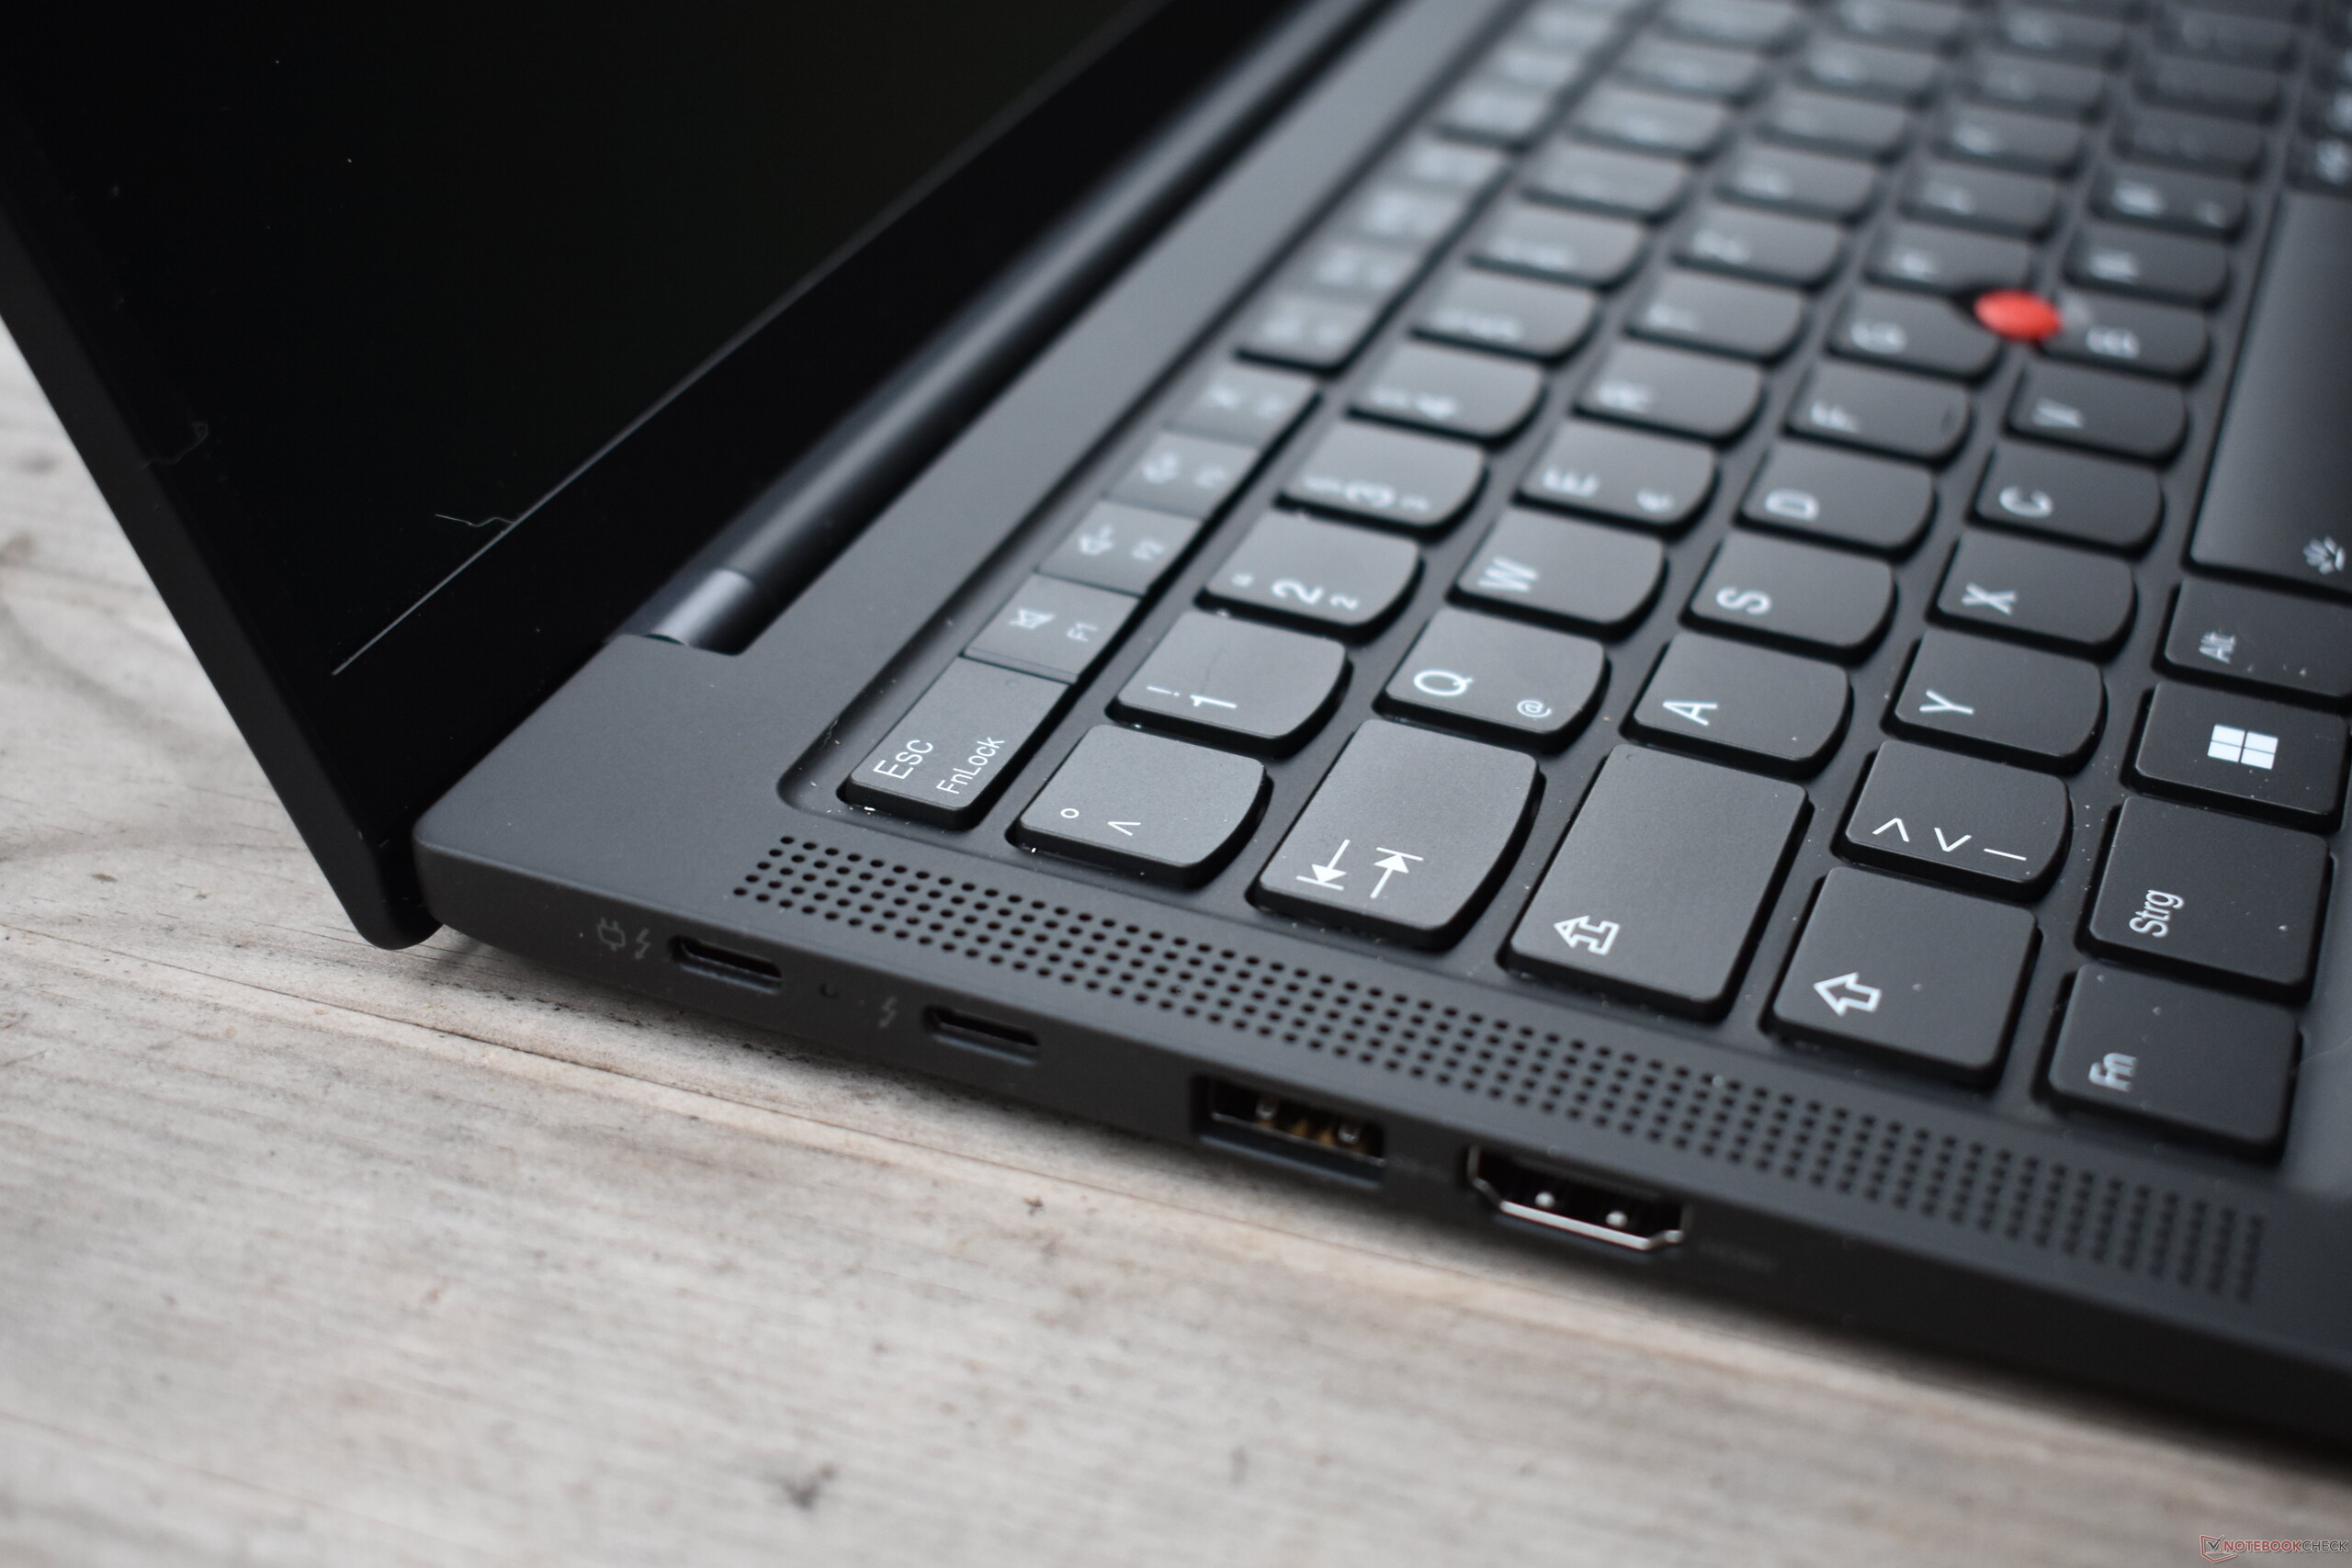
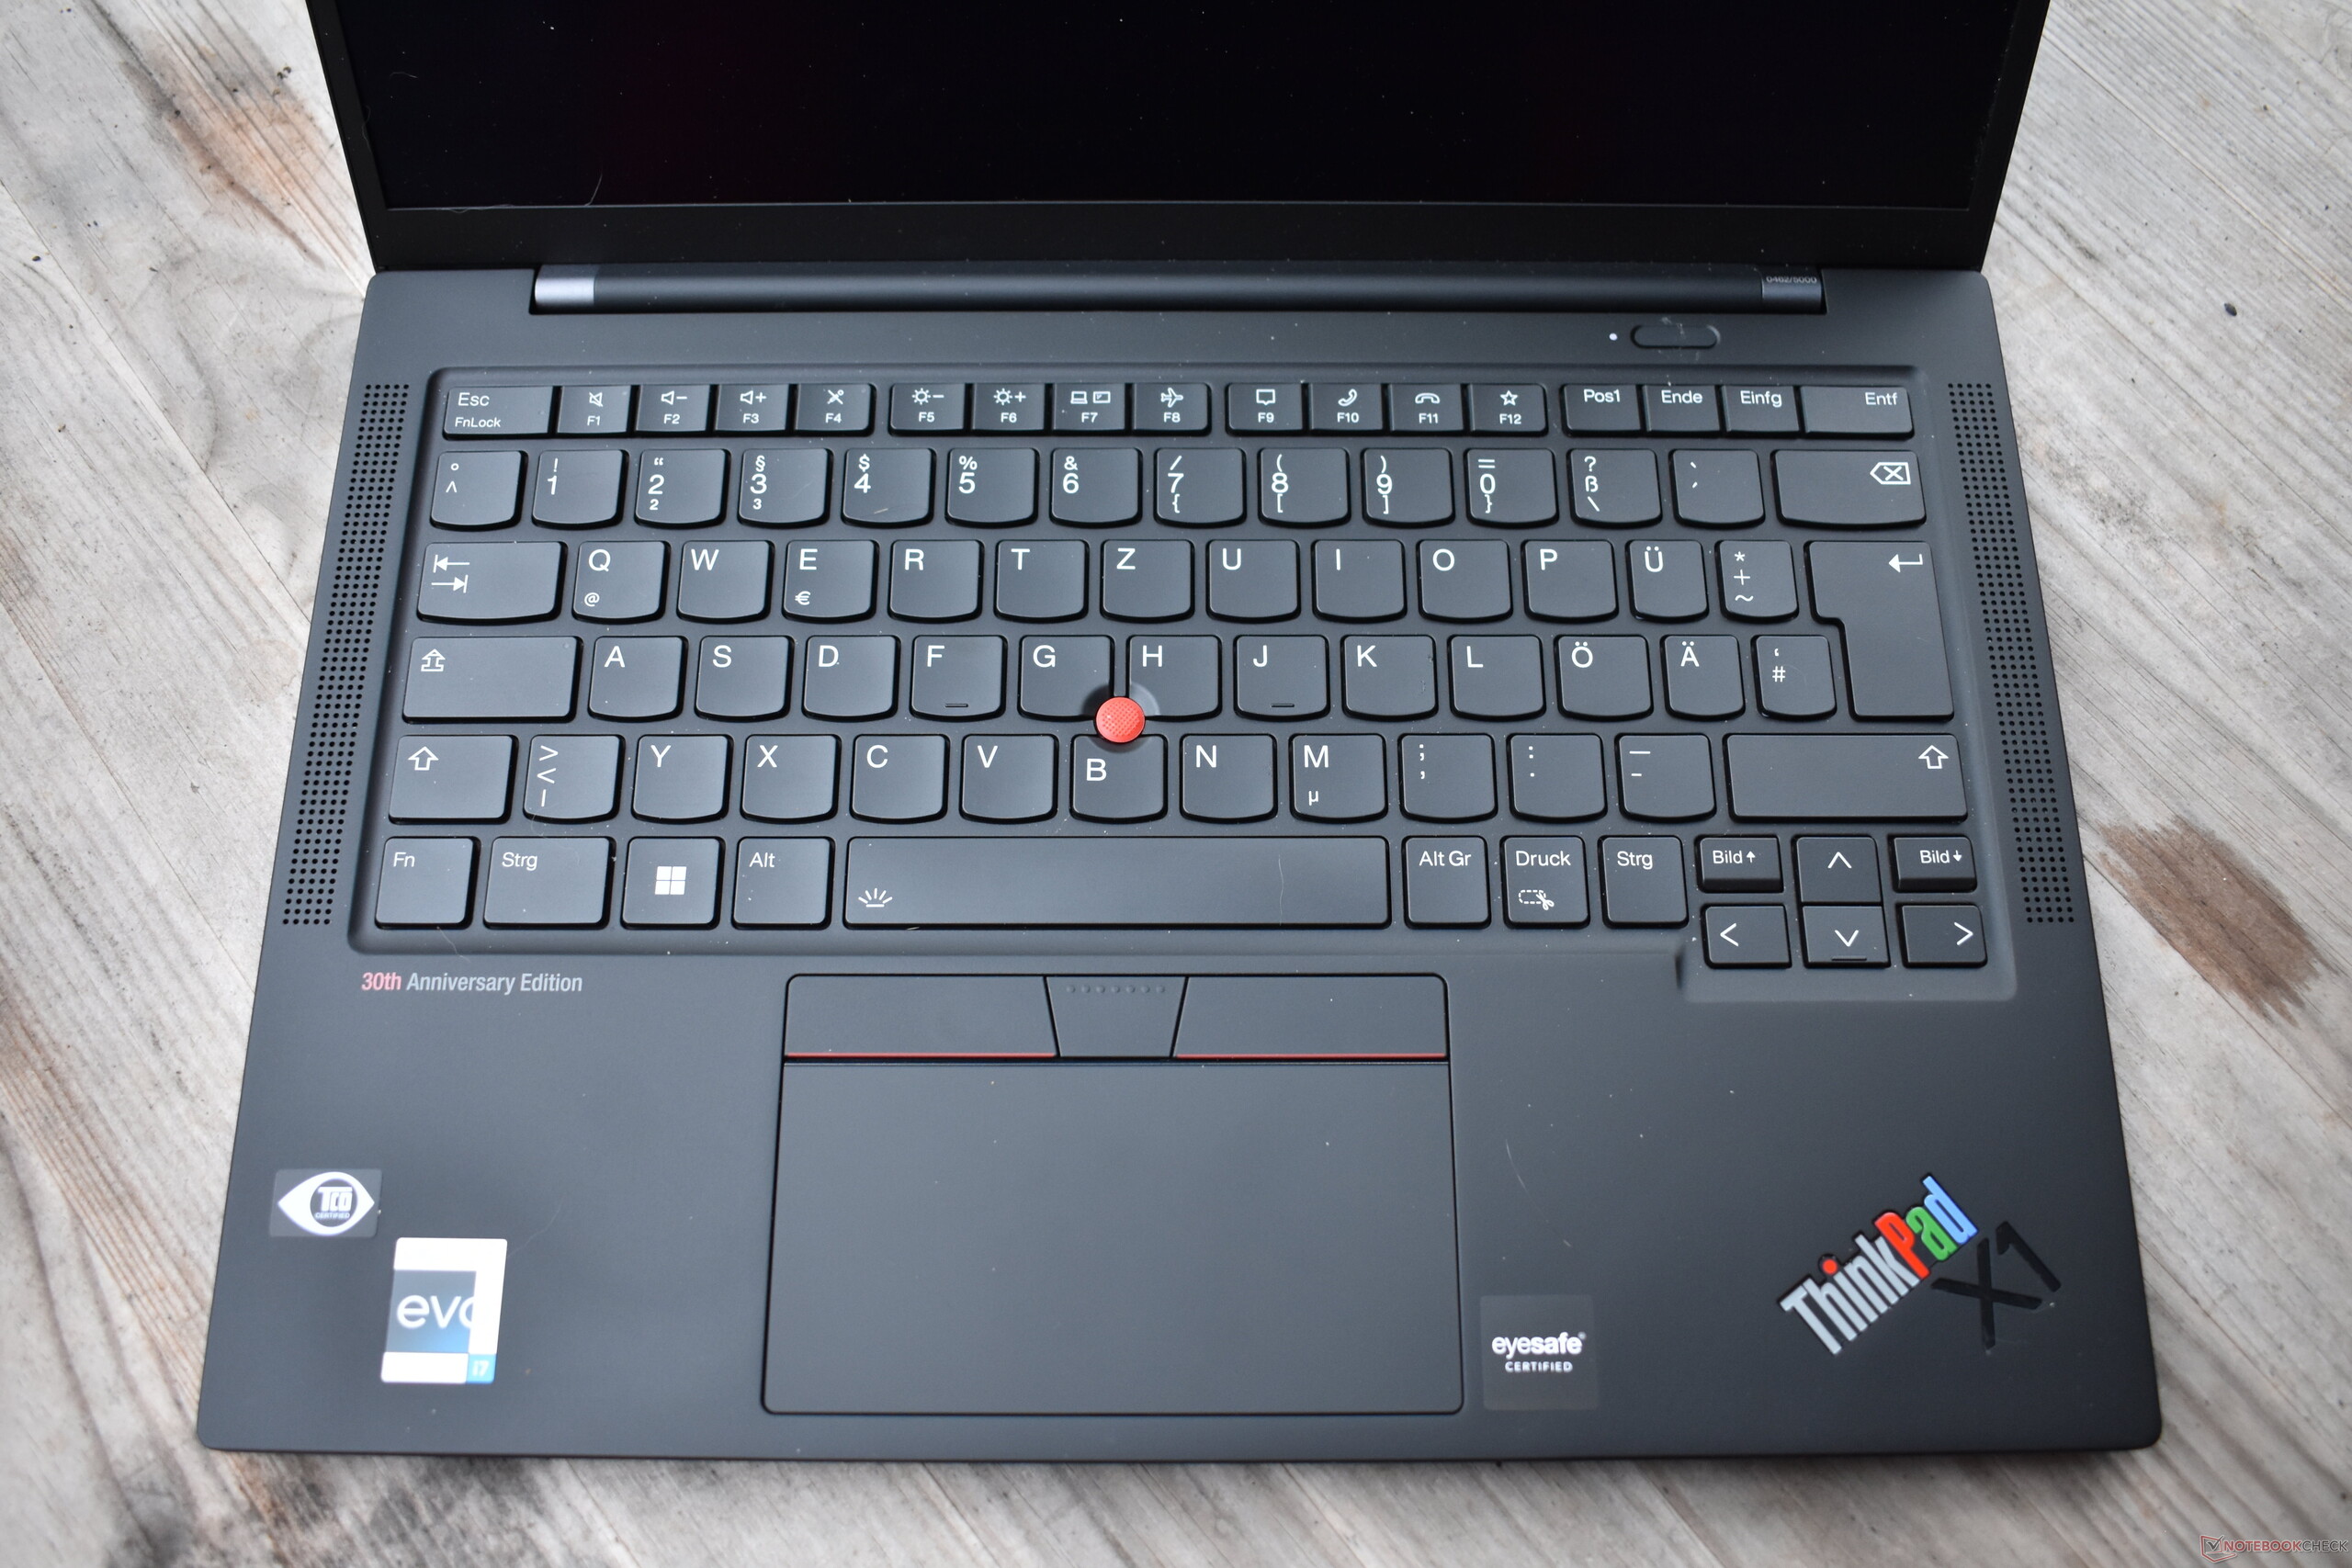
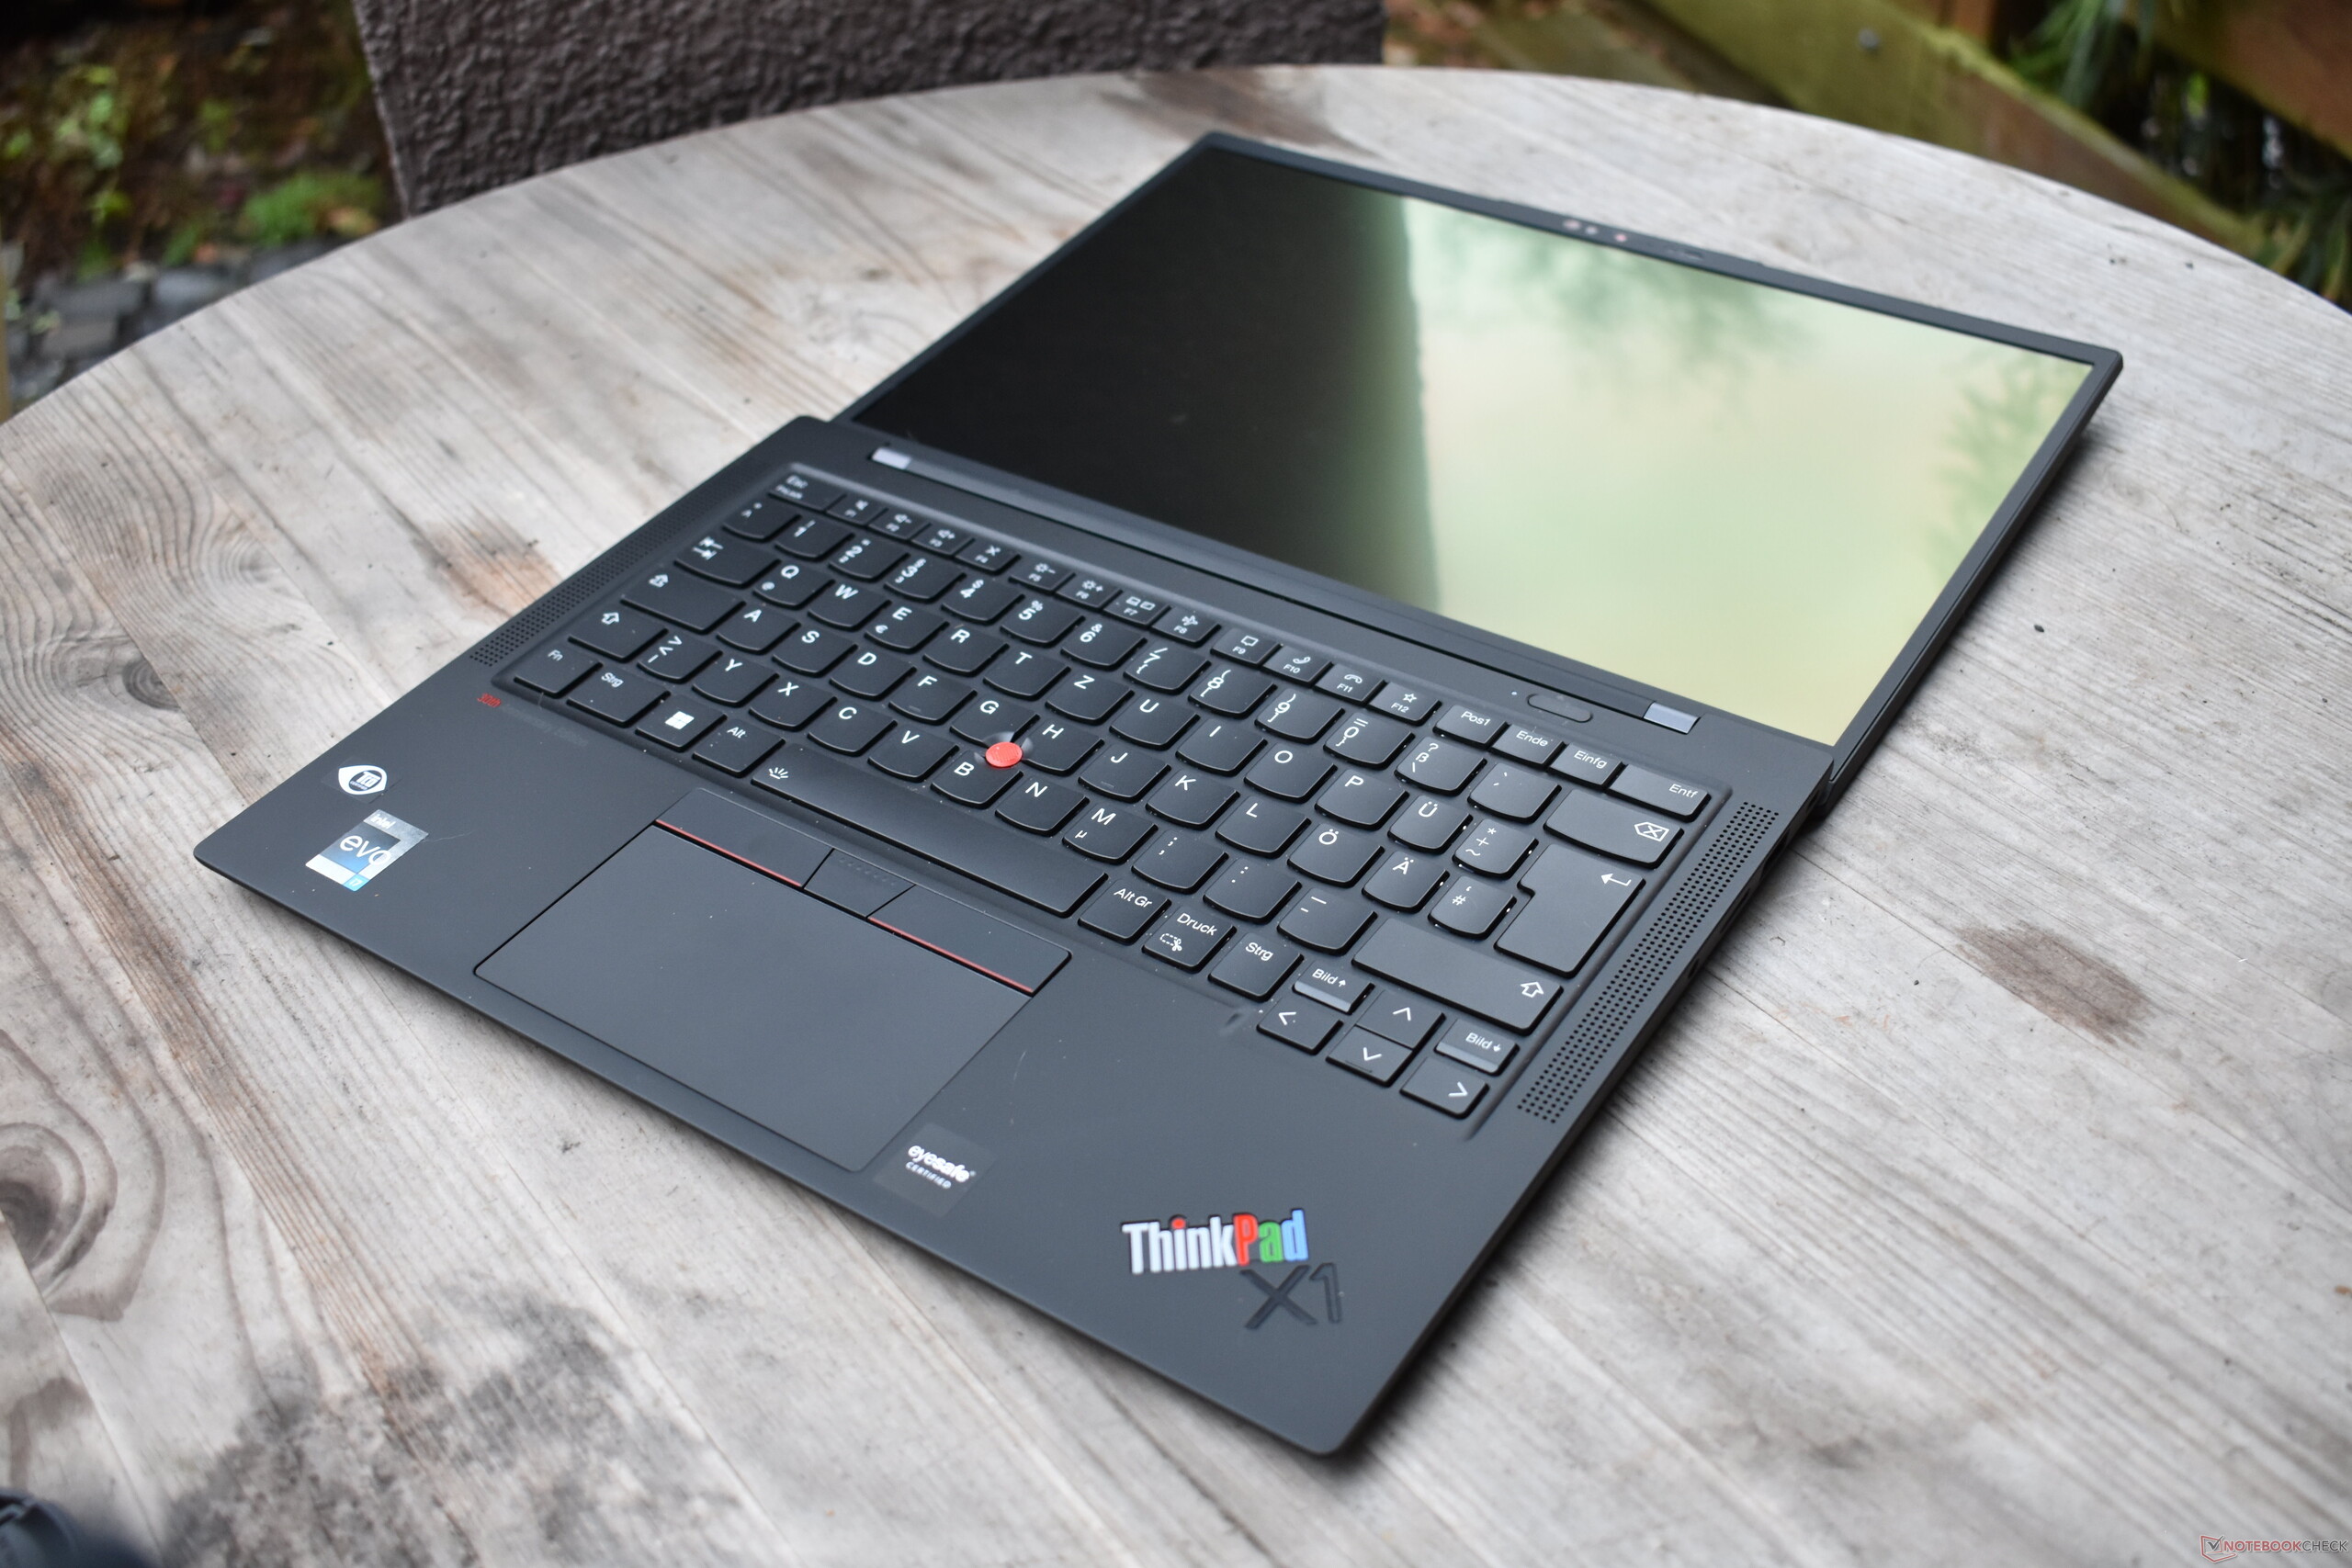
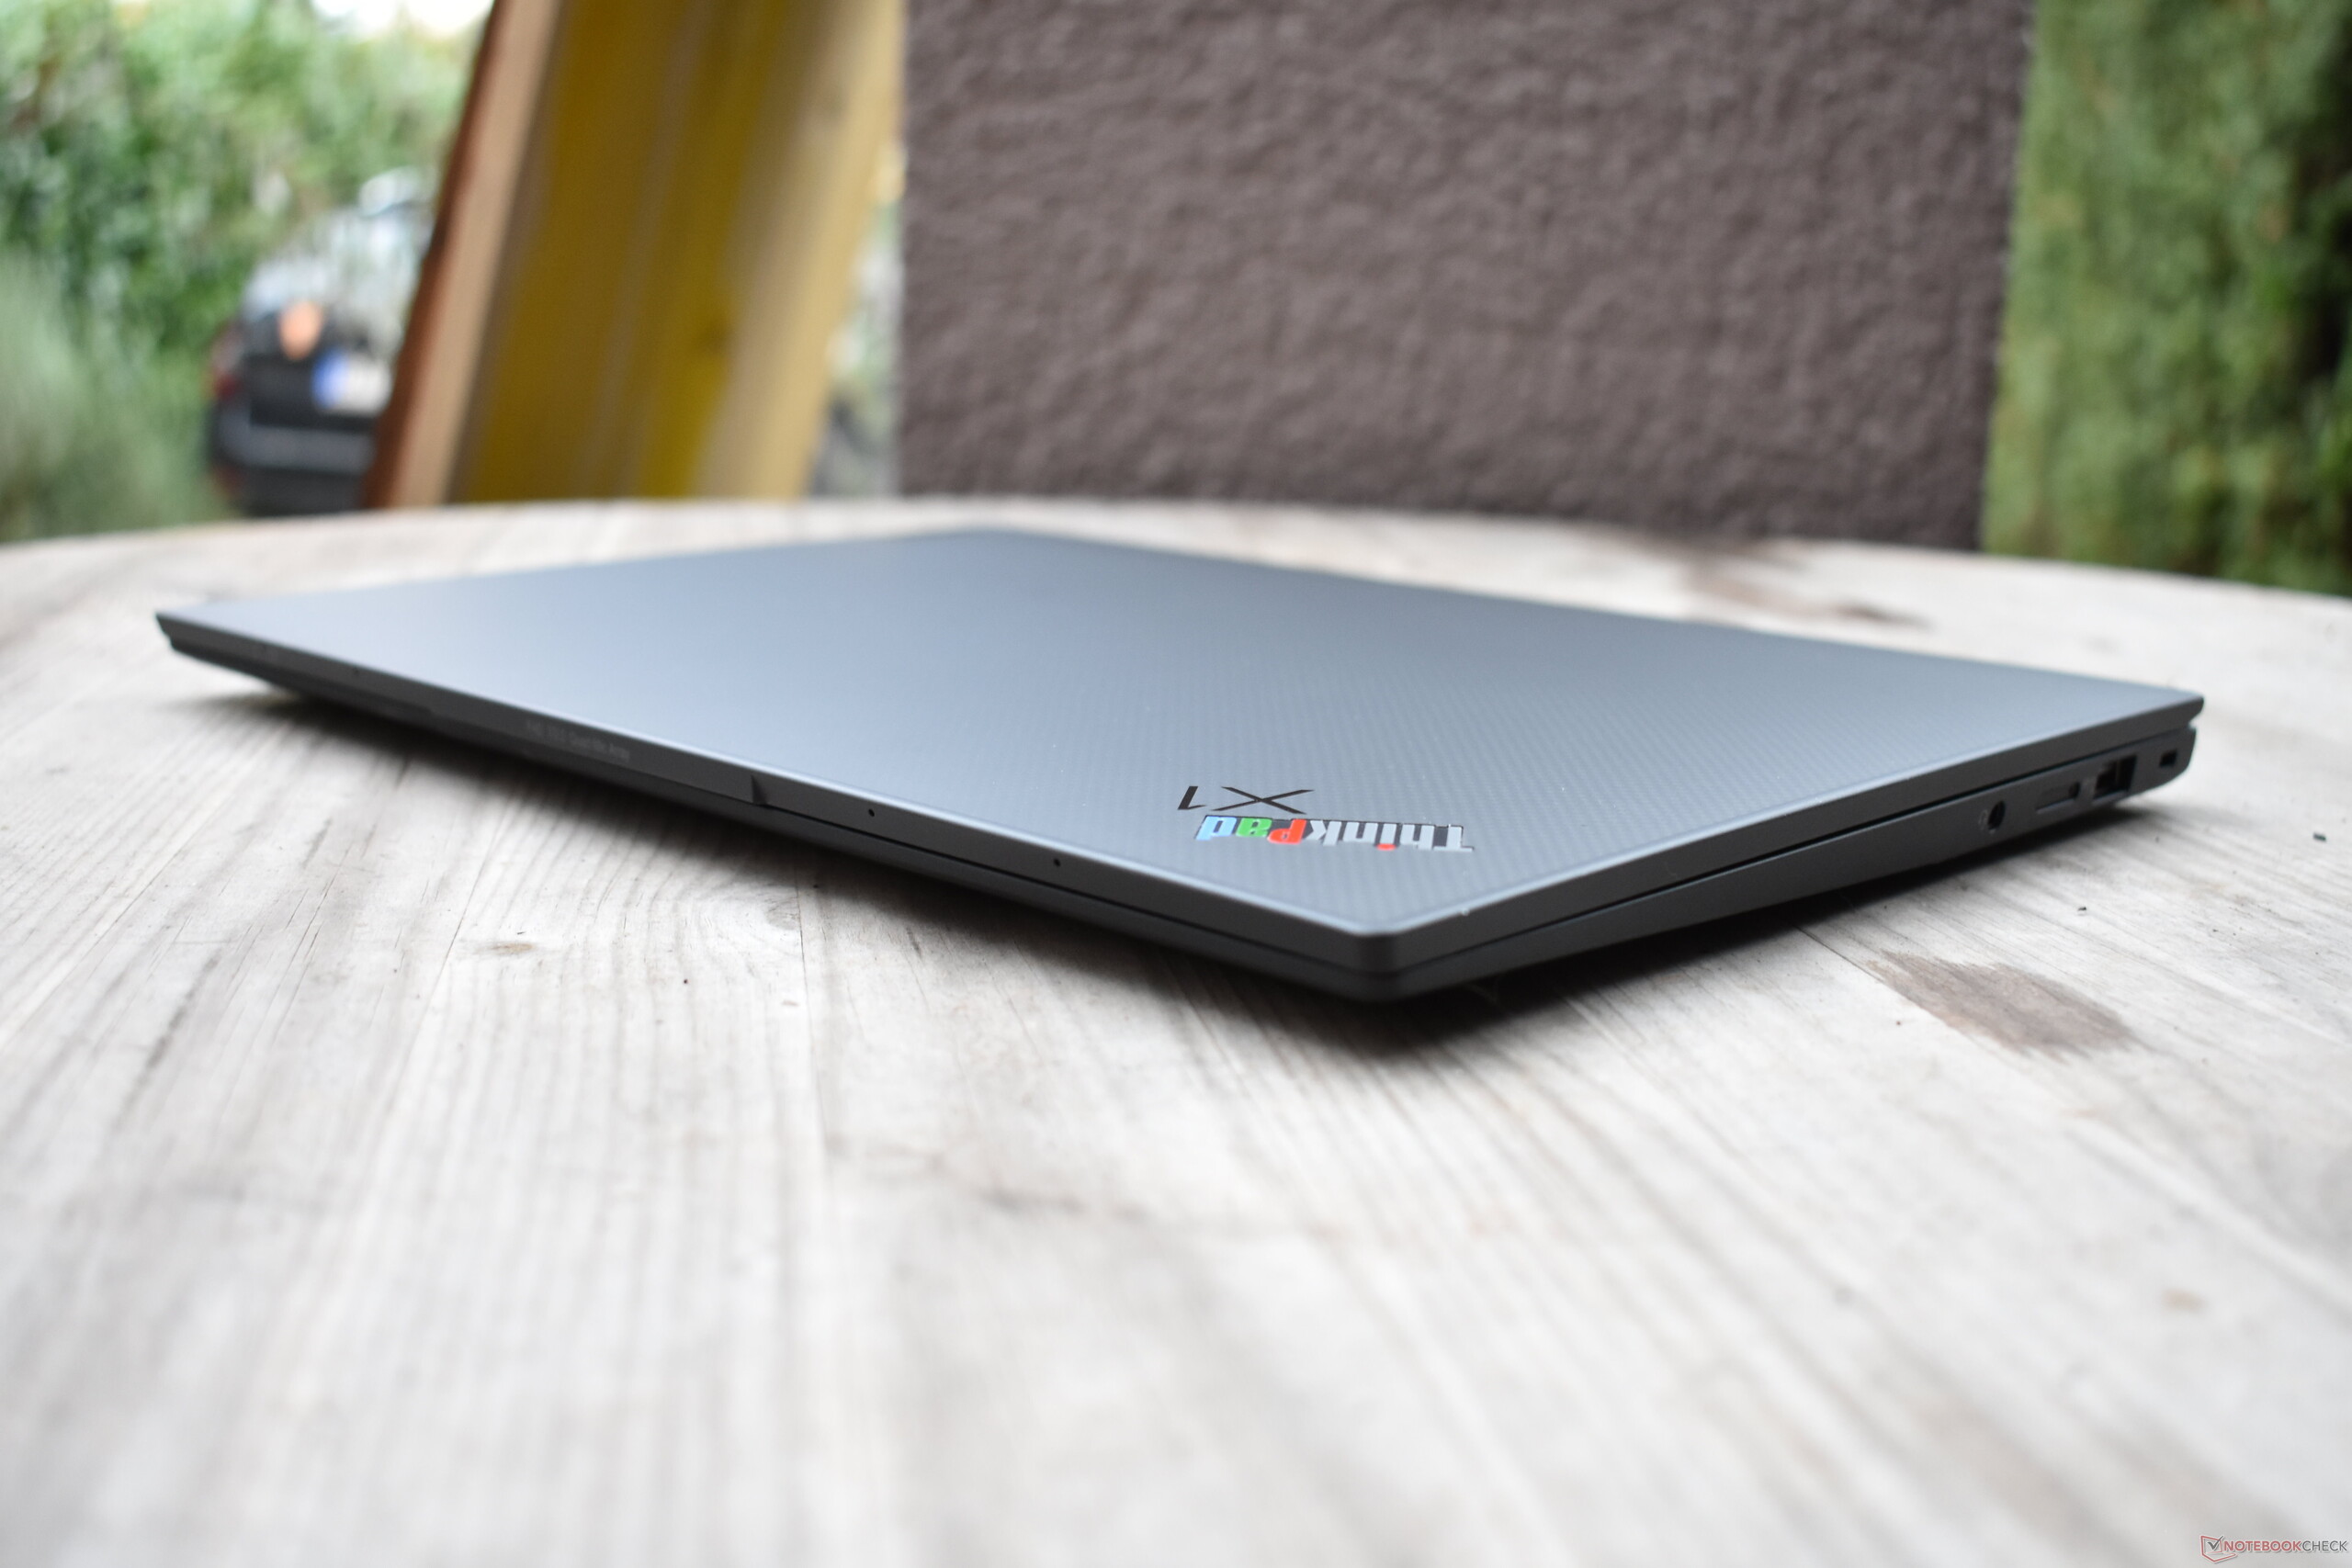
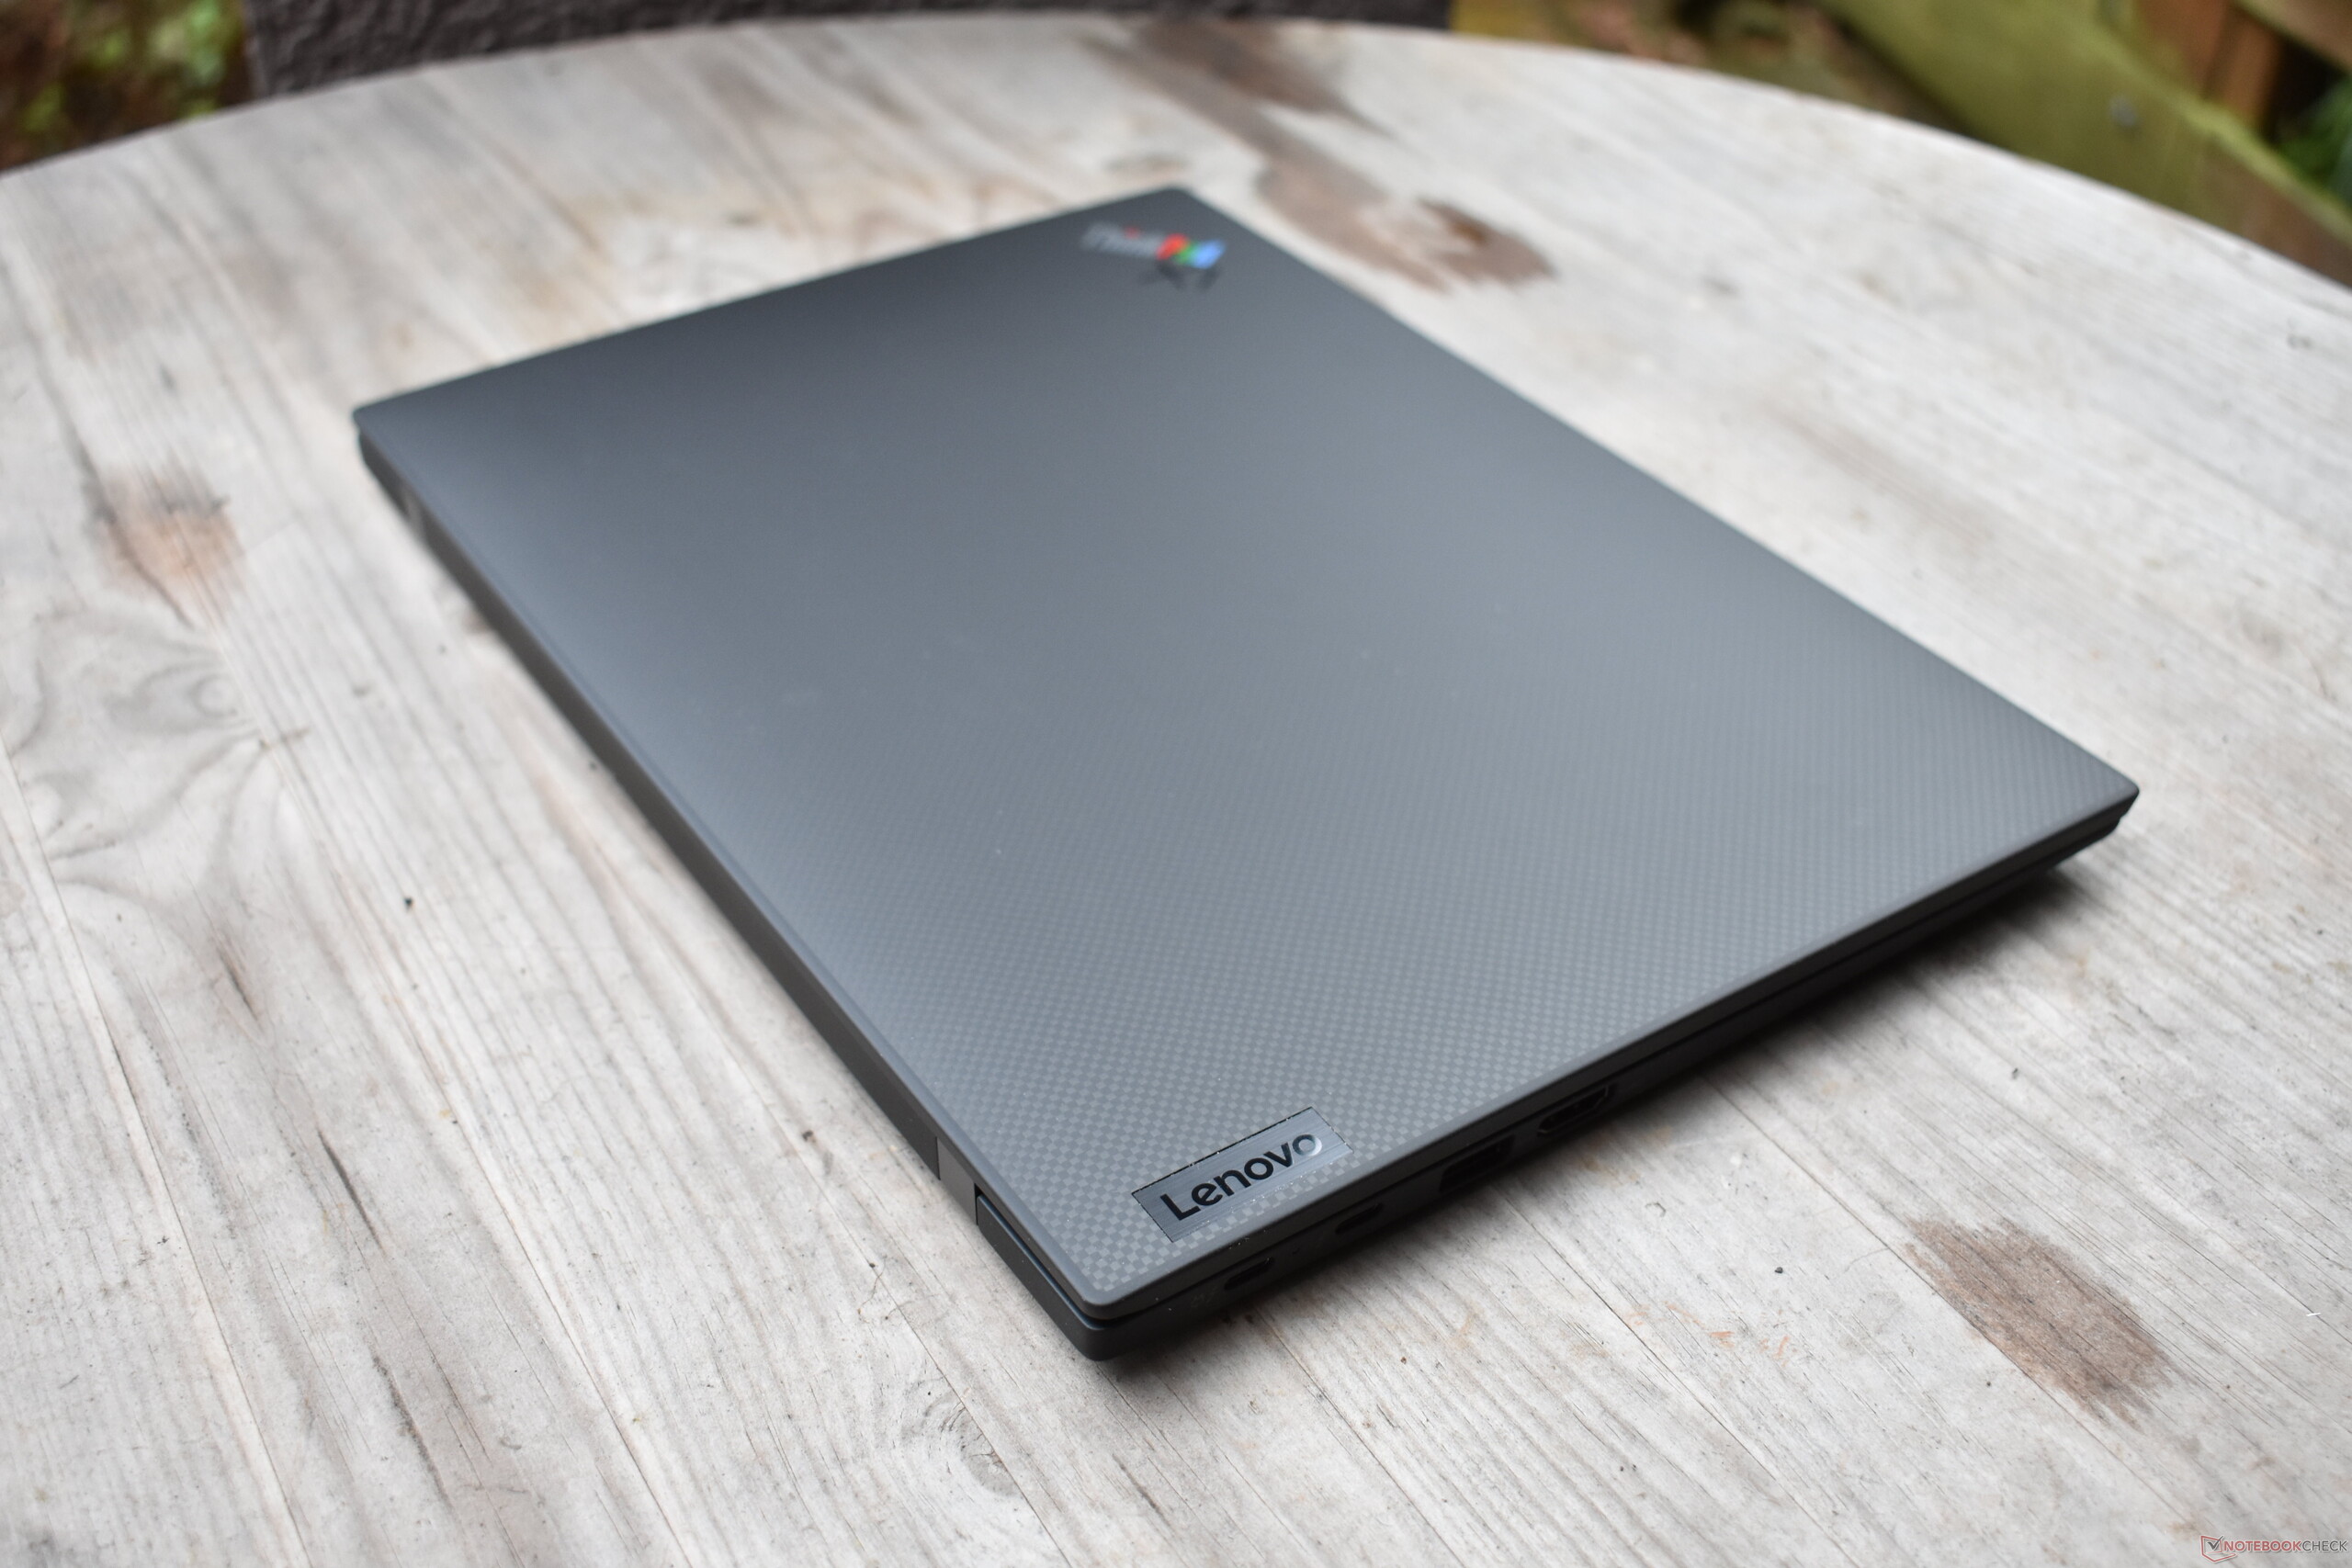
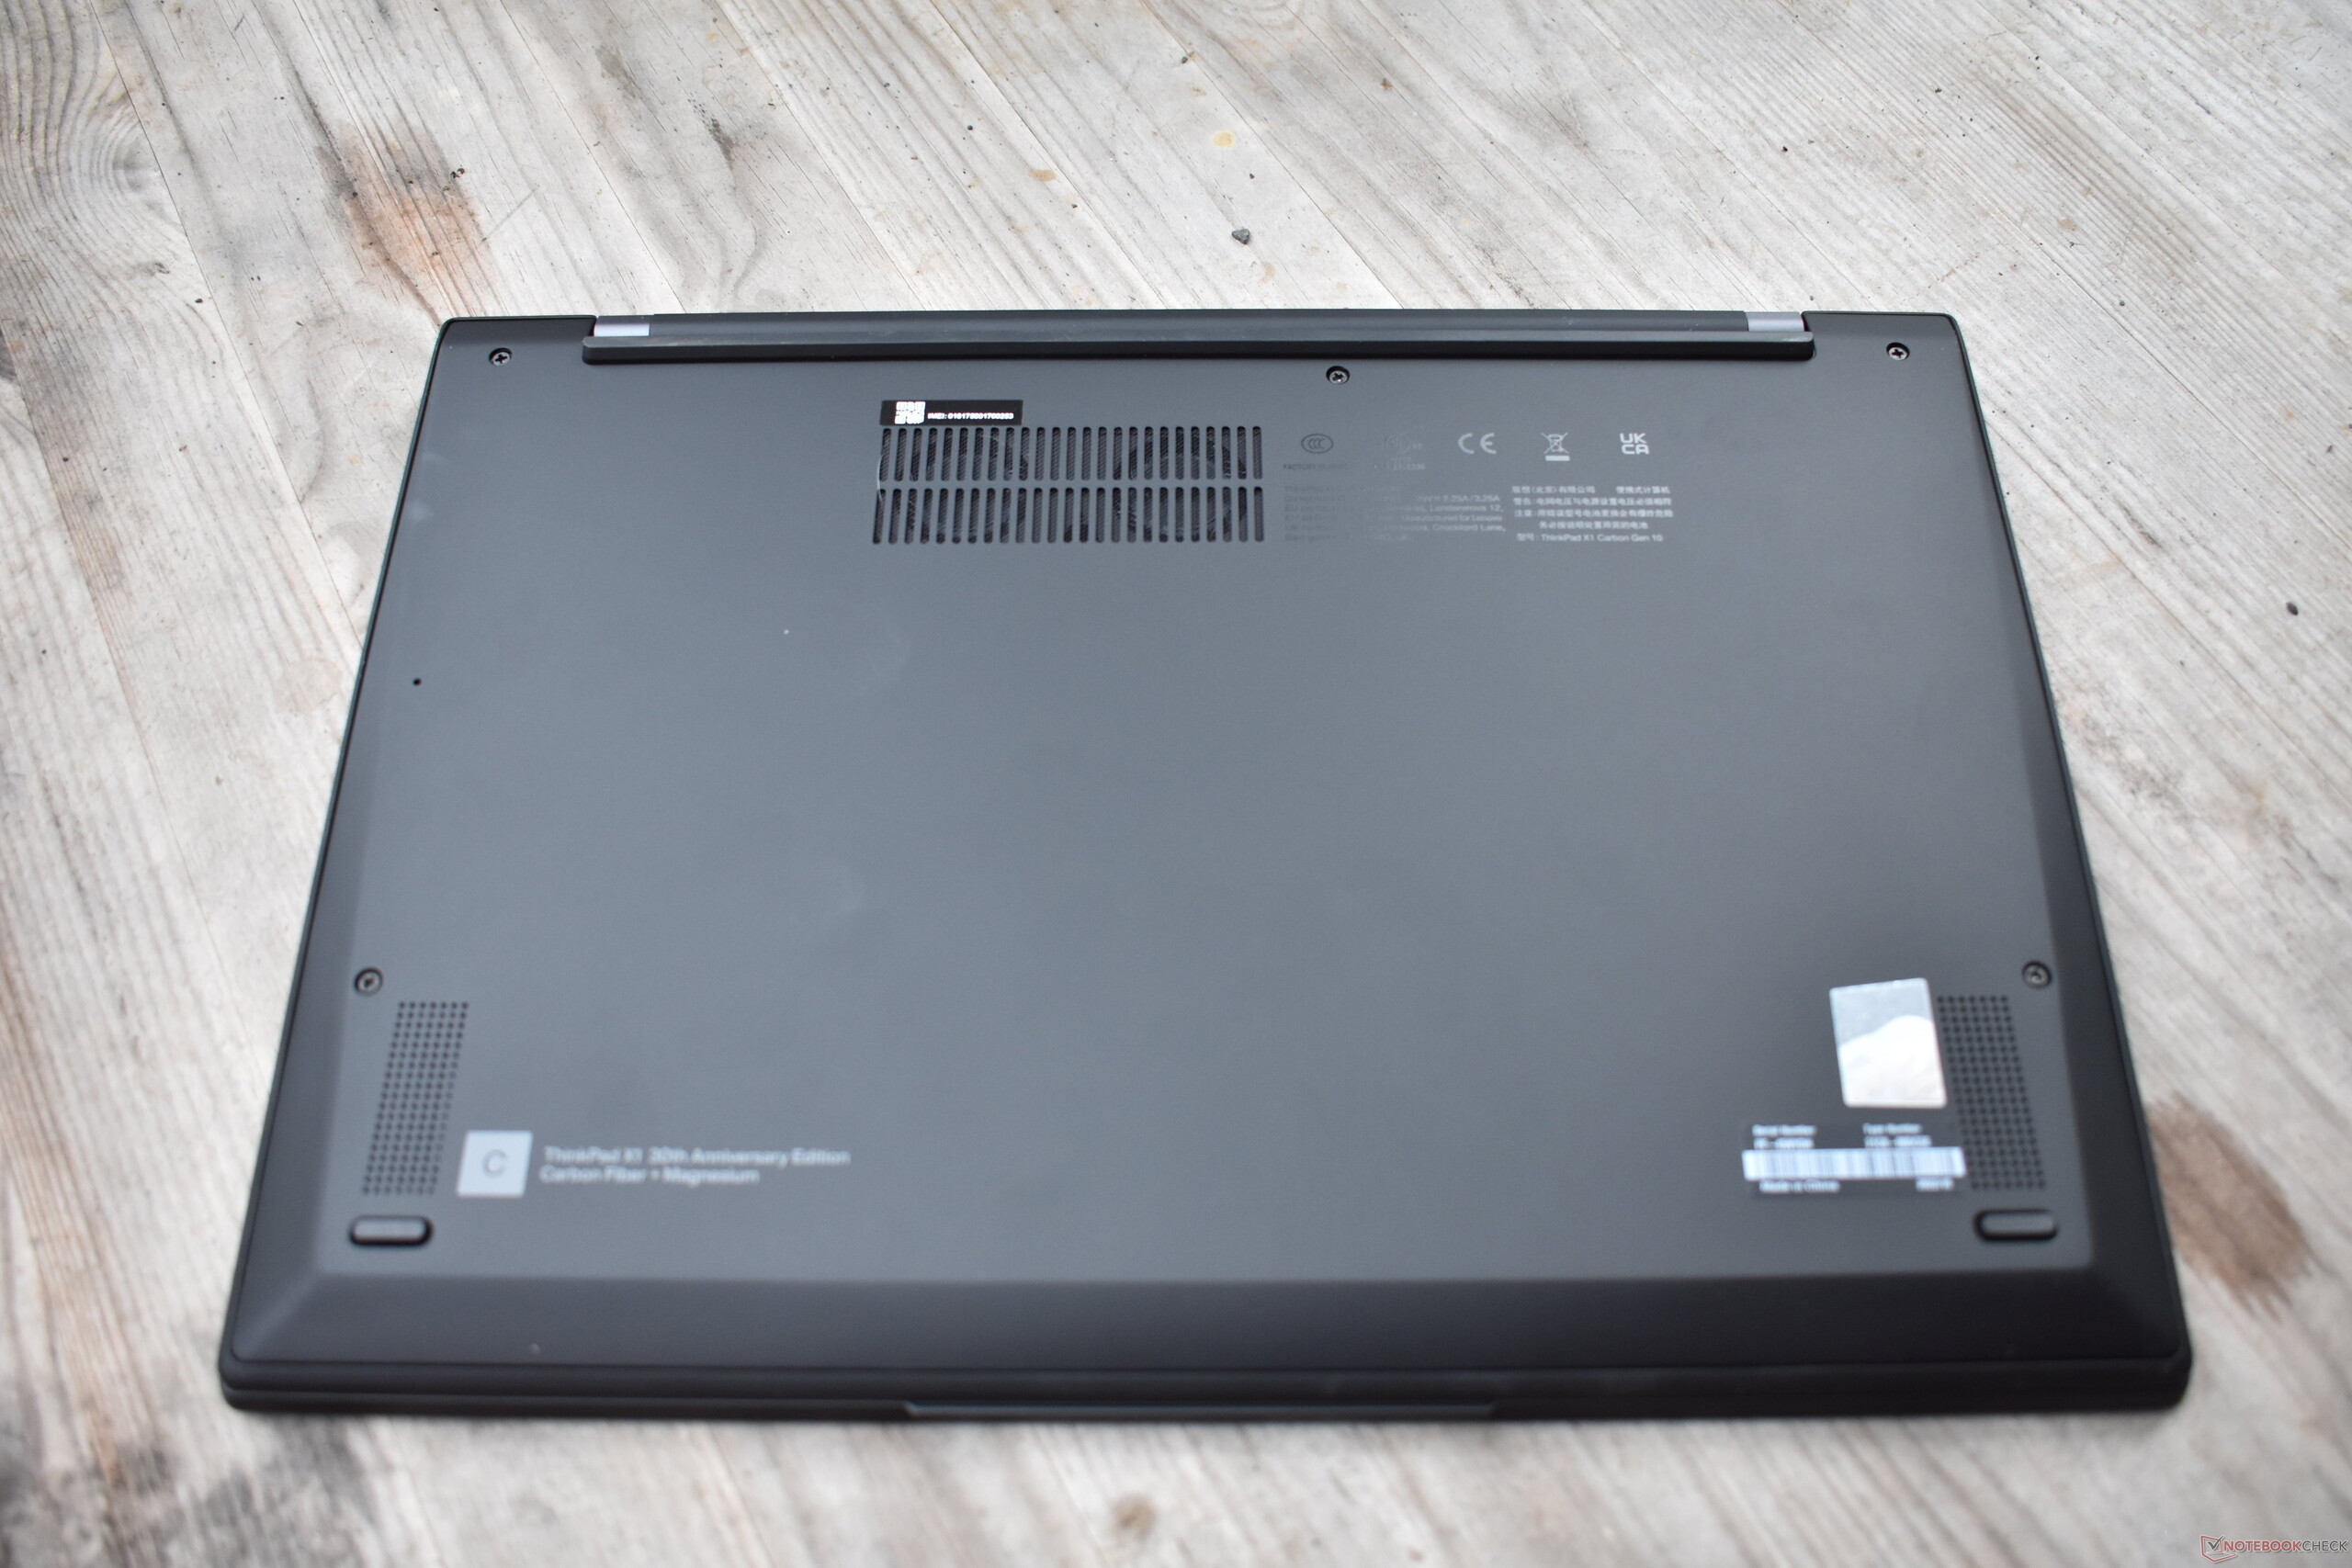
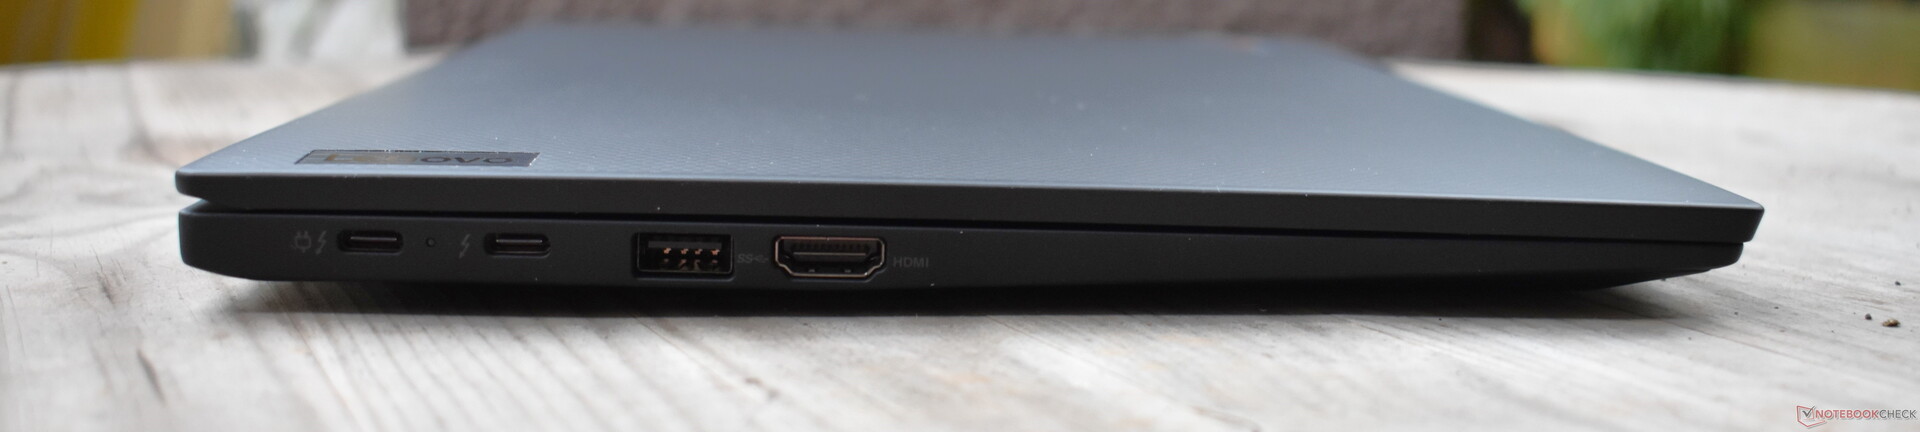
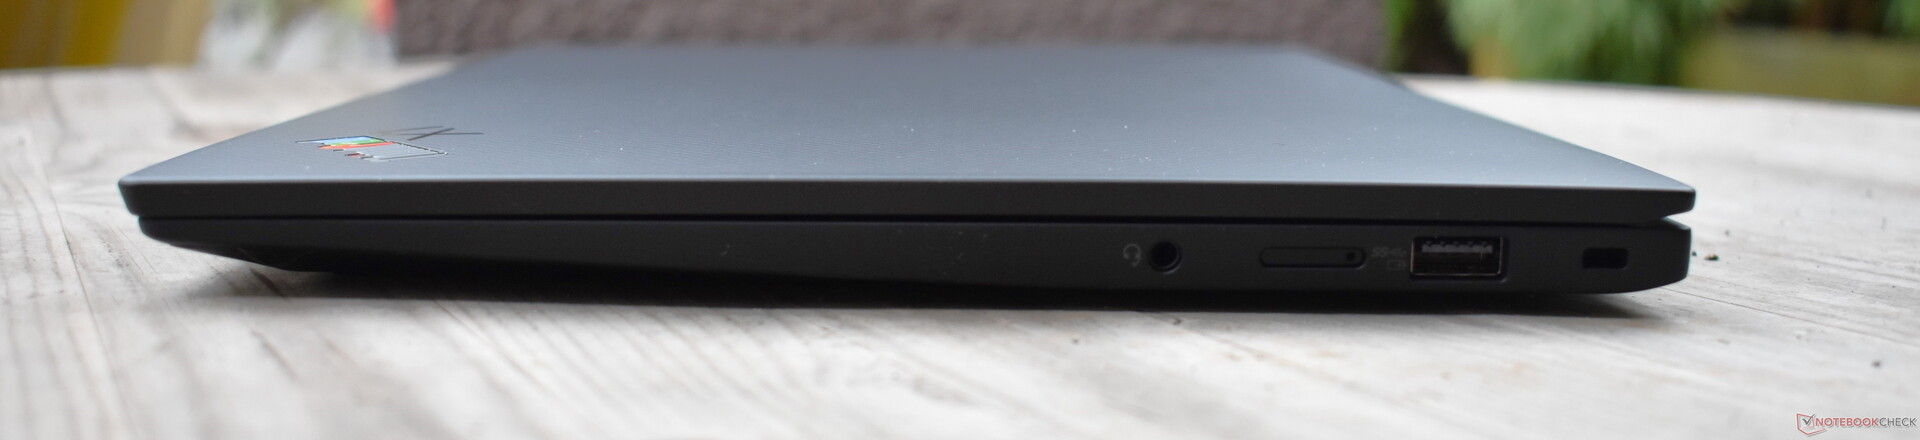
Unlike the ThinkPad 25 five years ago, Lenovo forgoes major changes to the hardware of the X1 Carbon Gen 10 30th Anniversary Edition. Instead, there are some cosmetic modifications, such as a "30th Anniversary Edition" logo on the palm rest, the laser-etched unit number on the hinge (there are 5,000 models in total), and the special anniversary ThinkPad logo with the "Pad" part in the IBM RGB Tricolor color scheme - inspired by the old IBM ThinkPad logo. Additionally, the scope of delivery includes a special edition packaging and three extra TrackPoint caps, with each one being red, green and blue. Otherwise, it is a regular ThinkPad X1 Carbon G10. Lenovo does not attempt to revive the classic ThinkPad keyboard with seven rows this time.


No changes to the equipment have been made, and the WiFi and webcam results are virtually identical to the first review of the ThinkPad X1 Carbon G10. Exception: The version tested here runs Windows 10, which is why we were unable to test WiFi 6E.


OLED display in the X1 Carbon is almost matte

The centerpiece of this version of the Lenovo ThinkPad X1 Carbon Gen 10 is without question the screen. As with almost every ThinkPad, there are various options, which we also listed in our first review of the X1 Carbon G10. Today's review unit houses the 14-inch 2.8K display (2,880 x 1,800) - the panel (model number ATNA40YK01-1) comes from Samsung, and is an OLED display.
According to Lenovo, the screen is reportedly capable of displaying SDR content at 400 cd/m² and HDR at 500 cd/m². While we did not measure the latter, we can definitely confirm the SDR value. This makes the screen darker than the 4K UHD display of the X1 Carbon G9 and the 2.5K LCD of the Dell Latitude 9430. But in return, the OLED display has other advantages: The brightness is very evenly distributed, there is no backlight bleeding, and the response times are significantly better than those of the IPS rivals. A pity, however, that Lenovo has left the refresh rate at 60 Hz, as 90 Hz would have been a good step forward.
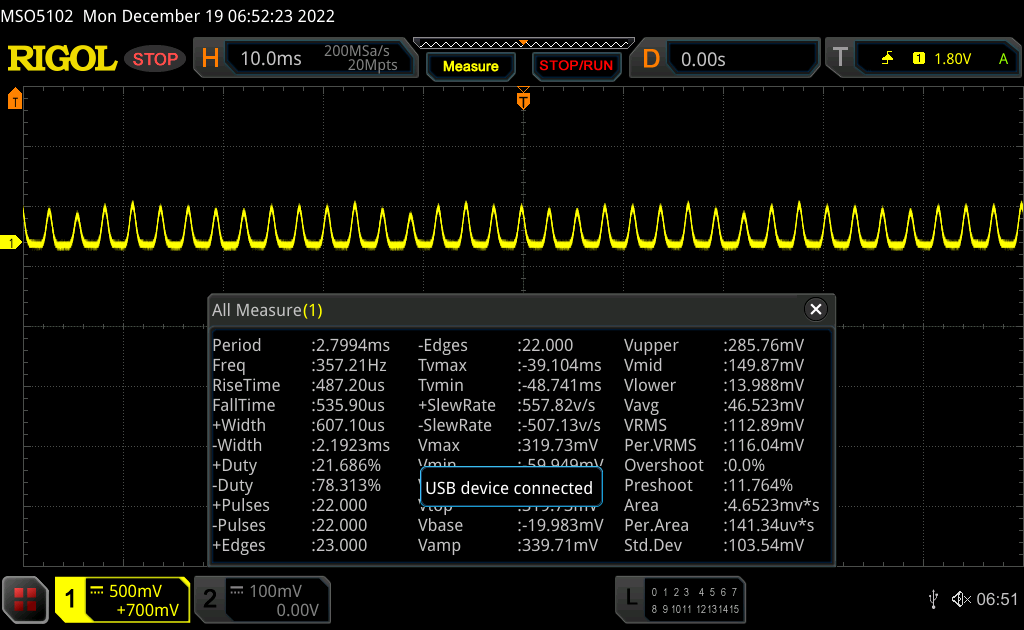
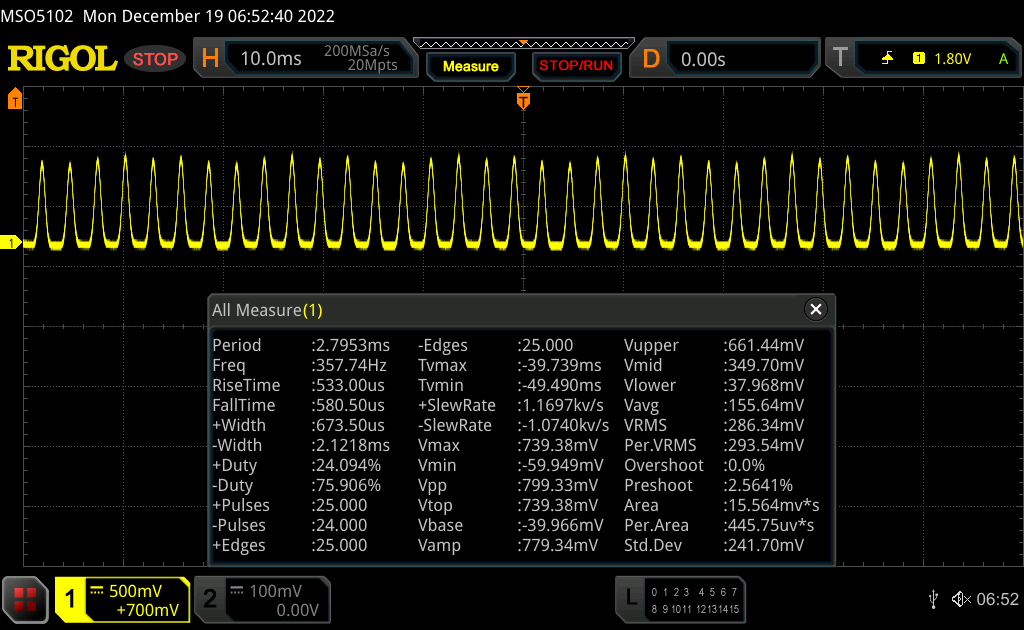
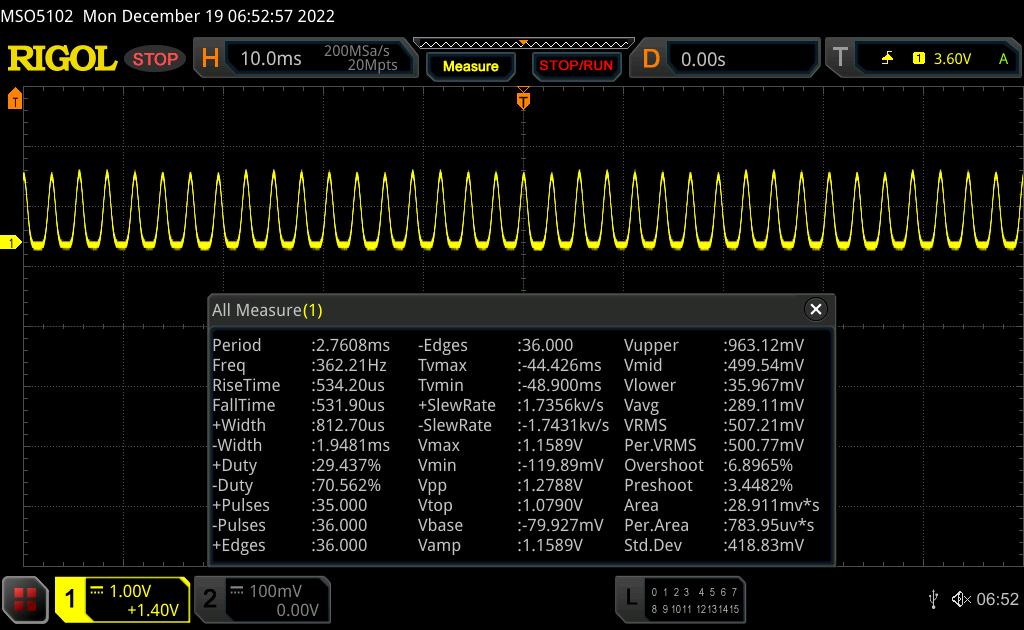
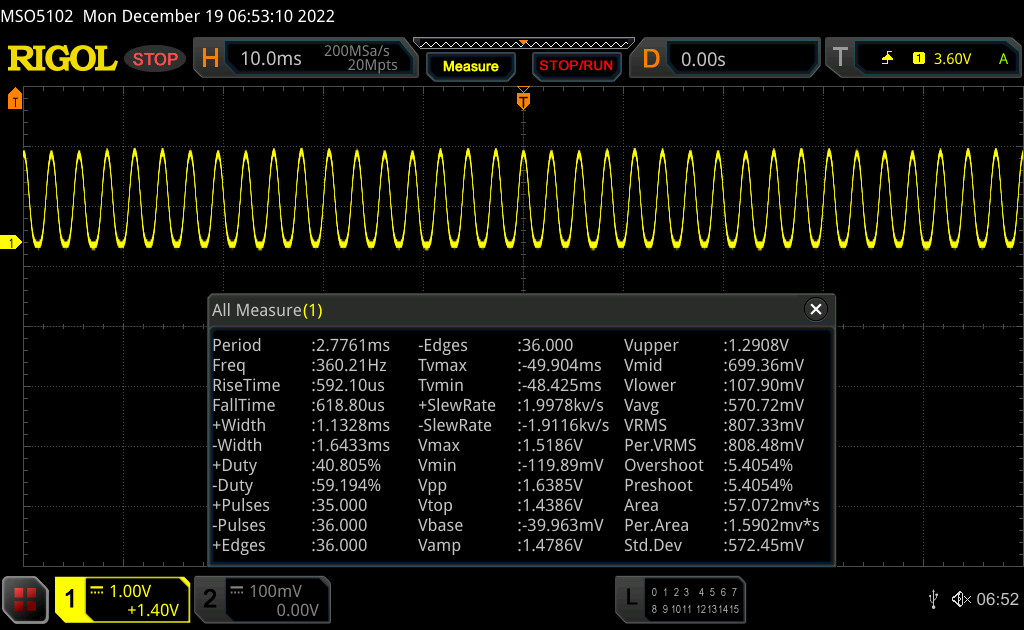
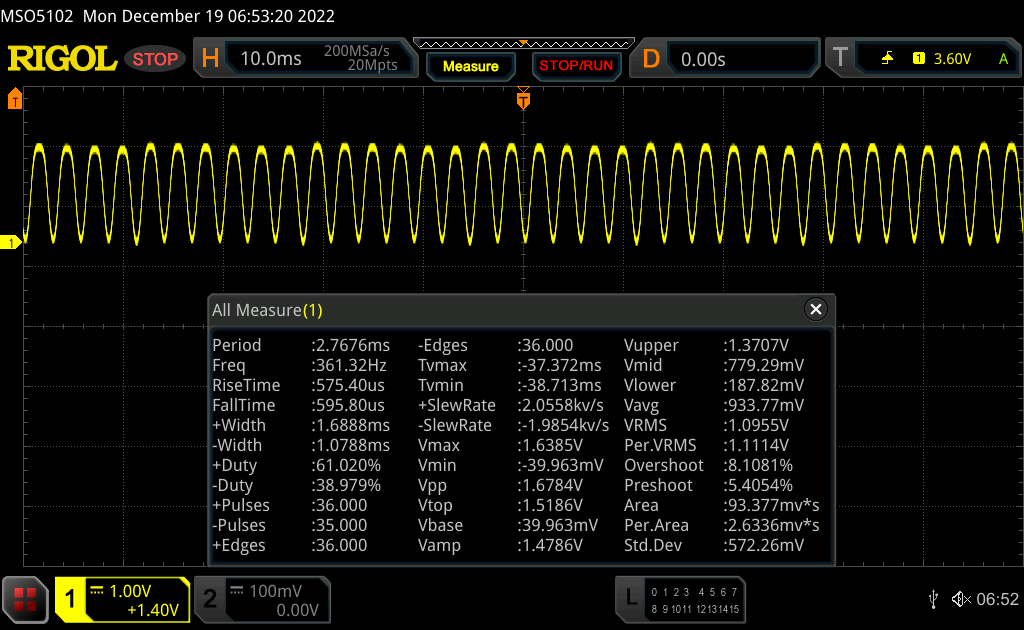
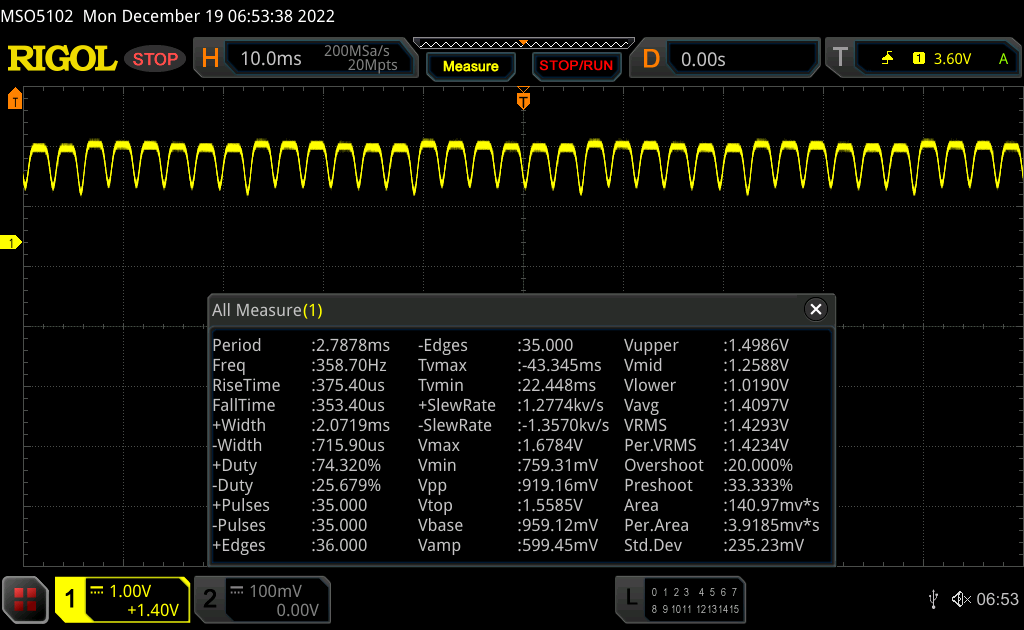
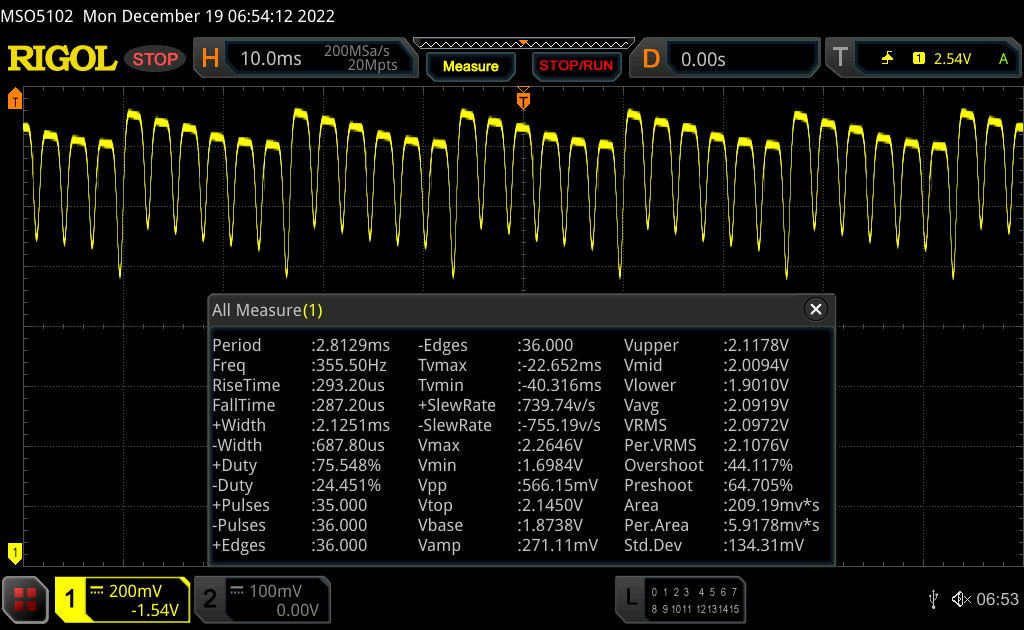
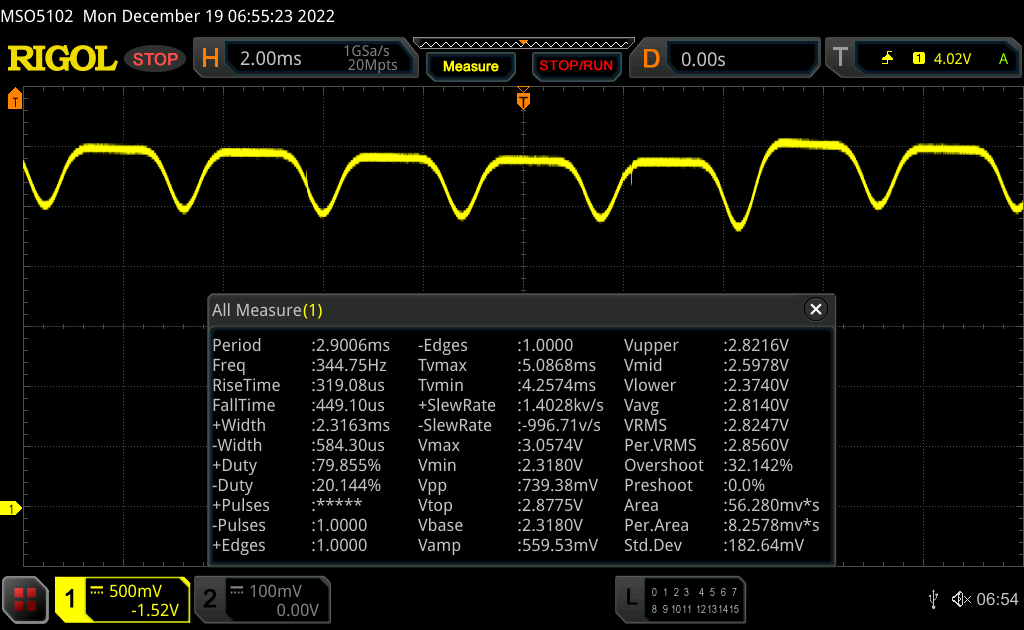
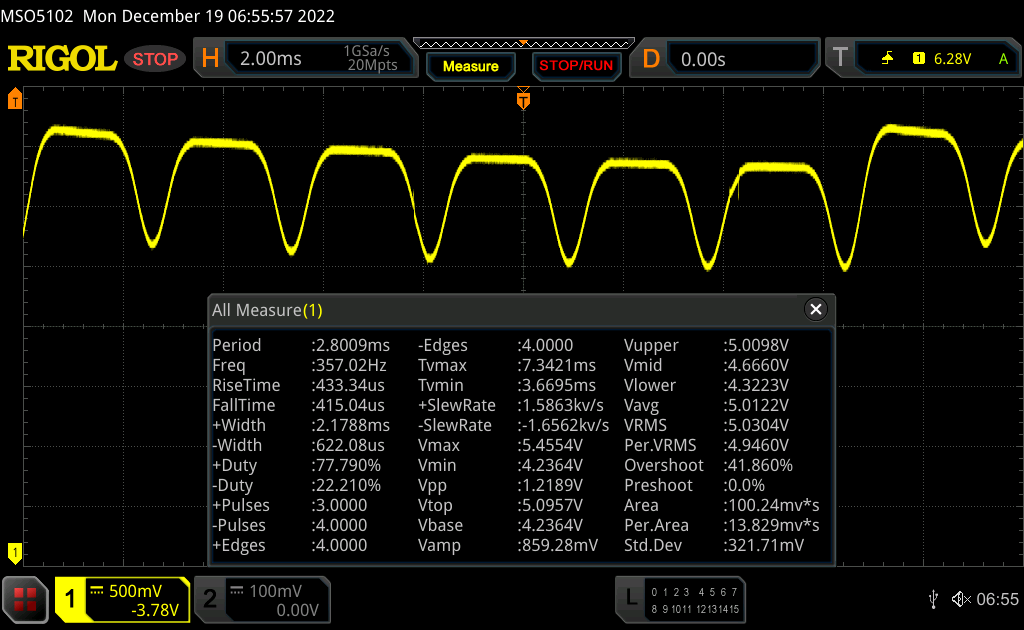
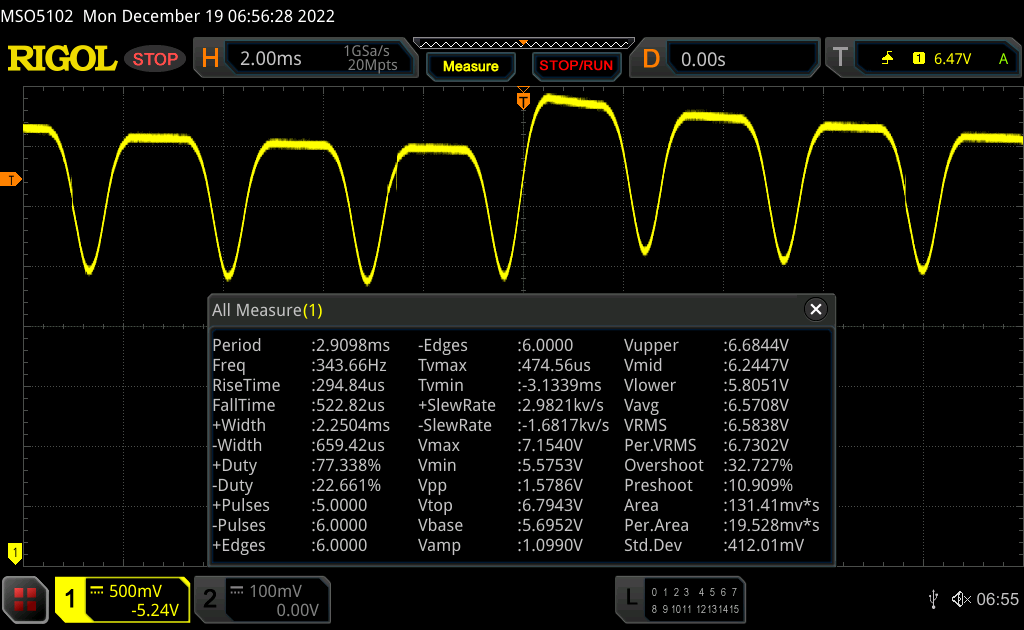
One drawback of OLED technology: PWM is always present. The PWM frequency of around 342 Hz at all brightness levels may cause headaches in sensitive people, even if no flickering is visible to the naked eye.
| |||||||||||||||||||||||||
Brightness Distribution: 97 %
Center on Battery: 400 cd/m²
Contrast: ∞:1 (Black: 0 cd/m²)
ΔE ColorChecker Calman: 2.2 | ∀{0.5-29.43 Ø4.73}
calibrated: 2.6
ΔE Greyscale Calman: 1.2 | ∀{0.09-98 Ø4.97}
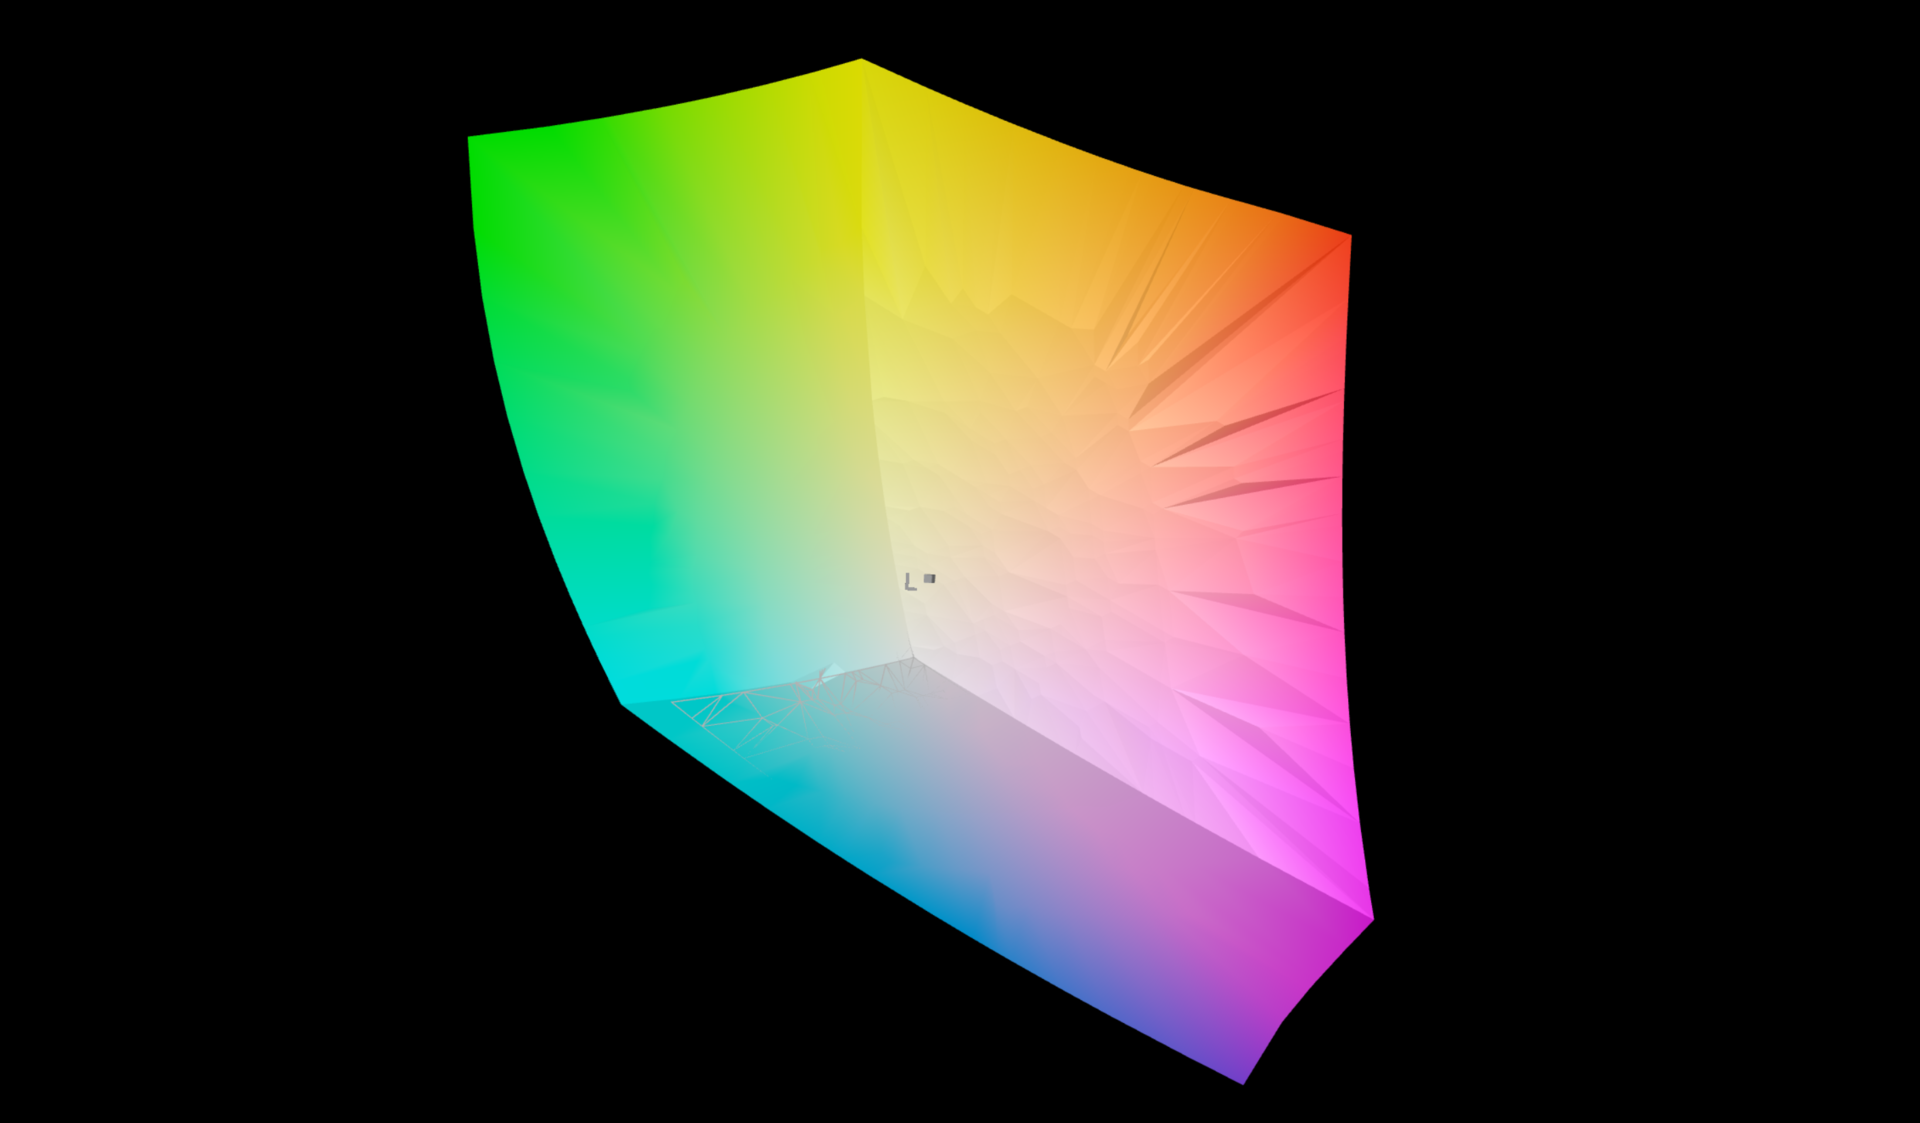
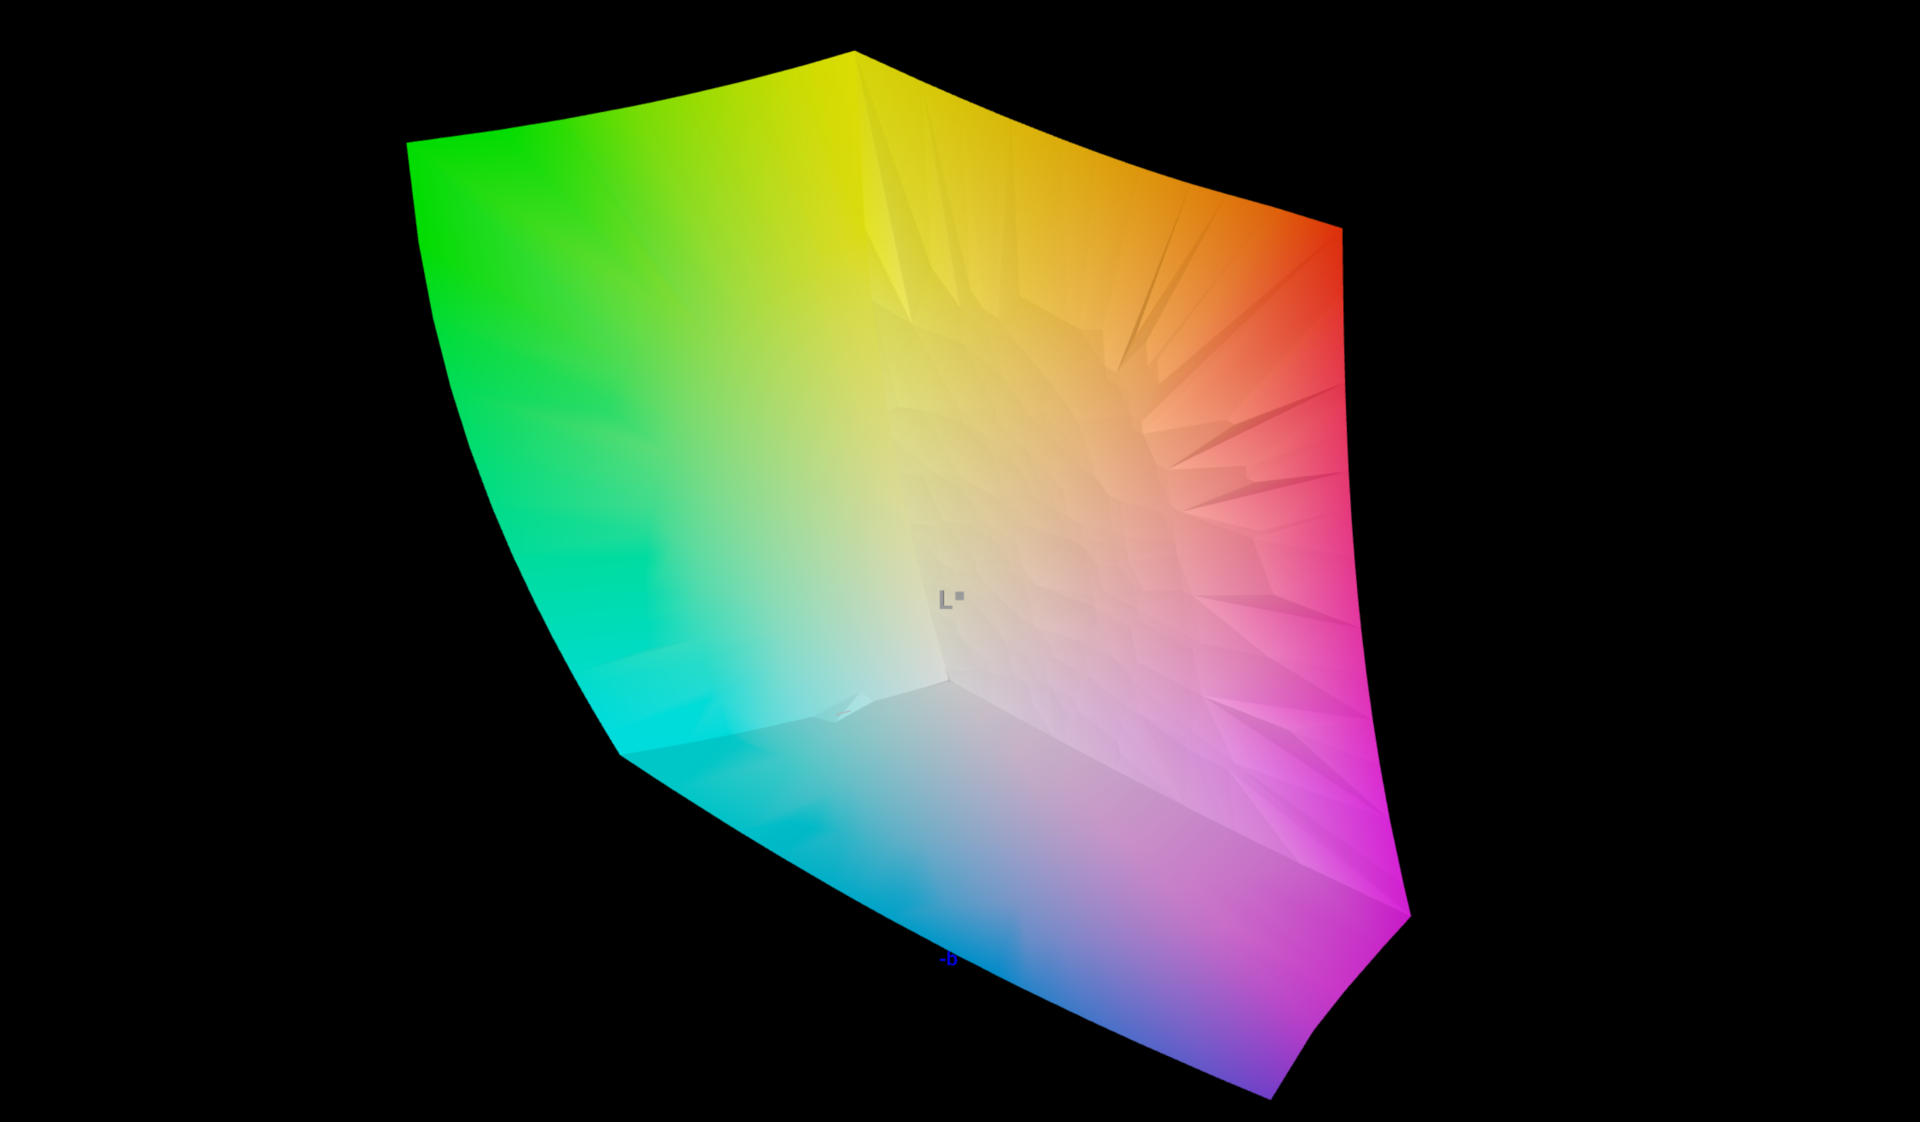
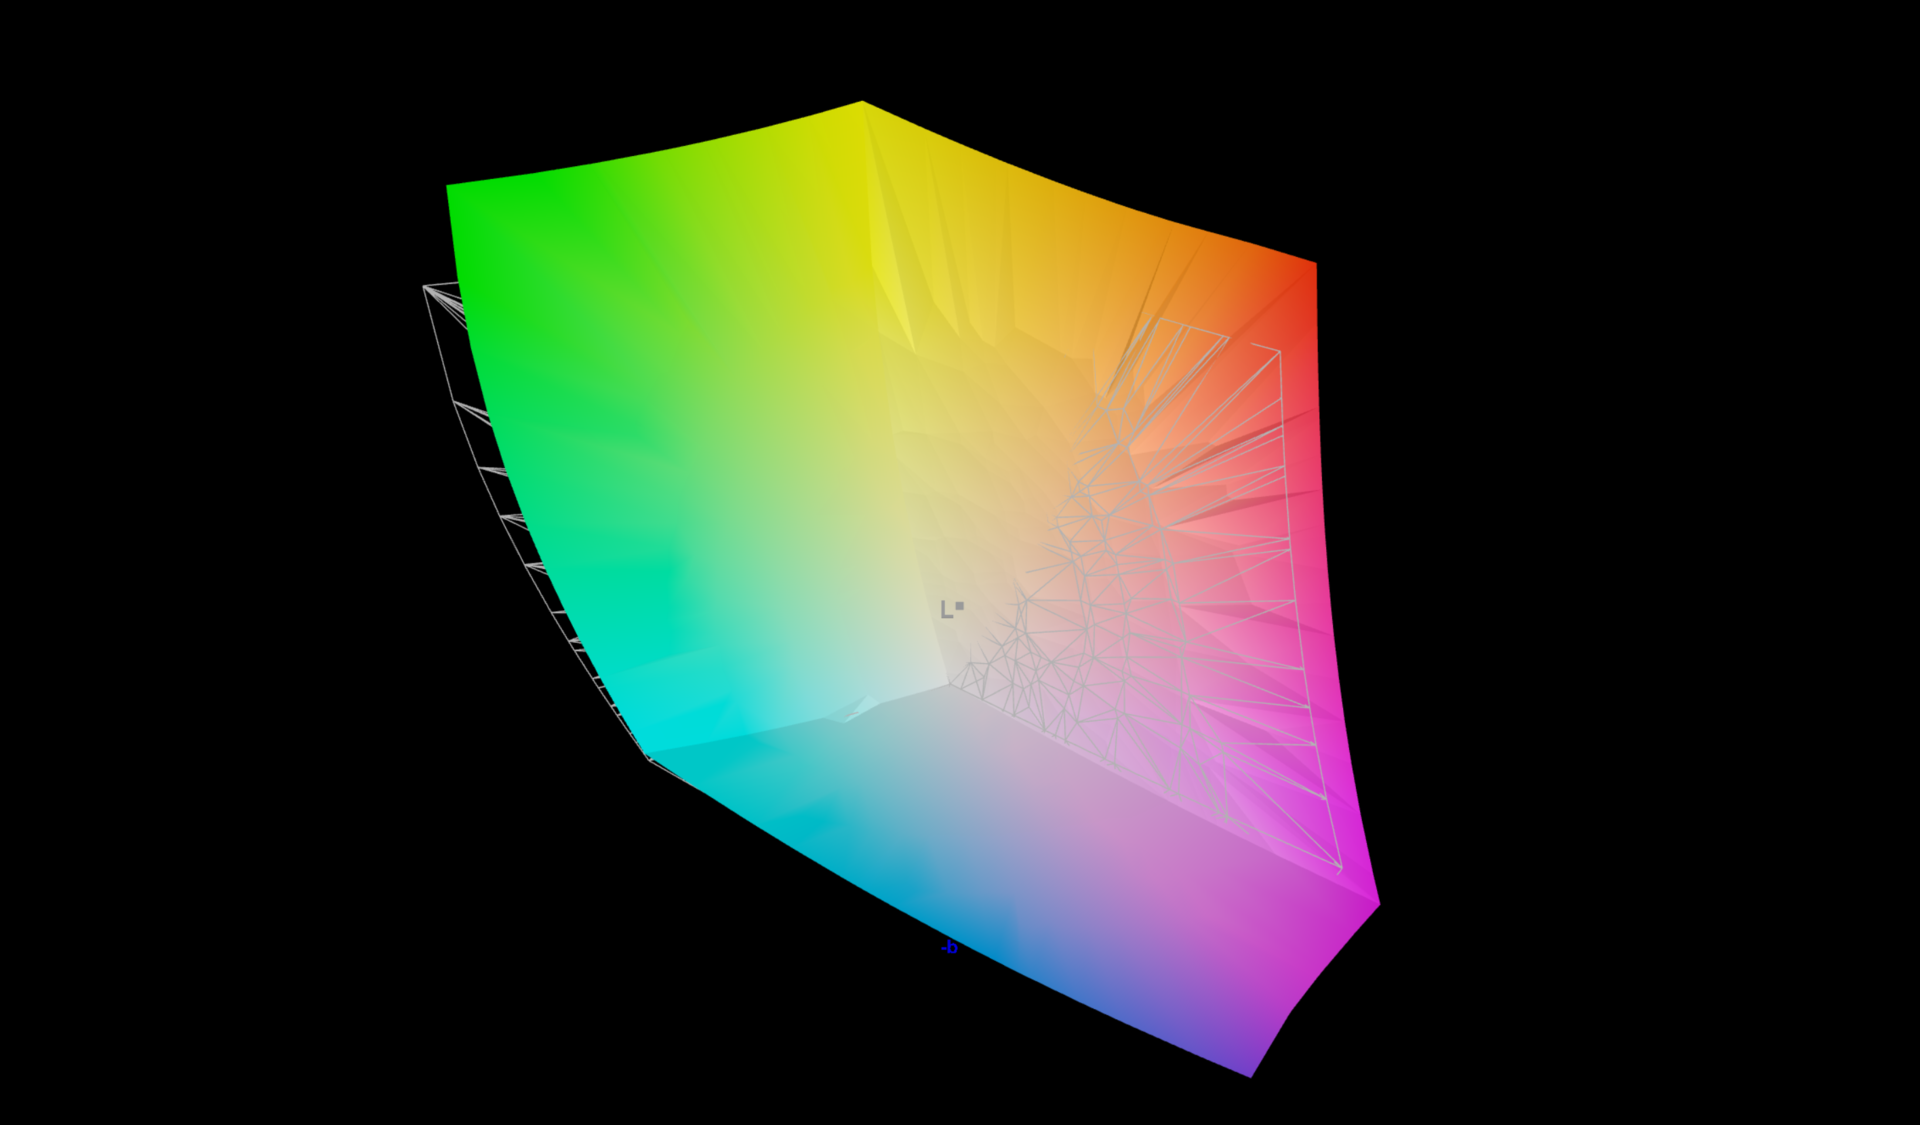
96.5% AdobeRGB 1998 (Argyll 3D)
100% sRGB (Argyll 3D)
99.7% Display P3 (Argyll 3D)
Gamma: 2.22
CCT: 6364 K
| Lenovo ThinkPad X1 Carbon G10 21CB00DCGE ATNA40YK01-1, OLED, 2880x1800, 14" | Lenovo ThinkPad X1 Carbon G10 21CC001RGE B140UAN02.1, IPS LED, 1920x1200, 14" | Lenovo ThinkPad X1 Carbon G9-20XWCTO1WW MNE007A1-2, IPS LED, 3840x2400, 14" | Lenovo ThinkPad Z13 G1-21D20016GE ATNA33AA02-0, OLED, 2880x1800, 13.3" | HP Elite Dragonfly G3 Chi Mei CMN13C0, IPS, 1920x1280, 13.5" | Dell Latitude 9430 2-in-1 AU Optronics B140QAN, IPS, 2560x1600, 14" | |
|---|---|---|---|---|---|---|
| Display | -16% | -4% | 0% | -21% | -13% | |
| Display P3 Coverage (%) | 99.7 | 74.6 -25% | 95.2 -5% | 99.9 0% | 68 -32% | 79.4 -20% |
| sRGB Coverage (%) | 100 | 98.6 -1% | 99.8 0% | 100 0% | 98.3 -2% | 100 0% |
| AdobeRGB 1998 Coverage (%) | 96.5 | 76.5 -21% | 89.2 -8% | 97.5 1% | 69.9 -28% | 79.4 -18% |
| Response Times | -2546% | -2754% | -29% | -3117% | -3600% | |
| Response Time Grey 50% / Grey 80% * (ms) | 1.2 ? | 45.5 ? -3692% | 46 ? -3733% | 1.9 ? -58% | 50.8 ? -4133% | 63.6 ? -5200% |
| Response Time Black / White * (ms) | 1.6 ? | 24 ? -1400% | 30 ? -1775% | 1.6 ? -0% | 35.2 ? -2100% | 33.6 ? -2000% |
| PWM Frequency (Hz) | 342 ? | 53050 ? | 240 ? | |||
| Screen | -51% | 27% | -10% | -18% | -29% | |
| Brightness middle (cd/m²) | 400 | 372 -7% | 497 24% | 371 -7% | 387.2 -3% | 517.7 29% |
| Brightness (cd/m²) | 401 | 362 -10% | 488 22% | 378 -6% | 360 -10% | 493 23% |
| Brightness Distribution (%) | 97 | 94 -3% | 87 -10% | 98 1% | 80 -18% | 90 -7% |
| Black Level * (cd/m²) | 0.18 | 0.35 | 0.04 | 0.26 | 0.33 | |
| Colorchecker dE 2000 * | 2.2 | 3.4 -55% | 1.2 45% | 2.5 -14% | 2.36 -7% | 3.38 -54% |
| Colorchecker dE 2000 max. * | 4.3 | 6.7 -56% | 2.1 51% | 4.4 -2% | 4.79 -11% | 6.25 -45% |
| Colorchecker dE 2000 calibrated * | 2.6 | 1.8 31% | 0.9 65% | 1.9 27% | 0.63 76% | 0.41 84% |
| Greyscale dE 2000 * | 1.2 | 4.3 -258% | 1.3 -8% | 2 -67% | 3 -150% | 4 -233% |
| Gamma | 2.22 99% | 2.13 103% | 2.16 102% | 2.17 101% | 2.17 101% | 2.13 103% |
| CCT | 6364 102% | 6158 106% | 6690 97% | 6228 104% | 6137 106% | 6186 105% |
| Contrast (:1) | 2067 | 1420 | 9275 | 1489 | 1569 | |
| Color Space (Percent of AdobeRGB 1998) (%) | 79.37 | |||||
| Color Space (Percent of sRGB) (%) | 99.78 | |||||
| Total Average (Program / Settings) | -871% /
-458% | -910% /
-444% | -13% /
-10% | -1052% /
-535% | -1214% /
-620% |
* ... smaller is better
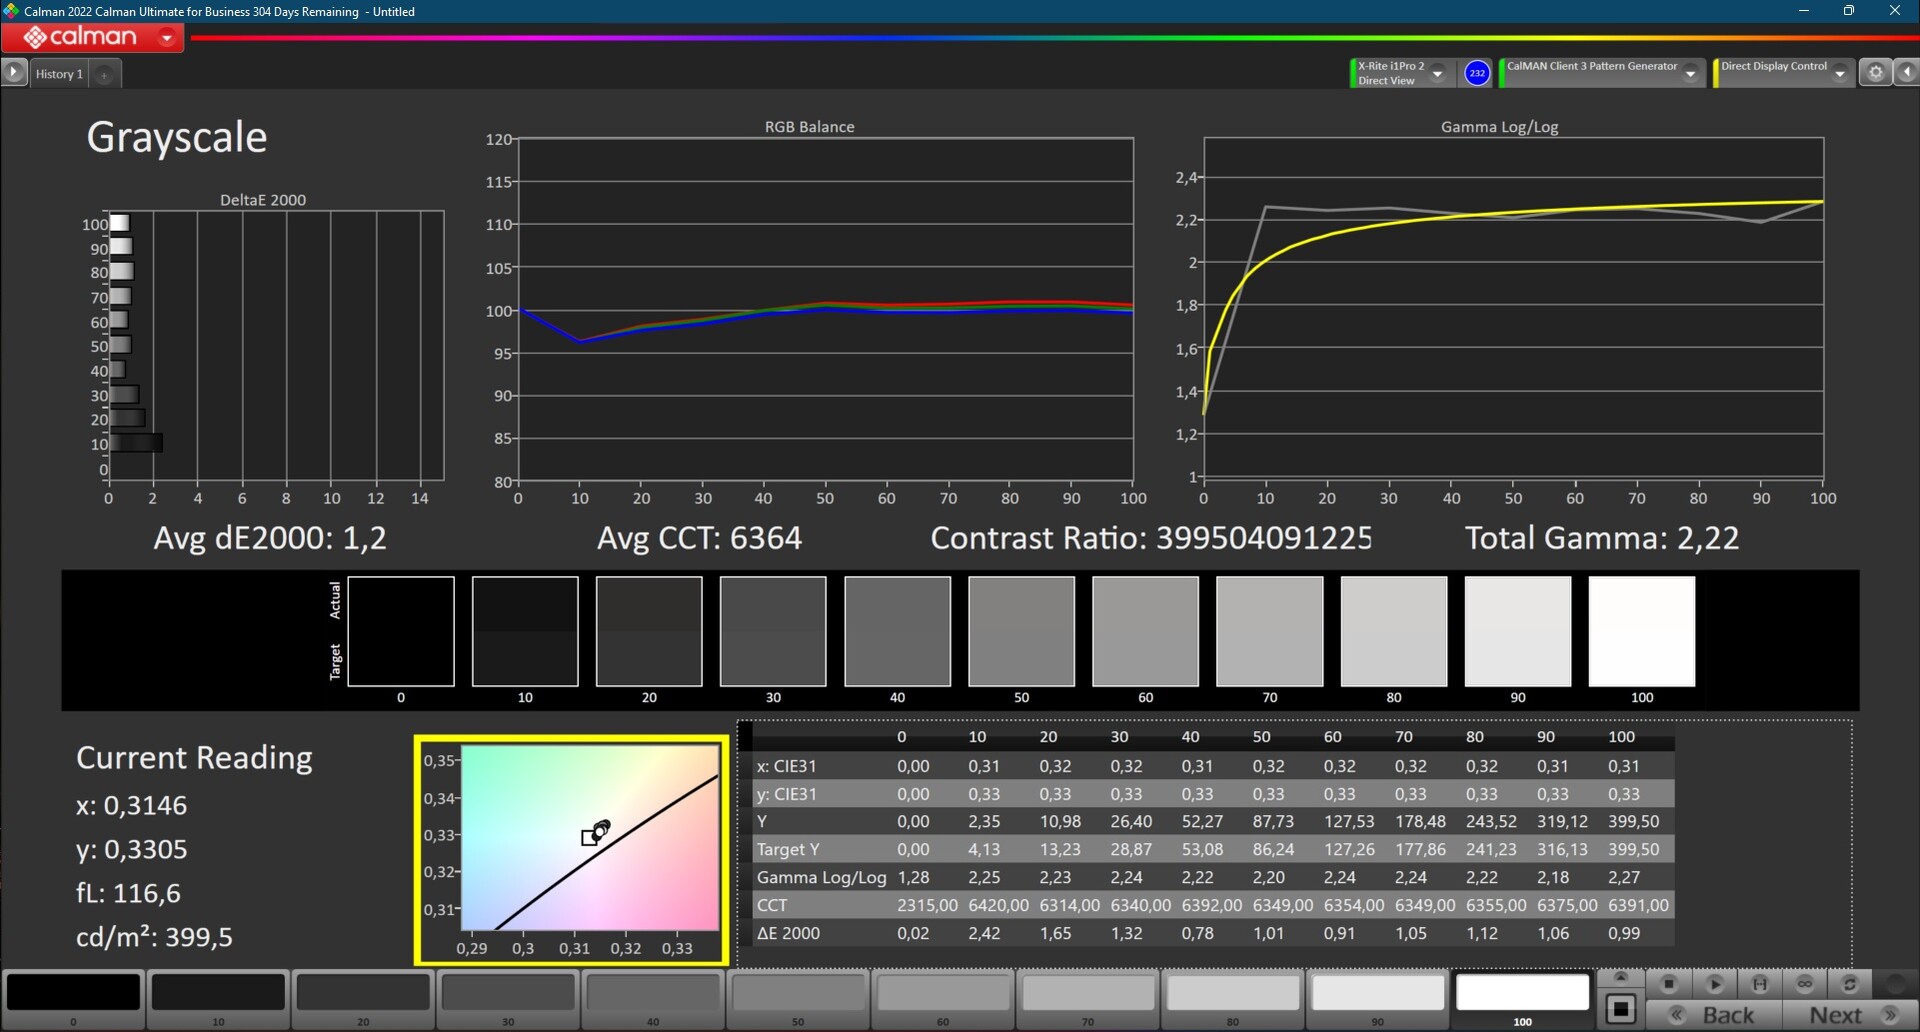
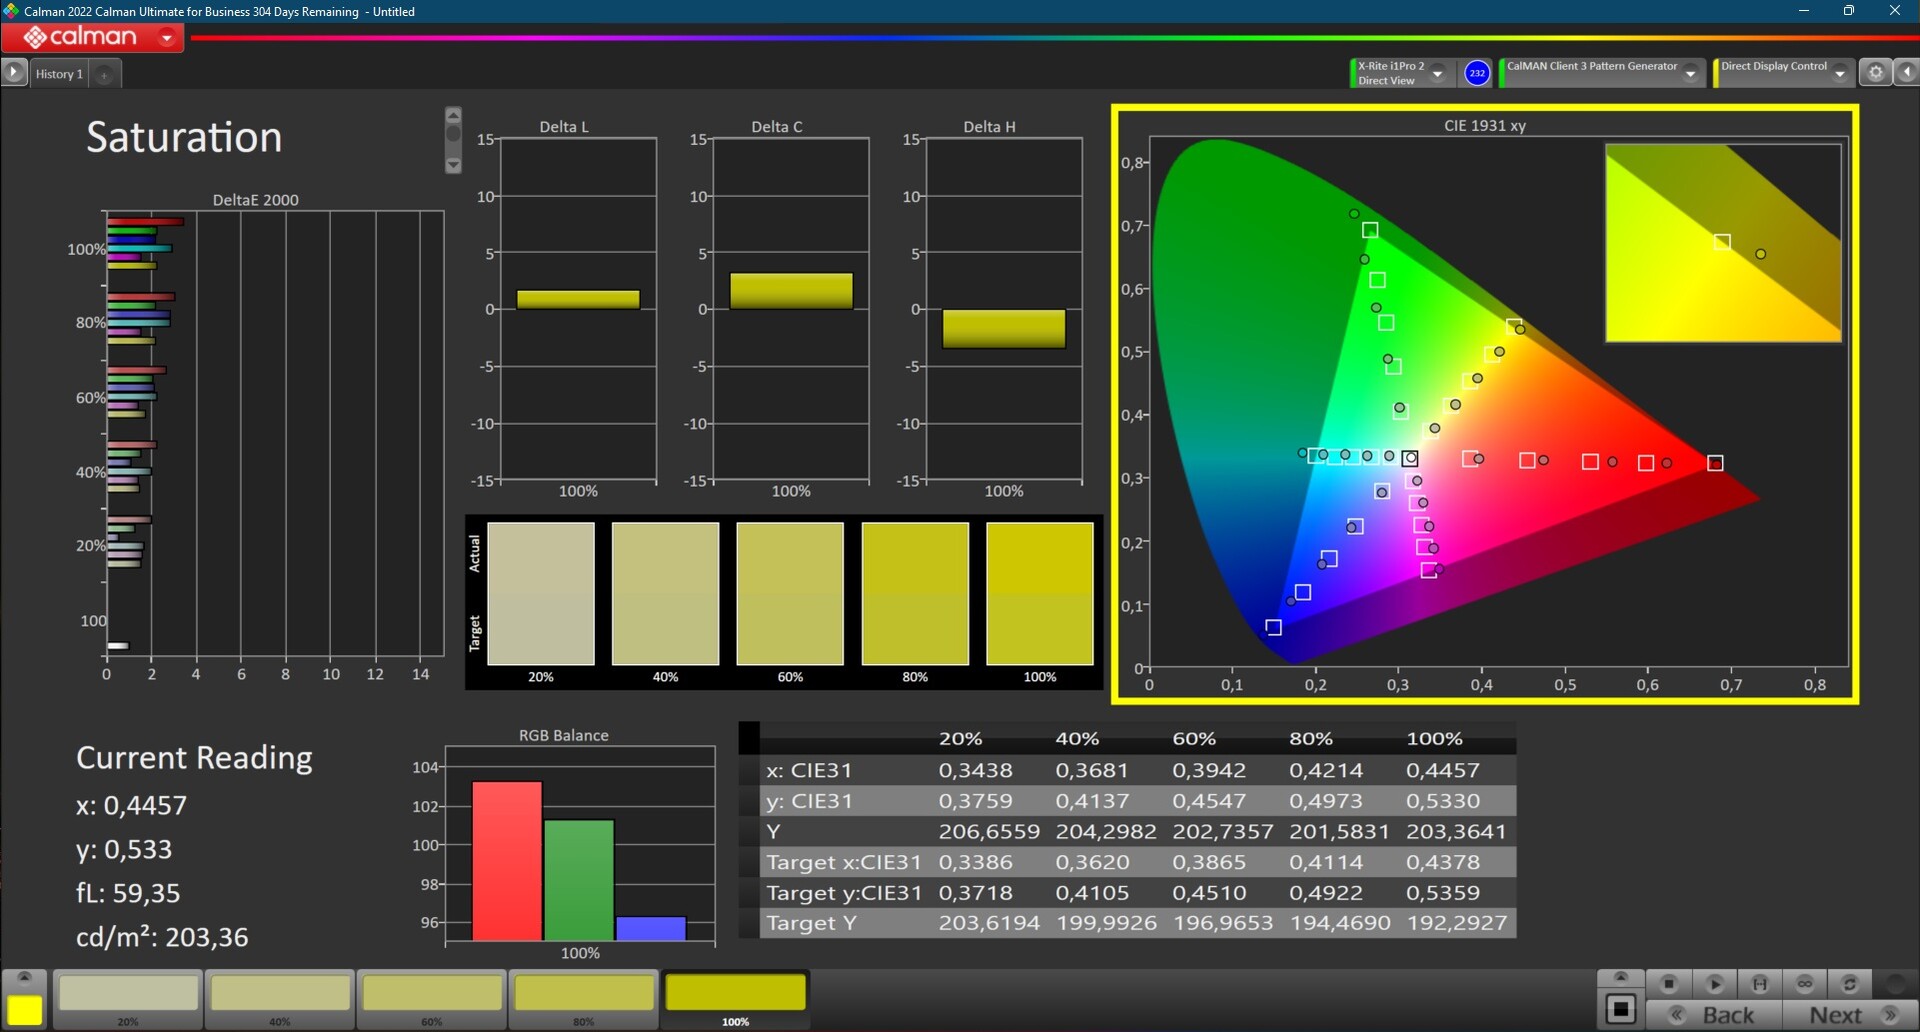
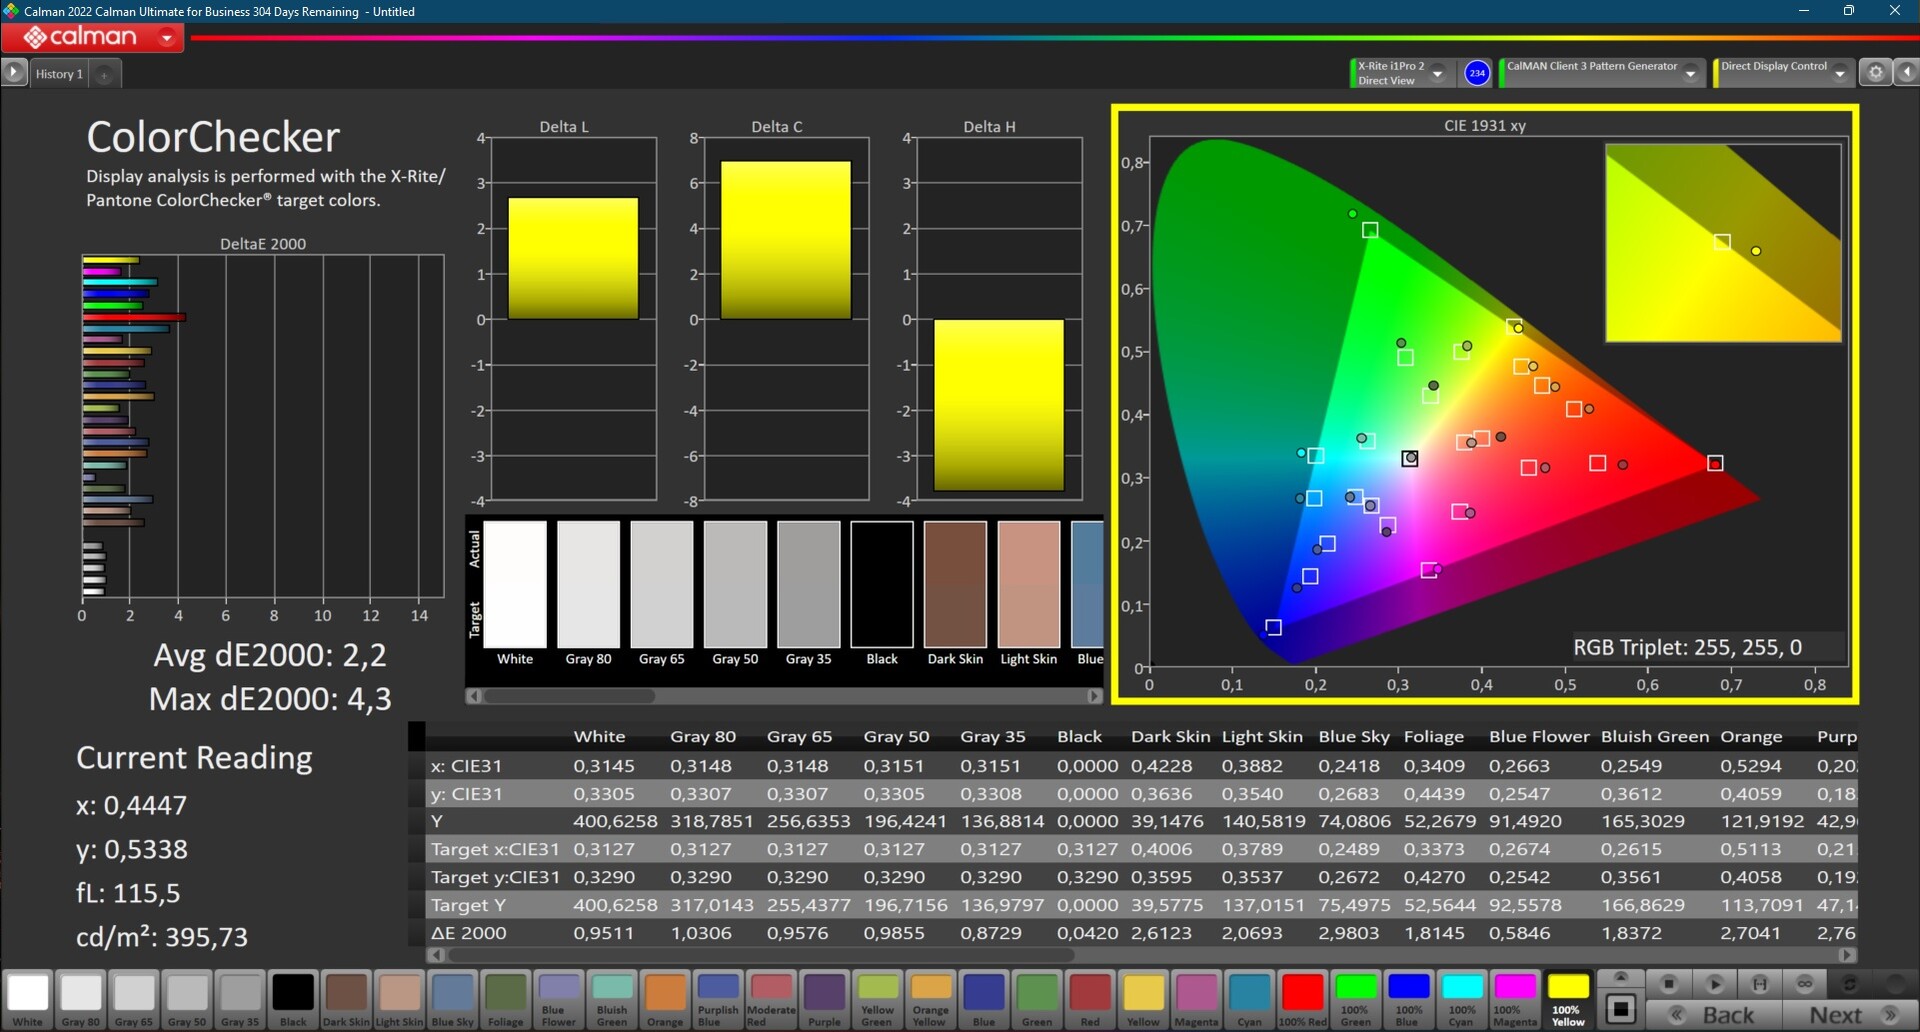
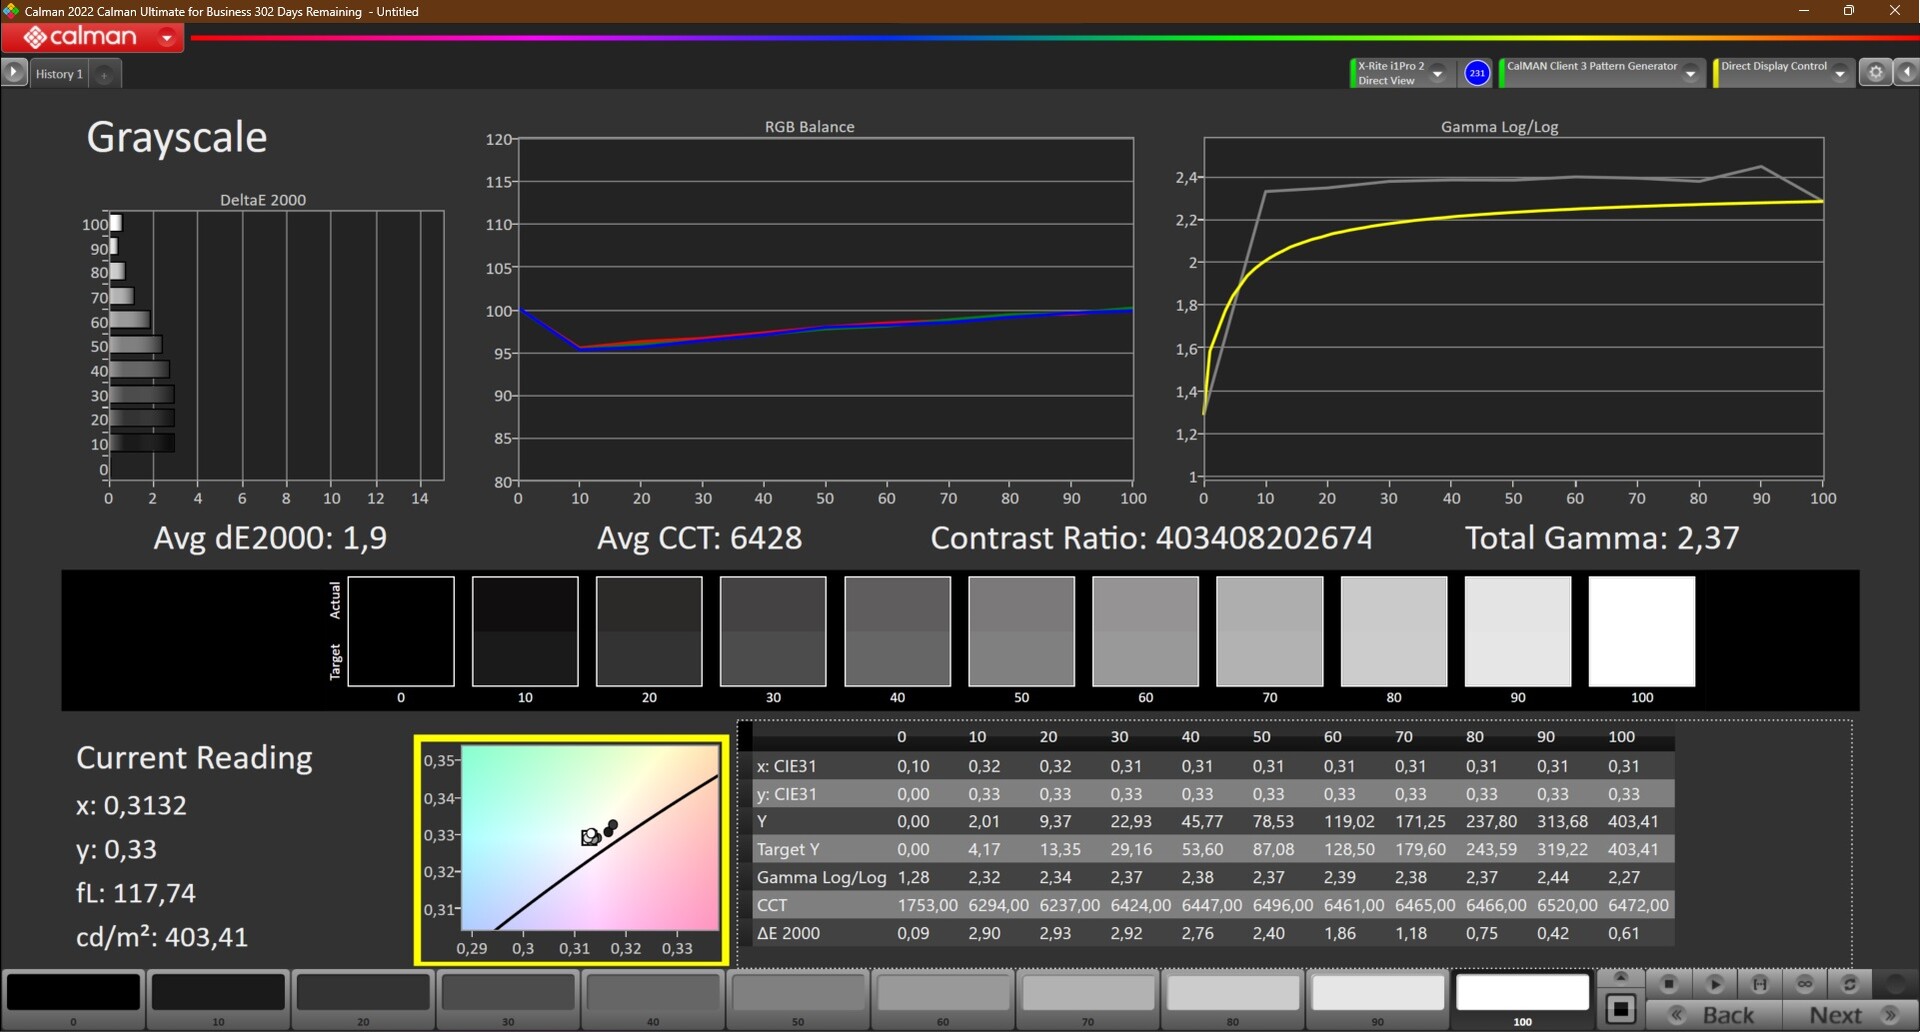
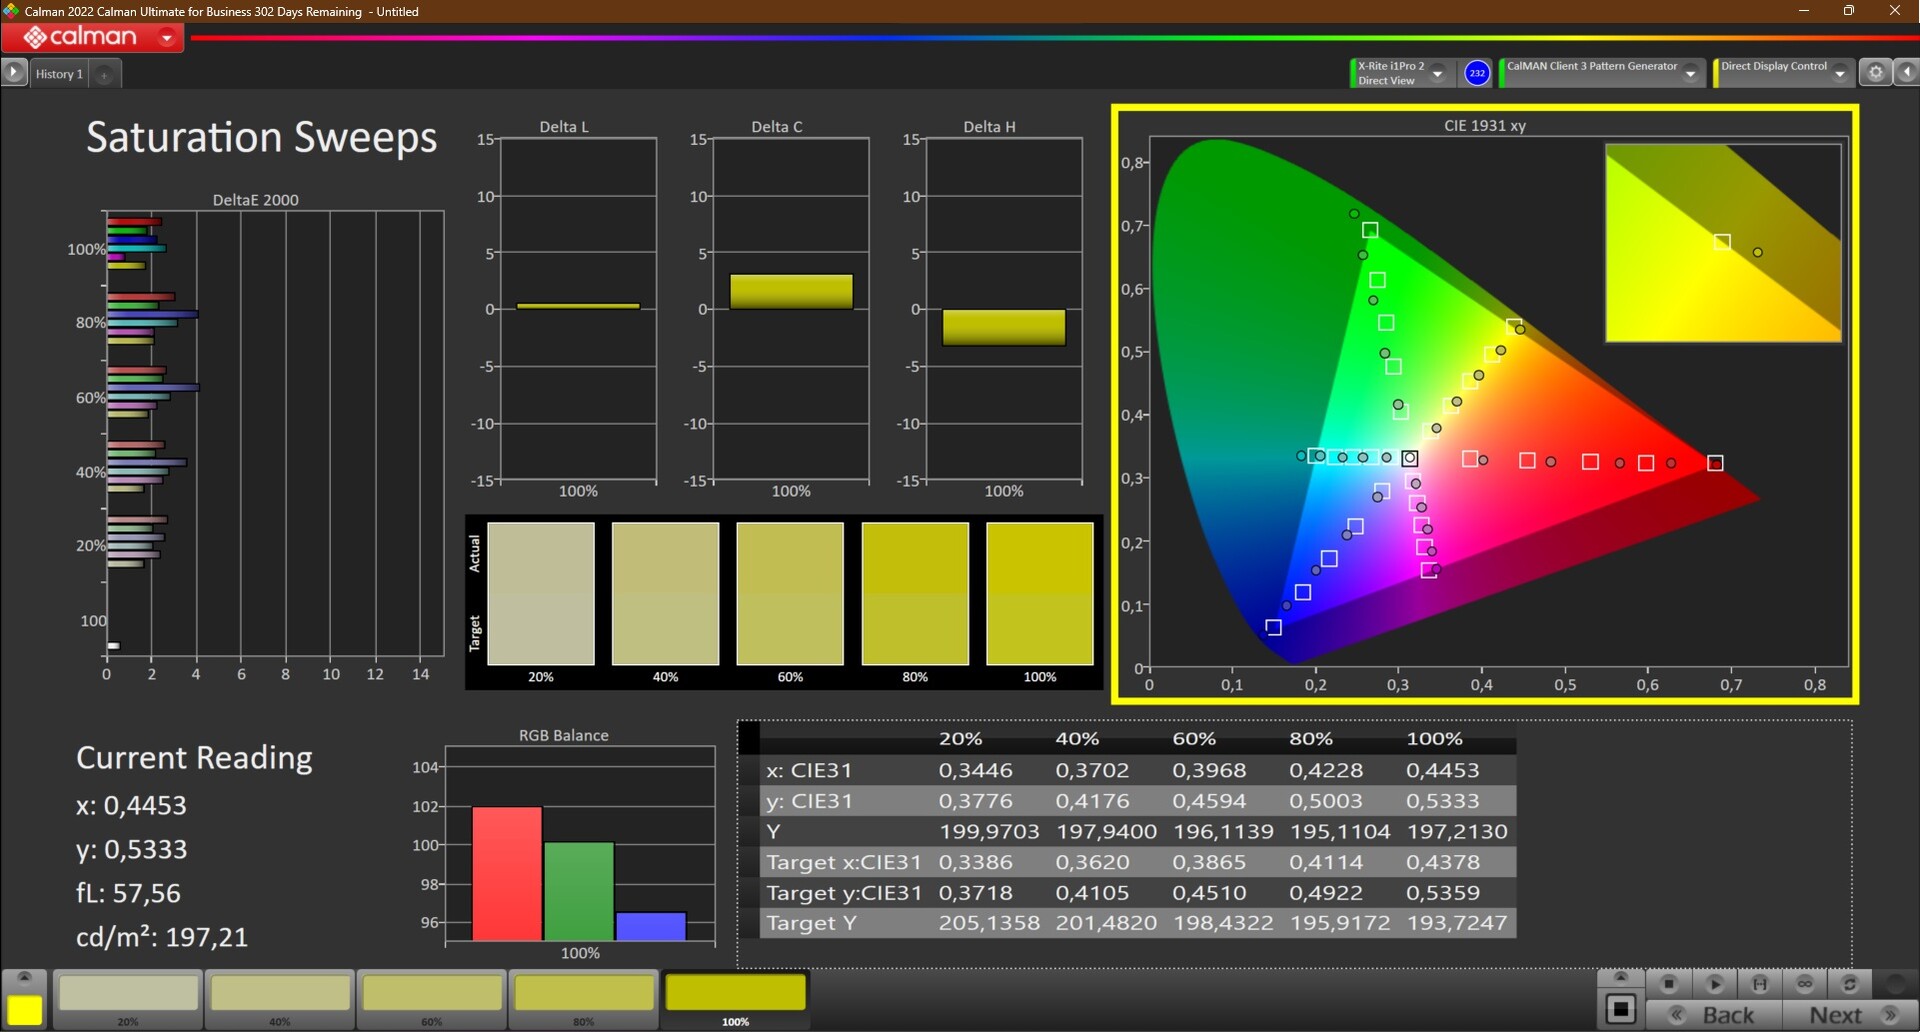
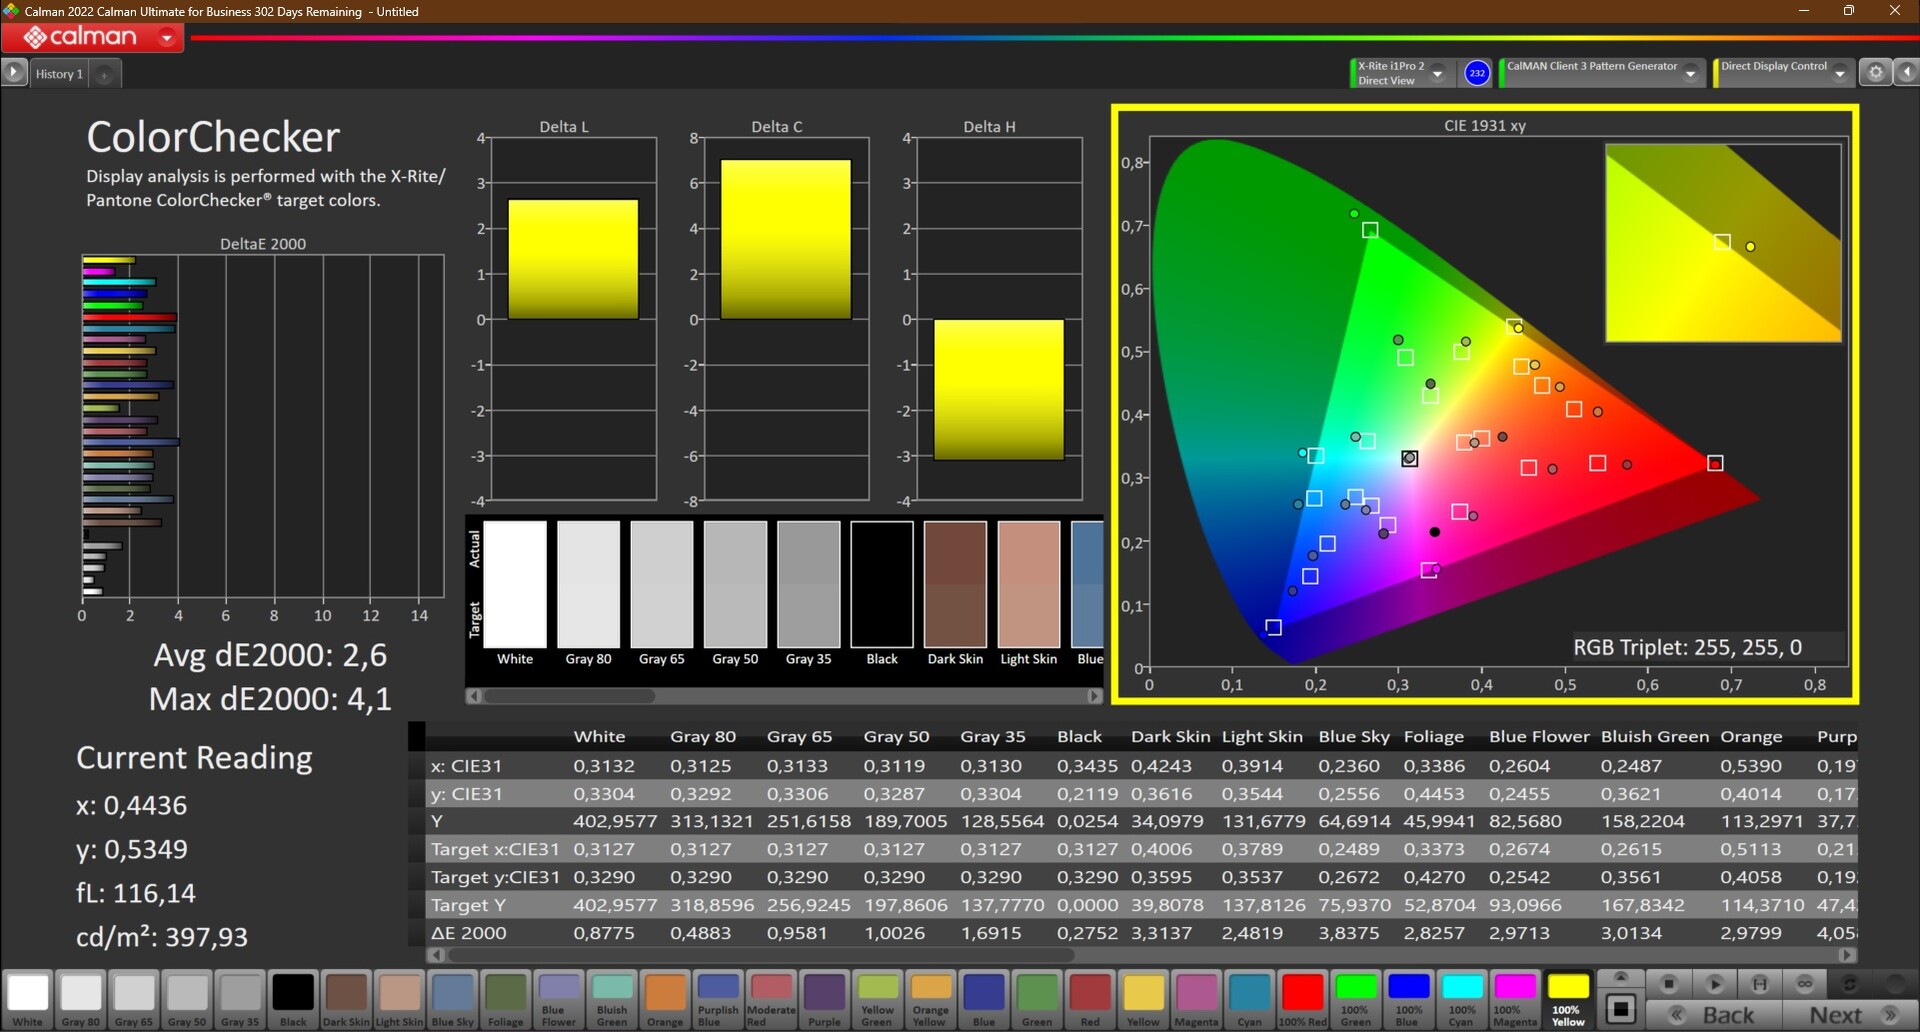
The screen's color quality is already extremely high in factory state; the practically infinitely high contrast value results in vivid, accentuated colors. Deviations from the ideal are already comparatively small for most colors ex-works - and we were hardly able to improve the quality via calibration.
One strength of the OLED screen is the very good color space coverage. Lenovo promises 100% DCI-P3, which actually turns out to be 99.7%. The panel is able to fully reproduce the small sRGB color space, and even AdobeRGB is not lacking much at 96.5%.
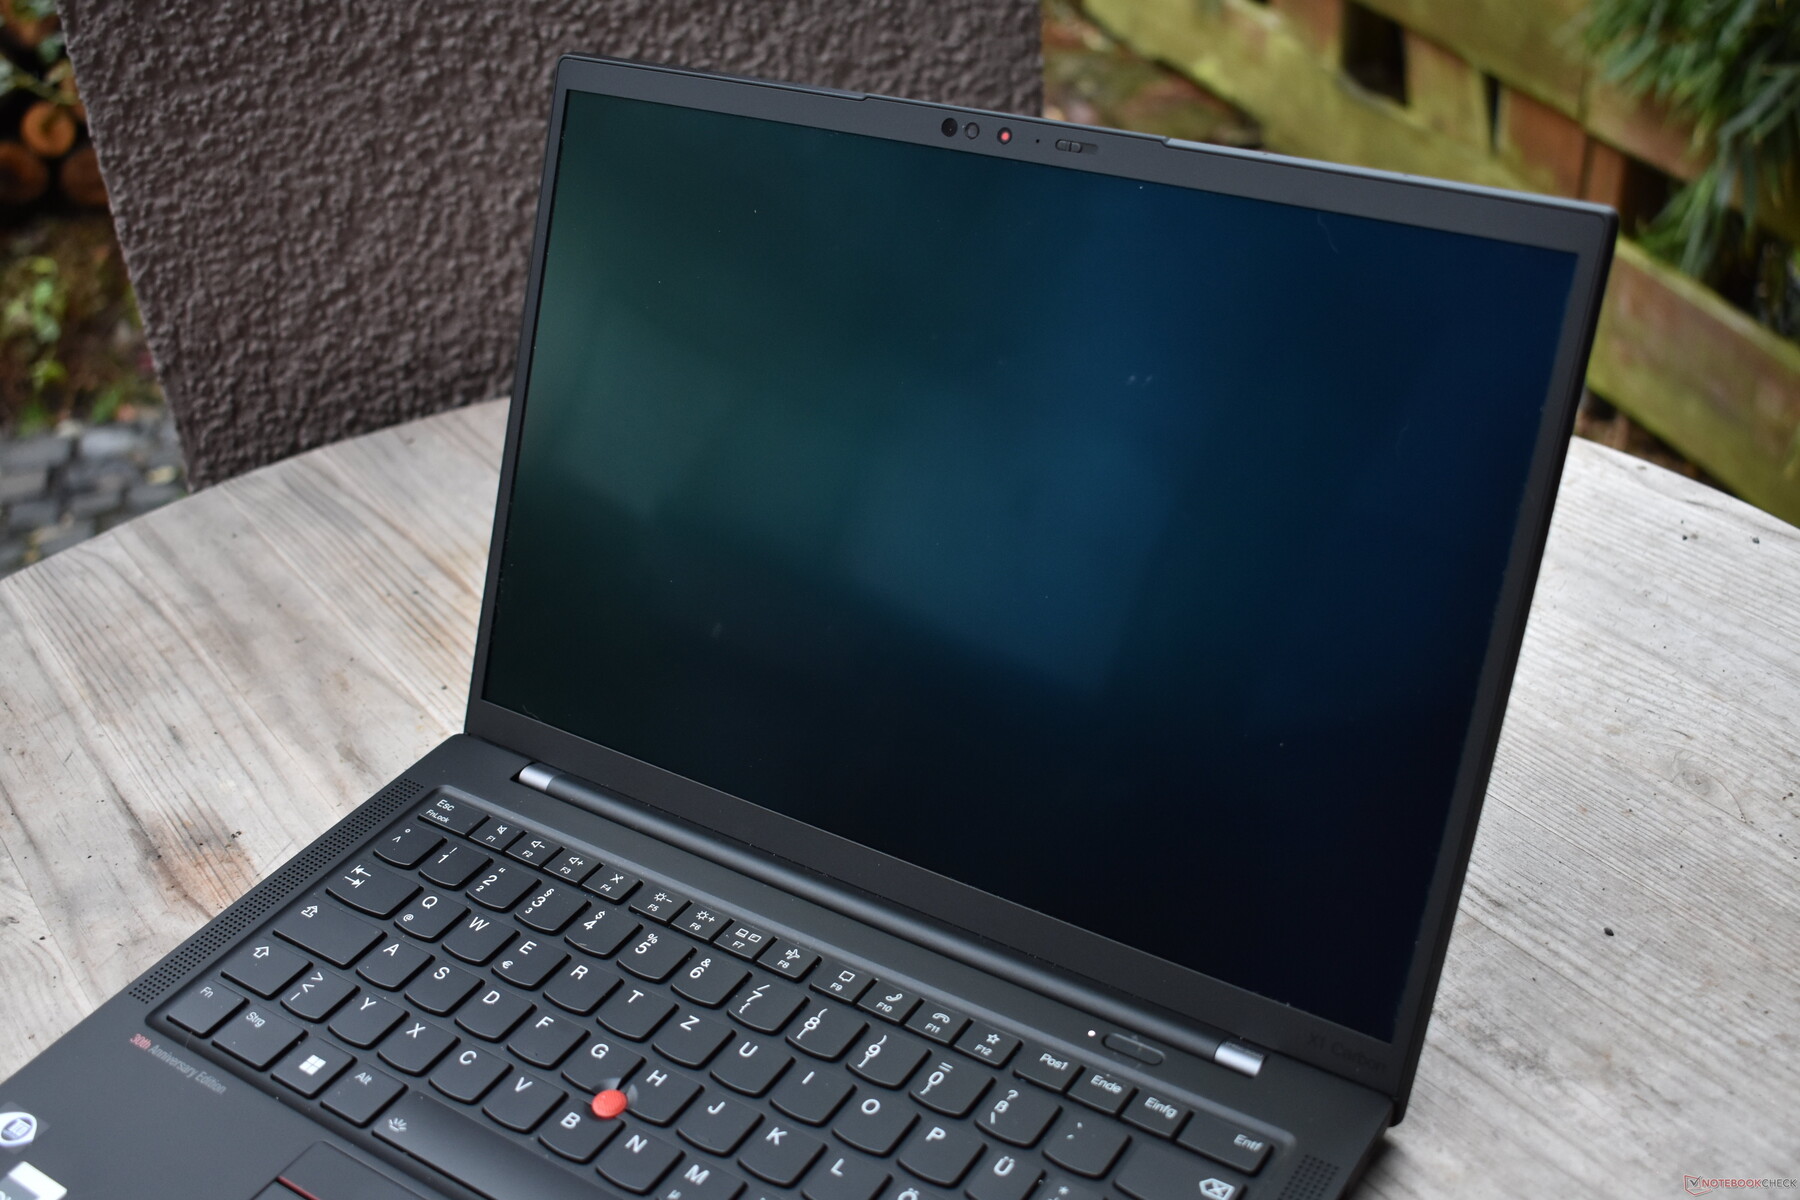
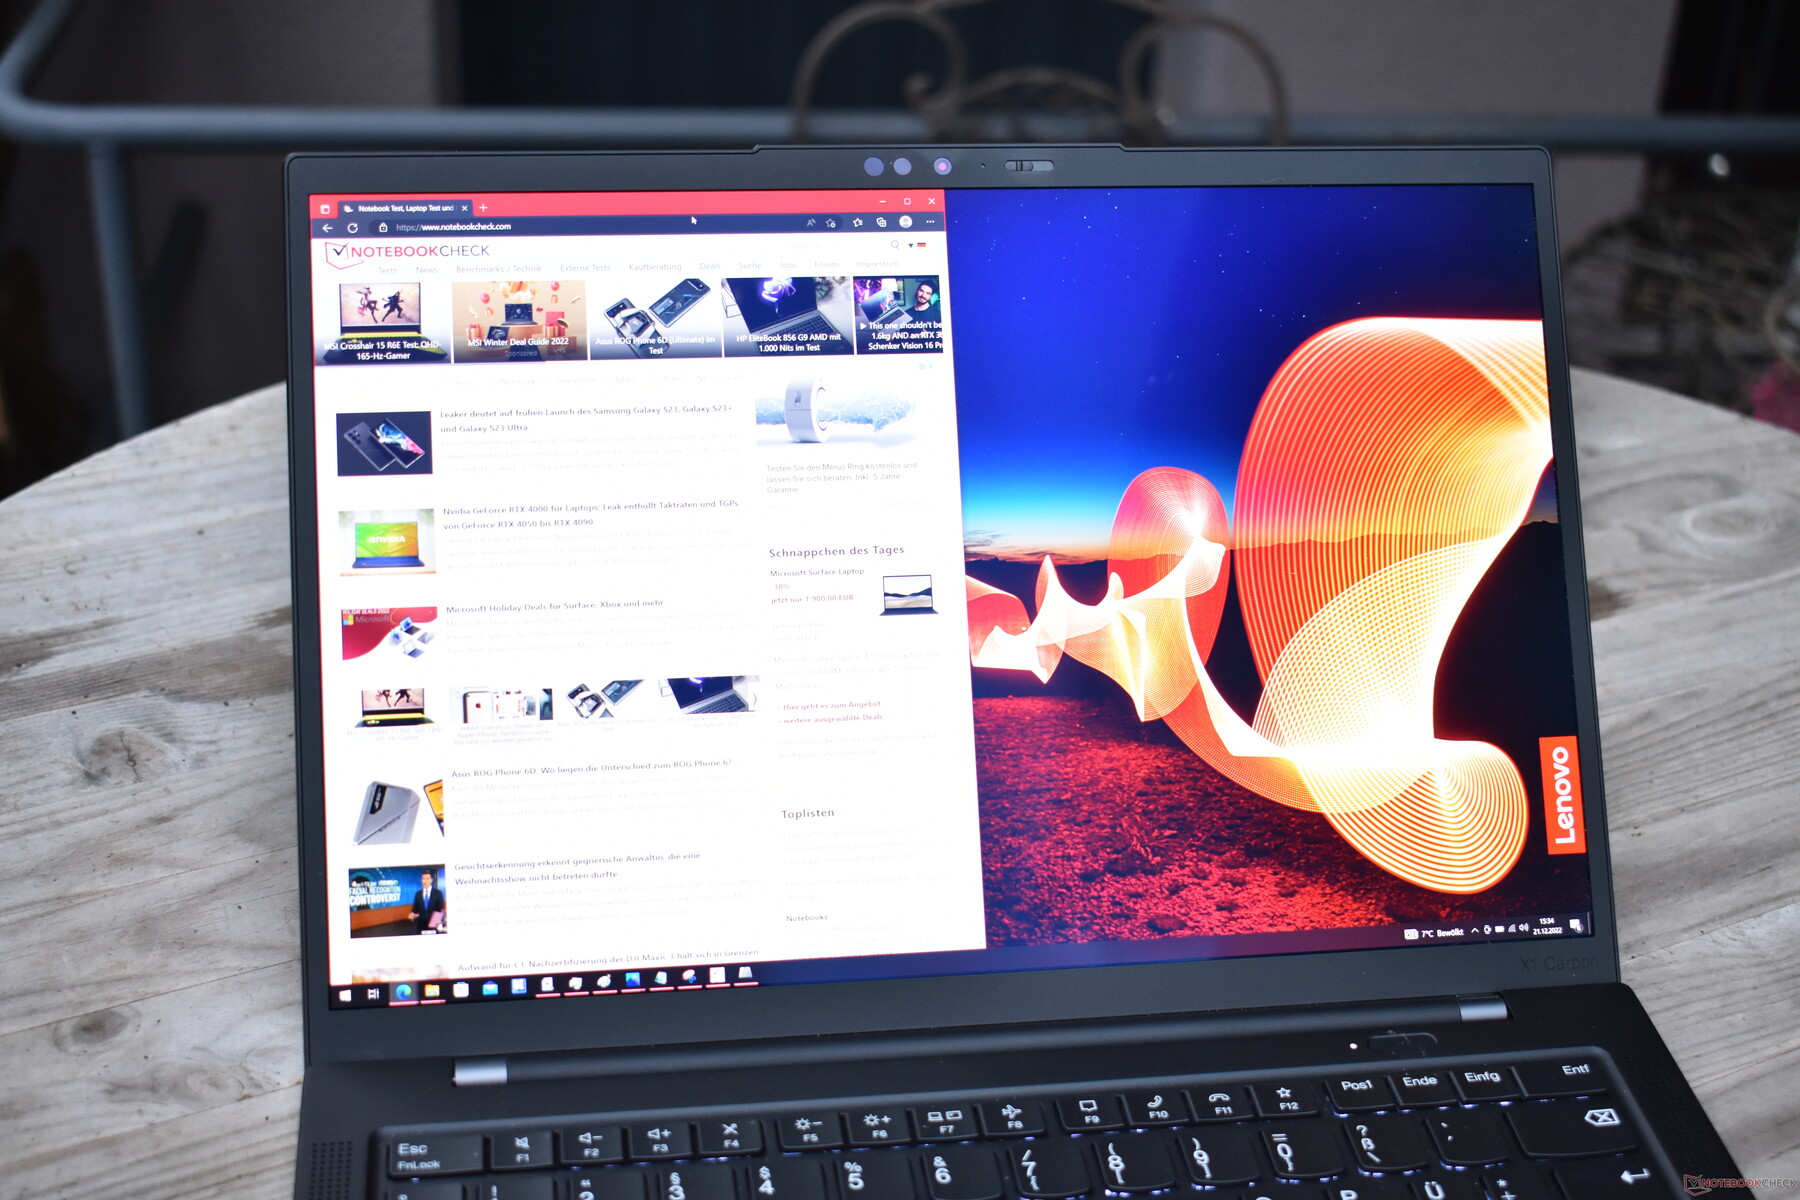
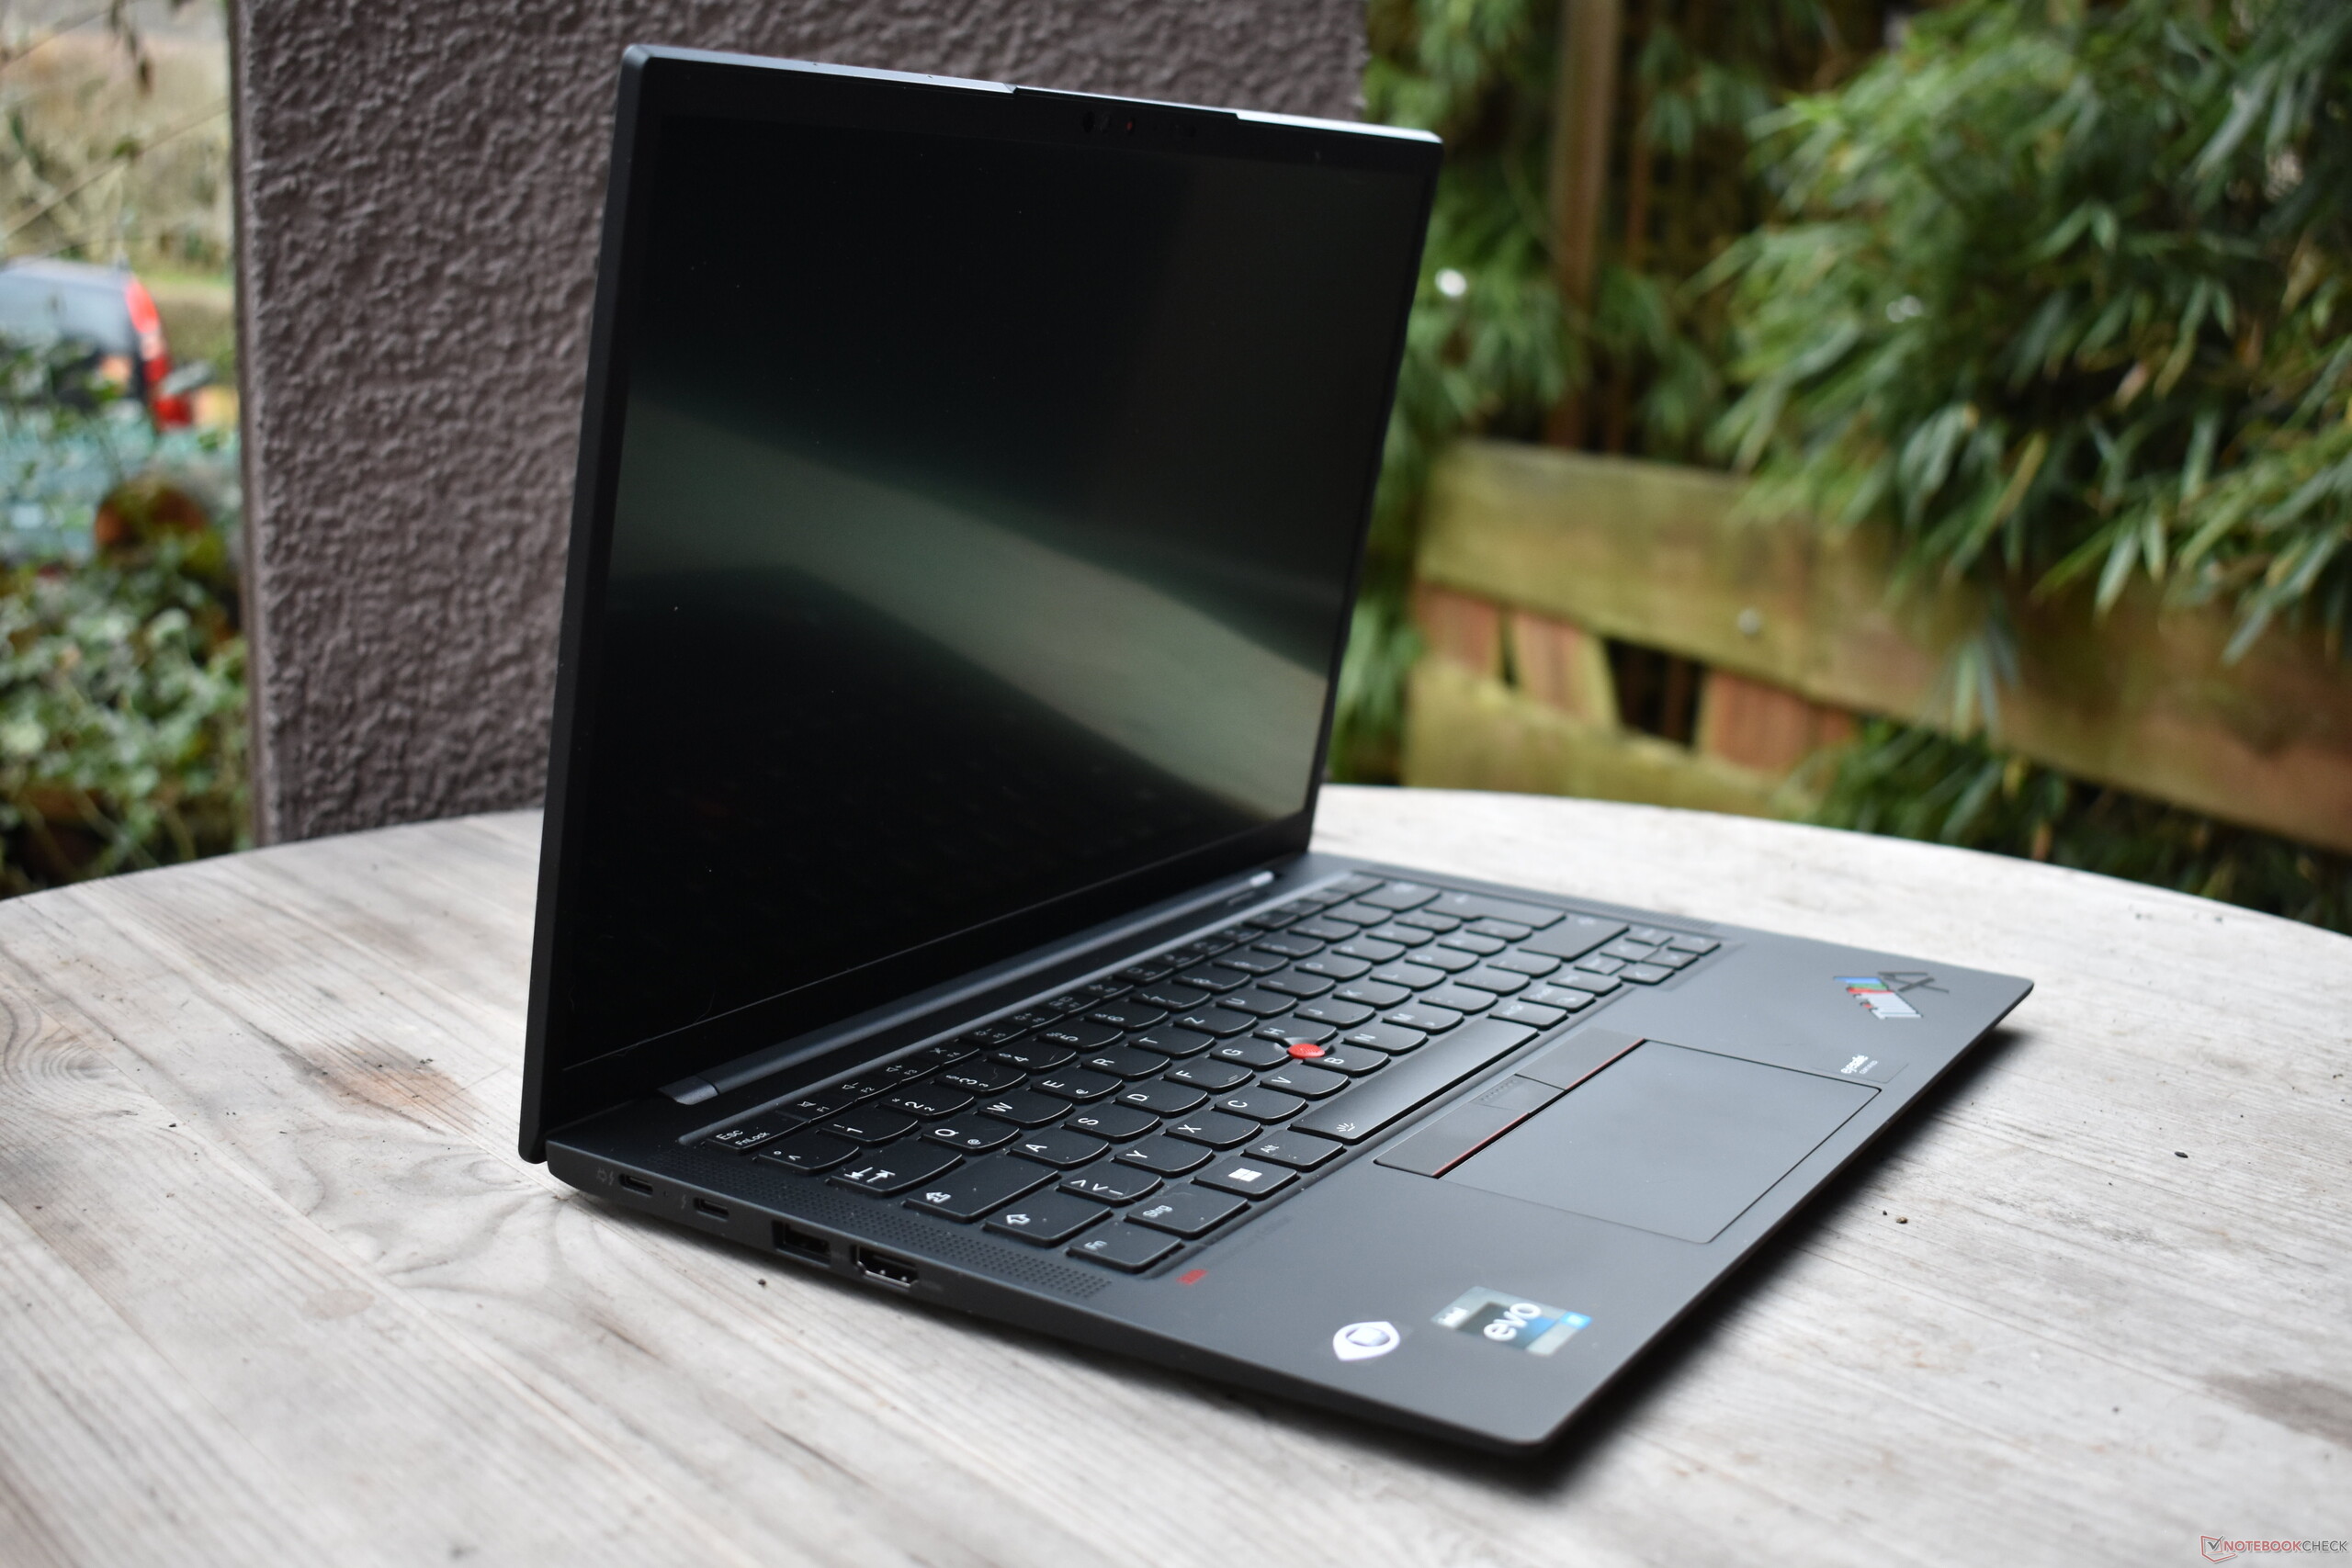
OLED displays are usually glossy - the screen of Lenovo's ThinkPad X1 Carbon G10 is also glossy, but only very slightly, and is also an anti-reflective panel. In combination with a brightness of around 400 cd/m² and the high contrast ratio, the screen can be used outdoors without issue.
Display Response Times
| ↔ Response Time Black to White | ||
|---|---|---|
| 1.6 ms ... rise ↗ and fall ↘ combined | ↗ 0.9 ms rise | 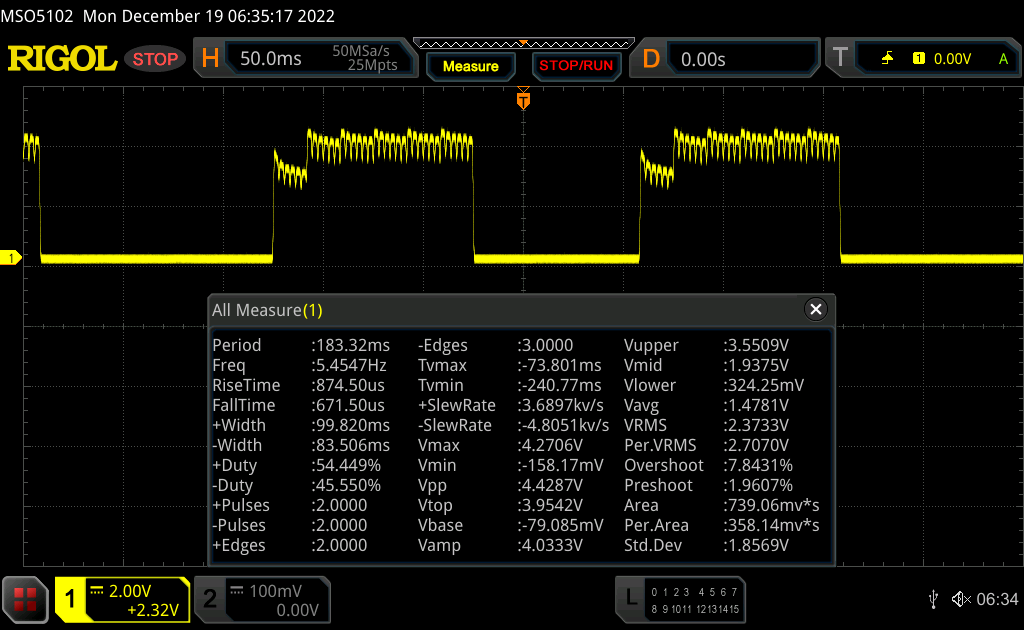 |
| ↘ 0.7 ms fall | ||
| The screen shows very fast response rates in our tests and should be very well suited for fast-paced gaming. In comparison, all tested devices range from 0.1 (minimum) to 240 (maximum) ms. » 9 % of all devices are better. This means that the measured response time is better than the average of all tested devices (19.9 ms). | ||
| ↔ Response Time 50% Grey to 80% Grey | ||
| 1.2 ms ... rise ↗ and fall ↘ combined | ↗ 0.6 ms rise | 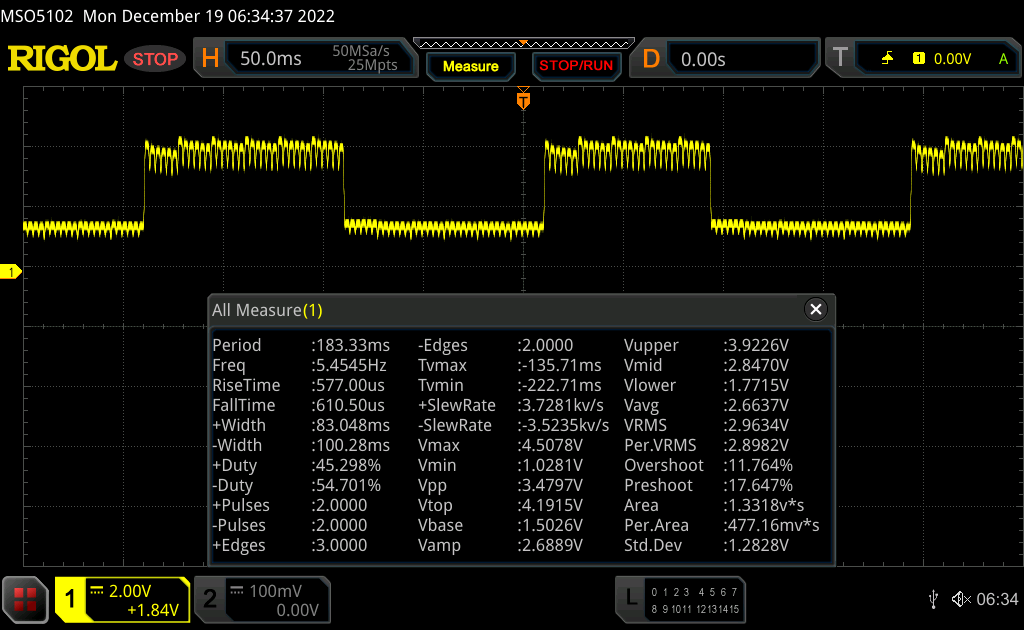 |
| ↘ 0.6 ms fall | ||
| The screen shows very fast response rates in our tests and should be very well suited for fast-paced gaming. In comparison, all tested devices range from 0.165 (minimum) to 636 (maximum) ms. » 5 % of all devices are better. This means that the measured response time is better than the average of all tested devices (31.1 ms). | ||
Screen Flickering / PWM (Pulse-Width Modulation)
| Screen flickering / PWM detected | 342 Hz | ≤ 100 % brightness setting | 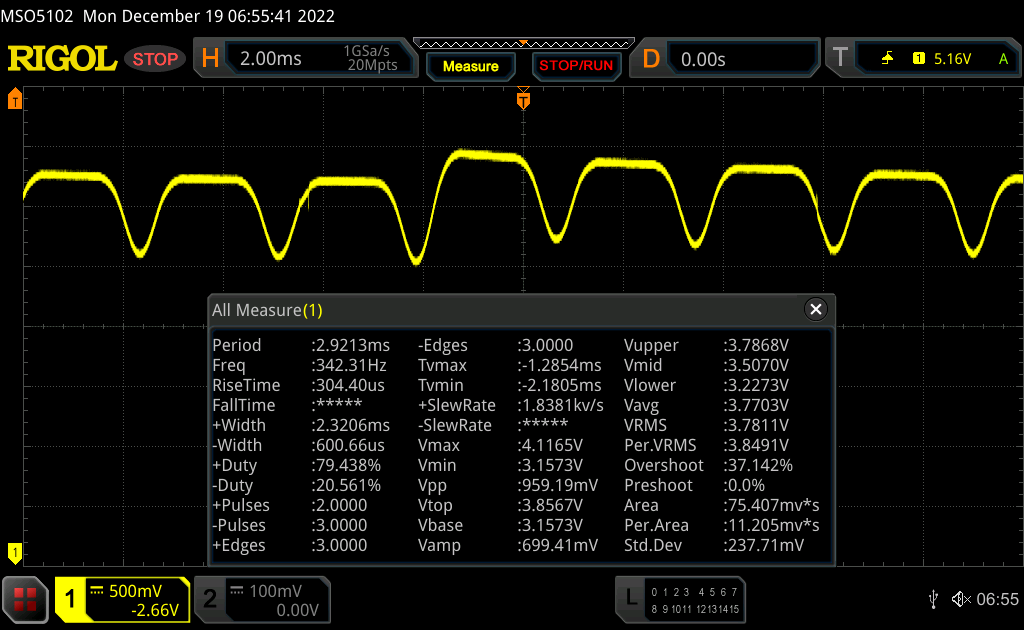 |
The display backlight flickers at 342 Hz (worst case, e.g., utilizing PWM) Flickering detected at a brightness setting of 100 % and below. There should be no flickering or PWM above this brightness setting. The frequency of 342 Hz is relatively high, so most users sensitive to PWM should not notice any flickering. However, there are reports that some users are still sensitive to PWM at 500 Hz and above, so be aware. In comparison: 52 % of all tested devices do not use PWM to dim the display. If PWM was detected, an average of 7798 (minimum: 5 - maximum: 343500) Hz was measured. | |||


Performance: Lenovo sets TDP limit higher this time
A description of the component options can be found in our first review of the Lenovo ThinkPad X1 Carbon G10.
Testing Conditions
As always with the ThinkPads, Lenovo uses the Windows performance modes that can be set in the Windows settings. The "Longest Battery Life" mode permanently limits the processor to 11 watts. In the middle level "Better Performance", up to 50 watts is possible as a boost, and the processor is limited to 19 watts for long periods of time. This long-term limit also applies to the "Best Performance" setting, whereby up to 56 watts is possible for short bursts and 28 watts for intermediate stages.
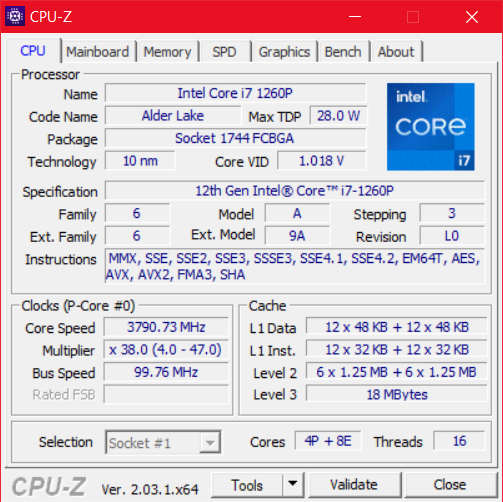
Processor
The Intel Core i7-1260P is a processor from the "Alder-Lake-P28" series. As the name suggests, a total of twelve cores, four of them performance and eight efficiency cores, are designed for a consumption of 28 watts. Our processor list can be used for more extensive benchmark comparisons with other CPUs.
The permanent consumption of 19 watts is well below the 28-watt mark for which this processor is actually intended. On the other hand, this is still an improvement compared to our first review sample of the X1 Carbon G10, whose Intel Core i5-1250P was permanently limited to just 15 watts. In addition, the processor can hold the 28 watts as an intermediate stage longer than in our first review. In terms of CPU performance, the X1 Carbon Gen 10 is thus significantly more competitive. However, it is still clearly inferior to the Lenovo ThinkPad Z13 with its AMD processor.
CPU performance is also fully available in battery mode.
Cinebench R15 Multi Sustained Load
Cinebench R23: Multi Core | Single Core
Cinebench R20: CPU (Multi Core) | CPU (Single Core)
Cinebench R15: CPU Multi 64Bit | CPU Single 64Bit
Blender: v2.79 BMW27 CPU
7-Zip 18.03: 7z b 4 | 7z b 4 -mmt1
Geekbench 5.5: Multi-Core | Single-Core
HWBOT x265 Benchmark v2.2: 4k Preset
LibreOffice : 20 Documents To PDF
R Benchmark 2.5: Overall mean
| CPU Performance rating | |
| Lenovo ThinkPad Z13 G1-21D20016GE | |
| Dell Latitude 9430 2-in-1 -1! | |
| Average of class Office | |
| Average Intel Core i7-1260P | |
| Lenovo ThinkPad X1 Carbon G10 21CB00DCGE | |
| HP Elite Dragonfly G3 | |
| Lenovo ThinkPad X1 Carbon G10 21CC001RGE | |
| Lenovo ThinkPad X1 Carbon G9-20XWCTO1WW | |
| Cinebench R23 / Multi Core | |
| Lenovo ThinkPad Z13 G1-21D20016GE | |
| Average of class Office (1673 - 22808, n=73, last 2 years) | |
| Lenovo ThinkPad X1 Carbon G10 21CB00DCGE | |
| Average Intel Core i7-1260P (3173 - 12150, n=27) | |
| Dell Latitude 9430 2-in-1 | |
| Lenovo ThinkPad X1 Carbon G10 21CC001RGE | |
| HP Elite Dragonfly G3 | |
| Lenovo ThinkPad X1 Carbon G9-20XWCTO1WW | |
| Cinebench R23 / Single Core | |
| Dell Latitude 9430 2-in-1 | |
| Average Intel Core i7-1260P (1155 - 1812, n=25) | |
| Average of class Office (708 - 2130, n=73, last 2 years) | |
| Lenovo ThinkPad X1 Carbon G10 21CB00DCGE | |
| HP Elite Dragonfly G3 | |
| Lenovo ThinkPad X1 Carbon G10 21CC001RGE | |
| Lenovo ThinkPad X1 Carbon G9-20XWCTO1WW | |
| Lenovo ThinkPad Z13 G1-21D20016GE | |
| Cinebench R20 / CPU (Multi Core) | |
| Lenovo ThinkPad Z13 G1-21D20016GE | |
| Average of class Office (648 - 8840, n=72, last 2 years) | |
| Lenovo ThinkPad X1 Carbon G10 21CB00DCGE | |
| Average Intel Core i7-1260P (1234 - 4748, n=25) | |
| Dell Latitude 9430 2-in-1 | |
| HP Elite Dragonfly G3 | |
| Lenovo ThinkPad X1 Carbon G10 21CC001RGE | |
| Lenovo ThinkPad X1 Carbon G9-20XWCTO1WW | |
| Cinebench R20 / CPU (Single Core) | |
| Dell Latitude 9430 2-in-1 | |
| Average of class Office (345 - 816, n=72, last 2 years) | |
| Average Intel Core i7-1260P (448 - 698, n=25) | |
| Lenovo ThinkPad X1 Carbon G10 21CB00DCGE | |
| Lenovo ThinkPad Z13 G1-21D20016GE | |
| HP Elite Dragonfly G3 | |
| Lenovo ThinkPad X1 Carbon G9-20XWCTO1WW | |
| Lenovo ThinkPad X1 Carbon G10 21CC001RGE | |
| Cinebench R15 / CPU Multi 64Bit | |
| Lenovo ThinkPad Z13 G1-21D20016GE | |
| Average of class Office (250 - 3380, n=74, last 2 years) | |
| Lenovo ThinkPad X1 Carbon G10 21CB00DCGE | |
| Dell Latitude 9430 2-in-1 | |
| Average Intel Core i7-1260P (549 - 2034, n=29) | |
| Lenovo ThinkPad X1 Carbon G10 21CC001RGE | |
| HP Elite Dragonfly G3 | |
| Lenovo ThinkPad X1 Carbon G9-20XWCTO1WW | |
| Cinebench R15 / CPU Single 64Bit | |
| Dell Latitude 9430 2-in-1 | |
| Average of class Office (99.5 - 312, n=74, last 2 years) | |
| Lenovo ThinkPad Z13 G1-21D20016GE | |
| Average Intel Core i7-1260P (165.4 - 260, n=27) | |
| HP Elite Dragonfly G3 | |
| Lenovo ThinkPad X1 Carbon G9-20XWCTO1WW | |
| Lenovo ThinkPad X1 Carbon G10 21CC001RGE | |
| Lenovo ThinkPad X1 Carbon G10 21CB00DCGE | |
| Blender / v2.79 BMW27 CPU | |
| Lenovo ThinkPad X1 Carbon G9-20XWCTO1WW | |
| Lenovo ThinkPad X1 Carbon G10 21CC001RGE | |
| HP Elite Dragonfly G3 | |
| Average Intel Core i7-1260P (264 - 906, n=26) | |
| Average of class Office (158 - 1940, n=73, last 2 years) | |
| Lenovo ThinkPad X1 Carbon G10 21CB00DCGE | |
| Lenovo ThinkPad Z13 G1-21D20016GE | |
| 7-Zip 18.03 / 7z b 4 | |
| Lenovo ThinkPad Z13 G1-21D20016GE | |
| Average of class Office (7098 - 76886, n=75, last 2 years) | |
| Lenovo ThinkPad X1 Carbon G10 21CB00DCGE | |
| Average Intel Core i7-1260P (16146 - 47064, n=25) | |
| Dell Latitude 9430 2-in-1 | |
| HP Elite Dragonfly G3 | |
| Lenovo ThinkPad X1 Carbon G10 21CC001RGE | |
| Lenovo ThinkPad X1 Carbon G9-20XWCTO1WW | |
| 7-Zip 18.03 / 7z b 4 -mmt1 | |
| Dell Latitude 9430 2-in-1 | |
| Average of class Office (3387 - 6469, n=74, last 2 years) | |
| Lenovo ThinkPad Z13 G1-21D20016GE | |
| Average Intel Core i7-1260P (4064 - 5791, n=25) | |
| Lenovo ThinkPad X1 Carbon G10 21CB00DCGE | |
| Lenovo ThinkPad X1 Carbon G9-20XWCTO1WW | |
| HP Elite Dragonfly G3 | |
| Lenovo ThinkPad X1 Carbon G10 21CC001RGE | |
| Geekbench 5.5 / Multi-Core | |
| Dell Latitude 9430 2-in-1 | |
| Average of class Office (1483 - 16999, n=71, last 2 years) | |
| Average Intel Core i7-1260P (3866 - 10570, n=25) | |
| Lenovo ThinkPad X1 Carbon G10 21CB00DCGE | |
| Lenovo ThinkPad Z13 G1-21D20016GE | |
| HP Elite Dragonfly G3 | |
| Lenovo ThinkPad X1 Carbon G10 21CC001RGE | |
| Lenovo ThinkPad X1 Carbon G9-20XWCTO1WW | |
| Geekbench 5.5 / Single-Core | |
| Average of class Office (811 - 2128, n=71, last 2 years) | |
| Dell Latitude 9430 2-in-1 | |
| Lenovo ThinkPad X1 Carbon G10 21CB00DCGE | |
| Average Intel Core i7-1260P (1436 - 1786, n=25) | |
| Lenovo ThinkPad X1 Carbon G10 21CC001RGE | |
| Lenovo ThinkPad X1 Carbon G9-20XWCTO1WW | |
| HP Elite Dragonfly G3 | |
| Lenovo ThinkPad Z13 G1-21D20016GE | |
| HWBOT x265 Benchmark v2.2 / 4k Preset | |
| Lenovo ThinkPad Z13 G1-21D20016GE | |
| Average of class Office (2.21 - 26, n=73, last 2 years) | |
| Average Intel Core i7-1260P (3.45 - 13.6, n=26) | |
| Dell Latitude 9430 2-in-1 | |
| Lenovo ThinkPad X1 Carbon G10 21CB00DCGE | |
| HP Elite Dragonfly G3 | |
| Lenovo ThinkPad X1 Carbon G10 21CC001RGE | |
| Lenovo ThinkPad X1 Carbon G9-20XWCTO1WW | |
| LibreOffice / 20 Documents To PDF | |
| HP Elite Dragonfly G3 | |
| Average of class Office (41.5 - 102.3, n=73, last 2 years) | |
| Lenovo ThinkPad X1 Carbon G10 21CC001RGE | |
| Lenovo ThinkPad Z13 G1-21D20016GE | |
| Average Intel Core i7-1260P (40.2 - 65.7, n=25) | |
| Lenovo ThinkPad X1 Carbon G10 21CB00DCGE | |
| Dell Latitude 9430 2-in-1 | |
| Lenovo ThinkPad X1 Carbon G9-20XWCTO1WW | |
| R Benchmark 2.5 / Overall mean | |
| Lenovo ThinkPad X1 Carbon G9-20XWCTO1WW | |
| Lenovo ThinkPad X1 Carbon G10 21CC001RGE | |
| HP Elite Dragonfly G3 | |
| Average of class Office (0.4098 - 0.888, n=73, last 2 years) | |
| Lenovo ThinkPad X1 Carbon G10 21CB00DCGE | |
| Lenovo ThinkPad Z13 G1-21D20016GE | |
| Average Intel Core i7-1260P (0.4559 - 0.727, n=25) | |
| Dell Latitude 9430 2-in-1 | |
* ... smaller is better
AIDA64: FP32 Ray-Trace | FPU Julia | CPU SHA3 | CPU Queen | FPU SinJulia | FPU Mandel | CPU AES | CPU ZLib | FP64 Ray-Trace | CPU PhotoWorxx
| Performance rating | |
| Lenovo ThinkPad Z13 G1-21D20016GE | |
| Average of class Office | |
| Dell Latitude 9430 2-in-1 | |
| Average Intel Core i7-1260P | |
| Lenovo ThinkPad X1 Carbon G9-20XWCTO1WW | |
| Lenovo ThinkPad X1 Carbon G10 21CB00DCGE | |
| HP Elite Dragonfly G3 | |
| Lenovo ThinkPad X1 Carbon G10 21CC001RGE | |
| AIDA64 / FP32 Ray-Trace | |
| Average of class Office (2083 - 31245, n=79, last 2 years) | |
| Lenovo ThinkPad Z13 G1-21D20016GE | |
| Dell Latitude 9430 2-in-1 | |
| Lenovo ThinkPad X1 Carbon G9-20XWCTO1WW | |
| Lenovo ThinkPad X1 Carbon G10 21CB00DCGE | |
| Average Intel Core i7-1260P (2176 - 10898, n=26) | |
| HP Elite Dragonfly G3 | |
| Lenovo ThinkPad X1 Carbon G10 21CC001RGE | |
| AIDA64 / FPU Julia | |
| Lenovo ThinkPad Z13 G1-21D20016GE | |
| Average of class Office (8191 - 125394, n=79, last 2 years) | |
| Dell Latitude 9430 2-in-1 | |
| Lenovo ThinkPad X1 Carbon G10 21CB00DCGE | |
| Average Intel Core i7-1260P (11015 - 56906, n=26) | |
| HP Elite Dragonfly G3 | |
| Lenovo ThinkPad X1 Carbon G9-20XWCTO1WW | |
| Lenovo ThinkPad X1 Carbon G10 21CC001RGE | |
| AIDA64 / CPU SHA3 | |
| Lenovo ThinkPad Z13 G1-21D20016GE | |
| Average of class Office (433 - 5755, n=79, last 2 years) | |
| Dell Latitude 9430 2-in-1 | |
| Lenovo ThinkPad X1 Carbon G9-20XWCTO1WW | |
| Average Intel Core i7-1260P (669 - 2709, n=26) | |
| HP Elite Dragonfly G3 | |
| Lenovo ThinkPad X1 Carbon G10 21CB00DCGE | |
| Lenovo ThinkPad X1 Carbon G10 21CC001RGE | |
| AIDA64 / CPU Queen | |
| Lenovo ThinkPad Z13 G1-21D20016GE | |
| Lenovo ThinkPad X1 Carbon G10 21CB00DCGE | |
| Average Intel Core i7-1260P (42571 - 82493, n=26) | |
| Lenovo ThinkPad X1 Carbon G10 21CC001RGE | |
| Dell Latitude 9430 2-in-1 | |
| Average of class Office (22784 - 115197, n=69, last 2 years) | |
| HP Elite Dragonfly G3 | |
| Lenovo ThinkPad X1 Carbon G9-20XWCTO1WW | |
| AIDA64 / FPU SinJulia | |
| Lenovo ThinkPad Z13 G1-21D20016GE | |
| Average of class Office (1378 - 18321, n=79, last 2 years) | |
| Average Intel Core i7-1260P (2901 - 6975, n=26) | |
| Dell Latitude 9430 2-in-1 | |
| Lenovo ThinkPad X1 Carbon G10 21CB00DCGE | |
| Lenovo ThinkPad X1 Carbon G10 21CC001RGE | |
| Lenovo ThinkPad X1 Carbon G9-20XWCTO1WW | |
| HP Elite Dragonfly G3 | |
| AIDA64 / FPU Mandel | |
| Lenovo ThinkPad Z13 G1-21D20016GE | |
| Average of class Office (4601 - 66922, n=79, last 2 years) | |
| Dell Latitude 9430 2-in-1 | |
| Lenovo ThinkPad X1 Carbon G9-20XWCTO1WW | |
| Lenovo ThinkPad X1 Carbon G10 21CB00DCGE | |
| Average Intel Core i7-1260P (5950 - 26376, n=26) | |
| HP Elite Dragonfly G3 | |
| Lenovo ThinkPad X1 Carbon G10 21CC001RGE | |
| AIDA64 / CPU AES | |
| Lenovo ThinkPad X1 Carbon G9-20XWCTO1WW | |
| Lenovo ThinkPad Z13 G1-21D20016GE | |
| Average of class Office (4854 - 155900, n=79, last 2 years) | |
| Average Intel Core i7-1260P (16041 - 92356, n=26) | |
| Dell Latitude 9430 2-in-1 | |
| Lenovo ThinkPad X1 Carbon G10 21CB00DCGE | |
| HP Elite Dragonfly G3 | |
| Lenovo ThinkPad X1 Carbon G10 21CC001RGE | |
| AIDA64 / CPU ZLib | |
| Average of class Office (114.6 - 1366, n=79, last 2 years) | |
| Lenovo ThinkPad Z13 G1-21D20016GE | |
| Dell Latitude 9430 2-in-1 | |
| Average Intel Core i7-1260P (259 - 771, n=26) | |
| Lenovo ThinkPad X1 Carbon G10 21CC001RGE | |
| HP Elite Dragonfly G3 | |
| Lenovo ThinkPad X1 Carbon G10 21CB00DCGE | |
| Lenovo ThinkPad X1 Carbon G9-20XWCTO1WW | |
| AIDA64 / FP64 Ray-Trace | |
| Average of class Office (1109 - 17834, n=79, last 2 years) | |
| Lenovo ThinkPad Z13 G1-21D20016GE | |
| Dell Latitude 9430 2-in-1 | |
| Lenovo ThinkPad X1 Carbon G9-20XWCTO1WW | |
| Average Intel Core i7-1260P (1237 - 5858, n=26) | |
| Lenovo ThinkPad X1 Carbon G10 21CB00DCGE | |
| HP Elite Dragonfly G3 | |
| Lenovo ThinkPad X1 Carbon G10 21CC001RGE | |
| AIDA64 / CPU PhotoWorxx | |
| Dell Latitude 9430 2-in-1 | |
| HP Elite Dragonfly G3 | |
| Lenovo ThinkPad X1 Carbon G9-20XWCTO1WW | |
| Lenovo ThinkPad X1 Carbon G10 21CB00DCGE | |
| Average of class Office (11090 - 65229, n=79, last 2 years) | |
| Lenovo ThinkPad X1 Carbon G10 21CC001RGE | |
| Average Intel Core i7-1260P (13261 - 43652, n=26) | |
| Lenovo ThinkPad Z13 G1-21D20016GE | |
System Performance
The synthetic system performance benchmarks are similar to the CPU tests. The Lenovo ThinkPad X1 Carbon Gen 10 30th Anniversary Edition works fast, but does not take pole position. In everyday use, it proves to be a very responsive device.
CrossMark: Overall | Productivity | Creativity | Responsiveness
| PCMark 10 / Score | |
| Average of class Office (2601 - 9298, n=63, last 2 years) | |
| Lenovo ThinkPad Z13 G1-21D20016GE | |
| Average Intel Core i7-1260P, Intel Iris Xe Graphics G7 96EUs (4796 - 6068, n=17) | |
| Dell Latitude 9430 2-in-1 | |
| Lenovo ThinkPad X1 Carbon G10 21CB00DCGE | |
| Lenovo ThinkPad X1 Carbon G10 21CC001RGE | |
| Lenovo ThinkPad X1 Carbon G9-20XWCTO1WW | |
| HP Elite Dragonfly G3 | |
| PCMark 10 / Essentials | |
| Dell Latitude 9430 2-in-1 | |
| Average Intel Core i7-1260P, Intel Iris Xe Graphics G7 96EUs (9260 - 11251, n=17) | |
| Lenovo ThinkPad Z13 G1-21D20016GE | |
| Lenovo ThinkPad X1 Carbon G10 21CC001RGE | |
| Lenovo ThinkPad X1 Carbon G9-20XWCTO1WW | |
| Average of class Office (3245 - 11594, n=63, last 2 years) | |
| Lenovo ThinkPad X1 Carbon G10 21CB00DCGE | |
| HP Elite Dragonfly G3 | |
| PCMark 10 / Productivity | |
| Average of class Office (5336 - 17243, n=63, last 2 years) | |
| Lenovo ThinkPad Z13 G1-21D20016GE | |
| Dell Latitude 9430 2-in-1 | |
| Average Intel Core i7-1260P, Intel Iris Xe Graphics G7 96EUs (6167 - 8629, n=17) | |
| Lenovo ThinkPad X1 Carbon G9-20XWCTO1WW | |
| Lenovo ThinkPad X1 Carbon G10 21CB00DCGE | |
| Lenovo ThinkPad X1 Carbon G10 21CC001RGE | |
| HP Elite Dragonfly G3 | |
| PCMark 10 / Digital Content Creation | |
| Average of class Office (2049 - 13541, n=63, last 2 years) | |
| Lenovo ThinkPad Z13 G1-21D20016GE | |
| Lenovo ThinkPad X1 Carbon G10 21CB00DCGE | |
| Average Intel Core i7-1260P, Intel Iris Xe Graphics G7 96EUs (5231 - 6908, n=17) | |
| Dell Latitude 9430 2-in-1 | |
| HP Elite Dragonfly G3 | |
| Lenovo ThinkPad X1 Carbon G10 21CC001RGE | |
| Lenovo ThinkPad X1 Carbon G9-20XWCTO1WW | |
| CrossMark / Overall | |
| Average Intel Core i7-1260P, Intel Iris Xe Graphics G7 96EUs (1484 - 1811, n=16) | |
| Dell Latitude 9430 2-in-1 | |
| Lenovo ThinkPad X1 Carbon G10 21CB00DCGE | |
| Lenovo ThinkPad X1 Carbon G10 21CC001RGE | |
| Lenovo ThinkPad Z13 G1-21D20016GE | |
| Average of class Office (381 - 2010, n=74, last 2 years) | |
| HP Elite Dragonfly G3 | |
| CrossMark / Productivity | |
| Average Intel Core i7-1260P, Intel Iris Xe Graphics G7 96EUs (1486 - 1755, n=16) | |
| Dell Latitude 9430 2-in-1 | |
| Lenovo ThinkPad Z13 G1-21D20016GE | |
| Lenovo ThinkPad X1 Carbon G10 21CB00DCGE | |
| Lenovo ThinkPad X1 Carbon G10 21CC001RGE | |
| Average of class Office (464 - 1880, n=74, last 2 years) | |
| HP Elite Dragonfly G3 | |
| CrossMark / Creativity | |
| Average Intel Core i7-1260P, Intel Iris Xe Graphics G7 96EUs (1451 - 1872, n=16) | |
| Lenovo ThinkPad X1 Carbon G10 21CB00DCGE | |
| Dell Latitude 9430 2-in-1 | |
| Lenovo ThinkPad X1 Carbon G10 21CC001RGE | |
| Average of class Office (319 - 2361, n=74, last 2 years) | |
| Lenovo ThinkPad Z13 G1-21D20016GE | |
| HP Elite Dragonfly G3 | |
| CrossMark / Responsiveness | |
| Average Intel Core i7-1260P, Intel Iris Xe Graphics G7 96EUs (1253 - 1807, n=16) | |
| Dell Latitude 9430 2-in-1 | |
| Lenovo ThinkPad X1 Carbon G10 21CC001RGE | |
| Lenovo ThinkPad X1 Carbon G10 21CB00DCGE | |
| Lenovo ThinkPad Z13 G1-21D20016GE | |
| Average of class Office (360 - 1690, n=74, last 2 years) | |
| HP Elite Dragonfly G3 | |
| PCMark 10 Score | 5411 points | |
Help | ||
| AIDA64 / Memory Copy | |
| Dell Latitude 9430 2-in-1 | |
| HP Elite Dragonfly G3 | |
| Average of class Office (20075 - 110930, n=76, last 2 years) | |
| Lenovo ThinkPad X1 Carbon G10 21CC001RGE | |
| Lenovo ThinkPad X1 Carbon G10 21CB00DCGE | |
| Lenovo ThinkPad X1 Carbon G9-20XWCTO1WW | |
| Average Intel Core i7-1260P (25125 - 71544, n=25) | |
| Lenovo ThinkPad Z13 G1-21D20016GE | |
| AIDA64 / Memory Read | |
| Lenovo ThinkPad X1 Carbon G10 21CC001RGE | |
| Lenovo ThinkPad X1 Carbon G10 21CB00DCGE | |
| Average of class Office (10084 - 128030, n=77, last 2 years) | |
| HP Elite Dragonfly G3 | |
| Dell Latitude 9430 2-in-1 | |
| Lenovo ThinkPad X1 Carbon G9-20XWCTO1WW | |
| Average Intel Core i7-1260P (24983 - 72065, n=25) | |
| Lenovo ThinkPad Z13 G1-21D20016GE | |
| AIDA64 / Memory Write | |
| Average of class Office (20073 - 119858, n=77, last 2 years) | |
| Dell Latitude 9430 2-in-1 | |
| Lenovo ThinkPad X1 Carbon G10 21CB00DCGE | |
| Lenovo ThinkPad X1 Carbon G9-20XWCTO1WW | |
| Lenovo ThinkPad X1 Carbon G10 21CC001RGE | |
| HP Elite Dragonfly G3 | |
| Average Intel Core i7-1260P (23512 - 66799, n=25) | |
| Lenovo ThinkPad Z13 G1-21D20016GE | |
| AIDA64 / Memory Latency | |
| Lenovo ThinkPad Z13 G1-21D20016GE | |
| HP Elite Dragonfly G3 | |
| Dell Latitude 9430 2-in-1 | |
| Average of class Office (7.6 - 162.9, n=72, last 2 years) | |
| Lenovo ThinkPad X1 Carbon G10 21CB00DCGE | |
| Lenovo ThinkPad X1 Carbon G9-20XWCTO1WW | |
| Average Intel Core i7-1260P (77.9 - 118.4, n=21) | |
| Lenovo ThinkPad X1 Carbon G10 21CC001RGE | |
| Lenovo ThinkPad X1 Carbon G10 21CC001RGE | |
* ... smaller is better
DPC Latency
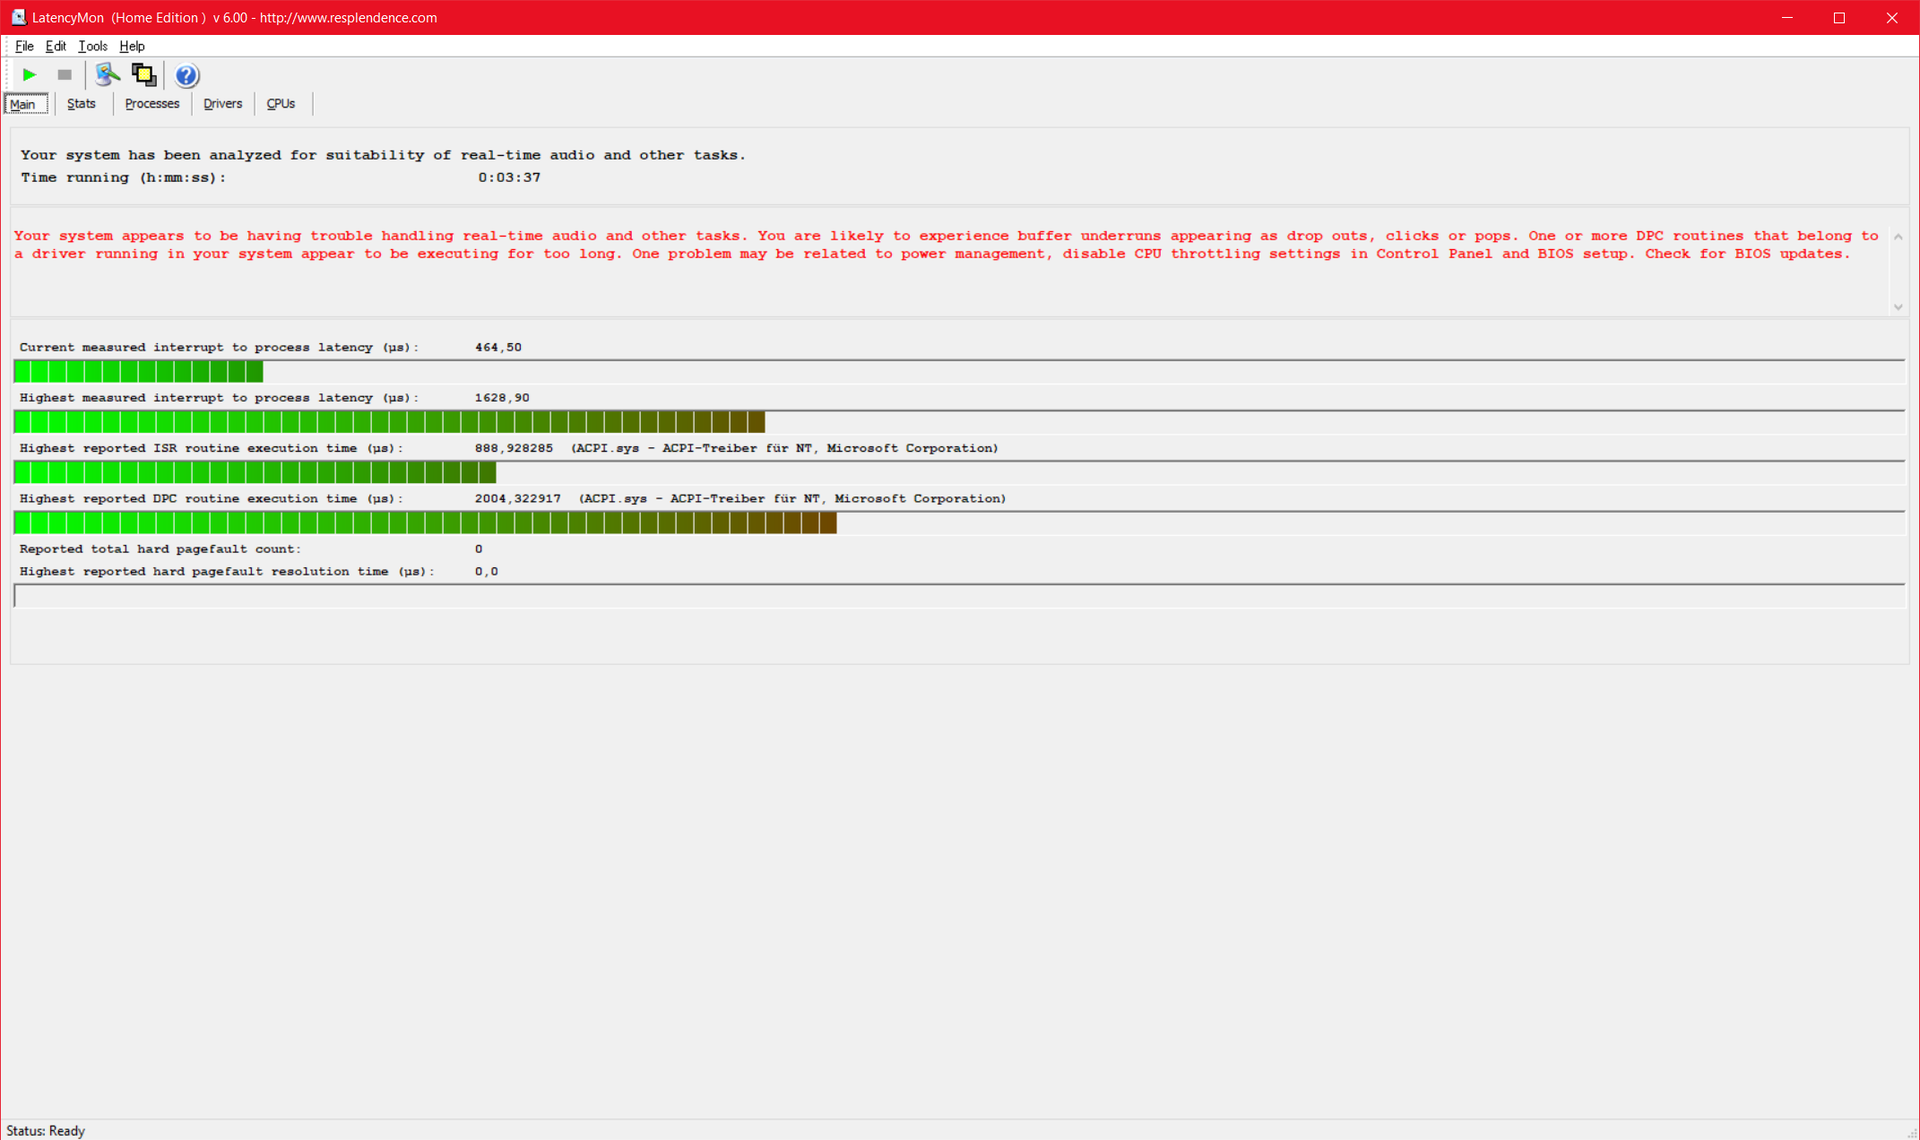
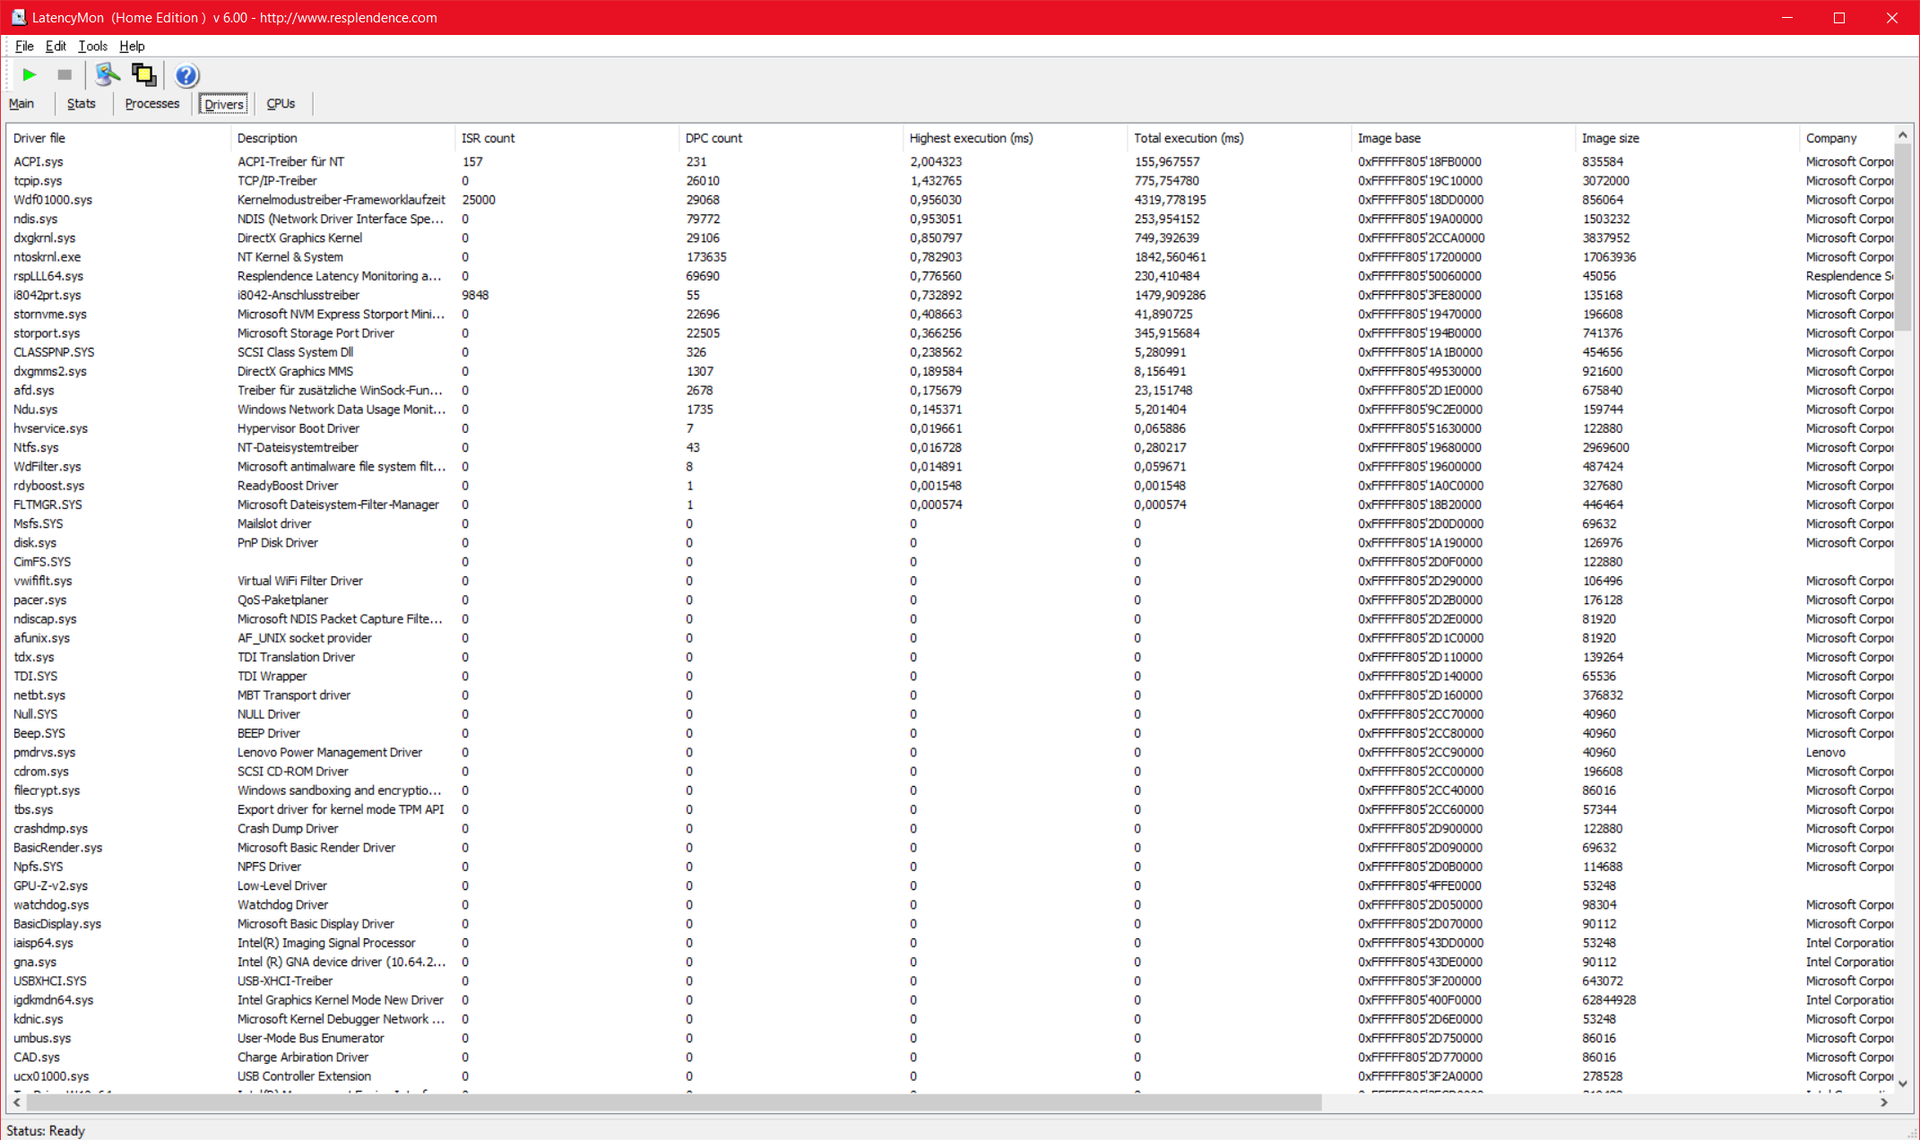
| DPC Latencies / LatencyMon - interrupt to process latency (max), Web, Youtube, Prime95 | |
| Lenovo ThinkPad X1 Carbon G10 21CC001RGE | |
| Lenovo ThinkPad X1 Carbon G10 21CB00DCGE | |
| HP Elite Dragonfly G3 | |
| Dell Latitude 9430 2-in-1 | |
| Lenovo ThinkPad Z13 G1-21D20016GE | |
| Lenovo ThinkPad X1 Carbon G9-20XWCTO1WW | |
* ... smaller is better
Storage Devices
The M.2 SSD PM91A with a capacity of 512 GB comes from Samsung. It's connected to the NVMe PCIe 4.0 standard and works fast, albeit slightly below average for this SSD. At least performance is completely stable, even under permanent load.

* ... smaller is better
Sustained Read Performance: DiskSpd Read Loop, Queue Depth 8
Graphics Card
Compared to our first review sample of the X1 Carbon 2022, there also has been a change to the GPU, because the Intel Iris Xe installed here has 96 instead of 80 execution units. This results in a slight performance increase, but doesn't really make a big difference. The GPU is sufficient for simple tasks, but the X1 Carbon G10 is the wrong notebook for everything else, including both games and CAD.
| 3DMark 11 Performance | 5769 points | |
| 3DMark Cloud Gate Standard Score | 14688 points | |
| 3DMark Fire Strike Score | 4154 points | |
| 3DMark Time Spy Score | 1722 points | |
Help | ||
* ... smaller is better
| The Witcher 3 - 1920x1080 Ultra Graphics & Postprocessing (HBAO+) | |
| Lenovo ThinkPad Z13 G1-21D20016GE | |
| Average of class Office (14.8 - 18.1, n=4, last 2 years) | |
| Dell Latitude 9430 2-in-1 | |
| HP Elite Dragonfly G3 | |
| Lenovo ThinkPad X1 Carbon G10 21CB00DCGE | |
| Lenovo ThinkPad X1 Carbon G10 21CC001RGE | |
| Final Fantasy XV Benchmark - 1920x1080 High Quality | |
| Average of class Office (8.09 - 79.5, n=67, last 2 years) | |
| Lenovo ThinkPad Z13 G1-21D20016GE | |
| Dell Latitude 9430 2-in-1 | |
| HP Elite Dragonfly G3 | |
| Lenovo ThinkPad X1 Carbon G10 21CB00DCGE | |
| Lenovo ThinkPad X1 Carbon G10 21CC001RGE | |
| Strange Brigade - 1920x1080 ultra AA:ultra AF:16 | |
| Lenovo ThinkPad Z13 G1-21D20016GE | |
| Average of class Office (12.9 - 142.1, n=50, last 2 years) | |
| Dell Latitude 9430 2-in-1 | |
| HP Elite Dragonfly G3 | |
| Lenovo ThinkPad X1 Carbon G10 21CB00DCGE | |
| Dota 2 Reborn - 1920x1080 ultra (3/3) best looking | |
| Lenovo ThinkPad Z13 G1-21D20016GE | |
| Dell Latitude 9430 2-in-1 | |
| Average of class Office (14.6 - 135, n=73, last 2 years) | |
| HP Elite Dragonfly G3 | |
| Lenovo ThinkPad X1 Carbon G10 21CB00DCGE | |
| Lenovo ThinkPad X1 Carbon G10 21CC001RGE | |
Witcher 3 FPS Chart
| low | med. | high | ultra | QHD | |
|---|---|---|---|---|---|
| The Witcher 3 (2015) | 83.3 | 51 | 27.2 | 12.9 | |
| Dota 2 Reborn (2015) | 99.8 | 74.7 | 50.3 | 43.5 | |
| Final Fantasy XV Benchmark (2018) | 39.8 | 18.6 | 13 | 9.59 | |
| X-Plane 11.11 (2018) | 38.1 | 38.2 | 34.2 | ||
| Strange Brigade (2018) | 79.2 | 34.2 | 25.8 | 19.8 |
Emissions: Increased performance means greater fan noise
Noise
While performance values have improved, it is the opposite with fan noise, which are louder than in our first review sample and also run more frequently. Even in idle mode, the cooling system occasionally occasionally kicks in. By comparison, only the Lenovo ThinkPad Z13 has a louder cooling under load. The ThinkPad X1 Carbon G10 is therefore not necessarily the right choice for lovers of silence, especially since the fans are also relatively high-frequency.
No coil whine was detected.
Noise level
| Idle |
| 22.8 / 22.8 / 24.6 dB(A) |
| Load |
| 38.2 / 38.2 dB(A) |
 | ||
30 dB silent 40 dB(A) audible 50 dB(A) loud |
||
min: | ||
| Lenovo ThinkPad X1 Carbon G10 21CB00DCGE Iris Xe G7 96EUs, i7-1260P, Samsung PM9A1 MZVL2512HCJQ | Lenovo ThinkPad X1 Carbon G10 21CC001RGE Iris Xe G7 80EUs, i5-1250P, Samsung PM9A1 MZVL2512HCJQ | Lenovo ThinkPad X1 Carbon G9-20XWCTO1WW Iris Xe G7 96EUs, i7-1165G7, Samsung PM9A1 MZVL21T0HCLR | Lenovo ThinkPad Z13 G1-21D20016GE Radeon 680M, R7 PRO 6860Z, Micron 2450 1TB MTFDKCD1T0TFK | HP Elite Dragonfly G3 Iris Xe G7 96EUs, i7-1265U, Micron 3400 MTFDKBA512TFH 512GB | Dell Latitude 9430 2-in-1 Iris Xe G7 96EUs, i7-1265U | |
|---|---|---|---|---|---|---|
| Noise | 5% | 2% | -6% | 9% | -4% | |
| off / environment * (dB) | 22.8 | 22.81 -0% | 23.66 -4% | 24.3 -7% | 22.8 -0% | 23.7 -4% |
| Idle Minimum * (dB) | 22.8 | 22.81 -0% | 23.6 -4% | 24.3 -7% | 23.2 -2% | 23.7 -4% |
| Idle Average * (dB) | 22.8 | 22.81 -0% | 23.6 -4% | 24.3 -7% | 23.2 -2% | 23.7 -4% |
| Idle Maximum * (dB) | 24.6 | 22.81 7% | 23.6 4% | 24.3 1% | 23.2 6% | 23.7 4% |
| Load Average * (dB) | 38.2 | 31.59 17% | 33.5 12% | 41 -7% | 25.1 34% | 35.1 8% |
| Witcher 3 ultra * (dB) | 38.1 | 35.59 7% | 41 -8% | 32 16% | 43.3 -14% | |
| Load Maximum * (dB) | 38.2 | 35.47 7% | 34.3 10% | 41 -7% | 35.2 8% | 43 -13% |
* ... smaller is better
Temperature
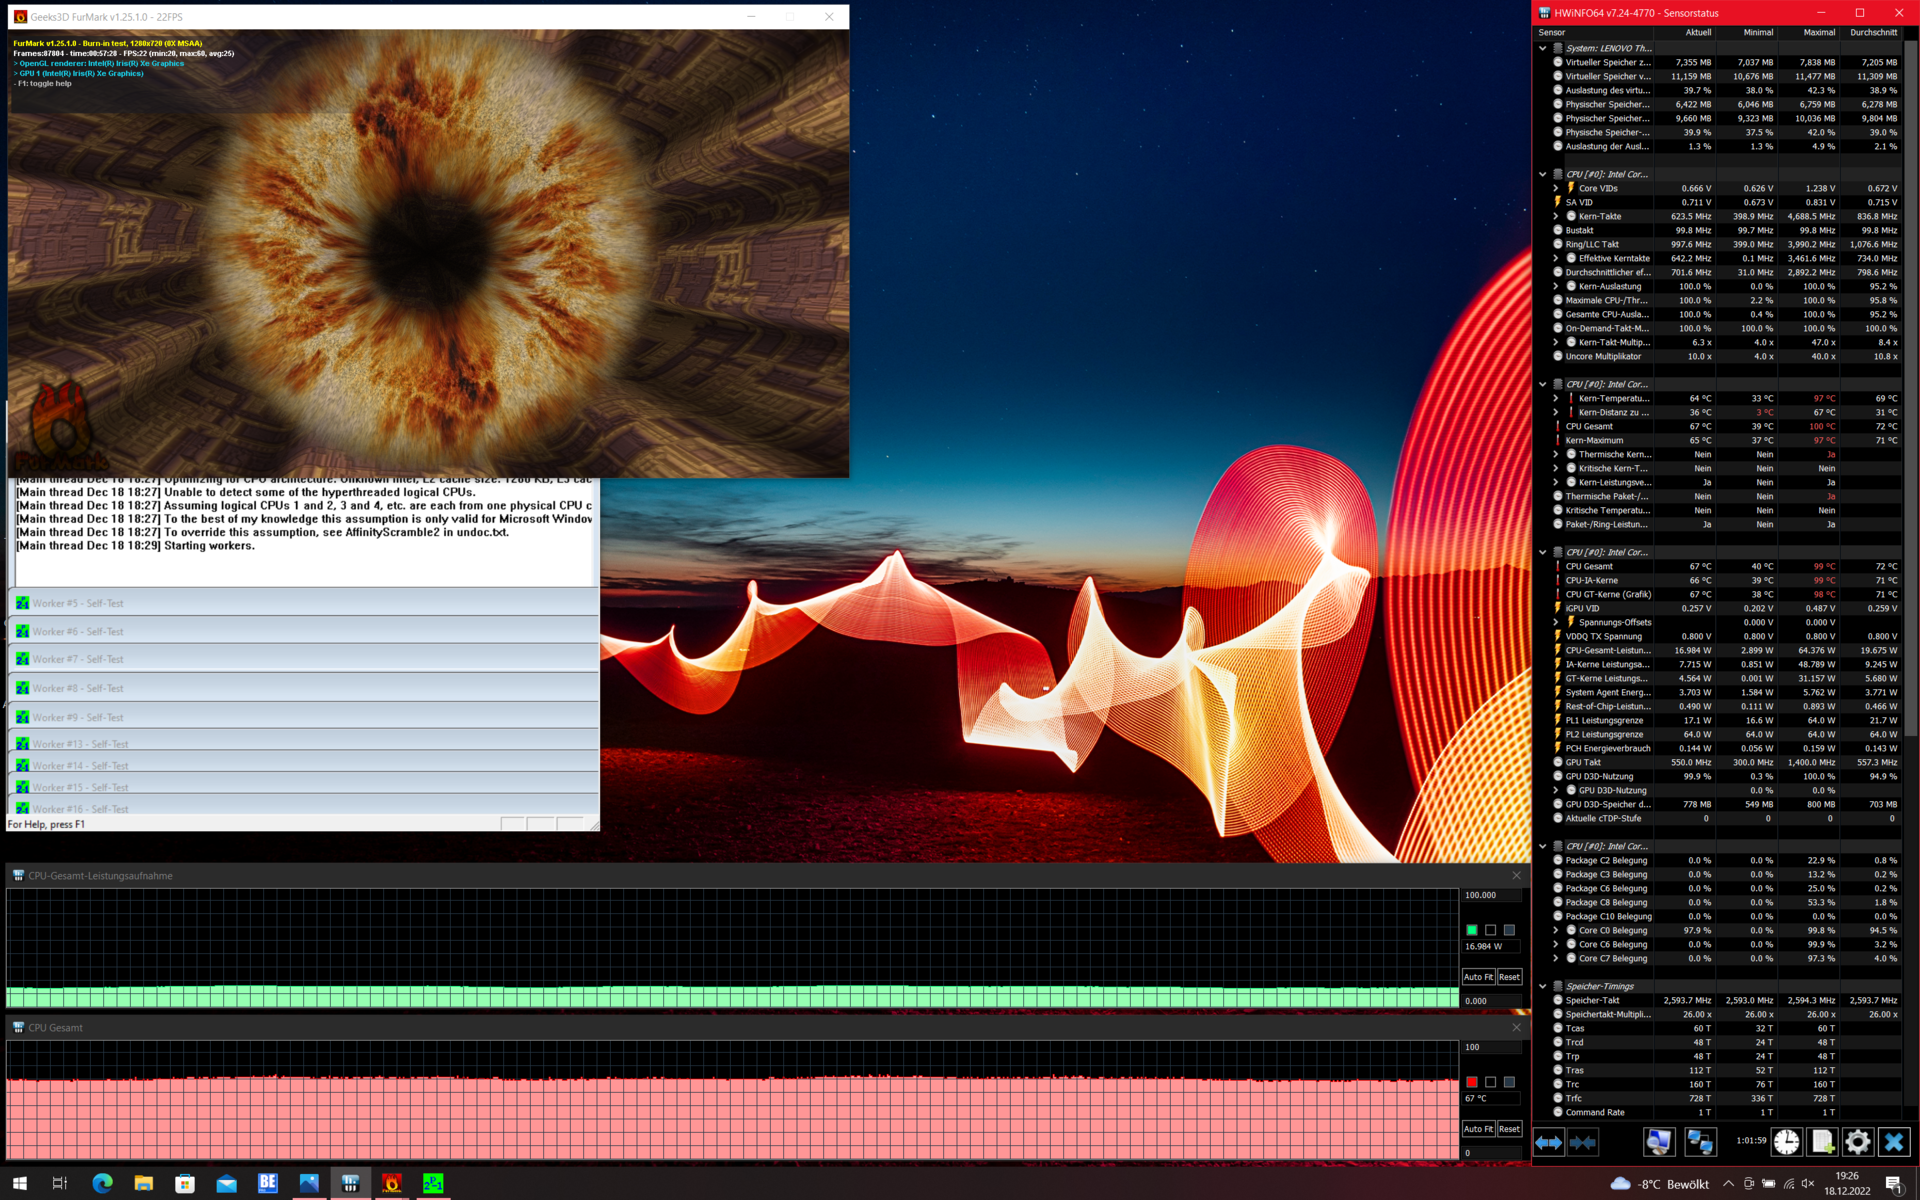
Most heat development is concentrated in the upper left corner of the case. Around 50 degrees Celsius is reached here under load, both on the top and bottom, and even a little more in the Witcher 3 test. Thankfully, these are areas that are not typically touched during use, but the Lenovo ThinkPad X1 Carbon G10 30th Anniversary Edition certainly cannot be described as a cool-running laptop.
During stress testing, i.e. the simultaneous load of GPU and CPU, the processor is permanently limited to just 17 watts. This TDP-related throttling has no further impact on everyday use, apart from the already existing limitation of the CPU performance. In this case, the GPU consumes an additional part of the TDP budget.
(-) The maximum temperature on the upper side is 50 °C / 122 F, compared to the average of 34.3 °C / 94 F, ranging from 21.2 to 62.5 °C for the class Office.
(-) The bottom heats up to a maximum of 49.7 °C / 121 F, compared to the average of 36.8 °C / 98 F
(+) In idle usage, the average temperature for the upper side is 27.1 °C / 81 F, compared to the device average of 29.5 °C / 85 F.
(±) Playing The Witcher 3, the average temperature for the upper side is 35.7 °C / 96 F, compared to the device average of 29.5 °C / 85 F.
(+) The palmrests and touchpad are cooler than skin temperature with a maximum of 28.8 °C / 83.8 F and are therefore cool to the touch.
(±) The average temperature of the palmrest area of similar devices was 27.5 °C / 81.5 F (-1.3 °C / -2.3 F).
| Lenovo ThinkPad X1 Carbon G10 21CB00DCGE Intel Core i7-1260P, Intel Iris Xe Graphics G7 96EUs | Lenovo ThinkPad X1 Carbon G10 21CC001RGE Intel Core i5-1250P, Intel Iris Xe Graphics G7 80EUs | Lenovo ThinkPad X1 Carbon G9-20XWCTO1WW Intel Core i7-1165G7, Intel Iris Xe Graphics G7 96EUs | Lenovo ThinkPad Z13 G1-21D20016GE AMD Ryzen 7 PRO 6860Z, AMD Radeon 680M | HP Elite Dragonfly G3 Intel Core i7-1265U, Intel Iris Xe Graphics G7 96EUs | Dell Latitude 9430 2-in-1 Intel Core i7-1265U, Intel Iris Xe Graphics G7 96EUs | |
|---|---|---|---|---|---|---|
| Heat | 6% | 6% | 9% | 17% | 24% | |
| Maximum Upper Side * (°C) | 50 | 45 10% | 51.5 -3% | 45.6 9% | 39 22% | 39.2 22% |
| Maximum Bottom * (°C) | 49.7 | 44 11% | 45.3 9% | 51 -3% | 42.2 15% | 44.8 10% |
| Idle Upper Side * (°C) | 32.4 | 31.2 4% | 29.6 9% | 27 17% | 26.8 17% | 21.4 34% |
| Idle Bottom * (°C) | 32.3 | 33.2 -3% | 30 7% | 27.9 14% | 28.2 13% | 22.4 31% |
* ... smaller is better
Speakers
Compared to the speakers in the Dell Latitude 9430, the four speakers in the Lenovo ThinkPad X1 Carbon G10 are considerably quieter, but somewhat more balanced. The combination of two woofers on the bottom and two tweeters on the top is powerful enough to fill a small room with sound.
Lenovo ThinkPad X1 Carbon G10 21CB00DCGE audio analysis
(±) | speaker loudness is average but good (75.2 dB)
Bass 100 - 315 Hz
(±) | reduced bass - on average 12.8% lower than median
(±) | linearity of bass is average (14.9% delta to prev. frequency)
Mids 400 - 2000 Hz
(+) | balanced mids - only 2.5% away from median
(+) | mids are linear (4.8% delta to prev. frequency)
Highs 2 - 16 kHz
(+) | balanced highs - only 1.1% away from median
(+) | highs are linear (2.8% delta to prev. frequency)
Overall 100 - 16.000 Hz
(+) | overall sound is linear (12.2% difference to median)
Compared to same class
» 5% of all tested devices in this class were better, 2% similar, 94% worse
» The best had a delta of 7%, average was 21%, worst was 53%
Compared to all devices tested
» 10% of all tested devices were better, 2% similar, 88% worse
» The best had a delta of 4%, average was 24%, worst was 134%
Dell Latitude 9430 2-in-1 audio analysis
(+) | speakers can play relatively loud (94.3 dB)
Bass 100 - 315 Hz
(±) | reduced bass - on average 12.3% lower than median
(+) | bass is linear (5.3% delta to prev. frequency)
Mids 400 - 2000 Hz
(+) | balanced mids - only 2% away from median
(+) | mids are linear (4.7% delta to prev. frequency)
Highs 2 - 16 kHz
(±) | higher highs - on average 5.4% higher than median
(+) | highs are linear (3% delta to prev. frequency)
Overall 100 - 16.000 Hz
(+) | overall sound is linear (11.6% difference to median)
Compared to same class
» 10% of all tested devices in this class were better, 4% similar, 87% worse
» The best had a delta of 6%, average was 20%, worst was 57%
Compared to all devices tested
» 8% of all tested devices were better, 2% similar, 90% worse
» The best had a delta of 4%, average was 24%, worst was 134%
Power Management: OLED shortens battery life of the X1 Carbon G10
Power Consumption
The effect of the higher-resolution OLED screen on consumption is clearly a negative aspect. The minimum idle consumption is more than twice as high as the first model of the ThinkPad X1 Carbon G10, which was equipped with an IPS WUXGA panel. At least the X1 Carbon is almost on par with the ThinkPad Z13, which also has an OLED screen.
The power supply is more than adequately sized for the maximum consumption of 62.5 watts, which also only represents the peak load.
| Off / Standby | |
| Idle | |
| Load |
|
Key:
min: | |
| Lenovo ThinkPad X1 Carbon G10 21CB00DCGE i7-1260P, Iris Xe G7 96EUs, Samsung PM9A1 MZVL2512HCJQ, OLED, 2880x1800, 14" | Lenovo ThinkPad X1 Carbon G10 21CC001RGE i5-1250P, Iris Xe G7 80EUs, Samsung PM9A1 MZVL2512HCJQ, IPS LED, 1920x1200, 14" | Lenovo ThinkPad X1 Carbon G9-20XWCTO1WW i7-1165G7, Iris Xe G7 96EUs, Samsung PM9A1 MZVL21T0HCLR, IPS LED, 3840x2400, 14" | Lenovo ThinkPad Z13 G1-21D20016GE R7 PRO 6860Z, Radeon 680M, Micron 2450 1TB MTFDKCD1T0TFK, OLED, 2880x1800, 13.3" | HP Elite Dragonfly G3 i7-1265U, Iris Xe G7 96EUs, Micron 3400 MTFDKBA512TFH 512GB, IPS, 1920x1280, 13.5" | Dell Latitude 9430 2-in-1 i7-1265U, Iris Xe G7 96EUs, , IPS, 2560x1600, 14" | Average Intel Iris Xe Graphics G7 96EUs | Average of class Office | |
|---|---|---|---|---|---|---|---|---|
| Power Consumption | 28% | -10% | -3% | 16% | 19% | -5% | 10% | |
| Idle Minimum * (Watt) | 6.4 | 2.9 55% | 5 22% | 5.7 11% | 3.4 47% | 2.9 55% | 5.51 ? 14% | 4.4 ? 31% |
| Idle Average * (Watt) | 7.4 | 4.9 34% | 10.2 -38% | 7.6 -3% | 5.6 24% | 5.8 22% | 8.66 ? -17% | 7.32 ? 1% |
| Idle Maximum * (Watt) | 8.3 | 6 28% | 11 -33% | 8.4 -1% | 8.4 -1% | 6.6 20% | 10.9 ? -31% | 8.56 ? -3% |
| Load Average * (Watt) | 56.5 | 29.3 48% | 51.7 8% | 54.4 4% | 40.8 28% | 49.2 13% | 45.6 ? 19% | 42.5 ? 25% |
| Witcher 3 ultra * (Watt) | 37.5 | 36.6 2% | 48.1 -28% | 35.5 5% | 35.3 6% | |||
| Load Maximum * (Watt) | 62.5 | 63.3 -1% | 67.5 -8% | 62.7 -0% | 68.4 -9% | 63.1 -1% | 67.8 ? -8% | 64.1 ? -3% |
* ... smaller is better
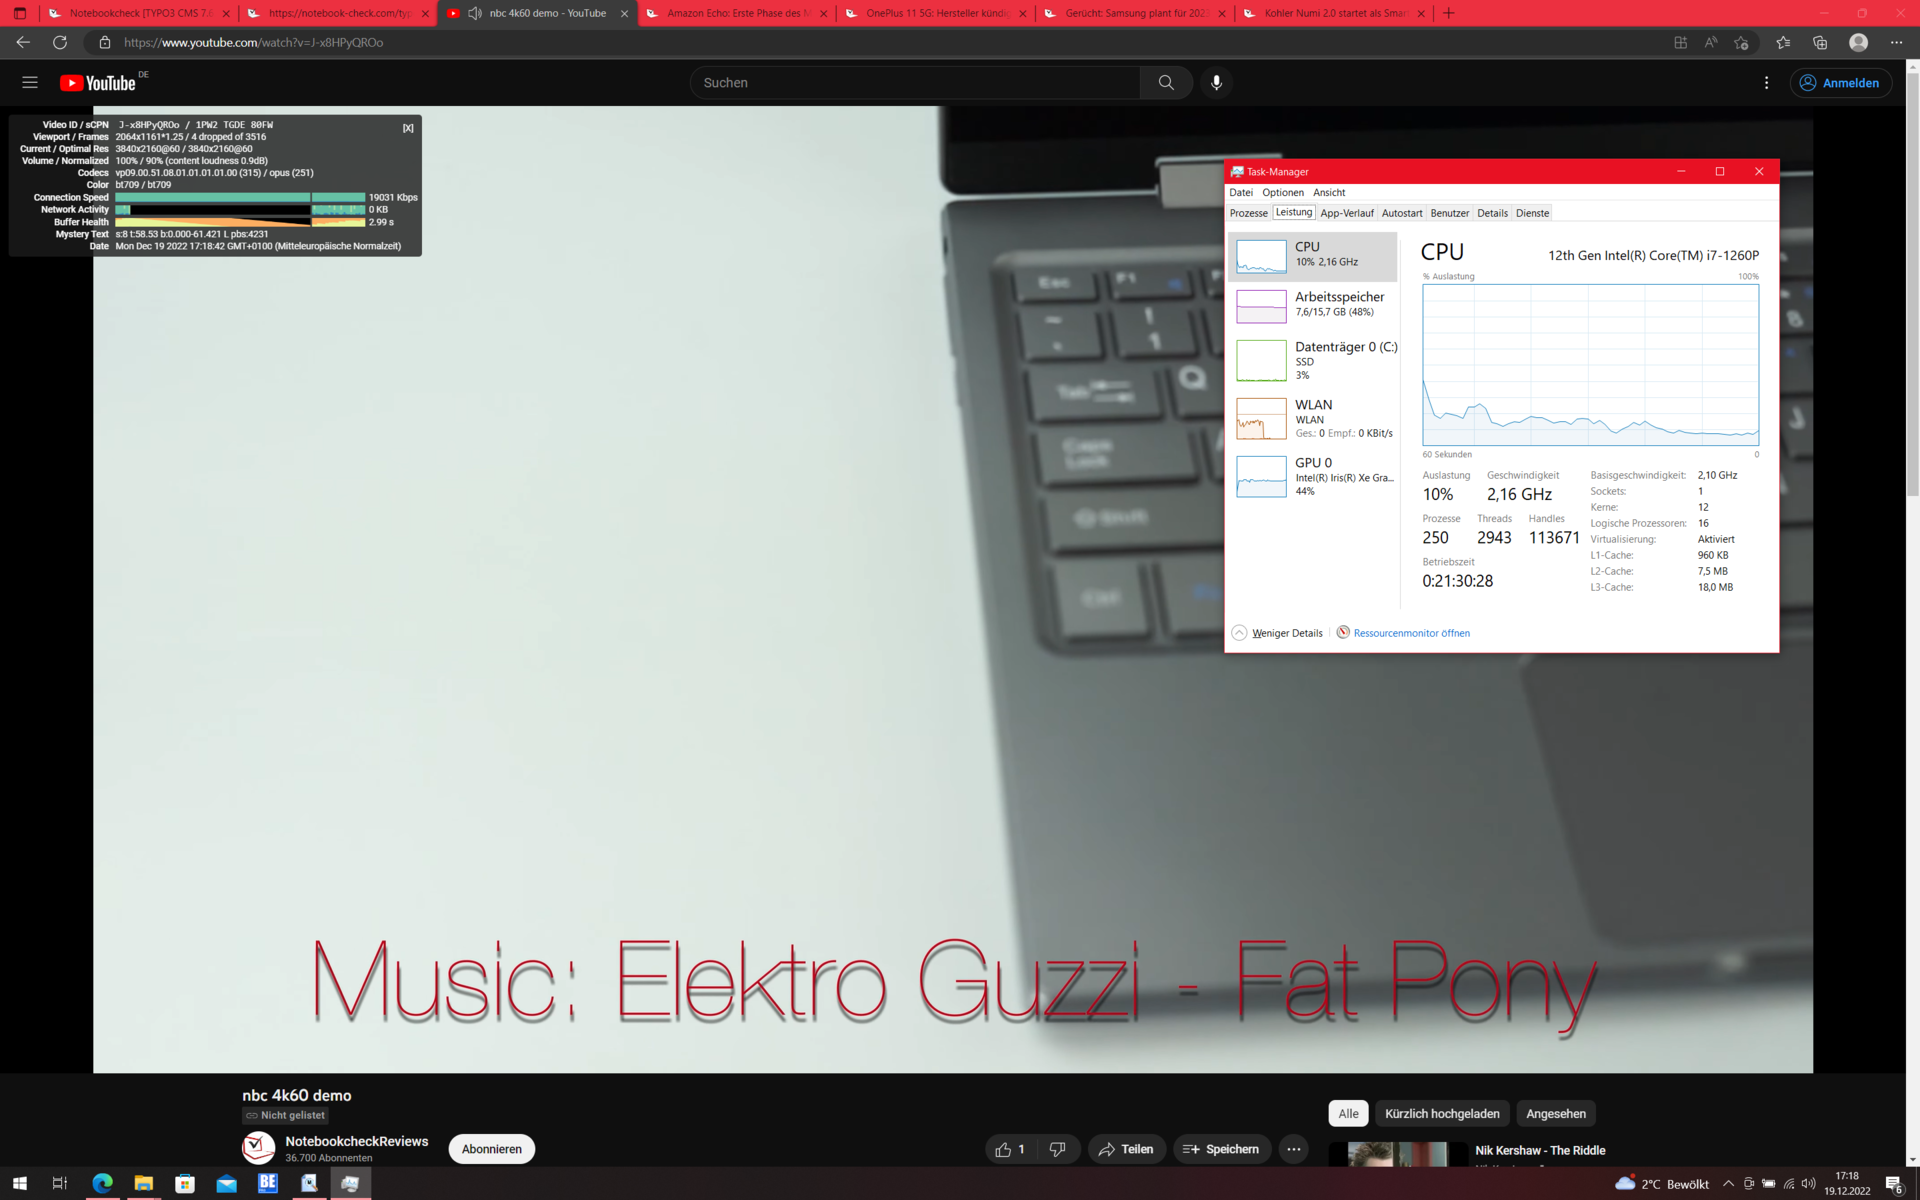
Power consumption Witcher 3 / Stress test
Power Consumption with an external monitor
Battery Life
The battery capacity of 57 watt hours remains unchanged. The higher consumption of the OLED screen significantly impacts battery runtimes: The Lenovo ThinkPad X1 Carbon G10 30th Anniversary Edition runs out of power after only five hours in our Wi-Fi test (150 cd/m² brightness). This is very weak. By comparison: The ThinkPad Z13, also with a power-hungry OLED display, achieved more than seven hours in the same test.
One way to achieve longer battery runtimes in OLED laptops is the dark mode. Our WiFi test mainly consists of websites with bright backgrounds, which means higher consumption on part of the self-illuminating pixels. Modern web browsers can be set so that all websites are displayed in dark mode. We repeated the Wi-Fi test under these conditions. In dark mode, the Lenovo ThinkPad X1 Carbon G10 OLED achieves a runtime of approximately seven hours in the Wi-Fi test. Buyers of this model and other OLED laptops should use dark mode where possible.
Pros
Cons
Verdict: High-quality OLED display shortens battery life
Even without an OLED display, the Lenovo ThinkPad X1 Carbon Gen 10 is a very good business notebook. Our first review device, with an IPS panel, achieved an overall rating of 90 percent. With OLED, the display quality is significantly increased, but compromises have to be made elsewhere: The battery life suffers considerably due to the higher consumption, and the X1 Carbon G10 OLED can hardly be used on the go for long periods of time without the activated dark mode for all apps and websites. A pity, since the anti-reflective OLED panel is actually very well suited for outdoor use.
Another exciting aspect of this review update was the CPU performance, which was found wanting in our first review of the X1 Carbon G10 mit i5-CPU. Fortunately, this has improved, and Lenovo has solved the issue with firmware updates. However, the fan runs a little louder under load than before.
Little anniversary spirit, but a very good OLED display: The Lenovo ThinkPad X1 Carbon Gen 10 30th Anniversary Edition
You barely notice that this is an anniversary edition in everyday use, apart from the colorful logo as a reminder. Lenovo squandered the chance to create something unique here, which means that the OLED display is the main focus in this model. This is actually still a fairly rare feature among business laptops, and the high image quality is a very good argument for the X1 Carbon Gen 10 30th Anniversary Edition. It might not be as practical as other business models due to the shorter battery life, but using the OLED monitor is a pleasure.
If the ports and the more classic ThinkPad design are not so important, the Lenovo ThinkPad Z13 OLED may be a good alternative. It is even more powerful and has a longer battery life. The business competition of the other manufacturers does not offer OLED, but the HP Elite Dragonfly G3 has a very good IPS LCD in 3:2 format, which may be interesting for some readers. The Dell Latitude 9430 2-in-1 is significantly heavier, but has a brighter display in return. Both the Dell and HP laptops also have a much better battery life.
Price and Availability
Depending on your location, the Lenovo ThinkPad X1 Carbon Gen 10 30th Anniversary Edition is available via Lenovo's official website as a freely configurable laptop. Prices in the USA start at US$1,397.40. Starting prices in the UK and Singapore are £2,310.00 and SG$2,303.74, respectively (this is not an exhaustive list).
Prices are as of 22.12.2022 and subject to change.
Lenovo ThinkPad X1 Carbon G10 21CB00DCGE
- 12/21/2022 v7 (old)
Benjamin Herzig
Price comparison

