Alienware 13 (GTX 960M) Notebook Review

For the original German review, see here.
We previously tested the Alienware 13 around 6 months ago. We loved the great 13-inch case, with beautiful workmanship and great lighting, yet modest weight (~2 kg). However, the CPU performance was lacking as the dual-core Core i5-4210U processor operates at 1.7 - 2.7 GHz, which is not great for a gaming notebook. Now Alienware is offering the Core i7-5500U (Broadwell architecture, 2.4 - 3.0 GHz) for this model and we want to check how much more performance can this upgrade offer? The graphics card has also been upgraded: instead of the GeForce GTX 860M, the model will now employ the faster GeForce GTX 960M.
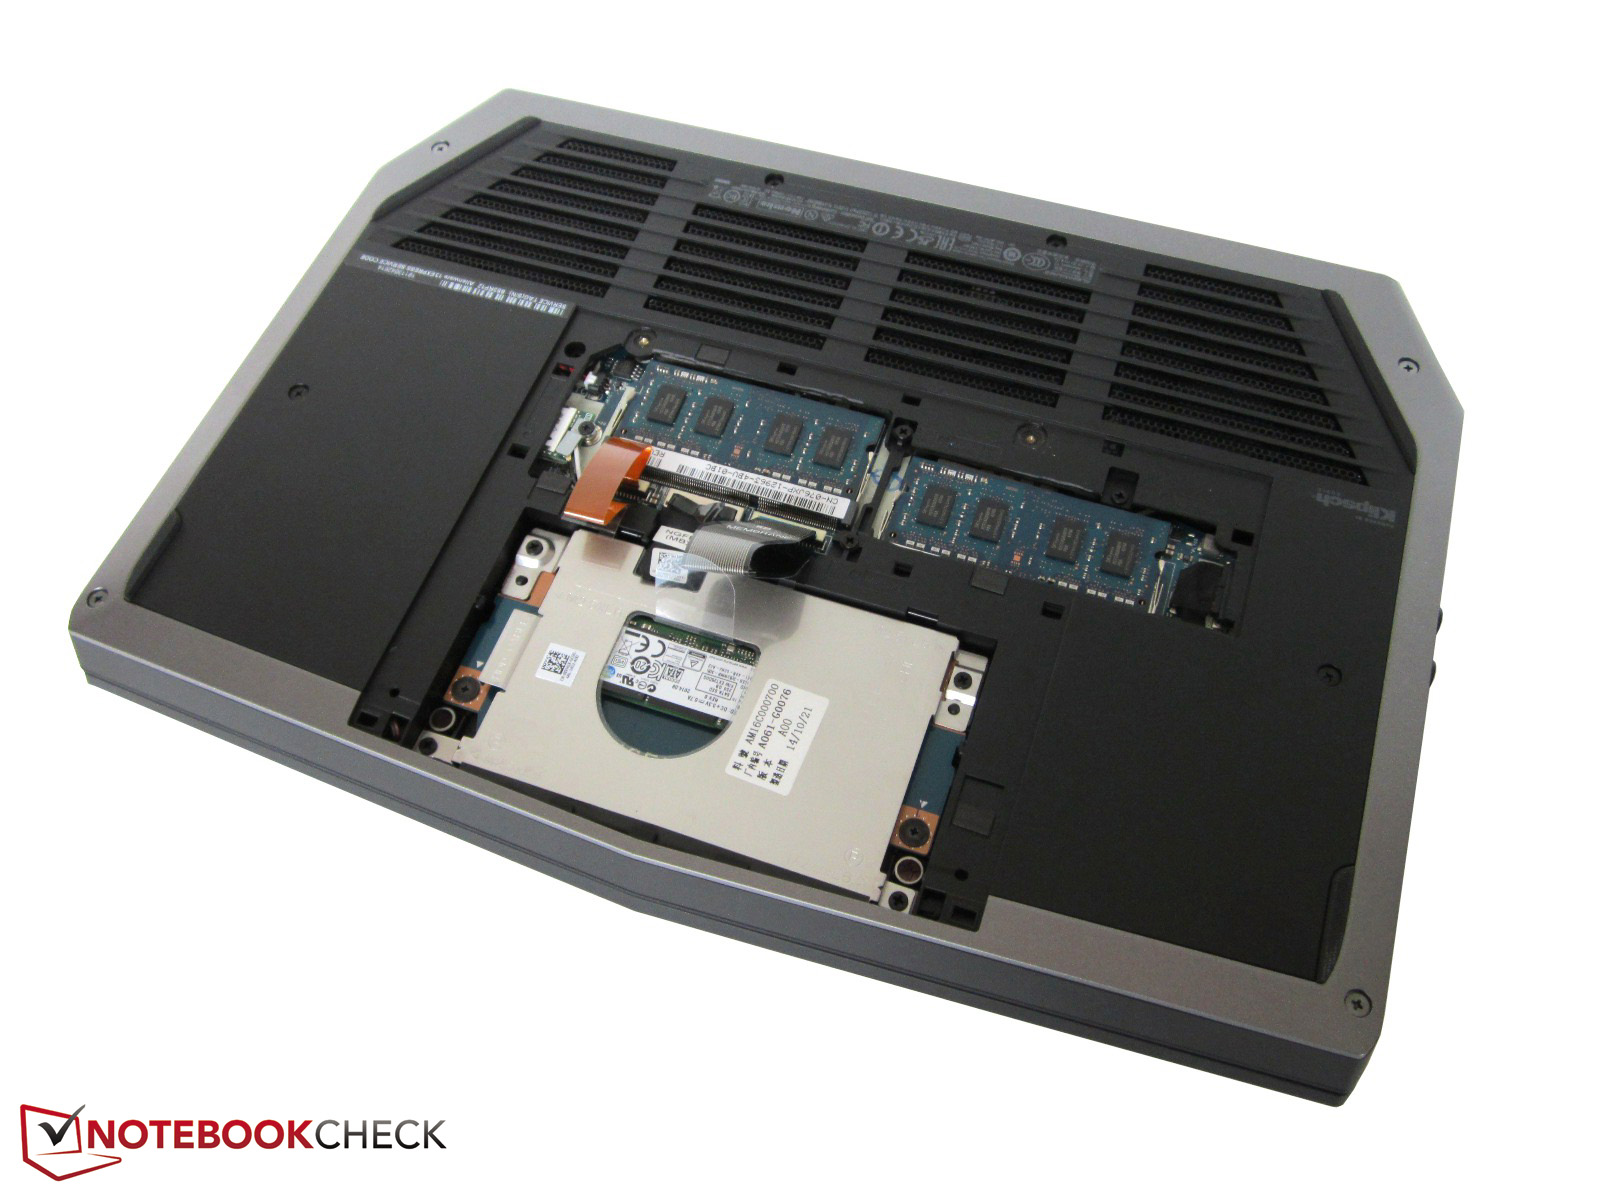
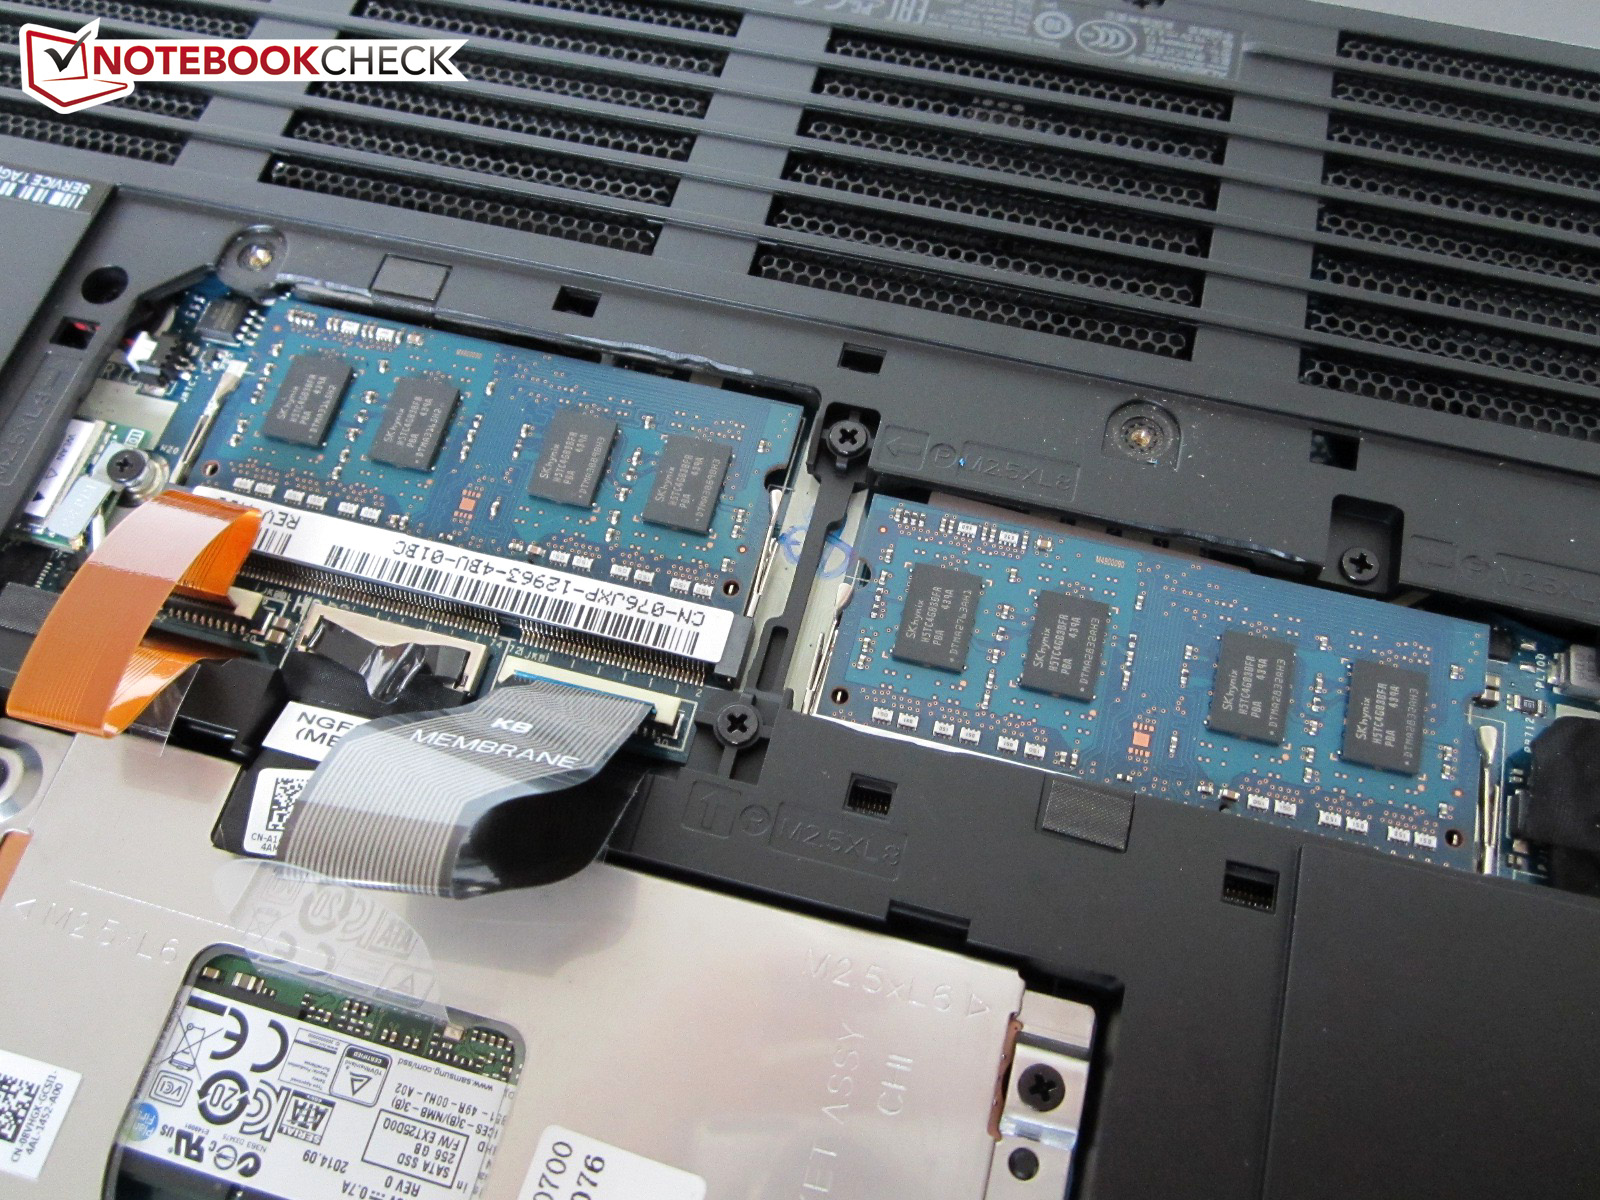
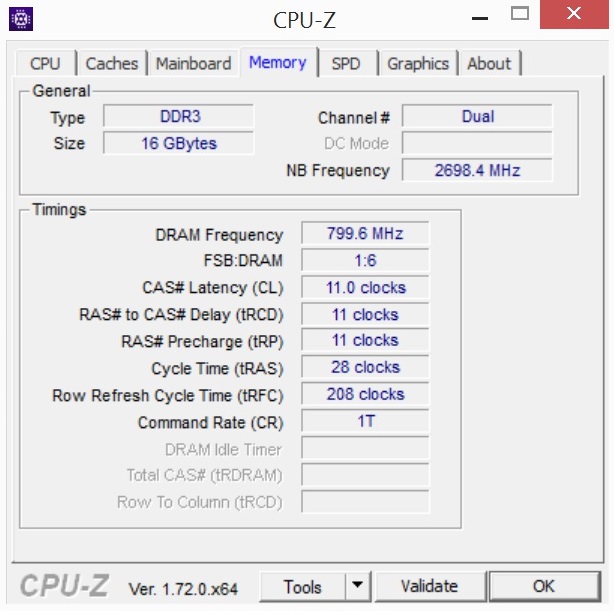
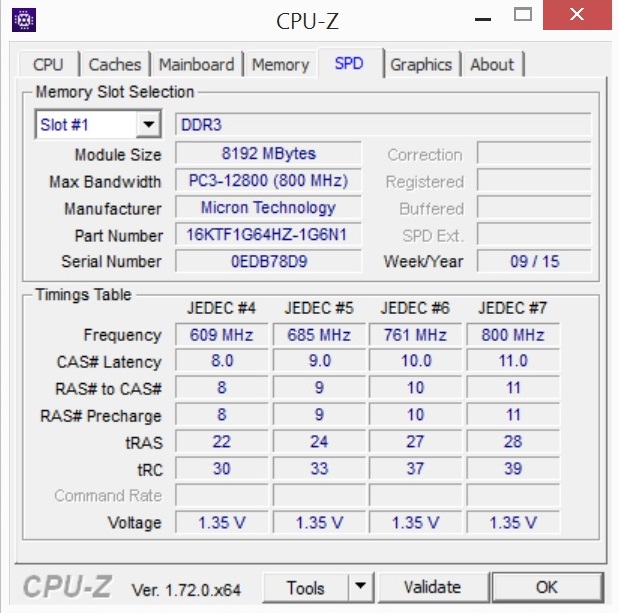
Most of the other hardware has stayed the same: we were happy to see a 256 GB SSD and a matte FHD panel. Furthermore, the German buyers will have to decide between a 1,000 GB HDD or a 512 GB SSD and between an HD panel (1366x768) and a QHD+ panel (3200x1800). The configuration is rounded off with 16 GB of DDR3 RAM, comprised of two 8 GB RAM modules.

Case
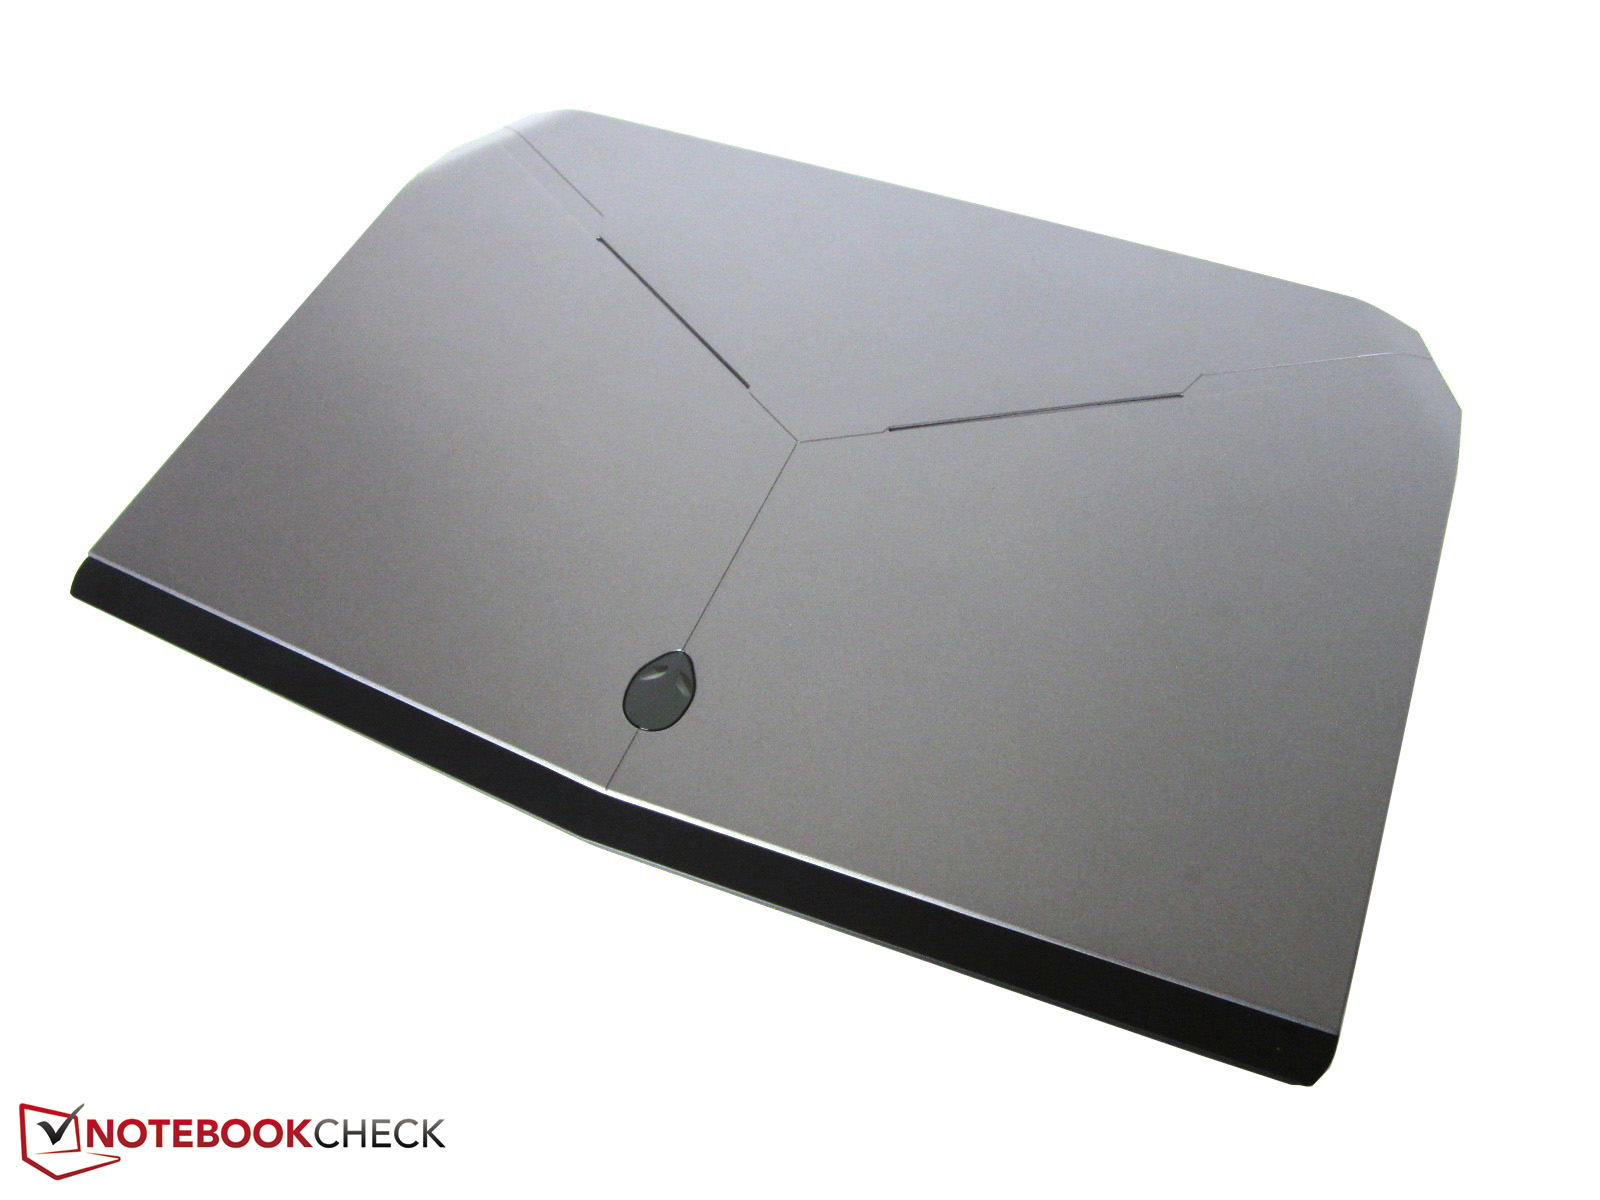
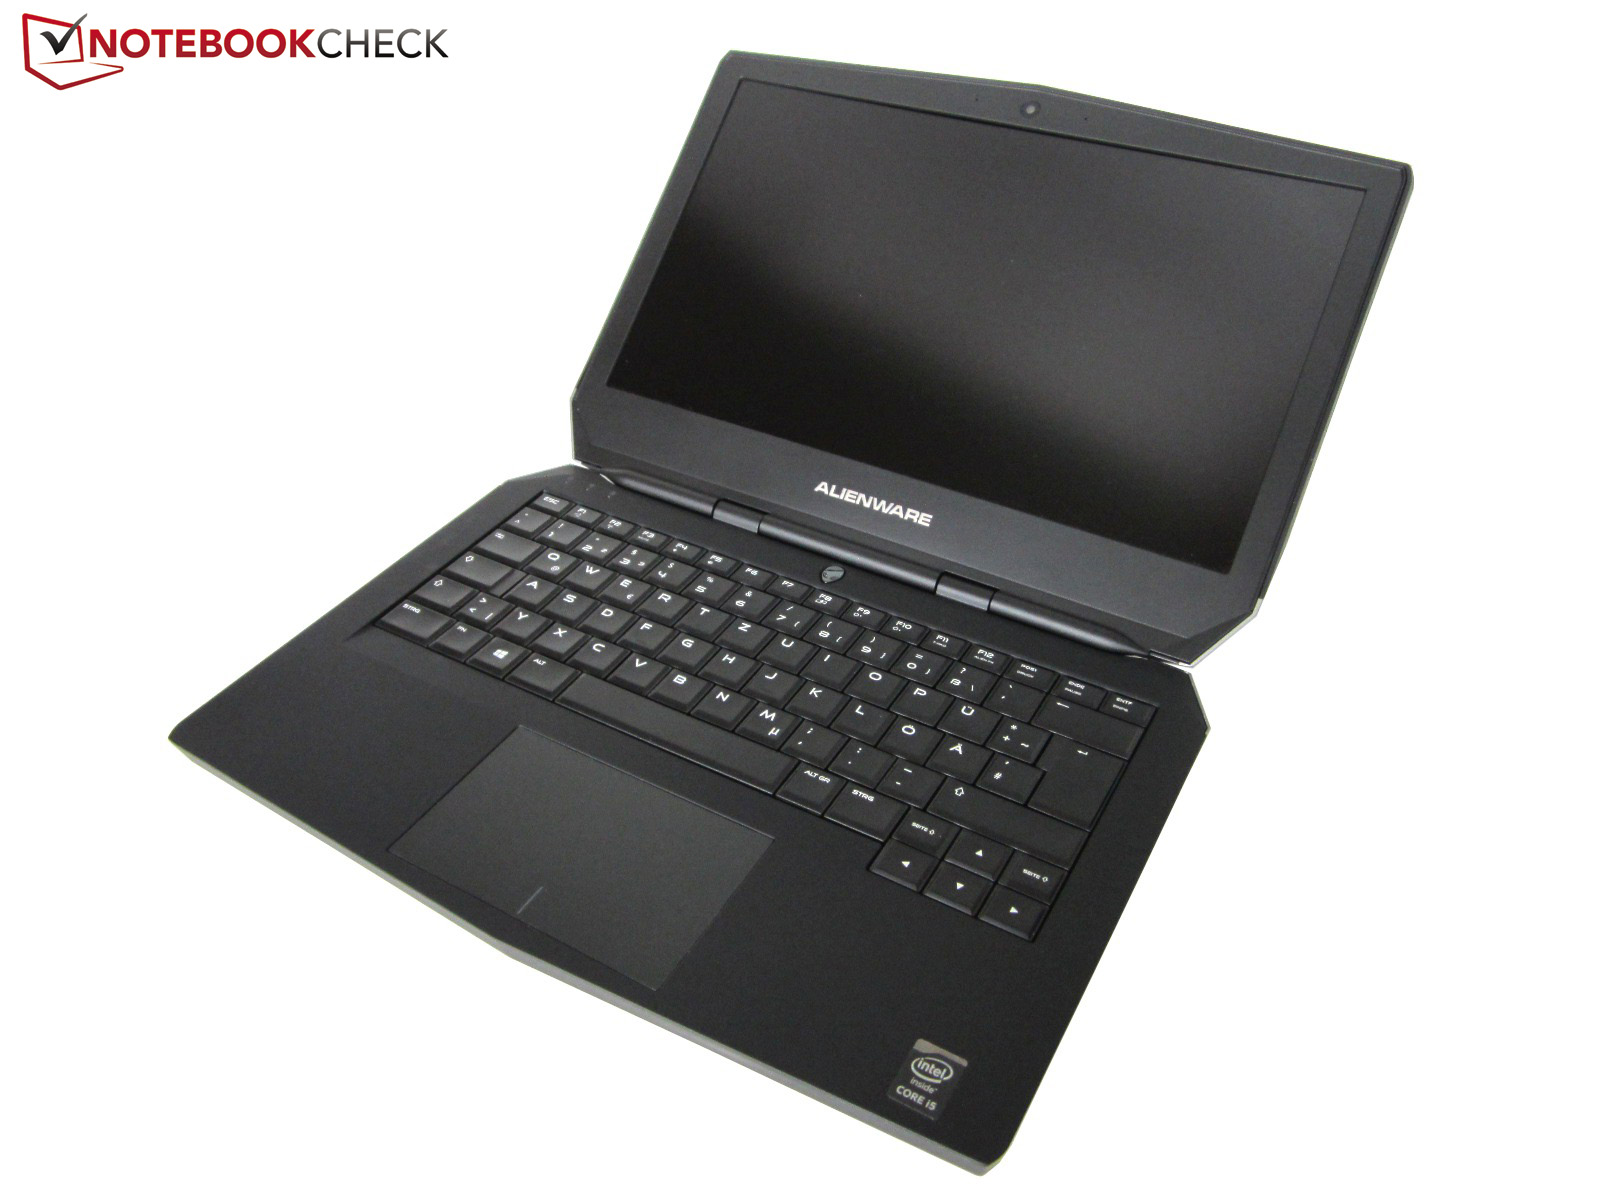
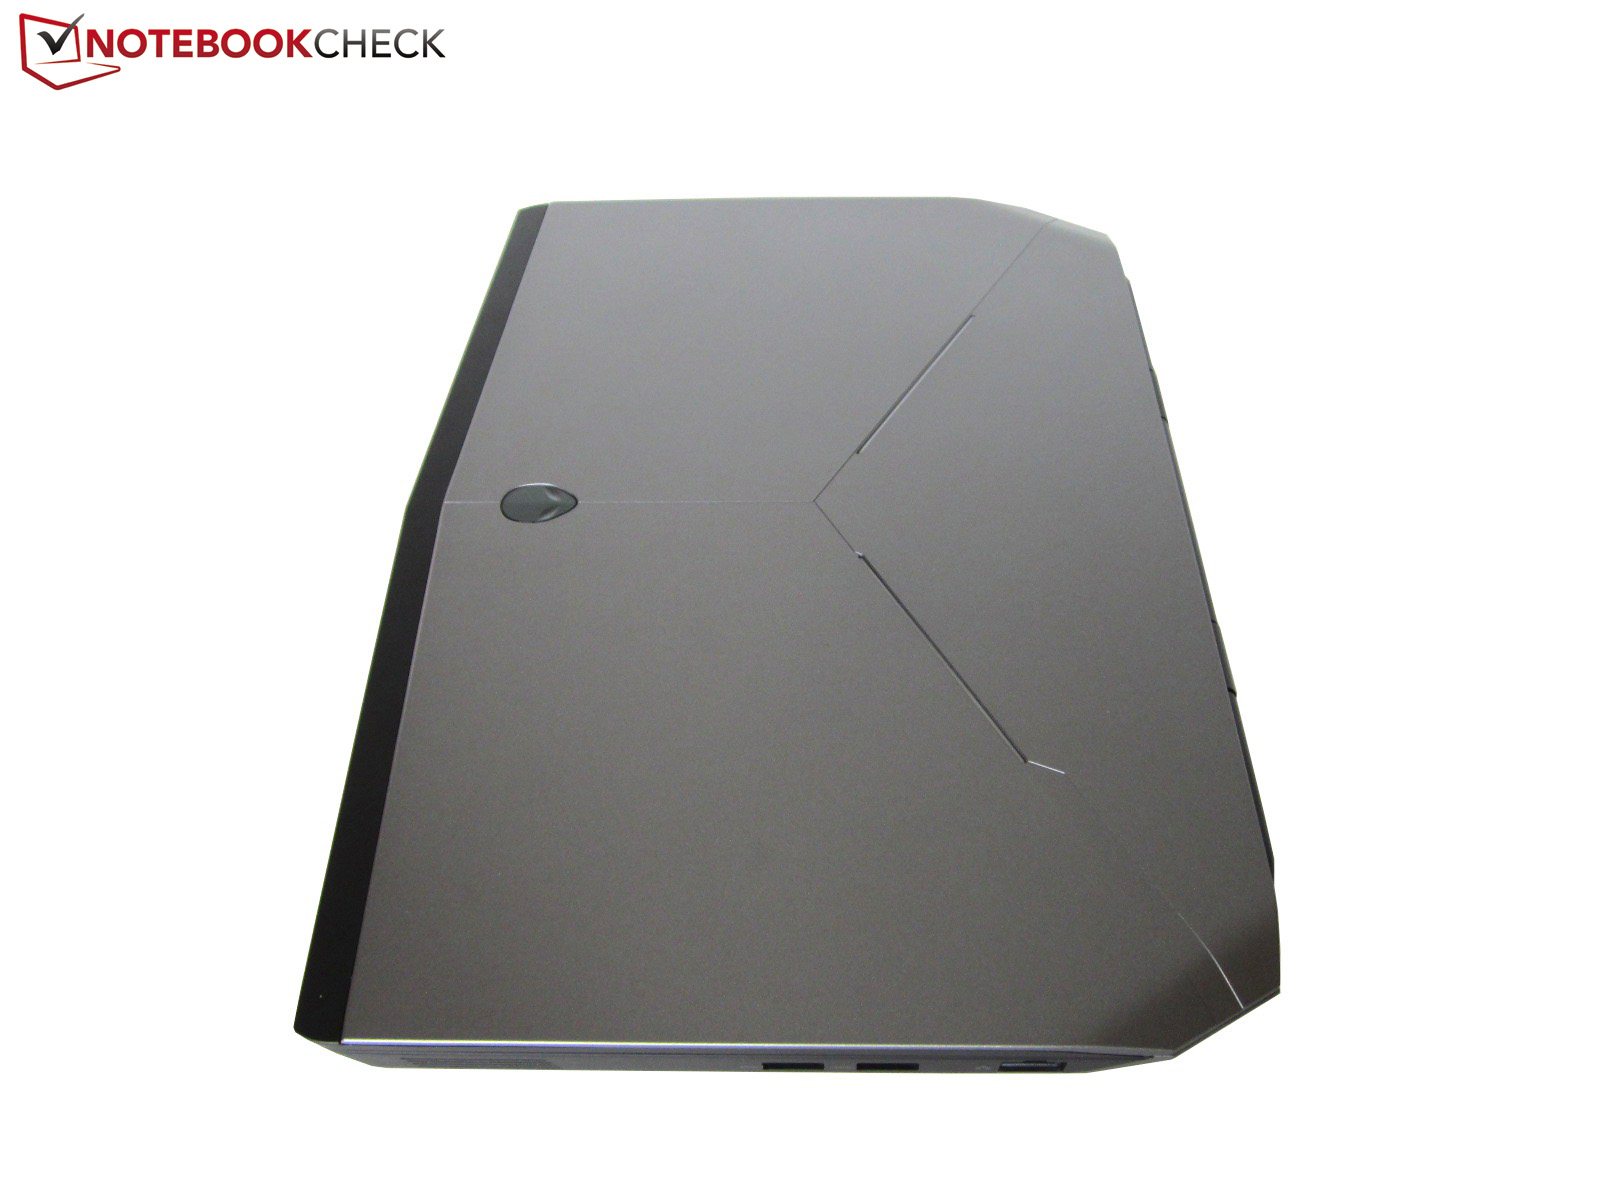
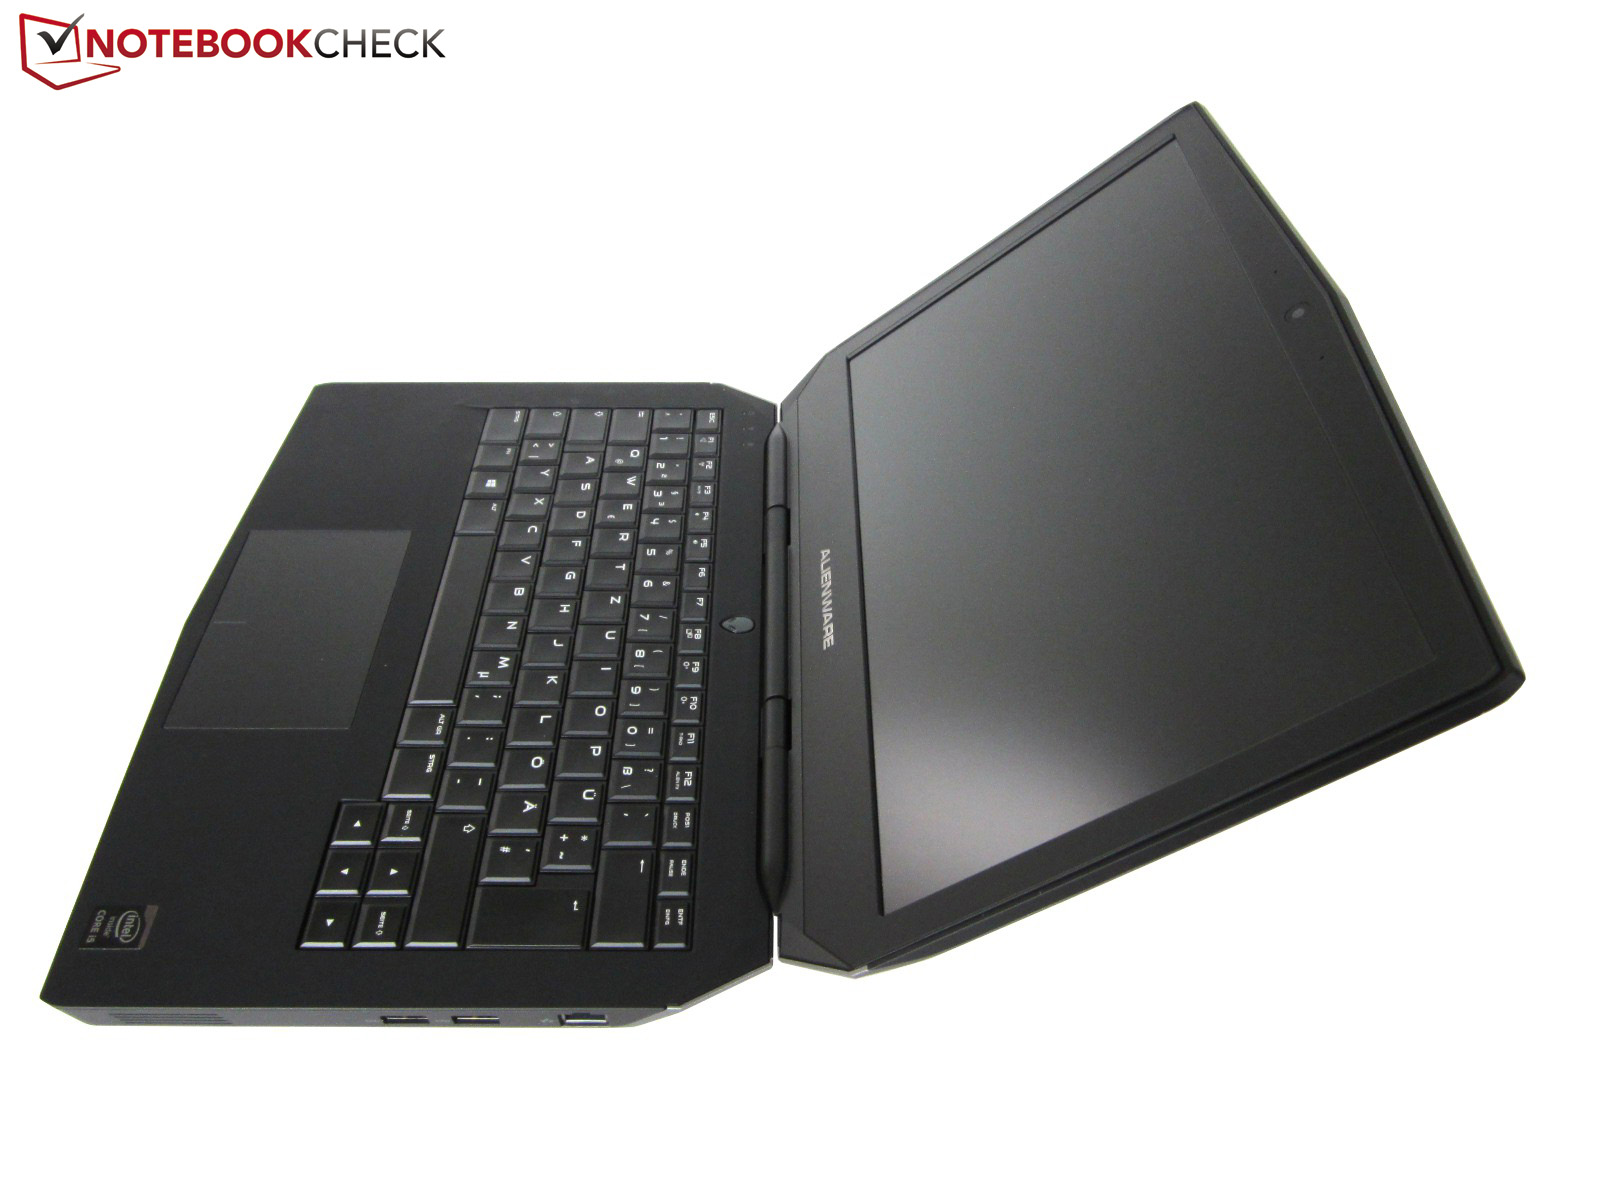
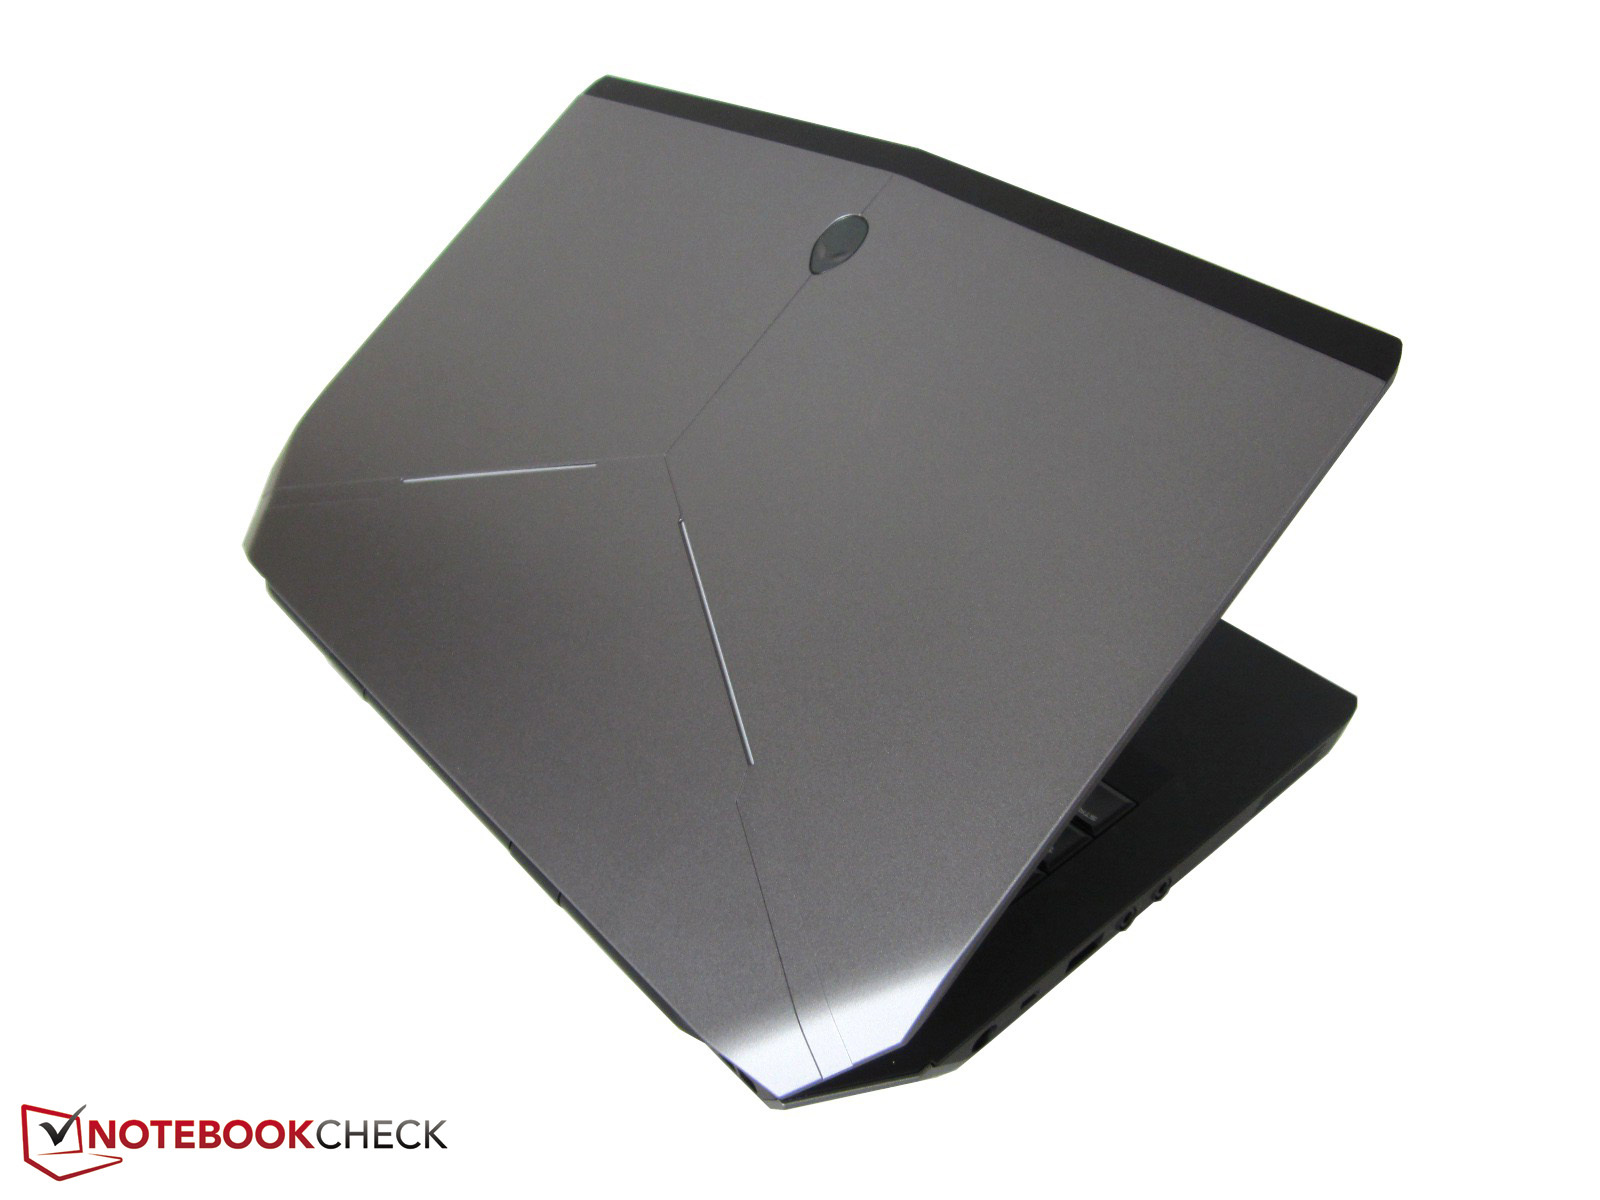
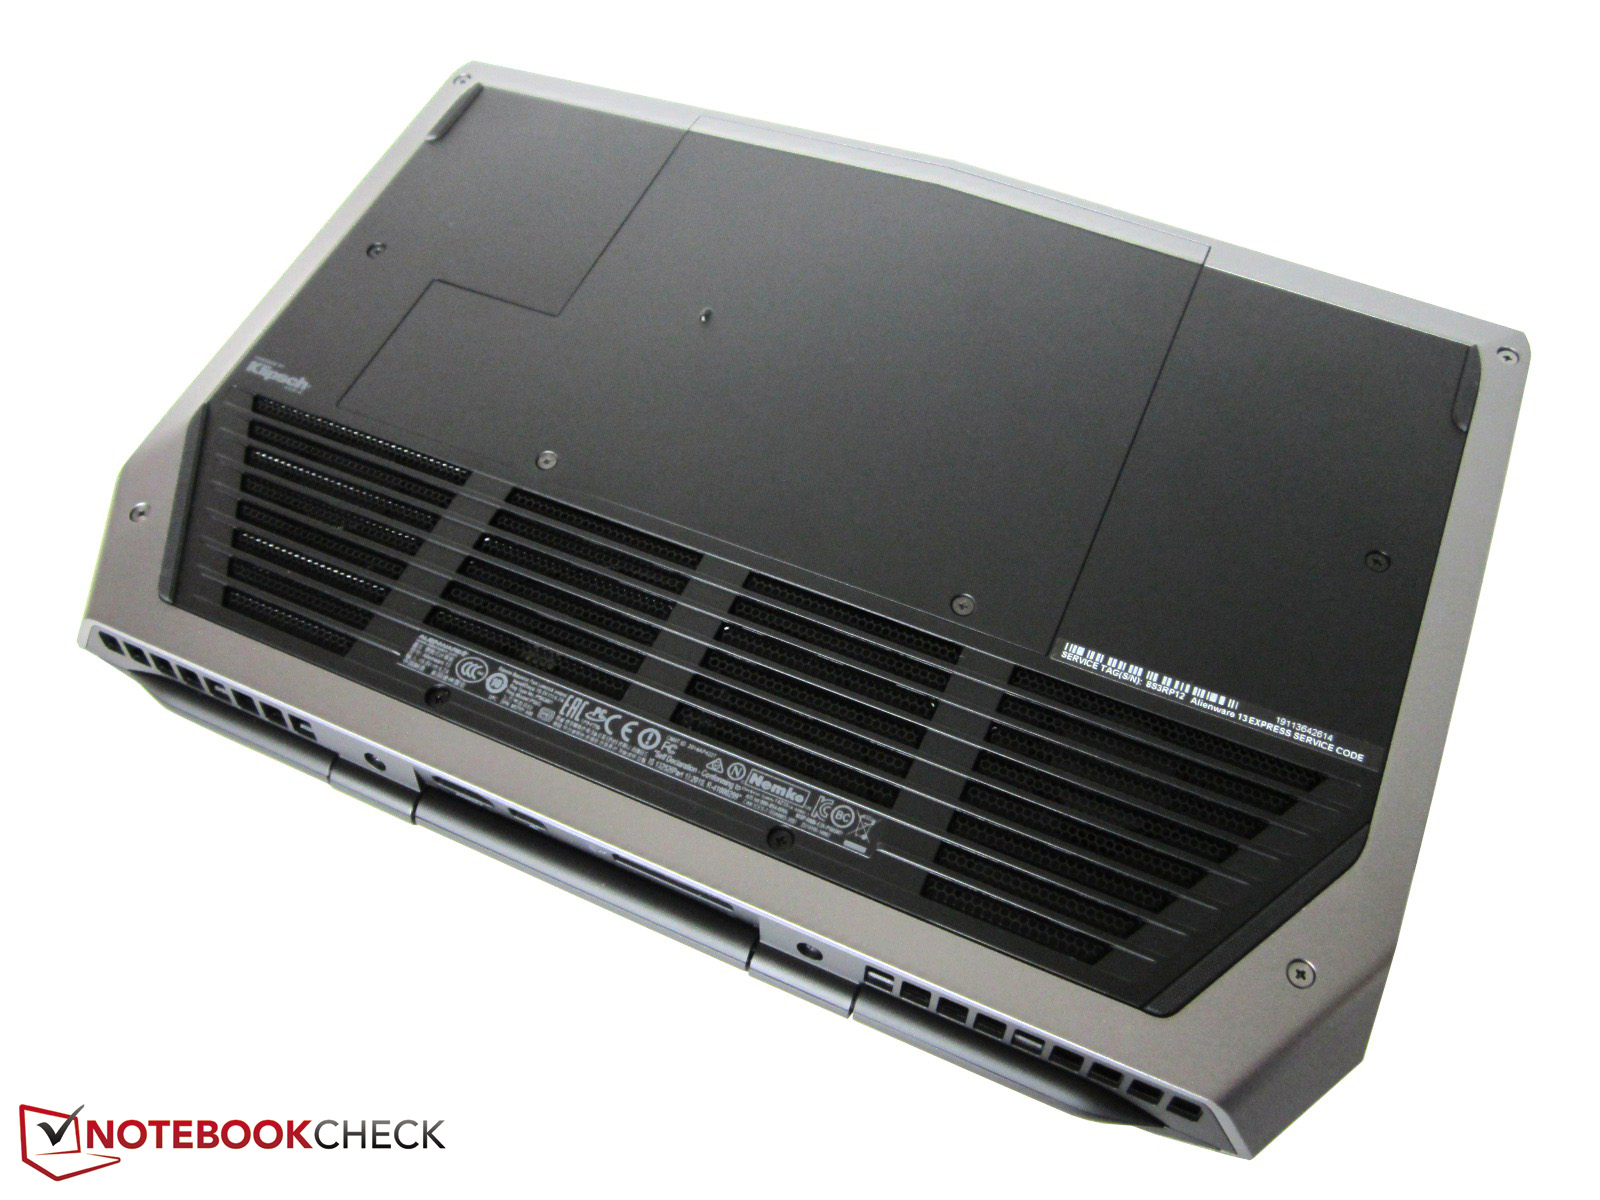
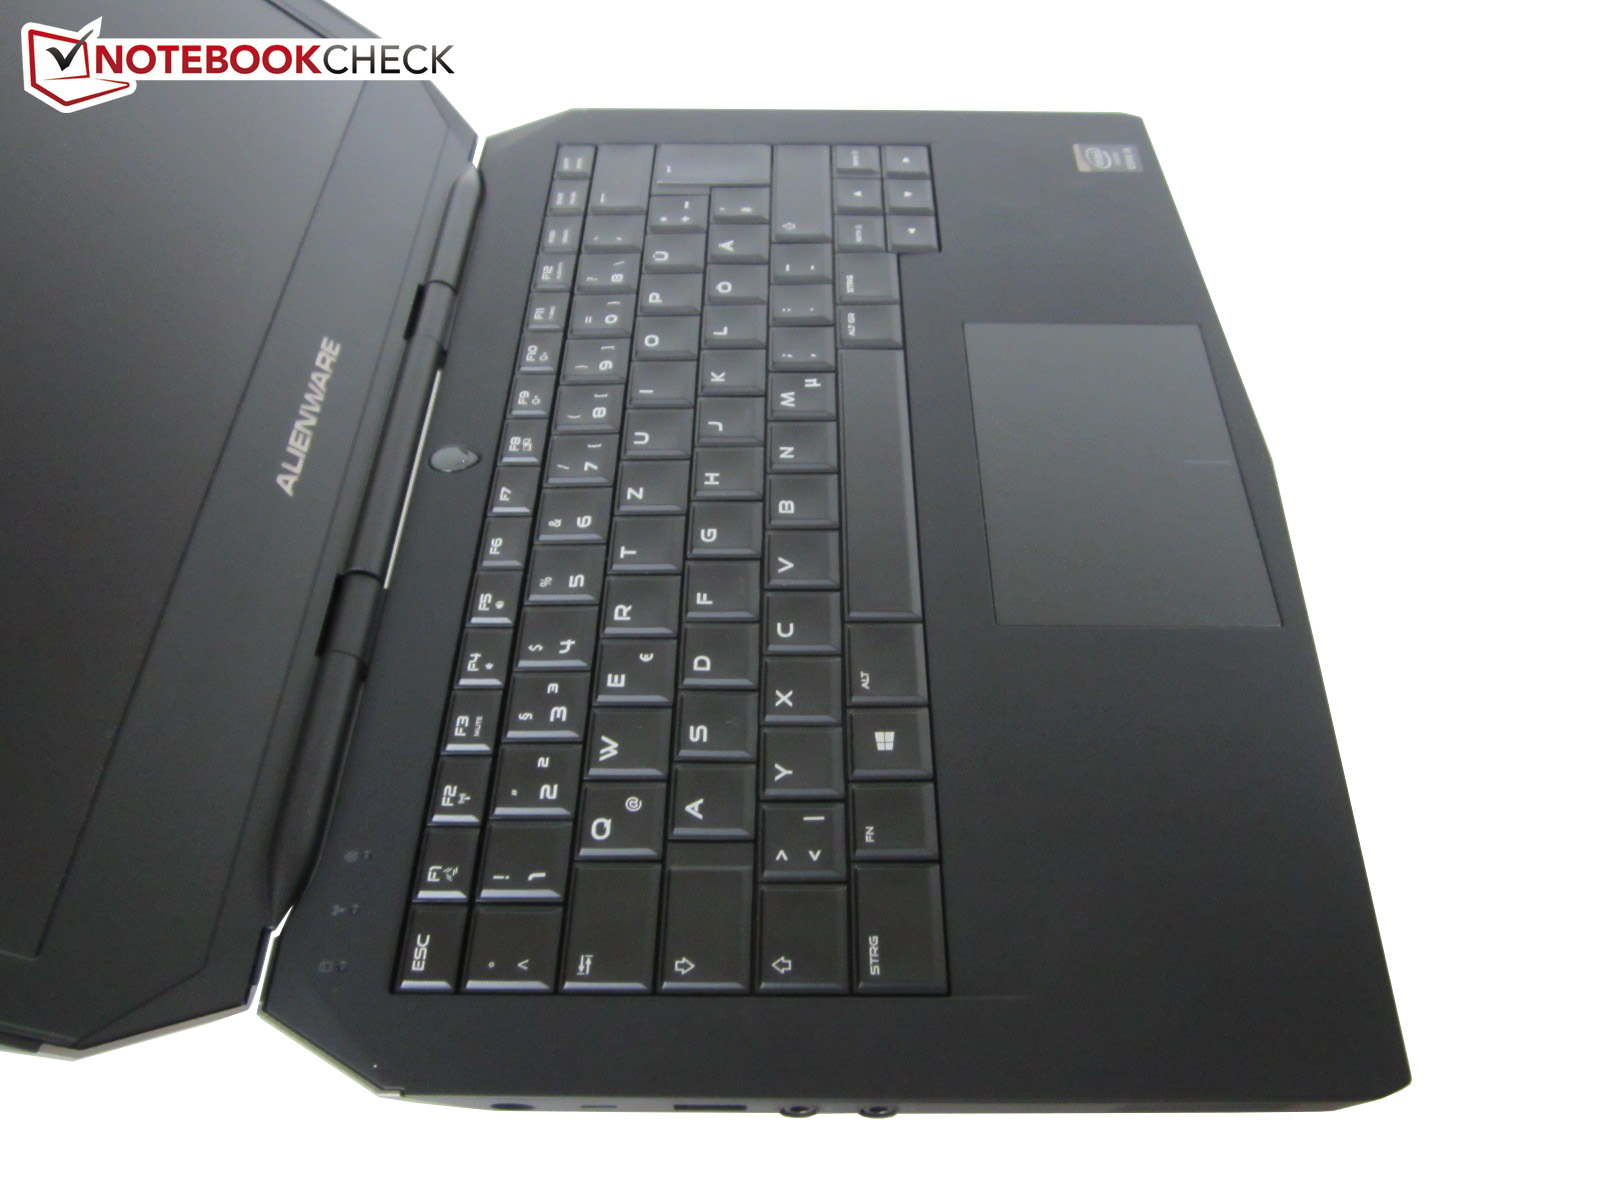
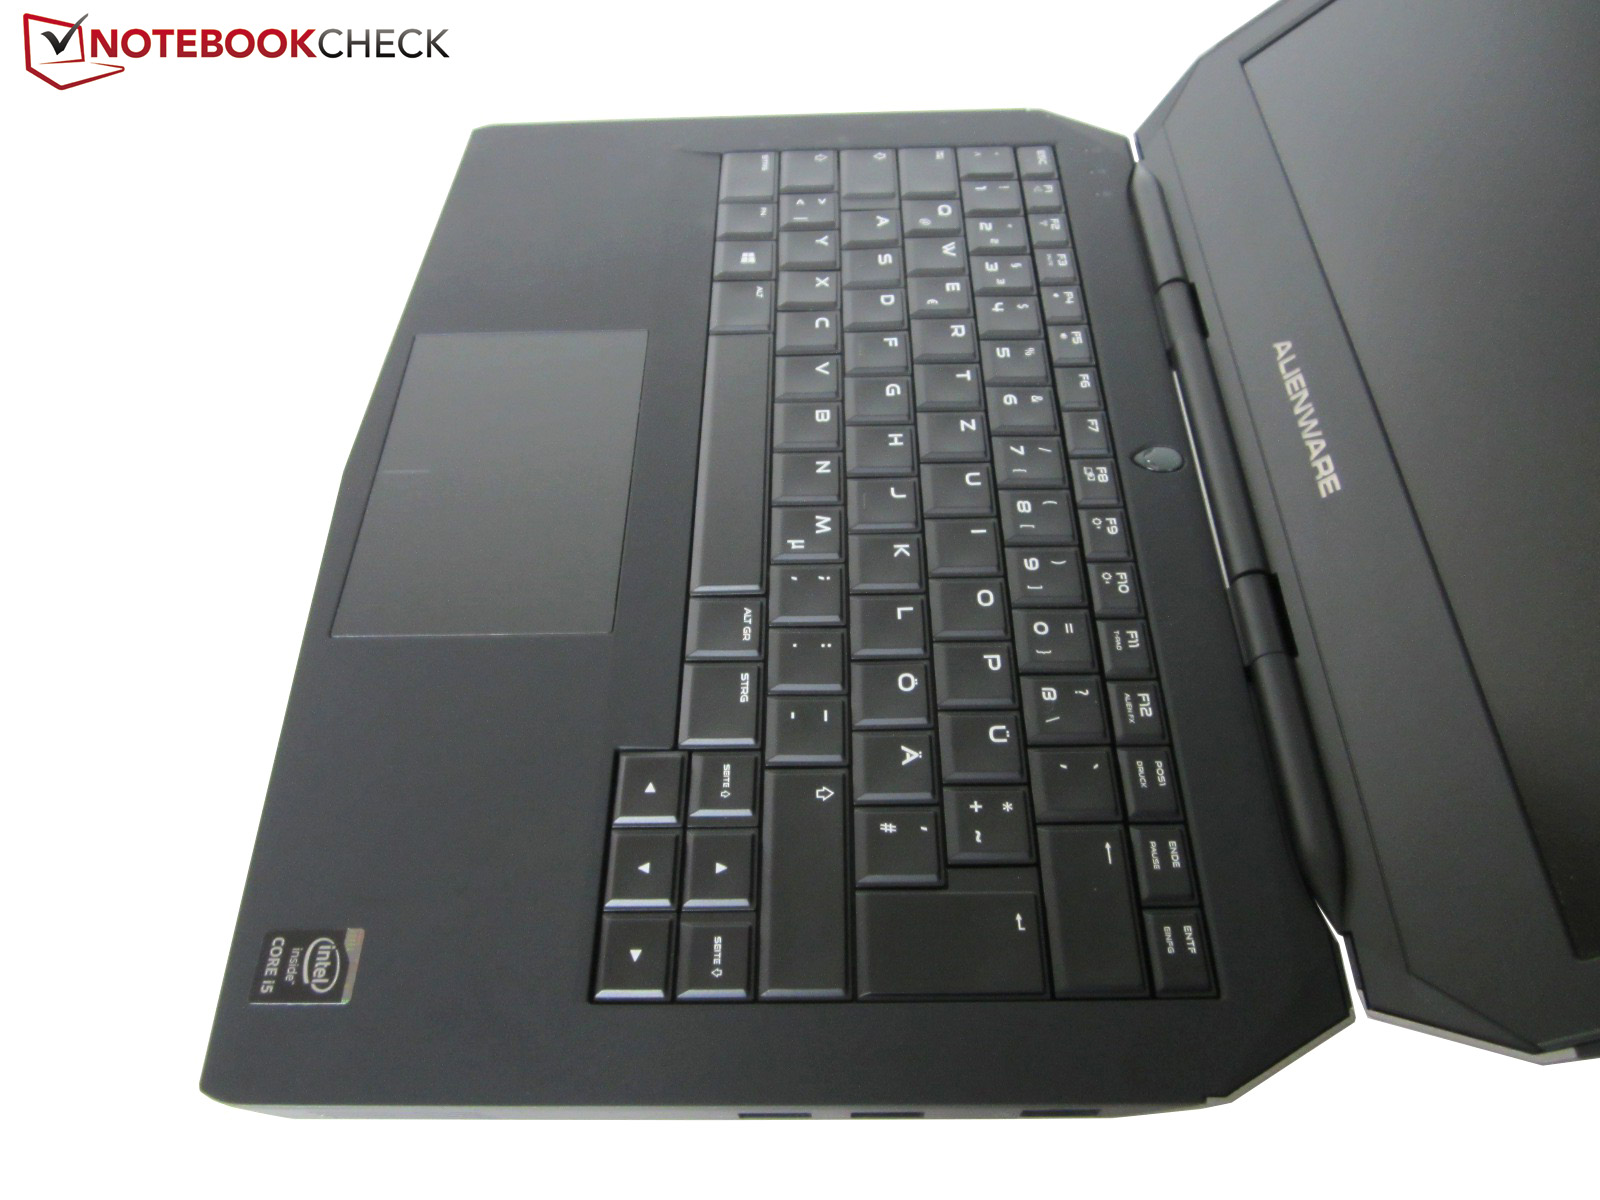
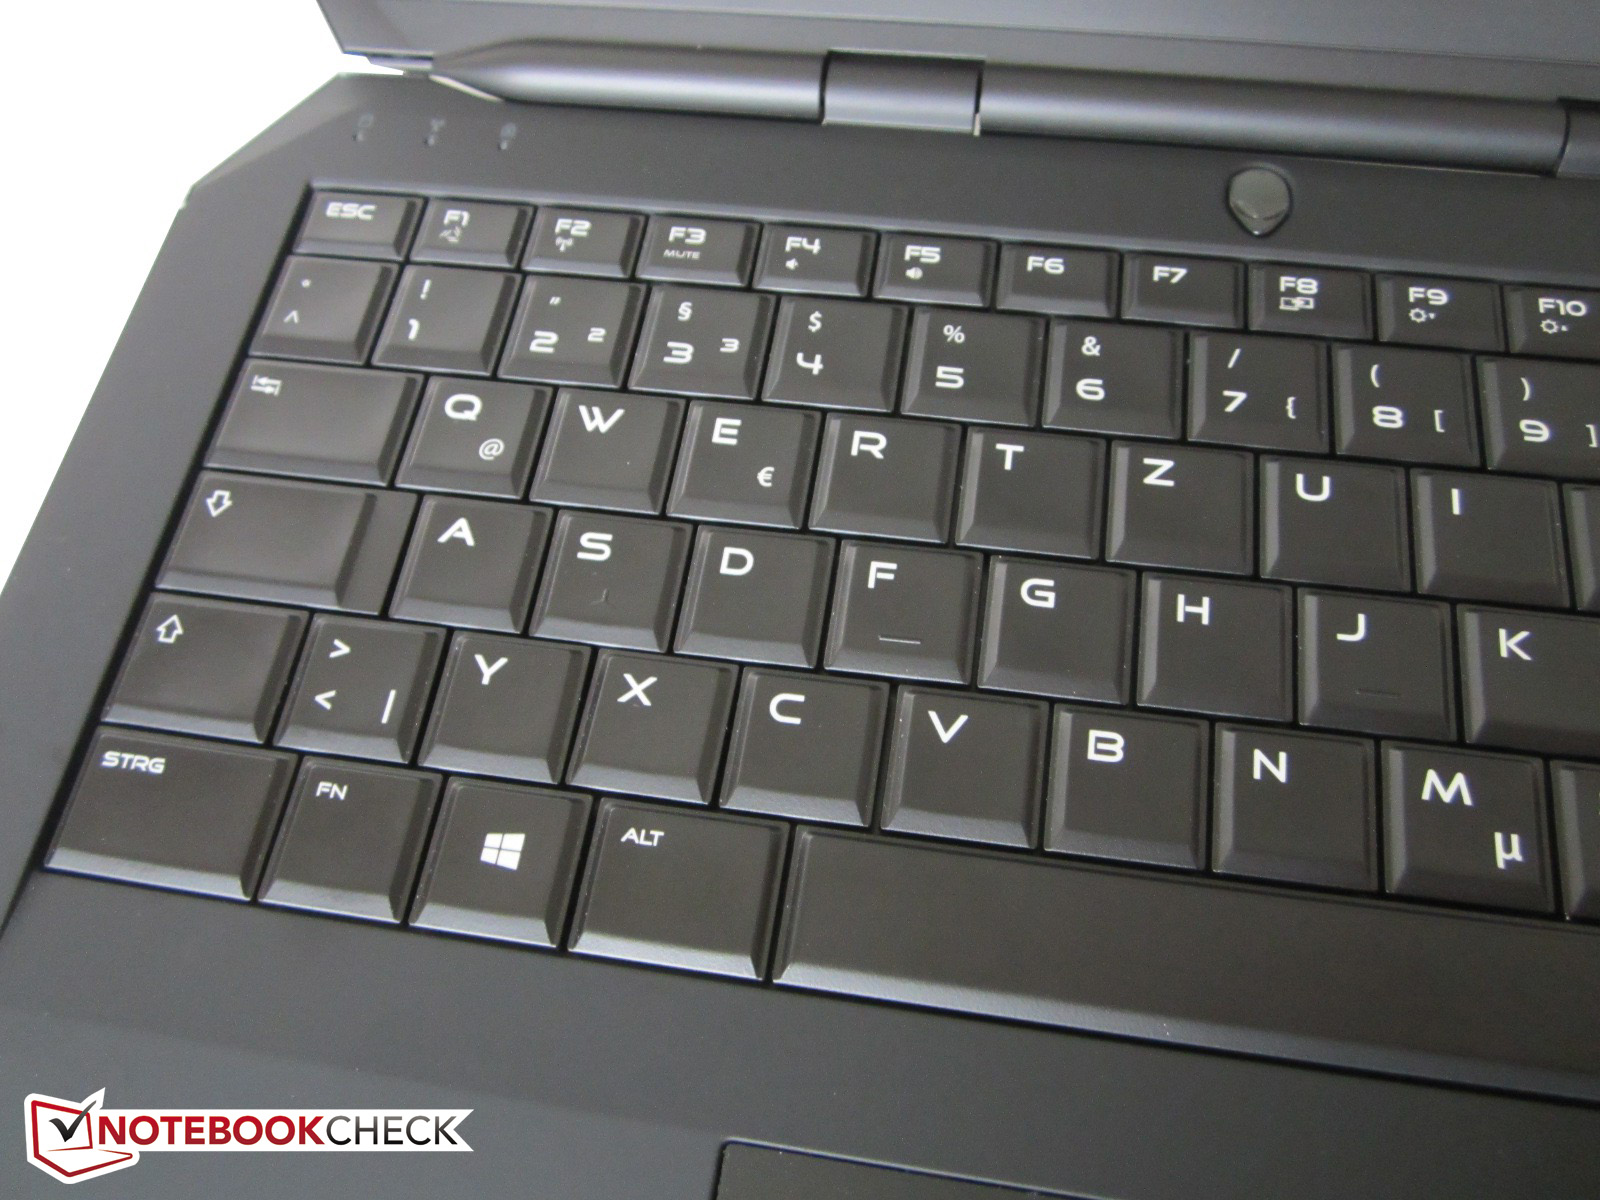
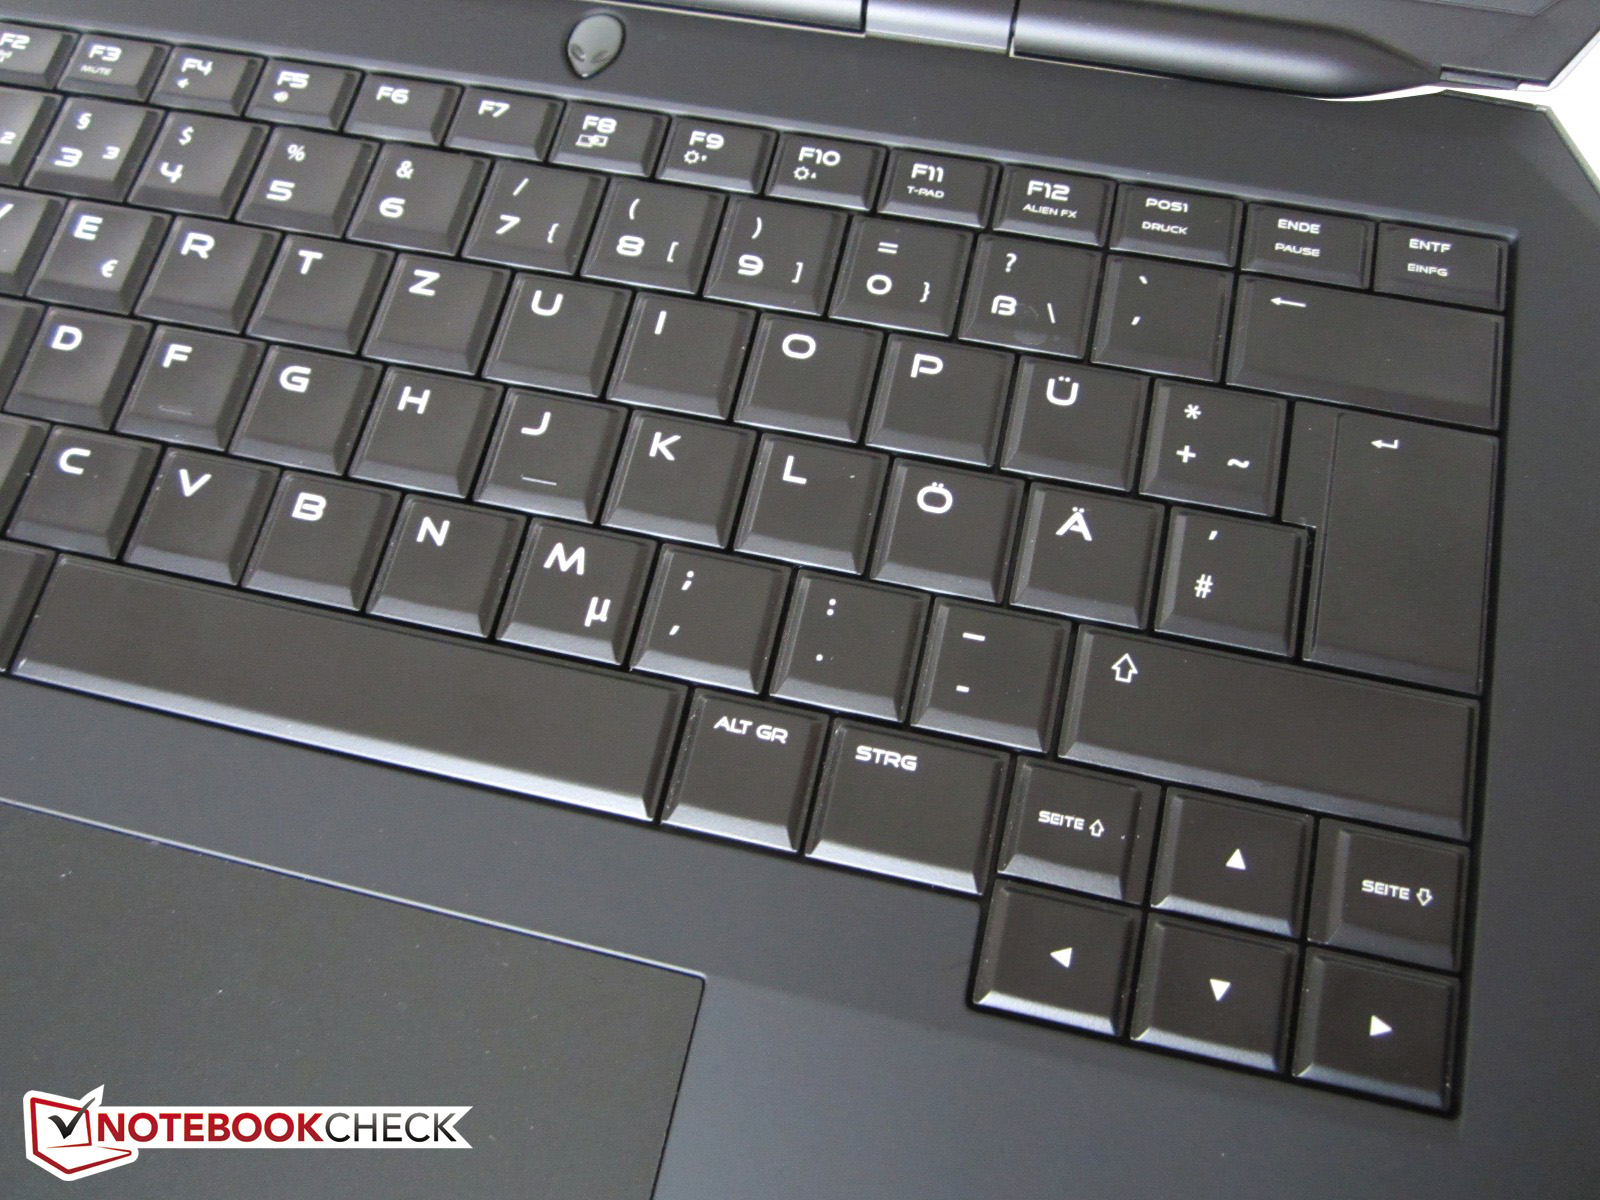
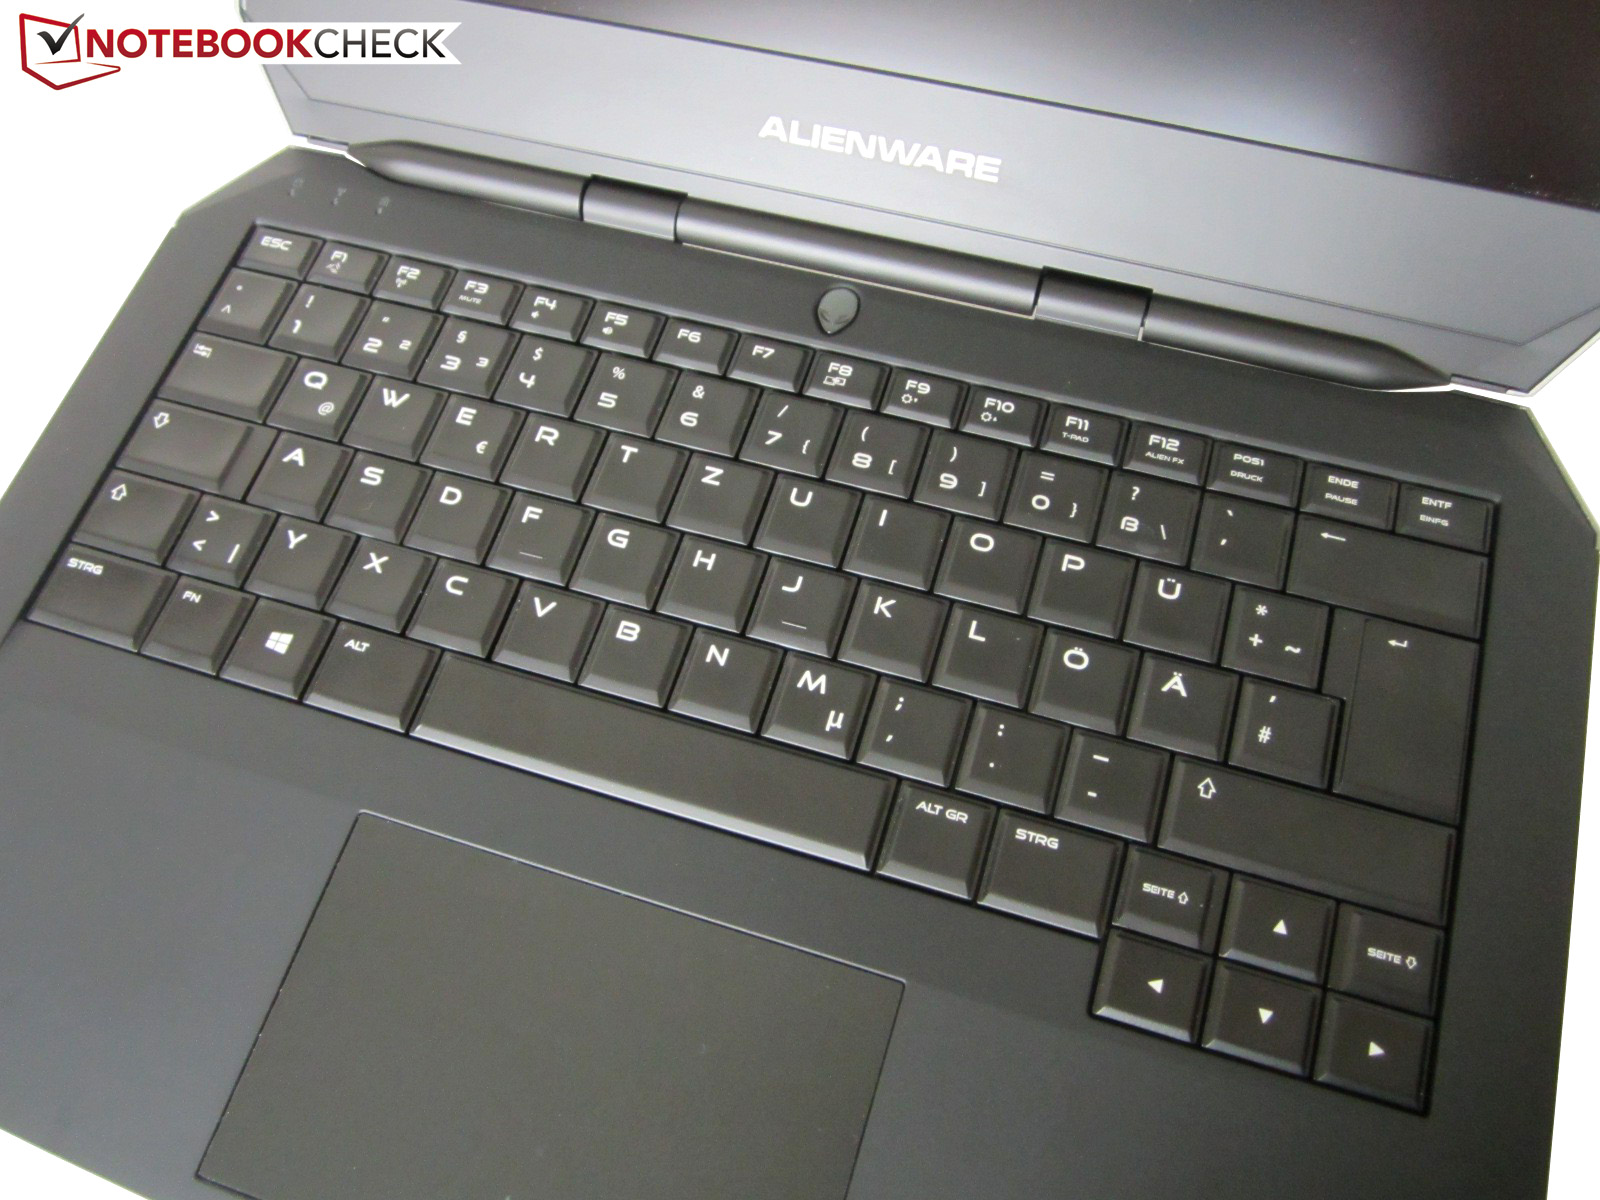
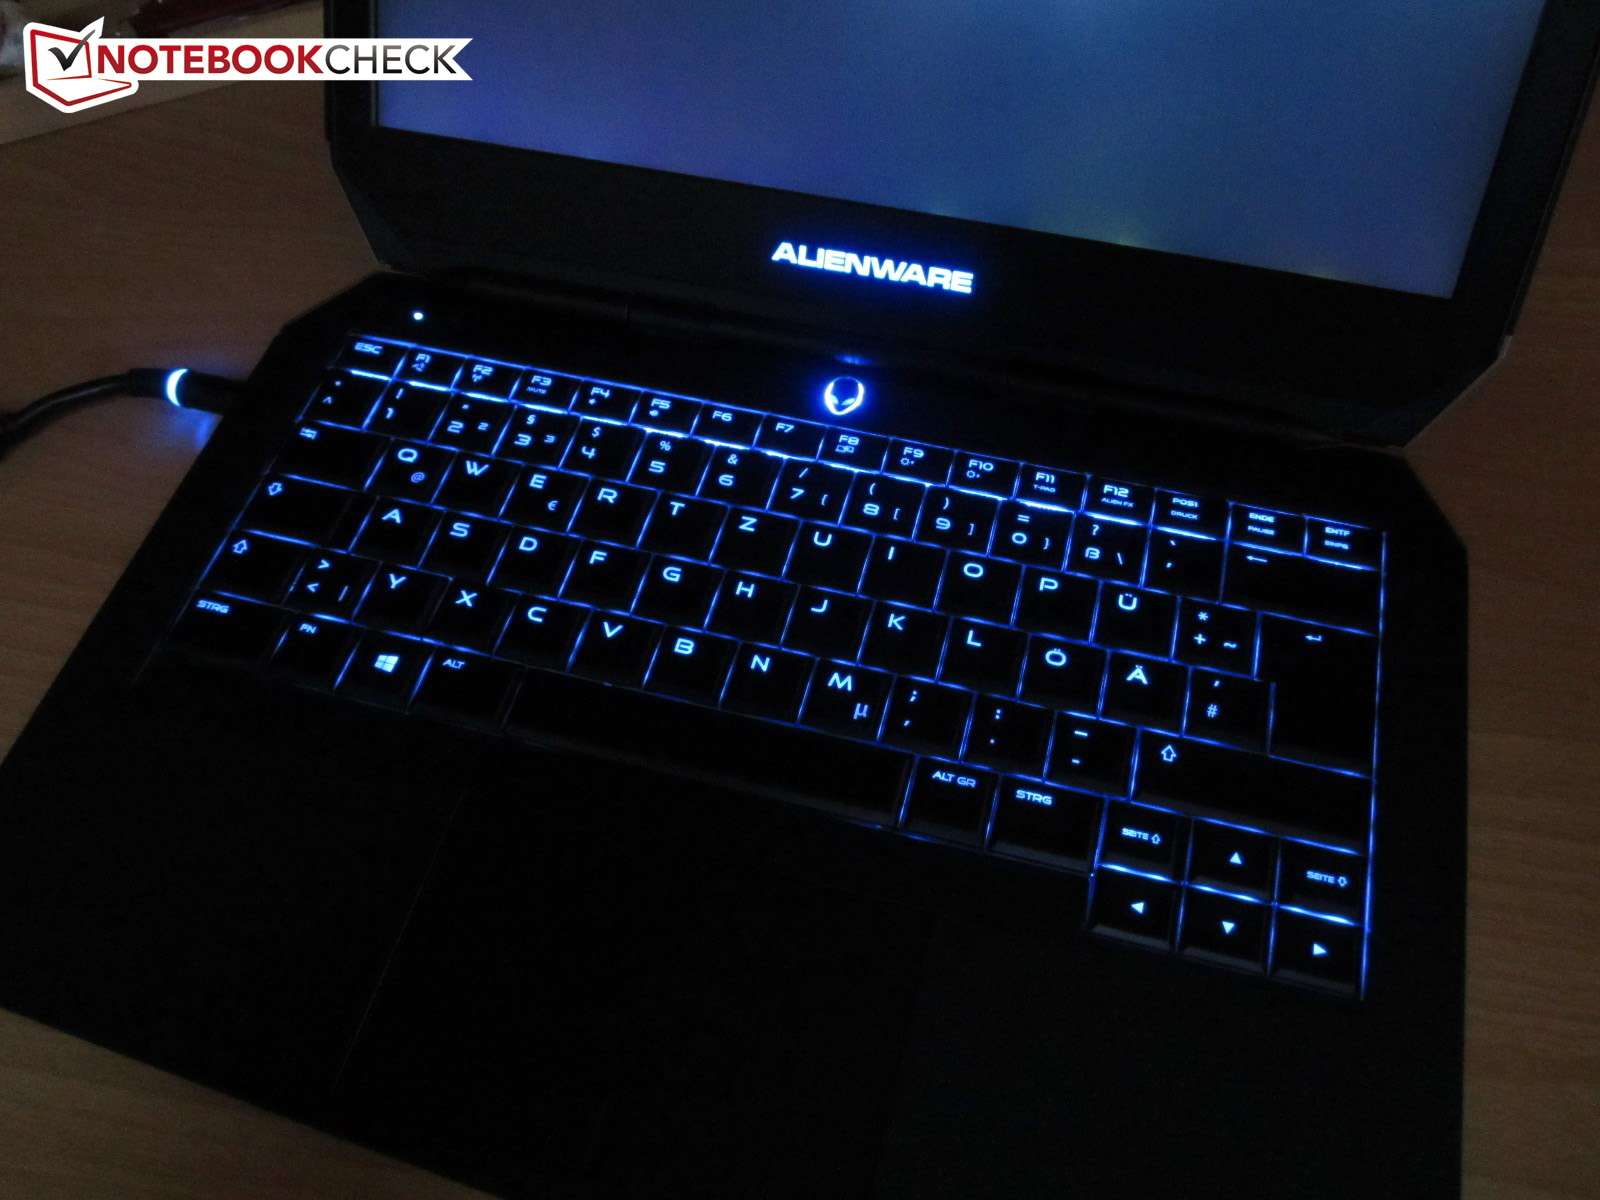
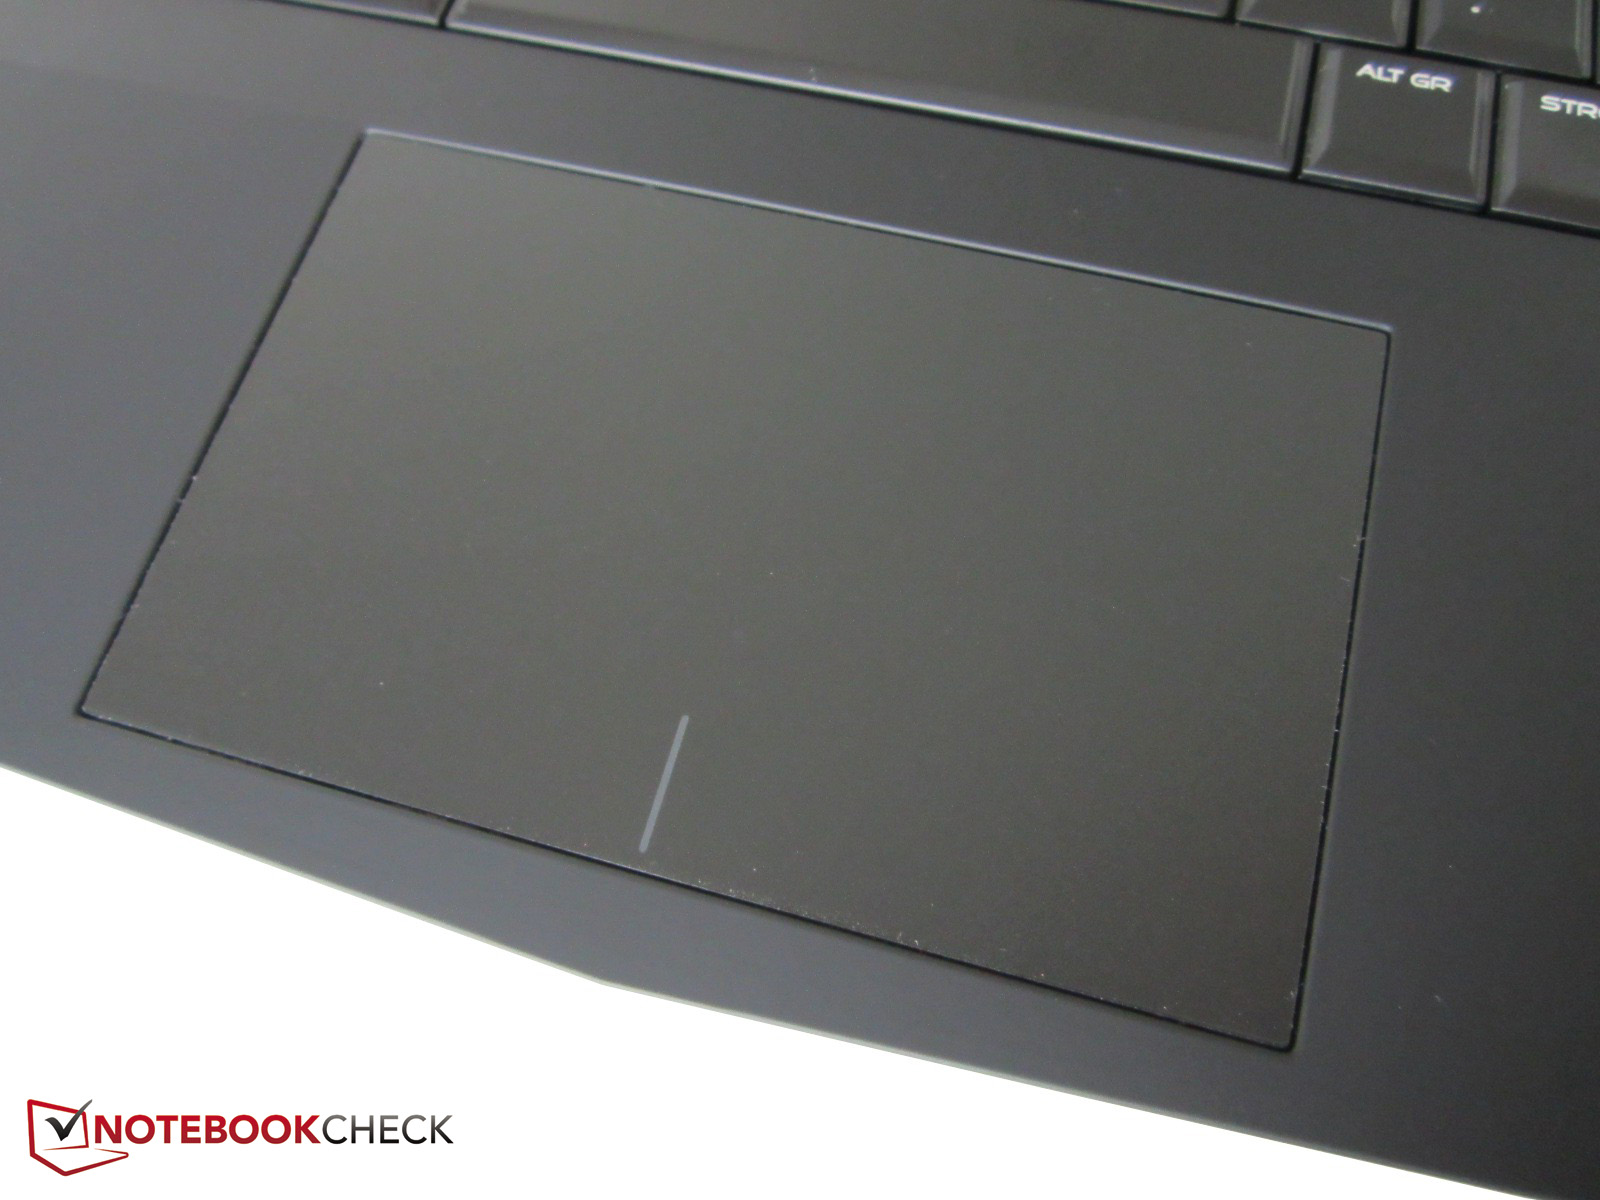
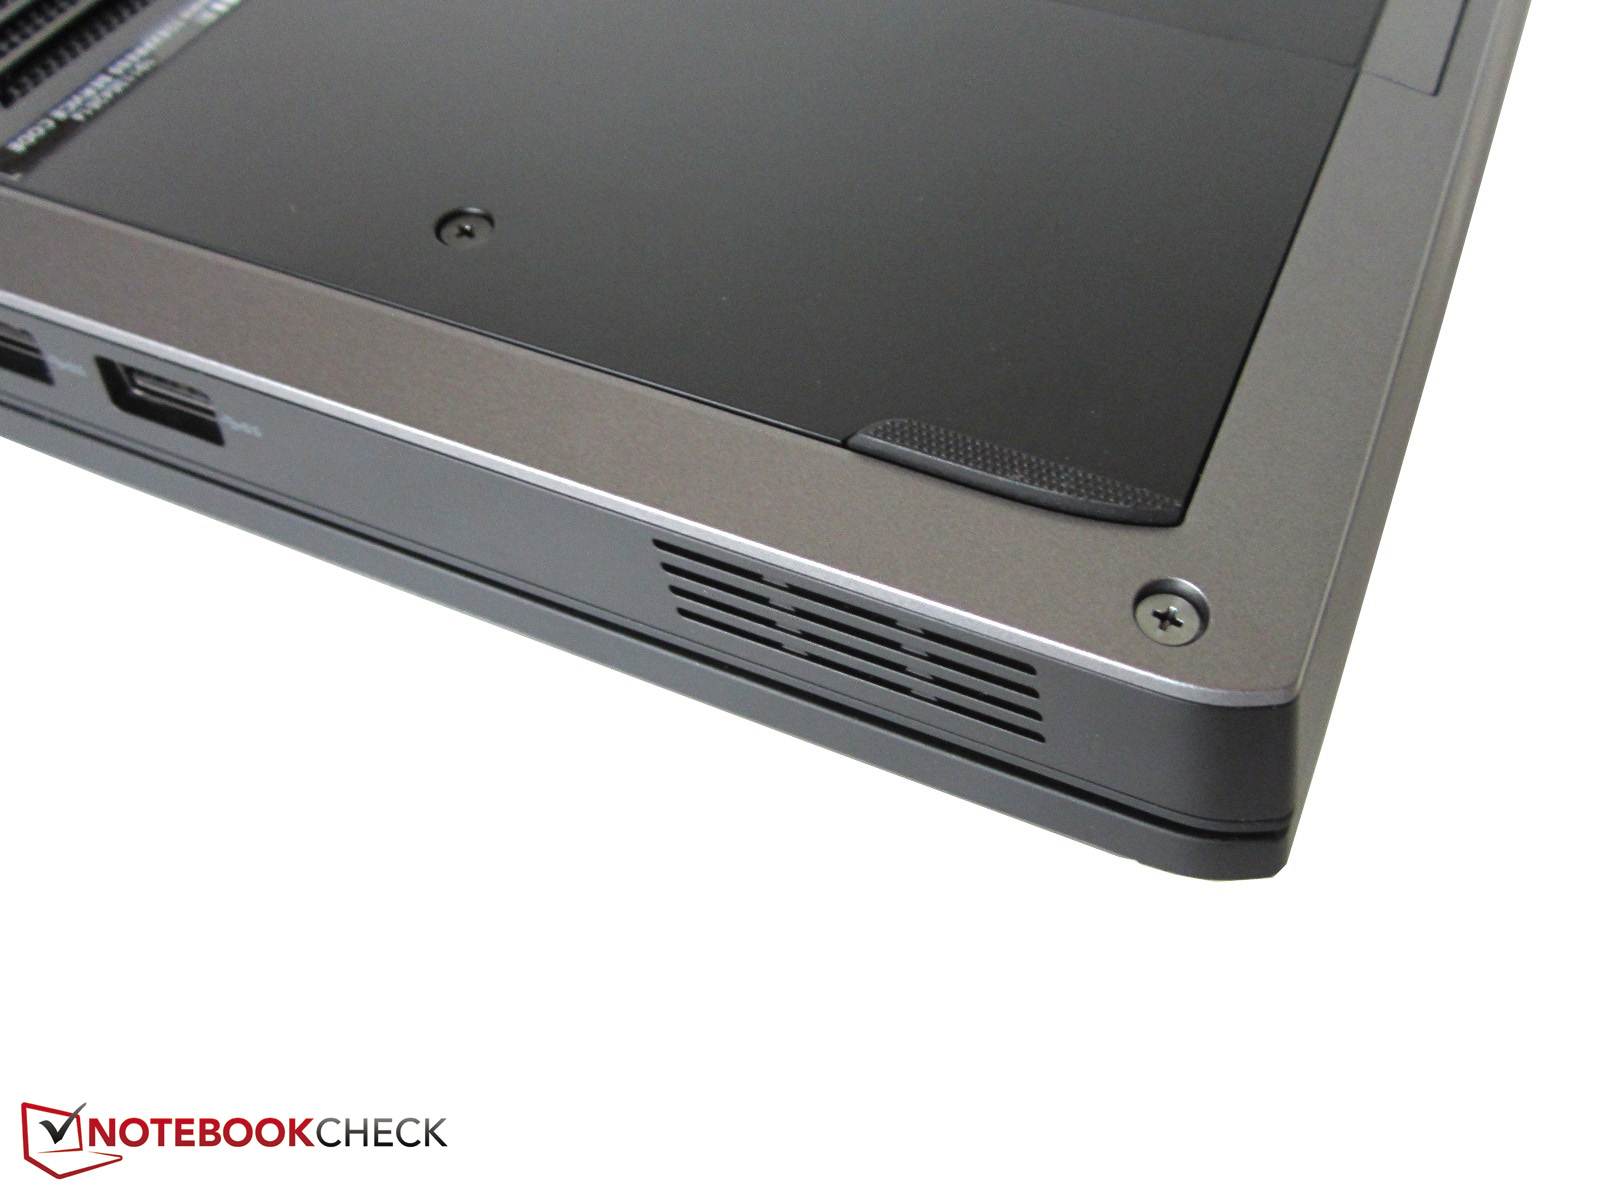
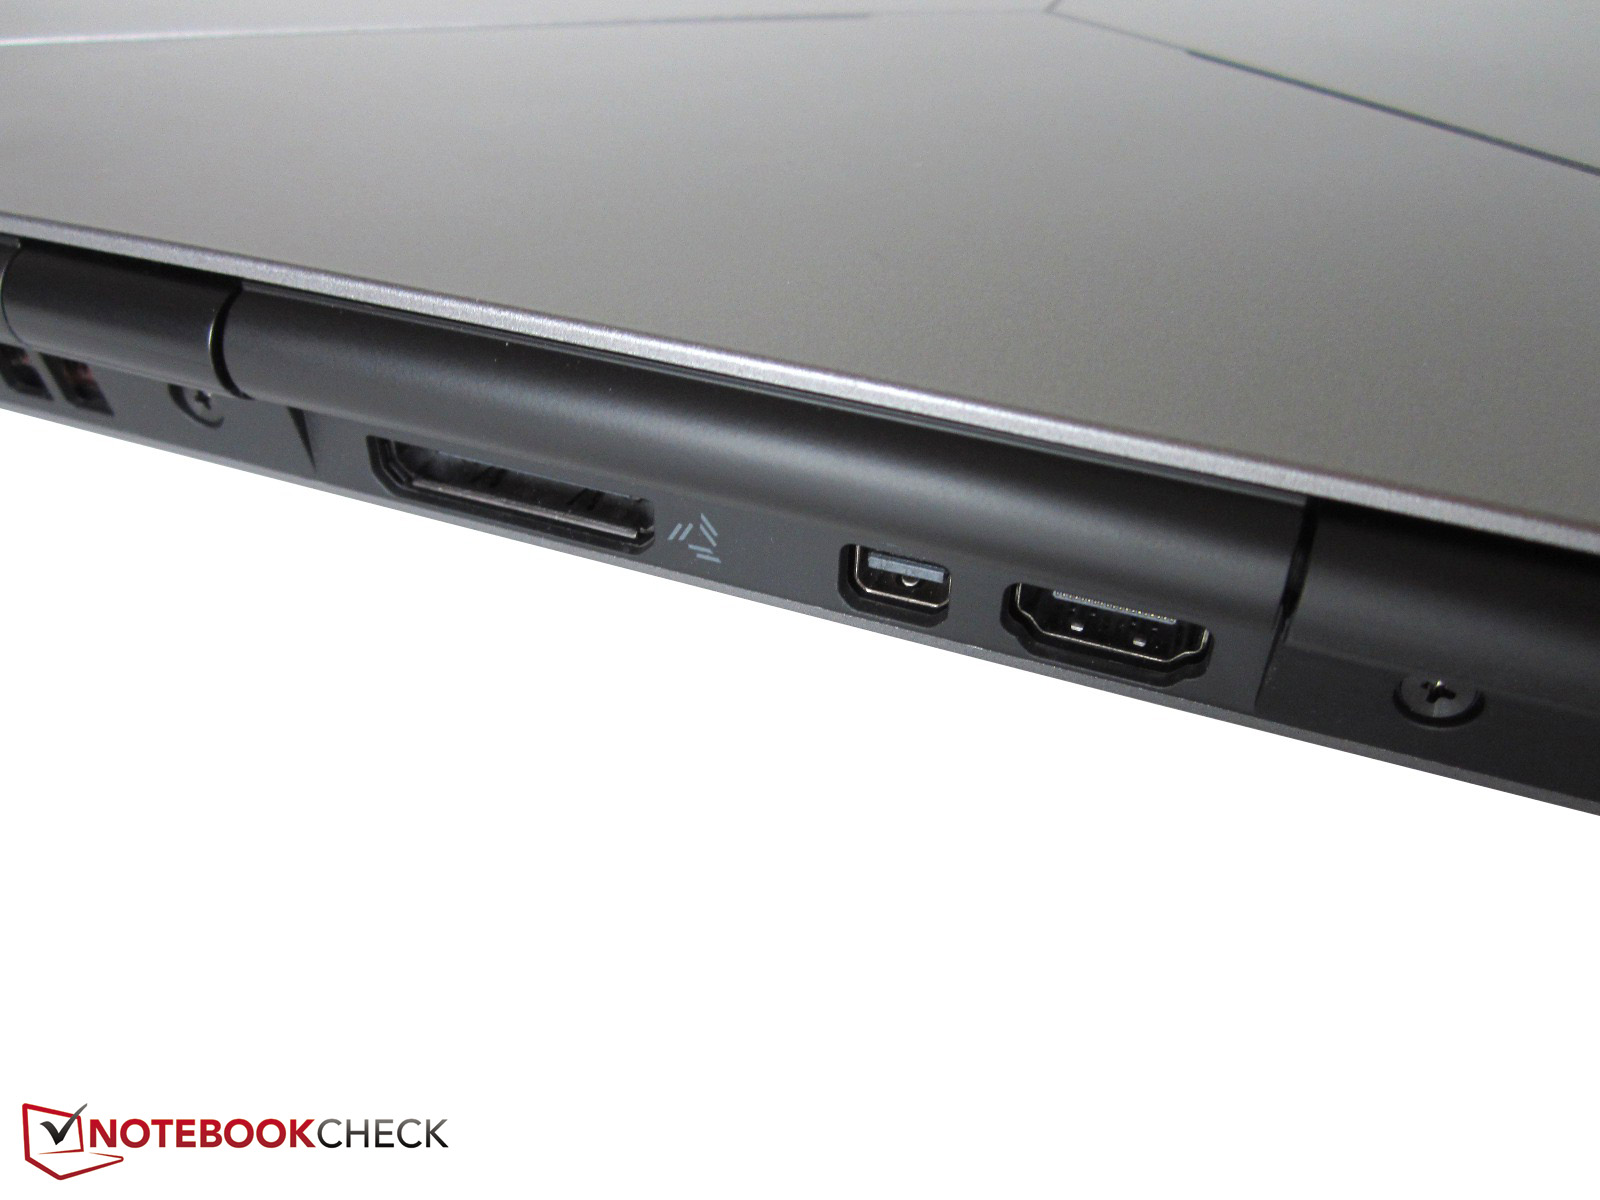
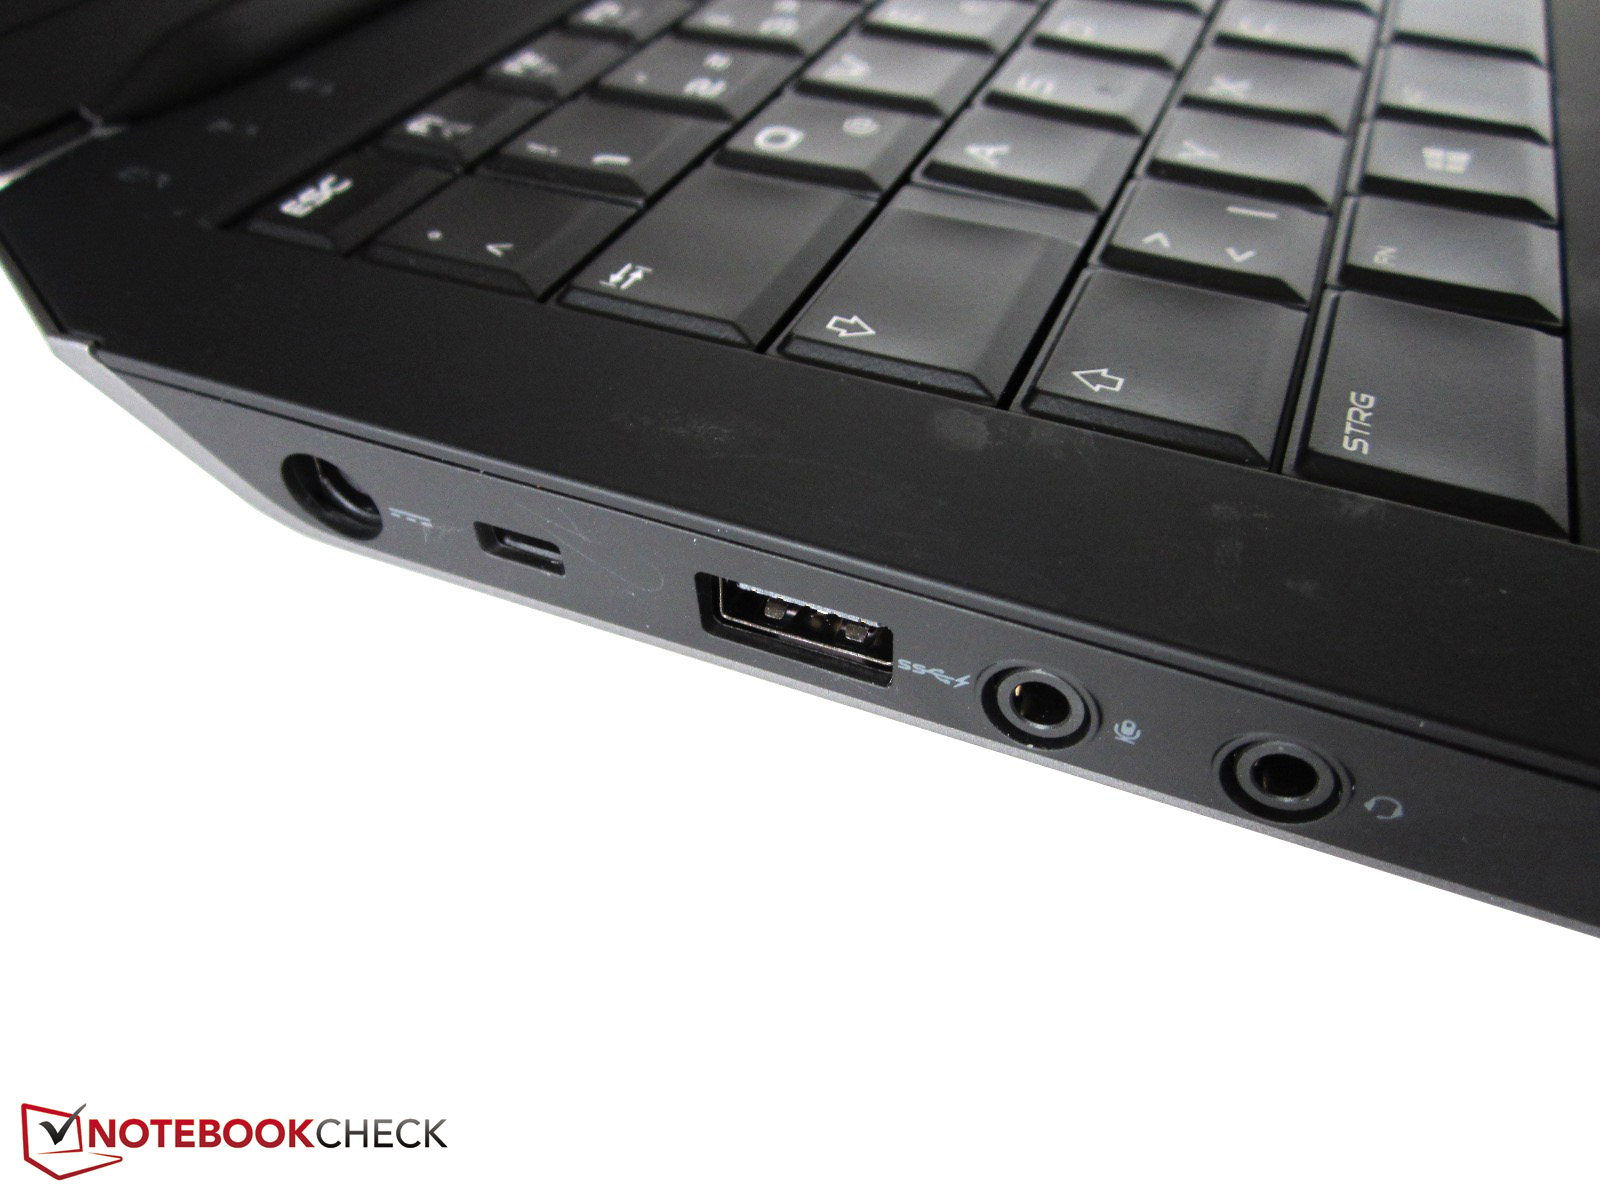
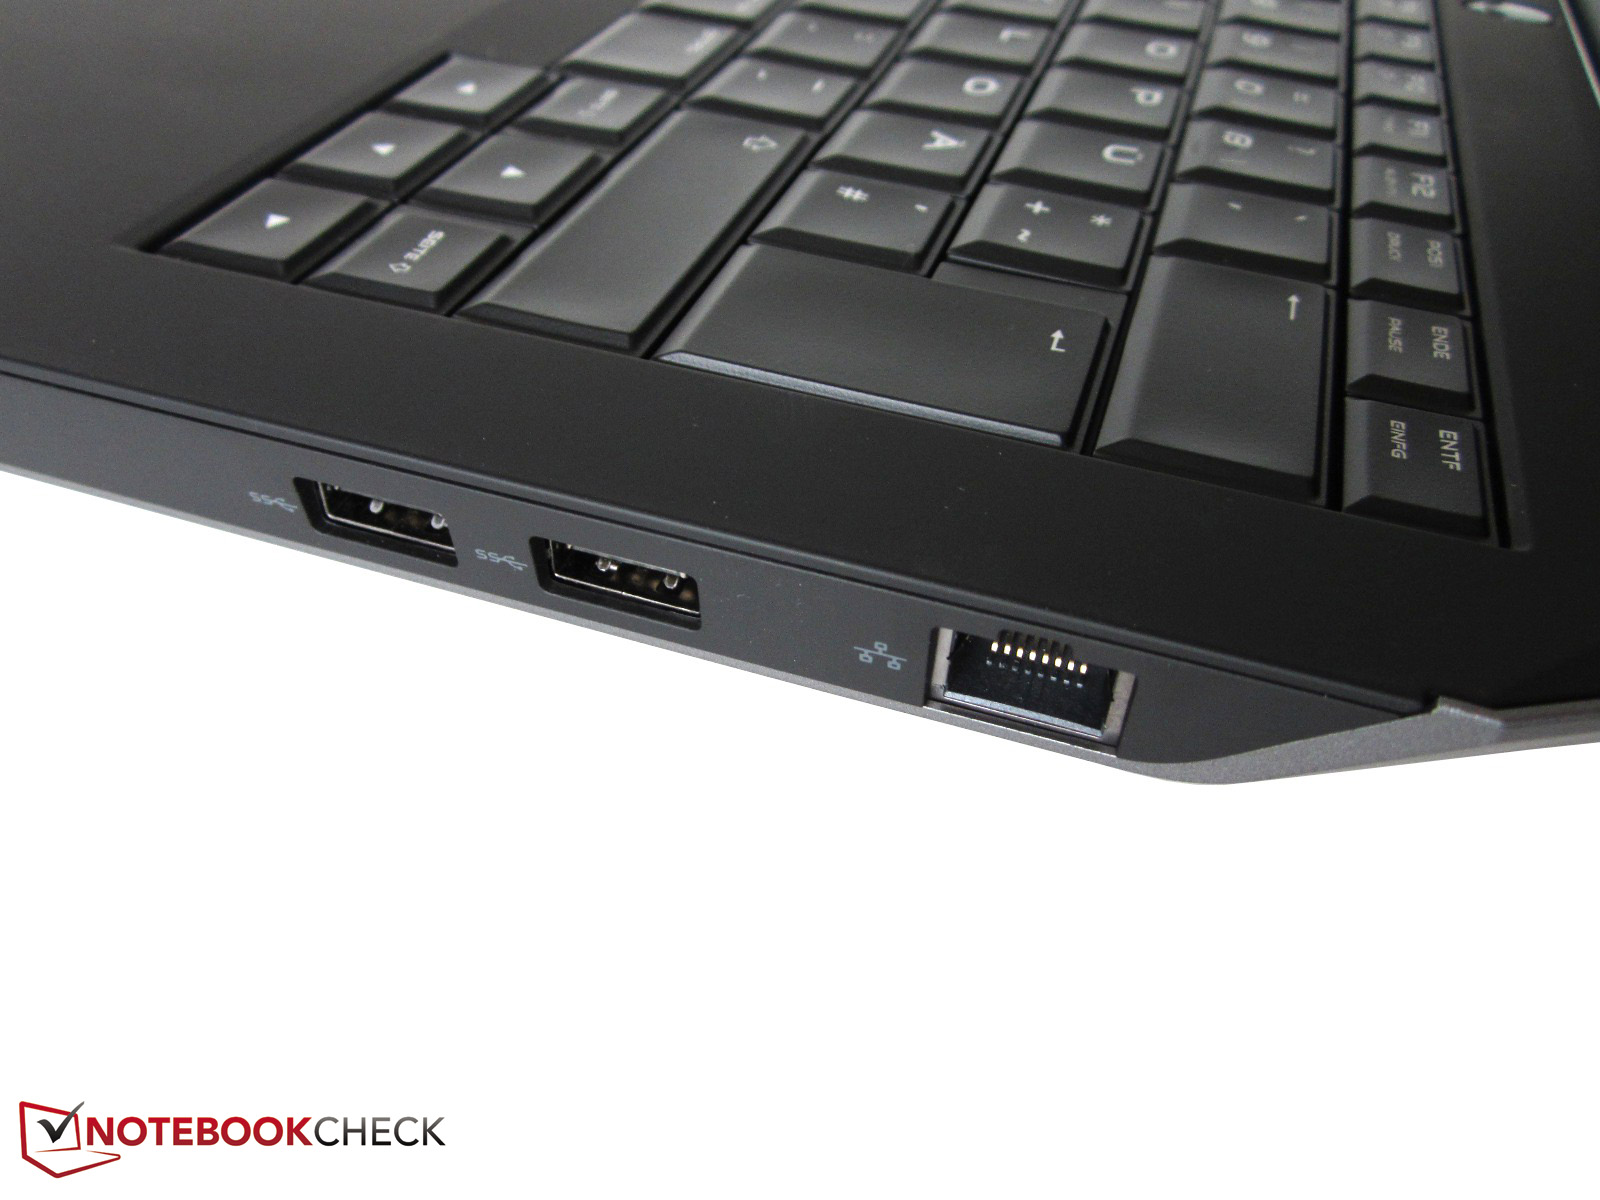
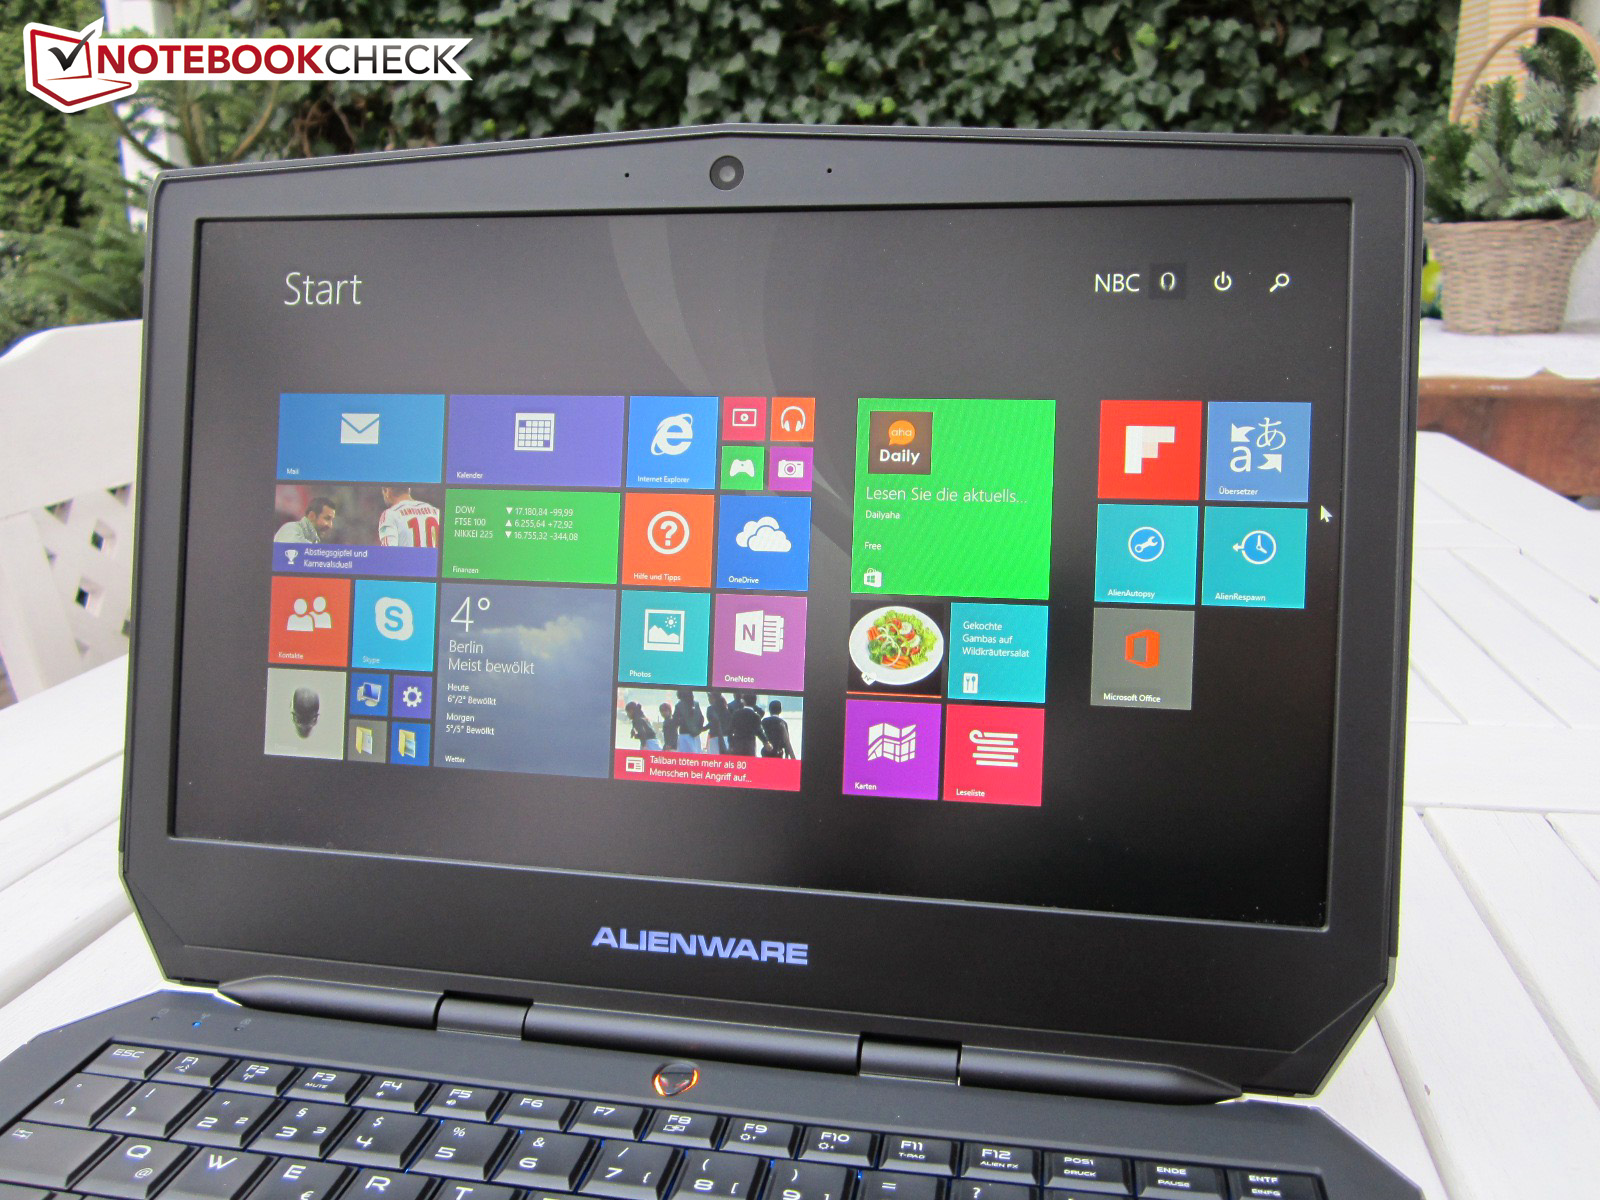
As the Alienware 13 is nigh identical to our test model in many ways, we will skip a few sections: the chassis, the connectivity, the input devices and the sound system. For more information on these topics, we refer you to the review of the Alienware 13 from last year. Hint: the images below have been taken from the previous review due to the aforementioned similarities.
Display
Despite being the same FHD panel of last year, the values are slightly different. For example, the 9T7WM-133HL display (monitor ID SDC4848) offered 997:1 contrast last year, whereas in our test model we measure a slightly higher contrast of 1,055:1. However, it is normal to see such small deviations in quality, even for supposedly identical panels.
| |||||||||||||||||||||||||
Brightness Distribution: 78 %
Center on Battery: 327 cd/m²
Contrast: 1055:1 (Black: 0.31 cd/m²)
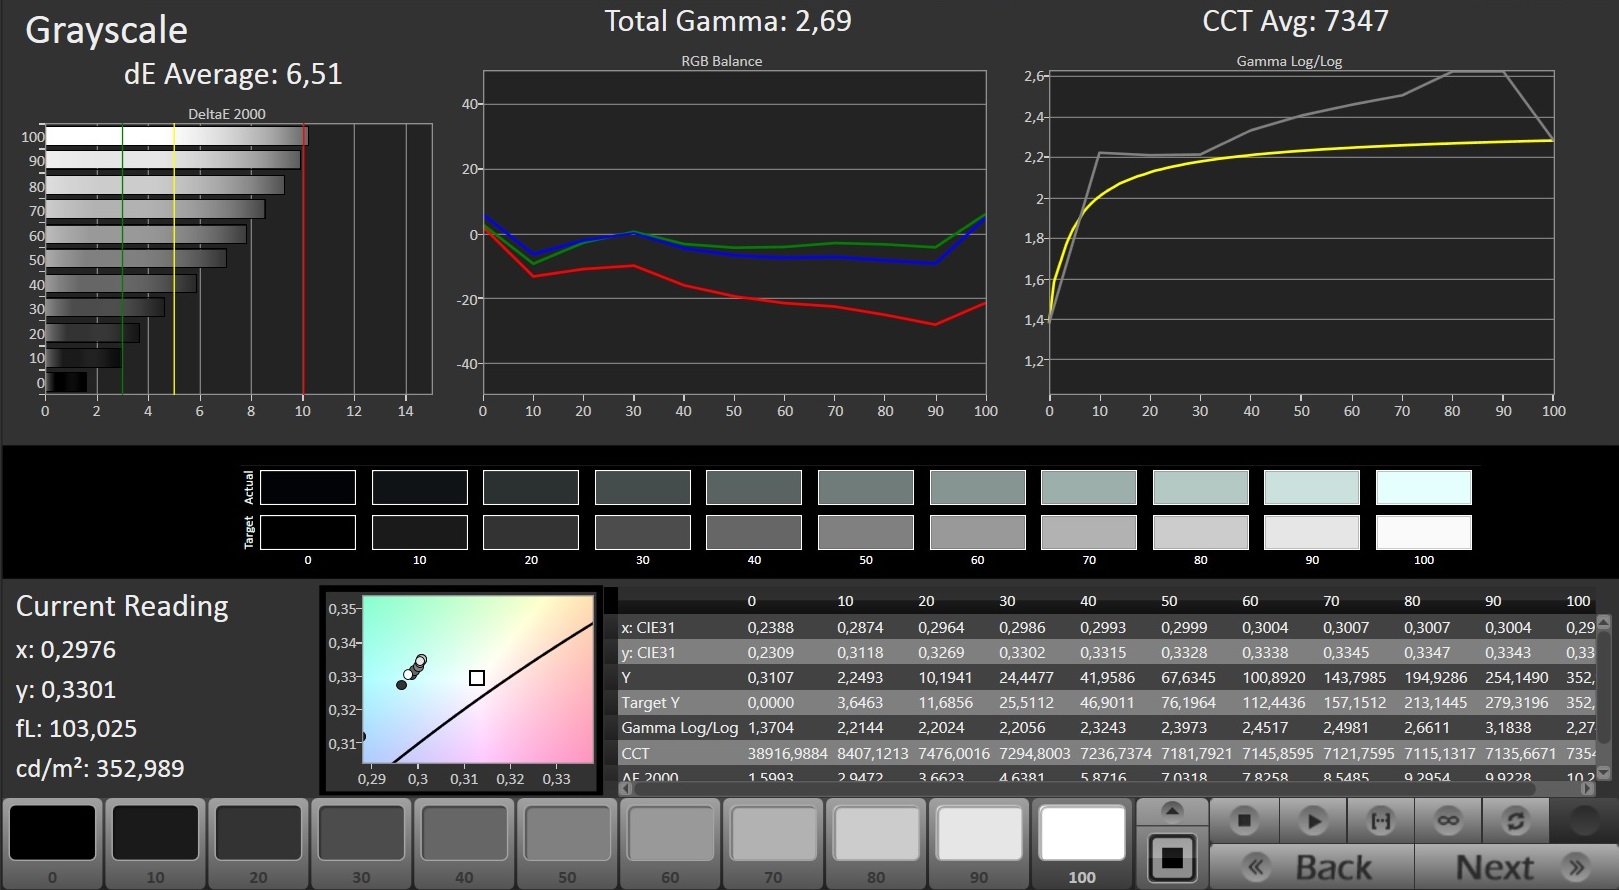
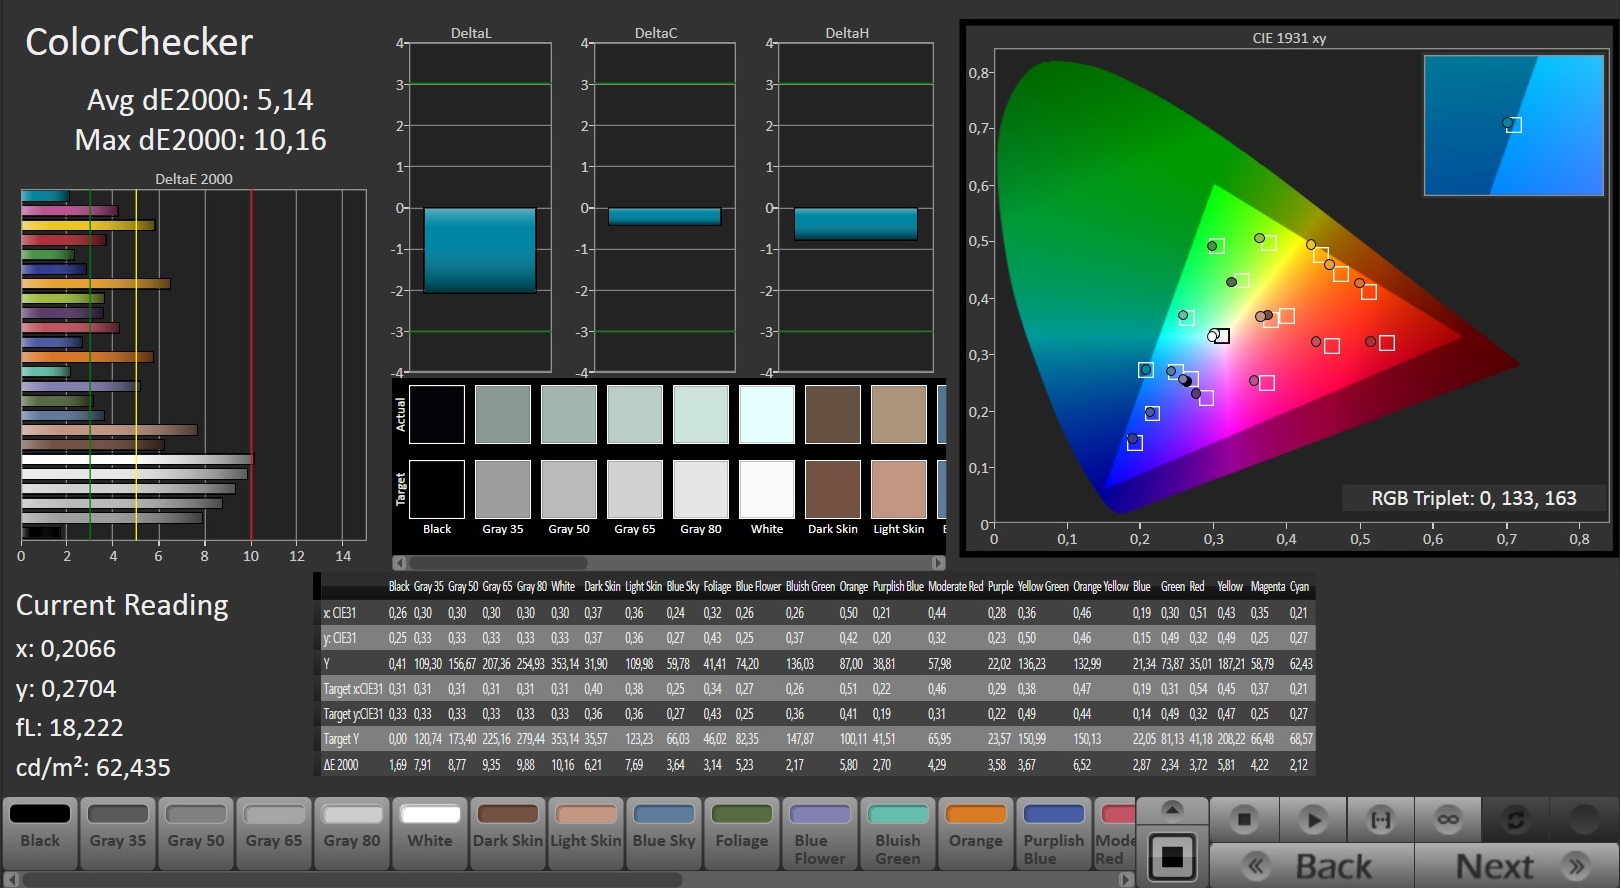
ΔE ColorChecker Calman: 5.14 | ∀{0.5-29.43 Ø4.73}
ΔE Greyscale Calman: 6.51 | ∀{0.09-98 Ø4.97}
97% sRGB (Argyll 1.6.3 3D)
61% AdobeRGB 1998 (Argyll 1.6.3 3D)
67.1% AdobeRGB 1998 (Argyll 3D)
94.9% sRGB (Argyll 3D)
64.9% Display P3 (Argyll 3D)
Gamma: 2.69
CCT: 7347 K
The panel also offers a great black value of 0.31 cd/m² and a brightness of 305 cd/m².
| Alienware 13 (GTX 960M) 9T7WM_133HL (SDC4C48) | MSI GS30 Shadow BOEhydis HN133WU3-102 (BOE05E3) | Alienware 13 9T7WM_133HL (SDC4C48) | Schenker XMG A305 CMN N133HSE-EA1 (CMN1343) | Schenker XMG C405 AU Optronics B140HAN01.1 (AUO113ED) | Razer Blade 14 2015 | |
|---|---|---|---|---|---|---|
| Display | -5% | -6% | -2% | 5% | ||
| Display P3 Coverage (%) | 64.9 | 65.9 2% | 61.8 -5% | 66.8 3% | 70.3 8% | |
| sRGB Coverage (%) | 94.9 | 85.5 -10% | 88.3 -7% | 89.6 -6% | 97.1 2% | |
| AdobeRGB 1998 Coverage (%) | 67.1 | 62.5 -7% | 63.4 -6% | 65.6 -2% | 71.1 6% | |
| Screen | -6% | -6% | -5% | -3% | -1% | |
| Brightness middle (cd/m²) | 327 | 273 -17% | 319 -2% | 315 -4% | 280 -14% | 318.4 -3% |
| Brightness (cd/m²) | 305 | 258 -15% | 295 -3% | 310 2% | 267 -12% | 311 2% |
| Brightness Distribution (%) | 78 | 88 13% | 83 6% | 86 10% | 85 9% | 78 0% |
| Black Level * (cd/m²) | 0.31 | 0.38 -23% | 0.32 -3% | 0.35 -13% | 0.32 -3% | 0.416 -34% |
| Contrast (:1) | 1055 | 718 -32% | 997 -5% | 900 -15% | 875 -17% | 765 -27% |
| Colorchecker dE 2000 * | 5.14 | 4.86 5% | 5.83 -13% | 5.63 -10% | 4.75 8% | 3.67 29% |
| Greyscale dE 2000 * | 6.51 | 4.56 30% | 7.63 -17% | 6.71 -3% | 5.91 9% | 5.41 17% |
| Gamma | 2.69 82% | 2.23 99% | 2.57 86% | 2.53 87% | 2.52 87% | 2.26 97% |
| CCT | 7347 88% | 7292 89% | 7195 90% | 5920 110% | 5742 113% | 7118 91% |
| Color Space (Percent of AdobeRGB 1998) (%) | 61 | 56 -8% | 57 -7% | 57 -7% | 59 -3% | 64.64 6% |
| Color Space (Percent of sRGB) (%) | 97 | |||||
| Total Average (Program / Settings) | -6% /
-6% | -6% /
-6% | -5% /
-5% | -3% /
-3% | 2% /
1% |
* ... smaller is better
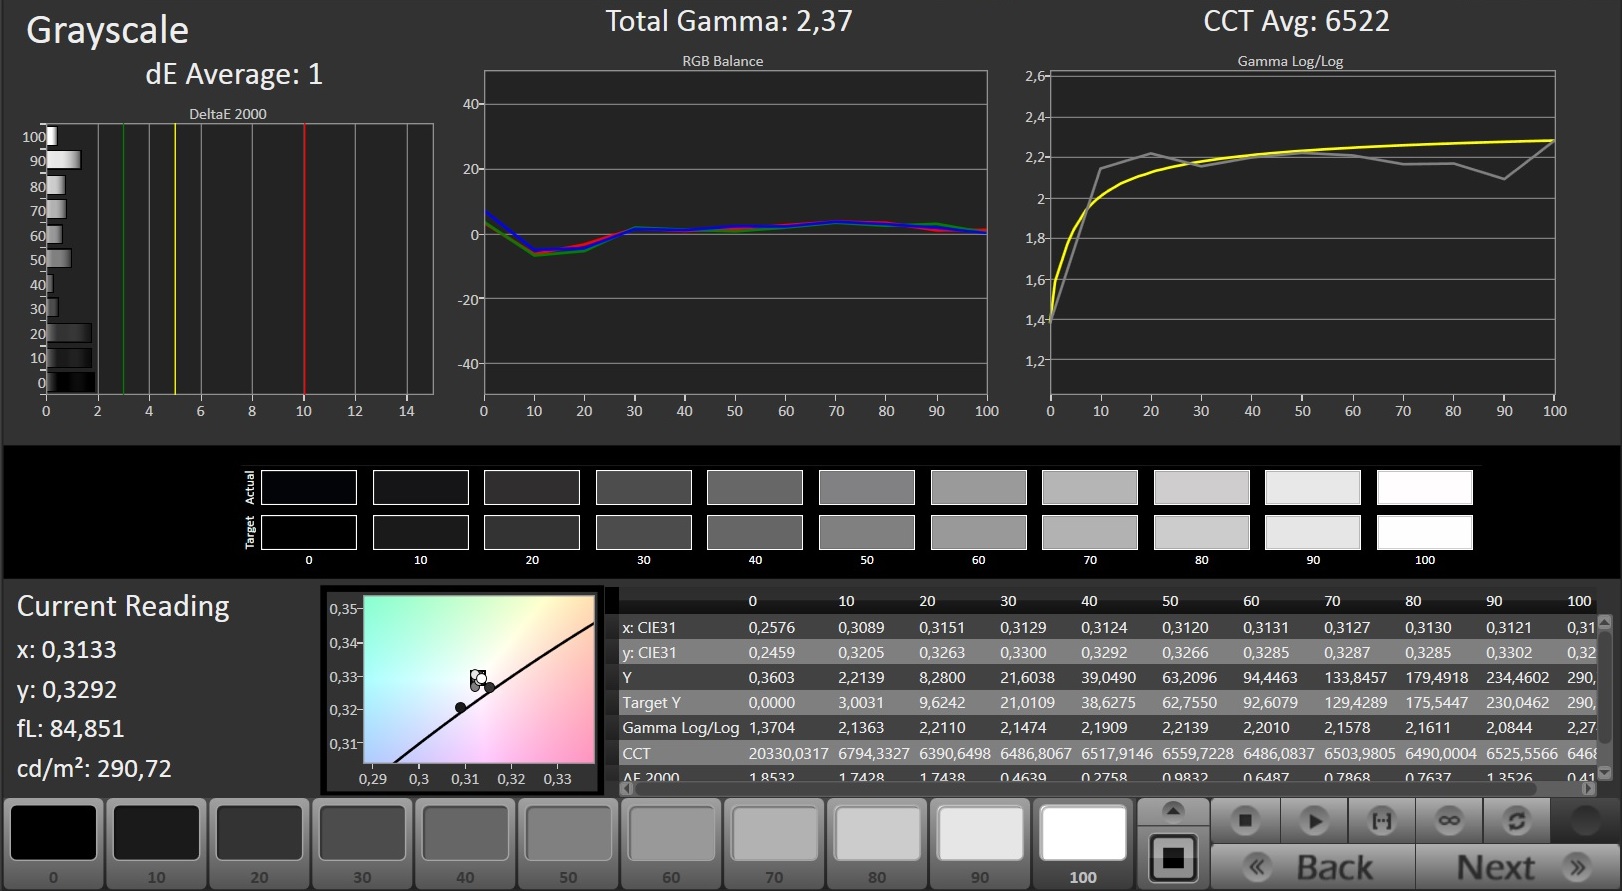
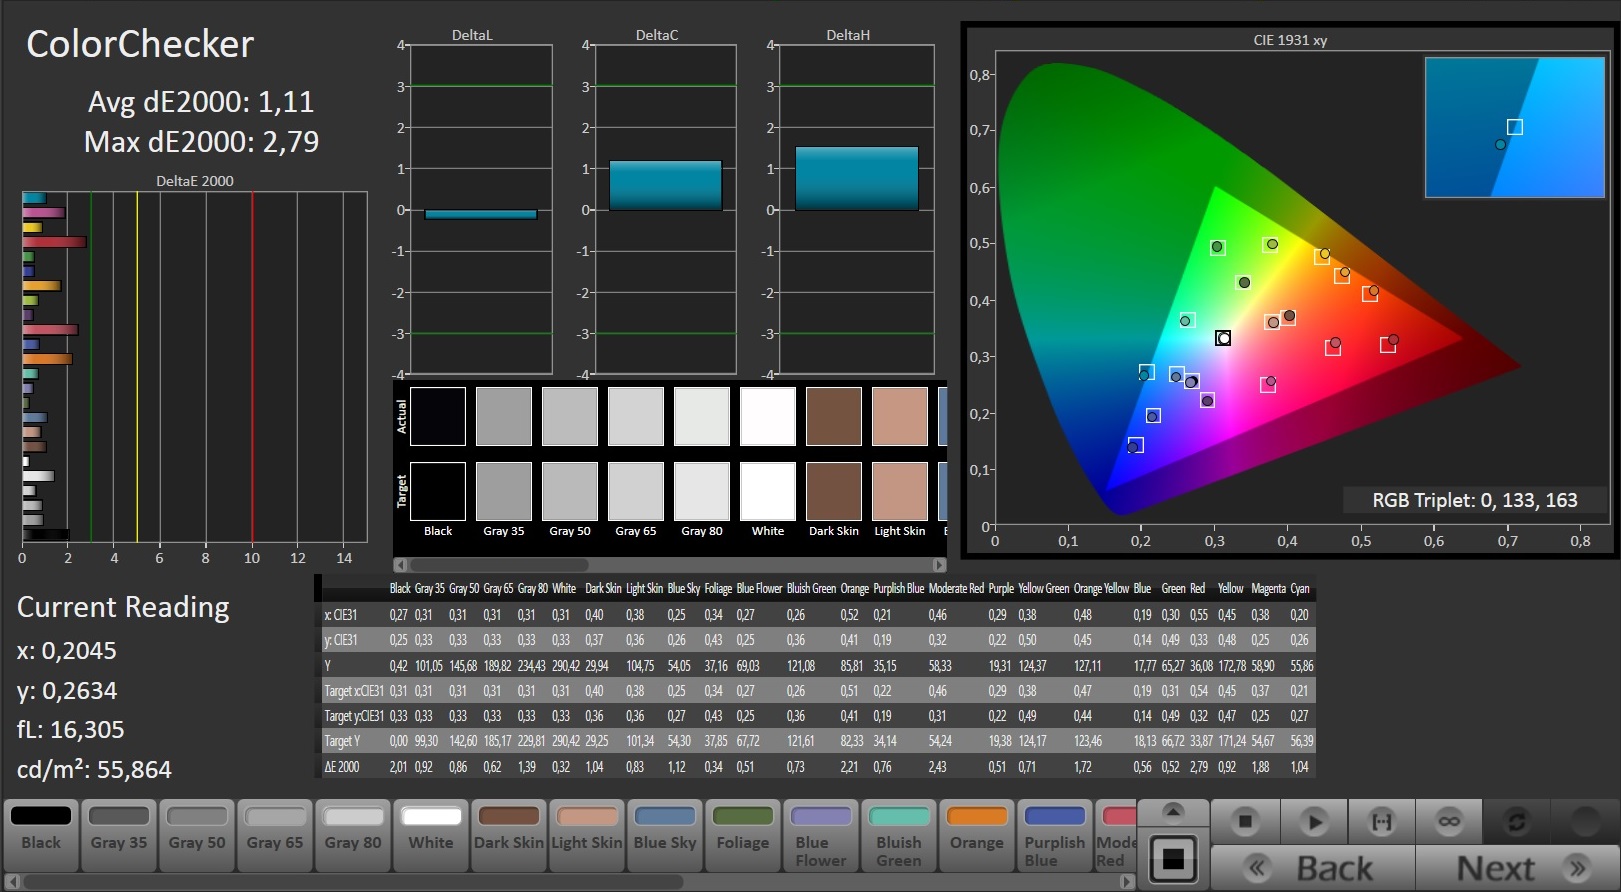
In the color tests with the professional CalMAN tool, the FHD display shows some great results. In comparison to most competitors, our test model has fewer deviations from the optimal color value. After a calibration, the panel offers very accurate grayscale, RGB balance and saturation.
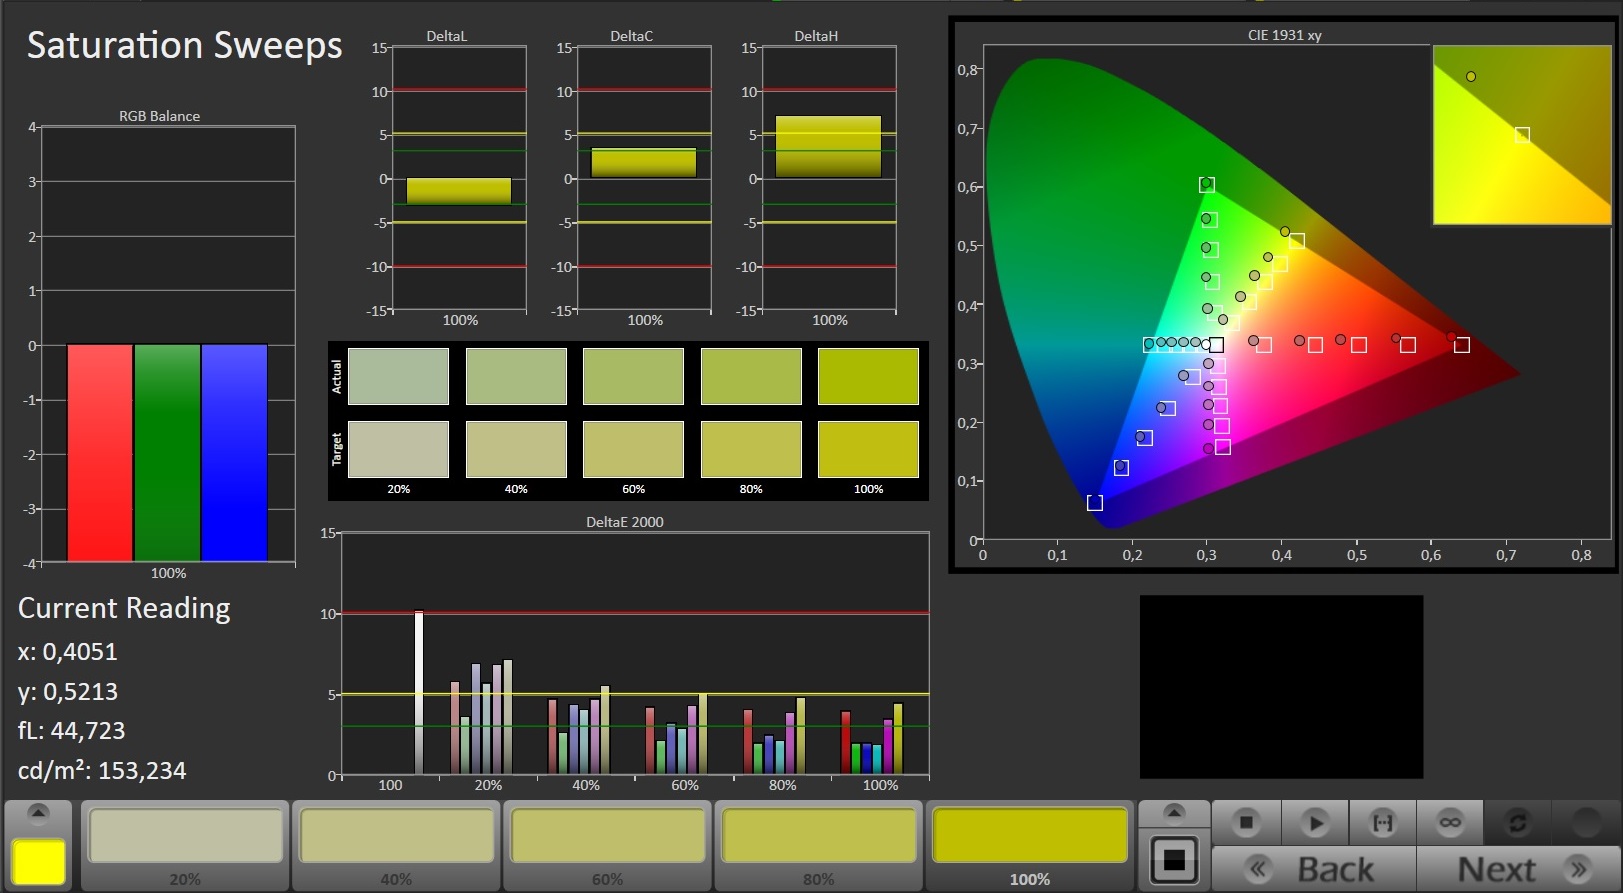
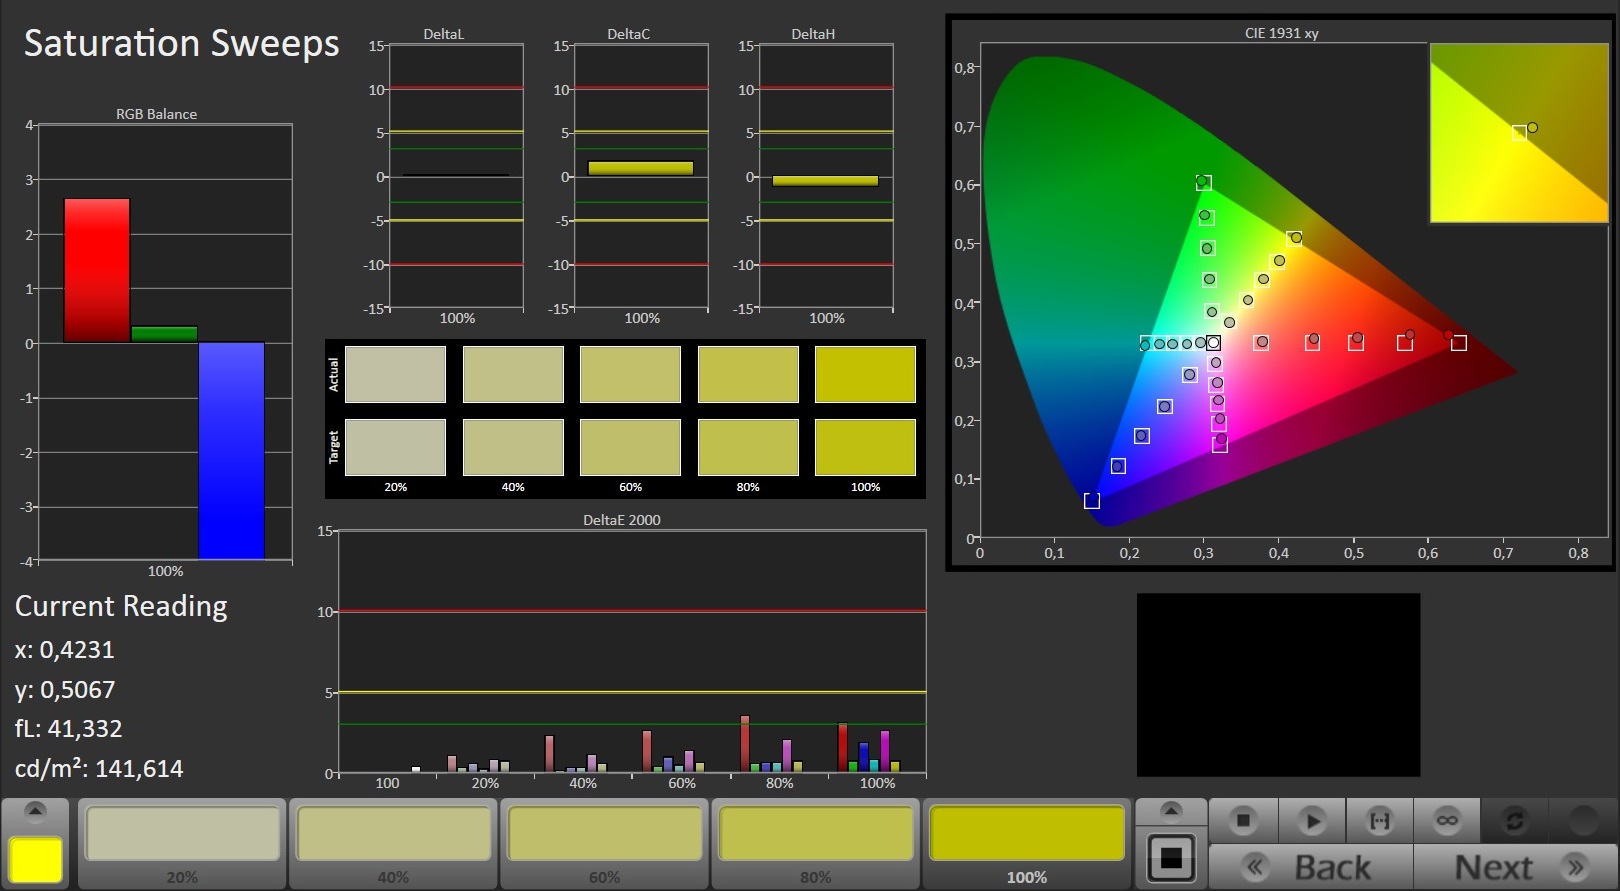

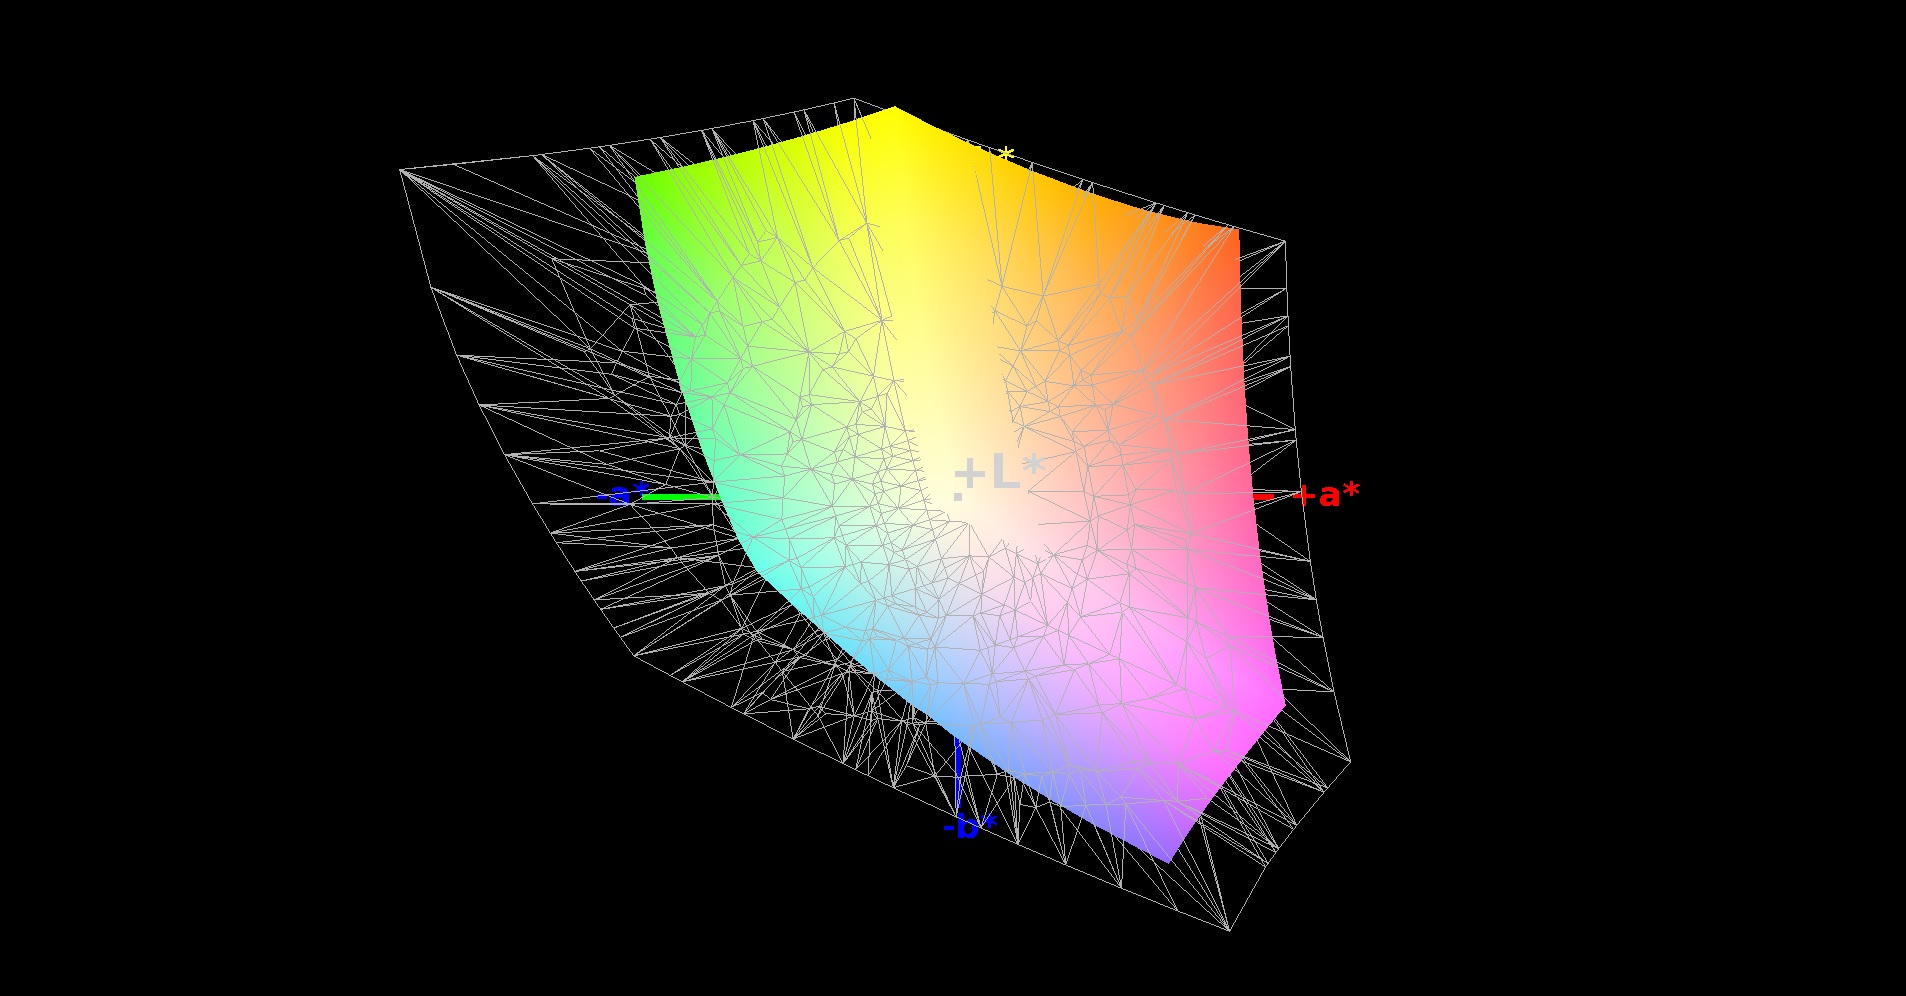
The panel has a nice AdobeRGB coverage of 61%. The sRGB color spectrum is almost fully covered by the 13-inch screen.

Performance
Despite the CPU and GPU updates, we do not consider the Alienware 13 a member of the high-end class. Rather, we believe it places firmly in the middle-class. A dual-core processor or a graphics card with 2 GB VRAM is no longer appropriate for the high-end class in 2015. On the other hand, 16 GB DDR3 RAM and a M.2 format Solid State Drive (SSD) are definitely high-end.

Processor
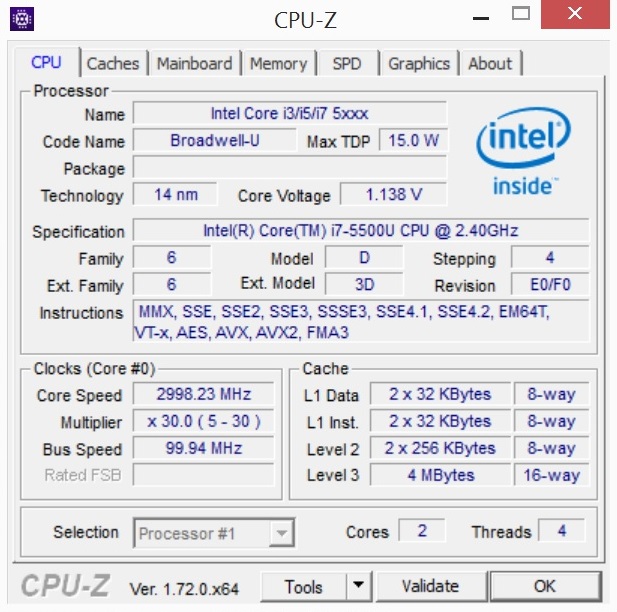
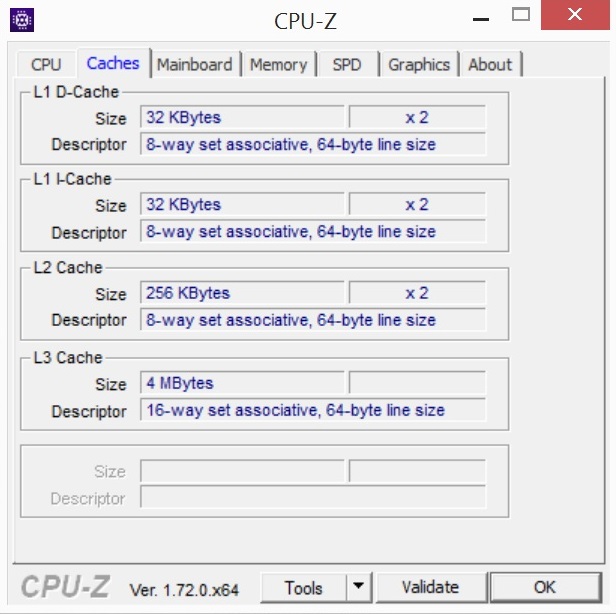
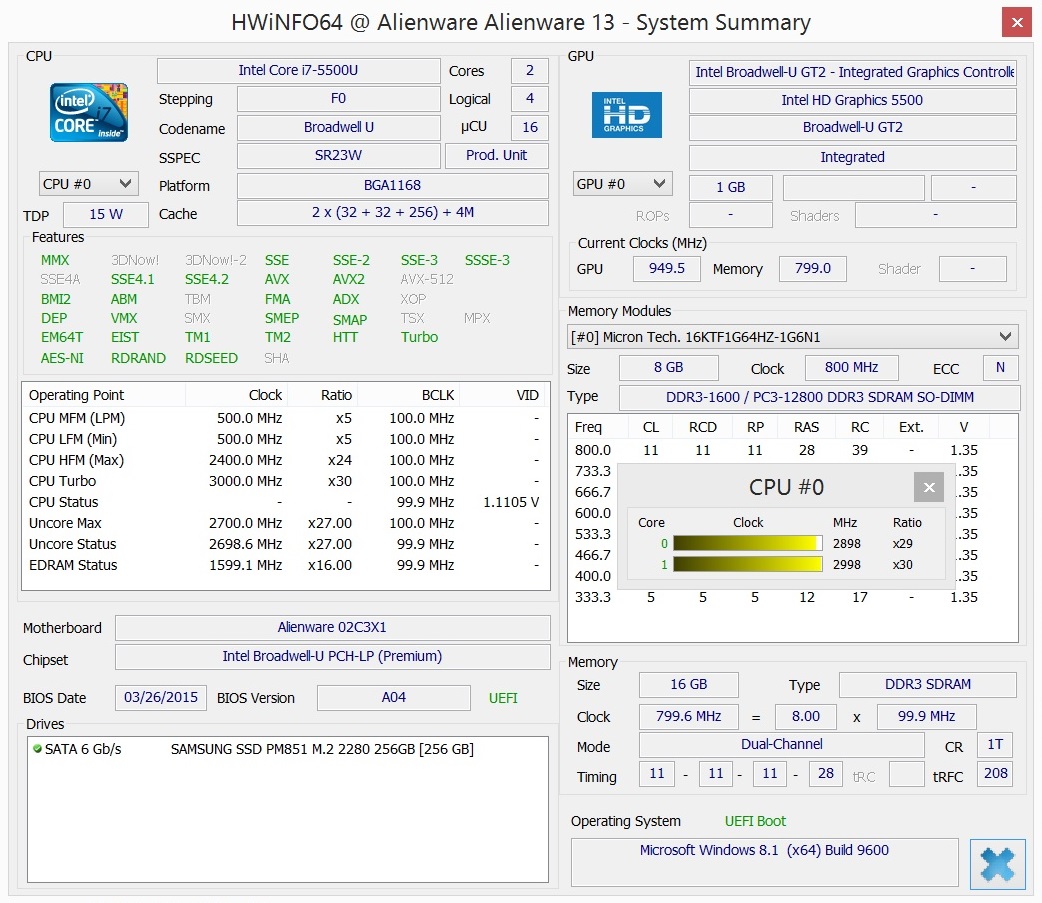
Of course, the most important change is the processor. The Intel Core i5-4210U of last year belongs to the Haswell generation and achieved a maximum of 2.7 GHz. Our test model is equipped with the Core i7-5500U, which can achieve up to 3.0 GHz at load (+300 MHz). The base clock speed is +700 MHz higher (2.4 vs. 1.7 GHz). Furthermore, Intel has also upgraded the L3 cache. Instead of the 3 MB cache of last year, the i7-5500U uses a 4 MB L3 cache.
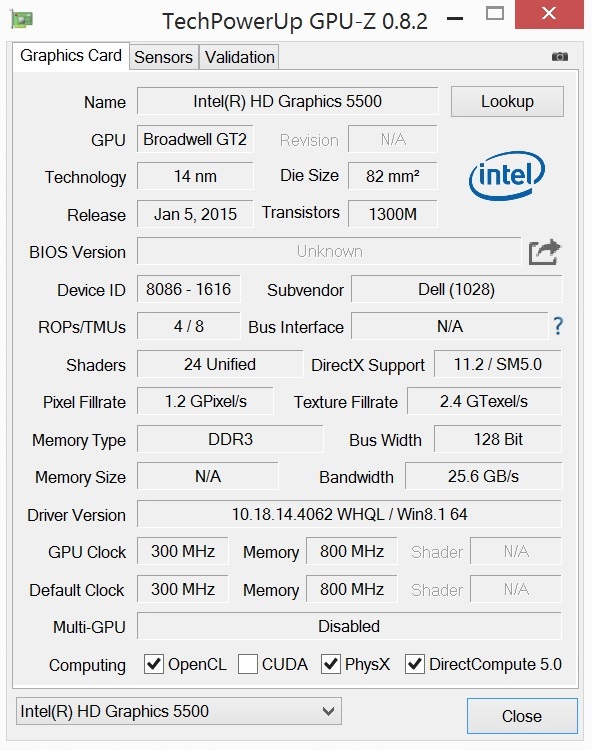
In addition, the HD Graphics 4400 (@i5-4210U) has been upgraded to the HD Graphics 5500 IGP (300-950 MHz). Thanks to Nvidia Optimus, the laptop can swap between the IGP and GPU, depending on the performance the user requires. For example, while performing everyday tasks, such as word editing or surfing the web, the IGP will be in charge, but as soon as you start a game, the dedicated Nvidia GPU will kick in. Both processors have a TDP value of 15 W.
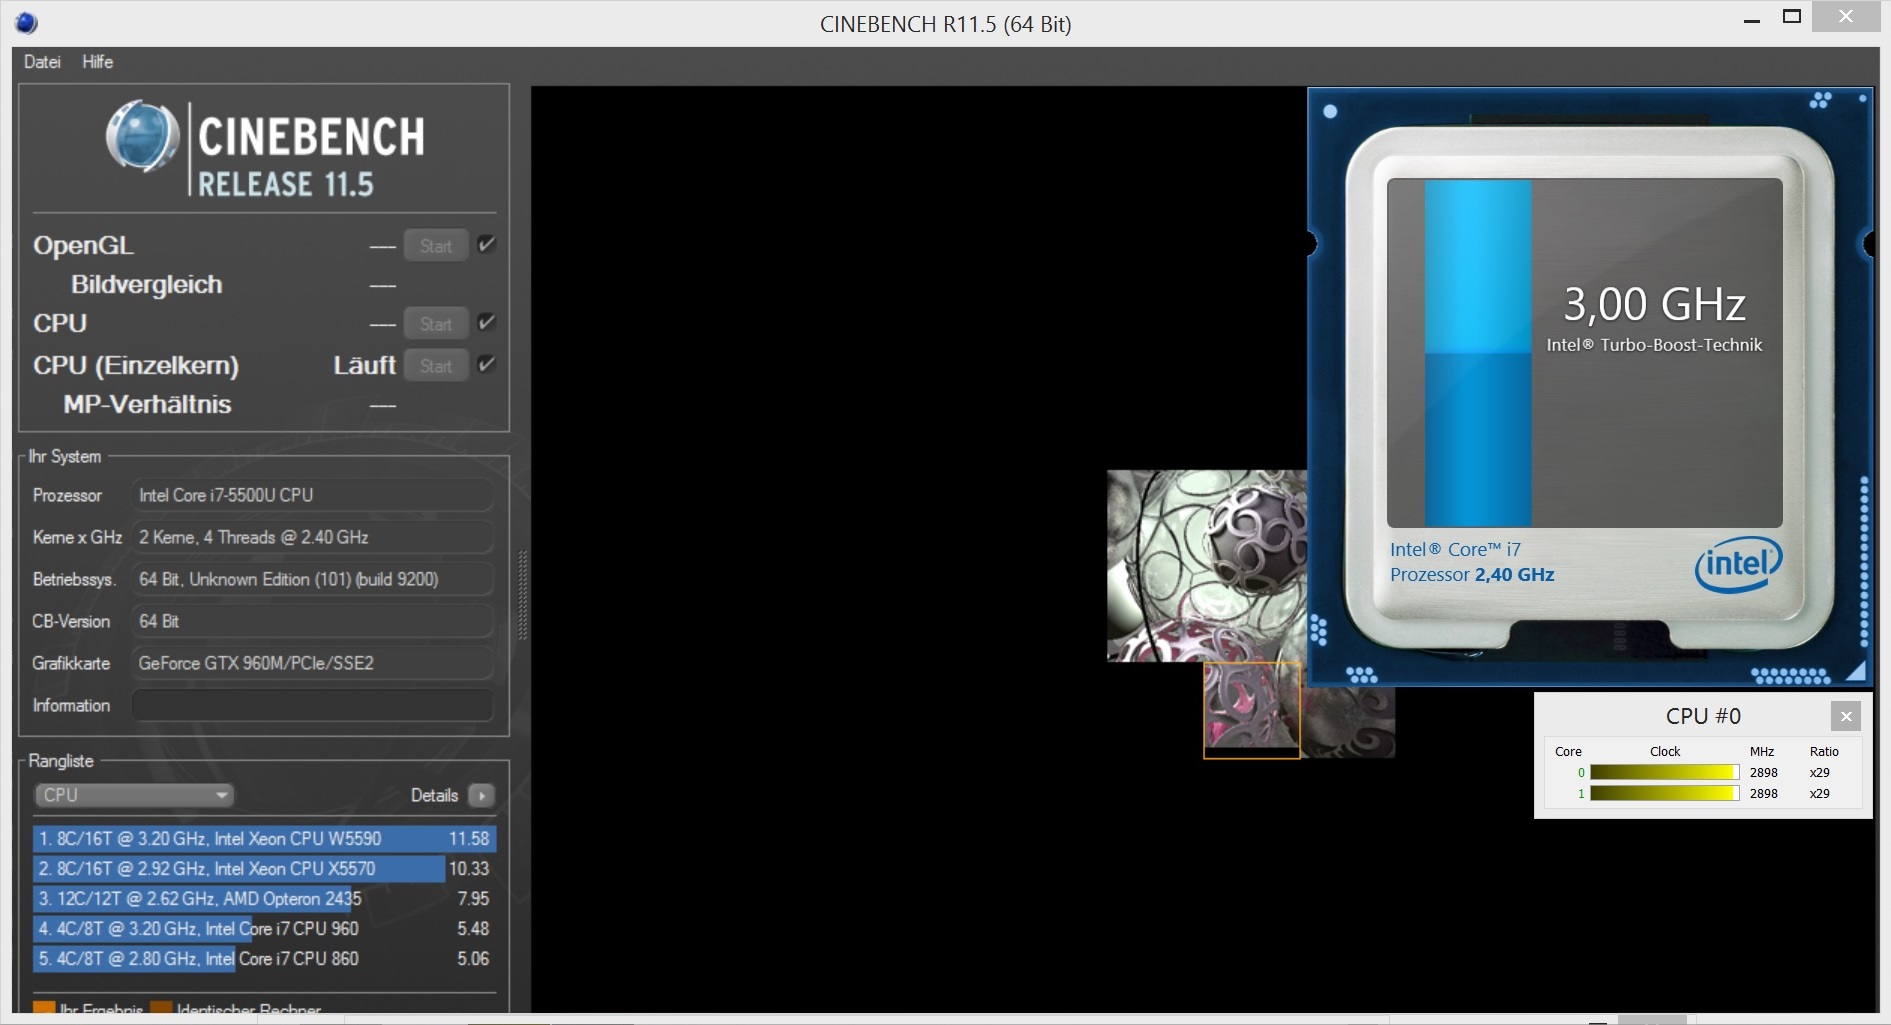
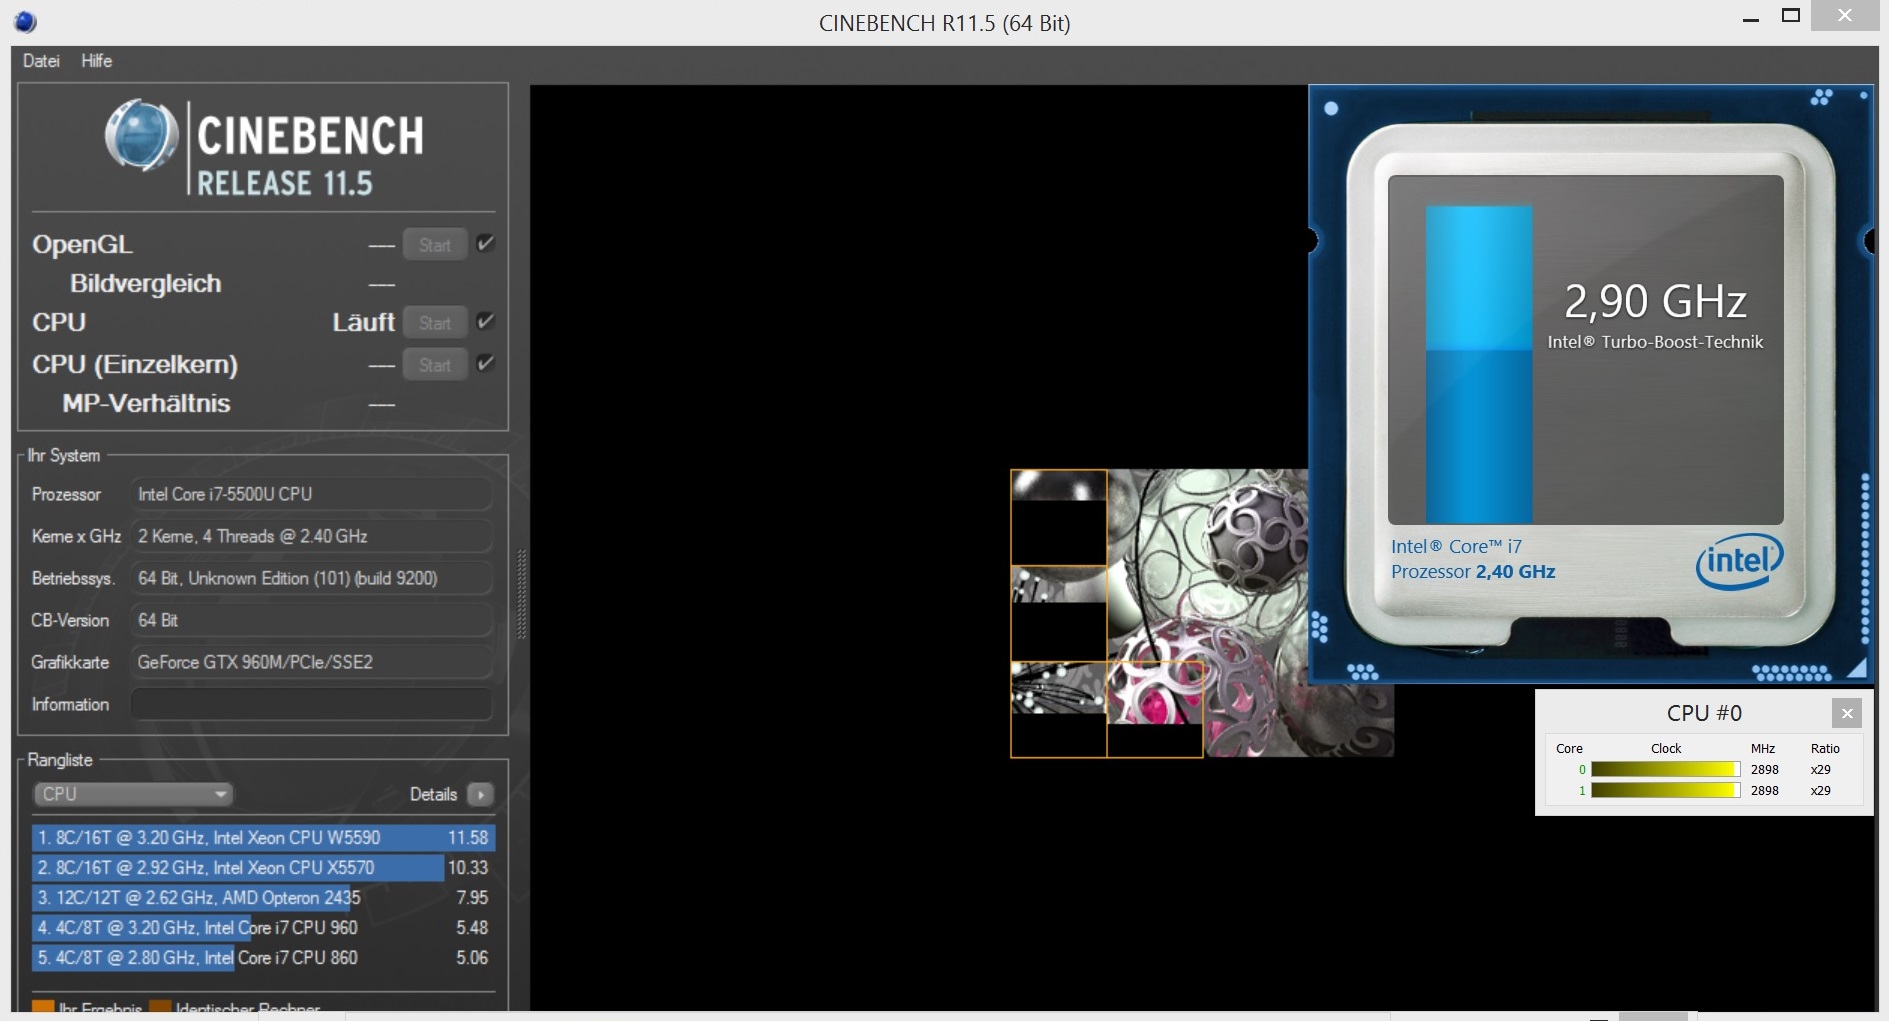
Thankfully, the CPU does not display an erratic clock speed behavior. In the Cinebench R11.5 benchmarks (see screenshots), the Core i7-5500U operates at its maximum speeds of 2.9-3.0 GHz. Although, the CPU speed dropped briefly to the 2 GHz region during the 3D test of the Unigine Heaven 4.0 benchmark, we did not encounter any actual throttling. However at full load, which will never occur during everyday usage (not even when playing games), the processor throttles down.
The CPU benchmarks leave us with mixed feelings. The Core i7-5500U is 20% faster than the Core i5-4210U in single-core and multi-core tests. However, in comparison to the traditional 47 W quad-core CPU found in most gaming notebooks, our CPU stands no chance. In fact, the gaps are enormous when we run any test that uses more than one core: the Core i7-4720HQ can surpass our test model by 100% in a few tests. The Schenker XMG A305 (GTX 960M) and the Razer Blade 14 (GTX 970M) are proof that it is possible to have a powerful quad-core processor in a flat 13 or 14-inch chassis.
System Performance
The weak processor of our test model performs clearly lower than the competition in system tests. The Alienware scores 5,238 points in PCMark 7, which is behind the gaming competition by about 20% (6,510 points @MSI GS30). Thankfully, the lower performance is not noticeable in everyday use.
| PCMark 7 Score | 5238 points | |
Help | ||
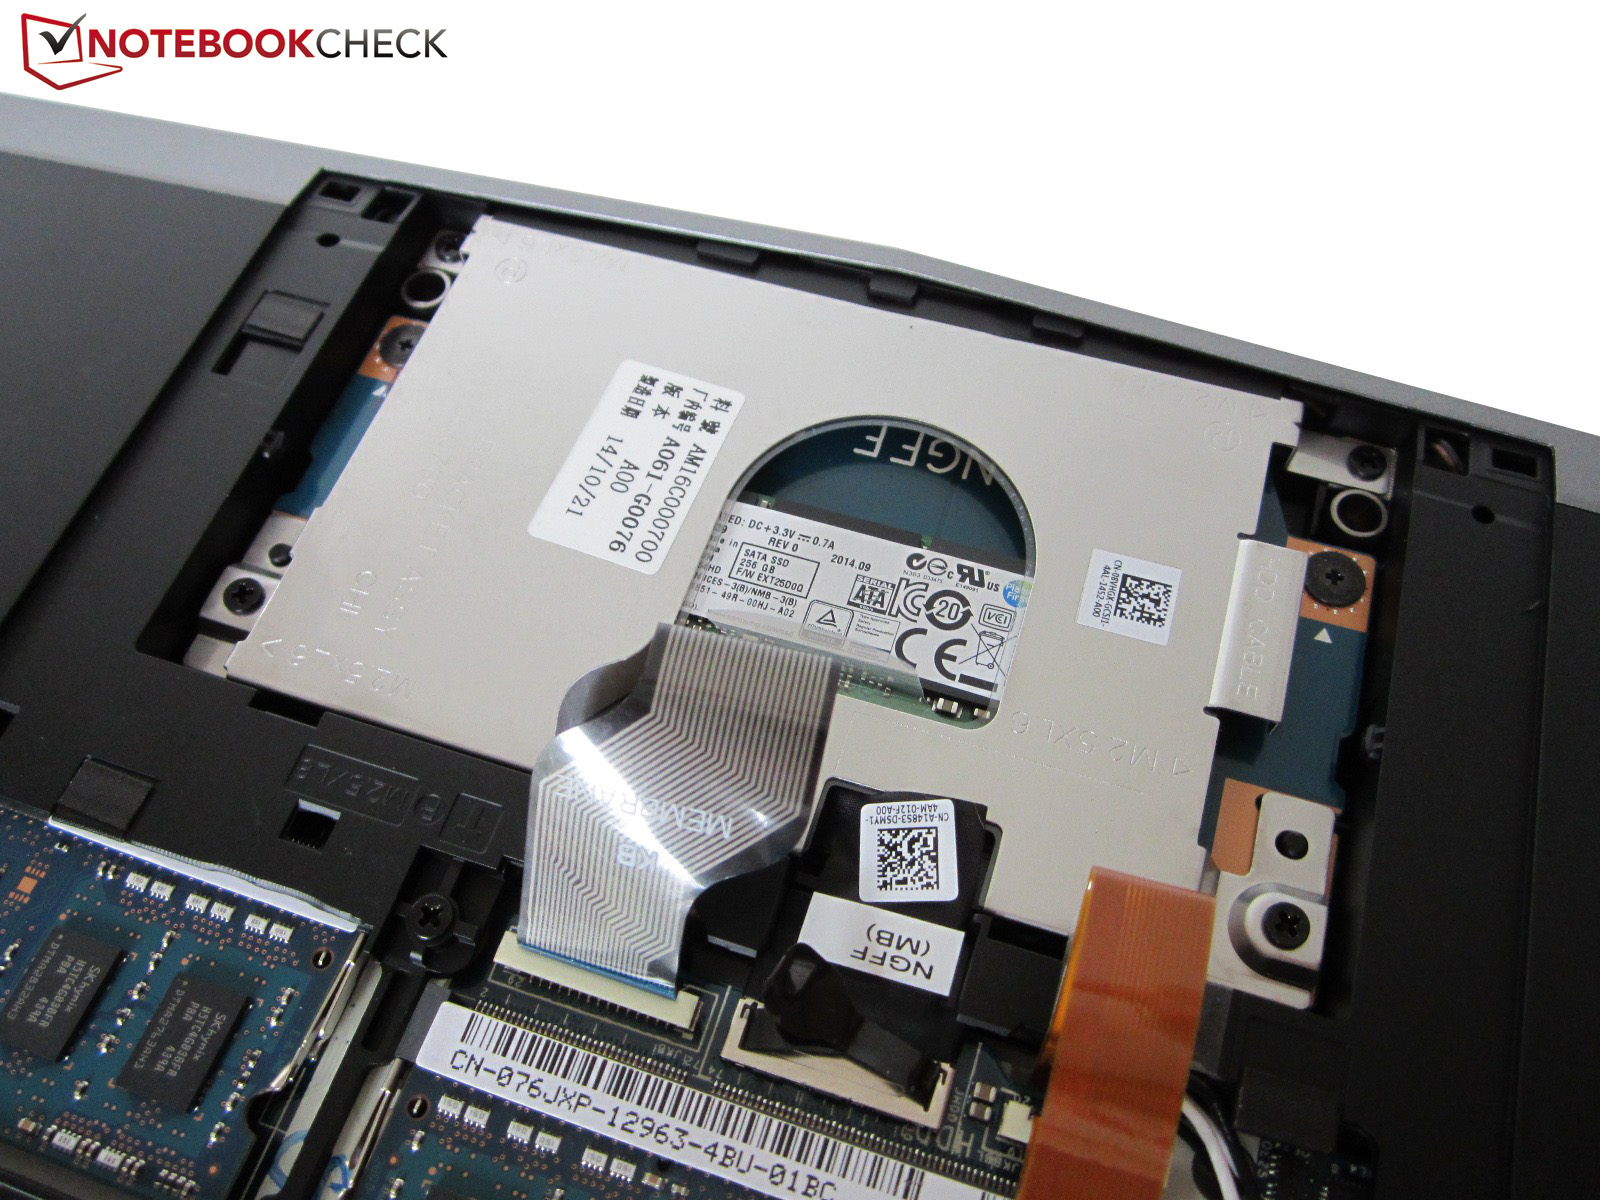
Storage Device
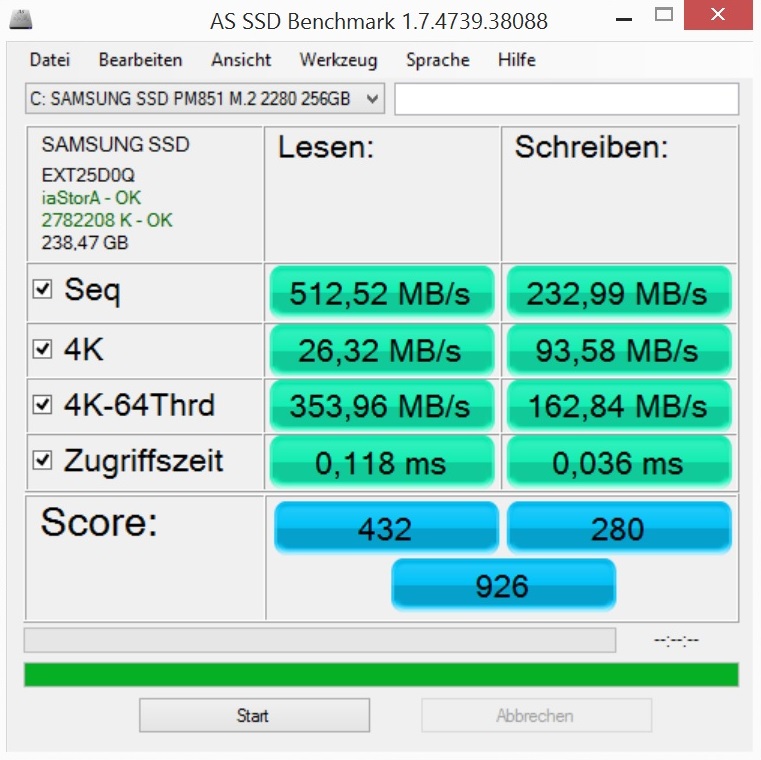
The storage device of our test model is a 256 GB SSD from Samsung, the PM851. Instead of the mSATA format, the drive employs the M.2 format, which should theoretically allow the use of PCIe models. Sadly, the Alienware 13 uses a classic SATA III SSD, which limits speeds to about 500-550 MB/s. The Samsung Drive places at that level in the sequential test of CrystalDiskMark.
Sadly, the test configuration cannot perform as well in the sequential write test. The SSD offers a modest write speed of 242 MB/s. A lot of the competition can offer 300 or 400 MB/s (like the 256 GB Crucial M550 in the Schenker XMG C405). The PM851 performs well with compact 4K files, which are often found in everyday use. The access times of 0.118 ms (read) and 0.036 ms (write) are quite decent (AS SSD benchmark).

Graphics Card
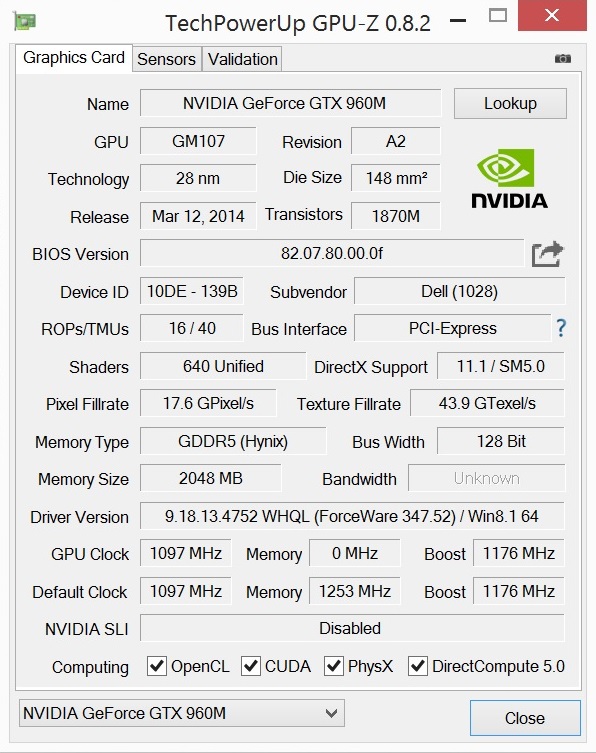
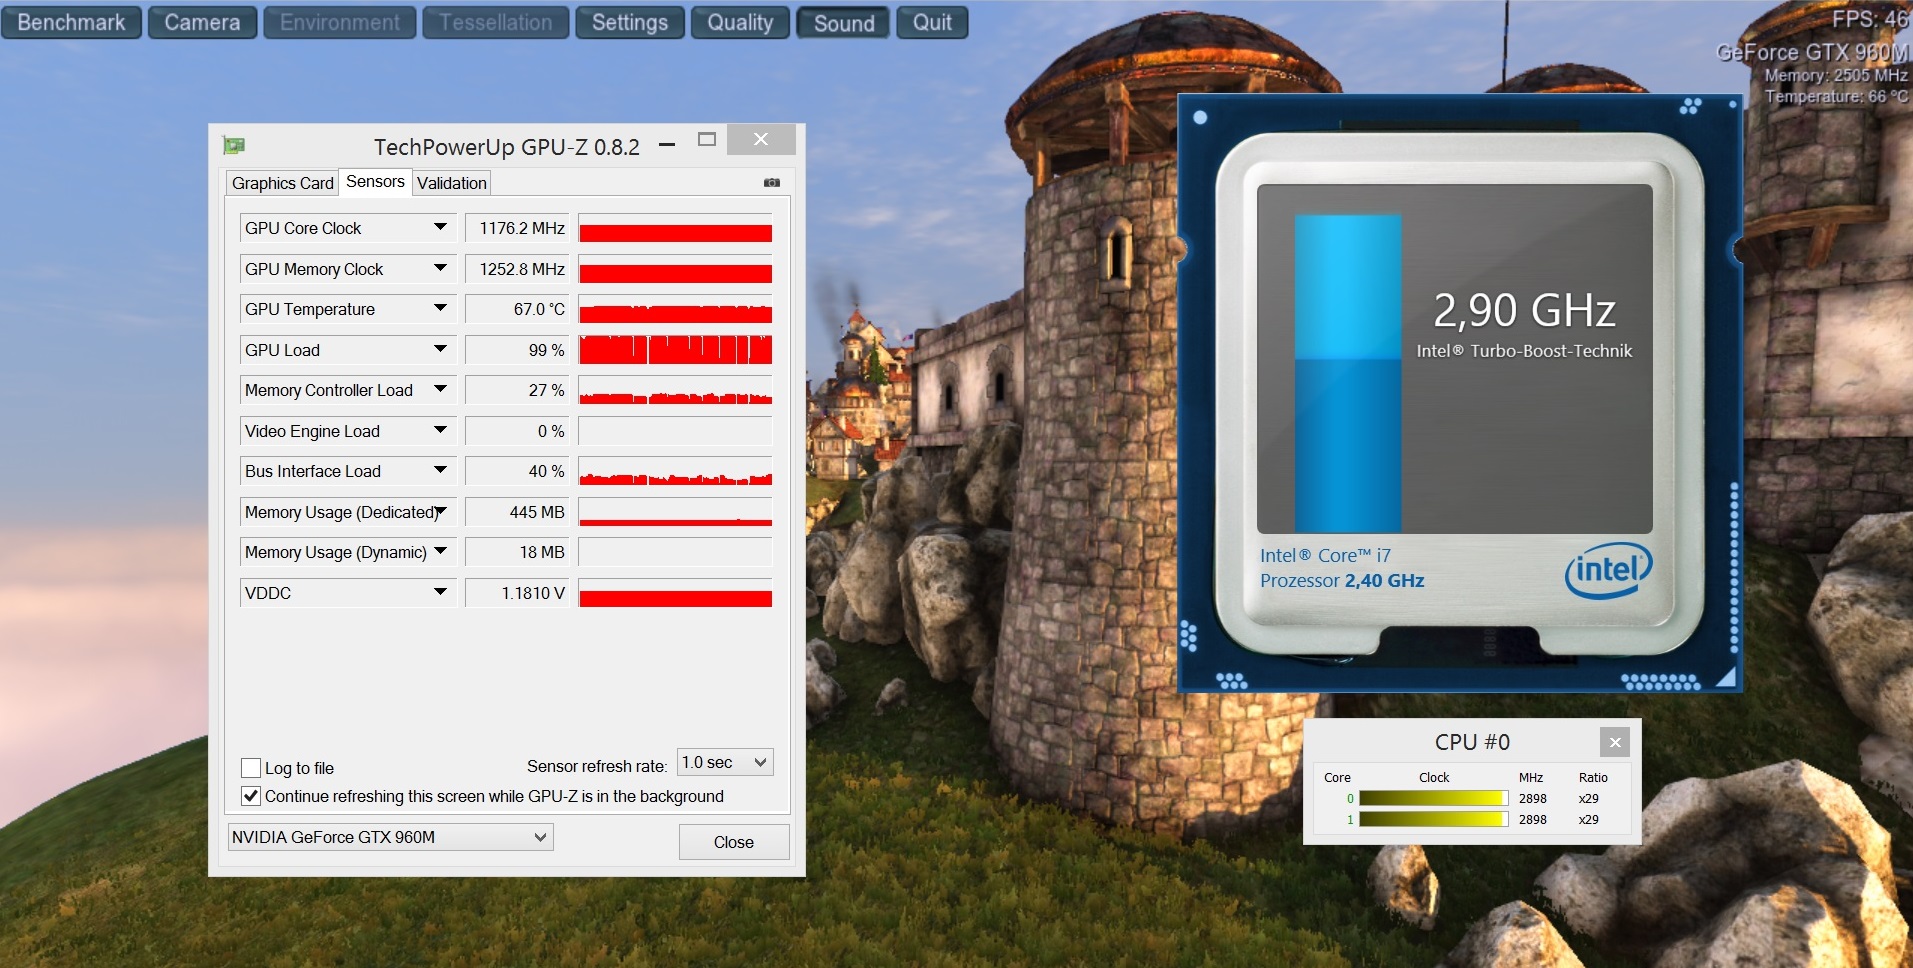
The GeForce GTX 960M is a slightly faster GeForce GTX 860M: instead of 1,029-1,097 MHz, the upgraded Nvidia GPU operates at 1,097-1,176 MHz (+7%).
The user should not expect massive performance increases as the rest of the specs have stayed the same. The GTX 960M uses 640 Unified Shaders (GTX 965M: 1,024 CUDA Cores) and a 2,048 MB GDDR5 memory which uses a 128-bit memory interface. Most gaming notebooks (see Asus G501) use the 4 GB version of GTX 960M, which offers more future security, but still has the 128-bit memory interface.
| 3DMark 11 Performance | 4684 points | |
| 3DMark Ice Storm Standard Score | 44549 points | |
| 3DMark Cloud Gate Standard Score | 10287 points | |
| 3DMark Fire Strike Score | 3611 points | |
Help | ||
In our benchmarks, the Alienware 13 had to compete with other 13 and 14-inch gaming notebooks. One look at the table makes two things clear: 1) The gap between our test model and the more expensive GTX 965M and GTX 970M is quite large at 34% and 49% in 3DMark 11% and 27% and 45% in the Fire Strike test of 3DMark 13. 2) The weaker CPU of our test model places it far behind other gaming notebooks with identical hardware, but stronger processors. Thanks to the quad-core CPU, the Schenker XMG A305 is ahead by about 10% in the 3DMark graphics tests. At least, our test model can outperform the Alienware 13 of last year by about 10% (the gaps are much larger in overall and physics tests).
| 3DMark | |
| 1920x1080 Fire Strike Score (sort by value) | |
| Alienware 13 (GTX 960M) | |
| MSI GS30 Shadow | |
| Alienware 13 | |
| Schenker XMG A305 | |
| Schenker XMG C405 | |
| Razer Blade 14 2015 | |
| 1920x1080 Fire Strike Graphics (sort by value) | |
| Alienware 13 (GTX 960M) | |
| MSI GS30 Shadow | |
| Alienware 13 | |
| Schenker XMG A305 | |
| Schenker XMG C405 | |
| Razer Blade 14 2015 | |
Gaming Performance
The GeForce GTX 960M tends towards middle-class performance, as is noticeable when running demanding games. Assassin's Creed Unity does not run fluidly at maximum or high details with the native resolution of 1920x1080 pixels. For a decent fps, the resolution has to be reduced to 1366x768 pixels and settings have to be dropped to medium. Far Cry 4 and Call of Duty: Advanced Warfare require far too much from the GTX 960M at high settings. Less demanding games, like Alien Isolation, FIFA 15 and The Sims 4, run beautifully at maximum settings (max details, AA). The GTX 960M is not appropriate for 4K gaming.
| low | med. | high | ultra | |
|---|---|---|---|---|
| Sims 4 (2014) | 184.6 | 104.9 | 65.8 | 56.9 |
| Fifa 15 (2014) | 172.9 | 133.4 | 96.8 | |
| Alien: Isolation (2014) | 142.2 | 110.3 | 59.8 | 43.1 |
| Call of Duty: Advanced Warfare (2014) | 90.7 | 60.7 | 42.6 | 24.1 |
| Assassin's Creed Unity (2014) | 50.8 | 38.9 | 25.3 | 7.3 |
| Far Cry 4 (2014) | 76.2 | 64.7 | 32 | 26.1 |
Unfortunately, as shown in the gaming benchmarks, the processor is the bottleneck of the system. Games that are not very demanding on the CPU run 10-20% smoother on a quad-core gaming laptop with a GTX 960M (see Schenker XMG A505). However, in extreme cases, the Alienware 13 falls behind by 30 to 40%. These extreme cases used low to medium settings, which are uncommon and unpopular on middle-class or high-end gaming laptops.
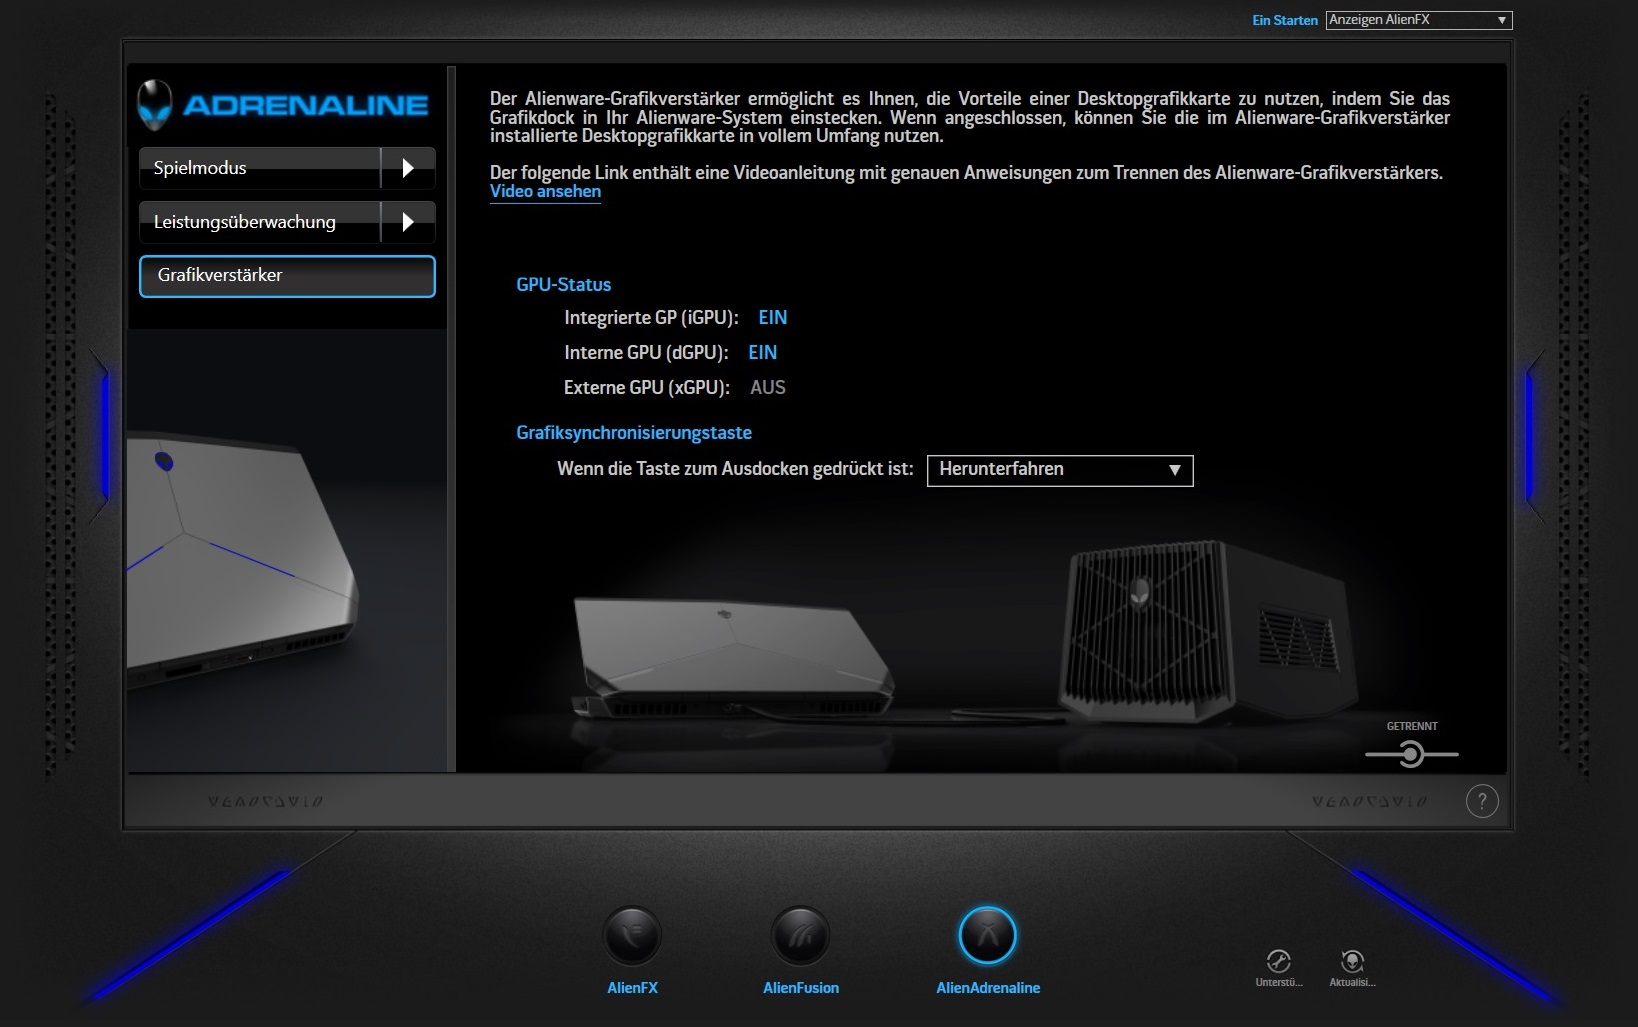
Graphics Amplifier
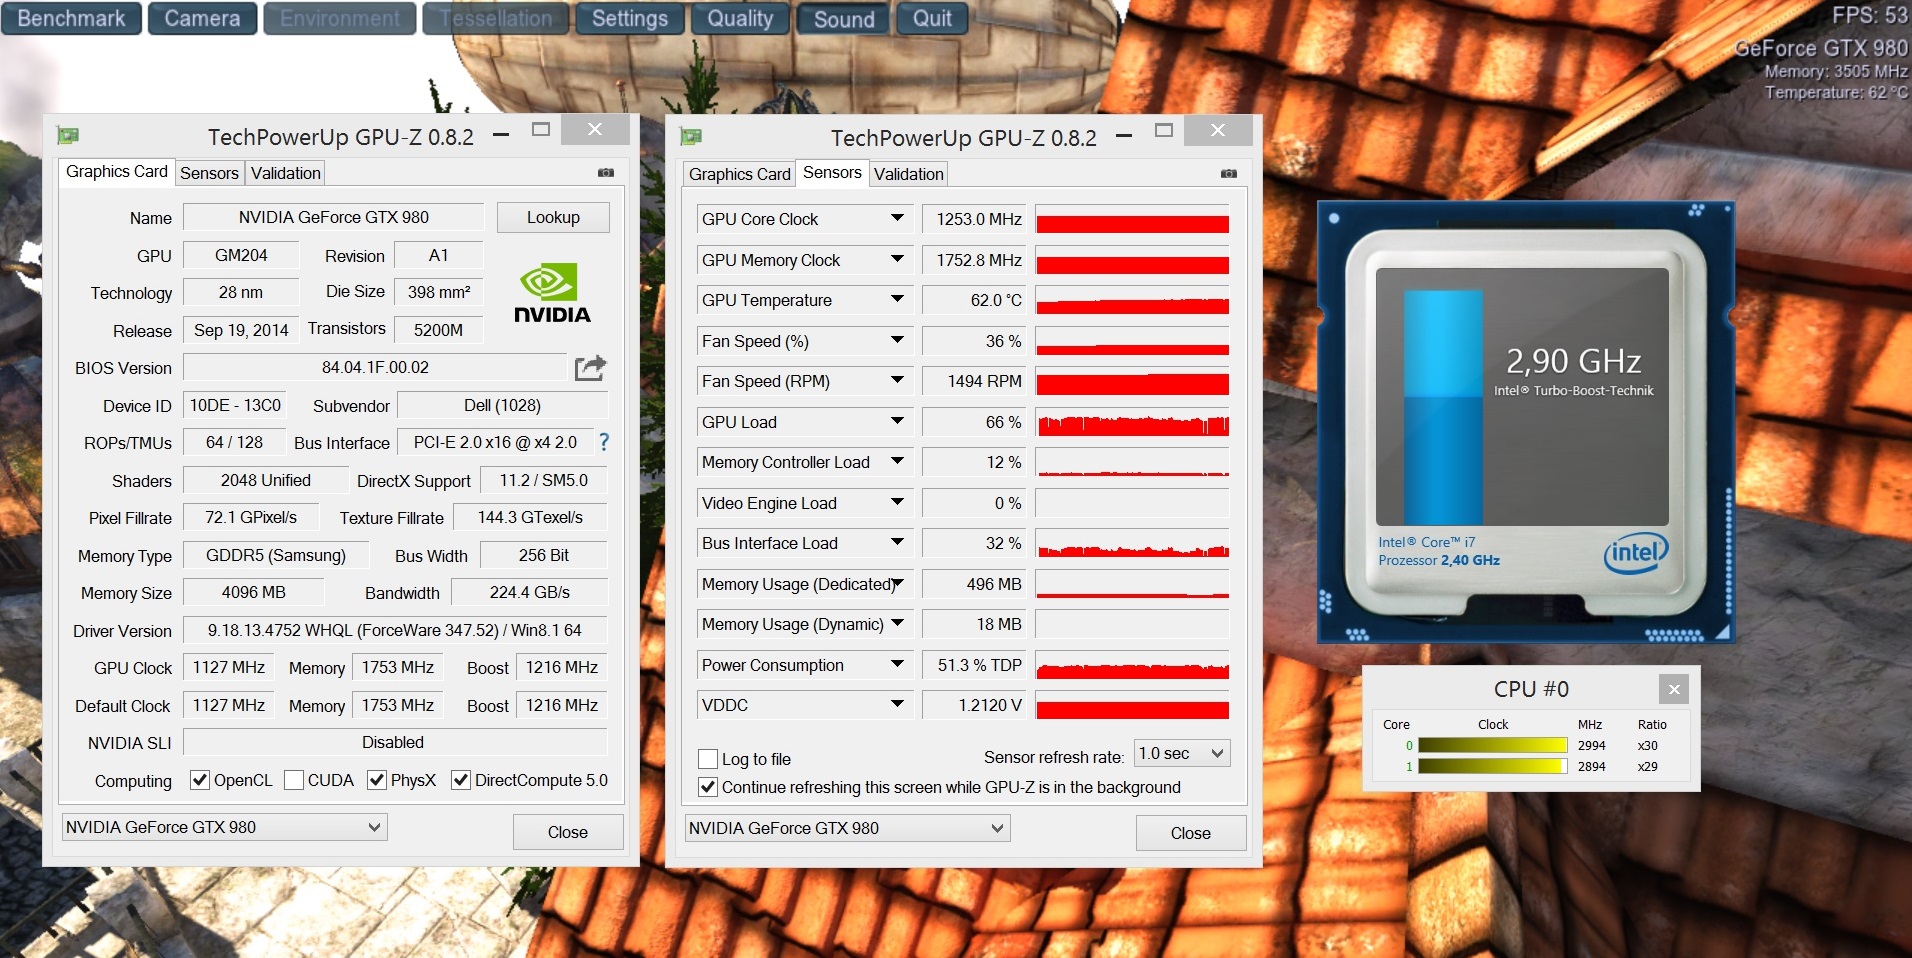
The optional graphics amplifier, also named Amplifier by Dell, is a feature we reviewed last year. In contrast to the MSI GS30, which uses a similar system, the 13-inch test model does not need to be placed on the dock and can be simply connected using a cable.
This is also the weak point: the desktop GPU of the MSI GS30 is in a PCIe-x16 interface, whereas the Alienware system uses a PCIe-x4 interface, which can reduce performance by up to 10%. However, as mentioned before, the dual-core CPU of our test model is the primary bottleneck. Although, the Core i7-5500U performs better than the Core i5-4210U, it does not suffice in combination with a desktop GPU. Depending on the game, the GeForce GTX 980 of the amplifier was up to 50% slower than that of our desktop PC (especially in Watch Dogs).
Sadly, we do not see any sense in having an amplifier if the hardware is not strong enough to match it. The Alienware 15, which also offers an amplifier, suffers less, thanks primarily to a stronger, quad-core CPU. Overall, the MSI system seems better designed, as the incredibly powerful Core i7-4870HQ could perform well in conjunction with the desktop GPU (GeForce GTX 970).
| 3DMark | |
| 1920x1080 Fire Strike Score (sort by value) | |
| Alienware 13 (GTX 960M) | |
| Alienware Amplifier | |
| Alienware Amplifier | |
| Desktop-PC | |
| MSI GamingDock | |
| 1920x1080 Fire Strike Graphics (sort by value) | |
| Alienware 13 (GTX 960M) | |
| Alienware Amplifier | |
| Alienware Amplifier | |
| Desktop-PC | |
| MSI GamingDock | |
| Alien: Isolation | |
| 1920x1080 Ultra, On, Shadow Map 2048, HDAO AA:2x SM AF:16x (sort by value) | |
| Alienware 13 (GTX 960M) | |
| Alienware Amplifier | |
| Alienware Amplifier | |
| Desktop-PC | |
| MSI GamingDock | |
| 1920x1080 High, On, Shadow Map 1536, Standard SSAO AA:FX AF:8x (sort by value) | |
| Alienware 13 (GTX 960M) | |
| Alienware Amplifier | |
| Alienware Amplifier | |
| Desktop-PC | |
| MSI GamingDock | |
| Assassin's Creed Unity | |
| 1920x1080 Ultra High Graphics Quality AA:4x MS (sort by value) | |
| Alienware 13 (GTX 960M) | |
| Alienware Amplifier | |
| Alienware Amplifier | |
| Alienware Amplifier | |
| Desktop-PC | |
| 1920x1080 High Graphics Quality AA:2x MS (sort by value) | |
| Alienware 13 (GTX 960M) | |
| Alienware Amplifier | |
| Alienware Amplifier | |
| Alienware Amplifier | |
| Desktop-PC | |
| Call of Duty: Advanced Warfare | |
| 1920x1080 Extra / On (Cache Shadow Maps Off), 2x Supersampling AA:2x SM (sort by value) | |
| Alienware 13 (GTX 960M) | |
| Alienware Amplifier | |
| Alienware Amplifier | |
| Alienware Amplifier | |
| Desktop-PC | |
| MSI GamingDock | |
| 1920x1080 High / On (Cache Shadow Maps Off) AA:FX (sort by value) | |
| Alienware 13 (GTX 960M) | |
| Alienware Amplifier | |
| Alienware Amplifier | |
| Alienware Amplifier | |
| Desktop-PC | |
| MSI GamingDock | |
| GRID: Autosport | |
| 1920x1080 Ultra Preset AA:4x MS (sort by value) | |
| Alienware Amplifier | |
| Alienware Amplifier | |
| Alienware Amplifier | |
| Desktop-PC | |
| MSI GamingDock | |
| 1920x1080 High Preset (sort by value) | |
| Alienware Amplifier | |
| Alienware Amplifier | |
| Alienware Amplifier | |
| Desktop-PC | |
| MSI GamingDock | |
| Far Cry 4 | |
| 1920x1080 Ultra Graphics Quality AA:SM (sort by value) | |
| Alienware 13 (GTX 960M) | |
| Alienware Amplifier | |
| Alienware Amplifier | |
| Alienware Amplifier | |
| Desktop-PC | |
| MSI GamingDock | |
| 1920x1080 High Graphics Quality AA:SM (sort by value) | |
| Alienware 13 (GTX 960M) | |
| Alienware Amplifier | |
| Alienware Amplifier | |
| Alienware Amplifier | |
| Desktop-PC | |
| MSI GamingDock | |
| Watch Dogs | |
| 1920x1080 Ultra Overall Quality, Ultra Textures AA:4x MS (sort by value) | |
| Alienware Amplifier | |
| Alienware Amplifier | |
| Alienware Amplifier | |
| Desktop-PC | |
| MSI GamingDock | |
| 1920x1080 High Overall Quality, High Textures AA:2x MS (sort by value) | |
| Alienware Amplifier | |
| Alienware Amplifier | |
| Alienware Amplifier | |
| Desktop-PC | |
| MSI GamingDock | |
Emissions
System Noise
Despite a conservative dual-core CPU, the fans are clearly audible at load. In the 3DMark 06 test, the noise emission varied dynamically between 39 dB(A) (CPU benchmarks) and 48 dB(A) (GPU benchmarks) with an average noise emission of 46 dB(A). The Alienware 13 is quieter than the MSI GS30 (~53 dB(A)), but far louder than the Alienware 13 of last year (Core i5-4210U and GeForce GTX 860M: ~38 dB(A)). After a stress test of 1 hour, the FurMark and Prime95 tools can get 52 dB(A) out of the system.
While idling, the notebook seems great: even when starting a browser or MS Office programs, the fans do not start up. At 29 dB(A), the system is as quiet as a mouse. Other gaming notebooks should learn from this test model.
Noise level
| Idle |
| 29.2 / 29.4 / 29.6 dB(A) |
| Load |
| 45.8 / 52 dB(A) |
 | ||
30 dB silent 40 dB(A) audible 50 dB(A) loud |
||
min: | ||
| Alienware 13 (GTX 960M) GeForce GTX 960M, 5500U | MSI GS30 Shadow Iris Pro Graphics 5200, 4870HQ | Alienware 13 GeForce GTX 860M, 4210U | Schenker XMG A305 GeForce GTX 960M, 4710MQ | Schenker XMG C405 GeForce GTX 965M, 4720HQ | Razer Blade 14 2015 GeForce GTX 970M, 4720HQ | |
|---|---|---|---|---|---|---|
| Noise | -17% | 4% | -3% | -14% | -2% | |
| Idle Minimum * (dB) | 29.2 | 29.4 -1% | 29.2 -0% | 29.4 -1% | 29.2 -0% | 29.7 -2% |
| Idle Average * (dB) | 29.4 | 36.2 -23% | 29.4 -0% | 30.1 -2% | 34.6 -18% | 29.9 -2% |
| Idle Maximum * (dB) | 29.6 | 42 -42% | 29.8 -1% | 30.8 -4% | 38.8 -31% | 30 -1% |
| Load Average * (dB) | 45.8 | 52.8 -15% | 37.6 18% | 49.2 -7% | 54 -18% | 42.1 8% |
| Load Maximum * (dB) | 52 | 53.6 -3% | 50.8 2% | 53.8 -3% | 54.4 -5% | 59 -13% |
* ... smaller is better
Temperature
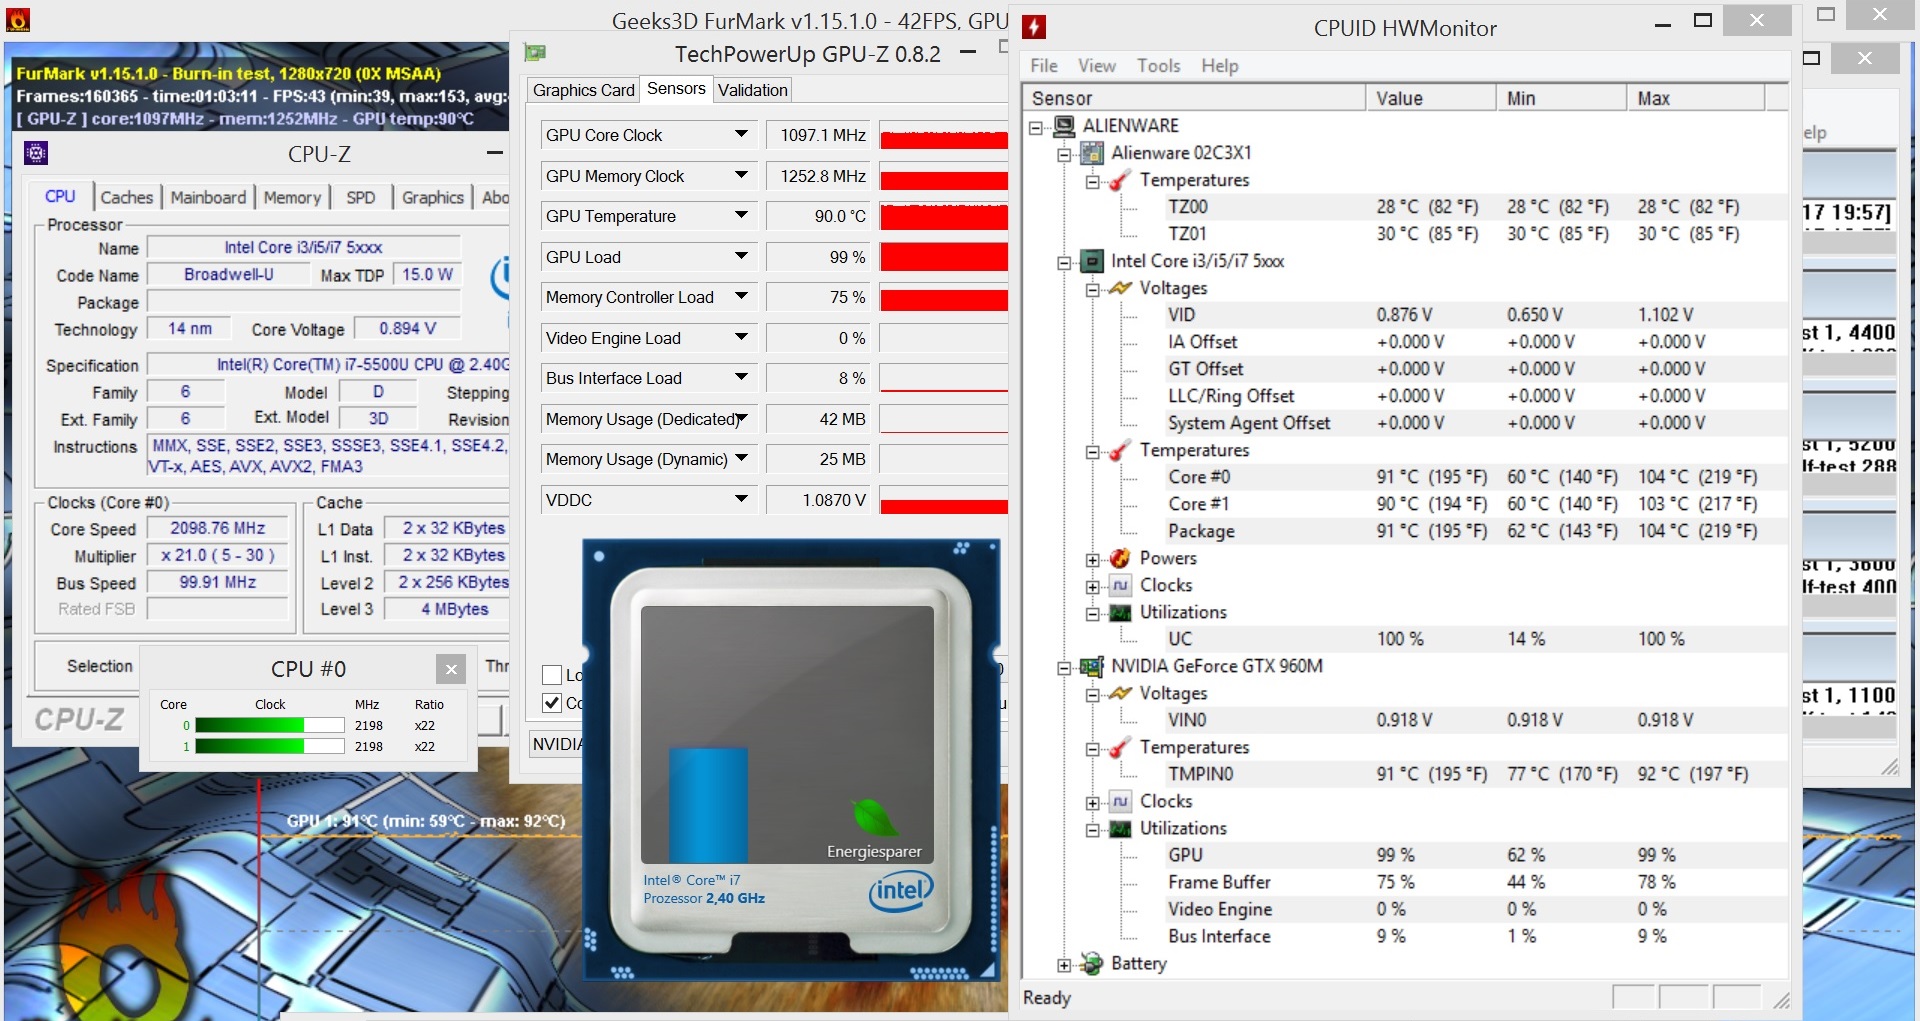
The temperatures of our test model are higher due to the upgraded processor. In the stress test, the model from last year hit maximum temperatures of 82 °C (179.6 °F, GPU) and 78 °C (172.4 °F, CPU), whereas our test model (according to HWMonitor) hits up to 92 and 104 °C (197.6 and 219.2 °F) respectively. As such, it is not surprising that our test model suffers from throttling (which drops the temperatures to 90 °C, 194 °F).
The case surfaces can get quite hot as well: at 63 °C (145.4 °F) in the back, we do not recommend using the notebook on the lap. While idling, the laptop has no temperature issues. After two hours of being idle, the average temperature was 28 °C (82.4 °F) – great.
(-) The maximum temperature on the upper side is 47.4 °C / 117 F, compared to the average of 40.4 °C / 105 F, ranging from 21.2 to 68.8 °C for the class Gaming.
(-) The bottom heats up to a maximum of 63.1 °C / 146 F, compared to the average of 43.2 °C / 110 F
(+) In idle usage, the average temperature for the upper side is 27.8 °C / 82 F, compared to the device average of 33.9 °C / 93 F.
(+) The palmrests and touchpad are reaching skin temperature as a maximum (32.2 °C / 90 F) and are therefore not hot.
(-) The average temperature of the palmrest area of similar devices was 28.8 °C / 83.8 F (-3.4 °C / -6.2 F).
| Alienware 13 (GTX 960M) GeForce GTX 960M, 5500U | MSI GS30 Shadow Iris Pro Graphics 5200, 4870HQ | Alienware 13 GeForce GTX 860M, 4210U | Schenker XMG A305 GeForce GTX 960M, 4710MQ | Schenker XMG C405 GeForce GTX 965M, 4720HQ | Razer Blade 14 2015 GeForce GTX 970M, 4720HQ | |
|---|---|---|---|---|---|---|
| Heat | -8% | 3% | -6% | -19% | 4% | |
| Maximum Upper Side * (°C) | 47.4 | 49.8 -5% | 44.5 6% | 46.2 3% | 47.8 -1% | 51.6 -9% |
| Maximum Bottom * (°C) | 63.1 | 52.5 17% | 60.2 5% | 47.7 24% | 60.4 4% | 51.2 19% |
| Idle Upper Side * (°C) | 30.3 | 35.2 -16% | 29.4 3% | 35 -16% | 37.7 -24% | 29.2 4% |
| Idle Bottom * (°C) | 28.8 | 36.8 -28% | 29.6 -3% | 38.2 -33% | 44.8 -56% | 28.8 -0% |
* ... smaller is better
Energy Management
Power Consumption
The power consumption of +20% is higher than the performance increase (relative to the model of last year). Instead of 5.1-11.2 W, the laptop now consumes 6.2-13.9 W when idle. In the first scene of 3DMark 06, the average consumption rises from 51.5 to 66.2 W. During the stress test, our laptop consumes a maximum of 123 W instead of 92.9 W. A typical GTX 960M notebook with a quad-core CPU requires about 50% more.
| Off / Standby | |
| Idle | |
| Load |
|
Key:
min: | |
| Alienware 13 (GTX 960M) GeForce GTX 960M, 5500U | MSI GS30 Shadow Iris Pro Graphics 5200, 4870HQ | Alienware 13 GeForce GTX 860M, 4210U | Schenker XMG A305 GeForce GTX 960M, 4710MQ | Schenker XMG C405 GeForce GTX 965M, 4720HQ | Razer Blade 14 2015 GeForce GTX 970M, 4720HQ | |
|---|---|---|---|---|---|---|
| Power Consumption | -12% | 20% | -57% | -100% | ||
| Idle Minimum * (Watt) | 6.2 | 7.5 -21% | 5.1 18% | 11.4 -84% | 15.8 -155% | |
| Idle Average * (Watt) | 8.7 | 11.6 -33% | 7.3 16% | 16.3 -87% | 22.8 -162% | |
| Idle Maximum * (Watt) | 13.9 | 21.2 -53% | 11.2 19% | 22.6 -63% | 27.3 -96% | |
| Load Average * (Watt) | 66.2 | 65.4 1% | 51.5 22% | 92.4 -40% | 106.8 -61% | |
| Load Maximum * (Watt) | 123 | 66.4 46% | 92.9 24% | 136 -11% | 152 -24% |
* ... smaller is better
Battery Life
The battery life of a maximum of 11 hours (Battery Eater Reader's test, minimum brightness) is not bad. At high load and full brightness, the Battery Eater Classic test records a run time of around 2 hours. The competition dies out far earlier (48 minutes @MSI GS30, 66 minutes @Razer Blade 14).
| Alienware 13 (GTX 960M) GeForce GTX 960M, 5500U | MSI GS30 Shadow Iris Pro Graphics 5200, 4870HQ | Alienware 13 GeForce GTX 860M, 4210U | Schenker XMG A305 GeForce GTX 960M, 4710MQ | Schenker XMG C405 GeForce GTX 965M, 4720HQ | Razer Blade 14 2015 GeForce GTX 970M, 4720HQ | |
|---|---|---|---|---|---|---|
| Battery runtime | -50% | 12% | -19% | -43% | ||
| Reader / Idle (h) | 11.3 | 6.7 -41% | 12.1 7% | 7 -38% | 6.3 -44% | |
| Load (h) | 1.9 | 0.8 -58% | 2.2 16% | 1.9 0% | 1.1 -42% |
Pros
Cons
Verdict
Overdue, yet not game-changing: the hardware upgrade for the Alienware 13 is sadly not what we were hoping for. Although the Core i7-5500U is superior to the Core i5-4210U in most cases, it cannot compete with gaming notebooks equipped with a quad-core processor.
The GeForce GTX 960M and the external graphics amplifier both suffer due to the dual-core CPU. Although the notebook is quite portable, it will not be the first choice for passionate gamers, due to the weak Core i7-5500U.
Overall, the verdict is quite similar to that of last year. Alienware attracts buyers with a stylish, high-quality case, a backlit keyboard and an IPS panel with strong contrast. We give additional points for high battery life. However, the touchpad and sound system require some work. It all comes down to personal preference whether you pick the Alienware 13 or the MSI GS30. The overall rating of 82% has stayed the same for the Alienware 13 over the years.
Alienware 13 (GTX 960M)
- 05/20/2015 v4 (old)
Florian Glaser
Price comparison
