

MSI GS30 Notebook Review

For the original German review, see here.
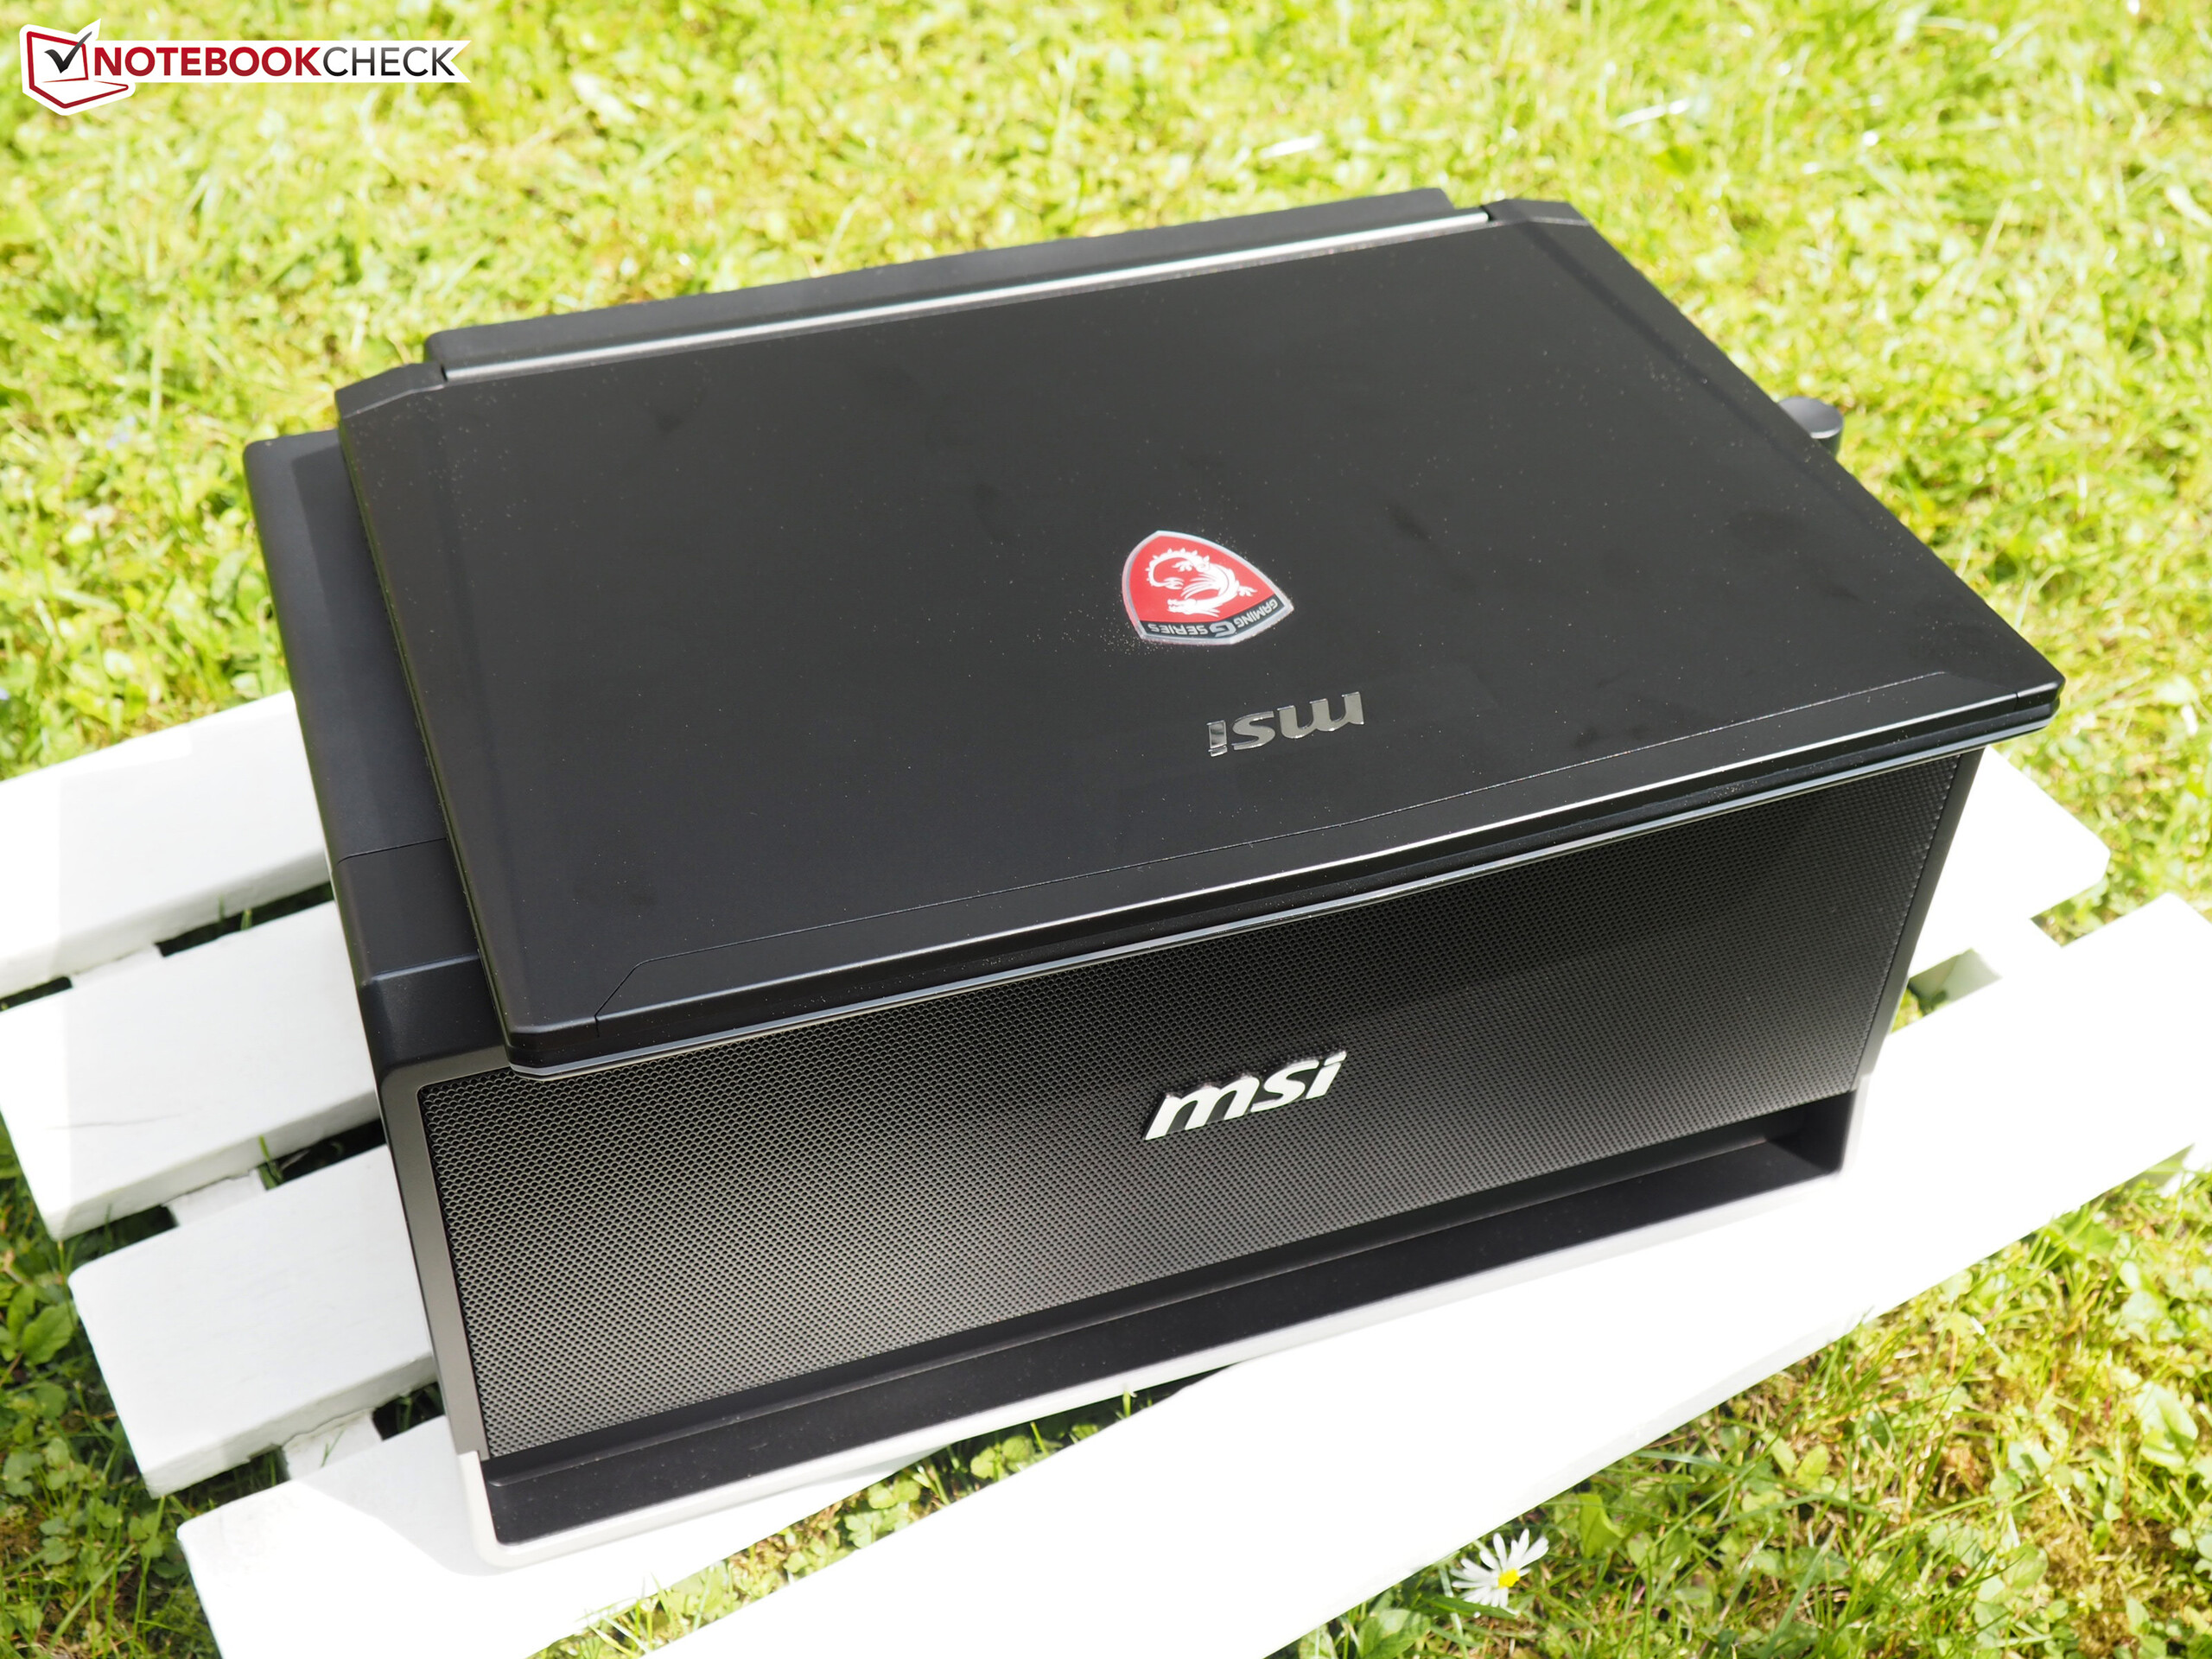
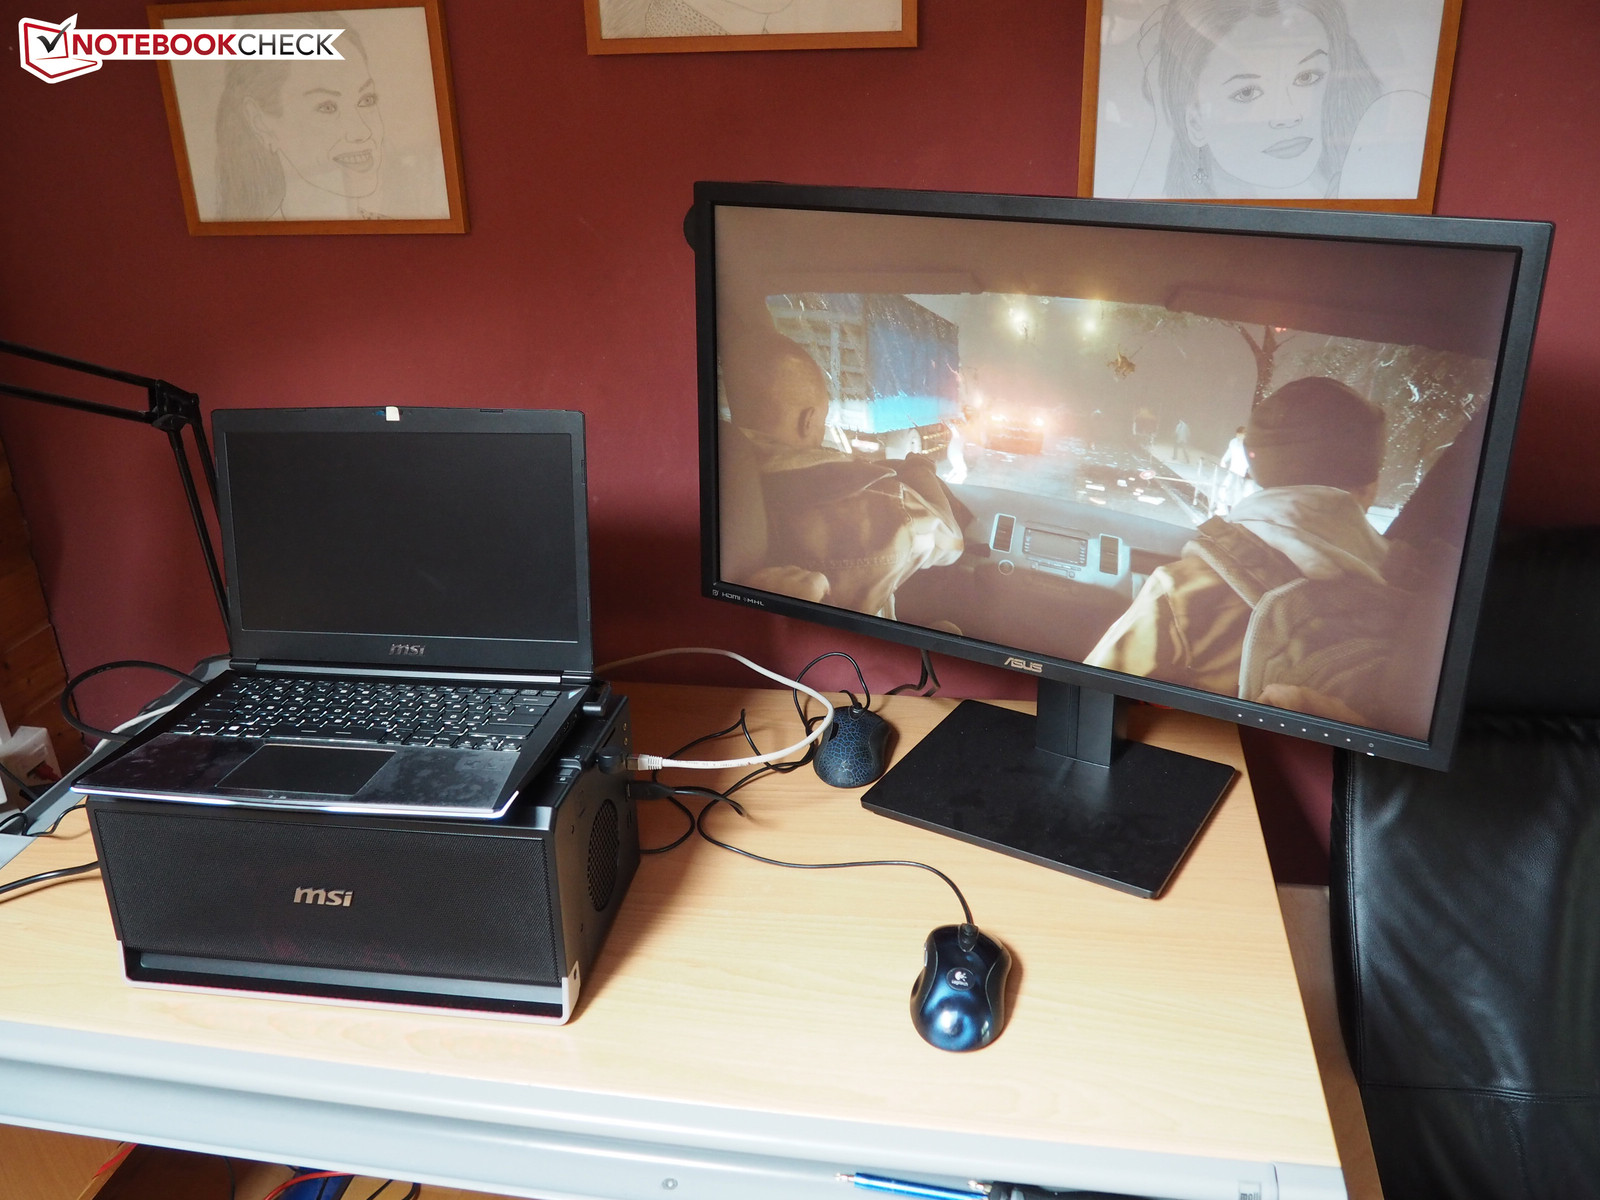
Like Alienware, MSI tried to produce a gaming notebook with an external graphics box. While the main competitor's system called "Amplifier" is compatible with several products (AW 13, AW 15 & AW 17), the version from MSI is specially tailored to the GS30. MSI even goes a step further and completely omitted a gaming GPU in the notebook. As a result, you have to make do with the graphics chip of the processor on-the-move. So, the mobile performance is lower, but MSI was able to make the device slimmer and lighter than Alienware.
In order to completely assess the concept, we used the GS30-2MDC16SR5 model for just under 1840 Euros (~$2041) in our test. Its GamingDock houses one of the most powerful desktop GPUs with the GeForce GTX 970. The top model called GS30-2MDE16SR5 costs about 160 Euros (~$177) more, but it comes with the slightly faster GeForce GTX 980. Both models have a wide-view display with Full HD resolution, 16 GB DDR-RAM (2x 8 GB @1600 MHz) and a RAID connection of two 256 GB SSDs in common.
If you do not need such a high graphics performance and/or want to buy a suitable desktop GPU yourself, you can also order the 13-incher with empty docking station. The corresponding model (GS30-2MD16SR2) is currently priced at about 1580 Euros (~$1753). We would not recommend buying a model without supplement box (GS30-2M16SR2), since there are better subnotebooks for about 1500 Euros (~$1664) on the market (see our Top 10).
Case
The 13-inch chassis left a mixed impression in our test. Pros are the compact construction. With a height of 20 mm and a weight of 1.3 kg, the GS30 is not only extremely slim but also exceptionally lightweight. The direct competitor from Dell, the Alienware 13, reaches 2.8 cm and 1.96 kg, which is +40% and +50% more. The 13-inch Schenker XMG A305 (GTX 960M) is not that portable, either, with 3.2 cm and 2.05 kg.
Among others, you'll also find the Schenker XMG C405 with GTX 965M (height: 21 mm, weight: 1.85 kg) and the 2015 edition of the Razer Blade 14 with GTX 970M (height: 18 mm, weight: 2.0 kg) among the 14-inch competitors. As already mentioned, the latter also feature a "gaming GPU" themselves and do not need to be connected to a separate graphics amplifier for maximum performance.
But back to the GS30: The build quality is quite good. The chassis is primarily made from aluminum, which has a very positive effect on the look and feel of the material. Only the display bezel is made of plastic. As usual, the manufacturer used black as the color. While dark colors are the best choice for gaming laptops, the GS30 shows smudges (fingerprints etc.) more easily because of it.
Another point of critique is the modest stability. Due to the ultra-slim construction, the device can be bent very strongly with the hands in some spots. The lid performs particularly badly in this aspect. In addition, the hinges are quite weak and the lid wobbles during vibrations. Despite these shortcomings, we never got the feeling that the 13-incher will fall apart easily. There is nothing to complain about the design. The stylish look is based on the bigger siblings from the GS and GE series (GS60, GE62, etc.).


Connectivity
Connectivity
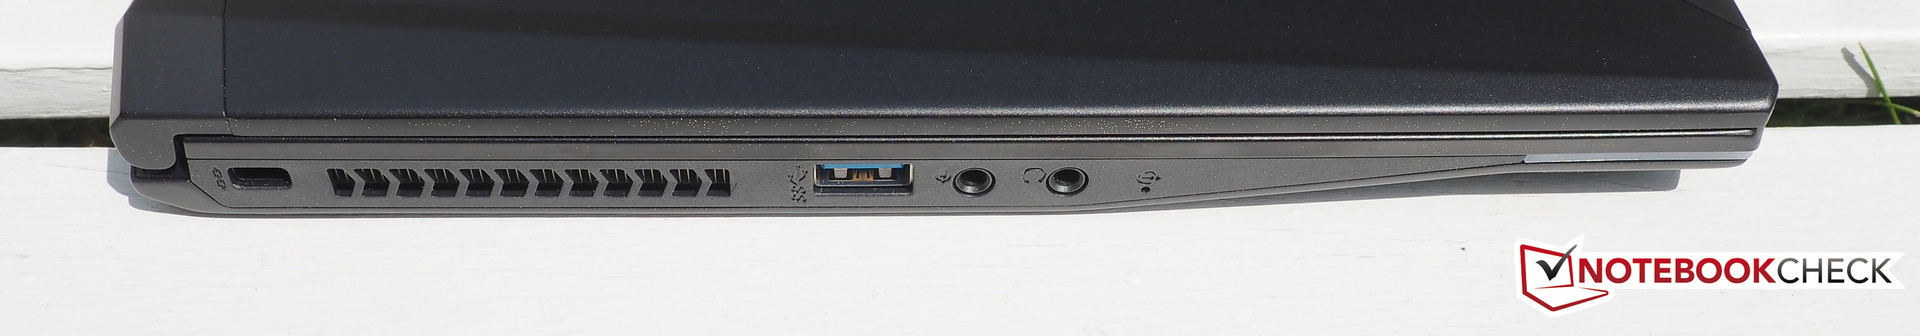
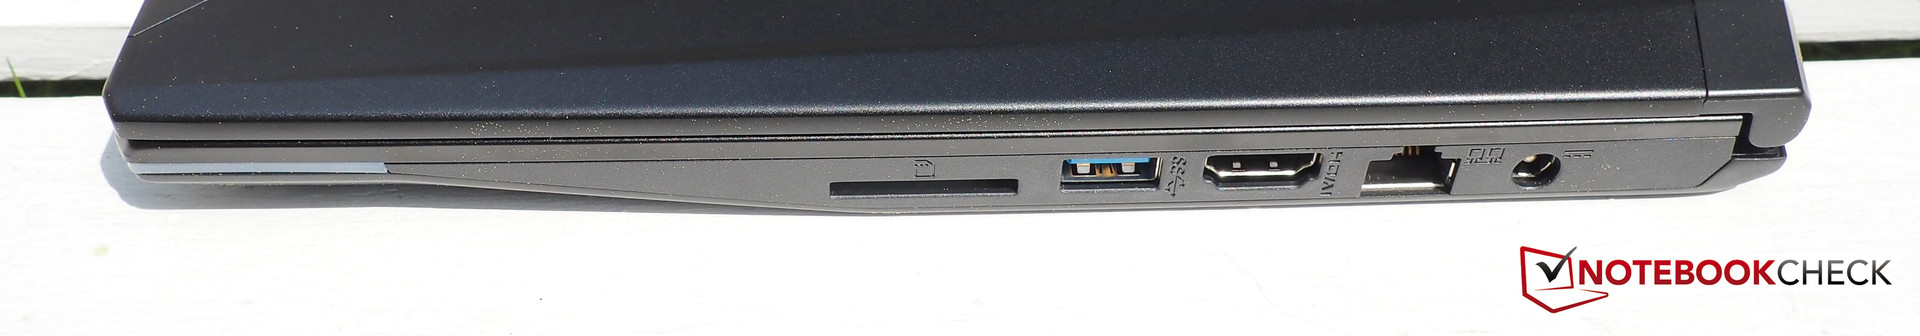
Those who have hoped for many interfaces will be disappointed - at least as far as it concerns the notebook itself. Compared to many other gaming products, two audio jacks are just as meager as two USB 3.0 ports and an HDMI-1.4b out. A DisplayPort is not available. At least the sides deliver all other "obligatory" ports, be it an RJ45 port, an SD-card reader or a Kensington-lock slot.
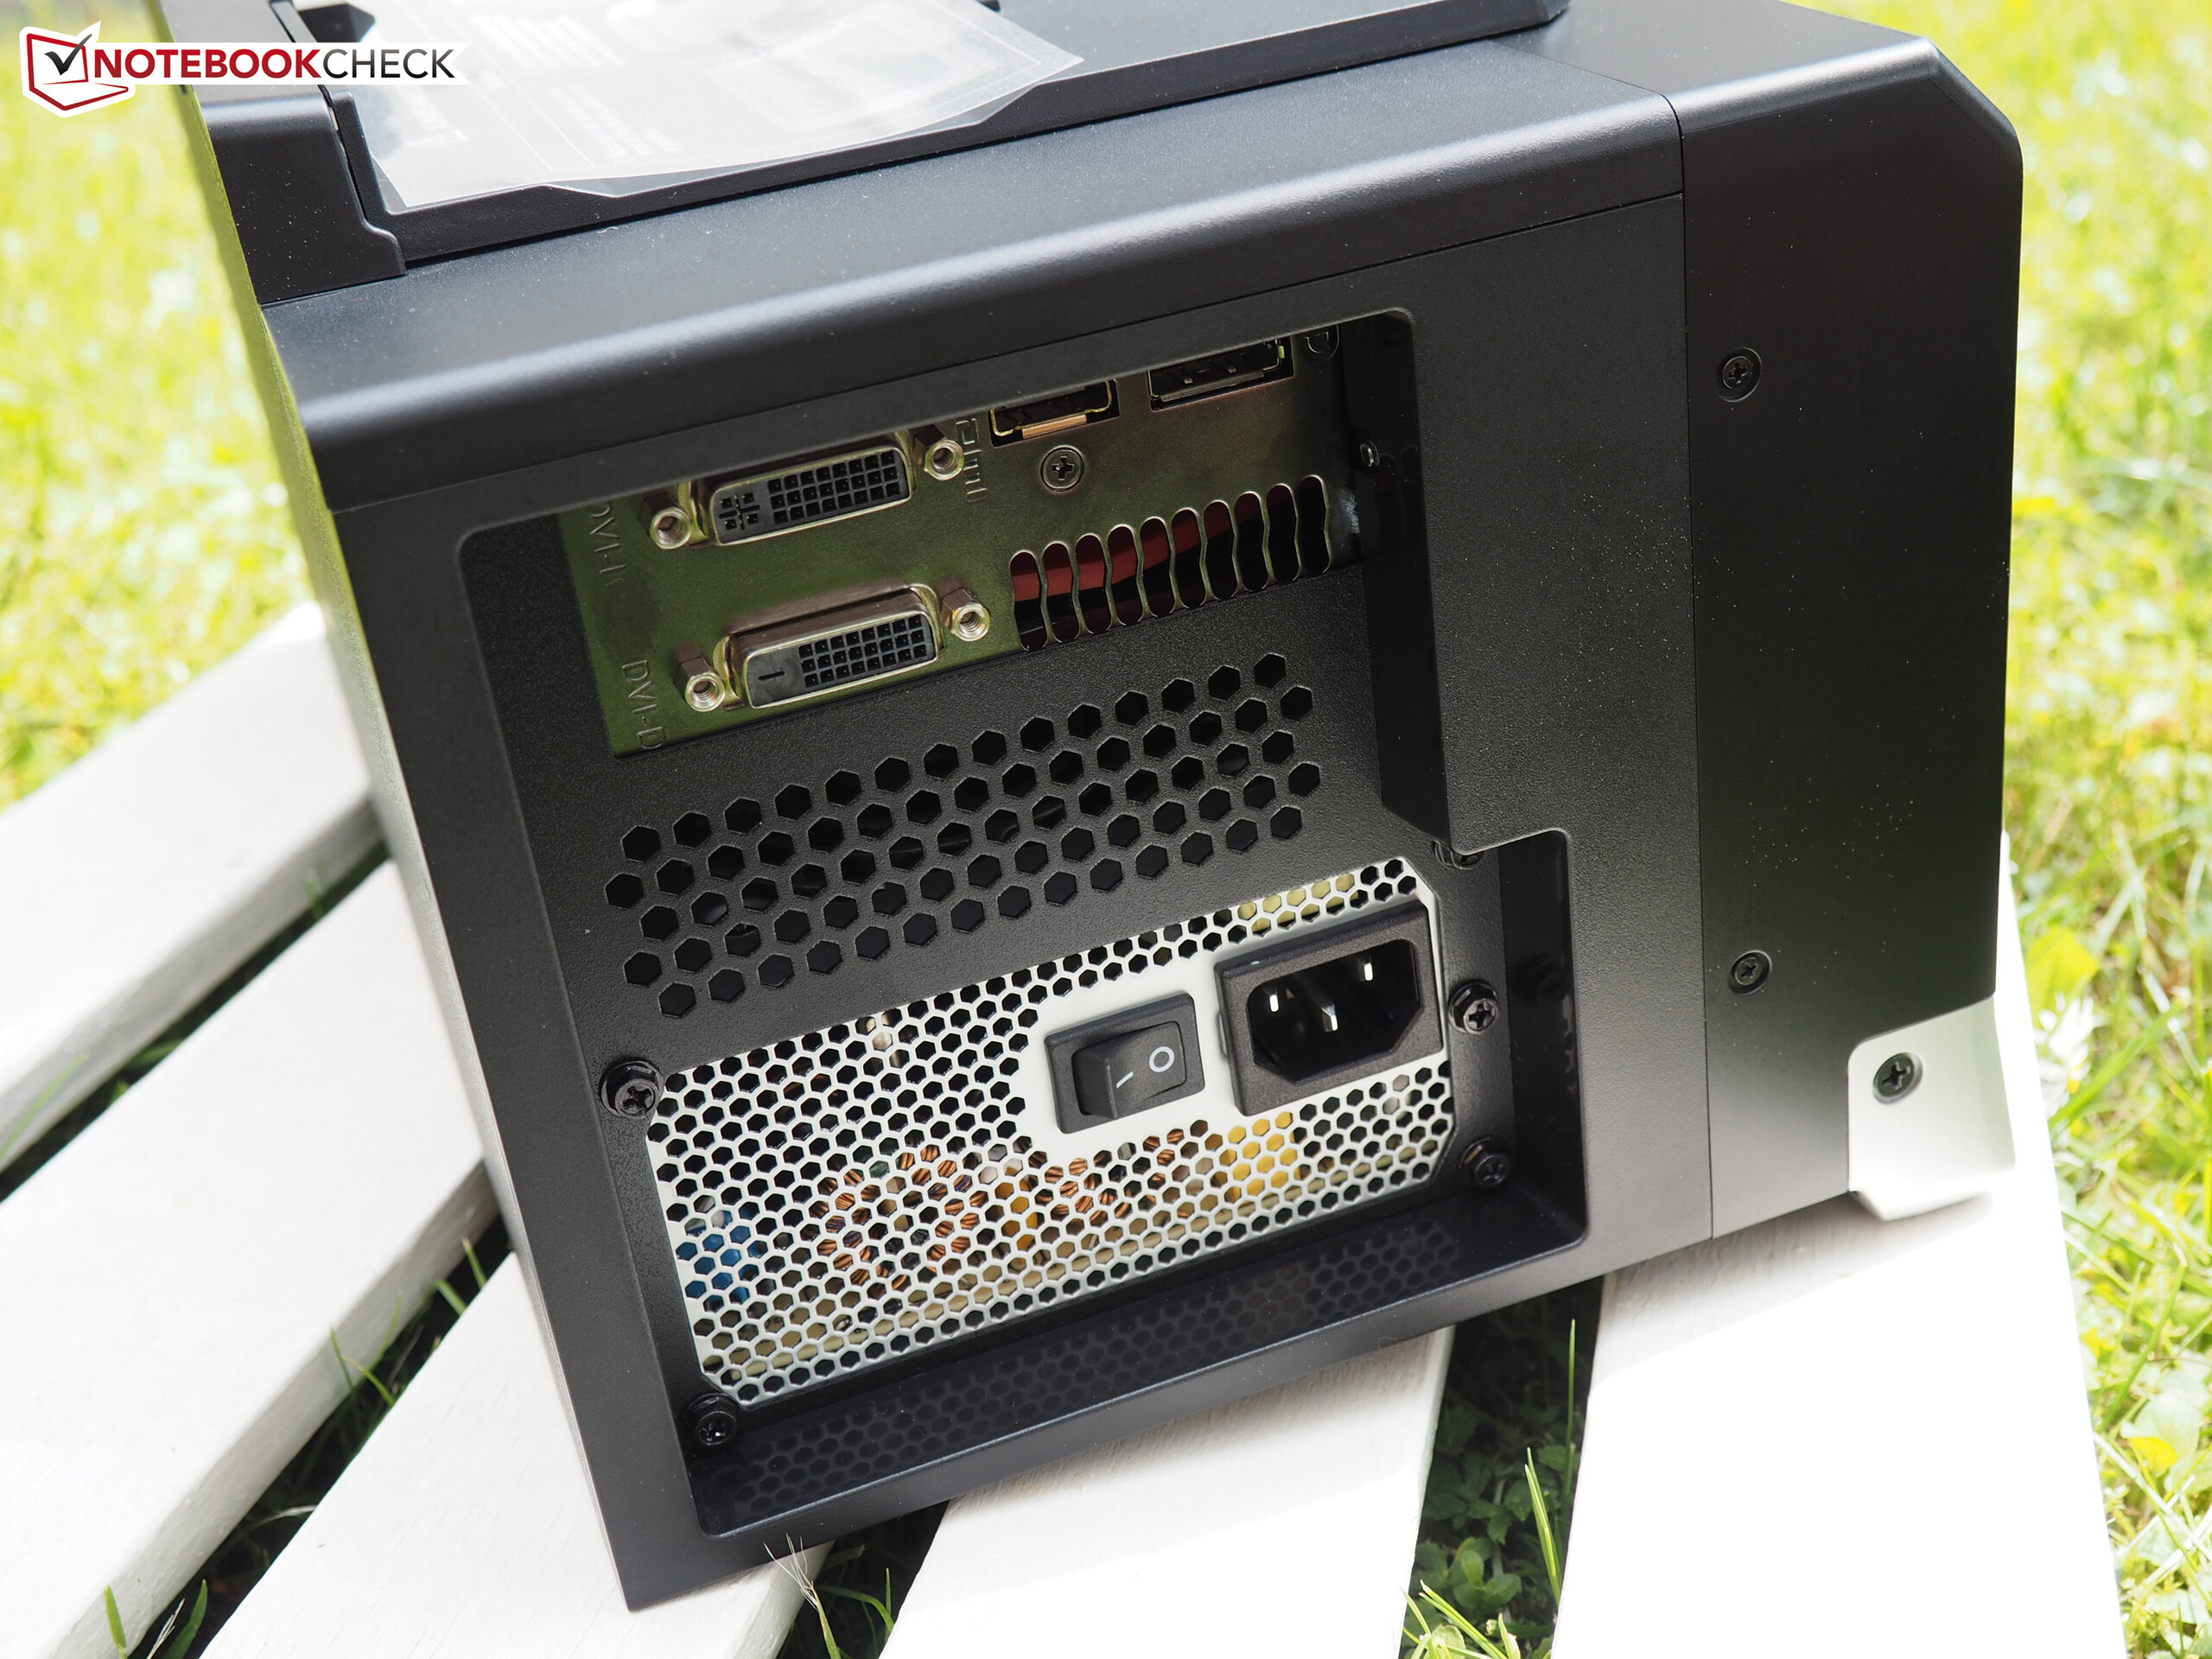
But, the features of the docking station are completely convincing. As it does not have an impact on the rating in any of the categories, we increased the rating manually (see verdict). Apart from four USB 3.0 ports, an RJ45 port and two audio jacks (headphone and microphone), which are all on the right side, the buyer will find the display outs of the desktop GPU on the left side. With the GTX 970, these are two DVI ports, an HDMI port and a standard size DisplayPort. The amplifier from Alienware, which does not look that much like a printer at the first glance, brings similar, yet slightly worse connectivity.
Wireless Communication
An Intel Centrino Wireless-AC 7260 module ensures wireless connections in the GS30. The decent Wi-Fi module supports all usual standards, including the relatively new ac technology. Furthermore, it supports Bluetooth 4.0. The GS30 did well in our reception range test with varying conditions depending on the tester. At 10 to 15 meters distance and through several walls, the web browser could still be used quite well (~2 to 4 bars).

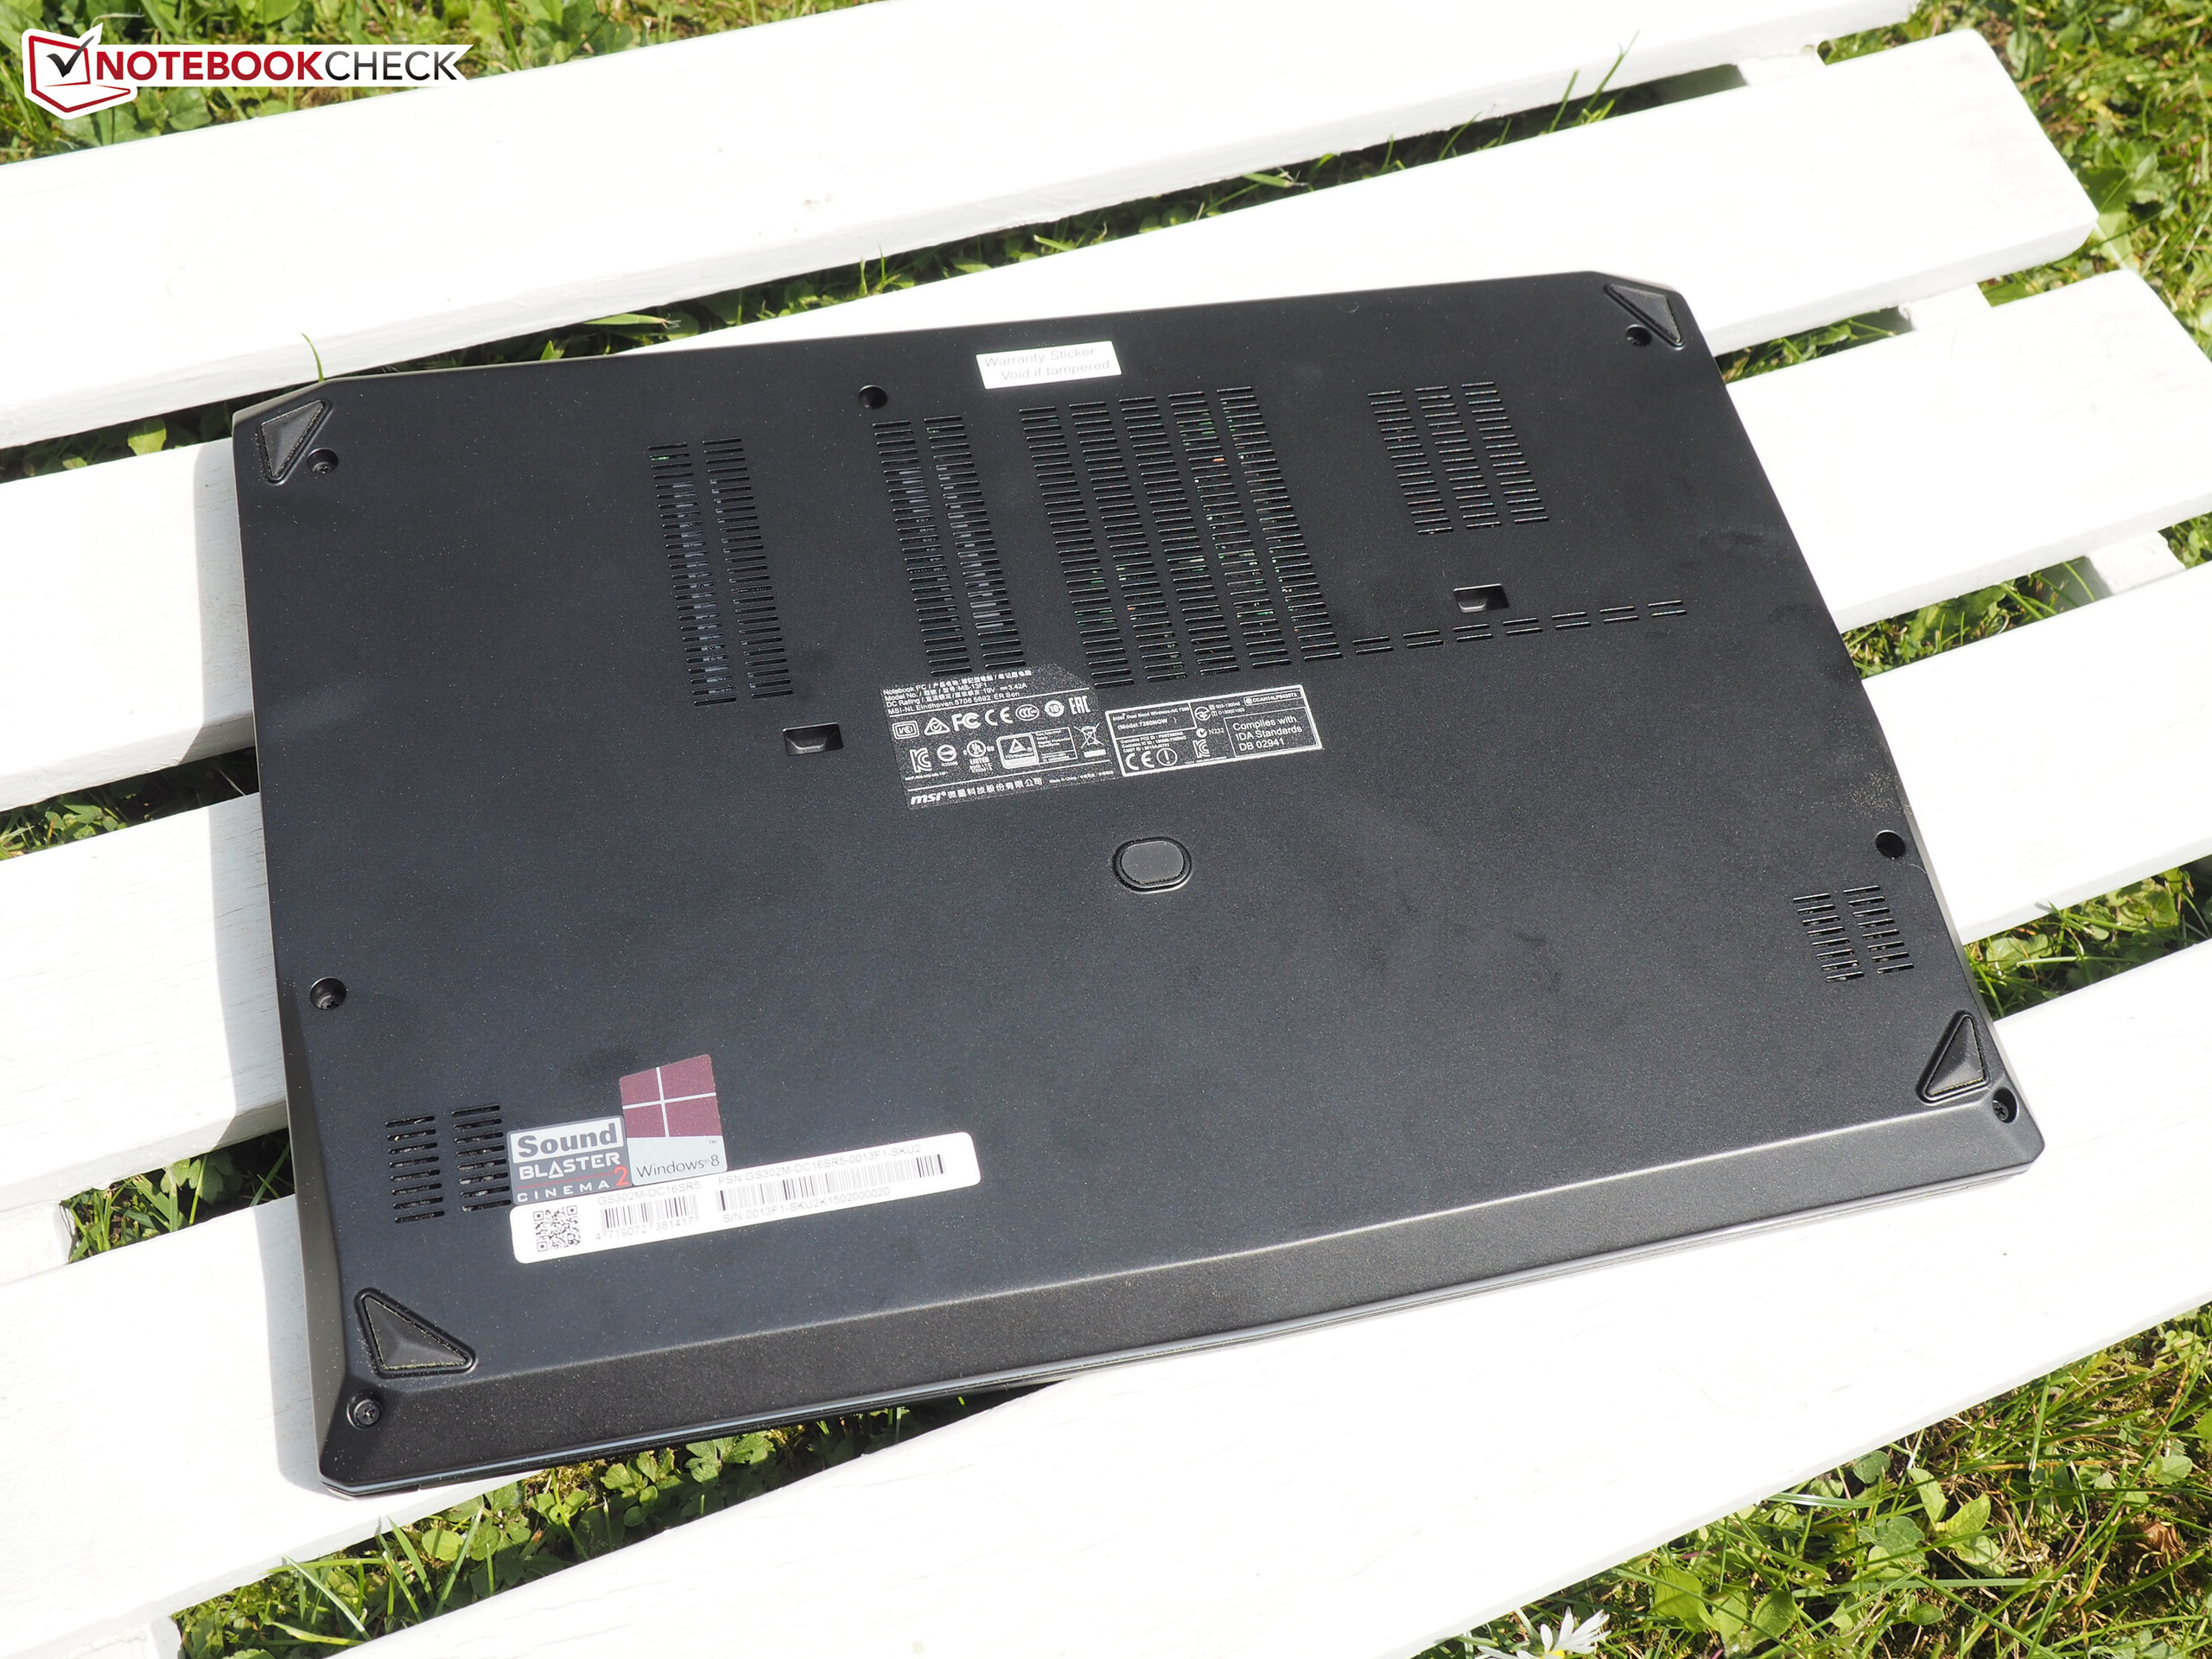
Maintenance
We can only judge about maintenance from second-hand sources, since MSI put warranty stickers on the notebook as well as on the docking station. These must stay intact when a device is provided by an online shop. Photos from other reviews show that the underside can be completely removed. While processor and graphics card are soldered with the motherboard, the Wi-Fi module, RAM, and the SSDs (two M.2 slots, version 2280) can be replaced if needed. Alike with most small notebooks, the big 4-cell battery cannot be reached from the outside but is screwed with the case inside. At least the GS30's maintenance is better than the Schenker S413's reviewed in 2013, which also does not feature an Nvidia GPU (no external graphics box).
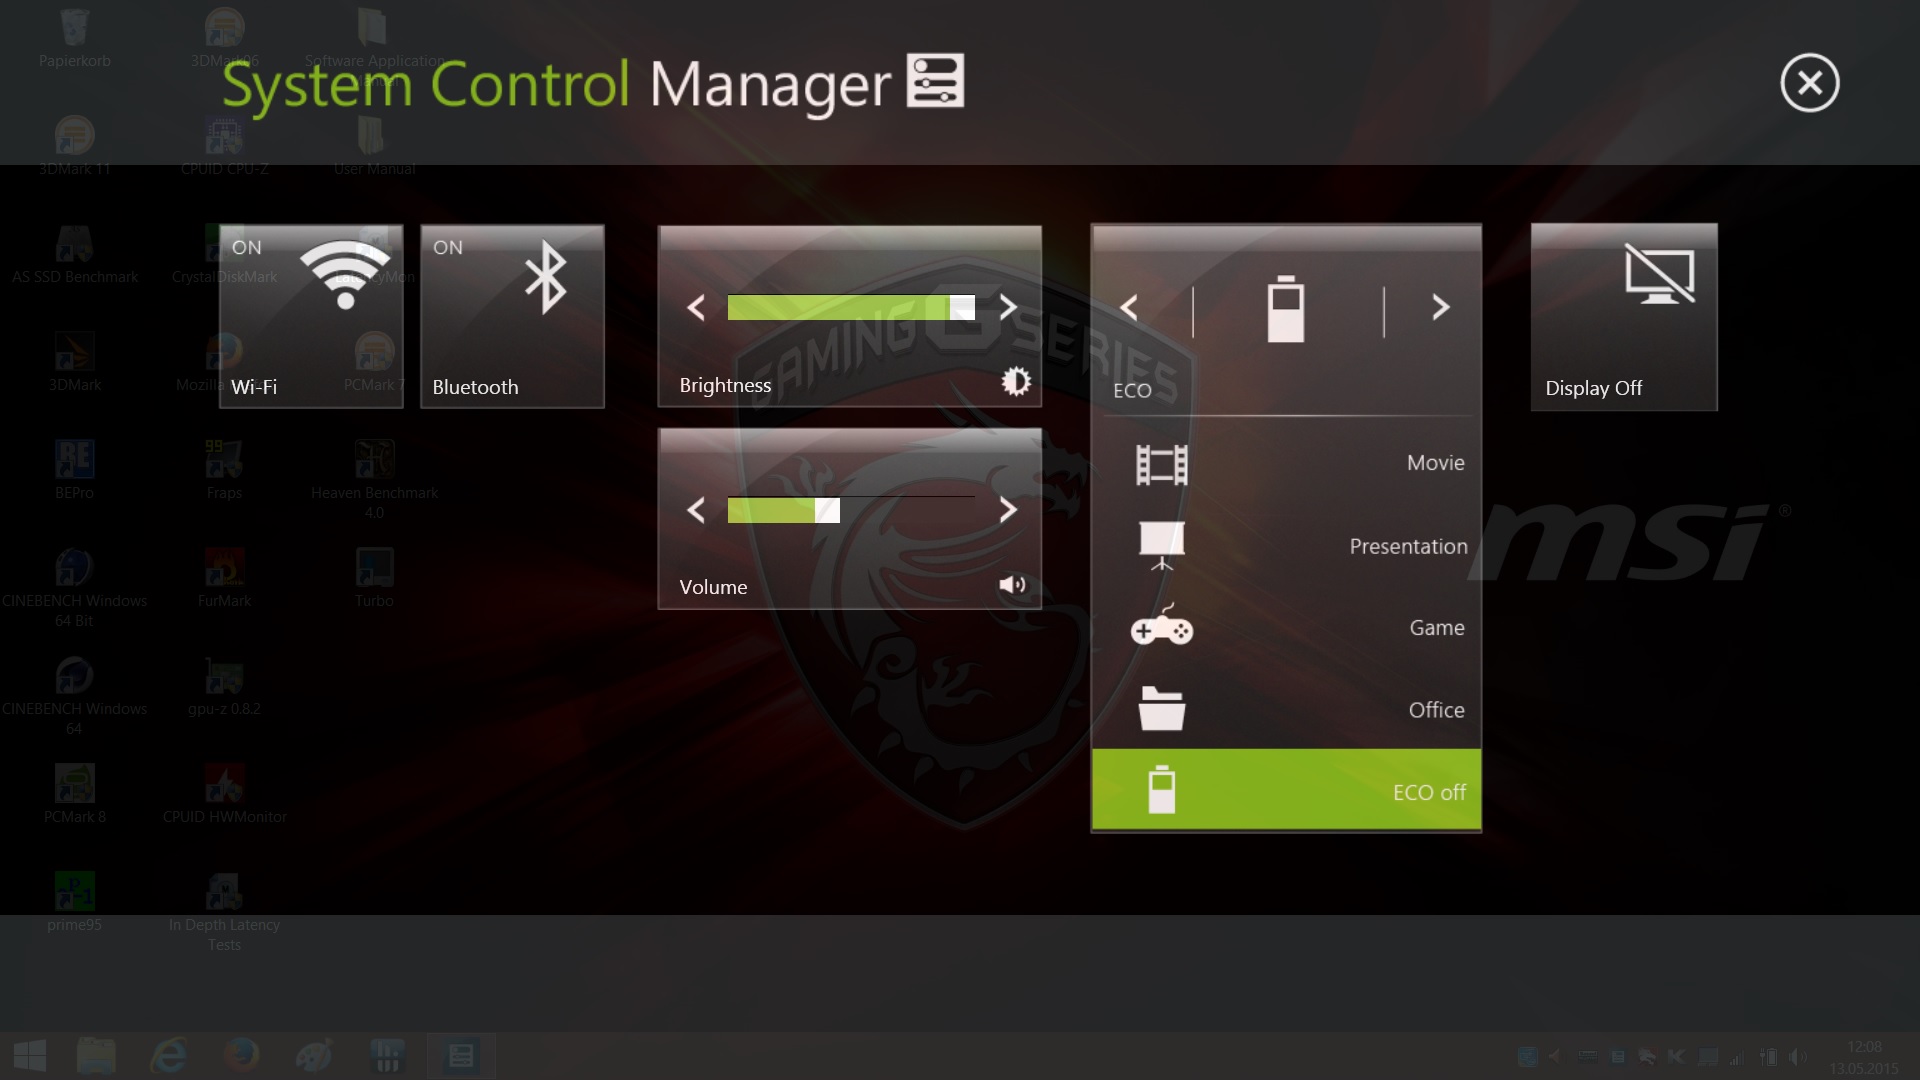
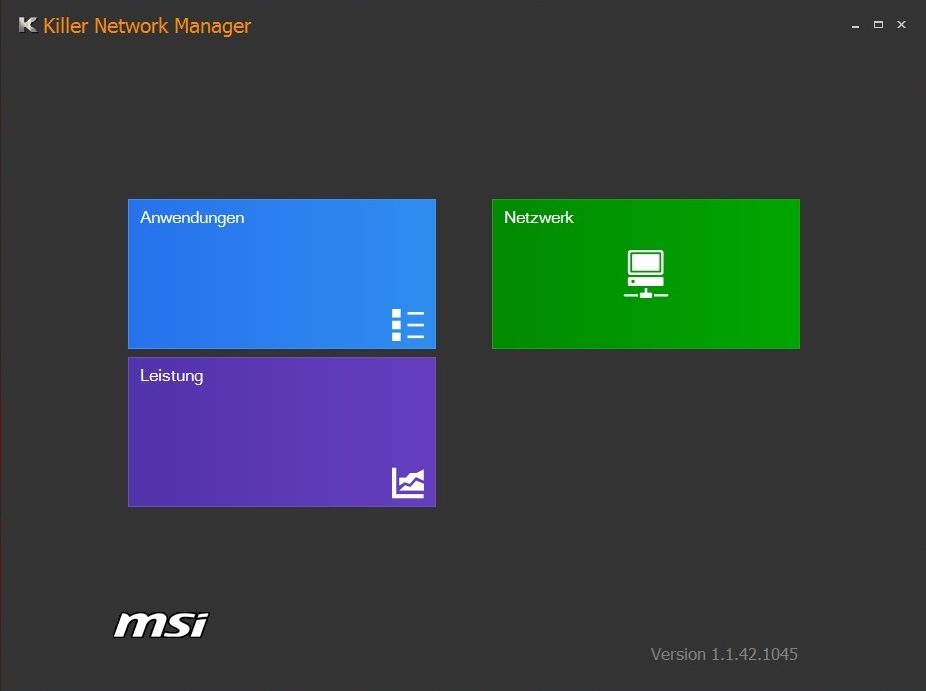
Software
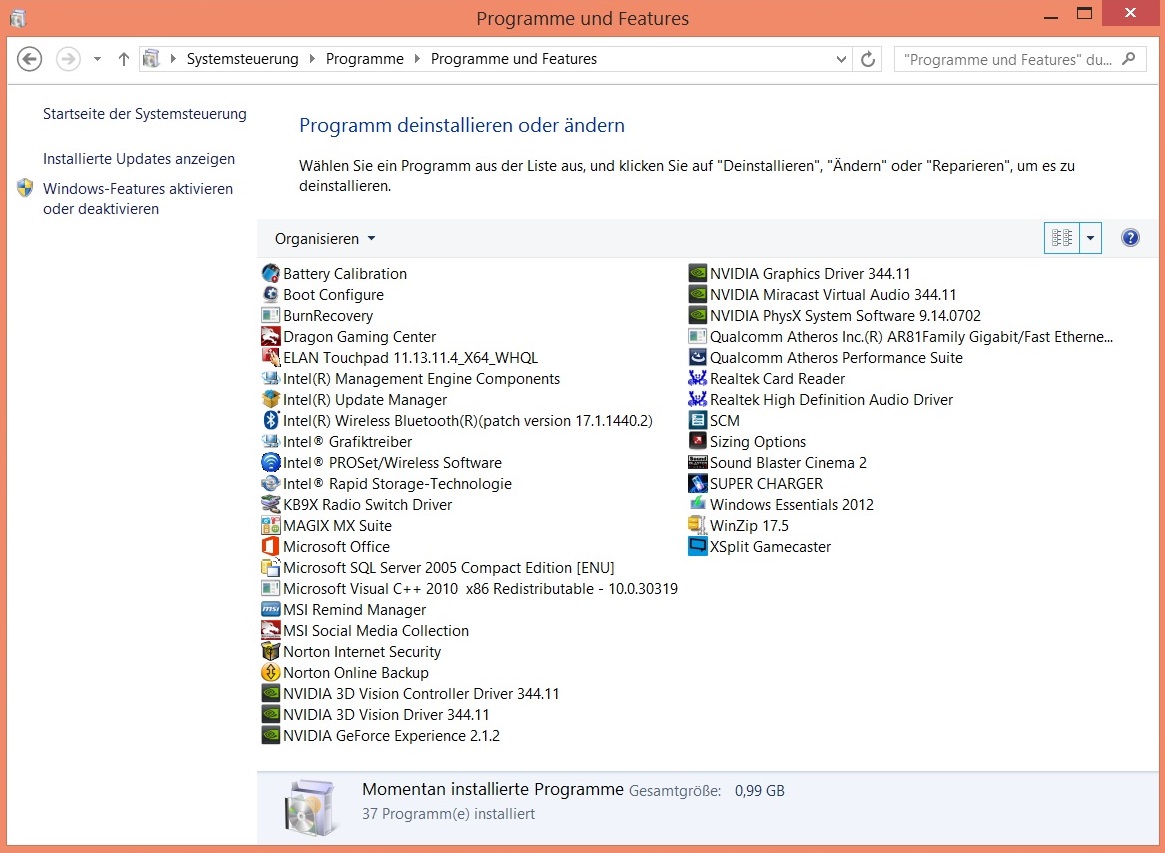
In contrast to barebone vendors such as Schenker, MSI installs a lot of software on their devices. Apart from necessary drivers, there are many programs and tools of questionable functionality. But, the system is not cluttered with bloatware. Many applications (Dragon Gaming Center, trial version of Office 365, Windows Essentials, etc.) are quite useful.
Accessories
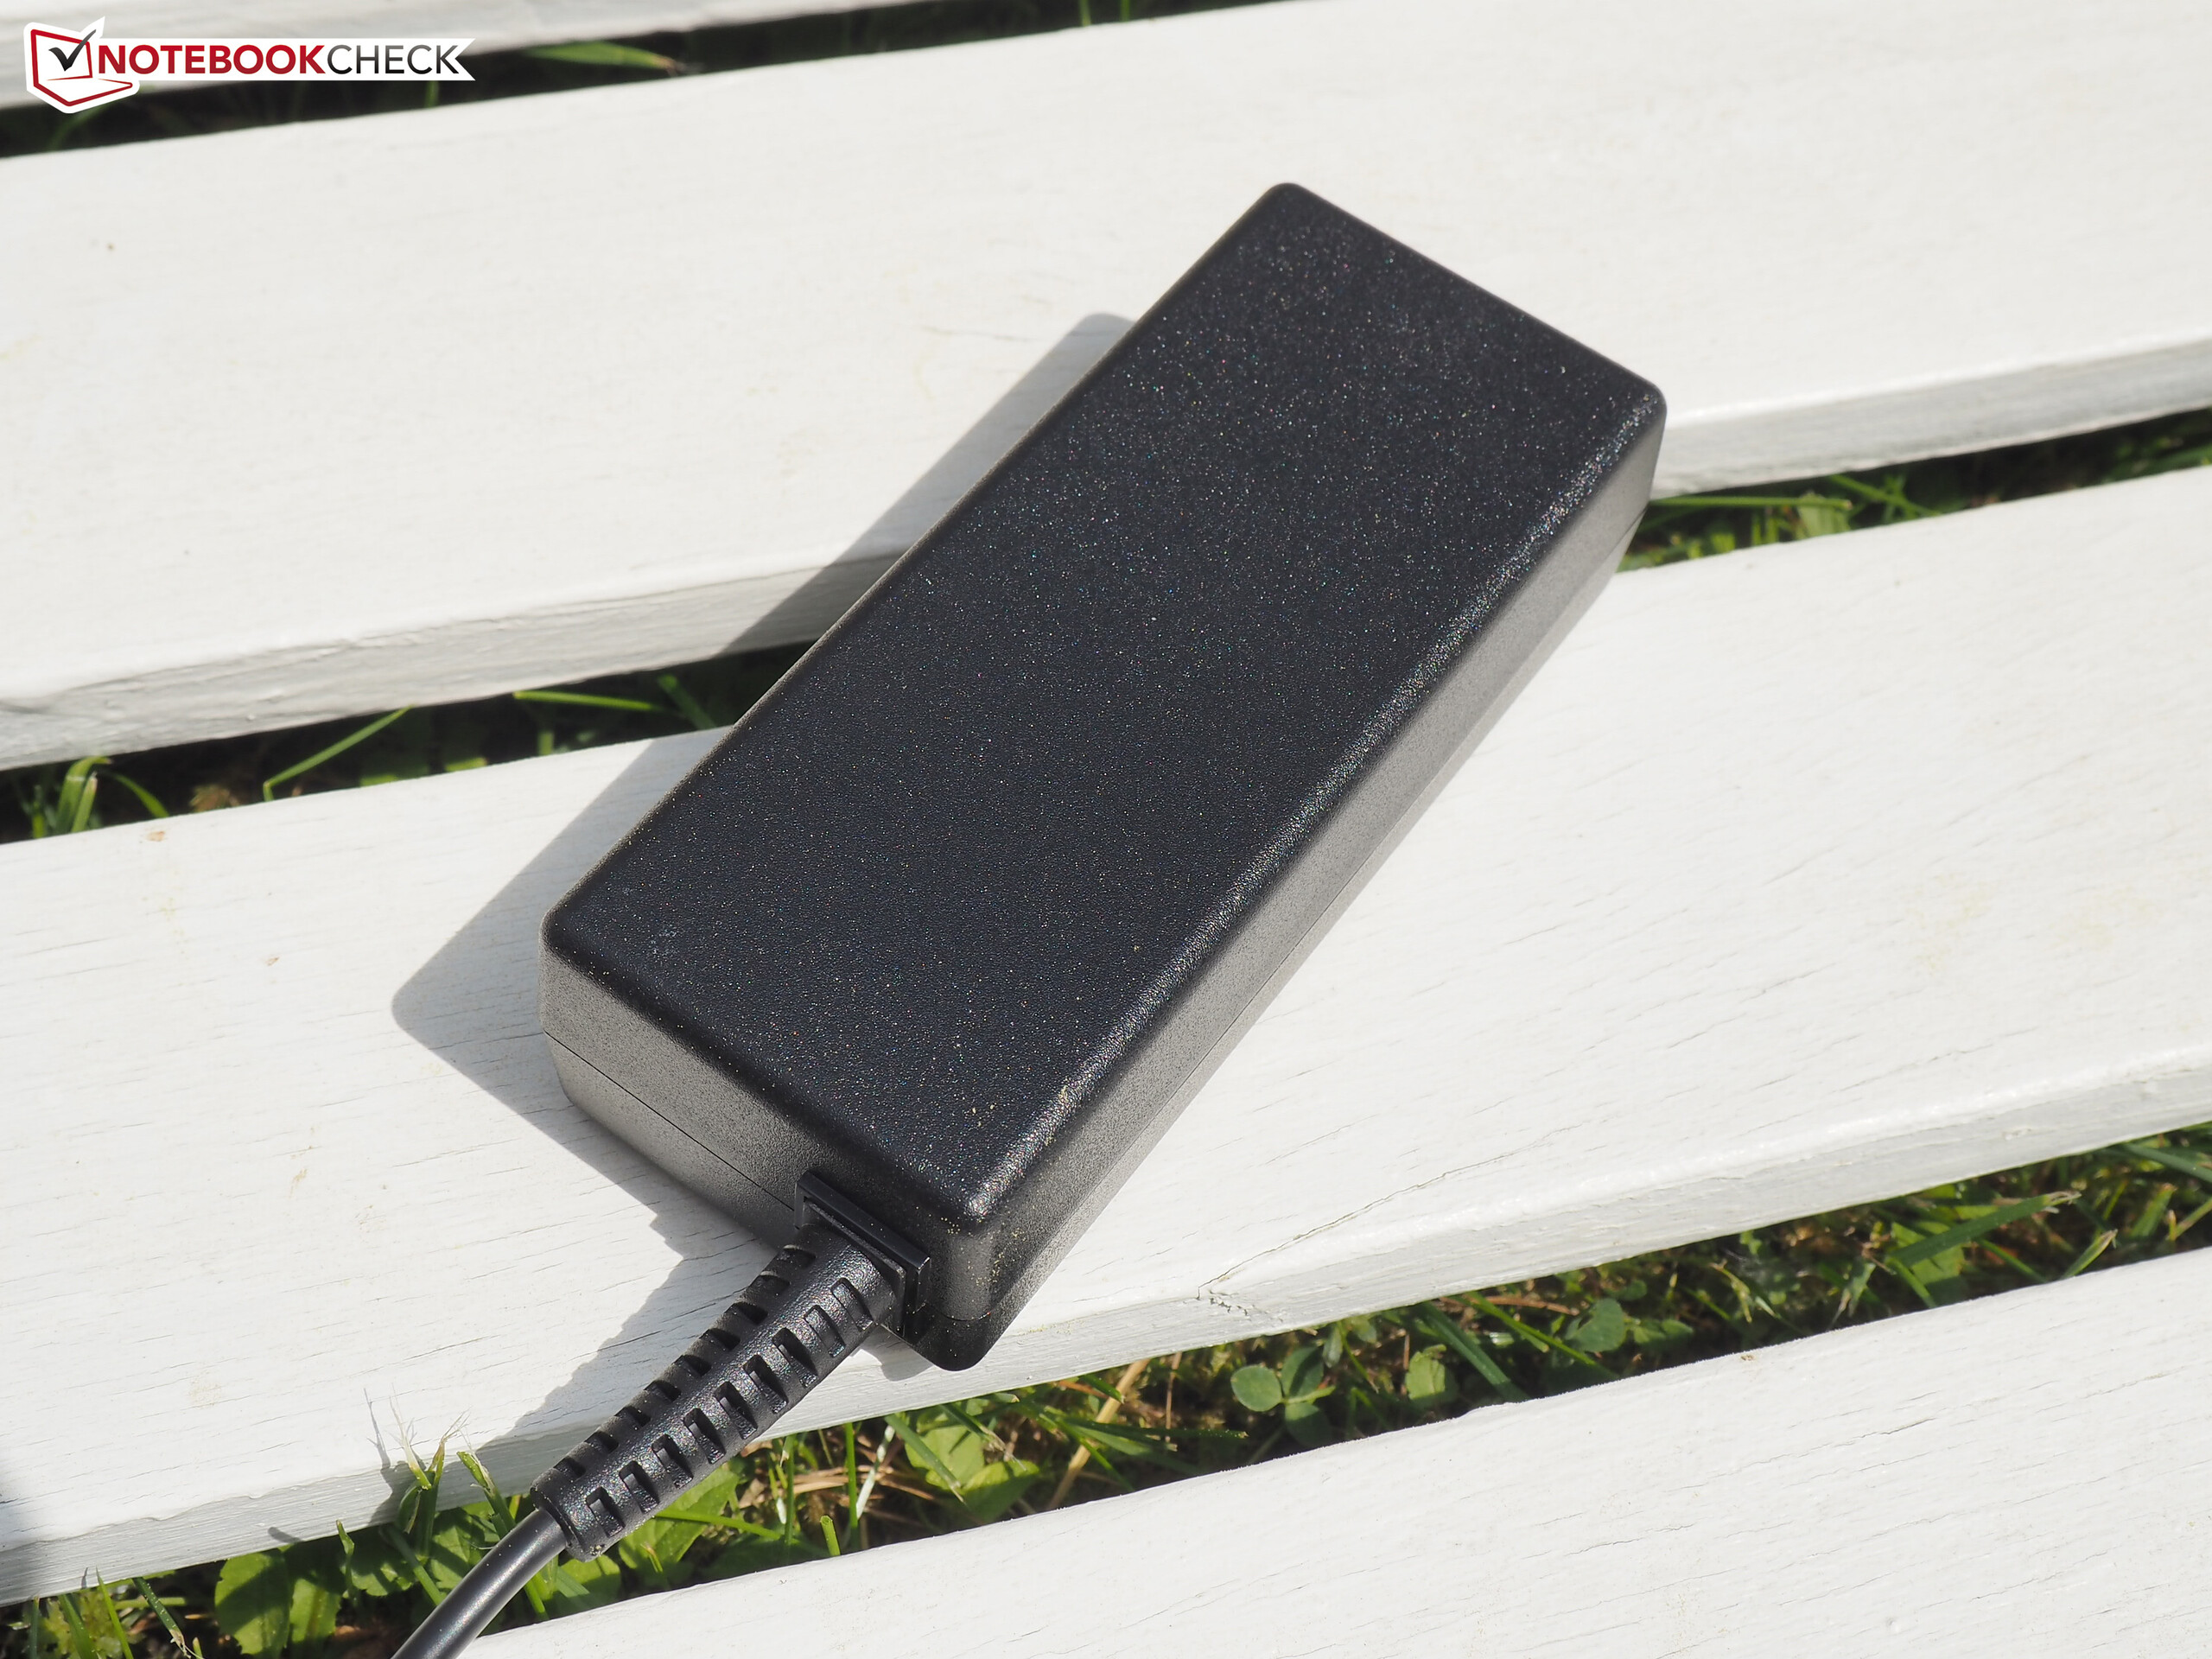
MSI is quite generous with the accessories and includes a recovery guide, a quick-start guide, a driver DVD, a cleaning cloth and warranty information. The biggest highlight is the included notebook bag made of cloth. If you order the device with GamingDock, you will also get a SATA cable, a service manual, another quick-start guide and an additional driver DVD (might be included by default). The power adaptor is a 65 W model that weighs 226 grams.
Warranty
The manufacturer promises a 24-month pickup and return service.

Input Devices
Keyboard
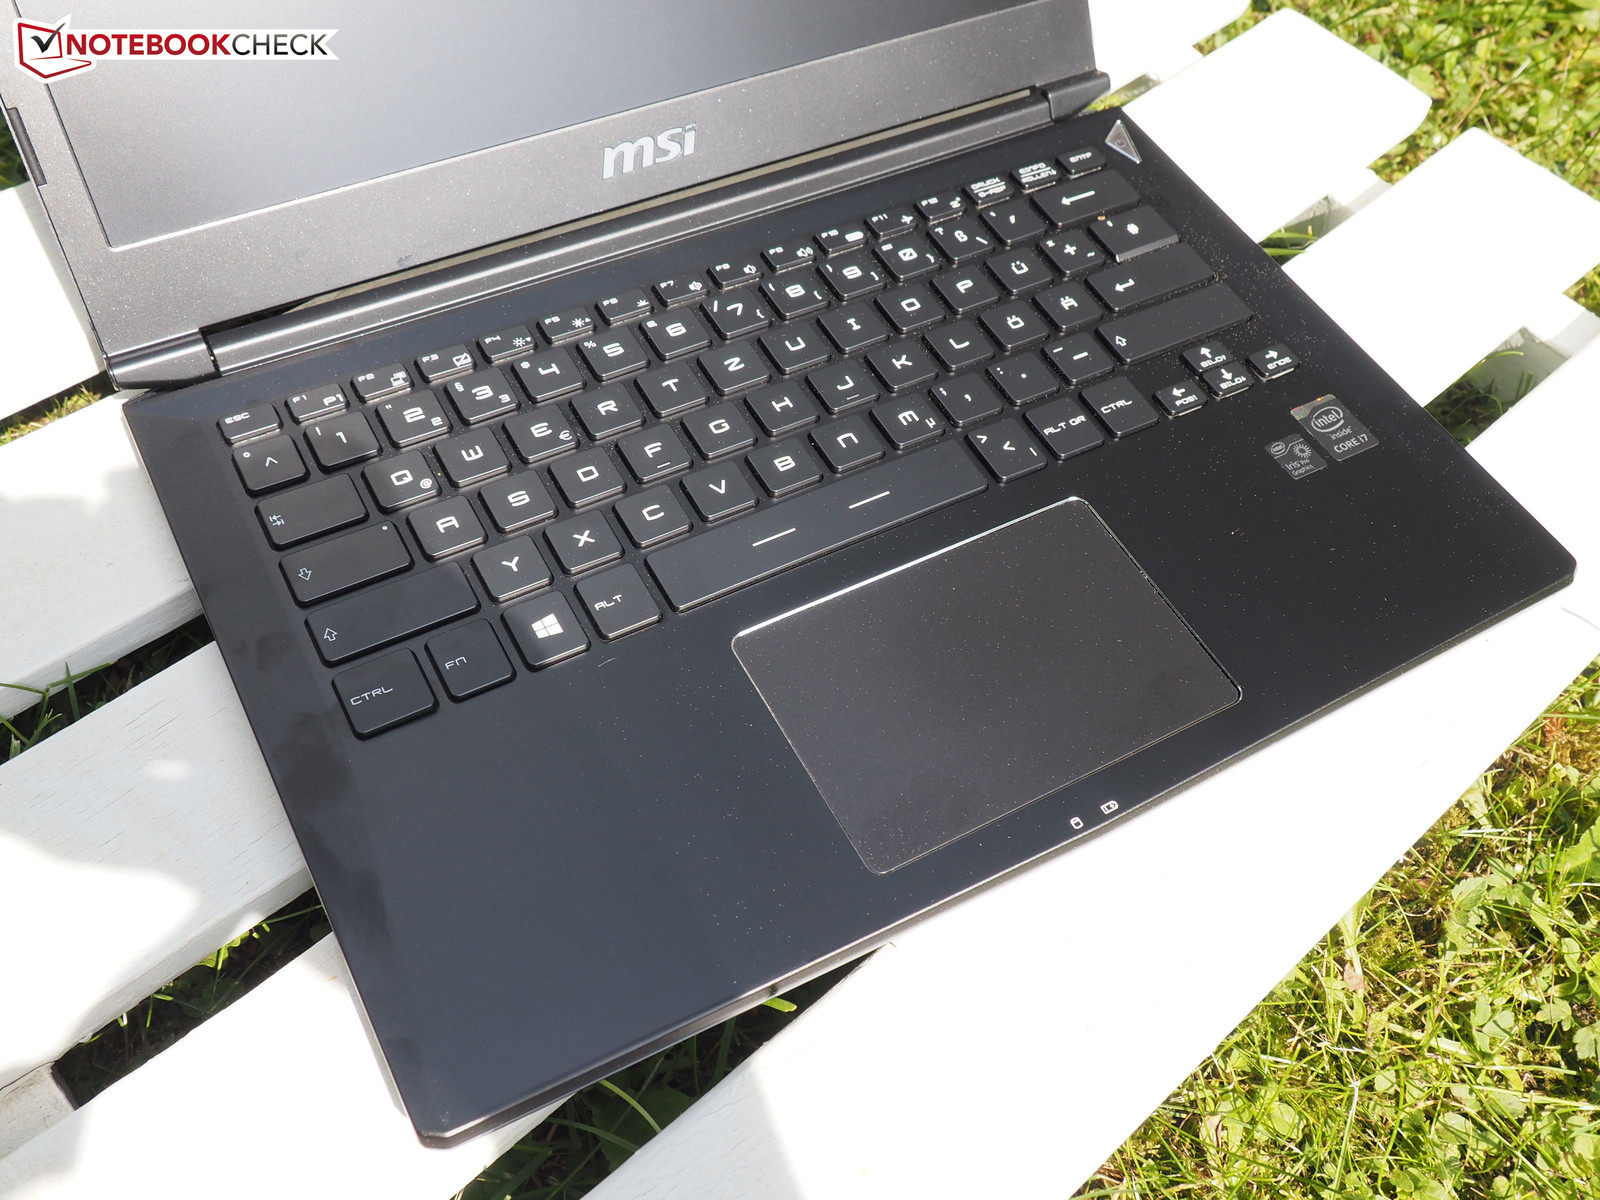
Typical MSI, the chiclet keyboard takes a lot of getting used to, since shape and position of several keys differ from the German standard. For example, there is a single-row Return key and <>| and # are not in their standard positions. Fans of arrow keys might also be a bit unhappy with the GS30 (very small size). However, since this is a 13-inch notebook, it is not surprising that the keyboard does not have a number block.
Technically, the keyboard is "acceptable." Apart from typing noise and pressure point, the stop is passable, although the author would have preferred a crisper feedback. For comfortable typing in the dark, MSI incorporated a white keyboard light. While it perfectly matches the light frame on the front side of the notebook, it only features a single brightness level (keyboards of other MSI models deliver several levels, colors and lighting zones). Finally, a few words about size: Thanks to a width of 15 mm, letter and number keys are sufficiently big.
Touchpad
MSI has opted for a modern ClickPad as mouse replacement. Compared to conventional touchpads with dedicated buttons, ClickPads often perform worse. This is due to modest reliability caused by the basic mechanics. Since the surface is used for left as well as right clicks, ClickPads do not always correctly recognize the intended user action (mouse movement instead of click or vice versa). Although the number of incorrect inputs was small, we would have preferred a conventional touchpad anyway. The comfortable, smooth finish, the good multi-touch support (zooming, scrolling, rotating, etc.) and the respectable size of 10.5 x 7.0 cm for a 13-inch device can't really make up for this.

Display
MSI has not only used a display with anti-reflective surface to improve outdoor capability. The Full HD panel called BOE HN133WU3-102 can largely keep up with its competition in other 13 and 14-inch notebooks in terms of quality. With a contrast of just under 720:1 and a black value of about 0.38 cd/m², the GS30 does not belong to the top models but should be able to meet the expectations of most buyers. Anyway, several of the competitors listed below achieve contrast ratios between 800 and 1000:1.
| |||||||||||||||||||||||||
Brightness Distribution: 88 %
Center on Battery: 273 cd/m²
Contrast: 718:1 (Black: 0.38 cd/m²)
ΔE ColorChecker Calman: 4.86 | ∀{0.5-29.43 Ø4.78}
ΔE Greyscale Calman: 4.56 | ∀{0.09-98 Ø5}
56% AdobeRGB 1998 (Argyll 1.6.3 3D)
62.5% AdobeRGB 1998 (Argyll 3D)
85.5% sRGB (Argyll 3D)
65.9% Display P3 (Argyll 3D)
Gamma: 2.23
CCT: 7292 K
The biggest weakness of the GS30's display is its modest brightness. Our test model only achieved an average brightness of 258 cd/m². While this might be acceptable indoors, you'll quickly wish for a higher brightness outdoors. The Schenker XMG A305 and the 4K panel of the Razer Blade 14 (glossy) achieve above 300 cd/m². Brightness distribution is another point of critique. 88% might be convincing on paper, but clouding is visible at the edges. However, many notebooks suffer from this problem.
| MSI GS30 Shadow BOEhydis HN133WU3-102 (BOE05E3) | Schenker S413 AUO B140HAN01 | Alienware 13 9T7WM_133HL (SDC4C48) | Schenker XMG A305 CMN N133HSE-EA1 (CMN1343) | Schenker XMG C405 AU Optronics B140HAN01.1 (AUO113ED) | Razer Blade 14 2015 | |
|---|---|---|---|---|---|---|
| Display | 2% | -1% | 4% | 12% | ||
| Display P3 Coverage (%) | 65.9 | 64.7 -2% | 61.8 -6% | 66.8 1% | 70.3 7% | |
| sRGB Coverage (%) | 85.5 | 88.5 4% | 88.3 3% | 89.6 5% | 97.1 14% | |
| AdobeRGB 1998 Coverage (%) | 62.5 | 64.6 3% | 63.4 1% | 65.6 5% | 71.1 14% | |
| Response Times | ||||||
| Response Time Grey 50% / Grey 80% * (ms) | 38 ? | |||||
| Response Time Black / White * (ms) | 28 ? | |||||
| PWM Frequency (Hz) | ||||||
| Screen | -1% | -1% | 1% | 2% | 6% | |
| Brightness middle (cd/m²) | 273 | 262 -4% | 319 17% | 315 15% | 280 3% | 318.4 17% |
| Brightness (cd/m²) | 258 | 268 4% | 295 14% | 310 20% | 267 3% | 311 21% |
| Brightness Distribution (%) | 88 | 88 0% | 83 -6% | 86 -2% | 85 -3% | 78 -11% |
| Black Level * (cd/m²) | 0.38 | 0.59 -55% | 0.32 16% | 0.35 8% | 0.32 16% | 0.416 -9% |
| Contrast (:1) | 718 | 444 -38% | 997 39% | 900 25% | 875 22% | 765 7% |
| Colorchecker dE 2000 * | 4.86 | 3.4 30% | 5.83 -20% | 5.63 -16% | 4.75 2% | 3.67 24% |
| Greyscale dE 2000 * | 4.56 | 2.5 45% | 7.63 -67% | 6.71 -47% | 5.91 -30% | 5.41 -19% |
| Gamma | 2.23 99% | 2.62 84% | 2.57 86% | 2.53 87% | 2.52 87% | 2.26 97% |
| CCT | 7292 89% | 6723 97% | 7195 90% | 5920 110% | 5742 113% | 7118 91% |
| Color Space (Percent of AdobeRGB 1998) (%) | 56 | 60 7% | 57 2% | 57 2% | 59 5% | 64.64 15% |
| Total Average (Program / Settings) | 1% /
-1% | -1% /
-1% | 1% /
1% | 3% /
3% | 9% /
7% |
* ... smaller is better
A general verdict on display size is not possible. Gamers have to decide individually whether 33.8 cm is sufficient for gaming. We feel that 13-inches is just big enough. The GS30 performs quite well in interpolating lower resolutions (especially because of the small display). 1366x738 pixels looks reasonably sharp.


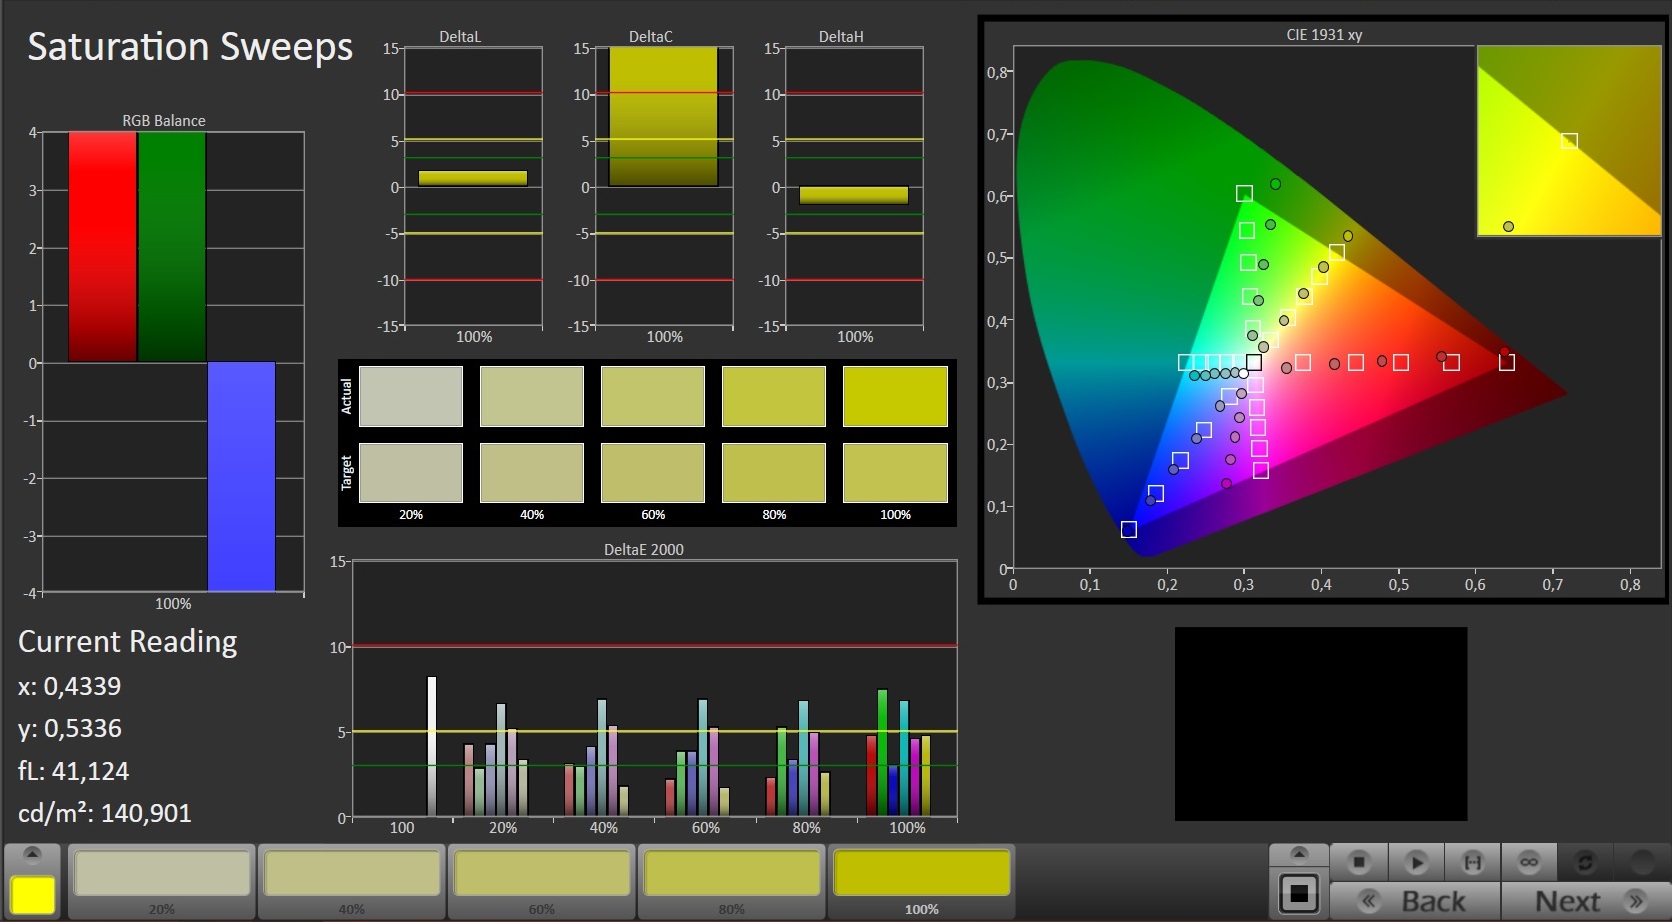
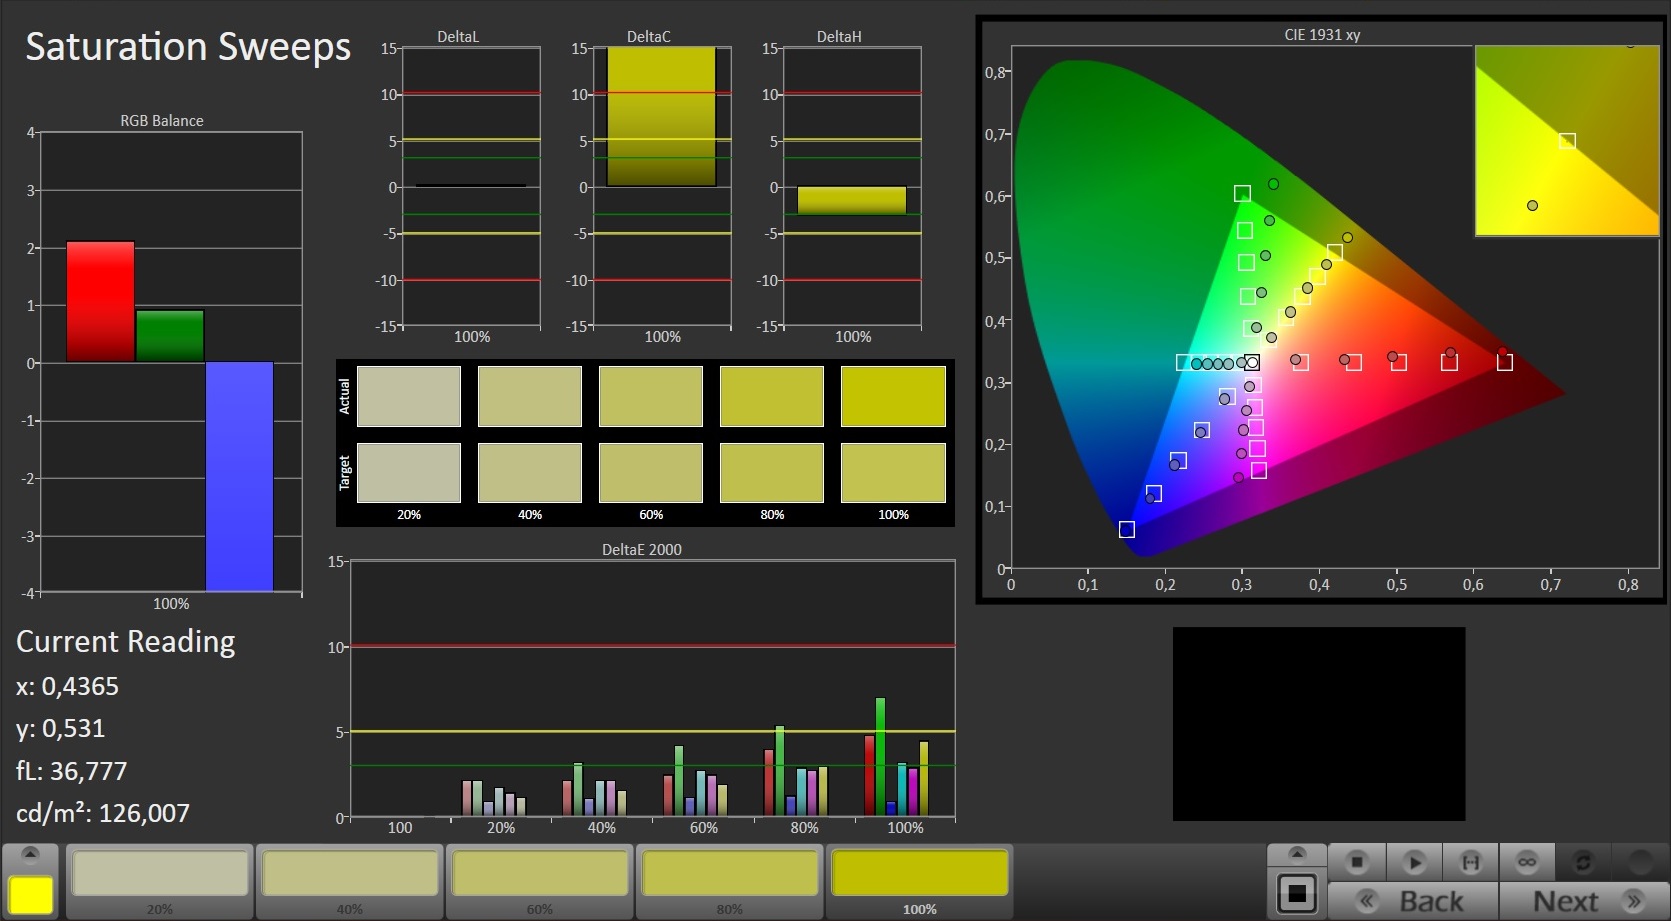


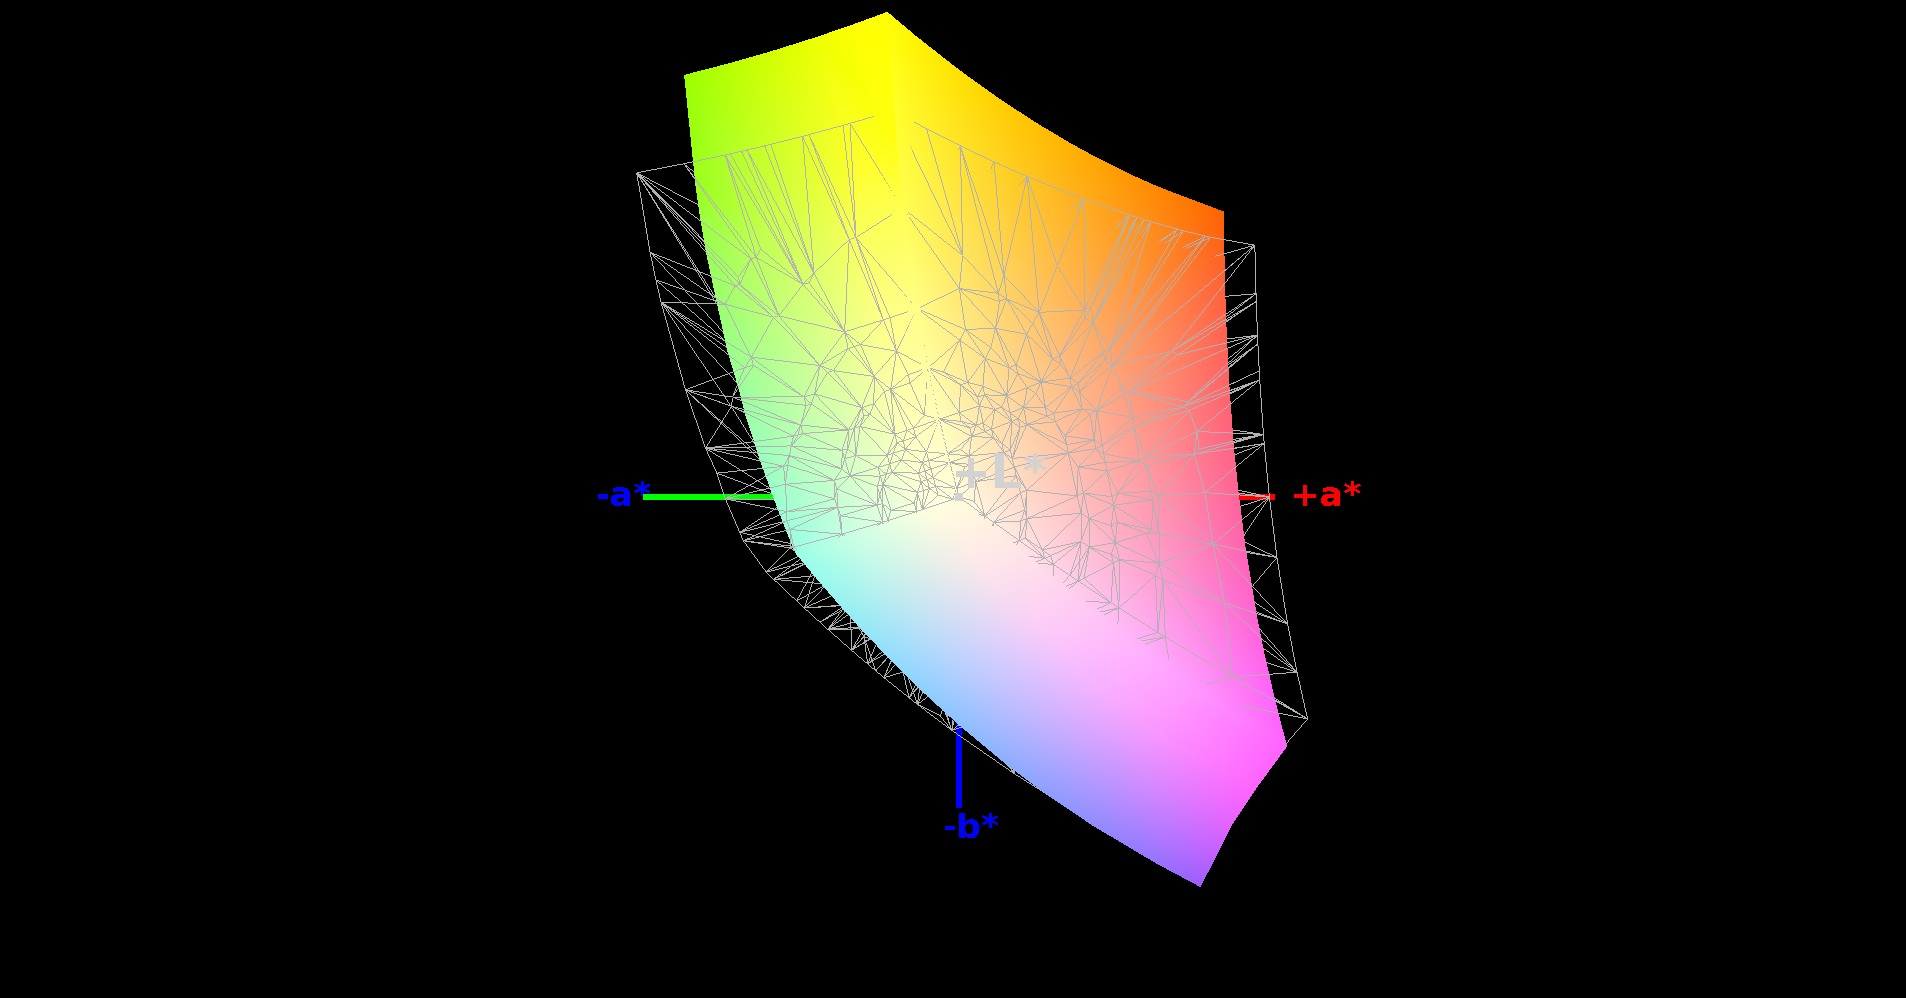

The viewing angles are not bad, either. As is typical for IPS screens, image distortions first evolve when looking from very acute angles. With cheaper TN-type panels, the screen content already changes in a disturbing way at significantly smaller deviations from the ideal viewing angle. Our measurement tools recorded color coverage of 86% of sRGB and 56% of AdobeRGB.


GamingDock
Having already mentioned the GamingDock a couple of times, we will describe it in more detail here. The box with a size of about 36 x 21 x 20 cm houses a desktop GPU. Together with its 450 Watt power adapter it weighs about five kilograms. The basic concept is similar to its counterpart from Alienware, but it differs from the latter in many details.
Apart from look, the technology used for data transfer is different. While the Alienware notebooks are connected via PCIe-x4 cable to the amplifier, the GS30 has to be directly placed on the top side of its GamingDock. The mechanism is not only easy to use but also allows connection via PCIe-x16 known from genuine desktop motherboards. As a result, the maximum performance is available to the notebook (in the worst case, the performance loss is up to 10% with PCIe-x4).
It is a disadvantage of the MSI model that you'll get an inflexible unit when connecting it to the notebook. Since the screen is automatically deactivated and the notebook sits very high, you'll need an external keyboard/mouse and an external display for desktop use. The Alienware laptops do not require additional hardware because they are connected via cable. However, we liked the configuration of the MSI model better. The desktop GPU was recognized immediately after connection, while the Amplifier required a driver installation. This could be caused by Nvidia's Optimus technology, which MSI did not implement in the GS30.
Both manufacturers should improve the system noise. The Amplifier as well as the GamingDock are clearly audible and lack a good control. It appears that the fans are always running at maximum speed. All things considered, we would prefer the MSI solution. The system appears to be more mature and comfortable since it is specifically designed for a certain notebook.


Performance
Processor
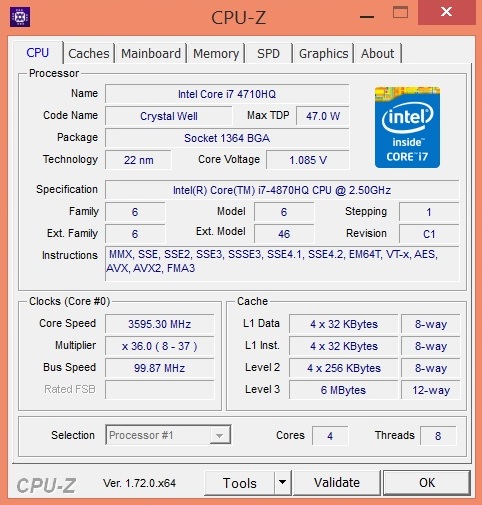
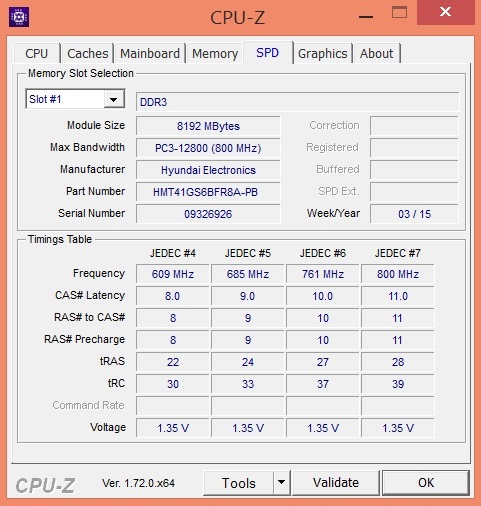
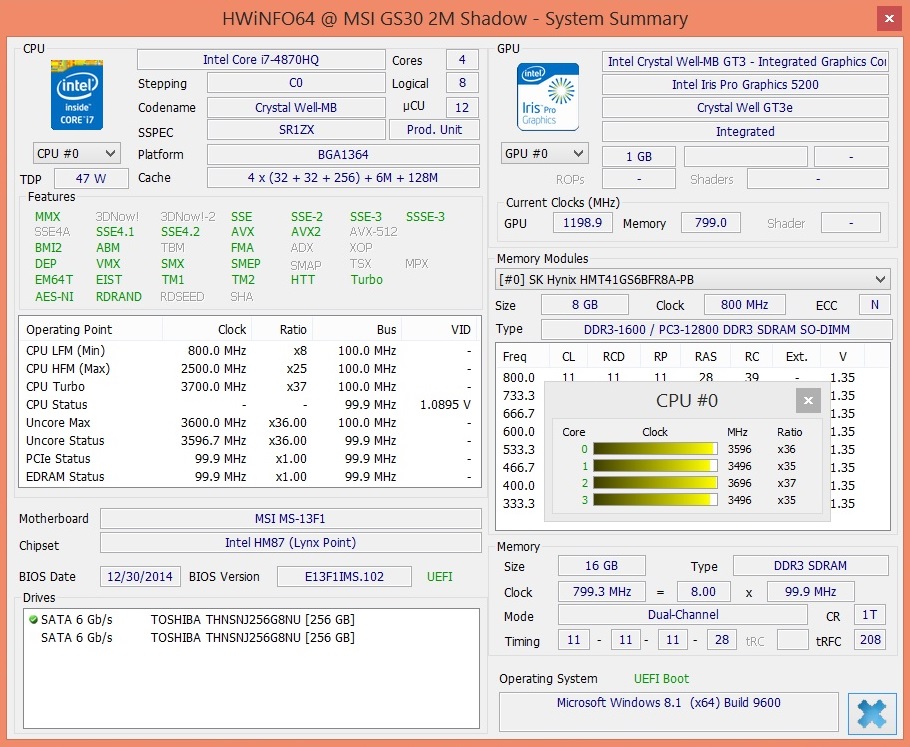
The Core i7-4870HQ is a quad-core processor from Intel's Haswell generation (22 nm), whose specs are quite similar to the cheaper Core i7-4720HQ sibling's. L3 cache (6 MB) and TDP are identical (47 Watt). While the clock rates are marginally different, you'll hardly notice a difference between 2.5-3.7 and 2.6-3.6 GHz in real-world scenarios.
Why, then, did MSI use a Core i7-4870HQ? Quite simply: The integrated graphics chip of the Core i7-4720HQ is significantly slower in games. For example, the HD Graphics 4600 performs far worse than the Iris Pro 5200 of the Core i7-4870HQ in many programs. Among others, this is due to double the pipelines (40 vs. 20) and the 128 MB eDRAM, which is missing in the HD Graphics 4600. But, the clock rates are almost the same. While the Iris Pro 5200 is able to reach a maximum of 1300 MHz (depending on the CPU), the HD Graphics 4600 reaches up to 1350 MHz (1.2 GHz @4720HQ).


The results in system noise, temperature, power consumption, and battery life, might raise the question whether the Core i7-4720HQ would have been the better choice despite weaker graphics performance. The Core i7-4870HQ is known for getting very hot and consuming an exceptional amount of power. This is also true for the GS30. In our opinion, the disadvantages outweigh the advantages - regardless of higher graphics performance. It would be exciting to see how the GS30 would perform with a combination of Core i7-4720HQ and mobile low-end GPU (GeForce 940M). MSI could make the chassis a few millimeters higher in this case.
The present concept with Core i7-4870HQ and Iris Pro 5200 does not completely work as desired. The best example is the low Turbo Boost under load. If only the processor part is stressed, automatic overclocking is used extensively. 3.3 to 3.7 GHz in the single-core test of the Cinebench R11.5 and 3.1 to 3.5 GHz in the multi-core test are nothing to sneeze at. However, the clock decreased to 2.5 to 3.0 GHz after a while, which is far lower than the maximum Turbo clock (3.5 GHz here) and has an impact on the CPU benchmarks.
The clock rates are really disappointing in 3D mode. It did not take a long time after starting the Unigine Heaven 4.0 benchmarks until the Turbo was completely deactivated and the Core i7-4870HQ ran at 2.5 GHz, i.e. its base clock. The third screenshot and the GPU benchmarks show that the Iris Pro 5200 also does not run at its maximum clock. Other notebooks with this GPU (e.g. the Schenker S413) partly compute several percent faster. Fortunately, this problem does not persist when using the docking station: As soon as the desktop GPU is active, the Turbo is available in all 3D applications (~3.0 GHz @multi-core load, ~3.5 GHz @single-core load).


In our CPU tests the GS30 is on par with other 13 and 14-inch notebooks. Because of the limited clock rate, supposedly weaker processors like the Core i7-4710MQ (2.5-3.5 GHz) can even perform slightly better in multi-core benchmarks. However, the difference is not really relevant in practice. The only exception is the Core i5-4210U in the Alienware 13 (an update review with i7-5550U will be available soon). Due to fewer cores and poor clock rates (1.7 to 2.7 GHz) the dual-core model performs up to 60% worse.
| Cinebench R11.5 | |
| CPU Single 64Bit (sort by value) | |
| MSI GS30 Shadow | |
| Schenker S413 | |
| Alienware 13 | |
| Schenker XMG A305 | |
| Schenker XMG C405 | |
| Razer Blade 14 2015 | |
| MSI GamingDock | |
| CPU Multi 64Bit (sort by value) | |
| MSI GS30 Shadow | |
| Schenker S413 | |
| Alienware 13 | |
| Schenker XMG A305 | |
| Schenker XMG C405 | |
| Razer Blade 14 2015 | |
| MSI GamingDock | |
| Cinebench R15 | |
| CPU Single 64Bit (sort by value) | |
| MSI GS30 Shadow | |
| Schenker S413 | |
| Alienware 13 | |
| Schenker XMG A305 | |
| Schenker XMG C405 | |
| Razer Blade 14 2015 | |
| MSI GamingDock | |
| CPU Multi 64Bit (sort by value) | |
| MSI GS30 Shadow | |
| Schenker S413 | |
| Alienware 13 | |
| Schenker XMG A305 | |
| Schenker XMG C405 | |
| Razer Blade 14 2015 | |
| MSI GamingDock | |
System Performance
In the system test, the performance of the mass storage is particularly important. Thanks to its SSD RAID the 13-incher has the chance to perform very well, which is proved by the PCMarks. With 6510 points, the Core i7 model of the GS30 outperforms all competing notebooks.
| PCMark 7 Score | 6510 points | |
| PCMark 8 Home Score Accelerated v2 | 4087 points | |
| PCMark 8 Creative Score Accelerated v2 | 5165 points | |
| PCMark 8 Work Score Accelerated v2 | 4916 points | |
Help | ||
| PCMark 7 - Score (sort by value) | |
| MSI GS30 Shadow | |
| Schenker S413 | |
| Alienware 13 | |
| Schenker XMG A305 | |
| Razer Blade 14 2015 | |
| PCMark 8 | |
| Work Score Accelerated v2 (sort by value) | |
| MSI GS30 Shadow | |
| Alienware 13 | |
| Schenker XMG C405 | |
| Razer Blade 14 2015 | |
| Creative Score Accelerated v2 (sort by value) | |
| MSI GS30 Shadow | |
| Alienware 13 | |
| Schenker XMG C405 | |
| Razer Blade 14 2015 | |
| Home Score Accelerated v2 (sort by value) | |
| MSI GS30 Shadow | |
| Alienware 13 | |
| Schenker XMG C405 | |
| Razer Blade 14 2015 | |
Storage Devices
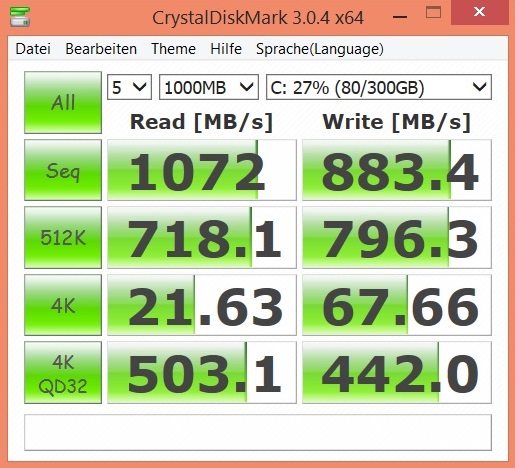
Although you won't profit from a RAID connection in most scenarios (the 4K performance is similar to a single hard drive's), MSI incorporated two mass storage devices. The capacity of the two M.2-SSDs (Toshiba HG6 THNSNJ256G8NU) sums up to a total of 512 GB. CrystalDiskMark confirms that at least the sequential transfer rates of the GS30 are outstanding. A single SSD with SATA-III interface cannot reach 1072 MB/s in reading and 883 MB/s in writing.
There are also models based on PCI-Express available (see e.g. the Asus GL771JW), which are contrary to the SATA-III competitors not limited to about 500 MB/s. So, the RAID system get slowly obsolete and we would have liked to see a PCIe SSD in the GS30 (potentially higher 4K performance), too.

Graphics Card
Only with the docking station is gaming really fun. In order to also attract demanding gamers, MSI offers two of the currently most powerful desktop models. Since the GeForce GTX 980 already had to show its strengths in the Alienware 13 and Alienware 15, it was the GeForce GTX 970's turn in the GS30. Nvidias's luxury GPU hit the headlines with "VRAM Gate" a few months ago. Instead of connecting the full 4 GB GDDR5 VRAM via 256-bit interface, the manufacturer only uses 32-bit for one 512 MB block. This can lead to an unnecessary performance loss in extreme scenarios.
Nevertheless, the GeForce GTX 970 can easily outperform notebook GPUs. For example, the GeForce GTX 970M only features 1280 instead of 1664 CUDA cores (-23%). The clock rates of the mobile sibling are also lower. While the notebook model is limited to 1038 MHz (2500 MHz @memory), the GTX 970 reaches up to 1266 MHz (3500 MHz @memory). Nvidia's top model of the Maxwell generation, the GeForce GTX 980, only features more shader units (2048 CUDA cores) than its desktop sibling.
| 3DMark 11 Performance | 2156 points | |
| 3DMark Ice Storm Standard Score | 84120 points | |
| 3DMark Cloud Gate Standard Score | 9626 points | |
| 3DMark Fire Strike Score | 1281 points | |
Help | ||
Let's turn to the graphics benchmarks, which are unambiguous. Based on the table below, it becomes clear quickly that using the GamingDock pays off many times over. For example, the GeForce GTX 970 computes above 700% faster than the Iris Pro 5200 and still 50% faster than the GeForce GTX 970M (GPU score) in the Fire Strike test of 3DMark 13. In the Unigine Heaven 4.0 benchmark (Extreme preset) it even performs 800% better than the Iris Pro 5200.
Thus, the GS30 turns into a genuine desktop PC with the GamingDock and easily outperforms almost all gaming notebooks. Only dual GPU systems can compete with the docking station. The Aorus X7 Pro with an SLI connection of two GTX 970M cards achieves about the same performance on average.
| 3DMark 11 - 1280x720 Performance GPU (sort by value) | |
| MSI GS30 Shadow | |
| Schenker S413 | |
| Alienware 13 | |
| Schenker XMG A305 | |
| Schenker XMG C405 | |
| Razer Blade 14 2015 | |
| MSI GamingDock | |
| 3DMark | |
| 1920x1080 Fire Strike Graphics (sort by value) | |
| MSI GS30 Shadow | |
| Schenker S413 | |
| Alienware 13 | |
| Schenker XMG A305 | |
| Schenker XMG C405 | |
| Razer Blade 14 2015 | |
| MSI GamingDock | |
| 1280x720 Sky Diver Graphics (sort by value) | |
| MSI GS30 Shadow | |
| Alienware 13 | |
| Schenker XMG A305 | |
| Schenker XMG C405 | |
| MSI GamingDock | |
| 1280x720 Cloud Gate Standard Graphics (sort by value) | |
| MSI GS30 Shadow | |
| Schenker S413 | |
| Alienware 13 | |
| Schenker XMG A305 | |
| Schenker XMG C405 | |
| Razer Blade 14 2015 | |
| MSI GamingDock | |
| 1280x720 Ice Storm Standard Graphics (sort by value) | |
| MSI GS30 Shadow | |
| Schenker S413 | |
| Alienware 13 | |
| Schenker XMG A305 | |
| Schenker XMG C405 | |
| Razer Blade 14 2015 | |
| MSI GamingDock | |
| Unigine Heaven 4.0 - Extreme Preset DX11 (sort by value) | |
| MSI GS30 Shadow | |
| MSI GamingDock | |
Gaming Performance
The Iris Pro 5200 quickly reaches its limits in current action games like Dragon Age: Inquisition. More than low to medium settings and 1366 x 768 pixels can only be used in undemanding titles (FIFA 15, The Sims 4, etc.). Some resource-hungry games (e.g. Far Cry 4) are not playable at all.
| low | med. | high | ultra | |
|---|---|---|---|---|
| Crysis 3 (2013) | 45.9 | 27.9 | 18.4 | 6.9 |
| Watch Dogs (2014) | 33.8 | 21.4 | 5.7 | 0 () |
| Sims 4 (2014) | 194.9 | 68.4 | 32.7 | 22.1 |
| Fifa 15 (2014) | 87.9 | 59.9 | 37 | |
| Far Cry 4 (2014) | 26.5 | 19.8 | 9.4 | 7 |
| Dragon Age: Inquisition (2014) | 39.3 | 26.3 | 9.7 | 5.5 |
| Battlefield Hardline (2015) | 47.8 | 34.1 | 15 | 8.6 |
| GTA V (2015) | 48.7 | 38.4 | 7.8 | 2.9 |
Things are completely different with the GeForce GTX 970: The desktop chip can even easily cope with computational-intensive games. Usually games run smoothly with high to maximum details and/or resolutions (above 40 fps @GTA V & Battlefield 4). This is only true for very few notebooks. The frame rates of other games run on the GeForce GTX 970 are available in our GPU article.
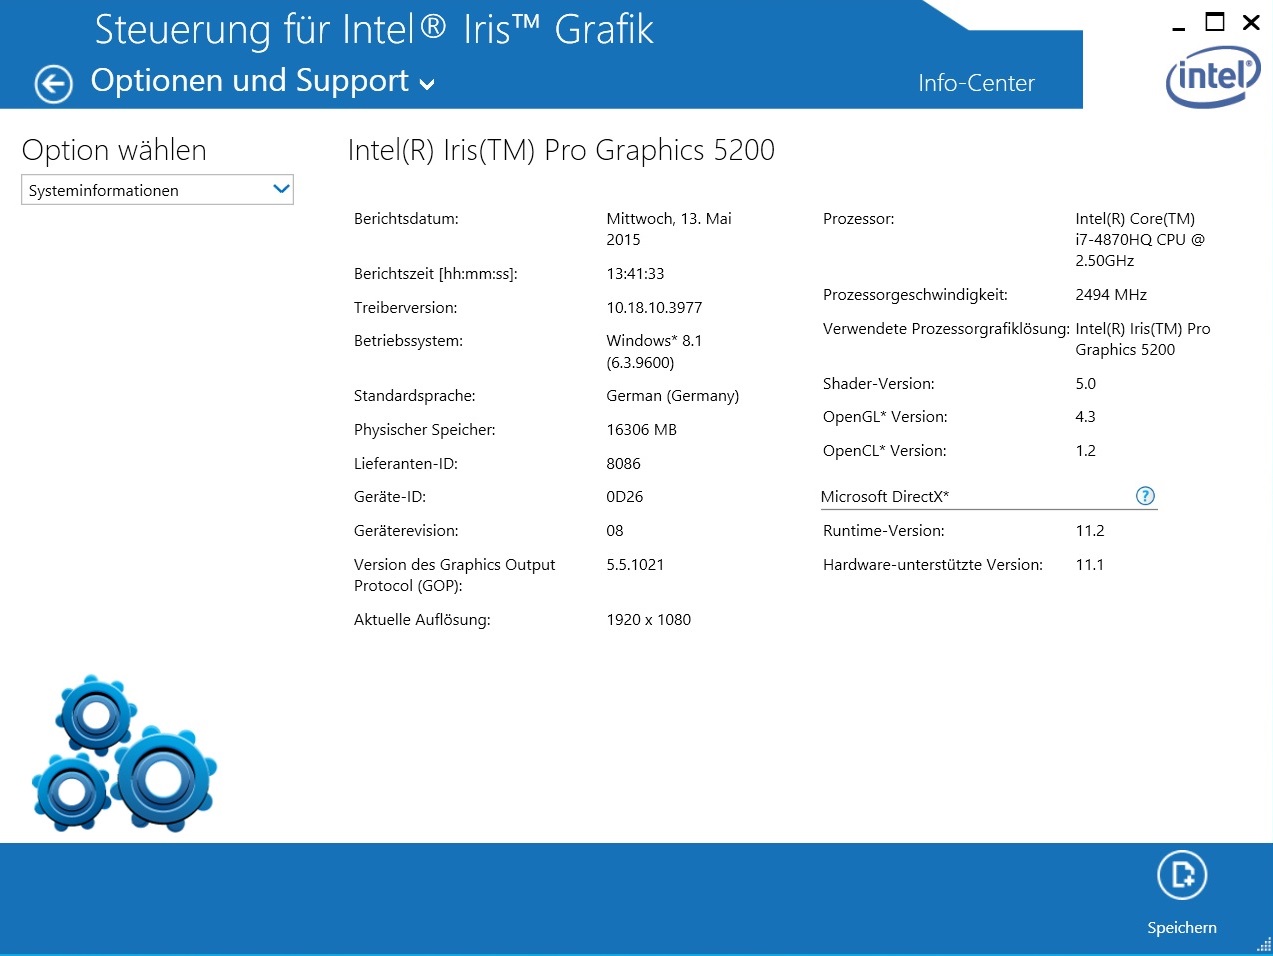
With the Nvidia card, we could not complain about graphics errors, but Assassin's Creed Unity neither ran on the GeForce GTX 970 nor on the Iris Pro 5200 without crashes. We assume that this is caused by an old driver (Intel 10.18.10.3977, Nvidia ForceWare 344.11). Speaking of drivers: There are many graphics errors when using the Iris Pro 5200, since Intel's driver development still has to catch up compared to Nvidia's.
| GTA V | |
| 3840x2160 High/On (Advanced Graphics Off) AA:FX AF:8x (sort by value) | |
| MSI GamingDock | |
| 1920x1080 Highest AA:4xMSAA + FX AF:16x (sort by value) | |
| MSI GS30 Shadow | |
| MSI GamingDock | |
| 1920x1080 High/On (Advanced Graphics Off) AA:2xMSAA + FX AF:8x (sort by value) | |
| MSI GS30 Shadow | |
| MSI GamingDock | |
| 1366x768 Normal/Off AF:4x (sort by value) | |
| MSI GS30 Shadow | |
| MSI GamingDock | |
| 1024x768 Lowest Settings possible (sort by value) | |
| MSI GS30 Shadow | |
| MSI GamingDock | |
| Battlefield Hardline | |
| 1920x1080 Ultra Graphics Quality (DX11) AA:4x MS (sort by value) | |
| MSI GS30 Shadow | |
| Schenker XMG A305 | |
| Schenker XMG C405 | |
| MSI GamingDock | |
| 1920x1080 High Graphics Quality (DX11) (sort by value) | |
| MSI GS30 Shadow | |
| Schenker XMG A305 | |
| Schenker XMG C405 | |
| MSI GamingDock | |
| 1366x768 Medium Graphics Quality (DX11) (sort by value) | |
| MSI GS30 Shadow | |
| Schenker XMG A305 | |
| Schenker XMG C405 | |
| MSI GamingDock | |
| 1024x768 Low Graphics Quality (DX11) (sort by value) | |
| MSI GS30 Shadow | |
| Schenker XMG A305 | |
| Schenker XMG C405 | |
| MSI GamingDock | |
| Dragon Age: Inquisition | |
| 1920x1080 Ultra Graphics Quality AA:2x MS (sort by value) | |
| MSI GS30 Shadow | |
| Alienware 13 | |
| MSI GamingDock | |
| 1920x1080 High Graphics Quality (sort by value) | |
| MSI GS30 Shadow | |
| Alienware 13 | |
| MSI GamingDock | |
| 1366x768 Medium Graphics Quality (sort by value) | |
| MSI GS30 Shadow | |
| Alienware 13 | |
| MSI GamingDock | |
| 1024x768 Low Graphics Quality (sort by value) | |
| MSI GS30 Shadow | |
| Alienware 13 | |
| MSI GamingDock | |
| Far Cry 4 | |
| 1920x1080 Ultra Graphics Quality AA:SM (sort by value) | |
| MSI GS30 Shadow | |
| Alienware 13 | |
| Schenker XMG A305 | |
| MSI GamingDock | |
| 1920x1080 High Graphics Quality AA:SM (sort by value) | |
| MSI GS30 Shadow | |
| Alienware 13 | |
| Schenker XMG A305 | |
| MSI GamingDock | |
| 1366x768 Medium Graphics Quality (sort by value) | |
| MSI GS30 Shadow | |
| Alienware 13 | |
| Schenker XMG A305 | |
| MSI GamingDock | |
| 1024x768 Low Graphics Quality (sort by value) | |
| MSI GS30 Shadow | |
| Alienware 13 | |
| Schenker XMG A305 | |
| MSI GamingDock | |
| Fifa 15 | |
| 3840x2160 High Preset (sort by value) | |
| MSI GamingDock | |
| 1920x1080 High Preset AA:4x MS (sort by value) | |
| MSI GS30 Shadow | |
| Alienware 13 | |
| Schenker XMG A305 | |
| MSI GamingDock | |
| 1366x768 High Preset AA:2x MS (sort by value) | |
| MSI GS30 Shadow | |
| Alienware 13 | |
| Schenker XMG A305 | |
| MSI GamingDock | |
| 1280x720 Low Preset (sort by value) | |
| MSI GS30 Shadow | |
| Alienware 13 | |
| Schenker XMG A305 | |
| MSI GamingDock | |
| Sims 4 | |
| 1920x1080 Ultra Preset (sort by value) | |
| MSI GS30 Shadow | |
| Alienware 13 | |
| Schenker XMG A305 | |
| MSI GamingDock | |
| 1920x1080 High Preset (sort by value) | |
| MSI GS30 Shadow | |
| Alienware 13 | |
| Schenker XMG A305 | |
| MSI GamingDock | |
| 1366x768 Medium Preset (sort by value) | |
| MSI GS30 Shadow | |
| Alienware 13 | |
| Schenker XMG A305 | |
| MSI GamingDock | |
| 1024x768 Low Preset (sort by value) | |
| MSI GS30 Shadow | |
| Alienware 13 | |
| Schenker XMG A305 | |
| MSI GamingDock | |
| Watch Dogs | |
| 1920x1080 Ultra Overall Quality, Ultra Textures AA:4x MS (sort by value) | |
| MSI GS30 Shadow | |
| Schenker XMG A305 | |
| MSI GamingDock | |
| 1920x1080 High Overall Quality, High Textures AA:2x MS (sort by value) | |
| MSI GS30 Shadow | |
| Schenker XMG A305 | |
| MSI GamingDock | |
| 1366x768 Medium Overall Quality, Medium Textures (sort by value) | |
| MSI GS30 Shadow | |
| Schenker XMG A305 | |
| MSI GamingDock | |
| 1024x768 Low Overall Quality, Medium Textures (sort by value) | |
| MSI GS30 Shadow | |
| Schenker XMG A305 | |
| MSI GamingDock | |
| Crysis 3 | |
| 1920x1080 Very High Preset AA:2xSM AF:16x (sort by value) | |
| MSI GS30 Shadow | |
| Schenker S413 | |
| MSI GamingDock | |
| 1366x768 High Preset AA:FX AF:16x (sort by value) | |
| MSI GS30 Shadow | |
| Schenker S413 | |
| MSI GamingDock | |
| 1366x768 Medium Preset AF:16x (sort by value) | |
| MSI GS30 Shadow | |
| Schenker S413 | |
| MSI GamingDock | |
| 1024x768 Low Preset (sort by value) | |
| MSI GS30 Shadow | |
| Schenker S413 | |
| MSI GamingDock | |
Emissions
To be fair, we will not compare the emissions with Optimus notebooks, but only with the Schenker S413, which also uses a Core i7-4870HQ with Iris Pro 5200.
System Noise
Unless our test model is defective, the fan control of the GS30 is suboptimal to put it mildly. Although the fan often stands still while idle, it produces quite a high-frequency, disturbing noise when it is active, which increases from 36 to above 40 dB(A) in low-load scenarios. During 3D applications, the GS30 even exceeds the 50 dB level. So, it is definitely not suitable for noise-sensitive users. The similarly thin Schenker S413 is quieter while idle (~30-33 dB) and in 3D mode (~46-47 dB). We urgently recommend that MSI checks the cooling again. For now, the fan behavior appears to be very annoying to us.
Noise level
| Idle |
| 29.4 / 36.2 / 42 dB(A) |
| Load |
| 52.8 / 53.6 dB(A) |
 | ||
30 dB silent 40 dB(A) audible 50 dB(A) loud |
||
min: | ||
| MSI GS30 Shadow Iris Pro Graphics 5200, 4870HQ | Schenker S413 Iris Pro Graphics 5200, 4750HQ | Alienware 13 GeForce GTX 860M, 4210U | Schenker XMG A305 GeForce GTX 960M, 4710MQ | Schenker XMG C405 GeForce GTX 965M, 4720HQ | Razer Blade 14 2015 GeForce GTX 970M, 4720HQ | |
|---|---|---|---|---|---|---|
| Noise | 12% | 17% | 10% | 2% | 11% | |
| Idle Minimum * (dB) | 29.4 | 30.1 -2% | 29.2 1% | 29.4 -0% | 29.2 1% | 29.7 -1% |
| Idle Average * (dB) | 36.2 | 30.7 15% | 29.4 19% | 30.1 17% | 34.6 4% | 29.9 17% |
| Idle Maximum * (dB) | 42 | 33.3 21% | 29.8 29% | 30.8 27% | 38.8 8% | 30 29% |
| Load Average * (dB) | 52.8 | 46.4 12% | 37.6 29% | 49.2 7% | 54 -2% | 42.1 20% |
| Load Maximum * (dB) | 53.6 | 46.7 13% | 50.8 5% | 53.8 -0% | 54.4 -1% | 59 -10% |
* ... smaller is better
Temperature
We cannot complain that much about the temperatures. Although you should not place the GS30 on your lap while gaming (maximum of 53 °C in the rear third), the palm rests only reach a maximum of 33 °C after one hour of full load. While idle, the whole chassis feels quite cool to the touch, whereas the Schenker S413 remains a few degrees cooler (also in 3D mode).
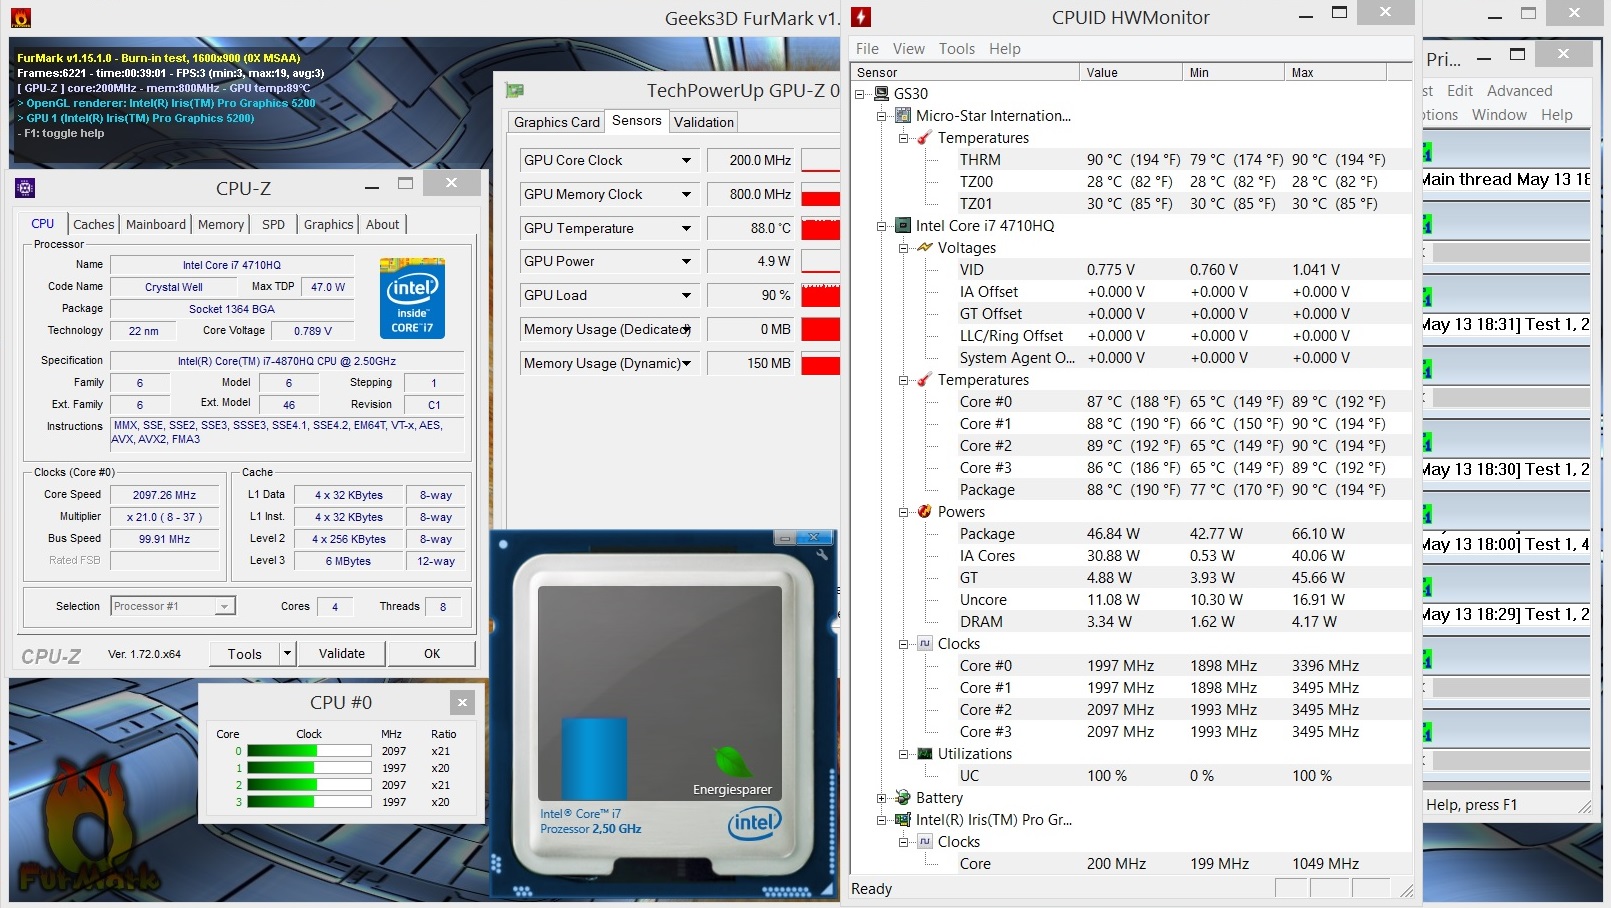
Especially the cooling of the inner components showed weaknesses. Although CPU (~2.0 GHz) and graphics chip (~200 MHz) throttle heavily during our stress test with Furmark and Prime95, the temperature of the Core i7-4870HQ increases to just under 90 °C. Without throttling the temperatures would probably reach 100 °C or higher.
(-) The maximum temperature on the upper side is 49.8 °C / 122 F, compared to the average of 40.4 °C / 105 F, ranging from 21.2 to 68.8 °C for the class Gaming.
(-) The bottom heats up to a maximum of 52.5 °C / 127 F, compared to the average of 43.3 °C / 110 F
(±) In idle usage, the average temperature for the upper side is 33 °C / 91 F, compared to the device average of 33.9 °C / 93 F.
(+) The palmrests and touchpad are reaching skin temperature as a maximum (32.6 °C / 90.7 F) and are therefore not hot.
(-) The average temperature of the palmrest area of similar devices was 28.9 °C / 84 F (-3.7 °C / -6.7 F).
| MSI GS30 Shadow Iris Pro Graphics 5200, 4870HQ | Schenker S413 Iris Pro Graphics 5200, 4750HQ | Alienware 13 GeForce GTX 860M, 4210U | Schenker XMG A305 GeForce GTX 960M, 4710MQ | Schenker XMG C405 GeForce GTX 965M, 4720HQ | Razer Blade 14 2015 GeForce GTX 970M, 4720HQ | |
|---|---|---|---|---|---|---|
| Heat | 4% | 8% | 3% | -10% | 9% | |
| Maximum Upper Side * (°C) | 49.8 | 41.9 16% | 44.5 11% | 46.2 7% | 47.8 4% | 51.6 -4% |
| Maximum Bottom * (°C) | 52.5 | 54.6 -4% | 60.2 -15% | 47.7 9% | 60.4 -15% | 51.2 2% |
| Idle Upper Side * (°C) | 35.2 | 34.2 3% | 29.4 16% | 35 1% | 37.7 -7% | 29.2 17% |
| Idle Bottom * (°C) | 36.8 | 36.7 -0% | 29.6 20% | 38.2 -4% | 44.8 -22% | 28.8 22% |
* ... smaller is better
Speakers
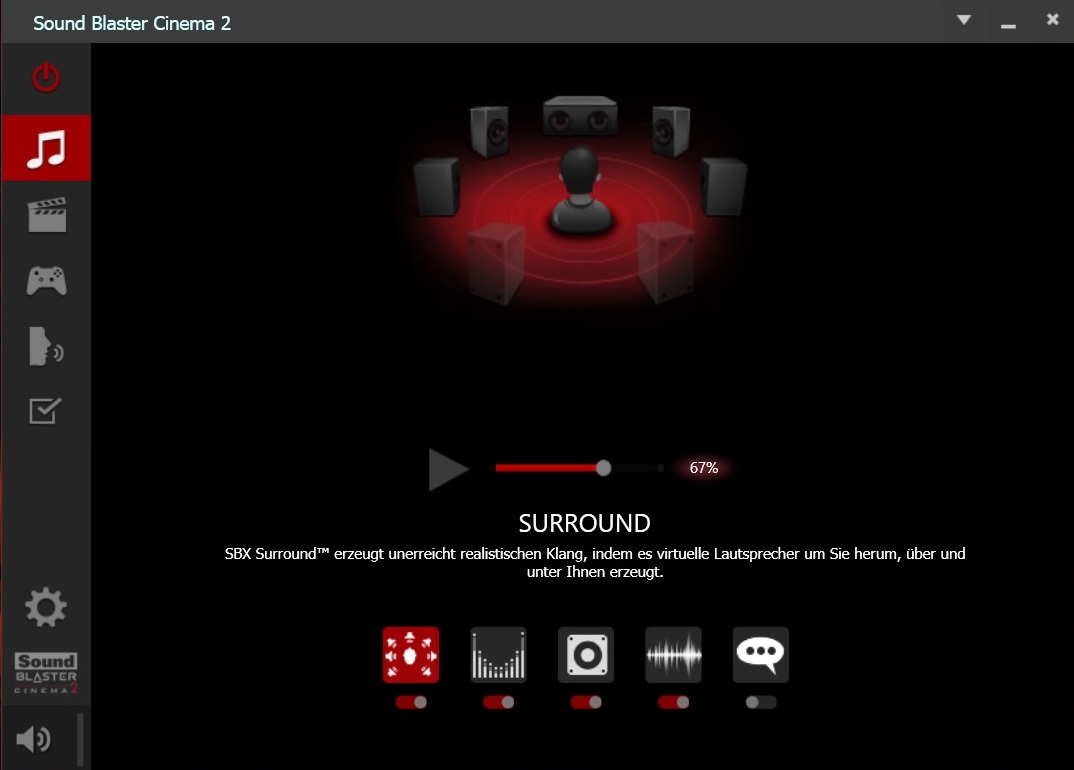
Considering that the available space is small, MSI gets a lot from the sound system. The GS30 features two stereo speakers in the front part of the underside, which deliver an acceptable sound for on-the-move. This is not surprising, since the Sound Blaster Cinema 2 technology from the sound experts Creative is on board. However, you should not expect a top experience. Neither precision nor volume nor bass can keep up with a hi-fi system or a good headset.
Energy Management
Power Consumption
The power consumption is not throughout convincing. Yes, many notebooks can only dream of 7.5 to 21.2 Watt while idle; however, the GS30 only houses a processor chip and does not feature a dedicated GPU. Just under 66 Watt is not especially low for the offered performance, since the Turbo of processor and graphics unit is often inactive or falls behind its potential. Furthermore, it seems that the power adapter is dangerously small. All things considered, we would say that the energy management of the MSI G30 was mediocre. Conventional gaming notebooks usually need significantly more energy. We did not test the power-hunger of the GamingDock.
| Off / Standby | |
| Idle | |
| Load |
|
Key:
min: | |
| MSI GS30 Shadow Iris Pro Graphics 5200, 4870HQ | Schenker S413 Iris Pro Graphics 5200, 4750HQ | Alienware 13 GeForce GTX 860M, 4210U | Schenker XMG A305 GeForce GTX 960M, 4710MQ | Schenker XMG C405 GeForce GTX 965M, 4720HQ | Razer Blade 14 2015 GeForce GTX 970M, 4720HQ | |
|---|---|---|---|---|---|---|
| Power Consumption | -13% | 19% | -49% | -86% | ||
| Idle Minimum * (Watt) | 7.5 | 10.1 -35% | 5.1 32% | 11.4 -52% | 15.8 -111% | |
| Idle Average * (Watt) | 11.6 | 14.9 -28% | 7.3 37% | 16.3 -41% | 22.8 -97% | |
| Idle Maximum * (Watt) | 21.2 | 15.4 27% | 11.2 47% | 22.6 -7% | 27.3 -29% | |
| Load Average * (Watt) | 65.4 | 73 -12% | 51.5 21% | 92.4 -41% | 106.8 -63% | |
| Load Maximum * (Watt) | 66.4 | 78.3 -18% | 92.9 -40% | 136 -105% | 152 -129% |
* ... smaller is better
Battery Life
The battery life of a laptop not only depends on the incorporated hardware but also to a large extent on the capacity of the battery. The lithium-polymer model of the GS30 is relatively weak with 4-cells. This gets apparent in comparison with other notebooks with higher energy demand. The GS30 achieves just under 50 minutes during 3D use (Battery Eater's Classic test, maximum display brightness). The competitors perform between 38% (66 minutes @Razer Blade 14) and 179% (134 minutes @Alienware 13) better.
While idle (Battery Eater's Reader's test, minimum display brightness), the GS30 can substantially catch up with almost 7 hours and ranks mid-range among the contenders. During playback of an HD video in H.264-format, the 13-incher lasts 2 hours and 46 minutes. The WLAN test ends after 3.5 hours with medium brightness.
| MSI GS30 Shadow Iris Pro Graphics 5200, 4870HQ | Schenker S413 Iris Pro Graphics 5200, 4750HQ | Alienware 13 GeForce GTX 860M, 4210U | Schenker XMG A305 GeForce GTX 960M, 4710MQ | Schenker XMG C405 GeForce GTX 965M, 4720HQ | Razer Blade 14 2015 GeForce GTX 970M, 4720HQ | |
|---|---|---|---|---|---|---|
| Battery runtime | 46% | 97% | 66% | 16% | ||
| Reader / Idle (h) | 6.7 | 6 -10% | 12.1 81% | 7 4% | 6.3 -6% | |
| H.264 (h) | 2.8 | 5.4 93% | 4.4 57% | |||
| WiFi (h) | 3.5 | 4.3 23% | 4.9 40% | |||
| Load (h) | 0.8 | 1.8 125% | 2.2 175% | 1.9 138% | 1.1 38% | |
| WiFi v1.3 (h) | 3.9 | 3.7 |
Pros
Cons
Verdict

Apart from Alienware, MSI belongs to the few gaming companies which have the courage to offer a notebook with optional graphics amplifier. However, the risky concept was implemented quite well. Due to the hot-headed Core i7-4870HQ, the notebook can already get quite loud while idle, which might discourage many customers from buying. Not to mention the fact that the Turbo is hardly used under load. In addition, the stability of the case, the battery life, the ClickPad and the connectivity are not the best.
Otherwise, MSI did many things right. Regardless whether design, display or the use of the docking station: the GS30 achieves a good rating in most aspects. With the desktop GPU, the 13-incher turns into a powerful gaming platform, which can run all the latest games even in high settings and resolutions without stuttering.
It is difficult for us to categorize such a system. Actually the G30 should be considered a subnotebook because of its integrated Iris Pro 5200, but this does not live up to its concept. Finally, we decided to put the test model into the "gaming" category, since you do not need to buy the graphics card of the docking station separately.
With the benchmarks results of the GeForce GTX 970, the gaming performance would be 100% instead of 84% (Iris Pro 5200), and the total rating would increase by 3%. We manually added this 3% in our rating table. Without the GamingDock the rating would only be 79% instead of 82%.
Please let us know in a comment whether you believe this procedure is appropriate or we should evaluate such systems differently in the future.
MSI GS30 Shadow
- 05/17/2015 v4 (old)
Florian Glaser
Price comparison
