MSI GS70 6QE Stealth Pro Notebook Review
For the original German review, see here.
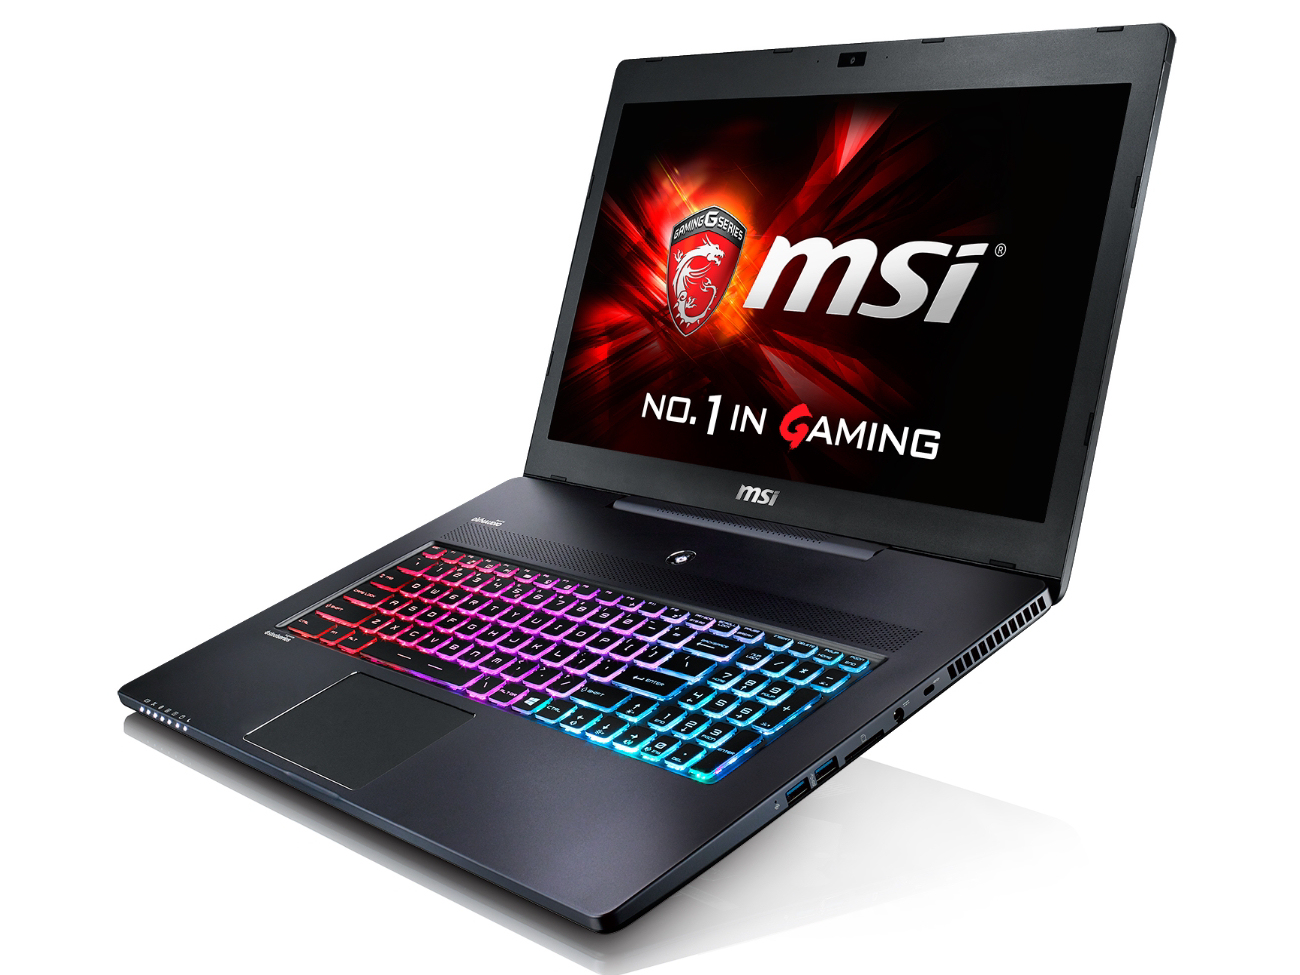
The MSI GS70-6QE16H21 is a thin gaming notebook with a 17.3-inch display. Above all, the configuration set before us is an upgrade from Haswell to Skylake. We reviewed the Haswell model earlier this year. Does MSI make an attractive offer with this new device? Read on to find out.
The GS70's competition includes computers like the Schenker XMG A706, the Medion Erazer X7615, the Acer Aspire VN7-791G and the Lenovo Y70.
Because the two MSI GS70 models are structurally identical, we won't cover the case, connectivity features, input devices, display or speakers in detail. We will, of course, expound on any differences between the two notebooks. Comprehensive information on the aforementioned subjects is available in our review of the MSI GS70-2QE16SR51.
Changes
The new Skylake processor isn't the only innovation to have found its way into the new GS70. The Haswell GS70 we reviewed had two mSATA SSD slots. When filled, the two SSDs could be used together as a RAID system. The Skylake GS70 comes without mSATA slots. Instead, there is just one M.2 slot connected via PCI Express x4 (NVMe). If the slot is filled with an SSD that supports PCIe, the transfer rates reach the same level as the RAID 0 system in the Haswell GS70. The SSD installed in our test device doesn't support this quick data transfer.
MSI also made some changes to the notebook's external connections: Two of the Haswell GS70's four USB 3.0 ports have been replaced by USB 3.1 ports. However, the company has yet to adopt the new Type-C format; the ports are still the familiar Type-A.
Recently, we started testing memory card readers on laptops. As a result, we have some new information about the GS70's performance: When copying large blocks of data, the device reaches a maximum transfer rate of 188 MB/s. The notebook transferred 250 .jpg image files (each around 5 MB) at a speed of about 161 MB/s. Our reference SD card for transfer rate tests is always the Toshiba Exceria Pro SDXC 64 GB UHS-II.
Display
The GS70 is outfitted with the same 17.3-inch display as the Haswell model we reviewed in January. Even so, the Skylake GS70's contrast and brightness prove to be considerably worse. The preinstalled color profile is responsible for this discrepancy. A brightness value of 161 cd/m² and contrast ratio of 662:1 are too low for a notebook that costs 2000 Euros (~$2148).
| |||||||||||||||||||||||||
Brightness Distribution: 85 %
Center on Battery: 172 cd/m²
Contrast: 662:1 (Black: 0.26 cd/m²)
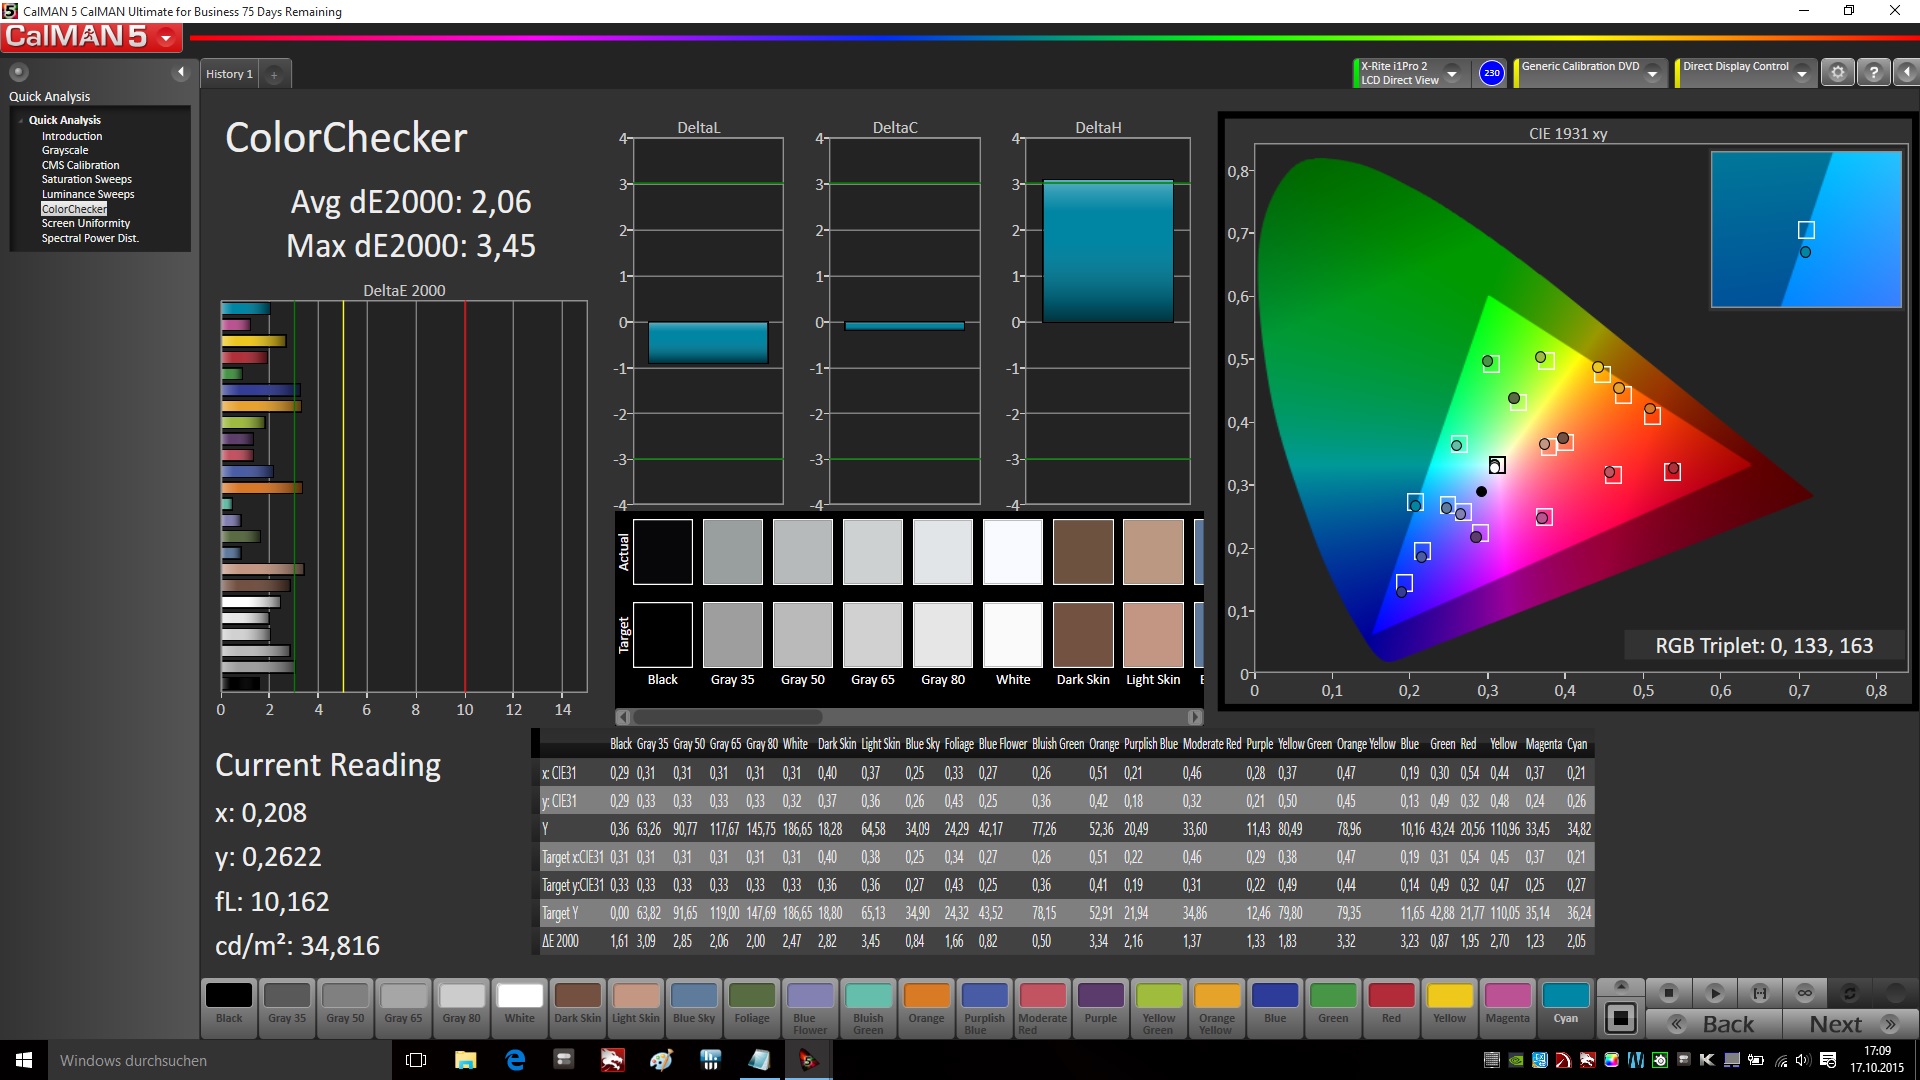
ΔE ColorChecker Calman: 2.06 | ∀{0.5-29.43 Ø4.73}
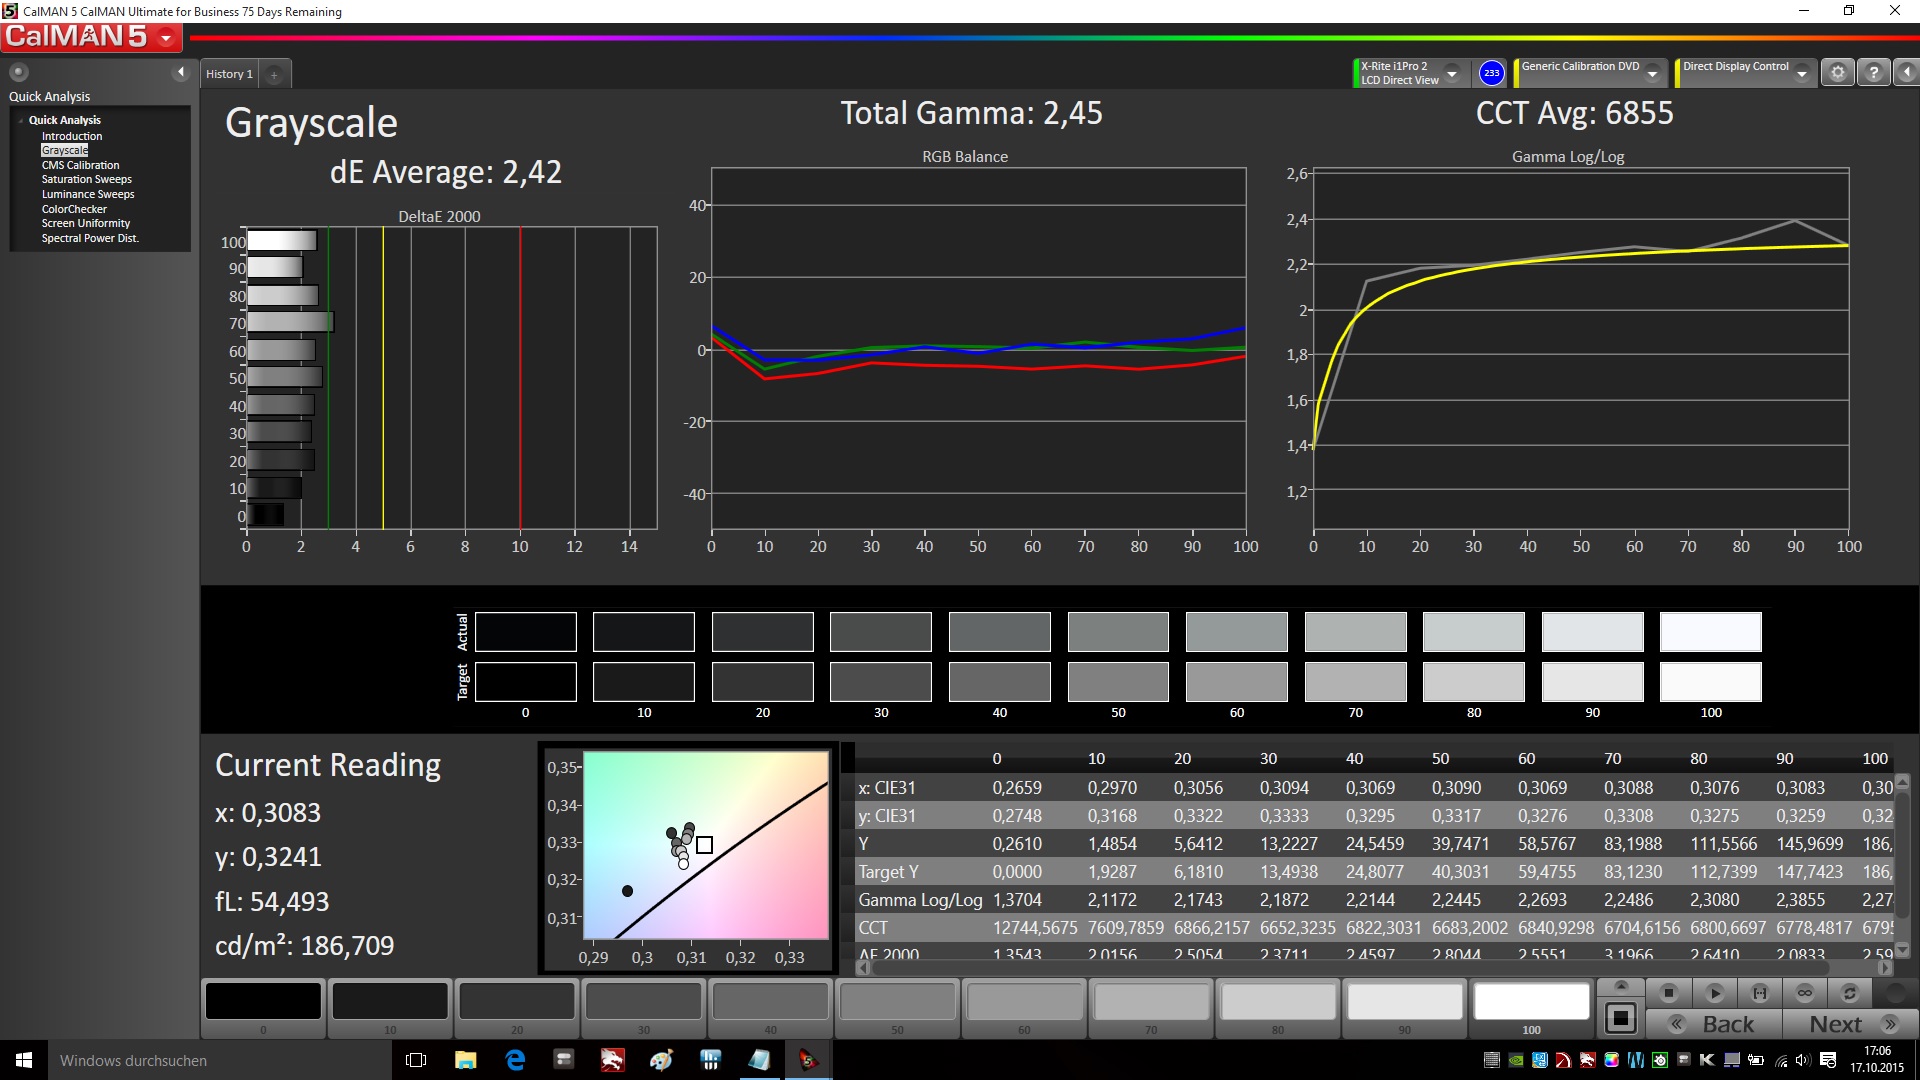
ΔE Greyscale Calman: 2.42 | ∀{0.09-98 Ø4.98}
97% sRGB (Argyll 1.6.3 3D)
62% AdobeRGB 1998 (Argyll 1.6.3 3D)
67.6% AdobeRGB 1998 (Argyll 3D)
97.3% sRGB (Argyll 3D)
67% Display P3 (Argyll 3D)
Gamma: 2.45
CCT: 6855 K
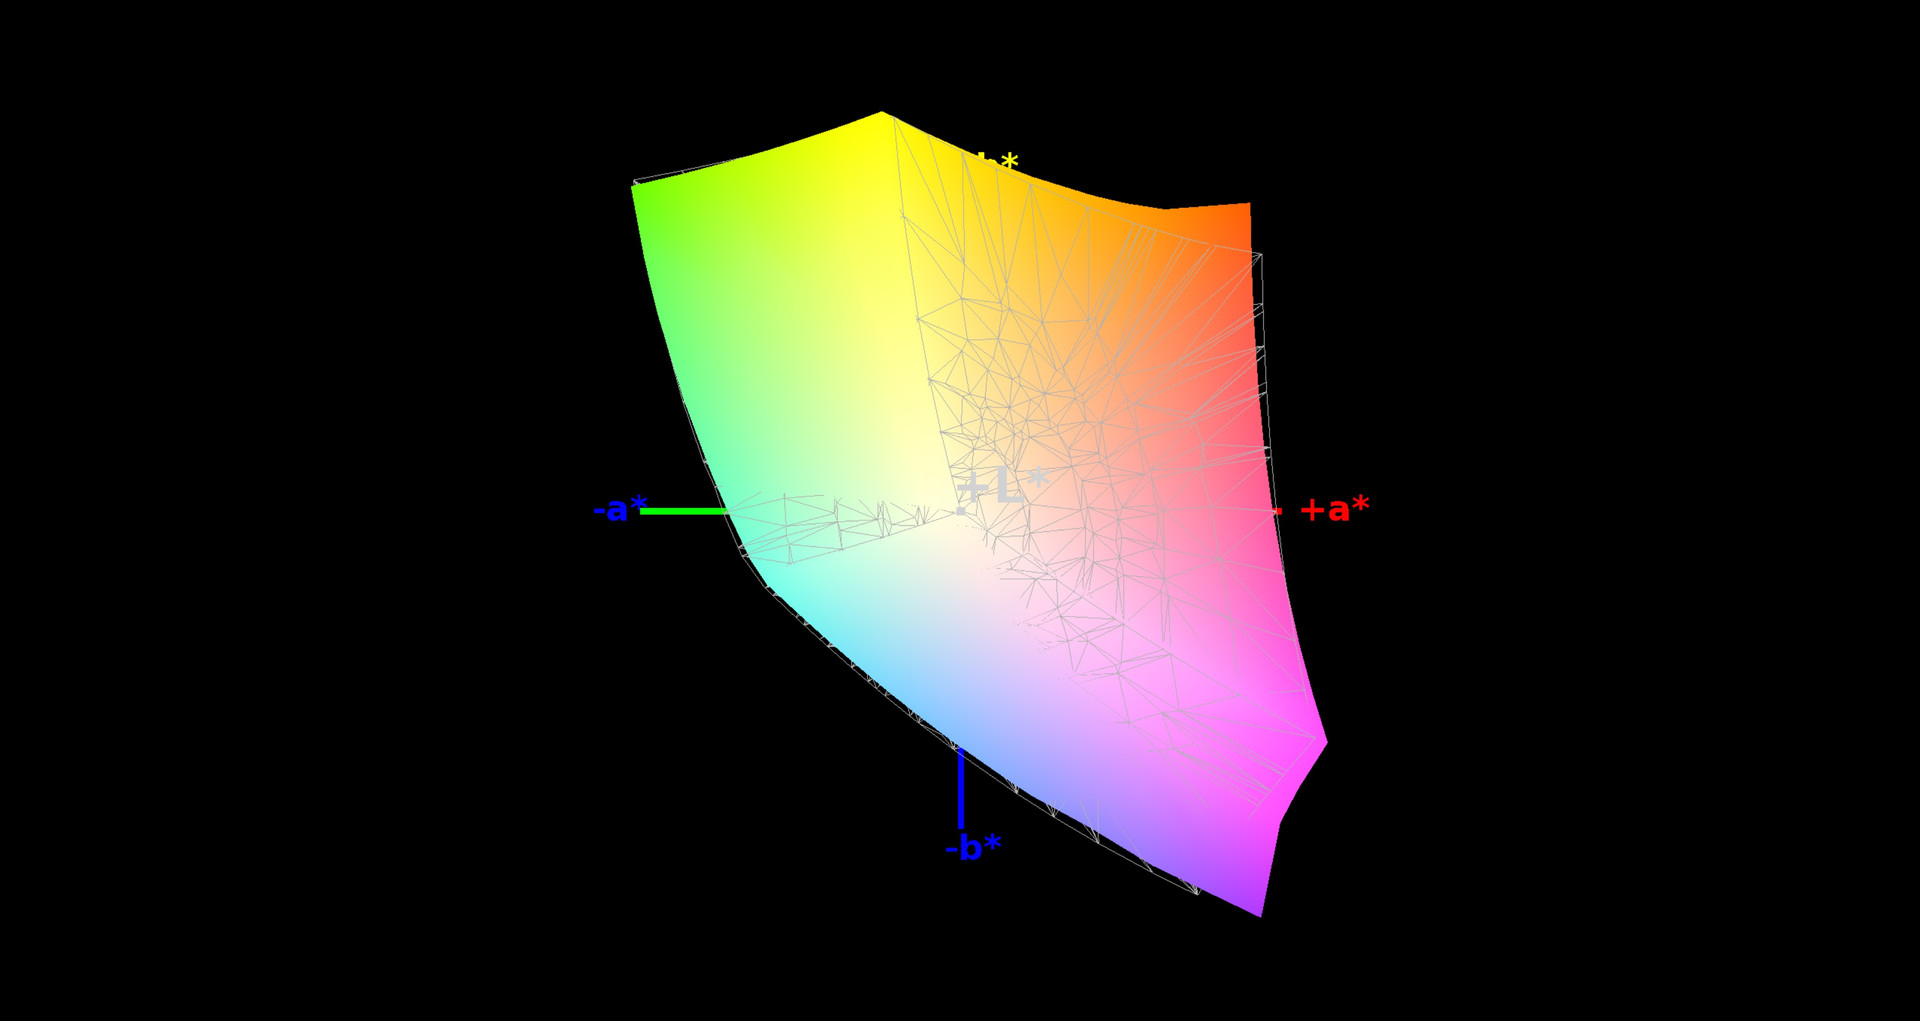
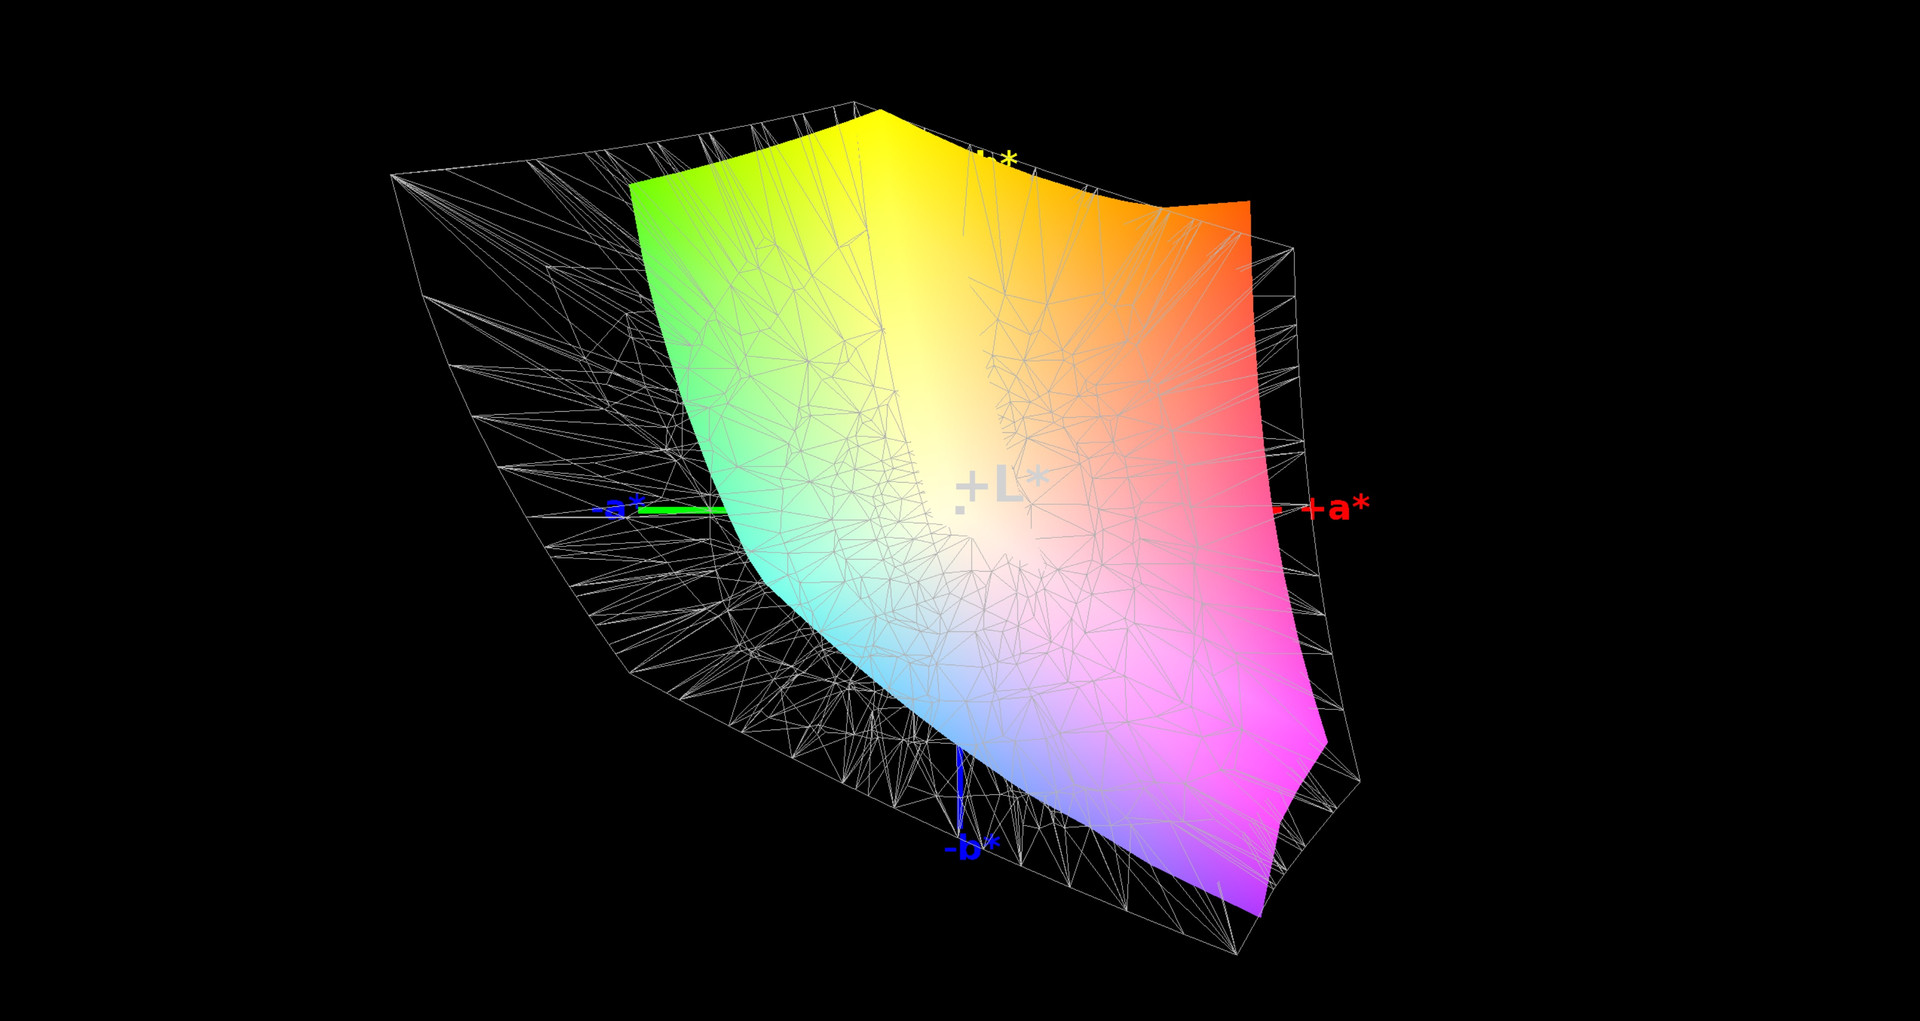
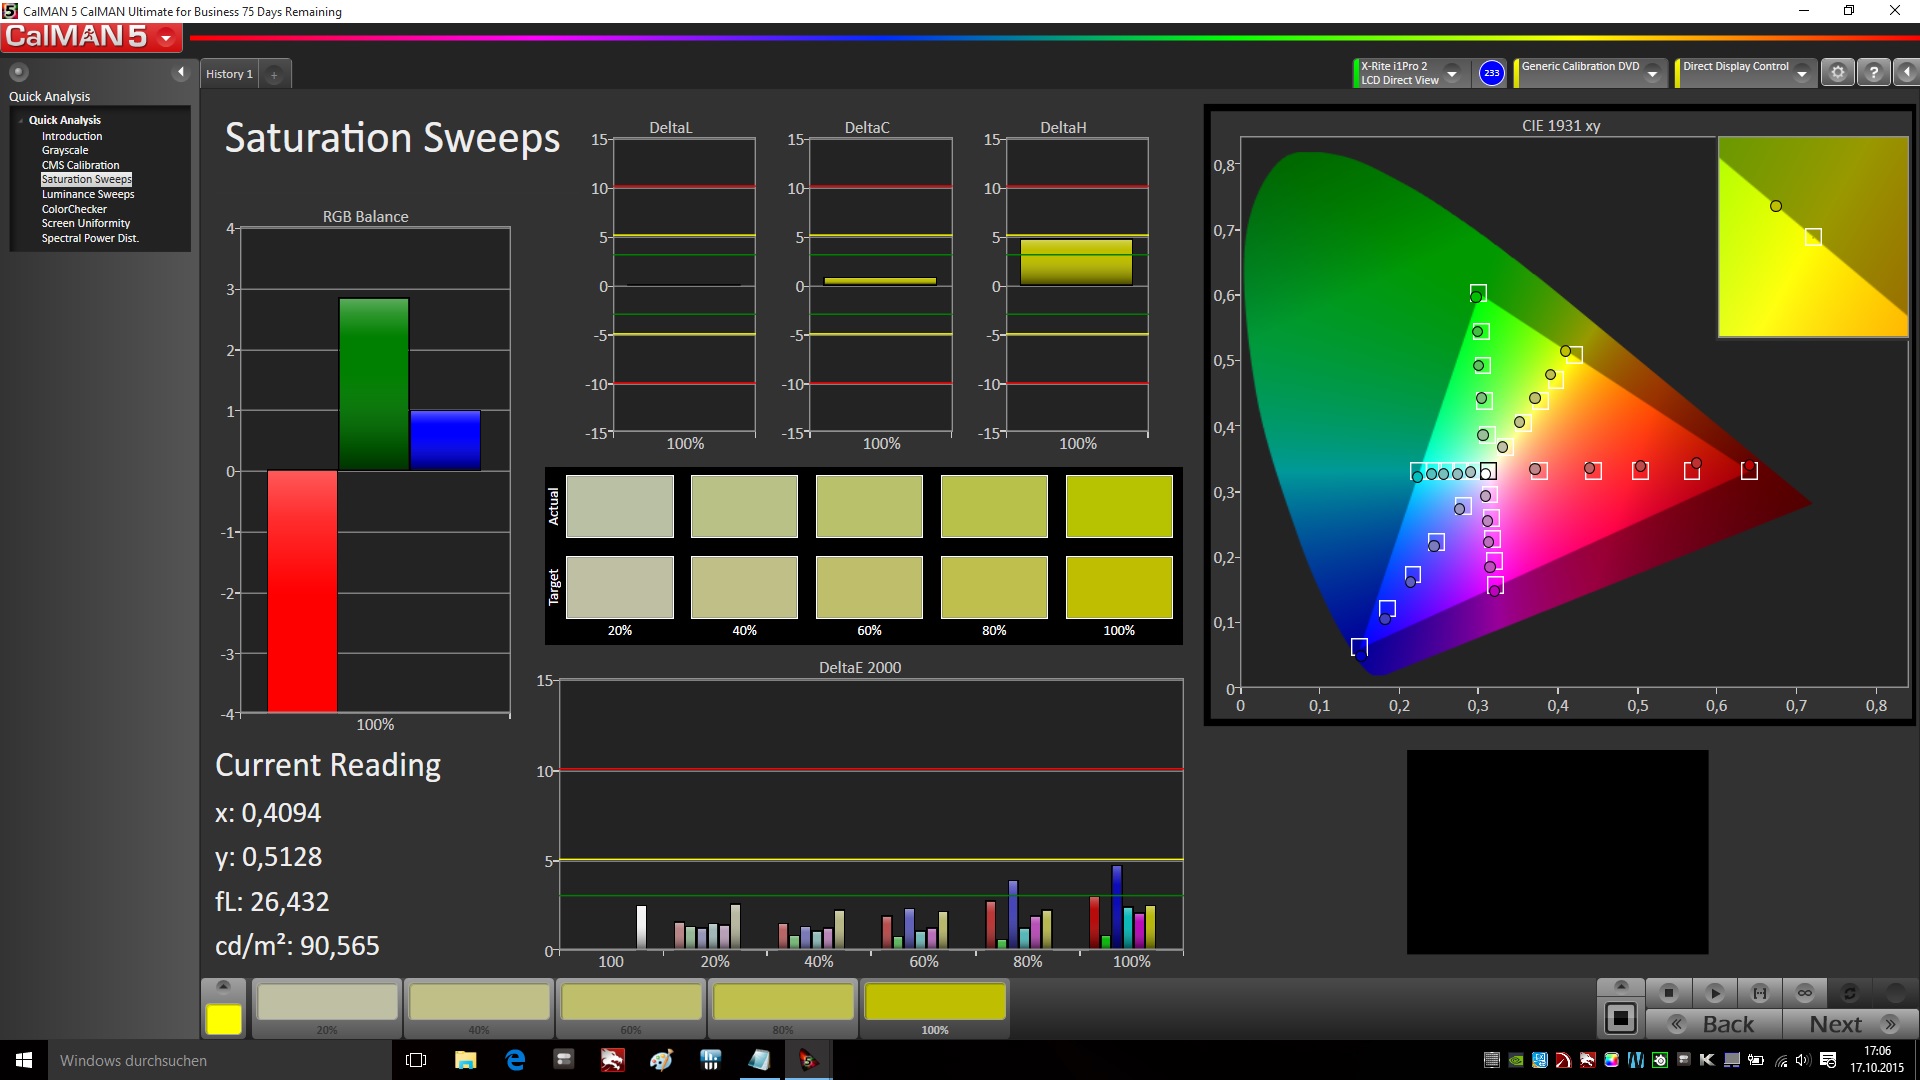
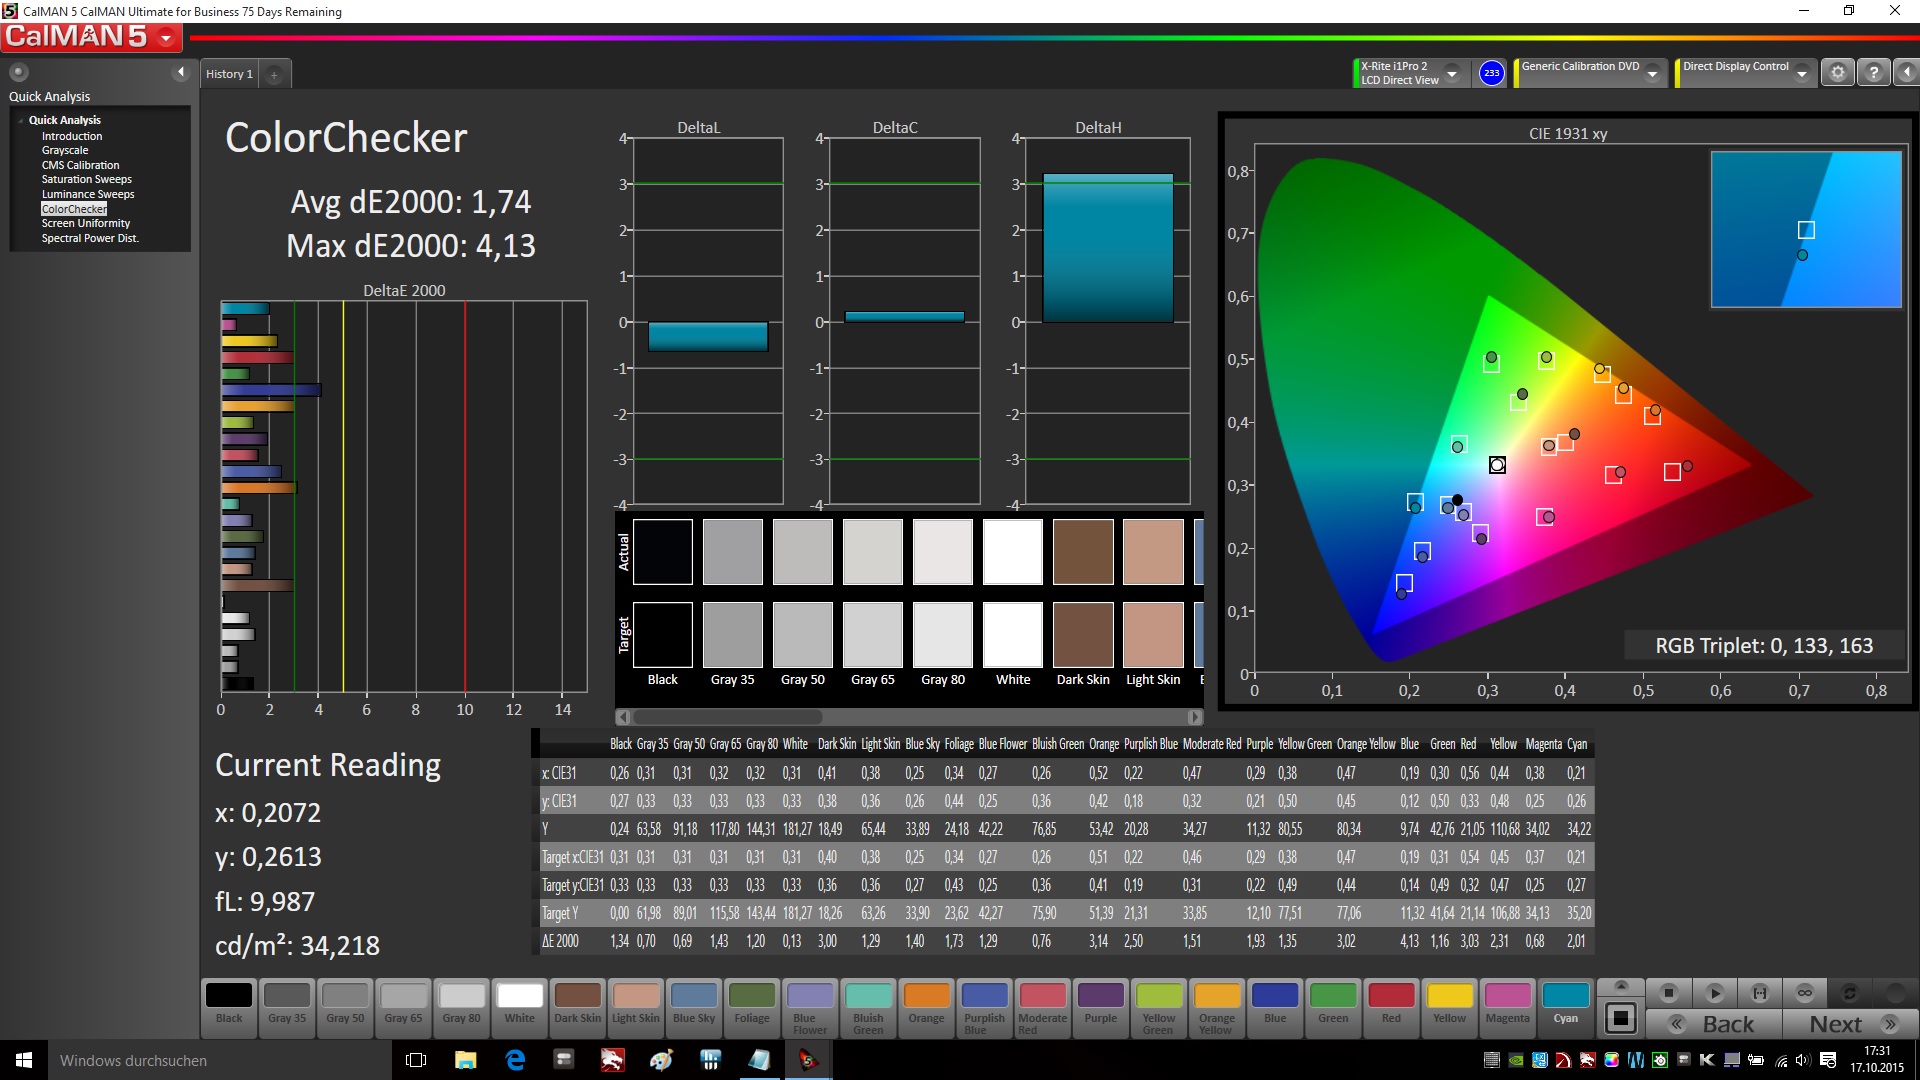
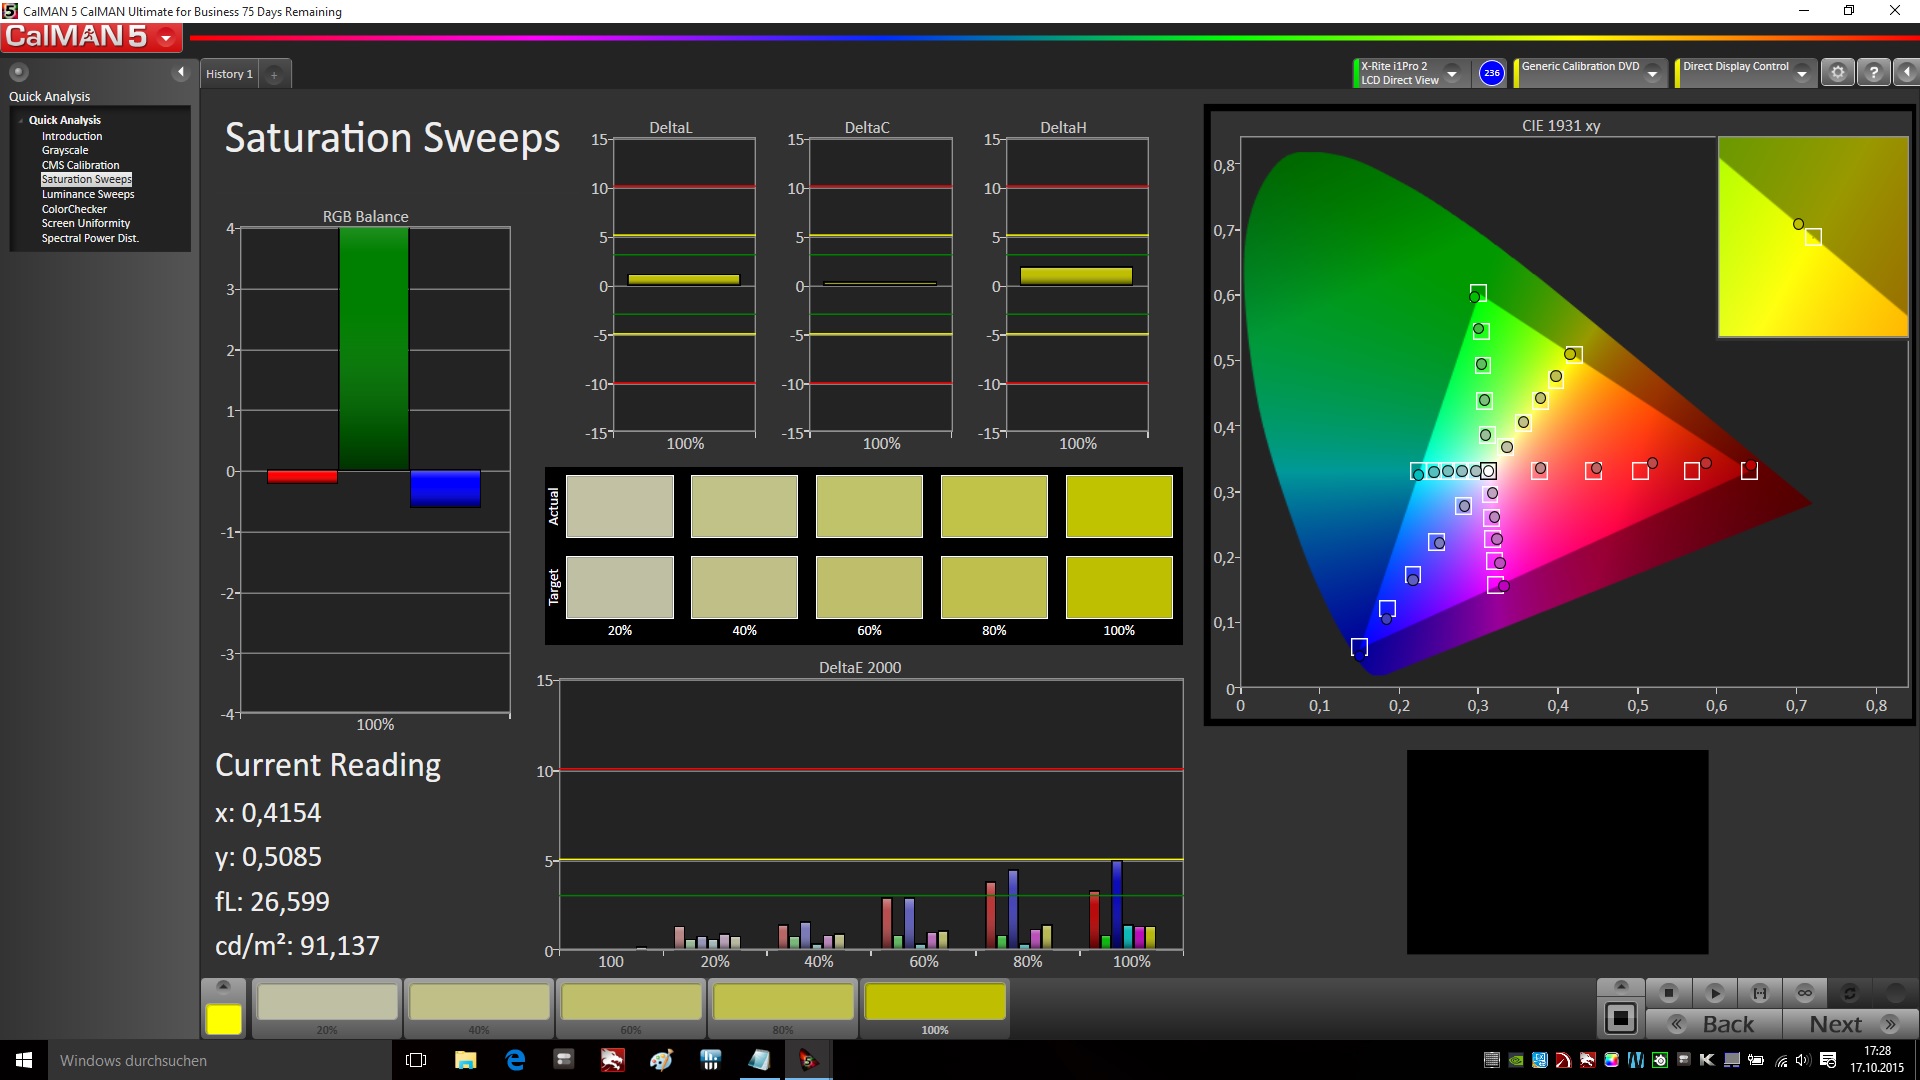
The display is incapable of reproducing the AdobeRGB color space. In regards to the sRGB color space, it fails only by a few percent. The coverage rates come to 62% (AdobeRGB) and 97% (sRGB). The display's color representation is good, even straight out of the factory. The panel shows a fully acceptable color deviation of just 2.06 (Delta E 2000 < 3). The grayscale is also well-balanced. The screen isn't plagued with a blue cast. When calibrated, the monitor's results only improve marginally.
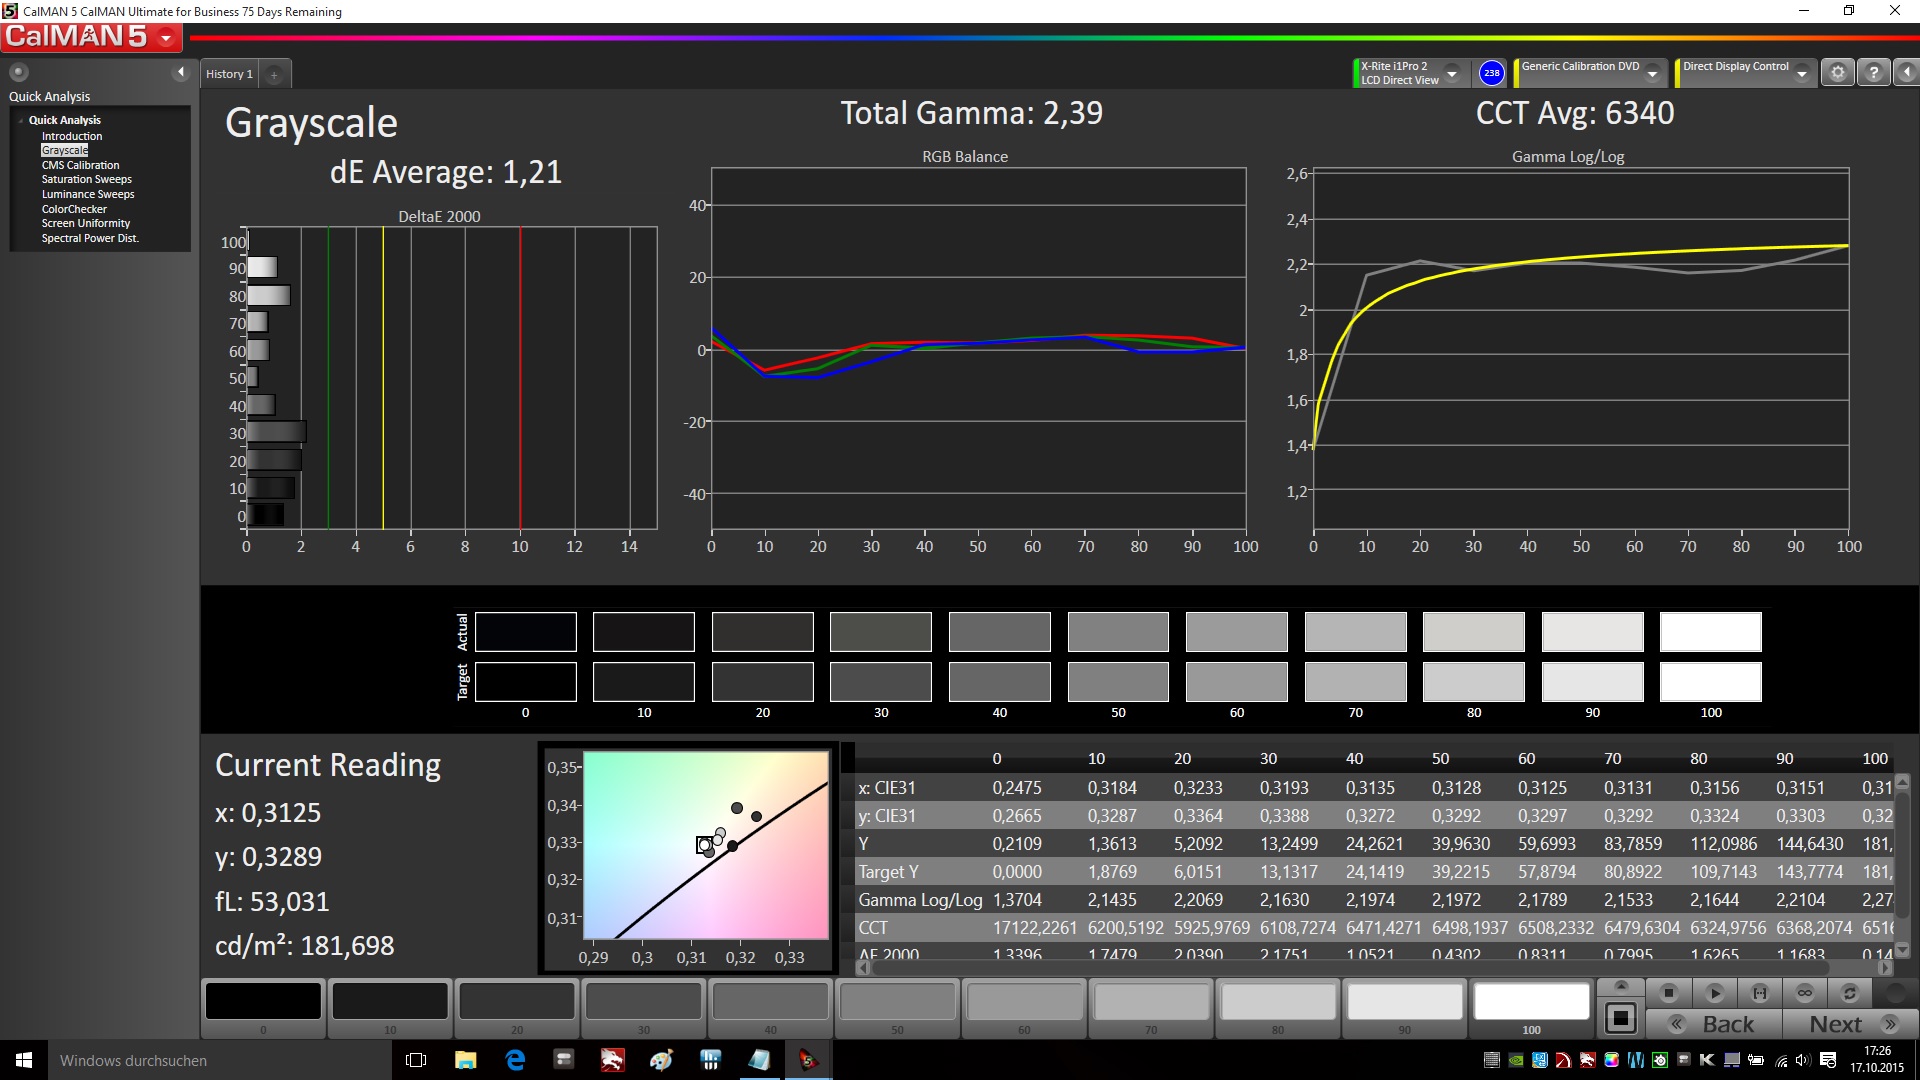
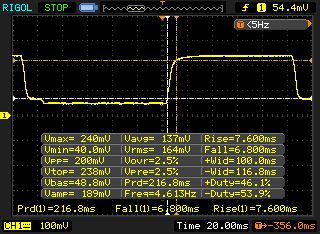
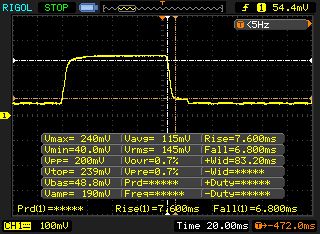
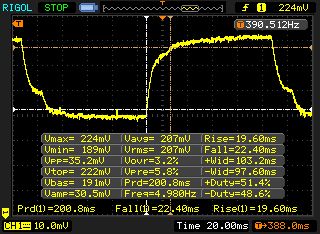
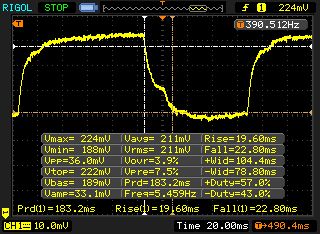
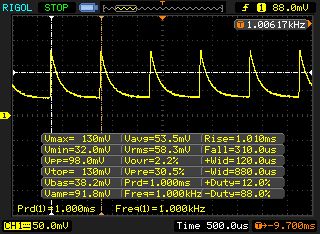
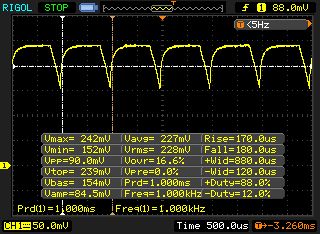
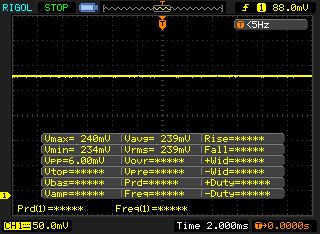
The panel's brightness is regulated via pulse-width modulation (PWM). Only at full brightness does the measurement diagram lack evidence of PWM - at all lower brightness levels, PWM is clearly recognizable. The frequency lies at 1000 kHz. As a result, the display image doesn't flicker.
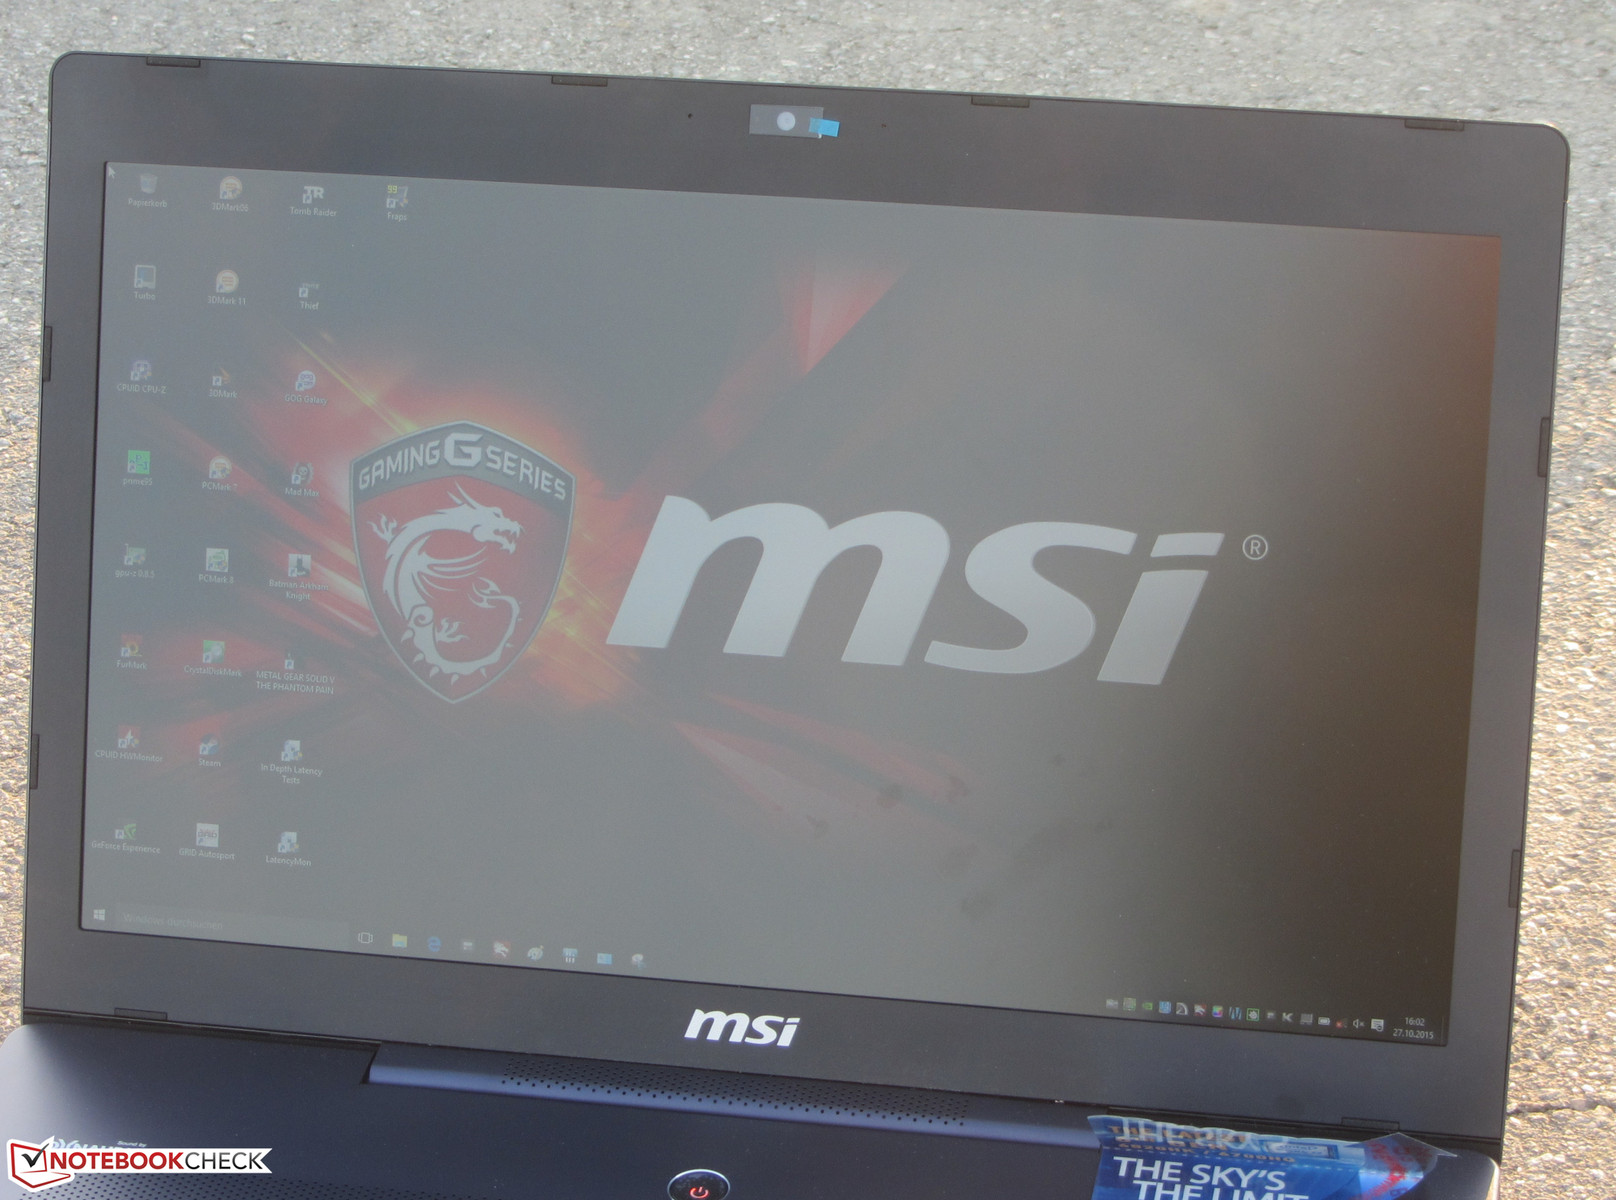
MSI equipped their GS70 with a TN display that keeps the screen content fairly undistorted from a variety of angles. This is one of the better models of its kind; it offers wider viewing angles than most TN panels we've seen. Of course, in the realm of viewing-angle stability, it has no chance against a good IPS panel. The MSI computer is essentially unusable outdoors. The display's low maximum brightness renders it functional in shadowy environments at best.

| MSI GS70-6QE16H21 Chi Mei N173HGE-E11 (CMN1735) | MSI GS70-2QE16SR51 CMN N173HGE-E11 | Schenker XMG A706 LG Philips LP173WF4-SPD1 | Schenker XMG P706 LG LP173WF4-SPD1 | Medion Erazer X7615-MD99293 CMN N173HGE-E11 (CMN1735) | Acer Aspire V Nitro 7-791G-70TW LG Philips LGD0469 ÖP173WF4-SPF1 | |
|---|---|---|---|---|---|---|
| Display | -10% | -8% | -7% | -0% | -3% | |
| Display P3 Coverage (%) | 67 | 61.1 -9% | 66.4 -1% | 66.9 0% | 66.7 0% | 70.1 5% |
| sRGB Coverage (%) | 97.3 | 85 -13% | 83.8 -14% | 84.6 -13% | 95.7 -2% | 87.5 -10% |
| AdobeRGB 1998 Coverage (%) | 67.6 | 62.1 -8% | 61.3 -9% | 61.8 -9% | 68.5 1% | 63.9 -5% |
| Screen | -52% | 0% | -9% | -84% | -32% | |
| Brightness middle (cd/m²) | 172 | 251 46% | 344 100% | 306 78% | 263 53% | 347 102% |
| Brightness (cd/m²) | 161 | 249 55% | 322 100% | 302 88% | 244 52% | 326 102% |
| Brightness Distribution (%) | 85 | 84 -1% | 88 4% | 90 6% | 83 -2% | 90 6% |
| Black Level * (cd/m²) | 0.26 | 0.28 -8% | 0.3 -15% | 0.34 -31% | 0.27 -4% | 0.409 -57% |
| Contrast (:1) | 662 | 896 35% | 1147 73% | 900 36% | 974 47% | 848 28% |
| Colorchecker dE 2000 * | 2.06 | 11.19 -443% | 4.8 -133% | 5.49 -167% | 12.24 -494% | 6.81 -231% |
| Greyscale dE 2000 * | 2.42 | 4.57 -89% | 4.91 -103% | 3.97 -64% | 12.17 -403% | 7.27 -200% |
| Gamma | 2.45 90% | 2.38 92% | 2.37 93% | 2.15 102% | 3.55 62% | 2.4 92% |
| CCT | 6855 95% | 14550 45% | 6796 96% | 6163 105% | 15589 42% | 7546 86% |
| Color Space (Percent of AdobeRGB 1998) (%) | 62 | 55 -11% | 55 -11% | 55.5 -10% | 62 0% | 57 -8% |
| Color Space (Percent of sRGB) (%) | 97 | 84 -13% | 84.5 -13% | 96 -1% | ||
| Total Average (Program / Settings) | -31% /
-41% | -4% /
-2% | -8% /
-8% | -42% /
-63% | -18% /
-24% |
* ... smaller is better
Performance
MSI's GS70 is a very thin gaming notebook with a 17.3-inch display. The computer can fluidly render every game currently on the market. Our test device has a 2000-Euro price tag (~$2148). Prospective buyers can keep some green in their pocket if they purchase the Haswell GS70 instead. At the time of writing, similarly equipped models are available for about 1500 Euros (~$1611). Including the extra cost of an SSD, customers can still save a good 400 Euros (~$429) compared to our current test device.
Processor
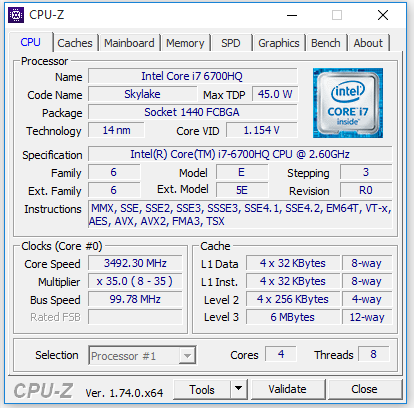
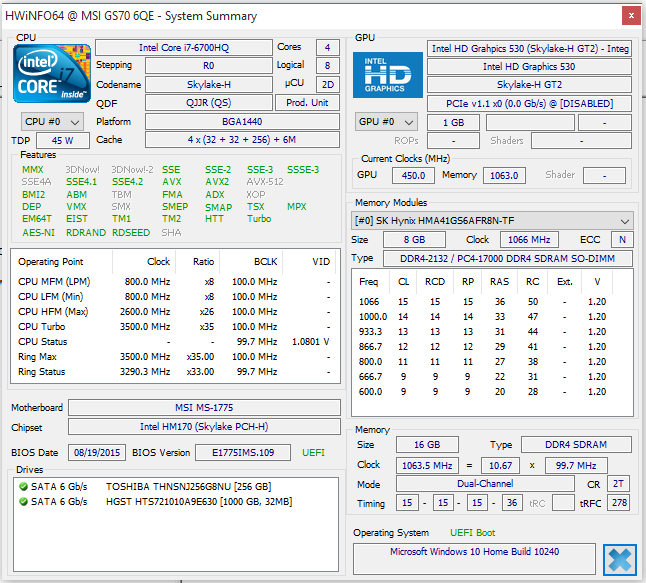
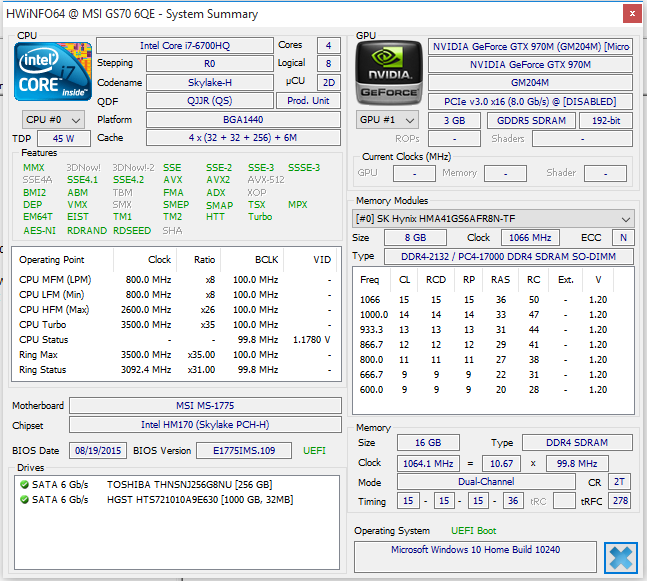
The inner life of the GS70 incorporates Intel's Core i7-6700HQ (Skylake) quad-core processor. The 14 nm model runs at a base clock speed of 2.6 GHz. Using turbo, the clock rate can be increased to 3.1 GHz (four cores), 3.3 GHz (two cores), or 2.5 GHz (one core). The CPU has a TDP of 45 Watts. The processor runs single-thread applications at 3.1 to 3.5 GHz in both AC power mode and battery mode. Multithread applications are processed at 2.1 to 2.2 GHz (battery mode) or 2.8 to 2.9 GHz (AC power mode). Given these results, we see that the processor doesn't attain to its full computational potential in this notebook.
In the beginning of January 2015, we reviewed a sister model of the GS70 that was outfitted with the predecessor to the predecessor of the CPU in our current test device - the Core i7-4720HQ (Haswell). The results of our CPU tests reveal that the two versions of the GS70 are usually on par with each other. Only in the single-thread applications test does the Skylake processor have a modest advantage. Here we see clearly that the Skylake CPU is unable to fully utilize its turbo in multithread applications. It is, however, noteworthy that the Skylake processor needs less energy to achieve slightly better results than its predecessor's predecessor.
| Cinebench R15 | |
| CPU Multi 64Bit (sort by value) | |
| MSI GS70-6QE16H21 | |
| MSI GS70-2QE16SR51 | |
| Schenker XMG A706 | |
| Schenker XMG P706 | |
| Medion Erazer X7615-MD99293 | |
| Acer Aspire V Nitro 7-791G-70TW | |
| CPU Single 64Bit (sort by value) | |
| MSI GS70-6QE16H21 | |
| MSI GS70-2QE16SR51 | |
| Schenker XMG A706 | |
| Schenker XMG P706 | |
| Medion Erazer X7615-MD99293 | |
| Acer Aspire V Nitro 7-791G-70TW | |
| Cinebench R11.5 | |
| CPU Multi 64Bit (sort by value) | |
| MSI GS70-6QE16H21 | |
| MSI GS70-2QE16SR51 | |
| Schenker XMG A706 | |
| Schenker XMG P706 | |
| Medion Erazer X7615-MD99293 | |
| Acer Aspire V Nitro 7-791G-70TW | |
| CPU Single 64Bit (sort by value) | |
| MSI GS70-6QE16H21 | |
| MSI GS70-2QE16SR51 | |
| Schenker XMG A706 | |
| Schenker XMG P706 | |
| Medion Erazer X7615-MD99293 | |
| Acer Aspire V Nitro 7-791G-70TW | |
| Cinebench R10 | |
| Rendering Multiple CPUs 32Bit (sort by value) | |
| MSI GS70-6QE16H21 | |
| Schenker XMG A706 | |
| Schenker XMG P706 | |
| Acer Aspire V Nitro 7-791G-70TW | |
| Rendering Single 32Bit (sort by value) | |
| MSI GS70-6QE16H21 | |
| Schenker XMG A706 | |
| Schenker XMG P706 | |
| Acer Aspire V Nitro 7-791G-70TW | |
| Geekbench 3 | |
| 32 Bit Single-Core Score (sort by value) | |
| MSI GS70-6QE16H21 | |
| Schenker XMG A706 | |
| Schenker XMG P706 | |
| 32 Bit Multi-Core Score (sort by value) | |
| MSI GS70-6QE16H21 | |
| Schenker XMG A706 | |
| Schenker XMG P706 | |
| Sunspider - 1.0 Total Score (sort by value) | |
| MSI GS70-6QE16H21 | |
| MSI GS70-2QE16SR51 | |
| Schenker XMG A706 | |
| Schenker XMG P706 | |
| Acer Aspire V Nitro 7-791G-70TW | |
| Mozilla Kraken 1.1 - Total (sort by value) | |
| MSI GS70-6QE16H21 | |
| MSI GS70-2QE16SR51 | |
| Schenker XMG A706 | |
| Schenker XMG P706 | |
| Octane V2 - Total Score (sort by value) | |
| MSI GS70-6QE16H21 | |
| MSI GS70-2QE16SR51 | |
| Schenker XMG A706 | |
| Schenker XMG P706 | |
| Peacekeeper - --- (sort by value) | |
| MSI GS70-6QE16H21 | |
| Schenker XMG A706 | |
| Schenker XMG P706 | |
* ... smaller is better
System Performance
The system runs quickly and fluidly. We didn't run into any problems. As we therefore would expect, the results in the PCMark benchmarks are very good. The Haswell model's results are on the same level as our test device's. In terms of system performance, the Haswell GS70's RAID system doesn't prove to be of any advantage. A RAID-0 configuration, on the other hand, is most certainly advantageous in a gaming notebook, as it shortens game load times. The MSI computer's Skylake model is only equipped with one M.2 slot. As a result, it's not possible to create a RAID system. However, the M.2 slot is connected via PCI Express x4 (NVMe). When a corresponding SSD is in the slot, the system reaches the same transfer rates as the predecessor's RAID 0 system. The SSD installed in our test device doesn't support this technology.
| PCMark 7 Score | 5912 points | |
| PCMark 8 Home Score Accelerated v2 | 4002 points | |
| PCMark 8 Creative Score Accelerated v2 | 4873 points | |
| PCMark 8 Work Score Accelerated v2 | 5043 points | |
Help | ||
| PCMark 7 - Score (sort by value) | |
| MSI GS70-6QE16H21 | |
| MSI GS70-2QE16SR51 | |
| Schenker XMG A706 | |
| Schenker XMG P706 | |
| Medion Erazer X7615-MD99293 | |
| Acer Aspire V Nitro 7-791G-70TW | |
| PCMark 8 - Home Score Accelerated v2 (sort by value) | |
| MSI GS70-6QE16H21 | |
| MSI GS70-2QE16SR51 | |
| Schenker XMG A706 | |
| Schenker XMG P706 | |
Storage Devices
Even though its case is so thin, the MSI computer contains two mass storage devices. A solid state drive manufactured by Toshiba serves as the system drive. This is an M.2 model that offers a total capacity of 256 GB. About 200 GB remains available to the user. The remaining storage space is occupied by the Windows installation and the recovery partition. The SSD's read speeds can be described as very good overall. The write speeds, on the other hand, are unusually low. Because we've tested this same SSD model in other notebooks, we know that the write rates should be about three to four times higher (Acer Aspire VN7-591G, Dell Latitude 13, etc.). In order to provide the storage space imperative in a gaming notebook, MSI chose to install a 2.5-inch conventional hard drive from HGST. This drive comprises 1 TB of storage and runs at 7200 rpm.

| MSI GS70-6QE16H21 Toshiba HG6 THNSNJ256G8NU | MSI GS70-2QE16SR51 Toshiba HG6 THNSNJ256GMCU | Schenker XMG A706 Samsung SSD 850 EVO M.2 250 GB | Schenker XMG P706 Samsung SM951 MZHPV512HDGL m.2 PCI-e | Medion Erazer X7615-MD99293 Samsung SSD PM851 128 GB MZMTE128HMGR | Acer Aspire V Nitro 7-791G-70TW Kingston RBU-SNS8100S3256GD | |
|---|---|---|---|---|---|---|
| AS SSD | 147% | 108% | 291% | 37% | 51% | |
| Seq Read (MB/s) | 501 | 1024 104% | 504 1% | 1863 272% | 479.3 -4% | 474.2 -5% |
| Seq Write (MB/s) | 109.7 | 643 486% | 469.7 328% | 1273 1060% | 132.9 21% | 320.3 192% |
| 4K Read (MB/s) | 20.85 | 21 1% | 35.54 70% | 39.93 92% | 32.6 56% | 28.33 36% |
| 4K Write (MB/s) | 55 | 72 31% | 77.7 41% | 95.3 73% | 90.7 65% | 61.7 12% |
| 4K-64 Read (MB/s) | 329.5 | 605 84% | 337 2% | 889 170% | 325.7 -1% | 192.3 -42% |
| 4K-64 Write (MB/s) | 60.4 | 314 420% | 267 342% | 392.1 549% | 99.4 65% | 151.5 151% |
| Access Time Read * (ms) | 0.139 | 0.12 14% | 0.087 37% | 0.05 64% | 0.076 45% | 0.089 36% |
| Access Time Write * (ms) | 0.075 | 0.05 33% | 0.046 39% | 0.042 44% | 0.04 47% | 0.055 27% |
* ... smaller is better
Graphics Card
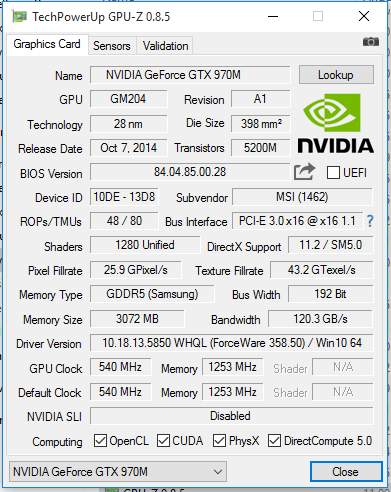
The new GS70 is outfitted with the same graphics card as its Haswell sister model. Both computers graphics tasks are handled by a GeForce GTX 970M. The core supports DirectX 11 and runs at a base clock frequency of 924 MHz. Using turbo, this frequency can be increased to up to 1038 MHz. The chip has access to 3072 MB of GDDR5 memory. The results in the 3DMark benchmarks are in the normal range for this GPU. The new GS70 is unable to surpass its Haswell counterpart in these tests; the two devices are on par with each other.
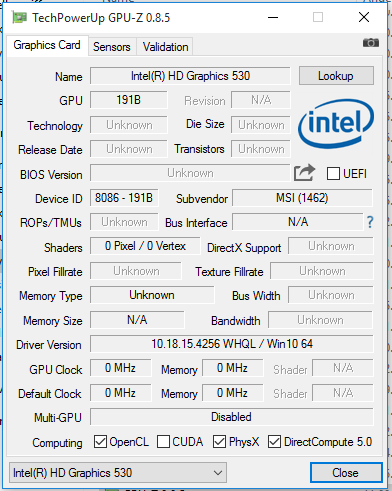
The GeForce GPU and the Intel HD Graphics 530 (integrated into the CPU) band together to create a switchable graphics solution (Optimus). Intel's core uses energy very sparingly and is therefore responsible for everyday tasks and graphics performance in battery mode. The GeForce steps up to the plate for applications that demand high performance, like computer games. The switching occurs automatically, though the user can always intervene.
| 3DMark 06 Standard Score | 25361 points | |
| 3DMark 11 Performance | 9421 points | |
| 3DMark Ice Storm Standard Score | 74841 points | |
| 3DMark Cloud Gate Standard Score | 20408 points | |
| 3DMark Fire Strike Score | 6555 points | |
Help | ||
| 3DMark 11 - 1280x720 Performance (sort by value) | |
| MSI GS70-6QE16H21 | |
| MSI GS70-2QE16SR51 | |
| Schenker XMG A706 | |
| Schenker XMG P706 | |
| Medion Erazer X7615-MD99293 | |
| Acer Aspire V Nitro 7-791G-70TW | |
| 3DMark | |
| 1280x720 Ice Storm Standard Score (sort by value) | |
| MSI GS70-6QE16H21 | |
| MSI GS70-2QE16SR51 | |
| Schenker XMG A706 | |
| Medion Erazer X7615-MD99293 | |
| Acer Aspire V Nitro 7-791G-70TW | |
| 1280x720 Cloud Gate Standard Score (sort by value) | |
| MSI GS70-6QE16H21 | |
| MSI GS70-2QE16SR51 | |
| Schenker XMG A706 | |
| Medion Erazer X7615-MD99293 | |
| Acer Aspire V Nitro 7-791G-70TW | |
| 1920x1080 Fire Strike Score (sort by value) | |
| MSI GS70-6QE16H21 | |
| MSI GS70-2QE16SR51 | |
| Schenker XMG A706 | |
| Schenker XMG P706 | |
| Medion Erazer X7615-MD99293 | |
| Acer Aspire V Nitro 7-791G-70TW | |
Gaming Performance
The GTX 970M and the Skylake quad-core processor form a strapping team that fluidly renders every computer game on the market. As a general rule, the user can select both maximum quality settings and the full screen resolution (Full HD). There are only a handful of titles in which the player is forced to be content to run the game at “just” high quality settings. While the GS70 and its Haswell sister model are neck-and-neck in the 3DMark benchmarks, the new Skylake GS70 achieves somewhat higher frame rates in computer games. The Skylake processor's somewhat higher single-thread performance and the newer driver are responsible for this modest advantage. The difference between a synthetic benchmark and real-life gaming scenarios is clearly visible here.
| low | med. | high | ultra | |
|---|---|---|---|---|
| Tomb Raider (2013) | 273.4 | 189 | 86.7 | |
| Thief (2014) | 80 | 76.1 | 47.8 | |
| GRID: Autosport (2014) | 123.9 | 99.3 | 78.4 | |
| The Witcher 3 (2015) | 83 | 46.7 | 25.4 | |
| Batman: Arkham Knight (2015) | 99 | 52 | 51 | |
| Metal Gear Solid V (2015) | 60 | 60 | 60 | |
| Mad Max (2015) | 160.2 | 81.6 | 75.3 | |
| World of Warships (2015) | 112.5 | 93.6 | 81 |
| Tomb Raider - 1920x1080 Ultra Preset AA:FX AF:16x (sort by value) | |
| MSI GS70-6QE16H21 | |
| MSI GS70-2QE16SR51 | |
| Schenker XMG A706 | |
| Schenker XMG P706 | |
| Acer Aspire V Nitro 7-791G-70TW | |
| Thief - 1920x1080 Very High Preset AA:FXAA & High SS AF:8x (sort by value) | |
| MSI GS70-6QE16H21 | |
| MSI GS70-2QE16SR51 | |
| Schenker XMG A706 | |
| Schenker XMG P706 | |
| GRID: Autosport - 1920x1080 Ultra Preset AA:4x MS (sort by value) | |
| MSI GS70-6QE16H21 | |
| Schenker XMG A706 | |
| Medion Erazer X7615-MD99293 | |
| Acer Aspire V Nitro 7-791G-70TW | |
| The Witcher 3 - 1920x1080 High Graphics & Postprocessing (Nvidia HairWorks Off) (sort by value) | |
| MSI GS70-6QE16H21 | |
| Medion Erazer X7615-MD99293 | |
| Batman: Arkham Knight - 1920x1080 High / On AA:SM AF:16x (sort by value) | |
| MSI GS70-6QE16H21 | |
| Schenker XMG A706 | |
| Medion Erazer X7615-MD99293 | |
| Metal Gear Solid V - 1920x1080 Extra High / On (sort by value) | |
| MSI GS70-6QE16H21 | |
| Schenker XMG A706 | |
| Mad Max - 1920x1080 Very High Preset AF:12x (sort by value) | |
| MSI GS70-6QE16H21 | |
| Schenker XMG A706 | |
| World of Warships - 1920x1080 Very High Preset AA:High FX AF:16x (sort by value) | |
| MSI GS70-6QE16H21 | |
| Schenker XMG A706 | |
| Schenker XMG P706 | |
Emissions
System Noise
The GS70 is equipped with two fans that often stand still in idle mode. When the fans are stationary, the only audible sound is the whirring of the conventional hard drive. The fans usually run at low speeds in this scenario. Every now and then, they accelerate momentarily. With such high-performance hardware in a slim case, it's unsurprising that they gear up under load. In our stress test, the sound pressure level increased to 53 dB. During gaming, the noise level varied between 37 and 44 dB (average: 41.8 dB). For a notebook in this performance class, these are reasonable numbers.
Noise level
| Idle |
| 30.8 / 31.2 / 36.6 dB(A) |
| HDD |
| 31 dB(A) |
| Load |
| 41.8 / 53 dB(A) |
 | ||
30 dB silent 40 dB(A) audible 50 dB(A) loud |
||
min: | ||
| MSI GS70-6QE16H21 6700HQ, GeForce GTX 970M | MSI GS70-2QE16SR51 4720HQ, GeForce GTX 970M | Schenker XMG A706 6700HQ, GeForce GTX 960M | Schenker XMG P706 6820HK, GeForce GTX 980M | Medion Erazer X7615-MD99293 4720HQ, GeForce GTX 965M | Acer Aspire V Nitro 7-791G-70TW 4720HQ, GeForce GTX 960M | |
|---|---|---|---|---|---|---|
| Noise | -6% | 6% | 6% | -5% | 0% | |
| Idle Minimum * (dB) | 30.8 | 29.6 4% | 29.2 5% | 30.9 -0% | 29.5 4% | 29.6 4% |
| Idle Average * (dB) | 31.2 | 34.4 -10% | 30.4 3% | 31.2 -0% | 31 1% | 32.1 -3% |
| Idle Maximum * (dB) | 36.6 | 39.4 -8% | 37.3 -2% | 31.2 15% | 40.8 -11% | 35.4 3% |
| Load Average * (dB) | 41.8 | 47.2 -13% | 39.8 5% | 40.5 3% | 47.6 -14% | 47.3 -13% |
| Load Maximum * (dB) | 53 | 55.8 -5% | 42.2 20% | 47 11% | 54.4 -3% | 48.1 9% |
* ... smaller is better
Temperature
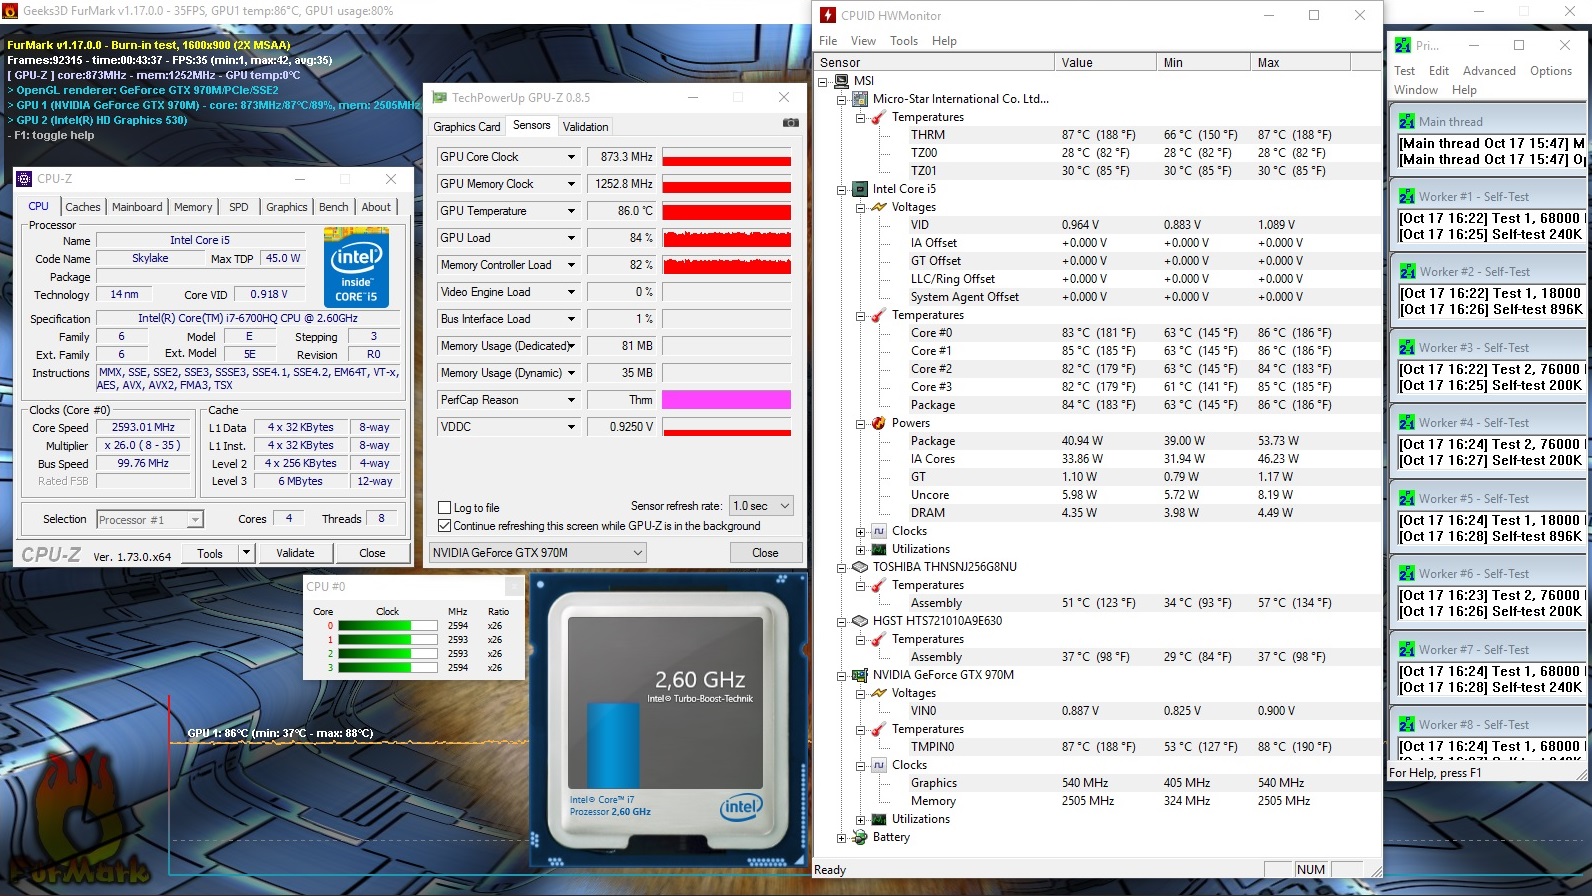
The MSI GS70 completed the stress test (Prime95 and Furmark running simultaneously for at least an hour) differently in AC power mode and battery mode. The processor performed its duty at 1.6 to 1.7 GHz (battery mode) and 2.0 to 2.5 GHz (AC power mode). The dedicated graphics core went about its work at about 600 to 800 MHz (battery mode) and 900 to 1000 MHz (AC power mode). The hardware certainly heated up in the stress test -- in the truest sense of the word. We measured temperatures above 50 °C (> 122 °F) in many spots. In everyday use, however, the computer won't reach these sizzling temperatures. The stress test is an extreme scenario.
(-) The maximum temperature on the upper side is 53.8 °C / 129 F, compared to the average of 40.4 °C / 105 F, ranging from 21.2 to 68.8 °C for the class Gaming.
(-) The bottom heats up to a maximum of 65.4 °C / 150 F, compared to the average of 43.2 °C / 110 F
(±) In idle usage, the average temperature for the upper side is 32.9 °C / 91 F, compared to the device average of 33.9 °C / 93 F.
(-) The palmrests and touchpad can get very hot to the touch with a maximum of 45.1 °C / 113.2 F.
(-) The average temperature of the palmrest area of similar devices was 28.8 °C / 83.8 F (-16.3 °C / -29.4 F).
| MSI GS70-6QE16H21 6700HQ, GeForce GTX 970M | MSI GS70-2QE16SR51 4720HQ, GeForce GTX 970M | Schenker XMG A706 6700HQ, GeForce GTX 960M | Schenker XMG P706 6820HK, GeForce GTX 980M | Medion Erazer X7615-MD99293 4720HQ, GeForce GTX 965M | Acer Aspire V Nitro 7-791G-70TW 4720HQ, GeForce GTX 960M | |
|---|---|---|---|---|---|---|
| Heat | -6% | 2% | 21% | -3% | 14% | |
| Maximum Upper Side * (°C) | 53.8 | 56.3 -5% | 53.7 -0% | 44 18% | 58.8 -9% | 49.6 8% |
| Maximum Bottom * (°C) | 65.4 | 68.6 -5% | 61.1 7% | 42.3 35% | 69.2 -6% | 51.7 21% |
| Idle Upper Side * (°C) | 36.3 | 37.9 -4% | 37.5 -3% | 31.7 13% | 35.2 3% | 29.5 19% |
| Idle Bottom * (°C) | 36.3 | 39.8 -10% | 35.5 2% | 29.9 18% | 36.5 -1% | 33 9% |
* ... smaller is better
Energy Management
Power Consumption
One of the Skylake architecture's most touted strengths is its higher energy efficiency. There is no evidence of this in idle mode. Here the GS70 lies on par with its Haswell sister model, at an energy consumption rate of up to 26.1 Watts. This is surprising, as other Skylake notebooks, like the Schenker XMG A706, prove to require less power than their Haswell counterparts. Under load, the GS70 begins to show its superiority to its Haswell predecessor. During the stress test, the computer needed just over 20 Watts less energy (166.9 vs. 146.4 Watts); in everyday gaming situations, the consumption rate is about 13 Watts lower (108.7 vs. 95.8 Watts). The power supply is rated at a capacity of 150 Watts.
| Off / Standby | |
| Idle | |
| Load |
|
Key:
min: | |
| MSI GS70-6QE16H21 6700HQ, GeForce GTX 970M | MSI GS70-2QE16SR51 4720HQ, GeForce GTX 970M | Schenker XMG A706 6700HQ, GeForce GTX 960M | Schenker XMG P706 6820HK, GeForce GTX 980M | Medion Erazer X7615-MD99293 4720HQ, GeForce GTX 965M | Acer Aspire V Nitro 7-791G-70TW 4720HQ, GeForce GTX 960M | |
|---|---|---|---|---|---|---|
| Power Consumption | -3% | 36% | 6% | 14% | 36% | |
| Idle Minimum * (Watt) | 16.5 | 15.7 5% | 5.4 67% | 12 27% | 9 45% | 5.8 65% |
| Idle Average * (Watt) | 23.1 | 21.7 6% | 11 52% | 17.9 23% | 15.2 34% | 13.1 43% |
| Idle Maximum * (Watt) | 26.1 | 26.3 -1% | 16.5 37% | 19.3 26% | 26.6 -2% | 14.5 44% |
| Load Average * (Watt) | 95.8 | 108.7 -13% | 77.8 19% | 97.7 -2% | 99 -3% | 98 -2% |
| Load Maximum * (Watt) | 146.4 | 166.9 -14% | 137.7 6% | 213 -45% | 155.8 -6% | 104.9 28% |
* ... smaller is better
Battery Life
The higher energy consumption rate in idle mode, combined with the somewhat smaller battery (56 Wh), leaves our test device with a significantly shorter battery life compared to its Haswell sister model. The Skylake GS70 gave up the ghost about 30 minutes earlier in our WLAN test. This test is designed to simulate a normal level of load as a computer loads websites. The “balanced” profile is active, and the display brightness is set to about 150 cd/m². The new computer's battery life during video playback is a full 80 minutes shorter. We test a device's battery life during video playback by running the short film Big Buck Bunny (H.264 encoding, 1920x1080 pixels) in a loop. Here the wireless modules are deactivated, and the display brightness is set to about 150 cd/m². All in all, the GS70's battery life is poor. This is, however, an admissible weakness, as the battery often serves merely as an emergency power source in gaming notebooks.
| MSI GS70-6QE16H21 56 Wh | MSI GS70-2QE16SR51 60 Wh | Schenker XMG A706 62 Wh | Schenker XMG P706 60 Wh | Medion Erazer X7615-MD99293 56 Wh | Acer Aspire V Nitro 7-791G-70TW 53 Wh | |
|---|---|---|---|---|---|---|
| Battery runtime | 23% | 108% | 34% | 15% | 13% | |
| Reader / Idle (h) | 4 | 5.1 27% | 11.8 195% | 5 25% | 5.7 43% | |
| H.264 (h) | 2.6 | 3.9 50% | 4.7 81% | 3.7 42% | ||
| WiFi v1.3 (h) | 3 | 5.5 83% | 3.7 23% | 3.3 10% | 3.4 13% | |
| Load (h) | 1.1 | 1 -9% | 1.9 73% | 1.6 45% | 1 -9% | |
| WiFi (h) | 3.5 |
Pros
Cons
Verdict
The MSI GS70 offers a powerful processor and a high-performance GPU. Together, these hardware components turn the computer into a gaming notebook that can tackle any title on today's market. The whole array of potent technology is contained in a slim case. It's not surprising, then, that the notebook isn't one of the quietest models around - the hardware has to be properly cooled. A solid state drive ensures that the system runs quickly. This drive could be replaced by a considerably faster model, as the computer's M.2 slot is connected via PCI Express x4. In order to give the user plenty of storage space, MSI also installed a 2.5-inch HDD.
The notebook's display is a TN panel that keeps the display content undistorted from a reasonably broad range of angles. When it comes to TN panels, this is one of the better models; we don't normally see such wide viewing angles with this kind of display. The panel's contrast ratio is acceptable, but its maximum brightness level is very low. Fault for the latter lies with the preinstalled color profile.
Finally, we'd like to take a short look at the Skylake processor. Compared to its Haswell predecessor, it only offers a minimal increase in CPU performance (less than 5%). More noteworthy is the Skylake GS70's lower energy consumption under load. As a result, the fans don't need to turn quite so rapidly. Surprisingly, the energy usage rates in idle mode aren't any lower. Indeed, the new GS70's decidedly worse battery life also shows that the computer required more energy than its Haswell sibling in our battery life tests. The differences in battery life can't be fully explained by the Skylake GS70's smaller battery capacity (56 Wh vs. 60 Wh).
All in all, the Skylake processor in the new GS70 provides some advantages, while also creating some drawbacks. But in the realm of gaming notebooks, ergonomic improvements hold more weight than a decline in battery life. Because the Skylake GS70's energy consumption rates and noise levels under load are both lower, the new computer will leave some customers with calmer nerves...and a lighter wallet.
MSI GS70-6QE16H21
- 03/08/2016 v5 (old)
Sascha Mölck
Price comparison
