Colorful EVOL X15 AT 23 Review: Impressive QHD gamer with Raptor Lake-HX and a few unmissable quirks

More popular for its range of PC motherboards and GPUs, Colorful began expanding its horizons to include Intel 12th gen Alder Lake laptops. This year, the Chinese tech giant has upgraded its lineup to offer several 13th gen Raptor Lake offerings.
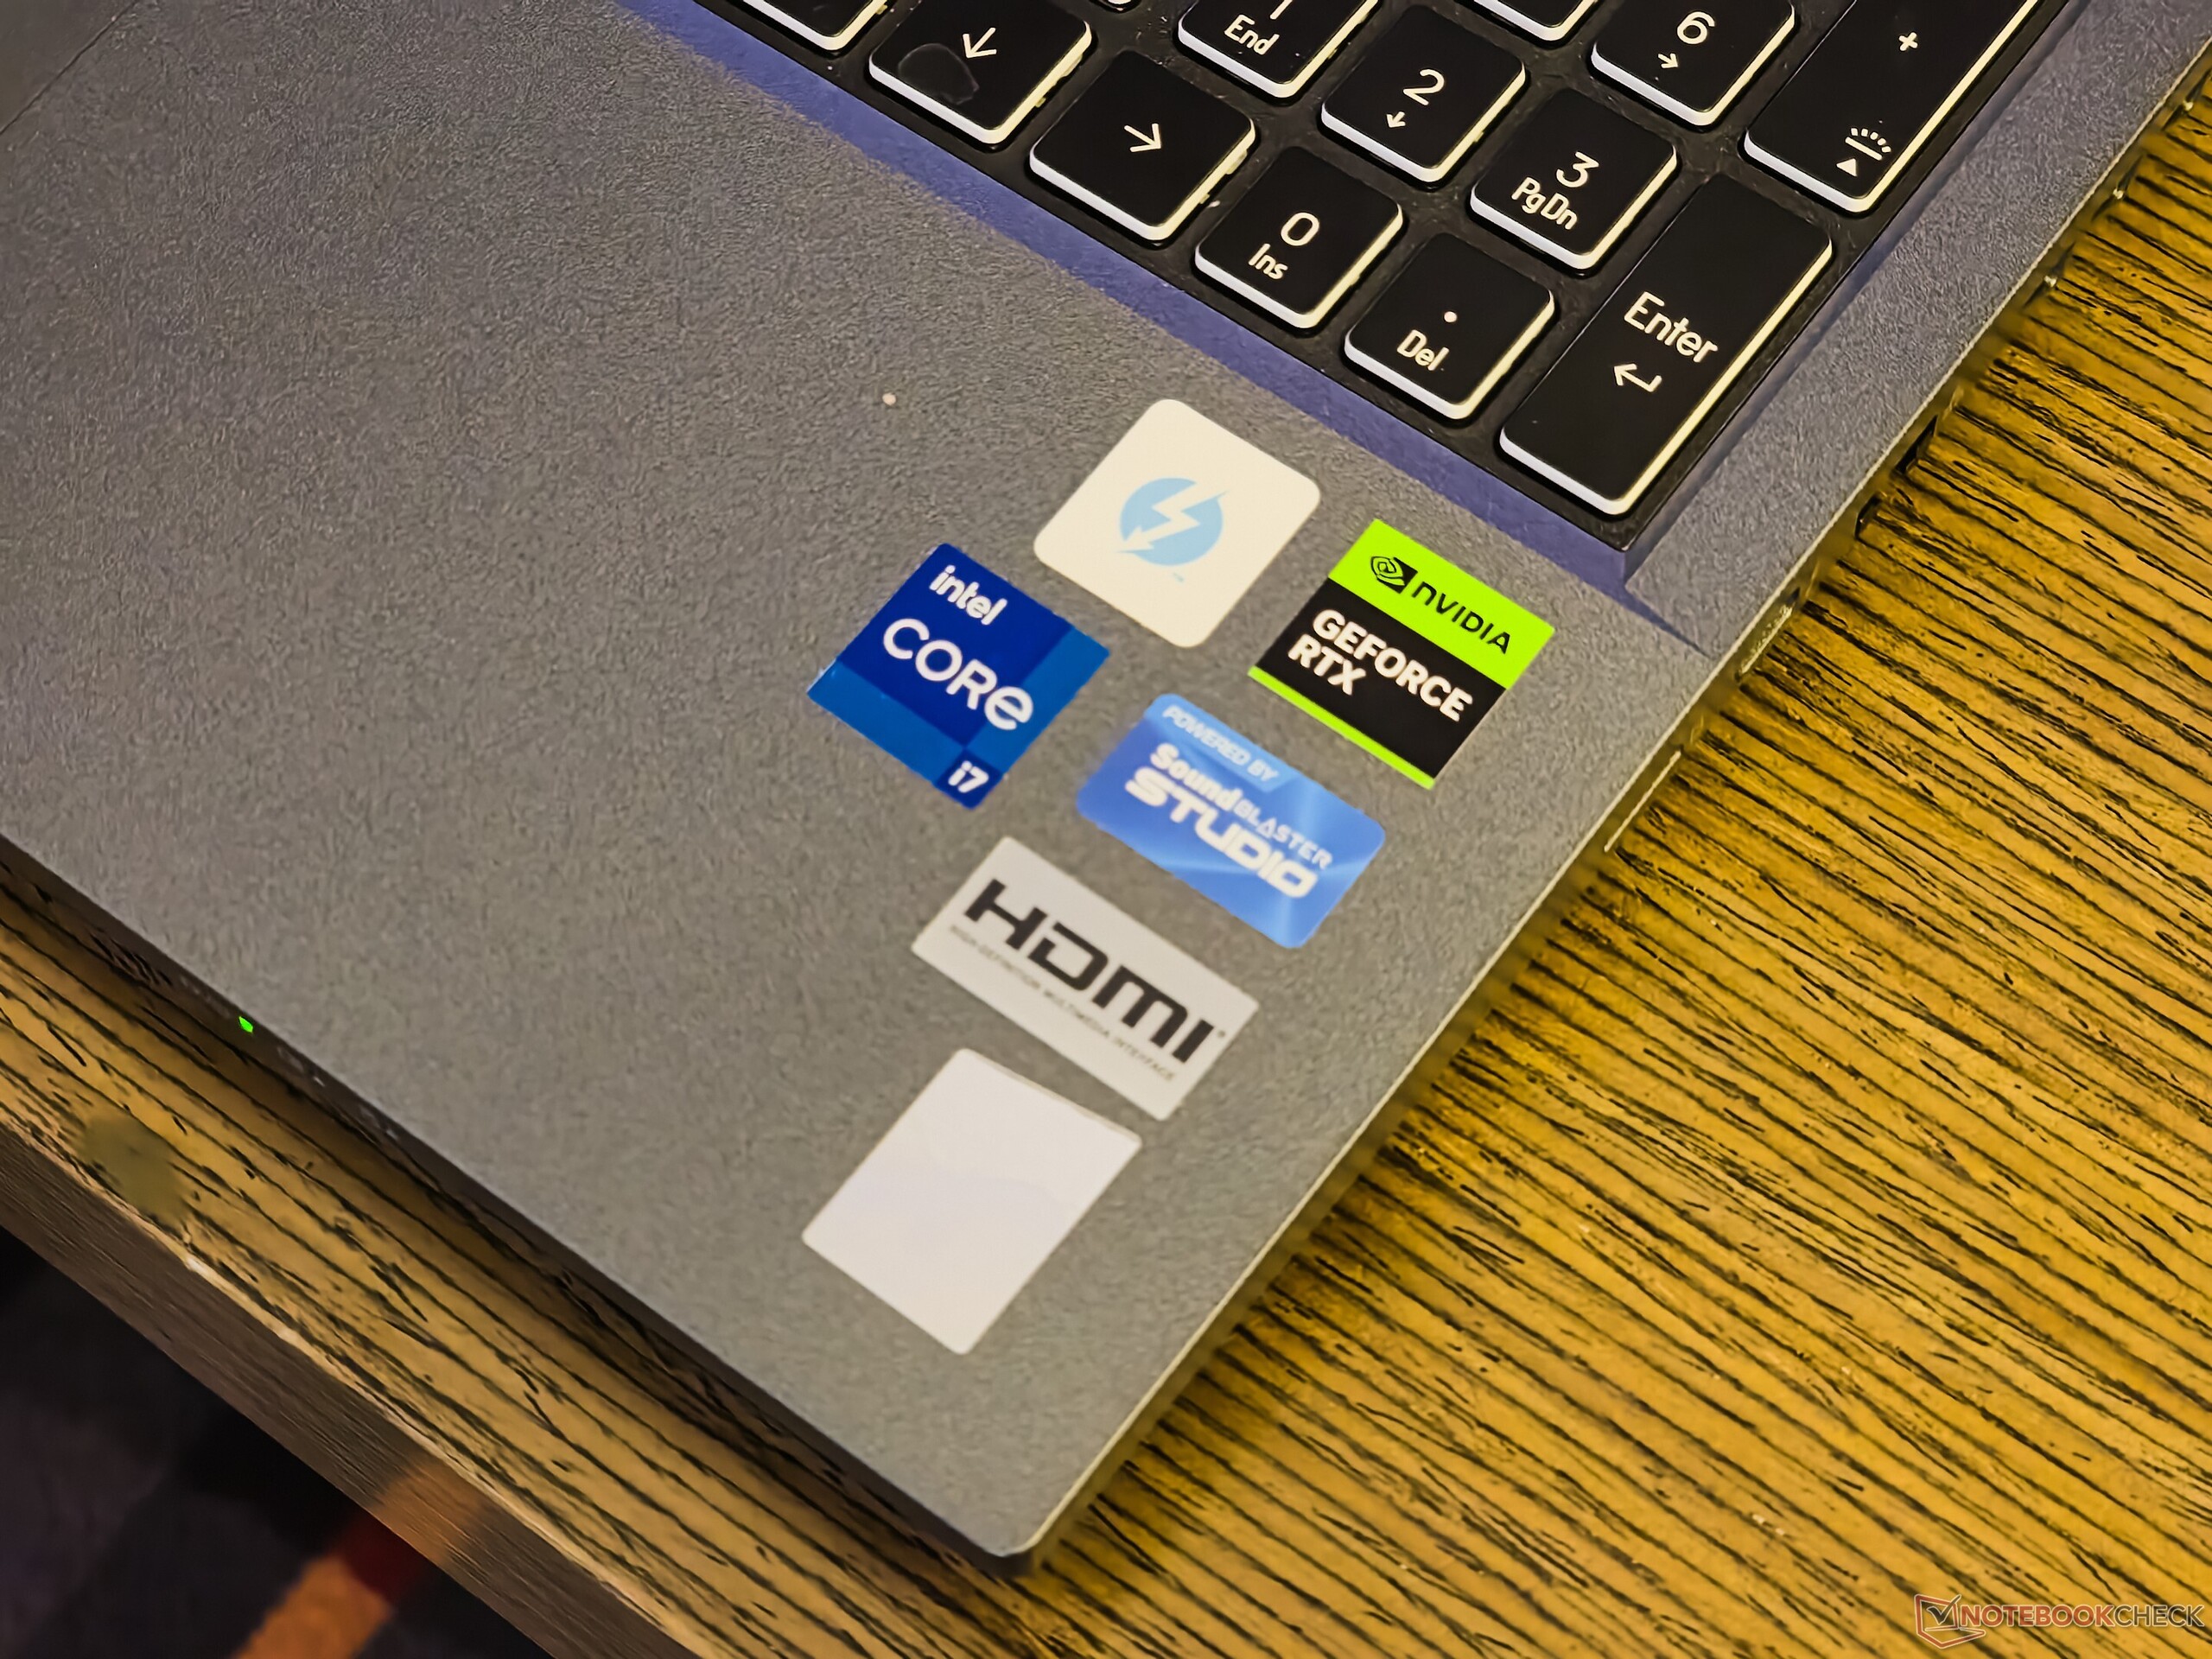
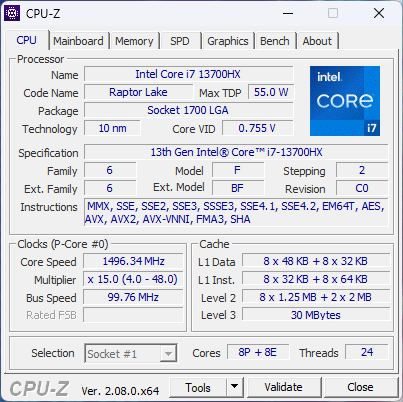
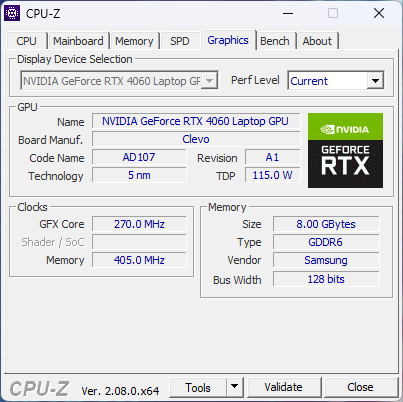
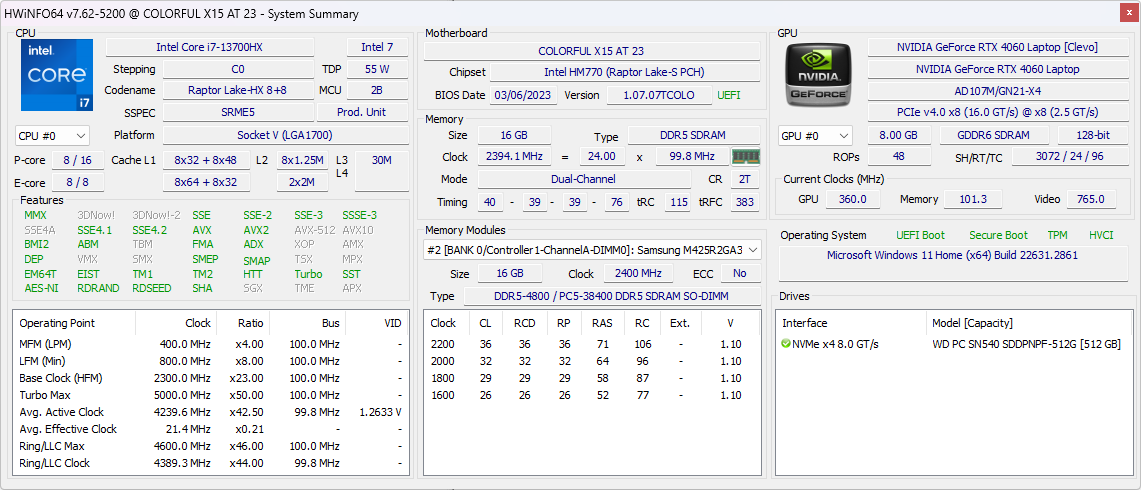
Apropos to this, the new Colorful EVOL X15 AT 23 recently arrived at our test labs. Our EVOL X15 AT sample is powered by the Intel Core i7-13700HX, Nvidia GeForce RTX 4060 Laptop GPU, 16 GB DDR5-4800 memory (single stick), and a 512 GB NVMe SSD.
The device offers impressive specifications, including a QHD 165 Hz display and a 73 WHr battery, and is available in select Asian markets such as China, Thailand, Malaysia, Indonesia, Philippines, and in Russia at Ozon for about $969. Newegg is selling this SKU in the U.S. at a $1,759 markup.
In this review, we take a look at the new Colorful EVOL X15 AT and see if it can stand up against some of its more entrenched competitors.
Potential competitors in comparison
Rating | Date | Model | Weight | Height | Size | Resolution | Price |
|---|---|---|---|---|---|---|---|
| 84.9 % v7 (old) | 12 / 2023 | Colorful EVOL X15 AT 23 i7-13700HX, GeForce RTX 4060 Laptop GPU | 2.3 kg | 26.9 mm | 15.60" | 2560x1440 | |
| 88.3 % v7 (old) | 09 / 2023 | Alienware m16 R1 Intel i7-13700HX, GeForce RTX 4060 Laptop GPU | 3 kg | 25.4 mm | 16.00" | 2560x1600 | |
| 87.4 % v7 (old) | 06 / 2023 | HP Omen 16-wf000 i7-13700HX, GeForce RTX 4080 Laptop GPU | 2.4 kg | 23.6 mm | 16.10" | 2560x1440 | |
| 89.5 % v7 (old) | 07 / 2023 | Acer Predator Helios 16 PH16-71-731Q i7-13700HX, GeForce RTX 4060 Laptop GPU | 2.6 kg | 26.9 mm | 16.00" | 2560x1600 | |
| 84.2 % v7 (old) | 06 / 2023 | Dell G15 5530 i7-13650HX, GeForce RTX 4060 Laptop GPU | 3 kg | 26.95 mm | 15.60" | 1920x1080 | |
| 86.2 % v7 (old) | 07 / 2023 | Schenker XMG Pro 15 (E23) i9-13900HX, GeForce RTX 4060 Laptop GPU | 2.4 kg | 24.9 mm | 15.60" | 2560x1440 | |
| 89.2 % v7 (old) | 08 / 2023 | Alienware m16 R1 AMD R9 7845HX, GeForce RTX 4080 Laptop GPU | 3.1 kg | 25.4 mm | 16.00" | 2560x1600 | |
| 88.2 % v7 (old) | 03 / 2023 | Uniwill GM6PX7X RTX 4070 i7-13700HX, GeForce RTX 4070 Laptop GPU | 2.2 kg | 22 mm | 16.00" | 2560x1600 |
Chassis: Function over form in plastic Clevo aesthetics
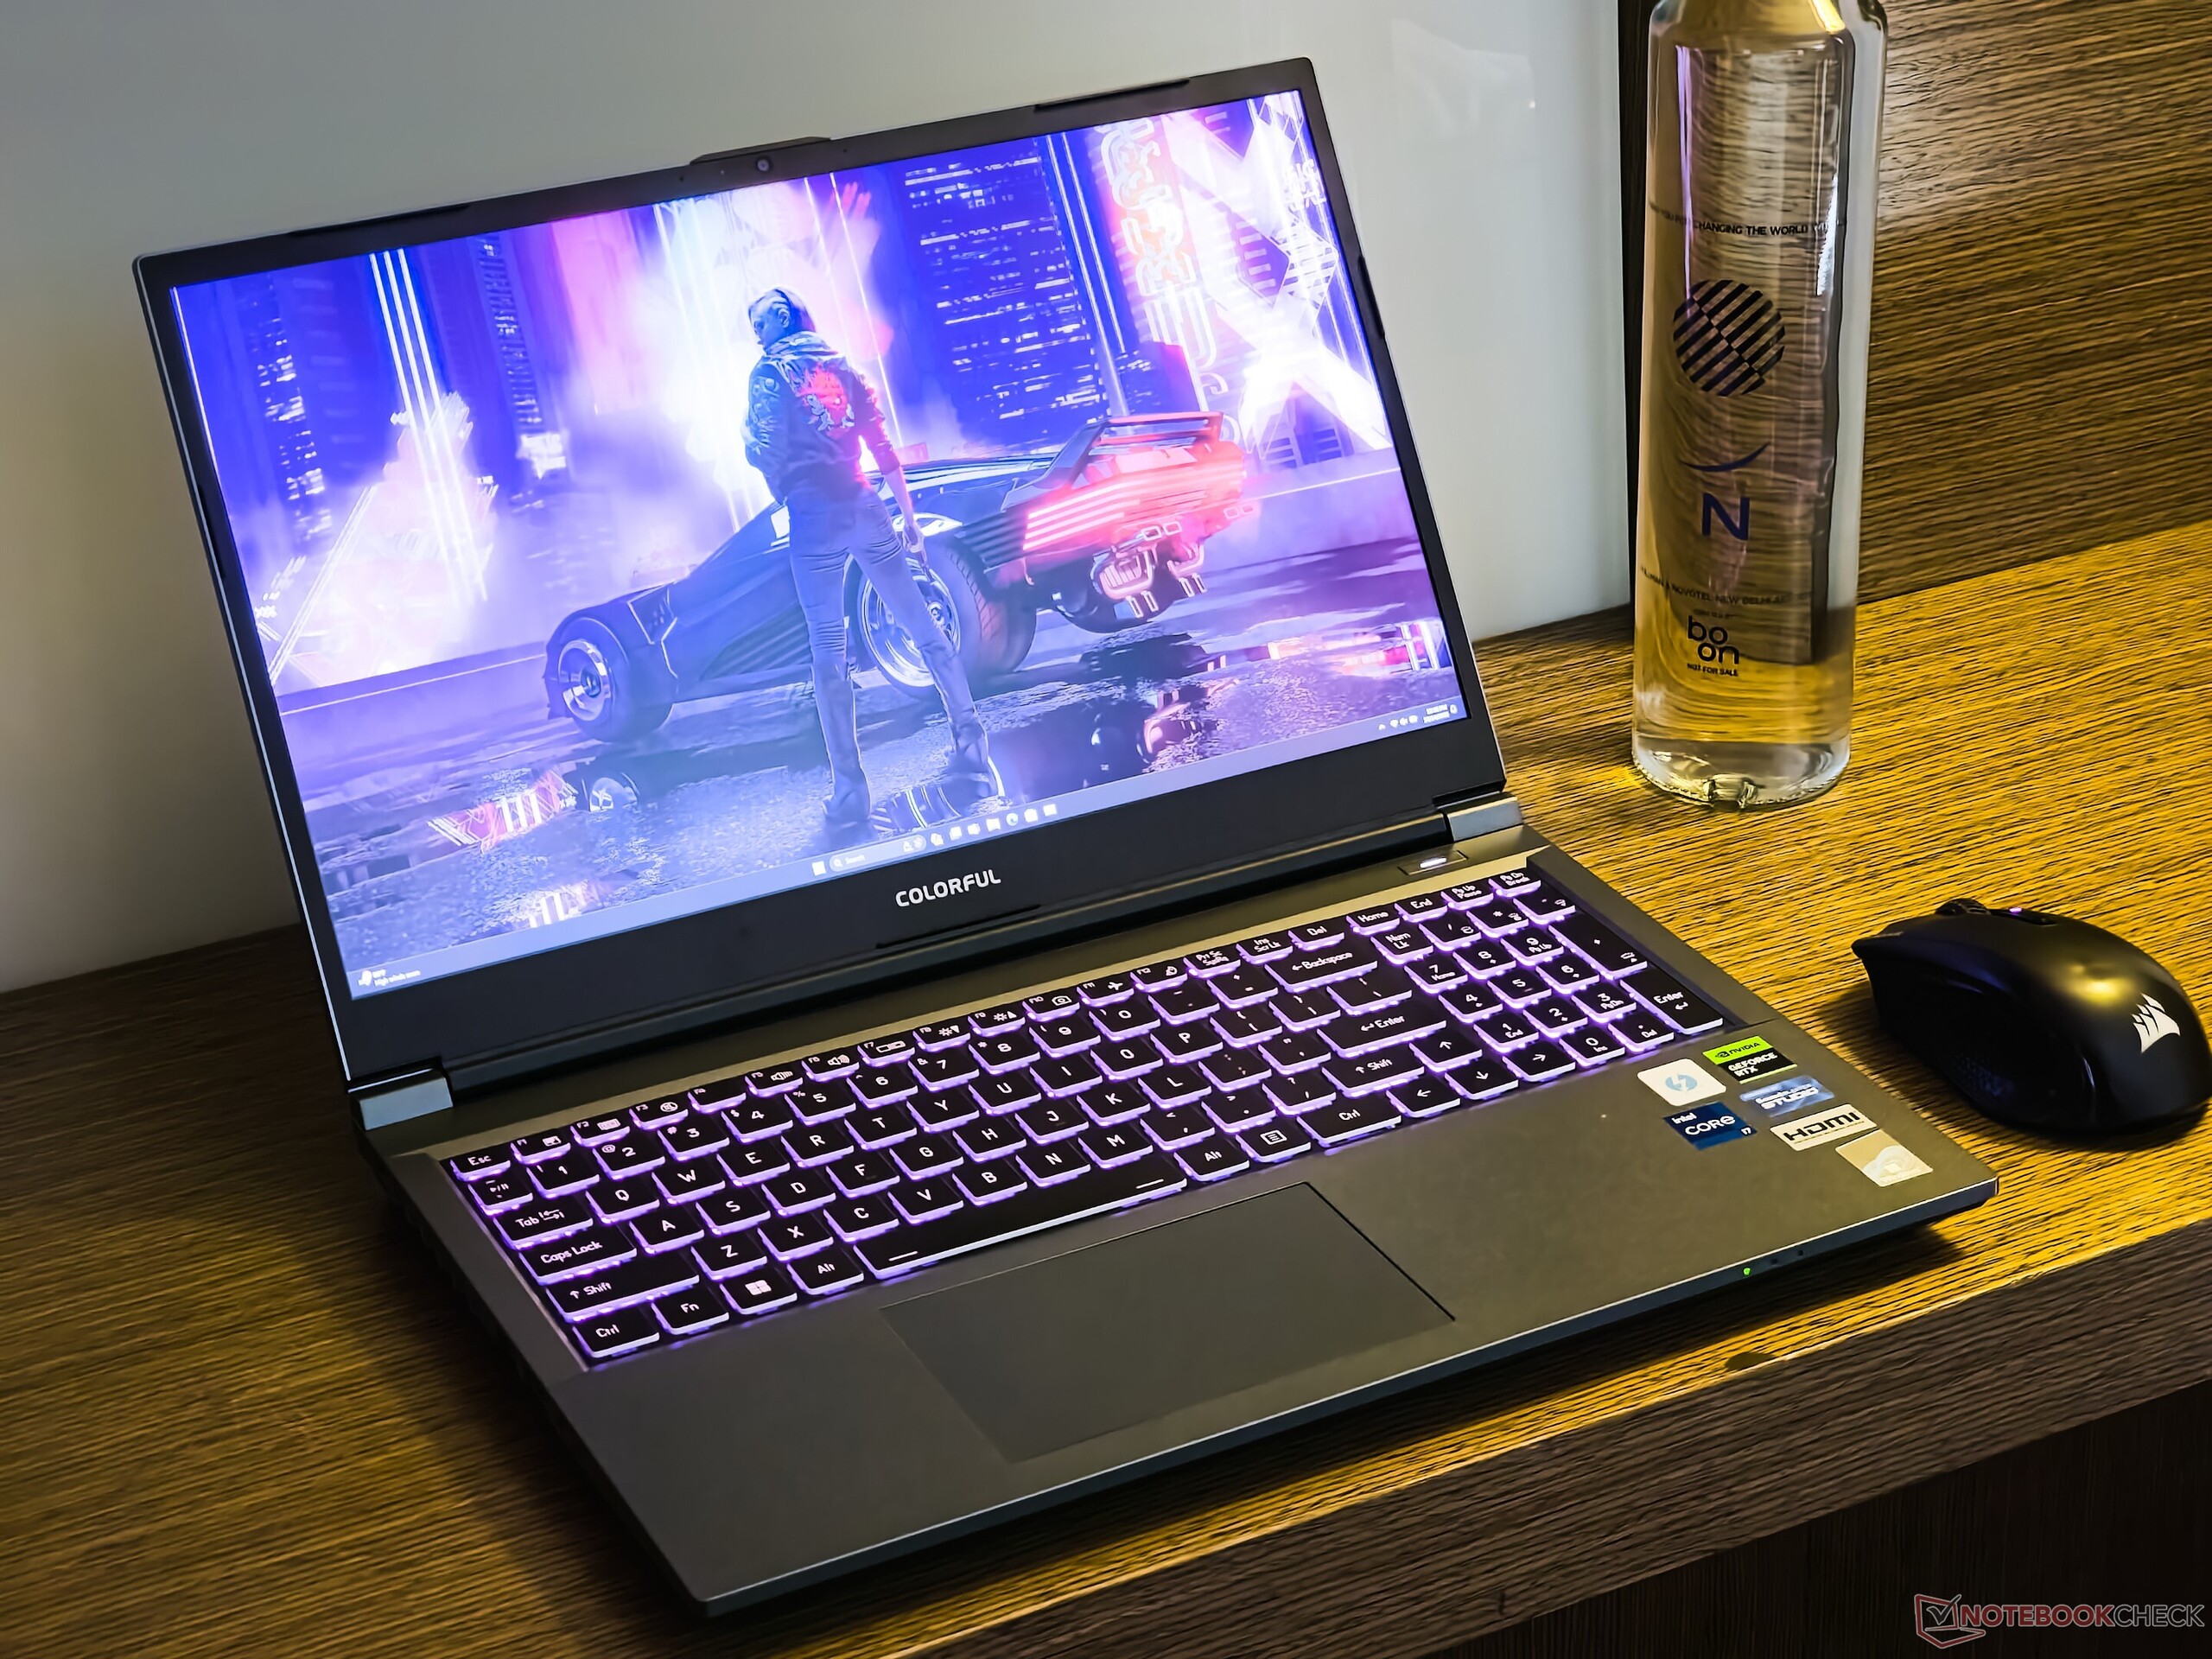
Colorful offers the EVOL X15 AT in three hues — Grape Purple, Pine Blue, and Mist Grey (our review unit). With a thickness of 27.1 mm and weight of 2.3 kg, the EVOL XT15 AT won't be winning any slimness awards. Still, it is significantly more portable than the Dell G15 5530 and the Alienware m16 R1.
The EVOL X15 AT, being a Clevo design, primarily sports a robust plastic chassis. The construction is largely reminiscent of the Gigabyte G5 KE, which is also a Clevo rebrand. Despite the sturdiness of the construction, we observed considerable flex in the keyboard deck.
The display lid is made of metal and doesn’t wobble much. The hinges have ideal tension, allowing the lid to be opened with a single finger without causing the base to slide
Overall, the EVOL X15 AT does not aim to woo you with a suave design language but is utilitarian enough as a gaming laptop.
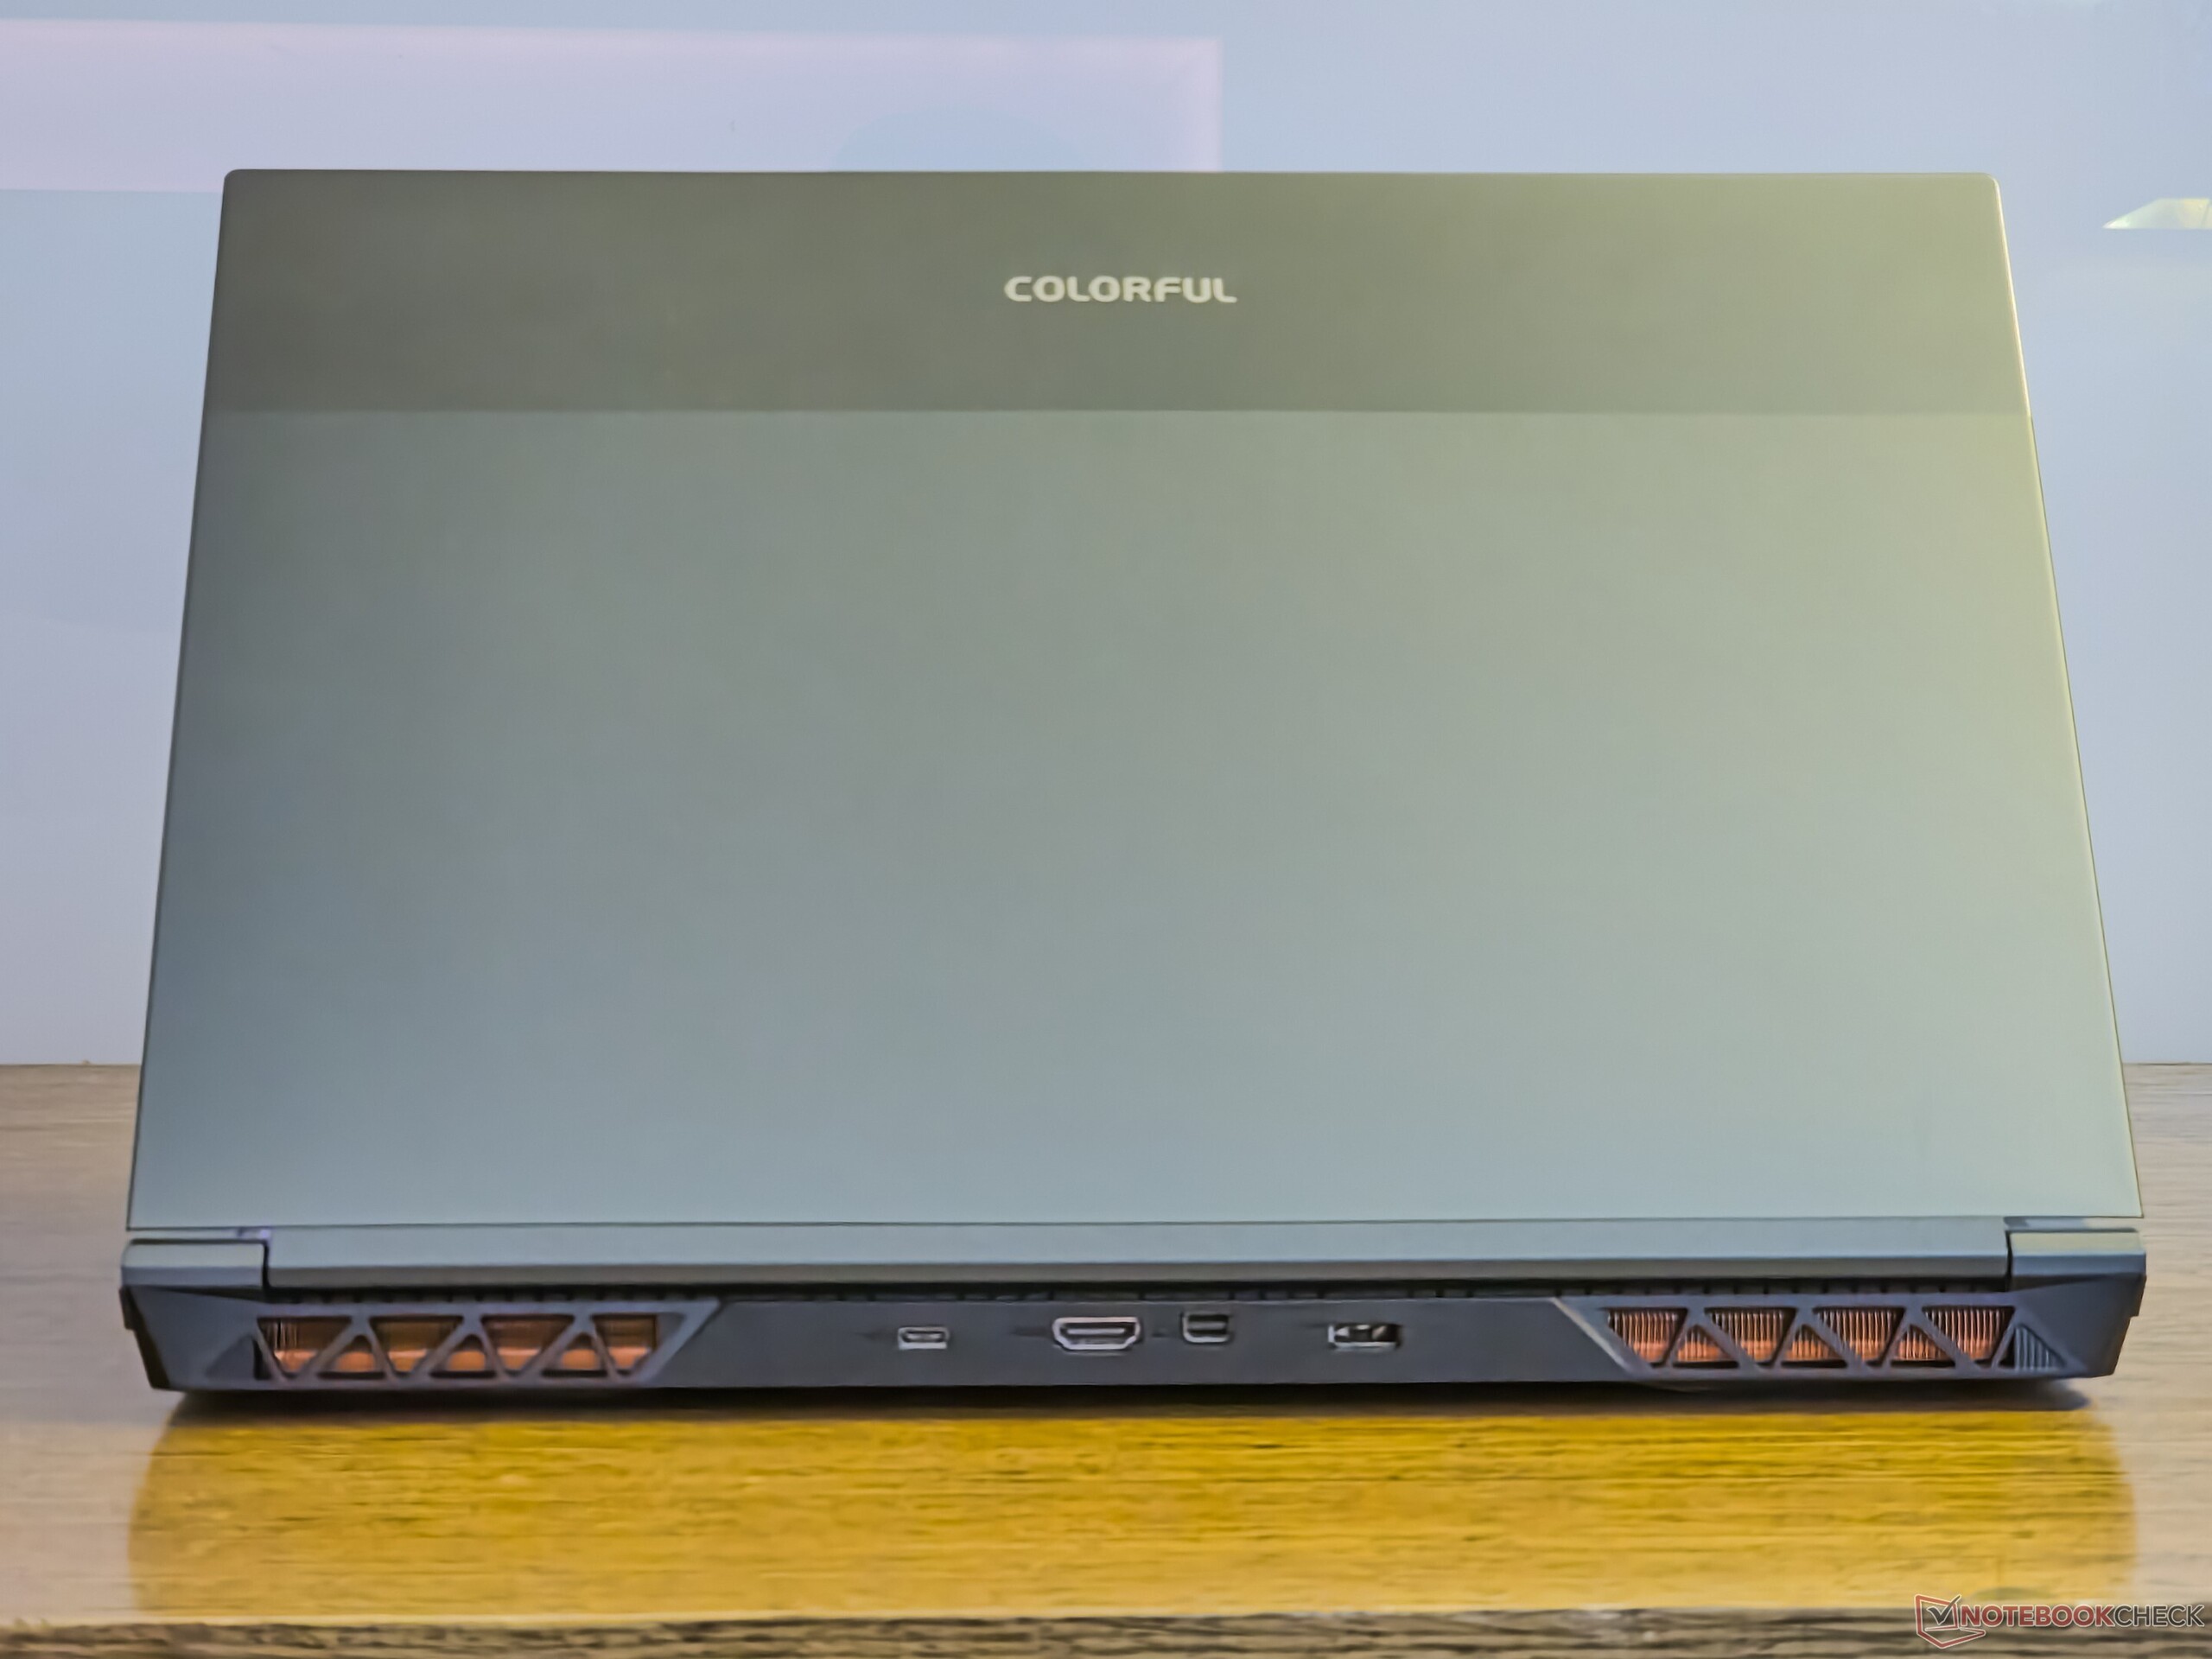
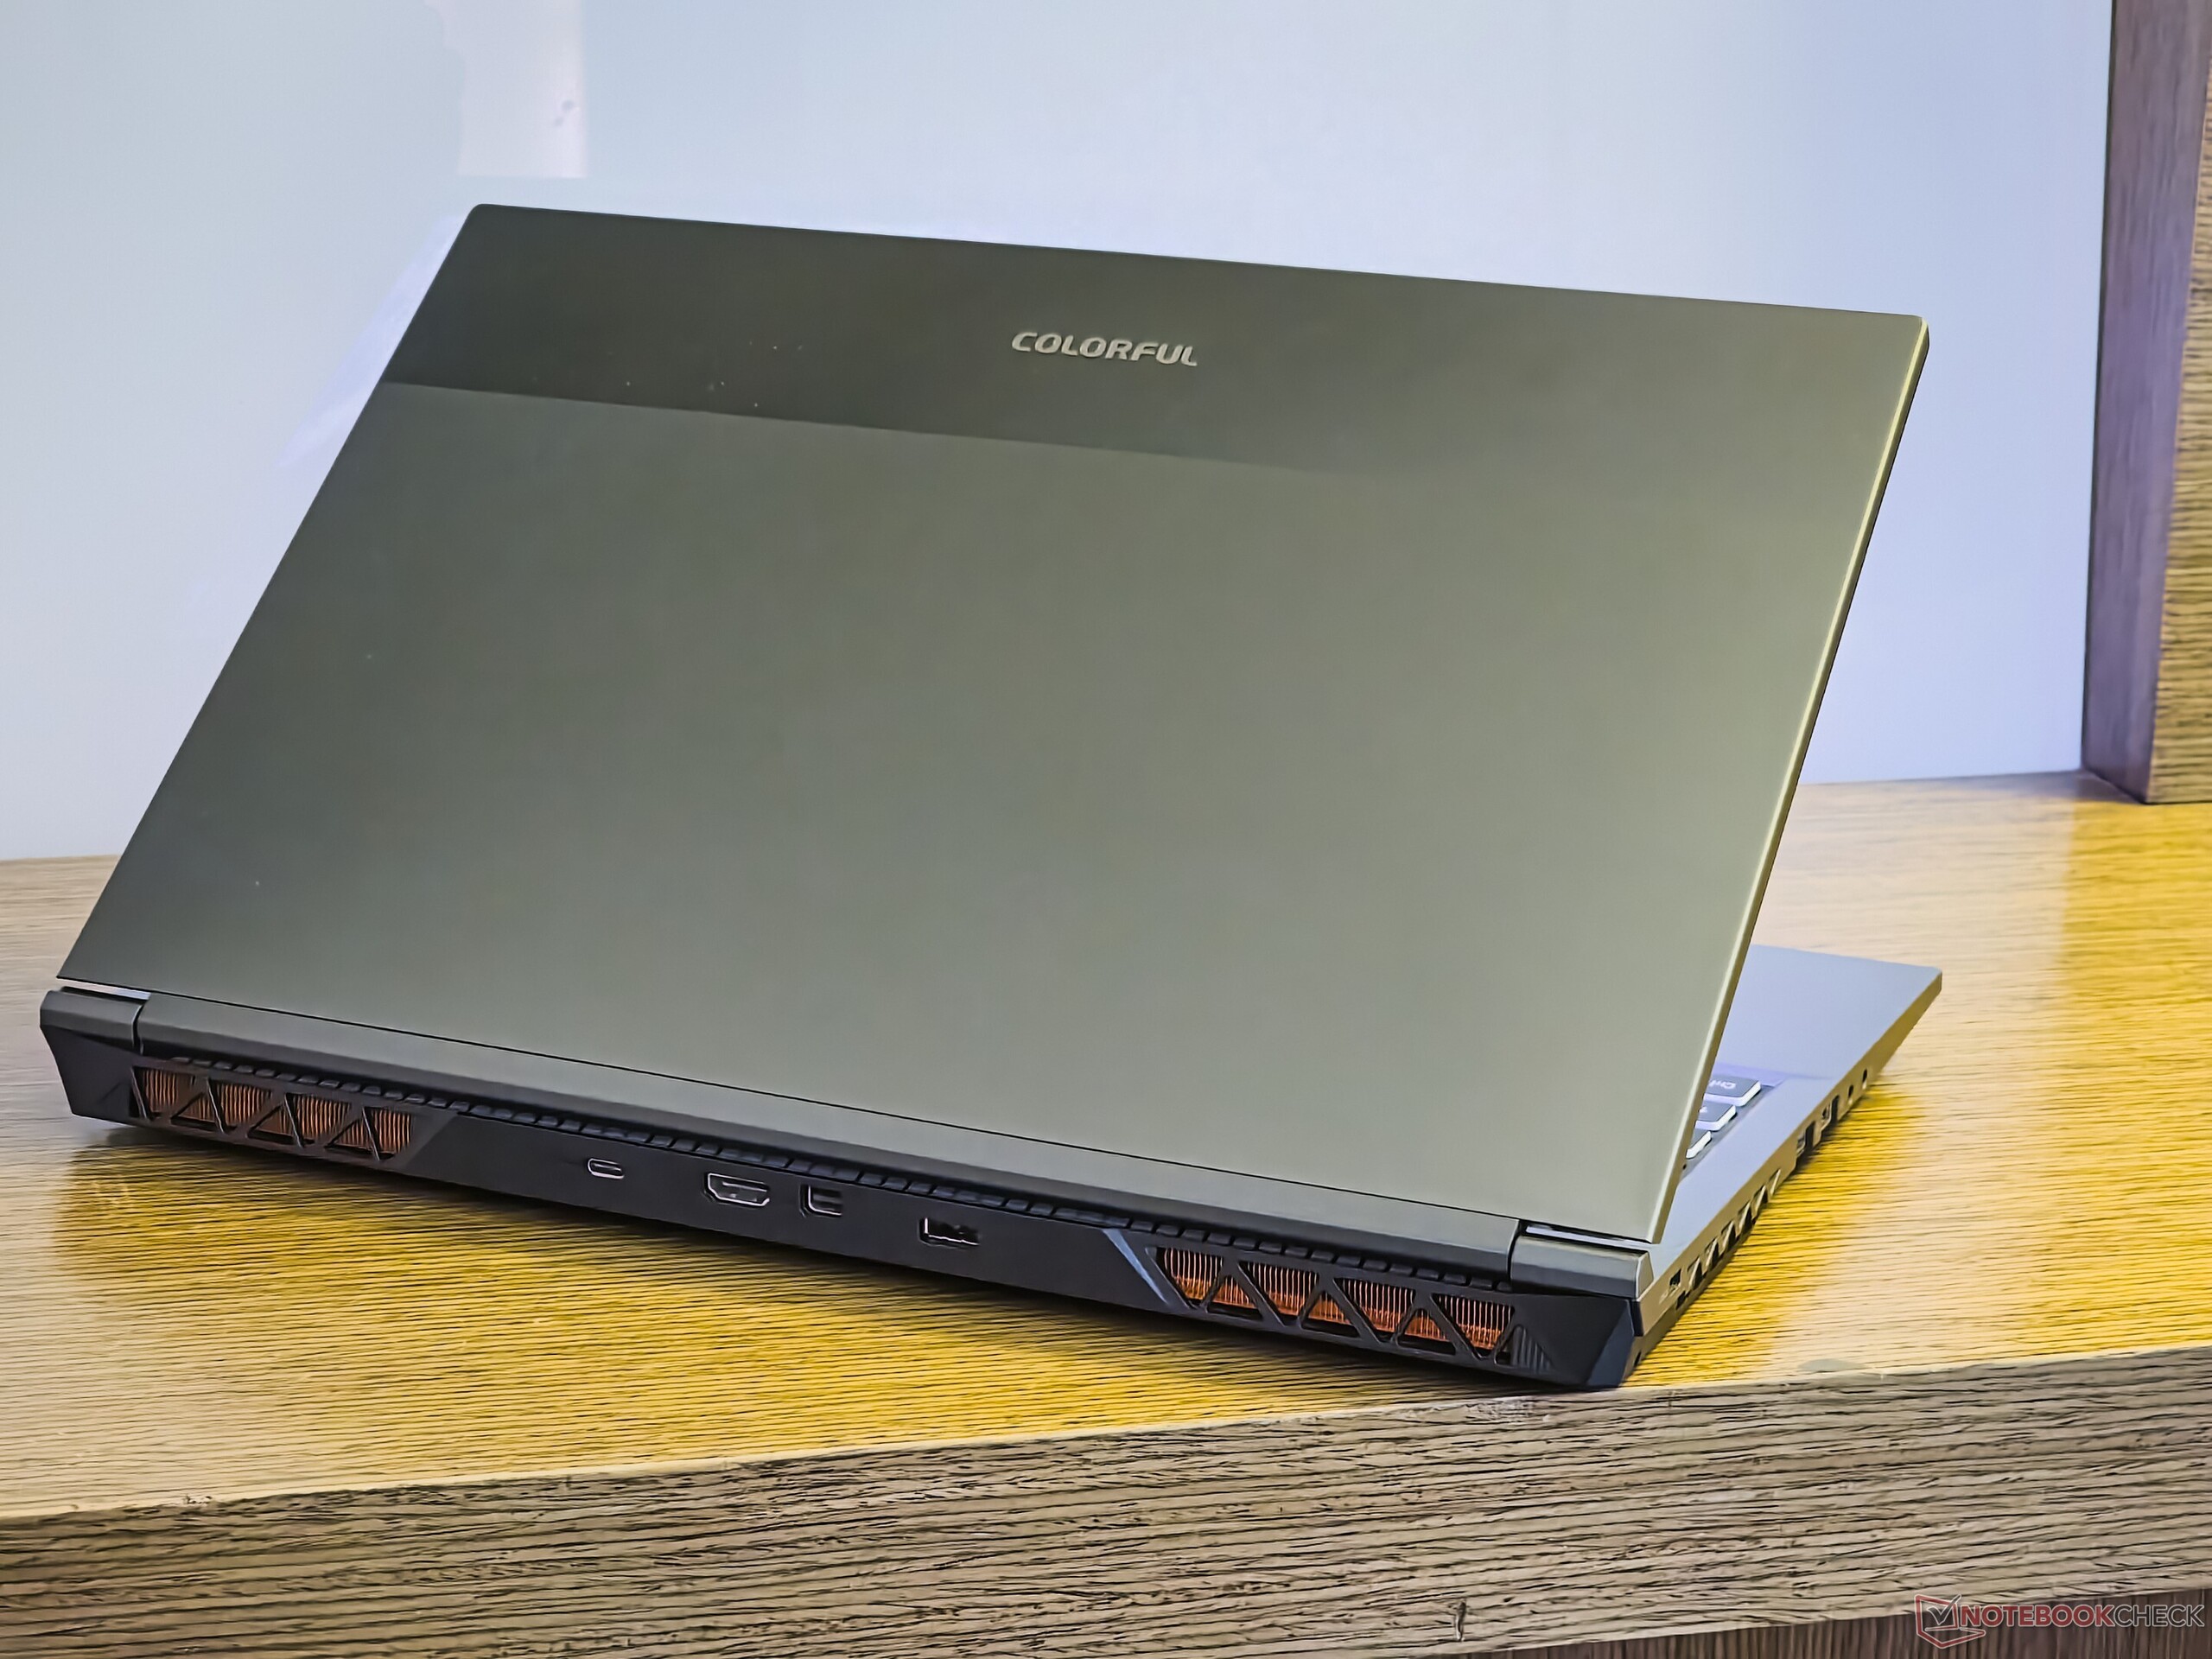
Connectivity: Type-C ports sans power delivery-in
Colorful has endowed the EVOL X15 AT with a fairly decent port selection. The left flank houses two USB-A options (USB 2.0 and USB 3.2 Gen 1) plus a dedicated line-in jack for analog audio input. On the right side reside a microSD slot, Thunderbolt 4, and Gigabit LAN.
On the right, we get to see a microSD card reader, Thunderbolt 4, and Gigabit LAN. Finally, the rear houses USB 3.2 Gen2 Type-C, mini-DisplayPort-out, and HDMI-out.
The Type-C ports unfortunately only support power delivery-out, so you will have to inevitably lug around the nearly 1 kg power brick everywhere to keep the laptop fed.


SD Card Reader
The EVOL X15's microSD card reader does not break any speed records and is about 28% slower than the class average in JPG copy and AS SSD sequential read tests.
| SD Card Reader | |
| average JPG Copy Test (av. of 3 runs) | |
| Alienware m16 R1 AMD (Toshiba Exceria Pro SDXC 64 GB UHS-II) | |
| Alienware m16 R1 Intel (AV PRO microSD 128 GB V60) | |
| Average of class Gaming (20.9 - 210, n=55, last 2 years) | |
| Schenker XMG Pro 15 (E23) | |
| Colorful EVOL X15 AT 23 (AV PRO microSD 128 GB V60) | |
| Acer Predator Helios 16 PH16-71-731Q | |
| Uniwill GM6PX7X RTX 4070 (AV PRO microSD 128 GB V60) | |
| maximum AS SSD Seq Read Test (1GB) | |
| Alienware m16 R1 AMD (Toshiba Exceria Pro SDXC 64 GB UHS-II) | |
| Alienware m16 R1 Intel (AV PRO microSD 128 GB V60) | |
| Average of class Gaming (25.5 - 261, n=52, last 2 years) | |
| Schenker XMG Pro 15 (E23) | |
| Colorful EVOL X15 AT 23 (AV PRO microSD 128 GB V60) | |
| Uniwill GM6PX7X RTX 4070 (AV PRO microSD 128 GB V60) | |
| Acer Predator Helios 16 PH16-71-731Q | |
Communication
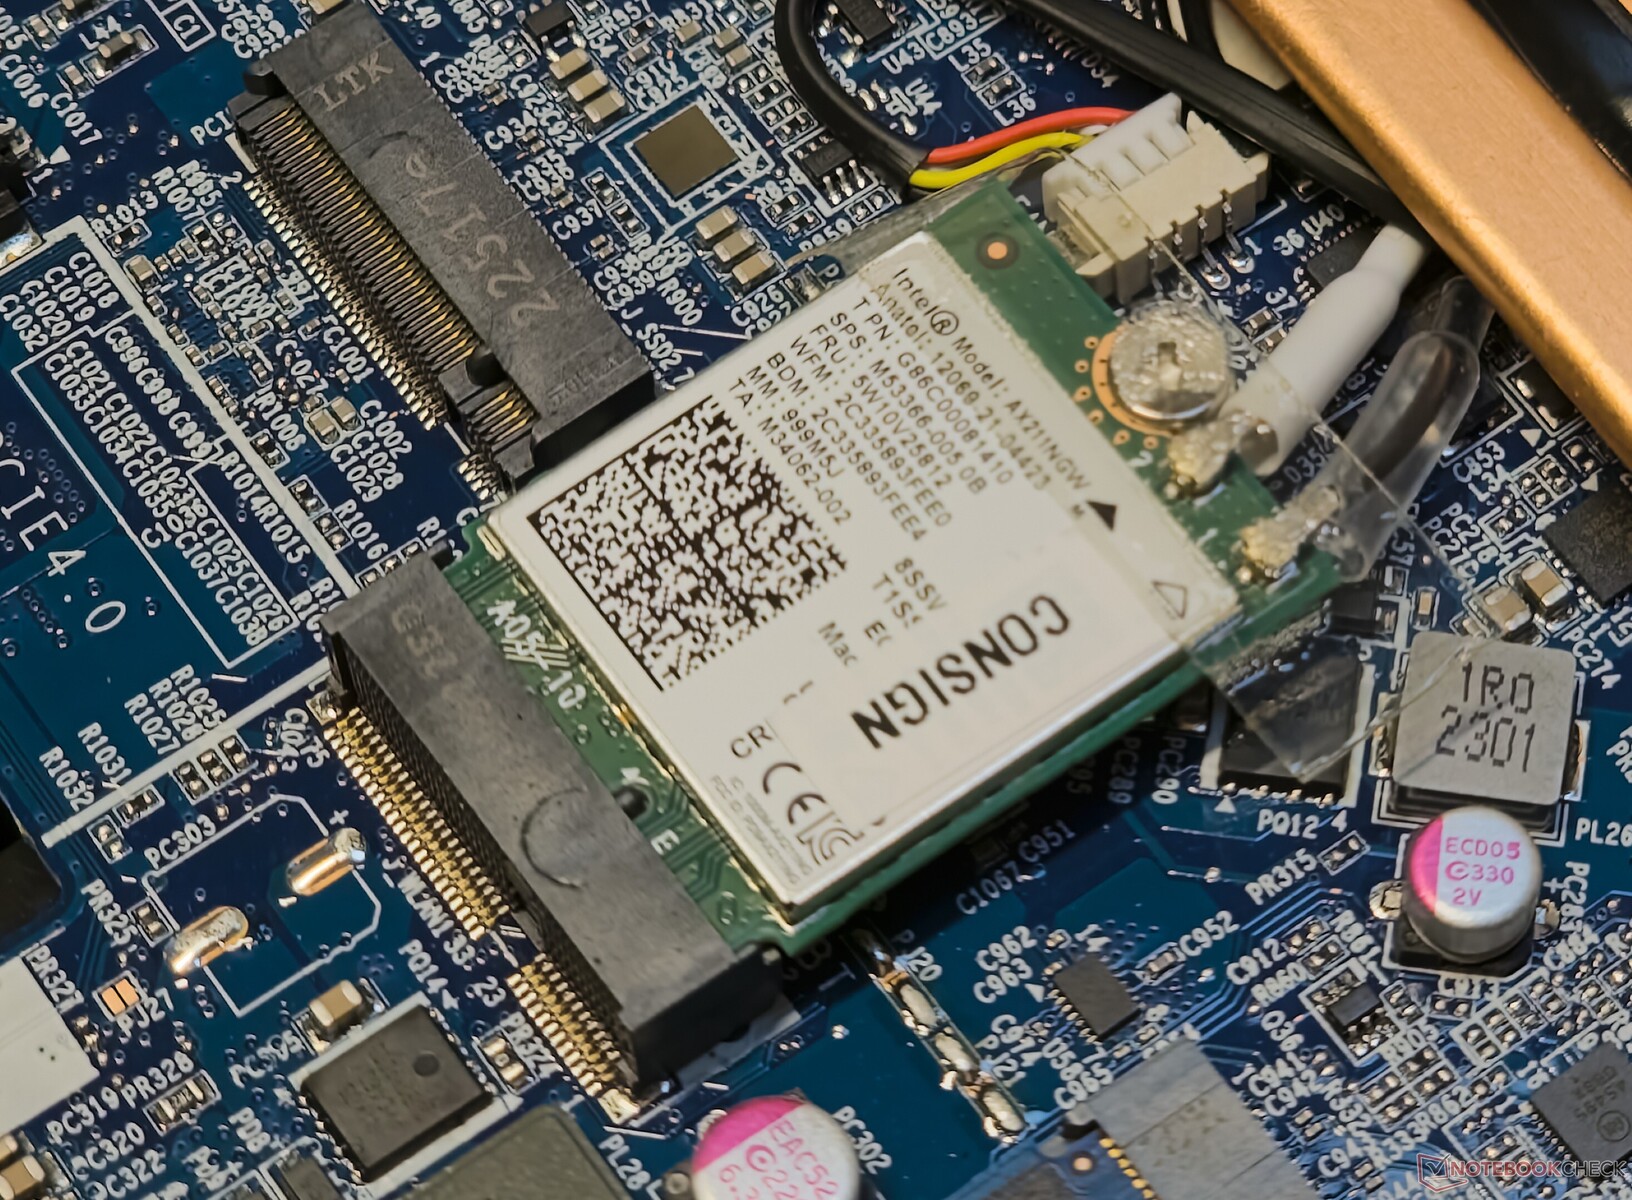
The EVOL X15 AT features an Intel Wi-Fi 6E AX211 WLAN chip. Transfer rates are pretty much consistent in both the 5 GHz and 6 GHz bands when tested with our reference Asus ROG Rapture GT-AXE11000 router.
The laptop offers excellent transmit and receive throughput in the 5 GHz band. In the 6 GHz range, the EVOL X15 falls short of the Alienware m16 R1 AMD in iPerf3 transmit tests but makes up for the deficiency in receive tests with a peak throughput of 1.7 Gbps.
| Networking / iperf3 transmit AXE11000 | |
| Colorful EVOL X15 AT 23 | |
| Dell G15 5530 | |
| Alienware m16 R1 AMD | |
| Acer Predator Helios 16 PH16-71-731Q | |
| Alienware m16 R1 Intel | |
| Average of class Gaming (560 - 1862, n=96, last 2 years) | |
| Average Intel Wi-Fi 6E AX211 (64 - 1921, n=276) | |
| Uniwill GM6PX7X RTX 4070 | |
| HP Omen 16-wf000 | |
| Schenker XMG Pro 15 (E23) | |
| Networking / iperf3 receive AXE11000 | |
| Colorful EVOL X15 AT 23 | |
| Alienware m16 R1 Intel | |
| Dell G15 5530 | |
| Average of class Gaming (680 - 1745, n=96, last 2 years) | |
| Acer Predator Helios 16 PH16-71-731Q | |
| Alienware m16 R1 AMD | |
| Average Intel Wi-Fi 6E AX211 (582 - 1890, n=276) | |
| HP Omen 16-wf000 | |
| Uniwill GM6PX7X RTX 4070 | |
| Schenker XMG Pro 15 (E23) | |
| Networking / iperf3 transmit AXE11000 6GHz | |
| Alienware m16 R1 AMD | |
| Acer Predator Helios 16 PH16-71-731Q | |
| Schenker XMG Pro 15 (E23) | |
| Colorful EVOL X15 AT 23 | |
| Average of class Gaming (723 - 2355, n=38, last 2 years) | |
| Average Intel Wi-Fi 6E AX211 (385 - 1851, n=226) | |
| HP Omen 16-wf000 | |
| Networking / iperf3 receive AXE11000 6GHz | |
| Colorful EVOL X15 AT 23 | |
| Schenker XMG Pro 15 (E23) | |
| Average of class Gaming (975 - 1775, n=37, last 2 years) | |
| Alienware m16 R1 AMD | |
| Average Intel Wi-Fi 6E AX211 (700 - 1857, n=226) | |
| Acer Predator Helios 16 PH16-71-731Q | |
| HP Omen 16-wf000 | |
Webcam
Given its primary focus on gaming, the EVOL X15 makes do with a conventional 720p webcam. The webcam is adequate for quick video chats but lacks in color accuracy, reproduction of details, and overall sharpness.


Security
There are no dedicated security features such as biometric logins built in. A TPM 2.0 module is present to meet Windows 11's security requirements.
Accessories and Warranty
There are no separate accessories in the box apart from the 280 W adapter and the usual paperwork. The Colorful EVOL X15 AT ships with a two-year standard warranty.
Maintenance
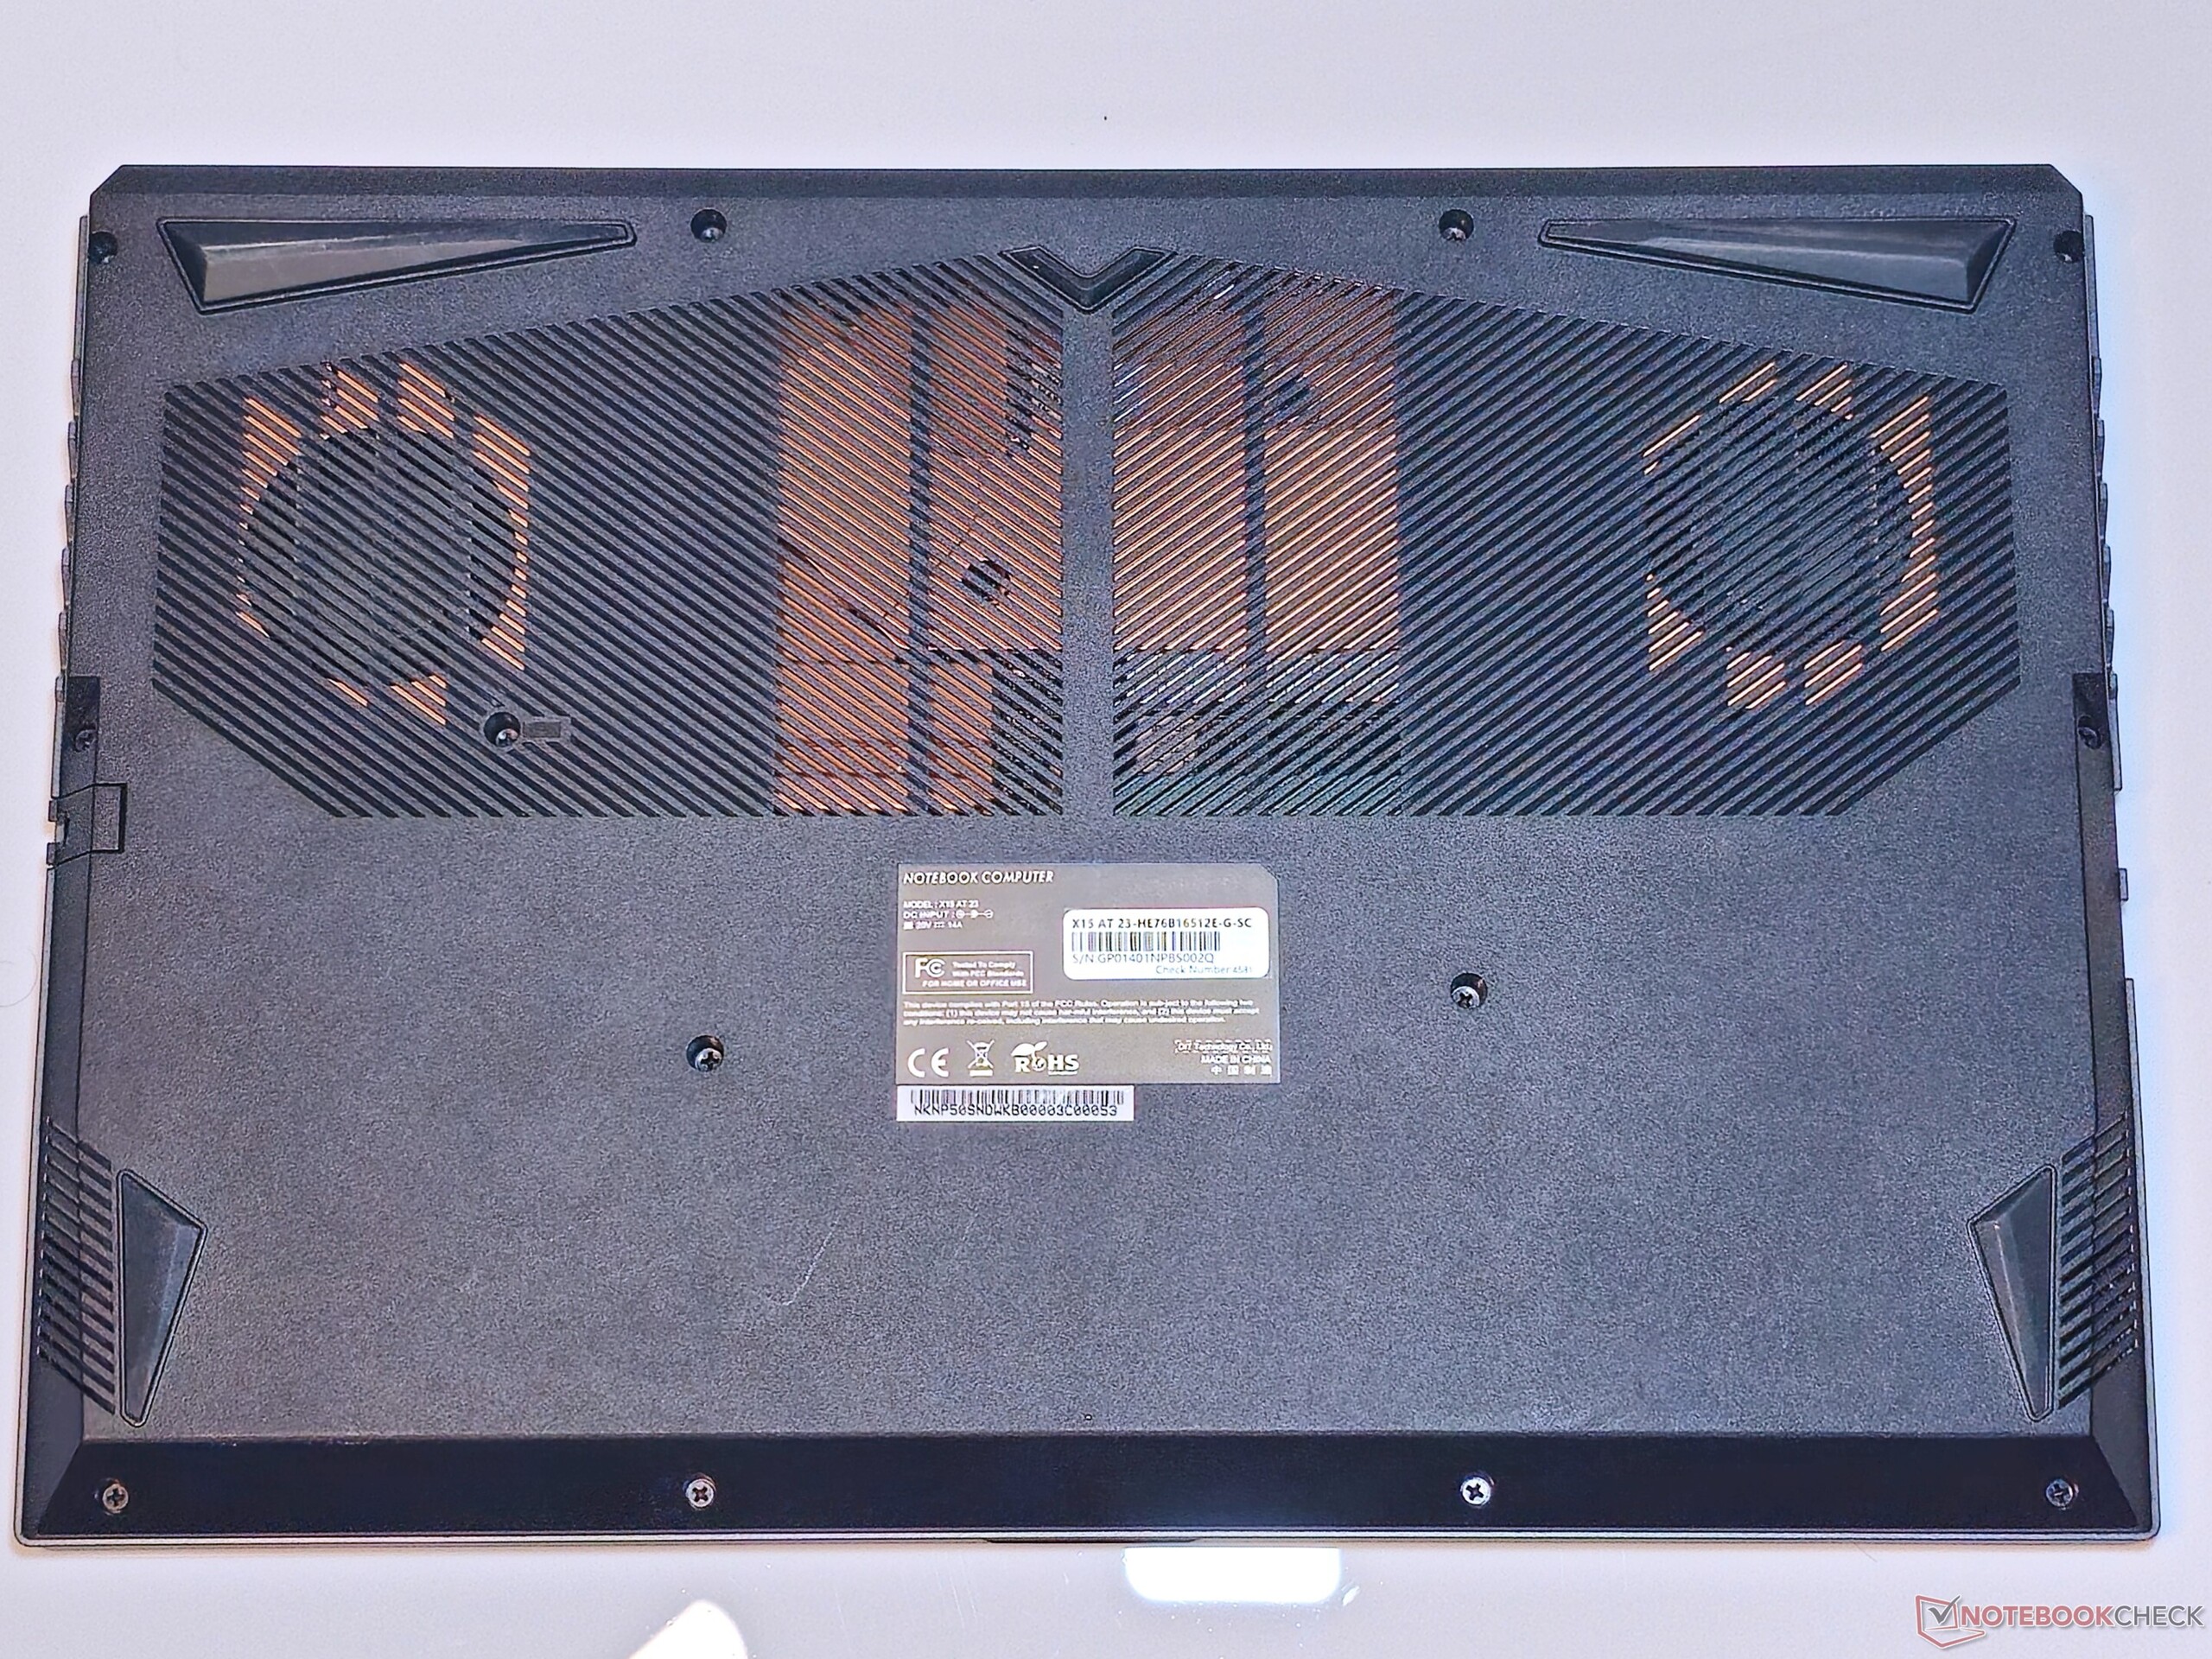
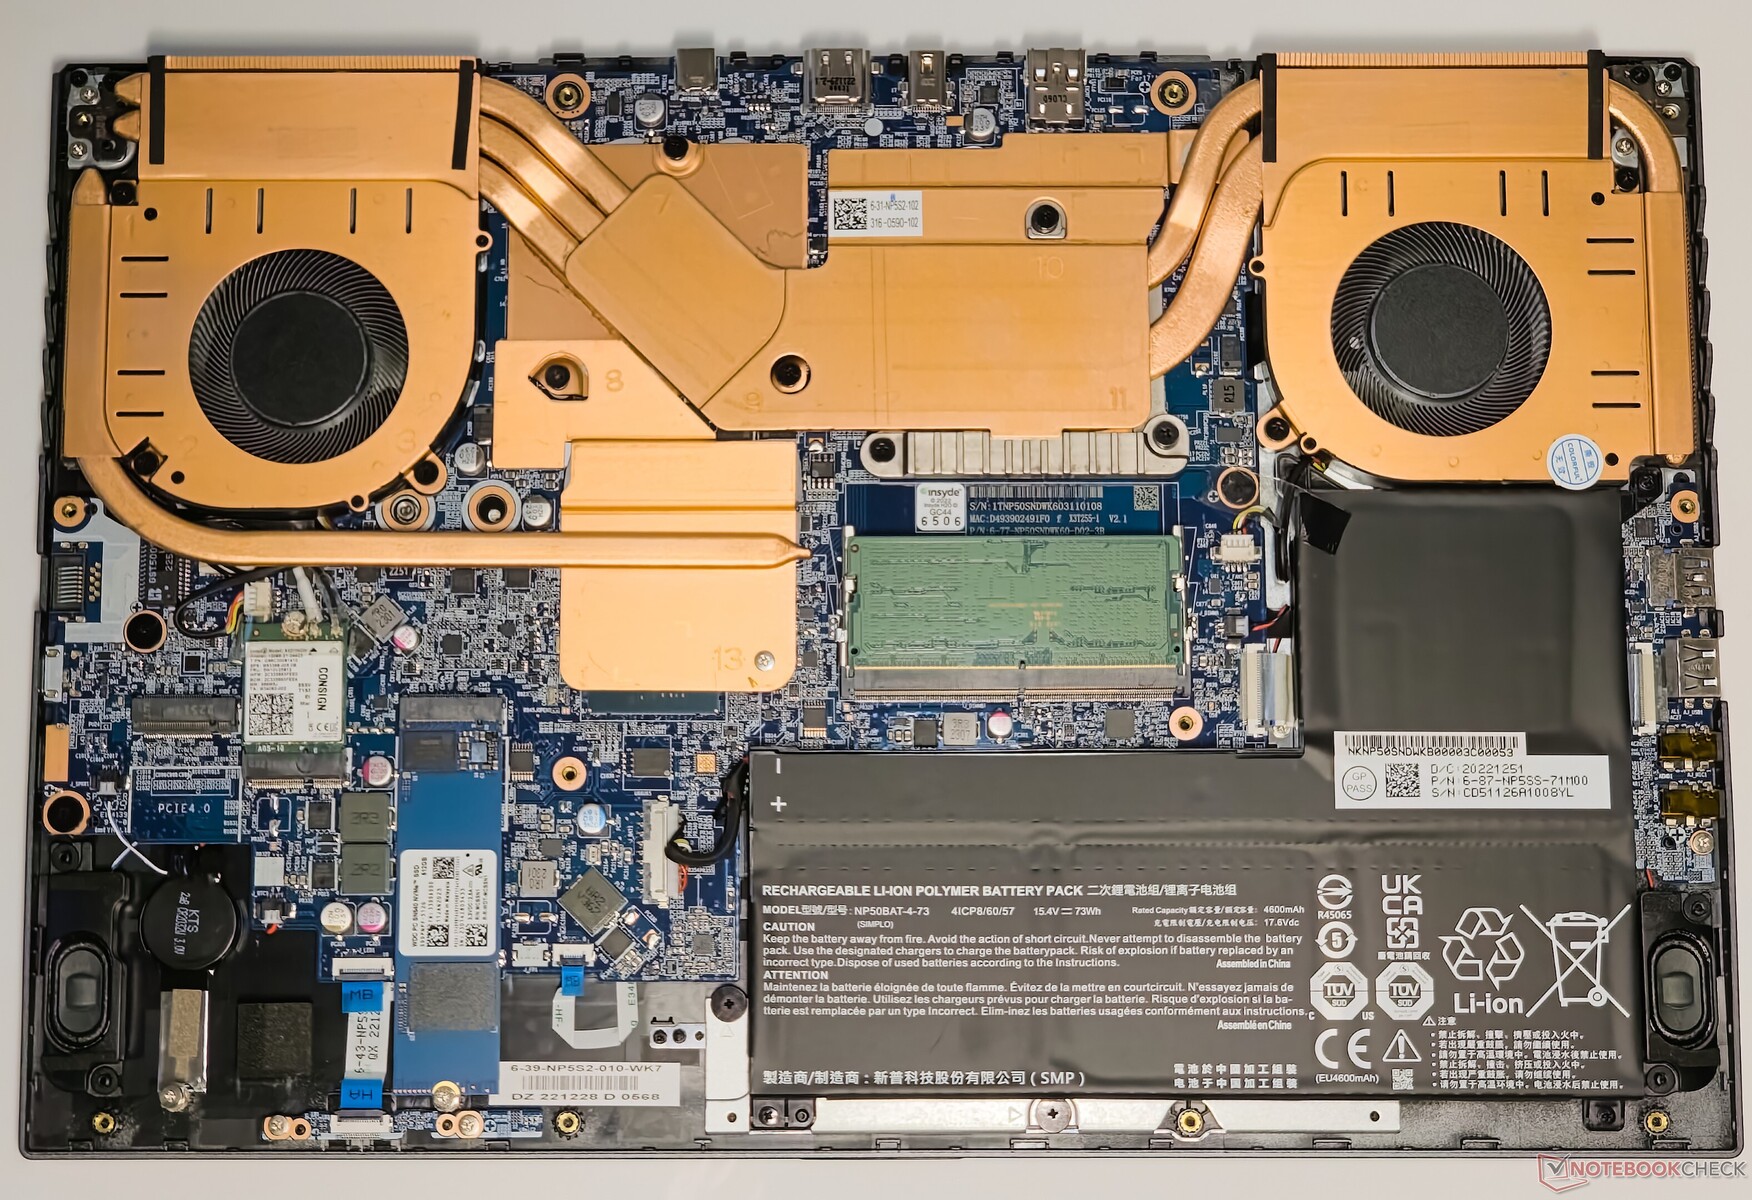
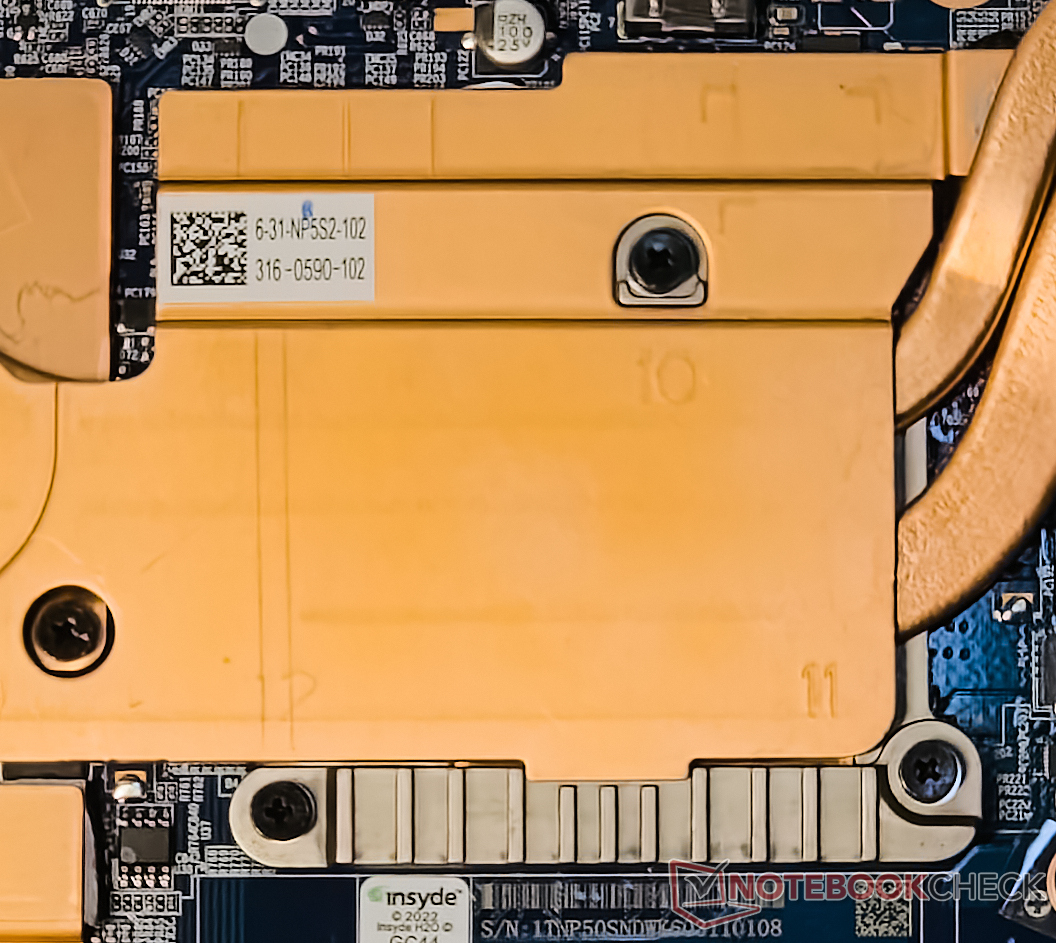
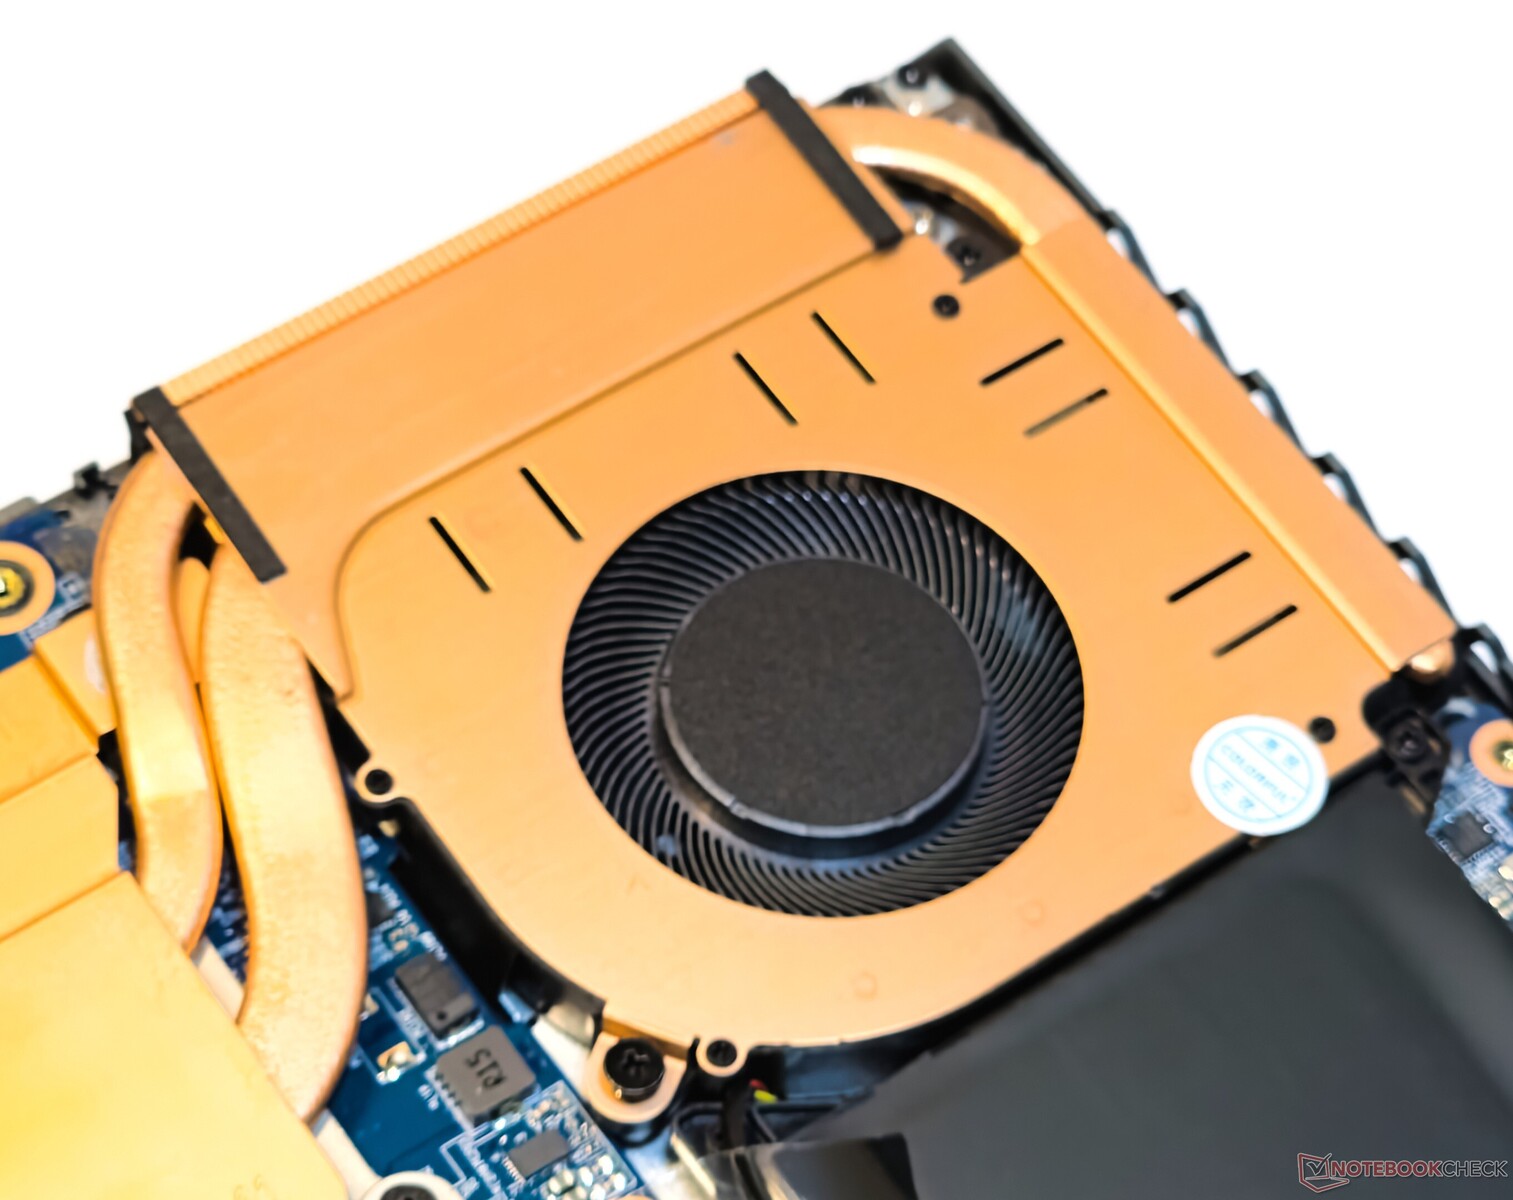
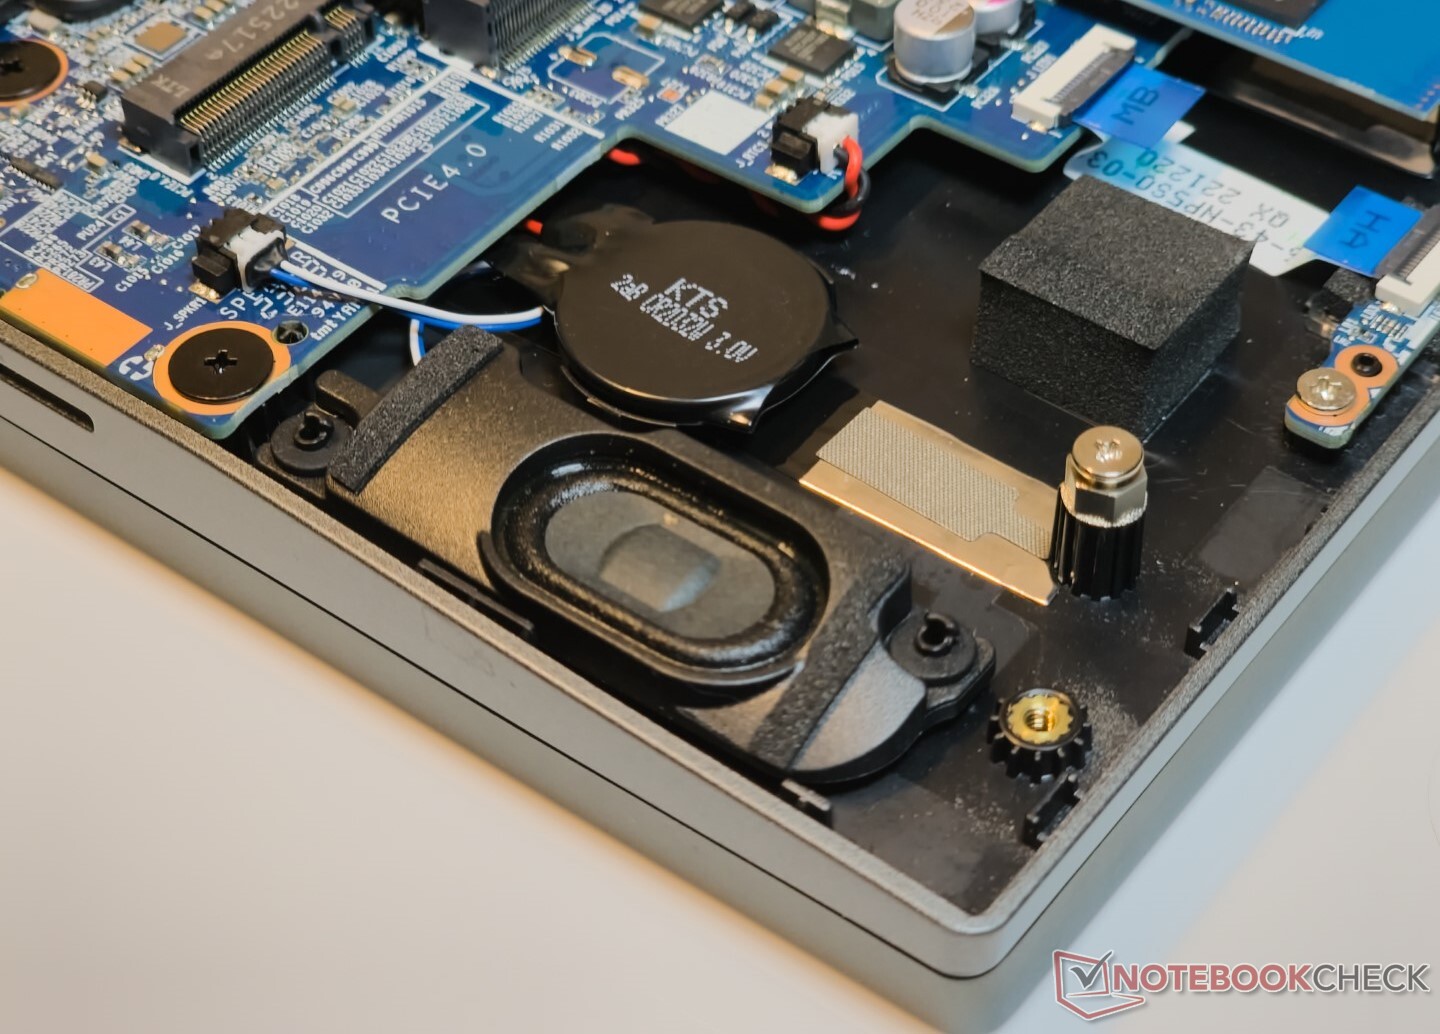
The back panel easily comes off after removing the 13 PH0 screws. The EVOL X15 shows a busy internal layout together with an extensive all-copper cooling system for the CPU and the GPU.
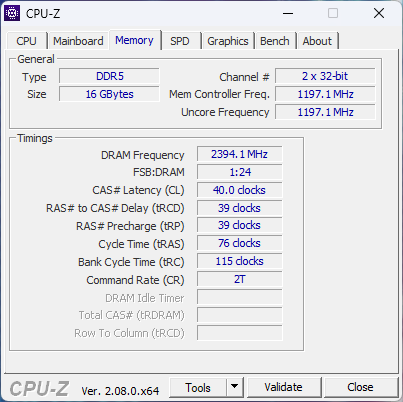
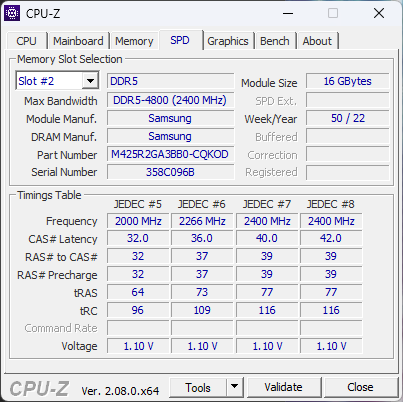
Our unit came with only a single 16 GB DDR5-4800 stick configured in dual-channel mode. The WLAN card, RAM, and NVMe SSD can be replaced or upgraded as necessary, and the L-shaped battery pack can be unscrewed.
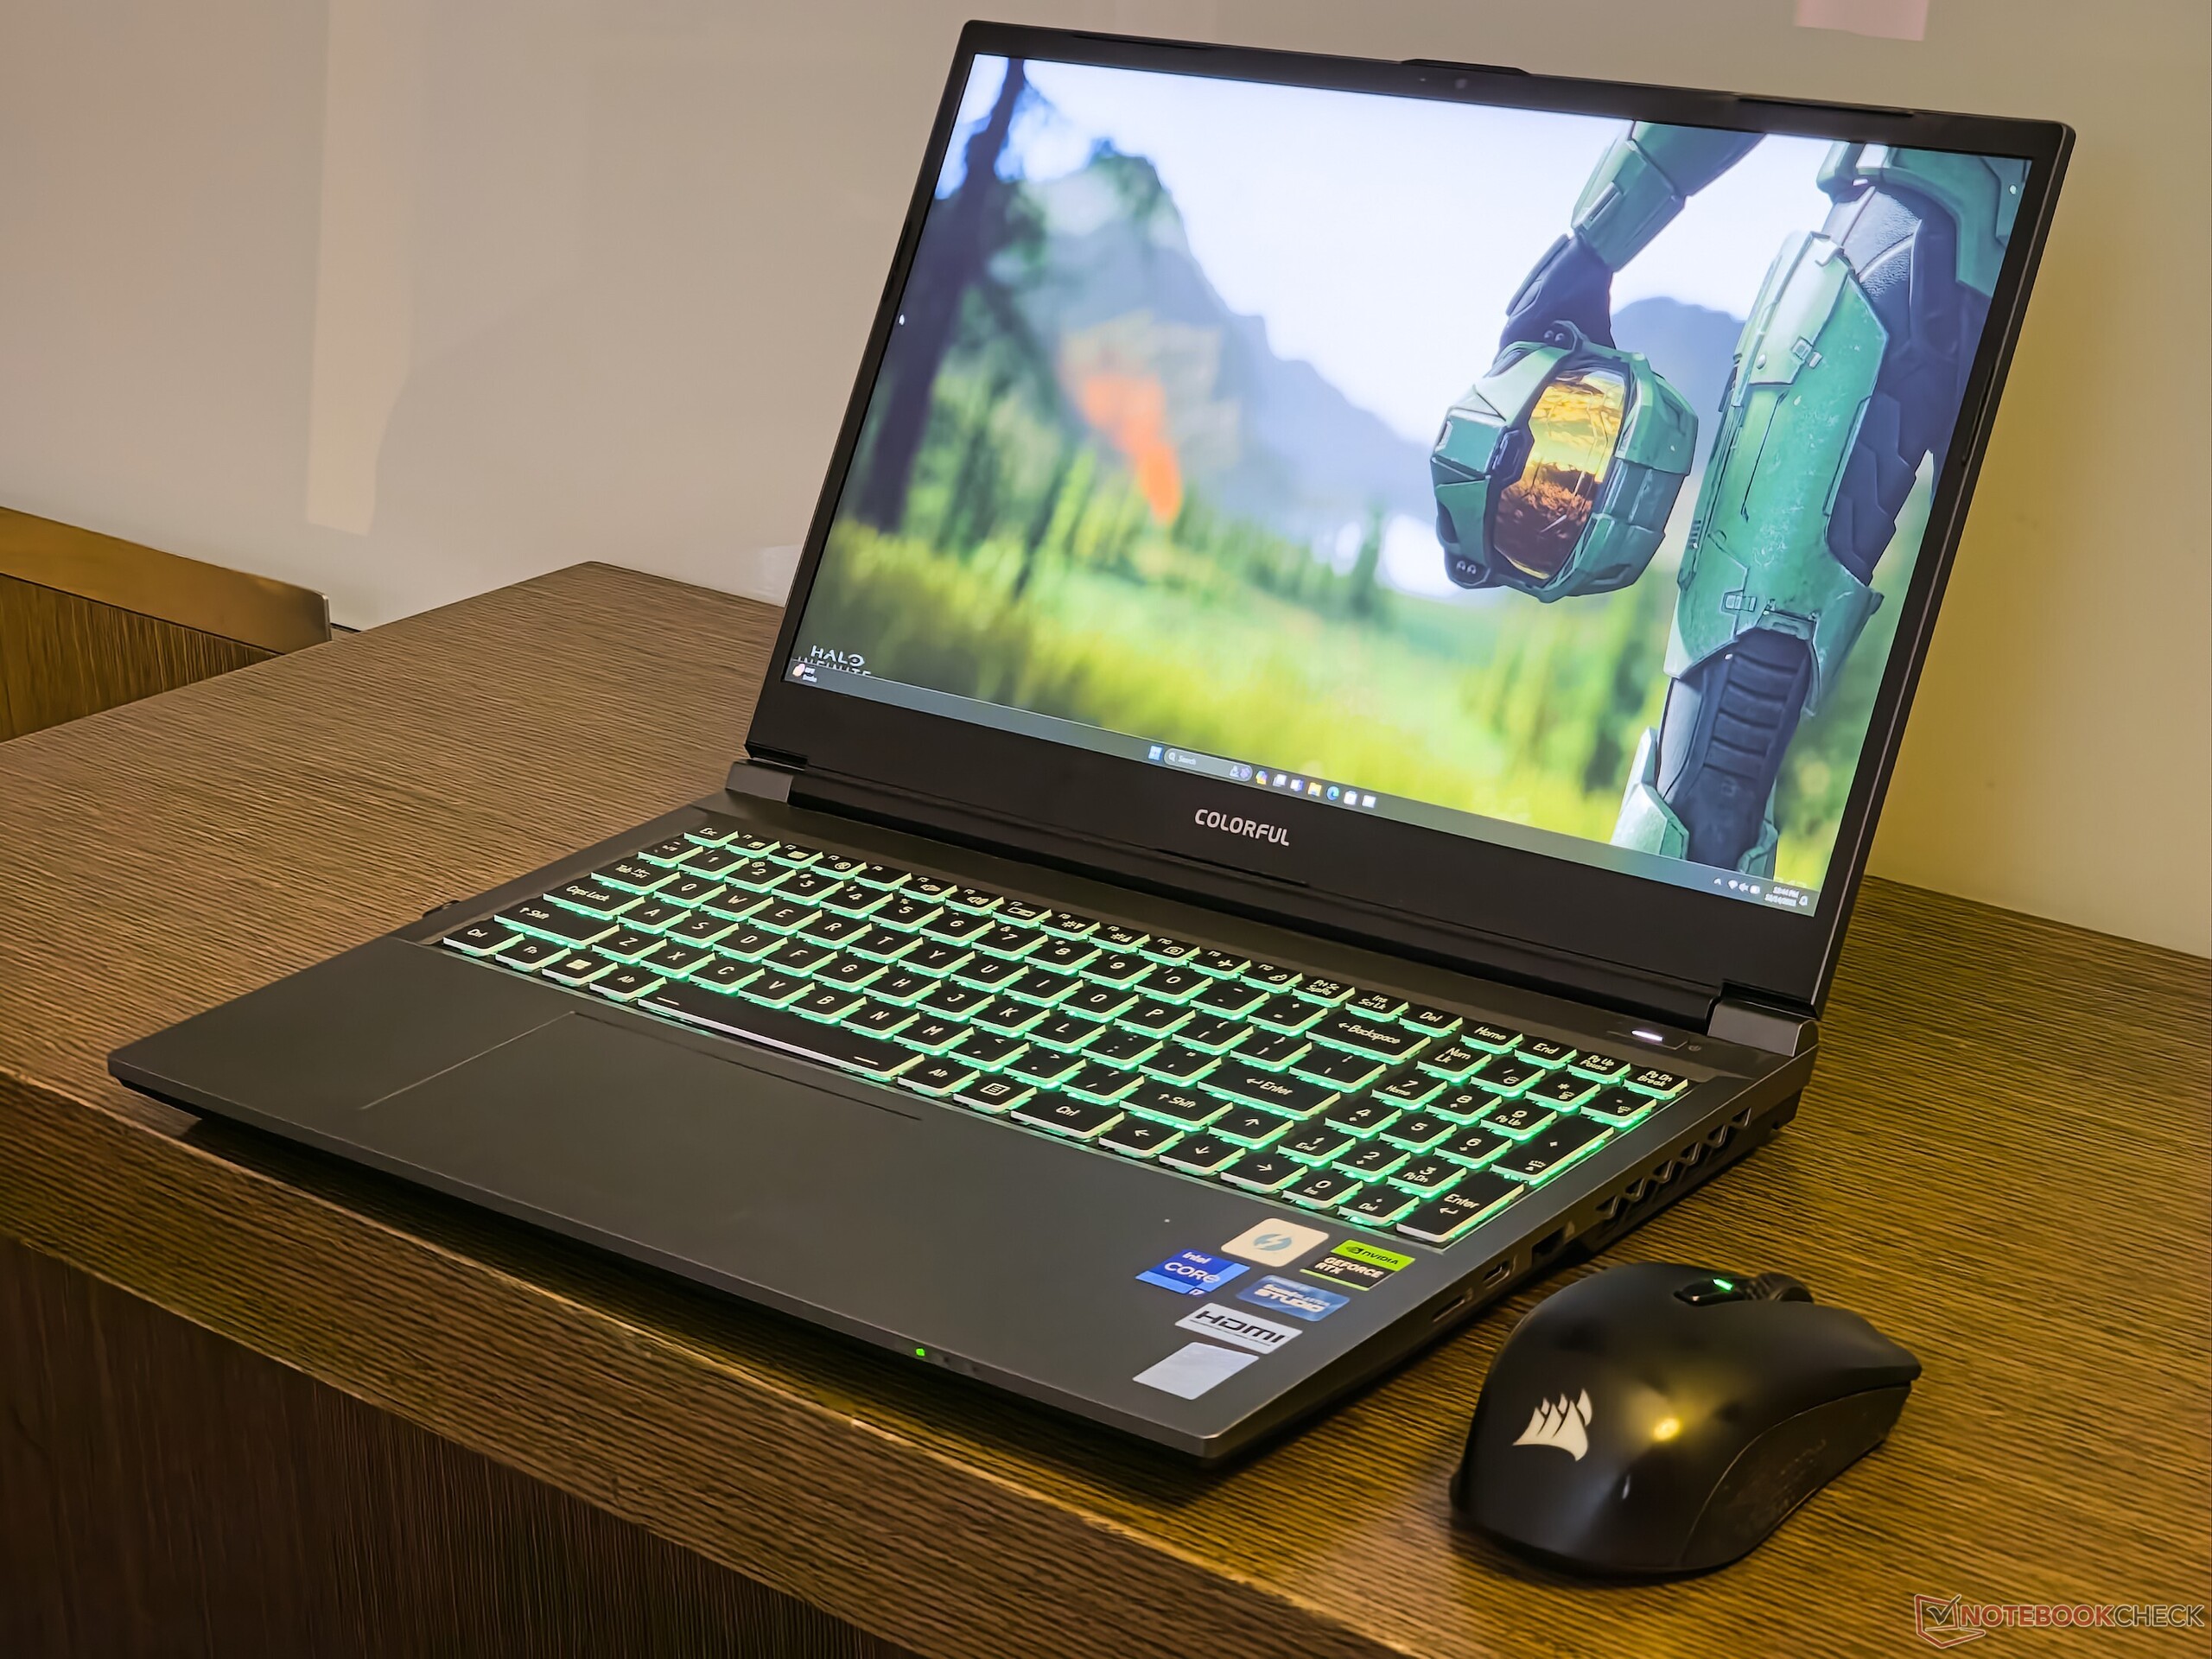
Input Devices: Mushy keys with decent tactility
Keyboard
The EVOL X15's full-sized keyboard includes a number pad and room for properly sized arrow keys — a boon for racing titles. One drawback of this layout is the shortened Right Shift key, which could trip up users transitioning from a typical desktop or even a laptop keyboard.
Key travel initially feels a bit mushy, but there's enough tactility for gaming and typing. Colorful's (read Clevo's) Control Center app allows keyboard and mouse macro recording, which should come in handy for MMORPG and MOBA gamers.
There's no multi-zone or per-key RGB backlighting, so you will have to contend with a limited color palette in the Control Center app. The backlight can be adjusted in four stages, but the keys filter out a good amount of light from passing through.
Touchpad
The 12 cm x 7 cm touchpad isn't the largest we've seen in gaming laptops this year, but it offers a relatively smooth gliding experience and fully supports Windows Precision gestures.
The entire touchpad surface serves as a left mouse button. However, clicks are easier and less noisy in the central and bottom regions of the touchpad compared to the top corners.
Display: 165 Hz QHD panel with no PWM
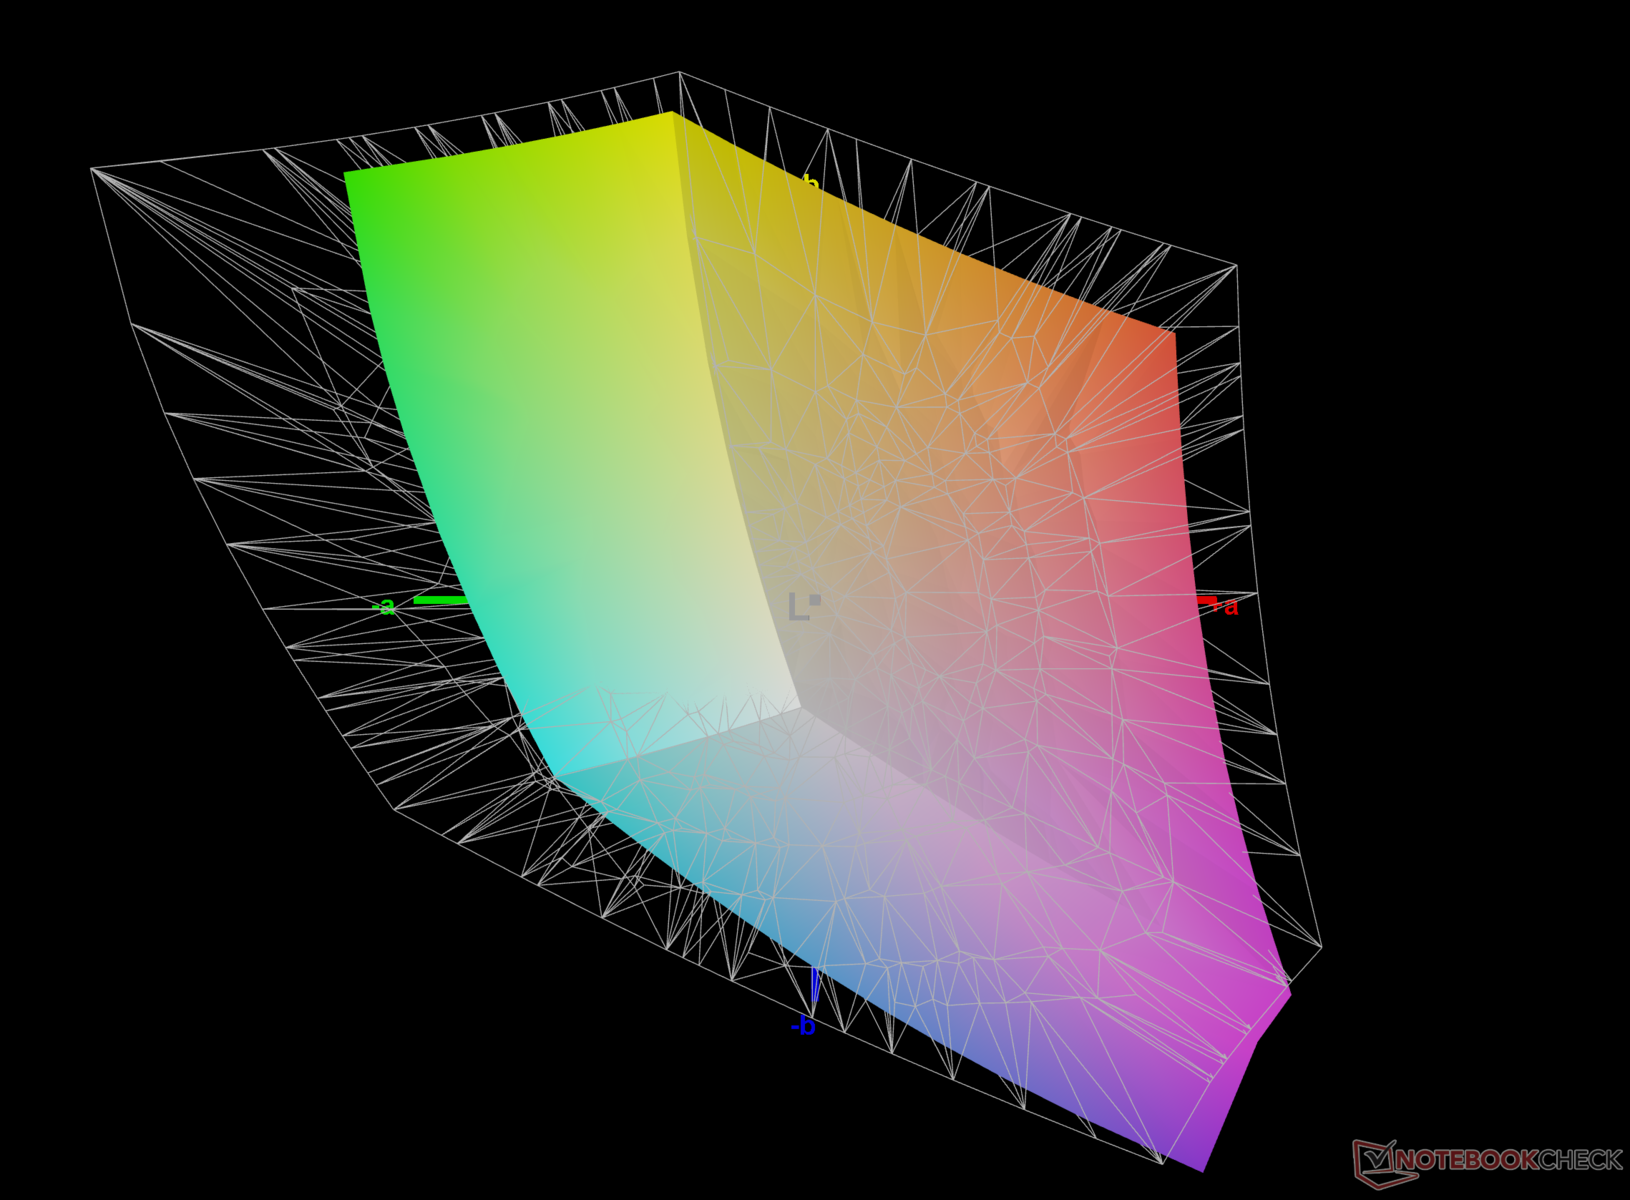
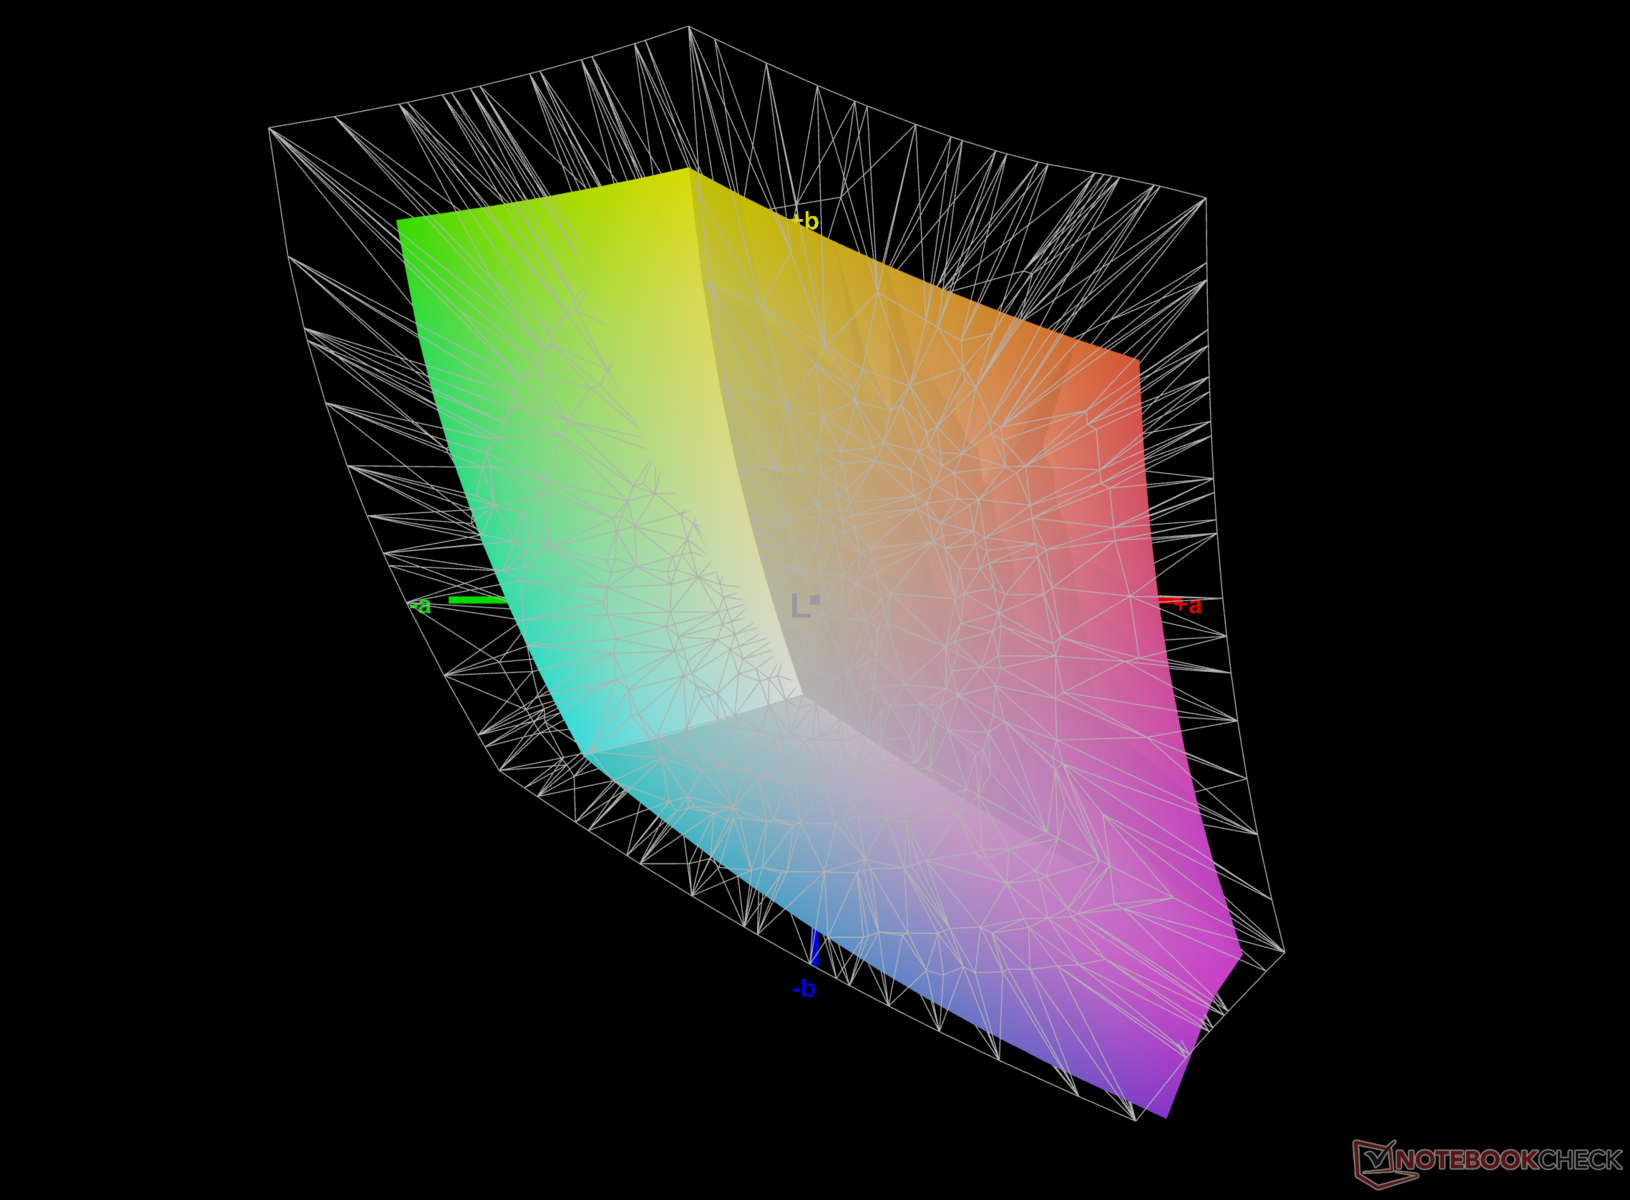
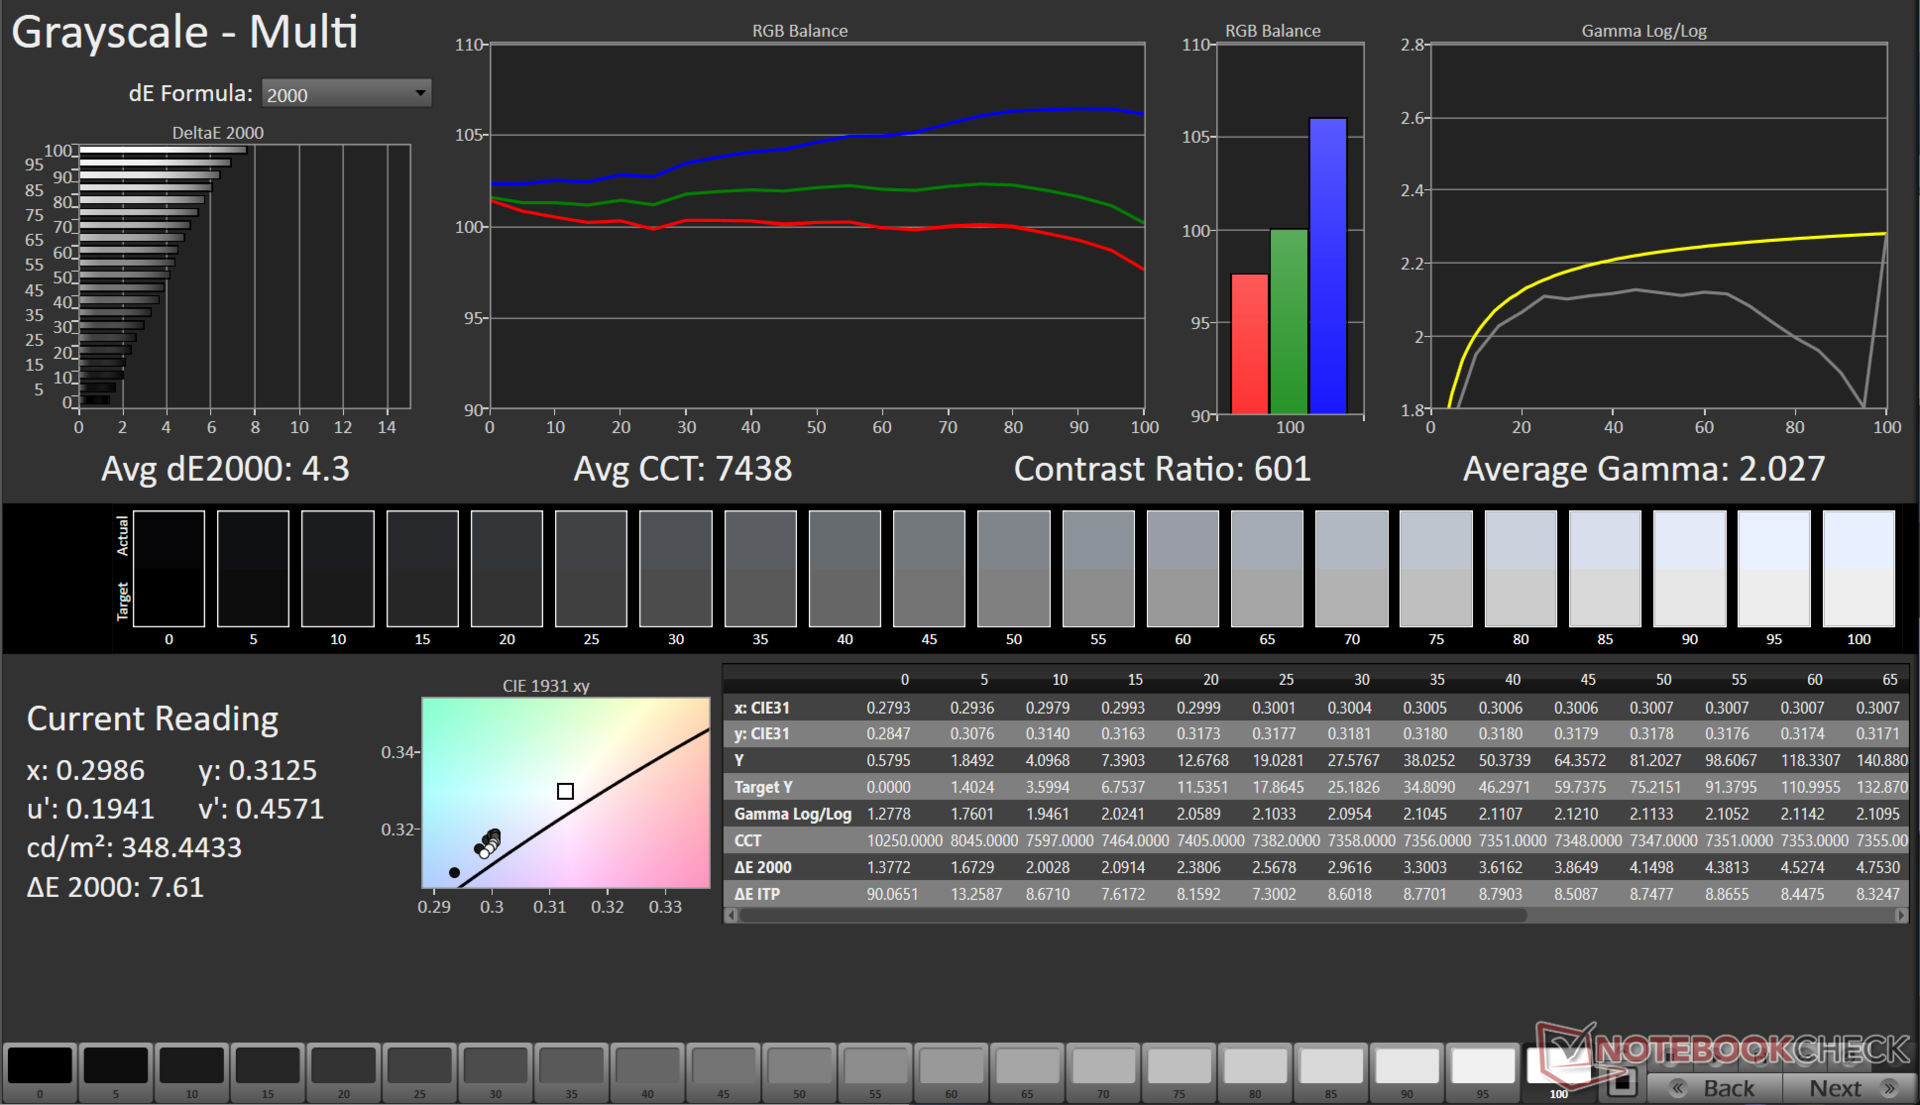
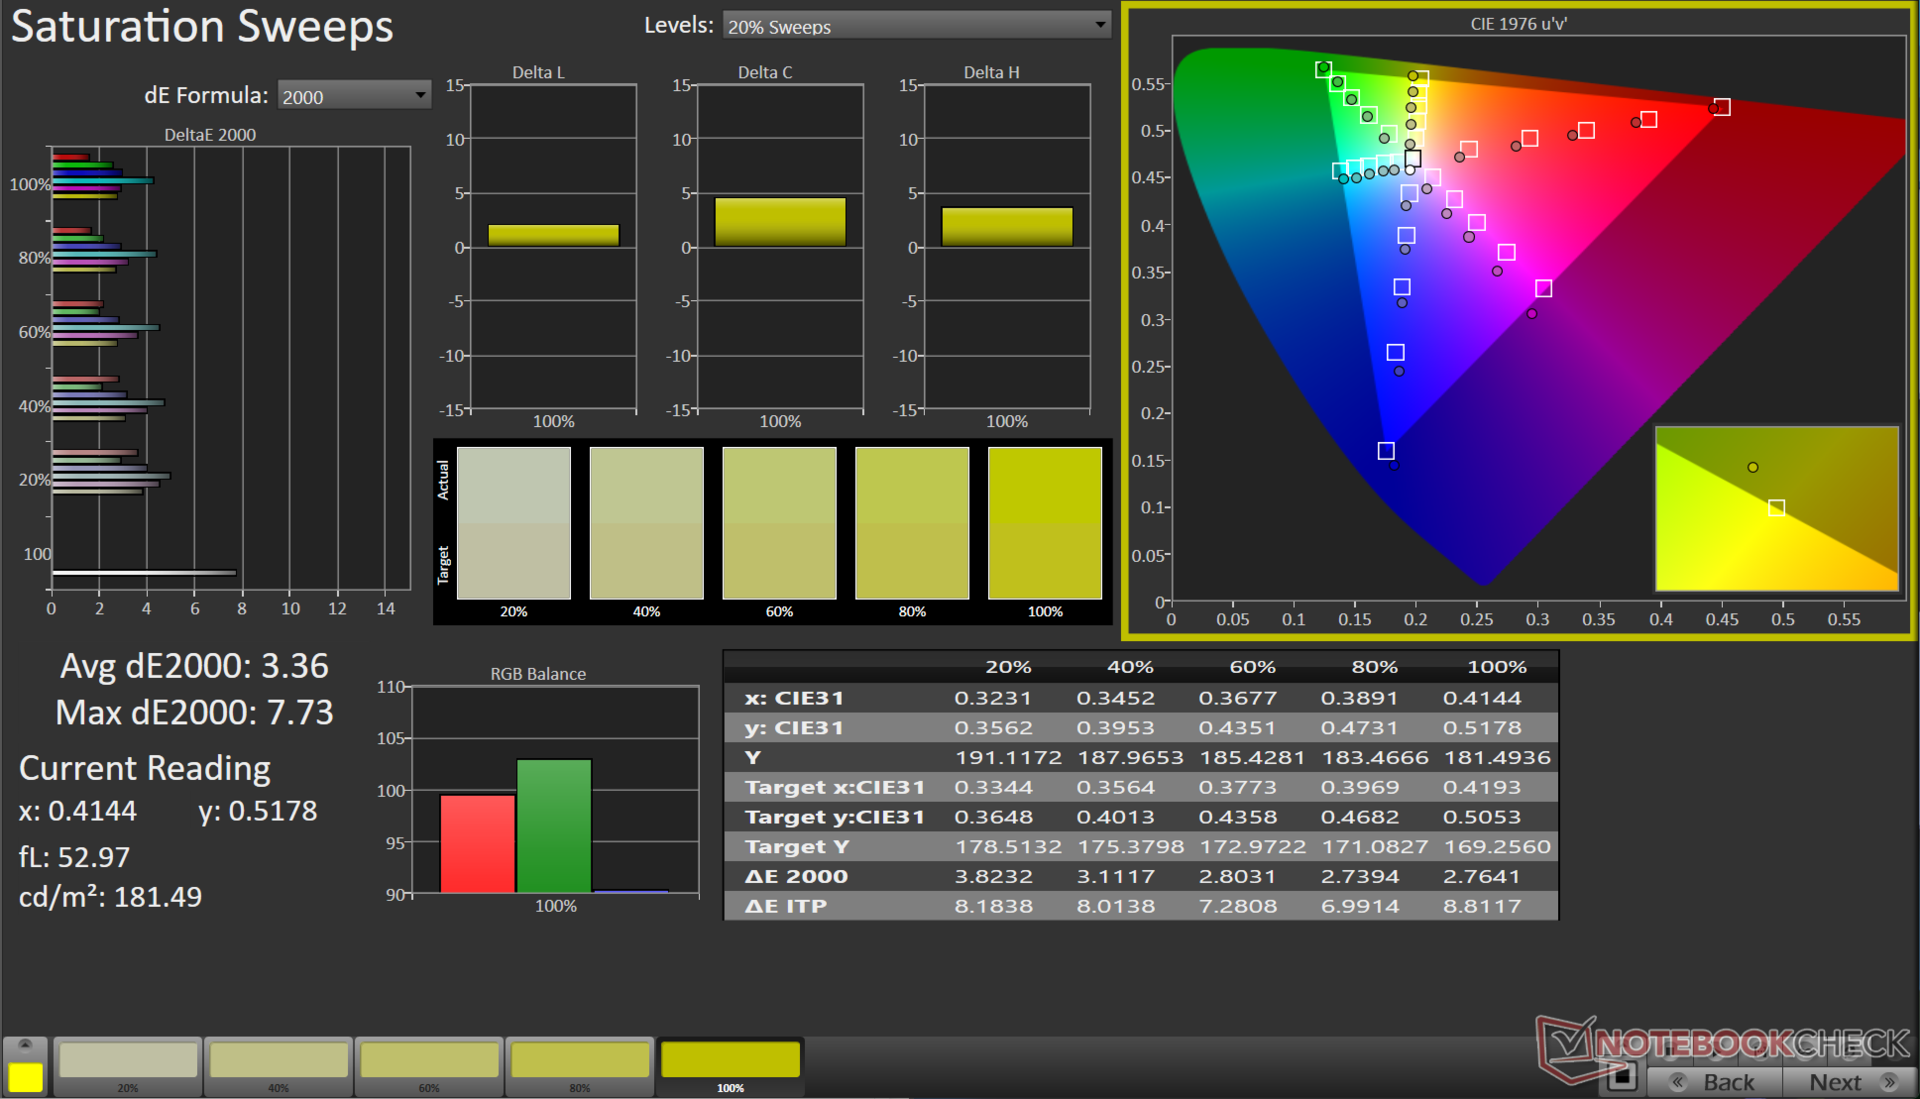
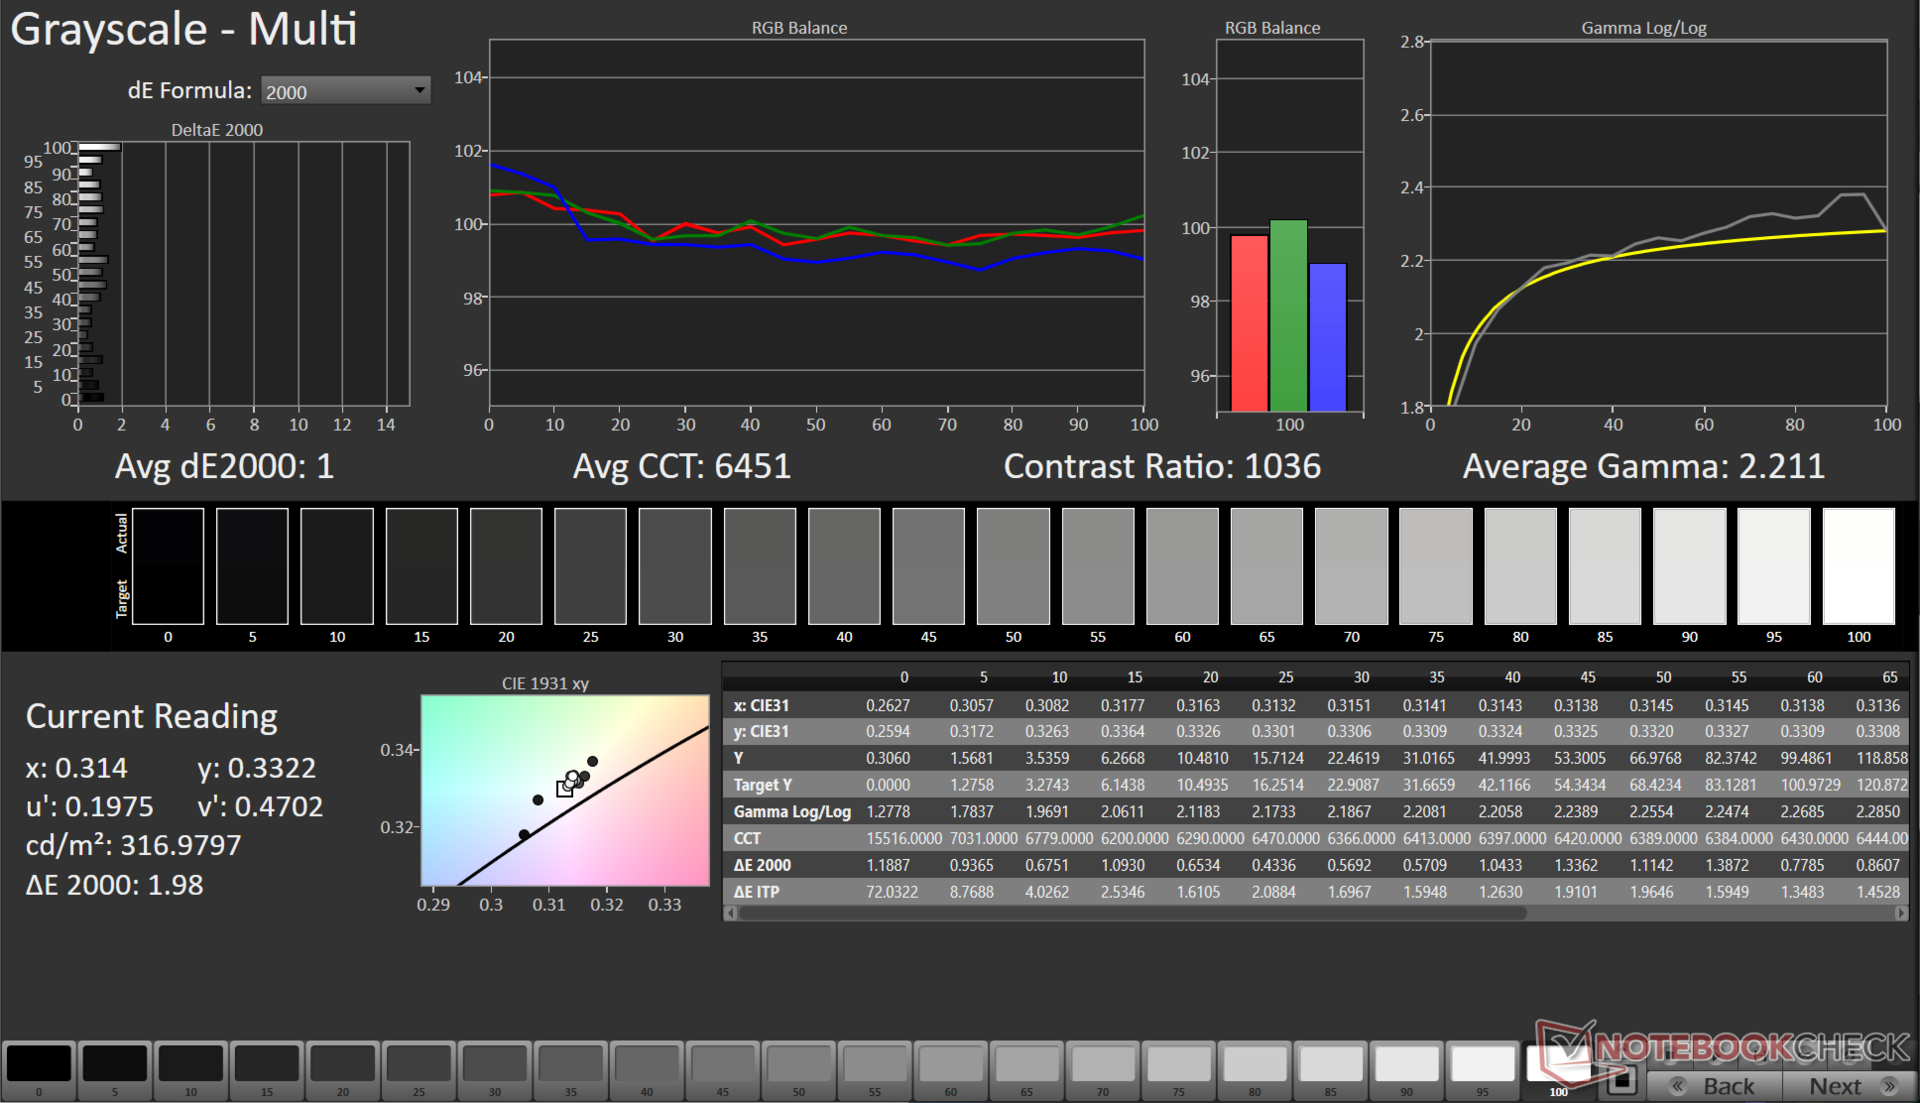
The EVOL X15 AT comes equipped with a 15.6-inch QHD 165 Hz BOE panel. The display doesn't exactly wow you with its 345 nits peak and 318 nits average luminance, but this is on par with most gaming laptops at this price. Minimal backlight bleeding is observed at the corners.
The panel exhibits a decent 81% brightness distribution, but the measured 607:1 contrast ratio is on the lower end especially when compared to other BOE panels in this comparison.

| |||||||||||||||||||||||||
Brightness Distribution: 81 %
Center on Battery: 251 cd/m²
Contrast: 607:1 (Black: 0.57 cd/m²)
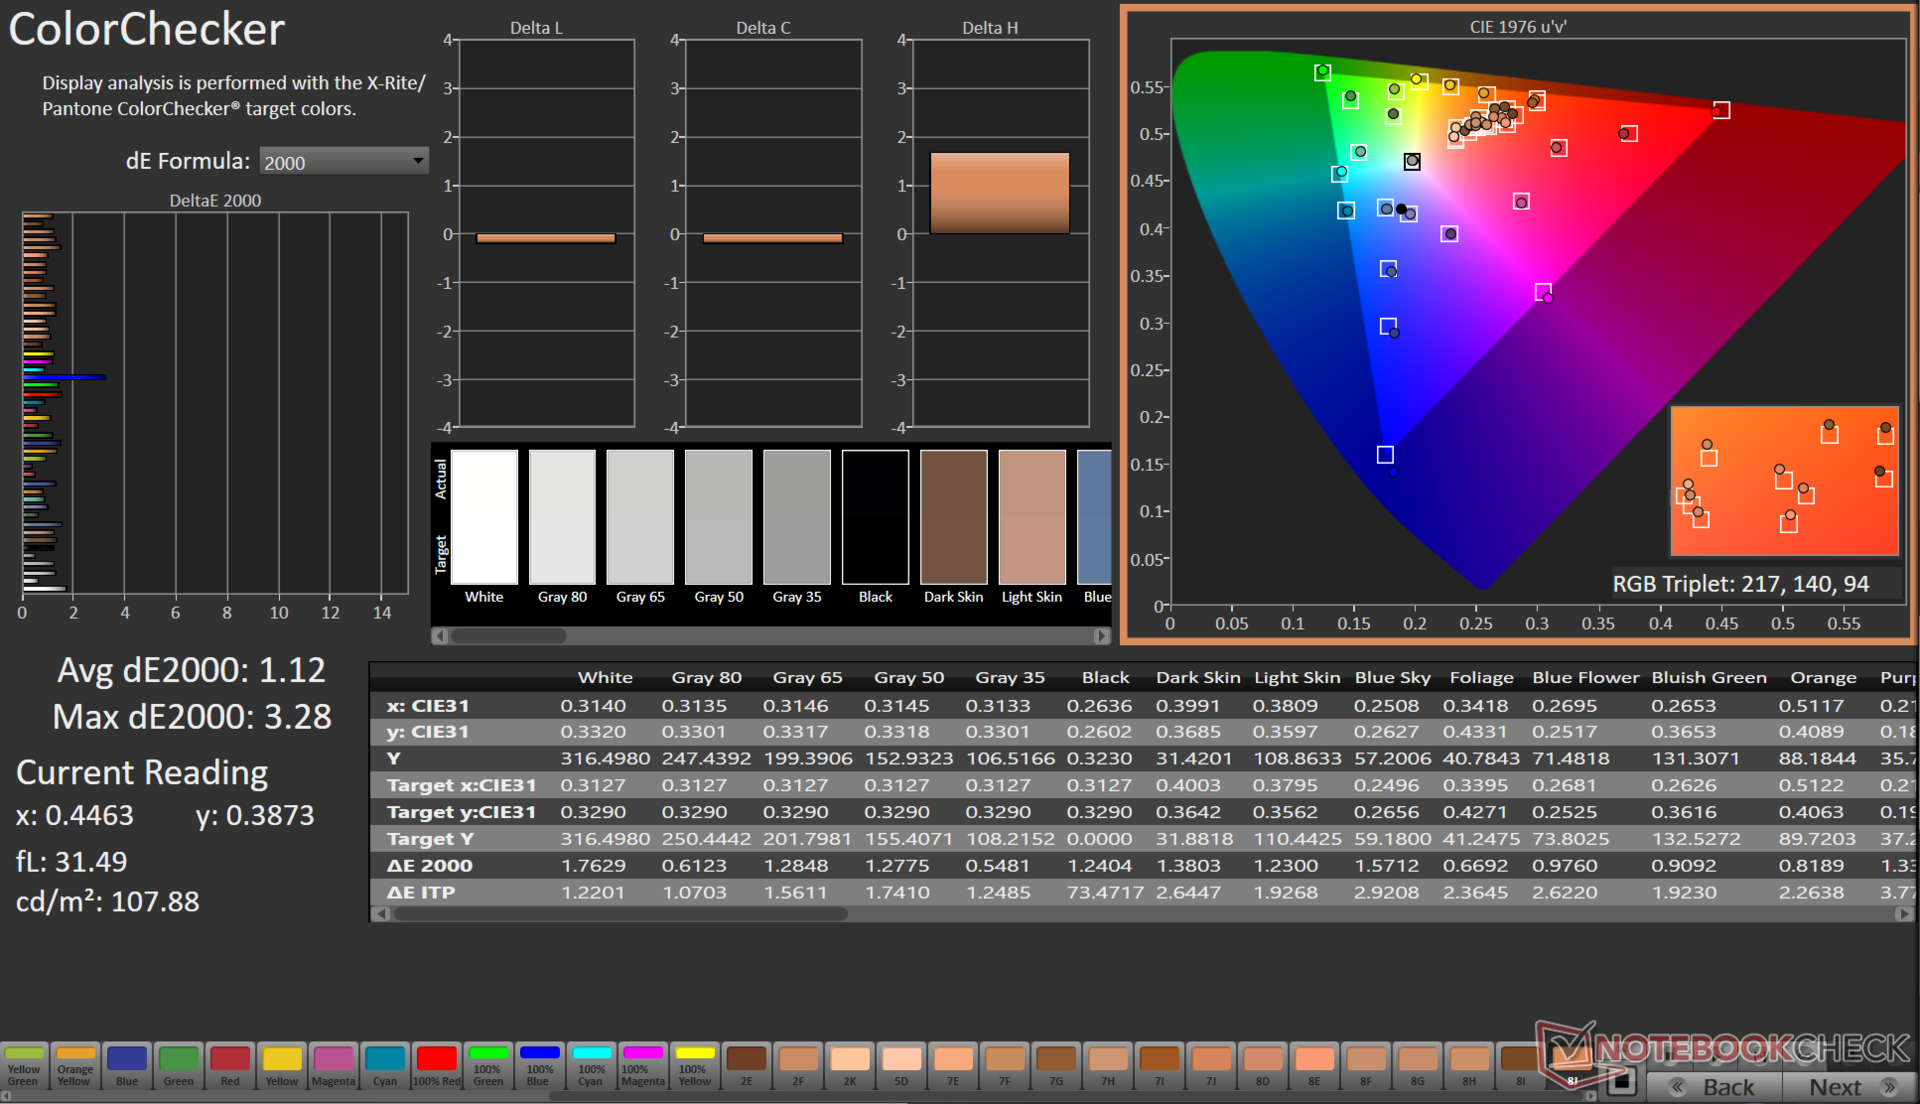
ΔE ColorChecker Calman: 3.08 | ∀{0.5-29.43 Ø4.73}
calibrated: 1.12
ΔE Greyscale Calman: 4.3 | ∀{0.09-98 Ø4.97}
68.2% AdobeRGB 1998 (Argyll 3D)
97.4% sRGB (Argyll 3D)
66.9% Display P3 (Argyll 3D)
Gamma: 2.02
CCT: 7438 K
| Colorful EVOL X15 AT 23 BOE CQ NE156QHM-NY2, IPS, 2560x1440, 15.6" | Alienware m16 R1 Intel BOE NE16NYB, IPS, 2560x1600, 16" | HP Omen 16-wf000 BOE0B7D, IPS, 2560x1440, 16.1" | Acer Predator Helios 16 PH16-71-731Q BOE NE160QDM-NZ2, IPS-LED, 2560x1600, 16" | Dell G15 5530 AUO B156HAN, IPS, 1920x1080, 15.6" | Schenker XMG Pro 15 (E23) BOE0AD1, IPS, 2560x1440, 15.6" | Alienware m16 R1 AMD BOE NE16NZ4, IPS, 2560x1600, 16" | Uniwill GM6PX7X RTX 4070 BOE CQ NE160QDM-NZ1, IPS, 2560x1600, 16" | |
|---|---|---|---|---|---|---|---|---|
| Display | 1% | 3% | 24% | 6% | 25% | 27% | 0% | |
| Display P3 Coverage (%) | 66.9 | 67.7 1% | 69 3% | 97.1 45% | 73.1 9% | 97.8 46% | 98.6 47% | 67.5 1% |
| sRGB Coverage (%) | 97.4 | 97.2 0% | 99.2 2% | 100 3% | 98.4 1% | 99.9 3% | 99.9 3% | 96.4 -1% |
| AdobeRGB 1998 Coverage (%) | 68.2 | 70 3% | 71.2 4% | 84.7 24% | 74.4 9% | 85.4 25% | 88.9 30% | 68.6 1% |
| Response Times | 35% | 16% | -7% | 49% | -29% | 18% | -23% | |
| Response Time Grey 50% / Grey 80% * (ms) | 10.42 ? | 4 ? 62% | 4.6 ? 56% | 13.6 ? -31% | 3.39 ? 67% | 14 ? -34% | 5.1 ? 51% | 12.6 ? -21% |
| Response Time Black / White * (ms) | 7.81 ? | 7.3 ? 7% | 9.7 ? -24% | 6.4 ? 18% | 5.35 ? 31% | 9.6 ? -23% | 9 ? -15% | 9.8 ? -25% |
| PWM Frequency (Hz) | 21620 ? | |||||||
| Screen | 24% | 28% | 42% | 7% | 12% | 0% | 22% | |
| Brightness middle (cd/m²) | 346 | 306 -12% | 310.9 -10% | 511 48% | 320 -8% | 322 -7% | 329 -5% | 338.6 -2% |
| Brightness (cd/m²) | 318 | 302 -5% | 296 -7% | 498 57% | 316 -1% | 301 -5% | 317 0% | 328 3% |
| Brightness Distribution (%) | 81 | 89 10% | 91 12% | 94 16% | 94 16% | 85 5% | 89 10% | 89 10% |
| Black Level * (cd/m²) | 0.57 | 0.3 47% | 0.35 39% | 0.36 37% | 0.21 63% | 0.36 37% | 0.32 44% | 0.32 44% |
| Contrast (:1) | 607 | 1020 68% | 888 46% | 1419 134% | 1524 151% | 894 47% | 1028 69% | 1058 74% |
| Colorchecker dE 2000 * | 3.08 | 2.57 17% | 2.18 29% | 1.76 43% | 4.55 -48% | 1.98 36% | 3.71 -20% | 2.18 29% |
| Colorchecker dE 2000 max. * | 7.62 | 4.26 44% | 3.58 53% | 3.7 51% | 9.83 -29% | 5.24 31% | 7.23 5% | 7.14 6% |
| Colorchecker dE 2000 calibrated * | 1.12 | 0.85 24% | 0.52 54% | 1.56 -39% | 1.51 -35% | 1.98 -77% | 2.82 -152% | 0.93 17% |
| Greyscale dE 2000 * | 4.3 | 3.3 23% | 2.8 35% | 3 30% | 6.2 -44% | 2.44 43% | 2.2 49% | 3.7 14% |
| Gamma | 2.02 109% | 1.997 110% | 2.18 101% | 2.33 94% | 2.07 106% | 2.42 91% | 2.3 96% | 2.18 101% |
| CCT | 7438 87% | 6895 94% | 6002 108% | 6341 103% | 6479 100% | 6984 93% | 6270 104% | 7245 90% |
| Total Average (Program / Settings) | 20% /
21% | 16% /
21% | 20% /
31% | 21% /
13% | 3% /
9% | 15% /
8% | -0% /
11% |
* ... smaller is better
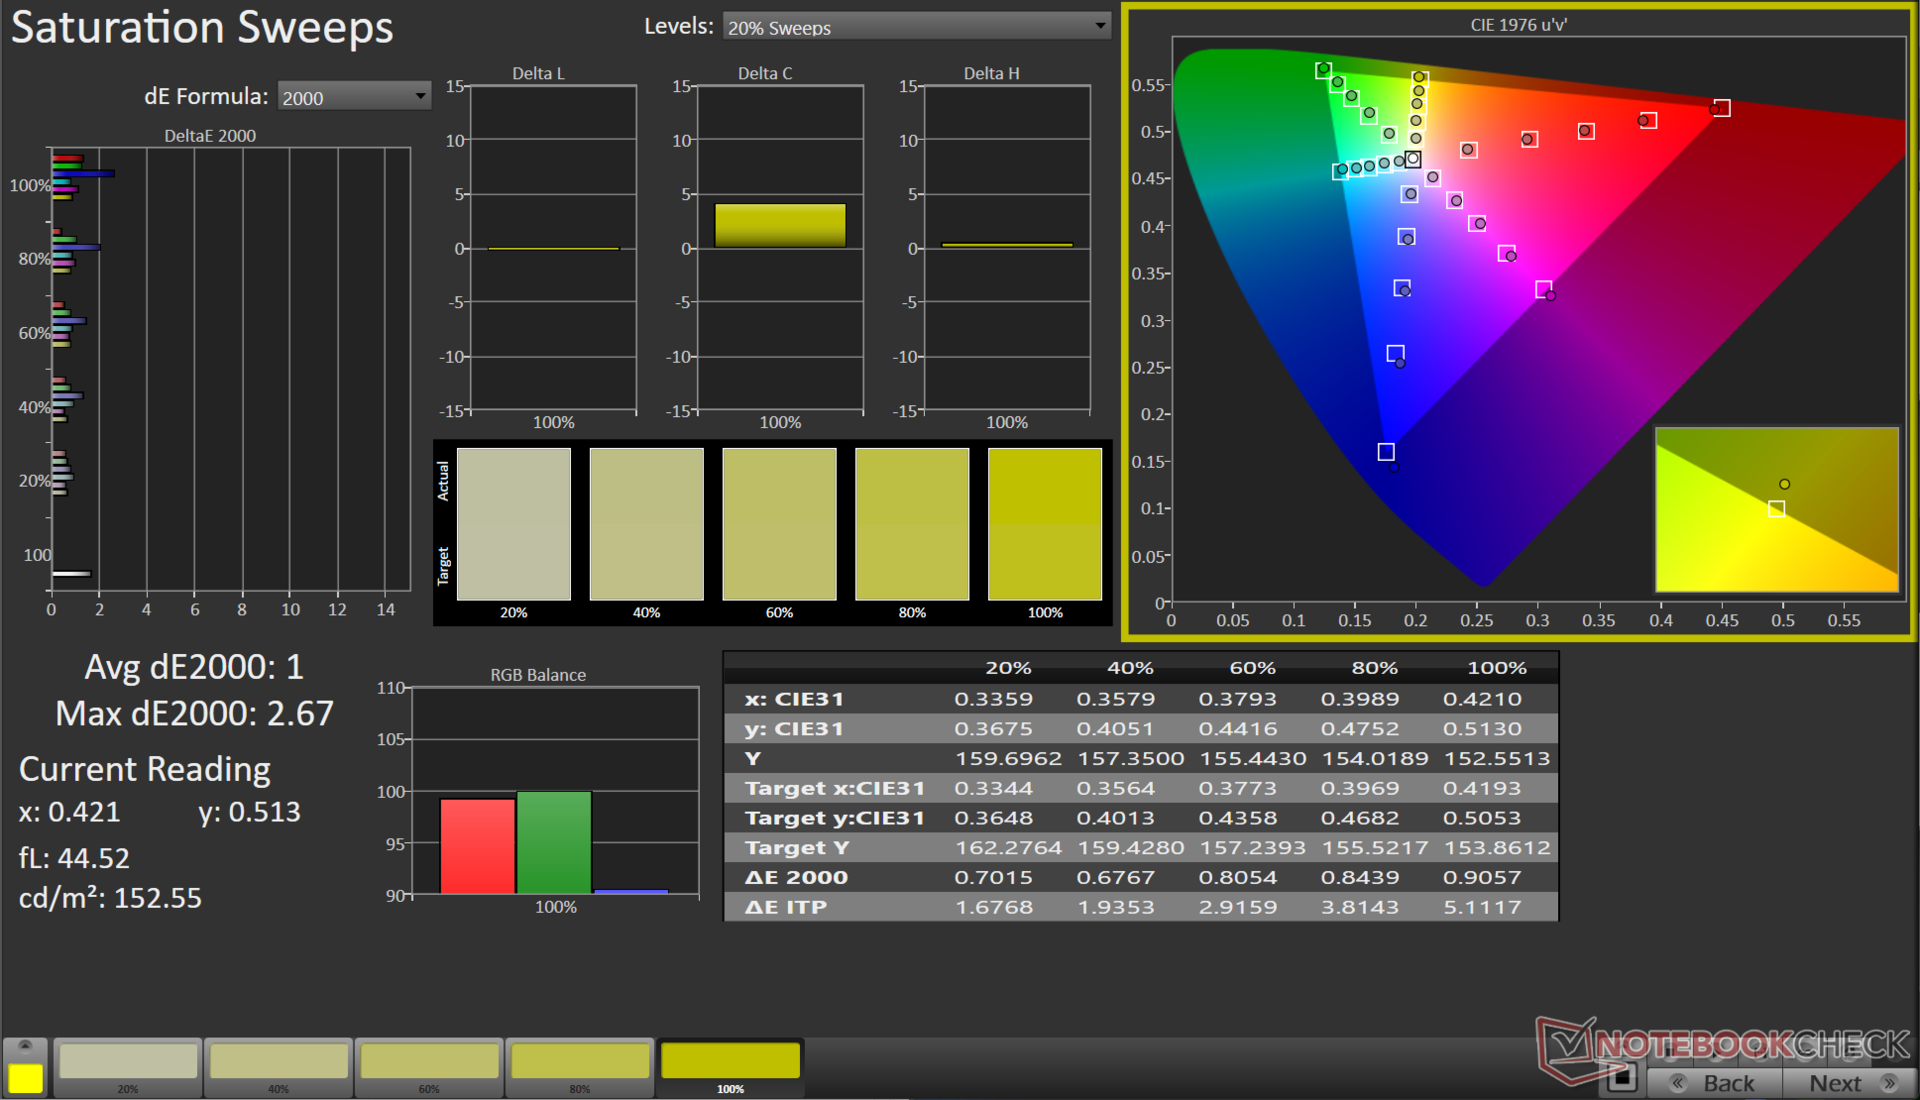
The EVOL X15 is not aimed at content creators, but the 97% sRGB coverage augurs well for gaming, web, and basic edits. Creators wishing to make use of the EVOL X15's capable hardware can use an external display to augment color performance.
The display's out-of-the-box color reproduction is serviceable for the most part, with average Grayscale and ColorChecker Delta E 2000 values of 4.3 and 3.08, respectively.
Our calibration routine, using the X-Rite i1Basic Pro 3 spectrophotometer and Portrait Display's Calman Ultimate software, considerably improves these corresponding values to 1 and 1.12.

The calibrated ICC file can be downloaded from the link above.
Display Response Times
| ↔ Response Time Black to White | ||
|---|---|---|
| 7.81 ms ... rise ↗ and fall ↘ combined | ↗ 4.01 ms rise | 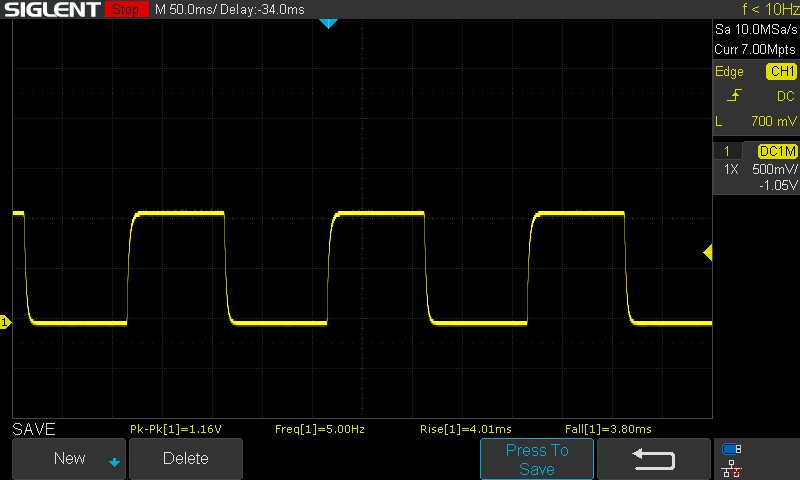 |
| ↘ 3.8 ms fall | ||
| The screen shows very fast response rates in our tests and should be very well suited for fast-paced gaming. In comparison, all tested devices range from 0.1 (minimum) to 240 (maximum) ms. » 22 % of all devices are better. This means that the measured response time is better than the average of all tested devices (19.9 ms). | ||
| ↔ Response Time 50% Grey to 80% Grey | ||
| 10.42 ms ... rise ↗ and fall ↘ combined | ↗ 4.73 ms rise | 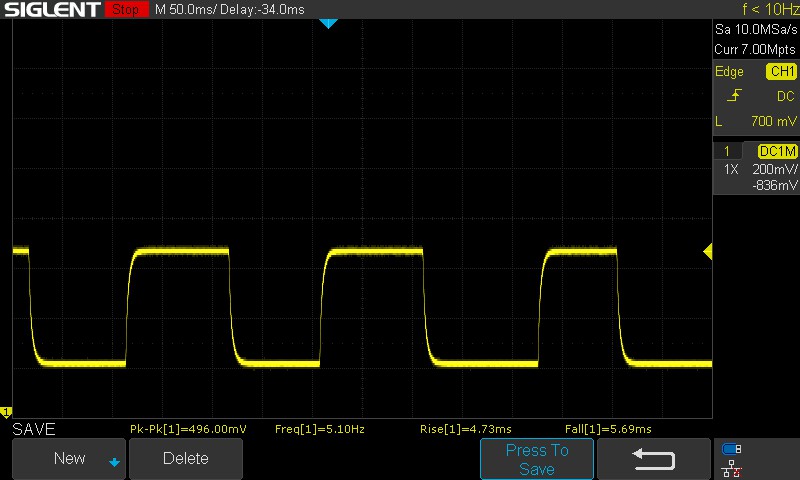 |
| ↘ 5.69 ms fall | ||
| The screen shows good response rates in our tests, but may be too slow for competitive gamers. In comparison, all tested devices range from 0.165 (minimum) to 636 (maximum) ms. » 24 % of all devices are better. This means that the measured response time is better than the average of all tested devices (31.1 ms). | ||
Response times are decent for most gaming needs. The EVOL X15 AT's panel does not use overdrive and there's no option to enable it, which would have helped to further reduce the 50% grey to 80% grey transition times.
Screen Flickering / PWM (Pulse-Width Modulation)
| Screen flickering / PWM not detected | ≤ 100 % brightness setting | 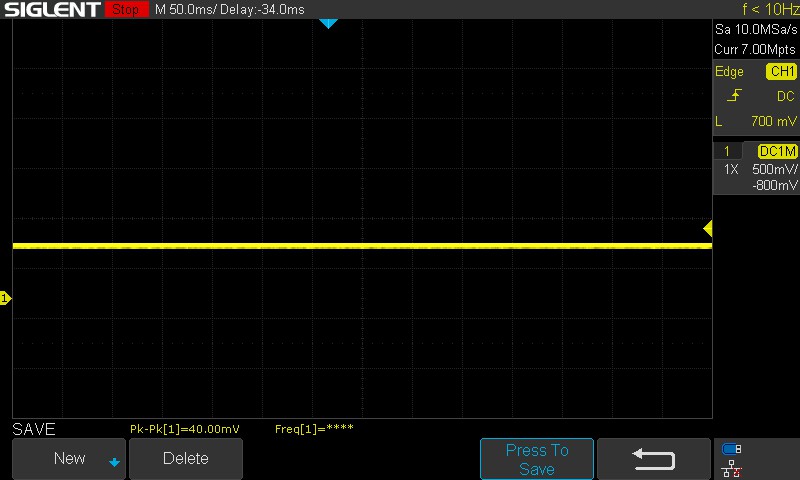 | |
In comparison: 52 % of all tested devices do not use PWM to dim the display. If PWM was detected, an average of 7798 (minimum: 5 - maximum: 343500) Hz was measured. | |||
We did not detect PWM or flickering at any of the tested brightness levels.
For more information, see our article, "Why PWM is such a headache", and also our PWM Ranking table.
Outdoor viewing is fine, but the brightness of the display may not be adequate for use in direct harsh sunlight. Viewing angles are relatively stable with only minor loss of brightness at the extremes.

Performance: Core i7-13700HX and RTX 4060 bode well for mid-range AAA gaming
The Colorful EVOL X15 AT is available with both Intel Core i5-13500HX and Core i7-13700HX options with corresponding GPU options being the Nvidia GeForce RTX 4050 Laptop GPU and the RTX 4060 Laptop GPU.
Testing Conditions
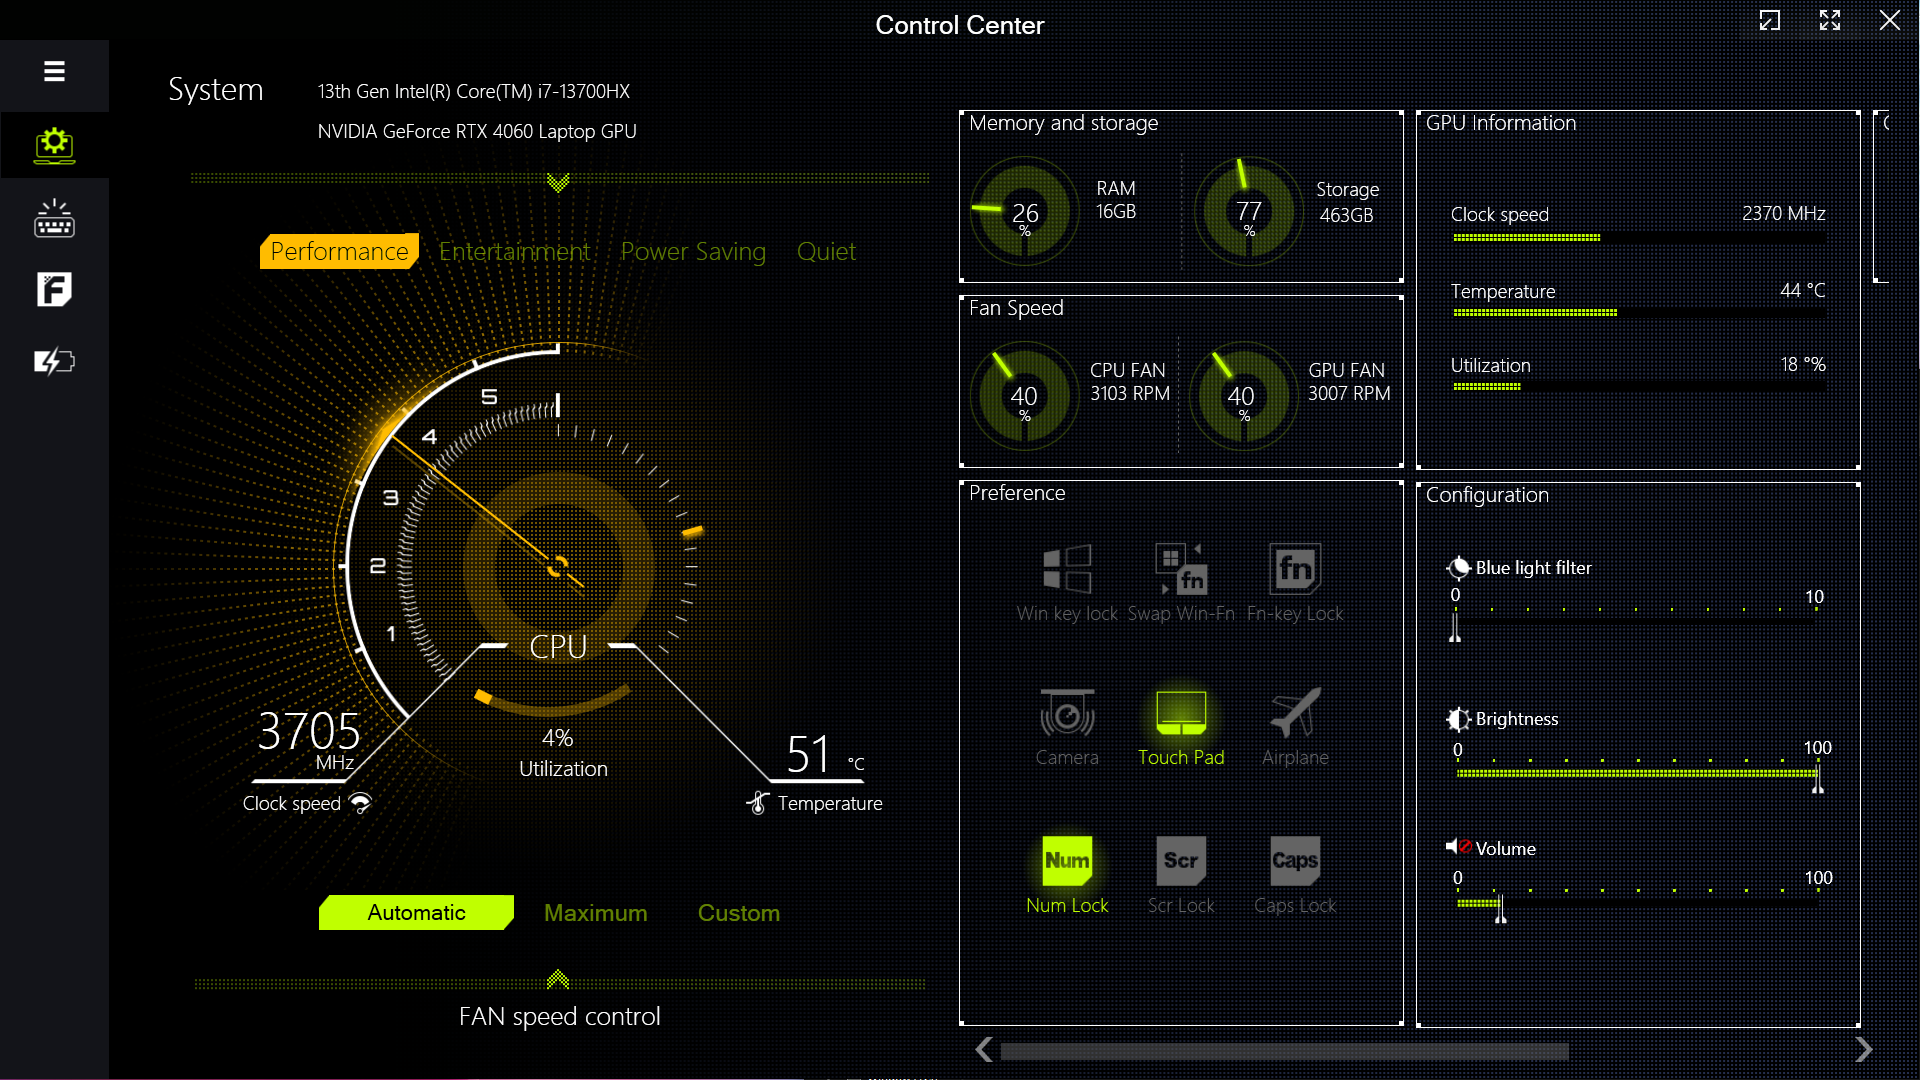
Colorful offers Clevo's Control Center app for performance tuning and adjusting various RGB effects. A total of four performance modes are offered.
All benchmarks were performed in the Performance mode that allows the Core i7-13700HX to fully flex its muscles. Discrete GPU mode was used for graphics and gaming tests.
Battery tests were performed in the Quiet profile with MSHybrid enabled.
Colorful caps the PL2 to 30 W in Quiet and Power Saving modes, which is a significant power reduction compared to the other modes. This is reflected in the drastic drop in Cinebench R15 scores as illustrated in the table below.
| Performance mode | PL1 (PBP) / Tau | PL2 (MTP) / Tau | Cinebench R15 Multi score | Cinebench R15 Multi score (30 loops) |
|---|---|---|---|---|
| Quiet | 15 W / 8 s | 30 W / 2.44 ms | 567 (-83%) | 542 (-82.28%) |
| Power Saving | 45 W / 8 s | 30 W / 2.44 ms | 557 (-84%) | 548 (-82.08%) |
| Entertainment | 65 W / 56 s | 130 W / 2.44 ms | 2814 (-19.18%) | 2168 (-29.12%) |
| Performance | 135 W / 96 s | 162 W / 2.44 ms | 3482 (100%) | 3059 (100%) |
Processor

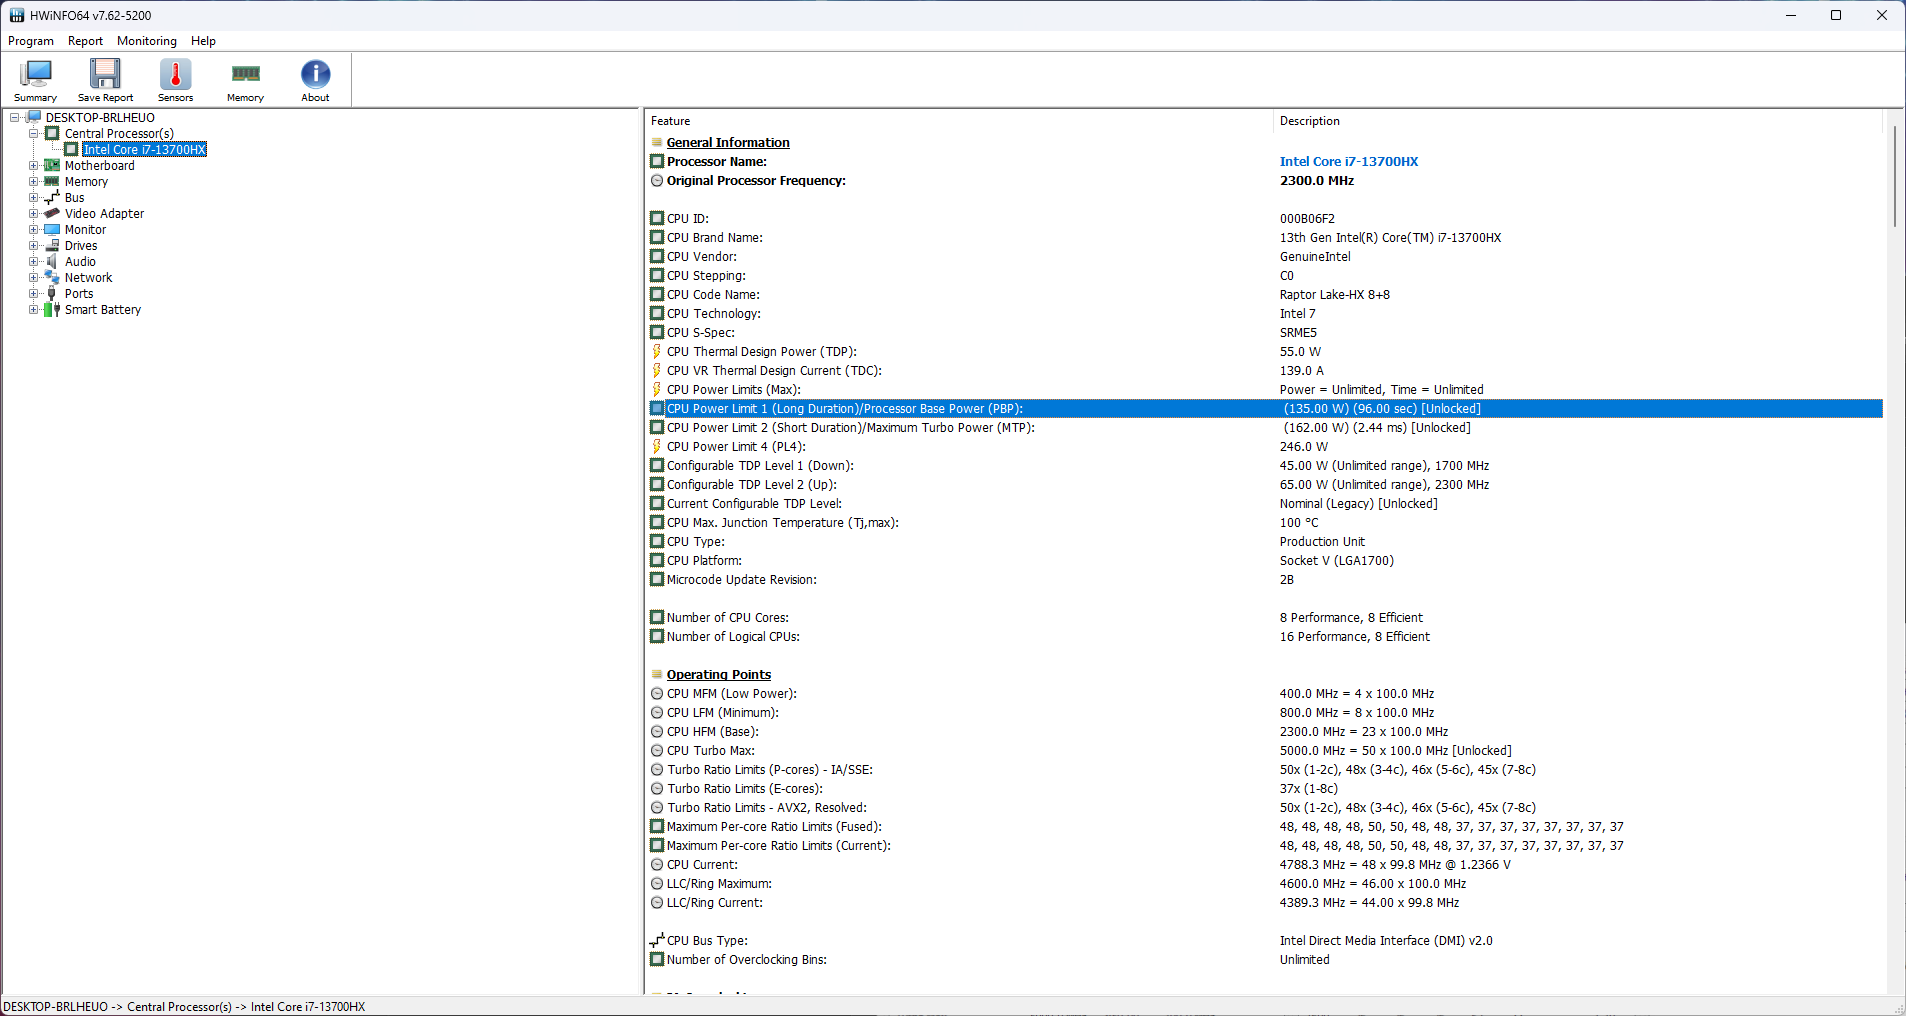
The Core i7-13700HX features 16 cores and 24 threads with a boost clock of up to 5 GHz. This CPU in the EVOL X15 AT generally performs on par with its counterpart in the Alienware m16 R1, and such other laptops overall. However, it significantly lags behind the 12-core 24-thread AMD Ryzen 9 7845HX in multi-core tests.
Although rated at 162 W, the Core i7-13700HX can utilize up to 145 W in the Performance mode. Nonetheless, this only provides a minimal advantage in single-core performance over the 115 W PL2 in the HP Omen 16.
Apart from the initial gradual decrease in scores, there is no perceived throttling during the Cinebench R15 multi-core loop test.
Cinebench R15 Multi Loop
Cinebench R23: Multi Core | Single Core
Cinebench R20: CPU (Multi Core) | CPU (Single Core)
Cinebench R15: CPU Multi 64Bit | CPU Single 64Bit
Blender: v2.79 BMW27 CPU
7-Zip 18.03: 7z b 4 | 7z b 4 -mmt1
Geekbench 5.5: Multi-Core | Single-Core
HWBOT x265 Benchmark v2.2: 4k Preset
LibreOffice : 20 Documents To PDF
R Benchmark 2.5: Overall mean
| CPU Performance rating | |
| Alienware m16 R1 AMD | |
| Average of class Gaming | |
| Schenker XMG Pro 15 (E23) | |
| Acer Predator Helios 16 PH16-71-731Q | |
| HP Omen 16-wf000 -1! | |
| Uniwill GM6PX7X RTX 4070 | |
| Alienware m16 R1 Intel | |
| Dell G15 5530 | |
| Colorful EVOL X15 AT 23 | |
| Average Intel Core i7-13700HX | |
| Cinebench R23 / Multi Core | |
| Alienware m16 R1 AMD | |
| Average of class Gaming (10488 - 40970, n=113, last 2 years) | |
| Schenker XMG Pro 15 (E23) | |
| Acer Predator Helios 16 PH16-71-731Q | |
| Colorful EVOL X15 AT 23 | |
| Alienware m16 R1 Intel | |
| Uniwill GM6PX7X RTX 4070 | |
| Dell G15 5530 | |
| Average Intel Core i7-13700HX (15558 - 22598, n=11) | |
| HP Omen 16-wf000 | |
| Cinebench R23 / Single Core | |
| Average of class Gaming (1166 - 2356, n=113, last 2 years) | |
| Alienware m16 R1 Intel | |
| Colorful EVOL X15 AT 23 | |
| Acer Predator Helios 16 PH16-71-731Q | |
| Schenker XMG Pro 15 (E23) | |
| HP Omen 16-wf000 | |
| Alienware m16 R1 AMD | |
| Dell G15 5530 | |
| Average Intel Core i7-13700HX (1666 - 1933, n=11) | |
| Uniwill GM6PX7X RTX 4070 | |
| Cinebench R20 / CPU (Multi Core) | |
| Alienware m16 R1 AMD | |
| Average of class Gaming (4029 - 16108, n=112, last 2 years) | |
| Schenker XMG Pro 15 (E23) | |
| Acer Predator Helios 16 PH16-71-731Q | |
| Colorful EVOL X15 AT 23 | |
| Uniwill GM6PX7X RTX 4070 | |
| Alienware m16 R1 Intel | |
| Dell G15 5530 | |
| Average Intel Core i7-13700HX (6160 - 8610, n=11) | |
| HP Omen 16-wf000 | |
| Cinebench R20 / CPU (Single Core) | |
| Average of class Gaming (442 - 895, n=112, last 2 years) | |
| Colorful EVOL X15 AT 23 | |
| Alienware m16 R1 Intel | |
| Acer Predator Helios 16 PH16-71-731Q | |
| Schenker XMG Pro 15 (E23) | |
| HP Omen 16-wf000 | |
| Alienware m16 R1 AMD | |
| Dell G15 5530 | |
| Uniwill GM6PX7X RTX 4070 | |
| Average Intel Core i7-13700HX (644 - 740, n=11) | |
| Cinebench R15 / CPU Multi 64Bit | |
| Alienware m16 R1 AMD | |
| Average of class Gaming (1578 - 6271, n=113, last 2 years) | |
| Schenker XMG Pro 15 (E23) | |
| Colorful EVOL X15 AT 23 | |
| Acer Predator Helios 16 PH16-71-731Q | |
| Acer Predator Helios 16 PH16-71-731Q | |
| Uniwill GM6PX7X RTX 4070 | |
| Average Intel Core i7-13700HX (2548 - 3482, n=12) | |
| Alienware m16 R1 Intel | |
| Dell G15 5530 | |
| HP Omen 16-wf000 | |
| Cinebench R15 / CPU Single 64Bit | |
| Alienware m16 R1 AMD | |
| Average of class Gaming (188.8 - 343, n=112, last 2 years) | |
| Alienware m16 R1 Intel | |
| Colorful EVOL X15 AT 23 | |
| Dell G15 5530 | |
| Acer Predator Helios 16 PH16-71-731Q | |
| Average Intel Core i7-13700HX (243 - 279, n=11) | |
| HP Omen 16-wf000 | |
| Uniwill GM6PX7X RTX 4070 | |
| Schenker XMG Pro 15 (E23) | |
| Blender / v2.79 BMW27 CPU | |
| Average Intel Core i7-13700HX (138 - 207, n=10) | |
| Dell G15 5530 | |
| Acer Predator Helios 16 PH16-71-731Q | |
| Alienware m16 R1 Intel | |
| Colorful EVOL X15 AT 23 | |
| Average of class Gaming (80 - 330, n=110, last 2 years) | |
| Uniwill GM6PX7X RTX 4070 | |
| Schenker XMG Pro 15 (E23) | |
| Alienware m16 R1 AMD | |
| 7-Zip 18.03 / 7z b 4 | |
| Alienware m16 R1 AMD | |
| Schenker XMG Pro 15 (E23) | |
| Average of class Gaming (33491 - 148086, n=111, last 2 years) | |
| Uniwill GM6PX7X RTX 4070 | |
| Alienware m16 R1 Intel | |
| Acer Predator Helios 16 PH16-71-731Q | |
| HP Omen 16-wf000 | |
| Dell G15 5530 | |
| Average Intel Core i7-13700HX (58912 - 89294, n=11) | |
| Colorful EVOL X15 AT 23 | |
| 7-Zip 18.03 / 7z b 4 -mmt1 | |
| Alienware m16 R1 AMD | |
| Alienware m16 R1 Intel | |
| Average of class Gaming (4199 - 7436, n=111, last 2 years) | |
| Colorful EVOL X15 AT 23 | |
| Schenker XMG Pro 15 (E23) | |
| Acer Predator Helios 16 PH16-71-731Q | |
| Average Intel Core i7-13700HX (5552 - 6409, n=11) | |
| Uniwill GM6PX7X RTX 4070 | |
| HP Omen 16-wf000 | |
| Dell G15 5530 | |
| Geekbench 5.5 / Multi-Core | |
| Schenker XMG Pro 15 (E23) | |
| Average of class Gaming (6460 - 27010, n=111, last 2 years) | |
| Acer Predator Helios 16 PH16-71-731Q | |
| Uniwill GM6PX7X RTX 4070 | |
| Alienware m16 R1 AMD | |
| HP Omen 16-wf000 | |
| Alienware m16 R1 Intel | |
| Dell G15 5530 | |
| Average Intel Core i7-13700HX (10156 - 15850, n=12) | |
| Colorful EVOL X15 AT 23 | |
| Geekbench 5.5 / Single-Core | |
| Average of class Gaming (986 - 2474, n=111, last 2 years) | |
| Alienware m16 R1 AMD | |
| Acer Predator Helios 16 PH16-71-731Q | |
| HP Omen 16-wf000 | |
| Dell G15 5530 | |
| Alienware m16 R1 Intel | |
| Colorful EVOL X15 AT 23 | |
| Uniwill GM6PX7X RTX 4070 | |
| Schenker XMG Pro 15 (E23) | |
| Average Intel Core i7-13700HX (1666 - 1899, n=12) | |
| HWBOT x265 Benchmark v2.2 / 4k Preset | |
| Alienware m16 R1 AMD | |
| Average of class Gaming (11.5 - 44.3, n=111, last 2 years) | |
| Uniwill GM6PX7X RTX 4070 | |
| Acer Predator Helios 16 PH16-71-731Q | |
| Schenker XMG Pro 15 (E23) | |
| Dell G15 5530 | |
| Alienware m16 R1 Intel | |
| Average Intel Core i7-13700HX (17.1 - 25.5, n=11) | |
| Colorful EVOL X15 AT 23 | |
| HP Omen 16-wf000 | |
| LibreOffice / 20 Documents To PDF | |
| Colorful EVOL X15 AT 23 | |
| Schenker XMG Pro 15 (E23) | |
| Average of class Gaming (19 - 88.8, n=111, last 2 years) | |
| Dell G15 5530 | |
| HP Omen 16-wf000 | |
| Alienware m16 R1 Intel | |
| Average Intel Core i7-13700HX (36.5 - 52.9, n=11) | |
| Alienware m16 R1 AMD | |
| Uniwill GM6PX7X RTX 4070 | |
| Acer Predator Helios 16 PH16-71-731Q | |
| R Benchmark 2.5 / Overall mean | |
| Uniwill GM6PX7X RTX 4070 | |
| Average Intel Core i7-13700HX (0.4274 - 0.513, n=11) | |
| Schenker XMG Pro 15 (E23) | |
| HP Omen 16-wf000 | |
| Colorful EVOL X15 AT 23 | |
| Alienware m16 R1 Intel | |
| Average of class Gaming (0.3439 - 0.759, n=112, last 2 years) | |
| Acer Predator Helios 16 PH16-71-731Q | |
| Dell G15 5530 | |
| Alienware m16 R1 AMD | |
* ... smaller is better
The EVOL X15's Core i7-13700HX can use a maximum of 145 W with boosts up to 4.2 GHz while running the Cinebench R15 multi-core loop in Performance mode. In Entertainment mode, the Core i7-13700HX can still manage to hit 4.2 GHz at 113 W, but the average power drops to just about 21 W during the run.
Quiet mode sees the EVOL X15 hit 4 GHz peak while consuming just 30 W. However, the average clocks dip to just under 1 GHz while sipping 15 W.
Cinebench R20 scores on battery drop by 26.5% and 54% in single-core and multi-core, respectively.
AIDA64: FP32 Ray-Trace | FPU Julia | CPU SHA3 | CPU Queen | FPU SinJulia | FPU Mandel | CPU AES | CPU ZLib | FP64 Ray-Trace | CPU PhotoWorxx
| Performance rating | |
| Alienware m16 R1 AMD | |
| Average of class Gaming | |
| Uniwill GM6PX7X RTX 4070 | |
| Alienware m16 R1 Intel | |
| Acer Predator Helios 16 PH16-71-731Q | |
| Schenker XMG Pro 15 (E23) | |
| Average Intel Core i7-13700HX | |
| HP Omen 16-wf000 | |
| Colorful EVOL X15 AT 23 | |
| Dell G15 5530 | |
| AIDA64 / FP32 Ray-Trace | |
| Alienware m16 R1 AMD | |
| Average of class Gaming (10227 - 85542, n=110, last 2 years) | |
| Uniwill GM6PX7X RTX 4070 | |
| Alienware m16 R1 Intel | |
| Acer Predator Helios 16 PH16-71-731Q | |
| Colorful EVOL X15 AT 23 | |
| Average Intel Core i7-13700HX (14261 - 21999, n=11) | |
| HP Omen 16-wf000 | |
| Dell G15 5530 | |
| Schenker XMG Pro 15 (E23) | |
| AIDA64 / FPU Julia | |
| Alienware m16 R1 AMD | |
| Average of class Gaming (51376 - 238426, n=110, last 2 years) | |
| Uniwill GM6PX7X RTX 4070 | |
| Alienware m16 R1 Intel | |
| Colorful EVOL X15 AT 23 | |
| Acer Predator Helios 16 PH16-71-731Q | |
| HP Omen 16-wf000 | |
| Average Intel Core i7-13700HX (74636 - 109364, n=11) | |
| Schenker XMG Pro 15 (E23) | |
| Dell G15 5530 | |
| AIDA64 / CPU SHA3 | |
| Alienware m16 R1 AMD | |
| Average of class Gaming (2180 - 9817, n=110, last 2 years) | |
| Uniwill GM6PX7X RTX 4070 | |
| Alienware m16 R1 Intel | |
| Schenker XMG Pro 15 (E23) | |
| Colorful EVOL X15 AT 23 | |
| Acer Predator Helios 16 PH16-71-731Q | |
| Dell G15 5530 | |
| Average Intel Core i7-13700HX (3359 - 5053, n=11) | |
| HP Omen 16-wf000 | |
| AIDA64 / CPU Queen | |
| Alienware m16 R1 AMD | |
| Schenker XMG Pro 15 (E23) | |
| Average of class Gaming (49785 - 173351, n=101, last 2 years) | |
| Alienware m16 R1 Intel | |
| Acer Predator Helios 16 PH16-71-731Q | |
| Colorful EVOL X15 AT 23 | |
| Uniwill GM6PX7X RTX 4070 | |
| Average Intel Core i7-13700HX (86532 - 114717, n=11) | |
| Dell G15 5530 | |
| HP Omen 16-wf000 | |
| AIDA64 / FPU SinJulia | |
| Alienware m16 R1 AMD | |
| Average of class Gaming (4424 - 33636, n=110, last 2 years) | |
| Alienware m16 R1 Intel | |
| Uniwill GM6PX7X RTX 4070 | |
| Acer Predator Helios 16 PH16-71-731Q | |
| Colorful EVOL X15 AT 23 | |
| Schenker XMG Pro 15 (E23) | |
| Average Intel Core i7-13700HX (9290 - 13519, n=11) | |
| HP Omen 16-wf000 | |
| Dell G15 5530 | |
| AIDA64 / FPU Mandel | |
| Alienware m16 R1 AMD | |
| Average of class Gaming (25115 - 128721, n=110, last 2 years) | |
| Uniwill GM6PX7X RTX 4070 | |
| Alienware m16 R1 Intel | |
| Acer Predator Helios 16 PH16-71-731Q | |
| Colorful EVOL X15 AT 23 | |
| HP Omen 16-wf000 | |
| Average Intel Core i7-13700HX (35751 - 53484, n=11) | |
| Schenker XMG Pro 15 (E23) | |
| Dell G15 5530 | |
| AIDA64 / CPU AES | |
| Uniwill GM6PX7X RTX 4070 | |
| Alienware m16 R1 Intel | |
| Acer Predator Helios 16 PH16-71-731Q | |
| Average Intel Core i7-13700HX (67846 - 182575, n=11) | |
| Alienware m16 R1 AMD | |
| Average of class Gaming (39258 - 247074, n=110, last 2 years) | |
| Colorful EVOL X15 AT 23 | |
| Schenker XMG Pro 15 (E23) | |
| HP Omen 16-wf000 | |
| Dell G15 5530 | |
| AIDA64 / CPU ZLib | |
| Alienware m16 R1 AMD | |
| Average of class Gaming (574 - 2531, n=110, last 2 years) | |
| Acer Predator Helios 16 PH16-71-731Q | |
| Schenker XMG Pro 15 (E23) | |
| Uniwill GM6PX7X RTX 4070 | |
| Alienware m16 R1 Intel | |
| HP Omen 16-wf000 | |
| Colorful EVOL X15 AT 23 | |
| Dell G15 5530 | |
| Average Intel Core i7-13700HX (981 - 1451, n=11) | |
| AIDA64 / FP64 Ray-Trace | |
| Alienware m16 R1 AMD | |
| Average of class Gaming (5509 - 45446, n=110, last 2 years) | |
| Uniwill GM6PX7X RTX 4070 | |
| Alienware m16 R1 Intel | |
| Colorful EVOL X15 AT 23 | |
| Acer Predator Helios 16 PH16-71-731Q | |
| Average Intel Core i7-13700HX (7728 - 11837, n=11) | |
| HP Omen 16-wf000 | |
| Dell G15 5530 | |
| Schenker XMG Pro 15 (E23) | |
| AIDA64 / CPU PhotoWorxx | |
| Schenker XMG Pro 15 (E23) | |
| Average of class Gaming (12271 - 89891, n=110, last 2 years) | |
| Uniwill GM6PX7X RTX 4070 | |
| HP Omen 16-wf000 | |
| Dell G15 5530 | |
| Alienware m16 R1 Intel | |
| Acer Predator Helios 16 PH16-71-731Q | |
| Average Intel Core i7-13700HX (19678 - 42415, n=11) | |
| Alienware m16 R1 AMD | |
| Colorful EVOL X15 AT 23 | |
More information can be found in our dedicated Intel Core i7-13700HX page.
System Performance
The EVOL X15 AT performs better in PCMark 10 compared to CrossMark. AIDA64 memory scores are on the lower side owing to the single dual-channel DDR5-4800 stick in the EVOL X15 compared to the dual quad-channel implementation in its competitors.
That being said, we did not face any hiccups in using the EVOL X15 for routine productivity and web browsing tasks.
CrossMark: Overall | Productivity | Creativity | Responsiveness
AIDA64: Memory Copy | Memory Read | Memory Write | Memory Latency
| PCMark 10 / Score | |
| Alienware m16 R1 AMD | |
| Uniwill GM6PX7X RTX 4070 | |
| Average of class Gaming (5828 - 11574, n=96, last 2 years) | |
| HP Omen 16-wf000 | |
| Acer Predator Helios 16 PH16-71-731Q | |
| Colorful EVOL X15 AT 23 | |
| Schenker XMG Pro 15 (E23) | |
| Average Intel Core i7-13700HX, NVIDIA GeForce RTX 4060 Laptop GPU (6909 - 7743, n=5) | |
| Alienware m16 R1 Intel | |
| Dell G15 5530 | |
| PCMark 10 / Essentials | |
| Uniwill GM6PX7X RTX 4070 | |
| Alienware m16 R1 AMD | |
| Schenker XMG Pro 15 (E23) | |
| Acer Predator Helios 16 PH16-71-731Q | |
| Dell G15 5530 | |
| Alienware m16 R1 Intel | |
| Average Intel Core i7-13700HX, NVIDIA GeForce RTX 4060 Laptop GPU (9760 - 11313, n=5) | |
| Average of class Gaming (8810 - 12600, n=100, last 2 years) | |
| Colorful EVOL X15 AT 23 | |
| HP Omen 16-wf000 | |
| PCMark 10 / Productivity | |
| Acer Predator Helios 16 PH16-71-731Q | |
| Average of class Gaming (6845 - 18766, n=98, last 2 years) | |
| Uniwill GM6PX7X RTX 4070 | |
| Schenker XMG Pro 15 (E23) | |
| Alienware m16 R1 AMD | |
| Dell G15 5530 | |
| Average Intel Core i7-13700HX, NVIDIA GeForce RTX 4060 Laptop GPU (9131 - 11018, n=5) | |
| Alienware m16 R1 Intel | |
| Colorful EVOL X15 AT 23 | |
| HP Omen 16-wf000 | |
| PCMark 10 / Digital Content Creation | |
| Alienware m16 R1 AMD | |
| Average of class Gaming (7602 - 19657, n=98, last 2 years) | |
| Uniwill GM6PX7X RTX 4070 | |
| HP Omen 16-wf000 | |
| Colorful EVOL X15 AT 23 | |
| Average Intel Core i7-13700HX, NVIDIA GeForce RTX 4060 Laptop GPU (9393 - 12434, n=5) | |
| Acer Predator Helios 16 PH16-71-731Q | |
| Alienware m16 R1 Intel | |
| Schenker XMG Pro 15 (E23) | |
| Dell G15 5530 | |
| CrossMark / Overall | |
| Acer Predator Helios 16 PH16-71-731Q | |
| Alienware m16 R1 Intel | |
| Alienware m16 R1 AMD | |
| Average of class Gaming (1366 - 2409, n=98, last 2 years) | |
| Uniwill GM6PX7X RTX 4070 | |
| Schenker XMG Pro 15 (E23) | |
| Average Intel Core i7-13700HX, NVIDIA GeForce RTX 4060 Laptop GPU (1663 - 2105, n=5) | |
| Dell G15 5530 | |
| Colorful EVOL X15 AT 23 | |
| HP Omen 16-wf000 | |
| CrossMark / Productivity | |
| Acer Predator Helios 16 PH16-71-731Q | |
| Alienware m16 R1 Intel | |
| Alienware m16 R1 AMD | |
| Average of class Gaming (1386 - 2254, n=98, last 2 years) | |
| Uniwill GM6PX7X RTX 4070 | |
| Schenker XMG Pro 15 (E23) | |
| Average Intel Core i7-13700HX, NVIDIA GeForce RTX 4060 Laptop GPU (1618 - 1989, n=5) | |
| Dell G15 5530 | |
| Colorful EVOL X15 AT 23 | |
| HP Omen 16-wf000 | |
| CrossMark / Creativity | |
| Acer Predator Helios 16 PH16-71-731Q | |
| Alienware m16 R1 Intel | |
| Average of class Gaming (1343 - 2729, n=98, last 2 years) | |
| Schenker XMG Pro 15 (E23) | |
| Alienware m16 R1 AMD | |
| Uniwill GM6PX7X RTX 4070 | |
| Dell G15 5530 | |
| Average Intel Core i7-13700HX, NVIDIA GeForce RTX 4060 Laptop GPU (1710 - 2274, n=5) | |
| HP Omen 16-wf000 | |
| Colorful EVOL X15 AT 23 | |
| CrossMark / Responsiveness | |
| Acer Predator Helios 16 PH16-71-731Q | |
| Alienware m16 R1 Intel | |
| Uniwill GM6PX7X RTX 4070 | |
| Schenker XMG Pro 15 (E23) | |
| Alienware m16 R1 AMD | |
| Average of class Gaming (1226 - 2334, n=98, last 2 years) | |
| Average Intel Core i7-13700HX, NVIDIA GeForce RTX 4060 Laptop GPU (1269 - 1983, n=5) | |
| Dell G15 5530 | |
| HP Omen 16-wf000 | |
| Colorful EVOL X15 AT 23 | |
| AIDA64 / Memory Copy | |
| Schenker XMG Pro 15 (E23) | |
| Average of class Gaming (21750 - 129946, n=110, last 2 years) | |
| Uniwill GM6PX7X RTX 4070 | |
| HP Omen 16-wf000 | |
| Dell G15 5530 | |
| Alienware m16 R1 Intel | |
| Acer Predator Helios 16 PH16-71-731Q | |
| Average Intel Core i7-13700HX, NVIDIA GeForce RTX 4060 Laptop GPU (36504 - 58458, n=5) | |
| Alienware m16 R1 AMD | |
| Colorful EVOL X15 AT 23 | |
| AIDA64 / Memory Read | |
| Schenker XMG Pro 15 (E23) | |
| Average of class Gaming (22956 - 118858, n=110, last 2 years) | |
| Uniwill GM6PX7X RTX 4070 | |
| Dell G15 5530 | |
| Alienware m16 R1 Intel | |
| HP Omen 16-wf000 | |
| Acer Predator Helios 16 PH16-71-731Q | |
| Average Intel Core i7-13700HX, NVIDIA GeForce RTX 4060 Laptop GPU (36510 - 67644, n=5) | |
| Alienware m16 R1 AMD | |
| Colorful EVOL X15 AT 23 | |
| AIDA64 / Memory Write | |
| Acer Predator Helios 16 PH16-71-731Q | |
| Average of class Gaming (22297 - 135096, n=110, last 2 years) | |
| Schenker XMG Pro 15 (E23) | |
| HP Omen 16-wf000 | |
| Uniwill GM6PX7X RTX 4070 | |
| Average Intel Core i7-13700HX, NVIDIA GeForce RTX 4060 Laptop GPU (33598 - 85675, n=5) | |
| Dell G15 5530 | |
| Alienware m16 R1 Intel | |
| Alienware m16 R1 AMD | |
| Colorful EVOL X15 AT 23 | |
| AIDA64 / Memory Latency | |
| Average of class Gaming (75.3 - 259, n=110, last 2 years) | |
| Alienware m16 R1 AMD | |
| Dell G15 5530 | |
| Alienware m16 R1 Intel | |
| Uniwill GM6PX7X RTX 4070 | |
| HP Omen 16-wf000 | |
| Average Intel Core i7-13700HX, NVIDIA GeForce RTX 4060 Laptop GPU (81.9 - 93, n=5) | |
| Acer Predator Helios 16 PH16-71-731Q | |
| Schenker XMG Pro 15 (E23) | |
| Colorful EVOL X15 AT 23 | |
* ... smaller is better
| PCMark 8 Home Score Accelerated v2 | 5769 points | |
| PCMark 8 Work Score Accelerated v2 | 5995 points | |
| PCMark 10 Score | 7655 points | |
Help | ||
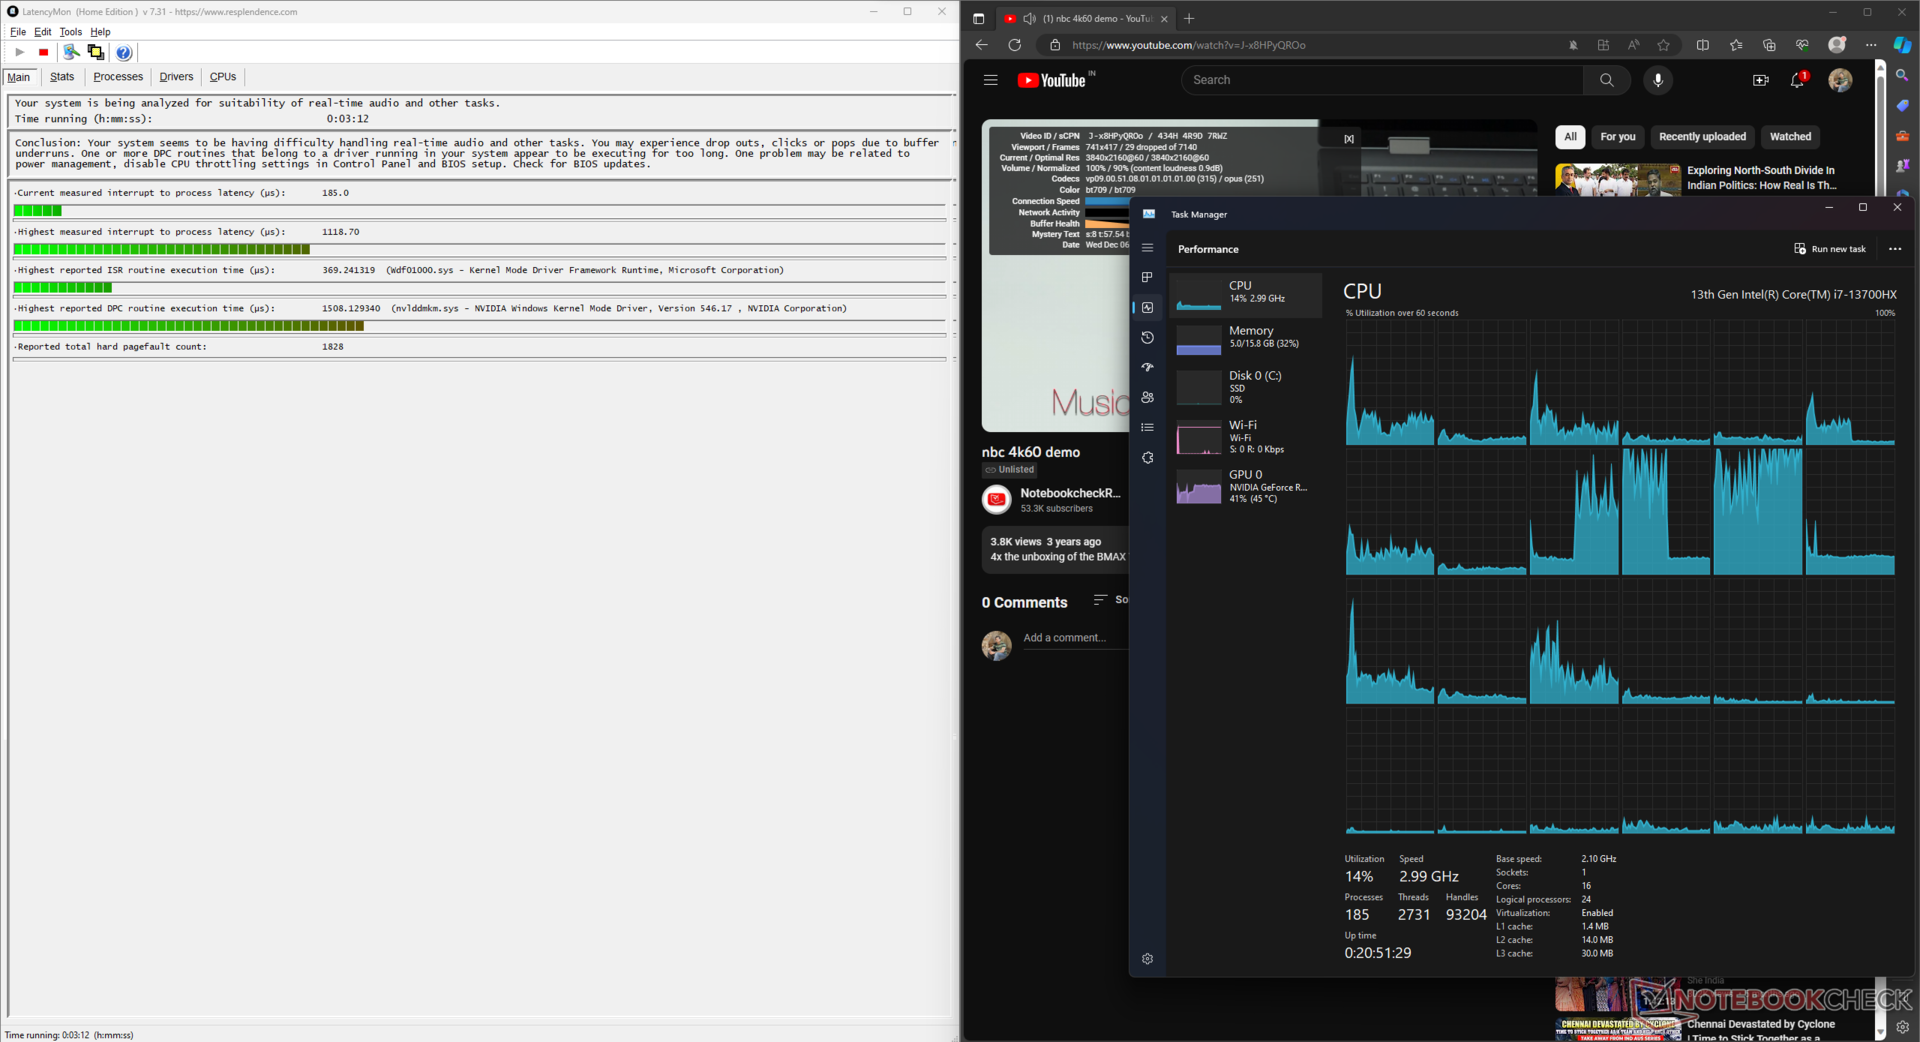
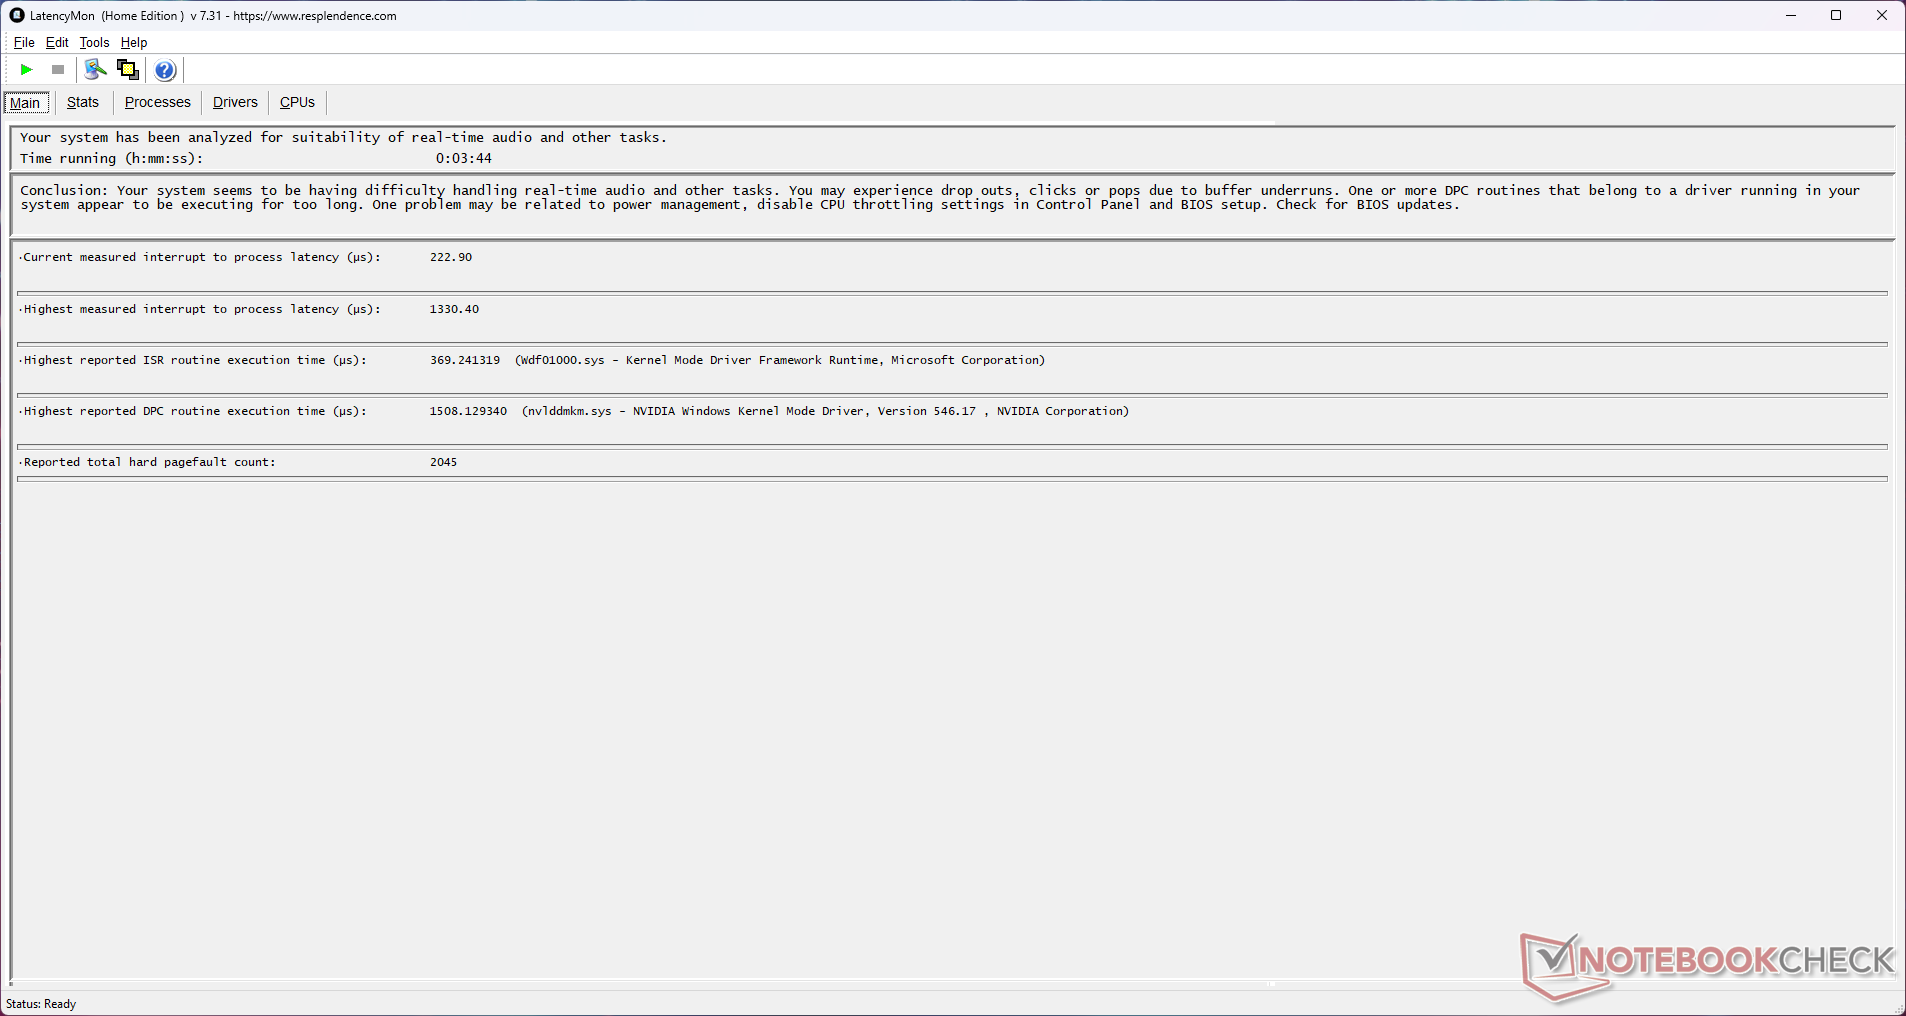
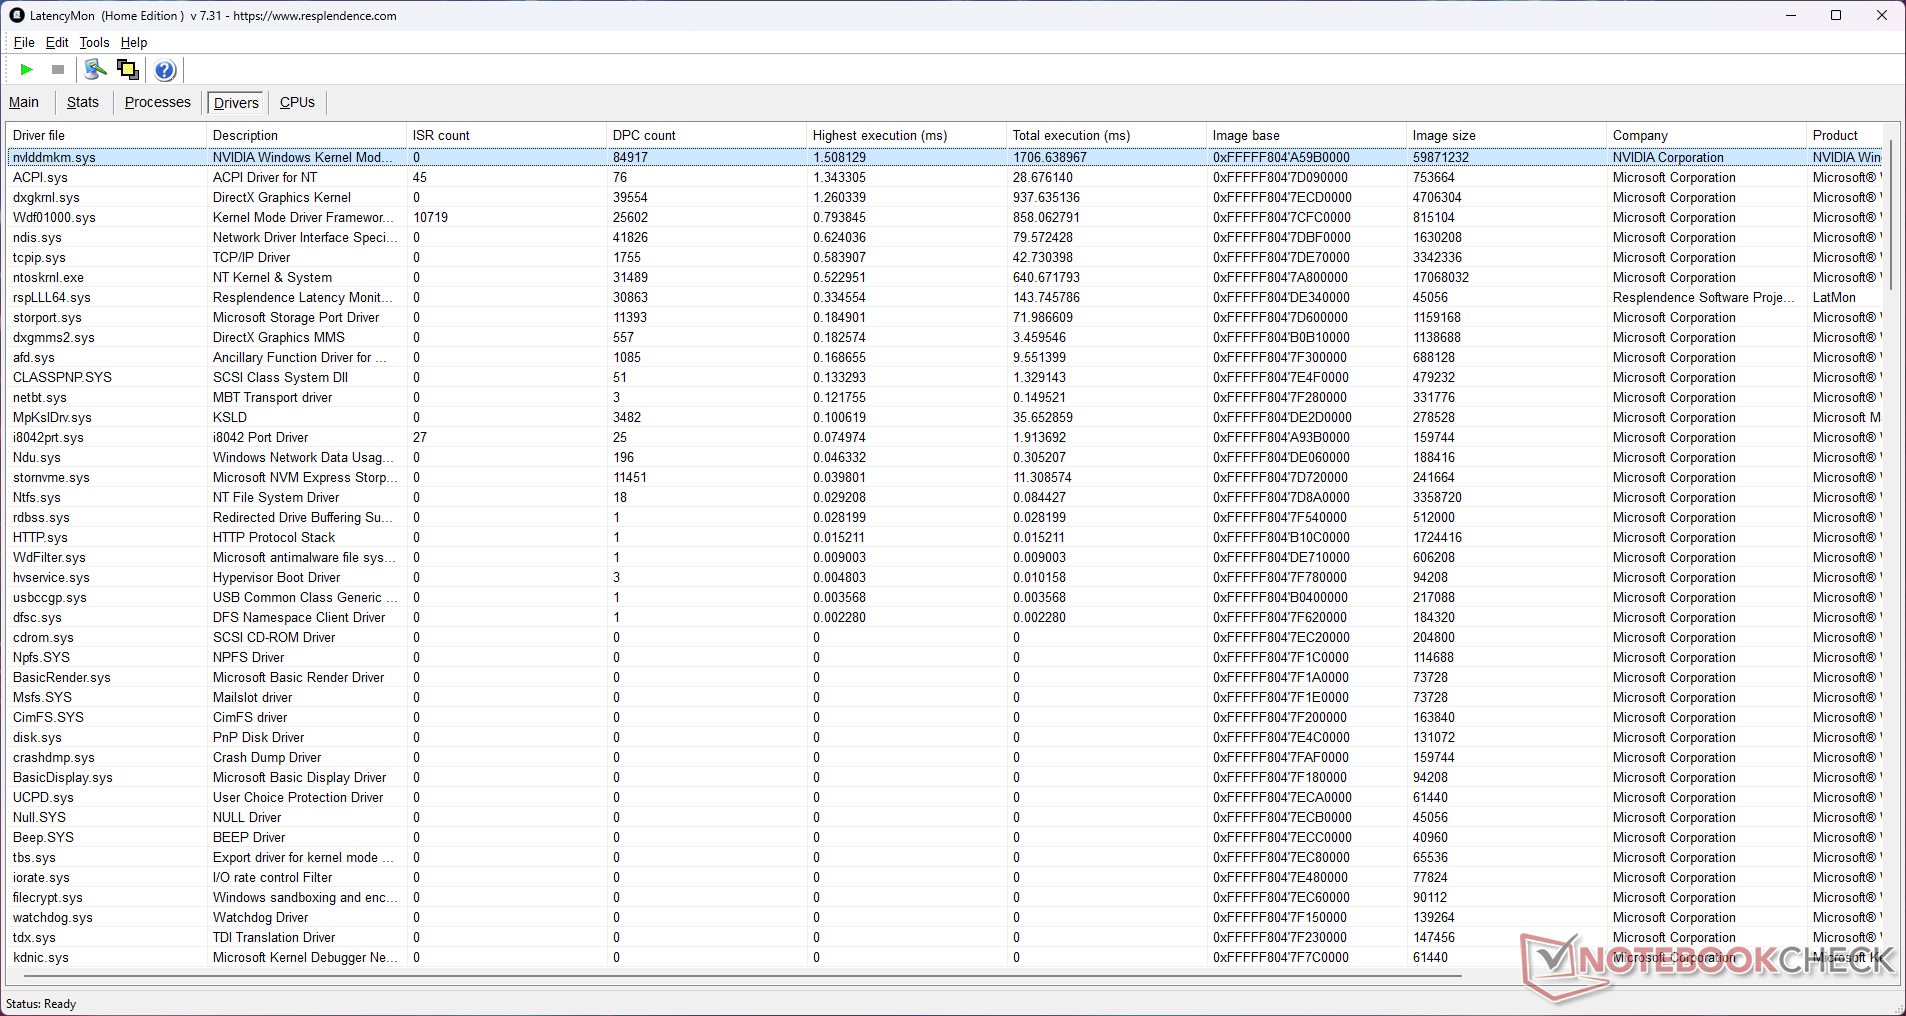
DPC Latency
High DPC latency is a known issue in laptops with Nvidia cards, and the EVOL X15 is no exception, although it fares better than its competitors.
We recorded an interrupt-to-process latency of 1,330.4 µs using LatencyMon, following a sample YouTube 4K60 playback and a 10-second Prime95 stress. The Nvidia Windows Kernel Mode Driver Framework (nvlddmkm.sys) contributes to this high latency.
| DPC Latencies / LatencyMon - interrupt to process latency (max), Web, Youtube, Prime95 | |
| Dell G15 5530 | |
| Alienware m16 R1 Intel | |
| HP Omen 16-wf000 | |
| Alienware m16 R1 AMD | |
| Acer Predator Helios 16 PH16-71-731Q | |
| Colorful EVOL X15 AT 23 | |
| Uniwill GM6PX7X RTX 4070 | |
| Schenker XMG Pro 15 (E23) | |
* ... smaller is better
Our DPC Latency Ranking page provides more LatencyMon comparisons across tested devices.
Storage Devices
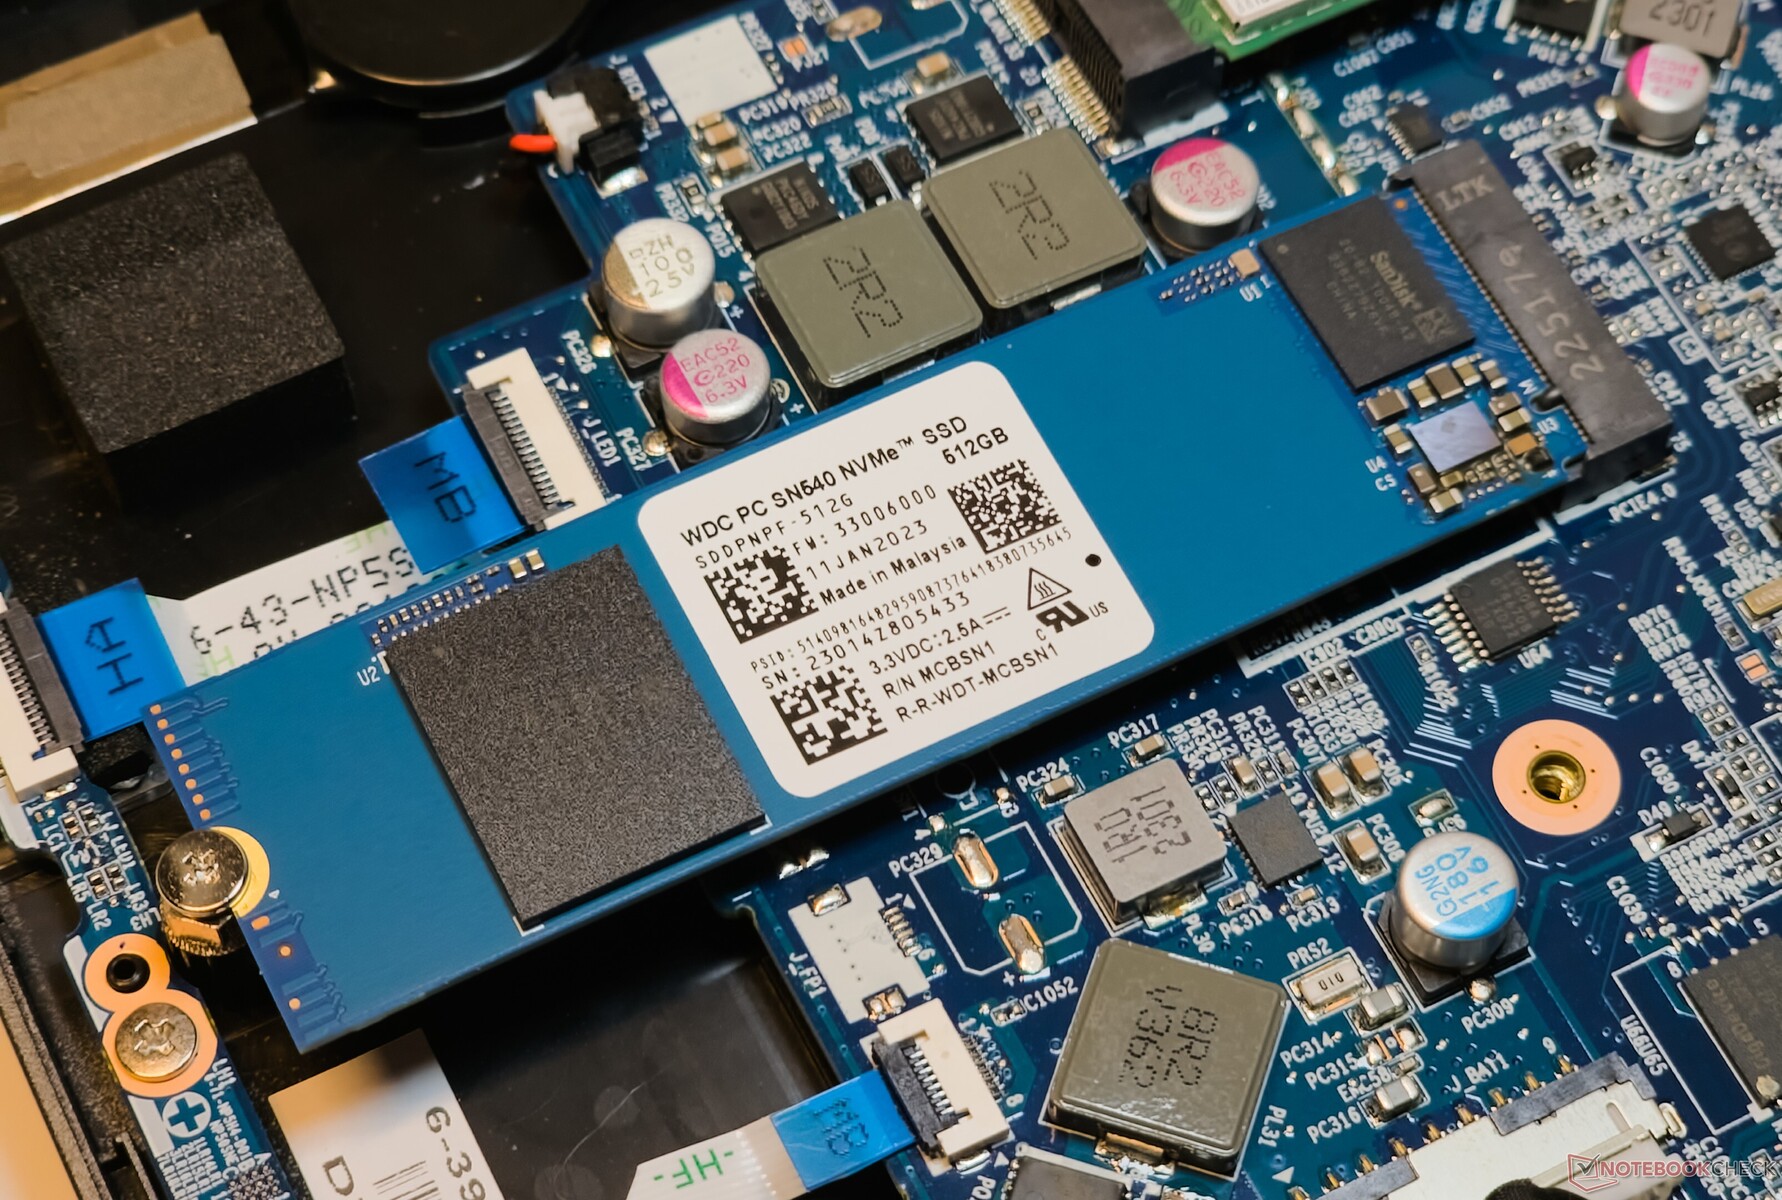
The EVOL X15's 512 GB Western Digital SN540 NVMe SSD is no match for the Kioxia and SK Hynix drives used by its competitors. Nevertheless, 4k q1 t1 reads and 4k q1 t1 writes surpass those of the Kioxia XG8 in the Alienware m16 R1 AMD.
Colorful allows you to add another PCIe Gen4 NVMe drive. However, there is no scope for adding 2.5-inch SATA mass storage.

* ... smaller is better
Disk Throttling: DiskSpd Read Loop, Queue Depth 8
The drive starts throttling after the 17th loop during the DiskSpd Read Loop test at a queue depth of 8. There is no thermal cover or padding provided on the drive.
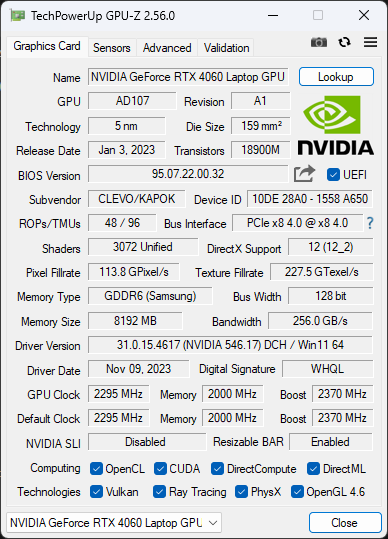
GPU Performance
The Nvidia GeForce RTX 4060 Laptop GPU in the EVOL X15 AT operates at a 140 W TGP. Its overall 3DMark performance is comparable to other laptops that use the same GPU.
We also see that the RTX 4060 is within striking distance of the 140 W RTX 4070 Laptop GPU in the Uniwill GM6PX7X, but it falls short by 31% when compared to the 175 W RTX 4080 Laptop GPU that powers the Alienware m16 R1 AMD.
3DMark Time Spy graphics scores can drop by nearly 54% on battery power.
| 3DMark 11 Performance | 30245 points | |
| 3DMark Ice Storm Standard Score | 278340 points | |
| 3DMark Cloud Gate Standard Score | 63582 points | |
| 3DMark Fire Strike Score | 24674 points | |
| 3DMark Fire Strike Extreme Score | 12089 points | |
| 3DMark Time Spy Score | 10590 points | |
Help | ||
| Blender / v3.3 Classroom OPTIX/RTX | |
| Schenker XMG Pro 15 (E23) | |
| Colorful EVOL X15 AT 23 | |
| Alienware m16 R1 Intel | |
| Average NVIDIA GeForce RTX 4060 Laptop GPU (19 - 28, n=53) | |
| Acer Predator Helios 16 PH16-71-731Q | |
| Dell G15 5530 | |
| Uniwill GM6PX7X RTX 4070 | |
| Average of class Gaming (9 - 32, n=112, last 2 years) | |
| HP Omen 16-wf000 | |
| Alienware m16 R1 AMD | |
| Blender / v3.3 Classroom CUDA | |
| Schenker XMG Pro 15 (E23) | |
| Average NVIDIA GeForce RTX 4060 Laptop GPU (39 - 53, n=53) | |
| Colorful EVOL X15 AT 23 | |
| Acer Predator Helios 16 PH16-71-731Q | |
| Dell G15 5530 | |
| Alienware m16 R1 Intel | |
| Uniwill GM6PX7X RTX 4070 | |
| Average of class Gaming (15 - 228, n=112, last 2 years) | |
| Alienware m16 R1 AMD | |
| HP Omen 16-wf000 | |
| Blender / v3.3 Classroom CPU | |
| Average NVIDIA GeForce RTX 4060 Laptop GPU (189 - 452, n=53) | |
| HP Omen 16-wf000 | |
| Dell G15 5530 | |
| Acer Predator Helios 16 PH16-71-731Q | |
| Colorful EVOL X15 AT 23 | |
| Schenker XMG Pro 15 (E23) | |
| Alienware m16 R1 Intel | |
| Average of class Gaming (122 - 565, n=108, last 2 years) | |
| Uniwill GM6PX7X RTX 4070 | |
| Alienware m16 R1 AMD | |
* ... smaller is better
Gaming Performance
The EVOL X15 manages small leads over competing laptops of similar specifications, including the Acer Predator Helios 16 and the Alienware m16 R1 Intel in overall gaming performance at 1080p Ultra.
QHD 60 fps gaming is achievable in many AAA titles, and there's potential to coax out even higher frame rates with the assistance of upscalers such as Nvidia DLSS, AMD FSR, or Intel XeSS.
| The Witcher 3 - 1920x1080 Ultra Graphics & Postprocessing (HBAO+) | |
| Average of class Gaming (95 - 240, n=8, last 2 years) | |
| Alienware m16 R1 AMD | |
| HP Omen 16-wf000 | |
| Schenker XMG Pro 15 (E23) | |
| Uniwill GM6PX7X RTX 4070 | |
| Alienware m16 R1 Intel | |
| Dell G15 5530 | |
| Colorful EVOL X15 AT 23 | |
| Acer Predator Helios 16 PH16-71-731Q | |
| GTA V - 1920x1080 Highest AA:4xMSAA + FX AF:16x | |
| Average of class Gaming (48.3 - 186.9, n=103, last 2 years) | |
| Uniwill GM6PX7X RTX 4070 | |
| Colorful EVOL X15 AT 23 | |
| HP Omen 16-wf000 | |
| Acer Predator Helios 16 PH16-71-731Q | |
| Dell G15 5530 | |
| Schenker XMG Pro 15 (E23) | |
| Final Fantasy XV Benchmark - 1920x1080 High Quality | |
| Alienware m16 R1 AMD | |
| HP Omen 16-wf000 | |
| Average of class Gaming (41 - 215, n=104, last 2 years) | |
| Uniwill GM6PX7X RTX 4070 | |
| Alienware m16 R1 Intel | |
| Colorful EVOL X15 AT 23 | |
| Acer Predator Helios 16 PH16-71-731Q | |
| Dell G15 5530 | |
The Witcher 3 FPS Chart
The cooling of the EVOL X15's graphics subsystem appears to be quite efficient, as evidenced by the stable frame rates observed while under stress with The Witcher 3 at 1080p Ultra.
| low | med. | high | ultra | QHD | |
|---|---|---|---|---|---|
| GTA V (2015) | 185.6 | 182.3 | 177.3 | 114.6 | 85.6 |
| The Witcher 3 (2015) | 450 | 333 | 205 | 103.4 | 75.7 |
| Dota 2 Reborn (2015) | 192.2 | 169.7 | 164.6 | 153.1 | |
| Final Fantasy XV Benchmark (2018) | 206 | 143.9 | 101 | 74 | |
| X-Plane 11.11 (2018) | 176.1 | 155.9 | 116.4 | ||
| Far Cry 5 (2018) | 162 | 146 | 141 | 135 | 101 |
| Strange Brigade (2018) | 480 | 288 | 225 | 192 | 127.4 |
| F1 22 (2022) | 253 | 253 | 194.5 | 65.8 | 42.3 |
| F1 23 (2023) | 248 | 250 | 184.1 | 58.3 | 37 |
| Cyberpunk 2077 (2023) | 119.4 | 96.5 | 82.8 | 71.1 | 42.8 |
| Assassin's Creed Mirage (2023) | 137 | 125 | 116 | 89 | 65 |
| Call of Duty Modern Warfare 3 2023 (2023) | 128 | 114 | 86 | 65 | 56 |
| Avatar Frontiers of Pandora (2023) | 77.3 | 71.1 | 60.8 | 45.2 | 29.8 |
Refer to our dedicated Nvidia GeForce RTX 4060 Laptop GPU page for more information and performance comparisons.
Emissions: Low surface temps accompanied by high fan noise
System Noise
Colorful limits the EVOL X15 AT's fan noise to under 30 db(A) in the Quiet mode.
However, both the Entertainment and Performance modes see noise levels nearing the 55 db(A) mark even under average 3DMark 06 loads.
The provided power profiles do have a perceivable impact on gaming performance. For instance, we see average frame rates dropping by 33% in The Witcher 3 at 1080p Ultra when switching from the Performance mode to Quiet mode.
Noise level
| Idle |
| 33.16 / 33.16 / 33.16 dB(A) |
| Load |
| 54.62 / 54.53 dB(A) |
 | ||
30 dB silent 40 dB(A) audible 50 dB(A) loud |
||
min: | ||
| Performance mode | Idle dB(A) | Load average dB(A) | Load maximum dB(A) | The Witcher 3 1080p Ultra dB(A) |
|---|---|---|---|---|
| Quiet | 24.73 | 26.61 | 26.08 | 26.82 / 67 fps |
| Power Saving | 24.85 | 26.02 | 41.05 | 46.10 / 75 fps |
| Entertainment | 25.07 | 54.06 | 54.56 | 53.29 / 97 fps |
| Performance | 33.16 | 54.62 | 54.53 | 54.62 / 100 fps |
| Colorful EVOL X15 AT 23 i7-13700HX, GeForce RTX 4060 Laptop GPU | Alienware m16 R1 Intel i7-13700HX, GeForce RTX 4060 Laptop GPU | HP Omen 16-wf000 i7-13700HX, GeForce RTX 4080 Laptop GPU | Acer Predator Helios 16 PH16-71-731Q i7-13700HX, GeForce RTX 4060 Laptop GPU | Dell G15 5530 i7-13650HX, GeForce RTX 4060 Laptop GPU | Schenker XMG Pro 15 (E23) i9-13900HX, GeForce RTX 4060 Laptop GPU | Alienware m16 R1 AMD R9 7845HX, GeForce RTX 4080 Laptop GPU | Uniwill GM6PX7X RTX 4070 i7-13700HX, GeForce RTX 4070 Laptop GPU | |
|---|---|---|---|---|---|---|---|---|
| Noise | 9% | 7% | 14% | 19% | 11% | 13% | 13% | |
| off / environment * (dB) | 21.32 | 25 -17% | 23 -8% | 24 -13% | 20.41 4% | 24 -13% | 22.9 -7% | 22.4 -5% |
| Idle Minimum * (dB) | 33.16 | 25 25% | 29.6 11% | 24 28% | 26.85 19% | 24 28% | 22.9 31% | 22.9 31% |
| Idle Average * (dB) | 33.16 | 26 22% | 29.8 10% | 24 28% | 26.85 19% | 24 28% | 29.7 10% | 29 13% |
| Idle Maximum * (dB) | 33.16 | 27 19% | 30.4 8% | 32.32 3% | 26.85 19% | 24 28% | 29.7 10% | 29 13% |
| Load Average * (dB) | 54.62 | 52 5% | 33.8 38% | 36.66 33% | 27.65 49% | 53.65 2% | 29.8 45% | 40.2 26% |
| Witcher 3 ultra * (dB) | 54.6 | 51 7% | 57 -4% | 49.06 10% | 47.9 12% | 53.53 2% | 54.7 -0% | 48.7 11% |
| Load Maximum * (dB) | 54.53 | 53 3% | 58.3 -7% | 49.49 9% | 47.86 12% | 53.65 2% | 54.7 -0% | 55 -1% |
* ... smaller is better
Temperature
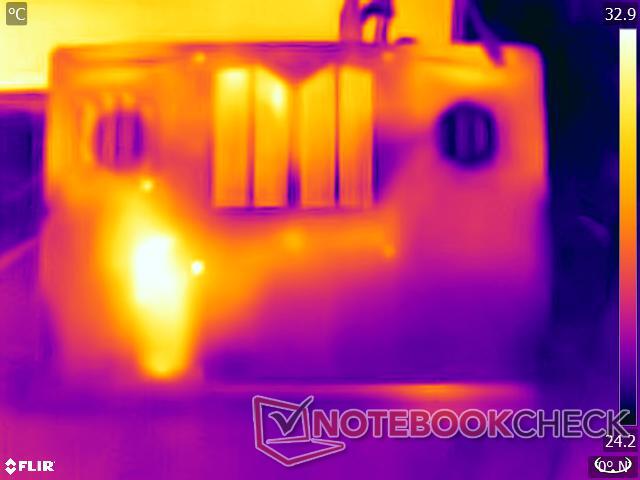
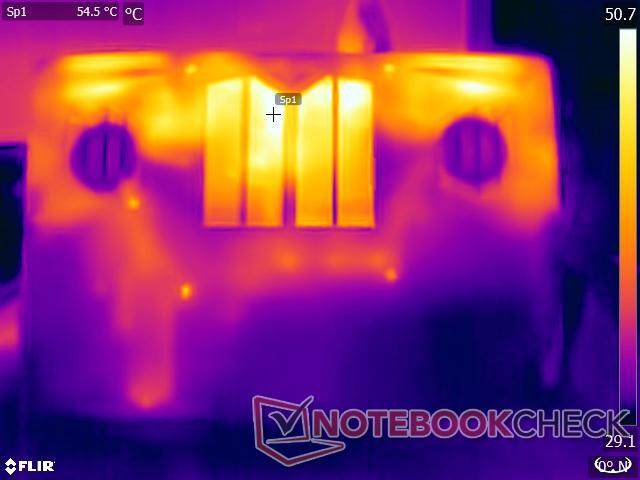
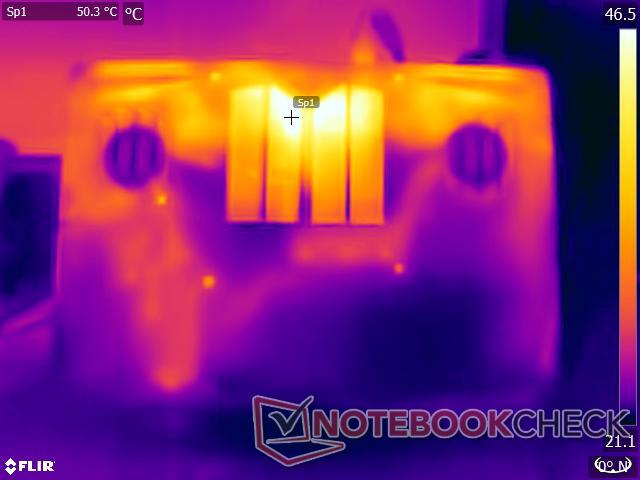
The EVOL X15 features a robust cooling system that fully covers the CPU, GPU, and the chipset. Surface temperatures are manageable under heavy load thanks to the solid plastic construction and ample clearance of the back panel from the motherboard. Only one hotspot at the bottom hits 51 °C.
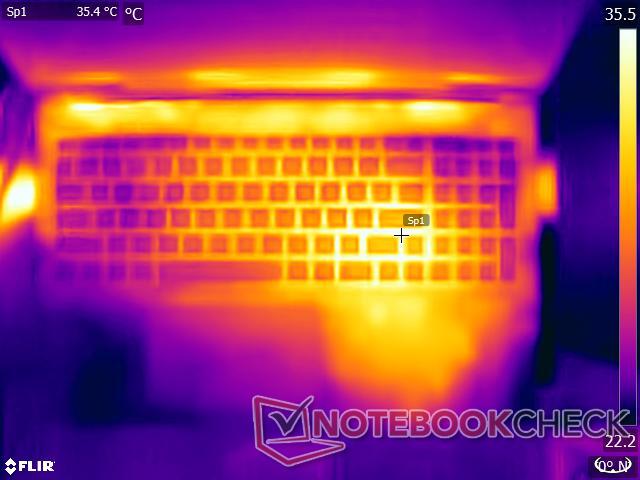
Notwithstanding its weight, the EVOL X15 can used on the lap as long as you don't push it too hard. The touchpad and palm rest areas remain relatively cool, only getting mildly warm under extreme load.

(+) The maximum temperature on the upper side is 37 °C / 99 F, compared to the average of 40.4 °C / 105 F, ranging from 21.2 to 68.8 °C for the class Gaming.
(-) The bottom heats up to a maximum of 51.2 °C / 124 F, compared to the average of 43.2 °C / 110 F
(+) In idle usage, the average temperature for the upper side is 29.3 °C / 85 F, compared to the device average of 33.9 °C / 93 F.
(+) Playing The Witcher 3, the average temperature for the upper side is 31.7 °C / 89 F, compared to the device average of 33.9 °C / 93 F.
(+) The palmrests and touchpad are reaching skin temperature as a maximum (34.8 °C / 94.6 F) and are therefore not hot.
(-) The average temperature of the palmrest area of similar devices was 28.8 °C / 83.8 F (-6 °C / -10.8 F).


| Colorful EVOL X15 AT 23 Intel Core i7-13700HX, NVIDIA GeForce RTX 4060 Laptop GPU | Alienware m16 R1 Intel Intel Core i7-13700HX, NVIDIA GeForce RTX 4060 Laptop GPU | HP Omen 16-wf000 Intel Core i7-13700HX, NVIDIA GeForce RTX 4080 Laptop GPU | Acer Predator Helios 16 PH16-71-731Q Intel Core i7-13700HX, NVIDIA GeForce RTX 4060 Laptop GPU | Dell G15 5530 Intel Core i7-13650HX, NVIDIA GeForce RTX 4060 Laptop GPU | Schenker XMG Pro 15 (E23) Intel Core i9-13900HX, NVIDIA GeForce RTX 4060 Laptop GPU | Alienware m16 R1 AMD AMD Ryzen 9 7845HX, NVIDIA GeForce RTX 4080 Laptop GPU | Uniwill GM6PX7X RTX 4070 Intel Core i7-13700HX, NVIDIA GeForce RTX 4070 Laptop GPU | |
|---|---|---|---|---|---|---|---|---|
| Heat | -18% | 0% | -17% | -19% | -9% | -9% | -5% | |
| Maximum Upper Side * (°C) | 37 | 49 -32% | 45 -22% | 41 -11% | 54 -46% | 50 -35% | 48 -30% | 38.2 -3% |
| Maximum Bottom * (°C) | 51.2 | 48 6% | 48.8 5% | 66 -29% | 62.2 -21% | 50 2% | 39 24% | 45 12% |
| Idle Upper Side * (°C) | 31.2 | 40 -28% | 29.2 6% | 36 -15% | 33.4 -7% | 33 -6% | 37 -19% | 33.6 -8% |
| Idle Bottom * (°C) | 32.8 | 39 -19% | 28.8 12% | 37 -13% | 33.4 -2% | 32 2% | 36.2 -10% | 39.6 -21% |
* ... smaller is better
Stress Test
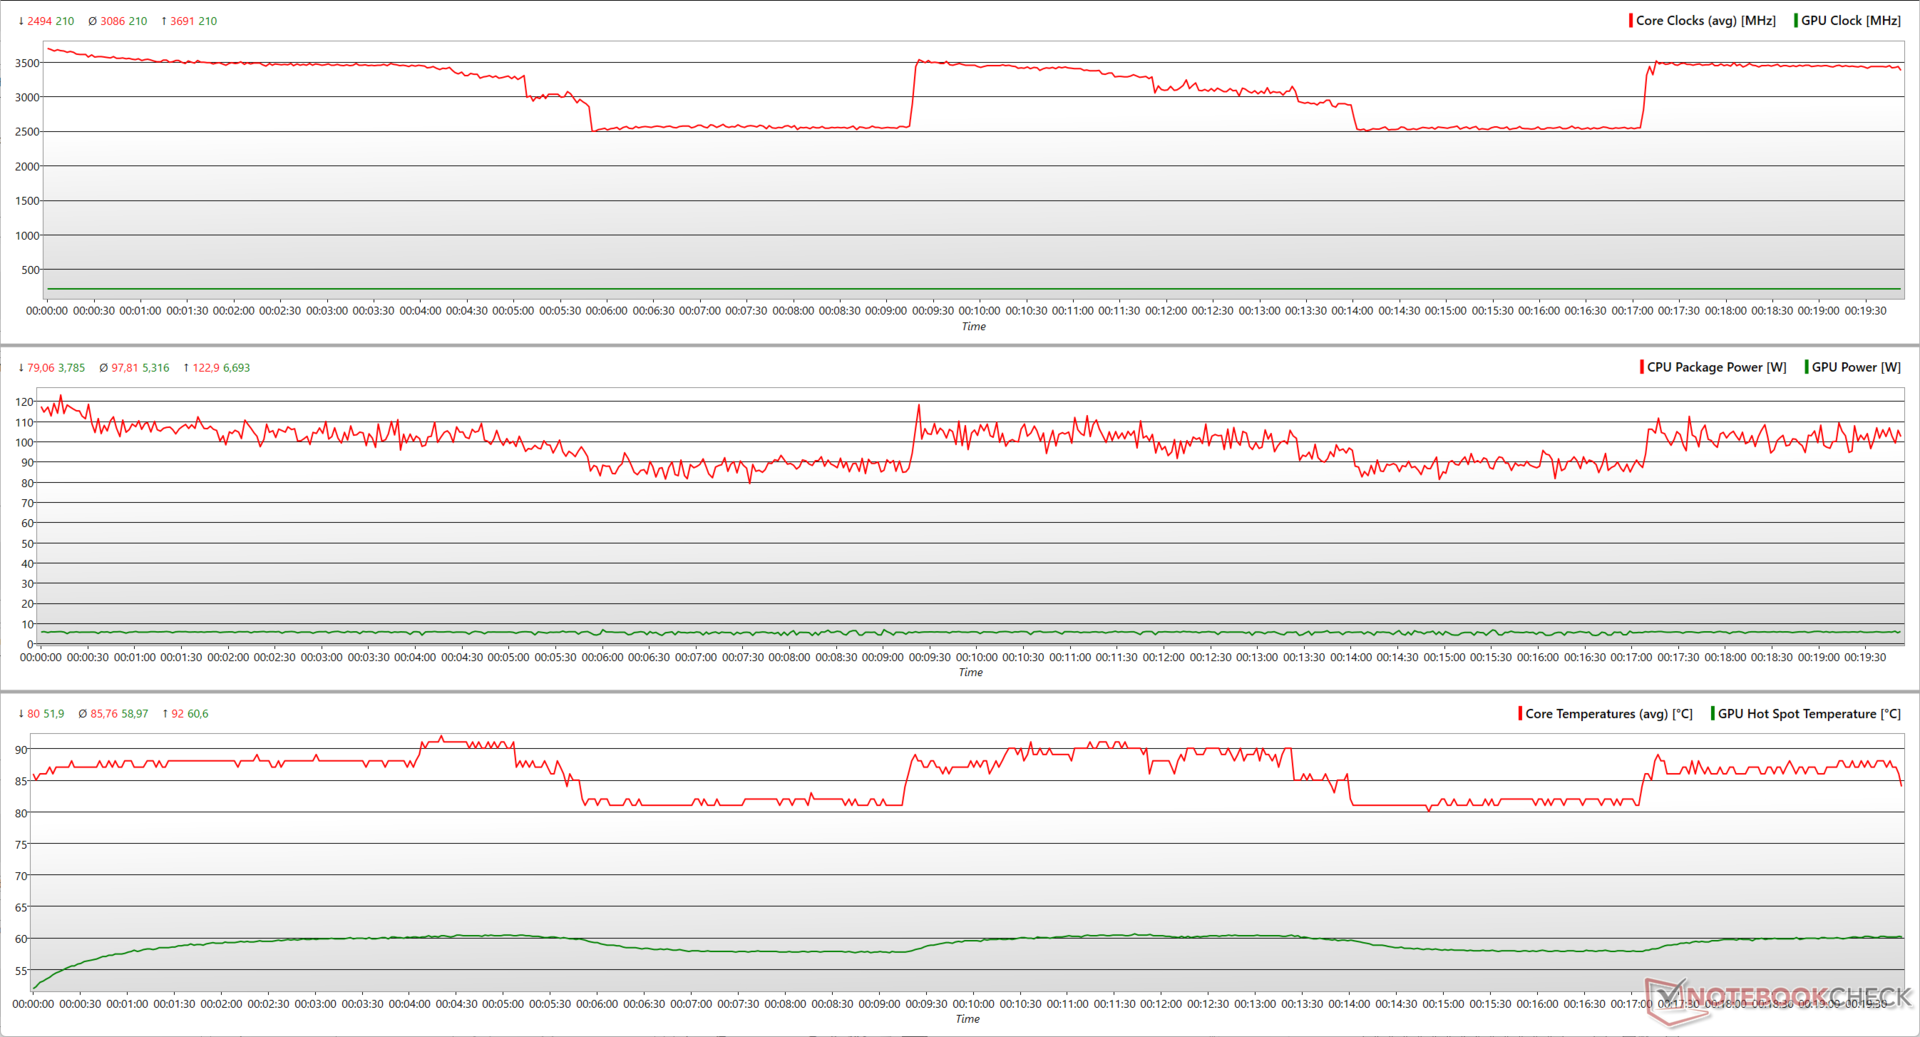
Stressing the EVOL X15 with Prime95 in-place large FFTs sees the Core i7-13700HX attaining peak boosts up to 3.7 GHz while utilizing 123 W. Despite comprehensive cooling, the CPU periodically drops to 2.5 GHz at 80 W before attempting to rise back to 3.7 GHz.
Upon adding FurMark, the Core i7-13700HX can now use up to 132 W to hit 4.2 GHz but still intermittently throttles close to the 2.5 GHz mark. The RTX 4060 can use the power headroom and hit 2,475 MHz peak while utilizing 161 W.
| Stress Test | CPU Clock (GHz) | GPU Clock (MHz) | Average CPU Temperature (°C) | Average GPU Temperature (°C) |
| System Idle | 1.42 | 210 | 31 | 37.1 |
| Prime95 | 3.42 | 210 | 85 | 50.8 |
| Prime95 + FurMark | 2.99 | 2,460 | 86 | 70.8 |
| The Witcher 3 1080p Ultra | 3.12 | 2,460 | 64 | 73.7 |
With The Witcher 3 at 1080p Ultra, the Core i7-13700HX is able to hit 4.2 GHz peak using only 76 W, while maintaining average clocks of 3.2 GHz at 46 W. This allows enough headroom for the RTX 4060 to attain a near-consistent boost of 2,490 MHz at 103 W.


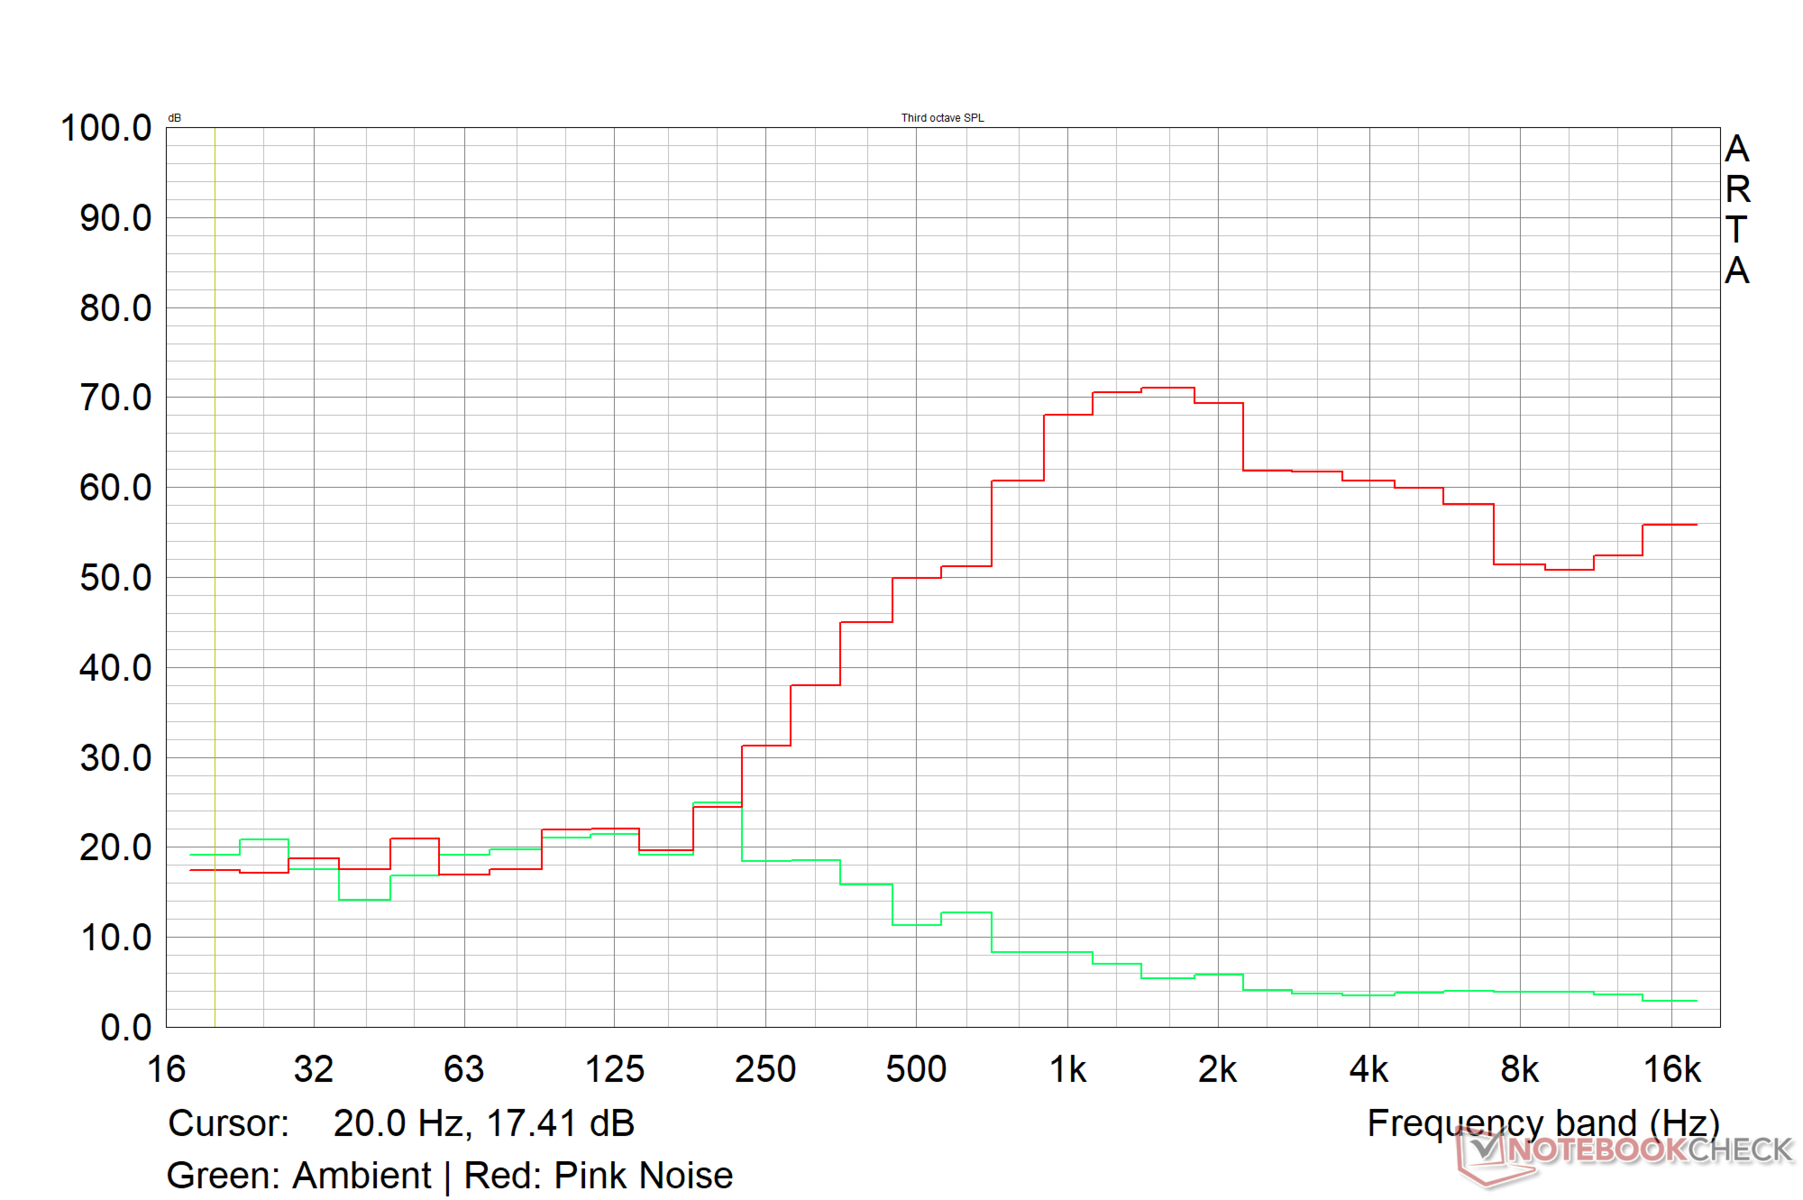
Speakers
The EVOL X15's stereo speakers are loud enough for a moderate-sized room. Colorful advertises Creative SoundBlaster Studio tuning, but the audio sounds tinny due to the lack of bass response and average mids. Higher frequencies, on the other hand, are reproduced fairly well.
Ideally, Colorful could have taken advantage of the large chassis to include more powerful passive radiators. Nevertheless, users can get better audio quality either through the 3.5 mm combo audio jack or Bluetooth 5.2.
Colorful EVOL X15 AT 23 audio analysis
(±) | speaker loudness is average but good (77.5 dB)
Bass 100 - 315 Hz
(-) | nearly no bass - on average 26.2% lower than median
(±) | linearity of bass is average (9.2% delta to prev. frequency)
Mids 400 - 2000 Hz
(±) | higher mids - on average 11.1% higher than median
(±) | linearity of mids is average (9.6% delta to prev. frequency)
Highs 2 - 16 kHz
(±) | higher highs - on average 6.1% higher than median
(+) | highs are linear (5.8% delta to prev. frequency)
Overall 100 - 16.000 Hz
(±) | linearity of overall sound is average (29.7% difference to median)
Compared to same class
» 95% of all tested devices in this class were better, 2% similar, 3% worse
» The best had a delta of 6%, average was 18%, worst was 132%
Compared to all devices tested
» 88% of all tested devices were better, 3% similar, 10% worse
» The best had a delta of 4%, average was 24%, worst was 134%
Apple MacBook Pro 16 2021 M1 Pro audio analysis
(+) | speakers can play relatively loud (84.7 dB)
Bass 100 - 315 Hz
(+) | good bass - only 3.8% away from median
(+) | bass is linear (5.2% delta to prev. frequency)
Mids 400 - 2000 Hz
(+) | balanced mids - only 1.3% away from median
(+) | mids are linear (2.1% delta to prev. frequency)
Highs 2 - 16 kHz
(+) | balanced highs - only 1.9% away from median
(+) | highs are linear (2.7% delta to prev. frequency)
Overall 100 - 16.000 Hz
(+) | overall sound is linear (4.6% difference to median)
Compared to same class
» 0% of all tested devices in this class were better, 0% similar, 100% worse
» The best had a delta of 5%, average was 17%, worst was 45%
Compared to all devices tested
» 0% of all tested devices were better, 0% similar, 100% worse
» The best had a delta of 4%, average was 24%, worst was 134%
Energy Management: Economical under max load
Power Consumption
The EVOL X15's idle power consumption is on the higher side compared to the competition using the Core i7-13700HX and RTX 4060. That being said, power draws under max load are relatively lower at 224 W.
The Uniwill GM6PX7X with an RTX 4070 shows 33% higher power draws under max load yet still manages to be 16% more economical overall than the EVOL X15.
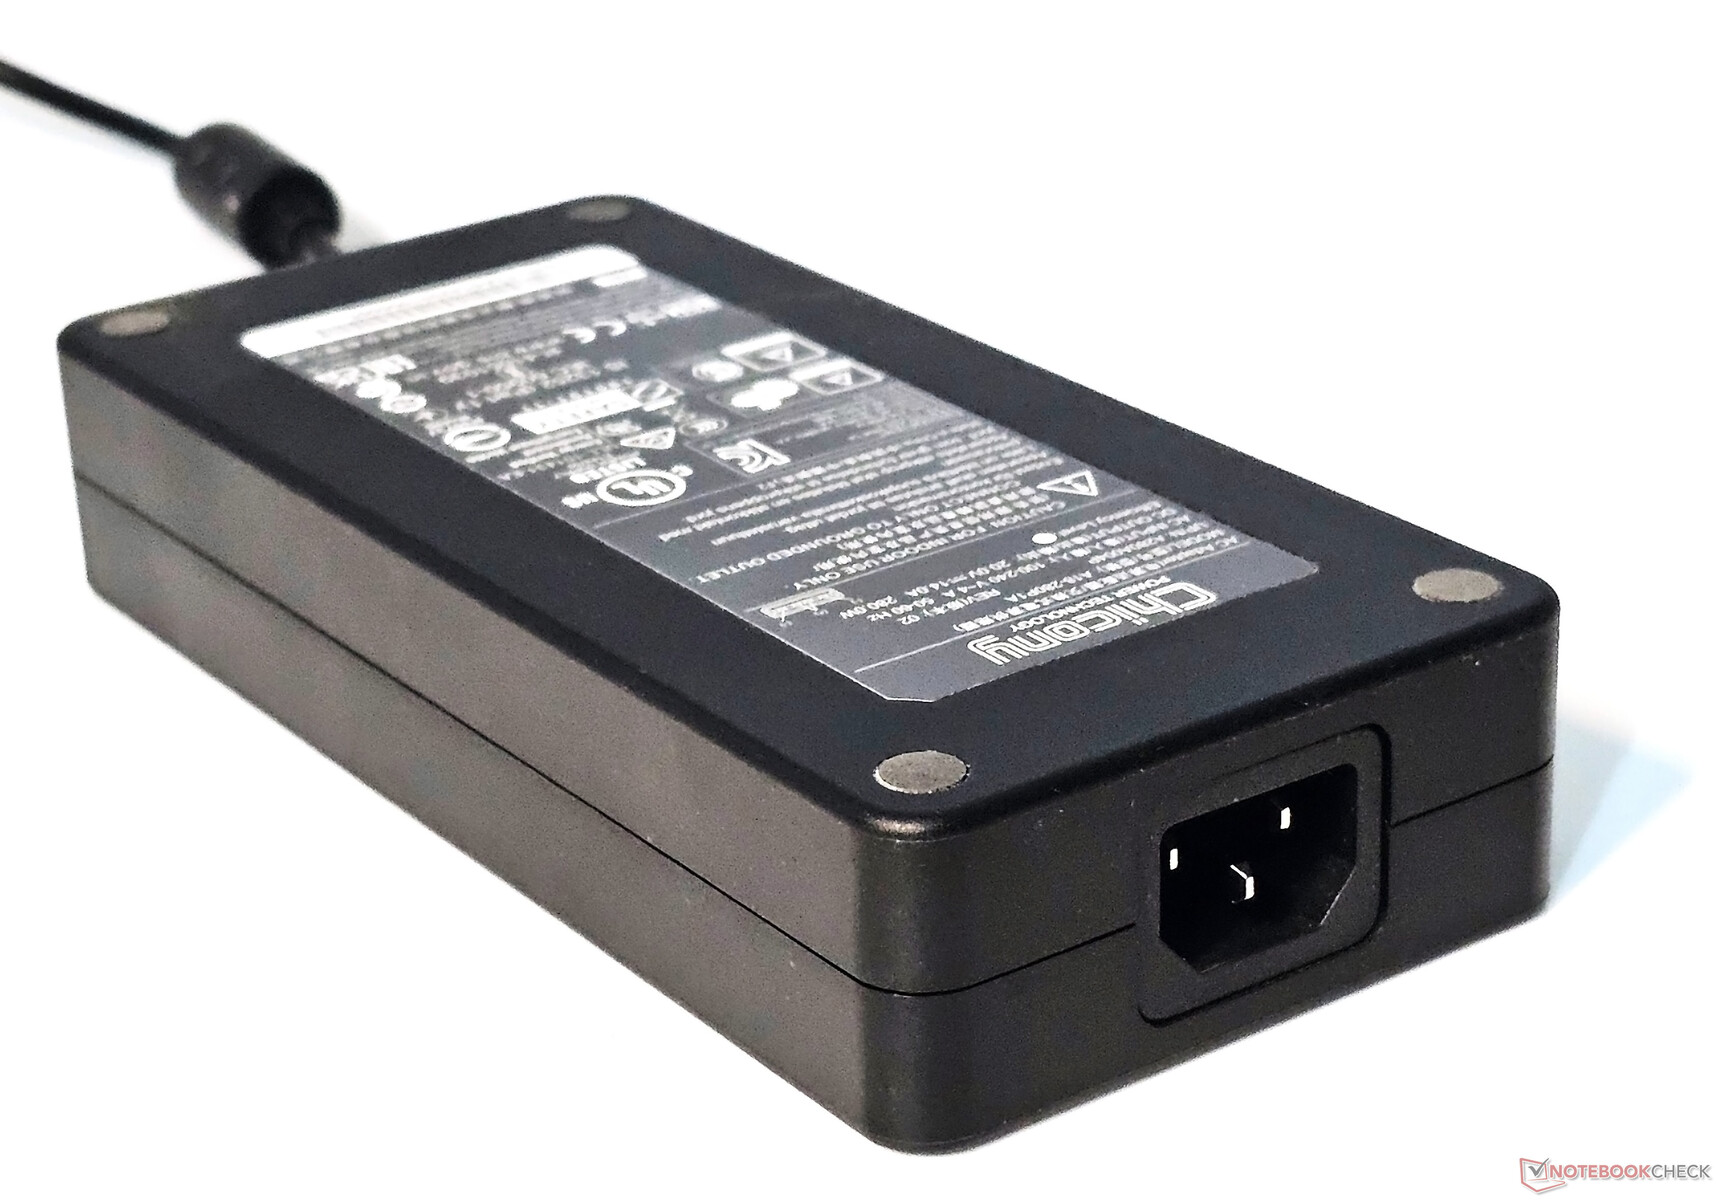
The supplied 280 W power brick can adequately power the laptop under stress.
| Off / Standby | |
| Idle | |
| Load |
|
Key:
min: | |
| Colorful EVOL X15 AT 23 i7-13700HX, GeForce RTX 4060 Laptop GPU, IPS, 2560x1440, 15.6" | Alienware m16 R1 Intel i7-13700HX, GeForce RTX 4060 Laptop GPU, IPS, 2560x1600, 16" | HP Omen 16-wf000 i7-13700HX, GeForce RTX 4080 Laptop GPU, IPS, 2560x1440, 16.1" | Acer Predator Helios 16 PH16-71-731Q i7-13700HX, GeForce RTX 4060 Laptop GPU, IPS-LED, 2560x1600, 16" | Dell G15 5530 i7-13650HX, GeForce RTX 4060 Laptop GPU, IPS, 1920x1080, 15.6" | Schenker XMG Pro 15 (E23) i9-13900HX, GeForce RTX 4060 Laptop GPU, IPS, 2560x1440, 15.6" | Alienware m16 R1 AMD R9 7845HX, GeForce RTX 4080 Laptop GPU, IPS, 2560x1600, 16" | Uniwill GM6PX7X RTX 4070 i7-13700HX, GeForce RTX 4070 Laptop GPU, IPS, 2560x1600, 16" | Average NVIDIA GeForce RTX 4060 Laptop GPU | Average of class Gaming | |
|---|---|---|---|---|---|---|---|---|---|---|
| Power Consumption | 20% | 2% | 20% | 30% | -11% | -45% | 16% | 36% | 25% | |
| Idle Minimum * (Watt) | 28.3 | 10 65% | 21.8 23% | 15.9 44% | 8.4 70% | 21.6 24% | 39 -38% | 12.6 55% | 11.5 ? 59% | 13.3 ? 53% |
| Idle Average * (Watt) | 32.2 | 14 57% | 26 19% | 20.5 36% | 14.98 53% | 29 10% | 44.6 -39% | 17.7 45% | 16 ? 50% | 19 ? 41% |
| Idle Maximum * (Watt) | 36.5 | 21 42% | 36 1% | 20.9 43% | 15.56 57% | 42.7 -17% | 68.1 -87% | 31.8 13% | 20.3 ? 44% | 24.5 ? 33% |
| Load Average * (Watt) | 119 | 119 -0% | 115.5 3% | 106 11% | 96.8 19% | 190 -60% | 129.8 -9% | 101.4 15% | 92.9 ? 22% | 108.1 ? 9% |
| Witcher 3 ultra * (Watt) | 189.6 | 186.7 2% | 214 -13% | 175 8% | 186 2% | 189 -0% | 285 -50% | 185.3 2% | ||
| Load Maximum * (Watt) | 224.3 | 323 -44% | 269.7 -20% | 276 -23% | 271.42 -21% | 269 -20% | 327.3 -46% | 298 -33% | 210 ? 6% | 254 ? -13% |
* ... smaller is better
Power Consumption: The Witcher 3 / Stress test
Power Consumption: External monitor
Battery Life
Given the EVOL X15's fairly powerful innards, the 73 WHr battery can afford only average run times. At 150 nits brightness, the laptop can last nearly 5.5 hours in our standard Wi-Fi web browsing test and roughly 6.5 hours during H.264 1080p video playback.
| Colorful EVOL X15 AT 23 i7-13700HX, GeForce RTX 4060 Laptop GPU, 73 Wh | Alienware m16 R1 Intel i7-13700HX, GeForce RTX 4060 Laptop GPU, 86 Wh | HP Omen 16-wf000 i7-13700HX, GeForce RTX 4080 Laptop GPU, 83 Wh | Acer Predator Helios 16 PH16-71-731Q i7-13700HX, GeForce RTX 4060 Laptop GPU, 90 Wh | Dell G15 5530 i7-13650HX, GeForce RTX 4060 Laptop GPU, 86 Wh | Schenker XMG Pro 15 (E23) i9-13900HX, GeForce RTX 4060 Laptop GPU, 80 Wh | Alienware m16 R1 AMD R9 7845HX, GeForce RTX 4080 Laptop GPU, 86 Wh | Uniwill GM6PX7X RTX 4070 i7-13700HX, GeForce RTX 4070 Laptop GPU, 62 Wh | Average of class Gaming | |
|---|---|---|---|---|---|---|---|---|---|
| Battery runtime | -15% | -11% | 5% | -11% | 26% | -35% | -26% | 25% | |
| H.264 (h) | 6.3 | 5.6 -11% | 4.8 -24% | 6.8 8% | 8.26 ? 31% | ||||
| WiFi v1.3 (h) | 5.4 | 4.8 -11% | 5.1 -6% | 5.6 4% | 6.5 20% | 5.7 6% | 3.7 -31% | 4 -26% | 7.01 ? 30% |
| Witcher 3 ultra (h) | 1.2 | 1.5 25% | 0.8 -33% | ||||||
| Load (h) | 1.3 | 1 -23% | 1.1 -15% | 1.5 15% | 0.8 -38% | 1.9 46% | 0.8 -38% | 1.47 ? 13% | |
| Reader / Idle (h) | 6.4 | 5.5 | 4 | 8.71 ? |
Pros
Cons
Verdict: Good choice if you can get it for under $1,000

Colorful aims to offer a capable QHD gaming laptop for under $1,000 and largely succeeds with the EVOL X15 AT 23. Primarily built with plastic Clevo construction, there is some keyboard flex; however, the EVOL X15 is remains structurally sound overall.
The EVOL X15 AT has a lot of things going for it. Prospective buyers will appreciate the decent port selection, fast Wi-Fi 6E speeds, and easy access to the innards.
The combination of an Intel Core i7-13700HX desktop-class CPU and the Nvidia GeForce RTX 4060 Laptop GPU enables the EVOL X15 AT to effectively compete with higher priced models such as the Alienware m16 R1 and the Acer Predator Helios 16.
The Colorful EVOL X15 AT may not offer all the bells and whistles found in the well-established competition, but it largely manages to get the basics right without any noticeable performance limitations."
That being said, there are several areas of criticism as well. Aspects such as the lack of power delivery-in with the Type-C ports and somewhat higher response times need addressing. Colorful also needs to focus on fine tuning fan curves with the default performance profiles and also work on improving idle power consumption.
Overall, the Colorful EVOL X15 AT is a worthy consideration, provided you are able to snag one for less than $1,000 and not have to pay a markup.
That being said, laptops powered by the RTX 3070 Ti Laptop GPU, or even the Radeon RX 6800M, may offer a better overall package at similar prices if you don't mind losing out on DLSS 3 frame generation and efficiency gains with Ada Lovelace.
Price and Availability
The Colorful EVOL X15 AT 23 is available directly from local distributors of Colorful products. The tested EVOL X15 AT configuration officially carries a $969 price tag, but it currently retails on Newegg at a substantially high markup of $1,759.
Alternatively, a QHD variant of the Acer Nitro 5 with an AMD Ryzen 7 6800H and RTX 3070 Ti Laptop GPU can be purchased from Amazon US for less than $1,200.
If raw CPU performance is not a priority, the Asus ROG Strix G15 featuring an AMD Ryzen 9 5900HX and Radeon RX 6800M is a good choice for less than $1,300 on Amazon US and less than $1,200 on Best Buy US.
Colorful EVOL X15 AT 23
- 12/20/2023 v7 (old)
Vaidyanathan Subramaniam
Transparency
The selection of devices to be reviewed is made by our editorial team. The test sample was given to the author by the manufacturer free of charge for the purposes of review. There was no third-party influence on this review, nor did the manufacturer receive a copy of this review before publication. There was no obligation to publish this review. As an independent media company, Notebookcheck is not subjected to the authority of manufacturers, retailers or publishers.
This is how Notebookcheck is testing
Every year, Notebookcheck independently reviews hundreds of laptops and smartphones using standardized procedures to ensure that all results are comparable. We have continuously developed our test methods for around 20 years and set industry standards in the process. In our test labs, high-quality measuring equipment is utilized by experienced technicians and editors. These tests involve a multi-stage validation process. Our complex rating system is based on hundreds of well-founded measurements and benchmarks, which maintains objectivity. Further information on our test methods can be found here.
Price comparison
