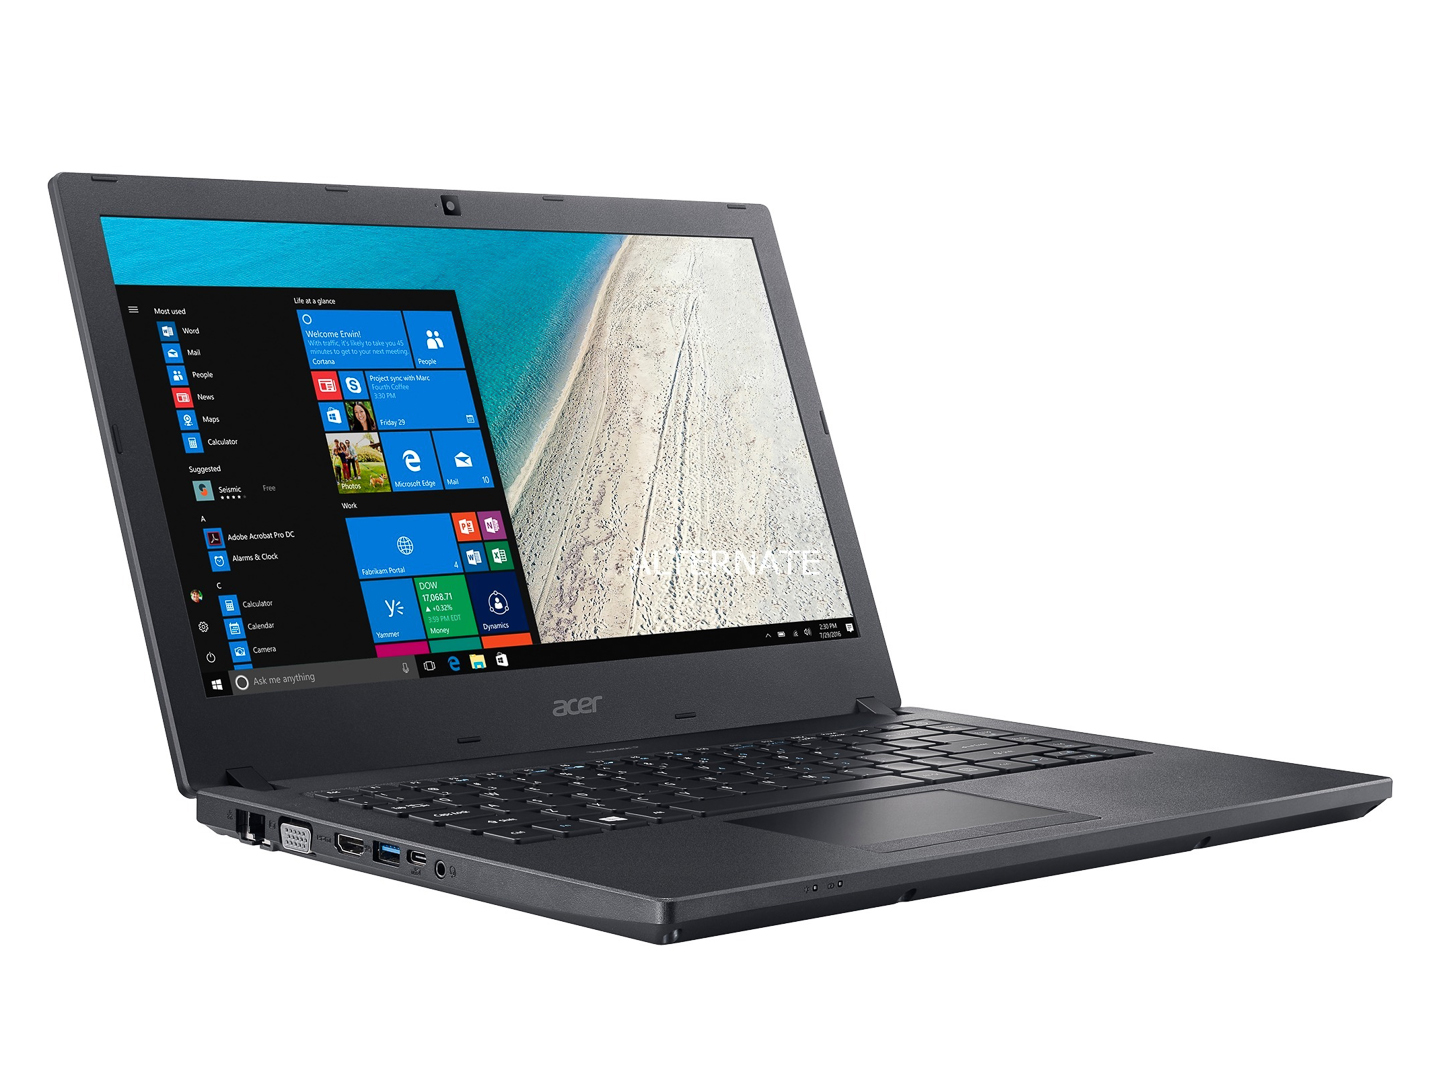
Acer TravelMate P2510 (i5-7200U, 256 GB SSD, IPS) Laptop Review
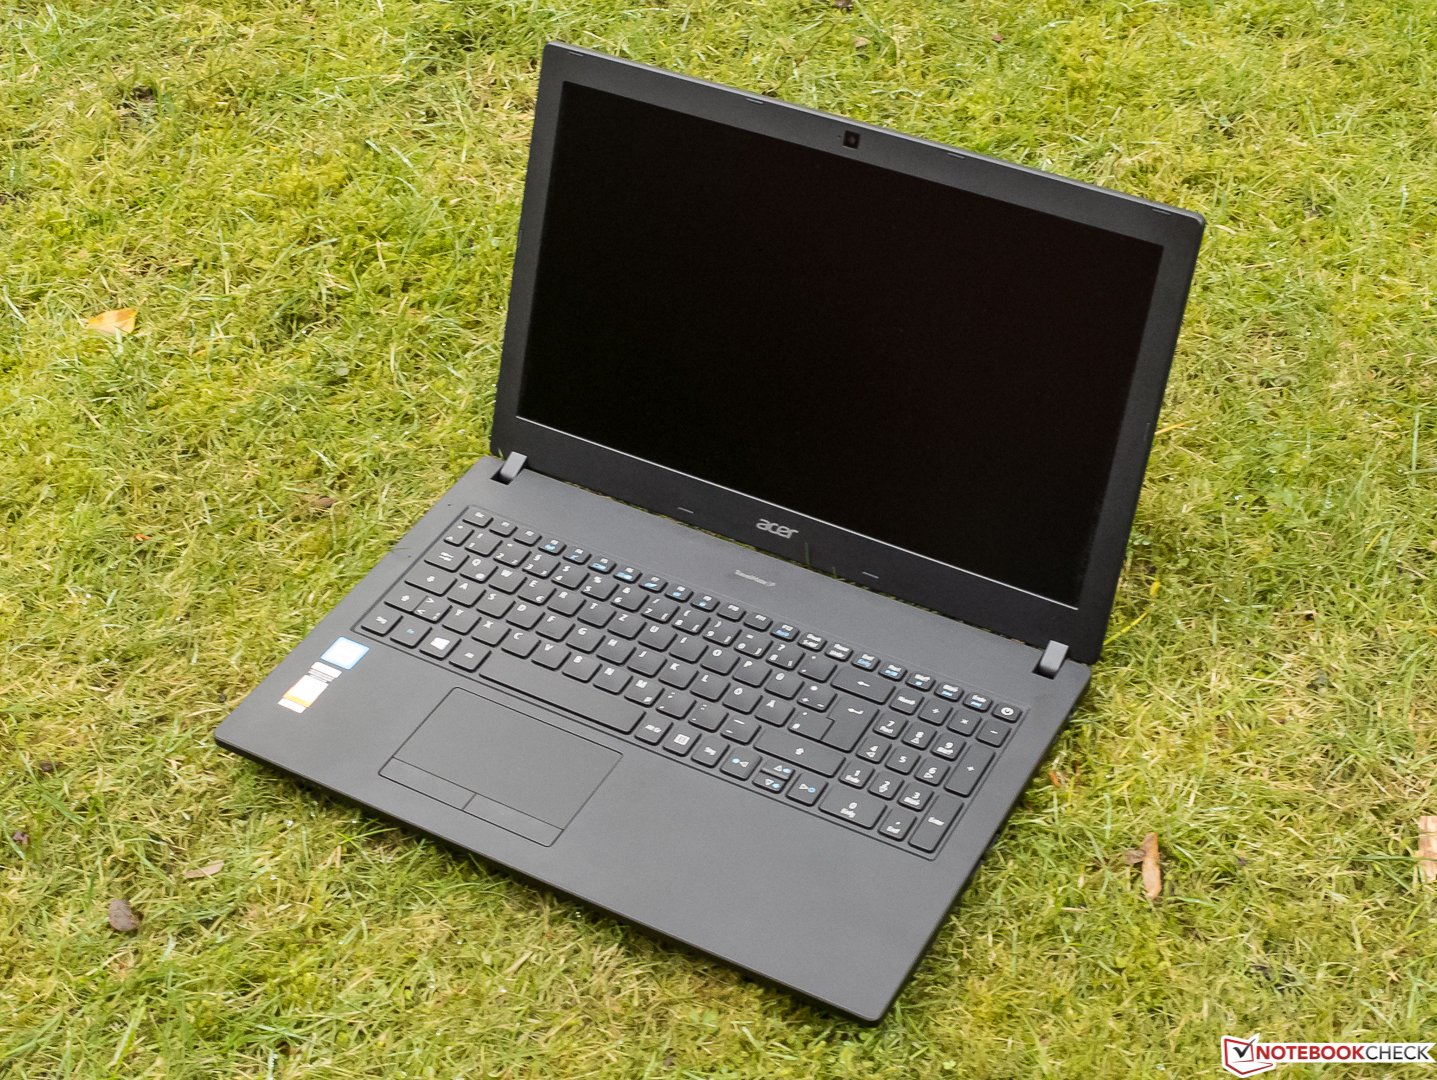
The Acer TravelMate P2510-M-51ZQ is a classic office notebook in the 15-inch format which weighs about 2.1 kg (~4.6 lb). It is driven by the Intel Core i5-7200U ULV dual-core processor accompanied by 8 GB of RAM. It has a Full HD IPS display, and a 256-GB SSD that serves as storage. Windows 10 Pro is preinstalled, and the laptop can be purchased starting at about 690 € (~$855) at the time of our test.
On its web page for the series, Acer mentions an optional Nvidia GeForce 940MX, which we were unable to discover at the large Berlin price comparison. However, we found the following variants instead:
- P2510-M-38GC (NX.VGAEG.001): Intel Core i3-7100U, 4 GB RAM, HDD 500 GB, TN display 1366x768, Linux, starting at about 360 € (~$446)
- P2510-M-52AH (NX.VGBEG.017): Intel Core i5-7200U, 4 GB RAM, HDD 500 GB, IPS display 1920x1080, Linux, starting at about 460 € (~$570)
- P2510-M-50ZZ (NX.VGBEG.018): Intel Core i5-7200U, 8 GB RAM, SSD 256 GB, TN display 1366x768, Windows 10 Pro, starting at about 670 € (~$831)
- P2510-M-73ZA (NX.VGBEV.008): Intel Core i7-7500U, 8 GB RAM, SSD 256 GB, IPS display 1920x1080, Windows 10 Pro, starting at about 910 € (~$1128)
There is ample choice of similarly-priced office notebooks, so that we did not have any problems finding comparable notebooks for this test. The following notebooks are used for comparison in this test:
- HP 15-bs103ng
- Dell Latitude 5580
- Lenovo V510-15IKB
Case
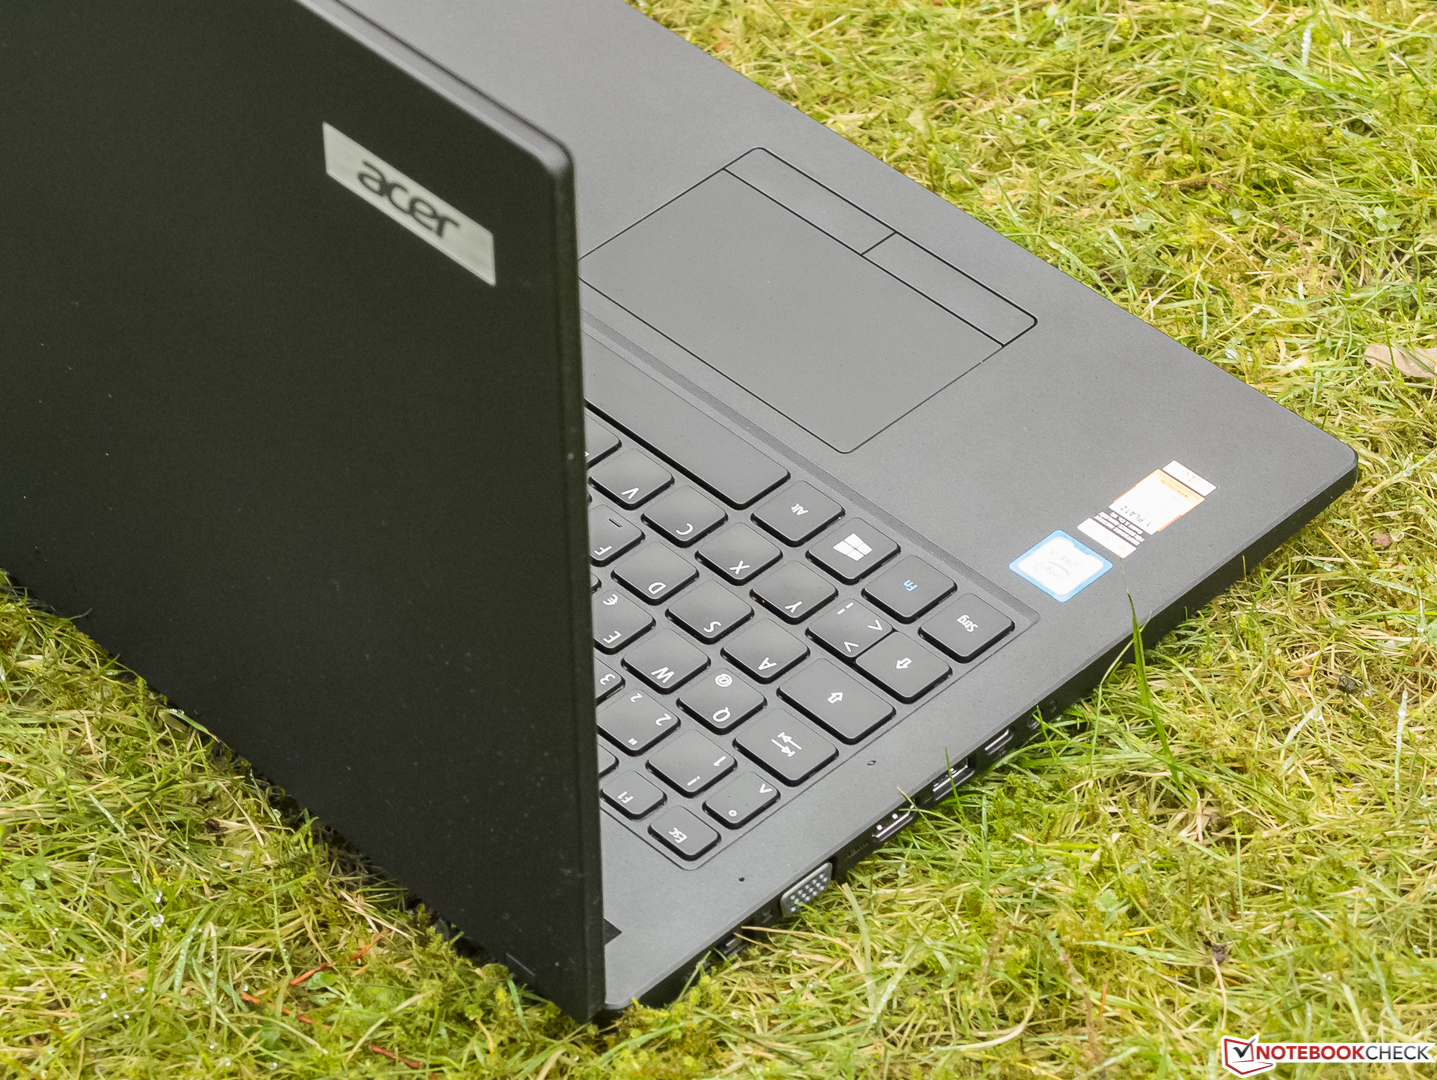
Considering the very affordable price of the entry-level model, it is not surprising that the black case is made entirely of plastic. The roughened, non-slip surfaces are not very susceptible to fingerprints. The motto is absolute simplicity in the design, and we are looking for visual accents in vain.
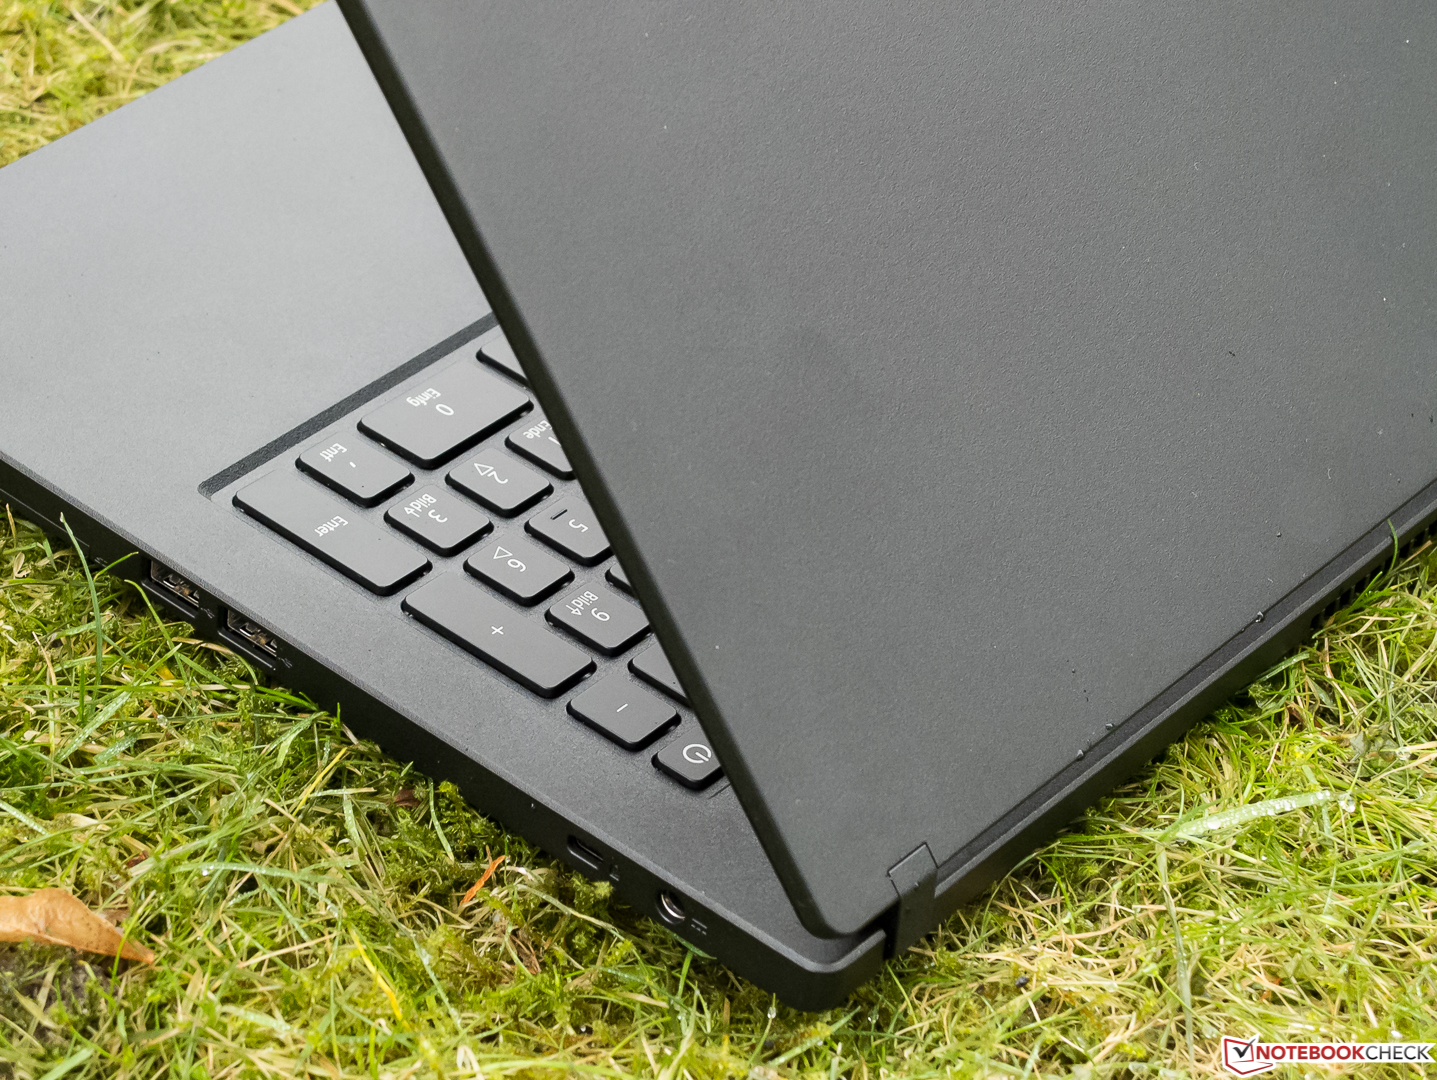
The impression of the quality of our test unit suffers massively from the fact that at least one of the feet of the case is always hanging in the air at a distance of a few millimeters from the table. If you press on one corner, the other lifts off the table. If you look at the base from the front or back, you can clearly see that it is bent down in the center. If we press in the center above or below the keyboard, the base can be bent down to the table without any difficulties. Acer's quality control has failed here, which naturally results in a deduction from the sub-rating. While we have not been used to something like this, even in the more affordable series from Acer, some of our readers might have had other experiences. The workmanship did not leave the best impression in other areas as well. The parts were not well fitted together in some places on the lid as well, and we were able to observe some uneven gaps that could be changed by pressure. While you can warp the base to some extent with the use of some force, we could not hear more than some harmless creaking noises.
The problems continue in the hinges: while the lid, which was not pressure resistant, could be opened with one hand, when picking up the opened laptop, the lid would continue to open by itself, down towards 180° if there were some minimal shaking movements. The wobbly behavior also left something to be desired.

In our four test candidates, the differences in their footprint, thickness, and weight are not very large. We only noticed here that with the V510, Lenovo has the lightest and deepest laptop. Probably none of the manufacturers had compact measurements high on their priority list.
Features
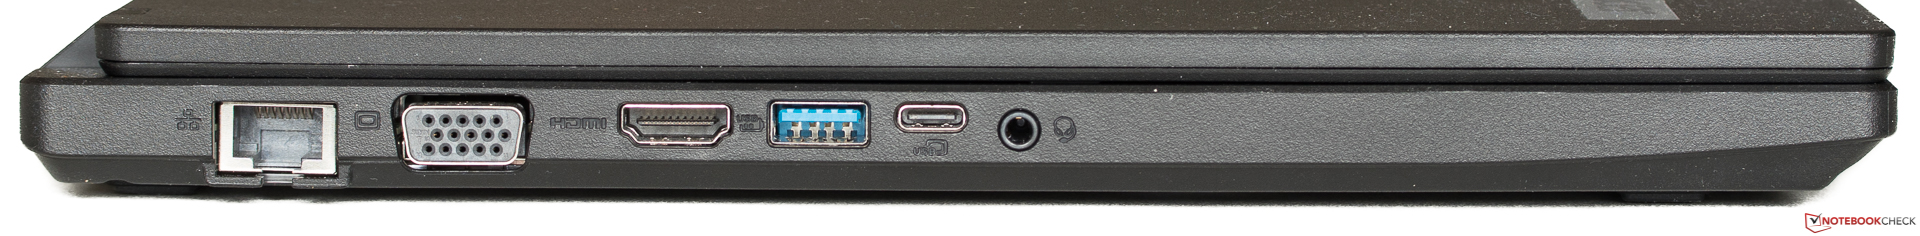
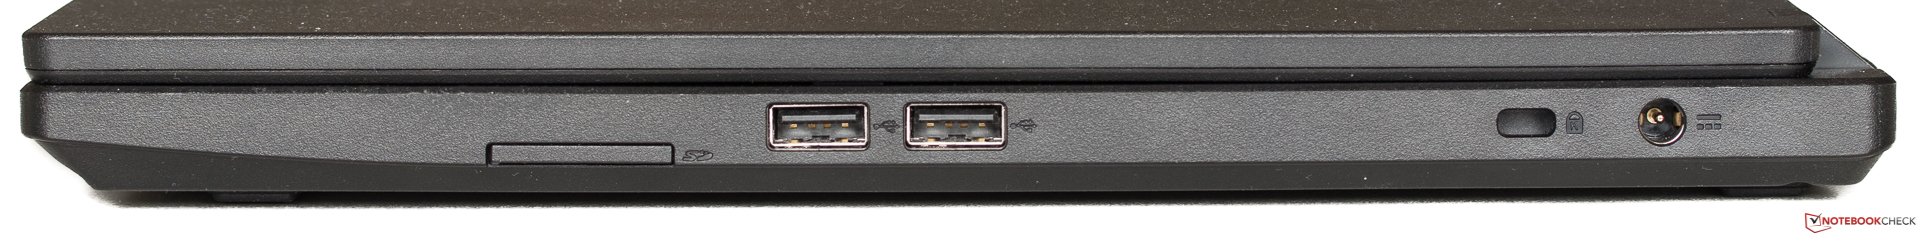
Hardly anyone would be surprised that the connections are only slightly more than the minimum required. For example, two of the four USB ports still operate according to the slower 2.0 standard and Thunderbolt is lacking. Instead, you are favored with an old VGA connection next to the HDMI. One of the USB 3 ports is implemented as Type C, and it offers DisplayPort, if you use the corresponding adapter, which is unfortunately not included. For right-handed users who want to connect an external mouse, the two USB-2.0 ports are too far in the front, so that the cable might get in the way. The left side, which has all the other connections except for the power, looks a little better.
SD Card Reader
Dead-slow card readers that connect via USB 2.0 are unfortunately not uncommon in affordable laptops, and aside from the Dell Latitude 5580, our candidates are no exception here. Anyone transferring larger amounts of photos to the Acer TravelMate P2510 on a frequent basis might quickly want to consider using an external USB-3.0 card reader. We performed our measurements with our Toshiba Exceria Pro SDXC 64 GB UHS-II reference storage card.
| SD Card Reader | |
| average JPG Copy Test (av. of 3 runs) | |
| Dell Latitude 5580 (Toshiba Exceria Pro SDXC 64 GB UHS-II) | |
| Acer TravelMate P2510-M-51ZQ (Toshiba Exceria Pro SDXC 64 GB UHS-II) | |
| HP 15-bs103ng (Toshiba Exceria Pro SDXC 64 GB UHS-II) | |
| Lenovo V510-15IKB 80WQ0002GE (Toshiba Exceria Pro SDXC 64 GB UHS-II) | |
| maximum AS SSD Seq Read Test (1GB) | |
| Dell Latitude 5580 (Toshiba Exceria Pro SDXC 64 GB UHS-II) | |
| Lenovo V510-15IKB 80WQ0002GE (Toshiba Exceria Pro SDXC 64 GB UHS-II) | |
| HP 15-bs103ng (Toshiba Exceria Pro SDXC 64 GB UHS-II) | |
| Acer TravelMate P2510-M-51ZQ (Toshiba Exceria Pro SDXC 64 GB UHS-II) | |
Communication
In terms of the WLAN transfer speed, our test unit with its Intel MIMO-2x2 module (867 Mb/s max.) can clearly outpace the other competitors in the test and shines particularly during sending at 681 Mb/s. Even though the Dell brings almost the same technical requisites, it is significantly weaker here and remains far behind the expectations. The Lenovo and the HP have only MIMO-1x1 components with a maximum of 433 Mb/s. We perform our measurements at a distance of one meter (~3 ft) from our Linksys EA8500 reference router.
| Networking | |
| iperf3 transmit AX12 | |
| Acer TravelMate P2510-M-51ZQ | |
| Dell Latitude 5580 | |
| HP 15-bs103ng | |
| Lenovo V510-15IKB 80WQ0002GE | |
| iperf3 receive AX12 | |
| Acer TravelMate P2510-M-51ZQ | |
| Dell Latitude 5580 | |
| Lenovo V510-15IKB 80WQ0002GE | |
| HP 15-bs103ng | |
Security
While there is no fingerprint sensor, there is a current (and more important) Trusted Platform Module (TPM) with version 2.0, which is also the base for the preinstalled Acer ProShield software. In addition, you have access to the Bitlocker drive encryption via Windows 10 Pro.
Accessories
The bland box contains just the power supply and customary setup and warranty instructions.
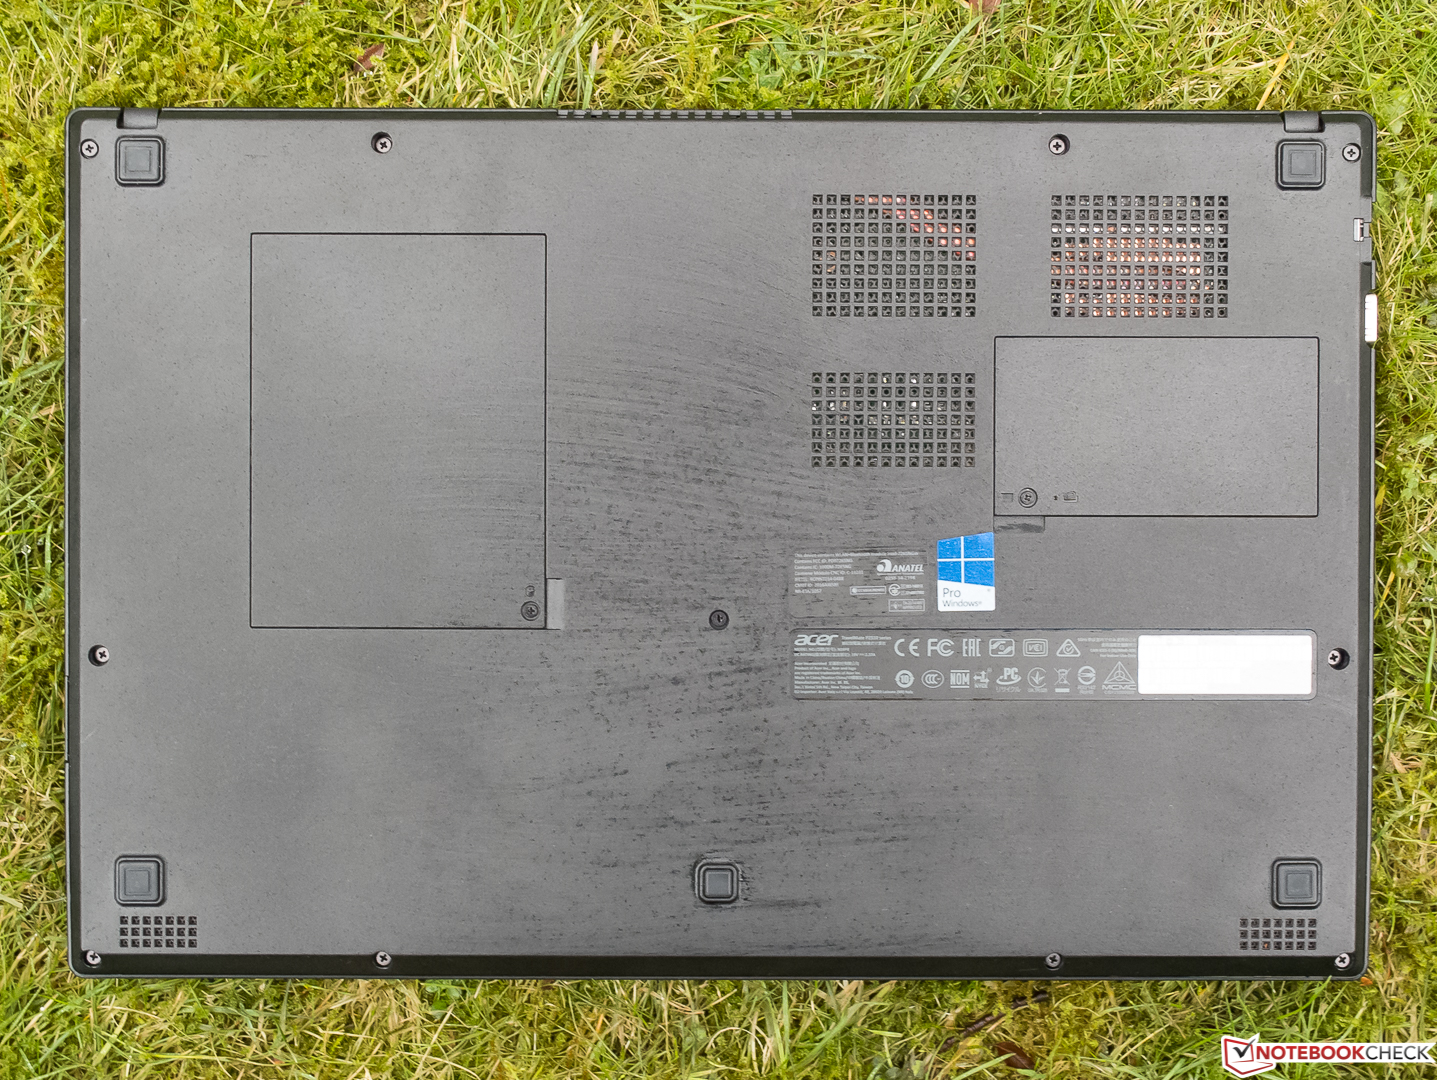
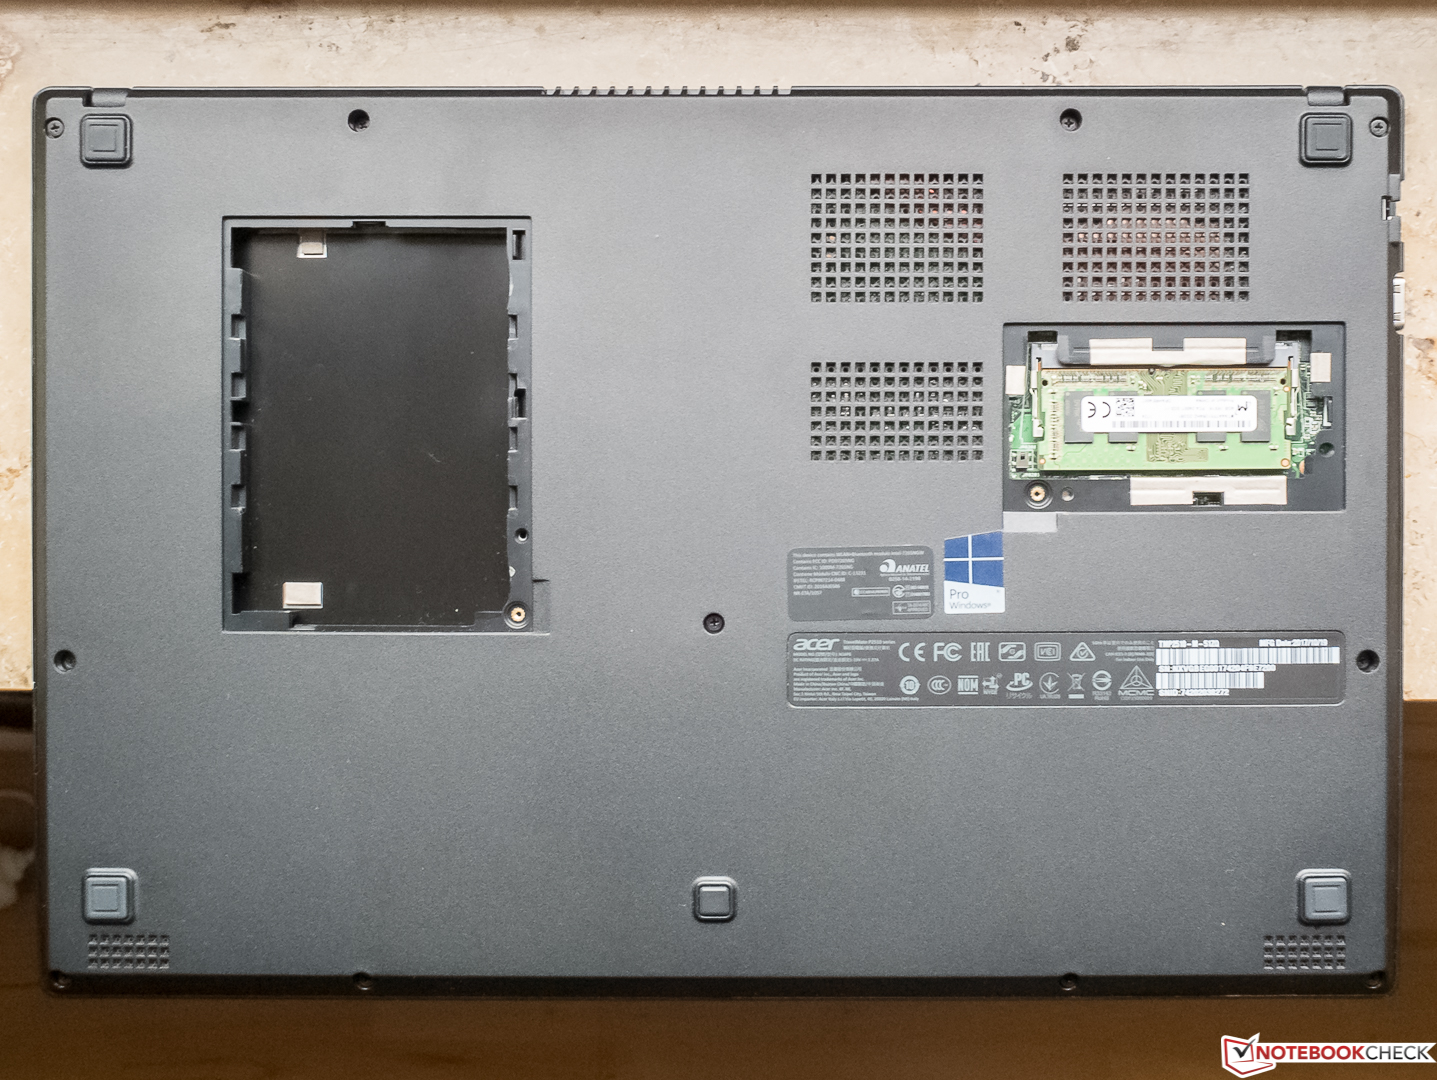
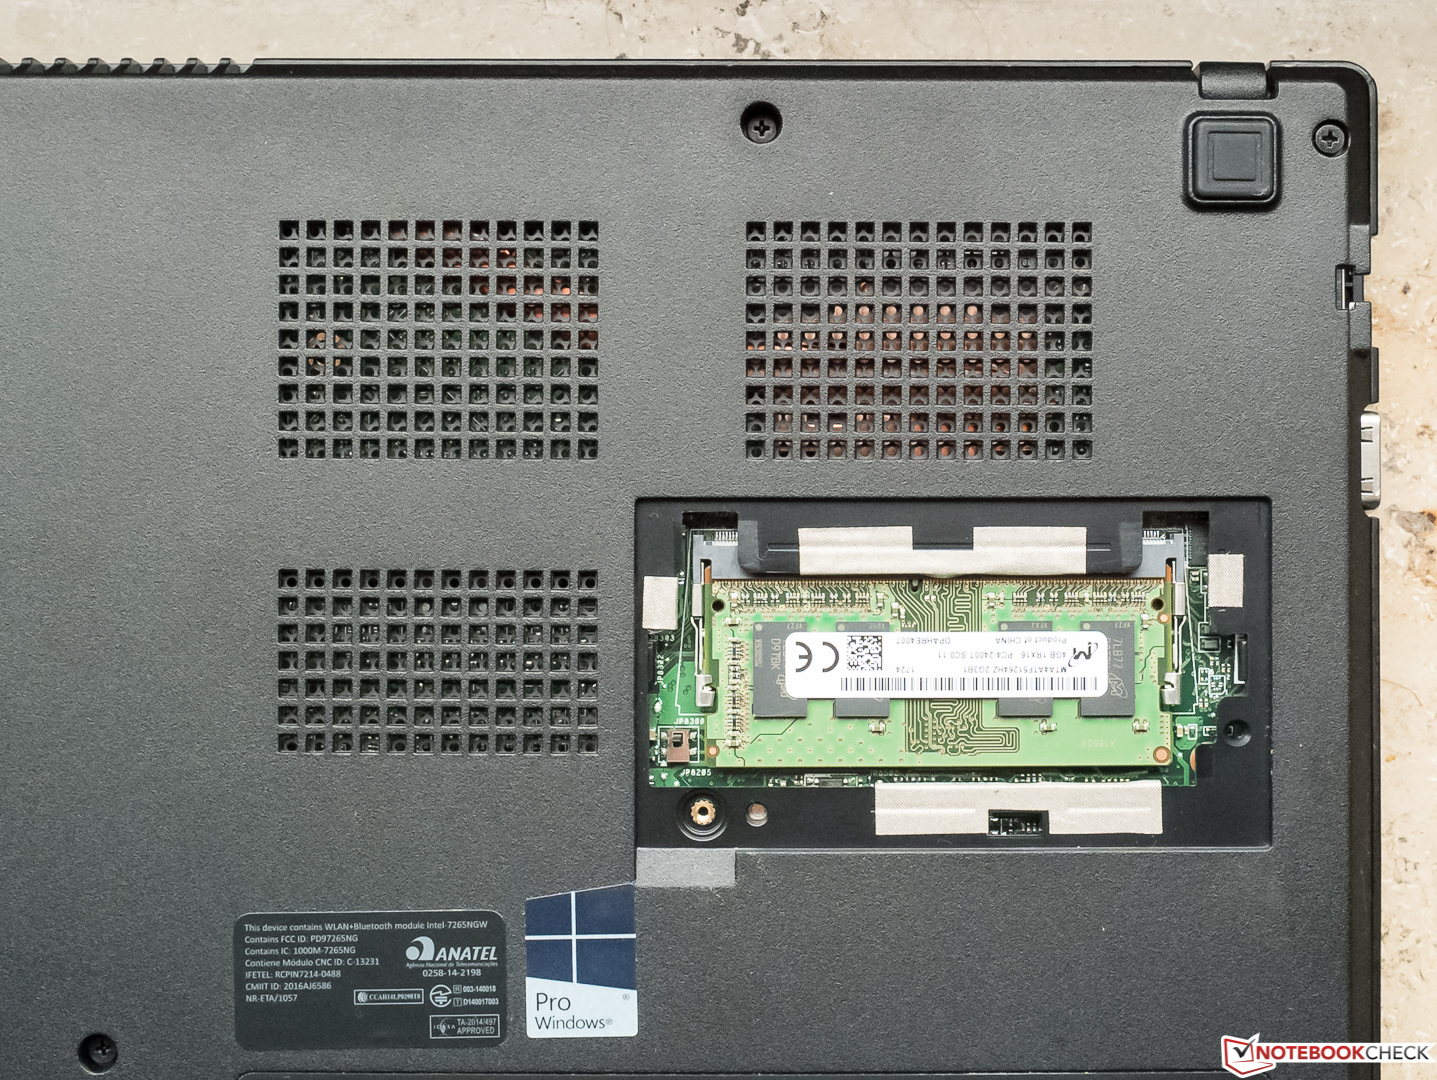
Maintenance
The TravelMate P2510 has two maintenance hatches which are secured with a single screw each. One hatch hides an empty 2.5-inch drive slot for an additional SSD, for example, and the other a single slot which is occupied with 4 GB of RAM. For all the other maintenance tasks including battery removal, you will need to remove the bottom of the case, which is secured with 11 Philips screws.
Warranty
Acer's statements on the warranty are contradictory once again. One place mentions a 3-year send-in warranty for TravelMate notebooks, and if you open the corresponding PDF document, the warranty shrinks to 2 years, which sounds correct to us (Note that this applies only to the German website). The manufacturer also offers fee-based warranty extensions, which you can check out here.
Please see our Guarantees, Return Policies and Warranties FAQ for country-specific information.
Input Devices
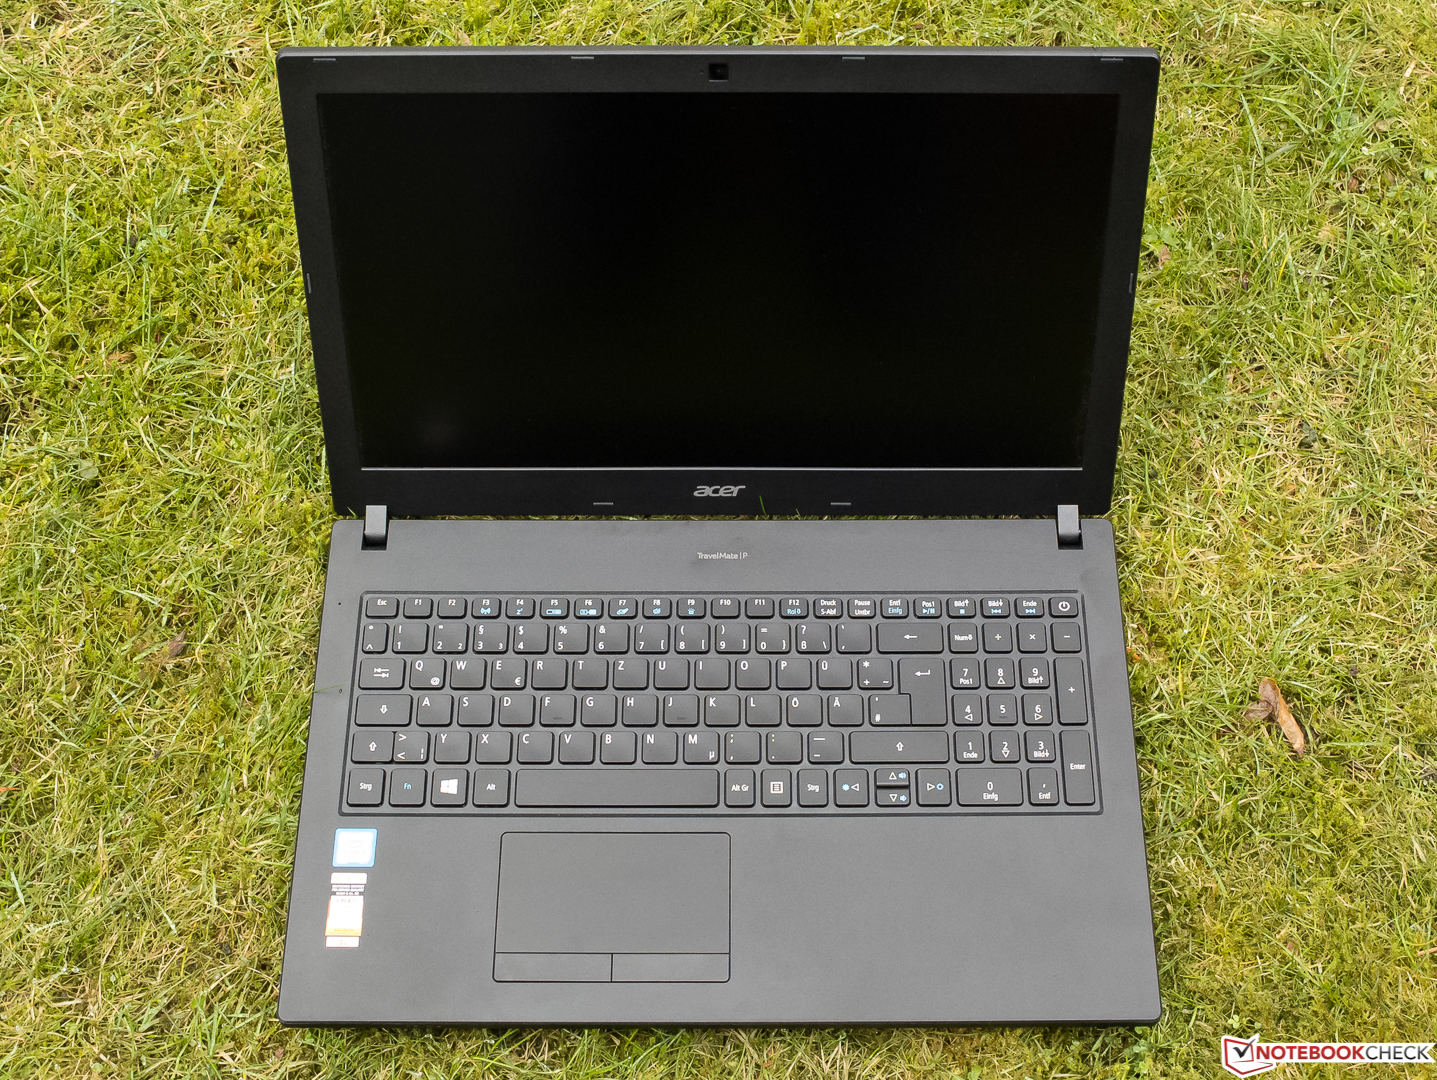
Keyboard
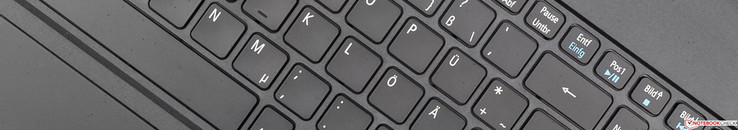
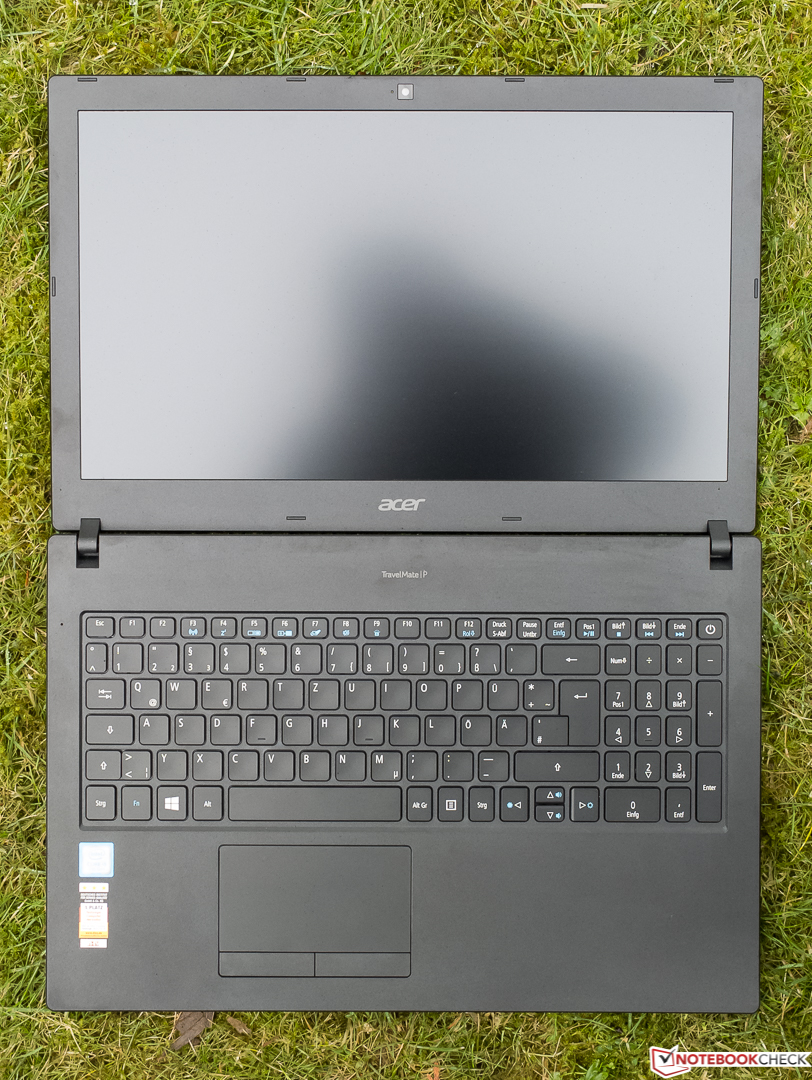
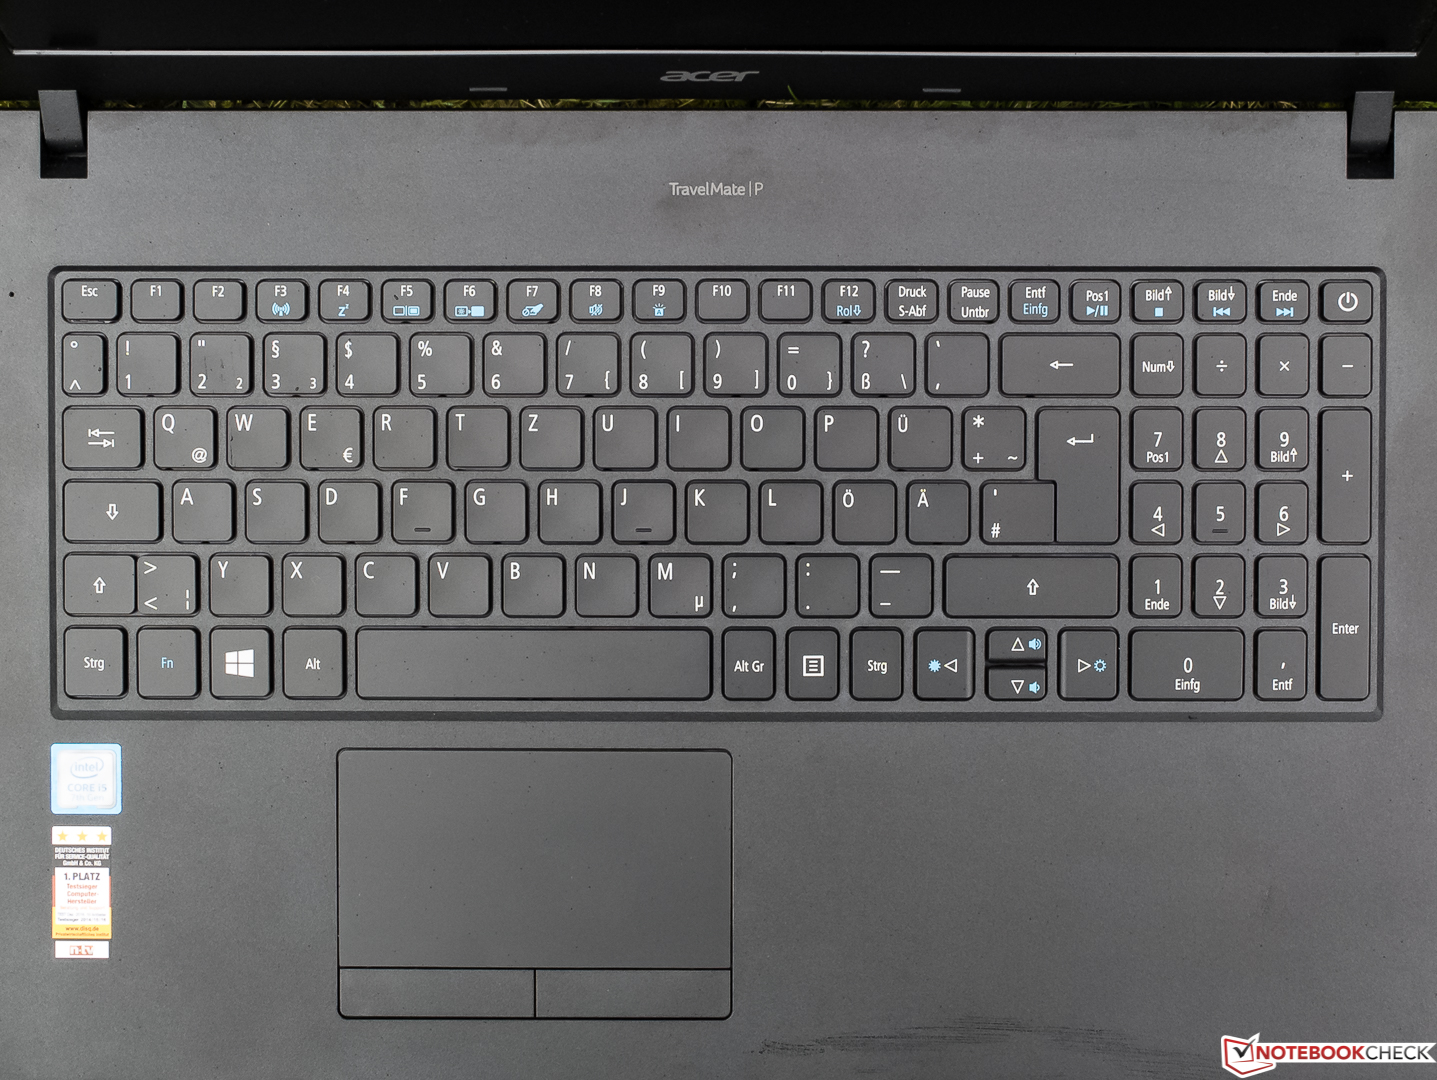
The main keypad of the cleanly set-in keyboard is only a few millimeters shorter than the width of a standard desktop keyboard, which allows for regular key sizes and spacing. Instead, the number pad is relatively small. Most of the main keys for letters, numbers, and punctuation have a concave surface and are comfortably rubberized like the remaining flat keys. In the center, the keyboard can be easily pressed down so far that the base touches the table. However, this instability is not very noticeable during regular typing.
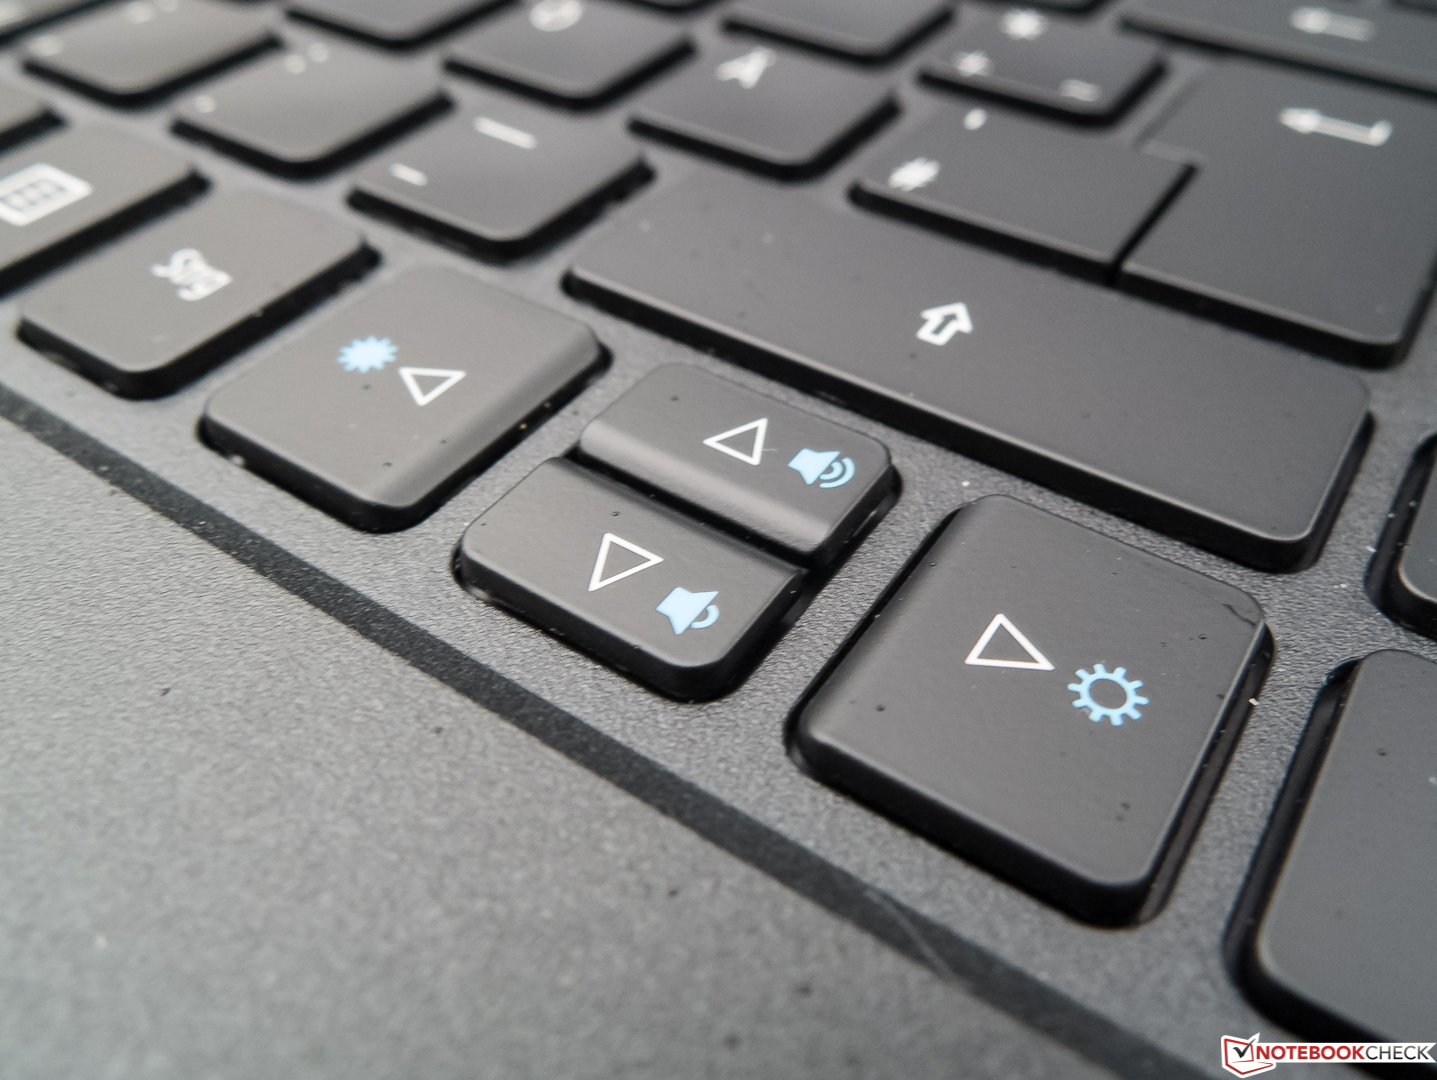
With a stroke of 1.5 mm (~0.06 in) at most, a pressure point that is easy to sense, and an only slightly dampened stroke, the haptic of the keyboard meets the tastes of the tester and should allow most users to type at their accustomed speeds. Due to the loud typing noises of the large keys in particular, using it in noise-sensitive environments is not recommended. Apart from the on/off key which is integrated into the number pad, the layout offers hardly any surprises. The keys are labeled flawlessly and can be illuminated evenly and sufficiently bright, but you have to make do without various dimming steps.
Touchpad
Acer has opted for a classical touchpad with separate keys and a smooth surface with a comfortable size, whose sliding characteristics are not affected, even with slightly moist fingers. The pointer is controlled accurately, and it follows fast movements flawlessly. Dedicated touchpad driver menus are falling out of fashion more and more, and you can "only" configure gestures with up to four fingers via the on-board Windows 10 settings.
Overall, we like the two tightly adjusted replacement mouse keys which have a short stroke and offer a clear acoustic and haptic feedback. However, the sounds are different, depending on where you press.
Display
The Full HD IPS panel from the manufacturer Chi Mei has stable viewing angles, but is otherwise not very compelling. It has a matte surface and a PPI of 141 is not that generous, but there is nothing to complain about in terms of its sharpness. The maximum brightness of barely 200 cd/m² on average is at the lower end of the acceptable range and is easily exceeded by the other competitors in the test, even though they are not very bright. The same goes for the below-average measured brightness distribution of only 78%, which corresponds to a slightly uneven black image with the beginnings of screen bleeding, particularly in the corners and at the bottom edge. Acer does not offer any alternative displays in the series.
| |||||||||||||||||||||||||
Brightness Distribution: 78 %
Center on Battery: 216 cd/m²
Contrast: 672:1 (Black: 0.32 cd/m²)
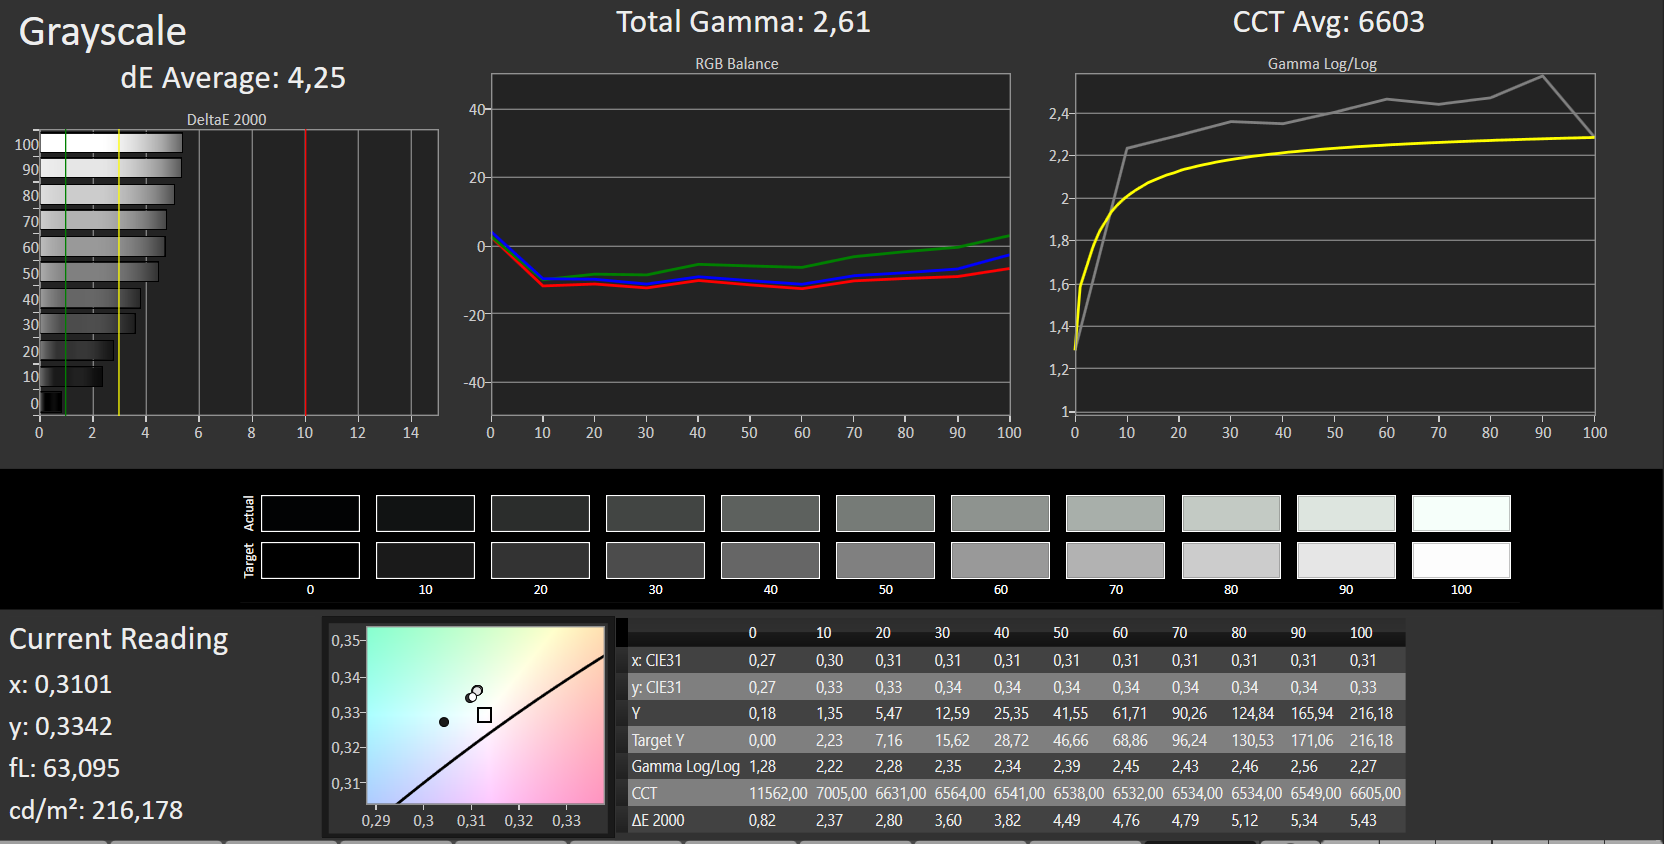
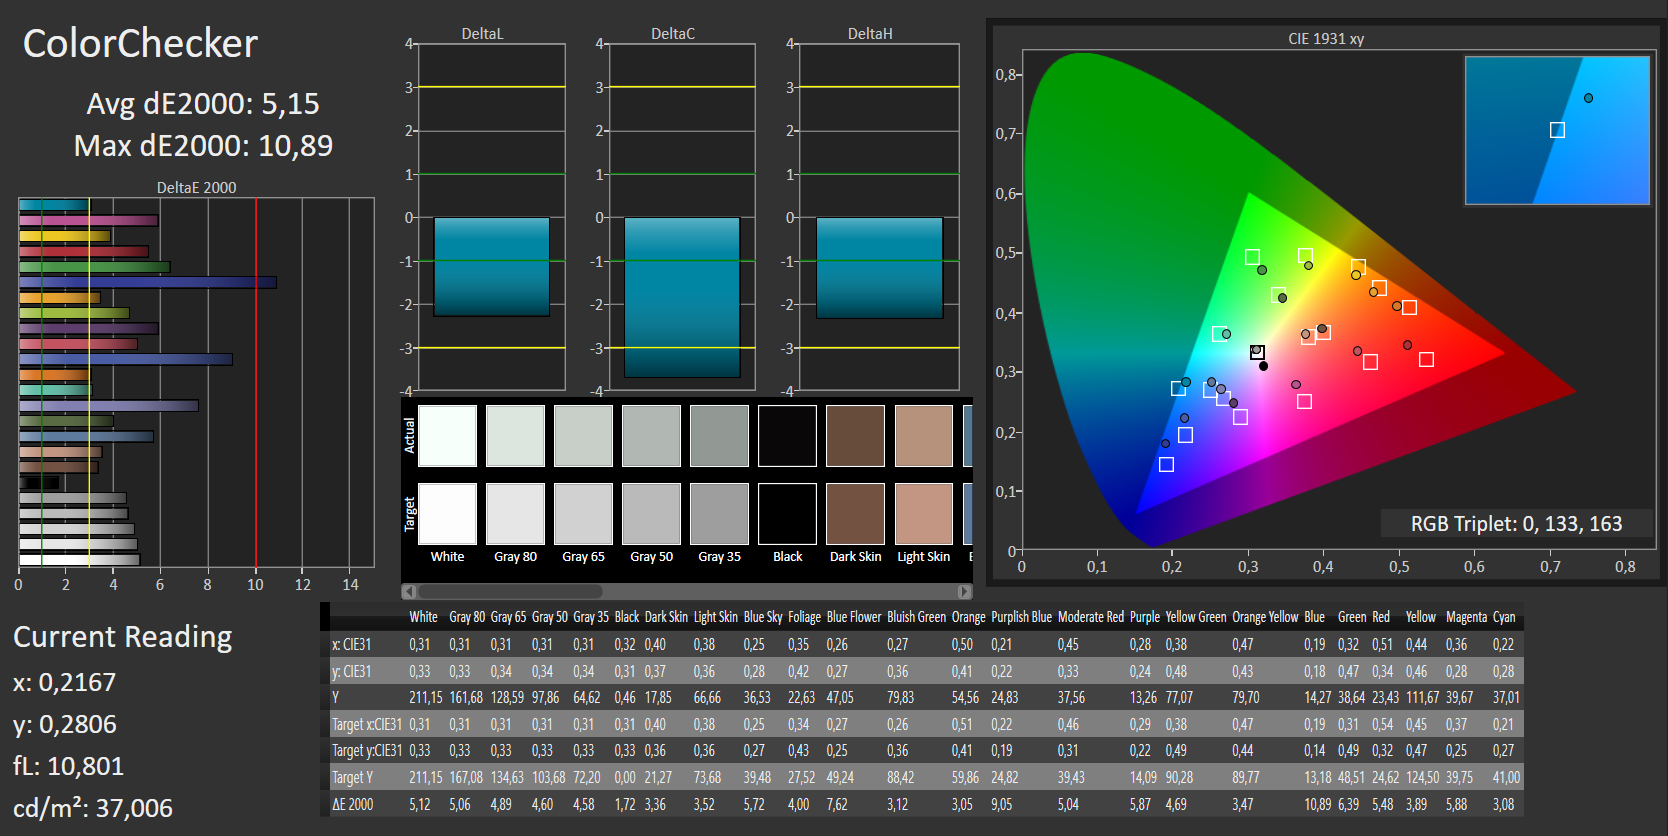
ΔE ColorChecker Calman: 5.15 | ∀{0.5-29.43 Ø4.72}
ΔE Greyscale Calman: 4.25 | ∀{0.09-98 Ø4.97}
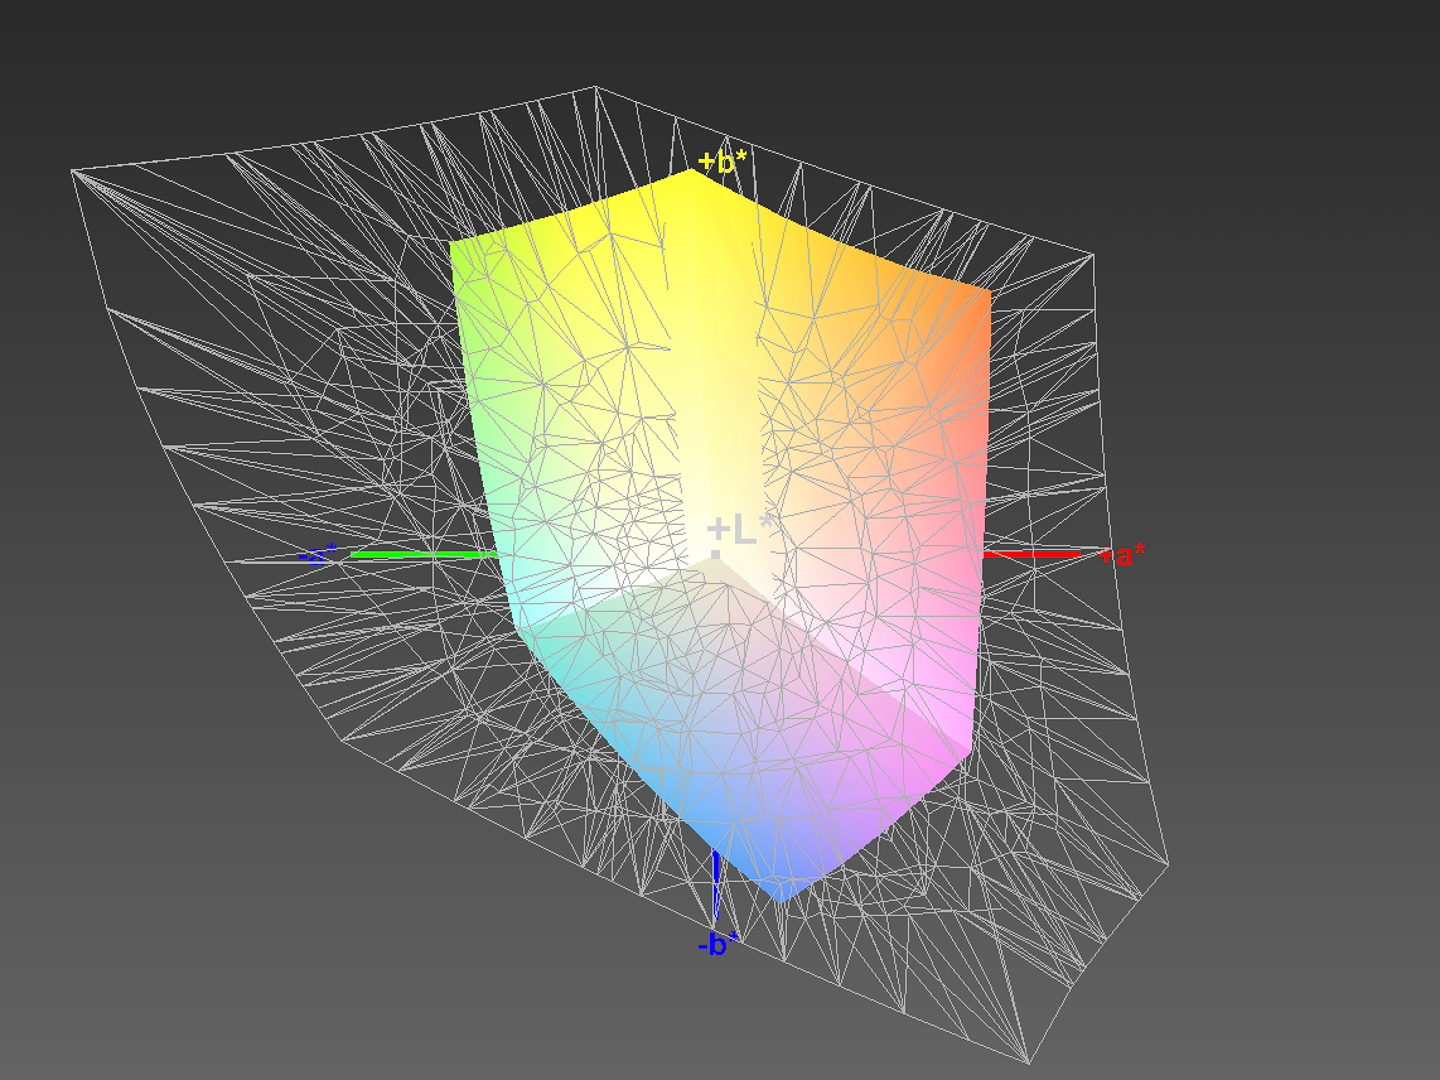
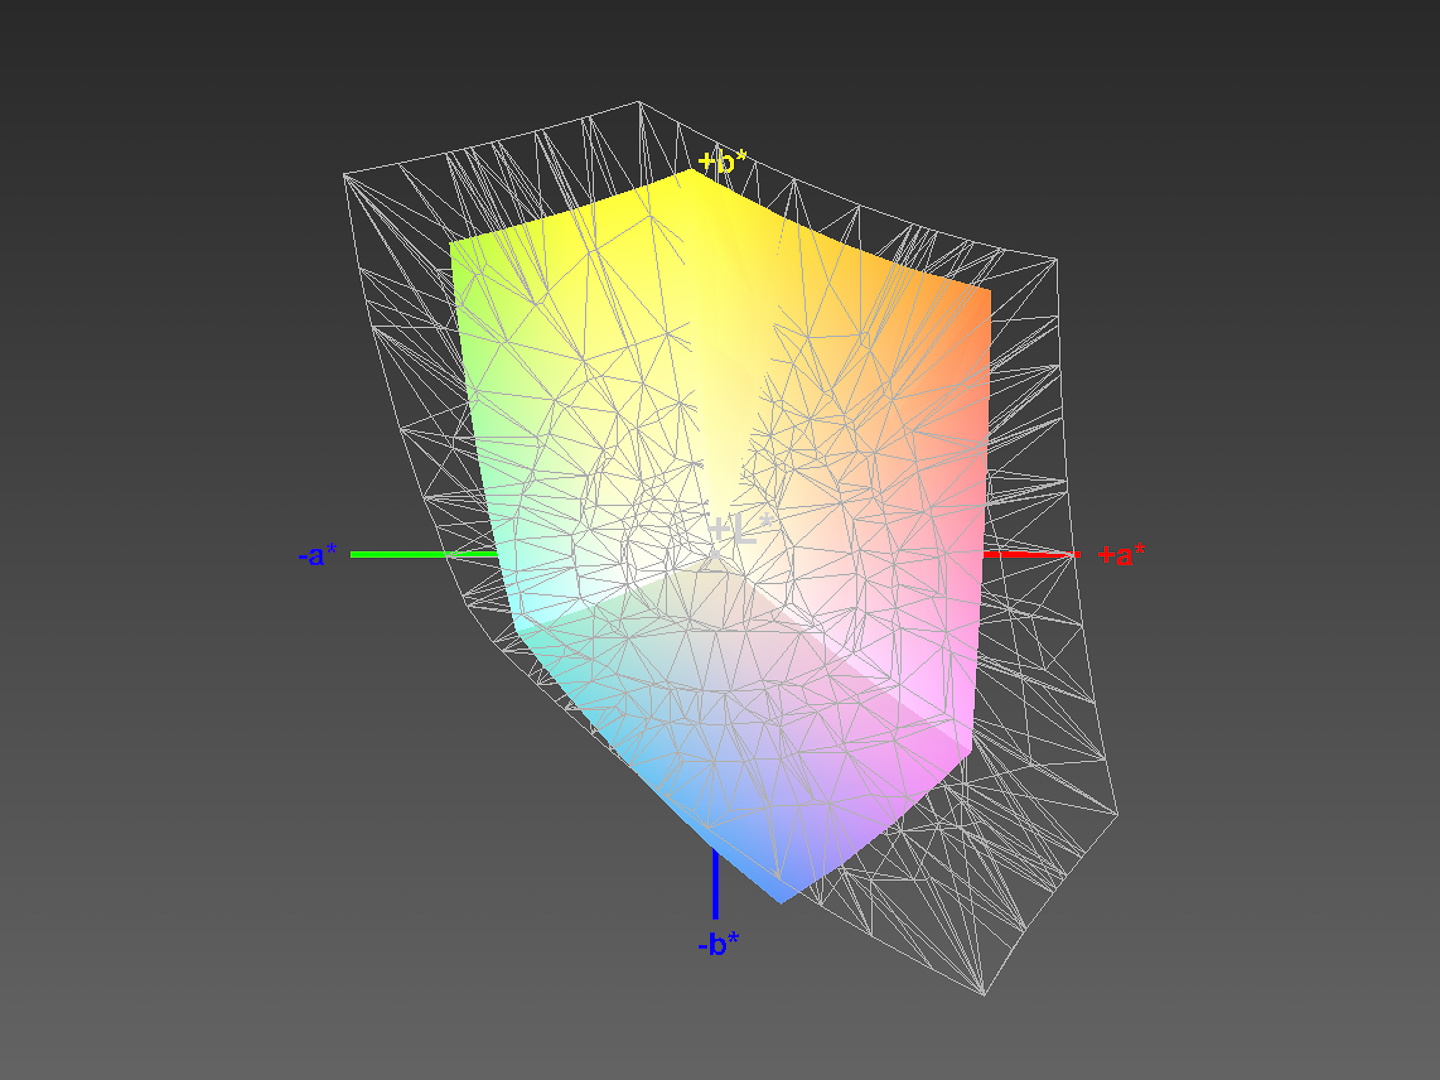
63% sRGB (Argyll 1.6.3 3D)
40% AdobeRGB 1998 (Argyll 1.6.3 3D)
43.94% AdobeRGB 1998 (Argyll 3D)
63.2% sRGB (Argyll 3D)
42.44% Display P3 (Argyll 3D)
Gamma: 2.61
CCT: 6603 K
| Acer TravelMate P2510-M-51ZQ Chi Mei CMN15D3 / N156HCE-EAA, , 1920x1080, 15.6" | Dell Latitude 5580 BOE NV15N42, , 1920x1080, 15.6" | HP 15-bs103ng AU Optronics, , 1920x1080, 15.6" | Lenovo V510-15IKB 80WQ0002GE LG Philips LP156WF6-SPK3, , 1920x1080, 15.6" | |
|---|---|---|---|---|
| Display | -3% | -14% | -9% | |
| Display P3 Coverage (%) | 42.44 | 41.57 -2% | 36.55 -14% | 38.8 -9% |
| sRGB Coverage (%) | 63.2 | 60.7 -4% | 55 -13% | 58.1 -8% |
| AdobeRGB 1998 Coverage (%) | 43.94 | 42.94 -2% | 37.76 -14% | 40.12 -9% |
| Response Times | 1% | 17% | 10% | |
| Response Time Grey 50% / Grey 80% * (ms) | 45 ? | 43 ? 4% | 44 ? 2% | 39 ? 13% |
| Response Time Black / White * (ms) | 32 ? | 33 ? -3% | 22 ? 31% | 30 ? 6% |
| PWM Frequency (Hz) | 25000 ? | 1020 ? | 20000 ? | |
| Screen | 18% | -57% | 6% | |
| Brightness middle (cd/m²) | 215 | 234 9% | 241 12% | 256 19% |
| Brightness (cd/m²) | 198 | 224 13% | 235 19% | 252 27% |
| Brightness Distribution (%) | 78 | 84 8% | 84 8% | 87 12% |
| Black Level * (cd/m²) | 0.32 | 0.18 44% | 0.43 -34% | 0.3 6% |
| Contrast (:1) | 672 | 1300 93% | 560 -17% | 853 27% |
| Colorchecker dE 2000 * | 5.15 | 5.3 -3% | 13.62 -164% | 5.4 -5% |
| Colorchecker dE 2000 max. * | 10.89 | 9.09 17% | 22.81 -109% | 9.36 14% |
| Greyscale dE 2000 * | 4.25 | 4 6% | 15.19 -257% | 5.37 -26% |
| Gamma | 2.61 84% | 2.46 89% | 2.13 103% | 2.58 85% |
| CCT | 6603 98% | 6441 101% | 17407 37% | 6795 96% |
| Color Space (Percent of AdobeRGB 1998) (%) | 40 | 39 -2% | 35 -12% | 37 -7% |
| Color Space (Percent of sRGB) (%) | 63 | 60 -5% | 55 -13% | 58 -8% |
| Total Average (Program / Settings) | 5% /
12% | -18% /
-38% | 2% /
3% |
* ... smaller is better
The low brightness in combination with an acceptable low black value of 0.35 cd/m² leads to a bland contrast ratio of only 672:1 which is not unusual in this price range. The contrast ratio of the slightly brighter HP is even lower, due to its worse and clearly too bright black value of 0.43 cd/m². The Dell Latitude with its 0.18 cd/m², which achieves a very good 1300:1, shows how much a dark black value can affect the contrast.
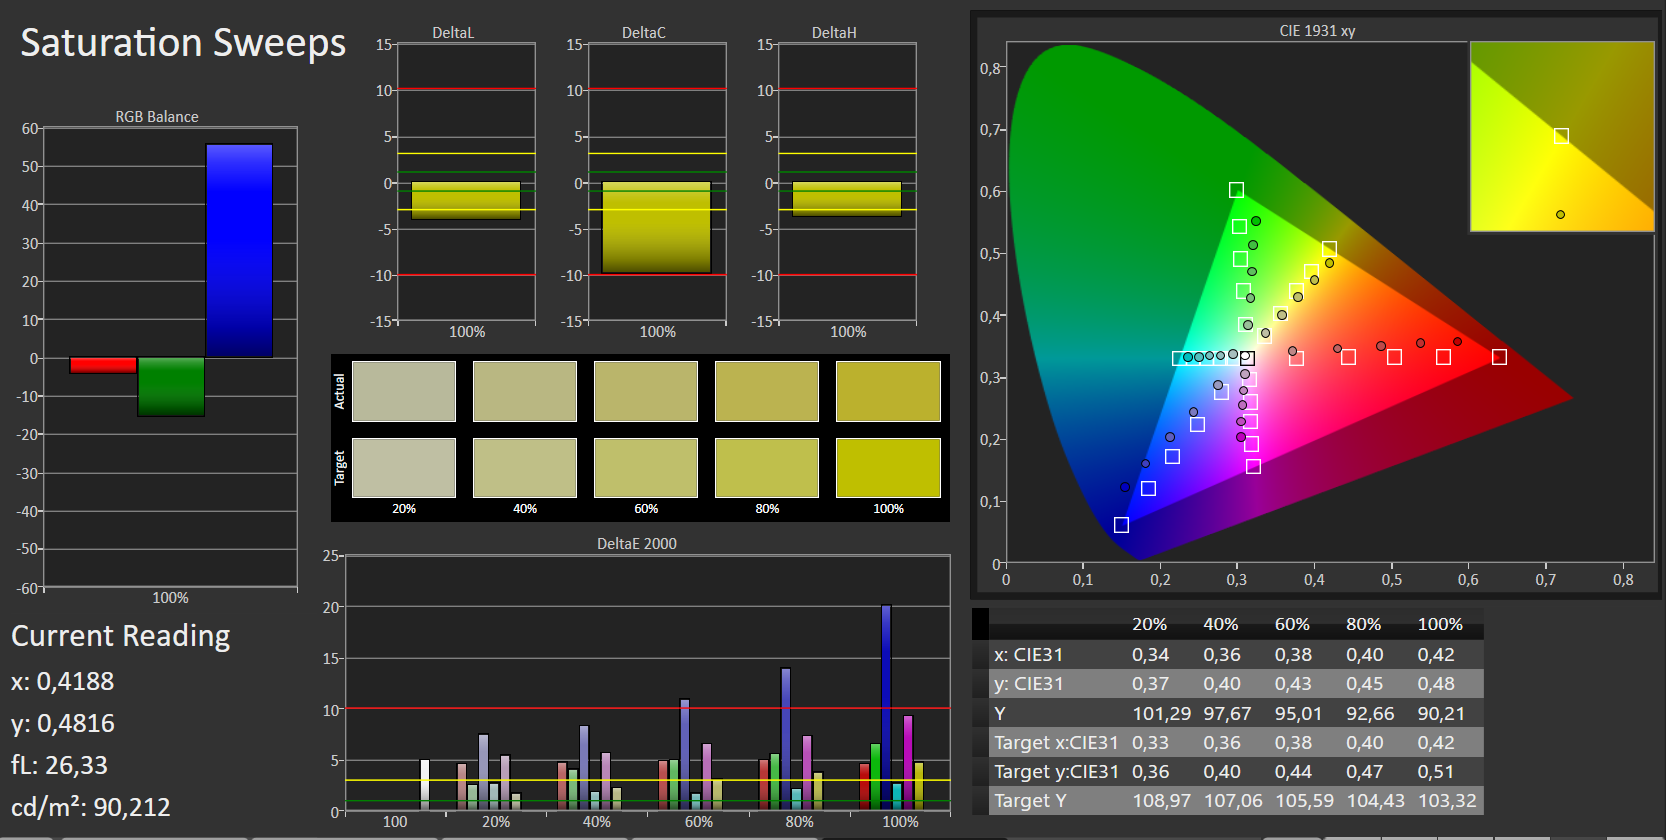
In terms of color accuracy, the HP 15-bs103ng is the worst with its extreme Delta-E values of 14 and 15. The three other notebooks including the test unit are significantly more accurate in the state of delivery and are not that far from the ideal Delta-E values of 3 or lower. While the too high Gamma value (Windows Standard 2.2) and the very low color space coverage deserve a negative rating in our test unit, it is even lower in the competitors and forbids any serious image processing. The color accuracy of the TravelMate P2510 could be further improved by installing the color profile linked in the box.
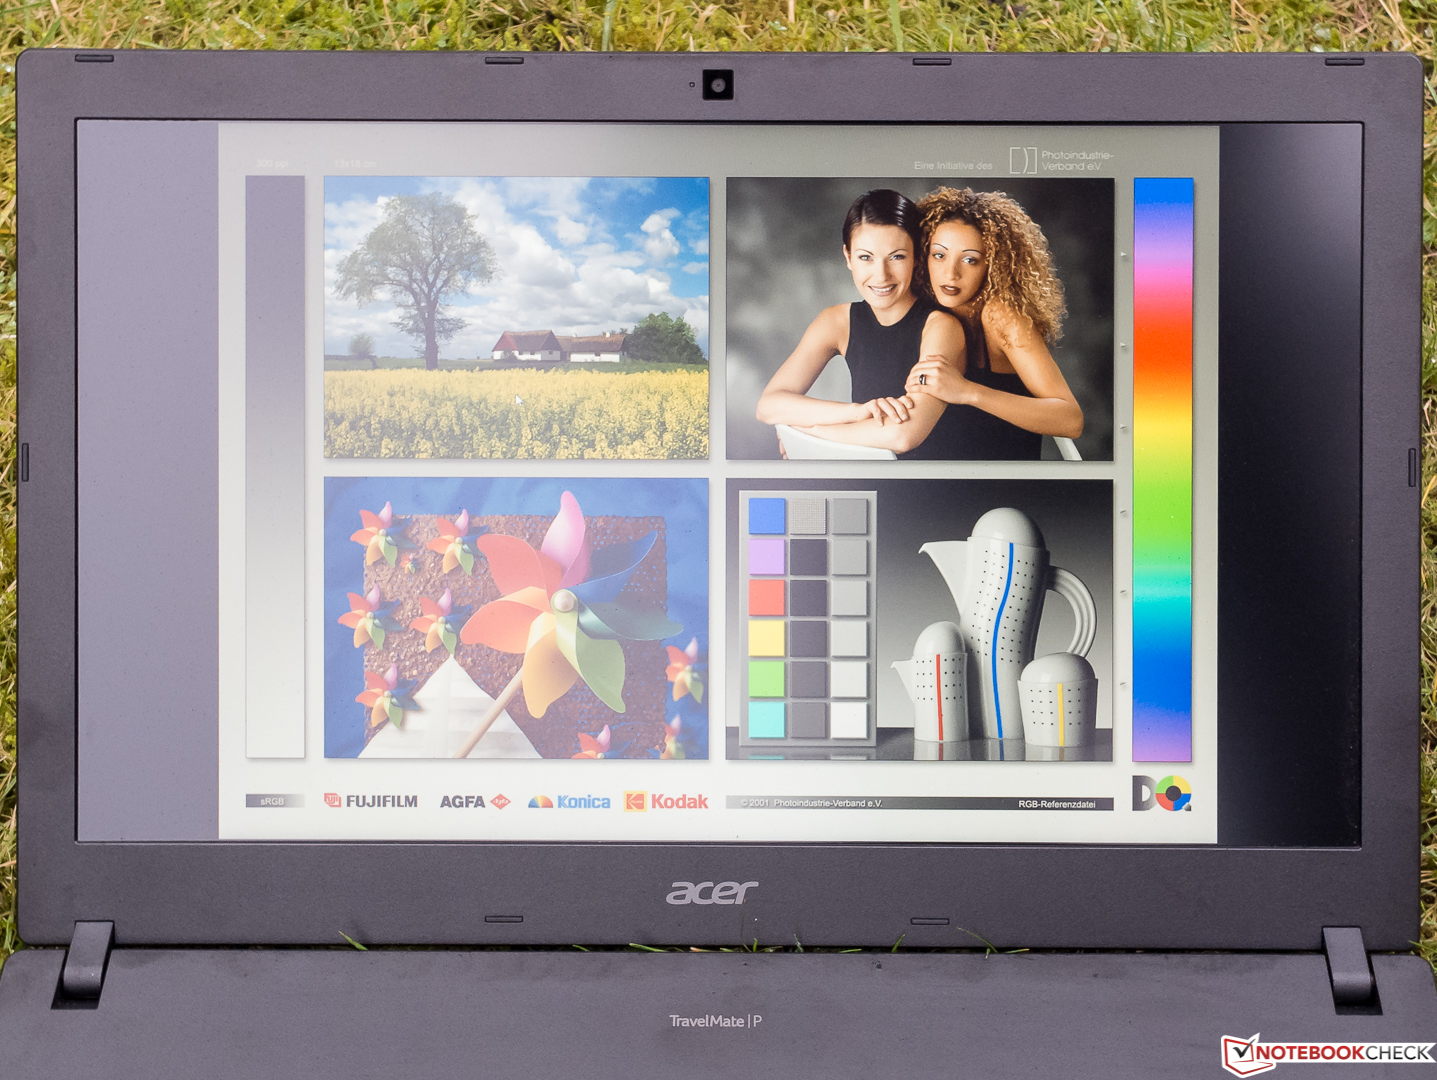
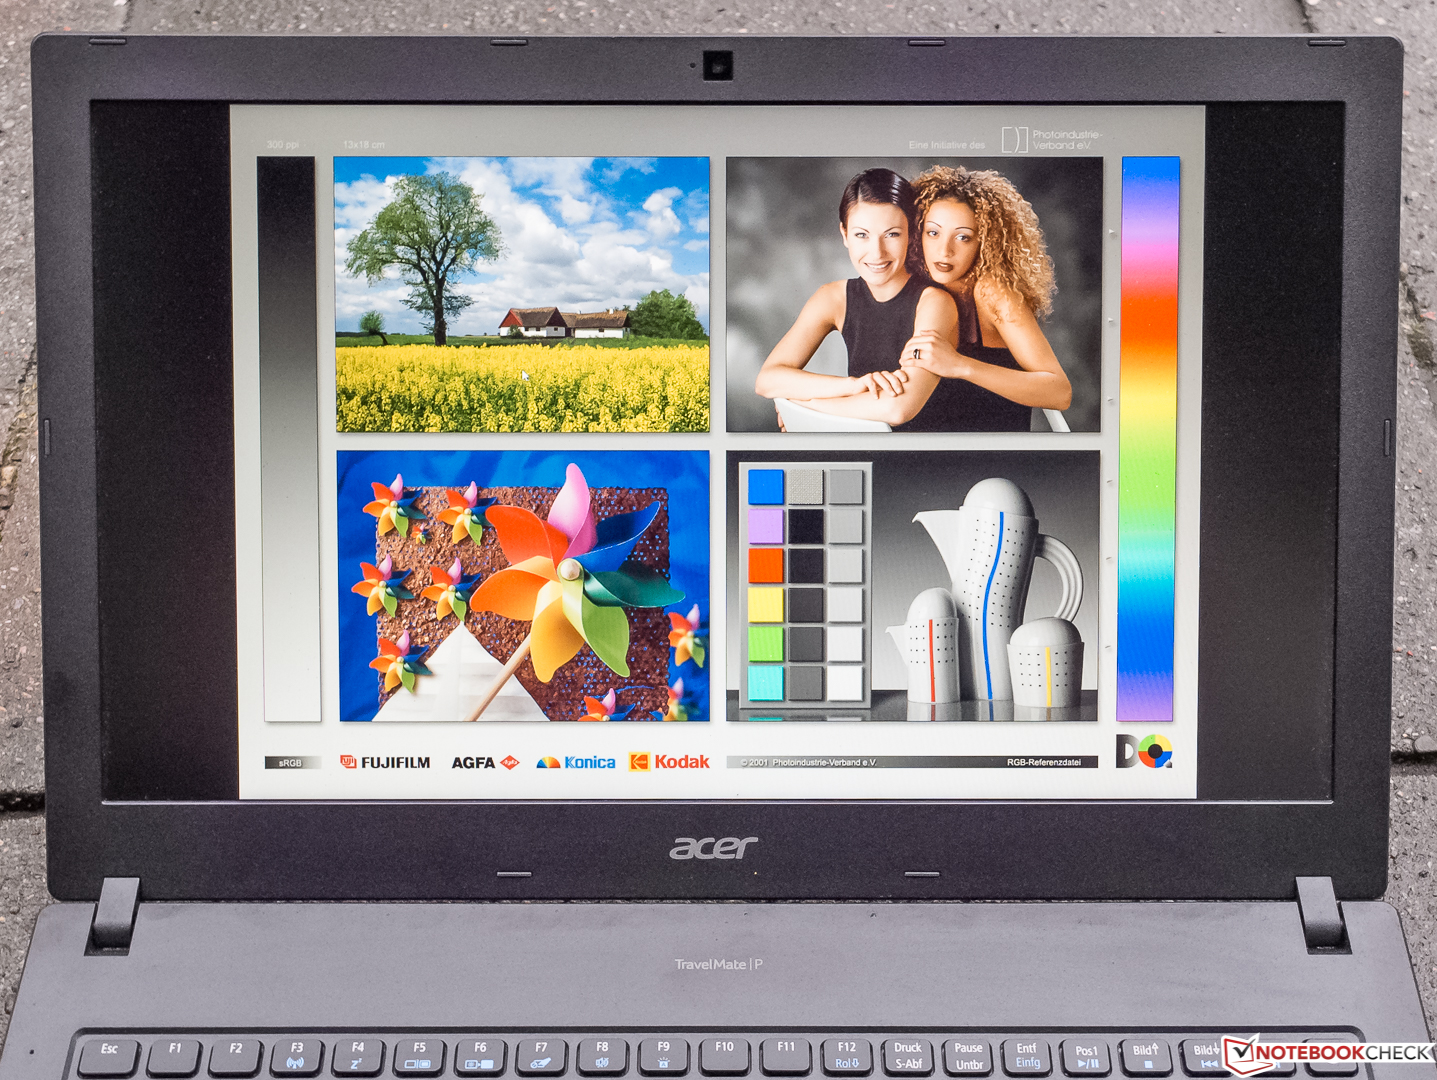
The outdoor test is often not much of a challenge in winter. During a dark overcast day, we were even able to recognize everything when we pointed the display directly towards the sky (left image), despite its mediocre brightness. If the sun had been shining onto the display, the screen contents could have only been seen in the dark shady parts on the right.
The right image, which in our experience would have looked the same in sunlight, shows the TravelMate with an entry in the back. In contrast, with reflective screens even the use in the shade is often difficult.
Display Response Times
| ↔ Response Time Black to White | ||
|---|---|---|
| 32 ms ... rise ↗ and fall ↘ combined | ↗ 18 ms rise | 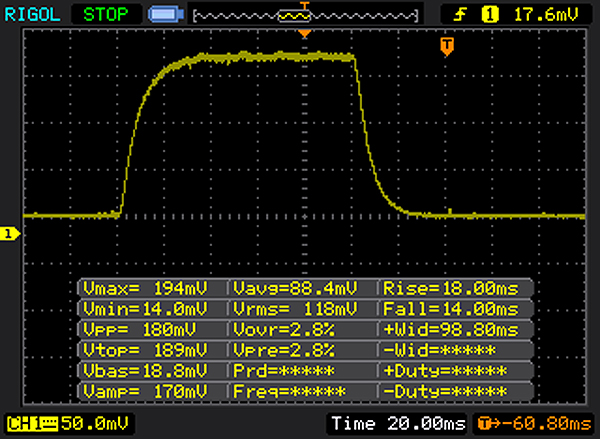 |
| ↘ 14 ms fall | ||
| The screen shows slow response rates in our tests and will be unsatisfactory for gamers. In comparison, all tested devices range from 0.1 (minimum) to 240 (maximum) ms. » 86 % of all devices are better. This means that the measured response time is worse than the average of all tested devices (19.8 ms). | ||
| ↔ Response Time 50% Grey to 80% Grey | ||
| 45 ms ... rise ↗ and fall ↘ combined | ↗ 27 ms rise | 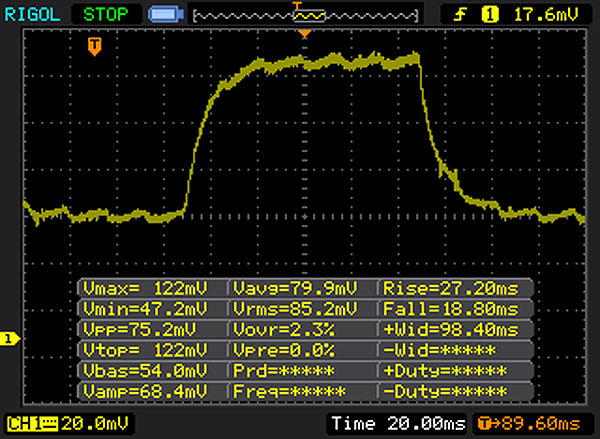 |
| ↘ 18 ms fall | ||
| The screen shows slow response rates in our tests and will be unsatisfactory for gamers. In comparison, all tested devices range from 0.165 (minimum) to 636 (maximum) ms. » 77 % of all devices are better. This means that the measured response time is worse than the average of all tested devices (31 ms). | ||
Screen Flickering / PWM (Pulse-Width Modulation)
| Screen flickering / PWM detected | 25000 Hz | ≤ 80 % brightness setting | 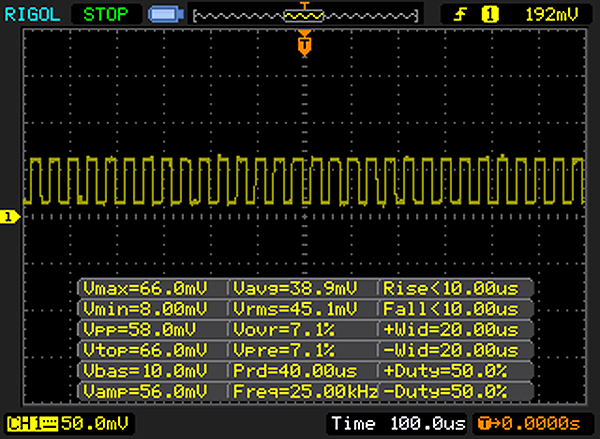 |
The display backlight flickers at 25000 Hz (worst case, e.g., utilizing PWM) Flickering detected at a brightness setting of 80 % and below. There should be no flickering or PWM above this brightness setting. The frequency of 25000 Hz is quite high, so most users sensitive to PWM should not notice any flickering. In comparison: 52 % of all tested devices do not use PWM to dim the display. If PWM was detected, an average of 7747 (minimum: 5 - maximum: 343500) Hz was measured. | |||
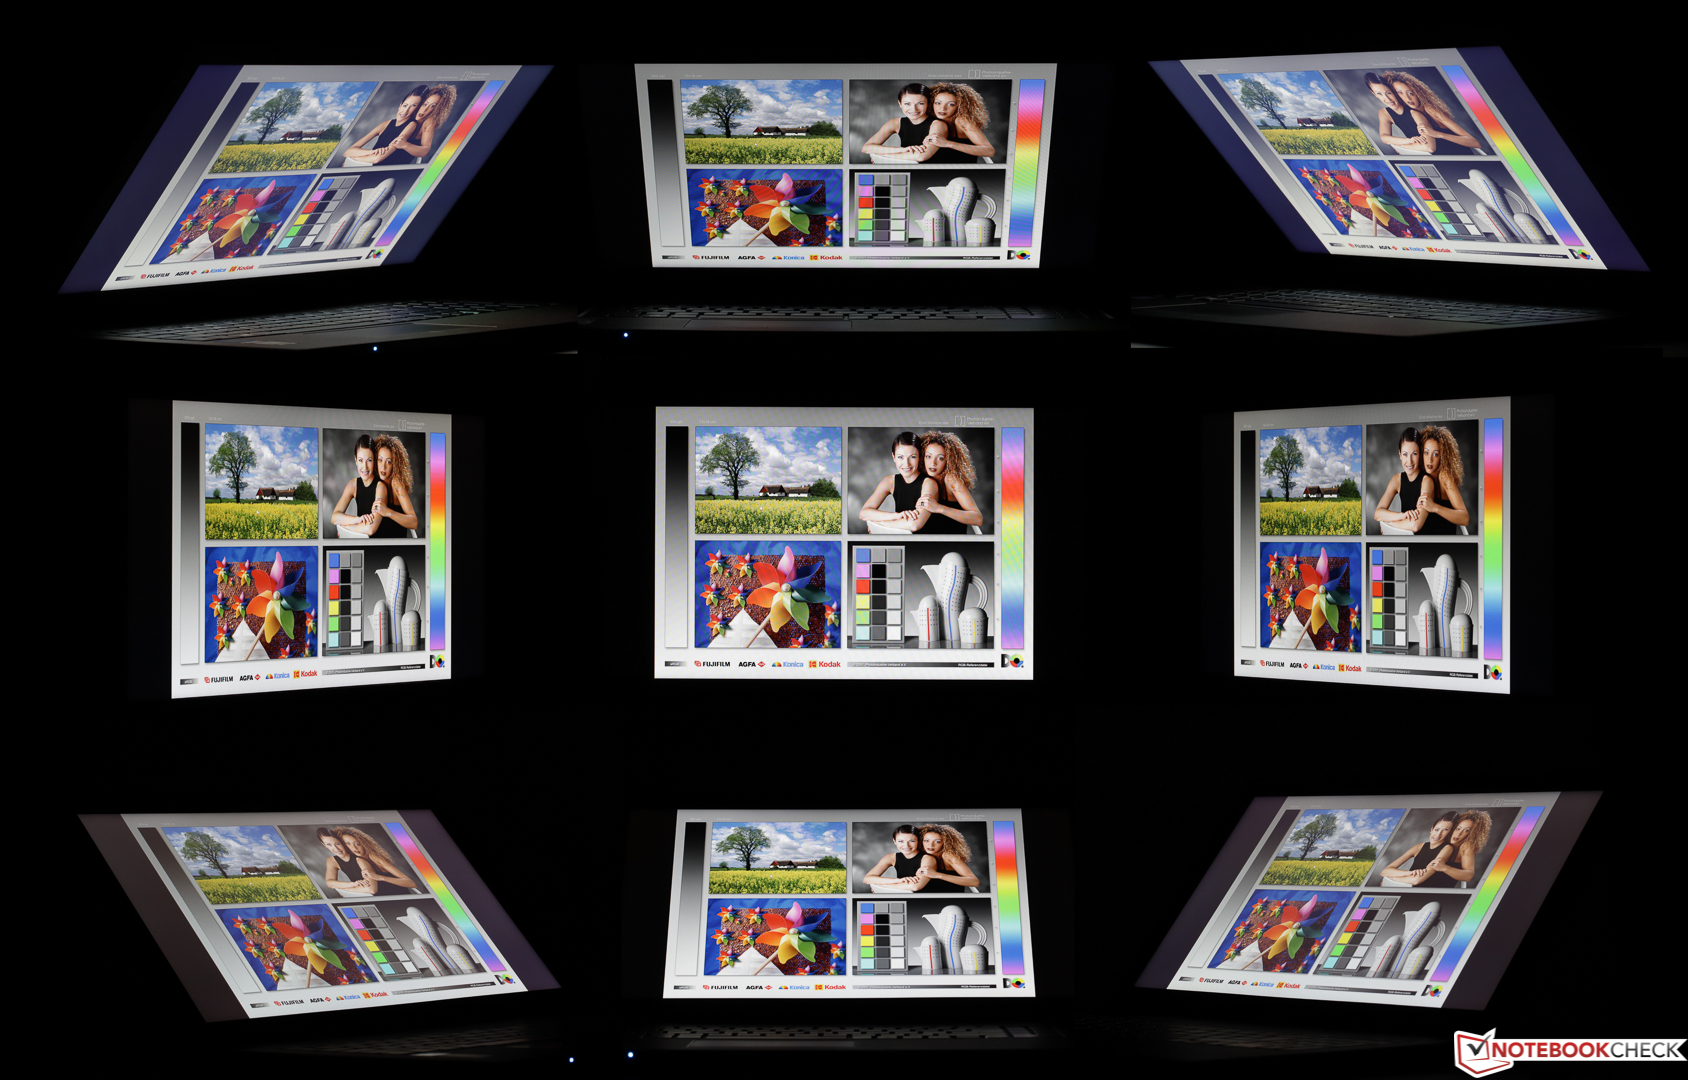
The good viewing angle stability is in the lower range of the class of IPS panels. This can be seen by the loss of brightness, which generally cannot be avoided completely, becoming clearly apparent even at viewing angles of below 45°, while the colors remain stable for the most part.
Performance
Processor
In keeping with the envisioned office use of the TravelMate P2510-M-51ZQ, Acer uses the efficient and extremely wide-spread Intel Core i5-7200U (2x 2.5 - 3.1 GHz, Hyper-Threading, TDP 15 W) Kaby Lake dual-core, which due to its low TDP is also suited for significantly slimmer and more compact laptops and brings more than sufficient performance for more demanding programs. However, it is not as well-suited for software such as video rendering that as with many current games benefit significantly from four or more physical cores. In addition to a DDR4 storage controller, there is of course a GPU in form of the Intel HD Graphics 620 on board. Improved capabilities for decoding H.265 videos in the hardware are added.
The CPU achieves the expected performance in Cinebench R15 and also shines with a very good Turbo usage, as you can see in the almost constant results in our Cinebench loop. In the single-thread test, the i5-7300U (2.6 - 3.5 GHz) in the Dell and the i5-8250U ULV quad-core (1.6 - 3.4 GHz) in the HP are able to achieve small advantages due to their higher clock speeds, while the i5-8250 outclasses the rest of the field with a speed advantage of 55% in the multi-thread test.
Nothing changes in the scores, when the laptop is away from the power outlets.
| Cinebench R15 | |
| CPU Single 64Bit | |
| Dell Latitude 5580 | |
| HP 15-bs103ng | |
| Lenovo V510-15IKB 80WQ0002GE | |
| Acer TravelMate P2510-M-51ZQ | |
| CPU Multi 64Bit | |
| HP 15-bs103ng | |
| Dell Latitude 5580 | |
| Acer TravelMate P2510-M-51ZQ | |
| Lenovo V510-15IKB 80WQ0002GE | |
System Performance
In the Work benchmark of PCMark 8, the HP has some advantages compared to our test unit due to its faster CPU and better performing SSD, but it is unable to benefit from these advantages in the Home benchmark. All the laptops are very close together in our test here, which corresponds to differences in the overall performance that according to our experience are hardly noticeable in practice. The disadvantage of the Dell, which is only equipped with a conventional HDD, probably would have turned out larger, but we lack the data here.
| PCMark 8 | |
| Home Score Accelerated v2 | |
| Acer TravelMate P2510-M-51ZQ | |
| Lenovo V510-15IKB 80WQ0002GE | |
| HP 15-bs103ng | |
| Dell Latitude 5580 | |
| Work Score Accelerated v2 | |
| HP 15-bs103ng | |
| Acer TravelMate P2510-M-51ZQ | |
| PCMark 8 Home Score Accelerated v2 | 3715 points | |
| PCMark 8 Work Score Accelerated v2 | 4592 points | |
Help | ||
Storage Solution
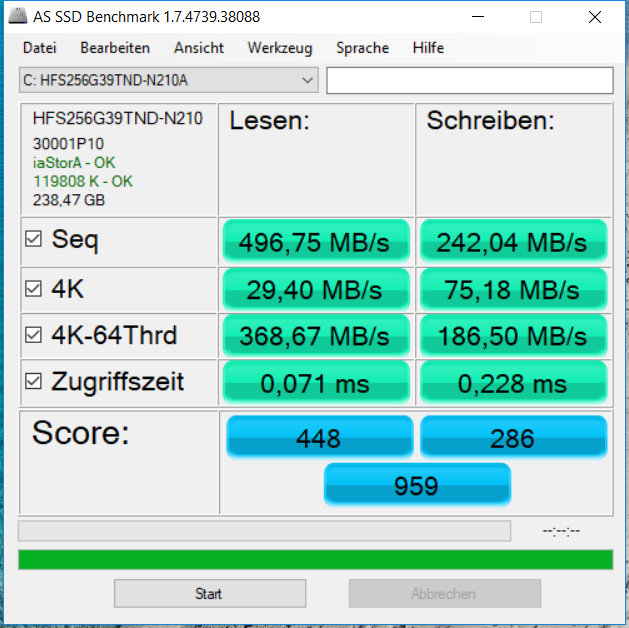
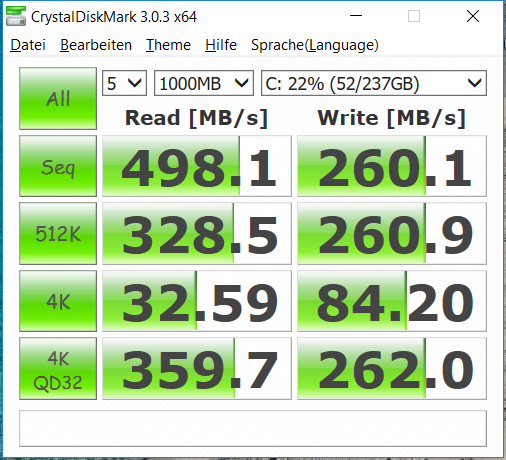
According to the AS SSD read rates, the 256 GB Hynix SSD is a typical SATA III drive. However, the 4K read rates, which are important for starting the OS and programs, turn out only mediocre.
The storage solution gets relatively bad results in the much less important write performance, where the overall faster SSDs in the competing notebooks have significant advantages in parts. Still, considering the price of the notebook, the performance of the SSD is okay, and the differences that are felt in practice should be within tight limits.
| Acer TravelMate P2510-M-51ZQ SK Hynix HFS256G39TND-N210A | HP 15-bs103ng Samsung SSD PM871a MZNLN256HMHQ | Lenovo V510-15IKB 80WQ0002GE Samsung CM871a MZNTY256HDHP | |
|---|---|---|---|
| CrystalDiskMark 3.0 | 23% | 24% | |
| Read Seq (MB/s) | 498.1 | 504 1% | 532 7% |
| Write Seq (MB/s) | 260.1 | 466.2 79% | 511 96% |
| Read 512 (MB/s) | 328.5 | 443.7 35% | 414.8 26% |
| Write 512 (MB/s) | 260.9 | 398.4 53% | 307.7 18% |
| Read 4k (MB/s) | 32.59 | 38.81 19% | 39.51 21% |
| Write 4k (MB/s) | 84.2 | 94.6 12% | 108.1 28% |
| Read 4k QD32 (MB/s) | 359.7 | 295.2 -18% | 361.6 1% |
| Write 4k QD32 (MB/s) | 262 | 266.6 2% | 253 -3% |

Graphics Card and Gaming Performance
While the Intel HD Graphics 620, which is integrated in the CPU and does not have its own storage, clearly benefits from the available DDR4 dual-channel-RAM, it is designed more for energy efficient 2D graphics computations and only handles very old or graphically undemanding 3D games smoothly. Moreover, you are mostly limited to the lower or medium presets. Games with isometric graphics, such as "Diablo III" which is not so new anymore, run better. In 3DMark 11, the AMD Radeon 520 in the HP, which is 23% faster, is able to achieve the first place in the test ahead of the three notebooks that use the 620.
In an additional run through the Cloud-Gate benchmark in battery operation, the Acer TravelMate P2510-M-51ZQ achieved an overall score of just 6200 vs. 6501 in mains operation.
| 3DMark 11 - 1280x720 Performance GPU | |
| HP 15-bs103ng | |
| Acer TravelMate P2510-M-51ZQ | |
| Lenovo V510-15IKB 80WQ0002GE | |
| Dell Latitude 5580 | |
| 3DMark | |
| 1280x720 Cloud Gate Standard Graphics | |
| Acer TravelMate P2510-M-51ZQ | |
| HP 15-bs103ng | |
| 1920x1080 Fire Strike Graphics | |
| Acer TravelMate P2510-M-51ZQ | |
| HP 15-bs103ng | |
| 3DMark 11 Performance | 1692 points | |
| 3DMark Cloud Gate Standard Score | 6501 points | |
| 3DMark Fire Strike Score | 938 points | |
Help | ||
As you can see in the small chart below, the Intel HD 620 completely capitulates with the graphically more demanding 3D games of the last few years. In "Farming Simulator 17," you can see in the very decent result of 620 that the unit in our test device performs relatively well.
| low | med. | high | ultra | |
|---|---|---|---|---|
| The Witcher 3 (2015) | 14.9 | |||
| Rise of the Tomb Raider (2016) | 18.9 | |||
| Farming Simulator 17 (2016) | 85.5 | 55.4 | 22.8 |
Emissions
Noise Emissions
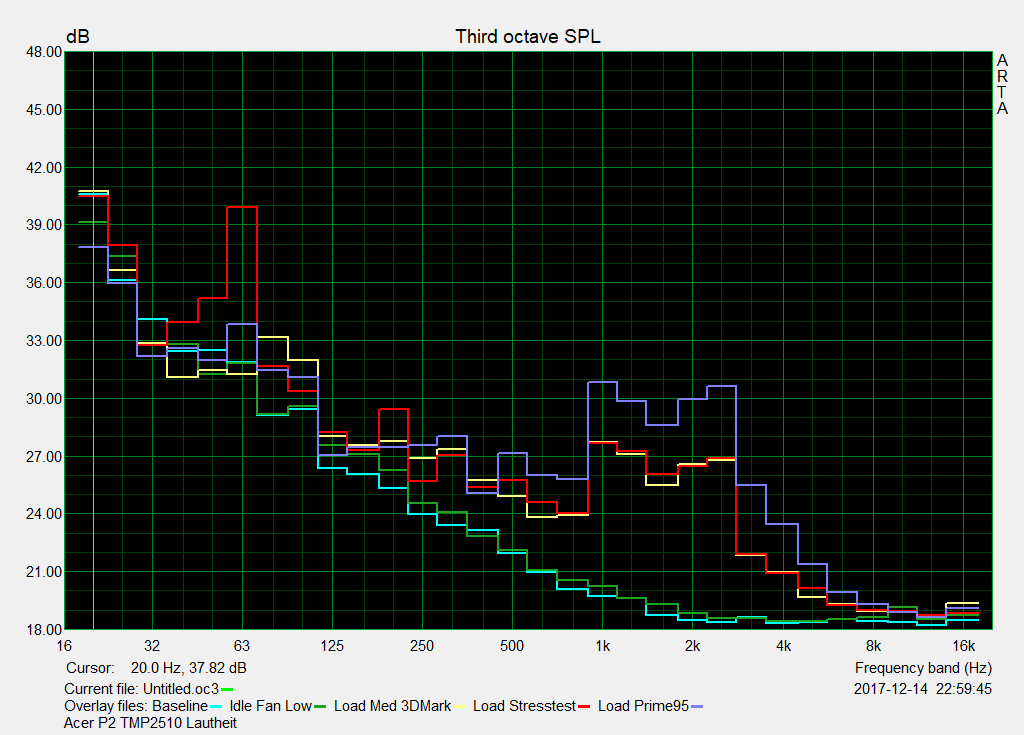
We performed the noise test in energy-saving mode with a passive system cooling guideline. While idling, the fan appears to not run or run very slowly, so that it is only audible when you place your ear near the keyboard. To be clear, we were able to hear something in close proximity, but were unable to say whether it was the fan. When we ran the Kraken 1.1 browser benchmark, the fan only revved up towards the end, but was still only audible nearby.
After activating the stress test (Prime95 + FurMark), the fan sped up smoothly to the maximum speed after a few seconds delay. We were then able to hear a soft noise up to a distance of perhaps 3 meters (~10 ft), which had a whirring quality that was not very disturbing. The device operation is very quiet overall, and during office operation you can expect it to be mostly quiet. If the system cooling guideline is active, the fan may become noticeable more often.
Noise level
| Idle |
| 31.8 / 31.8 / 31.8 dB(A) |
| Load |
| 36.6 / 36.5 dB(A) |
 | ||
30 dB silent 40 dB(A) audible 50 dB(A) loud |
||
min: | ||
Temperature
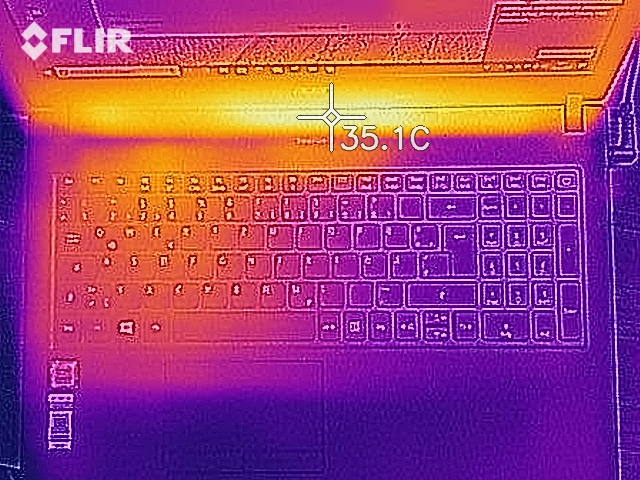
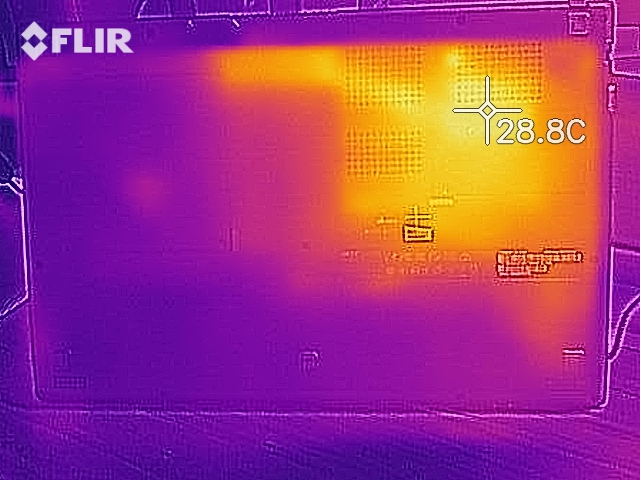
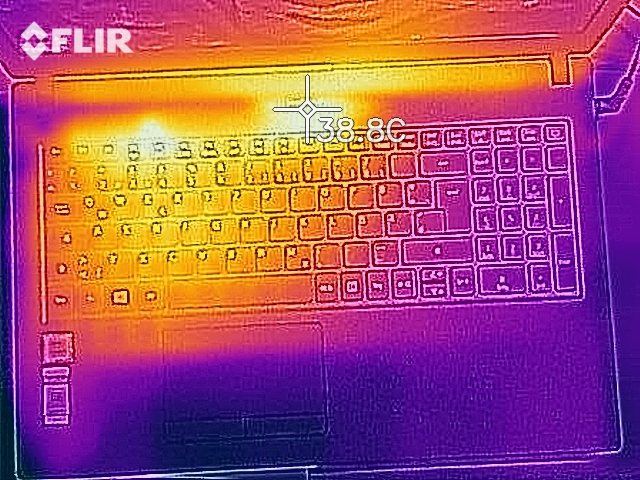
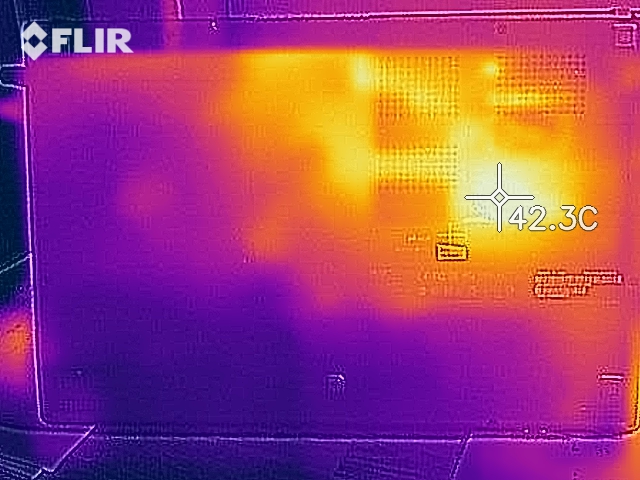
The surface temperatures of the Acer TravelMate P2510-M-51ZQ only reach a cozy 42 °C (108 °F) at the bottom, which is reached only during high constant load and should not become annoying to most users when using it on the lap.
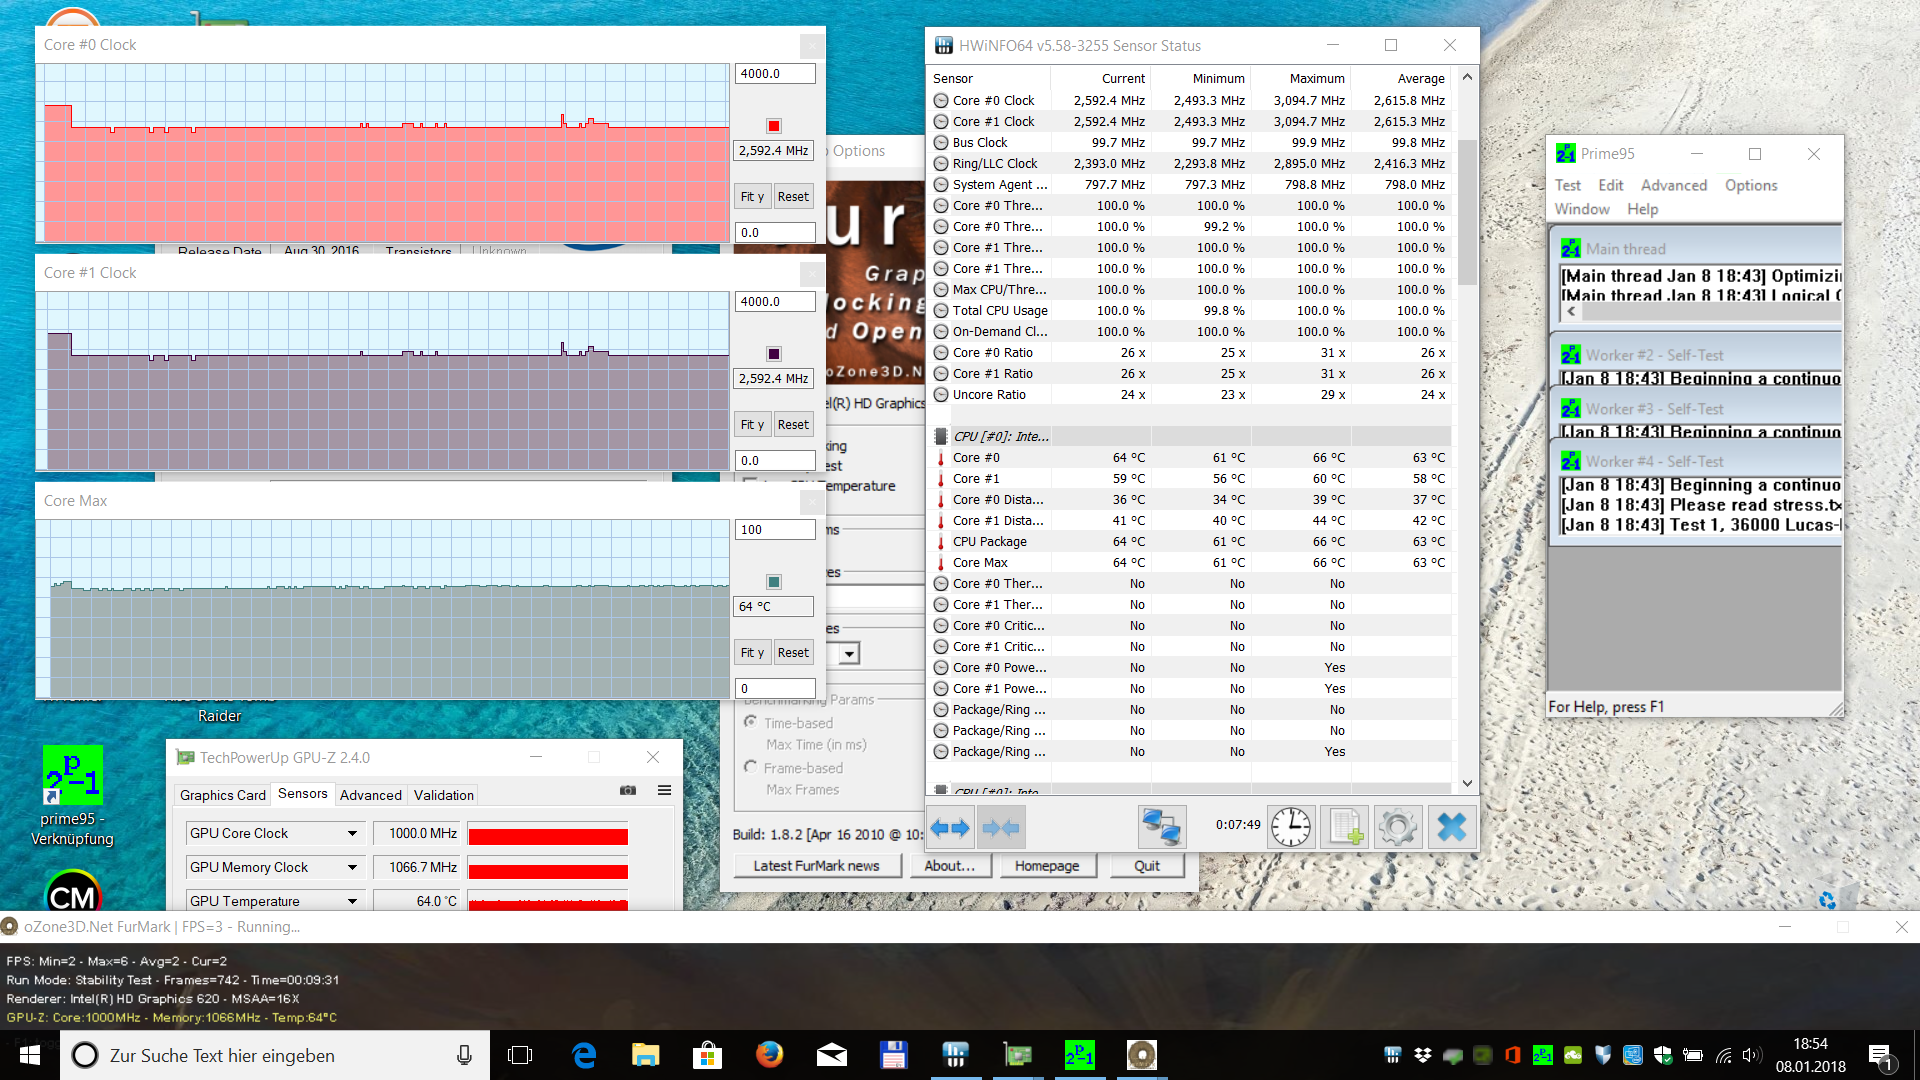
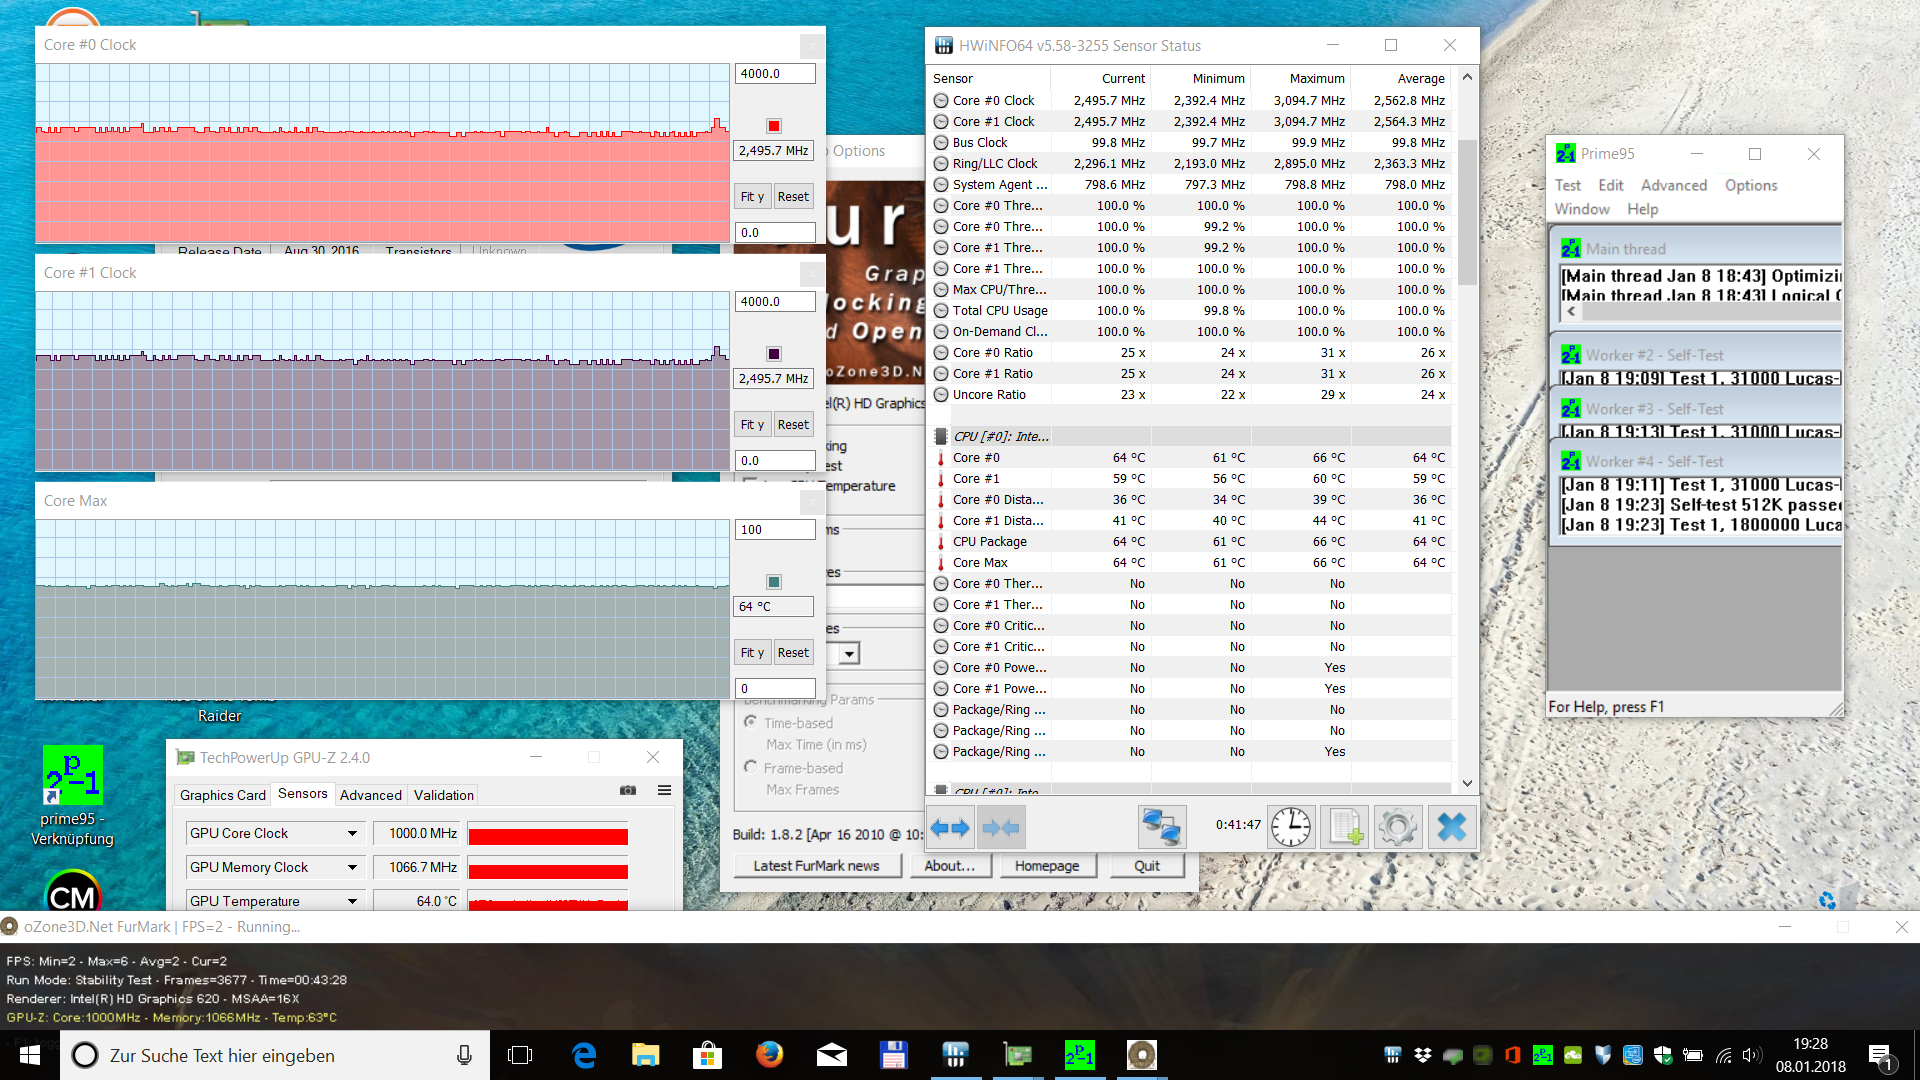
During the practically not very relevant stress test with Prime95 plus FurMark, the CPU was only able to maintain the Turbo speed for a short time and soon dropped to 2.6 GHz, which is still 100 MHz above the basic clock speed. Later it even dropped slightly below that, but the processor did not become any warmer than 66 °C (151 °F). In contrast, the integrated Intel HD Graphics 620 was able to maintain its Turbo speed of 1000 MHz continuously. Such a clock speed behavior is absolutely typical for a Core i5-7200U, and we have nothing to complain about.
(+) The maximum temperature on the upper side is 32 °C / 90 F, compared to the average of 34.3 °C / 94 F, ranging from 21.2 to 62.5 °C for the class Office.
(+) The bottom heats up to a maximum of 35.5 °C / 96 F, compared to the average of 36.8 °C / 98 F
(+) In idle usage, the average temperature for the upper side is 23.9 °C / 75 F, compared to the device average of 29.5 °C / 85 F.
(+) The palmrests and touchpad are cooler than skin temperature with a maximum of 23.9 °C / 75 F and are therefore cool to the touch.
(+) The average temperature of the palmrest area of similar devices was 27.5 °C / 81.5 F (+3.6 °C / 6.5 F).
Speakers
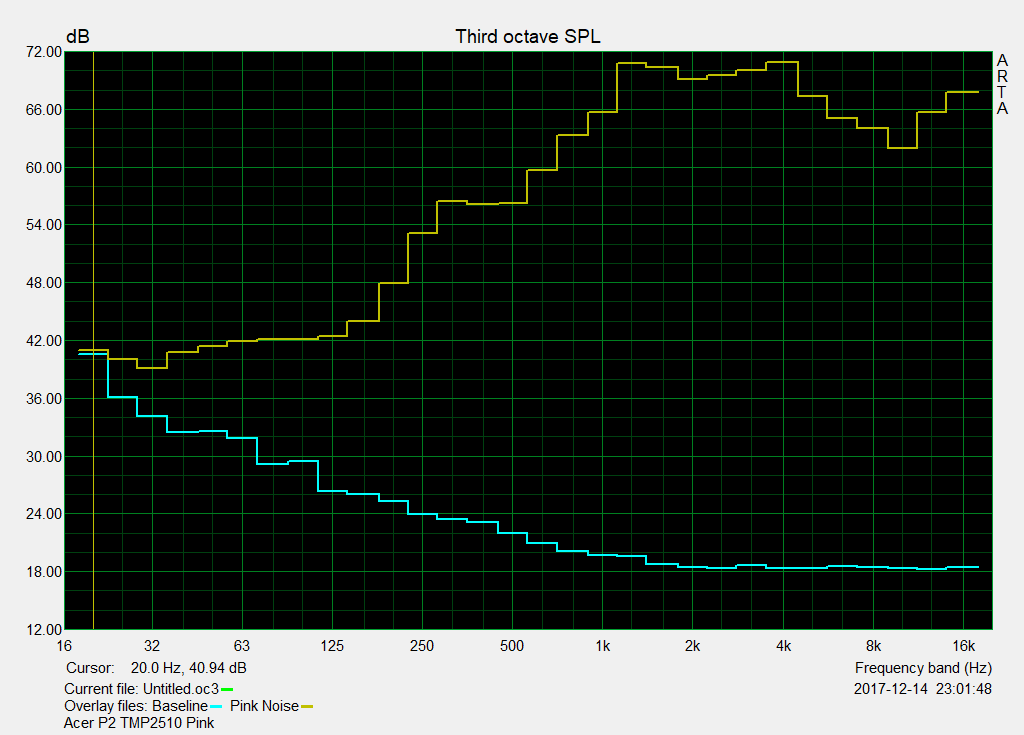
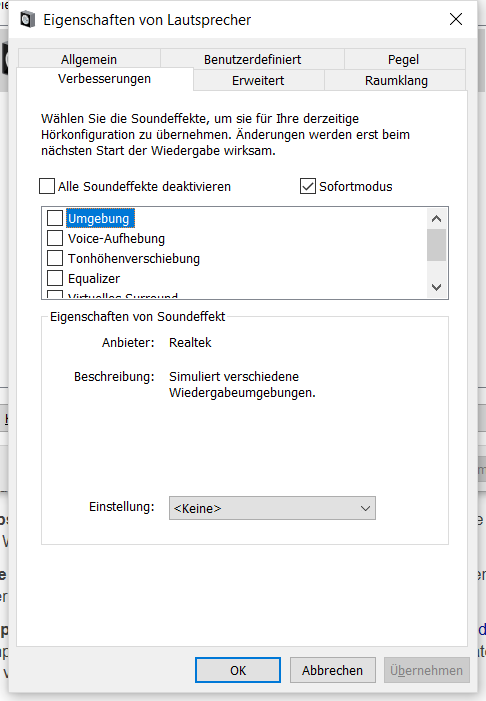
In terms of the sound of the two small speakers which point towards the bottom, we are neither positively nor negatively surprised. The maximum volume is easily sufficient to fill medium-sized rooms. The sound completely lacks any bass, the mids are emphasized, and it sounds quite tinny and even shrill in parts. In order to avoid distortions, the sound system adjusts lower at high levels, which leads to annoying volume fluctuations. The dynamic and spaciousness are only weak. The sound characteristic which we tested with the sound improvements deactivated (state of delivery, see image) hardly changes at lower volumes, but the volume fluctuations become less. Voice is easily understandable and sounds fairly natural.
Acer TravelMate P2510-M-51ZQ audio analysis
(-) | not very loud speakers (70.8 dB)
Bass 100 - 315 Hz
(-) | nearly no bass - on average 16.3% lower than median
(+) | bass is linear (5.4% delta to prev. frequency)
Mids 400 - 2000 Hz
(±) | reduced mids - on average 5.1% lower than median
(+) | mids are linear (4.7% delta to prev. frequency)
Highs 2 - 16 kHz
(+) | balanced highs - only 3.6% away from median
(+) | highs are linear (3.4% delta to prev. frequency)
Overall 100 - 16.000 Hz
(±) | linearity of overall sound is average (18.4% difference to median)
Compared to same class
» 33% of all tested devices in this class were better, 7% similar, 60% worse
» The best had a delta of 7%, average was 21%, worst was 53%
Compared to all devices tested
» 41% of all tested devices were better, 8% similar, 51% worse
» The best had a delta of 4%, average was 23%, worst was 134%
Dell Latitude 5580 audio analysis
(-) | not very loud speakers (71 dB)
Bass 100 - 315 Hz
(±) | reduced bass - on average 14.1% lower than median
(+) | bass is linear (4.8% delta to prev. frequency)
Mids 400 - 2000 Hz
(+) | balanced mids - only 3.8% away from median
(+) | mids are linear (5.4% delta to prev. frequency)
Highs 2 - 16 kHz
(+) | balanced highs - only 2% away from median
(+) | highs are linear (2.1% delta to prev. frequency)
Overall 100 - 16.000 Hz
(±) | linearity of overall sound is average (15% difference to median)
Compared to same class
» 14% of all tested devices in this class were better, 4% similar, 82% worse
» The best had a delta of 7%, average was 21%, worst was 53%
Compared to all devices tested
» 21% of all tested devices were better, 4% similar, 75% worse
» The best had a delta of 4%, average was 23%, worst was 134%
HP 15-bs103ng audio analysis
(-) | not very loud speakers (70.5 dB)
Bass 100 - 315 Hz
(-) | nearly no bass - on average 22.8% lower than median
(±) | linearity of bass is average (14.1% delta to prev. frequency)
Mids 400 - 2000 Hz
(+) | balanced mids - only 2.1% away from median
(+) | mids are linear (5% delta to prev. frequency)
Highs 2 - 16 kHz
(+) | balanced highs - only 2.4% away from median
(±) | linearity of highs is average (7.7% delta to prev. frequency)
Overall 100 - 16.000 Hz
(±) | linearity of overall sound is average (18% difference to median)
Compared to same class
» 30% of all tested devices in this class were better, 7% similar, 63% worse
» The best had a delta of 7%, average was 21%, worst was 53%
Compared to all devices tested
» 38% of all tested devices were better, 8% similar, 54% worse
» The best had a delta of 4%, average was 23%, worst was 134%
Lenovo V510-15IKB 80WQ0002GE audio analysis
(-) | not very loud speakers (71 dB)
Bass 100 - 315 Hz
(±) | reduced bass - on average 11.7% lower than median
(±) | linearity of bass is average (8.8% delta to prev. frequency)
Mids 400 - 2000 Hz
(+) | balanced mids - only 1.8% away from median
(+) | mids are linear (4% delta to prev. frequency)
Highs 2 - 16 kHz
(+) | balanced highs - only 3.5% away from median
(±) | linearity of highs is average (7.2% delta to prev. frequency)
Overall 100 - 16.000 Hz
(+) | overall sound is linear (14.3% difference to median)
Compared to same class
» 11% of all tested devices in this class were better, 4% similar, 85% worse
» The best had a delta of 7%, average was 21%, worst was 53%
Compared to all devices tested
» 17% of all tested devices were better, 4% similar, 78% worse
» The best had a delta of 4%, average was 23%, worst was 134%
Frequency comparison (checkboxes selectable!)
Power Management
Power Consumption
Here we limit our comparison initially to the laptops from Acer, Dell, and Lenovo, which have similar processors, while the HP breaks ranks with its quad-core. Among those three, our test unit is the most energy efficient and is able to distance itself in parts clearly from the two competitors, particularly while idling. Under load, the Dell is more efficient. If you compare all the 15.6-inch office notebooks with an i5-7200U, the TravelMate P2510 ends up mostly in the middle of the field. Only during average load, it is relatively power hungry.
| Off / Standby | |
| Idle | |
| Load |
|
Key:
min: | |
| Acer TravelMate P2510-M-51ZQ i5-7200U, HD Graphics 620, SK Hynix HFS256G39TND-N210A, IPS, 1920x1080, 15.6" | Dell Latitude 5580 i5-7300U, HD Graphics 620, Toshiba MQ01ACF050, IPS, 1920x1080, 15.6" | HP 15-bs103ng i5-8250U, Radeon 520, Samsung SSD PM871a MZNLN256HMHQ, TN LED, 1920x1080, 15.6" | Lenovo V510-15IKB 80WQ0002GE i5-7200U, HD Graphics 620, Samsung CM871a MZNTY256HDHP, IPS, 1920x1080, 15.6" | |
|---|---|---|---|---|
| Power Consumption | -25% | -3% | -20% | |
| Idle Minimum * (Watt) | 3.4 | 4.3 -26% | 3.2 6% | 4 -18% |
| Idle Average * (Watt) | 5.8 | 10.1 -74% | 5.8 -0% | 9.6 -66% |
| Idle Maximum * (Watt) | 8 | 11.8 -48% | 6.3 21% | 9.7 -21% |
| Load Average * (Watt) | 38 | 32 16% | 34 11% | 27.7 27% |
| Load Maximum * (Watt) | 32 | 29 9% | 49 -53% | 38.4 -20% |
* ... smaller is better
Battery Life
Our Latitude 5580 has a 42% higher battery capacity than the TravelMate, but lasts only 17% longer in the practically relevant WLAN surf test with the brightness reduced to about 150 cd/m² (how we test), which can be explained by the higher idle consumption. The deficit of the Lenovo V510 turns out disproportionately large here, while the lower battery capacity in the HP 15-bs103ng corresponds approximately to its lower battery life. Surprisingly, in terms of consumption, the HP comes closest to our test device.
So under realistic conditions, you can expect a battery life of almost 9 hours, which should get most users safely through the day.
| Acer TravelMate P2510-M-51ZQ i5-7200U, HD Graphics 620, 48 Wh | Dell Latitude 5580 i5-7300U, HD Graphics 620, 68 Wh | HP 15-bs103ng i5-8250U, Radeon 520, 41.6 Wh | Lenovo V510-15IKB 80WQ0002GE i5-7200U, HD Graphics 620, 32 Wh | |
|---|---|---|---|---|
| Battery runtime | 16% | -8% | -57% | |
| Reader / Idle (h) | 15.2 | 14.8 -3% | ||
| WiFi v1.3 (h) | 8.8 | 10.2 16% | 7.9 -10% | 3.8 -57% |
| Load (h) | 1.9 | 1.7 -11% | ||
| H.264 (h) | 7.6 |
Verdict
Pros
Cons
Whether the problems with the warped case only affects our test unit or not, we always have to evaluate what is provided to us. The sub-rating turns out correspondingly bad.
Apart from the case and considering the very low price of the entry-level model in particular, the results give a very positive impression. Budget buyers with office ambitions will surely overlook the weaknesses of the display as well as the slow card reader. The advantages from the list of positives such as the good input devices, the fast WLAN, TPM, and the very decent battery life are probably more important here. From a technical point of view, all looks good, and the TravelMate offers a constant performance while it remains quiet and cool.
With the TravelMate P2510-M-51ZQ, Acer actually presents a successful office notebook with a good price-performance ratio, although, due to considerable quality defects of the case of our test sample, we have to withhold our purchase recommendation.
Acer TravelMate P2510-M-51ZQ
- 03/03/2018 v6 (old)
Sven Kloevekorn
Price comparison
