Acer TravelMate P6 in review: Lightweight business laptop with long battery life

The Acer TravelMate P6 P614-51T-G2 is a high-end 14-inch business laptop. The device is powered by a Core i7-10510U processor (Comet Lake). Moreover, the P6 doesn't lack competitors. Some of them are the Lenovo ThinkPad T14s, the Lenovo ThinkPad X1 Carbon, and the Dell Latitude 7410. In order to have current Ice Lake devices in the comparison field too, we also add the Asus ZenBook 13 UX325JA and the Apple MacBook Pro 13 2020 13.3-inch devices to the competition.
Rating | Date | Model | Weight | Height | Size | Resolution | Price |
|---|---|---|---|---|---|---|---|
| 87 % v7 (old) | 08 / 2020 | Acer TravelMate P6 P614-51T-G2-72ZU i7-10510U, UHD Graphics 620 | 1.2 kg | 16.6 mm | 14.00" | 1920x1080 | |
| 90.2 % v7 (old) | 07 / 2020 | Lenovo ThinkPad X1 Carbon 2020-20UAS04T00 i7-10510U, UHD Graphics 620 | 1.1 kg | 14.9 mm | 14.00" | 1920x1080 | |
| 88.8 % v7 (old) | 07 / 2020 | Lenovo ThinkPad T14s-20T00044GE i5-10210U, UHD Graphics 620 | 1.3 kg | 16.1 mm | 14.00" | 1920x1080 | |
| 90.5 % v7 (old) | 08 / 2020 | Lenovo ThinkPad T14s-20UJS00K00 R7 PRO 4750U, Vega 7 | 1.3 kg | 16.1 mm | 14.00" | 1920x1080 | |
| 88.9 % v7 (old) | 07 / 2020 | Dell Latitude 7410 i7-10610U, UHD Graphics 620 | 1.4 kg | 19.3 mm | 14.00" | 3840x2160 | |
| 87.5 % v7 (old) | 08 / 2020 | Asus ZenBook 13 UX325JA i7-1065G7, Iris Plus Graphics G7 (Ice Lake 64 EU) | 1.1 kg | 13.9 mm | 13.30" | 1920x1080 | |
| 92.1 % v7 (old) | 06 / 2020 | Apple MacBook Pro 13 2020 2GHz i5 10th-Gen i5-1038NG7, Iris Plus Graphics G7 (Ice Lake 64 EU) | 1.4 kg | 15.6 mm | 13.30" | 2560x1600 |
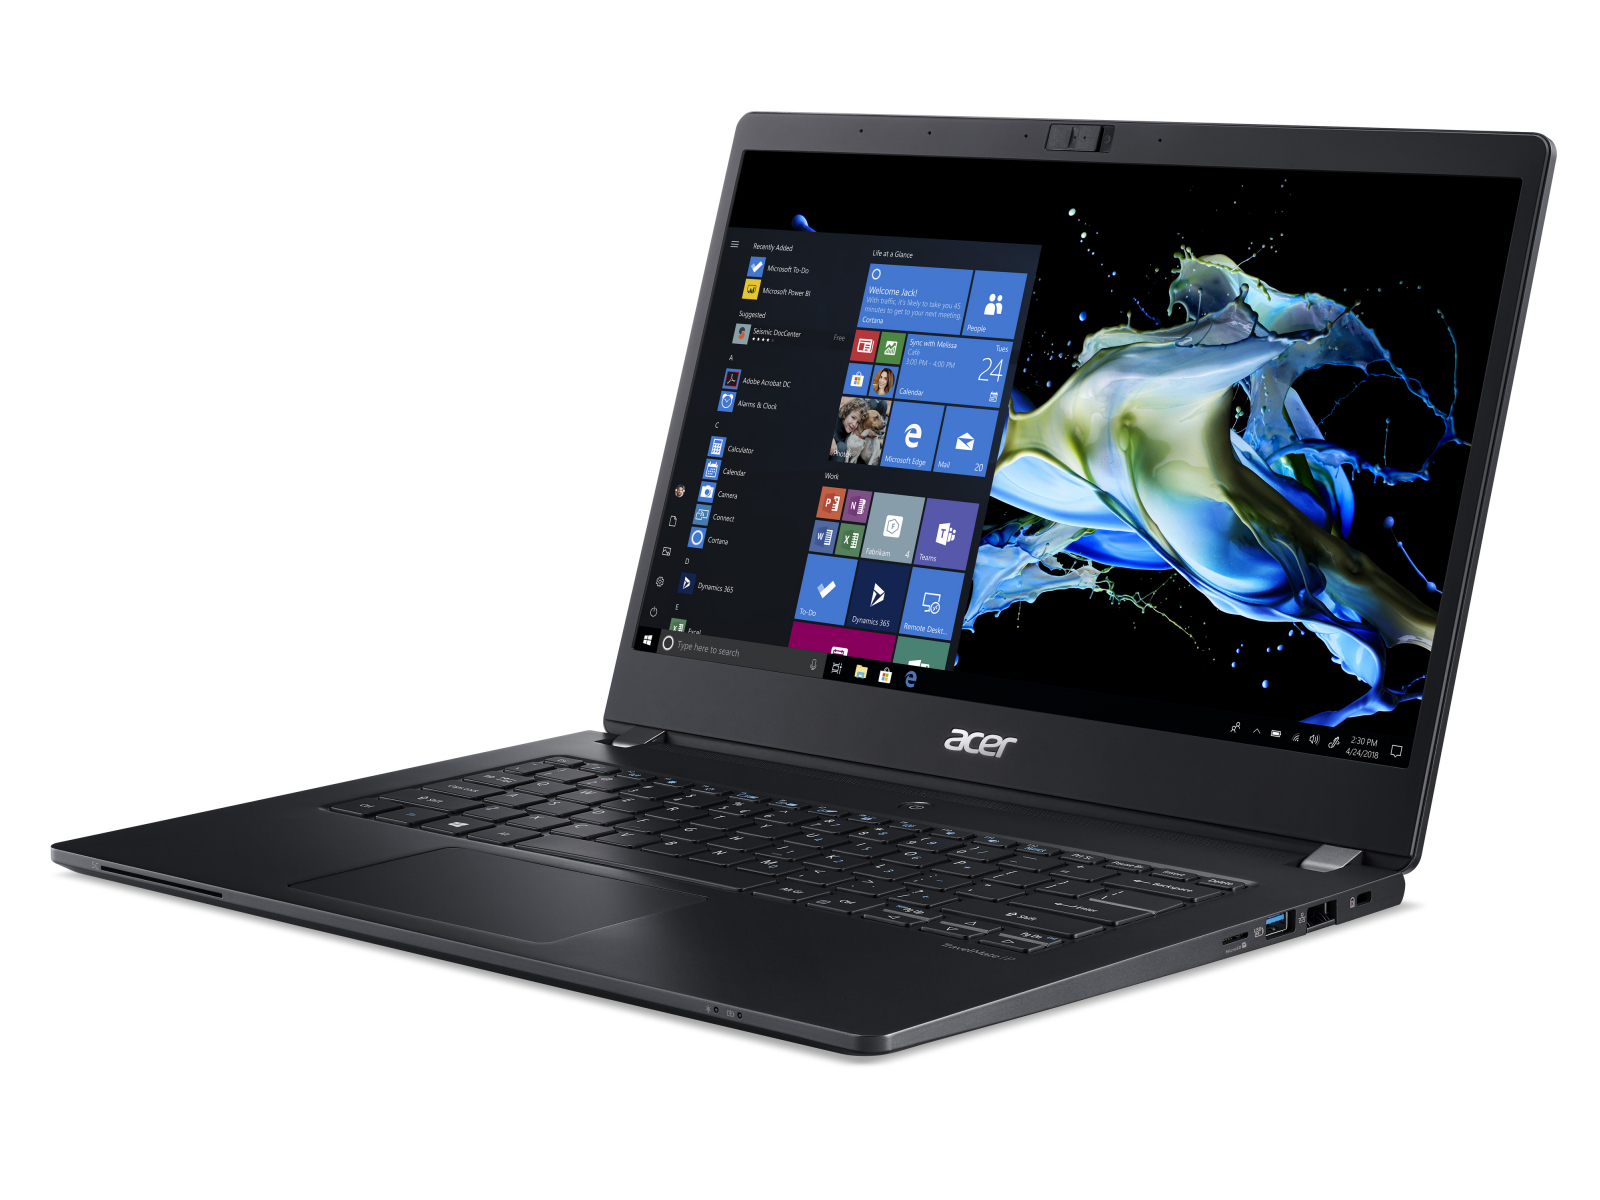
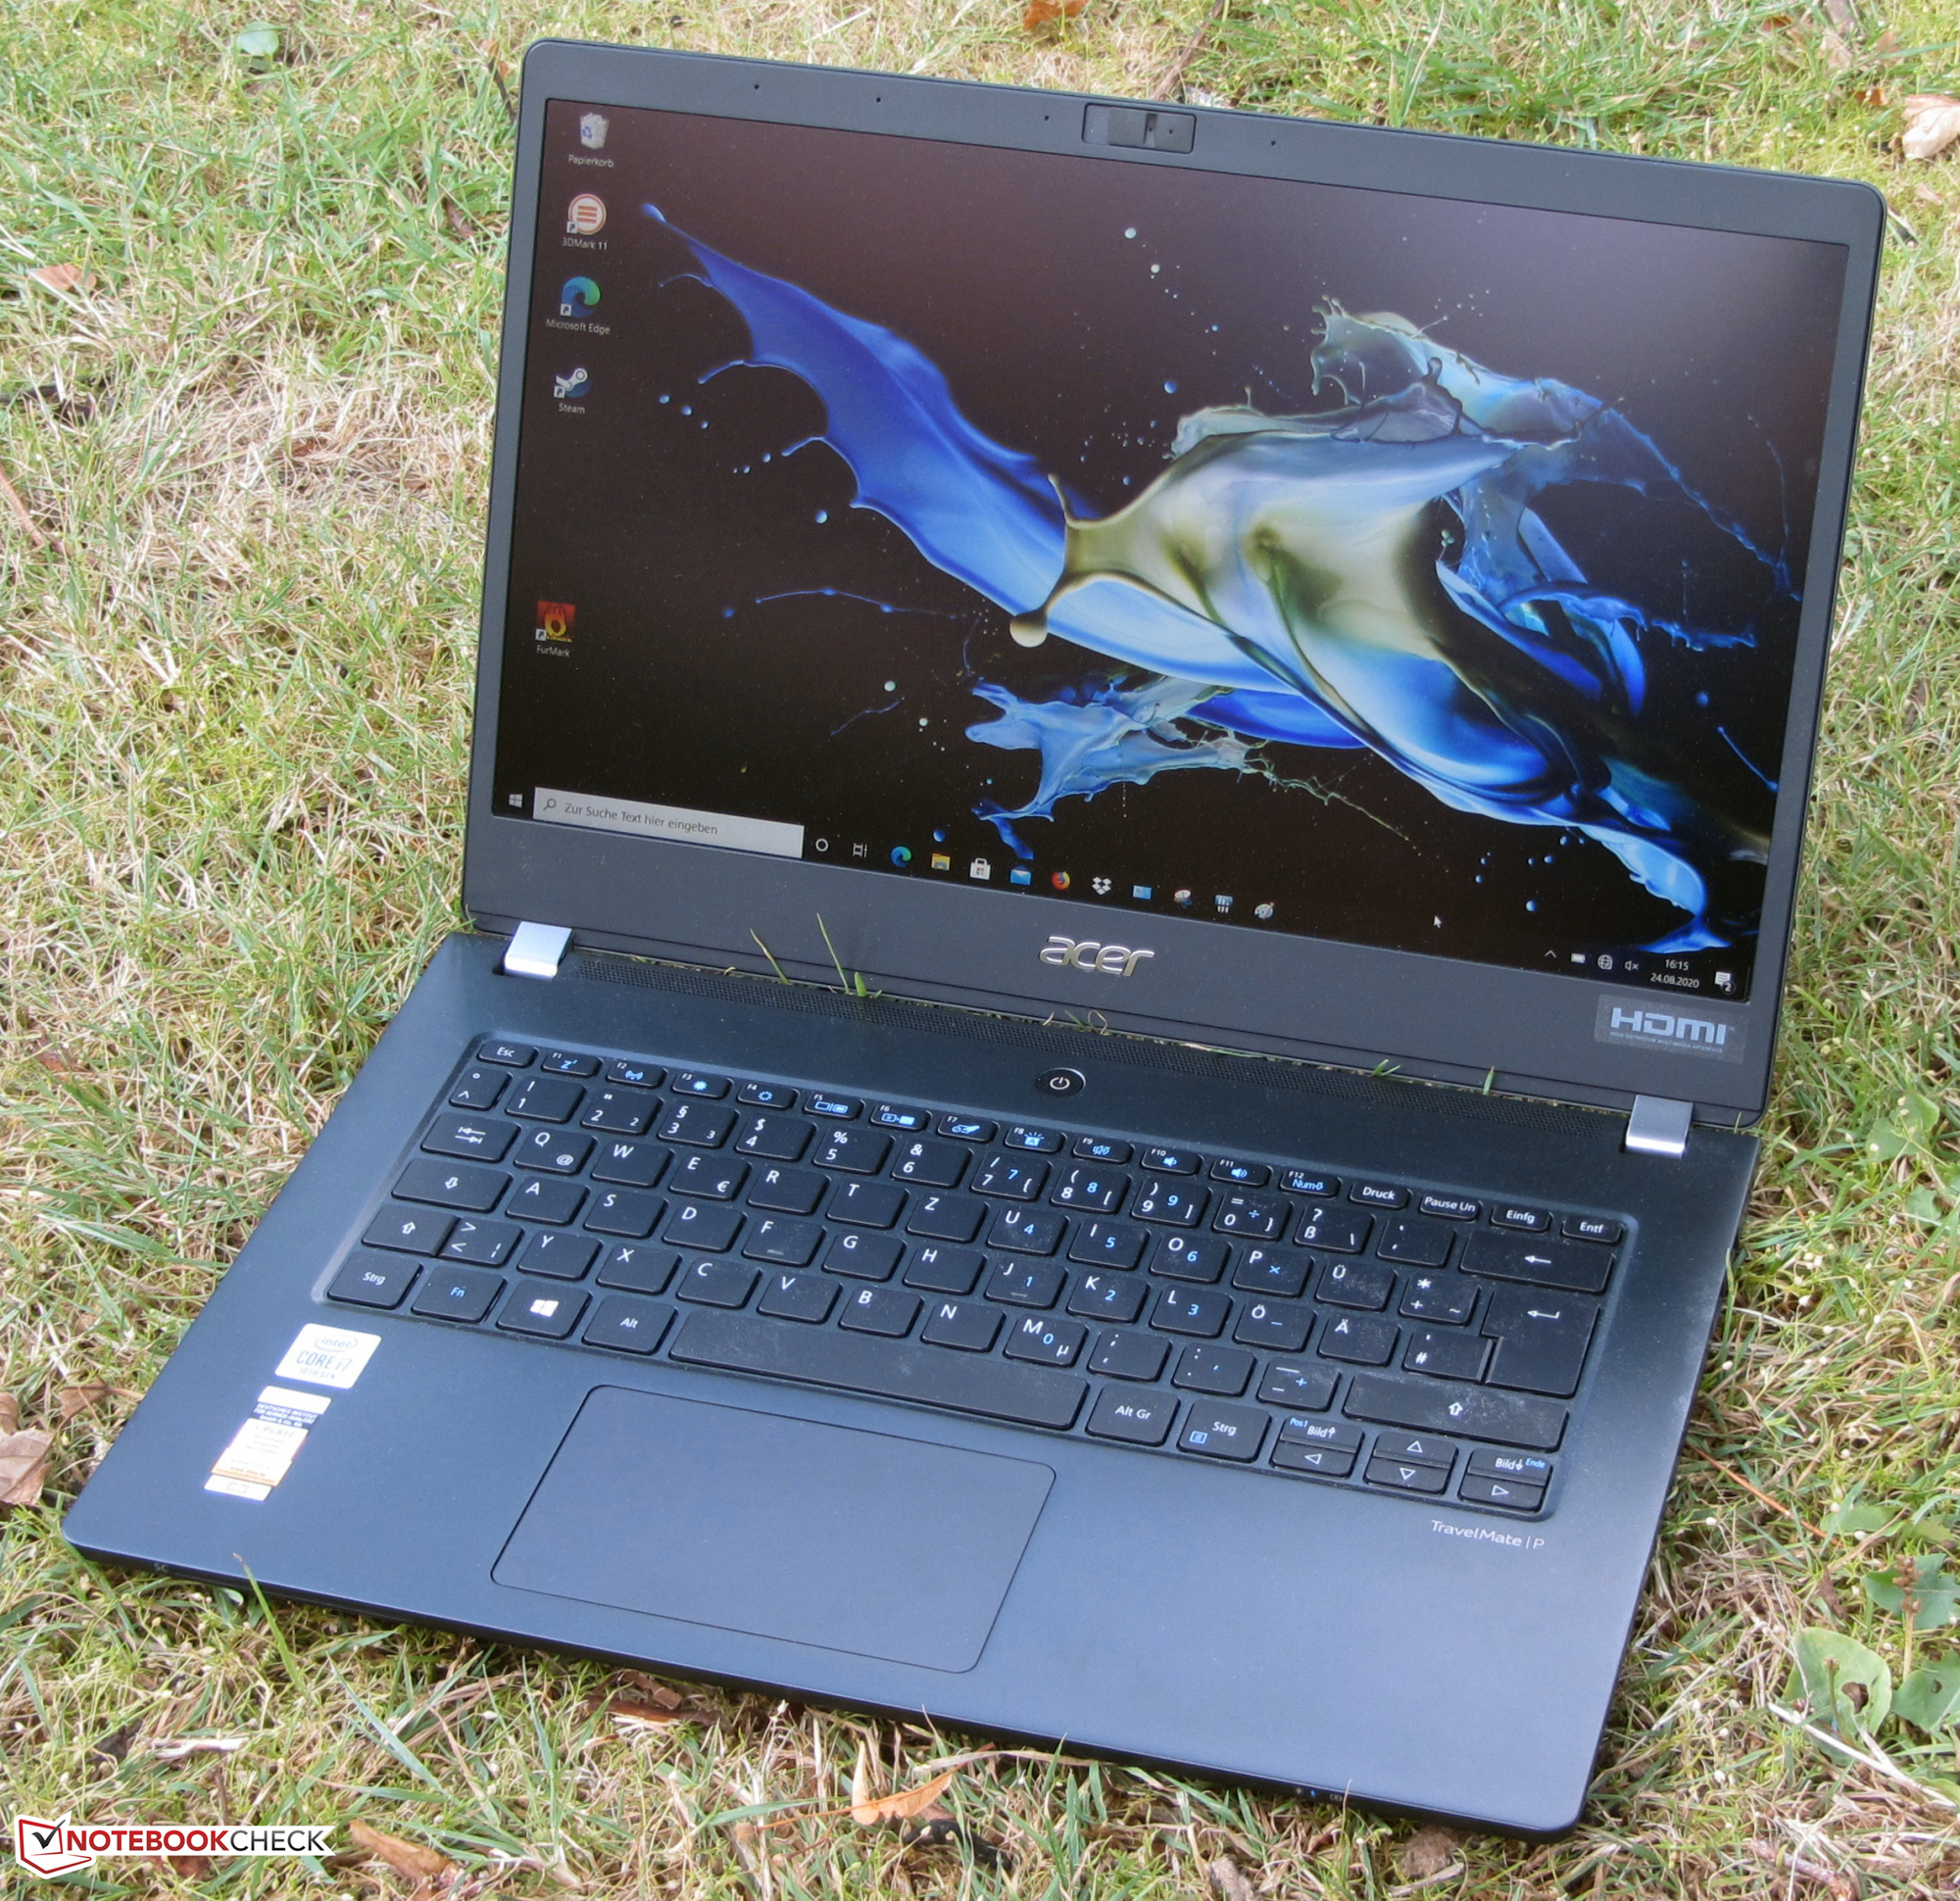
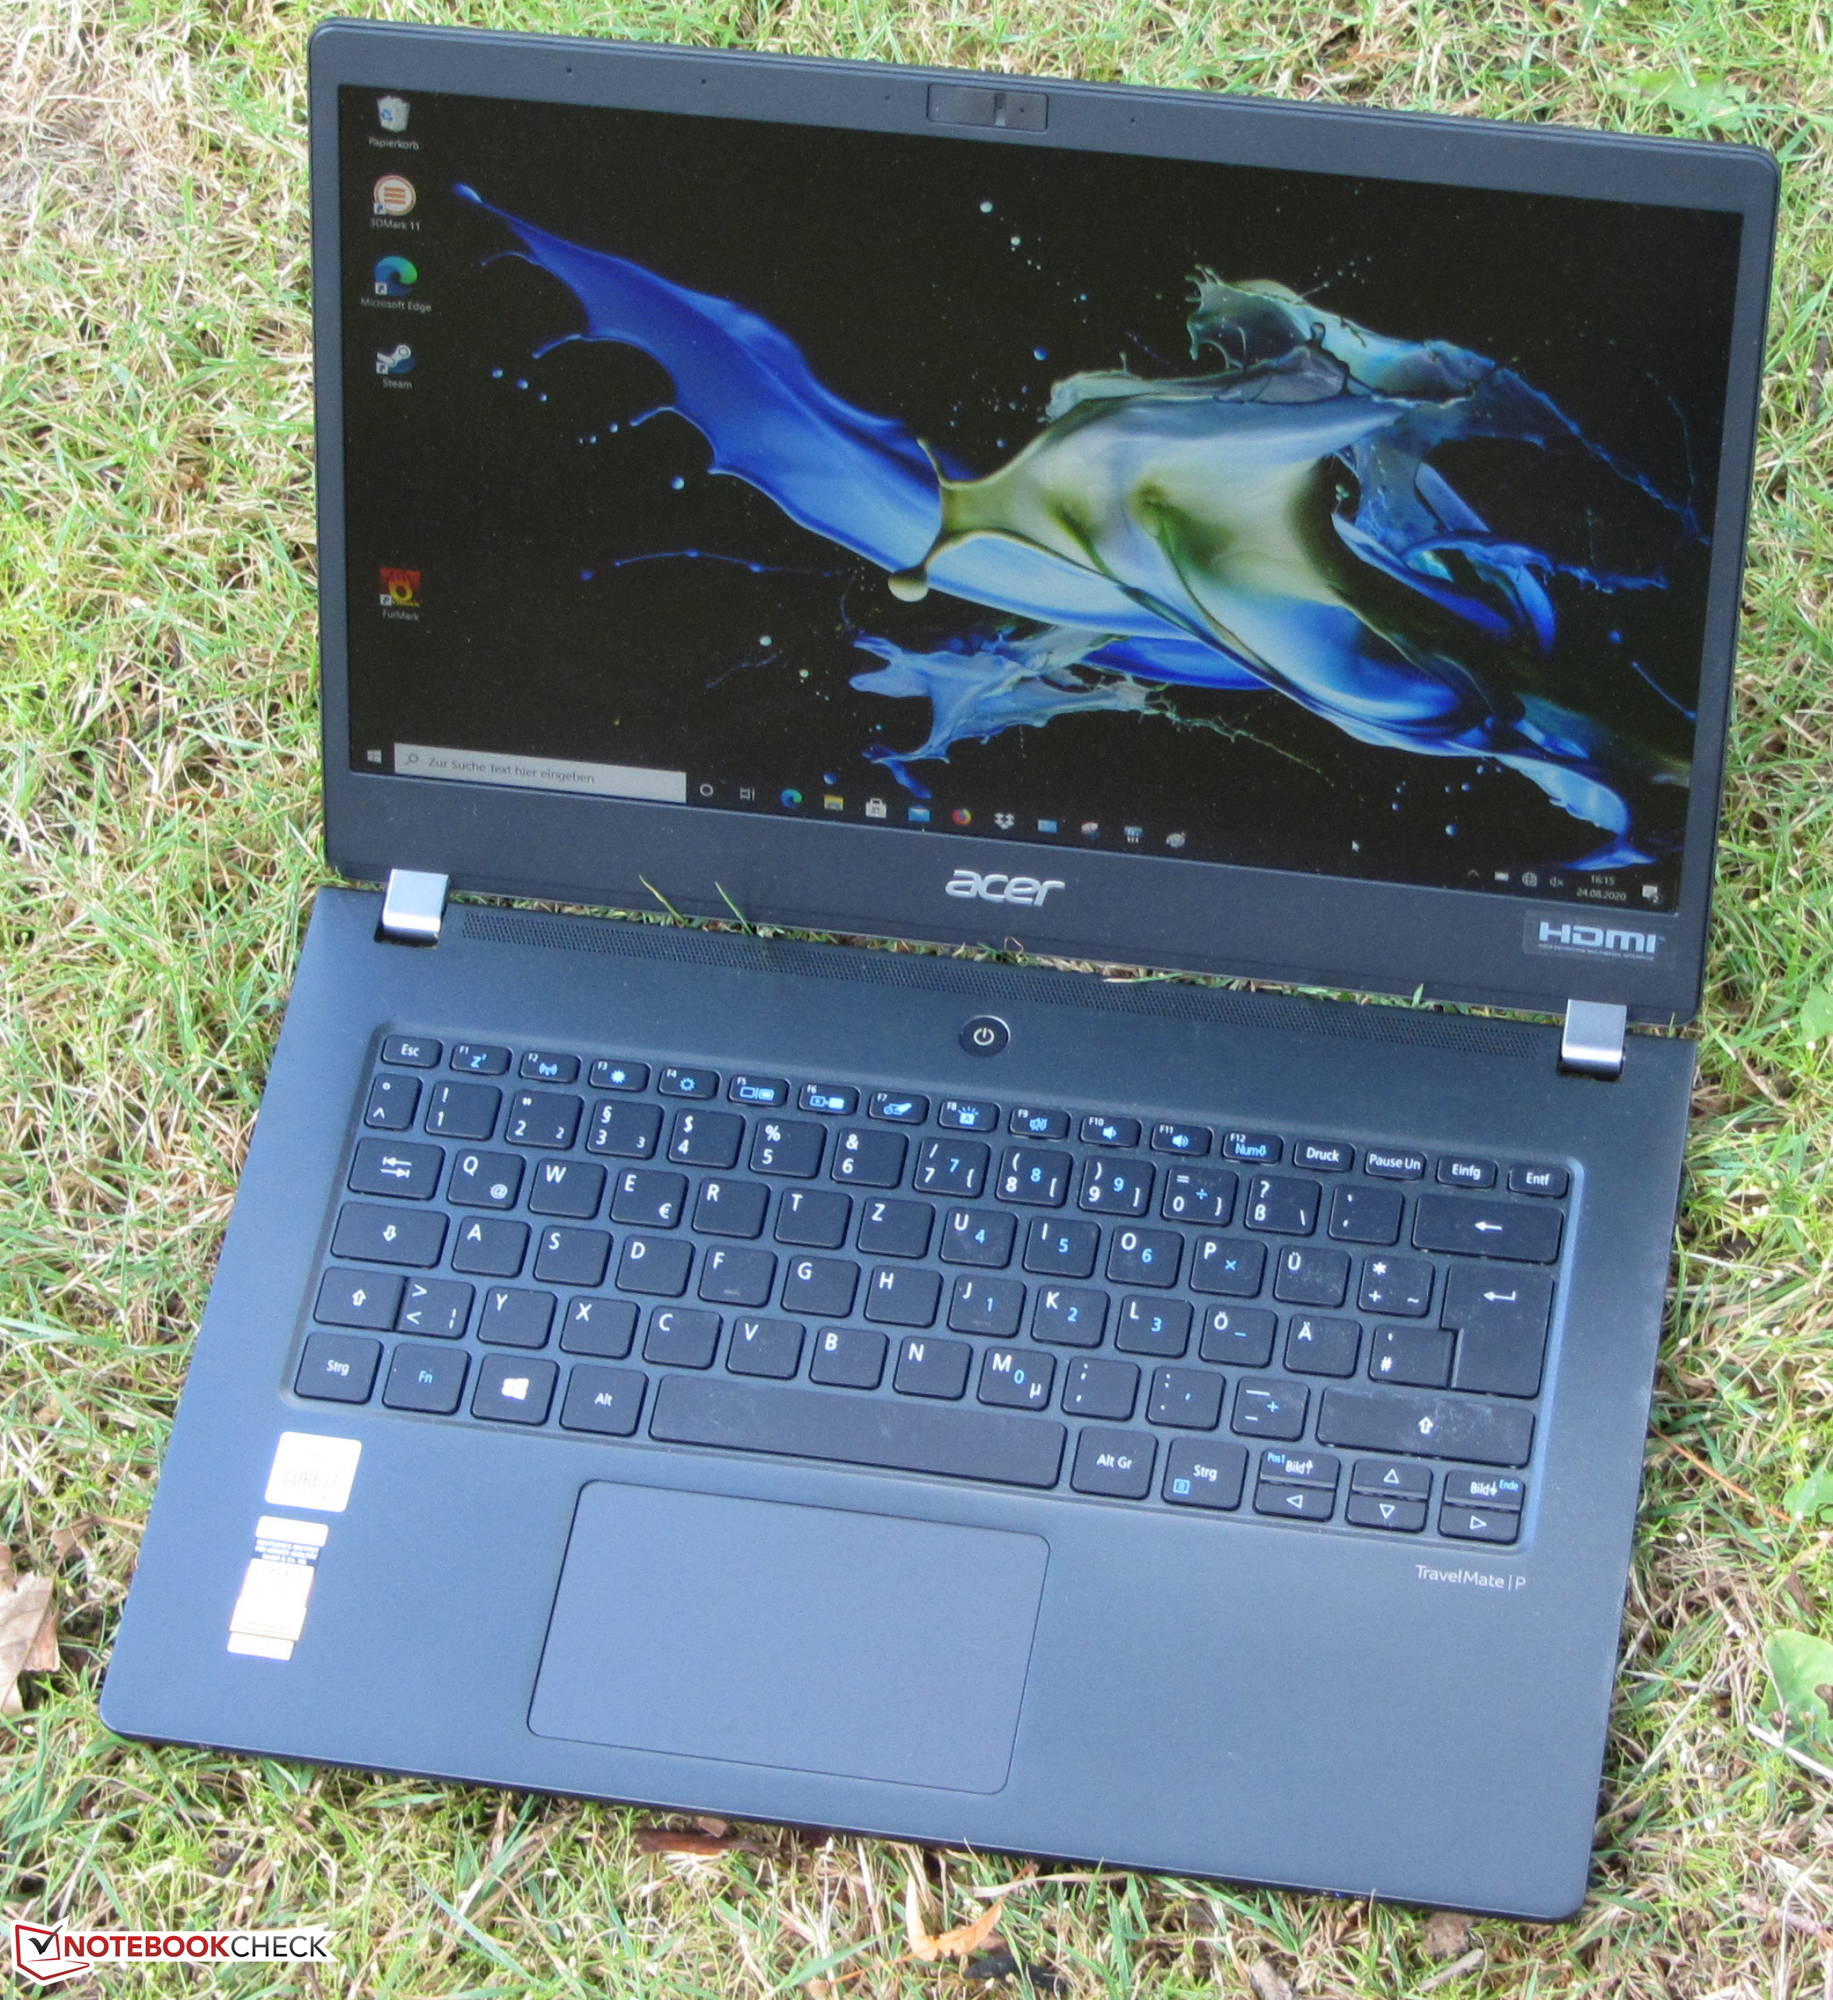
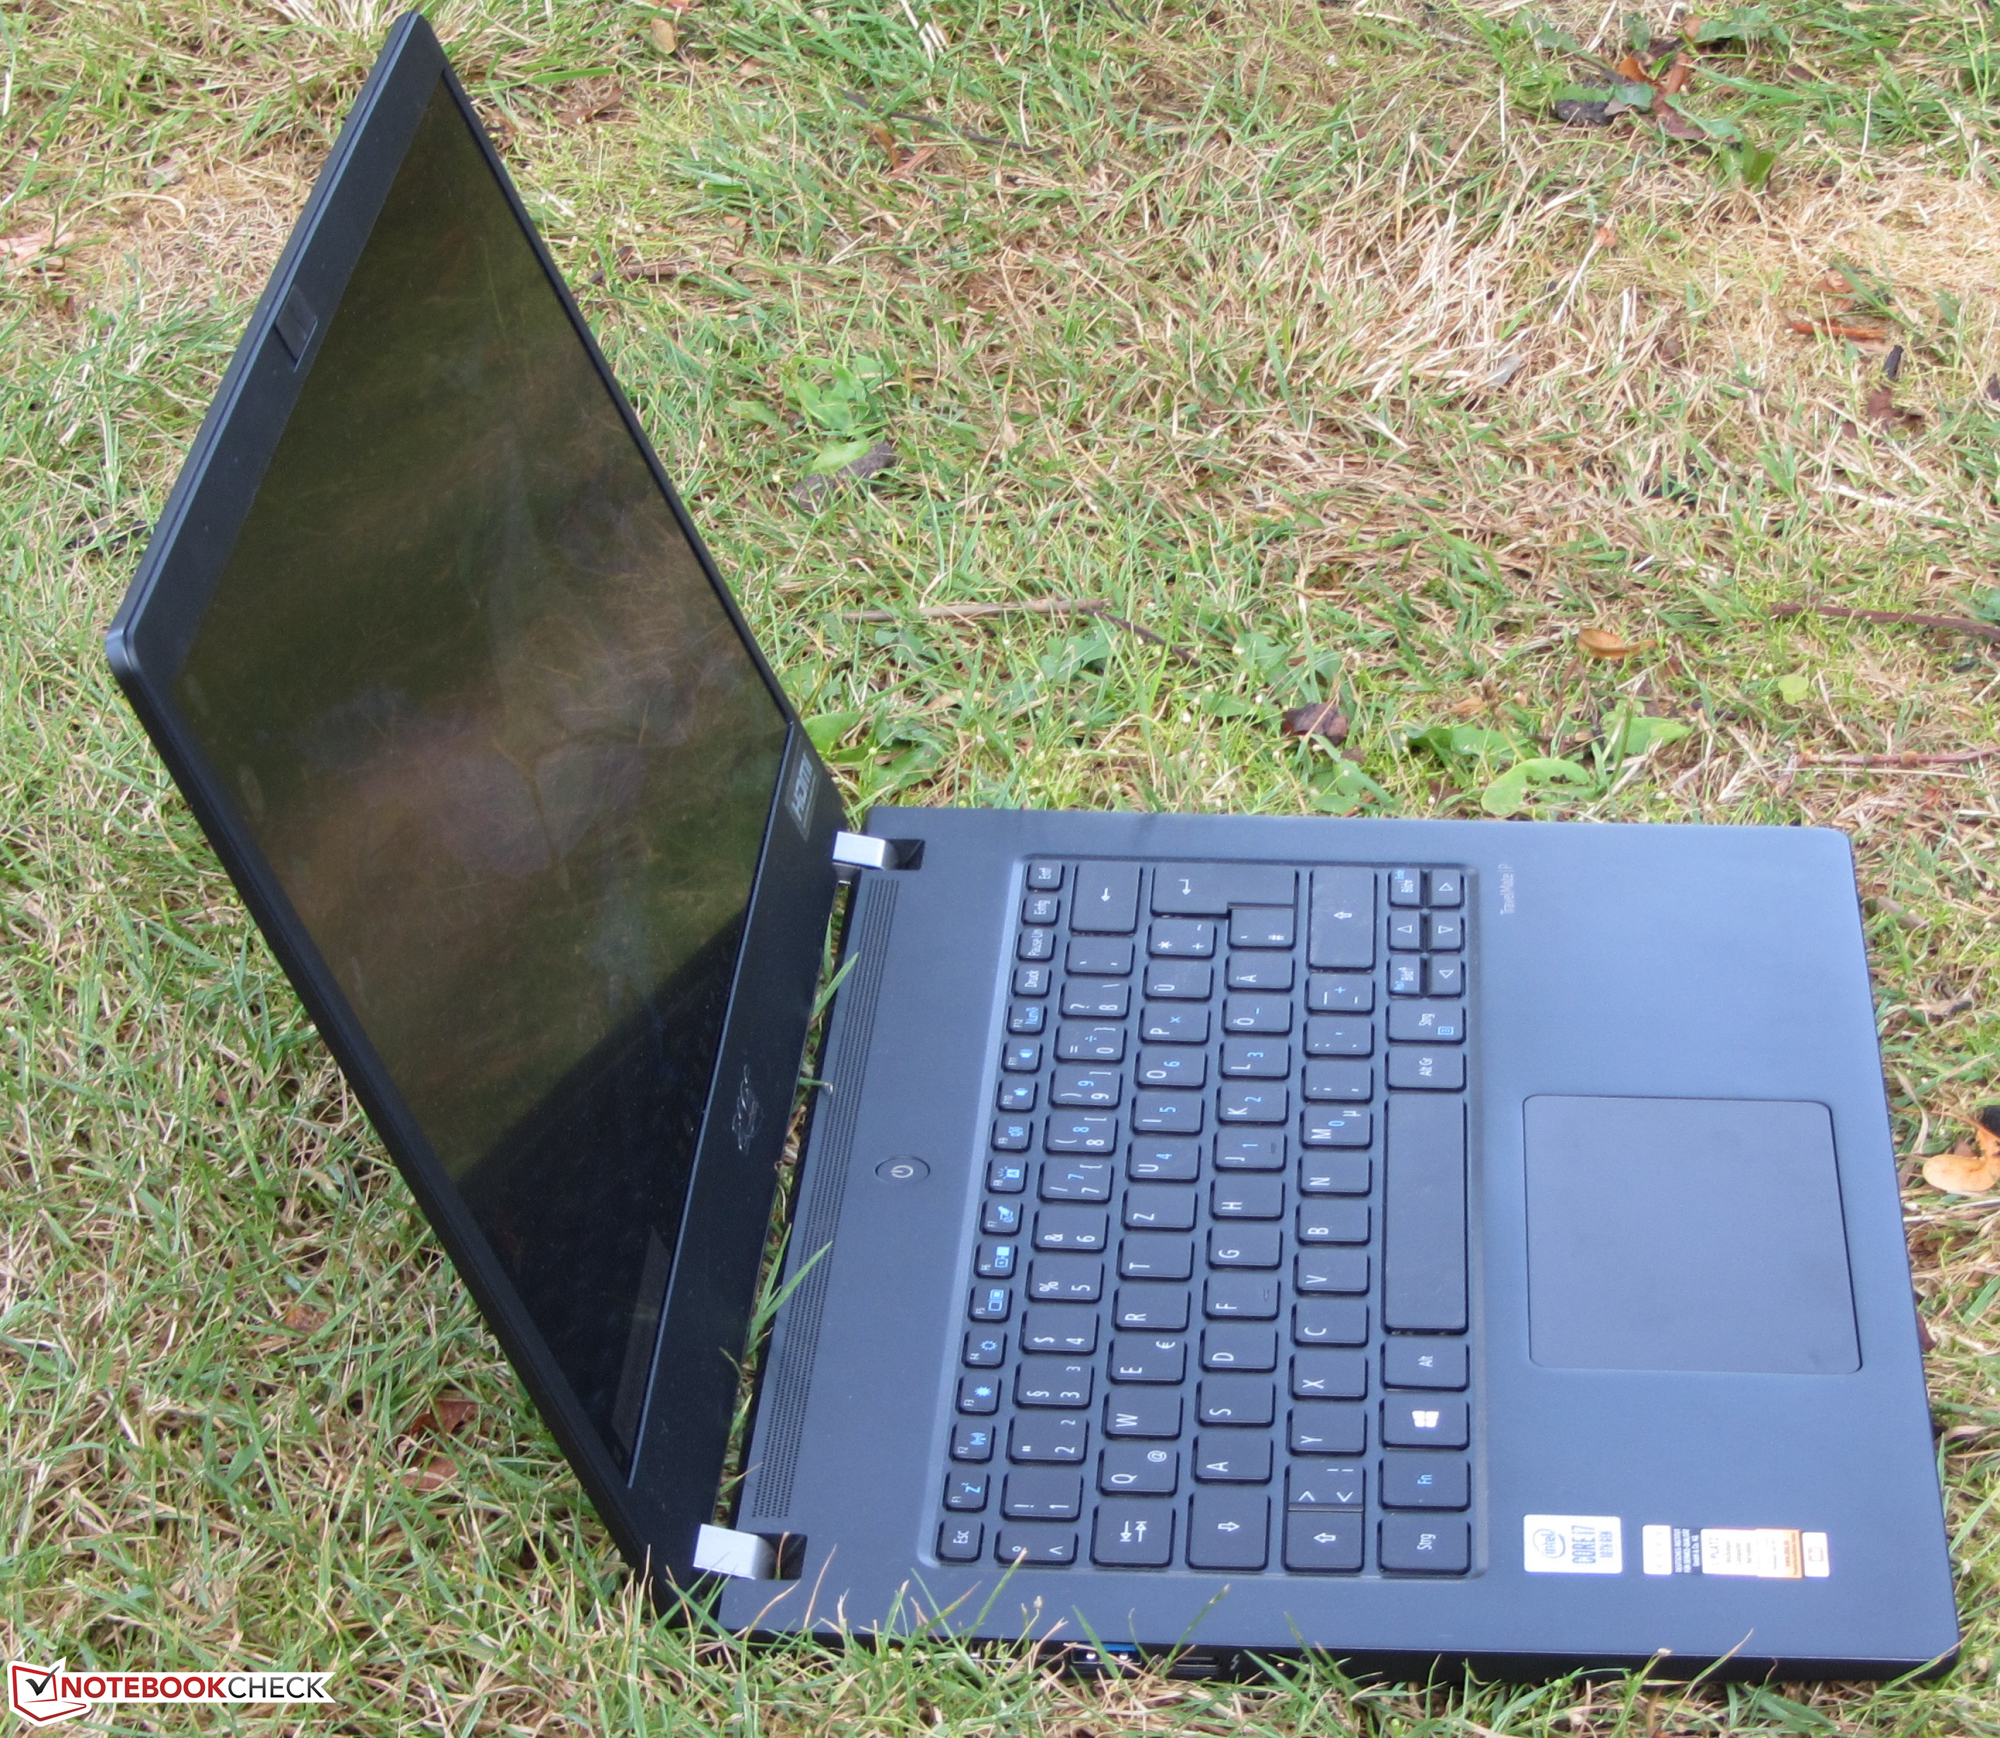
Case - Acer uses a magnesium alloy
Acer has forgone any creative extravagances with the TravelMate. Since this is a work tool for the professional environment, a sober appearance is used. The P6 is not the fanciest laptop. This is due to the fact that the base unit protrudes a good one centimeter towards the back. However, users' opinions will differ here. Furthermore, Acer has chosen a matte black case made of a magnesium alloy for the TravelMate. At just under 1.2 kg, the laptop doesn't weigh much. The battery is firmly installed, and there is no maintenance hatch.
Acer has managed to avoid making any mistakes in terms of workmanship. The gap dimensions are in order, and sharp edges are not noticeable. The base unit and the lid can be twisted a bit, but the whole situation is kept completely within the limits and doesn't represent a problem. Moreover, exerting pressure on the back of the lid doesn't cause any image distortions. The tight hinges hold the lid firmly in place, and it hardly wobbles. The maximum aperture angle is 180°. Opening the lid with one hand is possible with a little finger-hand-arm acrobatics.
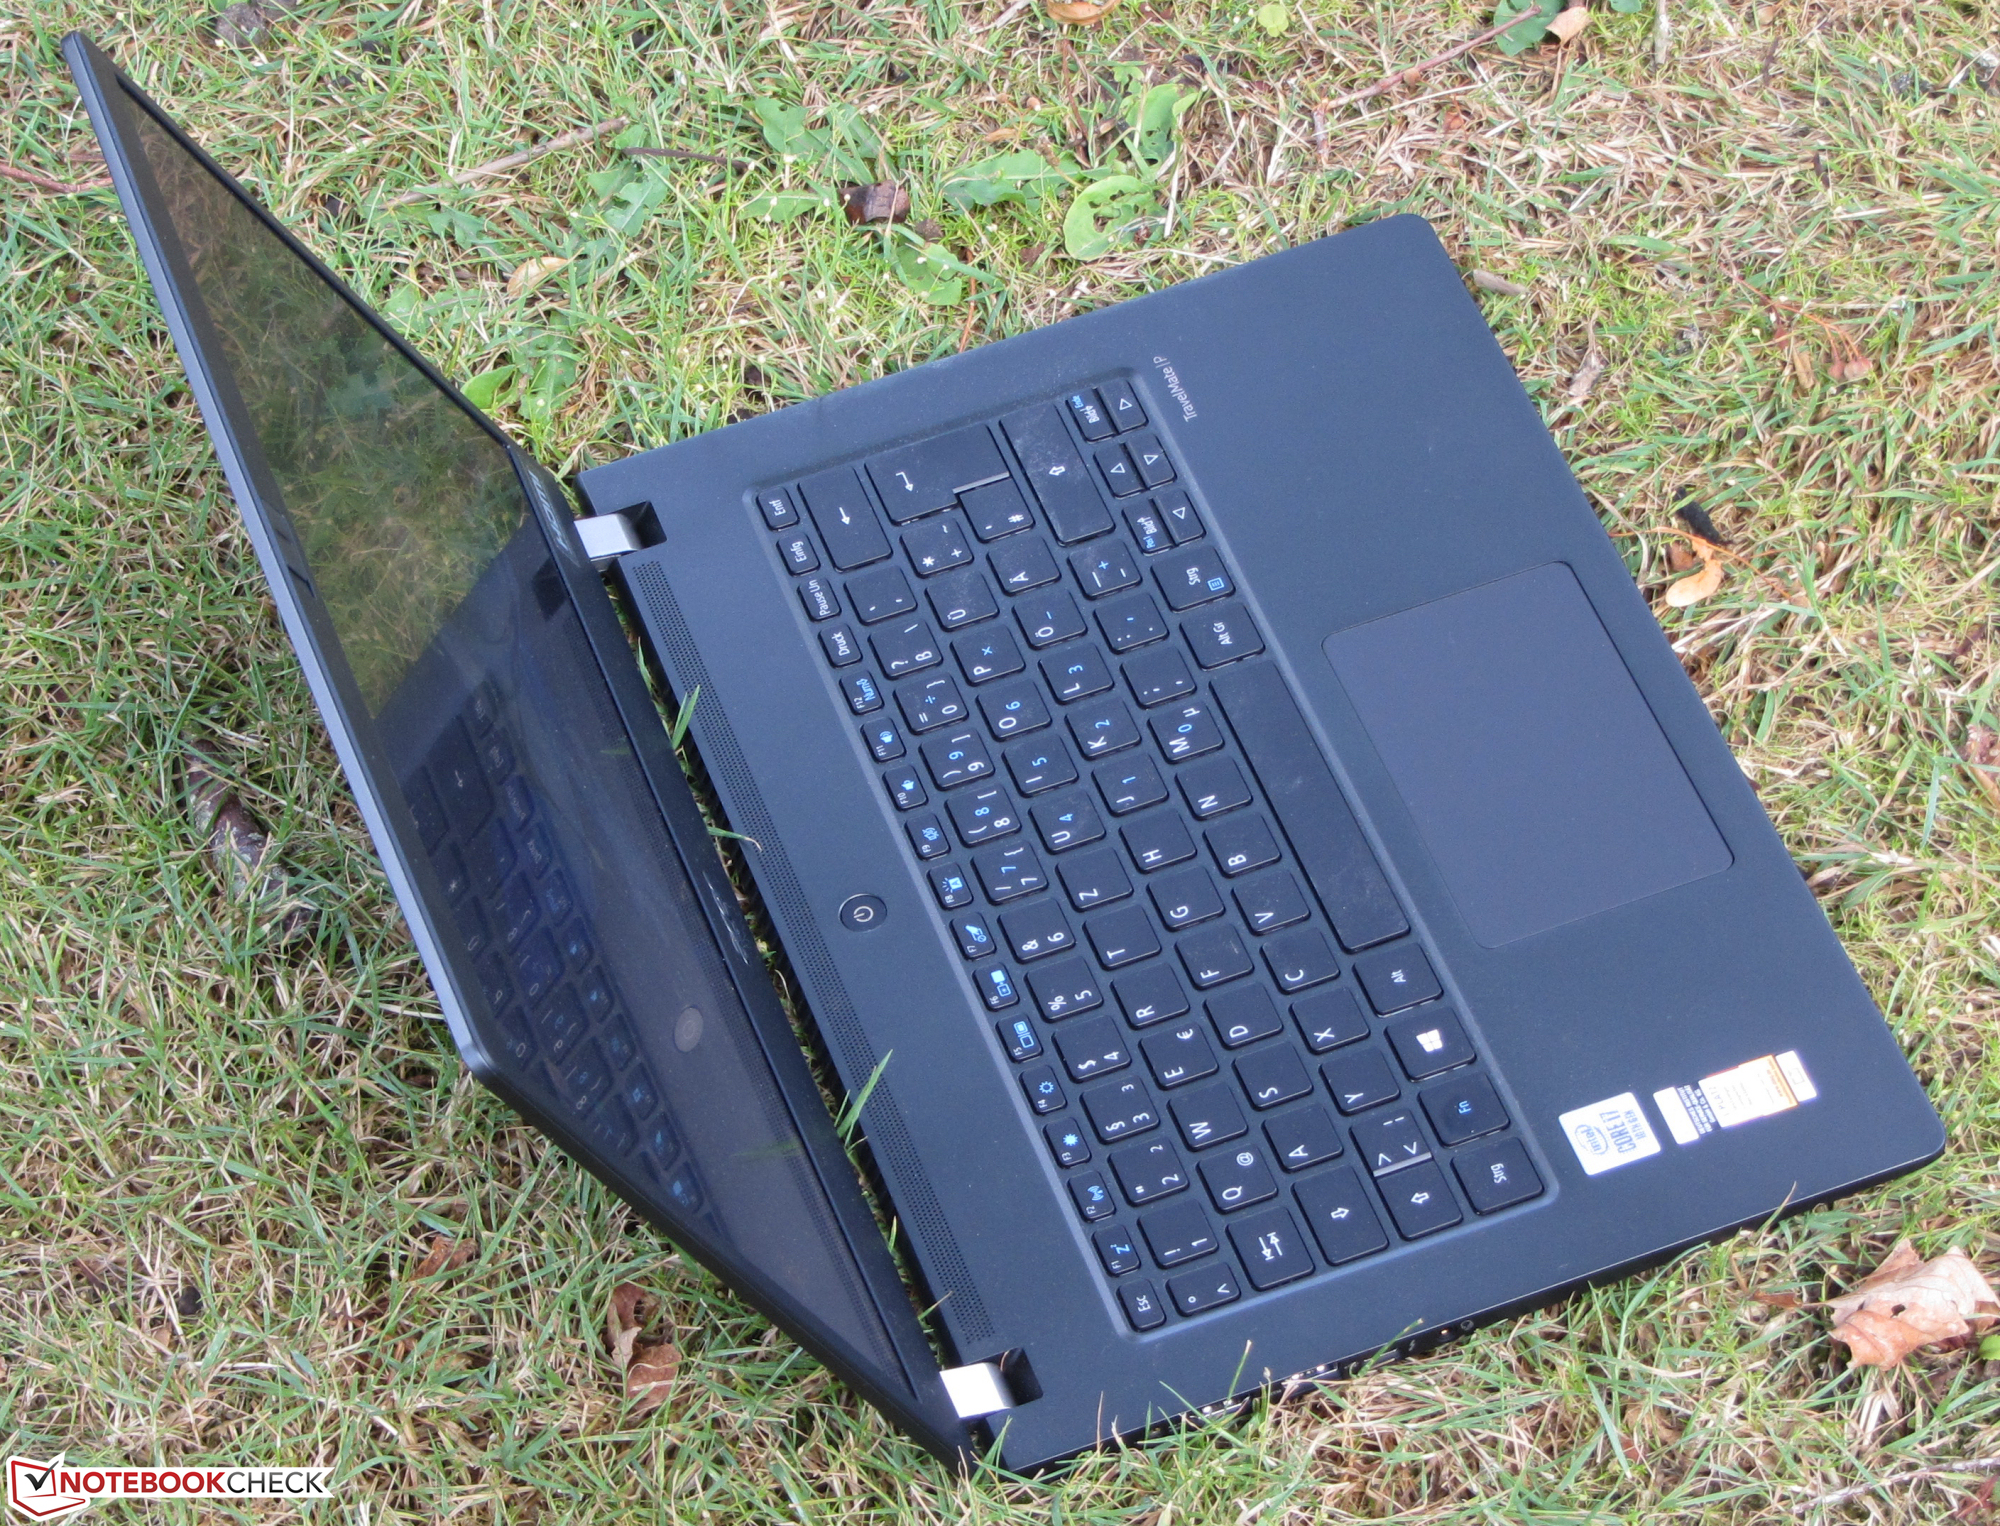

Within our comparison field, the P6 is the laptop with the largest dimensions. In terms of weight, it is one of the lightest devices.
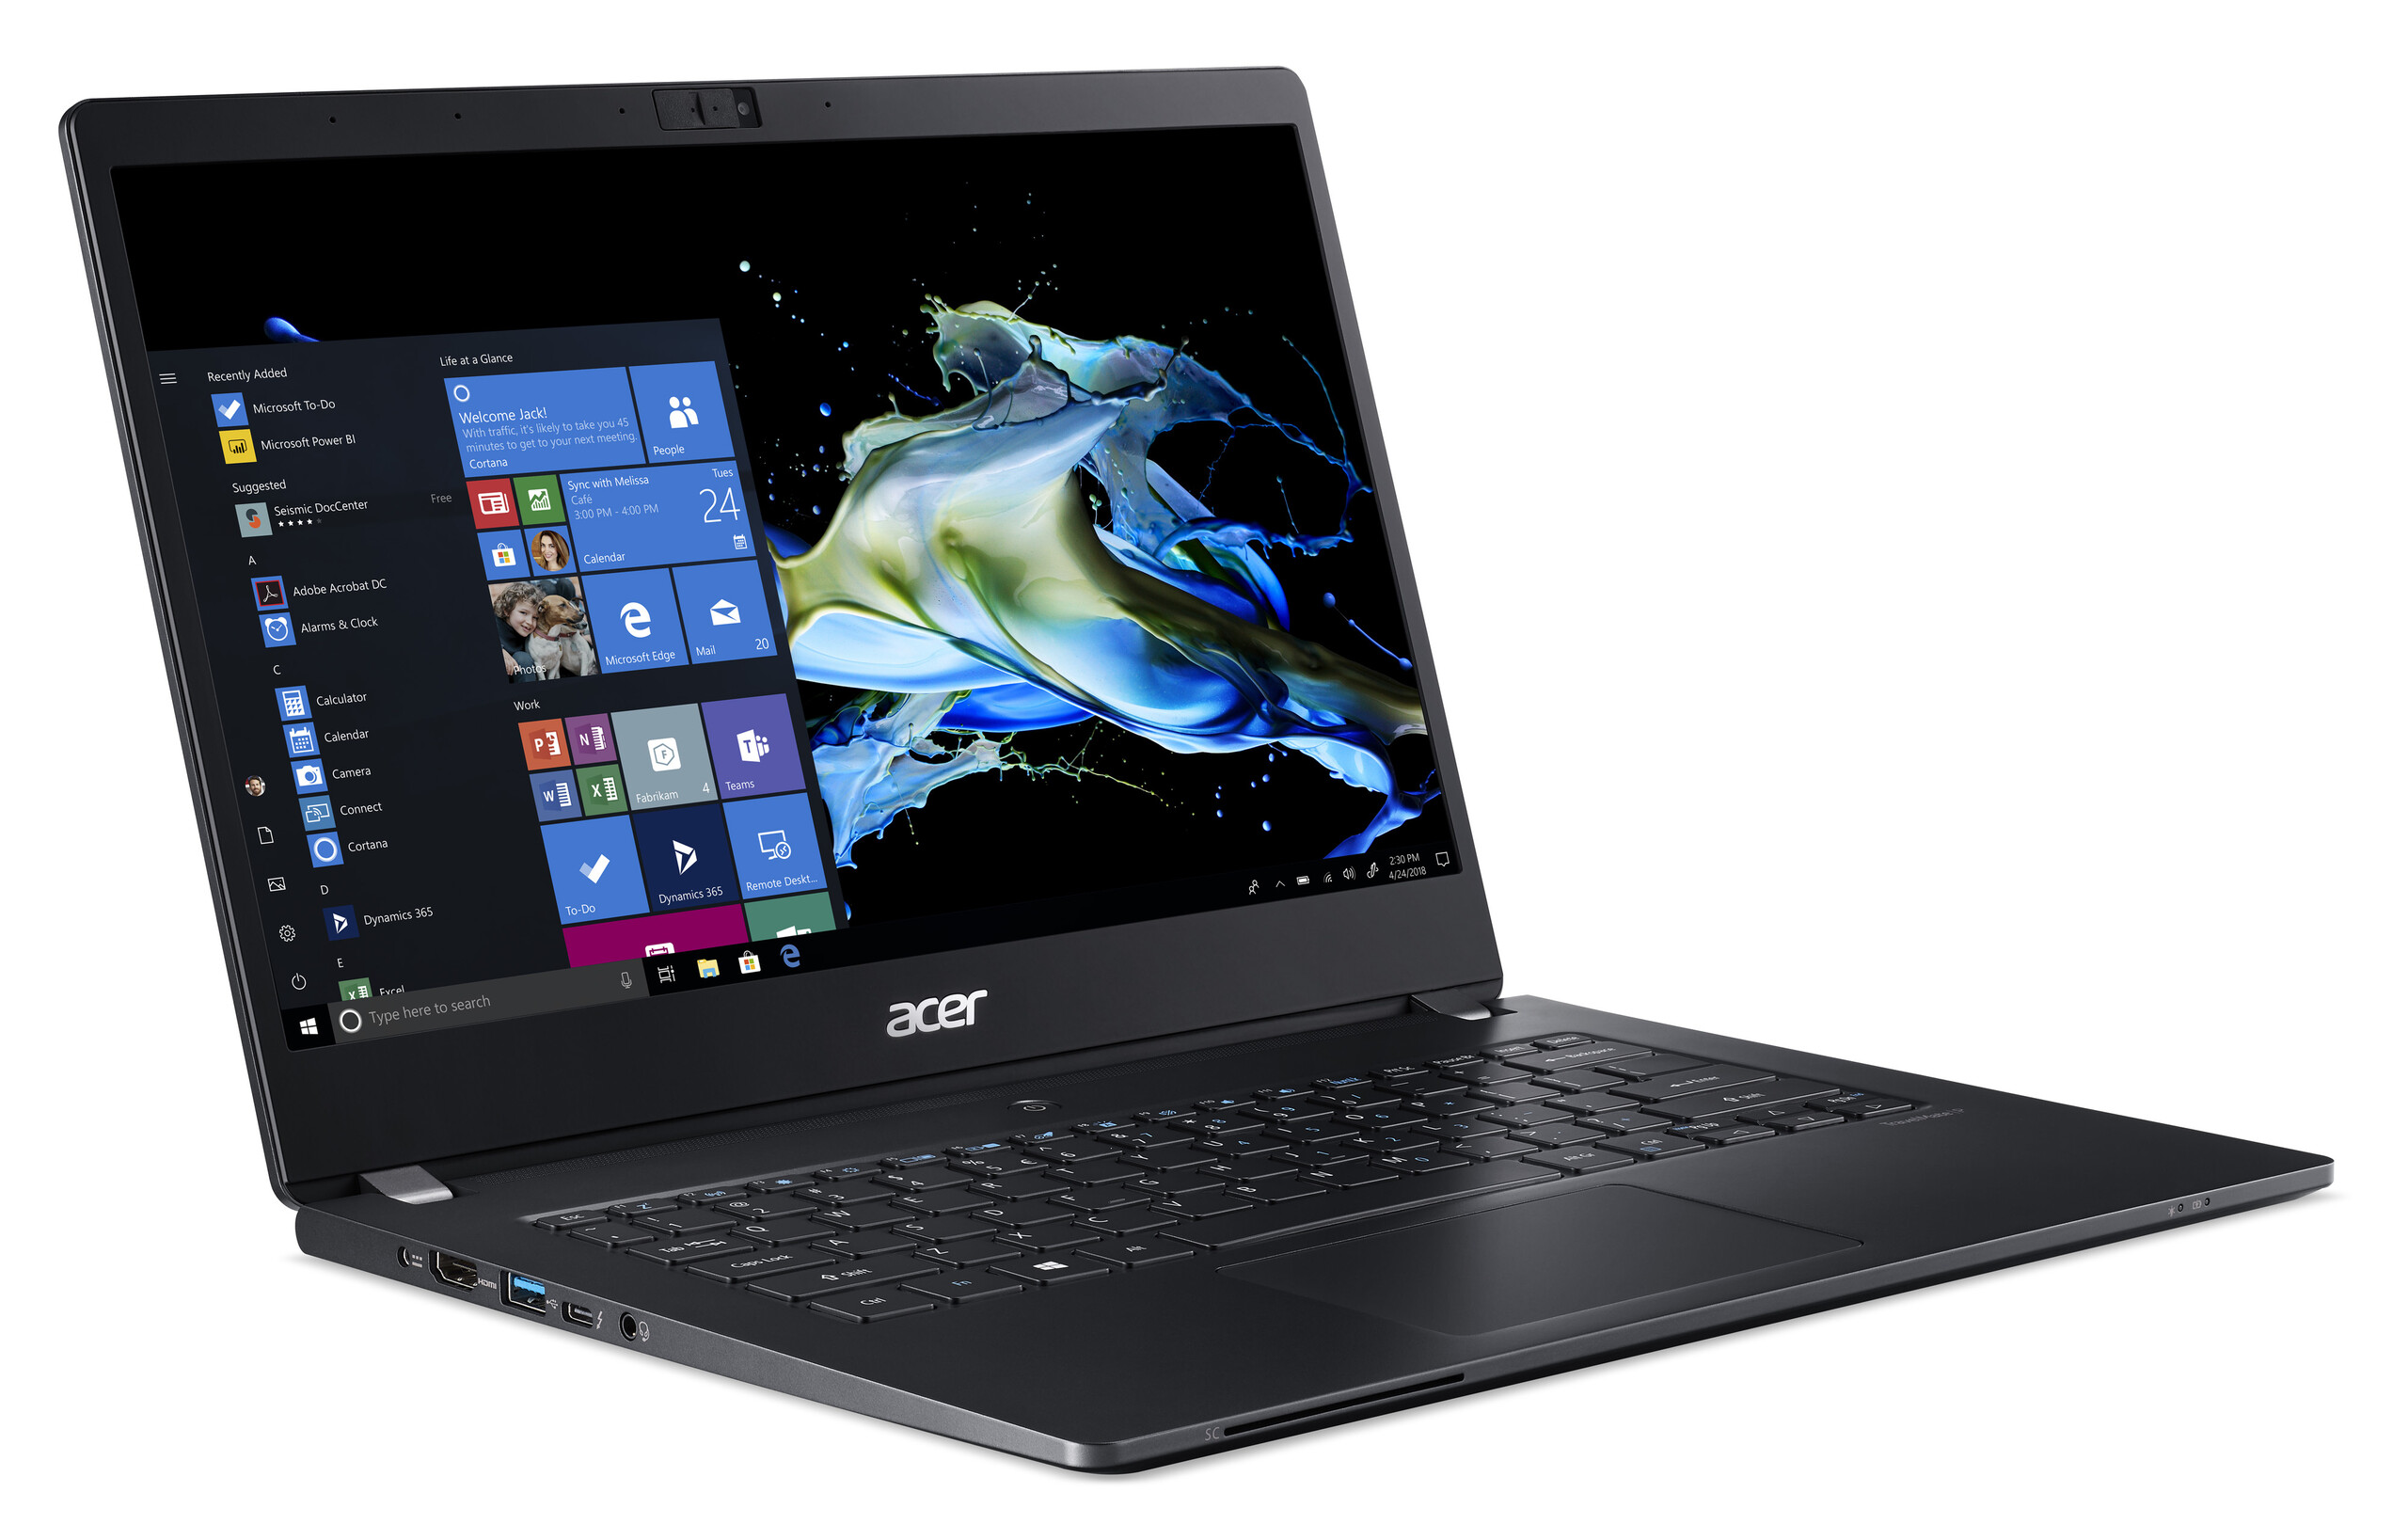
Connectivity - TravelMate with Thunderbolt 3
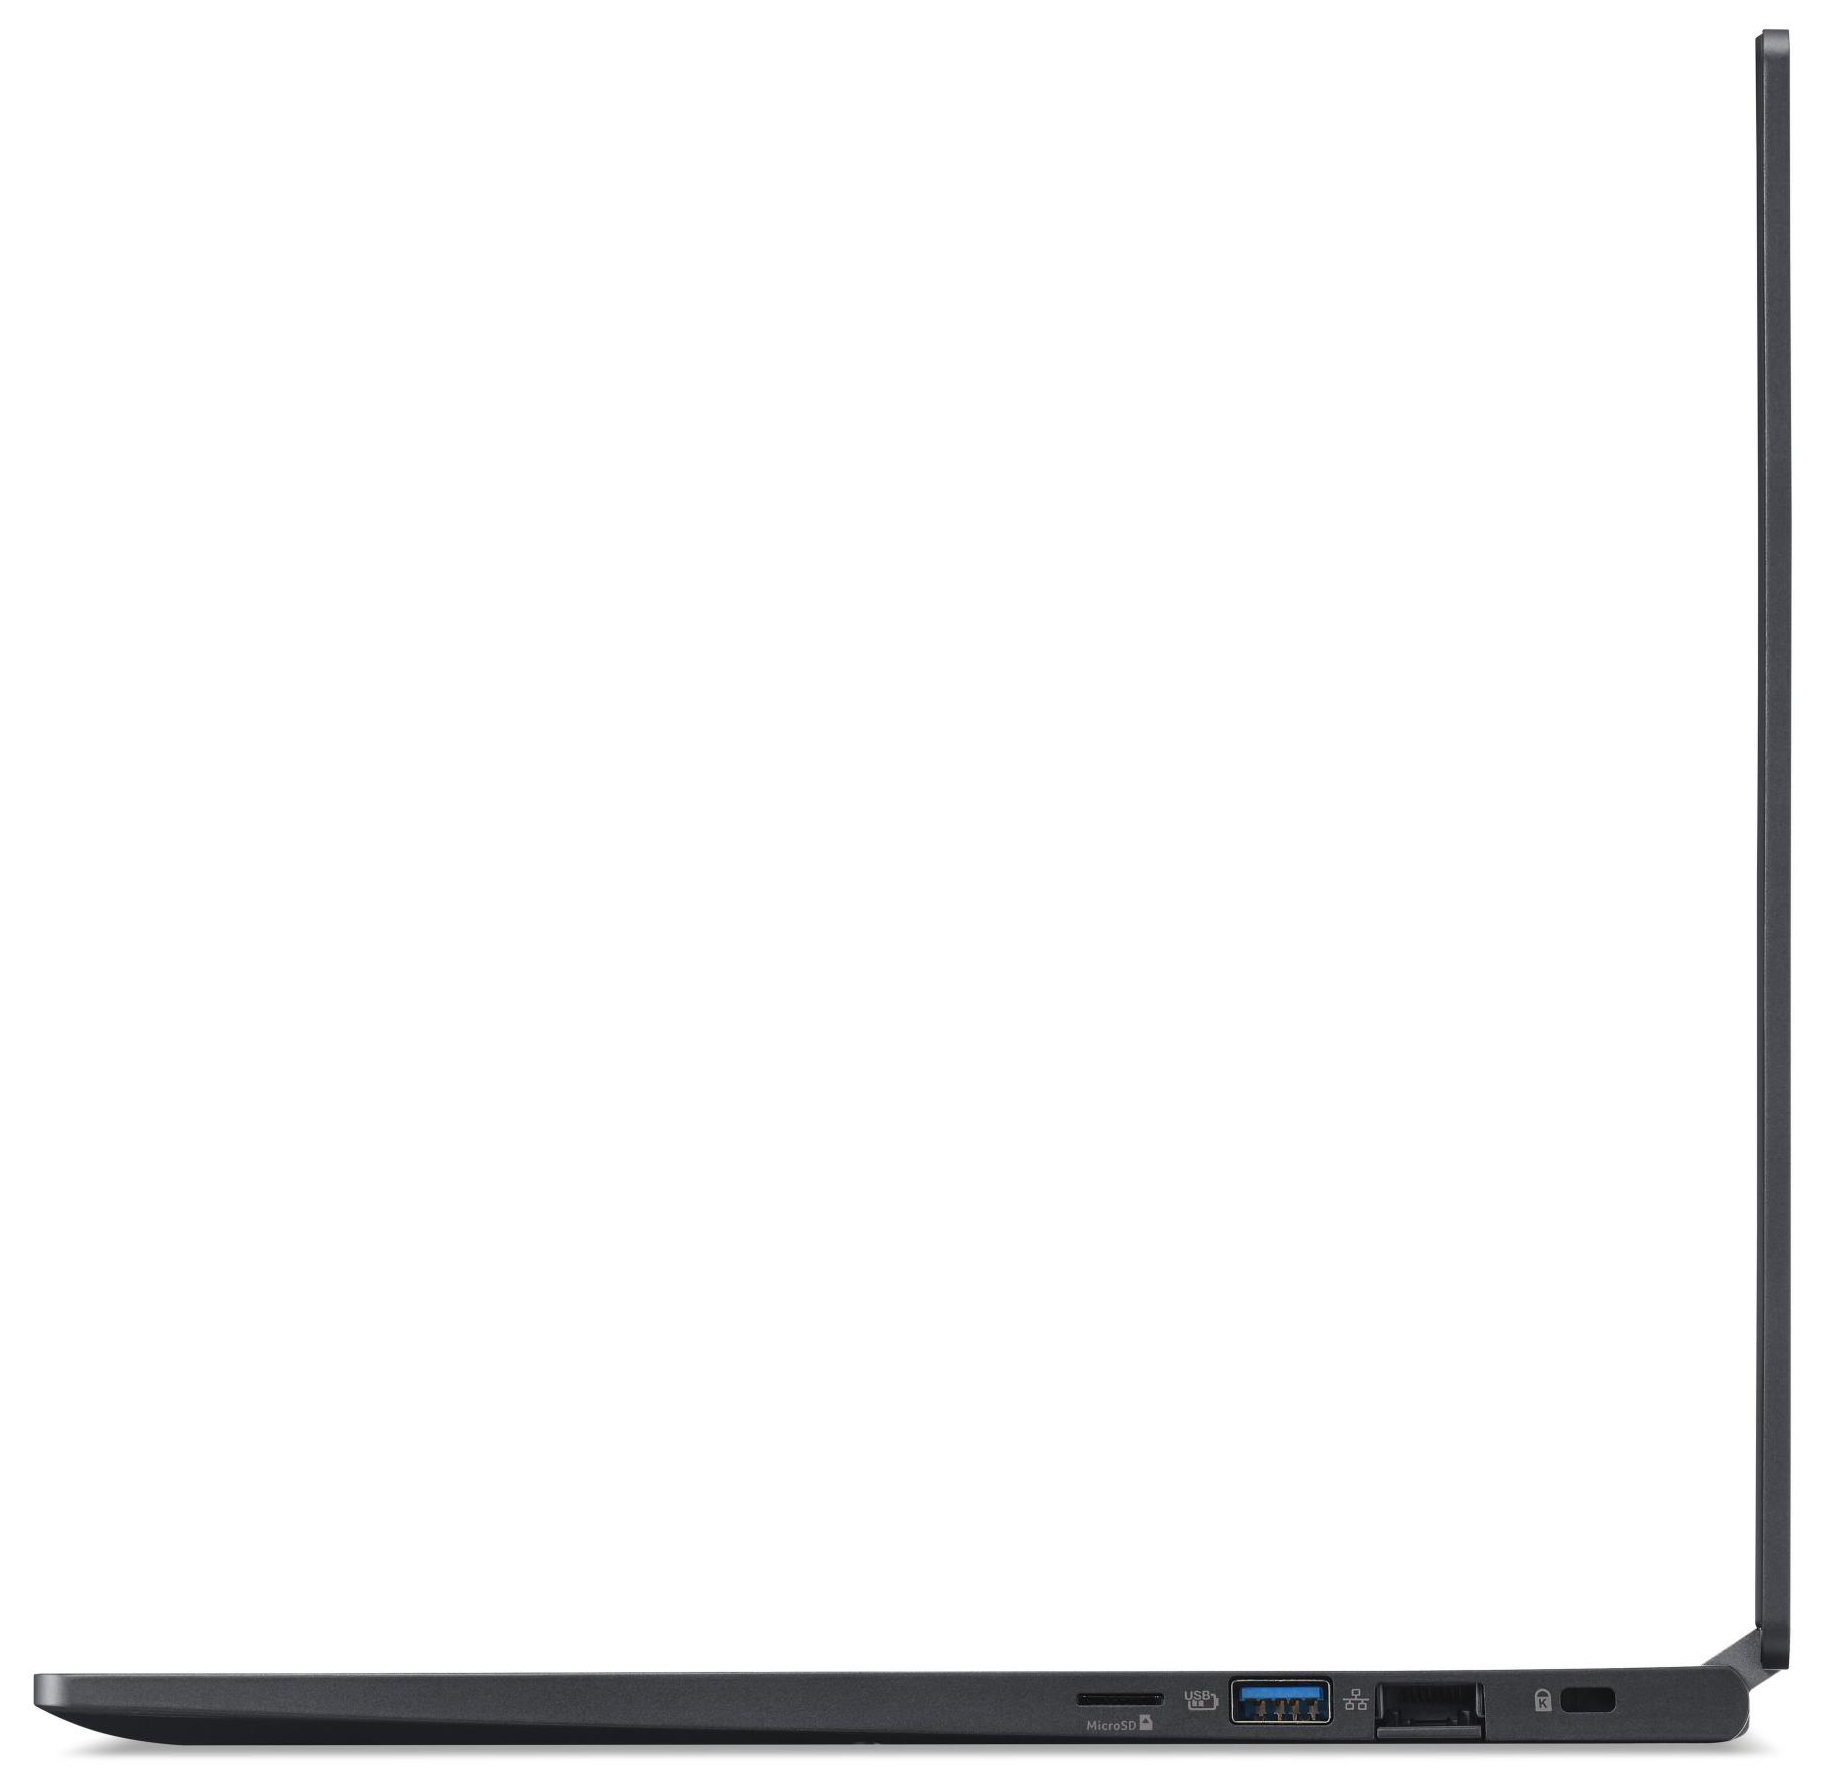
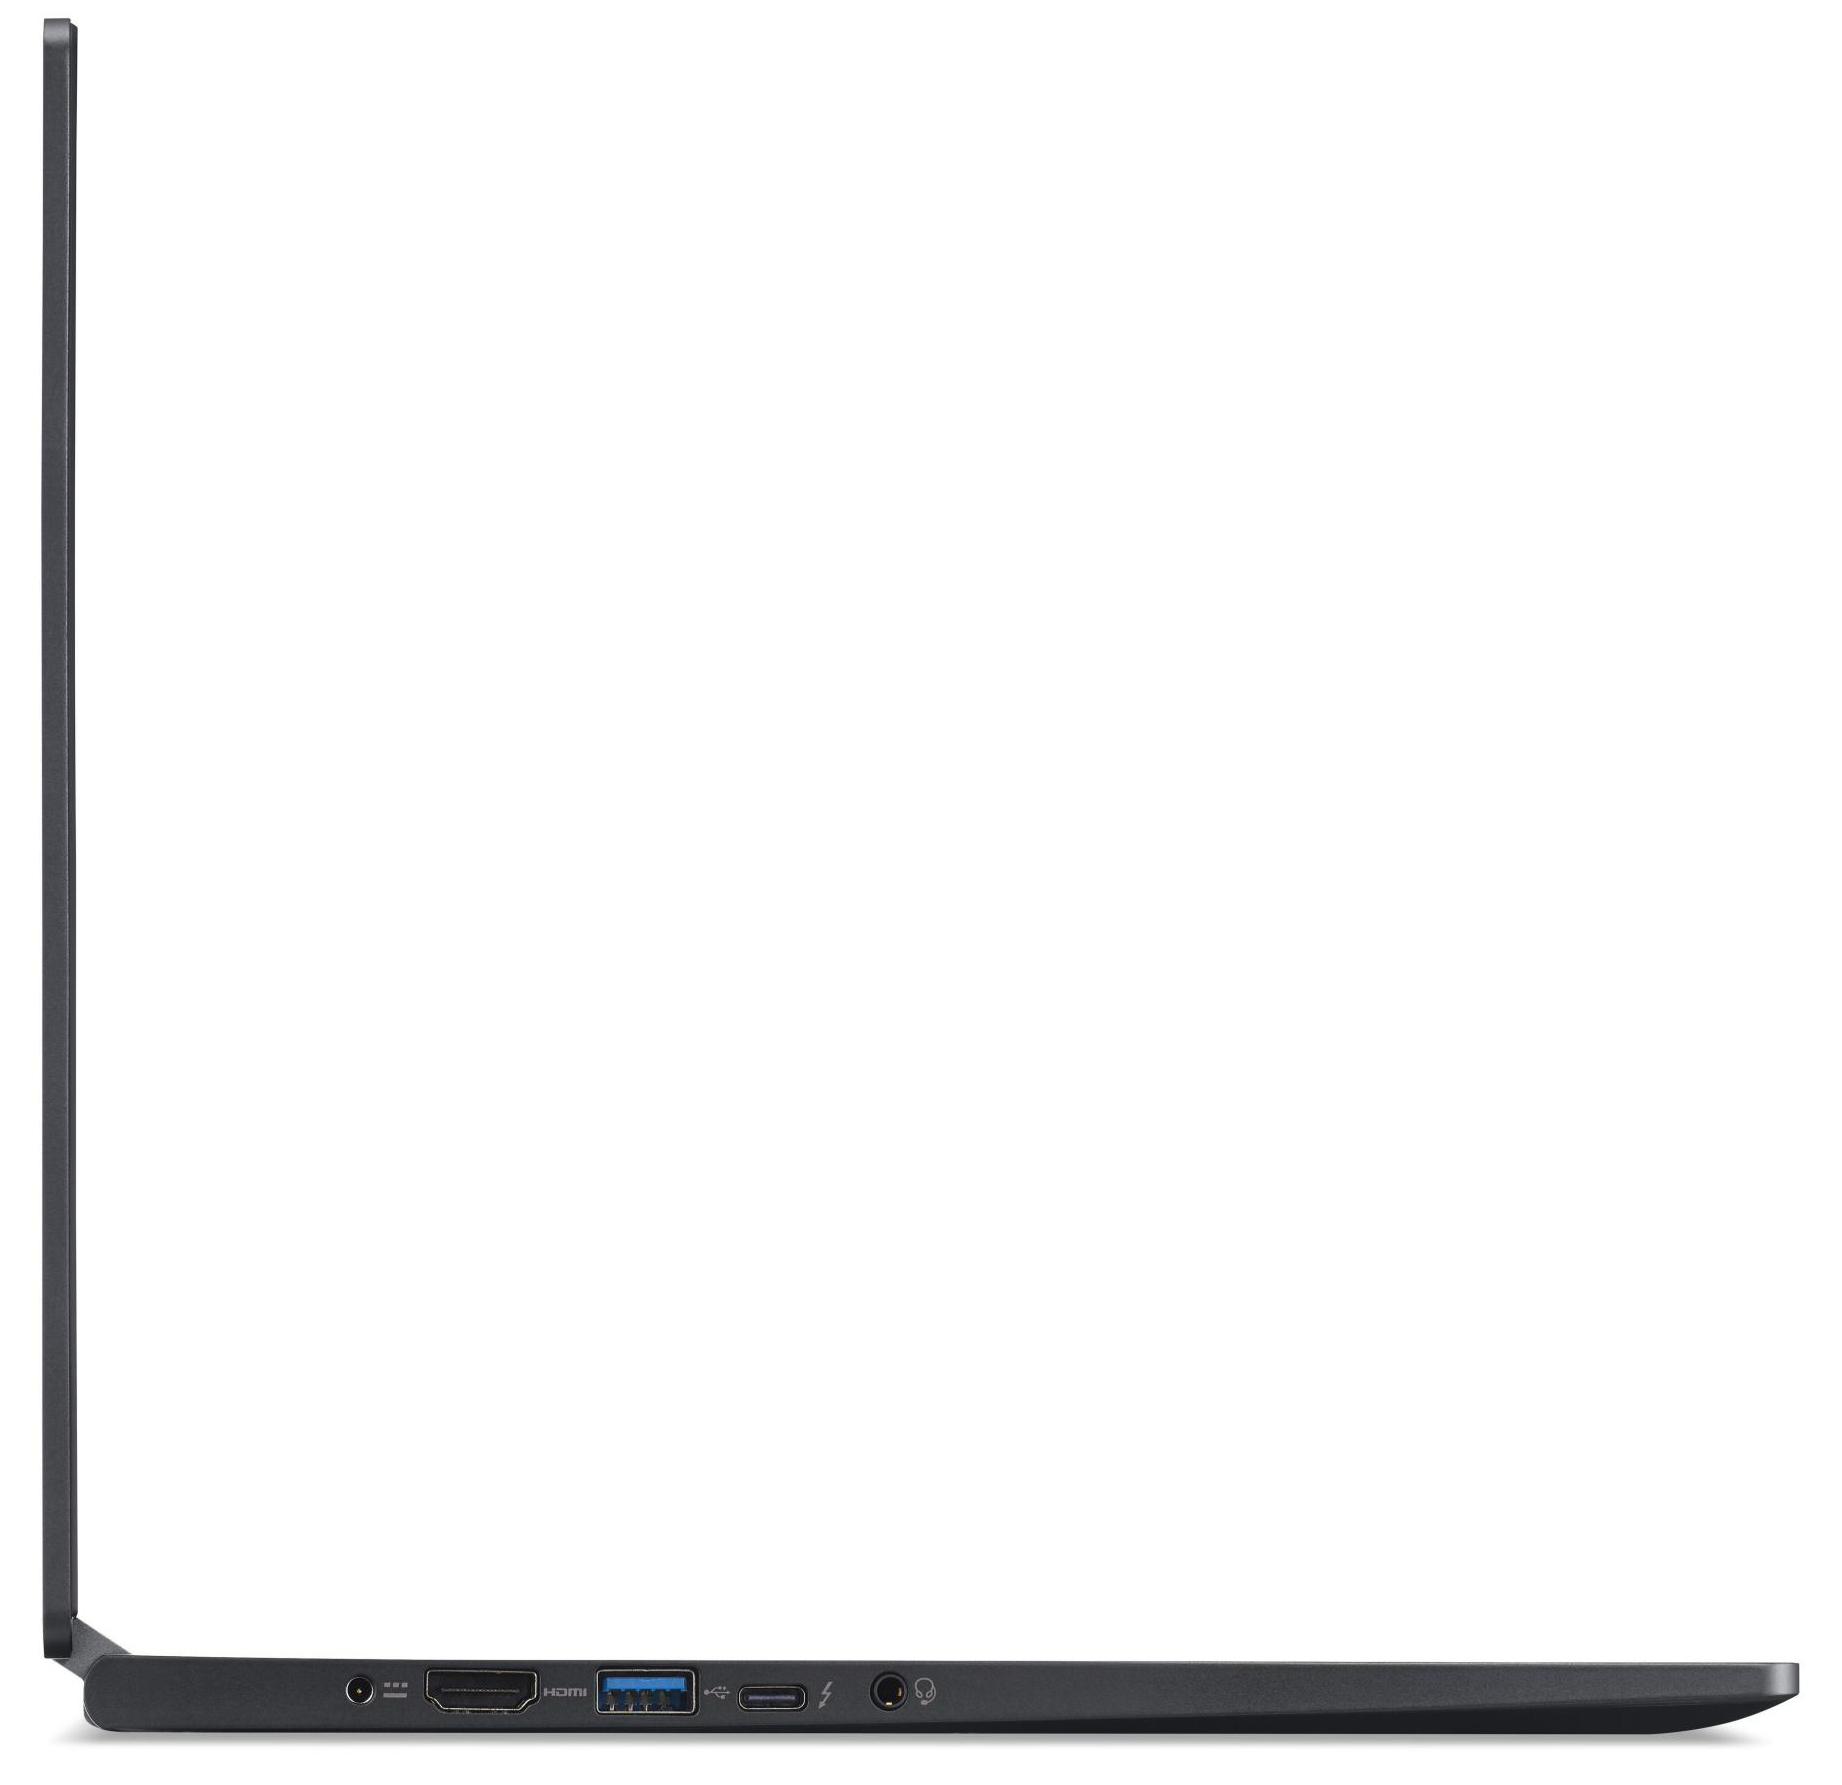
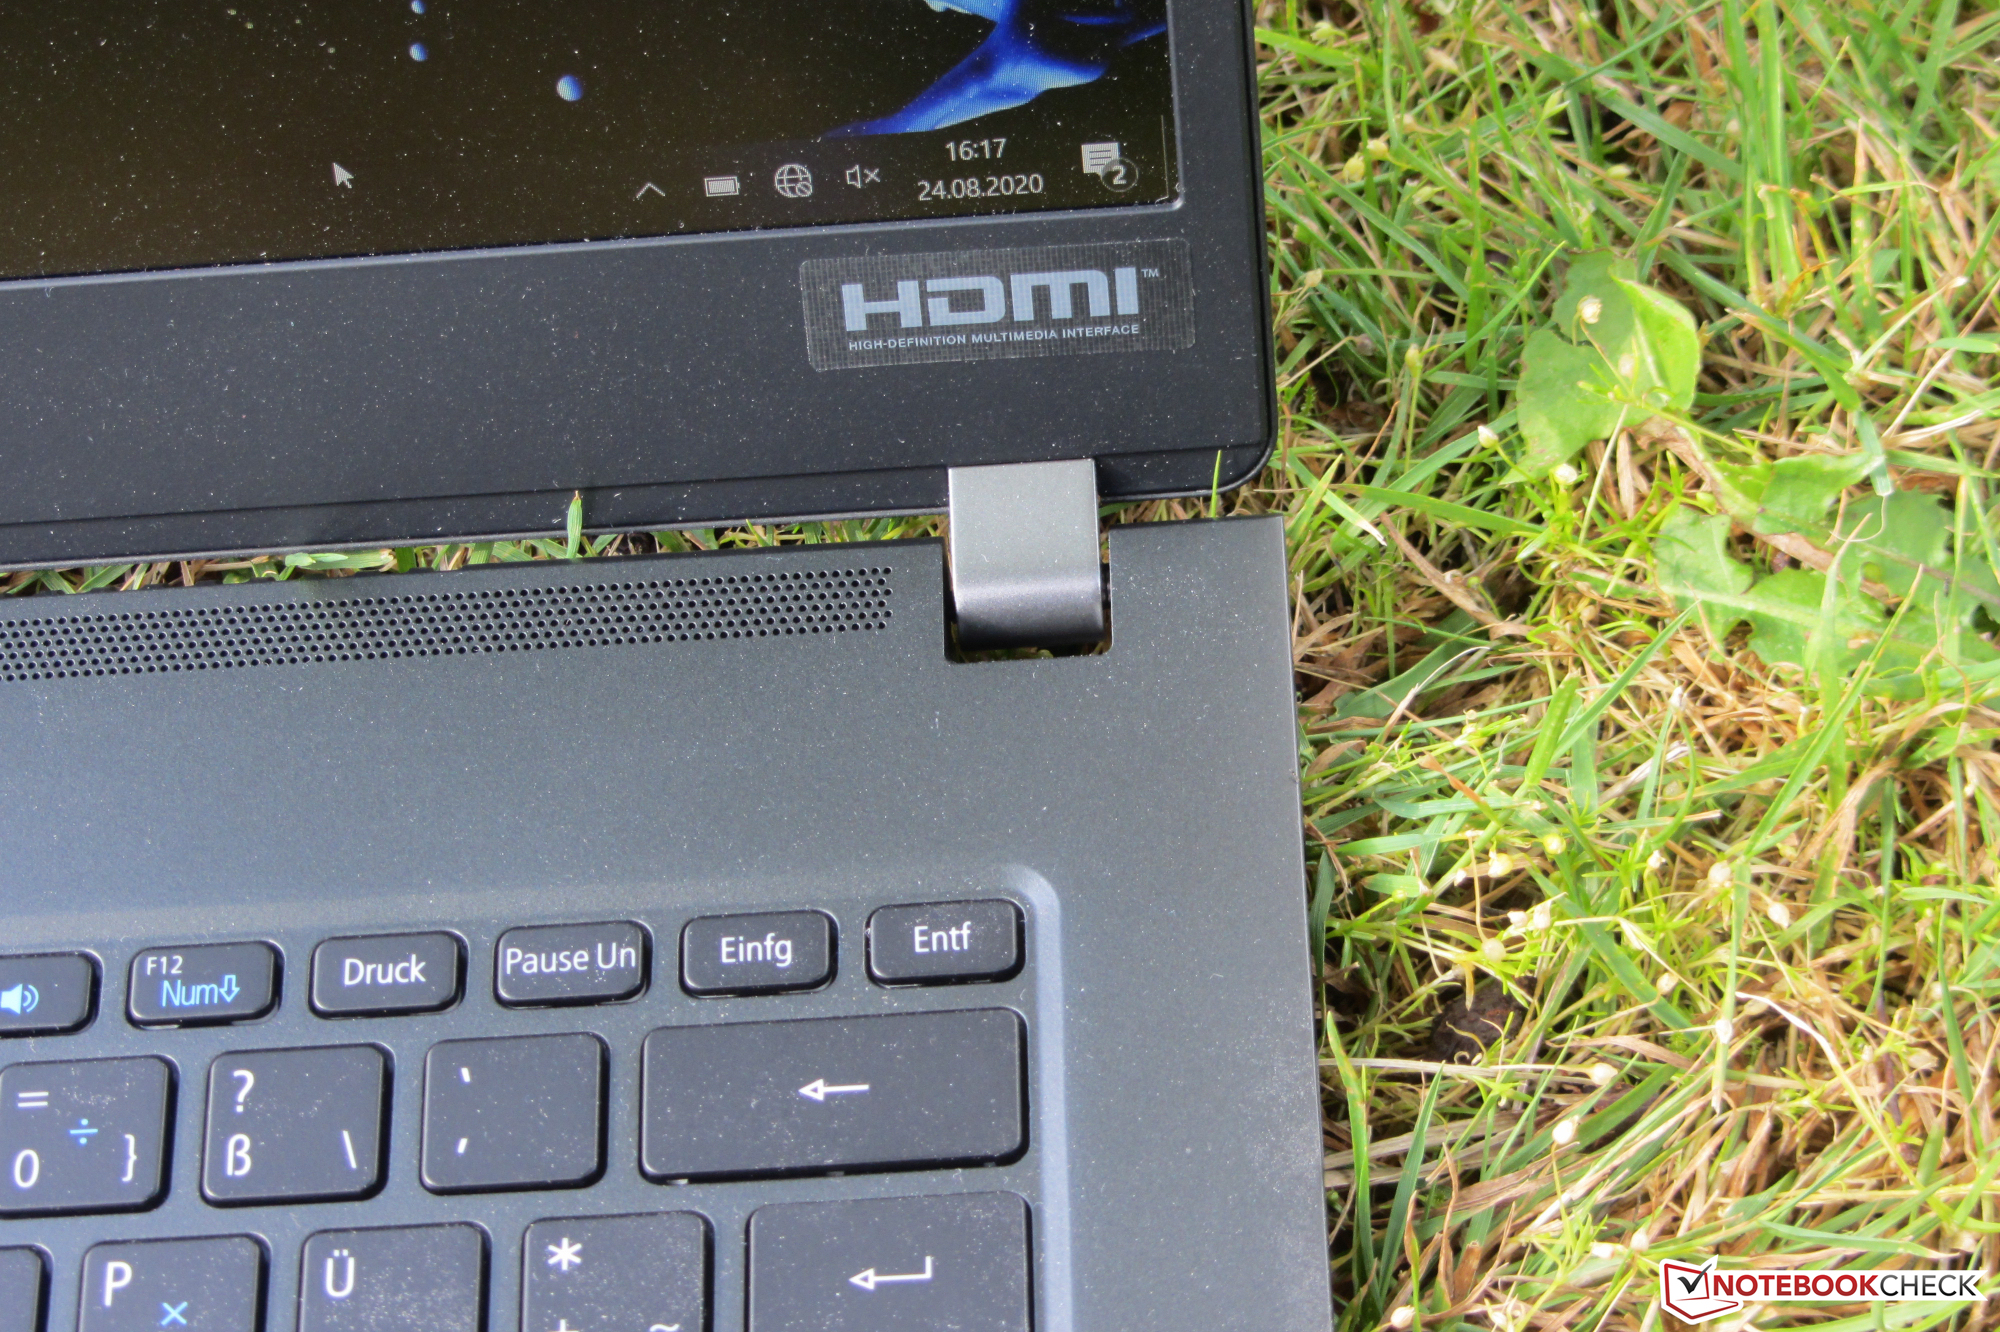
Despite its compact dimensions, the slim laptop offers a well-rounded range of ports. The connections are located in the rear areas of the right and left sides. This keeps the area next to the palm rest free of cables.
The two USB Type-A ports operate according to the USB 3.2 Gen 1 standard. They are joined by a Thunderbolt 3 port that supports Power Delivery and DisplayPort via USB-C. Together with the HDMI output, the TravelMate offers two video outputs. The Thunderbolt 3 port also offers the possibility to connect a docking station or an external GPU.


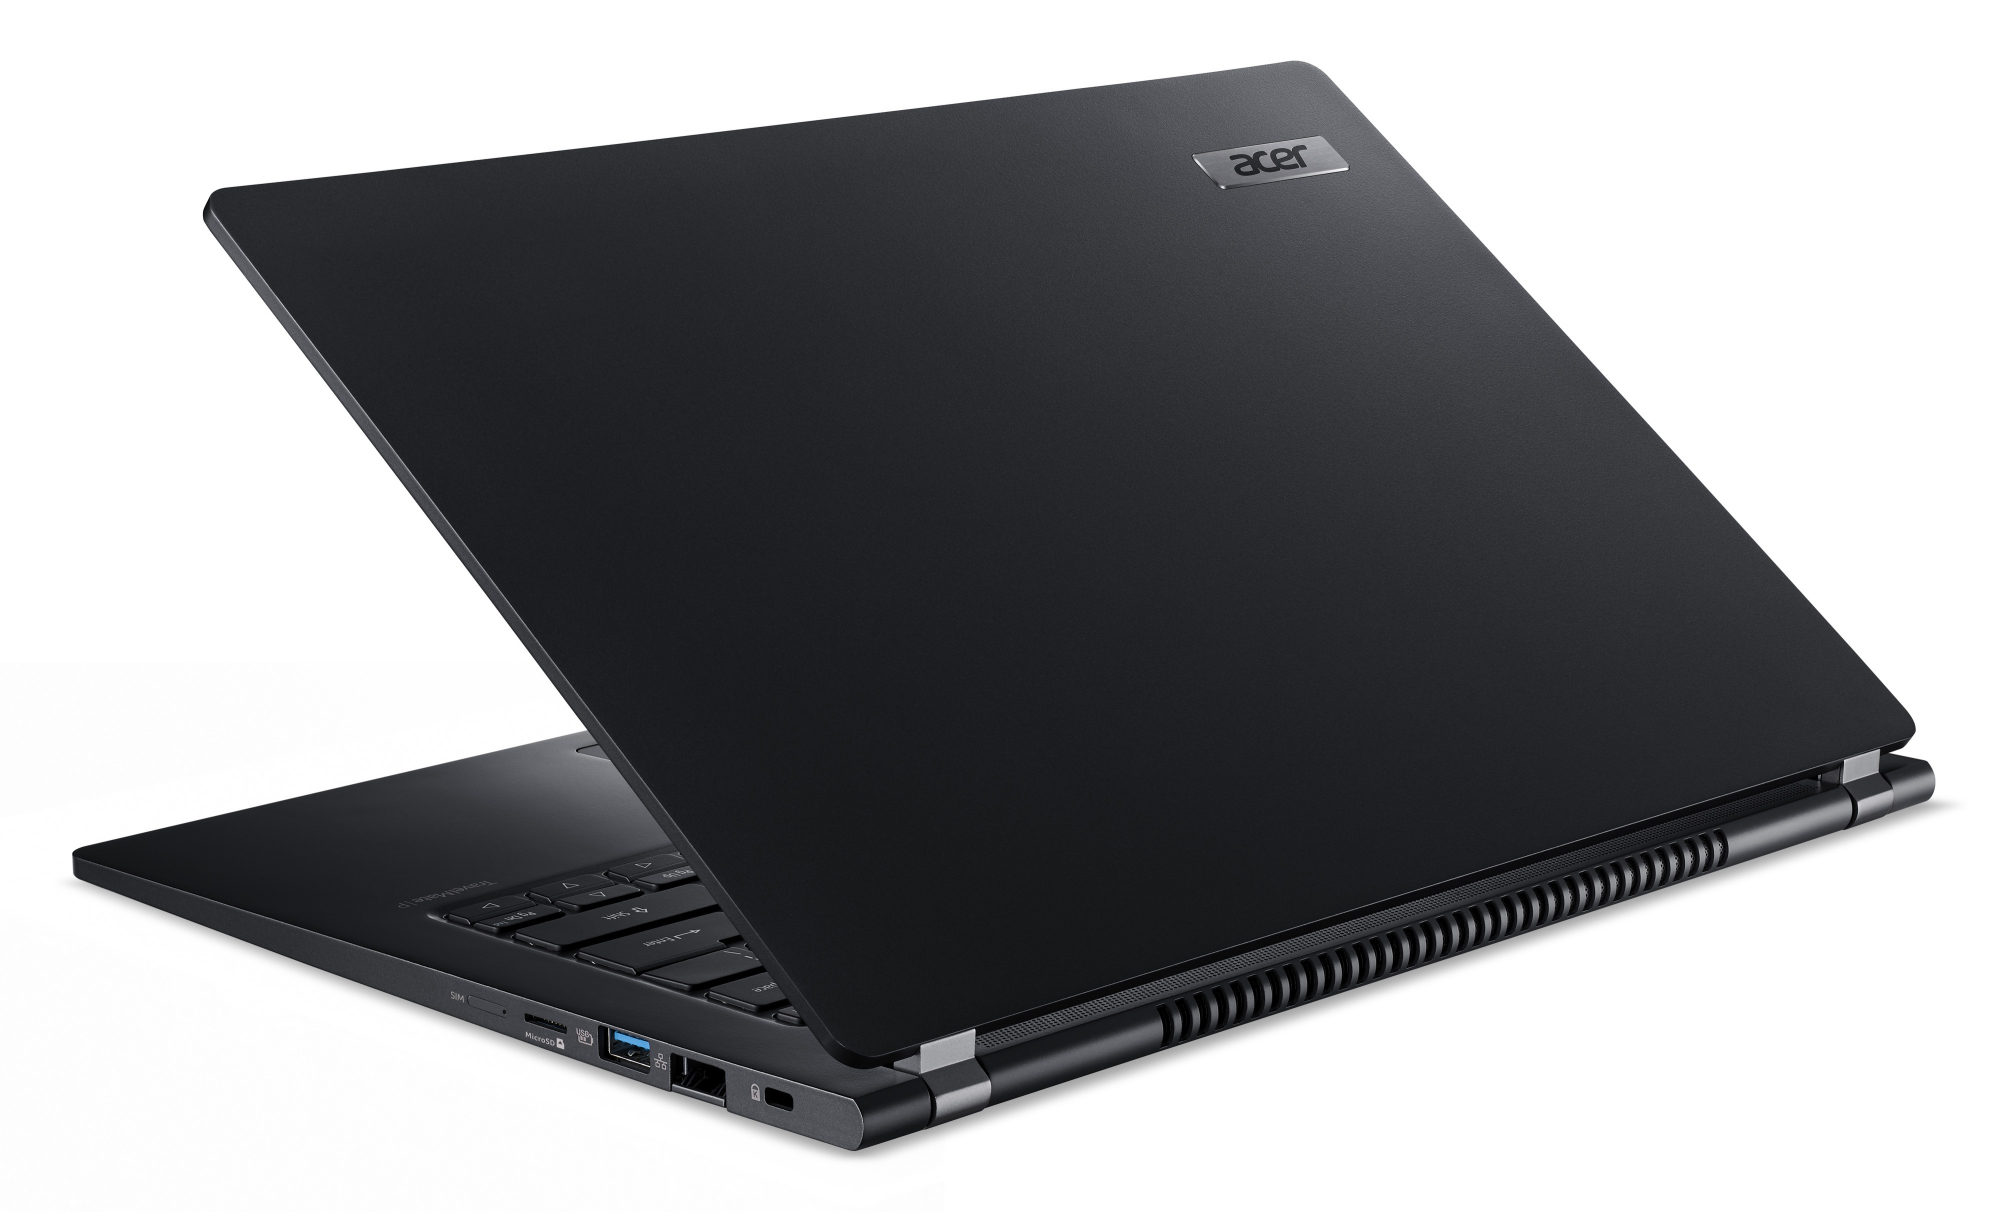
SDCard reader
The MicroSD memory card reader is very slow. When copying large data blocks, a maximum transfer rate of 26.2 MB/s is achieved. The transfer of 250 jpg image files (about 5 MB each) is completed at a speed of 22 MB/s. We test memory card readers using a reference card (the 64 GB Toshiba Exceria Pro M501 microSDXC).
| SD Card Reader | |
| average JPG Copy Test (av. of 3 runs) | |
| Dell Latitude 7410 (Toshiba Exceria Pro M501 64 GB UHS-II) | |
| Lenovo ThinkPad T14s-20UJS00K00 (Toshiba Exceria Pro M501 64 GB UHS-II) | |
| Asus ZenBook 13 UX325JA (Toshiba Exceria Pro M501 microSDXC 64GB) | |
| HP ProBook 445 G7 175W4EA (Toshiba Exceria Pro SDXC 64 GB UHS-II) | |
| Average of class Office (22.4 - 198.5, n=21, last 2 years) | |
| Lenovo ThinkPad T14s-20T00044GE (Toshiba Exceria Pro M501 64 GB UHS-II) | |
| Acer TravelMate P6 P614-51T-G2-72ZU (Toshiba Exceria Pro M501 microSDXC 64GB) | |
| maximum AS SSD Seq Read Test (1GB) | |
| Dell Latitude 7410 (Toshiba Exceria Pro M501 64 GB UHS-II) | |
| HP ProBook 445 G7 175W4EA (Toshiba Exceria Pro SDXC 64 GB UHS-II) | |
| Asus ZenBook 13 UX325JA (Toshiba Exceria Pro M501 microSDXC 64GB) | |
| Lenovo ThinkPad T14s-20UJS00K00 (Toshiba Exceria Pro M501 64 GB UHS-II) | |
| Average of class Office (27.4 - 249, n=20, last 2 years) | |
| Lenovo ThinkPad T14s-20T00044GE (Toshiba Exceria Pro M501 64 GB UHS-II) | |
| Acer TravelMate P6 P614-51T-G2-72ZU (Toshiba Exceria Pro M501 microSDXC 64GB) | |
Communication
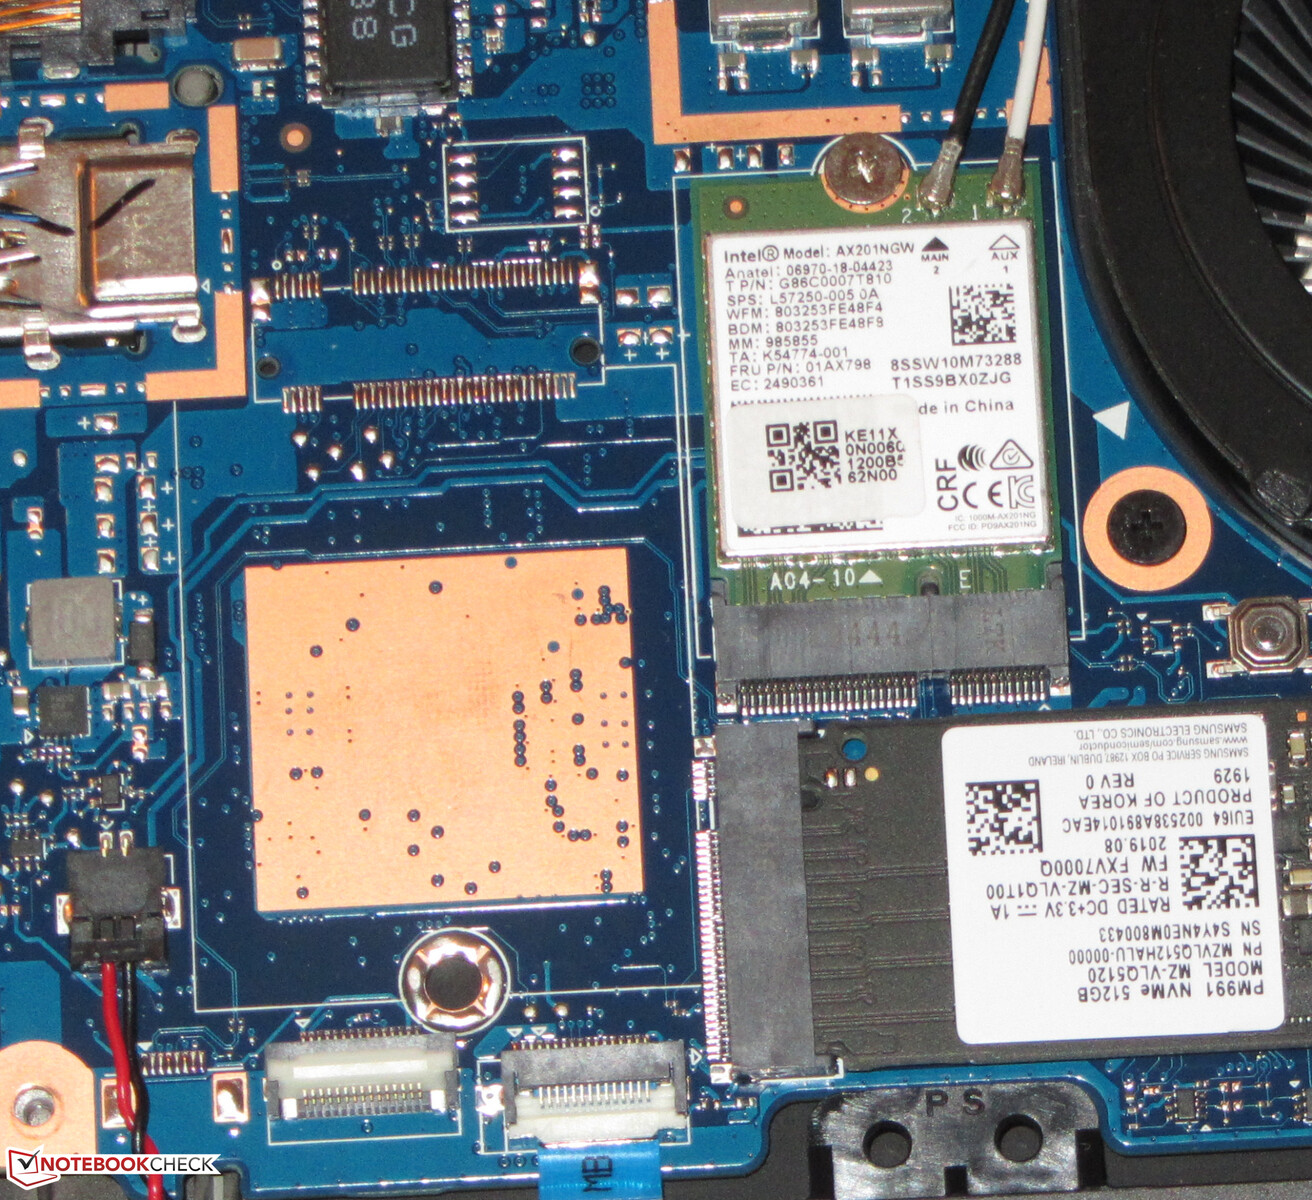
The WLAN module uses a chip from Intel (Wi-Fi 6 AX201) that supports the 802.11a/b/g/h/n/ac/ax WLAN standards. The transmission speeds determined under optimal conditions (no other WLAN devices nearby, short distance between laptop and server PC) are outstanding. Wired network connections are handled by Intel's I219-LM Gigabit Ethernet chip.
Our test device doesn't offer an LTE modem, and none can be retrofitted either. However, there are TravelMate P6 models available that have an LTE modem on board.
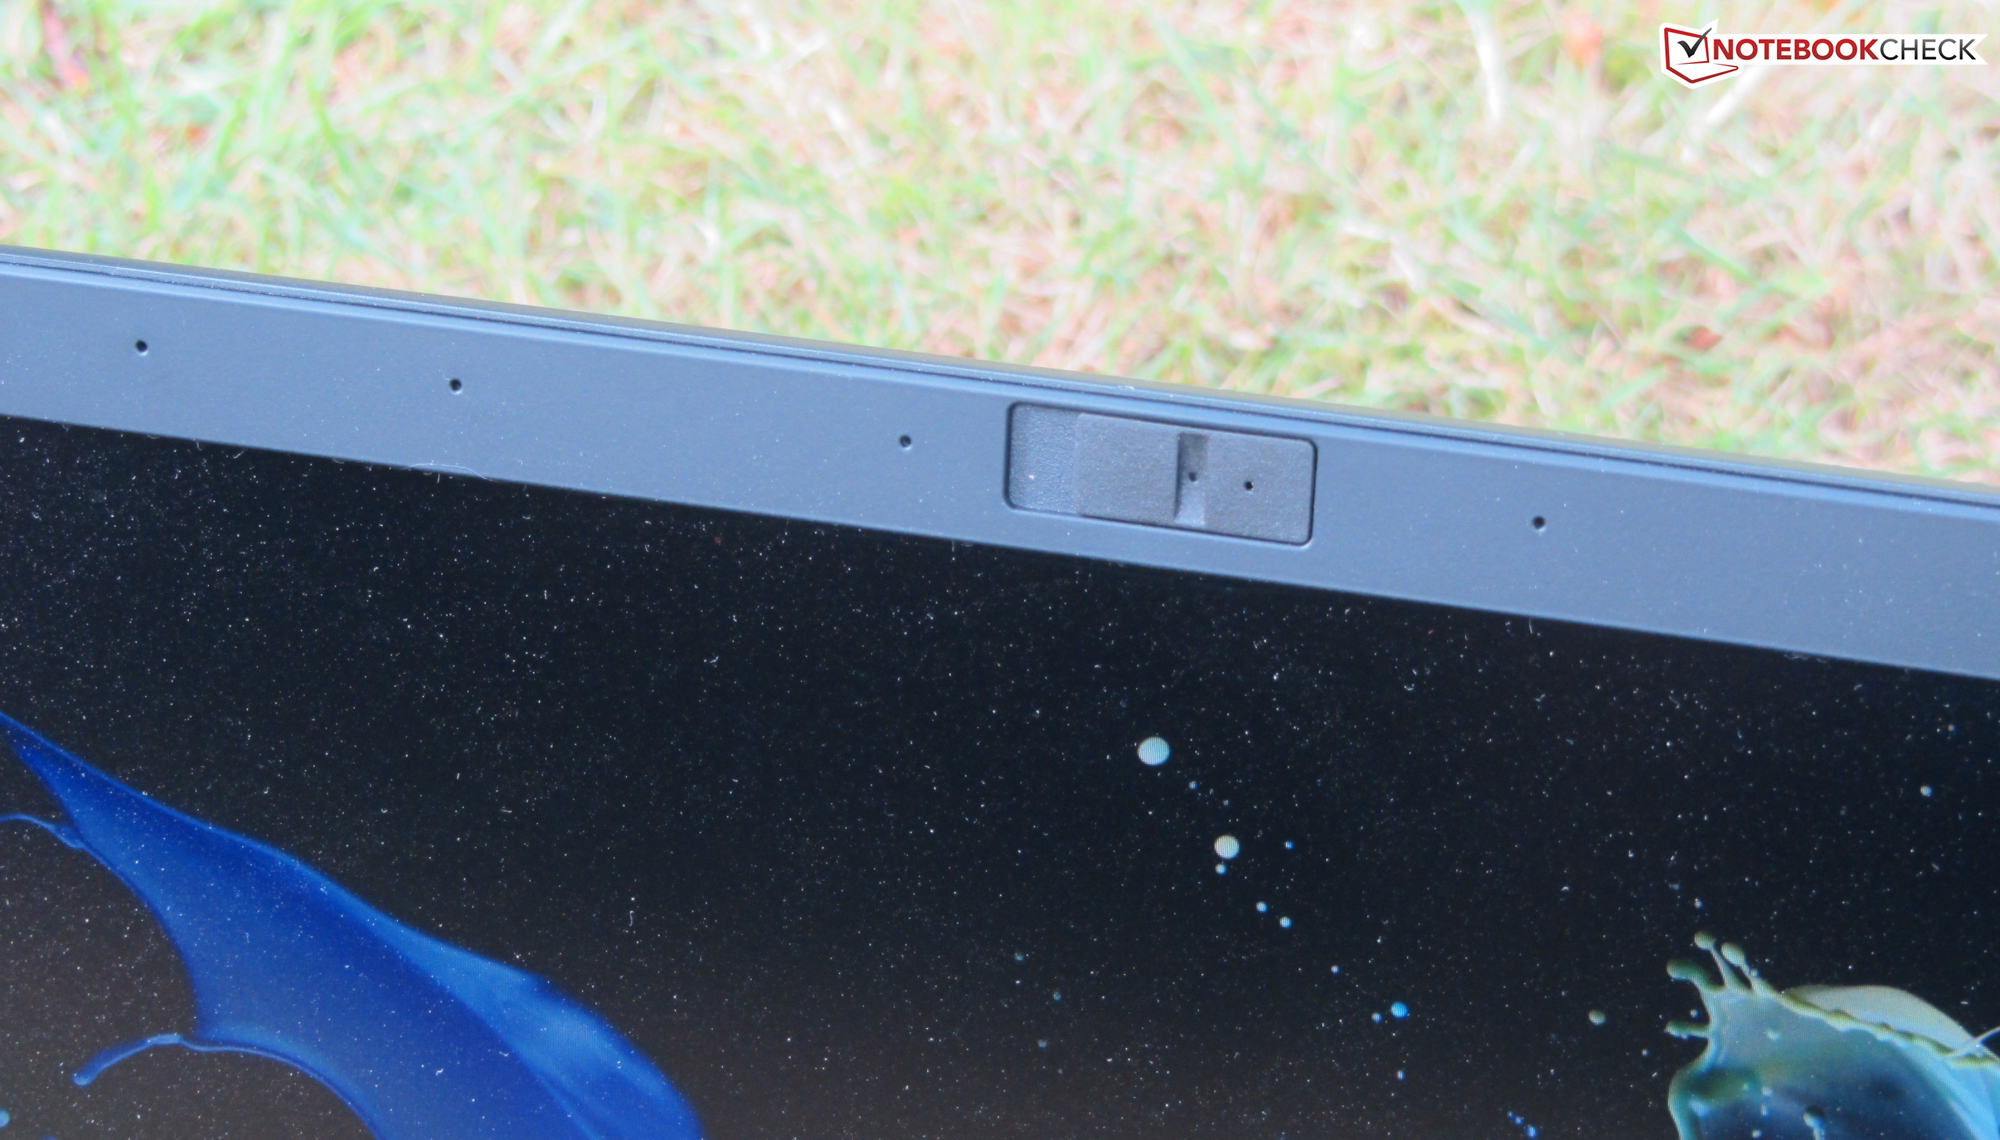
Webcam
The built-in webcam (0.9 MP) produces images with a maximum resolution of 1280x720 pixels. Moreover, there are issues in terms of color accuracy. With a Delta E 2000 color deviation of almost 17, the target (Delta E less than 3) is clearly missed.


, i5-1038NG7, Apple SSD SM0512F")
, i5-1038NG7, Apple SSD SM0512F")


, i7-1065G7, Intel SSD 660p 1TB SSDPEKNW010T8")
, i7-1065G7, Intel SSD 660p 1TB SSDPEKNW010T8")


Security
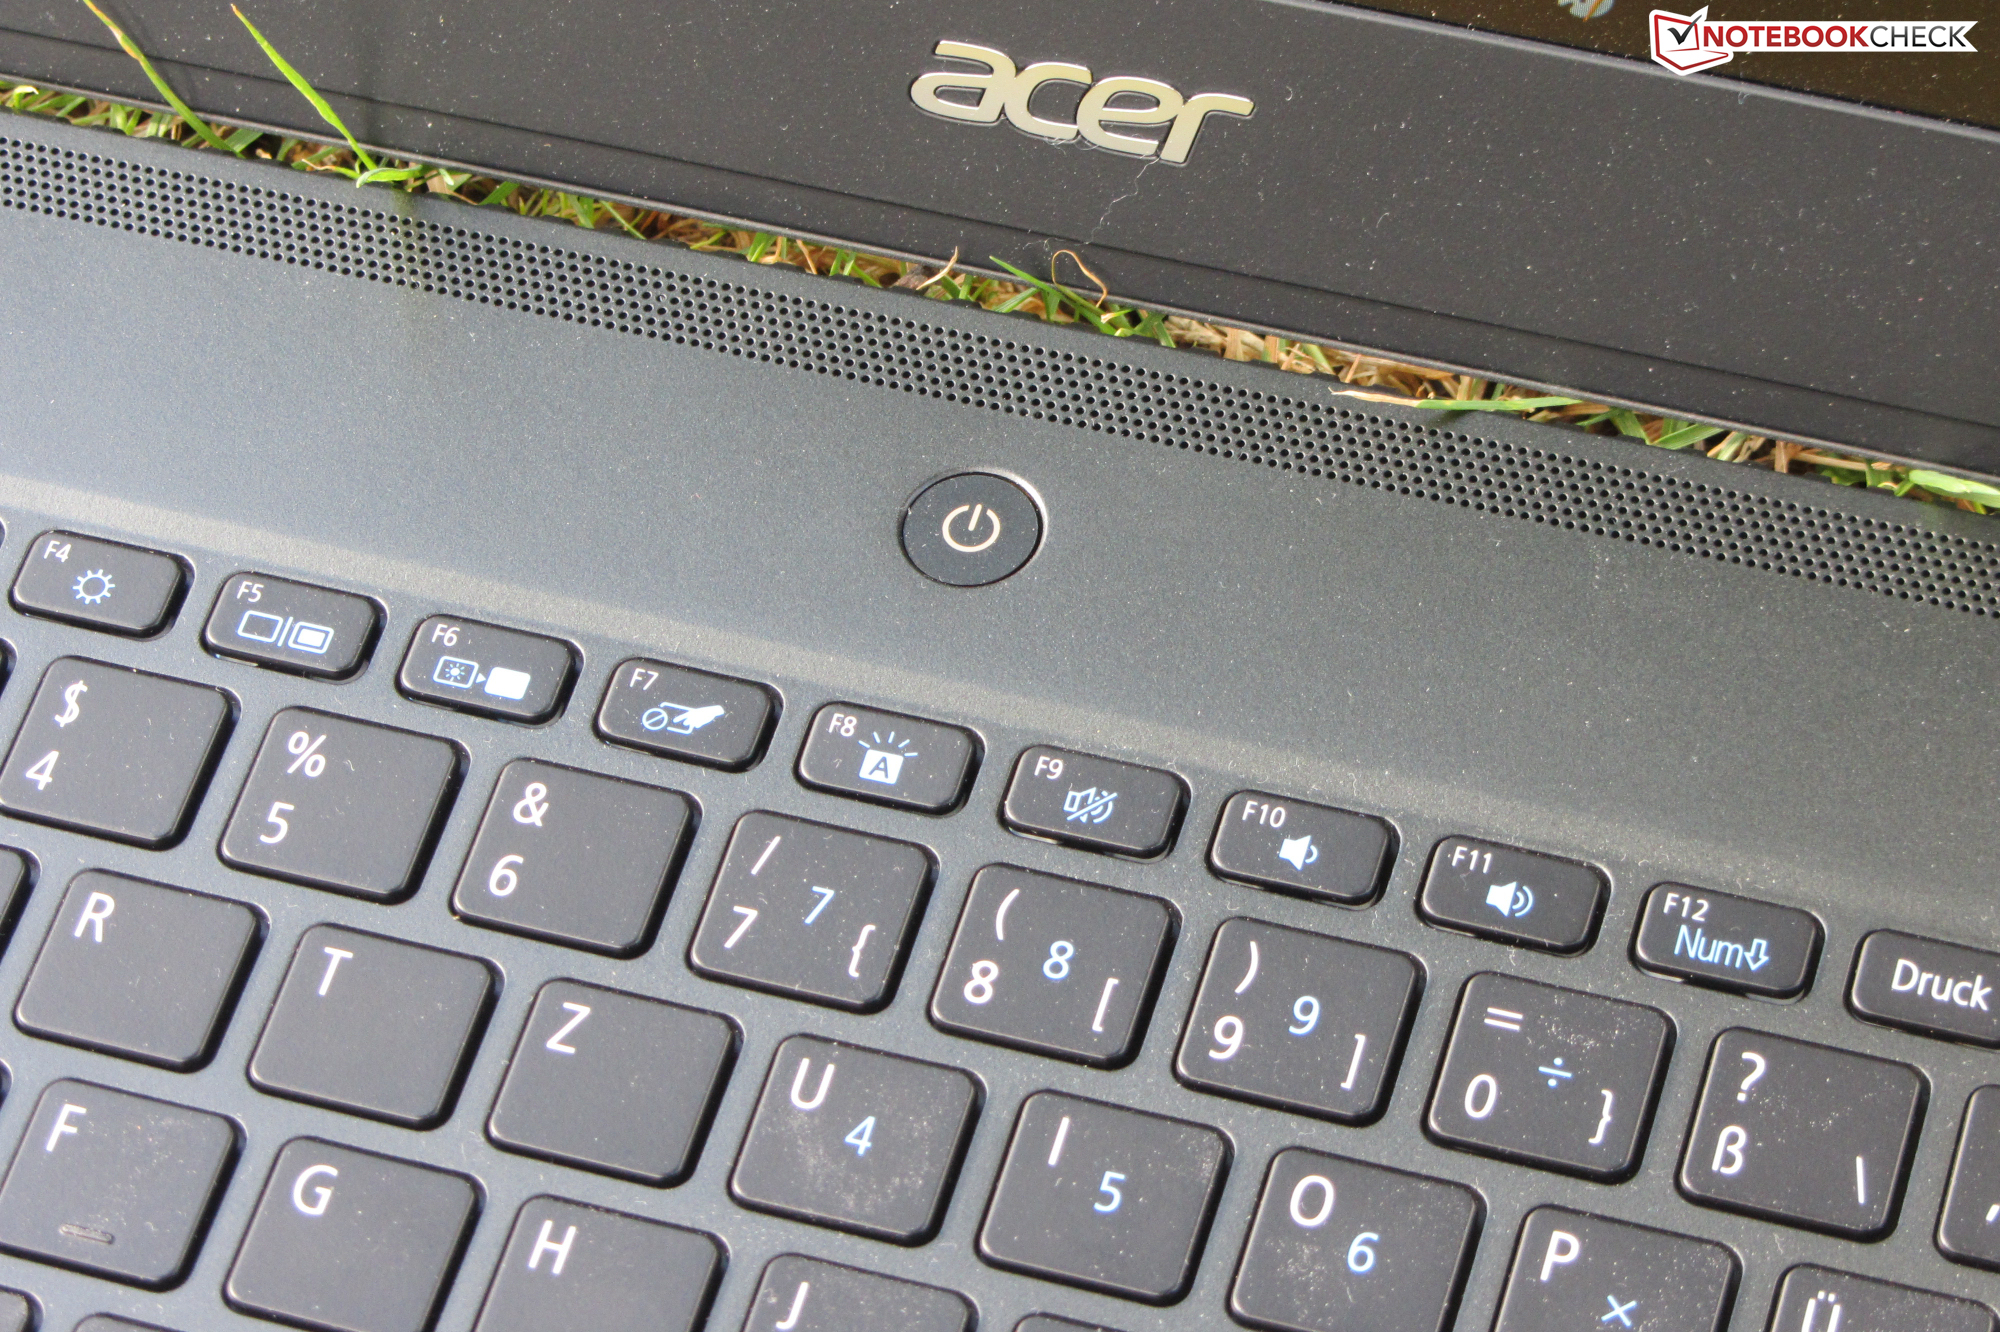
The laptop comes with some security features. It offers a Trusted Platform Module (2.0), a fingerprint scanner (integrated into the power button), and a smart card reader. The latter is an optional feature. In terms of software, the device comes with Acer's ProShield security software. In addition, the webcam is equipped with a shutter.
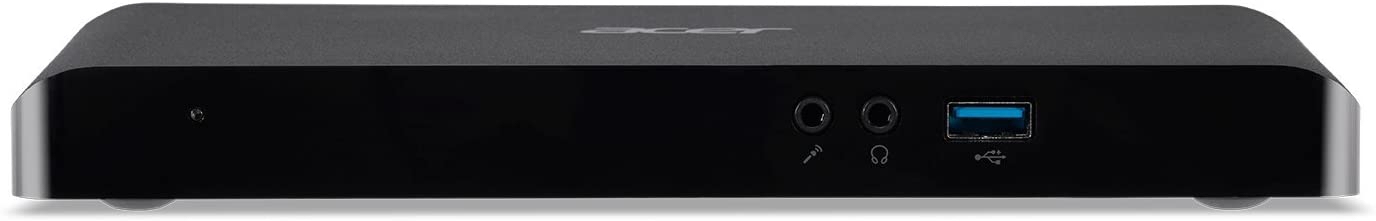
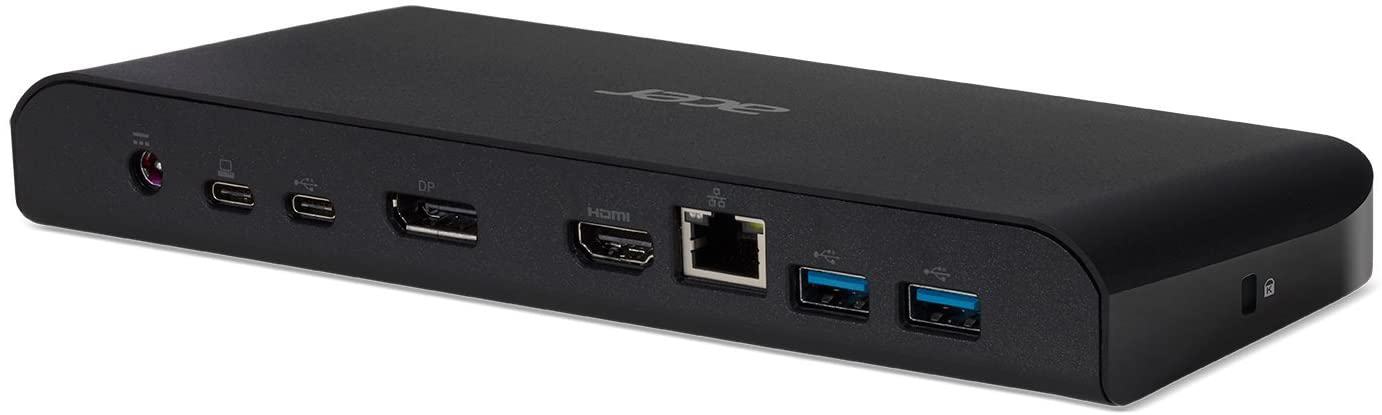
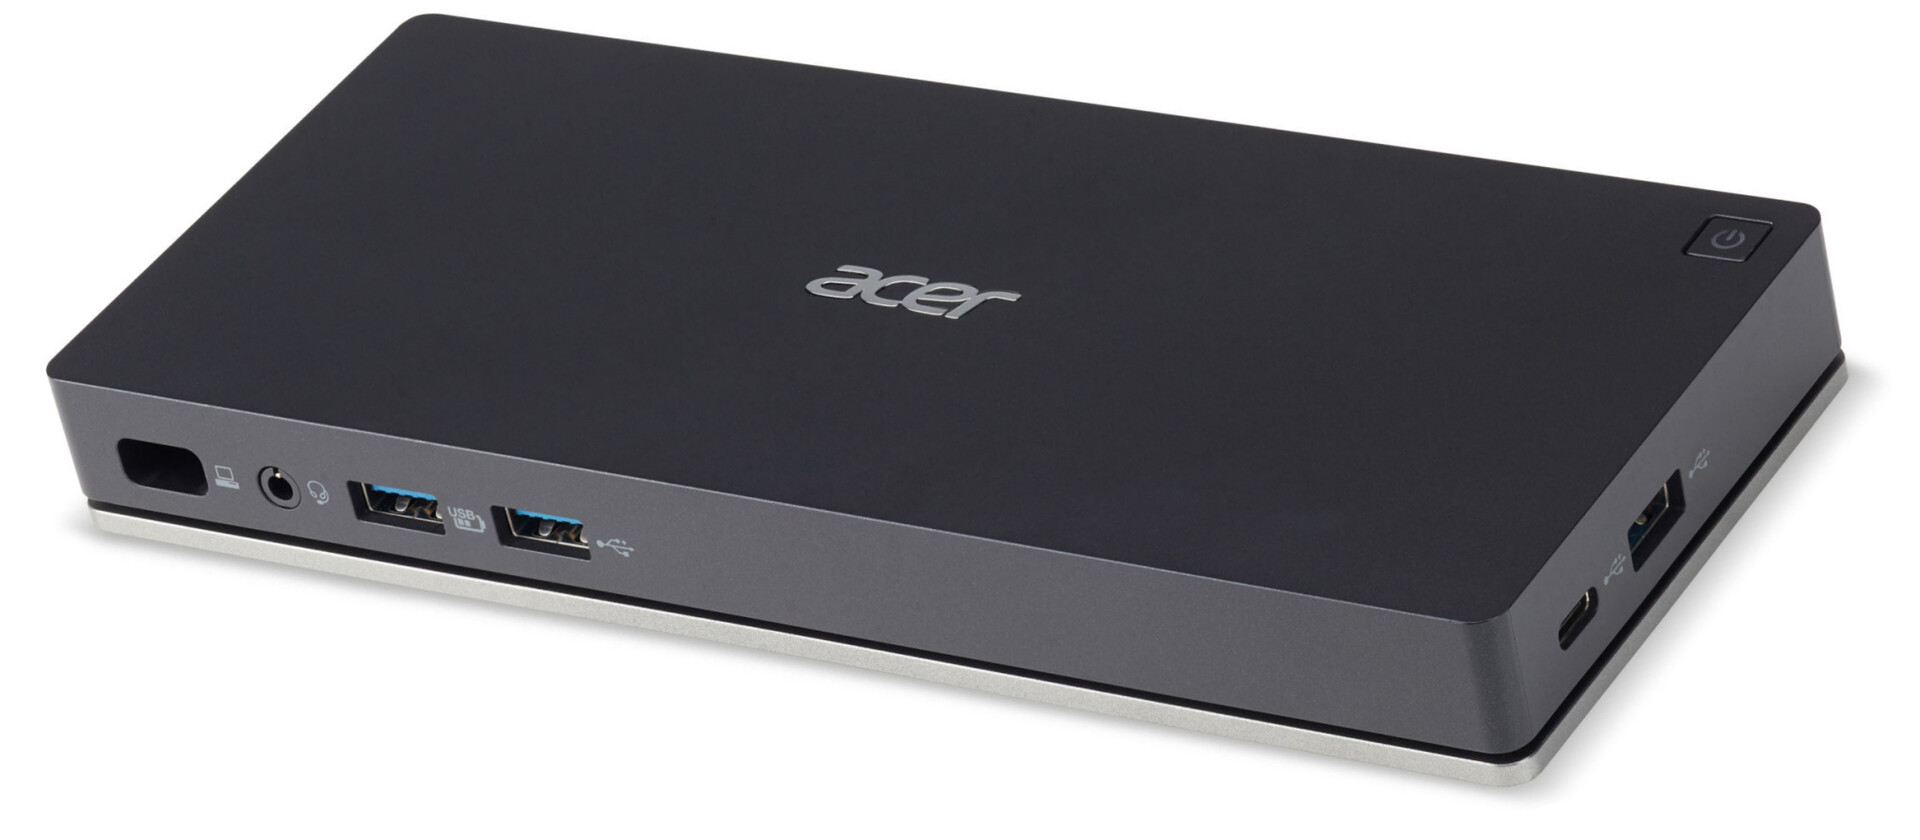
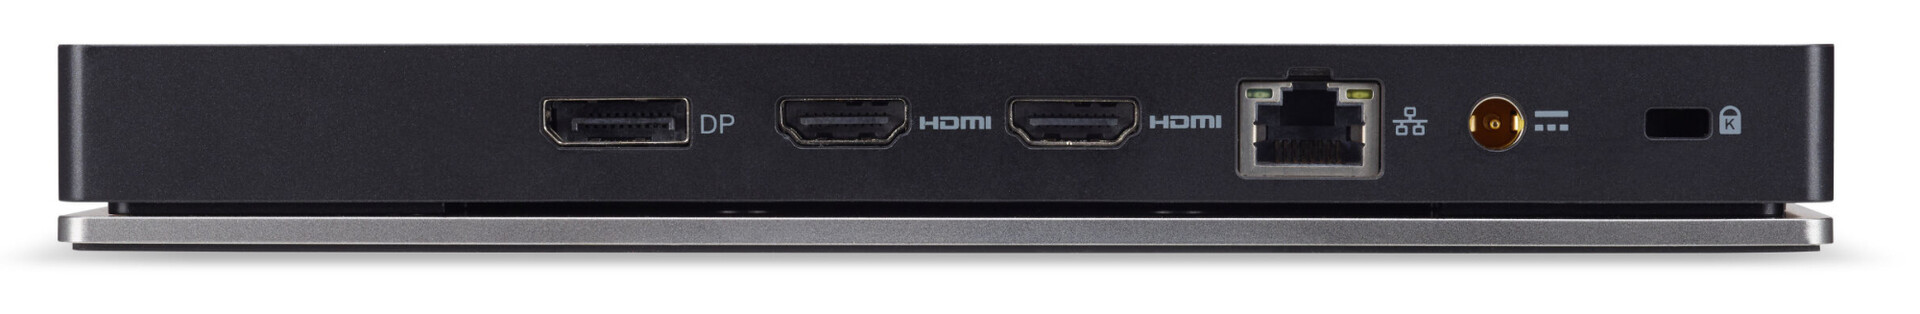
Accessories
The TravelMate comes with the usual accessories: A quick-start guide and warranty information. However, Acer has a lot of optional accessories available. The most interesting should be the USB Type-C Dock (NP.DCK11.01D; about 150 Euros (~$179)) and the USB Type-C Dock II (NP.DCK11.01N; about 200 Euros (~$238)). Both extend the TravelMate's range of connections considerably.
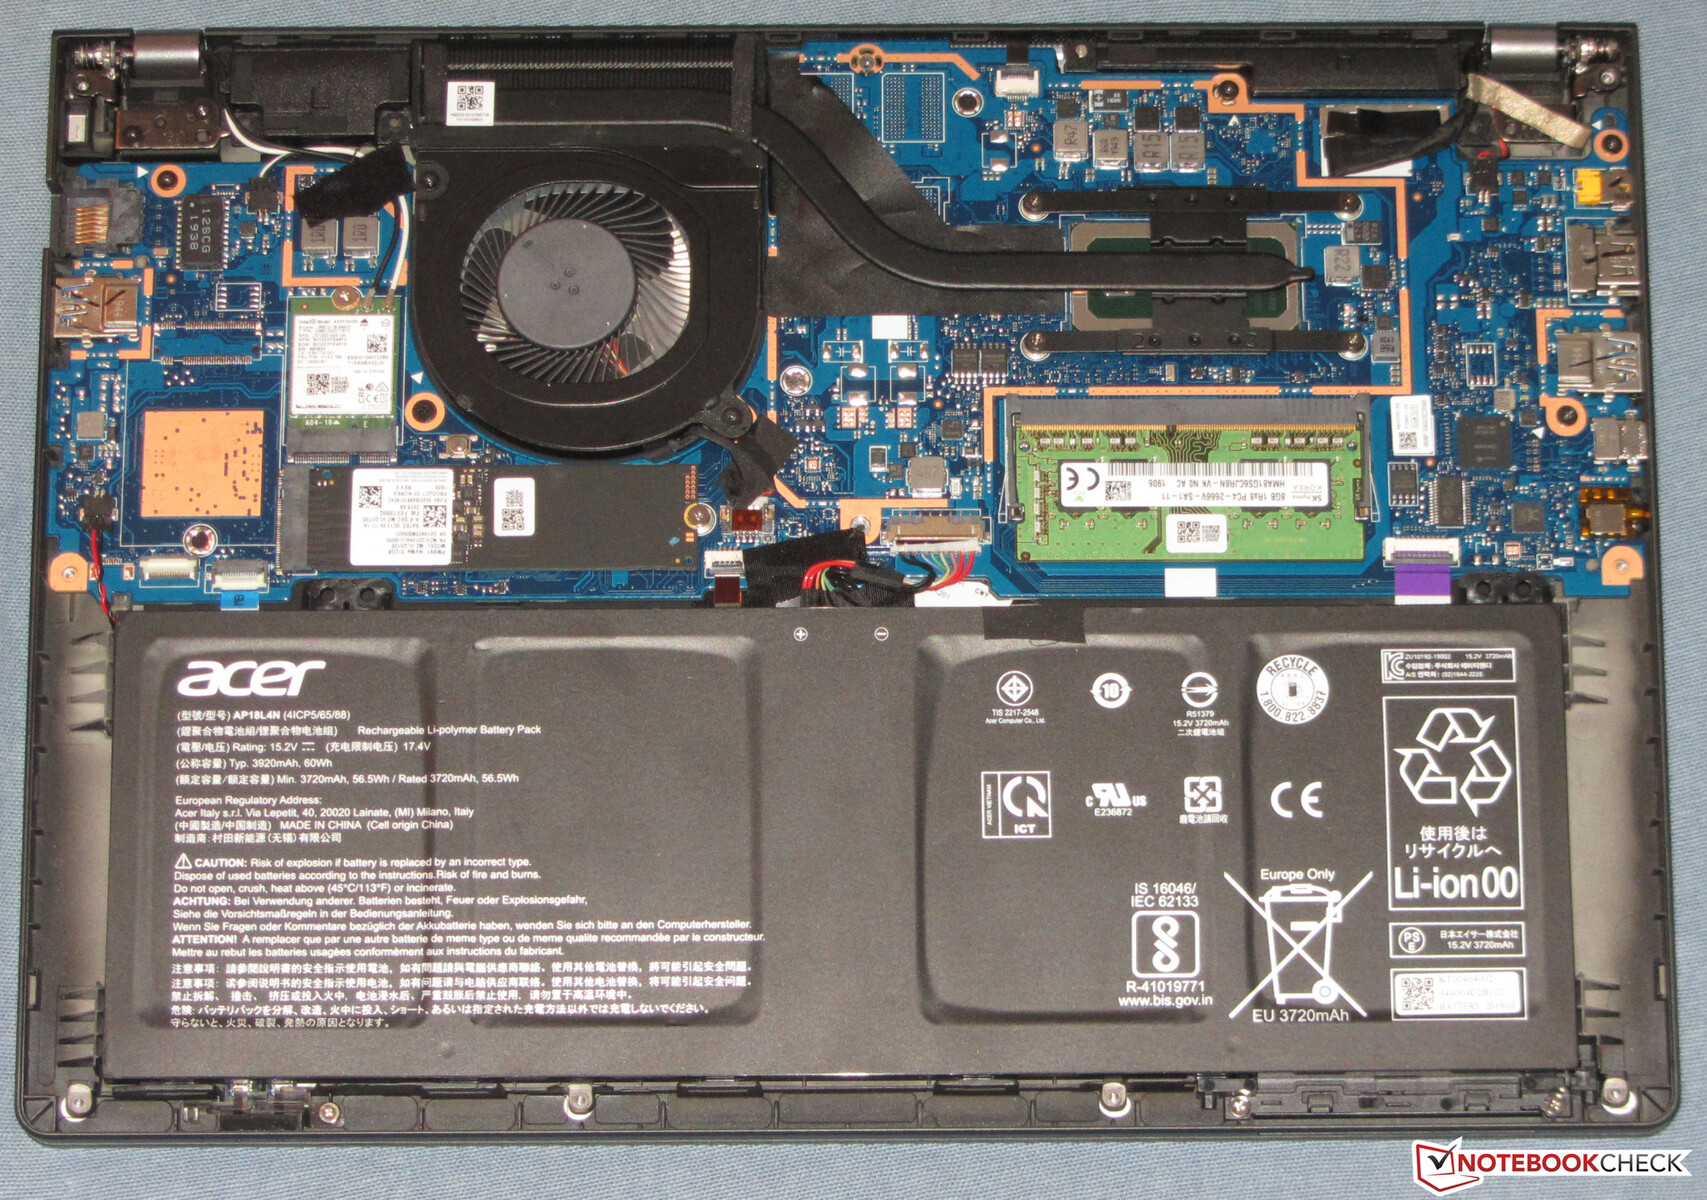
Maintenance
Maintenance and upgrade procedures require detaching the bottom cover - no complicated undertaking. After removing all the screws on the underside of the device, the bottom cover can be lifted with the aid of a grout finishing tool. It doesn't sit excessively tight in its place.
Warranty
Acer grants the TravelMate a three-year warranty (submission/return). A three-year on-site warranty costs about 150 Euros (~$179).
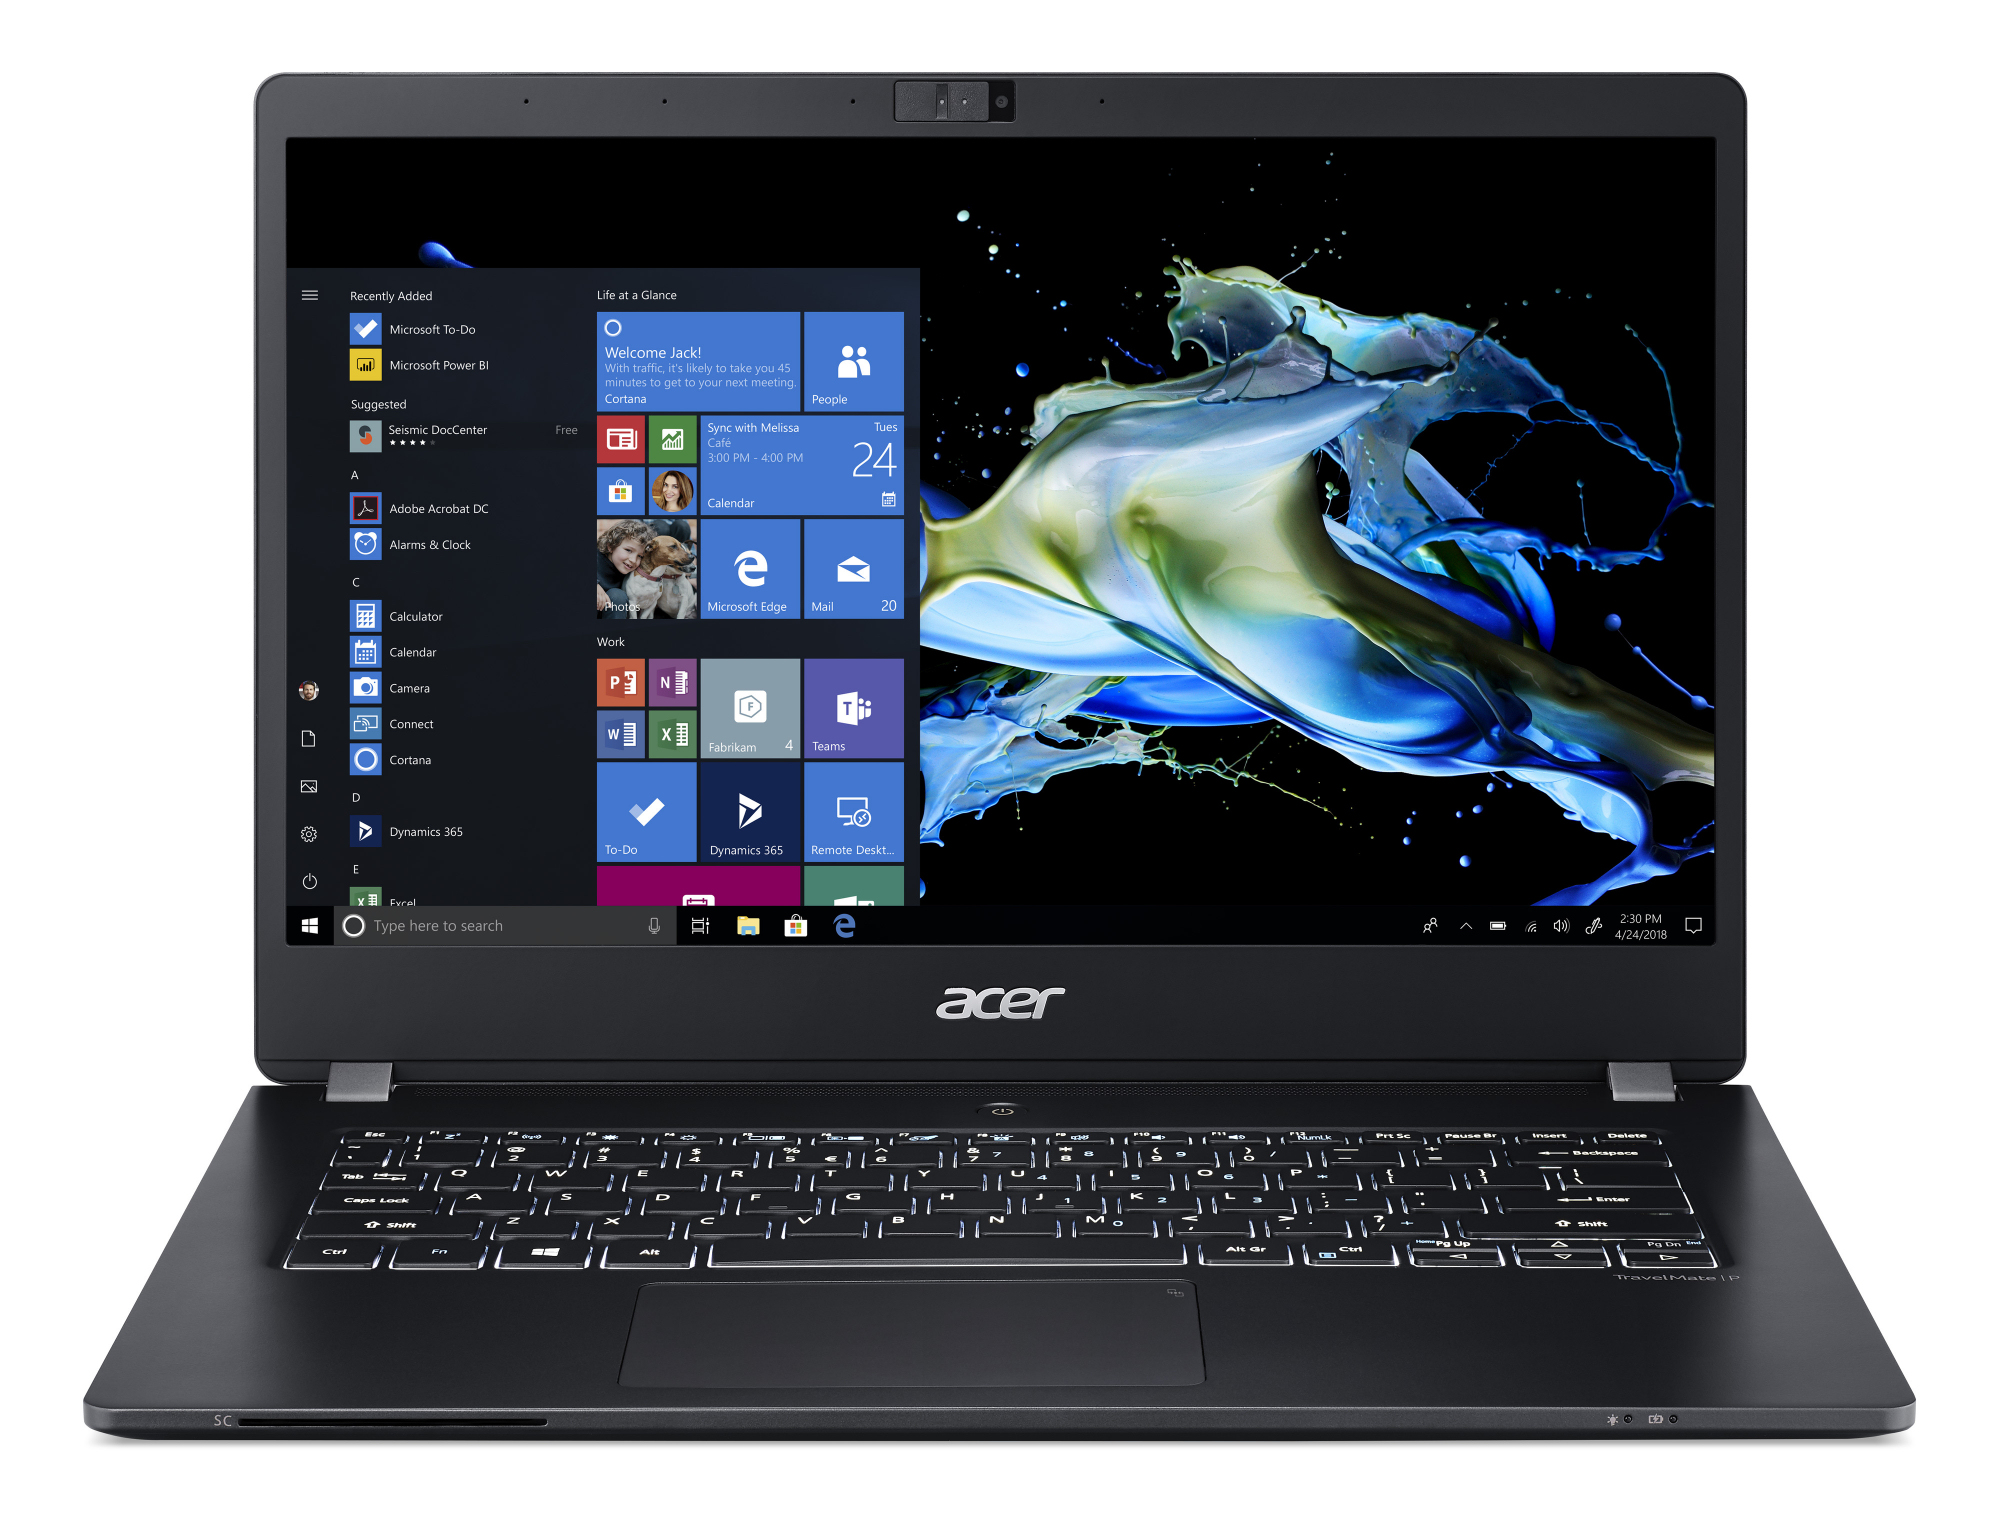
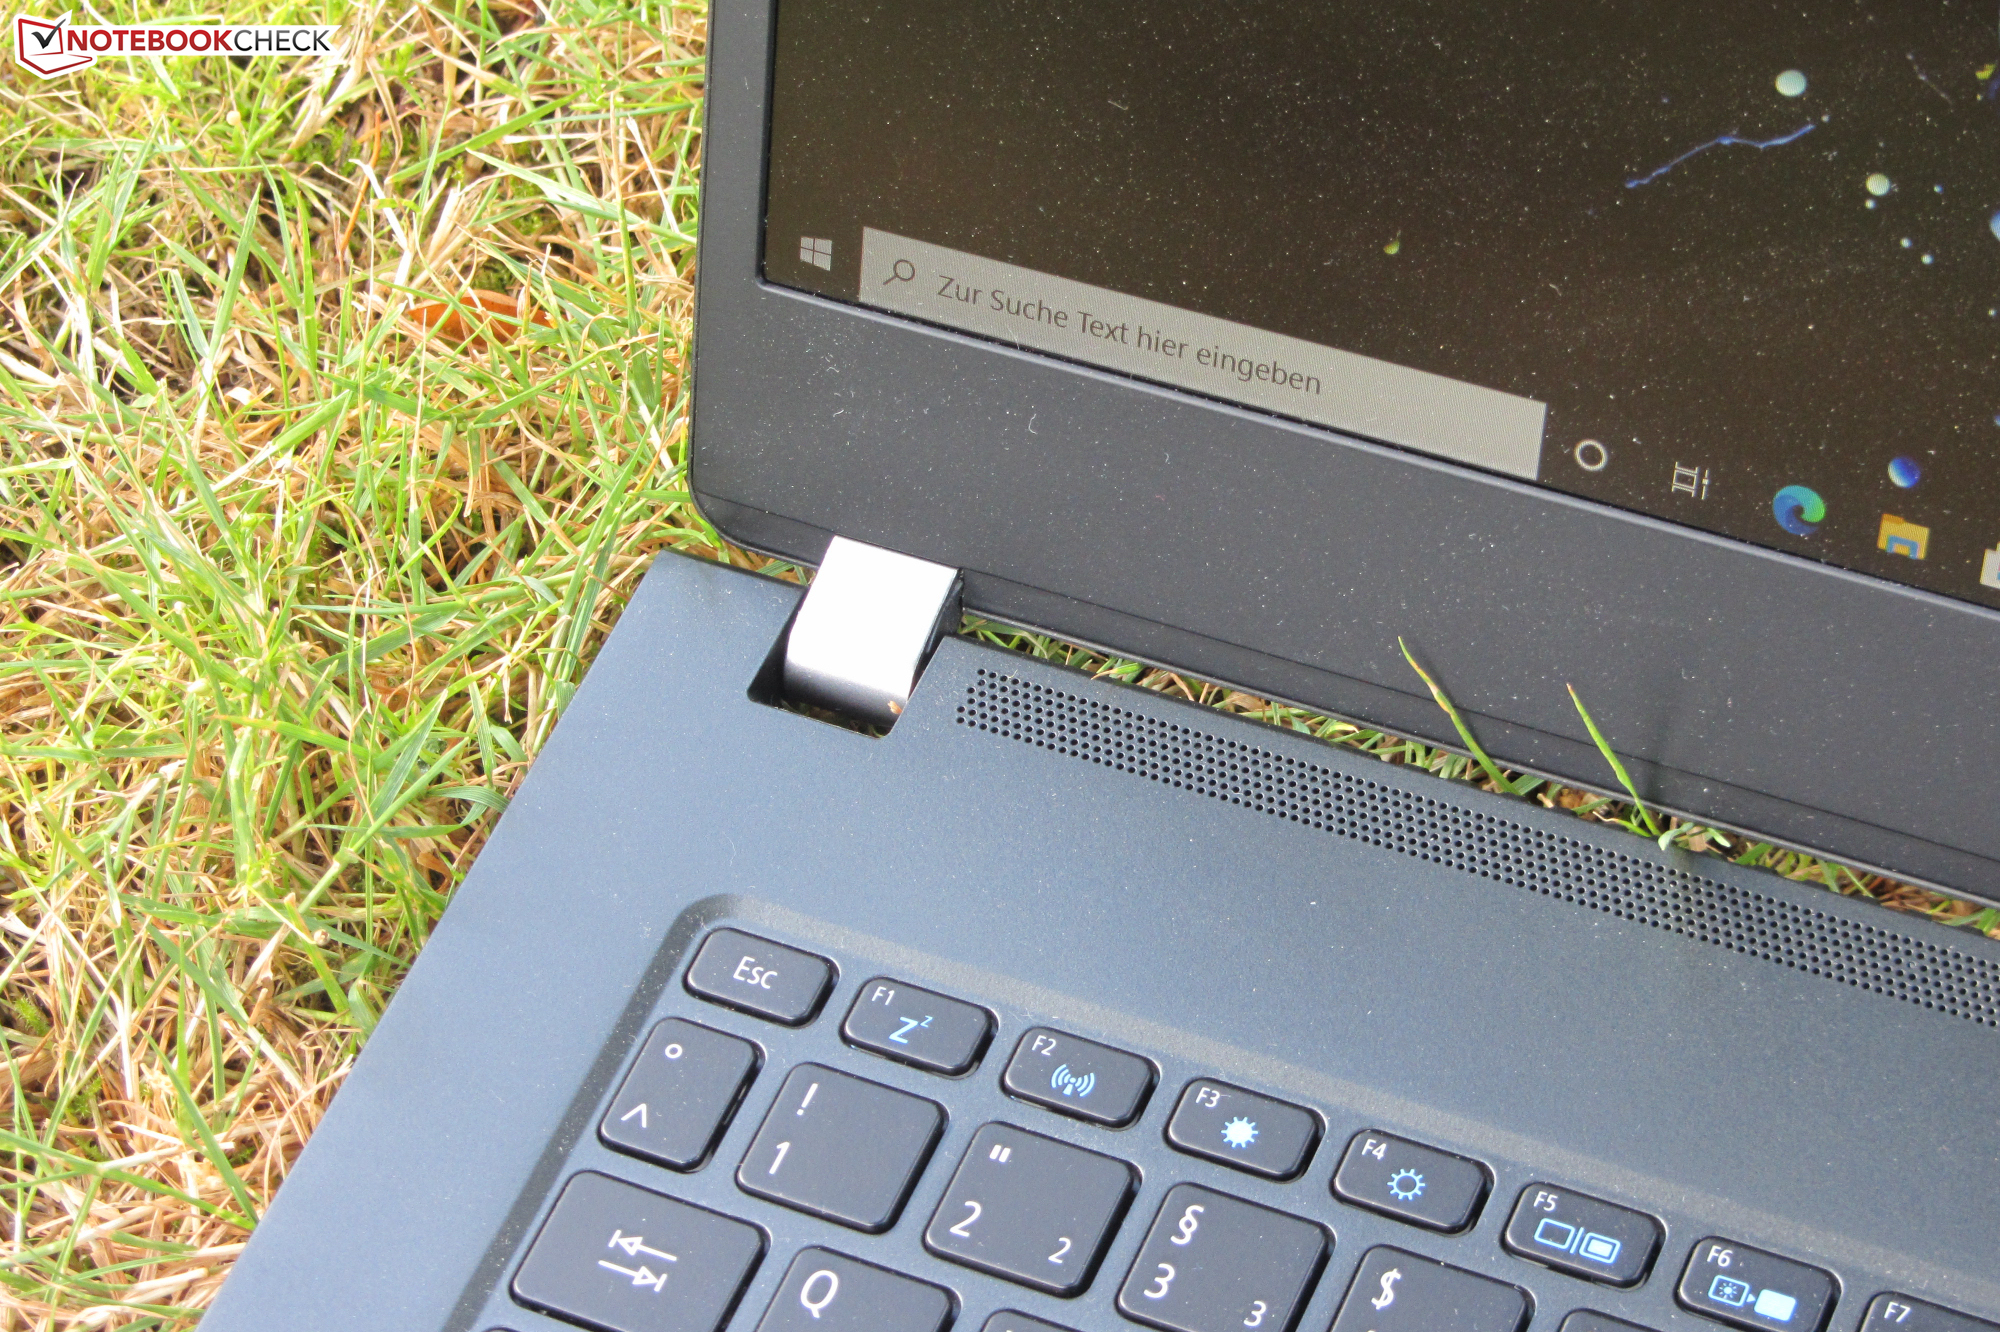
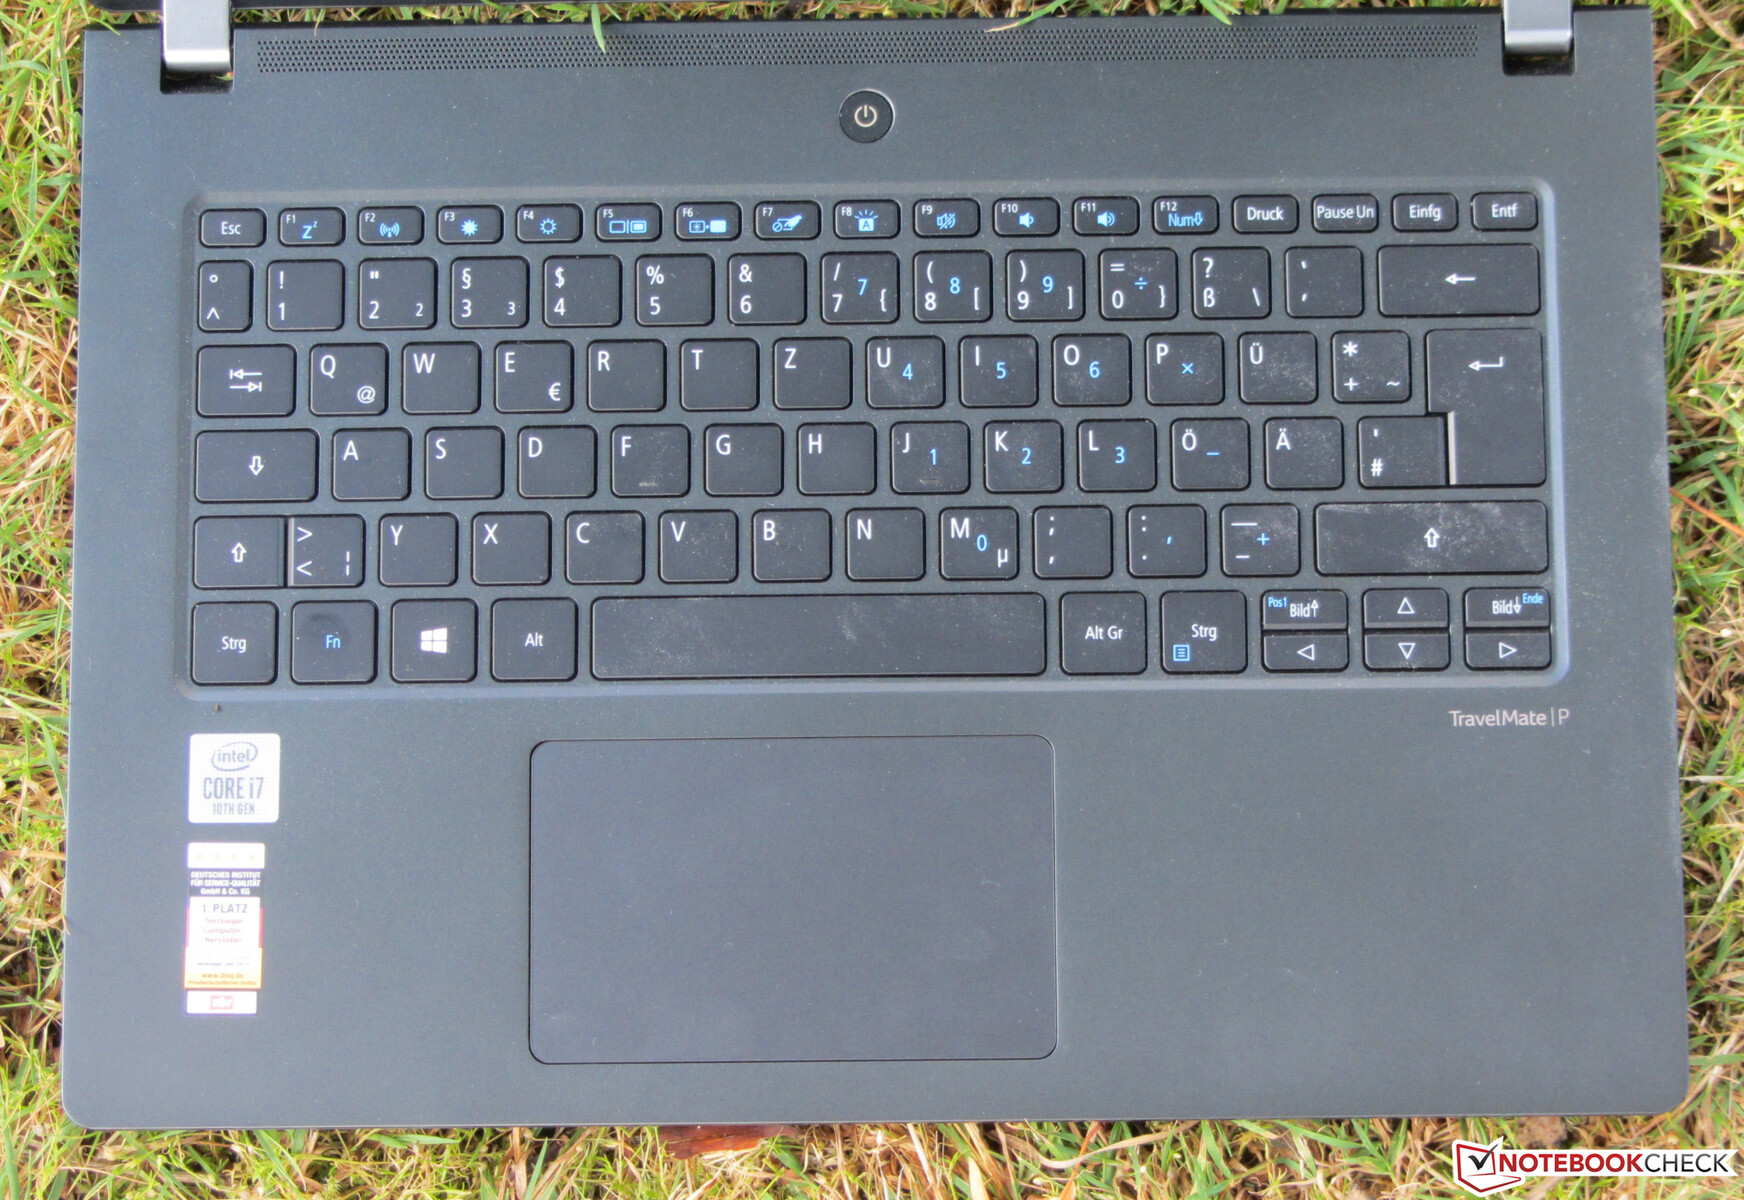
Input devices - P6 provides keyboard backlighting
Keyboard
Acer equips the P614 with a backlit chiclet keyboard. The flat, smooth keys have a short travel and a clear pressure point. While typing, the keyboard yields slightly in the middle, but this didn't prove to be annoying. The illumination (two brightness levels) is controlled with a function key. All in all, Acer delivers a keyboard suitable for everyday use here.
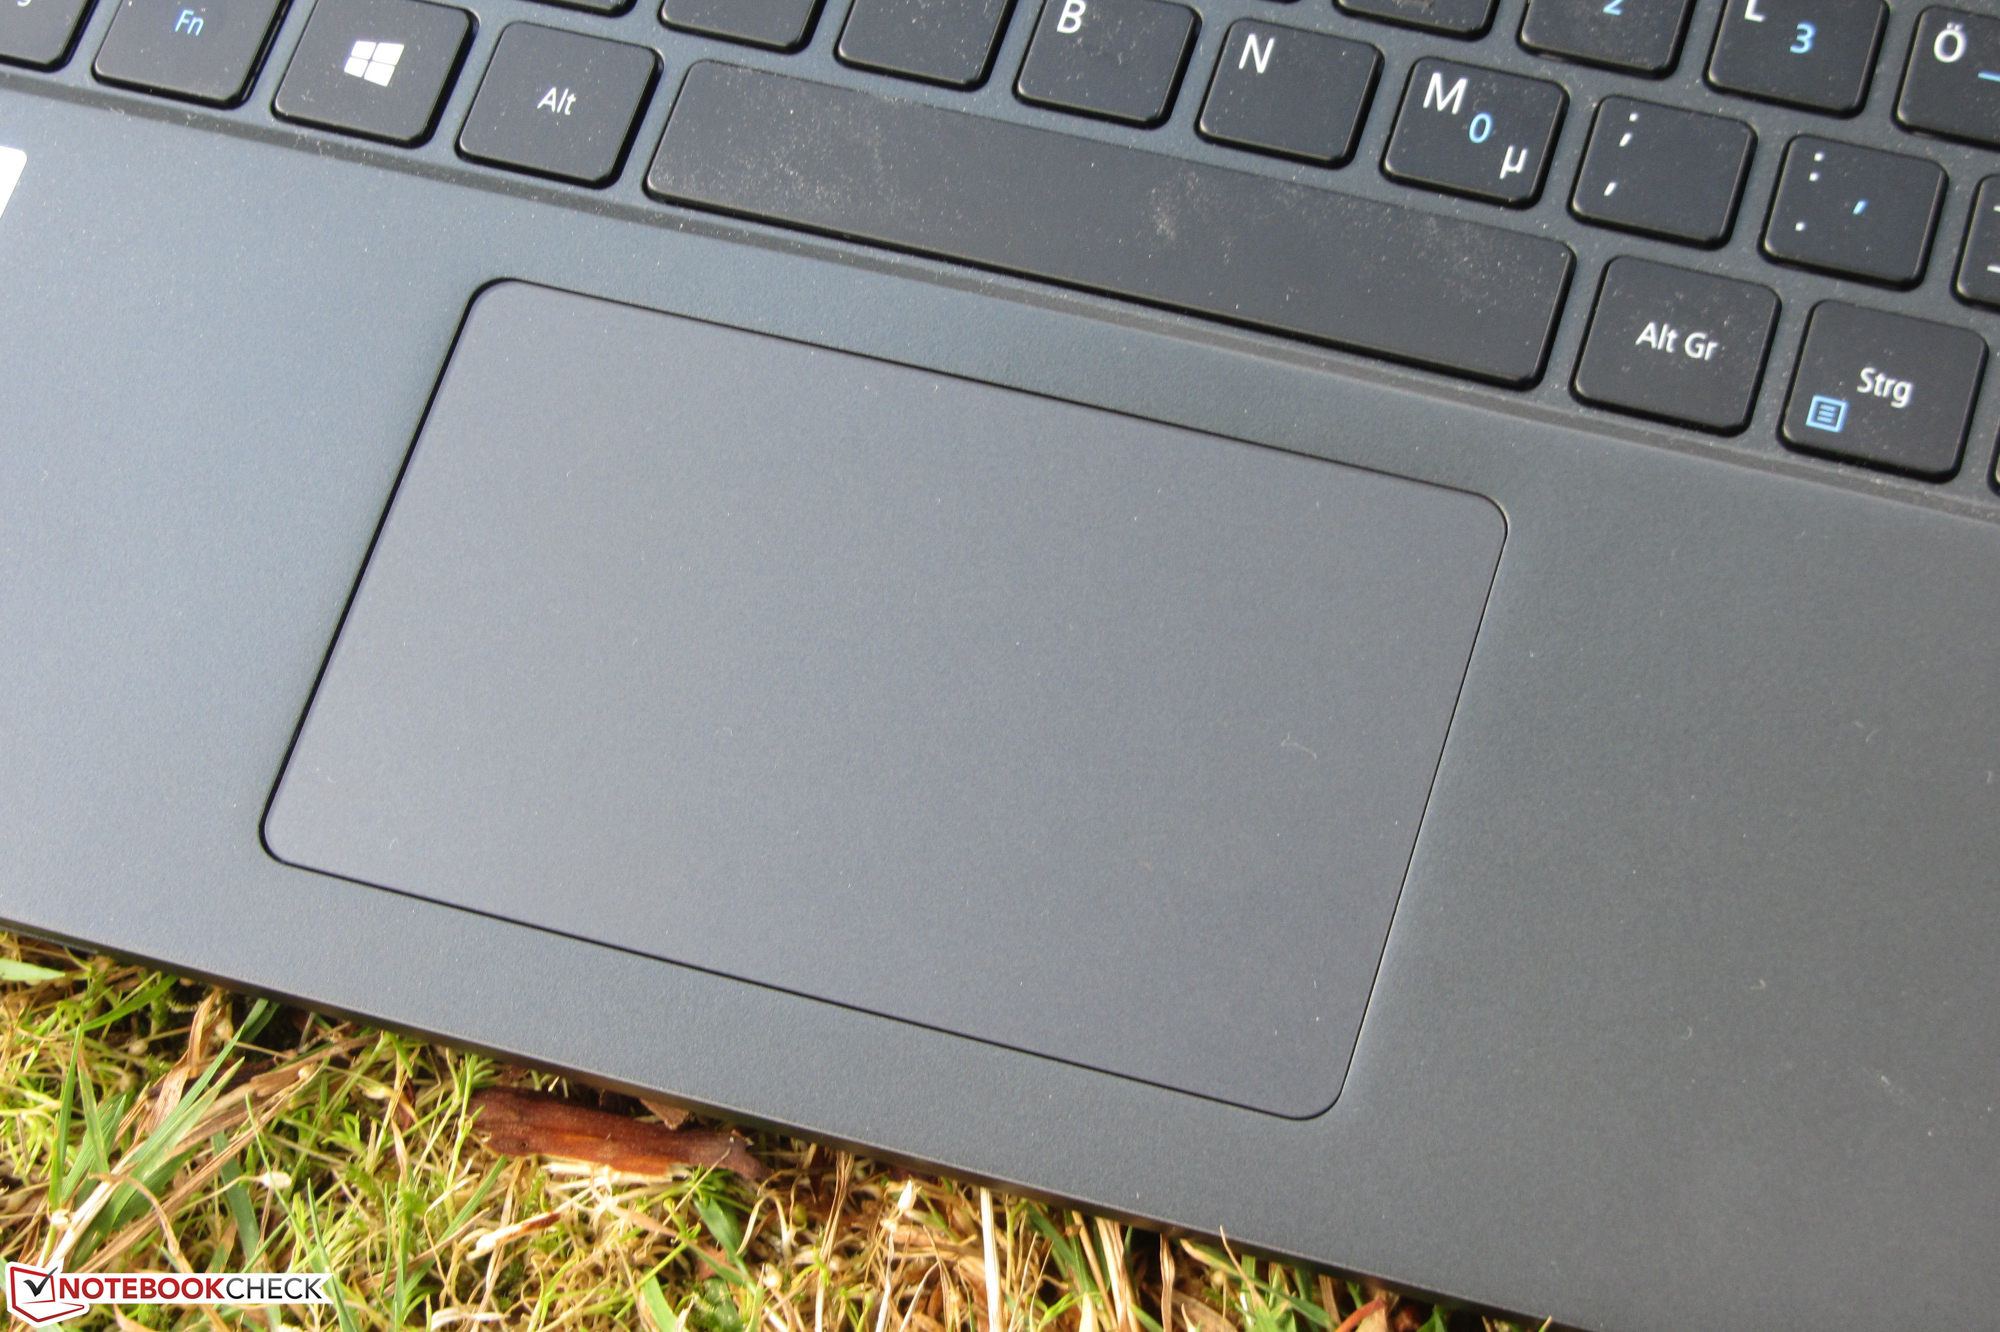
Touchpad
The multi-touch capable ClickPad occupies an area of about 10.5 x 6.5 cm. This provides plenty of space for the use of gesture controls. The smooth pad surface makes it easy for fingers to glide on it. In addition, the pad also reacts to input in the corners. It has a short travel and a clear pressure point.
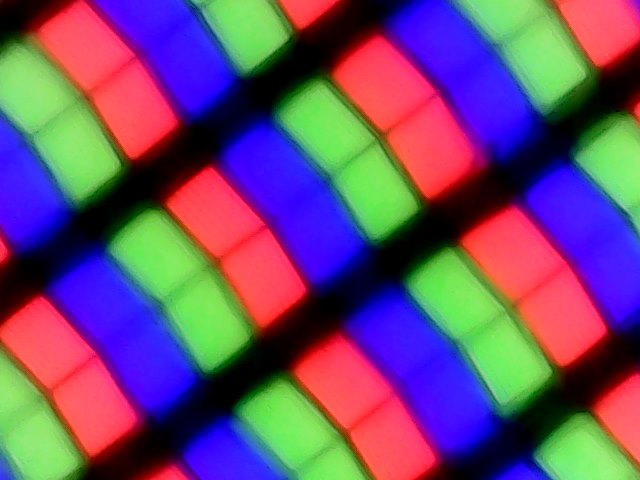
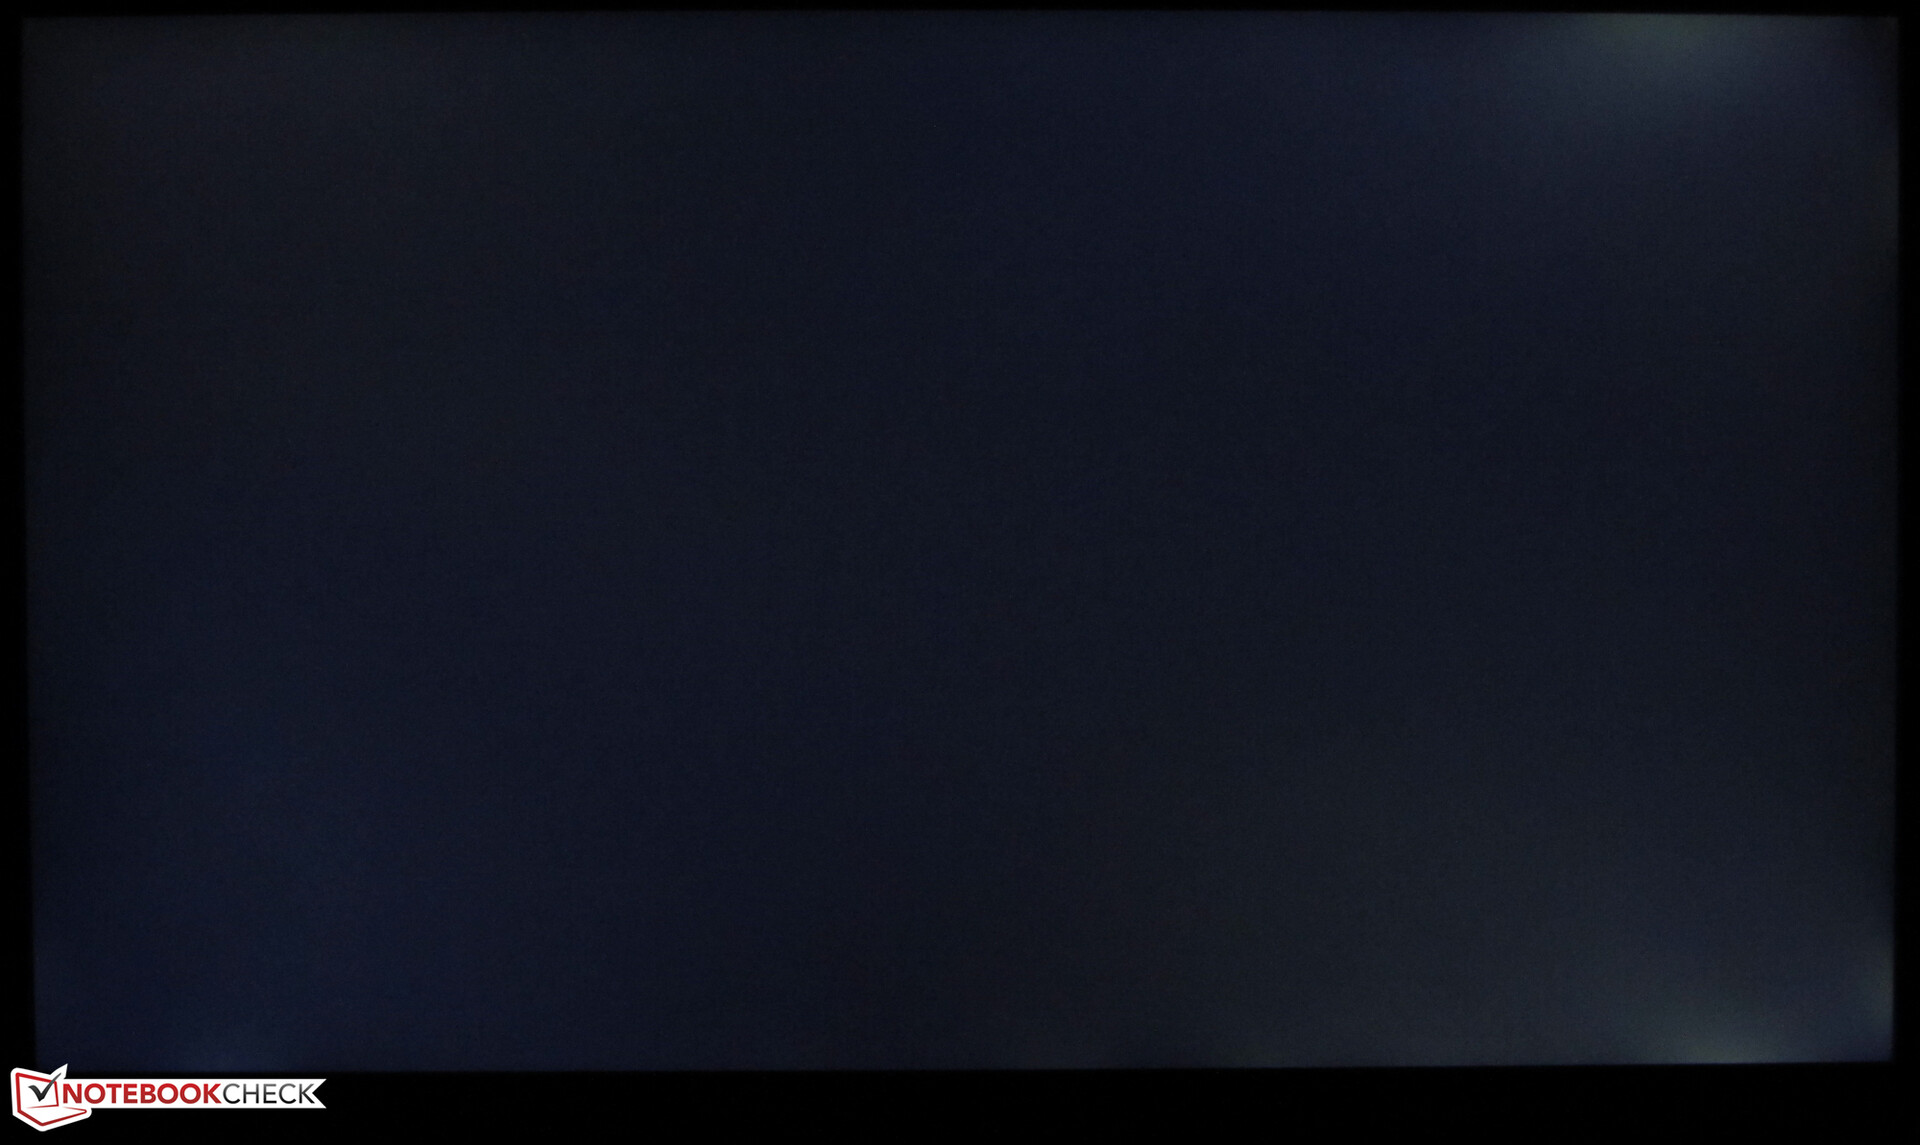
Display - IPS with touchscreen
The matte 14-inch touchscreen display has a native resolution of 1920x1080 pixels. Brightness (308.4 cd/m²) and contrast (923:1) are okay, but they should be much better on a laptop in this price range. Its competitors consistently deliver better values. Positive: The display doesn't show any PWM flickering.
| |||||||||||||||||||||||||
Brightness Distribution: 90 %
Center on Battery: 323 cd/m²
Contrast: 923:1 (Black: 0.35 cd/m²)
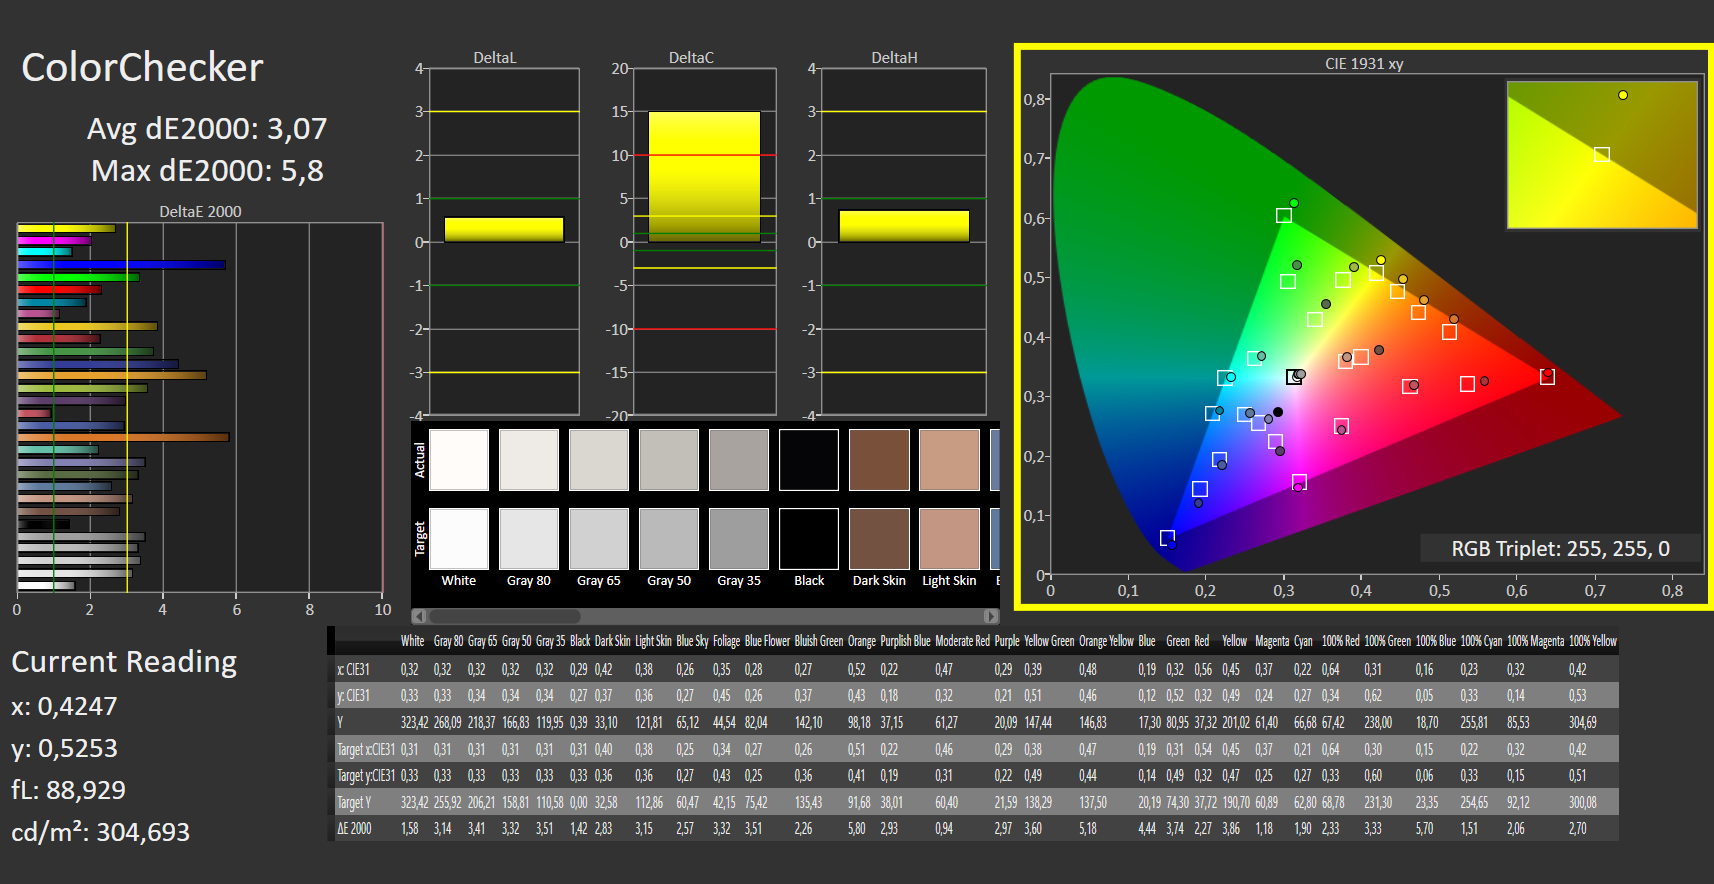
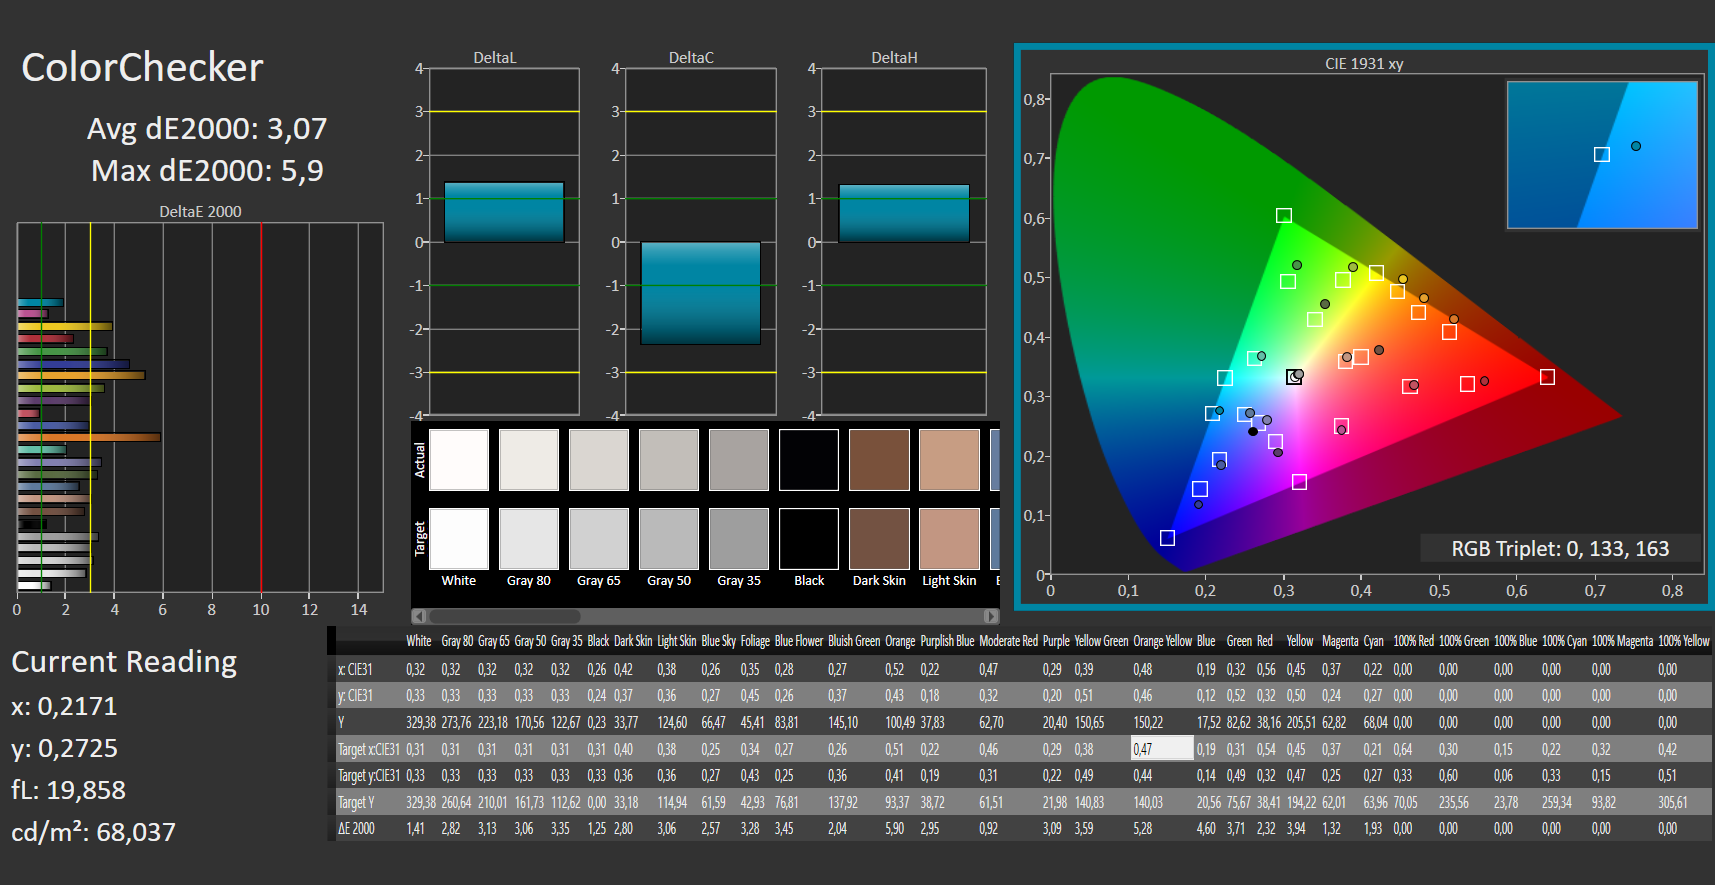
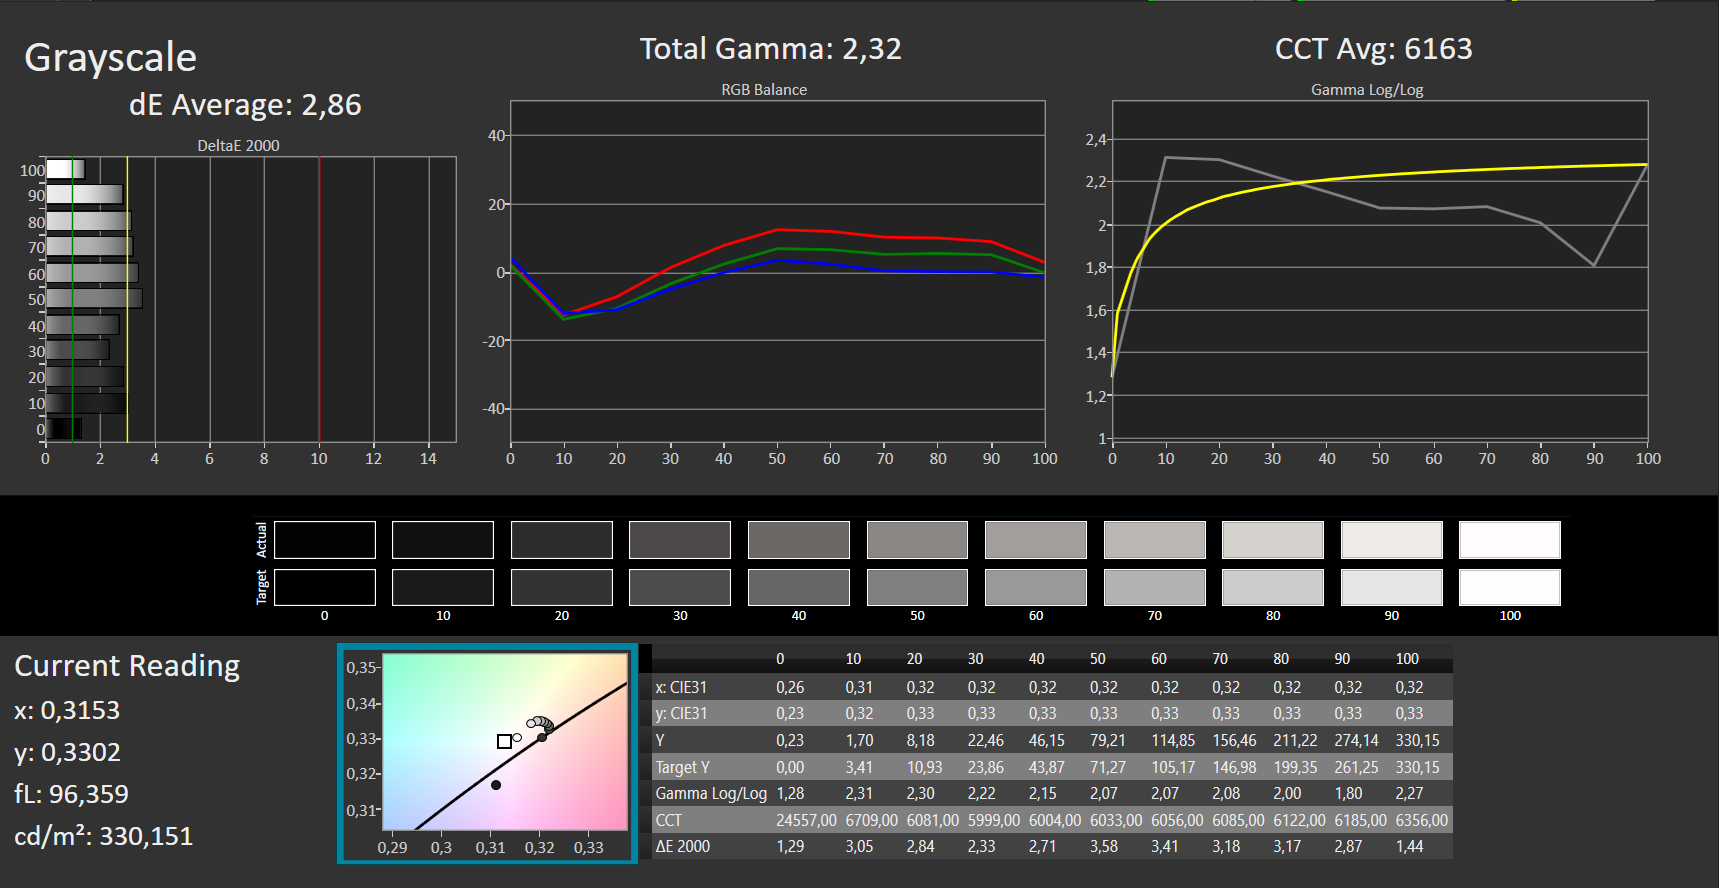
ΔE ColorChecker Calman: 3.07 | ∀{0.5-29.43 Ø4.73}
calibrated: 3.07
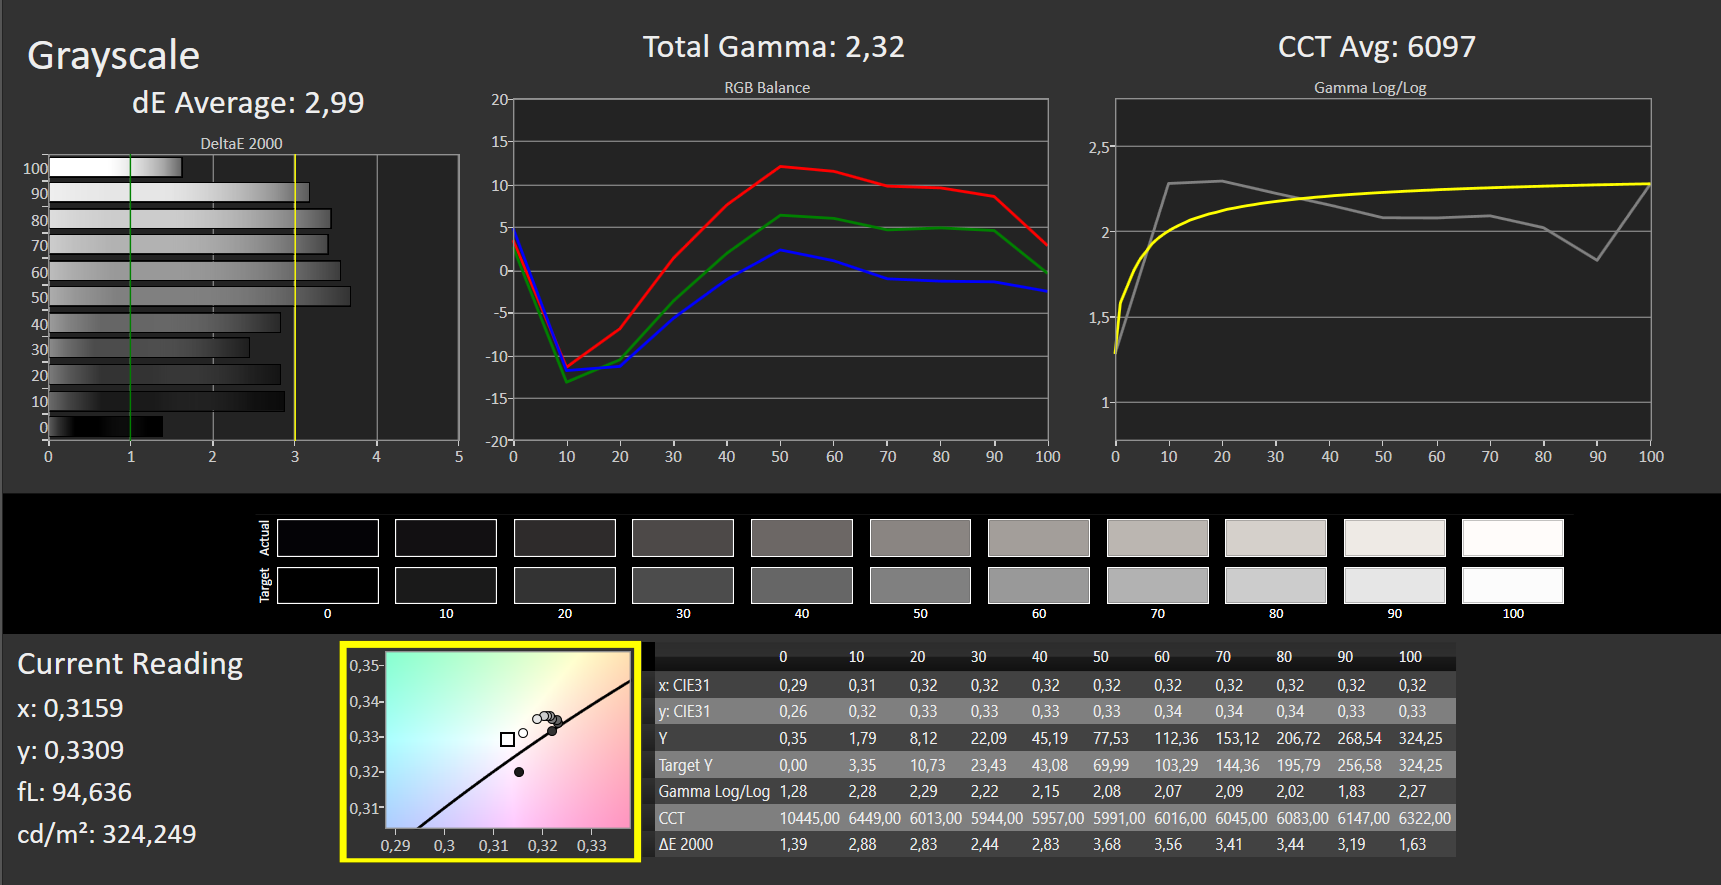
ΔE Greyscale Calman: 2.99 | ∀{0.09-98 Ø4.97}
93% sRGB (Argyll 1.6.3 3D)
61% AdobeRGB 1998 (Argyll 1.6.3 3D)
68.6% AdobeRGB 1998 (Argyll 3D)
93.7% sRGB (Argyll 3D)
69.2% Display P3 (Argyll 3D)
Gamma: 2.32
CCT: 6097 K
| Acer TravelMate P6 P614-51T-G2-72ZU AU Optronics B140HAK02.5, IPS, 1920x1080, 14" | Lenovo ThinkPad X1 Carbon 2020-20UAS04T00 BOE NE140FHM-N61, IPS, 1920x1080, 14" | Lenovo ThinkPad T14s-20T00044GE B140HAN05.7, LTPS AHVA-IPS LED, 1920x1080, 14" | Lenovo ThinkPad T14s-20UJS00K00 N140HCG-GQ2, IPS , 1920x1080, 14" | Dell Latitude 7410 AU Optronics B140ZAN, IPS, 3840x2160, 14" | Asus ZenBook 13 UX325JA Sharp LQ133M1JW40, IPS, 1920x1080, 13.3" | Apple MacBook Pro 13 2020 2GHz i5 10th-Gen APPA03D, IPS, 2560x1600, 13.3" | HP ProBook 445 G7 175W4EA BOE0868, IPS, 1920x1080, 14" | |
|---|---|---|---|---|---|---|---|---|
| Display | -1% | -1% | 1% | 5% | -4% | 25% | -39% | |
| Display P3 Coverage (%) | 69.2 | 68.9 0% | 66.6 -4% | 66.8 -3% | 71.8 4% | 63.8 -8% | 98.8 43% | 39.92 -42% |
| sRGB Coverage (%) | 93.7 | 91.6 -2% | 96.8 3% | 97.9 4% | 99.3 6% | 94.5 1% | 99.9 7% | 59.6 -36% |
| AdobeRGB 1998 Coverage (%) | 68.6 | 67.1 -2% | 67.6 -1% | 69 1% | 72.4 6% | 64.9 -5% | 86.4 26% | 41.25 -40% |
| Response Times | -46% | -40% | 27% | 4% | -4% | -25% | -12% | |
| Response Time Grey 50% / Grey 80% * (ms) | 37 ? | 64.8 ? -75% | 63.2 ? -71% | 32.4 ? 12% | 39.2 ? -6% | 47 ? -27% | 46 ? -24% | 40 ? -8% |
| Response Time Black / White * (ms) | 26 ? | 30.4 ? -17% | 28 ? -8% | 15.2 ? 42% | 22.4 ? 14% | 21 ? 19% | 32.4 ? -25% | 30 ? -15% |
| PWM Frequency (Hz) | 2404 ? | 26040 ? | 250 ? | 113600 ? | 192 ? | |||
| Screen | -5% | 25% | 27% | -7% | 5% | 39% | -36% | |
| Brightness middle (cd/m²) | 323 | 422 31% | 404 25% | 404 25% | 388.6 20% | 435 35% | 512 59% | 277 -14% |
| Brightness (cd/m²) | 308 | 395 28% | 397 29% | 371 20% | 365 19% | 404 31% | 491 59% | 270 -12% |
| Brightness Distribution (%) | 90 | 90 0% | 92 2% | 88 -2% | 82 -9% | 83 -8% | 91 1% | 88 -2% |
| Black Level * (cd/m²) | 0.35 | 0.27 23% | 0.21 40% | 0.34 3% | 0.35 -0% | 0.565 -61% | 0.32 9% | 0.285 19% |
| Contrast (:1) | 923 | 1563 69% | 1924 108% | 1188 29% | 1110 20% | 770 -17% | 1600 73% | 972 5% |
| Colorchecker dE 2000 * | 3.07 | 4.7 -53% | 3.1 -1% | 1.4 54% | 4.04 -32% | 2.66 13% | 1.7 45% | 5.53 -80% |
| Colorchecker dE 2000 max. * | 5.8 | 10 -72% | 4.7 19% | 3.2 45% | 9.2 -59% | 4.73 18% | 3.4 41% | 10.68 -84% |
| Colorchecker dE 2000 calibrated * | 3.07 | 2 35% | 1.3 58% | 0.8 74% | 1.25 59% | 1.19 61% | 1 67% | 4.43 -44% |
| Greyscale dE 2000 * | 2.99 | 6.4 -114% | 3.4 -14% | 1.6 46% | 6.4 -114% | 3.65 -22% | 1.9 36% | 6.2 -107% |
| Gamma | 2.32 95% | 2.12 104% | 2.38 92% | 2.13 103% | 2.3 96% | 2.34 94% | 2.19 100% | 2.34 94% |
| CCT | 6097 107% | 7106 91% | 7070 92% | 6480 100% | 6957 93% | 7109 91% | 6817 95% | 7342 89% |
| Color Space (Percent of AdobeRGB 1998) (%) | 61 | 59.5 -2% | 61.8 1% | 63 3% | 66.4 9% | 60 -2% | 77.4 27% | 38 -38% |
| Color Space (Percent of sRGB) (%) | 93 | 91.5 -2% | 96.6 4% | 97.9 5% | 99.4 7% | 95 2% | 99.9 7% | 59 -37% |
| Total Average (Program / Settings) | -17% /
-10% | -5% /
12% | 18% /
22% | 1% /
-4% | -1% /
2% | 13% /
28% | -29% /
-33% |
* ... smaller is better
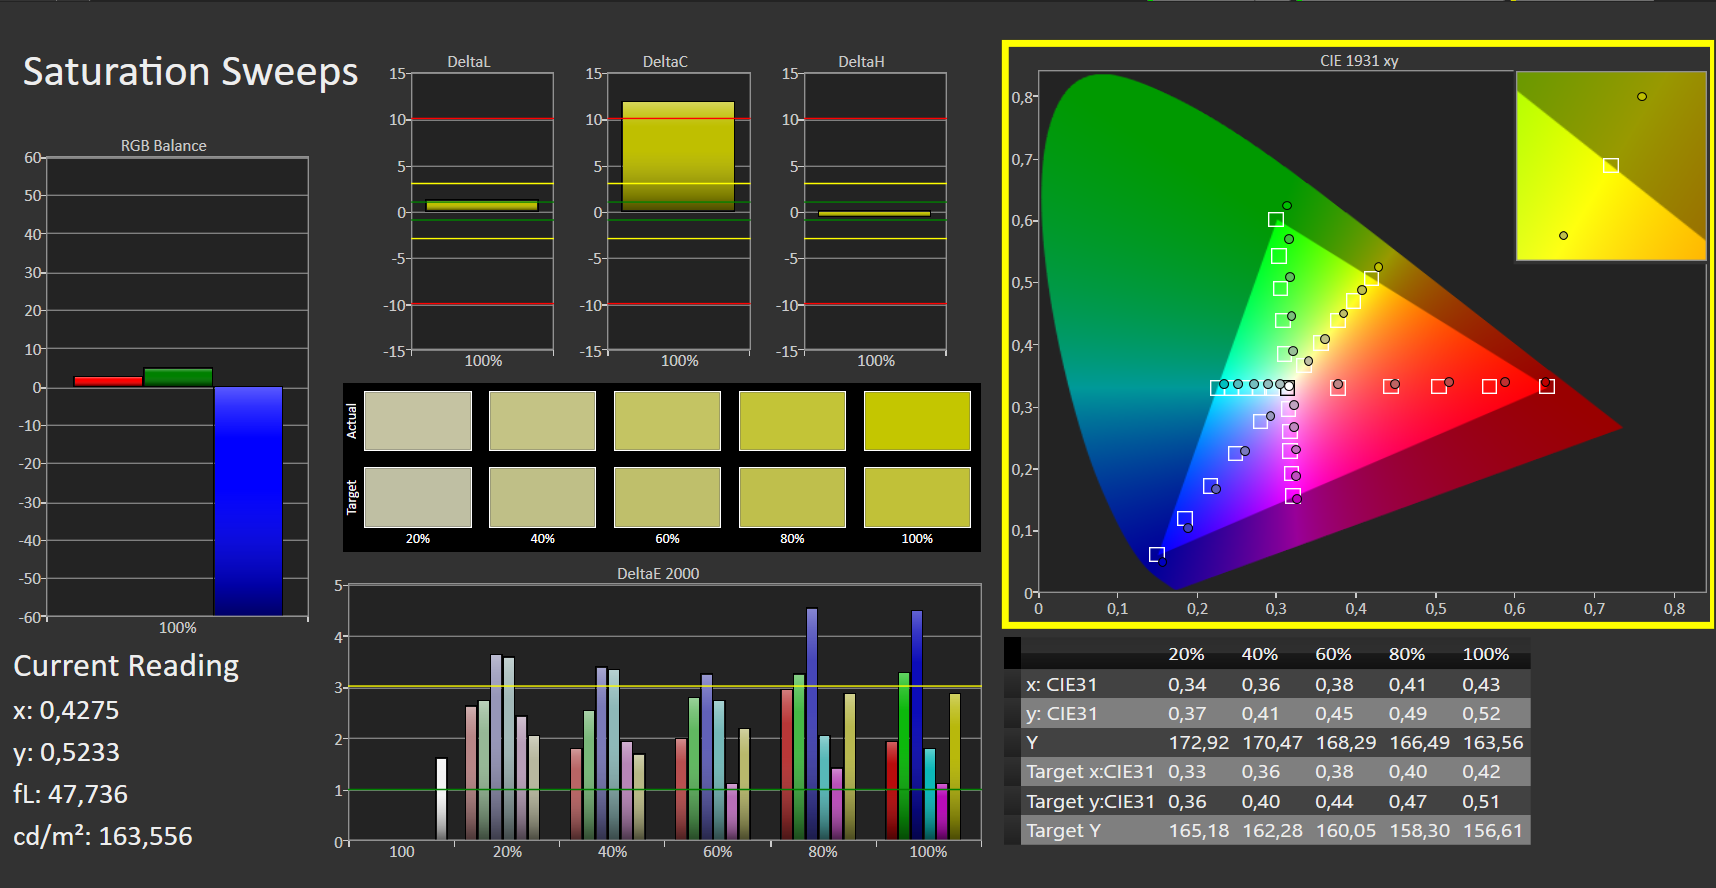
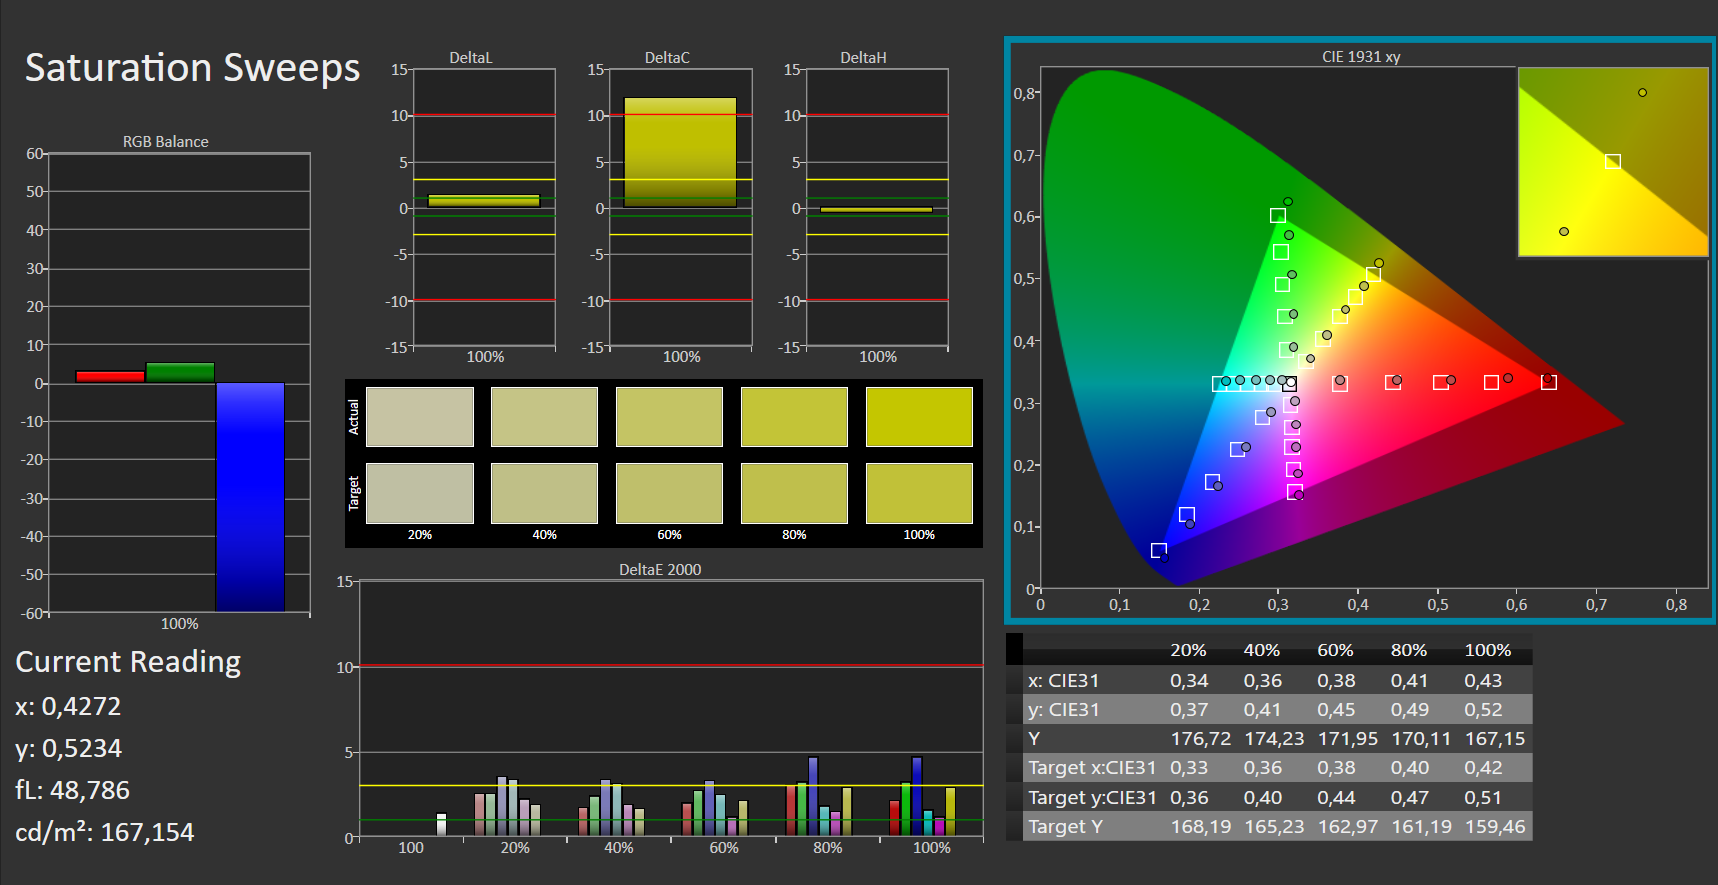
Out of the box, the display shows a good color reproduction, and it only just misses the target (Delta E less than 3) with a Delta E 2000 color deviation of almost 3.1. Furthermore, the display doesn't suffer from a blue tint. Calibration only leads to marginal improvements. The AdobeRGB (61%) and sRGB (93%) color spaces aren't fully mapped.
Display Response Times
| ↔ Response Time Black to White | ||
|---|---|---|
| 26 ms ... rise ↗ and fall ↘ combined | ↗ 14 ms rise | 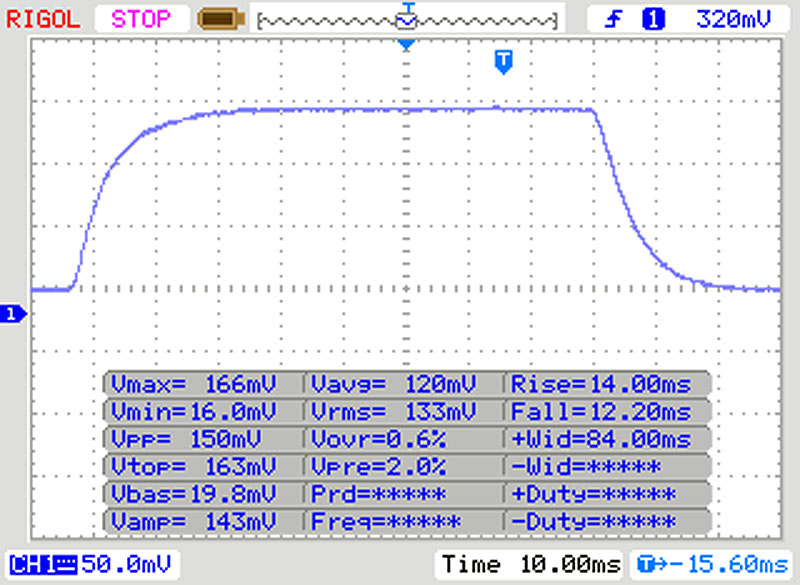 |
| ↘ 12 ms fall | ||
| The screen shows relatively slow response rates in our tests and may be too slow for gamers. In comparison, all tested devices range from 0.1 (minimum) to 240 (maximum) ms. » 62 % of all devices are better. This means that the measured response time is worse than the average of all tested devices (19.9 ms). | ||
| ↔ Response Time 50% Grey to 80% Grey | ||
| 37 ms ... rise ↗ and fall ↘ combined | ↗ 18 ms rise | 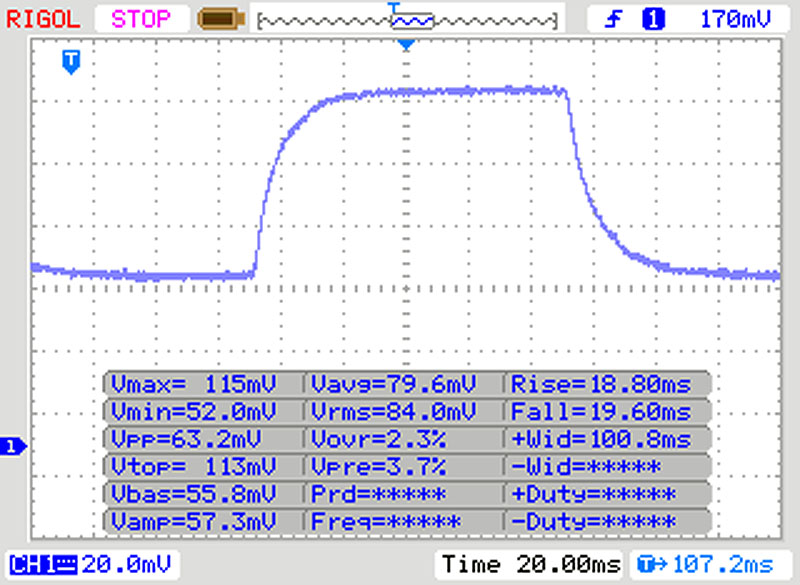 |
| ↘ 19 ms fall | ||
| The screen shows slow response rates in our tests and will be unsatisfactory for gamers. In comparison, all tested devices range from 0.165 (minimum) to 636 (maximum) ms. » 53 % of all devices are better. This means that the measured response time is worse than the average of all tested devices (31.1 ms). | ||
Screen Flickering / PWM (Pulse-Width Modulation)
| Screen flickering / PWM not detected |  | ||
In comparison: 52 % of all tested devices do not use PWM to dim the display. If PWM was detected, an average of 7794 (minimum: 5 - maximum: 343500) Hz was measured. | |||
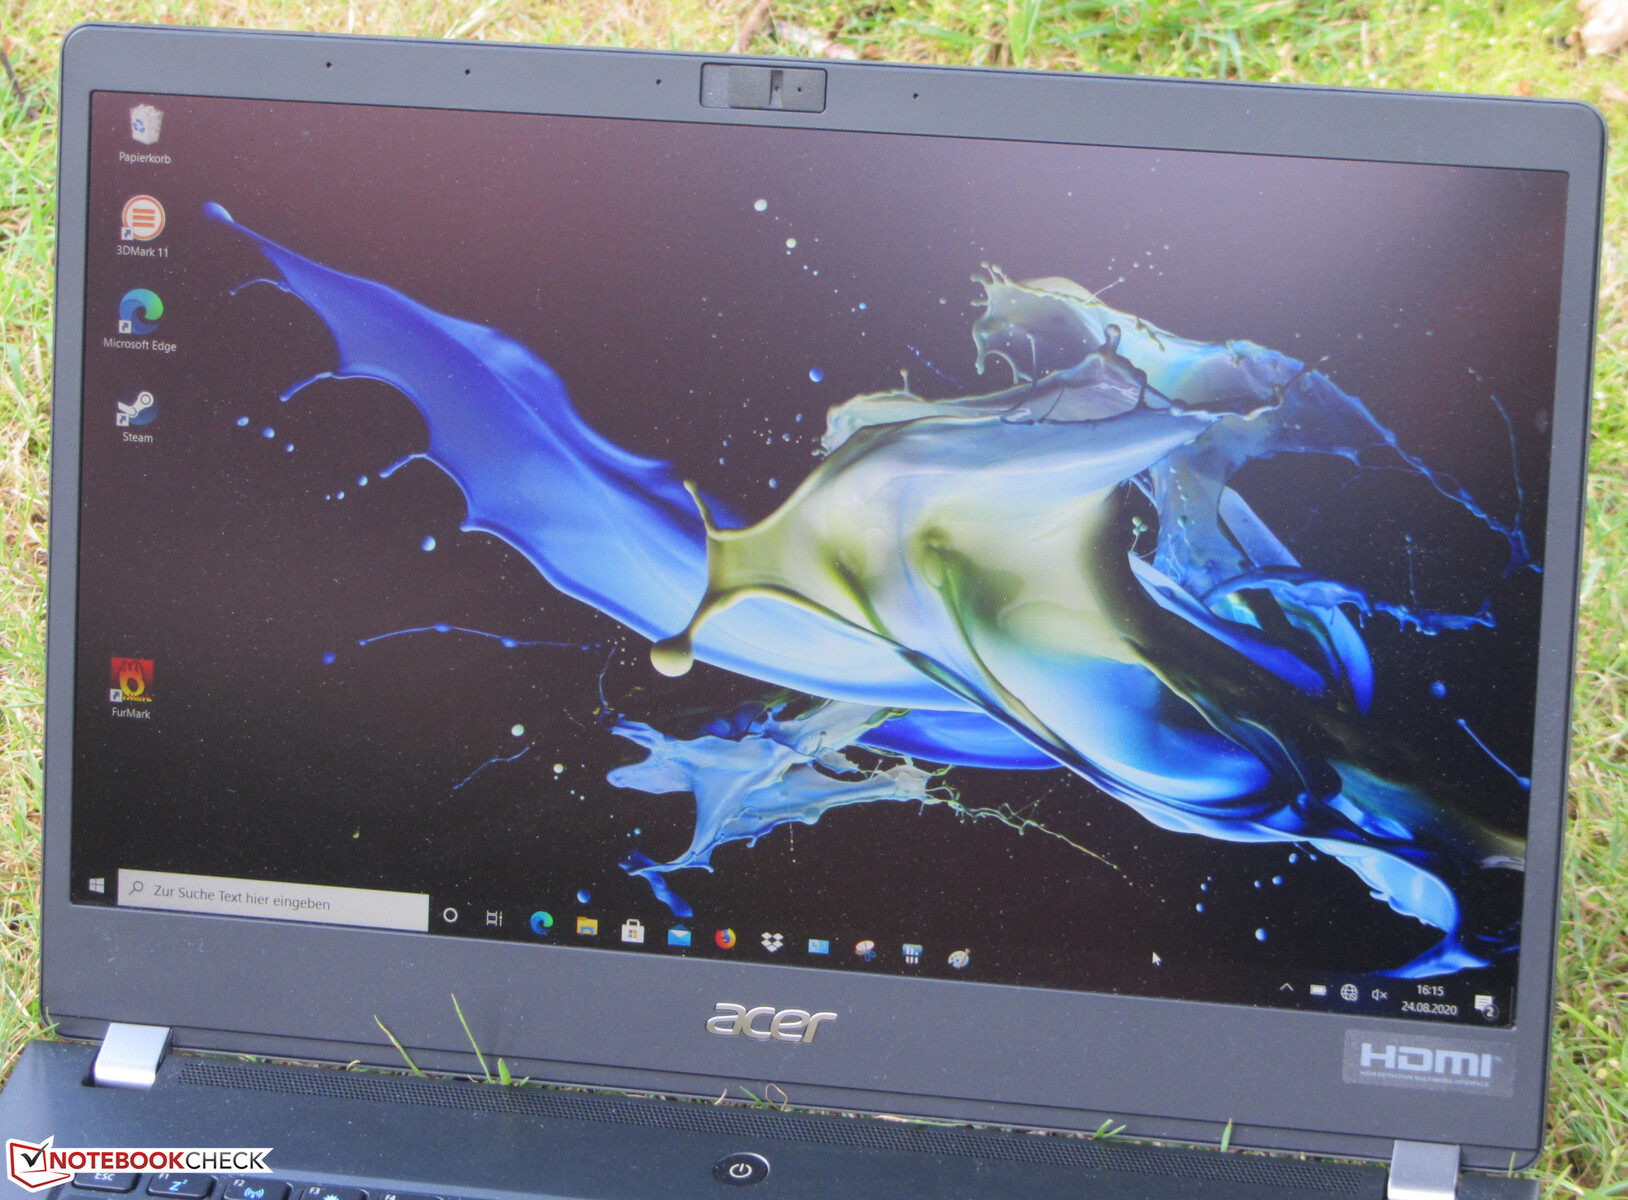
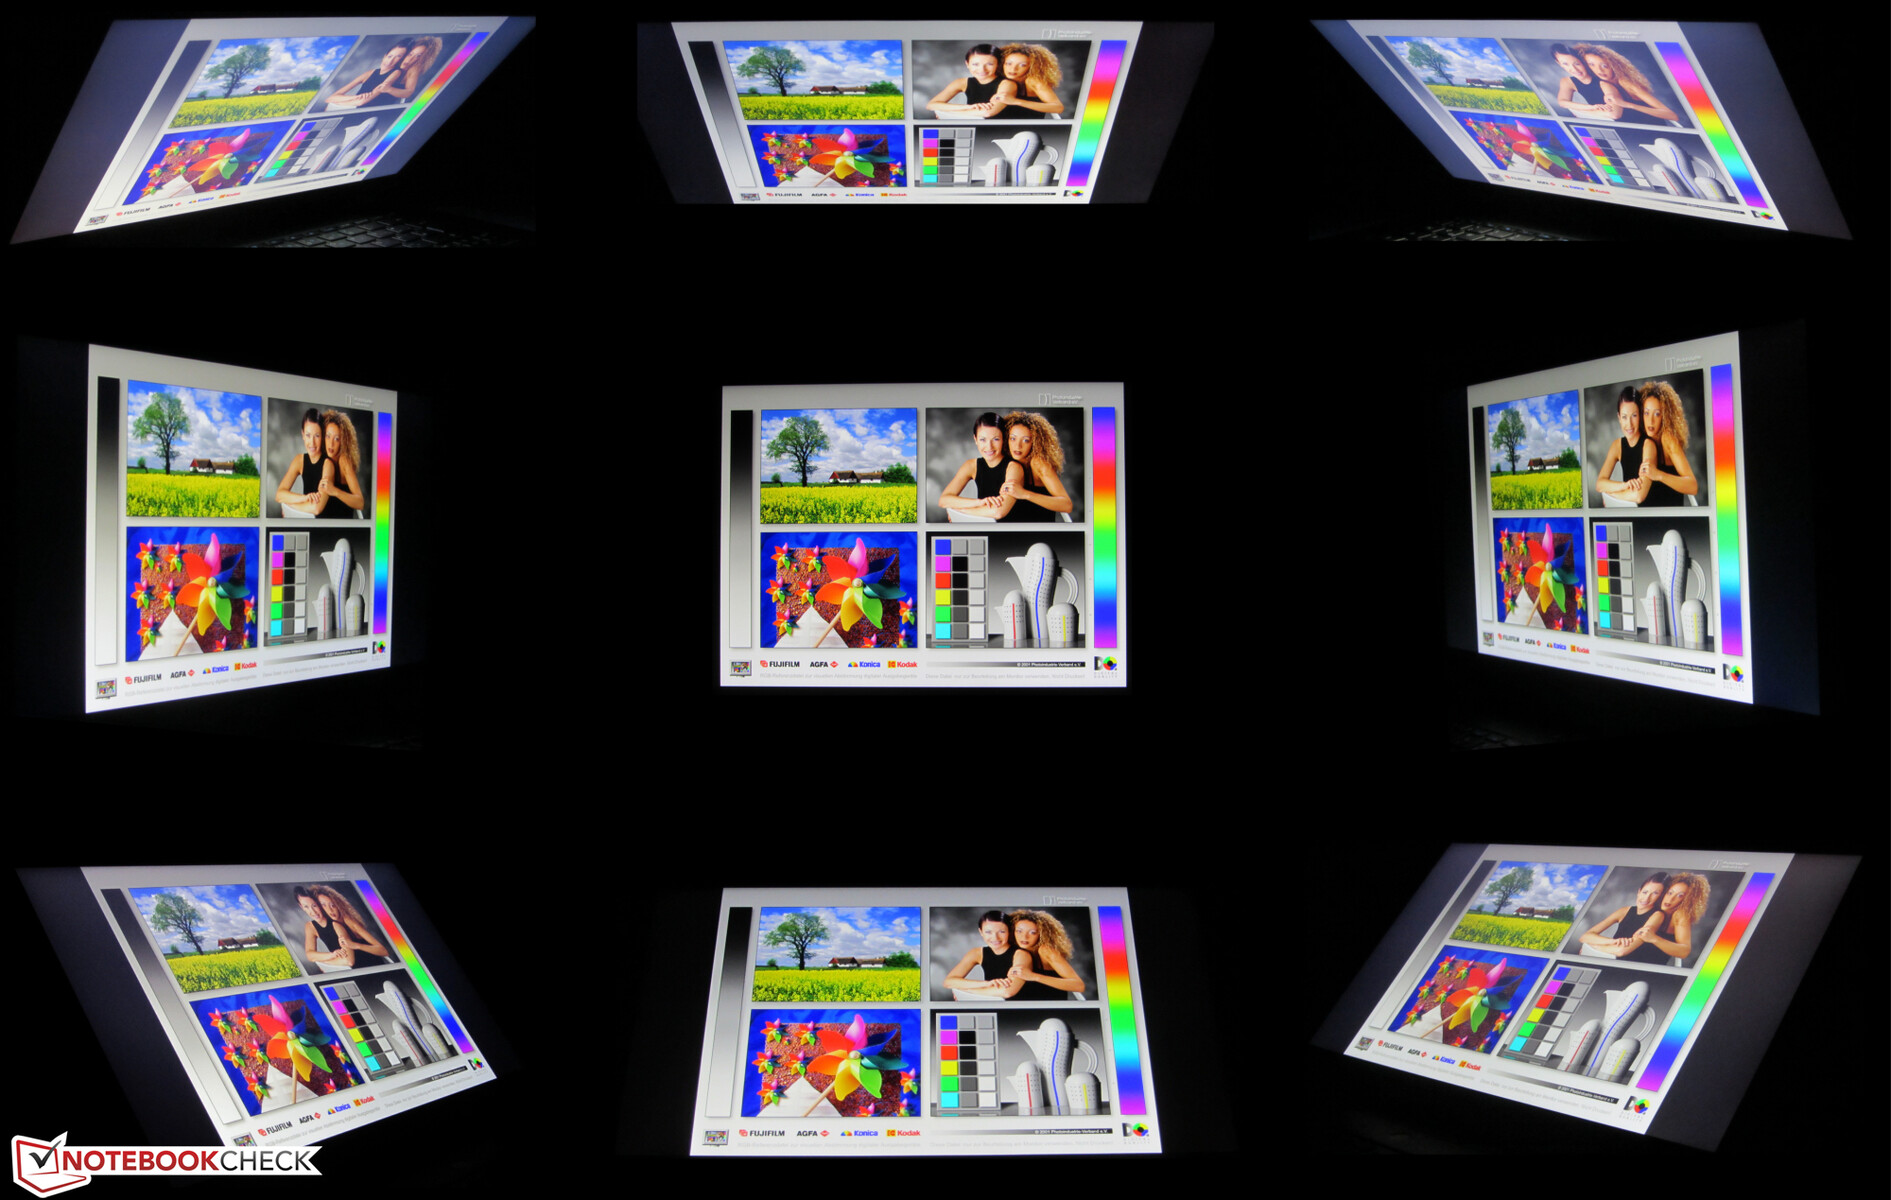
Acer has equipped the TravelMate with a viewing-angle-stable IPS panel. As a result, the screen can be read from any position. The display can be read outdoors when the sun is not too bright.
Performance - Enough for office and Internet
With the TravelMate P6 P614-51T-G2, Acer delivers a 14-inch business laptop that offers enough computing power for office and Internet applications. Our test device can be obtained for about 1,200 Euros (~$1,429). In addition, other configuration variants are available at prices starting at around 1,020 Euros (~$1,214).
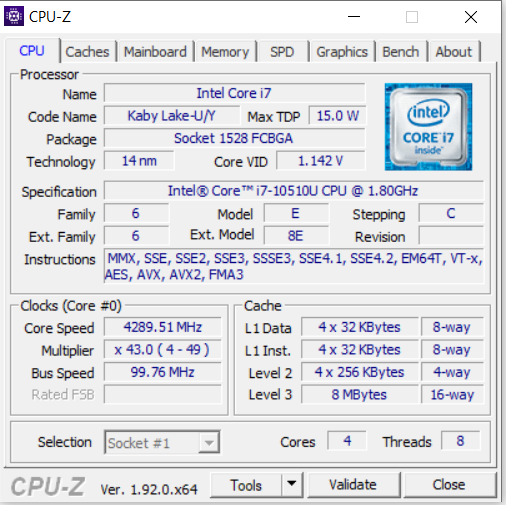
Processor
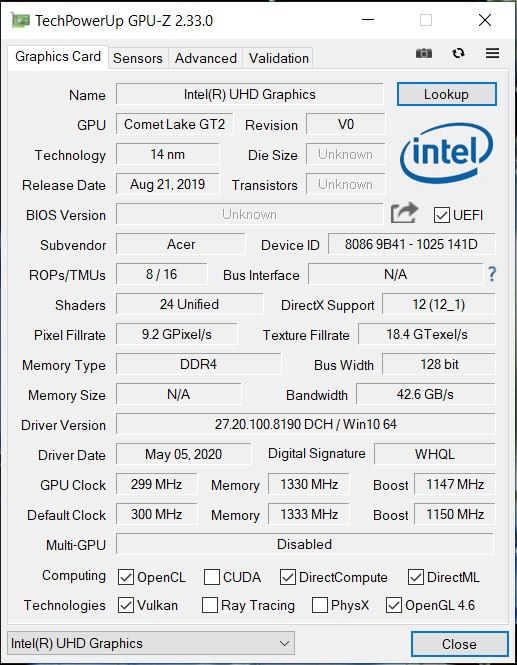
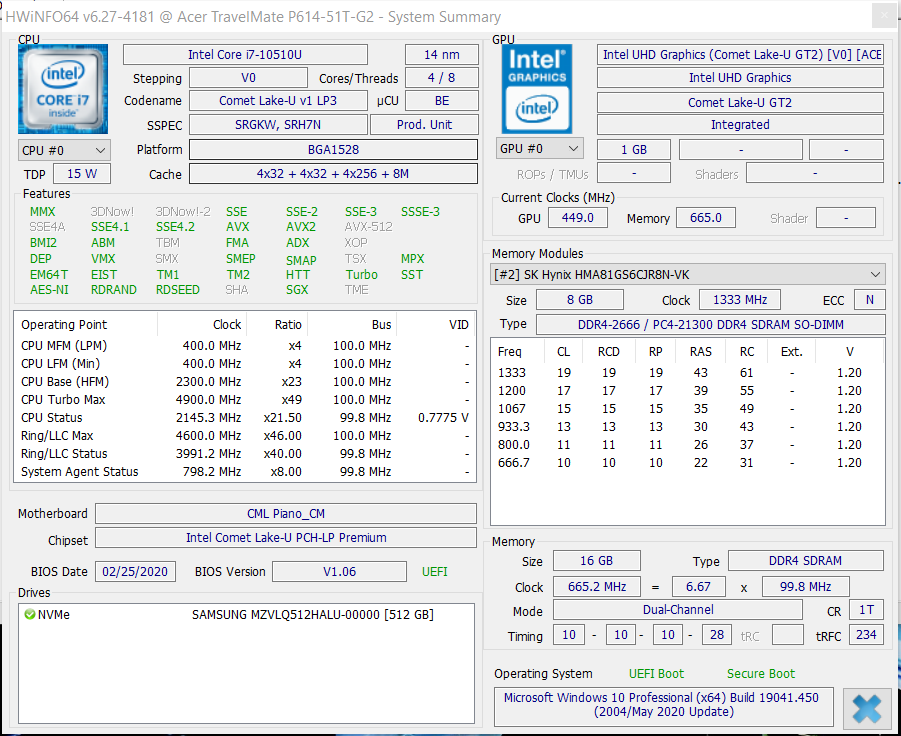
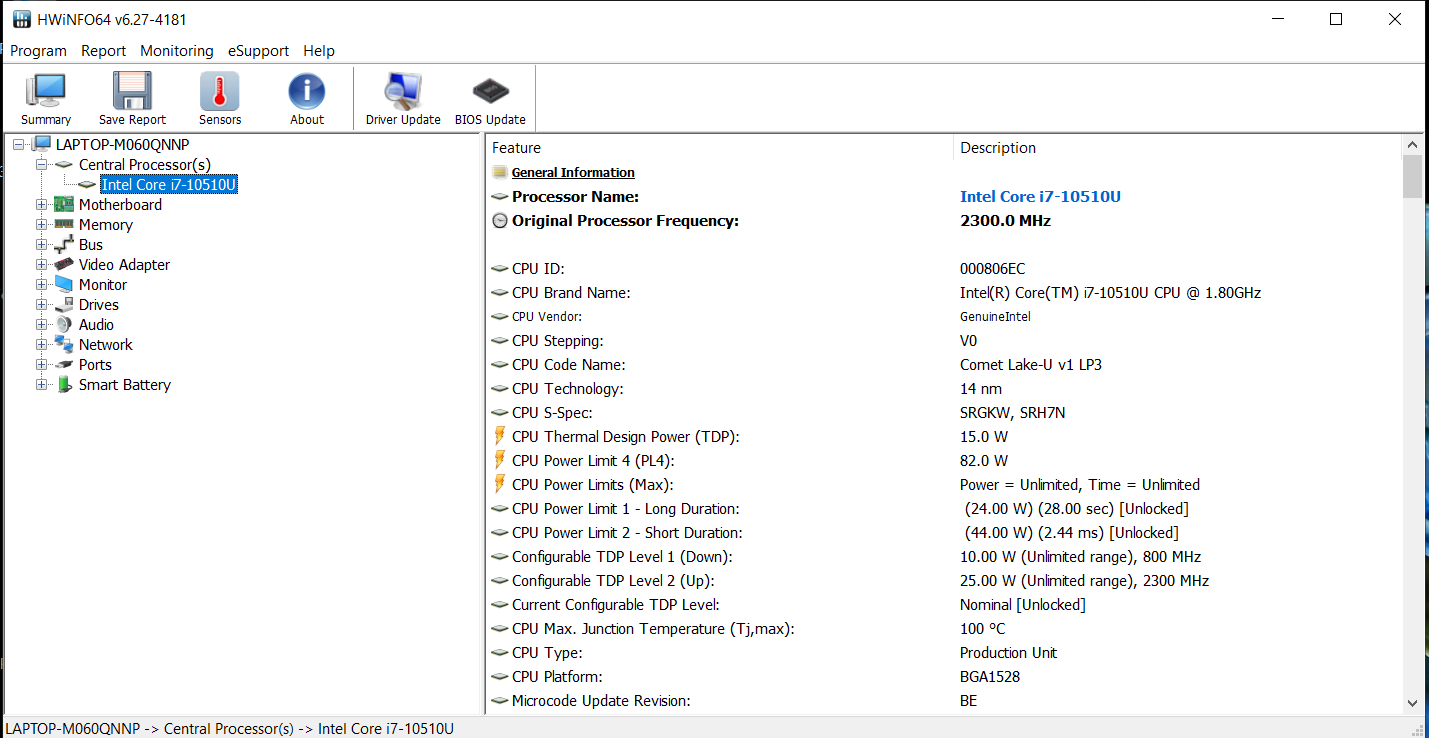
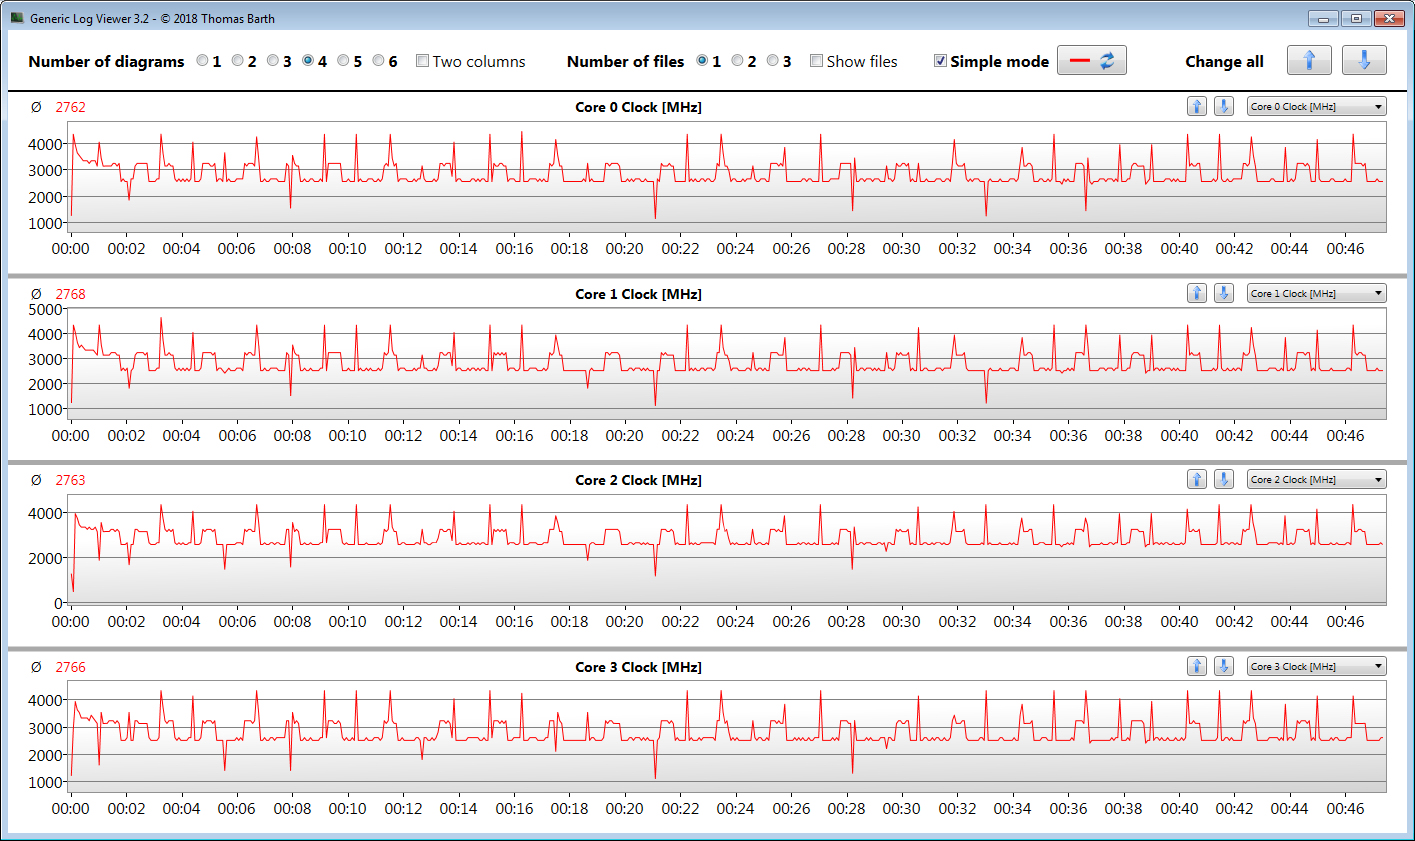
The TravelMate doesn't offer an Ice Lake processor. Instead, Acer uses a Core i7-10510U quad-core processor that is based on Intel's Comet Lake architecture. This ULV model (TDP: 15 watts) operates at a base speed of 1.8 GHz. This can be increased to 4.3 GHz (four cores) or 4.9 GHz (one core) via Turbo.
The processor works through the multithread tests of the Cinebench benchmarks at 3.8 to 4.2 GHz for a short time. The clock rate then drops to 3.1 to 3.3 GHz. Moreover, the single-thread tests are run at 4.3 to 4.9 GHz. On battery power, the speeds are 1.8 to 2.2 GHz (multithread) and 1.4 to 1.8 GHz (single-thread).

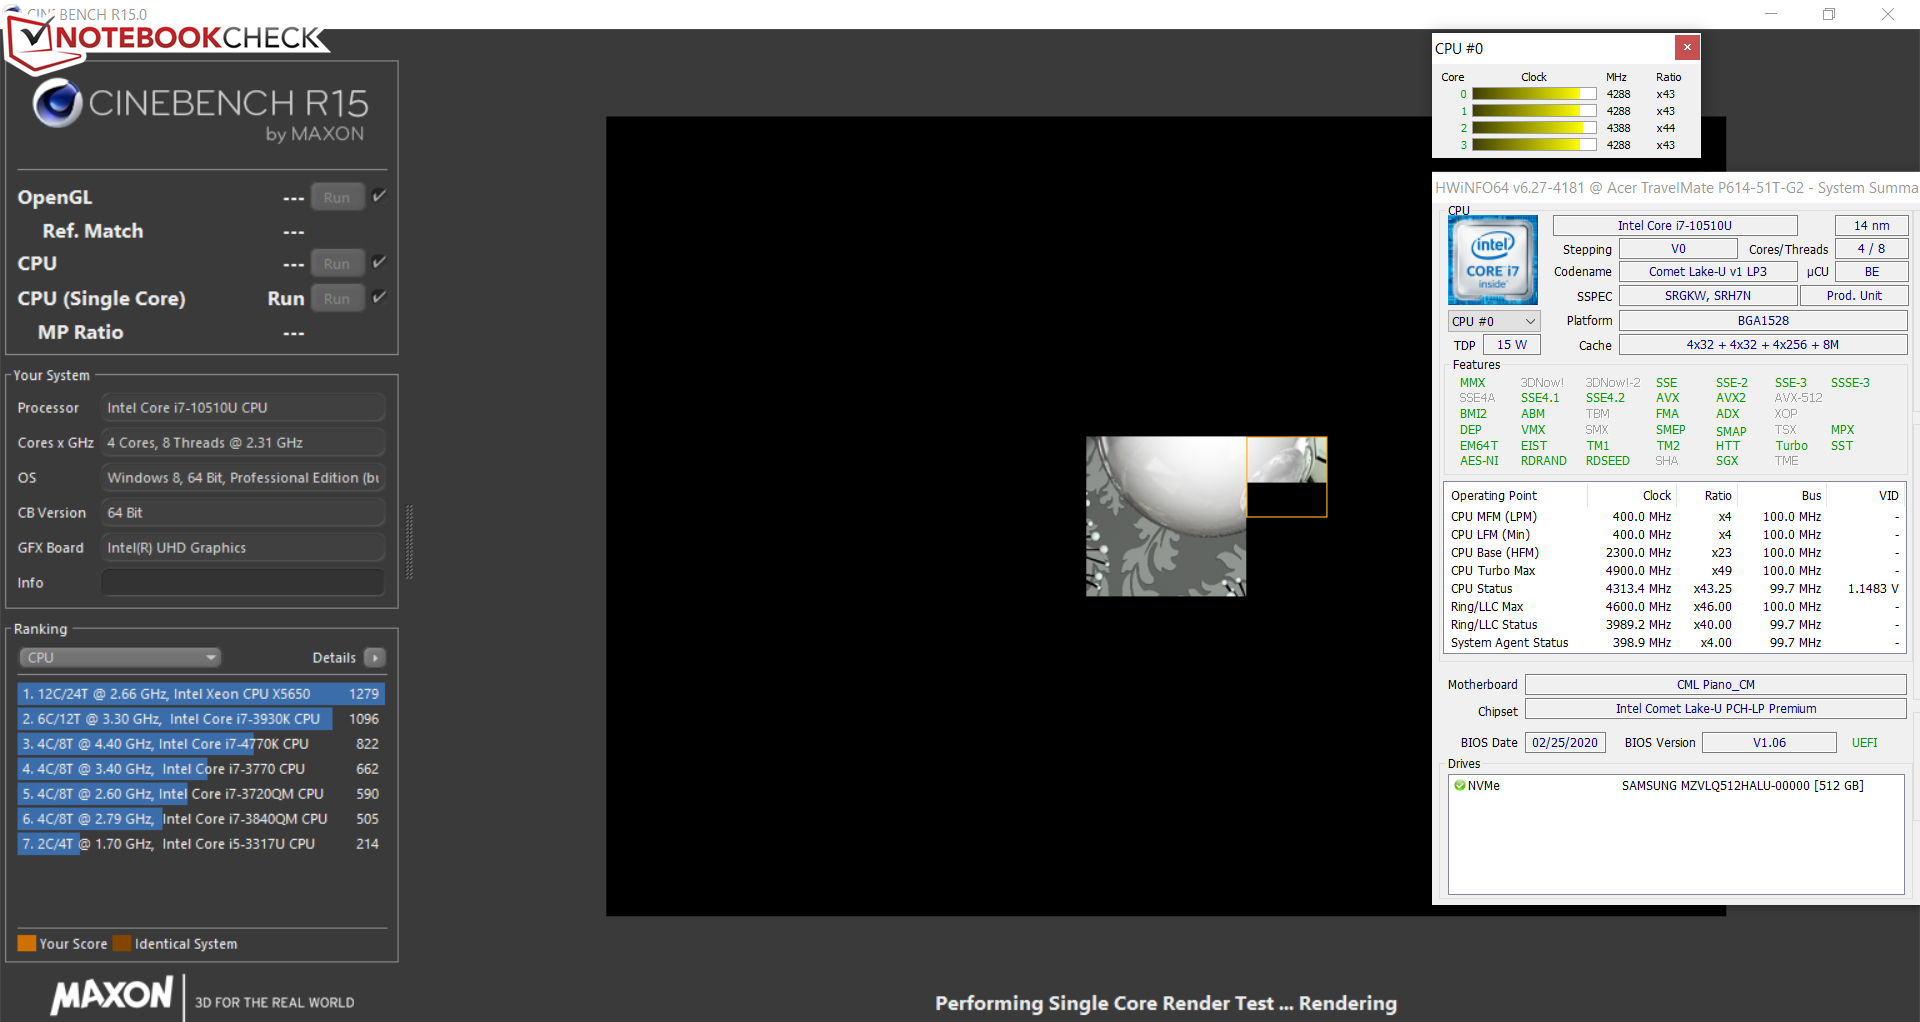
We verify if the CPU Turbo is used consistently when plugged in by running the Cinebench R15 benchmark's multithread test in a continuous loop for at least 30 minutes. The results remain at a quite constant level throughout. Turbo is used to a relatively small extent.
* ... smaller is better
System performance
The system works well and smoothly, and we didn't encounter any problems. The built-in Core i7 processor provides enough computing power for office and Internet applications. This is accompanied by good results in the PCMark benchmarks.
| PCMark 8 Home Score Accelerated v2 | 3323 points | |
| PCMark 8 Creative Score Accelerated v2 | 3981 points | |
| PCMark 8 Work Score Accelerated v2 | 5171 points | |
| PCMark 10 Score | 4438 points | |
Help | ||
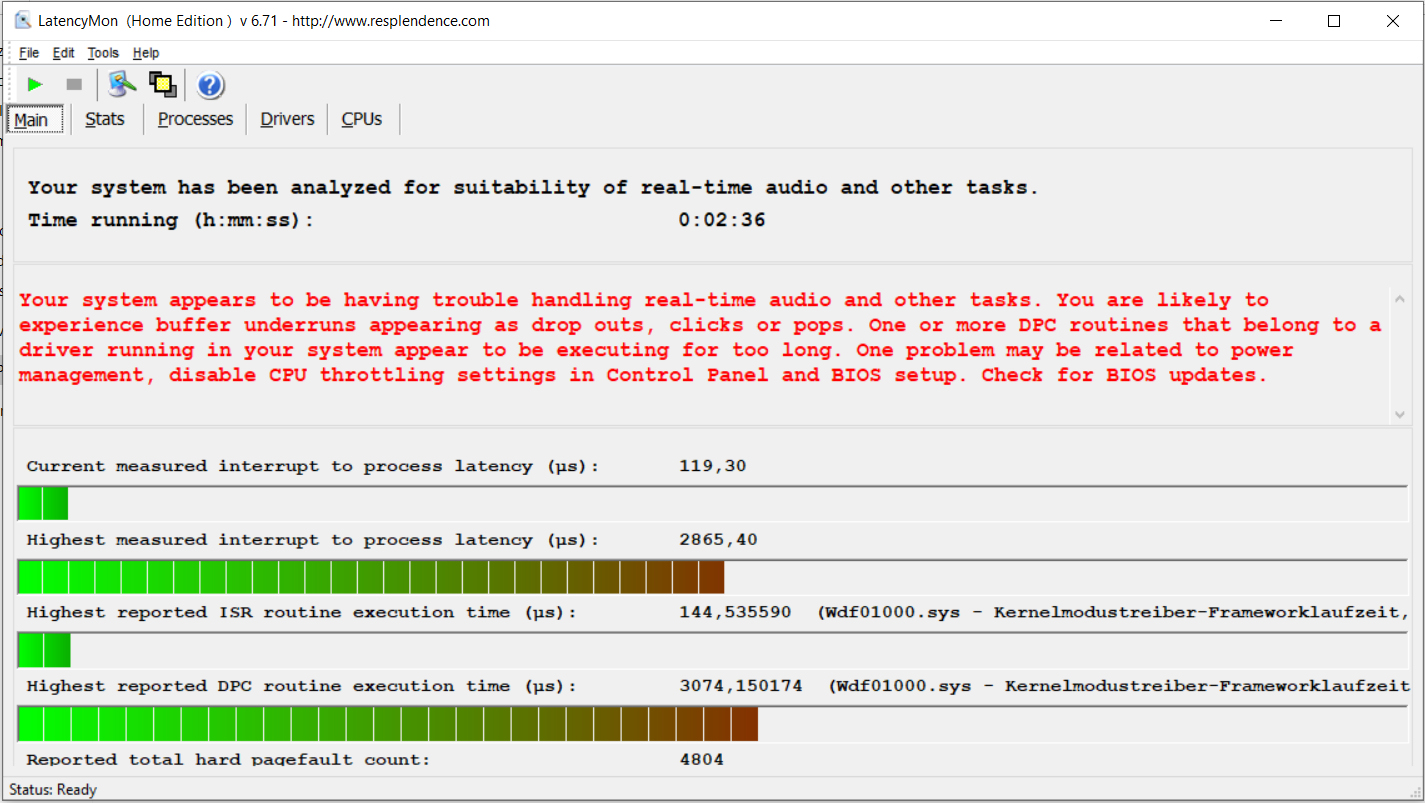
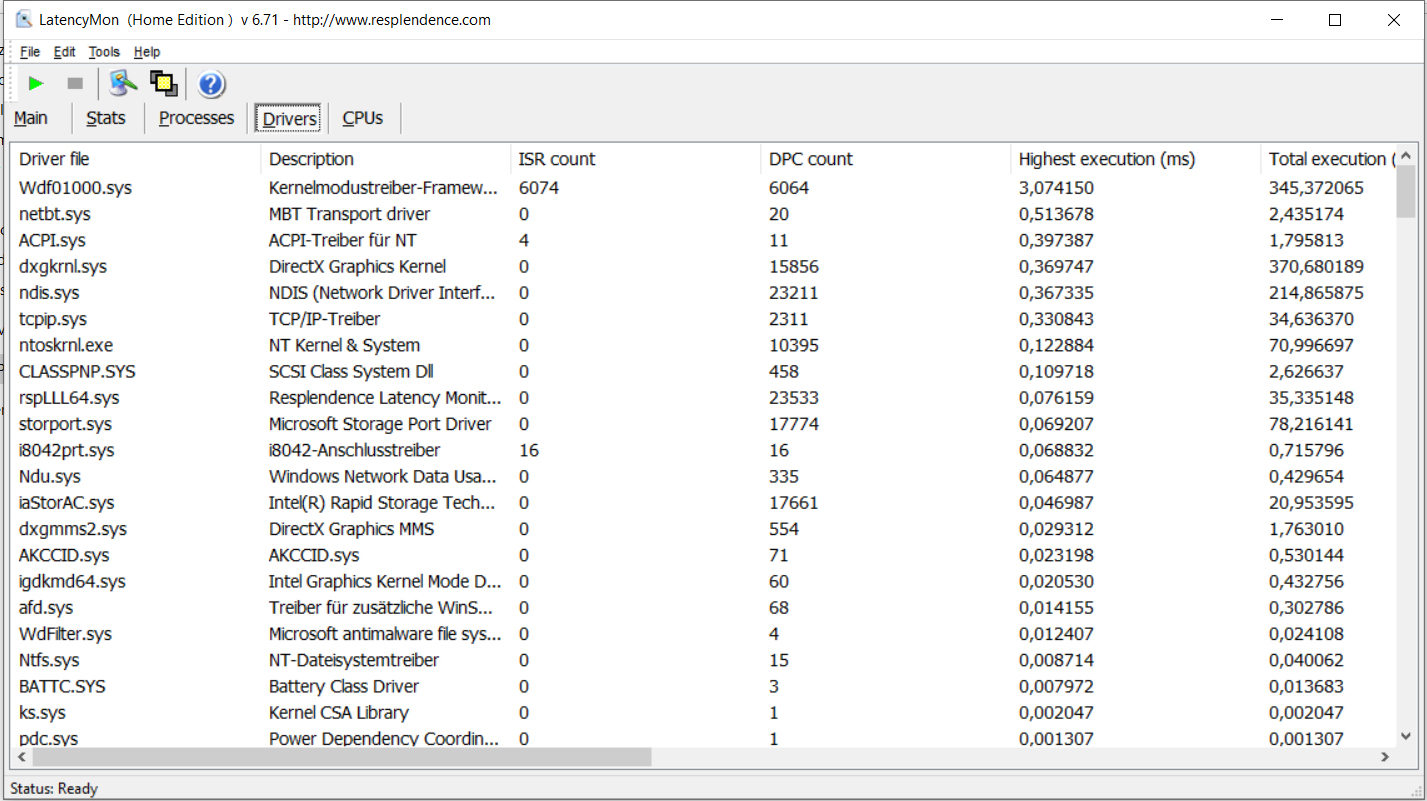
DPC latencies
In our standardized latency monitor test (web surfing, 4K video playback, high-load Prime95), we could observe issues with the DPC latencies. The system doesn't seem to be suitable for real-time video and audio-editing.
| DPC Latencies / LatencyMon - interrupt to process latency (max), Web, Youtube, Prime95 | |
| Acer TravelMate P6 P614-51T-G2-72ZU | |
| Asus ZenBook 13 UX325JA | |
| Lenovo ThinkPad T14s-20T00044GE | |
| Lenovo ThinkPad T14s-20UJS00K00 | |
| HP ProBook 445 G7 175W4EA | |
| Dell Latitude 7410 | |
| Lenovo ThinkPad X1 Carbon 2020-20UAS04T00 | |
* ... smaller is better
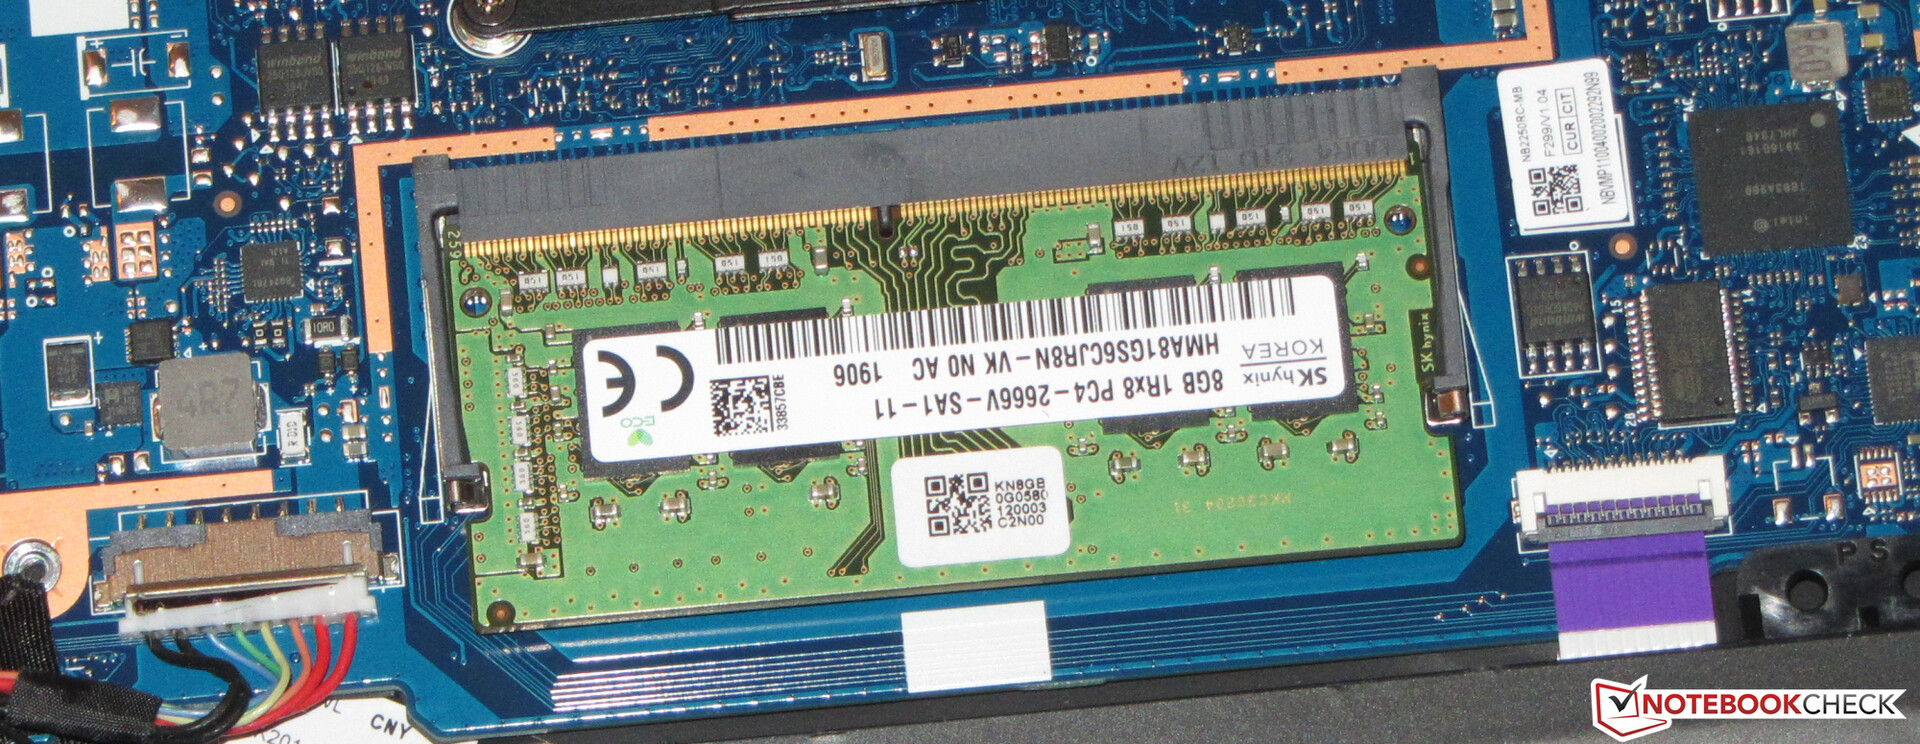
Storage
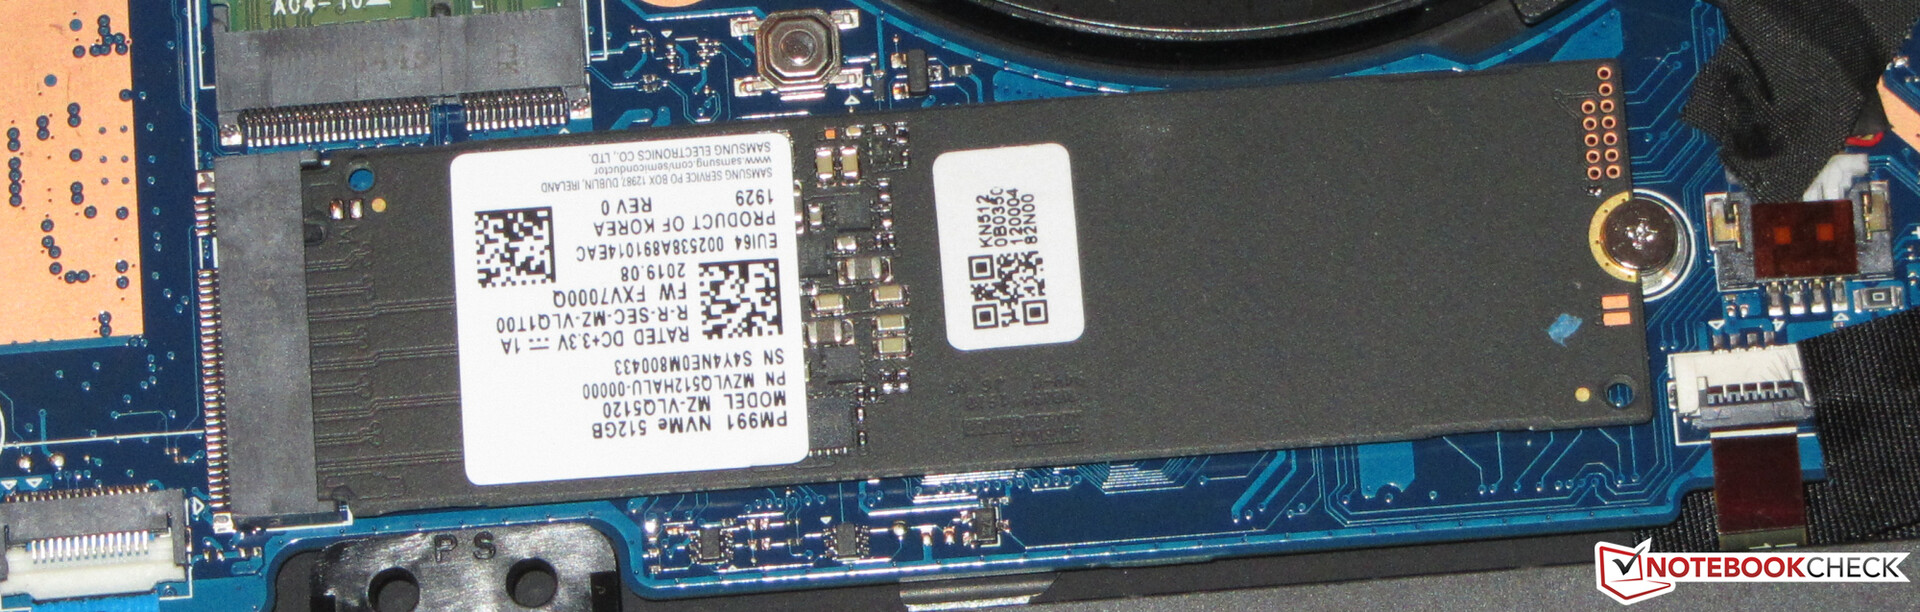
The system drive is a 512 GB NVMe SSD (M.2 2280) from Samsung that provides good transfer speeds. The laptop doesn't offer space for further storage drives.

| Acer TravelMate P6 P614-51T-G2-72ZU Samsung PM991 MZVLQ512HALU | Lenovo ThinkPad X1 Carbon 2020-20UAS04T00 Samsung SSD PM981a MZVLB512HBJQ | Lenovo ThinkPad T14s-20T00044GE Samsung SSD PM981a MZVLB256HBHQ | Lenovo ThinkPad T14s-20UJS00K00 WDC PC SN730 SDBPNTY-1T00 | Dell Latitude 7410 Toshiba XG6 KXG60ZNV512G | Asus ZenBook 13 UX325JA Intel SSD 660p 1TB SSDPEKNW010T8 | Apple MacBook Pro 13 2020 2GHz i5 10th-Gen Apple SSD SM0512F | HP ProBook 445 G7 175W4EA Samsung PM991 MZVLQ512HALU | Average Samsung PM991 MZVLQ512HALU | |
|---|---|---|---|---|---|---|---|---|---|
| CrystalDiskMark 5.2 / 6 | 34% | 13% | 27% | 25% | -2% | -21% | -8% | -6% | |
| Write 4K (MB/s) | 151.8 | 185 22% | 117.5 -23% | 108 -29% | 133.4 -12% | 139.7 -8% | 28.16 -81% | 144.6 -5% | 131.8 ? -13% |
| Read 4K (MB/s) | 55 | 50.6 -8% | 40.81 -26% | 39.82 -28% | 51.3 -7% | 56.4 3% | 17.5 -68% | 38.08 -31% | 44.9 ? -18% |
| Write Seq (MB/s) | 1292 | 1543 19% | 2031 57% | 2028 57% | 1897 47% | 1265 -2% | 1195 -8% | 1320 2% | 1162 ? -10% |
| Read Seq (MB/s) | 1668 | 1509 -10% | 1970 18% | 1826 9% | 2202 32% | 1492 -11% | 1470 -12% | 1397 -16% | 1473 ? -12% |
| Write 4K Q32T1 (MB/s) | 440.7 | 488.8 11% | 395.5 -10% | 570 29% | 384.9 -13% | 402.5 -9% | 205 -53% | 324.2 -26% | 399 ? -9% |
| Read 4K Q32T1 (MB/s) | 477.4 | 579 21% | 361.4 -24% | 401.5 -16% | 318.7 -33% | 329.3 -31% | 692 45% | 434.8 -9% | 426 ? -11% |
| Write Seq Q32T1 (MB/s) | 1169 | 2986 155% | 2330 99% | 3091 164% | 2866 145% | 1786 53% | 1475 26% | 1382 18% | 1348 ? 15% |
| Read Seq Q32T1 (MB/s) | 2245 | 3555 58% | 2530 13% | 2872 28% | 3122 39% | 1923 -14% | 1920 -14% | 2354 5% | 2398 ? 7% |
| AS SSD | 61% | 6% | 34% | -7% | -21% | -79% | -2% | -6% | |
| Seq Read (MB/s) | 2057 | 2659 29% | 2631 28% | 2291 11% | 1837 -11% | 1587 -23% | 1300 -37% | 1936 -6% | 1921 ? -7% |
| Seq Write (MB/s) | 1244 | 2551 105% | 1191 -4% | 1343 8% | 1438 16% | 938 -25% | 1518 22% | 1213 -2% | 1128 ? -9% |
| 4K Read (MB/s) | 48.07 | 56.4 17% | 44.76 -7% | 42.56 -11% | 48.1 0% | 51 6% | 14.09 -71% | 44.09 -8% | 47.6 ? -1% |
| 4K Write (MB/s) | 125.8 | 158 26% | 124.7 -1% | 132.2 5% | 132.1 5% | 141.9 13% | 24.25 -81% | 118.5 -6% | 137.9 ? 10% |
| 4K-64 Read (MB/s) | 875 | 1317 51% | 756 -14% | 850 -3% | 660 -25% | 576 -34% | 725 -17% | 867 -1% | 878 ? 0% |
| 4K-64 Write (MB/s) | 785 | 1786 128% | 1300 66% | 2262 188% | 1163 48% | 584 -26% | 169.6 -78% | 838 7% | 782 ? 0% |
| Access Time Read * (ms) | 0.047 | 0.089 | 0.05 | 0.059 | 0.083 | 0.172 | 0.122 | 0.09367 ? | |
| Access Time Write * (ms) | 0.031 | 0.024 23% | 0.03 3% | 0.028 10% | 0.096 -210% | 0.04 -29% | 0.155 -400% | 0.034 -10% | 0.03708 ? -20% |
| Score Read (Points) | 1129 | 1640 45% | 1064 -6% | 1121 -1% | 891 -21% | 785 -30% | 869 -23% | 1105 -2% | 1118 ? -1% |
| Score Write (Points) | 1035 | 2199 112% | 1544 49% | 2529 144% | 1439 39% | 820 -21% | 346 -67% | 1078 4% | 1033 ? 0% |
| Score Total (Points) | 2712 | 4682 73% | 3090 14% | 4185 54% | 2780 3% | 1990 -27% | 1667 -39% | 2721 0% | 2694 ? -1% |
| Copy ISO MB/s (MB/s) | 1600 | 1813 13% | 2546 59% | 2089 31% | 1311 -18% | 1347 ? -16% | |||
| Copy Program MB/s (MB/s) | 517 | 524 1% | 428.6 -17% | 548 6% | 310.3 -40% | 421 ? -19% | |||
| Copy Game MB/s (MB/s) | 1009 | 350.5 -65% | 943 -7% | 1226 22% | 801 -21% | 825 ? -18% | |||
| Total Average (Program / Settings) | 48% /
49% | 10% /
9% | 31% /
31% | 9% /
5% | -12% /
-14% | -50% /
-53% | -5% /
-5% | -6% /
-6% |
* ... smaller is better
Continuous load read: DiskSpd Read Loop, Queue Depth 8
Graphics card
Intel's UHD Graphics 620 graphics core is responsible for graphics output. It supports DirectX 12 and operates at speeds of up to 1,150 MHz. Moreover, the 3DMark results are at a normal level for this GPU.
| 3DMark 11 Performance | 2250 points | |
| 3DMark Ice Storm Standard Score | 72931 points | |
| 3DMark Cloud Gate Standard Score | 10028 points | |
| 3DMark Fire Strike Score | 1230 points | |
Help | ||
Gaming performance
The Acer laptop brings some of the games in our database onto the screen smoothly - at low resolutions and low quality settings. This includes titles that only have moderate hardware requirements.
| BioShock Infinite - 1366x768 High Preset | |
| Asus ZenBook 13 UX325JA | |
| Acer TravelMate P6 P614-51T-G2-72ZU | |
| Average Intel UHD Graphics 620 (8.1 - 35.9, n=187) | |
| low | med. | high | ultra | |
|---|---|---|---|---|
| Tomb Raider (2013) | 114.4 | 56.5 | 36 | 16.4 |
| BioShock Infinite (2013) | 79.2 | 42.7 | 35.8 | 11.5 |
| Dota 2 Reborn (2015) | 77.8 | 50.3 | 22 | 19.6 |
| X-Plane 11.11 (2018) | 20.3 | 13.4 | 12.8 | |
| Total War: Three Kingdoms (2019) | 29.5 | 7.9 | 4.6 | 3.2 |
| F1 2020 (2020) | 28 | 13 | 10 |
Emissions - The P614 only generates a little noise
Noise emissions
A work tool should generate as little noise as possible, and the TravelMate does not disappoint in this regard. In idle usage, the fan is usually quiet and silence prevails. Nonetheless, it turns up a bit under load. As a result, we register a maximum sound pressure level of 35 dB(A) in the medium load range. During the stress test, the level is 32.8 dB(A). Unfortunately, we could hear a rippling sound coming from inside the laptop during the stress test.
Noise level
| Idle |
| 27 / 27 / 27 dB(A) |
| Load |
| 35 / 32.8 dB(A) |
 | ||
30 dB silent 40 dB(A) audible 50 dB(A) loud |
||
min: | ||
| Acer TravelMate P6 P614-51T-G2-72ZU i7-10510U, UHD Graphics 620 | Lenovo ThinkPad X1 Carbon 2020-20UAS04T00 i7-10510U, UHD Graphics 620 | Lenovo ThinkPad T14s-20T00044GE i5-10210U, UHD Graphics 620 | Lenovo ThinkPad T14s-20UJS00K00 R7 PRO 4750U, Vega 7 | Dell Latitude 7410 i7-10610U, UHD Graphics 620 | Asus ZenBook 13 UX325JA i7-1065G7, Iris Plus Graphics G7 (Ice Lake 64 EU) | Apple MacBook Pro 13 2020 2GHz i5 10th-Gen i5-1038NG7, Iris Plus Graphics G7 (Ice Lake 64 EU) | Average Intel UHD Graphics 620 | Average of class Office | |
|---|---|---|---|---|---|---|---|---|---|
| Noise | -5% | -2% | -3% | -4% | -9% | -11% | -7% | 2% | |
| off / environment * (dB) | 27 | 29.5 -9% | 29.3 -9% | 29.2 -8% | 28.1 -4% | 30.1 -11% | 29.6 -10% | 29 ? -7% | 24.2 ? 10% |
| Idle Minimum * (dB) | 27 | 29.5 -9% | 29.3 -9% | 29.2 -8% | 28.1 -4% | 30.1 -11% | 29.6 -10% | 29.1 ? -8% | 24.4 ? 10% |
| Idle Average * (dB) | 27 | 29.5 -9% | 29.3 -9% | 29.2 -8% | 28.1 -4% | 30.1 -11% | 29.6 -10% | 29.1 ? -8% | 24.6 ? 9% |
| Idle Maximum * (dB) | 27 | 29.5 -9% | 29.3 -9% | 29.6 -10% | 28.1 -4% | 30.1 -11% | 29.6 -10% | 29.7 ? -10% | 25.4 ? 6% |
| Load Average * (dB) | 35 | 31.6 10% | 30 14% | 30.2 14% | 30 14% | 32.7 7% | 34.4 2% | 33.5 ? 4% | 33.7 ? 4% |
| Load Maximum * (dB) | 32.8 | 33.9 -3% | 30 9% | 32.3 2% | 39.3 -20% | 38.5 -17% | 42.1 -28% | 36.1 ? -10% | 41 ? -25% |
| Witcher 3 ultra * (dB) | 32.3 | 38.6 | 36.1 |
* ... smaller is better
Temperature
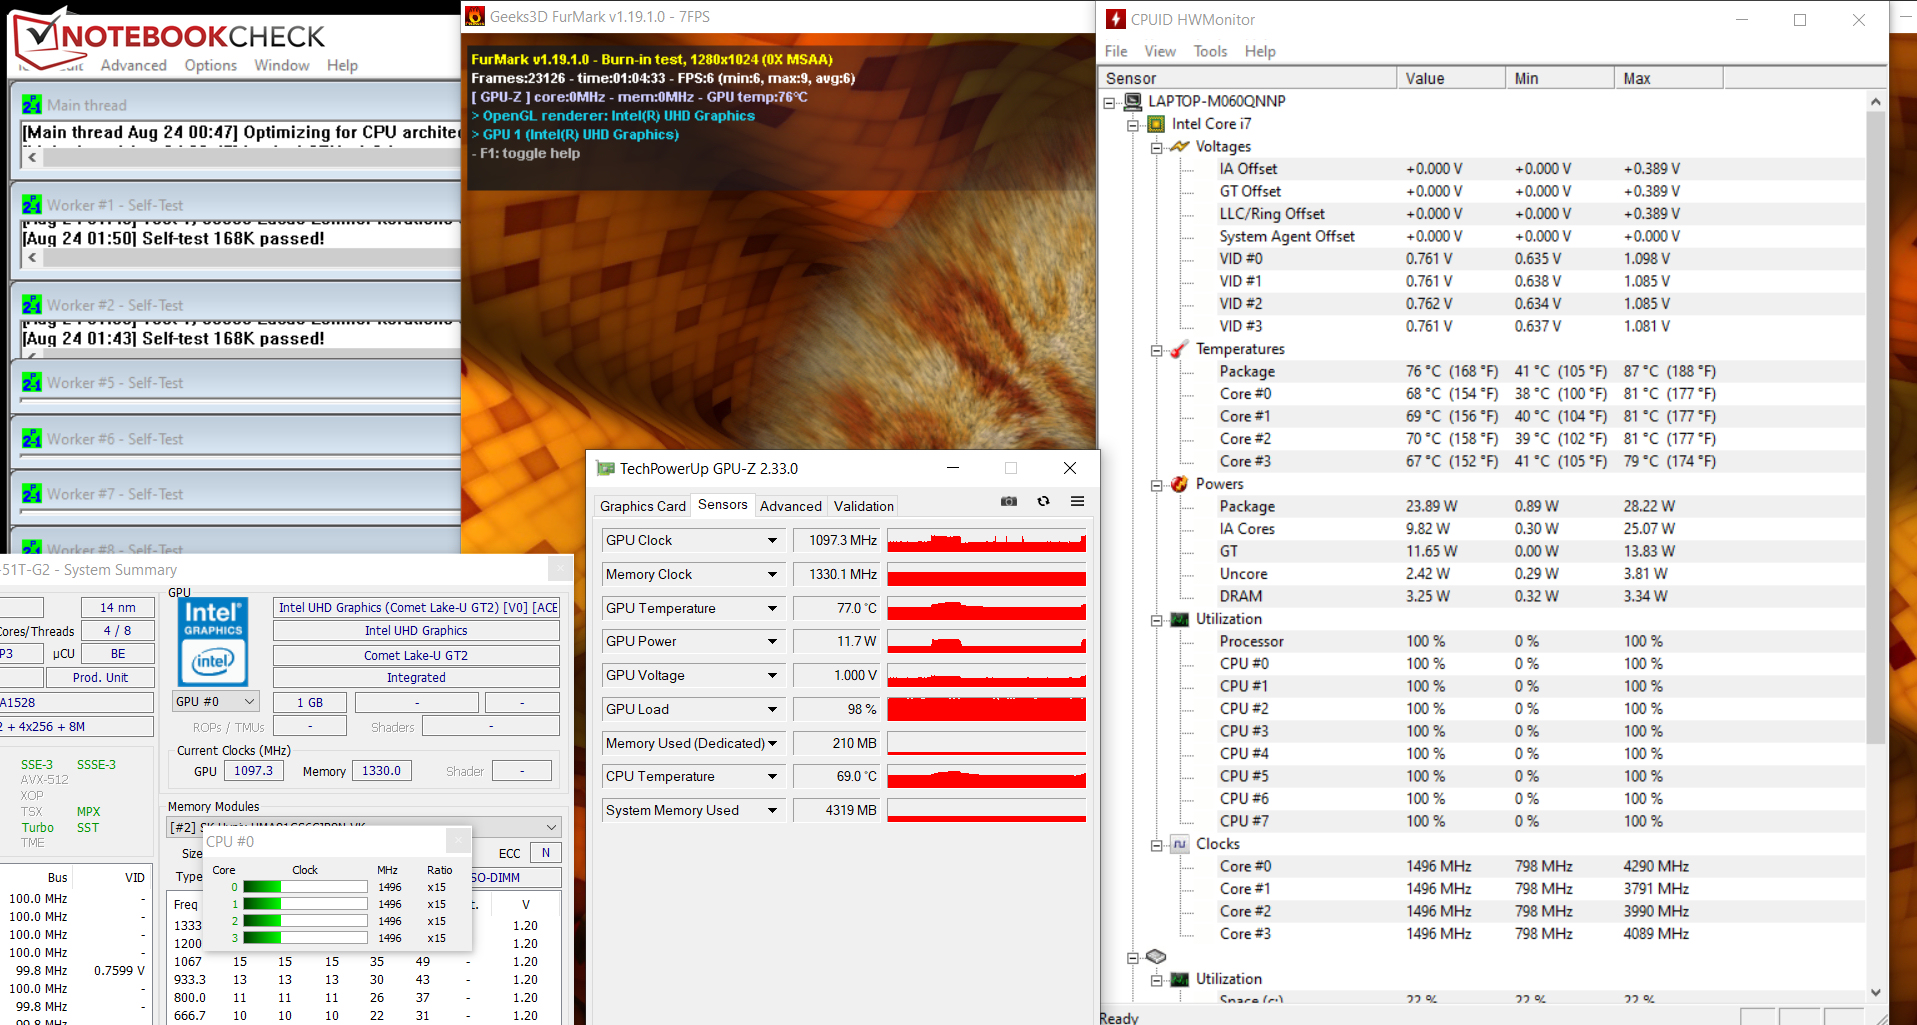
The laptop runs the stress test (Prime95 and FurMark run for at least an hour) in the same way both plugged in and on battery power. From an initial 1.8 to 2.6 GHz, the CPU clock speed drops to between 1.4 and 1.5 GHz. The graphics core runs at 800 to 1,100 MHz. The stress test represents an extreme scenario that doesn't occur in everyday life. With this test we check whether the system remains stable even under full load.
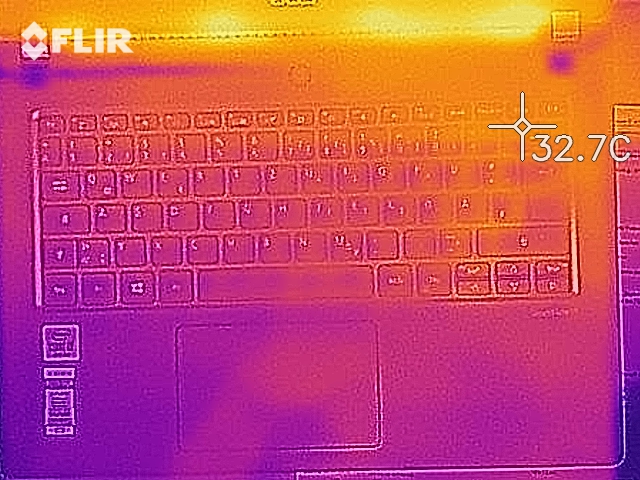
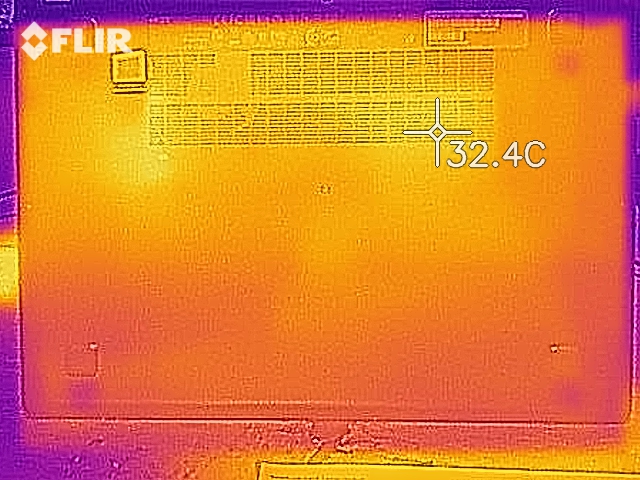
The Acer P6 doesn't heat up in a particularly strong way. During the stress test, we register temperatures in the lower 40 °C range at two measuring points. The values are consistently in the green range in everyday use.
(±) The maximum temperature on the upper side is 40.4 °C / 105 F, compared to the average of 34.3 °C / 94 F, ranging from 21.2 to 62.5 °C for the class Office.
(±) The bottom heats up to a maximum of 40 °C / 104 F, compared to the average of 36.8 °C / 98 F
(+) In idle usage, the average temperature for the upper side is 27.6 °C / 82 F, compared to the device average of 29.5 °C / 85 F.
(+) The palmrests and touchpad are cooler than skin temperature with a maximum of 29.7 °C / 85.5 F and are therefore cool to the touch.
(-) The average temperature of the palmrest area of similar devices was 27.5 °C / 81.5 F (-2.2 °C / -4 F).
| Acer TravelMate P6 P614-51T-G2-72ZU i7-10510U, UHD Graphics 620 | Lenovo ThinkPad X1 Carbon 2020-20UAS04T00 i7-10510U, UHD Graphics 620 | Lenovo ThinkPad T14s-20T00044GE i5-10210U, UHD Graphics 620 | Lenovo ThinkPad T14s-20UJS00K00 R7 PRO 4750U, Vega 7 | Dell Latitude 7410 i7-10610U, UHD Graphics 620 | Asus ZenBook 13 UX325JA i7-1065G7, Iris Plus Graphics G7 (Ice Lake 64 EU) | Apple MacBook Pro 13 2020 2GHz i5 10th-Gen i5-1038NG7, Iris Plus Graphics G7 (Ice Lake 64 EU) | Average Intel UHD Graphics 620 | Average of class Office | |
|---|---|---|---|---|---|---|---|---|---|
| Heat | 0% | -1% | -1% | -9% | 1% | 6% | -1% | 0% | |
| Maximum Upper Side * (°C) | 40.4 | 45.2 -12% | 47.1 -17% | 44.7 -11% | 44.6 -10% | 39.7 2% | 40.7 -1% | 41.1 ? -2% | 40.6 ? -0% |
| Maximum Bottom * (°C) | 40 | 45.7 -14% | 45.7 -14% | 44.6 -12% | 48.4 -21% | 39.9 -0% | 39.4 1% | 44.3 ? -11% | 42.8 ? -7% |
| Idle Upper Side * (°C) | 28.8 | 24.7 14% | 24.9 14% | 25.6 11% | 28.8 -0% | 28.7 -0% | 25.4 12% | 26.8 ? 7% | 27.2 ? 6% |
| Idle Bottom * (°C) | 28.6 | 25 13% | 24.8 13% | 25.6 10% | 29.8 -4% | 28.5 -0% | 25.1 12% | 27.7 ? 3% | 28.4 ? 1% |
* ... smaller is better
Speakers
The stereo speakers are located above the keyboard below a perforated section. They produce a decent sound that lacks bass. Moreover, the maximum volume is relatively low.
Acer TravelMate P6 P614-51T-G2-72ZU audio analysis
(-) | not very loud speakers (68.3 dB)
Bass 100 - 315 Hz
(-) | nearly no bass - on average 20.1% lower than median
(±) | linearity of bass is average (12.7% delta to prev. frequency)
Mids 400 - 2000 Hz
(+) | balanced mids - only 2.6% away from median
(±) | linearity of mids is average (7.3% delta to prev. frequency)
Highs 2 - 16 kHz
(±) | higher highs - on average 5.4% higher than median
(+) | highs are linear (2.7% delta to prev. frequency)
Overall 100 - 16.000 Hz
(±) | linearity of overall sound is average (19.3% difference to median)
Compared to same class
» 38% of all tested devices in this class were better, 7% similar, 55% worse
» The best had a delta of 7%, average was 21%, worst was 53%
Compared to all devices tested
» 47% of all tested devices were better, 8% similar, 46% worse
» The best had a delta of 4%, average was 24%, worst was 134%
Energy management - Not lacking endurance
Energy consumption
The power consumption is at a normal level for the hardware installed here. In idle usage, we register a maximum power consumption of 9.5 watts. The stress test (Prime95 and FurMark run for at least an hour) lets the power consumption rise up to 36 watts. Furthermore, the maximum consumption is reached at 42 watts in the medium load range. The power adapter's output is 65 watts.
| Off / Standby | |
| Idle | |
| Load |
|
Key:
min: | |
| Acer TravelMate P6 P614-51T-G2-72ZU i7-10510U, UHD Graphics 620 | Lenovo ThinkPad X1 Carbon 2020-20UAS04T00 i7-10510U, UHD Graphics 620 | Lenovo ThinkPad T14s-20T00044GE i5-10210U, UHD Graphics 620 | Lenovo ThinkPad T14s-20UJS00K00 R7 PRO 4750U, Vega 7 | Dell Latitude 7410 i7-10610U, UHD Graphics 620 | Asus ZenBook 13 UX325JA i7-1065G7, Iris Plus Graphics G7 (Ice Lake 64 EU) | Apple MacBook Pro 13 2020 2GHz i5 10th-Gen i5-1038NG7, Iris Plus Graphics G7 (Ice Lake 64 EU) | Average Intel UHD Graphics 620 | Average of class Office | |
|---|---|---|---|---|---|---|---|---|---|
| Power Consumption | -18% | -1% | -30% | -22% | 11% | -39% | -11% | -30% | |
| Idle Minimum * (Watt) | 3.6 | 2.96 18% | 2.6 28% | 5.7 -58% | 3.7 -3% | 2.4 33% | 3.8 -6% | 3.81 ? -6% | 4.44 ? -23% |
| Idle Average * (Watt) | 5.8 | 5.9 -2% | 5.5 5% | 8.9 -53% | 6.2 -7% | 4.6 21% | 8.6 -48% | 6.94 ? -20% | 7.38 ? -27% |
| Idle Maximum * (Watt) | 9.5 | 9.1 4% | 7.5 21% | 11 -16% | 7 26% | 9 5% | 10.3 -8% | 8.75 ? 8% | 8.59 ? 10% |
| Load Average * (Watt) | 42 | 42.1 -0% | 28.2 33% | 38.2 9% | 43.2 -3% | 36 14% | 52.1 -24% | 35 ? 17% | 43 ? -2% |
| Load Maximum * (Watt) | 31 | 65.1 -110% | 59.6 -92% | 40.2 -30% | 68.6 -121% | 36 -16% | 65.2 -110% | 47.5 ? -53% | 64.5 ? -108% |
| Witcher 3 ultra * (Watt) | 27 | 48.2 |
* ... smaller is better
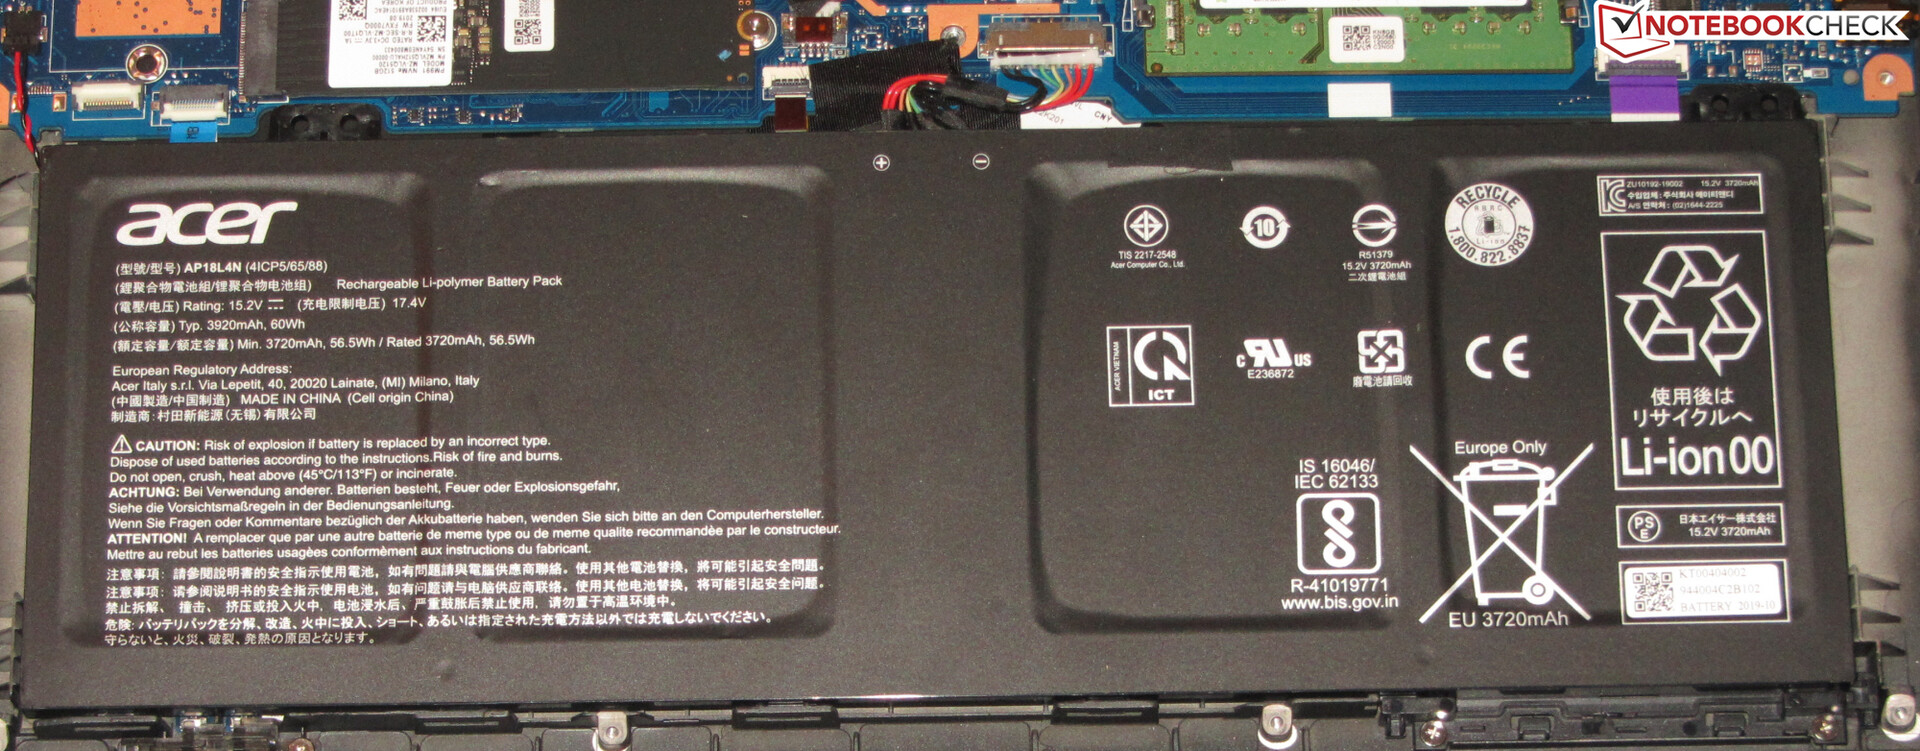
Battery life
The 60 Wh battery in the P614 ensures long battery life. Our WLAN test (accessing websites using a script) and video test (the short film Big Buck Bunny (H.264 encoding, Full HD)) running in a loop) are completed by the 14-incher after 11:16 hours and 12:53 hours, respectively. The maximum runtime is about 26 hours.
| Acer TravelMate P6 P614-51T-G2-72ZU i7-10510U, UHD Graphics 620, 60 Wh | Lenovo ThinkPad X1 Carbon 2020-20UAS04T00 i7-10510U, UHD Graphics 620, 51 Wh | Lenovo ThinkPad T14s-20T00044GE i5-10210U, UHD Graphics 620, 57 Wh | Lenovo ThinkPad T14s-20UJS00K00 R7 PRO 4750U, Vega 7, 57 Wh | Dell Latitude 7410 i7-10610U, UHD Graphics 620, 68 Wh | Asus ZenBook 13 UX325JA i7-1065G7, Iris Plus Graphics G7 (Ice Lake 64 EU), 67 Wh | Apple MacBook Pro 13 2020 2GHz i5 10th-Gen i5-1038NG7, Iris Plus Graphics G7 (Ice Lake 64 EU), 58 Wh | Average of class Office | |
|---|---|---|---|---|---|---|---|---|
| Battery runtime | -13% | 3% | -4% | 17% | 24% | -2% | 1% | |
| Reader / Idle (h) | 25.8 | 31.3 21% | 26.6 3% | 23.7 ? -8% | ||||
| H.264 (h) | 12.9 | 12.8 -1% | 14.7 14% | 13.2 2% | 16.5 28% | 11.5 -11% | 15 ? 16% | |
| WiFi v1.3 (h) | 11.3 | 10.1 -11% | 13.2 17% | 10.2 -10% | 11 -3% | 13.8 22% | 12.1 7% | 12.9 ? 14% |
| Load (h) | 2.2 | 1.6 -27% | 1.7 -23% | 2.1 -5% | 2.9 32% | 3.1 41% | 1.807 ? -18% |
Pros
Cons
Verdict
With the TravelMate P6, Acer delivers a light, compact 14-inch business laptop that is powered by a Core i7 processor based on the Comet Lake generation. The CPU offers more than enough computing power for office and Internet applications. The laptop works quietly and heats up moderately at the most.
With the Acer TravelMate P6 614-51T-G2, you will receive a business work tool that is light, quiet, and offers long battery life.
The battery life is excellent. With one battery charge, the device achieves practical runtimes of 11 to 13 hours. Most users should be able to get through the day without a power adapter. Furthermore, the laptop can be supplied with energy using the included proprietary power adapter or a universal USB power adapter (via the Thunderbolt 3 port).
The well-rounded port configuration can be extended if necessary using a docking station - the Thunderbolt 3 port makes it possible. The latter would also allow the connection of an external GPU. Our test device doesn't offer an LTE modem, and none can be retrofitted either. Within the TravelMate P6 series, however, there are correspondingly equipped configuration variants available.
The 14-inch touchscreen display scores points with stable viewing angles, a matte surface, decent color reproduction, and acceptable color-space coverage. The brightness and contrast are fundamentally in order, but they should be much better on a laptop in this price range.
Acer TravelMate P6 P614-51T-G2-72ZU
- 08/28/2020 v7 (old)
Sascha Mölck
Price comparison

