Acer TravelMate P6 (2021) Review: Welcome improvements to an already capable business laptop but not without caveats
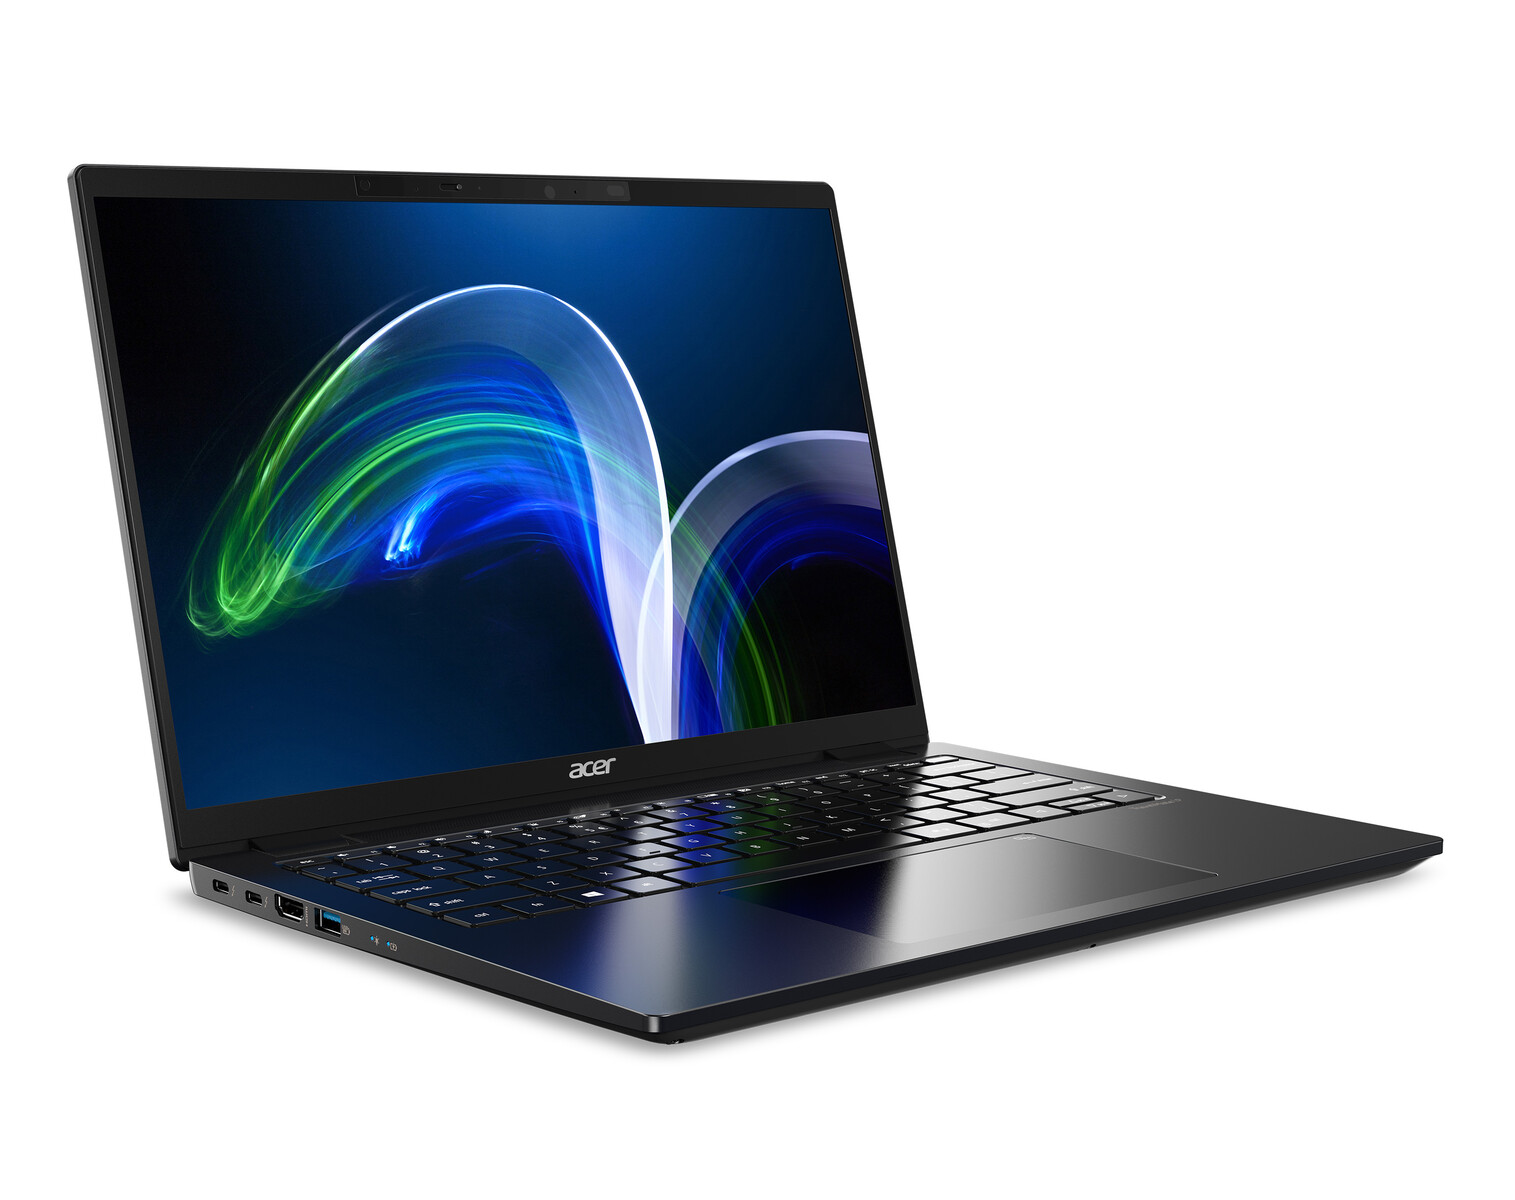
Acer recently refreshed its TravelMate lineup of business laptops with Intel Tiger Lake options. We have with us the Acer TravelMate P6 P614P-52 laptop for review. This year's TravelMate P6 is built according to Intel Evo platform requirements and comes with niceties such as 5G connectivity, a 16:10 display, Thunderbolt 4 ports, and more. The new TravelMate lineup can be expected to be available in the EMEA from September and in North America from December.
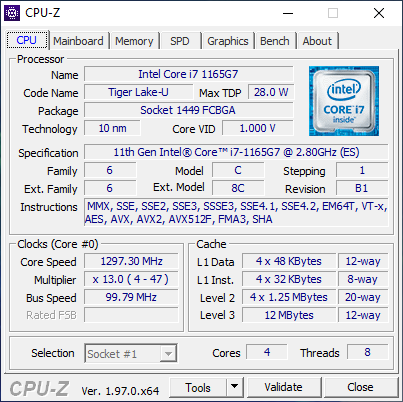
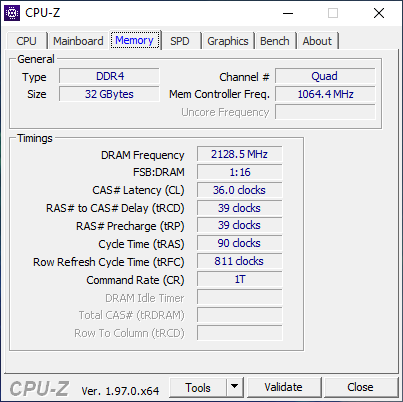
Our test TravelMate P6 P614P-52 device is powered by the Intel Core i7-1165G7 processor, 32 GB LPDDR4X RAM, 1 TB PCIe SSD, and a 14-inch 16:10 FHD display. This model also offers 5G and NFC connectivity. In this review, we evaluate the refreshed TravelMate P6 and see how well it fares against competing business laptops.
Note: Since the new TravelMate P6 is not yet available worldwide, Acer sent us a pre-production unit for evaluation. As such, drivers for the integrated fingerprint reader, Windows Hello camera, Acer User Sensing Technology, etc. were not available officially at the time of this writing. Therefore, we will not be awarding a rating for this device at this point. Acer confirmed to us that the drivers will be available on the official support site sometime in September.
Potential competitors in comparison
Rating | Date | Model | Weight | Height | Size | Resolution | Price |
|---|---|---|---|---|---|---|---|
v (old) | 09 / 2021 | Acer TravelMate P614P-52 i7-1165G7, Iris Xe G7 96EUs | 1 kg | 16.8 mm | 14.00" | 1920x1200 | |
| 89.4 % v7 (old) | 07 / 2021 | Lenovo ThinkPad T14s G2 20WM003TGE i7-1165G7, Iris Xe G7 96EUs | 1.3 kg | 16.14 mm | 14.00" | 1920x1080 | |
| 87.1 % v7 (old) | 03 / 2021 | Asus ExpertBook B9 B9400CE-KC0166R i7-1165G7, Iris Xe G7 96EUs | 995 g | 14.9 mm | 14.00" | 1920x1080 | |
| 88 % v7 (old) | 08 / 2021 | HP EliteBook 830 G8-i7-1165G7 i7-1165G7, Iris Xe G7 96EUs | 1.3 kg | 18 mm | 13.30" | 1920x1080 | |
| 85.5 % v7 (old) | 08 / 2021 | Lenovo ThinkPad E15 G3-20YG003UGE R7 5700U, Vega 8 | 1.8 kg | 18.9 mm | 15.60" | 1920x1080 | |
| 82.1 % v7 (old) | 07 / 2021 | Asus VivoBook S15 D533UA R7 5700U, Vega 8 | 1.8 kg | 16.1 mm | 15.60" | 1920x1080 | |
| 85.4 % v7 (old) | 07 / 2021 | Framework Laptop 13.5 i7-1165G7, Iris Xe G7 96EUs | 1.3 kg | 15.85 mm | 13.50" | 2256x1504 | |
| 89 % v7 (old) | 07 / 2021 | Dell Latitude 9420 2-in-1 i7-1185G7, Iris Xe G7 96EUs | 1.5 kg | 13.94 mm | 14.00" | 2560x1600 | |
| 86.6 % v7 (old) | 12 / 2020 | Razer Book 13 FHD i7-1165G7, Iris Xe G7 96EUs | 1.4 kg | 15.15 mm | 13.40" | 1920x1200 |
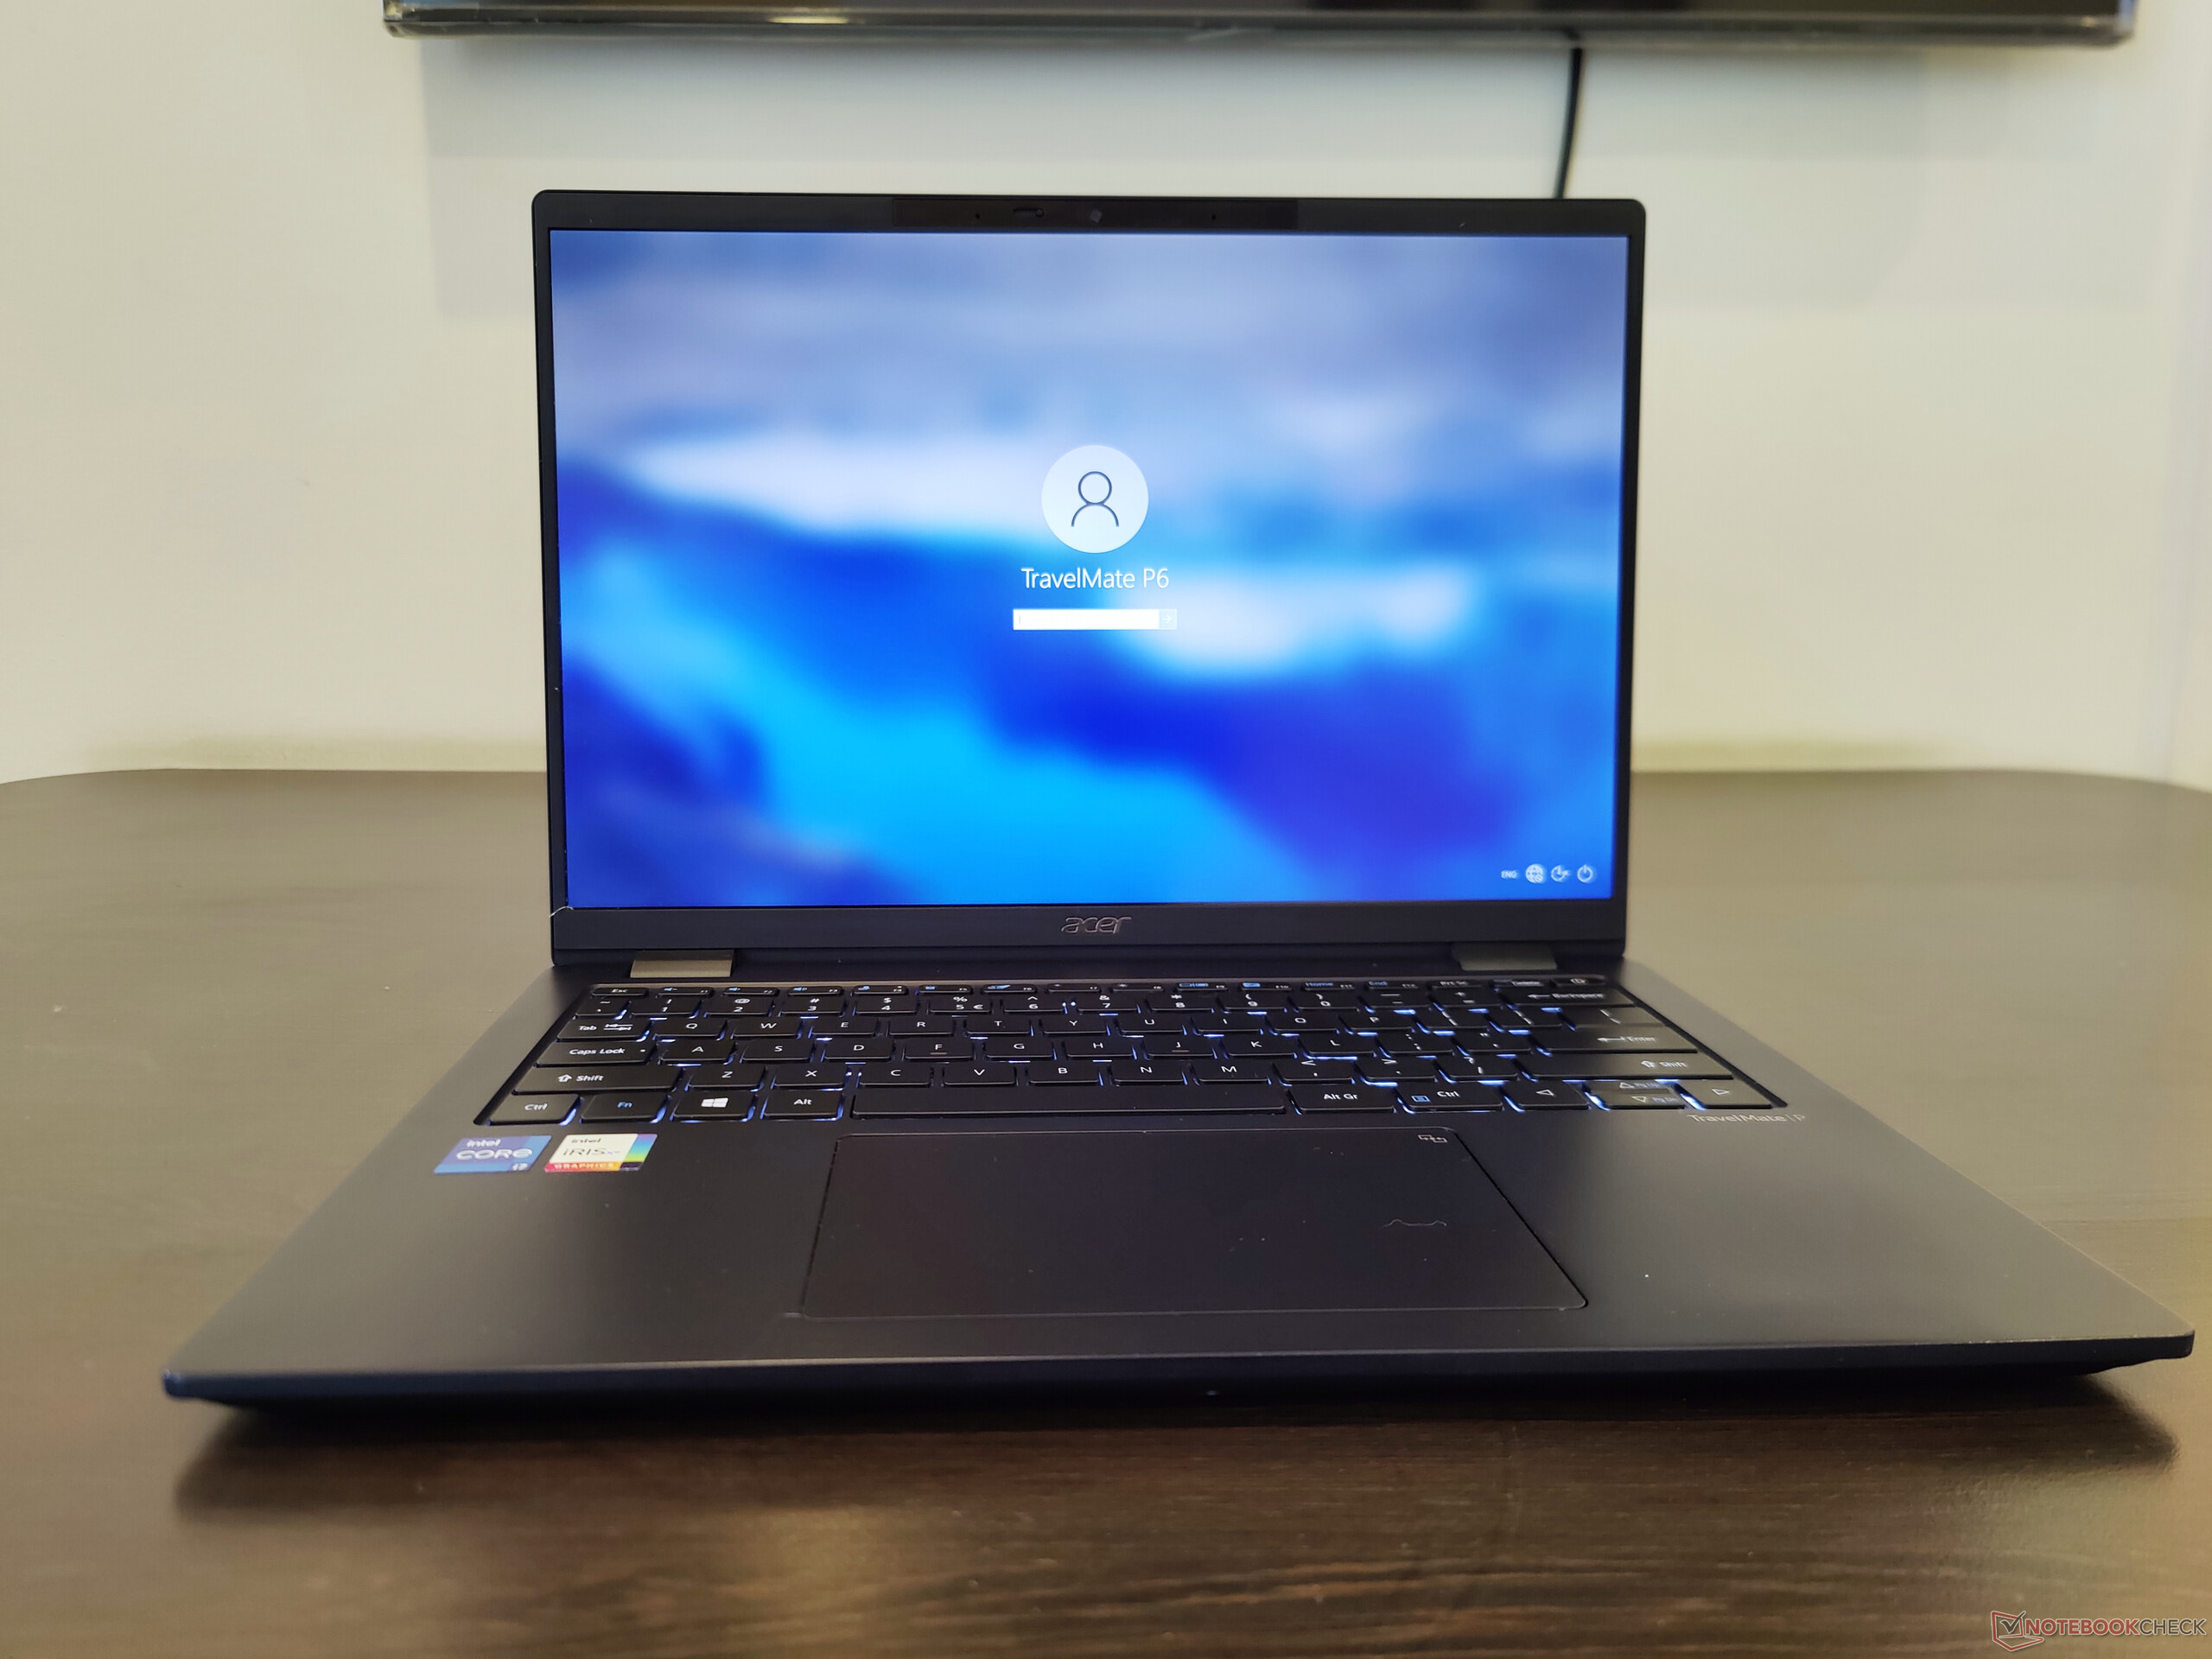
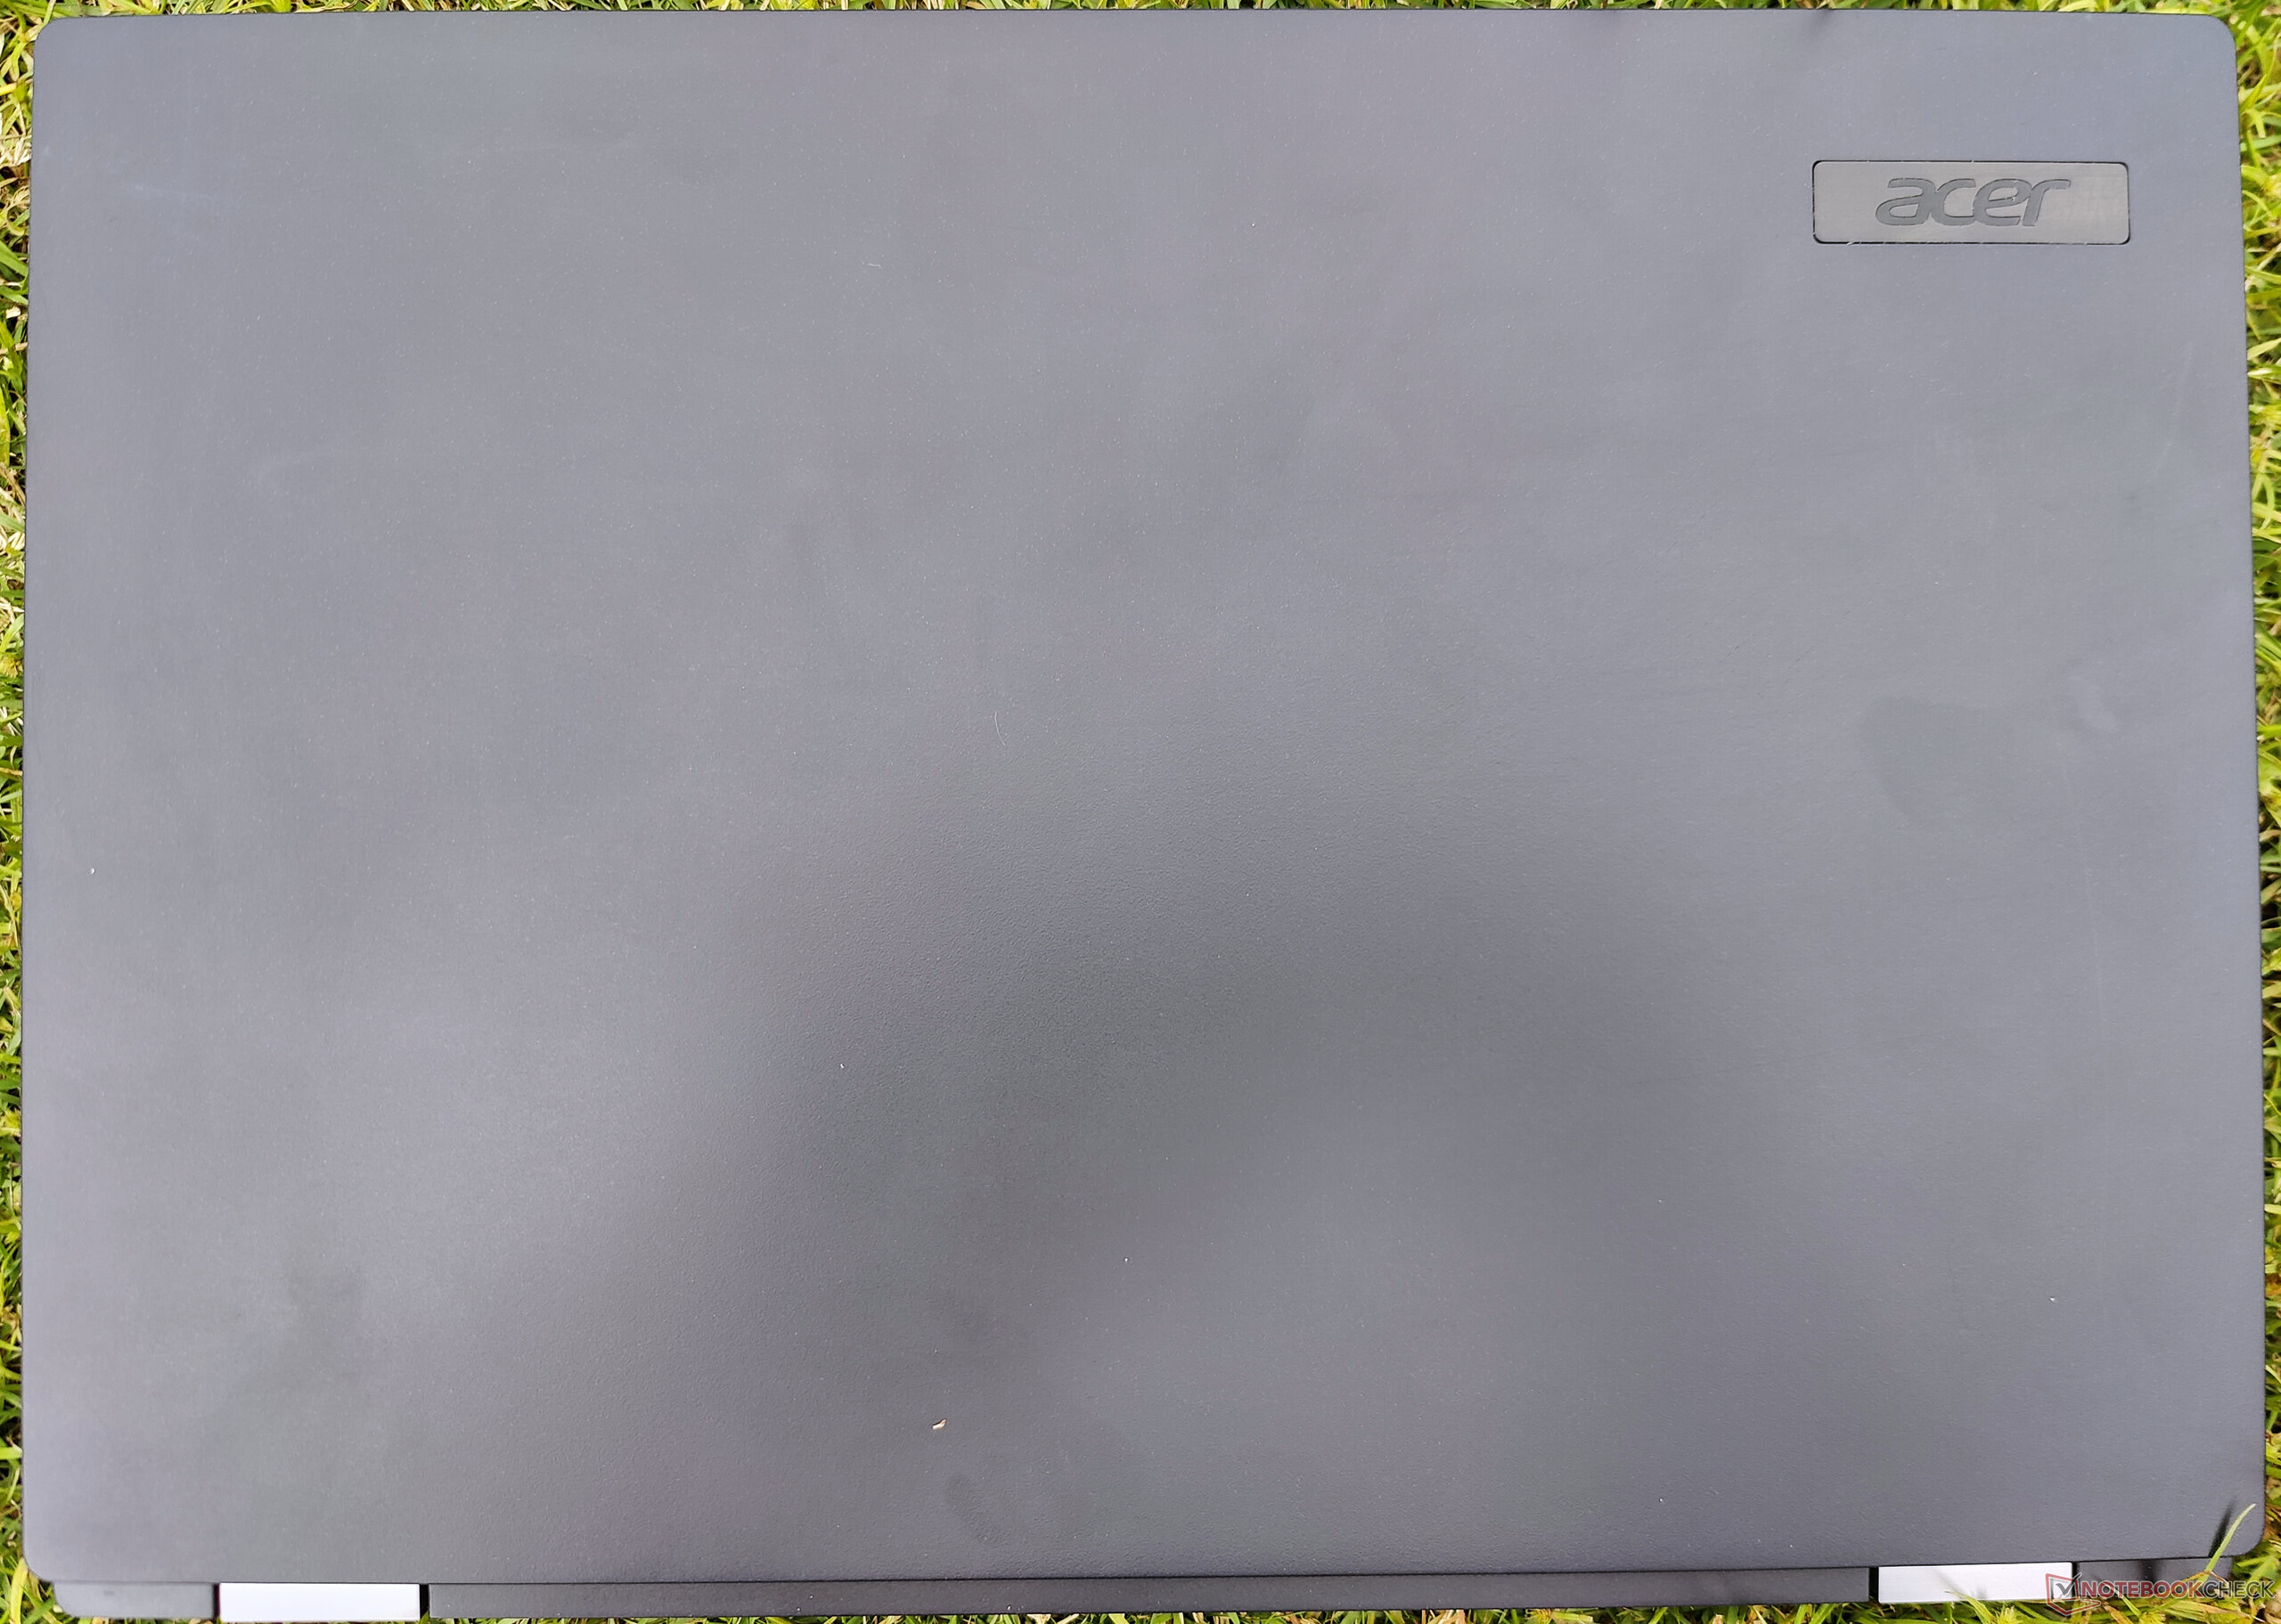
Case: Built for the road yet lightweight
Last year's TravelMate P6 was already among the lightest business laptops around tipping the scales at just 1.17 kg. This year, Acer has further reduced the weight to just 1 kg. The Acer TravelMate P6 P614P-52 is an Intel Evo-certified design but will not turn any heads. It keeps a minimal profile that works great for the intended business audience.
The body is primarily made of an aluminum-magnesium alloy, which is just 16.8 mm thick though the overall texture does feel plasticky. The lid is quite thin and does flex a bit under pressure. That being said, it does not wobble wantonly and the hinges feel quite sturdy as well. We didn't notice any artefacts on the display when pressing the back of the lid.
The lid can be easily lifted with a single finger without causing the laptop to slide and can be rotated fully flat up to 180°. We did not notice any creaks, bends, or sharp corners in the chassis construction except for the inner display bezels, which didn't quite seem to be firmly attached to the LCD panel. According to Acer, the TravelMate P6 is MIL-STD 810H-certified for durable operation.
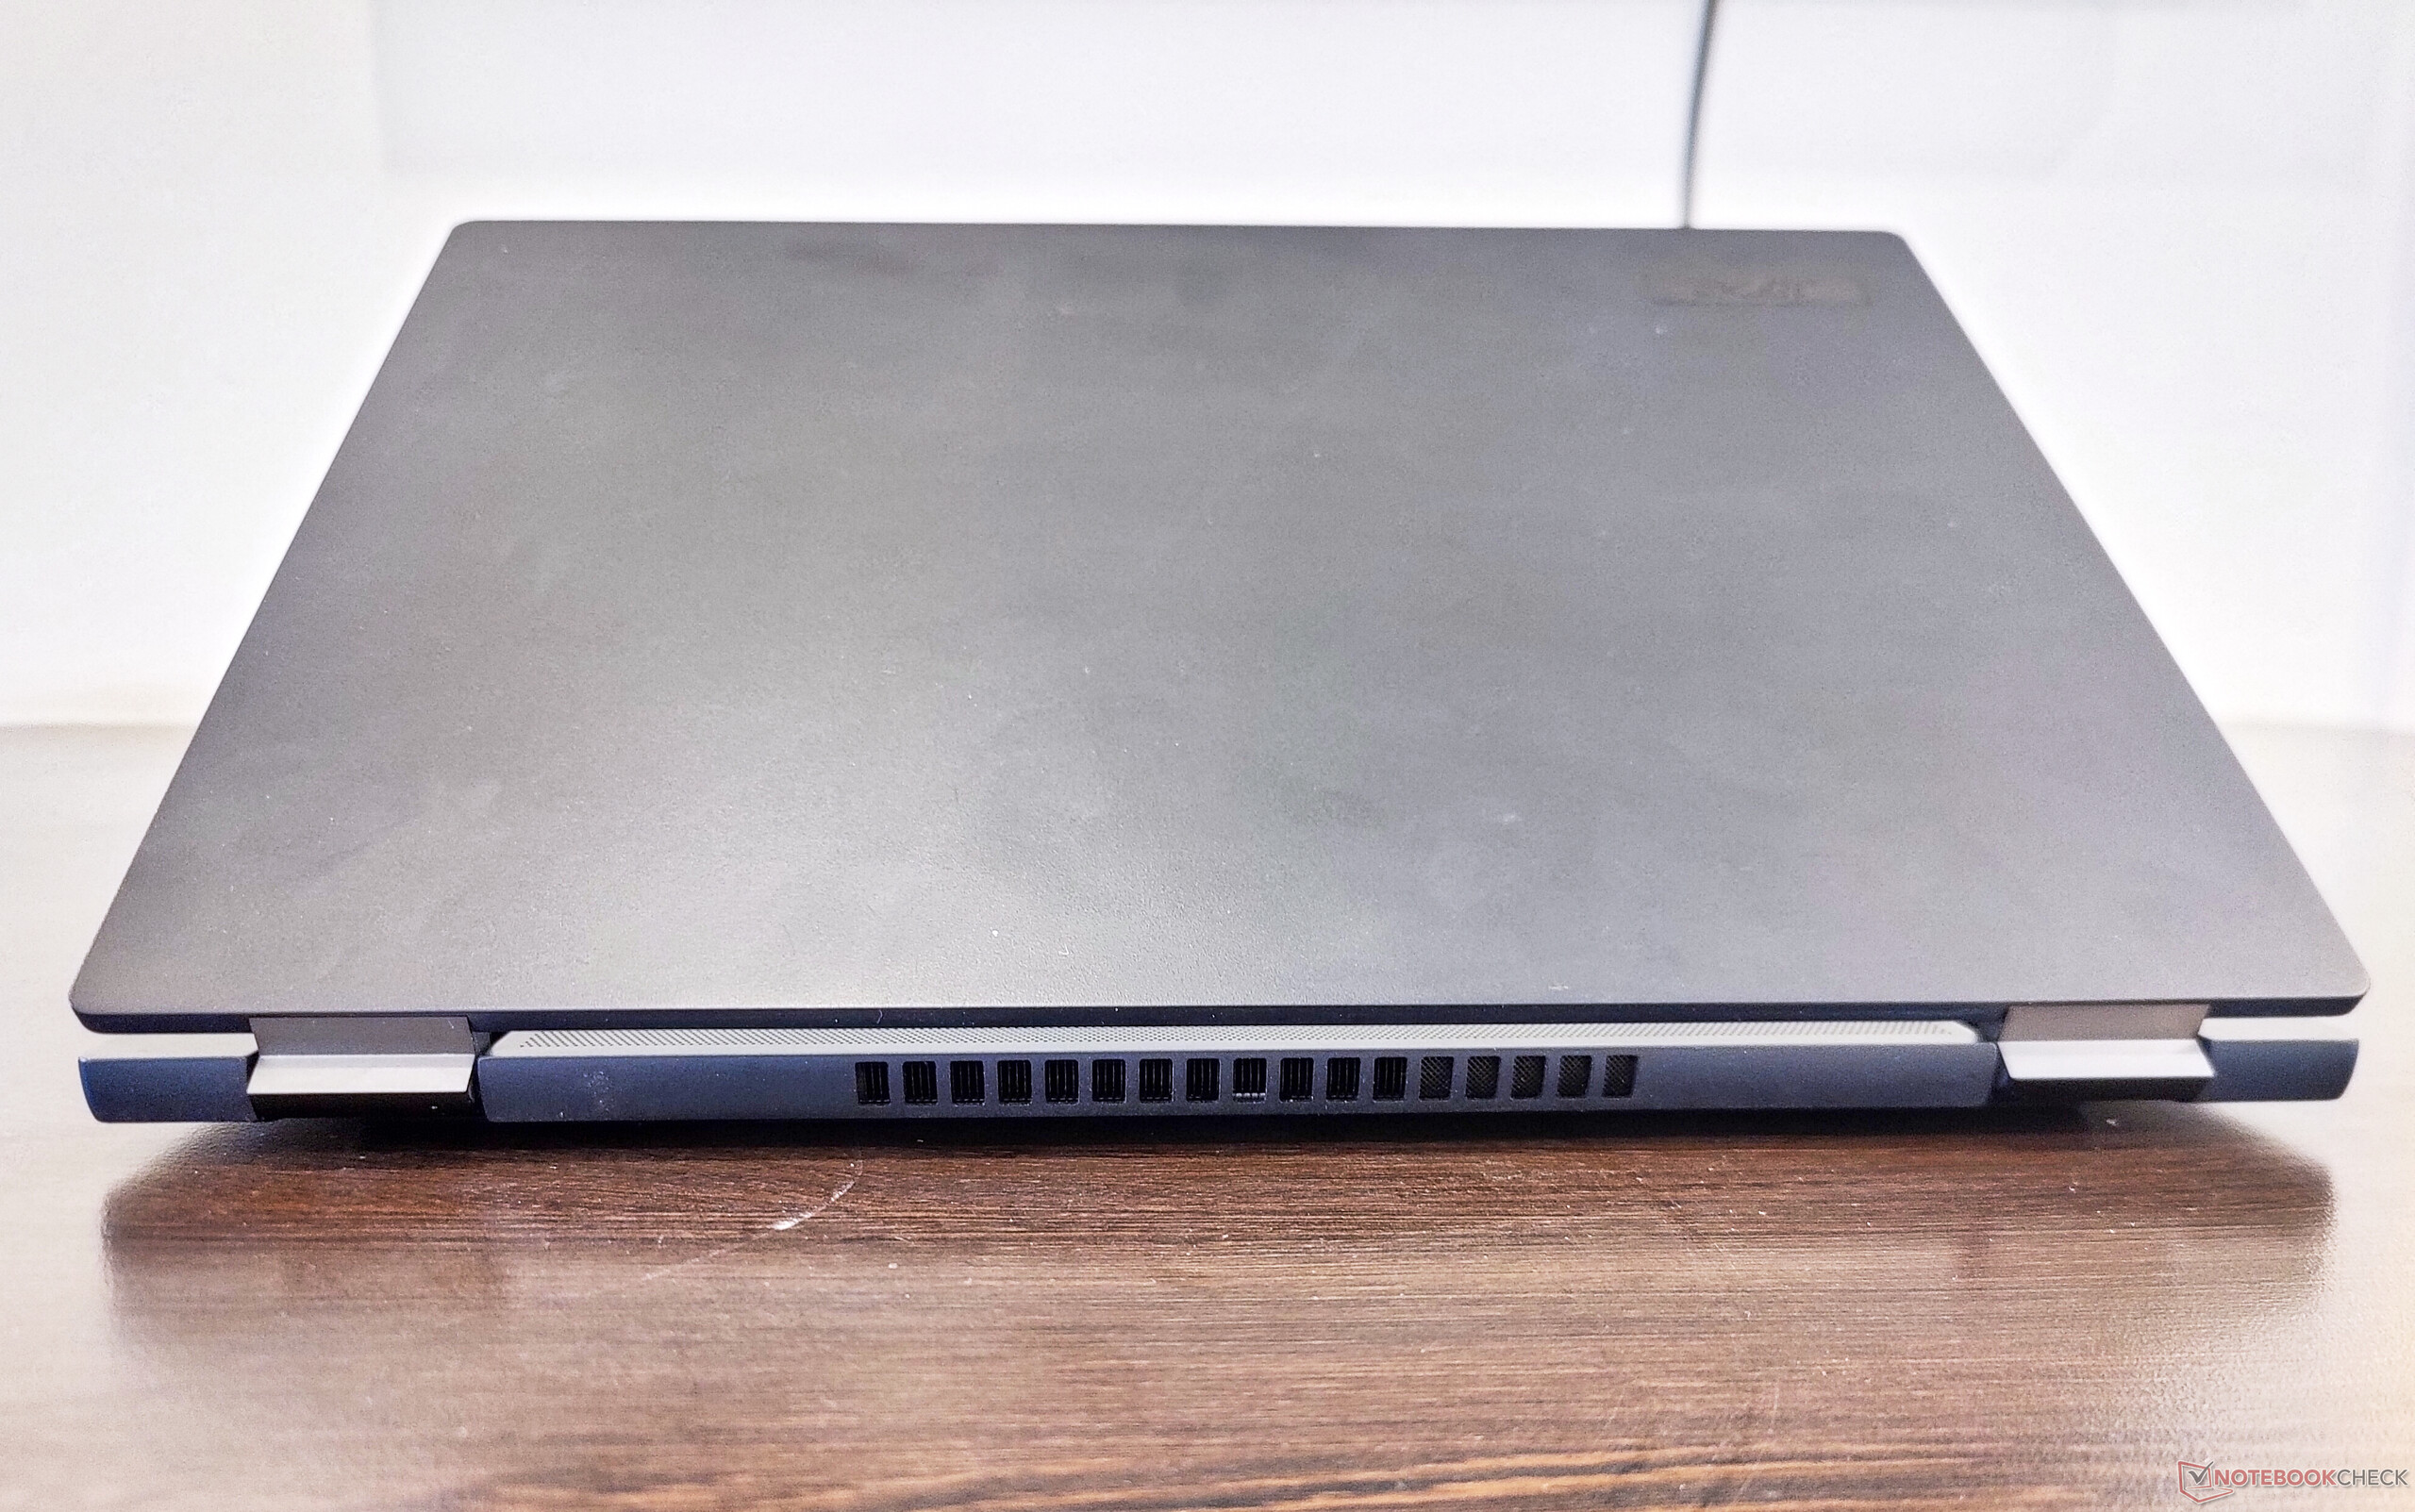
Connectivity: Slow microSD and Wi-Fi
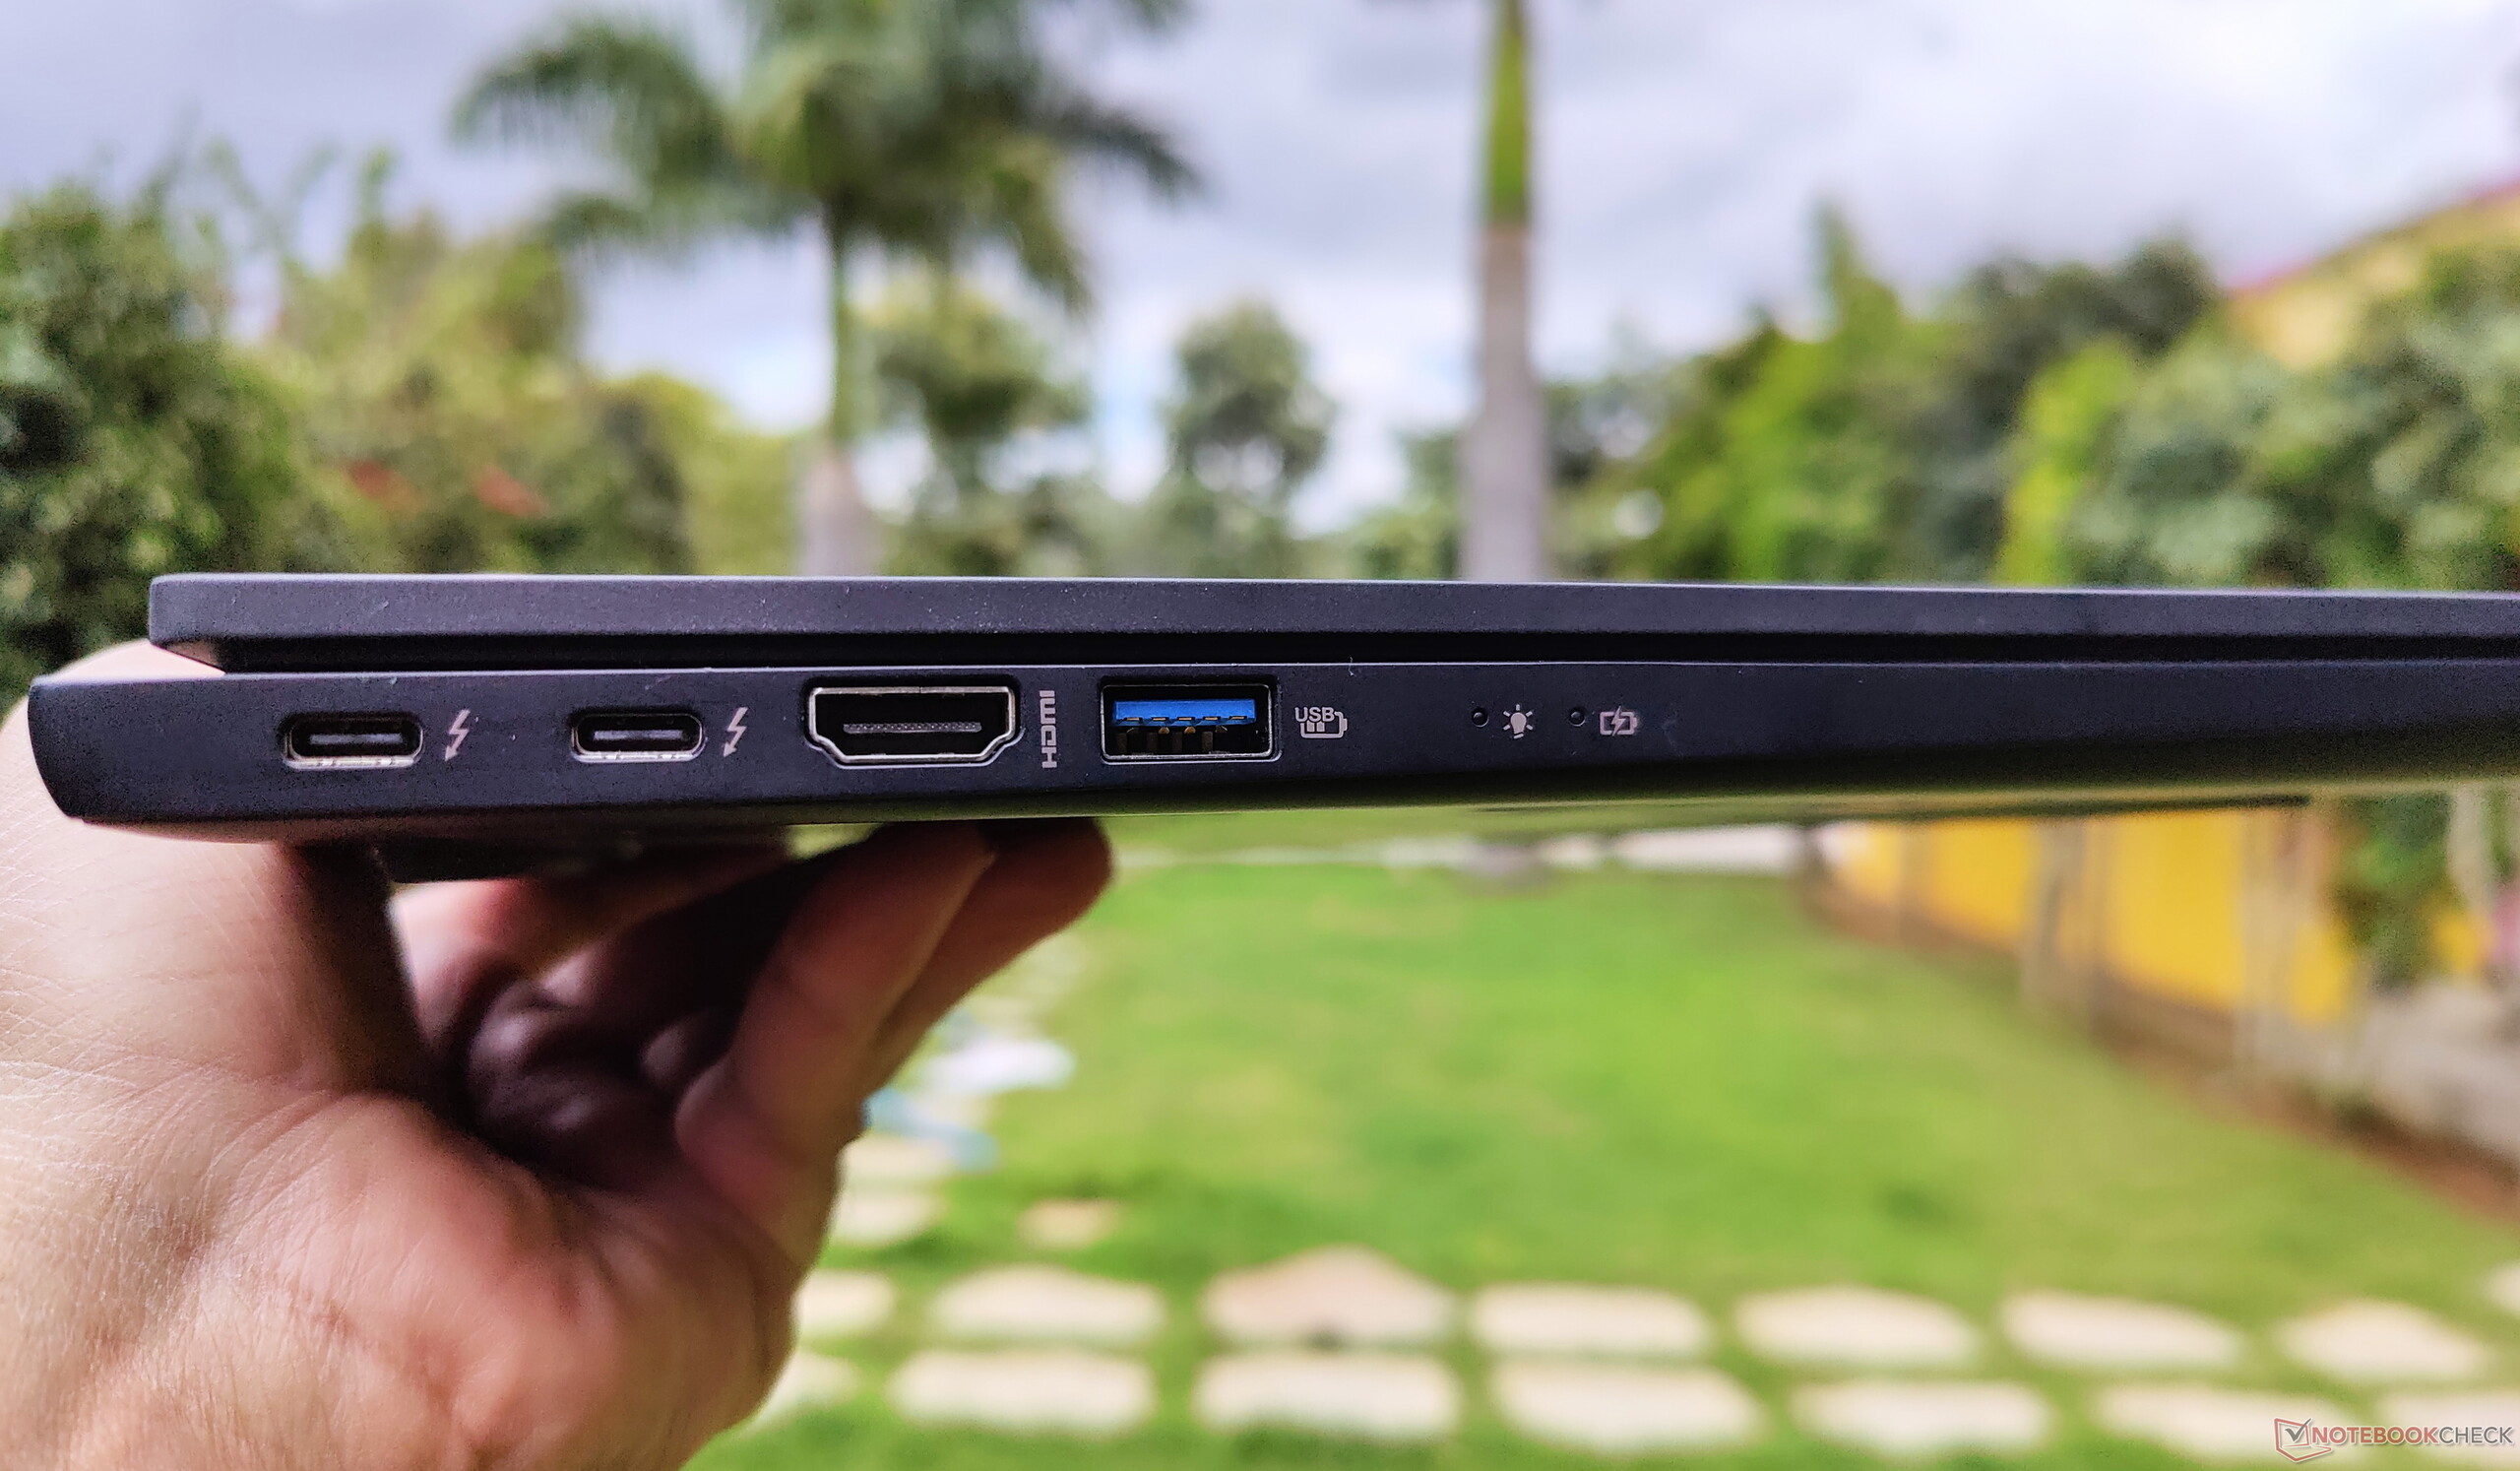
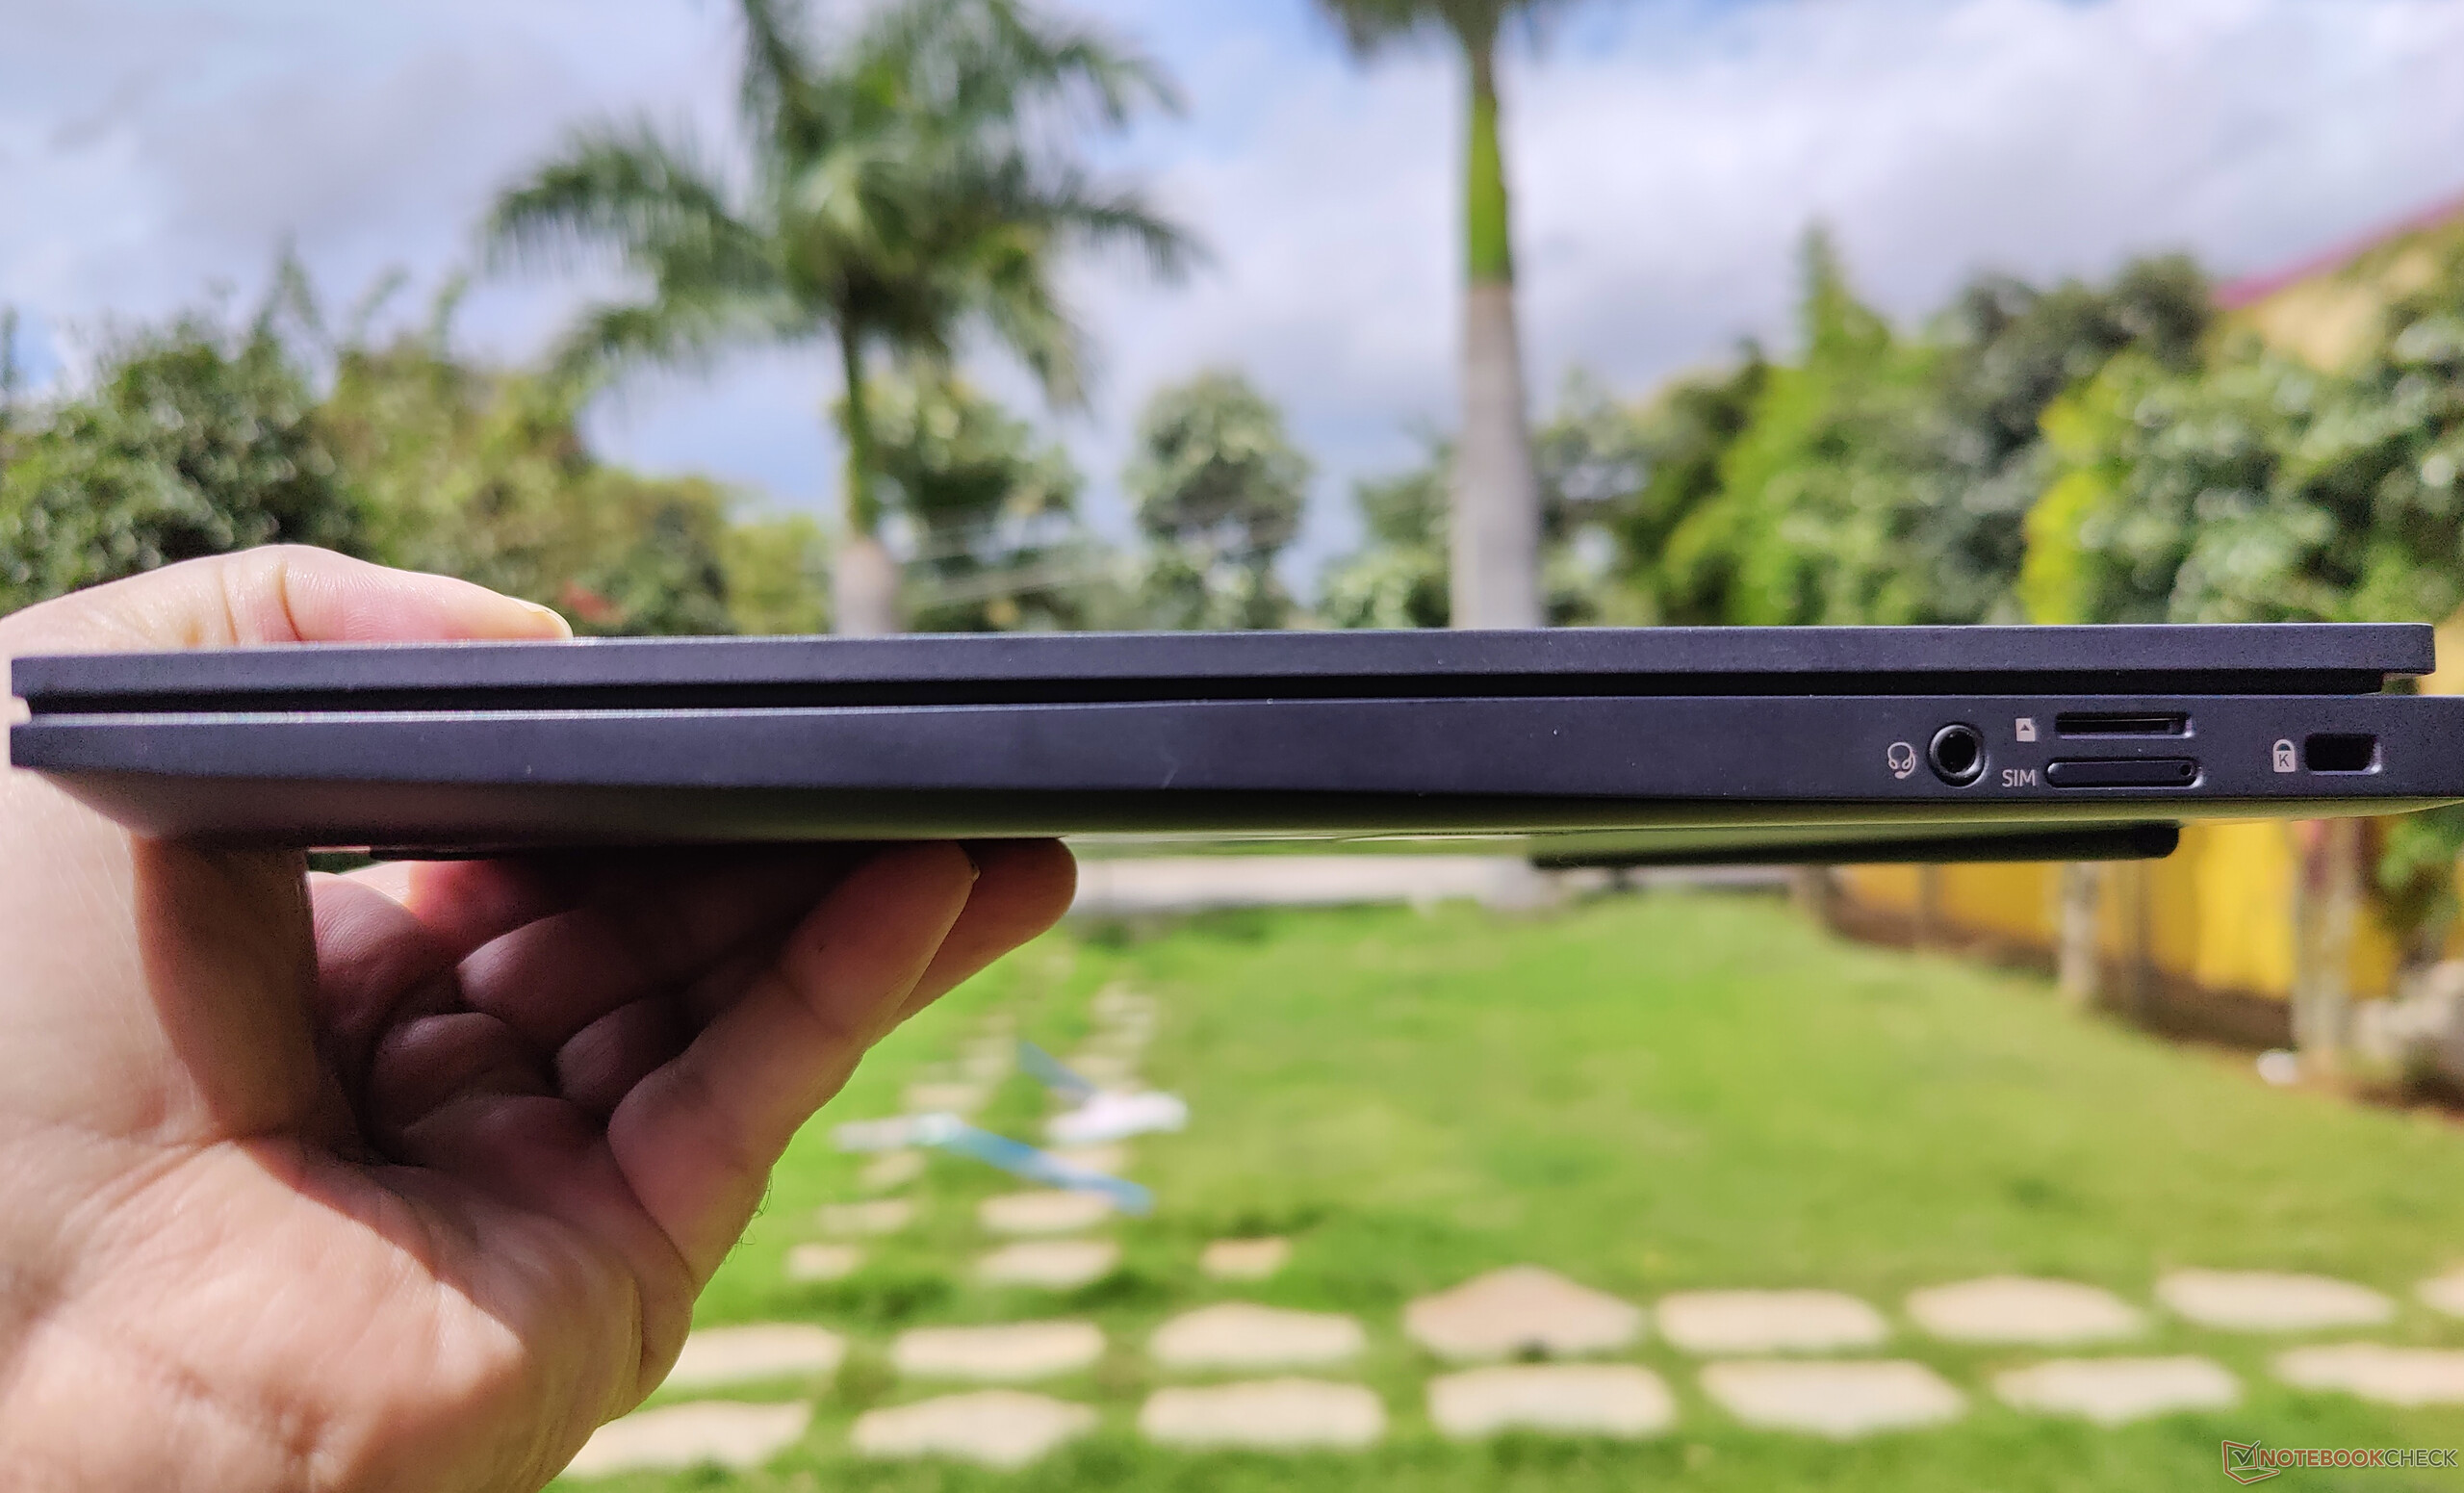
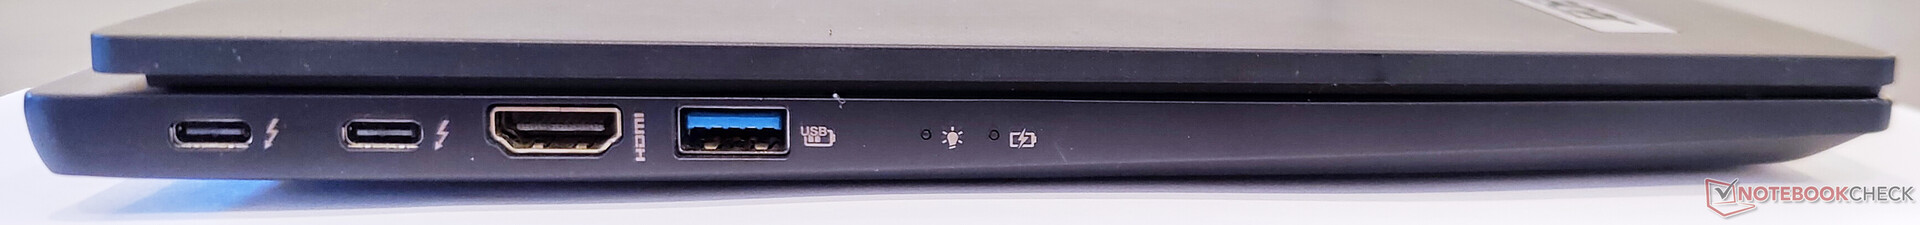
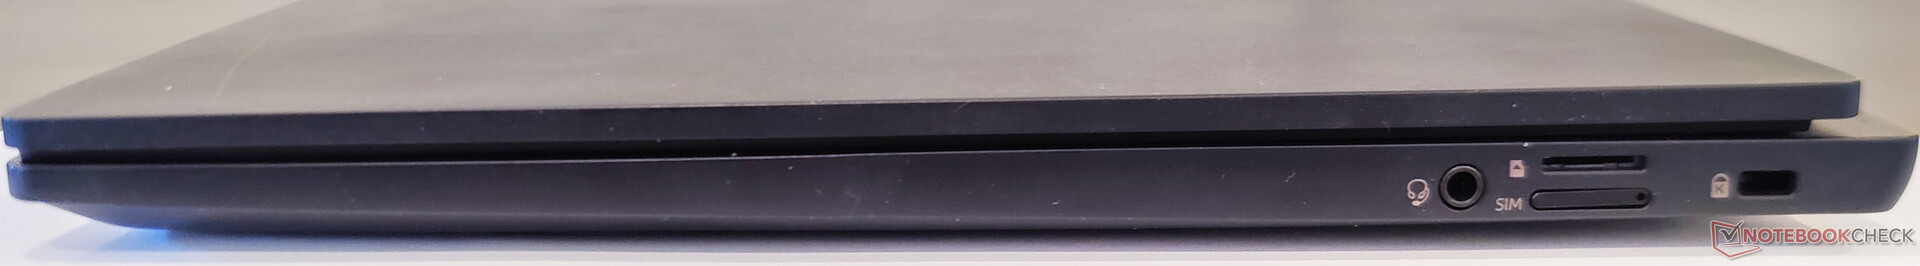
The TravelMate P614P-52 is endowed with a fairly decent port selection. On the left of the device, we find two Thunderbolt 4 ports, a HDMI port, and USB 3.2 Gen2 Type-A. Towards the right, we have a microSD reader, nano-SIM slot, a 3.5 mm combo audio jack, and a Kensington lock slot. The front and rear of the device are devoid of any ports.
SD Card Reader
Acer does not seem to have improved the microSD cad performance compared to last year's model. The TravelMate P6414P-52 manages just about 20.2 MB/s maximum transfer rate in our standard file copy test (250 JPEG files, ~4.5 MB each) when tested with our reference AV PRO 128 GB V60 UHS II microSD card. The sequential reads are slightly better at 23.61 MB/s.
| SD Card Reader | |
| average JPG Copy Test (av. of 3 runs) | |
| Razer Book 13 FHD (Toshiba Exceria Pro M501 32 GB UHS-II) | |
| Dell Latitude 9420 2-in-1 (AV PRO microSD 128 GB V60) | |
| Framework Laptop 13.5 (AV Pro UHS-II V60) | |
| Average of class Office (19.8 - 198.5, n=22, last 2 years) | |
| Asus VivoBook S15 D533UA (AV PRO microSD 128 GB V60) | |
| Acer TravelMate P614P-52 (AV PRO microSD 128 GB V60) | |
| maximum AS SSD Seq Read Test (1GB) | |
| Razer Book 13 FHD (Toshiba Exceria Pro M501 32 GB UHS-II) | |
| Dell Latitude 9420 2-in-1 (AV PRO microSD 128 GB V60) | |
| Framework Laptop 13.5 (AV Pro UHS-II V60) | |
| Average of class Office (27.4 - 249, n=21, last 2 years) | |
| Asus VivoBook S15 D533UA (AV PRO microSD 128 GB V60) | |
| Acer TravelMate P614P-52 (AV PRO microSD 128 GB V60) | |
Communication
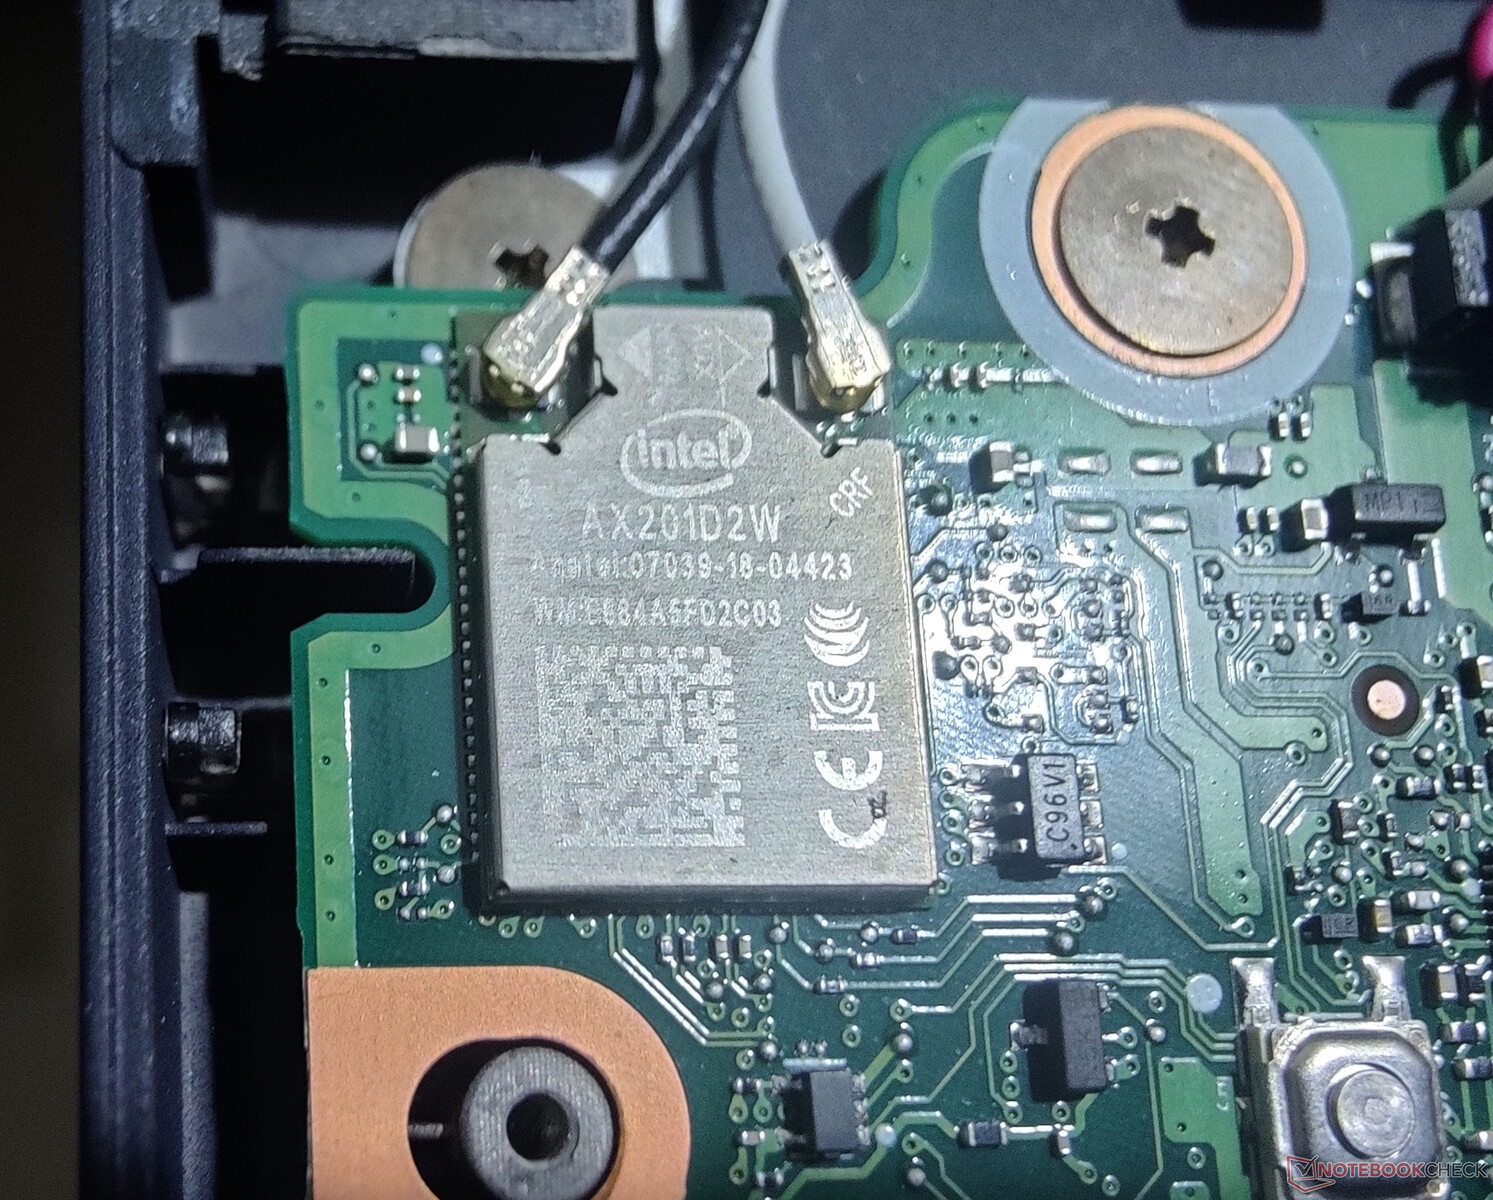
The TravelMate P6 is equipped with the Intel Wi-Fi AX201 Wi-Fi card that also offers Bluetooth 5.0. We tested the Wi-Fi performance using our reference Netgear Nighthawk AX12 RAX120 router at a distance of 1 m from the device in direct line of sight without any obstructions.
The Wi-Fi performance is about decent, particularly for downloads, though we have seen higher throughput in last year's model. Fast uploads are definitely not the TravelMate P6's forte, at least with our review sample.
Our unit also came with a built-in Intel WWAN module that supports 5G-NSA. eSIM support is available in addition to a physical nano-SIM slot. 4G LTE reception was good and was similar to what we observed with a smartphone (OnePlus 9) in the same area.
Webcam
This year's TravelMate P6 comes with a Full HD webcam, which offers a tangible improvement in color accuracy over the previous generation with a maximum Delta E of 12.35. However, as evident from our test chart, the integrated webcam leaves a lot to be desired when it comes to image sharpness. We also noticed that the webcam had a tendency for reddish to yellow tinting. Overall, the webcam quality is just about passable for video calling.


Security
Being a business laptop, the TravelMate P6 offers several security features. There's a discrete Trusted Platform Module (TPM) 2.0 chip available along with multiple authentication options such as facial and fingerprint. Optional Intel Evo vPro configurations are available as well. Acer offers the ProShield Plus app to configure additional security options such as file encryption, file decryption, file shredding, Application Guard, Browser Guard, USB device filter, and more.
The webcam is equipped with a manual privacy shutter. The TravelMate P6 also supports Acer User Sensing technology that automatically locks the screen when the user is not in range. We could not, however, test this feature owing to non-availability of drivers at the time of review.
Accessories
The in-box contents include the usual paperwork and a 65 W charger. With availability of two Thunderbolt 4 ports, there is ample scope for peripheral expansion. Though not listed on the Acer website yet, accessories such as the Acer USB Type-C Dock II are slated to be available soon.
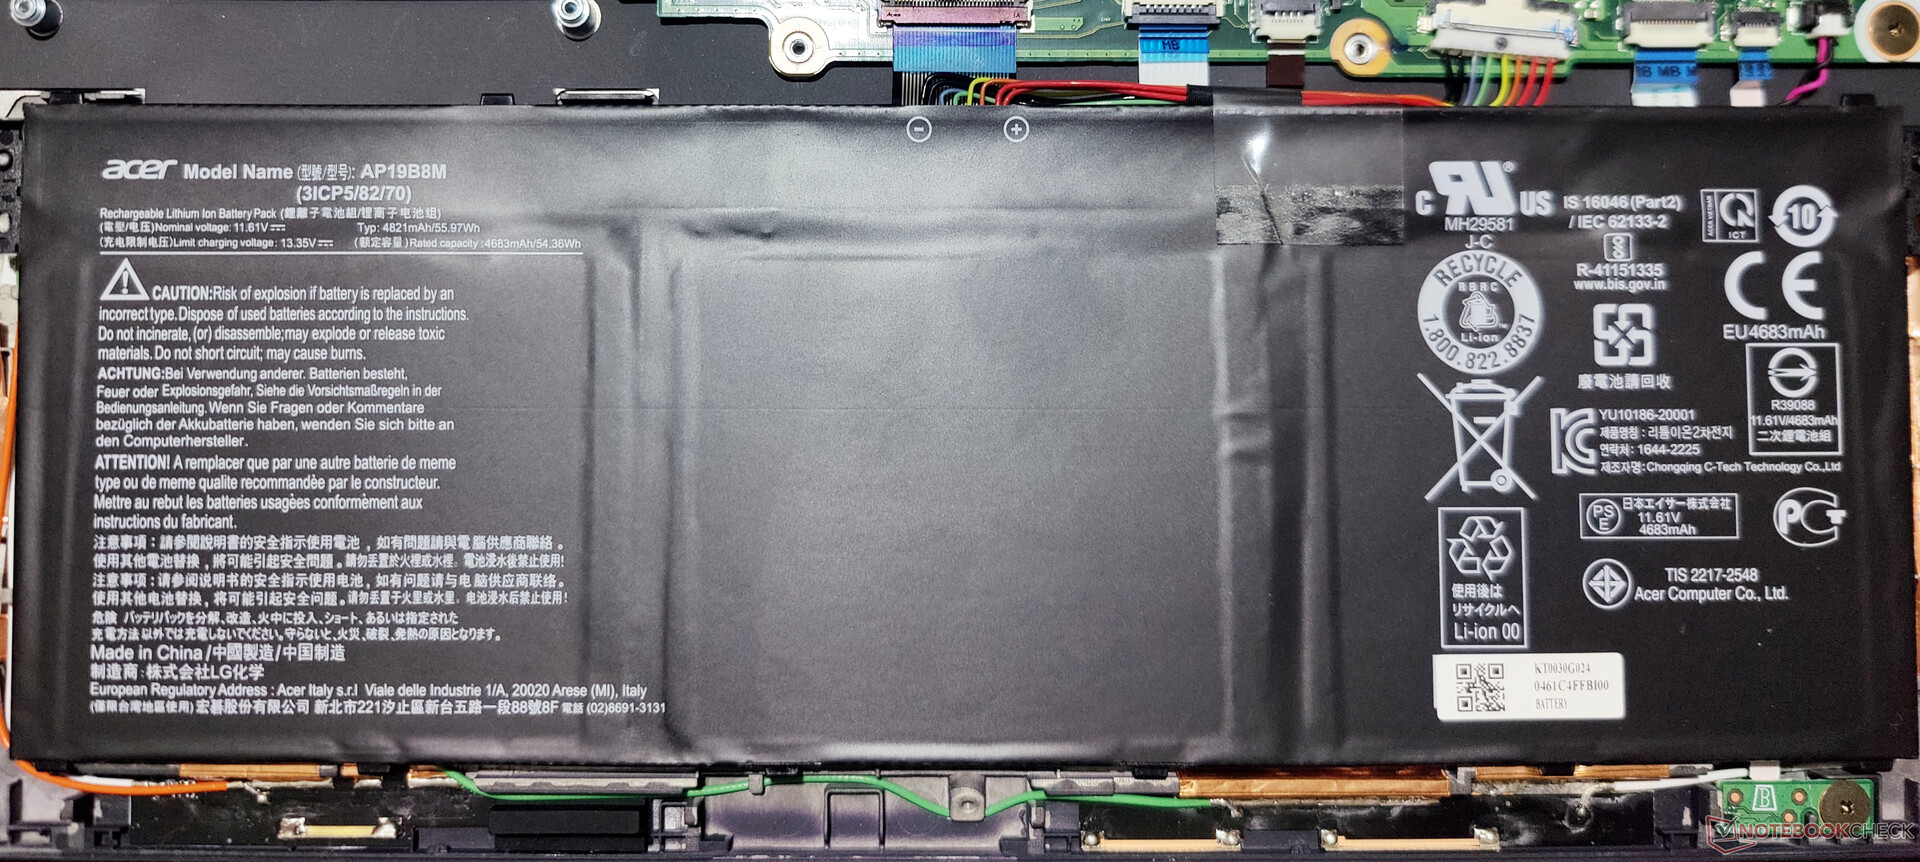
Maintenance
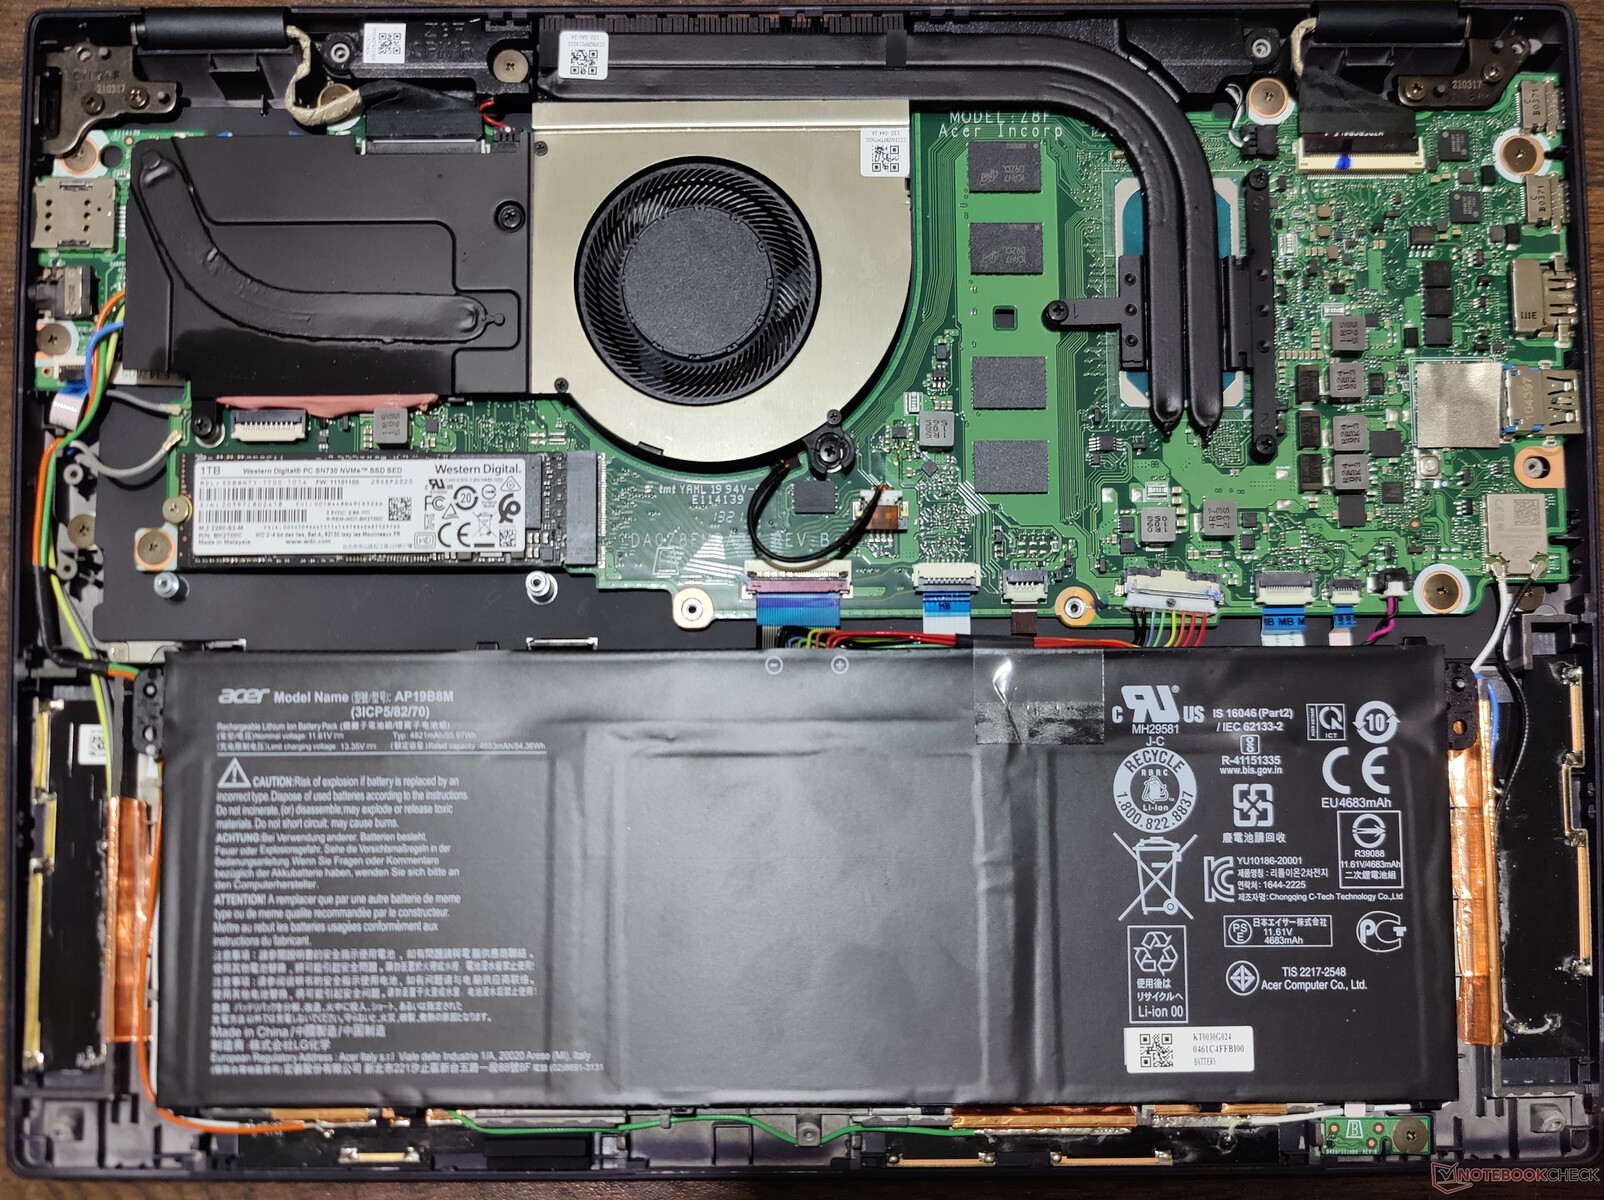
There is no dedicated maintenance hatch provided. Removing 11 Torx T5 screws on the underside allows lifting off the bottom cover with minimal effort.
The TravelMate P6 is not a very user-serviceable laptop. The LPDDR4X RAM and the Intel AX201 Wi-Fi module are soldered onto the motherboard. Only the PCIe NVMe SSD can be swapped out. There is no scope for additional storage expansion.
Warranty
Acer India offers a three-year or a five-year warranty period for TravelMate P6 devices bought in India. International warranty can be availed from Acer Taiwan, which offers a one year global carry-in warranty limited to countries specified in the Acer International Travelers Warranty document.
Input Devices: Comfortable for prolonged use
Keyboard
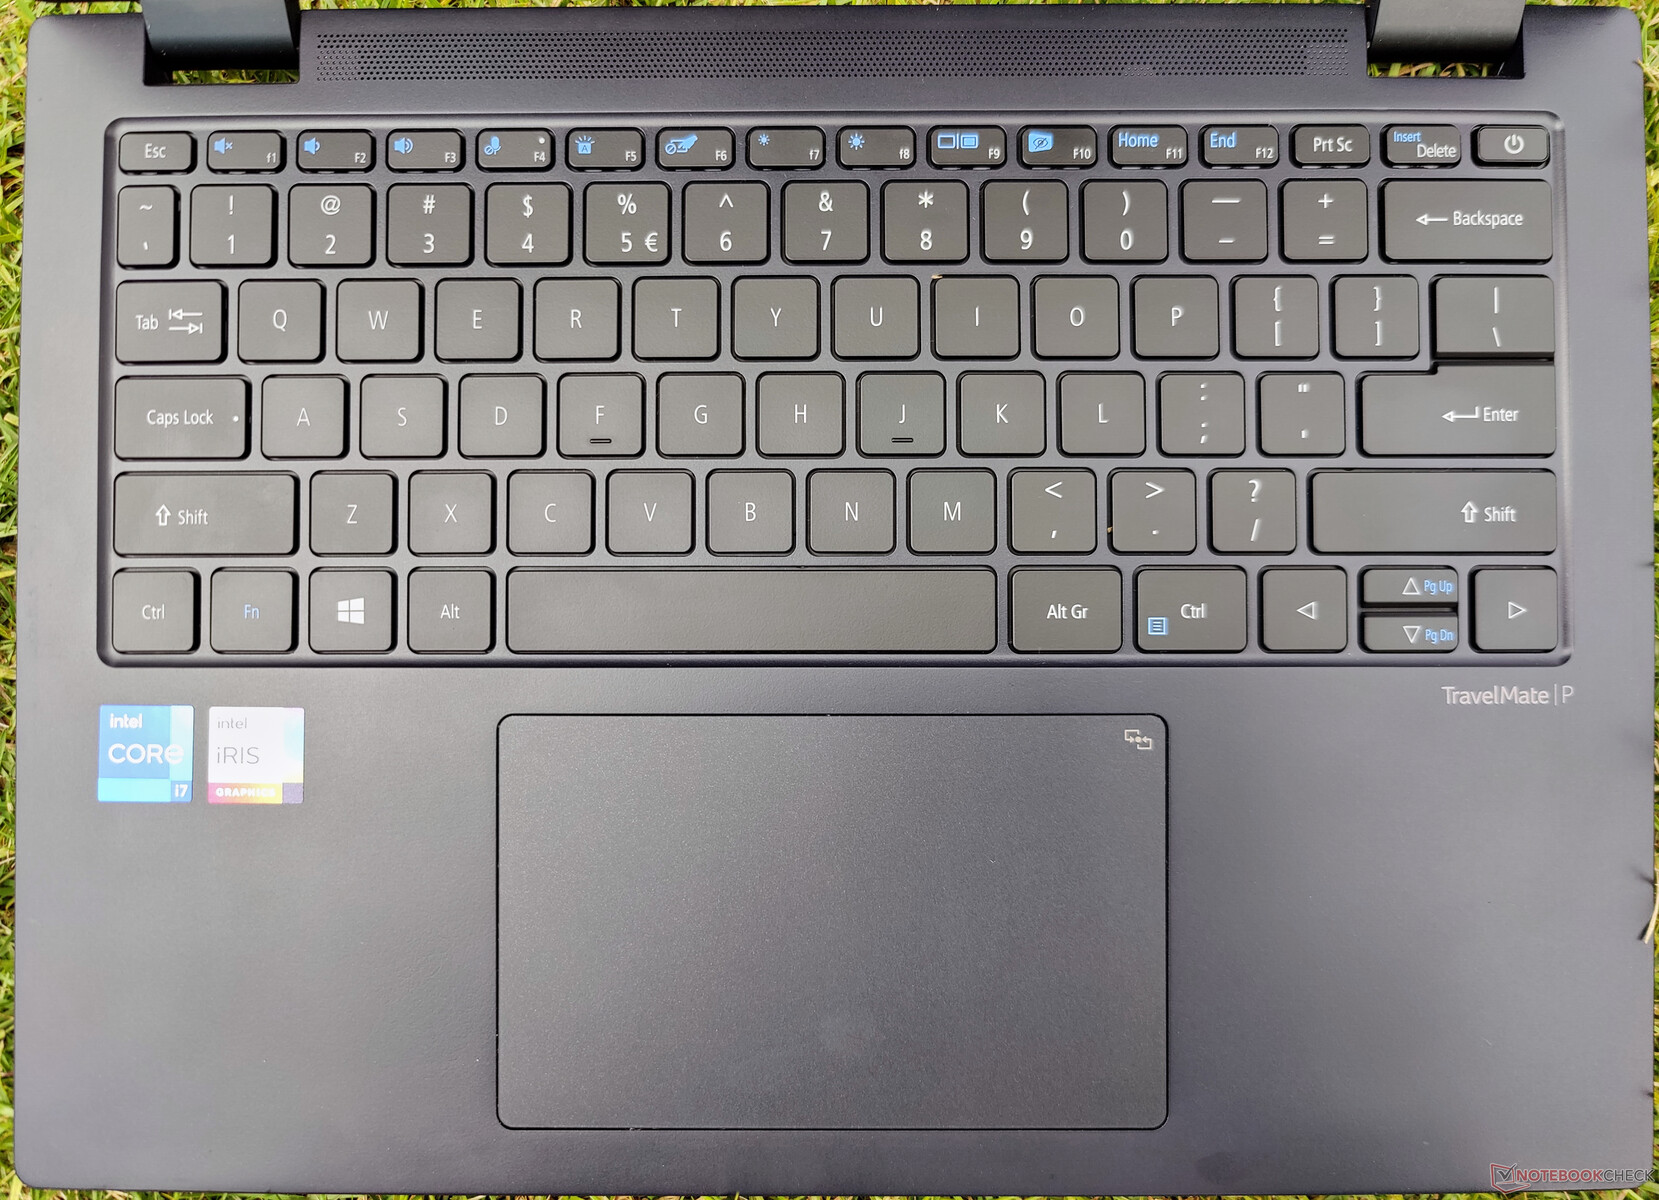
The TravelMate P6 offers a good typing experience with its chiclet backlit keyboard. The keys have a short travel with mediocre tactile feedback. That being said, the keys are adequately spaced and extended typing is quite comfortable. Unfortunately, the backlight does not have a multi-step brightness control.
Touchpad
At 7.5 x 12.5 cm, the touchpad in the new TravelMate P6 has a larger area compared to the previous generation. The touchpad offers a smooth gliding experience and supports Windows Precision gestures. The left and right buttons are flush with the touchpad and are quite responsive even at the corners, though they seem to click a tad bit louder than we'd like.
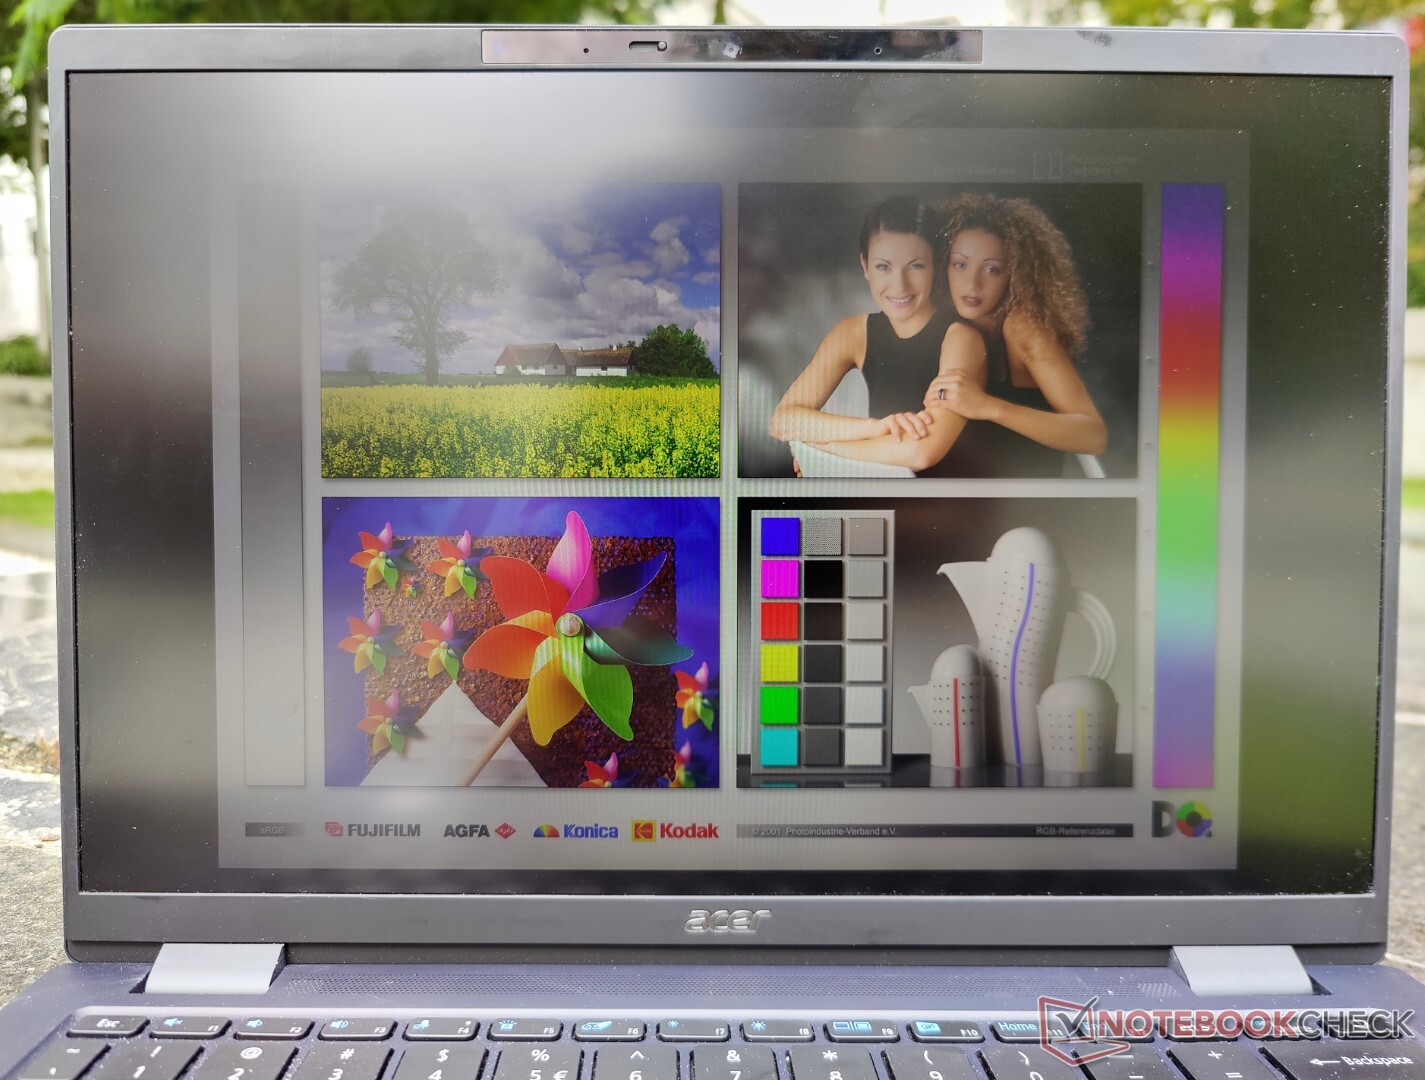
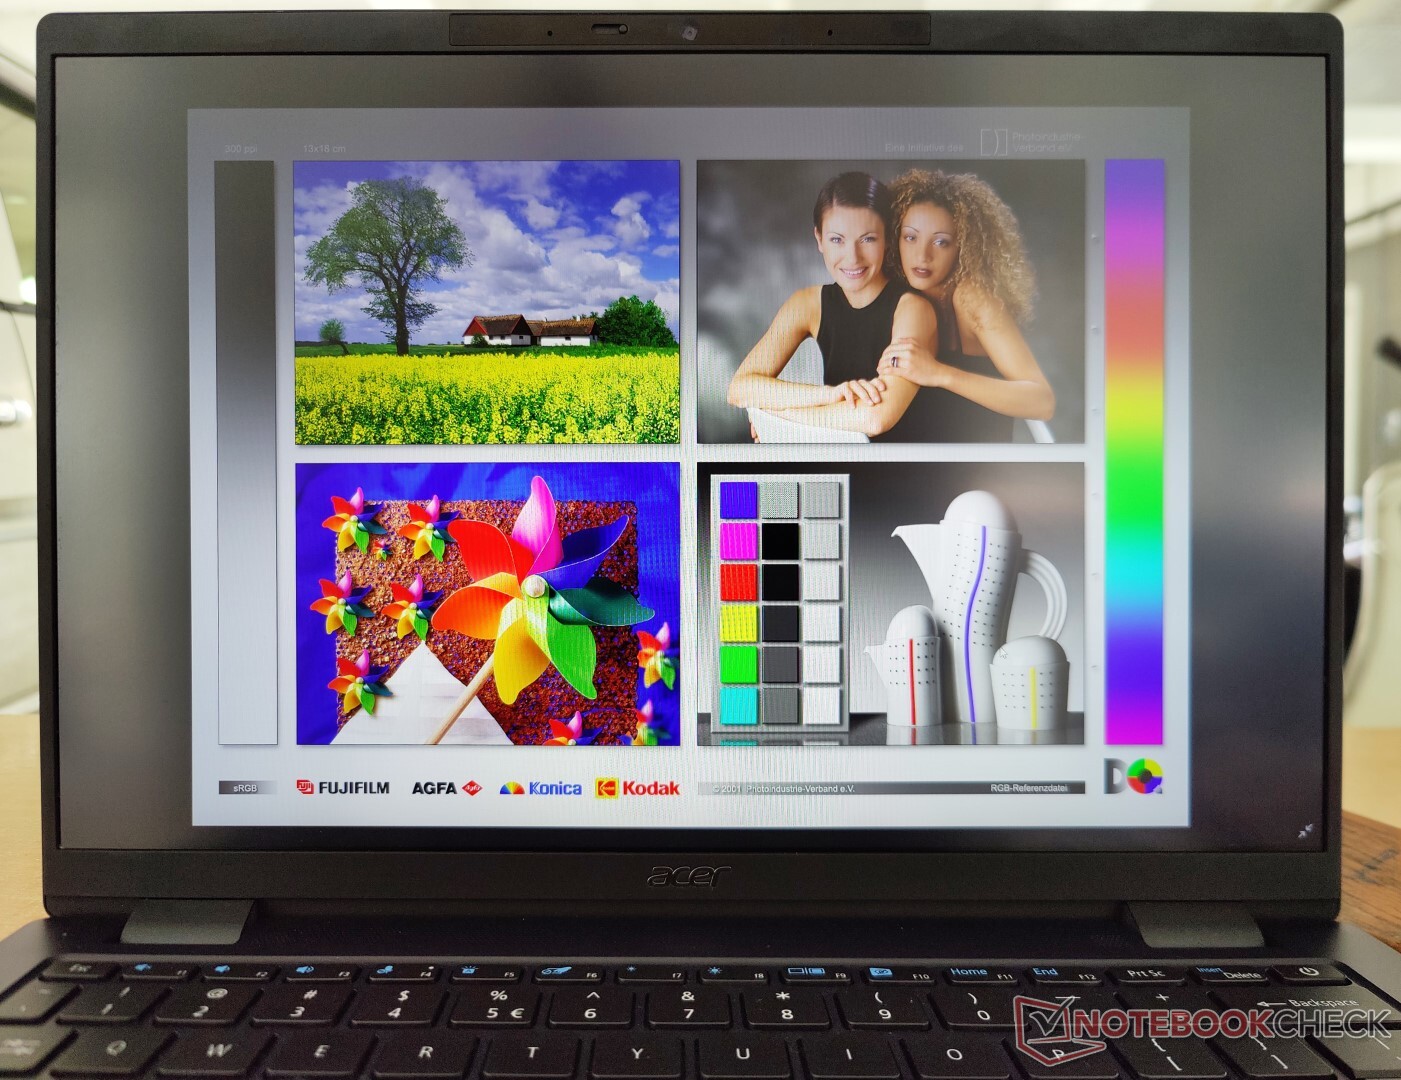
Display: 16:10 with good colors and high PWM
Our TravelMate P6 unit came equipped with a 14-inch FHD 16:10 non-touch matte panel with a 60 Hz refresh rate. Acer has improved the display on the TravelMate P6 this time around with very good color reproduction and much improved brightness levels.
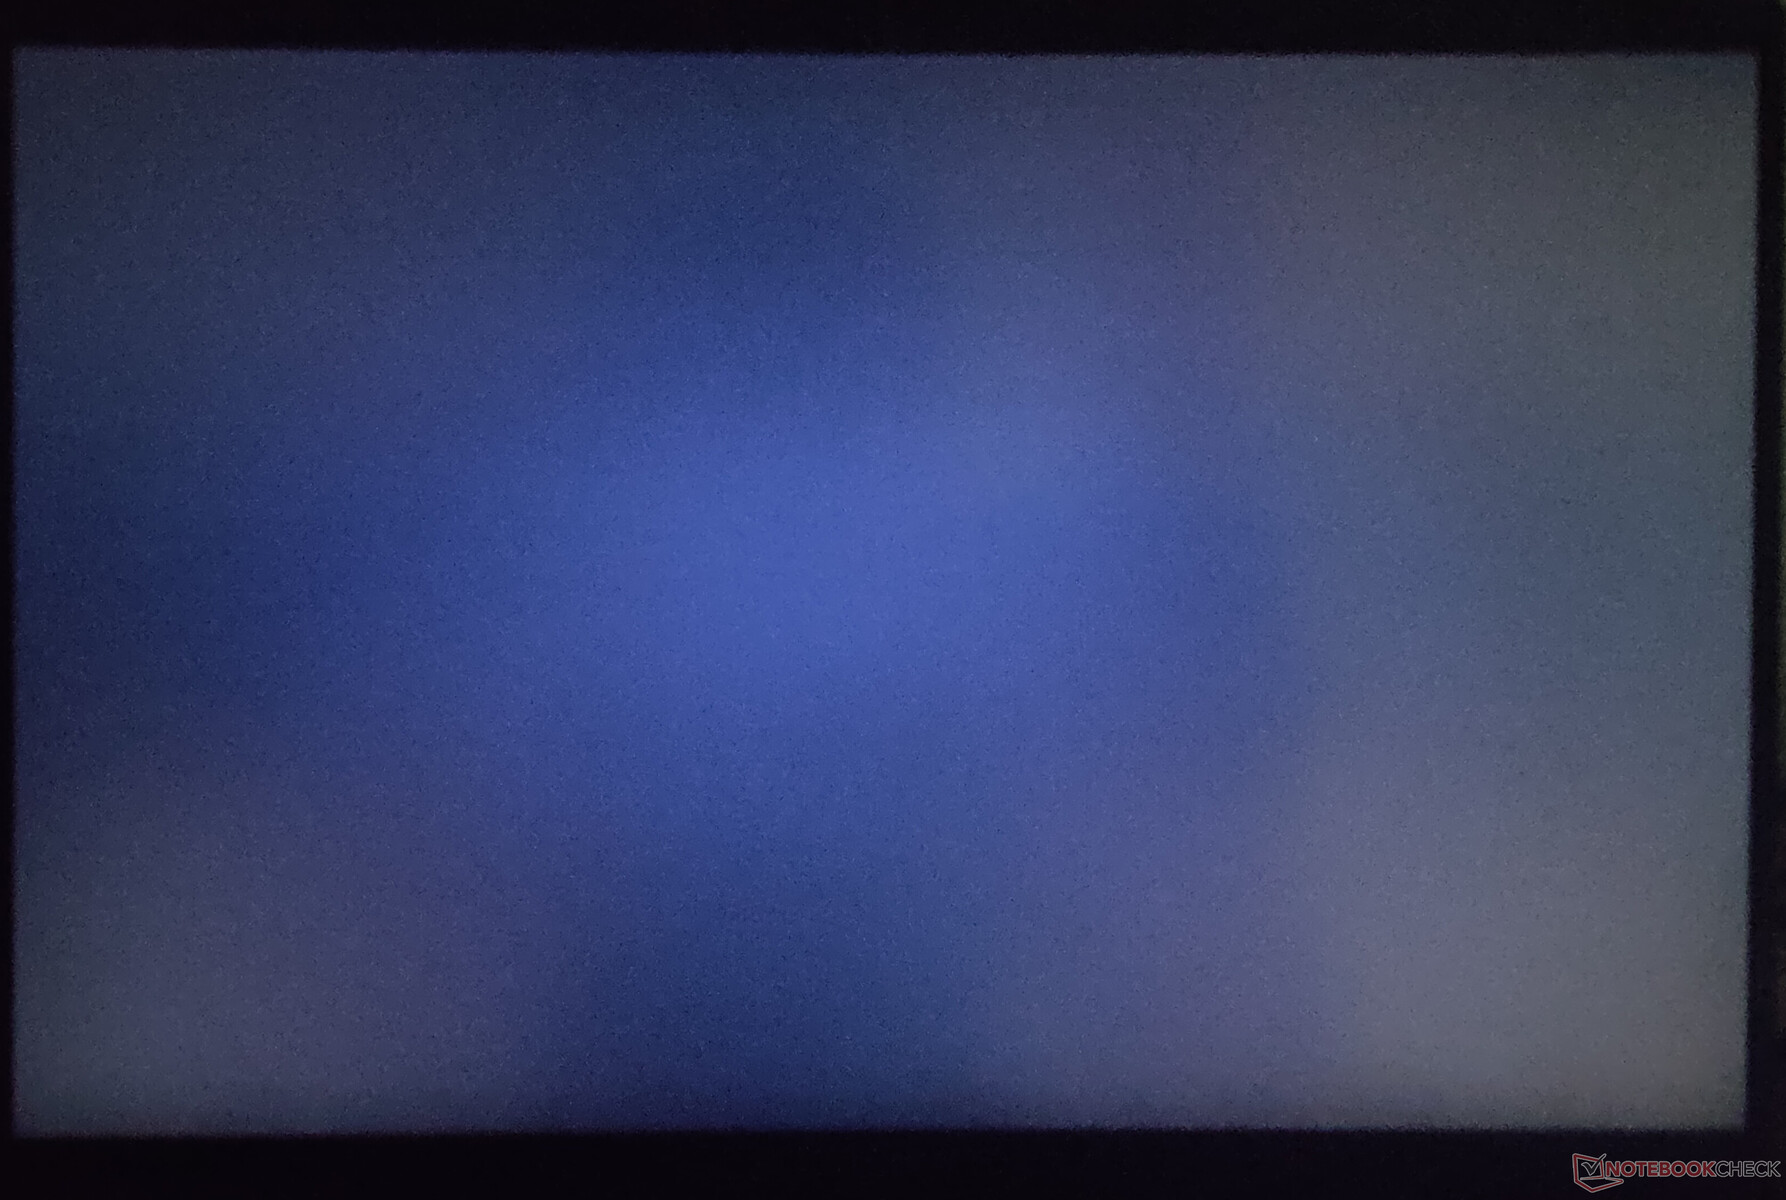
The overall characteristics of the TravelMate P6's panel seem very good with deep blacks and a high measured contrast ratio of 2653:1. We measured a peak brightness of 529.58 cd/m2, though the distribution itself is not up to the mark.
All display parameters were measured on AC power as we observed that the laptop lowers the brightness on battery by about 192 cd/m2 even though the brightness slider itself is set to maximum.
| |||||||||||||||||||||||||
Brightness Distribution: 77 %
Center on Battery: 312.04 cd/m²
Contrast: 2653:1 (Black: 0.19 cd/m²)
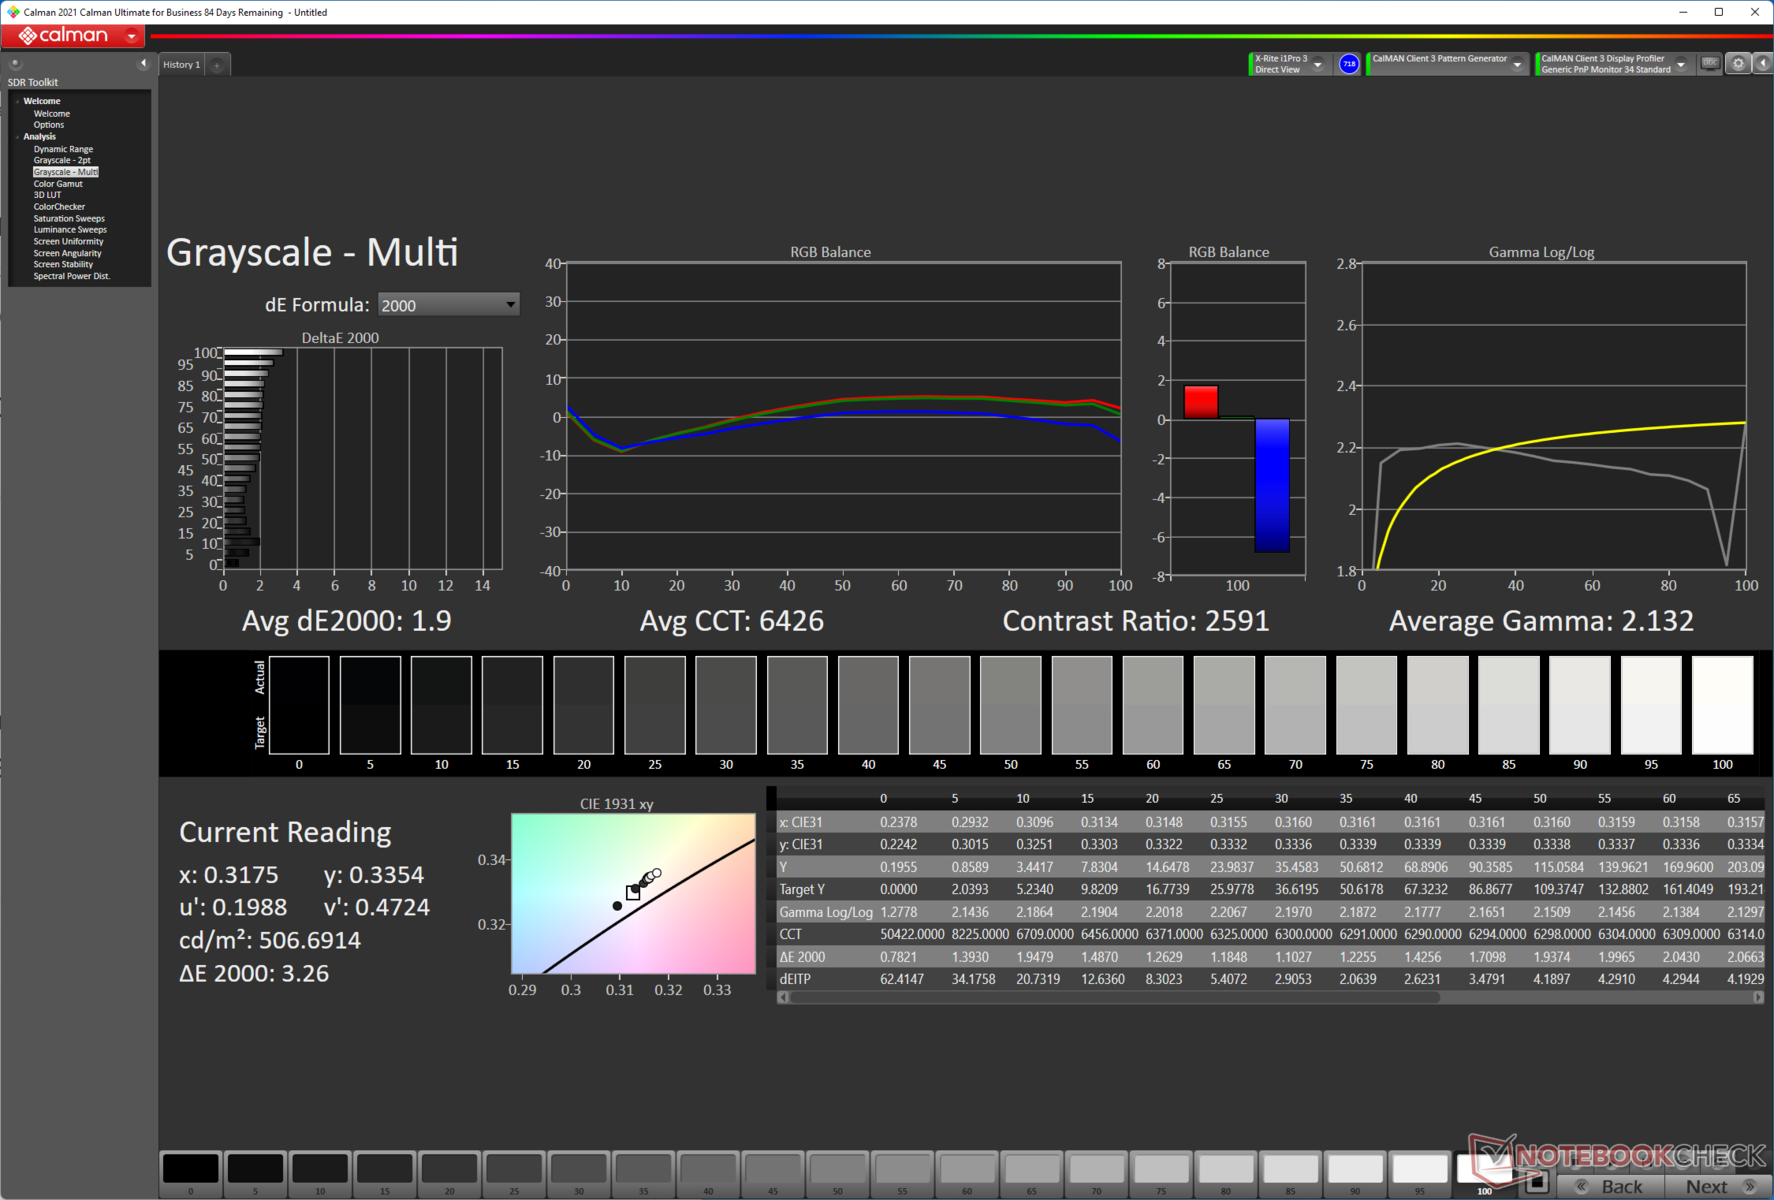
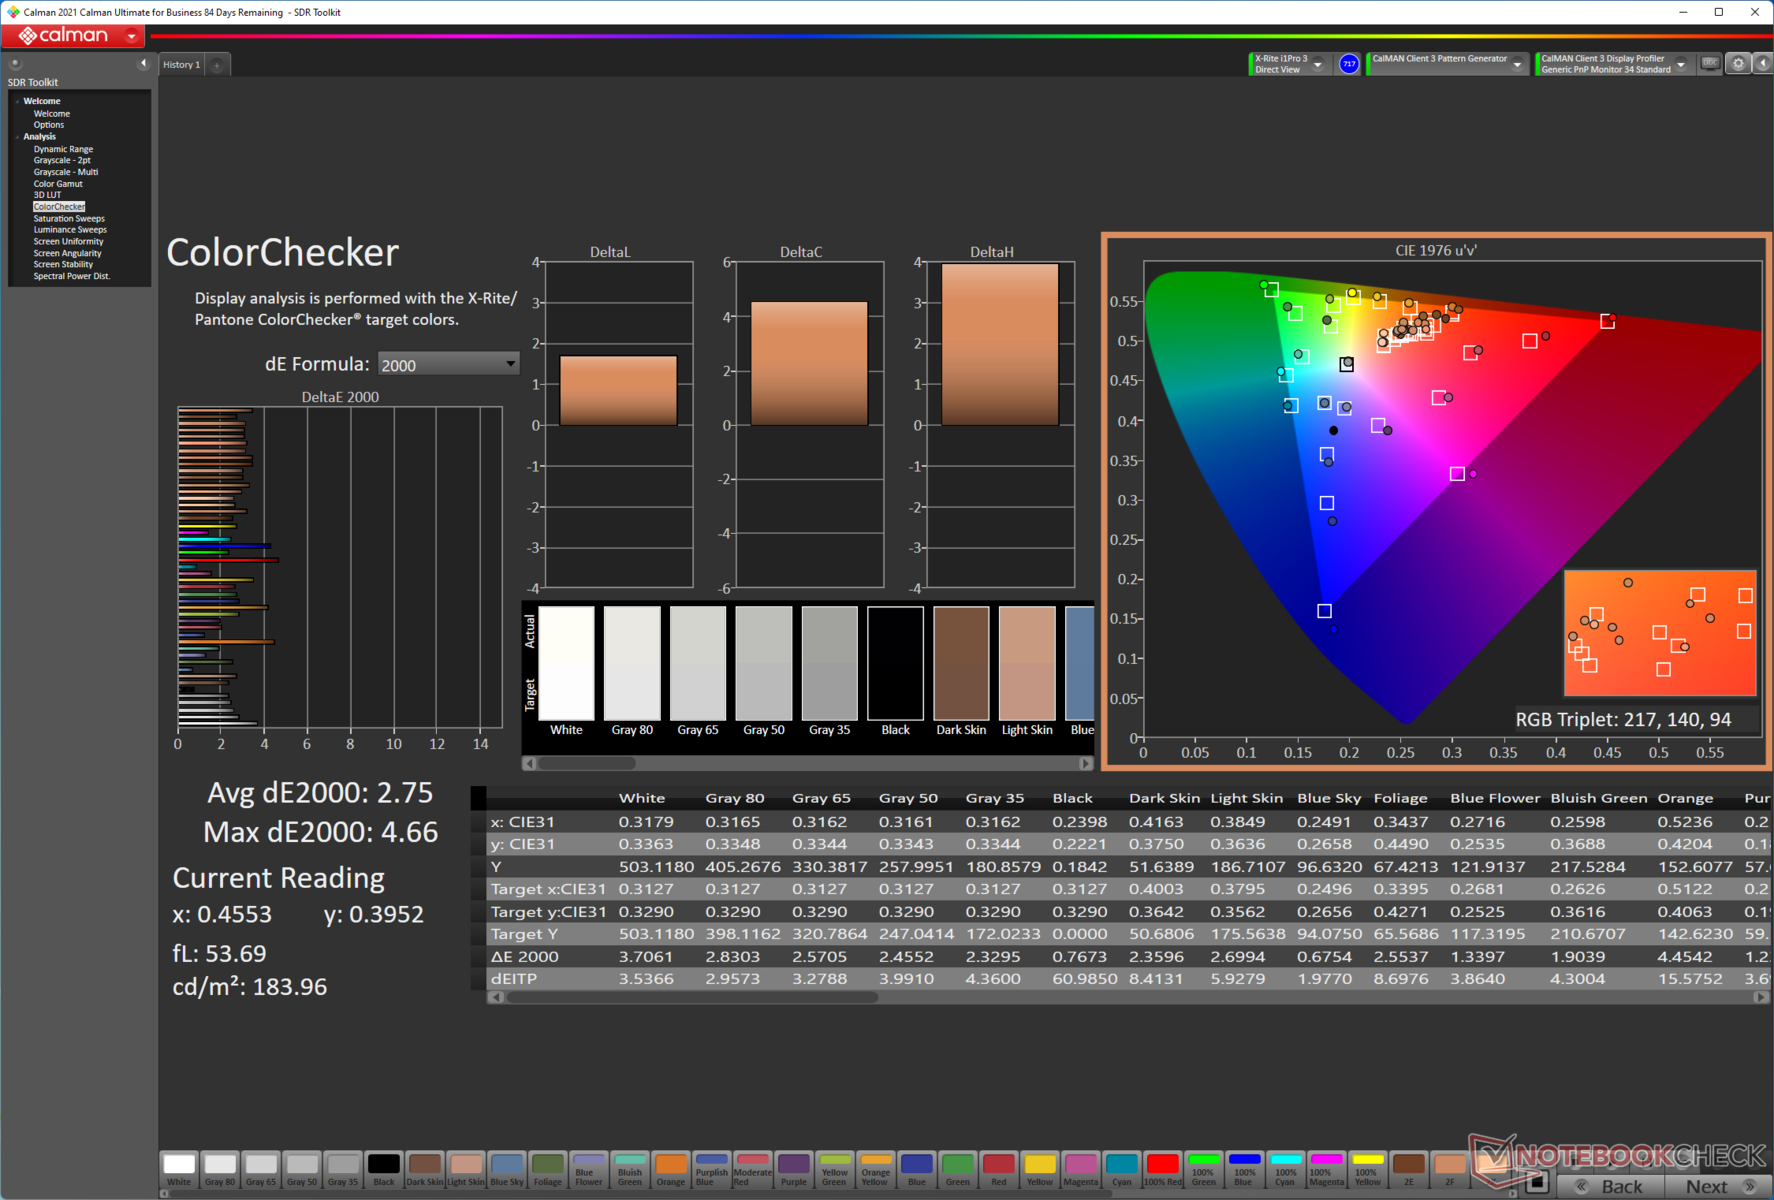
ΔE ColorChecker Calman: 2.75 | ∀{0.5-29.43 Ø4.72}
calibrated: 1.72
ΔE Greyscale Calman: 1.9 | ∀{0.09-98 Ø4.97}
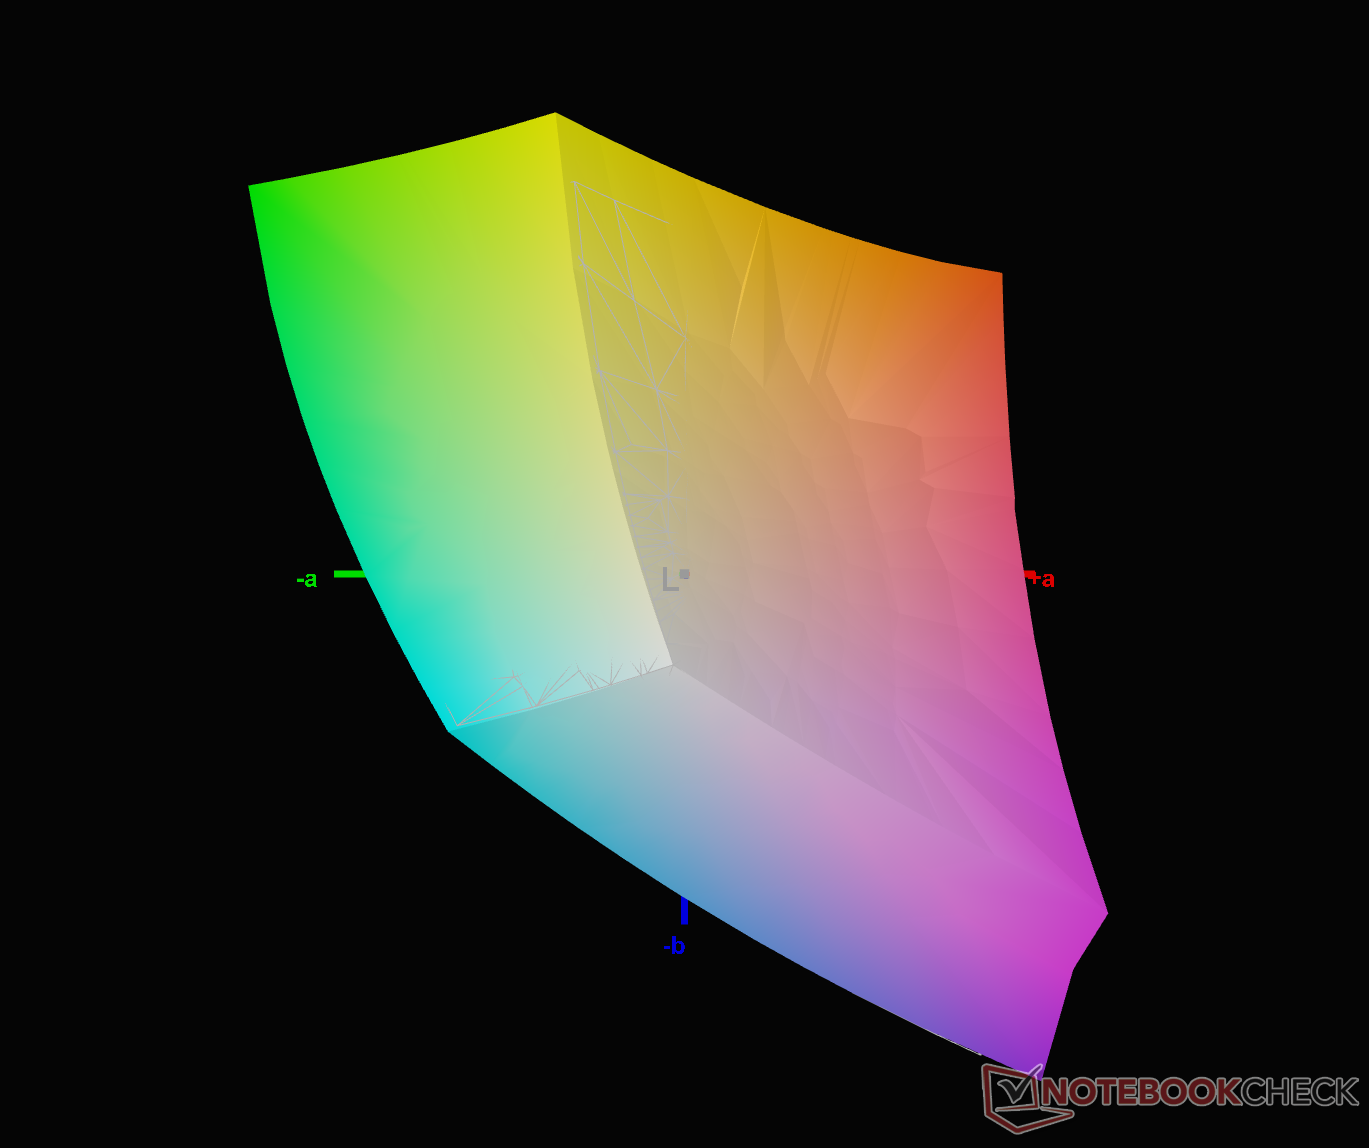
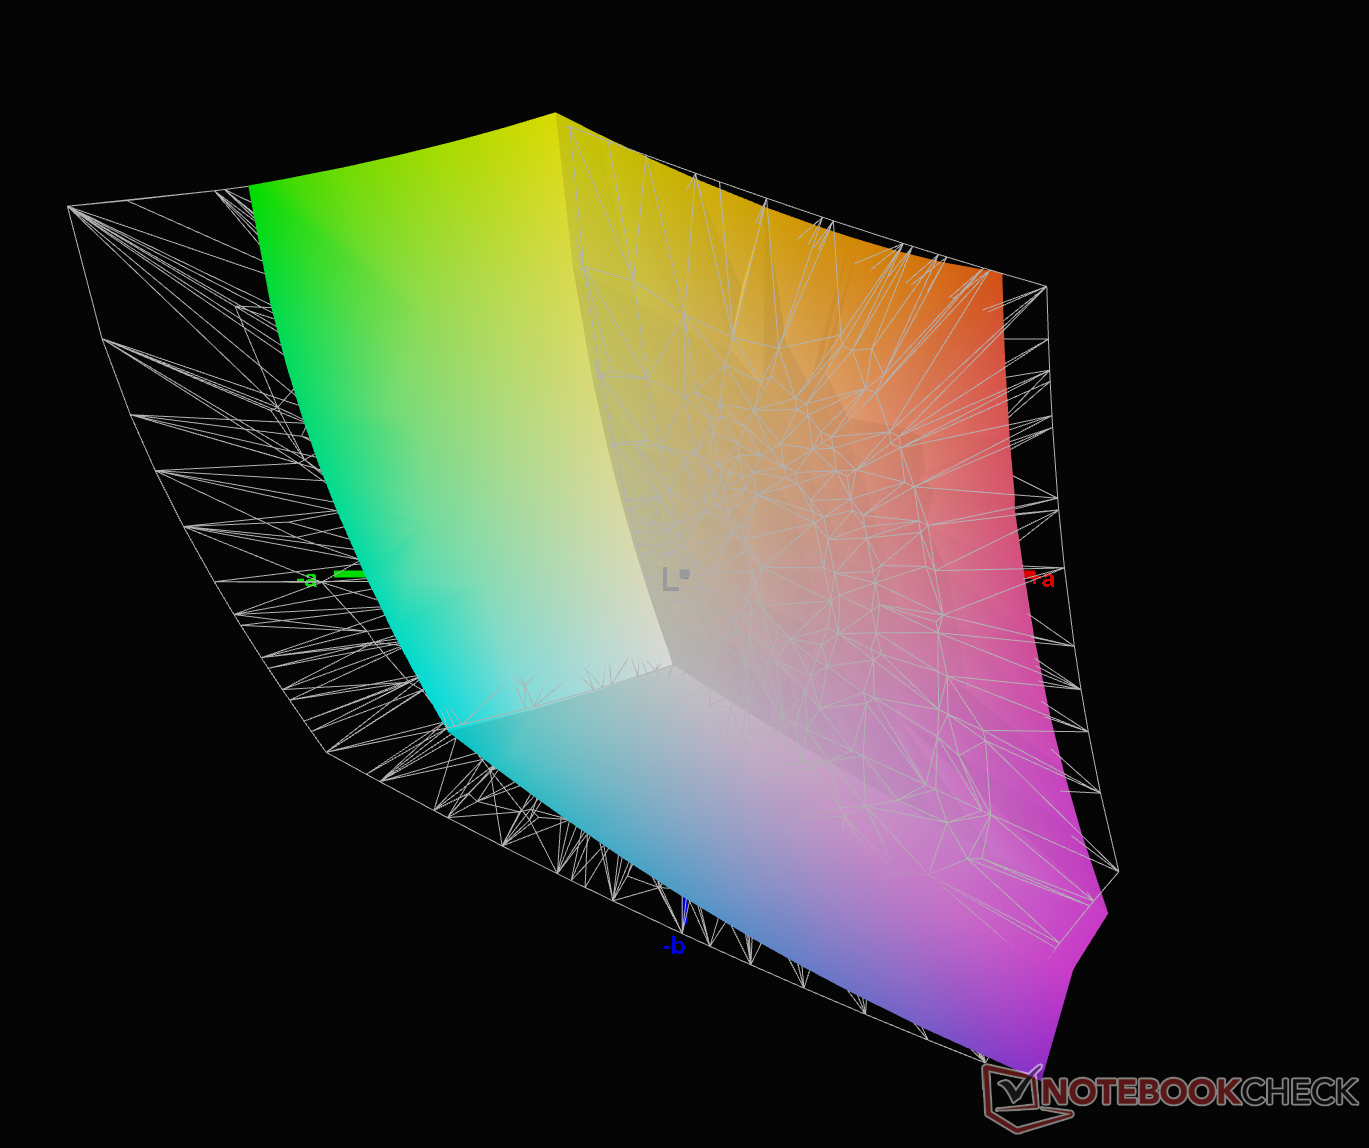
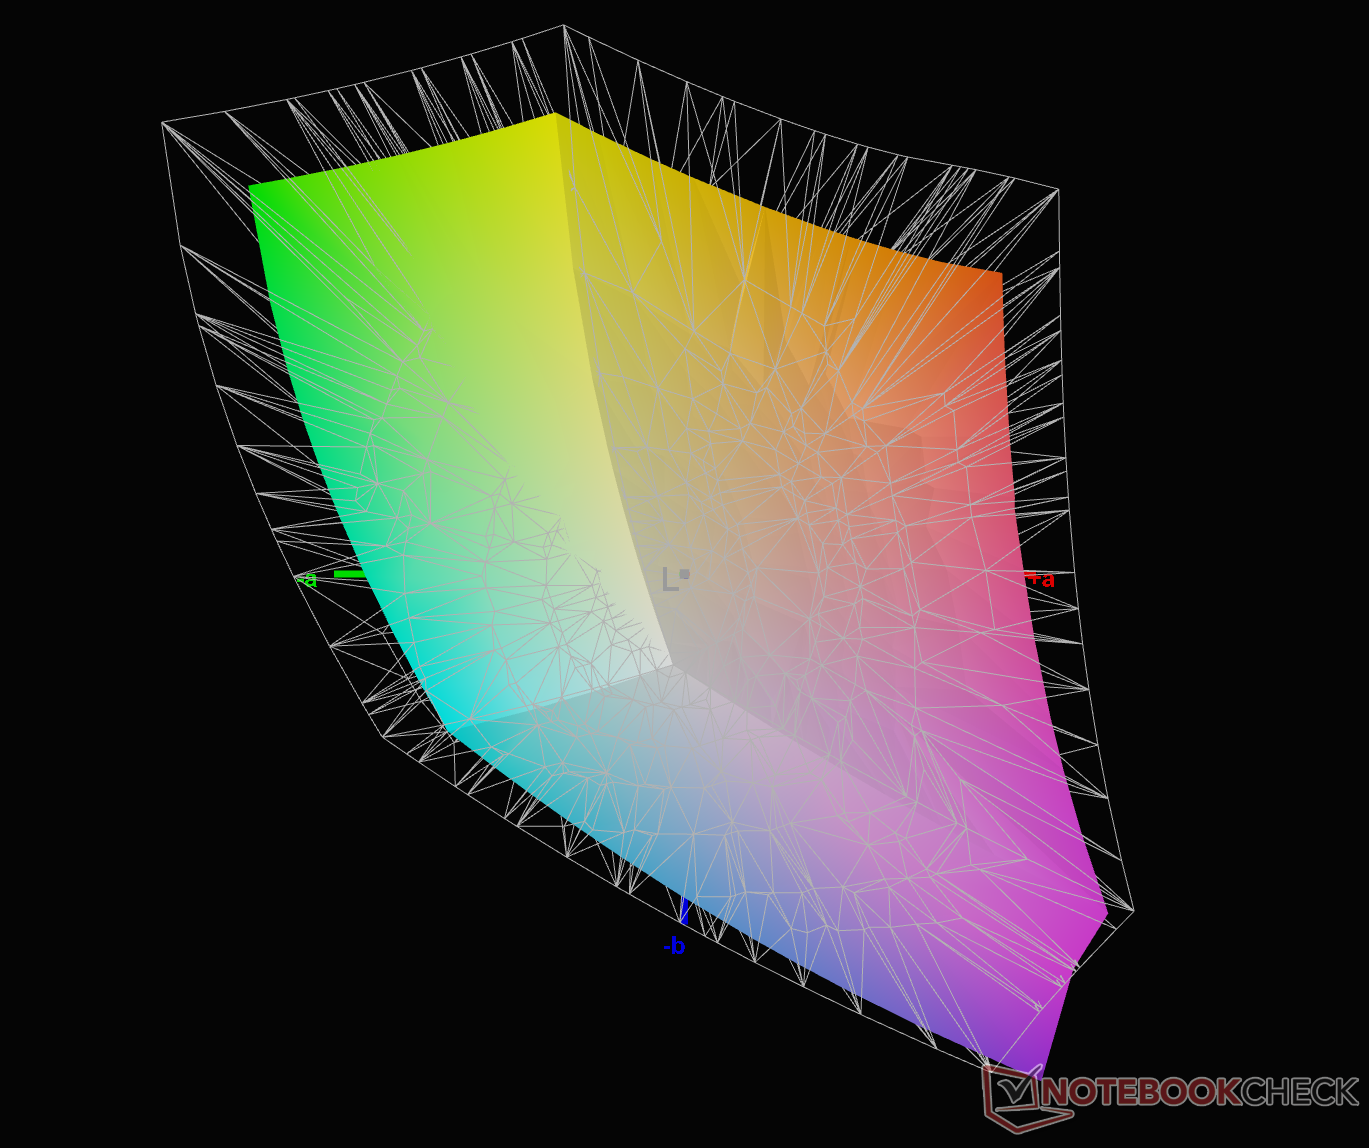
75.5% AdobeRGB 1998 (Argyll 3D)
99.4% sRGB (Argyll 3D)
76% Display P3 (Argyll 3D)
Gamma: 2.13
CCT: 6426 K
| Acer TravelMate P614P-52 AU Optronics B140UAV01.0, IPS, 14", 1920x1200 | Lenovo ThinkPad T14s G2 20WM003TGE NE140FHM-N61, IPS LED, 14", 1920x1080 | Dell Latitude 9420 2-in-1 AU Optronics B140QAN, IPS, 14", 2560x1600 | Asus ExpertBook B9 B9400CE-KC0166R B140HAN06.B, IPS, 14", 1920x1080 | Razer Book 13 FHD Sharp LQ134N1JW48, IPS, 13.4", 1920x1200 | HP EliteBook 830 G8-i7-1165G7 X133NVFF R0, IPS, 13.3", 1920x1080 | |
|---|---|---|---|---|---|---|
| Display | -10% | 4% | -5% | -4% | -7% | |
| Display P3 Coverage (%) | 76 | 68.1 -10% | 80.7 6% | 69.8 -8% | 70.1 -8% | 69.2 -9% |
| sRGB Coverage (%) | 99.4 | 91.7 -8% | 100 1% | 98.8 -1% | 99.3 0% | 94.5 -5% |
| AdobeRGB 1998 Coverage (%) | 75.5 | 67.1 -11% | 79.7 6% | 71.3 -6% | 71.6 -5% | 71.1 -6% |
| Response Times | -58% | -38% | -38% | -54% | -21% | |
| Response Time Grey 50% / Grey 80% * (ms) | 40.79 ? | 68 ? -67% | 54 ? -32% | 60 ? -47% | 56.8 ? -39% | 45 ? -10% |
| Response Time Black / White * (ms) | 22.9 ? | 34 ? -48% | 32.8 ? -43% | 29.6 ? -29% | 38.8 ? -69% | 30 ? -31% |
| PWM Frequency (Hz) | 1000 ? | 22730 ? | 2475 ? | |||
| Screen | -59% | -29% | -6% | -0% | -17% | |
| Brightness middle (cd/m²) | 504.15 | 422.9 -16% | 483.6 -4% | 437 -13% | 545.3 8% | 1007 100% |
| Brightness (cd/m²) | 482 | 397 -18% | 465 -4% | 421 -13% | 507 5% | 985 104% |
| Brightness Distribution (%) | 77 | 91 18% | 92 19% | 87 13% | 88 14% | 87 13% |
| Black Level * (cd/m²) | 0.19 | 0.32 -68% | 0.32 -68% | 0.29 -53% | 0.31 -63% | 0.34 -79% |
| Contrast (:1) | 2653 | 1322 -50% | 1511 -43% | 1507 -43% | 1759 -34% | 2962 12% |
| Colorchecker dE 2000 * | 2.75 | 4.8 -75% | 3.69 -34% | 1.8 35% | 1.39 49% | 4 -45% |
| Colorchecker dE 2000 max. * | 4.66 | 8.7 -87% | 5.97 -28% | 3.5 25% | 2.61 44% | 8.9 -91% |
| Colorchecker dE 2000 calibrated * | 1.72 | 1.9 -10% | 2.05 -19% | 1.4 19% | 2.72 -58% | 2.4 -40% |
| Greyscale dE 2000 * | 1.9 | 6.1 -221% | 3.5 -84% | 2.3 -21% | 1.3 32% | 4.3 -126% |
| Gamma | 2.13 103% | 2.23 99% | 2.04 108% | 2.18 101% | 2.2 100% | 2.1 105% |
| CCT | 6426 101% | 7635 85% | 6158 106% | 6782 96% | 6476 100% | 6462 101% |
| Color Space (Percent of AdobeRGB 1998) (%) | 65.4 | 65.9 | ||||
| Color Space (Percent of sRGB) (%) | 98.7 | 99.6 | ||||
| Total Average (Program / Settings) | -42% /
-48% | -21% /
-23% | -16% /
-10% | -19% /
-9% | -15% /
-15% |
* ... smaller is better
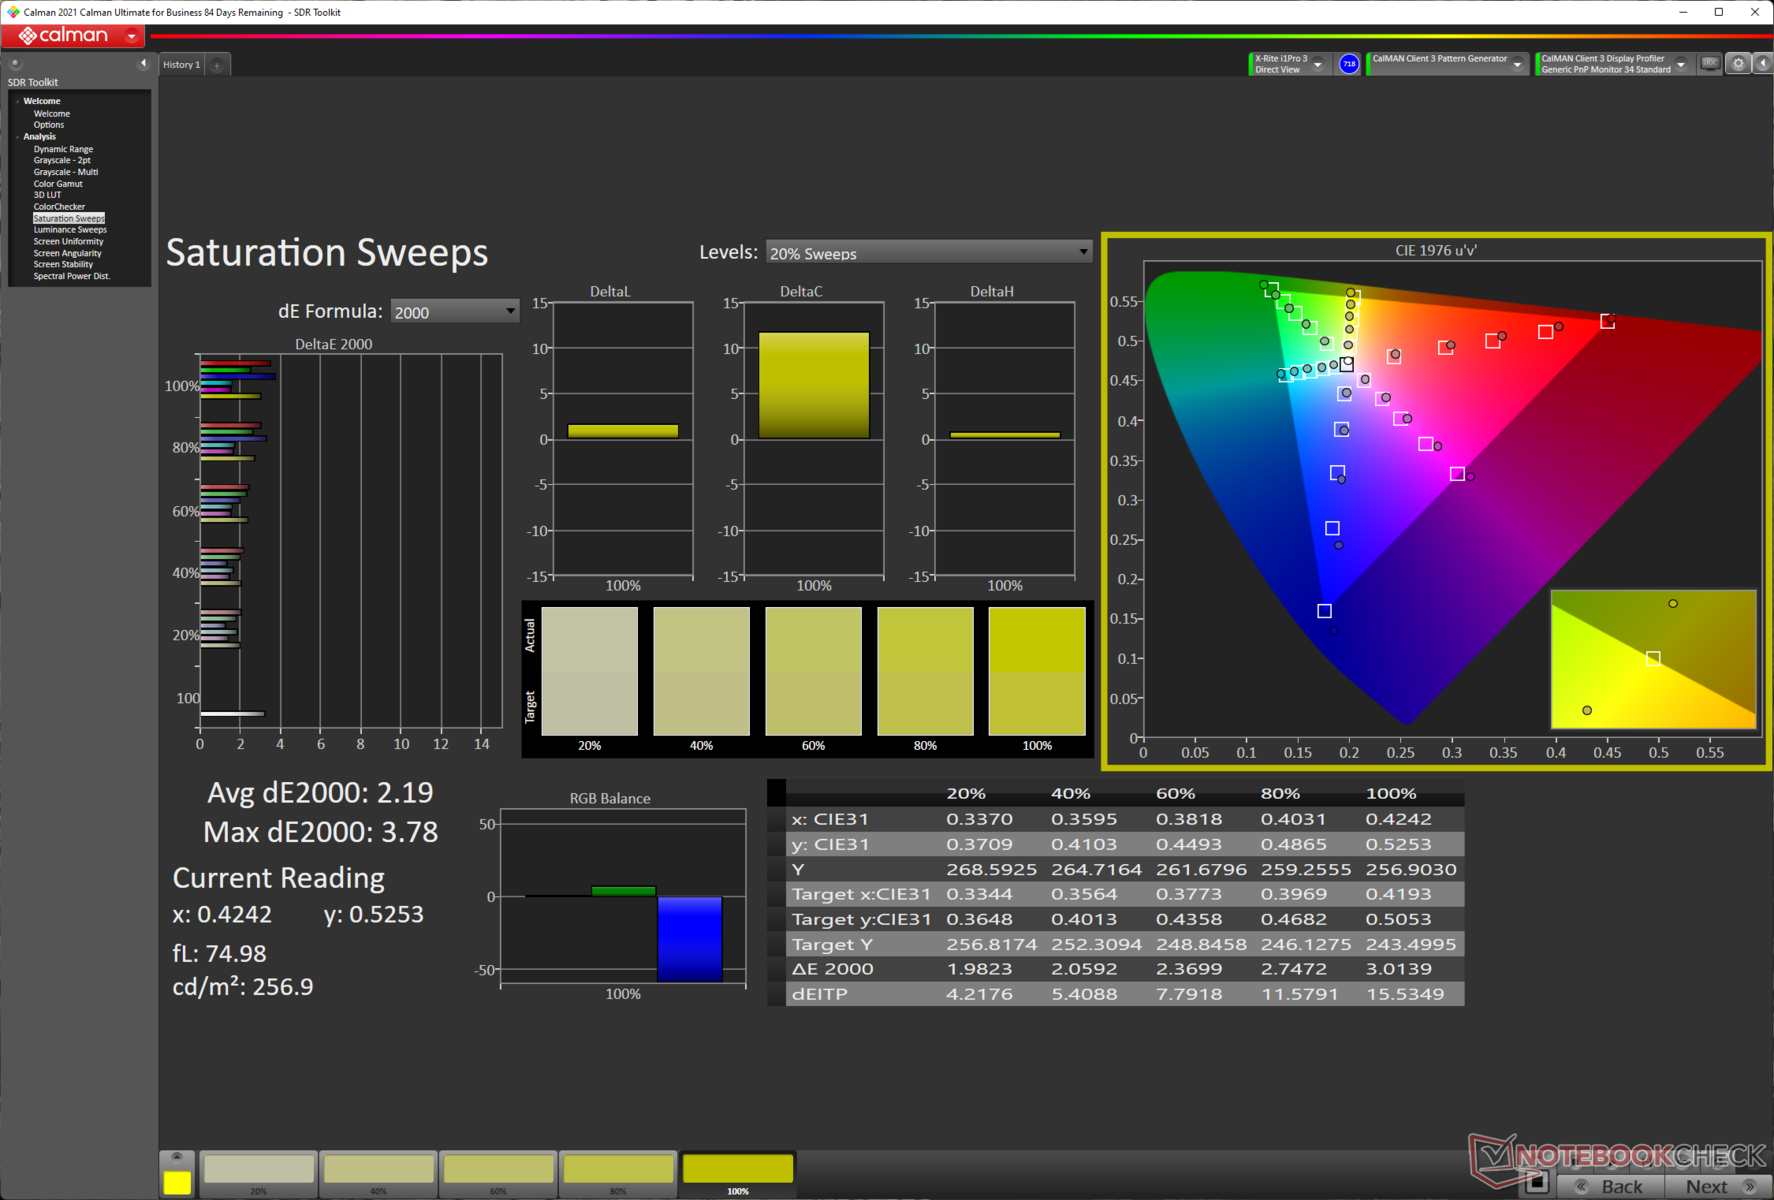
The TravelMate P6 pretty much covers the entire sRGB color gamut along with having decent AdobeRGB and DCI-P3 coverage. The panel already shows good color accuracy out-of-the-box, but we could achieve even better results with our calibration.


We measured a combined 22.9 ms response time from black to white and 40.79 ms from 50% grey to 80% grey. Though not exactly suited for gaming, the Acer TravelMate P6 offers decent response times compared to competing business laptops.
The TravelMate P6 uses PWM for backlight adjustment. While we observed very high to no PWM at 100% brightness, a PWM of 1,000 Hz is apparent as soon as the brightness is lowered to 99%. The good part is that this 1,000 Hz PWM frequency is maintained across all brightness levels from 0 to 99%, so users sensitive to PWM should not experience any discomfort during prolonged use.
For more information on PWM, check out our article on "Why Pulse Width Modulation (PWM) is such a headache". Also, have a look at our PWM ranking table for an overview of measured PWM and response times for all reviewed devices.
Display Response Times
| ↔ Response Time Black to White | ||
|---|---|---|
| 22.9 ms ... rise ↗ and fall ↘ combined | ↗ 10.96 ms rise | 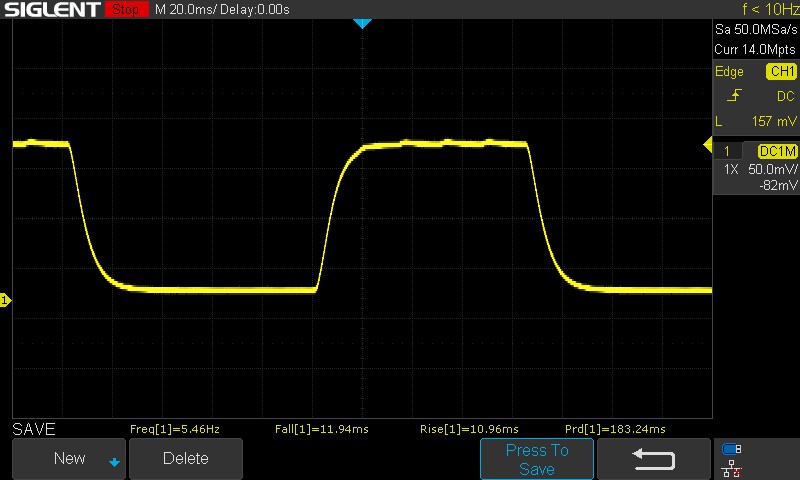 |
| ↘ 11.94 ms fall | ||
| The screen shows good response rates in our tests, but may be too slow for competitive gamers. In comparison, all tested devices range from 0.1 (minimum) to 240 (maximum) ms. » 52 % of all devices are better. This means that the measured response time is worse than the average of all tested devices (19.8 ms). | ||
| ↔ Response Time 50% Grey to 80% Grey | ||
| 40.79 ms ... rise ↗ and fall ↘ combined | ↗ 17.72 ms rise | 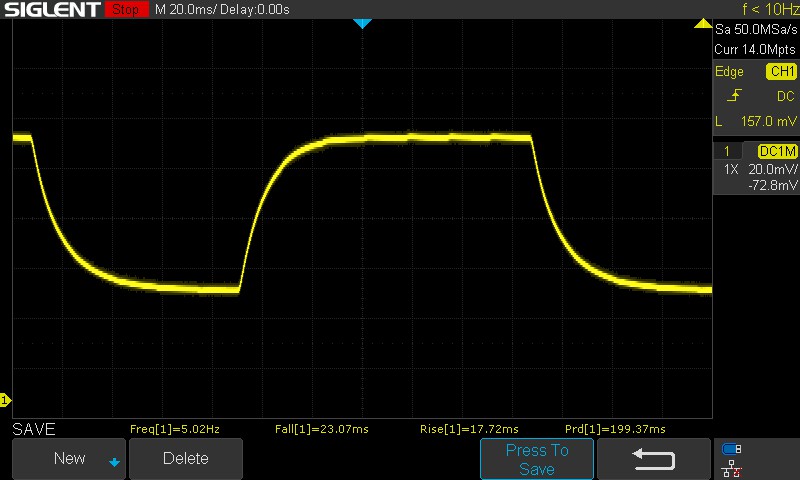 |
| ↘ 23.07 ms fall | ||
| The screen shows slow response rates in our tests and will be unsatisfactory for gamers. In comparison, all tested devices range from 0.165 (minimum) to 636 (maximum) ms. » 64 % of all devices are better. This means that the measured response time is worse than the average of all tested devices (31 ms). | ||
Screen Flickering / PWM (Pulse-Width Modulation)
| Screen flickering / PWM detected | 1000 Hz | ≤ 99 % brightness setting | 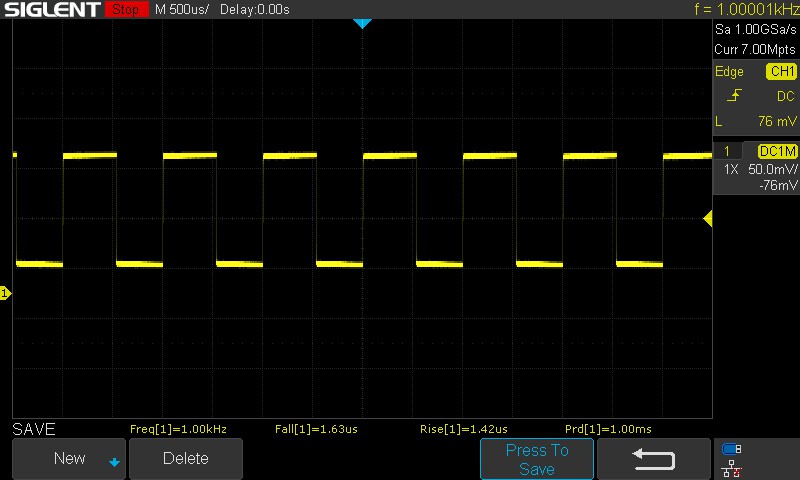 |
The display backlight flickers at 1000 Hz (worst case, e.g., utilizing PWM) Flickering detected at a brightness setting of 99 % and below. There should be no flickering or PWM above this brightness setting. The frequency of 1000 Hz is quite high, so most users sensitive to PWM should not notice any flickering. In comparison: 52 % of all tested devices do not use PWM to dim the display. If PWM was detected, an average of 7772 (minimum: 5 - maximum: 343500) Hz was measured. | |||
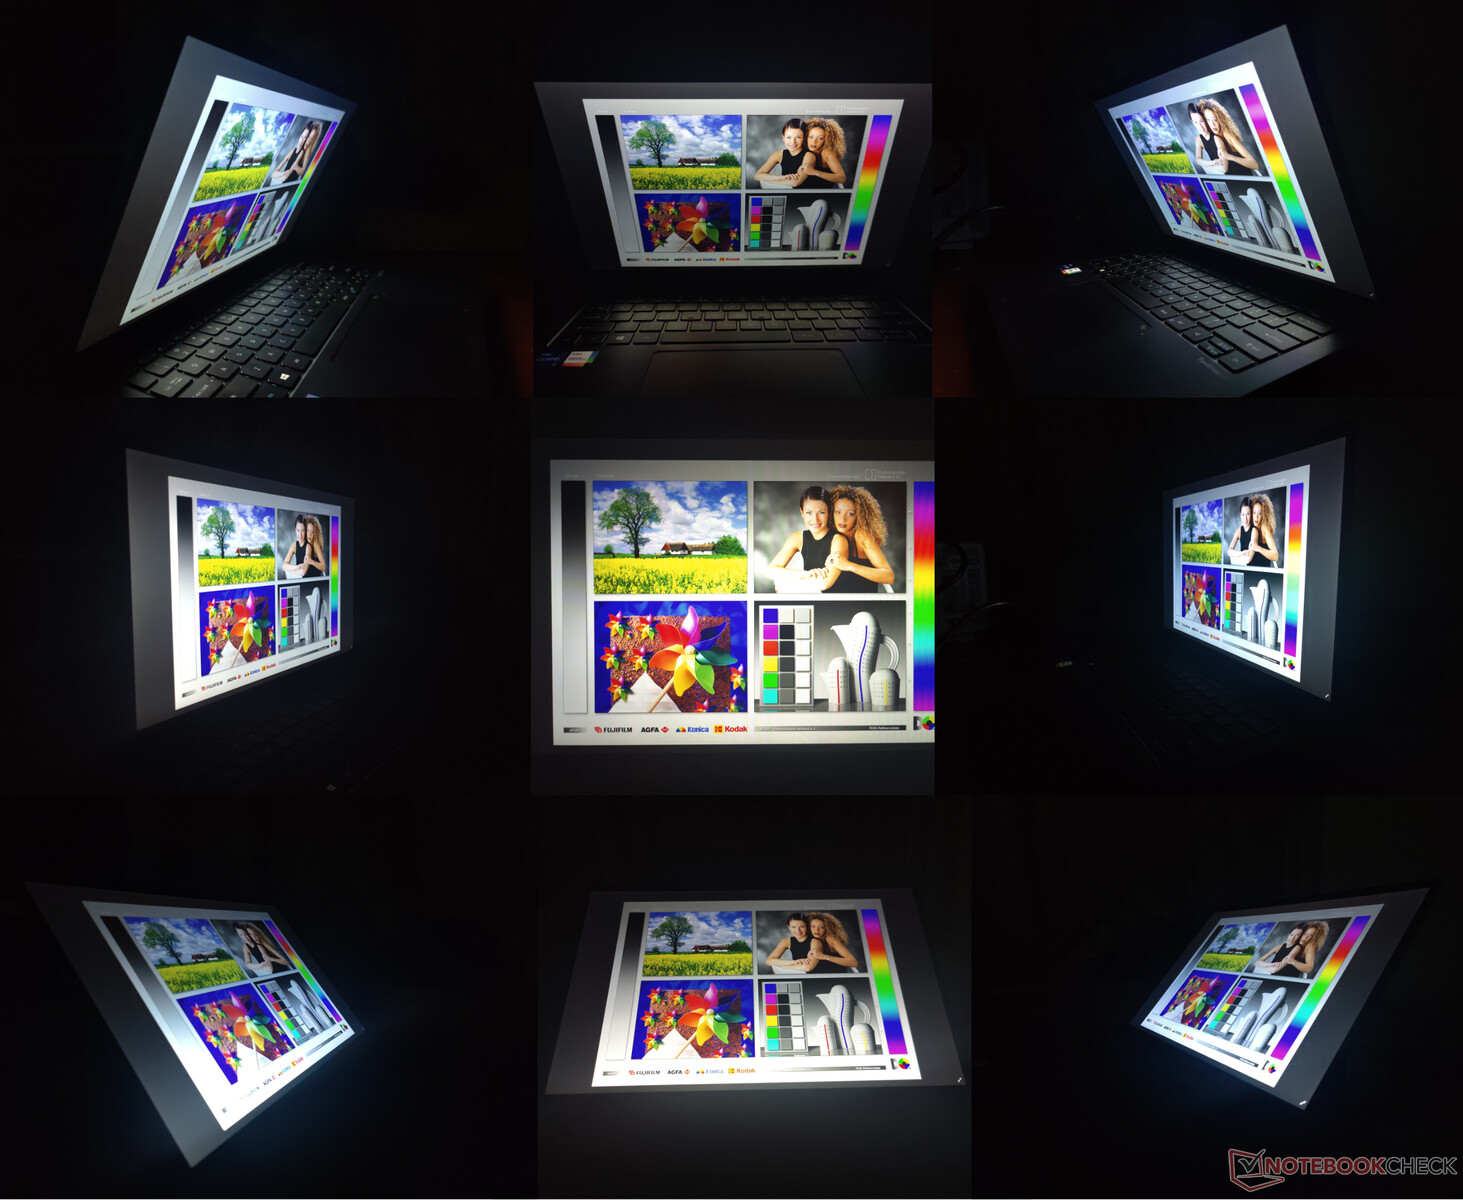
Our unit came equipped with the optional Acer PrivacyPanel that restricts viewing angles to just 90°. The PrivacyPanel can be toggled by pressing Fn+F10, and the best results are seen at lower brightness levels. Strangely, PrivacyPanel seemed to be automatically enabled when on AC power and pressing Fn+F10 apparently does not disable it.
Due to reduced brightness on battery as indicated above, the TravelMate P6's panel poses difficulty when viewed under direct sunlight. Acer claims a 170°-wide viewing angle, which is true if the PrivacyPanel is turned off. However, we did notice color shifts when viewed from extreme edges.
Performance: Well-sustained but not record-breaking
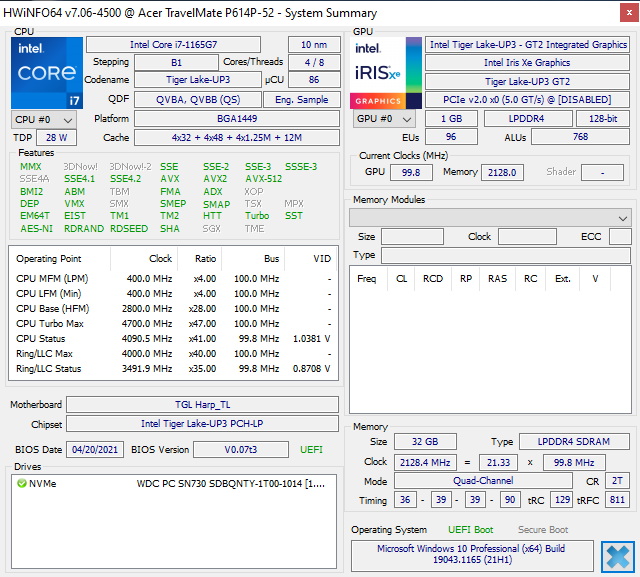
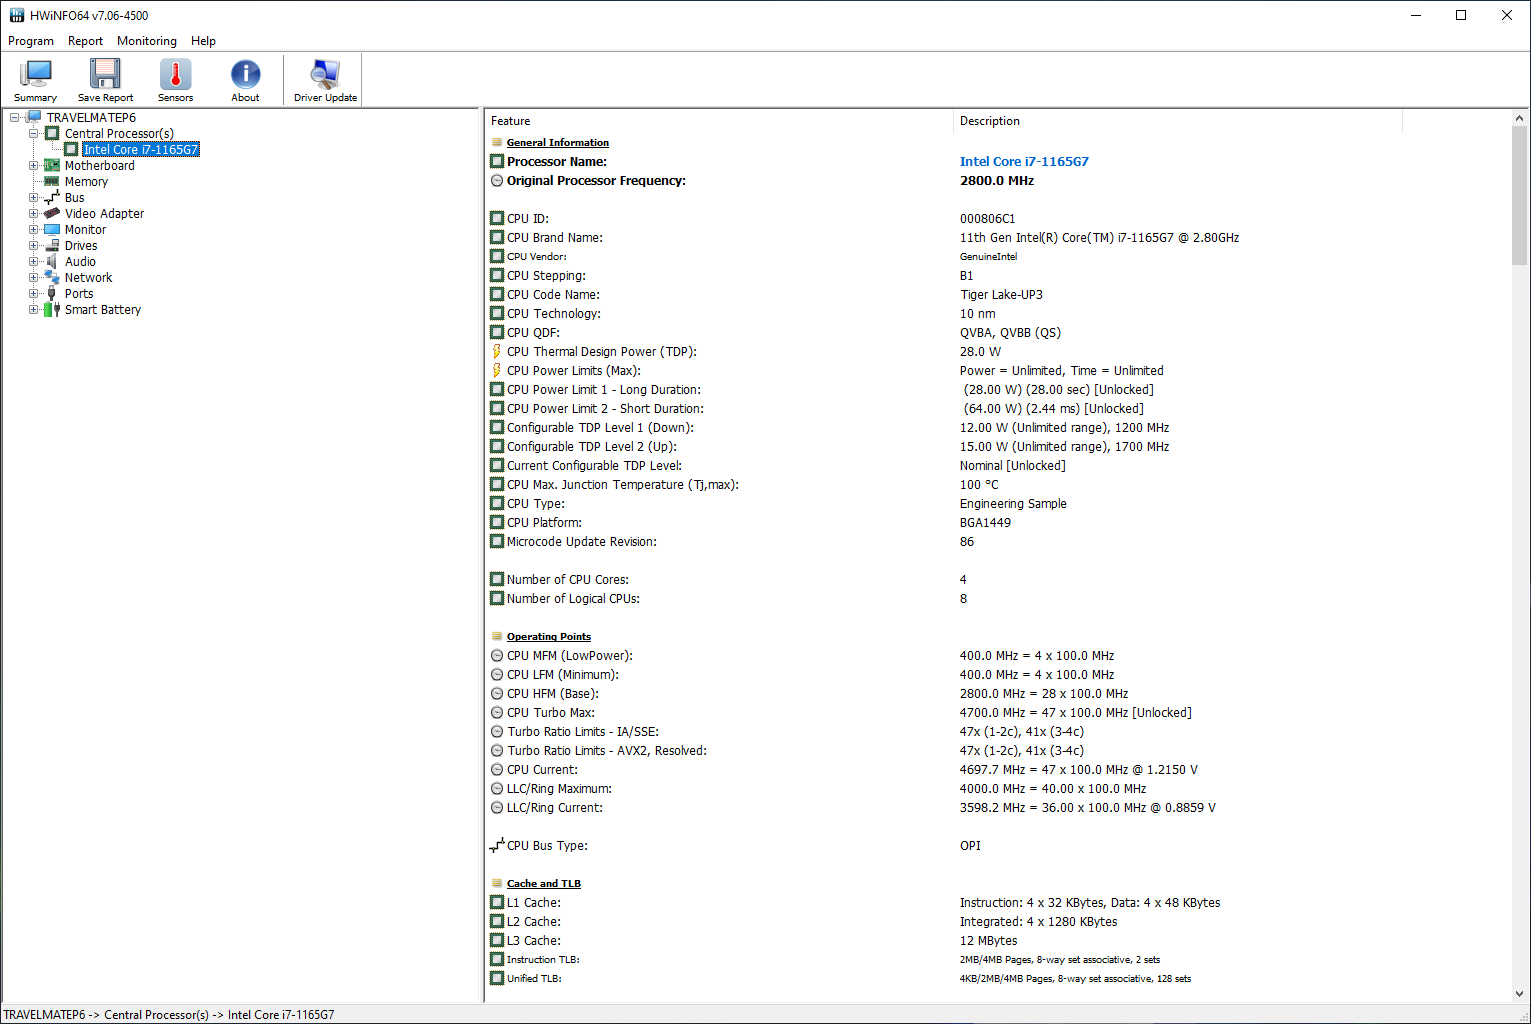
Our test unit is powered by an Intel Tiger Lake Core i7-1165G7 CPU, which is a 4C/8T part with 2.8 GHz base and 4.7 GHz boost clocks. Buyers can choose among Core i5-1135G7 and Core i7-1185G7 options as well.
Processor
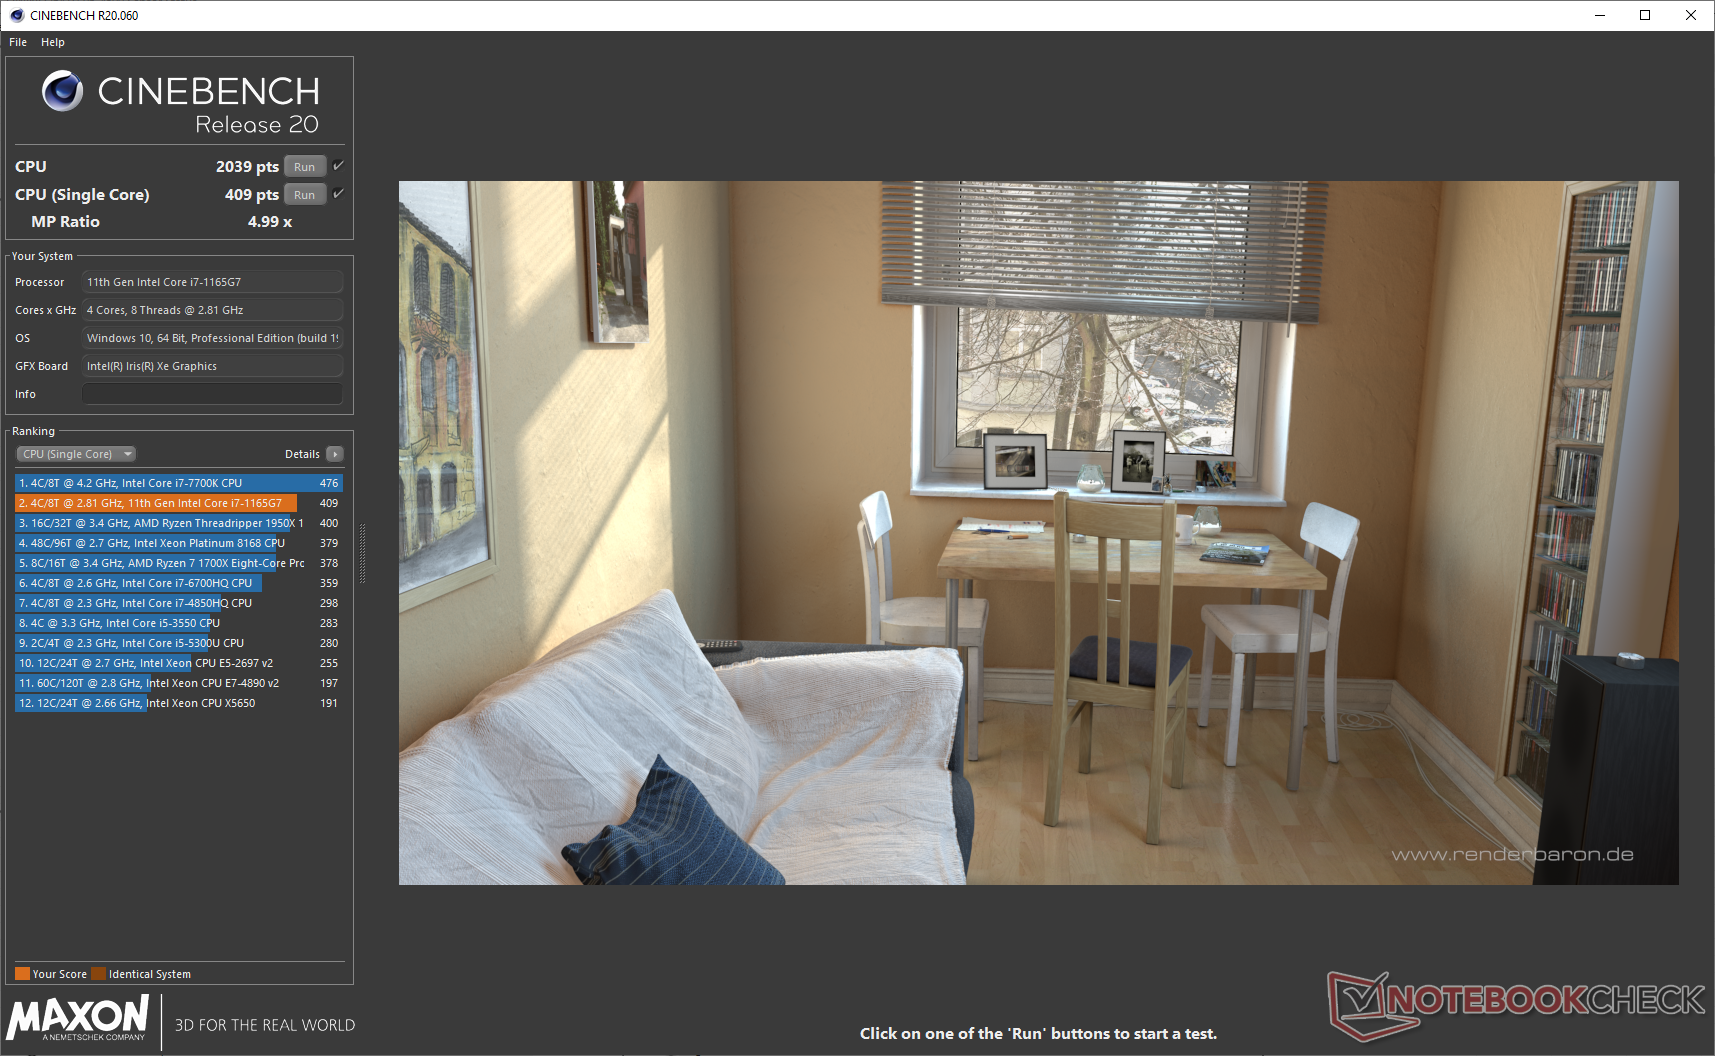
The Core i7-1165G7 in the TravelMate P6 affords very good performance with up to 17% leads in all Cinebench single-core tests and up to a 32% lead in Geekbench single-core over the AMD Ryzen 7 5700U. Single-core performance is also comparable to the Core i7-1185G7, though the TravelMate P6's implementation is not always the fastest Core i7-1165G7 in the comparison.
We find no signs of throttling in the Cinebench R15 loop test, and the performance is much more consistent than what we observed with the Lenovo ThinkPad T14s G2. Acer does not offer Ryzen 5000 Mobile-based TravelMate P6 laptops yet, which is unfortunate considering the huge disparity seen in multi-threaded performance compared to Ryzen 7 5700U-based devices such as the Lenovo ThinkPad E15 G3.
The Core i7-1165G7 in our test sample allows for a sustained PL1 of 28 W and a short burst PL2 of 64 W. According to Acer's documentation, it should be possible to switch between Silent, Normal, and Performance modes by using the Fn+F keyboard shortcut. However, the pre-production sample we received does not have this functionality. We also verified this with the latest version of the Acer Quick Access app that is supposed to offer performance mode selection, but we could not find any such option.
Check out our dedicated Core i7-1165G7 page for more information and benchmarks.
Cinebench R15 Multi Loop
Cinebench R20: CPU (Multi Core) | CPU (Single Core)
Cinebench R23: Multi Core | Single Core
Blender: v2.79 BMW27 CPU
7-Zip 18.03: 7z b 4 -mmt1 | 7z b 4
Geekbench 5.5: Single-Core | Multi-Core
HWBOT x265 Benchmark v2.2: 4k Preset
LibreOffice : 20 Documents To PDF
R Benchmark 2.5: Overall mean
| Cinebench R15 / CPU Multi 64Bit | |
| Average of class Office (250 - 3380, n=75, last 2 years) | |
| Asus VivoBook S15 D533UA | |
| Lenovo ThinkPad E15 G3-20YG003UGE | |
| Lenovo ThinkPad T14s G2 20WM003TGE | |
| Razer Book 13 FHD | |
| Dell Latitude 9420 2-in-1 | |
| Asus ExpertBook B9 B9400CE-KC0166R | |
| Acer TravelMate P614P-52 | |
| Framework Laptop 13.5 | |
| Average Intel Core i7-1165G7 (553 - 1027, n=86) | |
| HP EliteBook 830 G8-i7-1165G7 | |
| Cinebench R15 / CPU Single 64Bit | |
| Average of class Office (99.5 - 312, n=75, last 2 years) | |
| Razer Book 13 FHD | |
| Lenovo ThinkPad T14s G2 20WM003TGE | |
| Dell Latitude 9420 2-in-1 | |
| Framework Laptop 13.5 | |
| HP EliteBook 830 G8-i7-1165G7 | |
| Acer TravelMate P614P-52 | |
| Asus ExpertBook B9 B9400CE-KC0166R | |
| Average Intel Core i7-1165G7 (115 - 230, n=78) | |
| Asus VivoBook S15 D533UA | |
| Lenovo ThinkPad E15 G3-20YG003UGE | |
| Cinebench R20 / CPU (Multi Core) | |
| Average of class Office (648 - 8840, n=73, last 2 years) | |
| Asus VivoBook S15 D533UA | |
| Lenovo ThinkPad E15 G3-20YG003UGE | |
| Razer Book 13 FHD | |
| Dell Latitude 9420 2-in-1 | |
| Framework Laptop 13.5 | |
| Acer TravelMate P614P-52 | |
| Asus ExpertBook B9 B9400CE-KC0166R | |
| Average Intel Core i7-1165G7 (1060 - 2657, n=81) | |
| Lenovo ThinkPad T14s G2 20WM003TGE | |
| HP EliteBook 830 G8-i7-1165G7 | |
| Cinebench R20 / CPU (Single Core) | |
| Average of class Office (345 - 816, n=73, last 2 years) | |
| Razer Book 13 FHD | |
| Framework Laptop 13.5 | |
| Dell Latitude 9420 2-in-1 | |
| Acer TravelMate P614P-52 | |
| Asus ExpertBook B9 B9400CE-KC0166R | |
| Average Intel Core i7-1165G7 (442 - 589, n=81) | |
| Lenovo ThinkPad T14s G2 20WM003TGE | |
| HP EliteBook 830 G8-i7-1165G7 | |
| Asus VivoBook S15 D533UA | |
| Lenovo ThinkPad E15 G3-20YG003UGE | |
| Cinebench R23 / Multi Core | |
| Average of class Office (1673 - 22808, n=74, last 2 years) | |
| Asus VivoBook S15 D533UA | |
| Lenovo ThinkPad E15 G3-20YG003UGE | |
| Razer Book 13 FHD | |
| Dell Latitude 9420 2-in-1 | |
| Framework Laptop 13.5 | |
| Acer TravelMate P614P-52 | |
| Average Intel Core i7-1165G7 (2525 - 6862, n=64) | |
| Lenovo ThinkPad T14s G2 20WM003TGE | |
| Asus ExpertBook B9 B9400CE-KC0166R | |
| HP EliteBook 830 G8-i7-1165G7 | |
| Cinebench R23 / Single Core | |
| Average of class Office (708 - 2130, n=74, last 2 years) | |
| Framework Laptop 13.5 | |
| Dell Latitude 9420 2-in-1 | |
| Acer TravelMate P614P-52 | |
| Average Intel Core i7-1165G7 (1110 - 1539, n=59) | |
| Asus ExpertBook B9 B9400CE-KC0166R | |
| HP EliteBook 830 G8-i7-1165G7 | |
| Lenovo ThinkPad T14s G2 20WM003TGE | |
| Asus VivoBook S15 D533UA | |
| Lenovo ThinkPad E15 G3-20YG003UGE | |
| Blender / v2.79 BMW27 CPU | |
| HP EliteBook 830 G8-i7-1165G7 | |
| Average Intel Core i7-1165G7 (468 - 1138, n=80) | |
| Lenovo ThinkPad T14s G2 20WM003TGE | |
| Acer TravelMate P614P-52 | |
| Asus ExpertBook B9 B9400CE-KC0166R | |
| Framework Laptop 13.5 | |
| Dell Latitude 9420 2-in-1 | |
| Razer Book 13 FHD | |
| Average of class Office (158 - 1940, n=74, last 2 years) | |
| Asus VivoBook S15 D533UA | |
| Lenovo ThinkPad E15 G3-20YG003UGE | |
| 7-Zip 18.03 / 7z b 4 -mmt1 | |
| Framework Laptop 13.5 | |
| Average of class Office (3387 - 6469, n=75, last 2 years) | |
| HP EliteBook 830 G8-i7-1165G7 | |
| Razer Book 13 FHD | |
| Dell Latitude 9420 2-in-1 | |
| Asus ExpertBook B9 B9400CE-KC0166R | |
| Average Intel Core i7-1165G7 (4478 - 5507, n=80) | |
| Lenovo ThinkPad T14s G2 20WM003TGE | |
| Acer TravelMate P614P-52 | |
| Asus VivoBook S15 D533UA | |
| Lenovo ThinkPad E15 G3-20YG003UGE | |
| 7-Zip 18.03 / 7z b 4 | |
| Average of class Office (7098 - 76886, n=75, last 2 years) | |
| Asus VivoBook S15 D533UA | |
| Lenovo ThinkPad E15 G3-20YG003UGE | |
| Razer Book 13 FHD | |
| Dell Latitude 9420 2-in-1 | |
| Lenovo ThinkPad T14s G2 20WM003TGE | |
| Framework Laptop 13.5 | |
| Acer TravelMate P614P-52 | |
| Asus ExpertBook B9 B9400CE-KC0166R | |
| Average Intel Core i7-1165G7 (15347 - 27405, n=80) | |
| HP EliteBook 830 G8-i7-1165G7 | |
| Geekbench 5.5 / Single-Core | |
| Average of class Office (811 - 2128, n=71, last 2 years) | |
| Razer Book 13 FHD | |
| HP EliteBook 830 G8-i7-1165G7 | |
| Acer TravelMate P614P-52 | |
| Average Intel Core i7-1165G7 (1302 - 1595, n=77) | |
| Lenovo ThinkPad T14s G2 20WM003TGE | |
| Asus ExpertBook B9 B9400CE-KC0166R | |
| Asus VivoBook S15 D533UA | |
| Lenovo ThinkPad E15 G3-20YG003UGE | |
| Geekbench 5.5 / Multi-Core | |
| Average of class Office (1483 - 16999, n=71, last 2 years) | |
| Asus VivoBook S15 D533UA | |
| Lenovo ThinkPad E15 G3-20YG003UGE | |
| Razer Book 13 FHD | |
| Acer TravelMate P614P-52 | |
| Lenovo ThinkPad T14s G2 20WM003TGE | |
| HP EliteBook 830 G8-i7-1165G7 | |
| Average Intel Core i7-1165G7 (3078 - 5926, n=77) | |
| Asus ExpertBook B9 B9400CE-KC0166R | |
| HWBOT x265 Benchmark v2.2 / 4k Preset | |
| Average of class Office (2.21 - 26, n=74, last 2 years) | |
| Asus VivoBook S15 D533UA | |
| Lenovo ThinkPad E15 G3-20YG003UGE | |
| Razer Book 13 FHD | |
| Dell Latitude 9420 2-in-1 | |
| Lenovo ThinkPad T14s G2 20WM003TGE | |
| Framework Laptop 13.5 | |
| Asus ExpertBook B9 B9400CE-KC0166R | |
| Acer TravelMate P614P-52 | |
| Average Intel Core i7-1165G7 (1.39 - 8.47, n=80) | |
| HP EliteBook 830 G8-i7-1165G7 | |
| LibreOffice / 20 Documents To PDF | |
| Lenovo ThinkPad E15 G3-20YG003UGE | |
| Average of class Office (39.9 - 102.3, n=74, last 2 years) | |
| Asus VivoBook S15 D533UA | |
| HP EliteBook 830 G8-i7-1165G7 | |
| Razer Book 13 FHD | |
| Asus ExpertBook B9 B9400CE-KC0166R | |
| Average Intel Core i7-1165G7 (21.5 - 88.1, n=78) | |
| Dell Latitude 9420 2-in-1 | |
| Acer TravelMate P614P-52 | |
| Framework Laptop 13.5 | |
| Lenovo ThinkPad T14s G2 20WM003TGE | |
| R Benchmark 2.5 / Overall mean | |
| Lenovo ThinkPad E15 G3-20YG003UGE | |
| Acer TravelMate P614P-52 | |
| Average Intel Core i7-1165G7 (0.552 - 1.002, n=80) | |
| Asus ExpertBook B9 B9400CE-KC0166R | |
| Lenovo ThinkPad T14s G2 20WM003TGE | |
| Asus VivoBook S15 D533UA | |
| Framework Laptop 13.5 | |
| Dell Latitude 9420 2-in-1 | |
| HP EliteBook 830 G8-i7-1165G7 | |
| Razer Book 13 FHD | |
| Average of class Office (0.4098 - 0.888, n=74, last 2 years) | |
* ... smaller is better
A quick run of Cinebench R20 on battery in a Balanced power profile does not show much variation in the multi-core score compared to AC power.
However, we do see a nearly 27% decrease in single-core performance as clocks drop from ~4.5 GHz to ~3.2 GHz on battery.
System Performance
General productivity isn't an issue with the TravelMate P6. The laptop is quite responsive and the overall experience in daily usage is mostly lag-free. The Core i7-1165G7 offers more than enough oomph to sail through typical business needs on the move. PCMark 10 results show the TravelMate P6 to be on par with Ryzen 7 5700U and Core i7-1185G7-powered laptops.
| PCMark 10 / Score | |
| Average of class Office (2601 - 9298, n=64, last 2 years) | |
| Lenovo ThinkPad E15 G3-20YG003UGE | |
| Asus VivoBook S15 D533UA | |
| Acer TravelMate P614P-52 | |
| Dell Latitude 9420 2-in-1 | |
| Lenovo ThinkPad T14s G2 20WM003TGE | |
| Razer Book 13 FHD | |
| HP EliteBook 830 G8-i7-1165G7 | |
| Asus ExpertBook B9 B9400CE-KC0166R | |
| Average Intel Core i7-1165G7, Intel Iris Xe Graphics G7 96EUs (4531 - 5454, n=50) | |
| Framework Laptop 13.5 | |
| PCMark 10 / Essentials | |
| Acer TravelMate P614P-52 | |
| Razer Book 13 FHD | |
| Dell Latitude 9420 2-in-1 | |
| Framework Laptop 13.5 | |
| Lenovo ThinkPad T14s G2 20WM003TGE | |
| Asus ExpertBook B9 B9400CE-KC0166R | |
| Average Intel Core i7-1165G7, Intel Iris Xe Graphics G7 96EUs (8997 - 11505, n=50) | |
| Average of class Office (3245 - 11594, n=64, last 2 years) | |
| HP EliteBook 830 G8-i7-1165G7 | |
| Lenovo ThinkPad E15 G3-20YG003UGE | |
| Asus VivoBook S15 D533UA | |
| PCMark 10 / Productivity | |
| Average of class Office (5336 - 17243, n=64, last 2 years) | |
| Lenovo ThinkPad E15 G3-20YG003UGE | |
| Asus VivoBook S15 D533UA | |
| Acer TravelMate P614P-52 | |
| Dell Latitude 9420 2-in-1 | |
| Lenovo ThinkPad T14s G2 20WM003TGE | |
| Asus ExpertBook B9 B9400CE-KC0166R | |
| HP EliteBook 830 G8-i7-1165G7 | |
| Razer Book 13 FHD | |
| Average Intel Core i7-1165G7, Intel Iris Xe Graphics G7 96EUs (5570 - 7136, n=50) | |
| Framework Laptop 13.5 | |
| PCMark 10 / Digital Content Creation | |
| Average of class Office (2049 - 13541, n=64, last 2 years) | |
| Asus VivoBook S15 D533UA | |
| Lenovo ThinkPad E15 G3-20YG003UGE | |
| Acer TravelMate P614P-52 | |
| Dell Latitude 9420 2-in-1 | |
| Lenovo ThinkPad T14s G2 20WM003TGE | |
| HP EliteBook 830 G8-i7-1165G7 | |
| Razer Book 13 FHD | |
| Framework Laptop 13.5 | |
| Asus ExpertBook B9 B9400CE-KC0166R | |
| Average Intel Core i7-1165G7, Intel Iris Xe Graphics G7 96EUs (4083 - 5550, n=50) | |
| PCMark 8 Home Score Accelerated v2 | 5686 points | |
| PCMark 8 Creative Score Accelerated v2 | 7783 points | |
| PCMark 10 Score | 5317 points | |
Help | ||
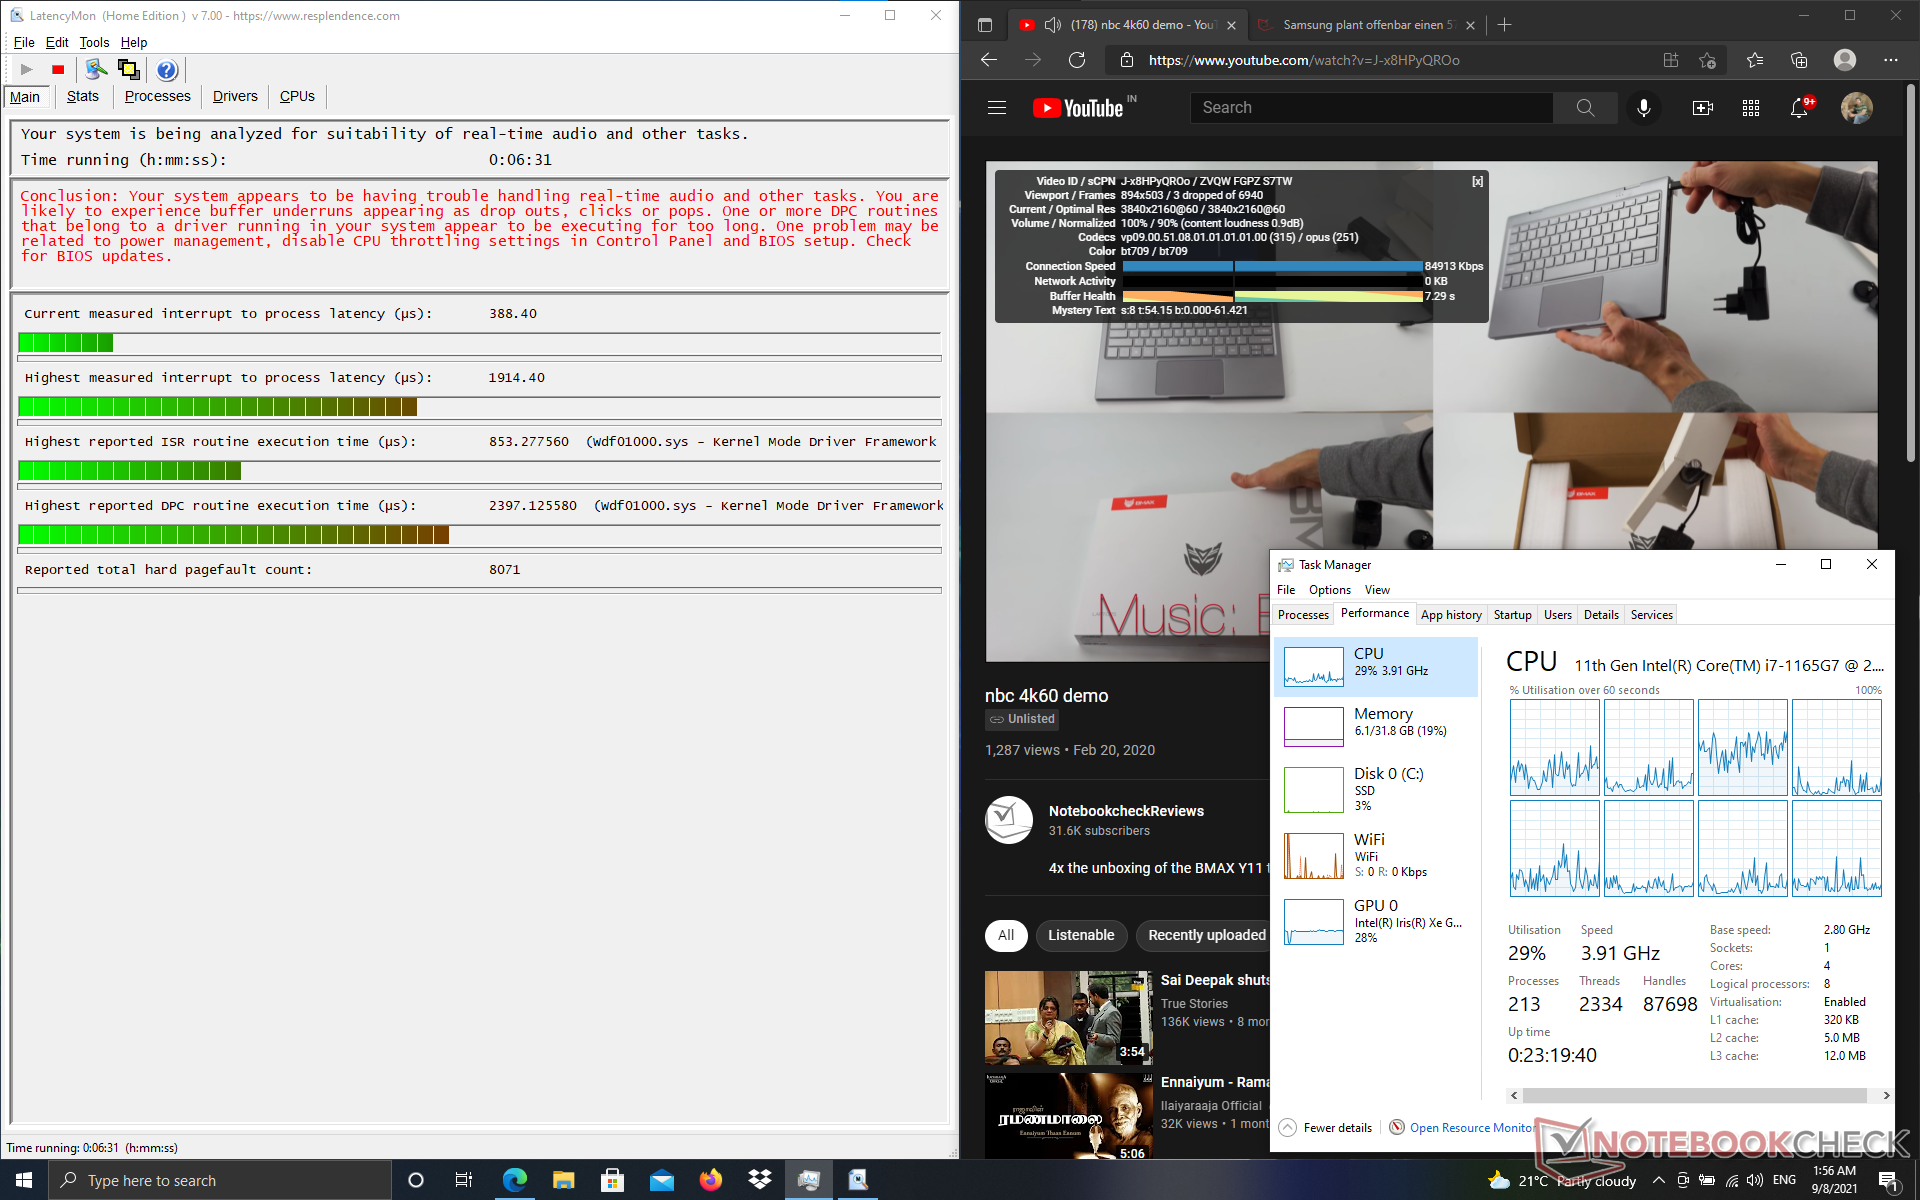
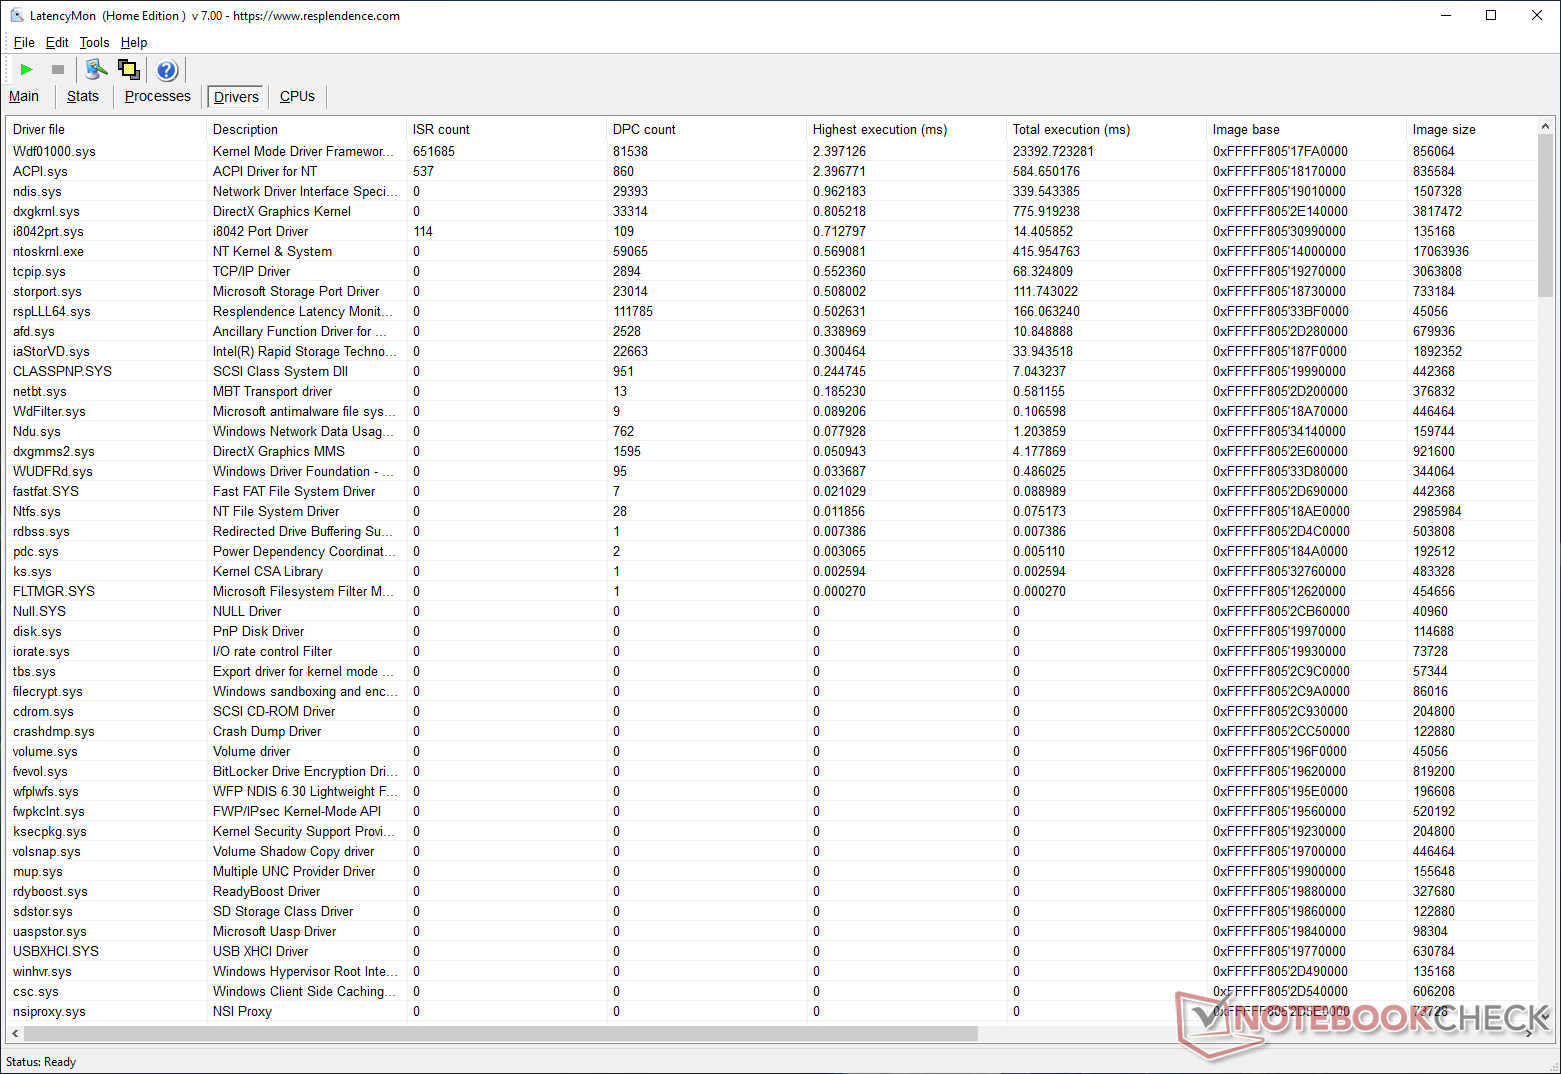
DPC Latency
We measured system latency using LatencyMon while opening multiple tabs of our site, playing back our sample 4K video on YouTube, and running Prime95 in-place large FFTs stress for 10 seconds. We recorded a high latency of 1914.40 µs. LatencyMon indicates Wdf01000.sys, which is the Windows Kernel Mode Driver Framework, as the driver with the highest execution time.
That being said, Wdf01000.sys's high execution times is usually due to other errant drivers which in this case is primarily ACPI.sys. Nevertheless, the TravelMate P6 does not seem to be suited for real-time audio or video editing.
Check out our DPC Latency Ranking page for more latency comparisons.
| DPC Latencies / LatencyMon - interrupt to process latency (max), Web, Youtube, Prime95 | |
| Lenovo ThinkPad T14s G2 20WM003TGE | |
| Framework Laptop 13.5 | |
| Acer TravelMate P614P-52 | |
| Razer Book 13 FHD | |
| HP EliteBook 830 G8-i7-1165G7 | |
| Lenovo ThinkPad E15 G3-20YG003UGE | |
| Asus VivoBook S15 D533UA | |
| Dell Latitude 9420 2-in-1 | |
| Asus ExpertBook B9 B9400CE-KC0166R | |
* ... smaller is better
Storage Devices
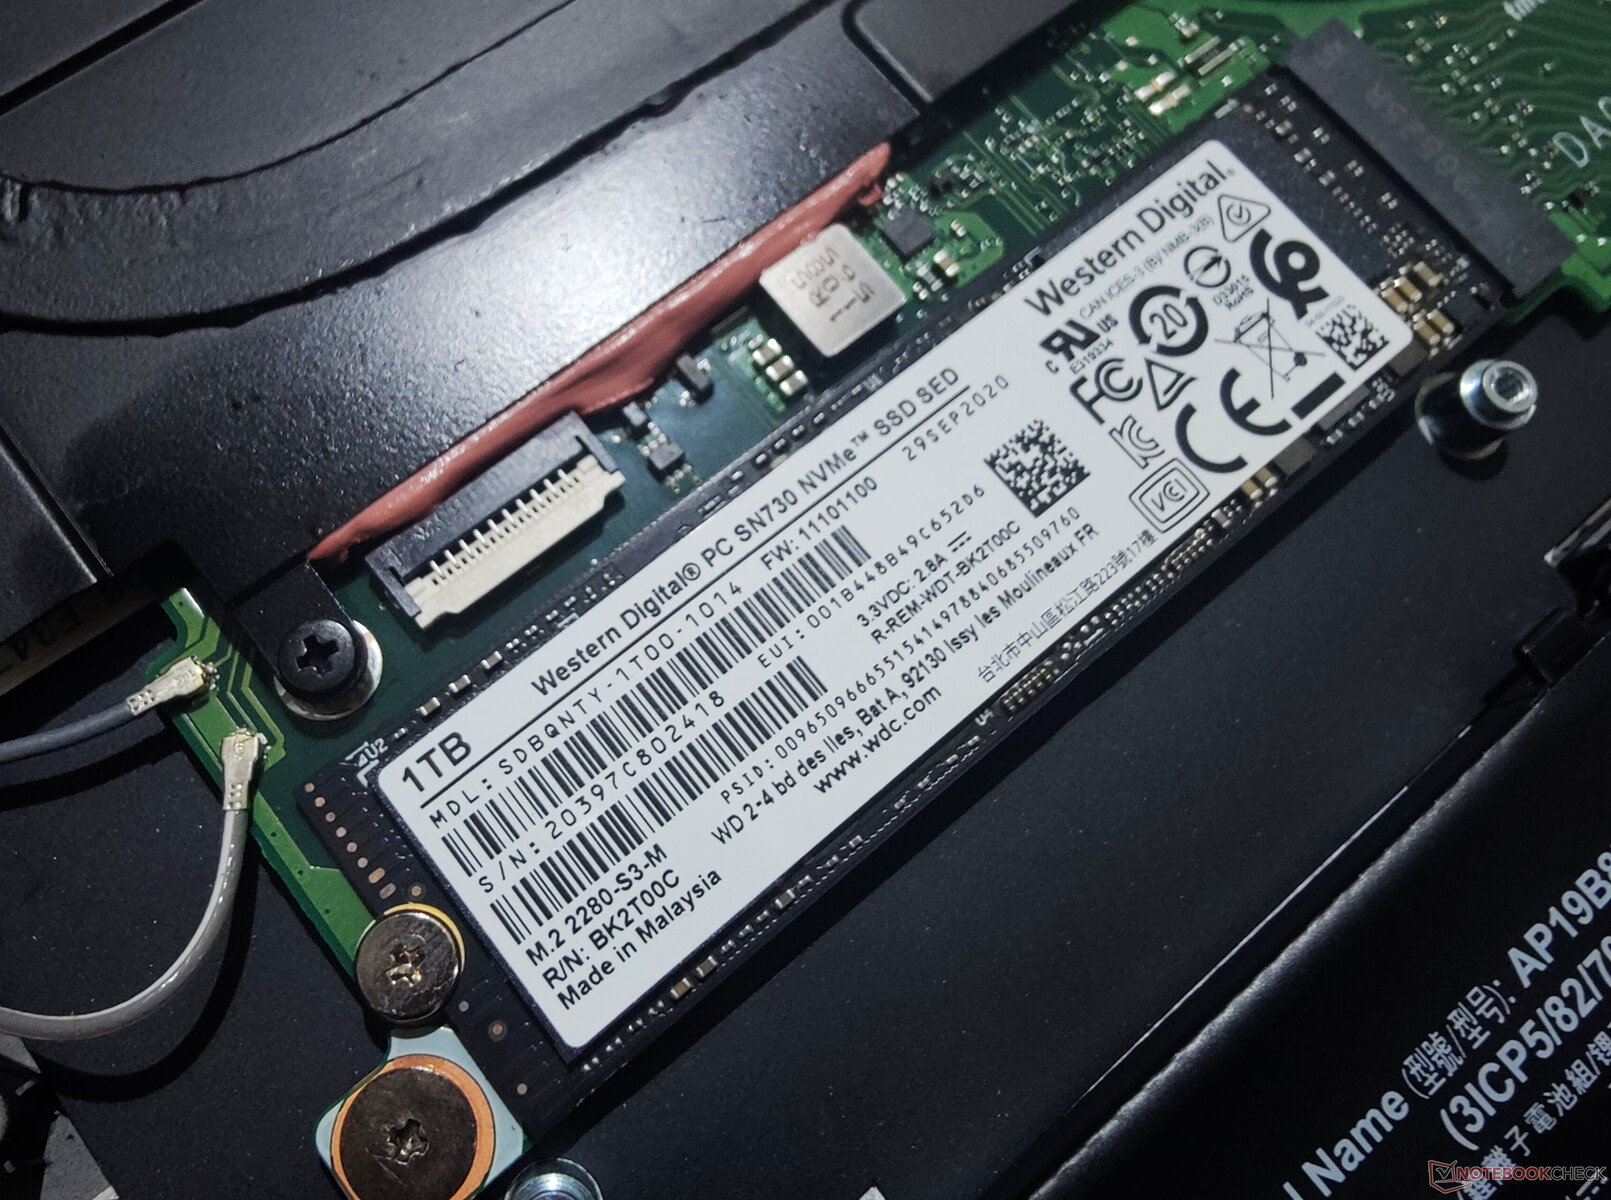
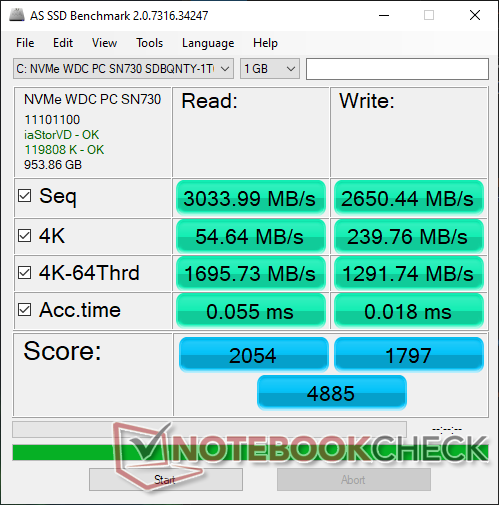
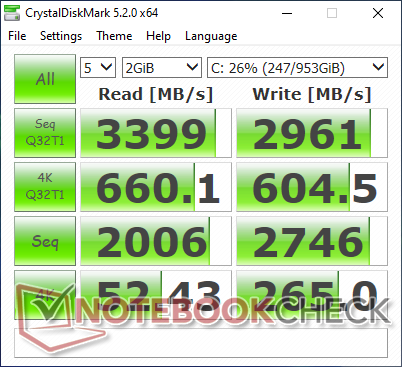
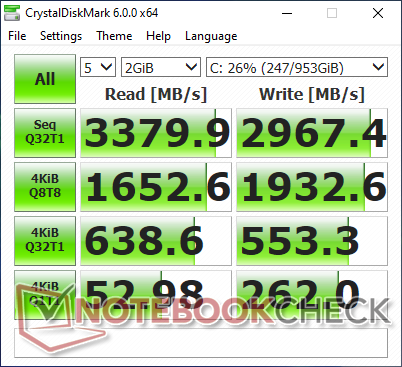
Our unit came with a 1 TB Western Digital SN730 PCIe Gen3 NVMe SSD that occupies the lone M.2 2280 slot on the motherboard. There is no scope for storage expansion via additional M.2 slots or drive bays. Synthetic benchmarks show that the SN730 SSD in the TravelMate P6 is significantly faster than the competition and is only beaten by the SN850 PCIe Gen4 SSD in the Framework Laptop 13.5.
We also did not observe any throttling in our DiskSpd read loop test. The performance of this drive is more than adequate for the intended business demographic.
Check out our SSD and HDD Benchmarks page for more storage performance comparisons.
| Acer TravelMate P614P-52 WDC PC SN730 SDBQNTY-1T00 | Lenovo ThinkPad T14s G2 20WM003TGE Samsung PM981a MZVLB1T0HBLR | HP EliteBook 830 G8-i7-1165G7 Samsung PM981a MZVLB1T0HBLR | Framework Laptop 13.5 Western Digital WD_BLACK SN850 WDS100T1X0E | Dell Latitude 9420 2-in-1 WDC PC SN530 SDBPNPZ-512G | Razer Book 13 FHD Samsung SSD PM981a MZVLB256HBHQ | Average WDC PC SN730 SDBQNTY-1T00 | |
|---|---|---|---|---|---|---|---|
| AS SSD | -8% | -24% | 30% | -86% | -57% | -12% | |
| Seq Read (MB/s) | 3034 | 2825 -7% | 2797 -8% | 5613 85% | 2102 -31% | 2329 -23% | 2679 ? -12% |
| Seq Write (MB/s) | 2650 | 1288 -51% | 1528 -42% | 4909 85% | 1155 -56% | 1011 -62% | 2311 ? -13% |
| 4K Read (MB/s) | 54.6 | 61.2 12% | 54.3 -1% | 80.6 48% | 45.63 -16% | 53 -3% | 45.7 ? -16% |
| 4K Write (MB/s) | 239.8 | 190.6 -21% | 128.4 -46% | 256.6 7% | 238.9 0% | 188.4 -21% | 148.8 ? -38% |
| 4K-64 Read (MB/s) | 1696 | 1147 -32% | 1095 -35% | 2222 31% | 752 -56% | 546 -68% | 1549 ? -9% |
| 4K-64 Write (MB/s) | 1292 | 1827 41% | 1640 27% | 2050 59% | 396.1 -69% | 416.4 -68% | 1747 ? 35% |
| Access Time Read * (ms) | 0.055 | 0.055 -0% | 0.041 25% | 0.032 42% | 0.062 -13% | 0.067 -22% | 0.0615 ? -12% |
| Access Time Write * (ms) | 0.018 | 0.019 -6% | 0.03 -67% | 0.044 -144% | 0.167 -828% | 0.058 -222% | 0.02817 ? -57% |
| Score Read (Points) | 2054 | 1491 -27% | 1429 -30% | 2864 39% | 1008 -51% | 832 -59% | 1863 ? -9% |
| Score Write (Points) | 1797 | 2146 19% | 1922 7% | 2797 56% | 751 -58% | 706 -61% | 2129 ? 18% |
| Score Total (Points) | 4885 | 4336 -11% | 4029 -18% | 7098 45% | 2238 -54% | 1914 -61% | 4927 ? 1% |
| Copy ISO MB/s (MB/s) | 2678 | 2715 1% | 1926 -28% | 1588 -41% | 1664 -38% | 1868 ? -30% | |
| Copy Program MB/s (MB/s) | 469.8 | 130.1 -72% | 947 102% | 1038 121% | 415.2 -12% | 512 ? 9% | |
| Copy Game MB/s (MB/s) | 1958 | 459.3 -77% | 1880 -4% | 1006 -49% | 420.2 -79% | 1365 ? -30% | |
| CrystalDiskMark 5.2 / 6 | -8% | -12% | 67% | -25% | -19% | -10% | |
| Write 4K (MB/s) | 265 | 149.7 -44% | 133.1 -50% | 299.4 13% | 190 -28% | 138.1 -48% | 169.8 ? -36% |
| Read 4K (MB/s) | 52.4 | 64.5 23% | 58 11% | 87.6 67% | 48.1 -8% | 44.97 -14% | 50.4 ? -4% |
| Write Seq (MB/s) | 2746 | 1933 -30% | 2032 -26% | 5205 90% | 1700 -38% | 1948 -29% | 2351 ? -14% |
| Read Seq (MB/s) | 2006 | 2512 25% | 2456 22% | 4276 113% | 1594 -21% | 2225 11% | 2078 ? 4% |
| Write 4K Q32T1 (MB/s) | 605 | 514 -15% | 461.9 -24% | 846 40% | 517 -15% | 526 -13% | 457 ? -24% |
| Read 4K Q32T1 (MB/s) | 660 | 475.9 -28% | 454.2 -31% | 905 37% | 477.8 -28% | 379.6 -42% | 513 ? -22% |
| Write Seq Q32T1 (MB/s) | 2961 | 2968 0% | 3021 2% | 5189 75% | 1841 -38% | 2258 -24% | 3048 ? 3% |
| Read Seq Q32T1 (MB/s) | 3399 | 3542 4% | 3534 4% | 6921 104% | 2472 -27% | 3528 4% | 3334 ? -2% |
| Write 4K Q8T8 (MB/s) | 1933 | 1933 ? 0% | |||||
| Read 4K Q8T8 (MB/s) | 1653 | 1653 ? 0% | |||||
| Total Average (Program / Settings) | -8% /
-8% | -18% /
-19% | 49% /
44% | -56% /
-64% | -38% /
-43% | -11% /
-11% |
* ... smaller is better

Disk Throttling: DiskSpd Read Loop, Queue Depth 8
GPU Performance
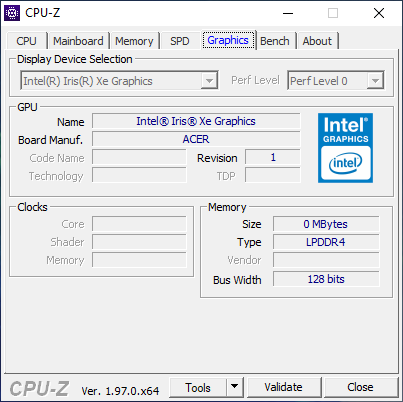
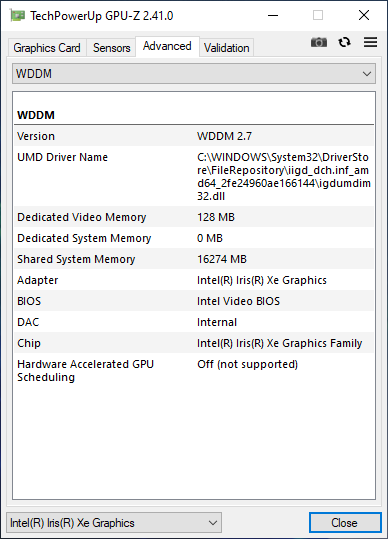
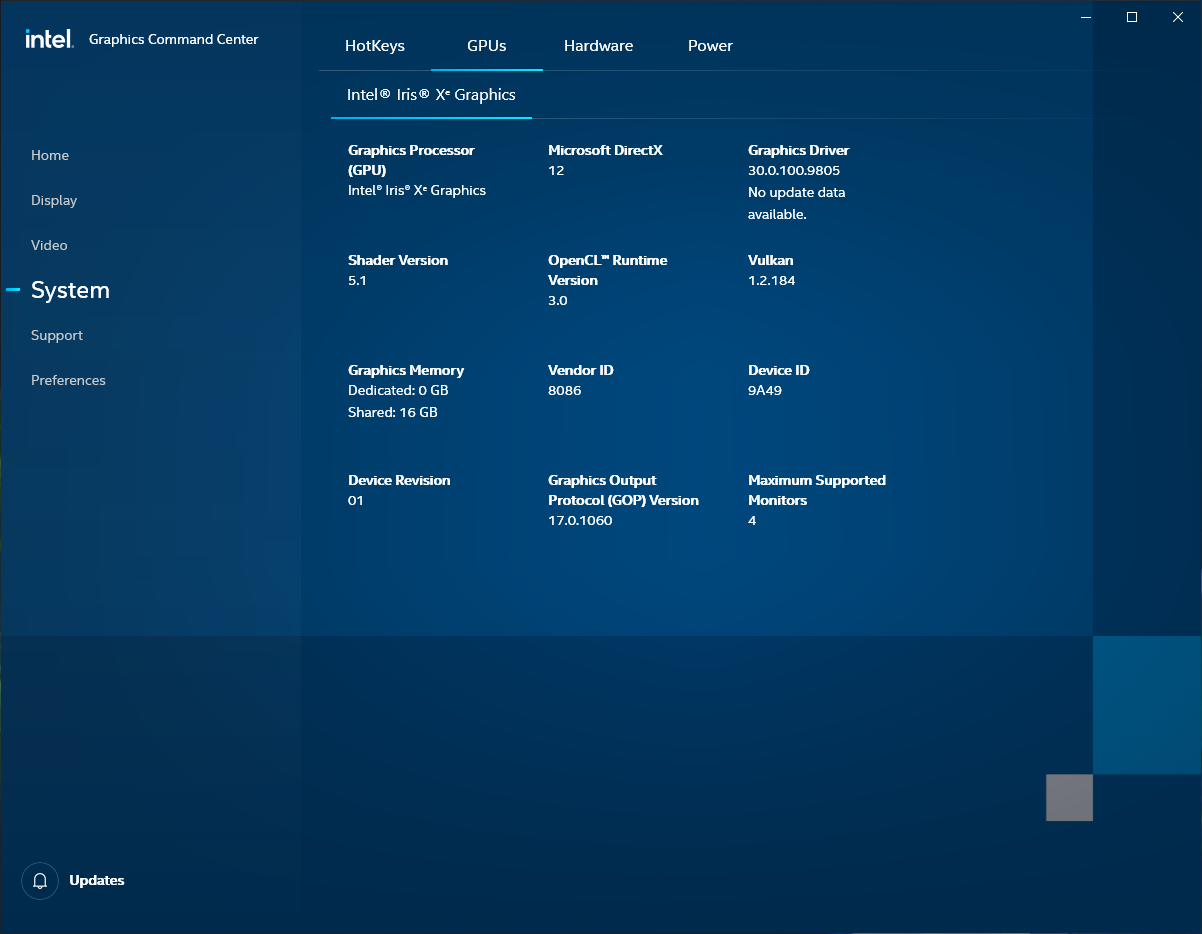
The Core i7-1165G7 features an Iris Xe Graphics G7 iGPU with 96 execution units (EUs), which has a base clock of 400 MHz, and a boost of up to 1,300 MHz. As evident from the benchmarks below, the Iris Xe Graphics G7 is suitable for light 3D workloads.
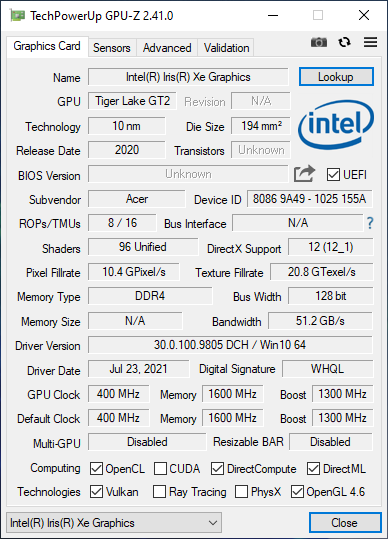
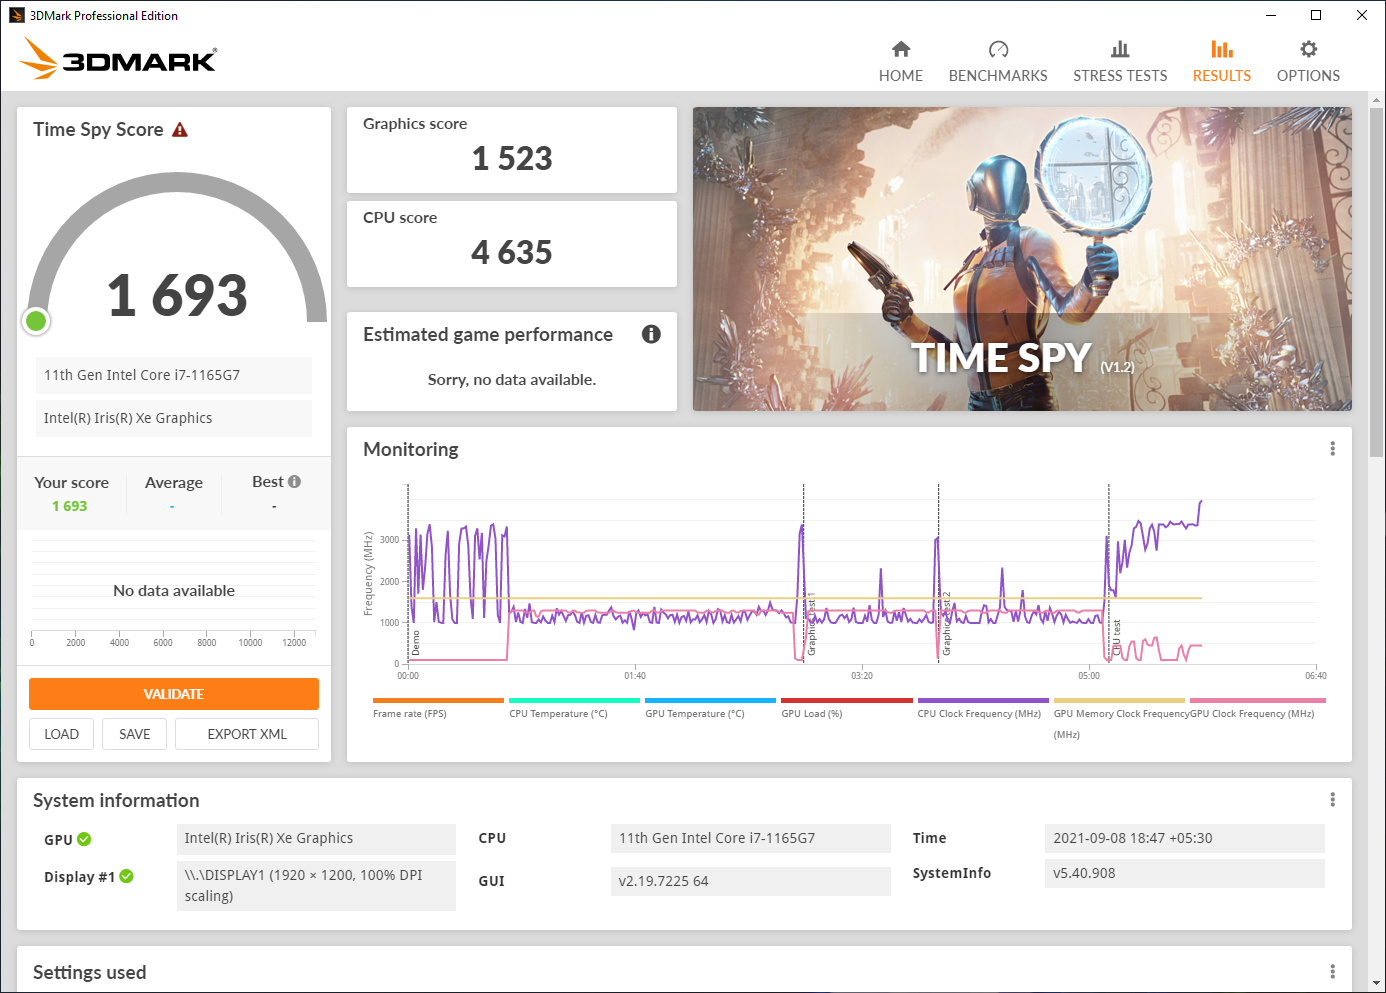
Performance of Iris Xe Graphics G7 in 3DMark is on expected lines often within range of the slightly faster clocked variant in the Core i7-1185G7. The Iris Xe Graphics G7 is significantly faster than the Radeon RX Vega 8 iGPU in the Ryzen 7 5700U.
We see only about a 6% reduction in performance in 3DMark Time Spy on battery in the Balanced power profile, which is not a major drop.
| 3DMark 11 Performance | 7145 points | |
| 3DMark Ice Storm Standard Score | 93056 points | |
| 3DMark Cloud Gate Standard Score | 20427 points | |
| 3DMark Fire Strike Score | 5000 points | |
| 3DMark Time Spy Score | 1804 points | |
Help | ||
Gaming Performance
The Iris Xe Graphics G7 is suited for light gaming of older titles at low to medium settings. Interestingly, we found gaming performance to be at times better than even the slightly faster version in the Core i7-1185G7 and well above the overall average of all Xe Graphics G7s with 96 EUs tested so far.
The Witcher 3 FPS Chart
The iGPU struggles to maintain a consistent frame rate in The Witcher 3 stress test at 1080p Ultra. Therefore, most modern games at high settings will not result in a pleasant experience.
Check out our dedicated Iris Xe Graphics G7 96 EUs page for more comparisons and performance benchmarks.
| low | med. | high | ultra | |
|---|---|---|---|---|
| BioShock Infinite (2013) | 142.3 | 100.5 | 114.7 | 32.75 |
| The Witcher 3 (2015) | 97.7 | 62.7 | 32.9 | 16.3 |
| Dota 2 Reborn (2015) | 125.8 | 82.2 | 59.5 | 57.1 |
| Final Fantasy XV Benchmark (2018) | 45.4 | 25 | 25 | |
| X-Plane 11.11 (2018) | 28.5 | 43.4 | 33.9 | |
| Strange Brigade (2018) | 85 | 38.6 | 30.9 | 24.9 |
Emissions: Quiet and comfortable for the most part
System Noise
The TravelMate P6 does well to offer a relatively pleasant computing experience under most workloads. We observed a maximum fan noise of 43.71 dB(A) under Prime95+FurMark load and about 40.7 dB(A) while running The Wither 3 stress at 1080p Ultra.
In regular use, the fans only come on during load and the noise profile is manageable for the most part. We did not observe any stray noises such as clicks or coil whine.
| Acer TravelMate P614P-52 Iris Xe G7 96EUs, i7-1165G7, WDC PC SN730 SDBQNTY-1T00 | Lenovo ThinkPad T14s G2 20WM003TGE Iris Xe G7 96EUs, i7-1165G7, Samsung PM981a MZVLB1T0HBLR | HP EliteBook 830 G8-i7-1165G7 Iris Xe G7 96EUs, i7-1165G7, Samsung PM981a MZVLB1T0HBLR | Framework Laptop 13.5 Iris Xe G7 96EUs, i7-1165G7, Western Digital WD_BLACK SN850 WDS100T1X0E | Dell Latitude 9420 2-in-1 Iris Xe G7 96EUs, i7-1185G7, WDC PC SN530 SDBPNPZ-512G | Razer Book 13 FHD Iris Xe G7 96EUs, i7-1165G7, Samsung SSD PM981a MZVLB256HBHQ | |
|---|---|---|---|---|---|---|
| Noise | 11% | 6% | 1% | 9% | 6% | |
| off / environment * (dB) | 26.61 | 24.81 7% | 26 2% | 23.9 10% | 25.4 5% | 27 -1% |
| Idle Minimum * (dB) | 26.61 | 24.81 7% | 26 2% | 23.9 10% | 25.4 5% | 27 -1% |
| Idle Average * (dB) | 26.61 | 24.81 7% | 26 2% | 23.9 10% | 25.4 5% | 27 -1% |
| Idle Maximum * (dB) | 26.61 | 24.81 7% | 27.5 -3% | 23.9 10% | 25.4 5% | 27.1 -2% |
| Load Average * (dB) | 42.1 | 35.14 17% | 35.4 16% | 45.6 -8% | 25.4 40% | 29 31% |
| Witcher 3 ultra * (dB) | 40.7 | 47.1 -16% | 41.3 -1% | 33.3 18% | ||
| Load Maximum * (dB) | 43.71 | 35.14 20% | 35.3 19% | 47.9 -10% | 41.3 6% | 44.8 -2% |
* ... smaller is better
Noise level
| Idle |
| 26.61 / 26.61 / 26.61 dB(A) |
| Load |
| 42.1 / 43.71 dB(A) |
 | ||
30 dB silent 40 dB(A) audible 50 dB(A) loud |
||
min: | ||
Temperature
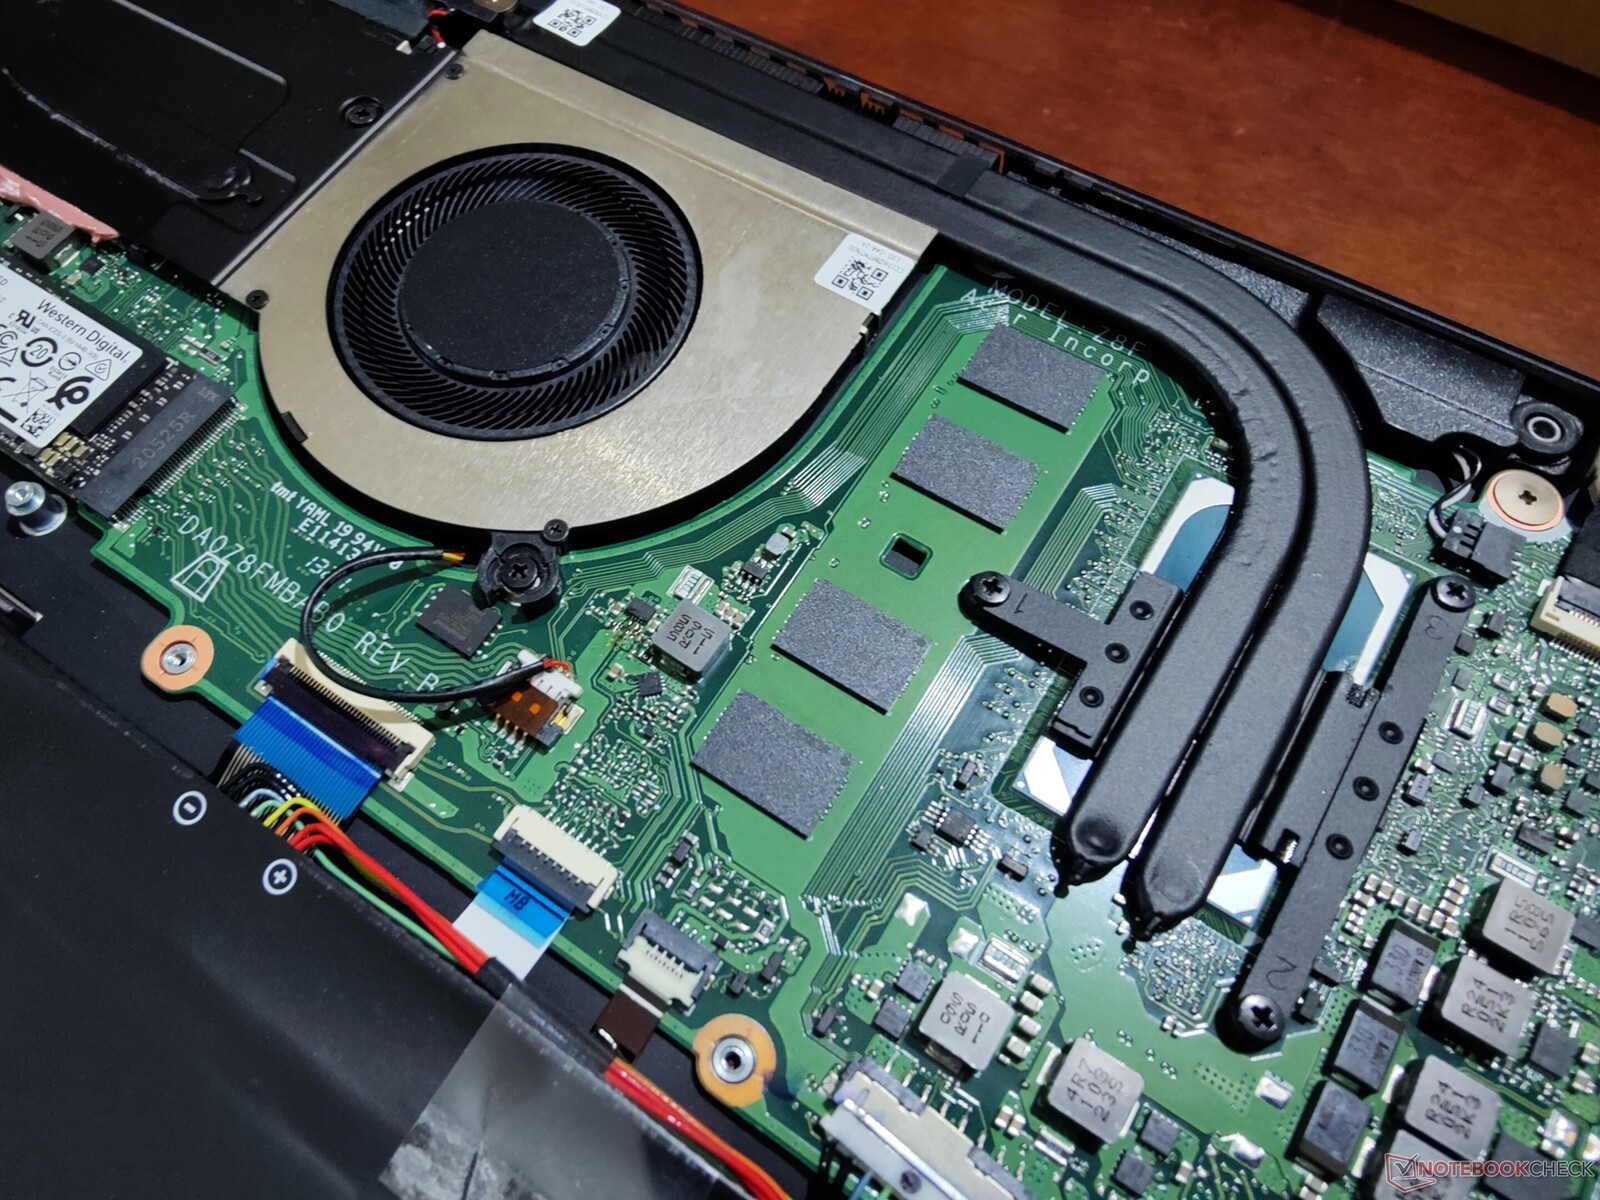
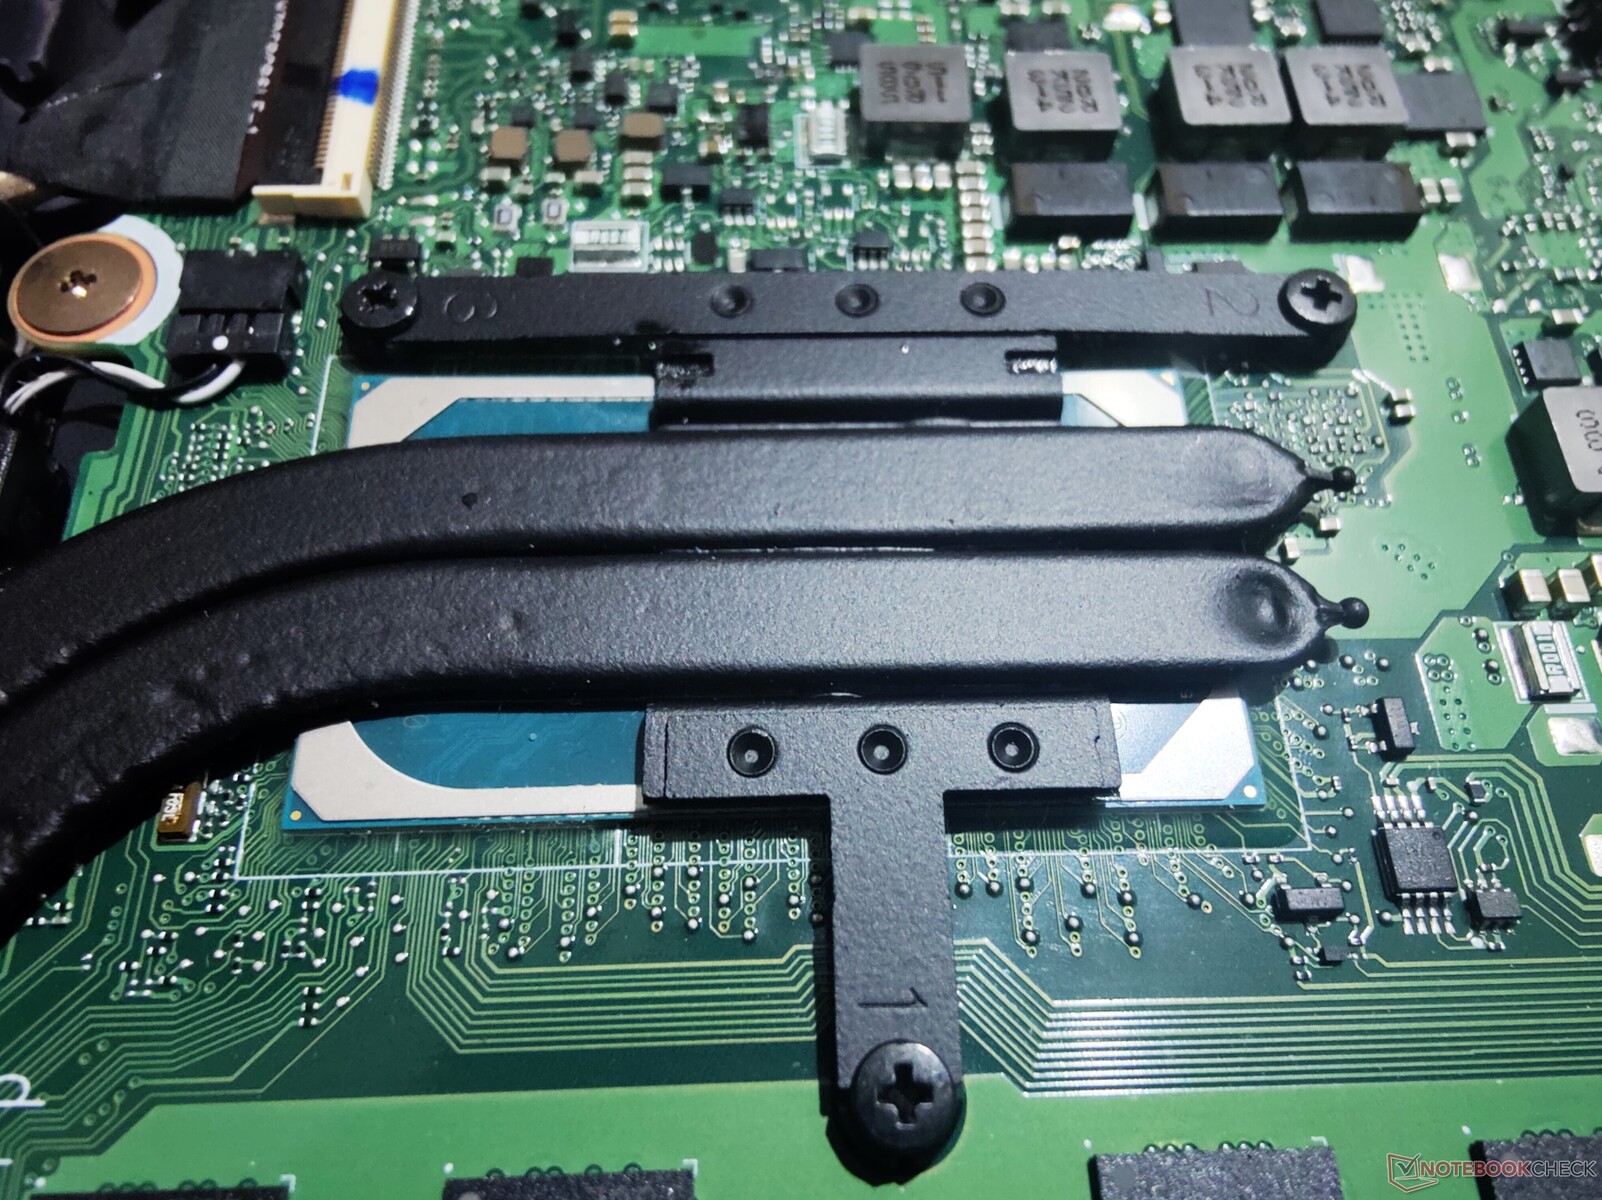
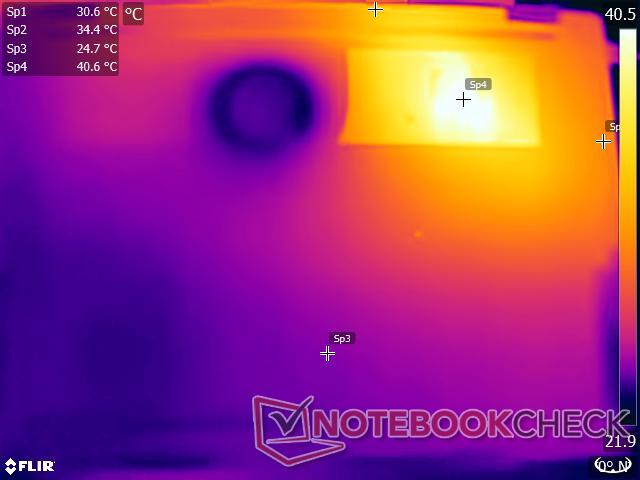
Given the ULV nature of the processor, the TravelMate P6 is equipped with a single fan with a dual heatpipe arrangement. The cooling mechanism is quite adequate for the target demographic and is able to handle the artificial stress that we've subjected it to without resulting in excessive surface temperatures.
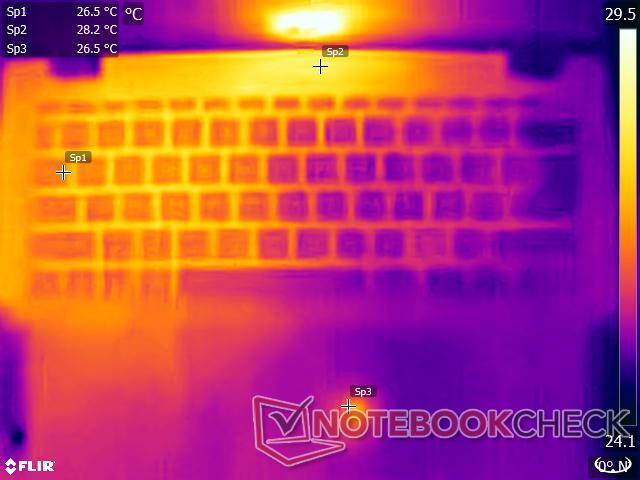
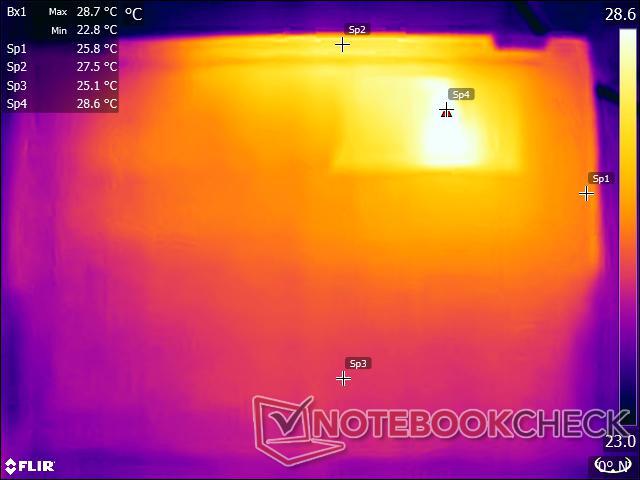
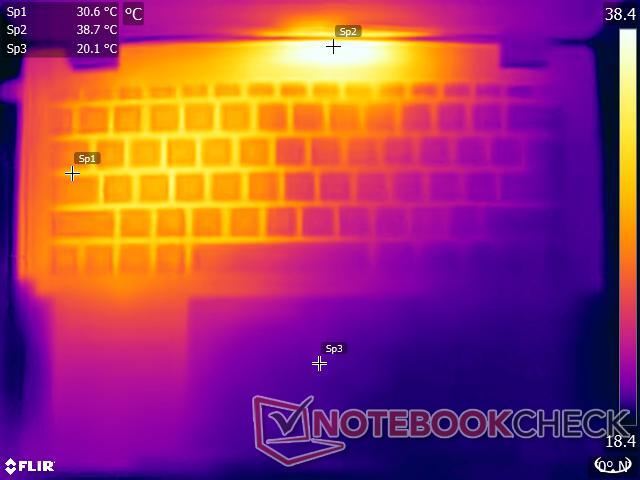
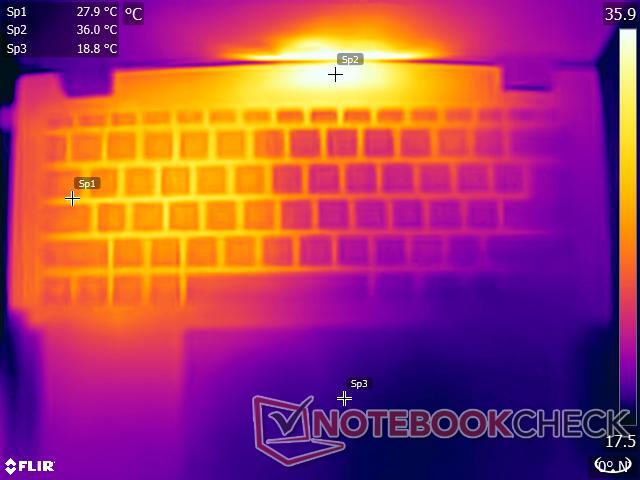
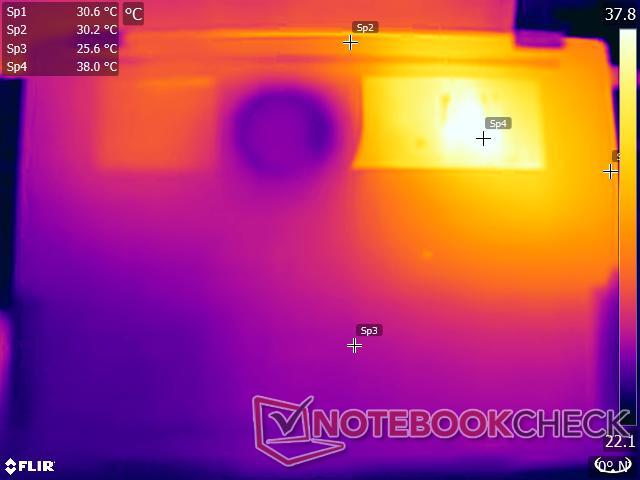
Under stress, the higher temperatures are majorly observed near the front top left and bottom top right of the unit. At close to a maximum of 43 °C, they aren't too uncomfortable. The touchpad and palm rest areas continue to remain relatively cool, which is a plus. Do note that real-life applications are unlikely to stress the device as much, so users should face no issues in handling the device at work or using it safely on the lap.
(±) The maximum temperature on the upper side is 41 °C / 106 F, compared to the average of 34.3 °C / 94 F, ranging from 21.2 to 62.5 °C for the class Office.
(±) The bottom heats up to a maximum of 43 °C / 109 F, compared to the average of 36.8 °C / 98 F
(+) In idle usage, the average temperature for the upper side is 26.82 °C / 80 F, compared to the device average of 29.5 °C / 85 F.
(±) Playing The Witcher 3, the average temperature for the upper side is 34.55 °C / 94 F, compared to the device average of 29.5 °C / 85 F.
(+) The palmrests and touchpad are reaching skin temperature as a maximum (32.4 °C / 90.3 F) and are therefore not hot.
(-) The average temperature of the palmrest area of similar devices was 27.5 °C / 81.5 F (-4.9 °C / -8.8 F).
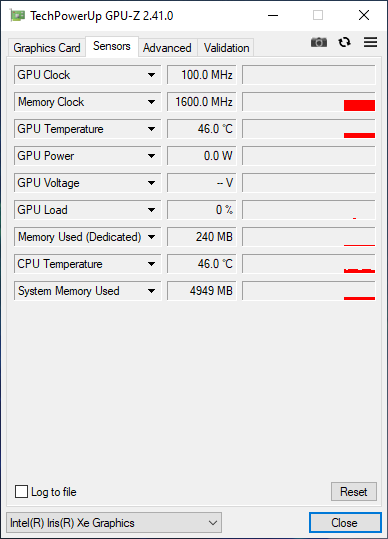
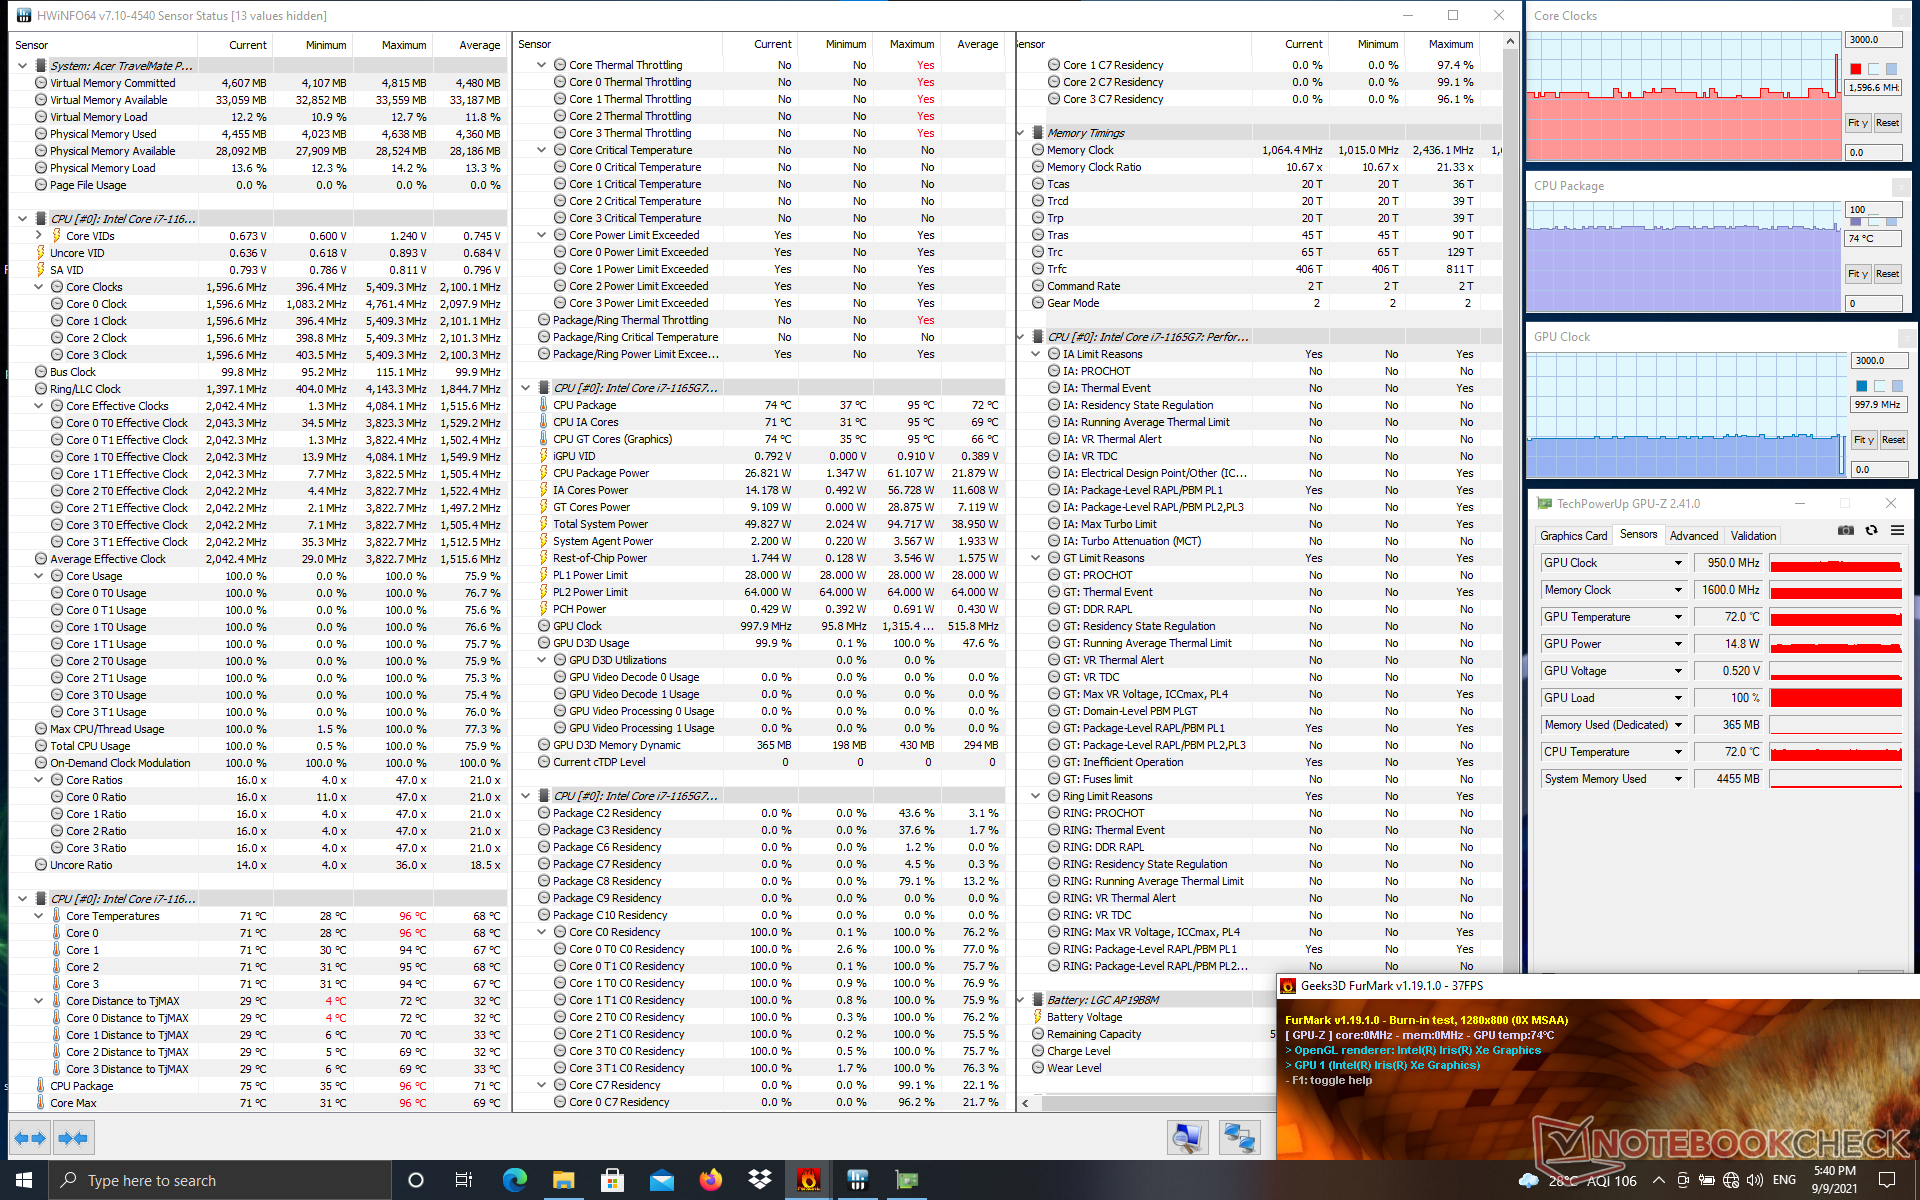
Stress Test
During Prime95 stress, the CPU clocks go up to a maximum of 2.65 GHz and continue to remain relatively stable at this frequency without any visible signs of throttling. Adding FurMark to the mix reduces the CPU clocks to 1.6 GHz after a momentary spike to 5.4 GHz. The GPU is able to attain its maximum boost of 1,300 MHz initially but soon settles near the 1,000 MHz mark throughout the remainder of the test.
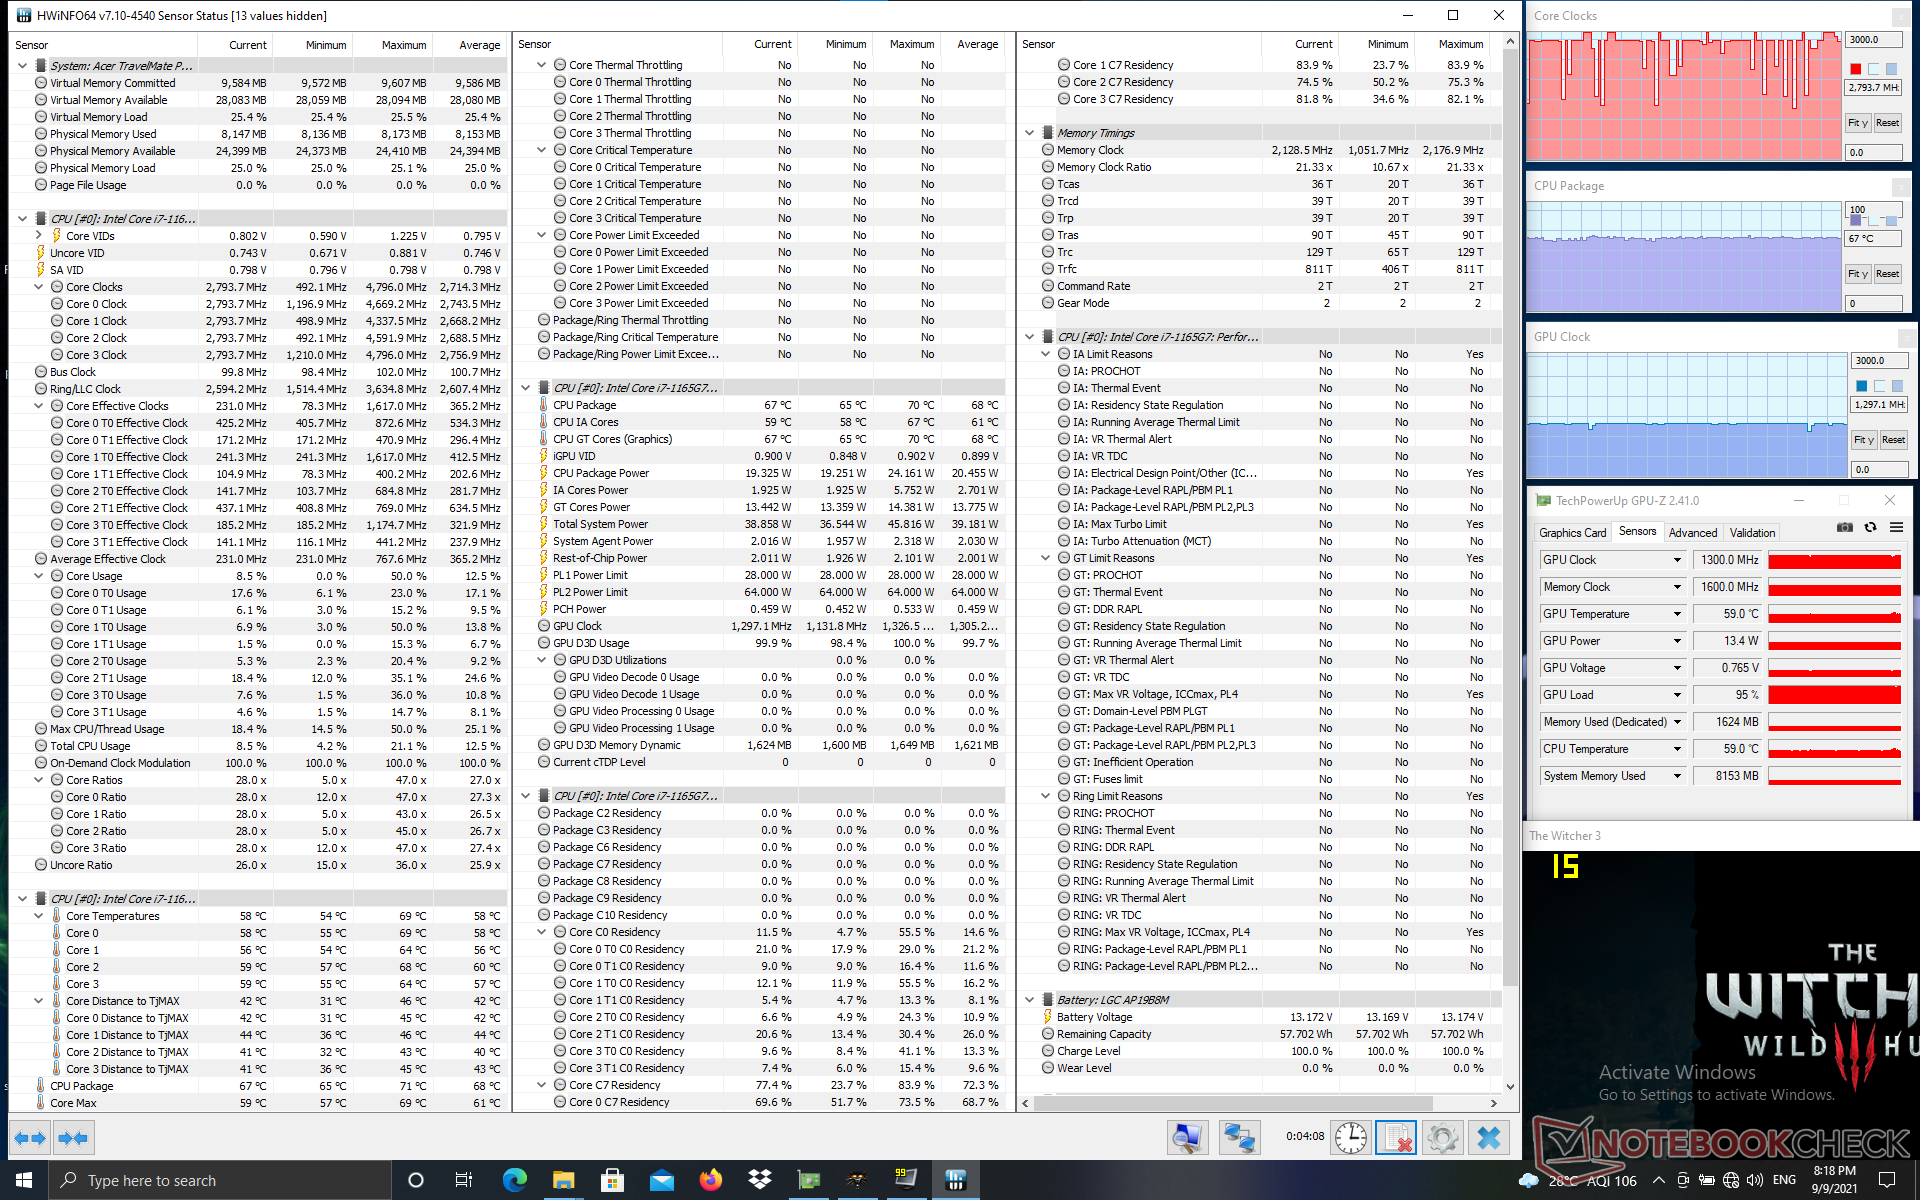
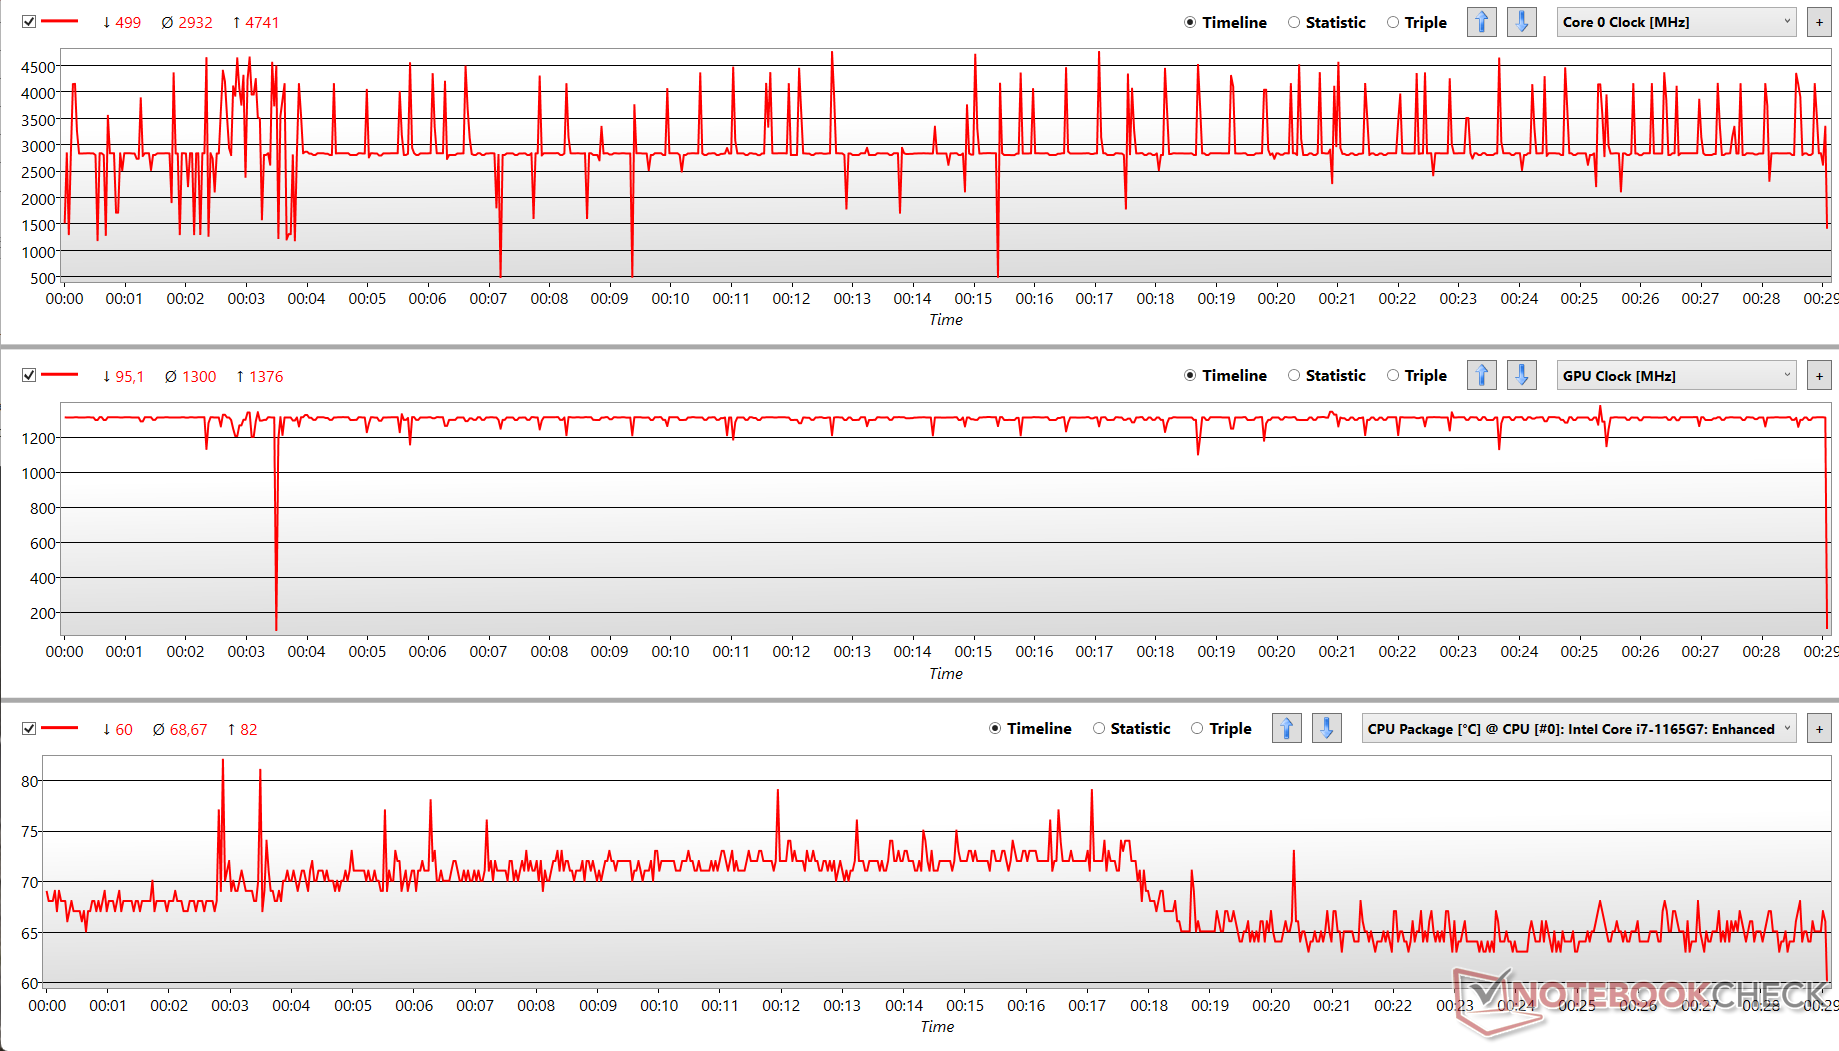
We see that the CPU is able to boost higher during The Witcher 3 stress at times, which takes away some power from the GPU momentarily. While the GPU does try to operate at its maximum boost frequency, it does not do so consistently resulting in frame rate fluctuations.
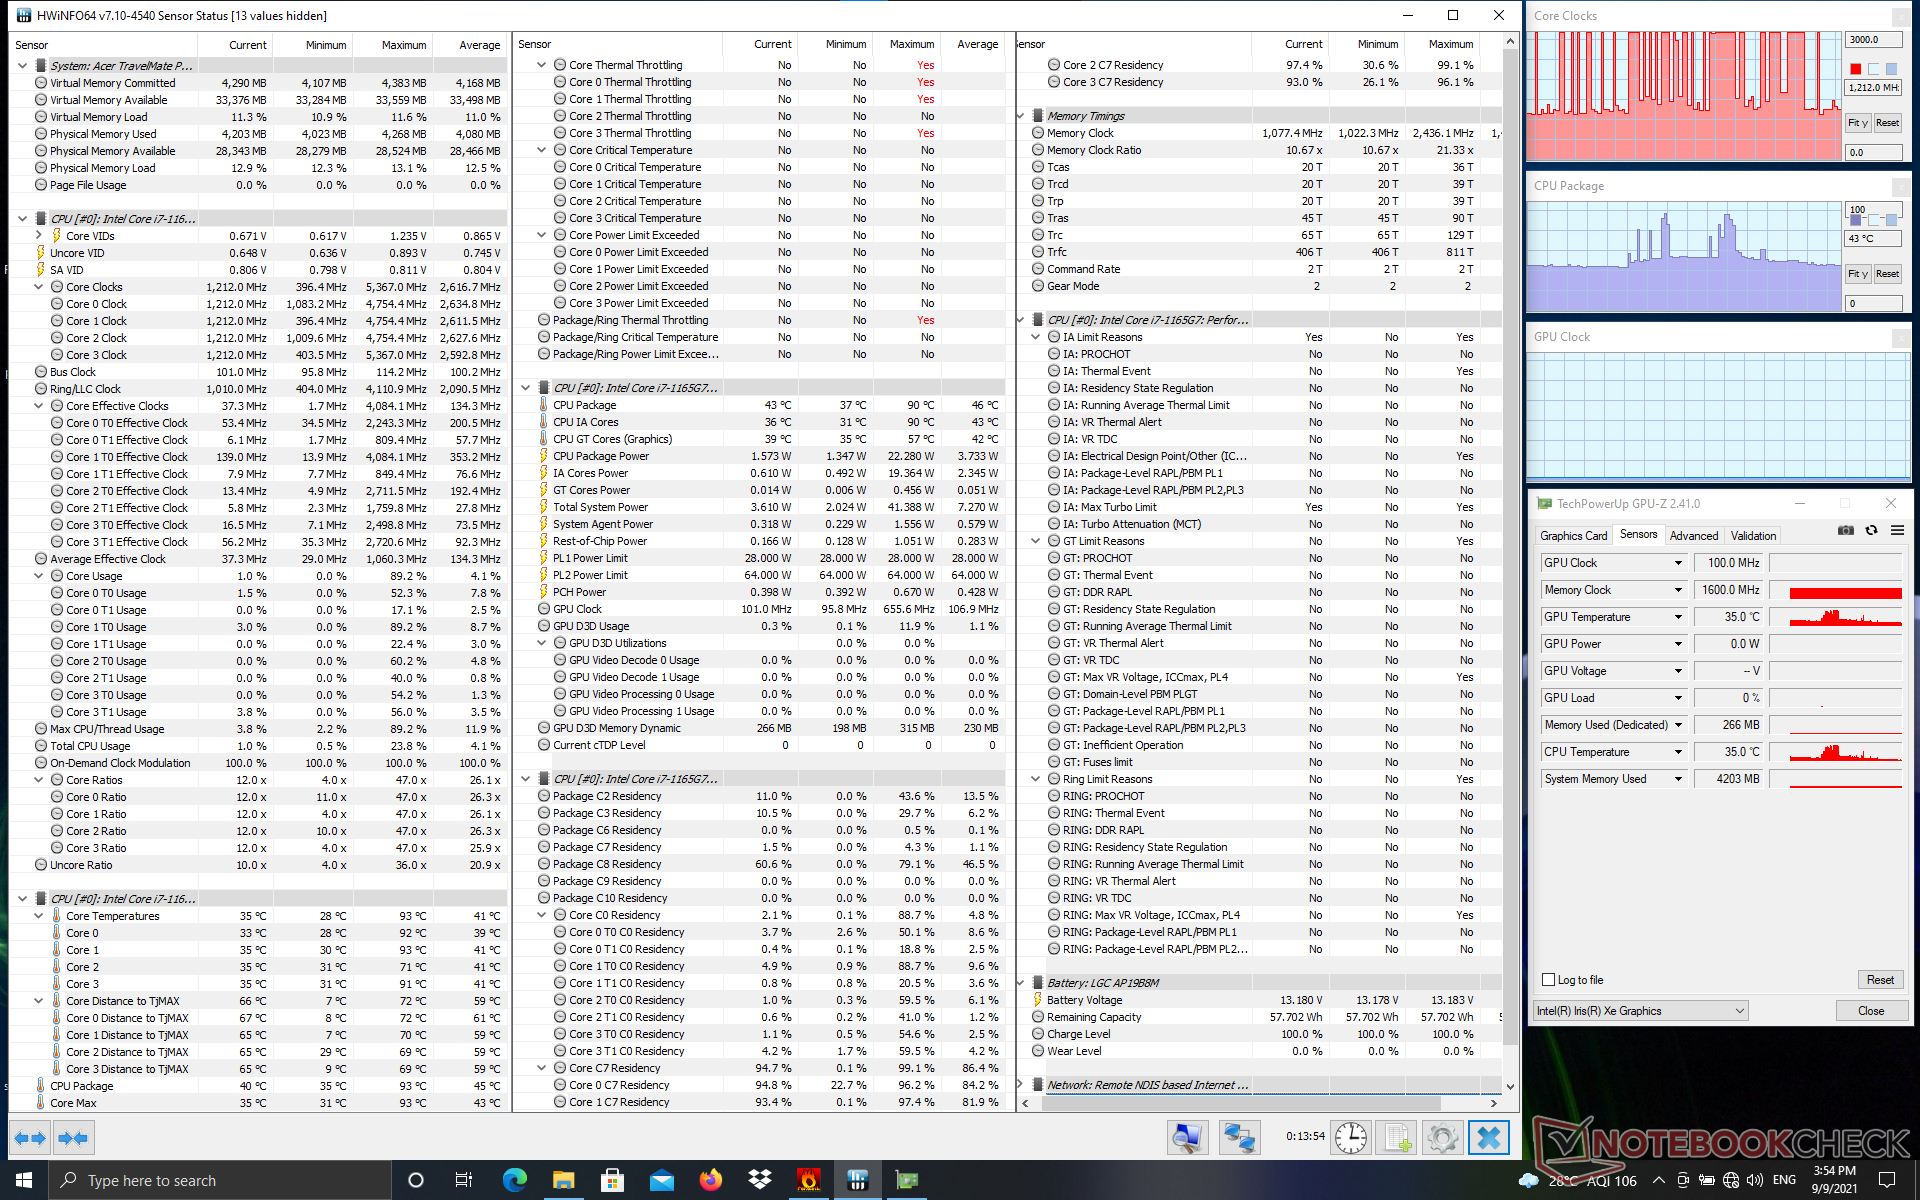
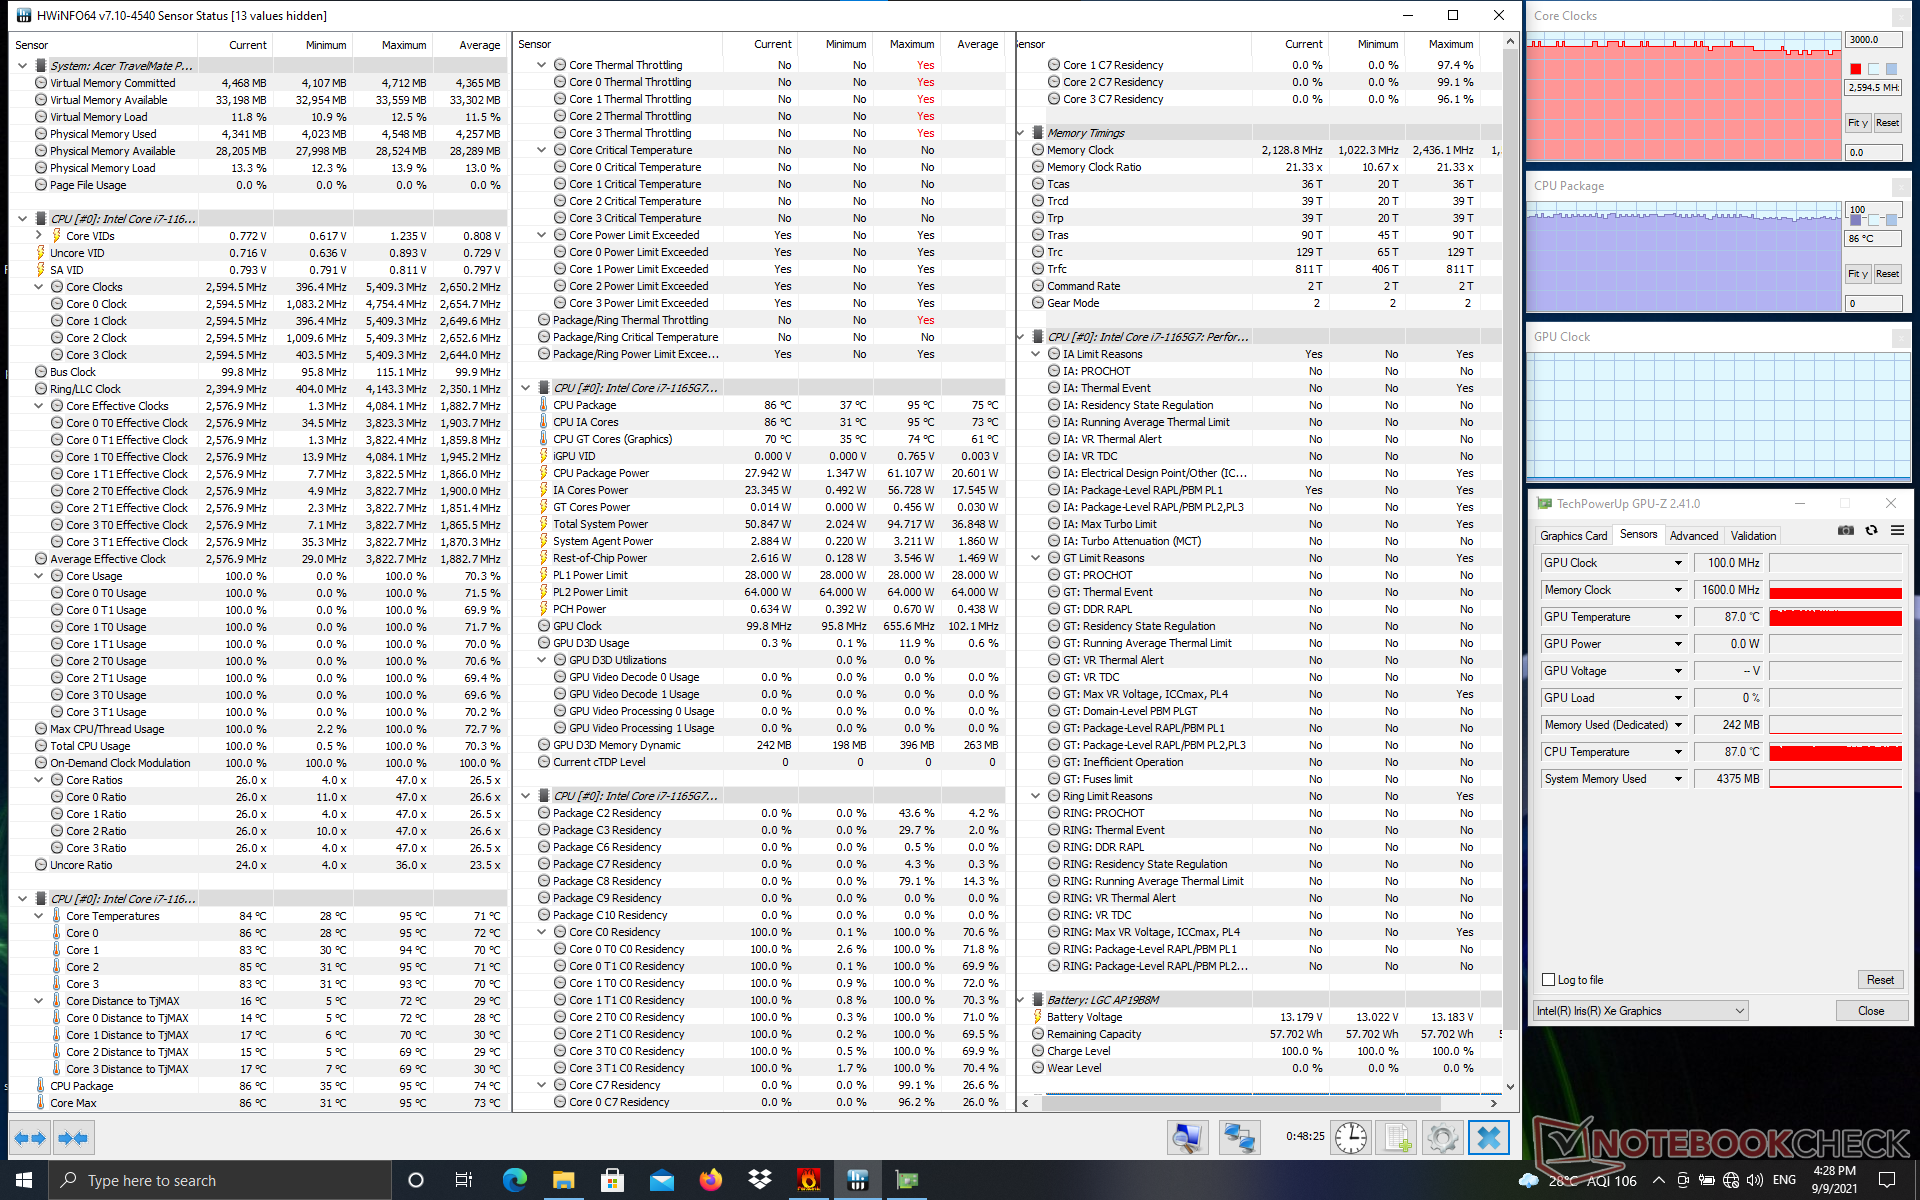
| Stress Test | CPU Clock (GHz) | GPU Clock (MHz) | Average Package Temperature (°C) |
| System Idle | 1.2 | 101 | 46 |
| Prime95 | 2.5 | 99.8 | 75 |
| Prime95 + FurMark | 1.6 | 997.9 | 72 |
| The Witcher 3 | 2.8 | 1.3 | 68 |
Speakers

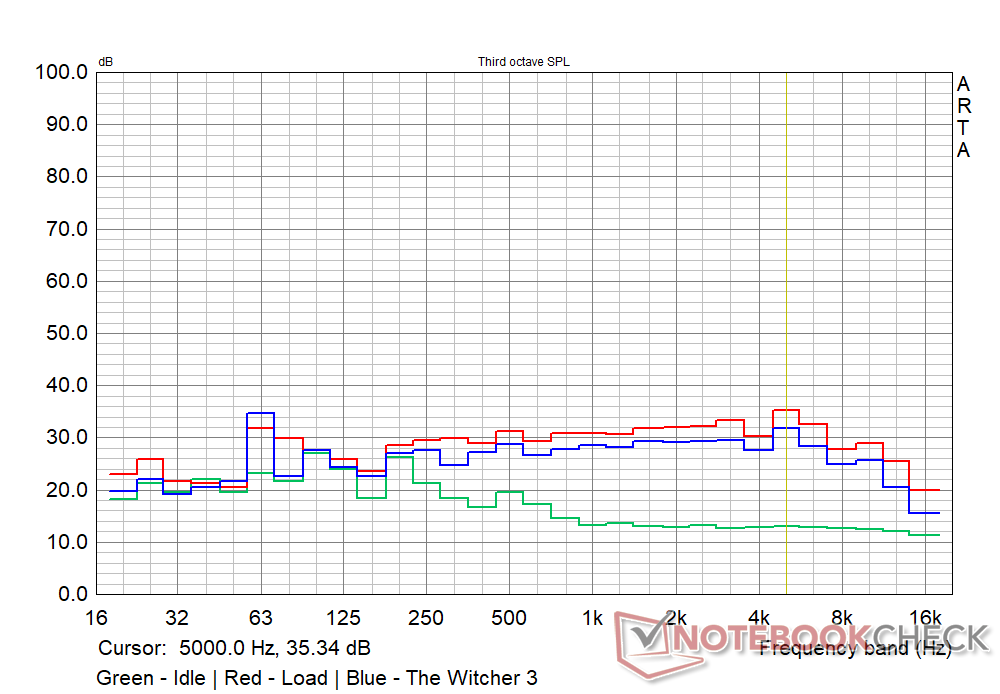
Similar to the previous generation, the 2021 TravelMate P6 also offers upward firing speakers with grills located above the keyboard deck. Acer seems to have improved on the loudness this time around likely due to what it calls the Smart Amplifier. The volume does feel adequate for personal listening and for listening at a reasonable distance away from the unit. The bass is definitely lacking, though we do see higher mids and relatively balanced highs.
Overall, these speakers are just about fine for regular office work involving video conferencing or watching the occasional YouTube video. There's a 3.5 mm combo audio jack available if you want to attach better performing headsets. Though not activated in our pre-production sample, Acer does indicate availability of DTS audio processing for the TravelMate P6.
Acer TravelMate P614P-52 audio analysis
(±) | speaker loudness is average but good (73.5 dB)
Bass 100 - 315 Hz
(-) | nearly no bass - on average 21.4% lower than median
(±) | linearity of bass is average (8.1% delta to prev. frequency)
Mids 400 - 2000 Hz
(±) | higher mids - on average 7.4% higher than median
(±) | linearity of mids is average (12% delta to prev. frequency)
Highs 2 - 16 kHz
(+) | balanced highs - only 1.1% away from median
(+) | highs are linear (3.7% delta to prev. frequency)
Overall 100 - 16.000 Hz
(±) | linearity of overall sound is average (24% difference to median)
Compared to same class
» 69% of all tested devices in this class were better, 9% similar, 22% worse
» The best had a delta of 7%, average was 21%, worst was 53%
Compared to all devices tested
» 72% of all tested devices were better, 6% similar, 22% worse
» The best had a delta of 4%, average was 24%, worst was 134%
Apple MacBook 12 (Early 2016) 1.1 GHz audio analysis
(+) | speakers can play relatively loud (83.6 dB)
Bass 100 - 315 Hz
(±) | reduced bass - on average 11.3% lower than median
(±) | linearity of bass is average (14.2% delta to prev. frequency)
Mids 400 - 2000 Hz
(+) | balanced mids - only 2.4% away from median
(+) | mids are linear (5.5% delta to prev. frequency)
Highs 2 - 16 kHz
(+) | balanced highs - only 2% away from median
(+) | highs are linear (4.5% delta to prev. frequency)
Overall 100 - 16.000 Hz
(+) | overall sound is linear (10.2% difference to median)
Compared to same class
» 7% of all tested devices in this class were better, 2% similar, 91% worse
» The best had a delta of 5%, average was 18%, worst was 53%
Compared to all devices tested
» 5% of all tested devices were better, 1% similar, 94% worse
» The best had a delta of 4%, average was 24%, worst was 134%
Energy Management: Not the most economical in its class
Power Consumption
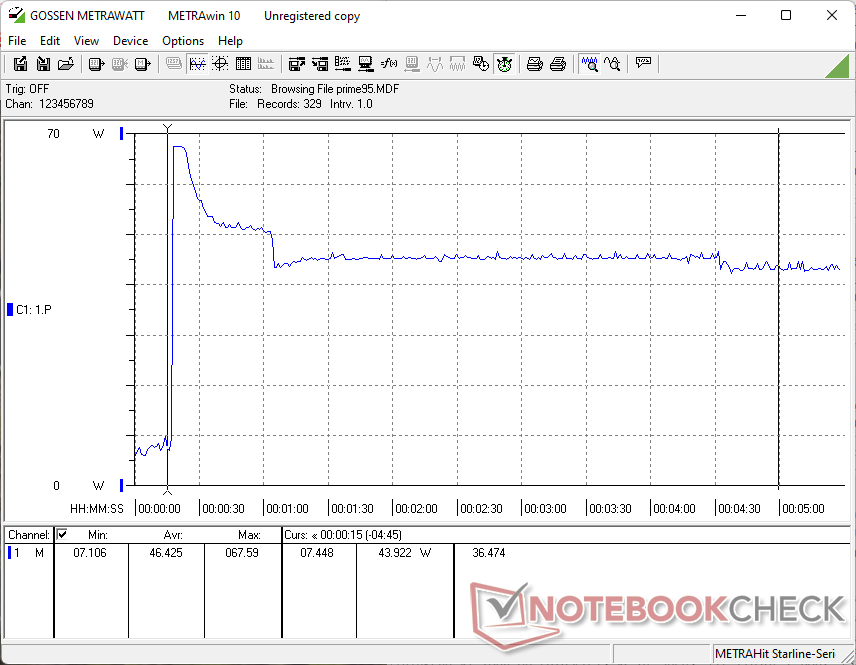
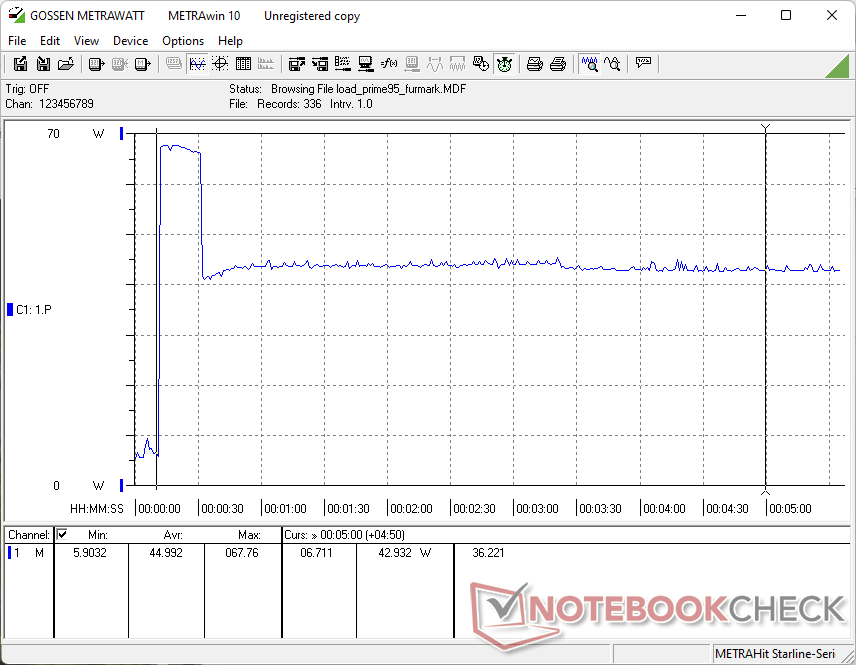
Idle power consumption is about 8 W on an average. During a Prime95 + FurMark load stress test, the consumption peaks to about 67 W before eventually settling at an average of 43 W.
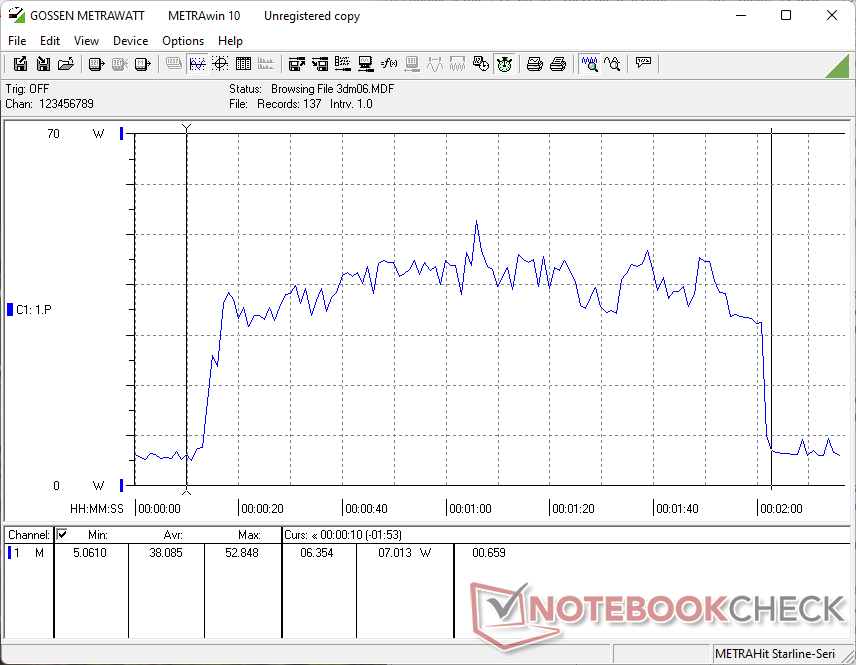
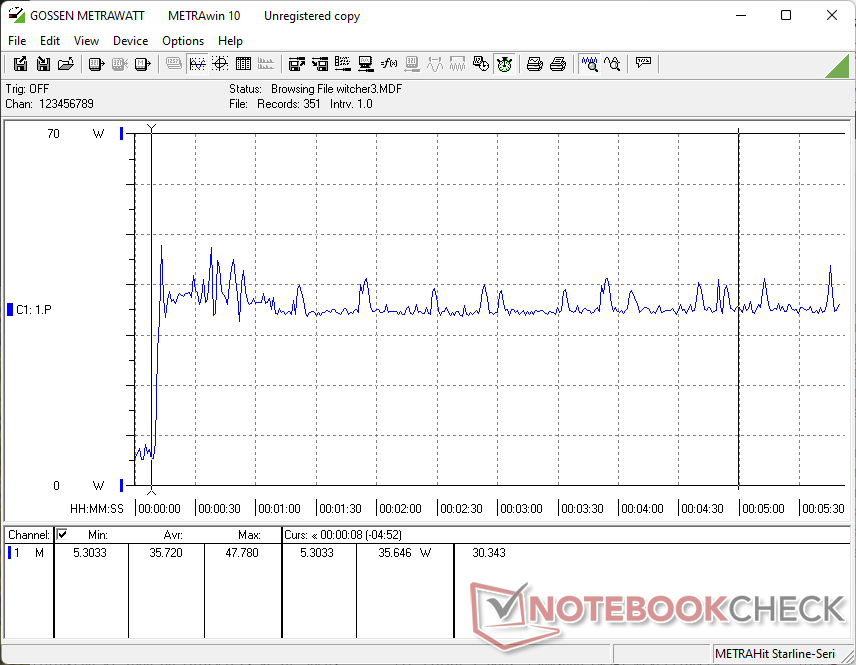
We noticed spikes throughout The Witcher 3 stress, which correlates with the CPU and GPU clock fluctuations observed earlier. Acer supplies a 65 W USB-C power adapter in the box, which provides sufficient power for the device even under stressful conditions.
| Off / Standby | |
| Idle | |
| Load |
|
Key:
min: | |
| Acer TravelMate P614P-52 i7-1165G7, Iris Xe G7 96EUs, WDC PC SN730 SDBQNTY-1T00, IPS, 1920x1200, 14" | Lenovo ThinkPad T14s G2 20WM003TGE i7-1165G7, Iris Xe G7 96EUs, Samsung PM981a MZVLB1T0HBLR, IPS LED, 1920x1080, 14" | HP EliteBook 830 G8-i7-1165G7 i7-1165G7, Iris Xe G7 96EUs, Samsung PM981a MZVLB1T0HBLR, IPS, 1920x1080, 13.3" | Framework Laptop 13.5 i7-1165G7, Iris Xe G7 96EUs, Western Digital WD_BLACK SN850 WDS100T1X0E, IPS, 2256x1504, 13.5" | Dell Latitude 9420 2-in-1 i7-1185G7, Iris Xe G7 96EUs, WDC PC SN530 SDBPNPZ-512G, IPS, 2560x1600, 14" | Razer Book 13 FHD i7-1165G7, Iris Xe G7 96EUs, Samsung SSD PM981a MZVLB256HBHQ, IPS, 1920x1200, 13.4" | |
|---|---|---|---|---|---|---|
| Power Consumption | 16% | 10% | -1% | -9% | 17% | |
| Idle Minimum * (Watt) | 6.99 | 2.2 69% | 6.5 7% | 4.3 38% | 4.6 34% | 3.3 53% |
| Idle Average * (Watt) | 8.32 | 5.5 34% | 8.4 -1% | 8.2 1% | 7.8 6% | 6.4 23% |
| Idle Maximum * (Watt) | 12.18 | 6.1 50% | 10.3 15% | 8.7 29% | 8.2 33% | 7 43% |
| Load Average * (Watt) | 38.08 | 41.3 -8% | 34.6 9% | 43.5 -14% | 47.9 -26% | 37.3 2% |
| Witcher 3 ultra * (Watt) | 35.7 | 34.5 3% | 34.4 4% | 43.5 -22% | 38.8 -9% | 36.4 -2% |
| Load Maximum * (Watt) | 44.99 | 67.3 -50% | 33 27% | 61.8 -37% | 87.1 -94% | 53.7 -19% |
* ... smaller is better
Power Consumption Witcher 3 / Stresstest
Battery Life
The 56 Wh battery in the TravelMate P6 affords a decent battery life that can get you by a typical workday without much issue. However, we find quite a noticeable reduction in runtimes compared to last year's model, which sported a 60 Wh cell.
We recorded close to 9 hours of battery life in our standard web surfing test and nearly 12 hours of video playback at a brightness of 150 cd/m2. It is interesting to note that the Razer Book 13 with a similar configuration and battery capacity can offer 66% higher runtimes than the TravelMate P6.
Charging the battery from zero to 100% can take nearly two hours. We also observed higher power draws with our power meter despite the indicator and Windows showing that the battery has been fully charged. This could be an isolated issue with the unit, but we nevertheless recommend an extended charging period whenever possible.
| Acer TravelMate P614P-52 i7-1165G7, Iris Xe G7 96EUs, 56 Wh | Lenovo ThinkPad T14s G2 20WM003TGE i7-1165G7, Iris Xe G7 96EUs, 57 Wh | Dell Latitude 9420 2-in-1 i7-1185G7, Iris Xe G7 96EUs, 60 Wh | Asus ExpertBook B9 B9400CE-KC0166R i7-1165G7, Iris Xe G7 96EUs, 66 Wh | Razer Book 13 FHD i7-1165G7, Iris Xe G7 96EUs, 55 Wh | HP EliteBook 830 G8-i7-1165G7 i7-1165G7, Iris Xe G7 96EUs, 53 Wh | |
|---|---|---|---|---|---|---|
| Battery runtime | 9% | 51% | 89% | 68% | 14% | |
| Reader / Idle (h) | 21 | 28.7 37% | 36.8 75% | |||
| WiFi v1.3 (h) | 8.9 | 9.7 9% | 11.7 31% | 12.4 39% | 14.8 66% | 8 -10% |
| Witcher 3 ultra (h) | 2 | |||||
| Load (h) | 1.3 | 1.4 8% | 2.4 85% | 3.1 138% | 2.1 62% | 1.8 38% |
Pros
Cons
Verdict: Capable business all-rounder with a few quirks
Acer has brought its TravelMate P6 series in tune with the times giving it both internal and external upgrades. The construction of the device is excellent and so are the ergonomics of using it daily. The display has been improved considerably in terms of color reproduction and the 16:10 aspect ratio, though the touchscreen options are now only available with the TravelMate Spin P6 series.
Port selection and communication options are good, and the options of 5G USIM and PrivacyPanel will be welcomed by businesses. The TravelMate P6 has enough power under the hood for most mobile business applications and at times can even rival the Core i7-1185G7-powered Dell Latitude 9420 2-in-1. Though the Ryzen 7 5700U-based Lenovo ThinkPad E15 G3 offers some serious multi-tasking prowess, the TravelMate P6 is not a complete slouch either. The surface temperatures are manageable and the fan noise is within tolerable limits as well under extreme load.
With the Acer TravelMate P6, businesses stand to get a light, efficient, and secure device that can match up to the requirements of the new normal. The TravelMate P6 gets the necessary upgrades to compete with other prominent business laptops in 2021 without sacrificing on the basics. It won't break any performance records, but the overall package is definitely promising.
That being said, the TravelMate P6 is not without a few quirks. While the Intel Evo platform does ensure some standardization, it also limits the TravelMate P6's servicing ability. This can be a point of contention for businesses looking for longer product lifecycles. Because this was a pre-production model some of the security-related features could not be fully evaluated. This meant we had to rely on stock drivers and Windows Update for the most part.
Also, Acer should have thought about a better webcam, faster Wi-Fi, and a faster memory card reader. Battery life, though not bad, could have been better given that the competition is able to achieve quite a significant runtime uplift with similar battery capacities. The TravelMate P6 is also not the most economical device when it comes to power consumption or battery life. The Lenovo ThinkPad T14s G2, Razer Book 13, and the HP EliteBook 830 G8 all perform much better in this regard.
Overall, Acer has gotten a lot of things right with this year's TravelMate P6 though there's still ample scope for improvement. Hopefully, some of the niggling issues we had observed during the course of the review will be resolved with official drivers once retail units start becoming widely available.
Price and availability
The Acer TravelMate P6 is yet to be available across retail stores worldwide, so pricing information for our configuration is not available. However, going by information from Acer's launch event back in May, the TravelMate P6 series should be available in North America in December starting from US$1,299.99, in EMEA in September starting from €999, and in China in August starting from RMB 6,999.
