MSI Cubi 5 10M with Core i3-10110U and 27-inch monitor MD271 in review
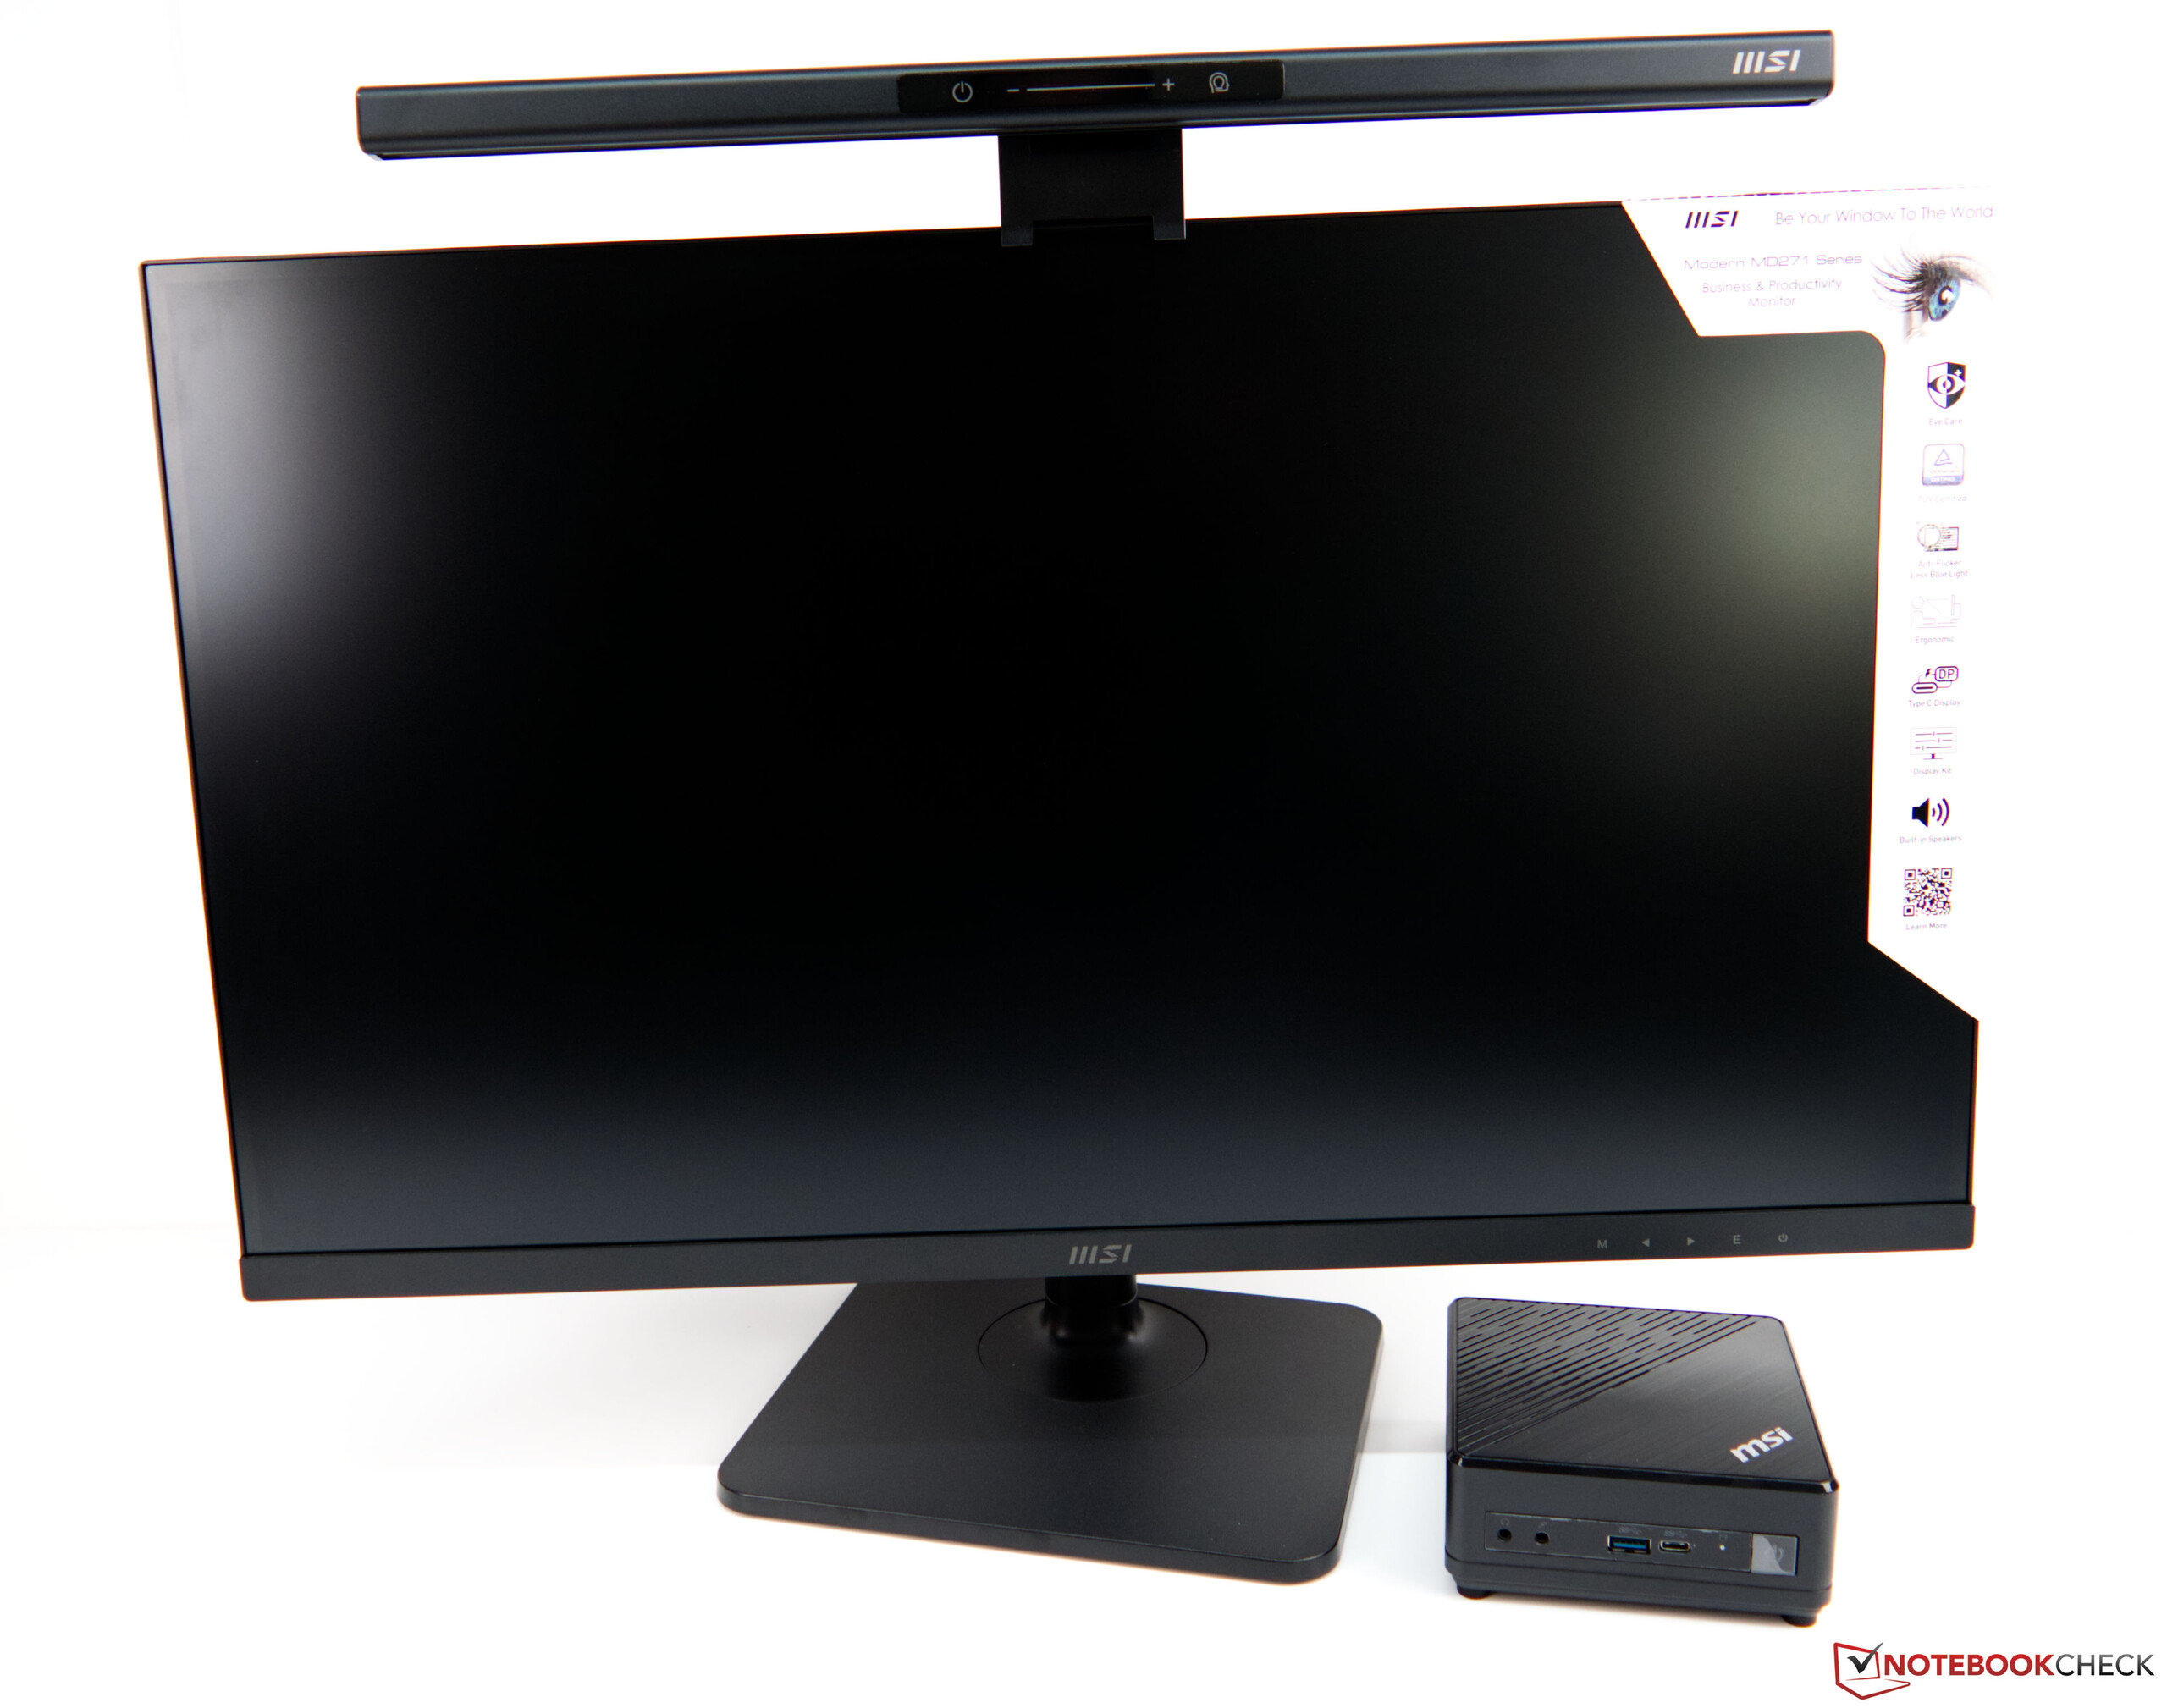
MSI provided us with an office setup for this review, consisting of the Cubi 5 10M, the 27-inch MSI Modern MD271 monitor and a Light Bar
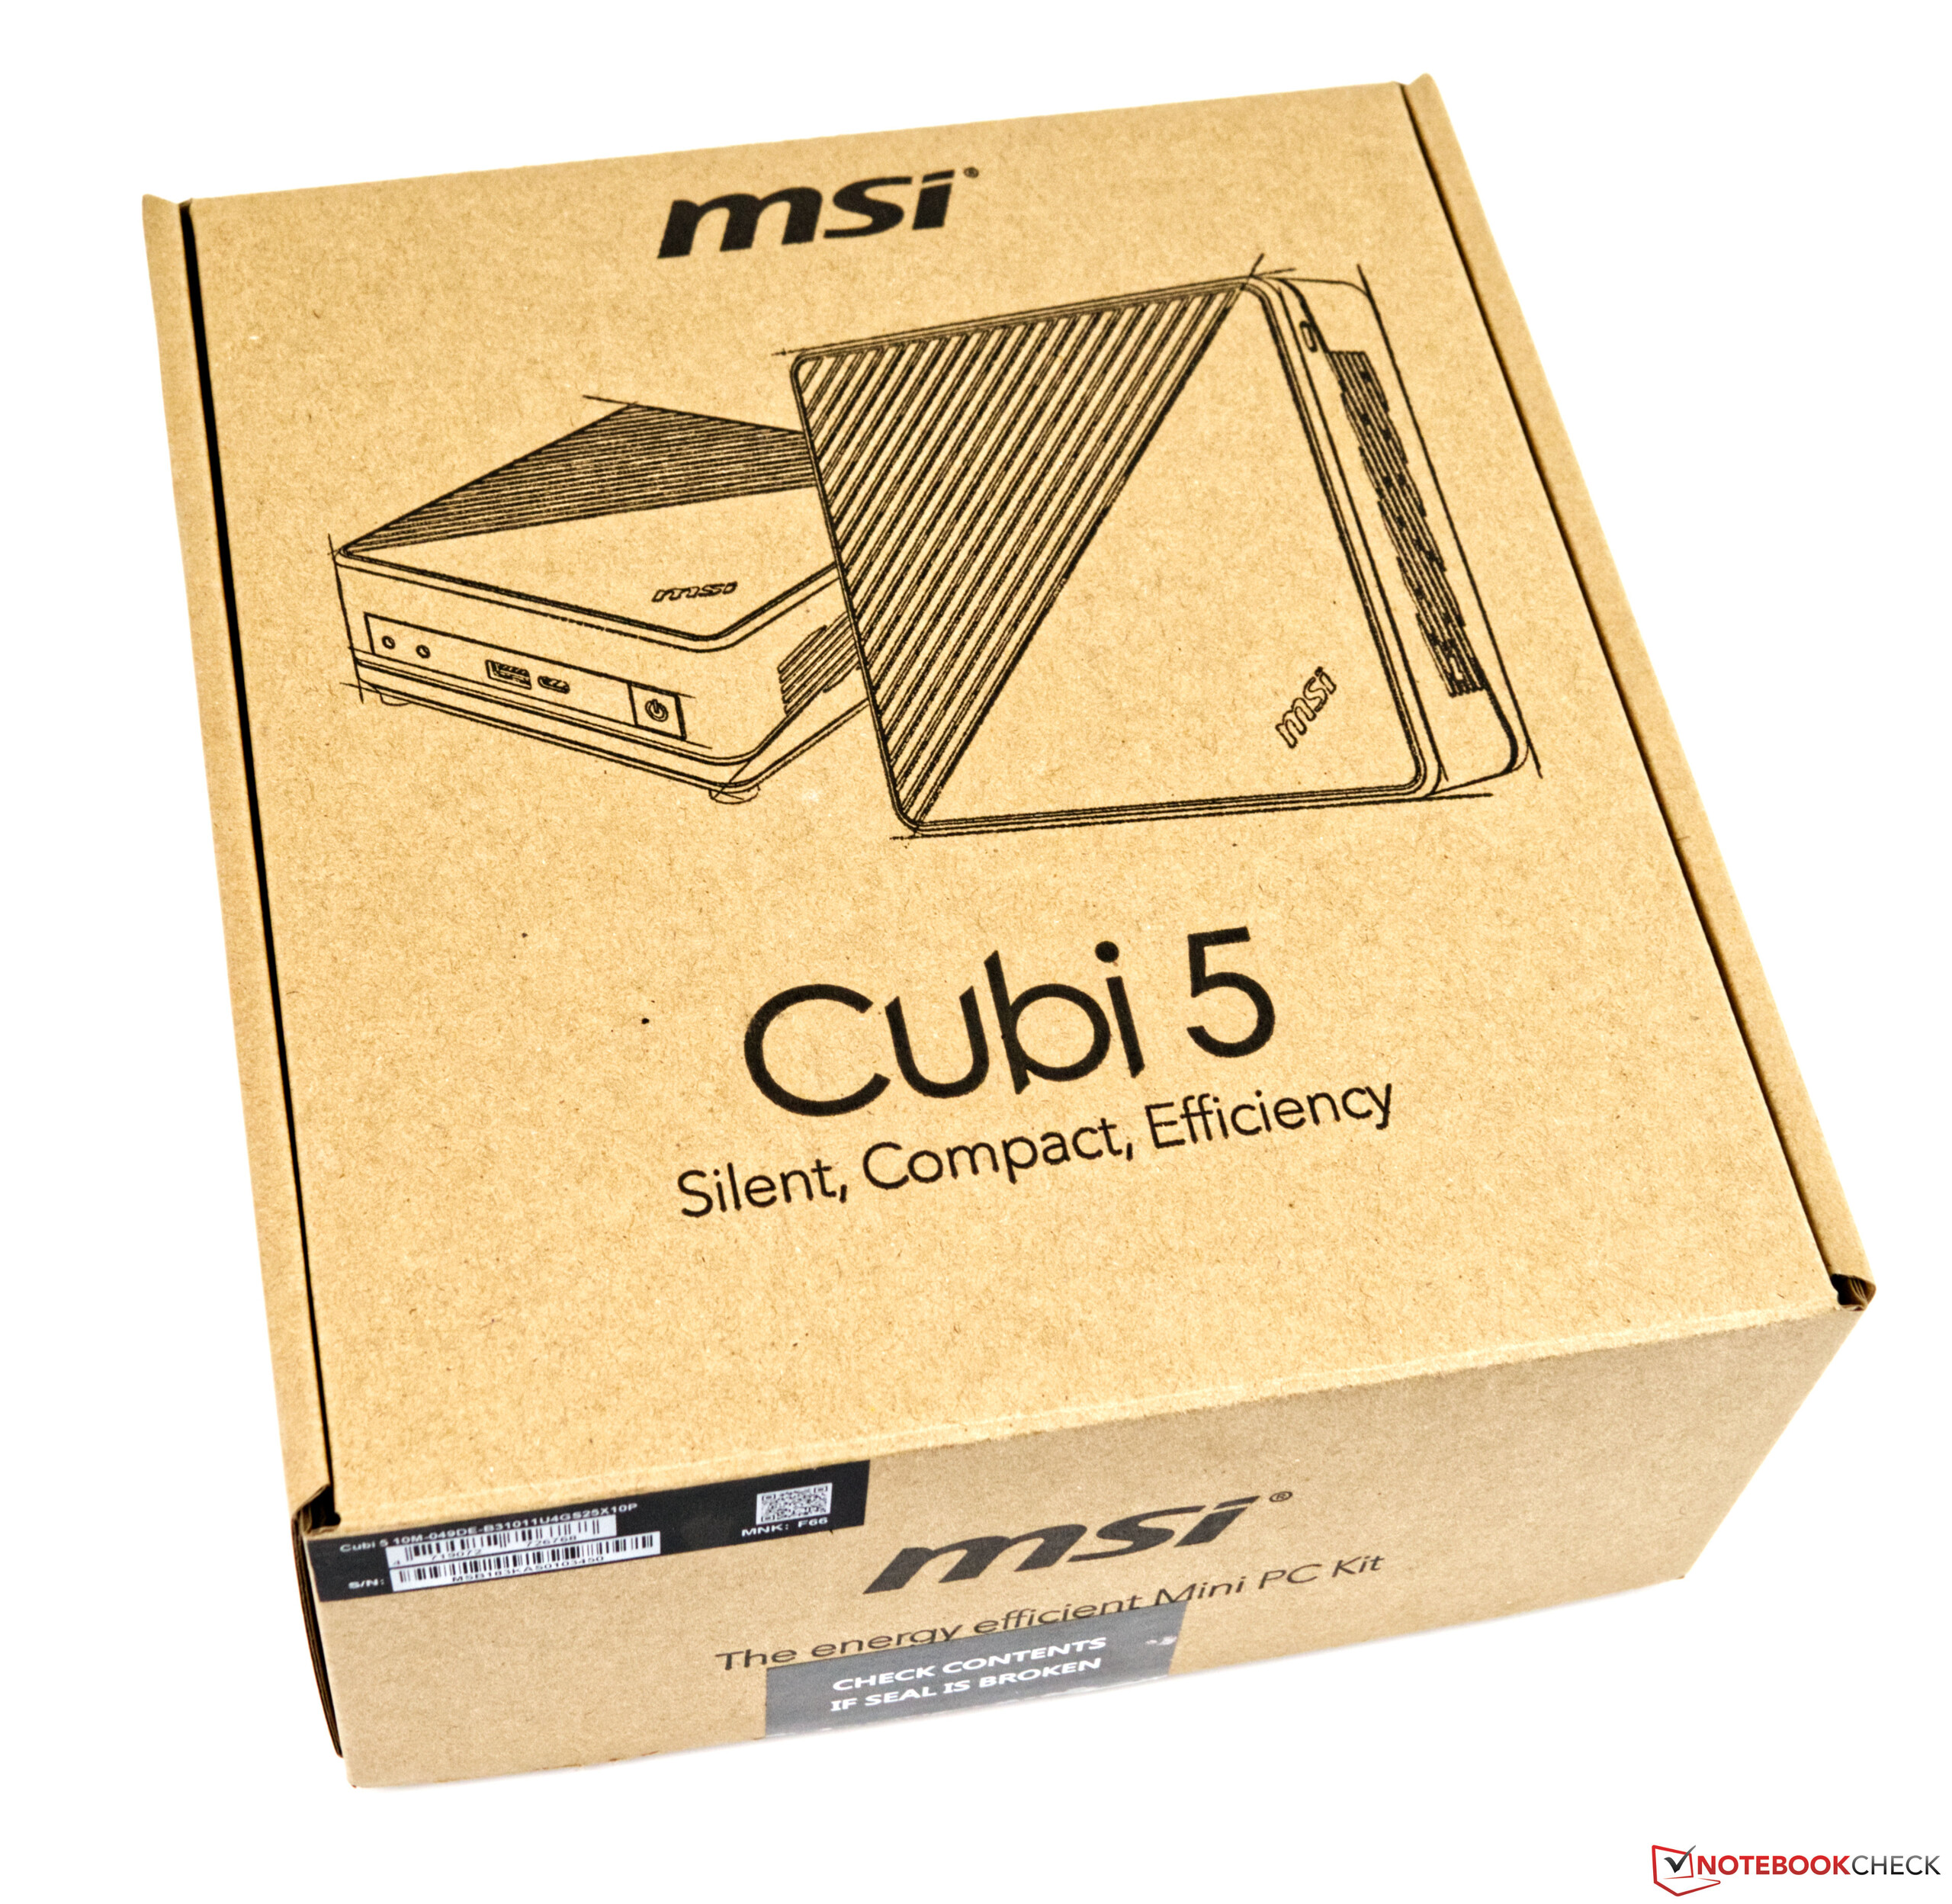
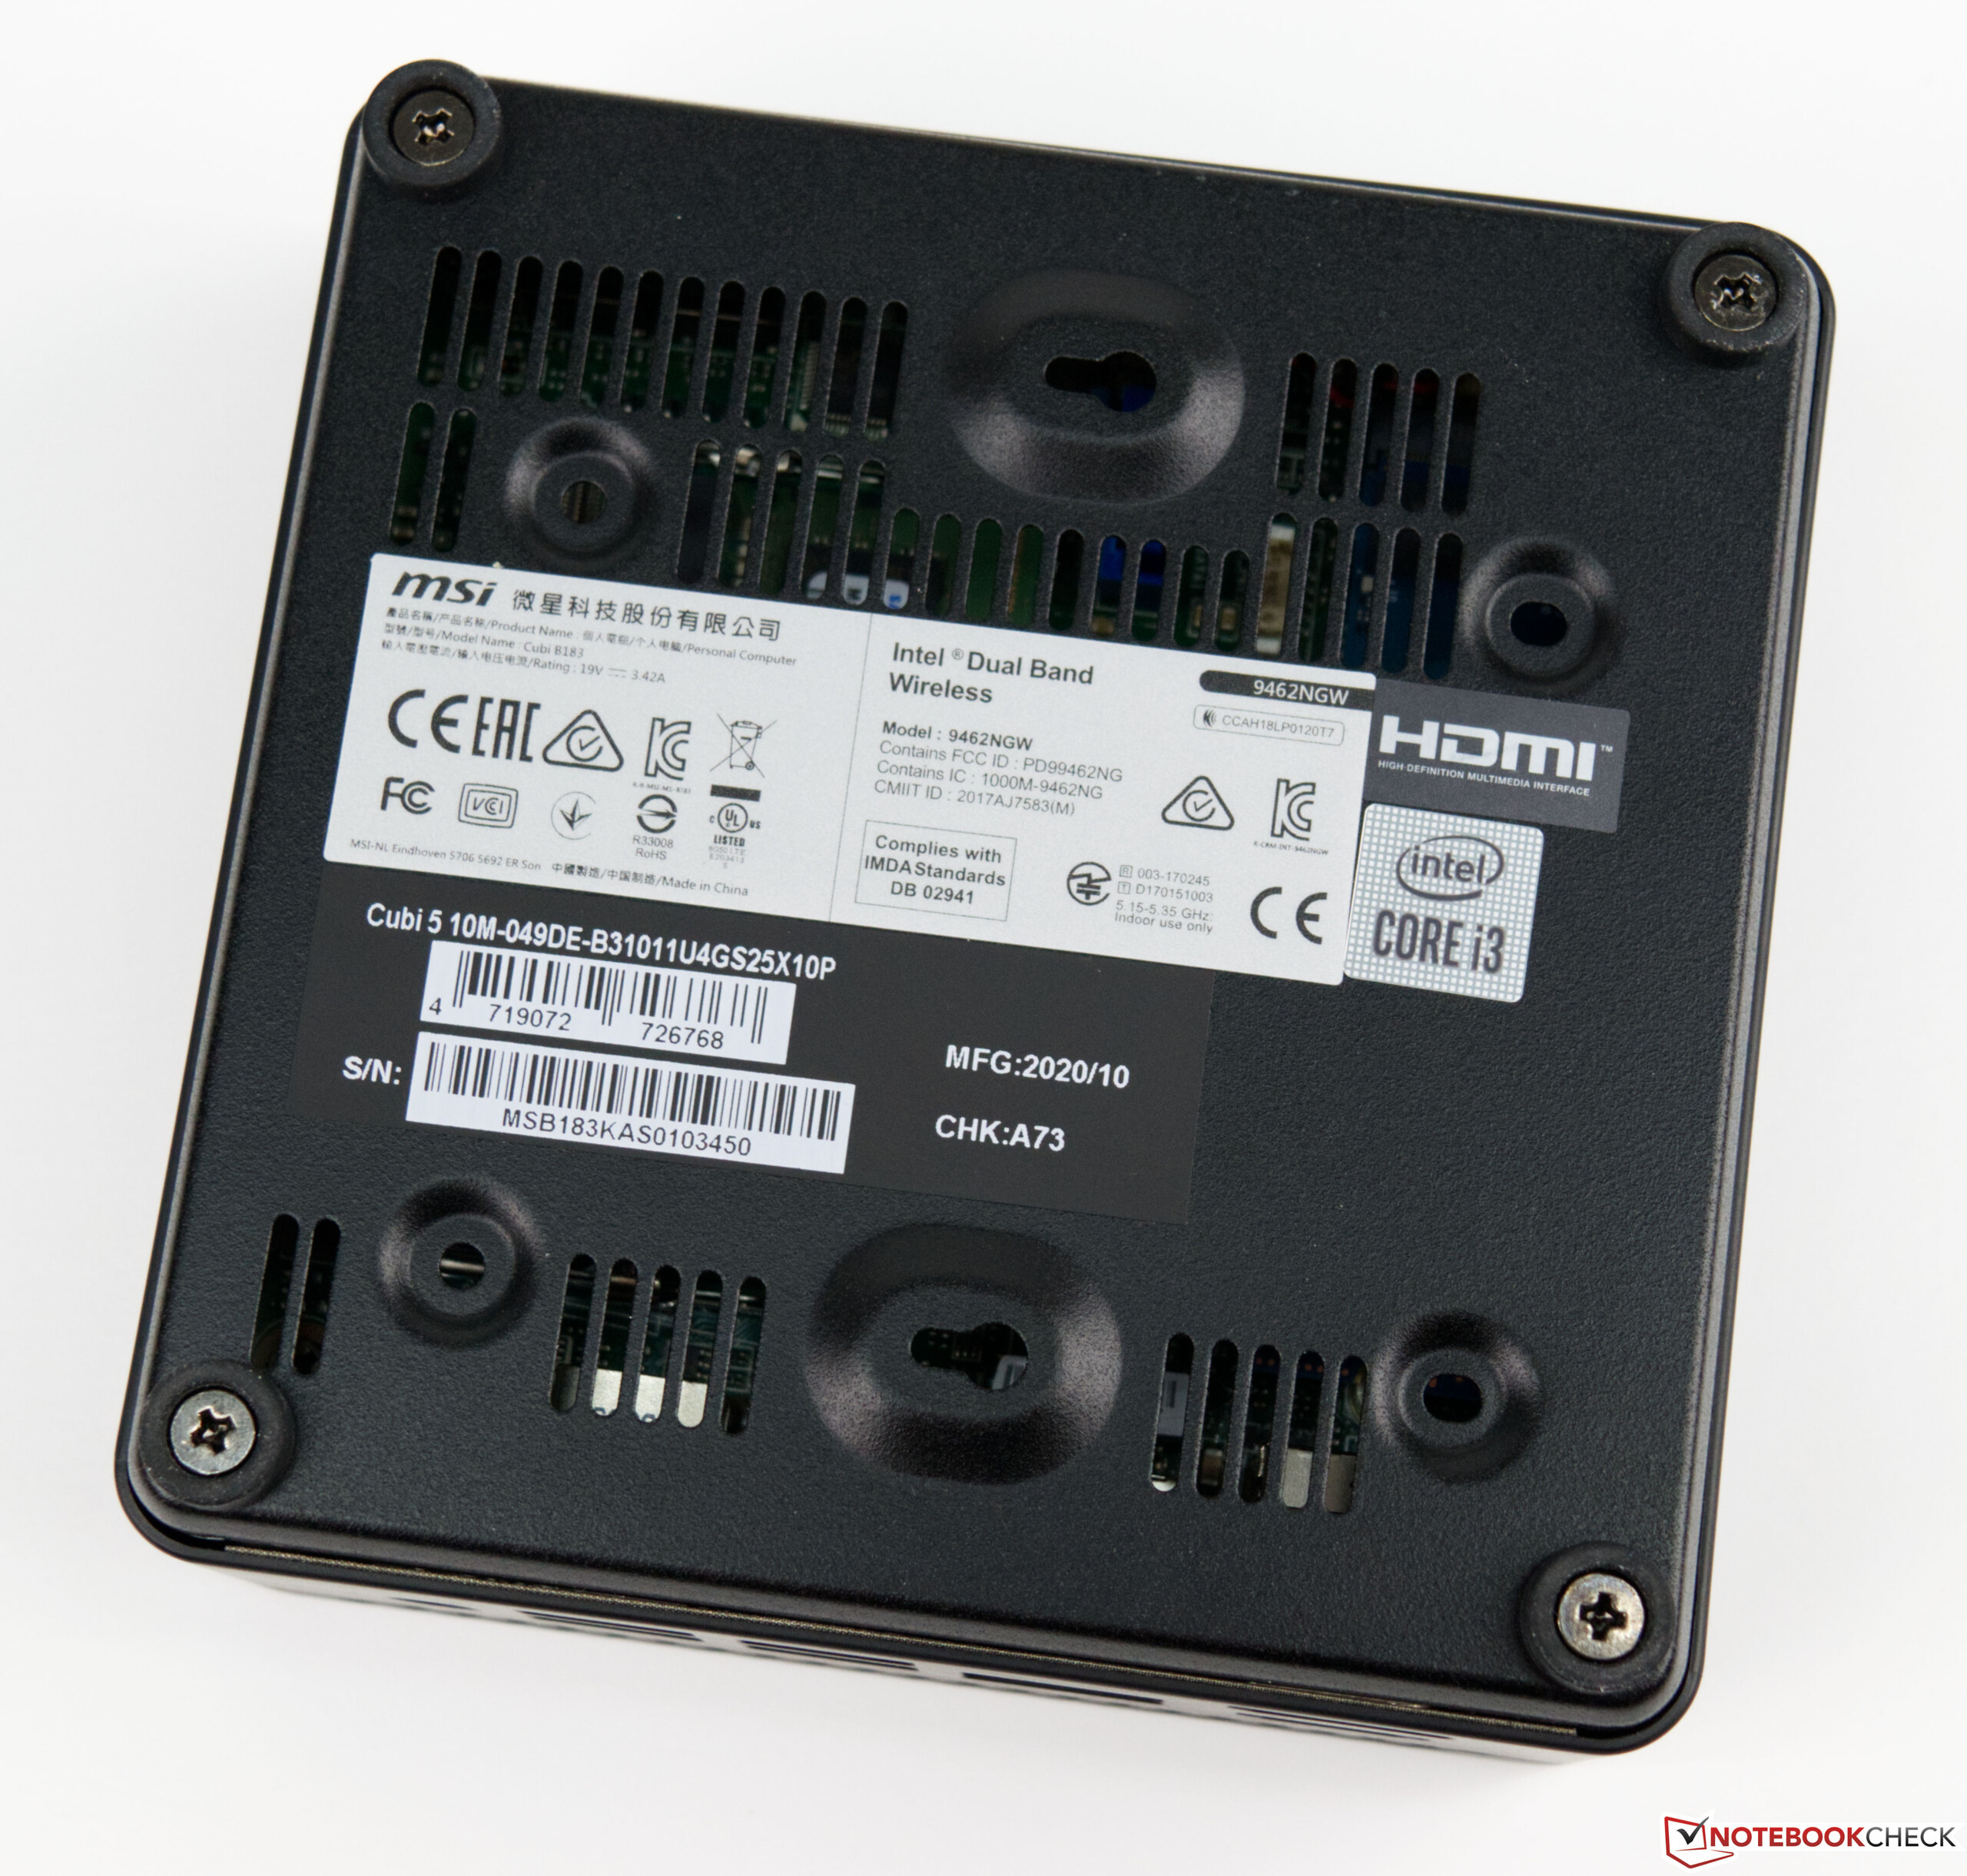
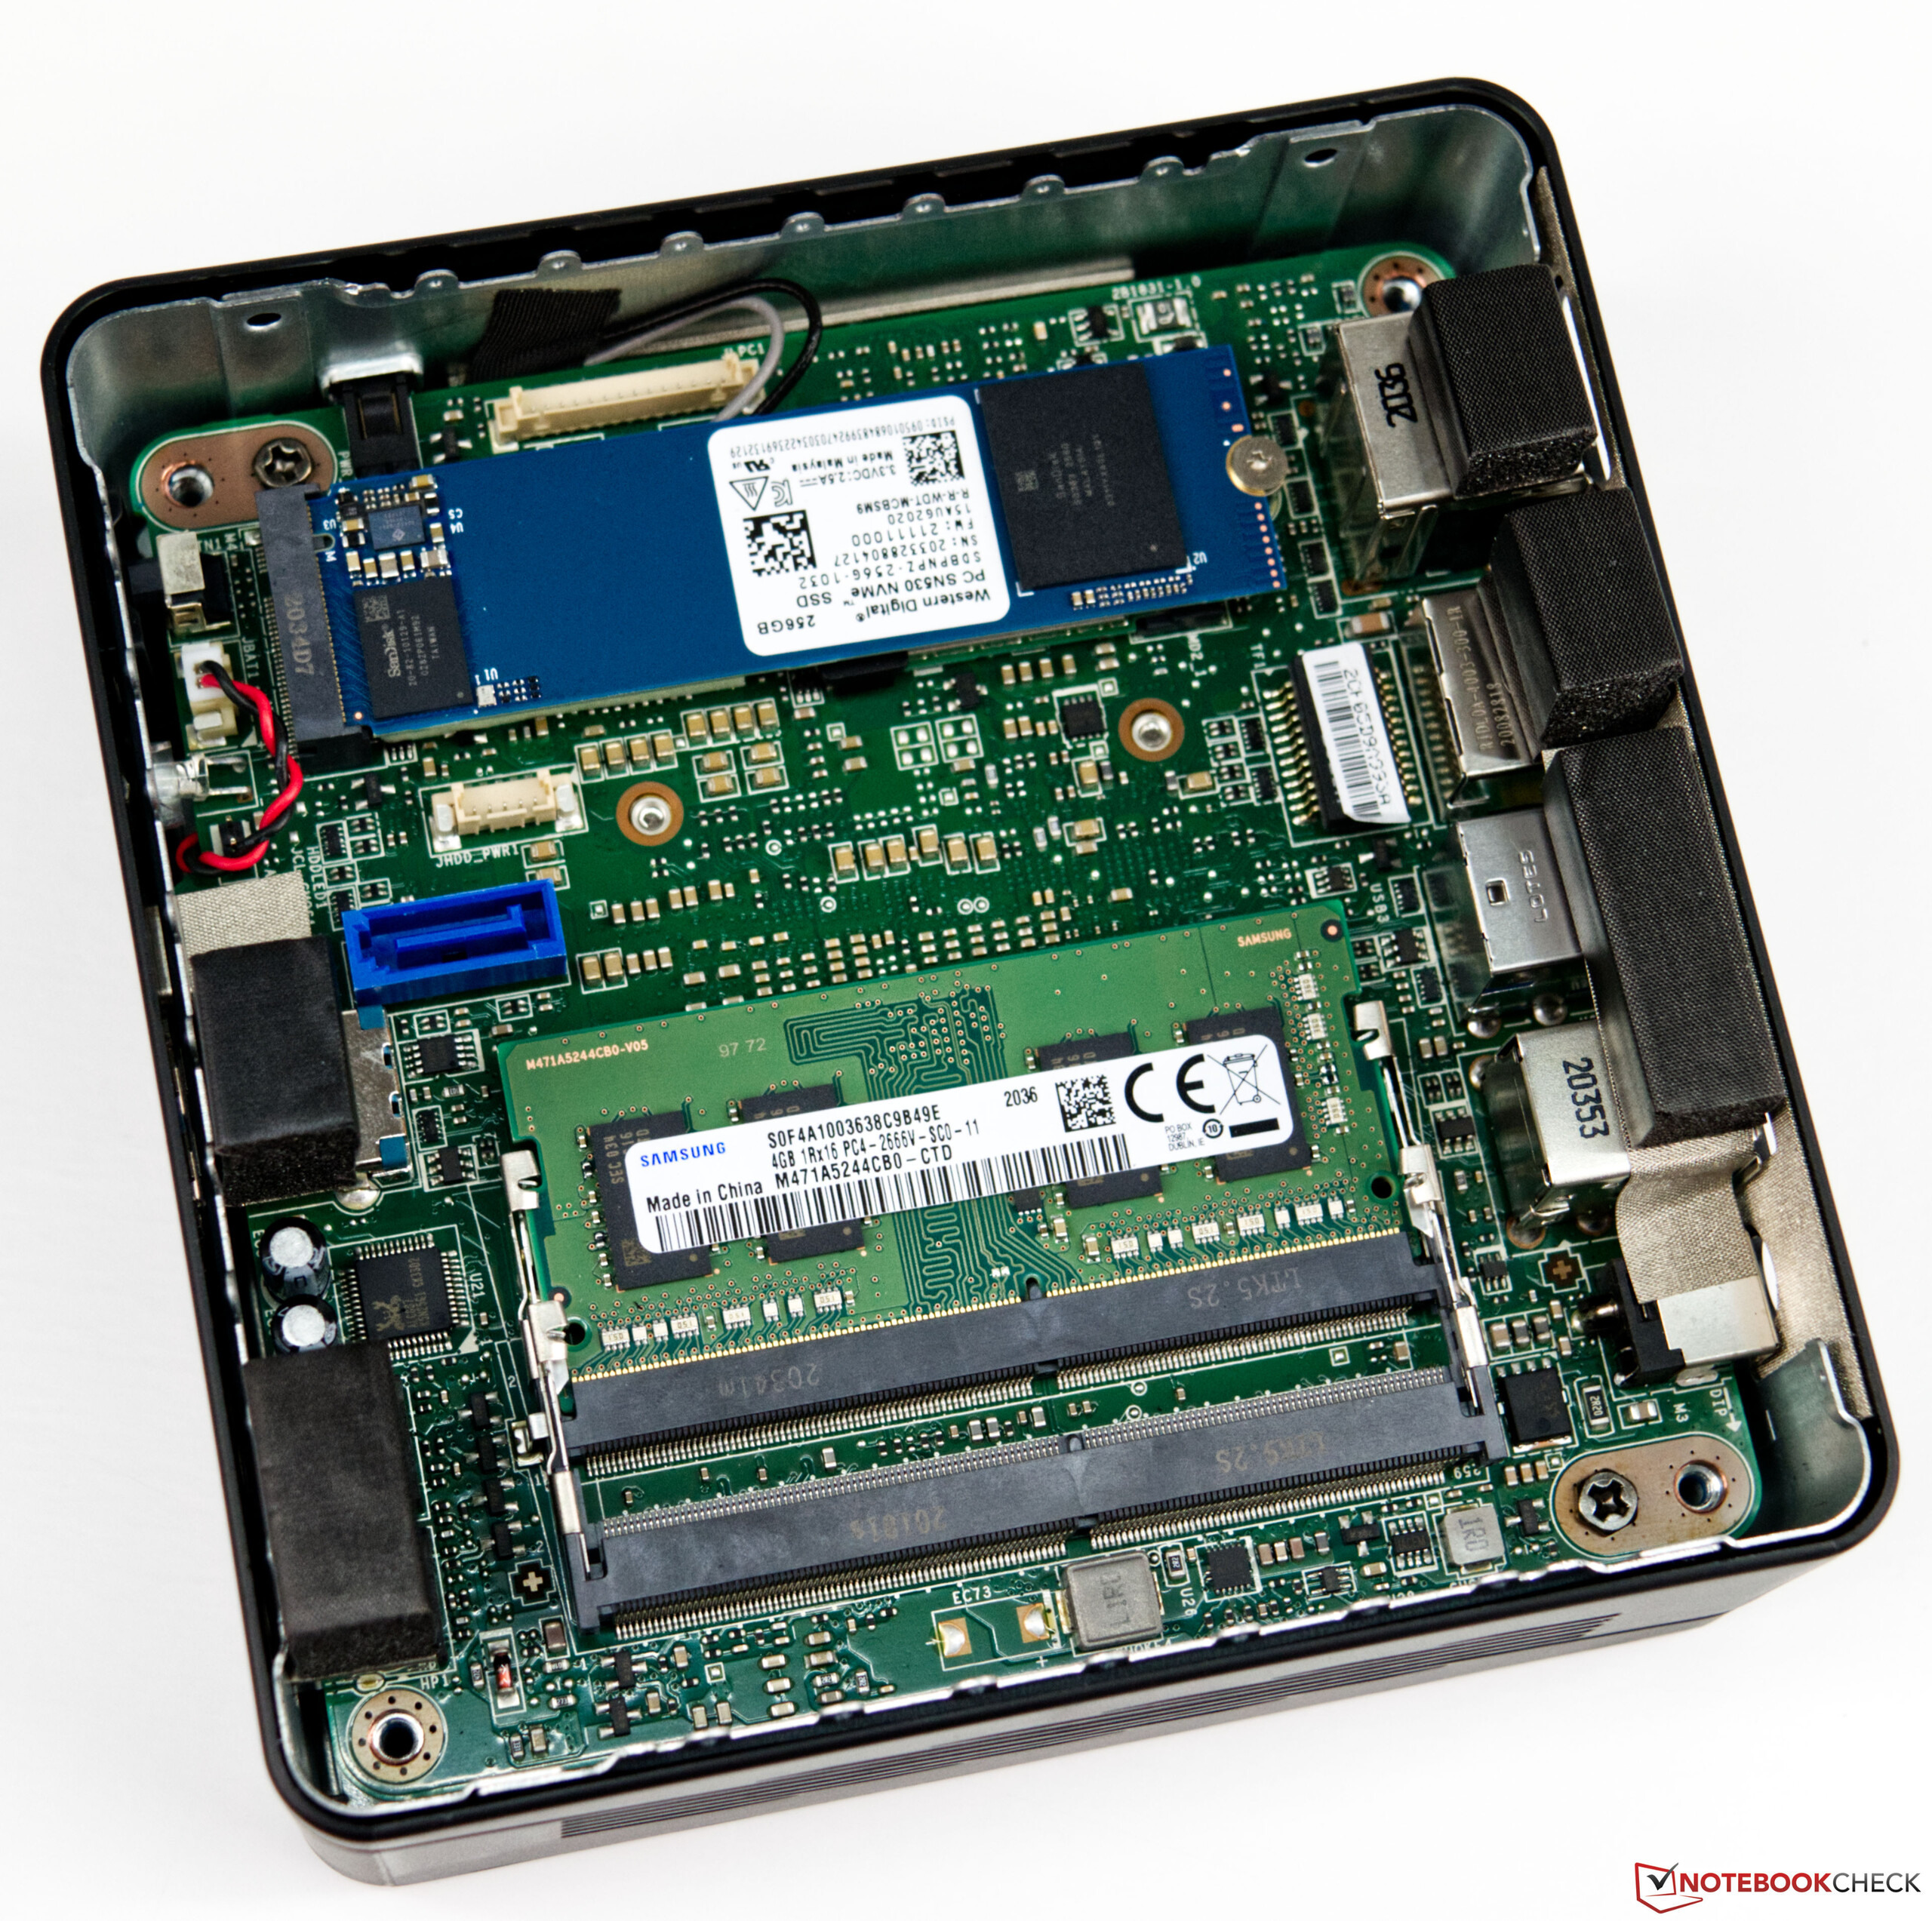
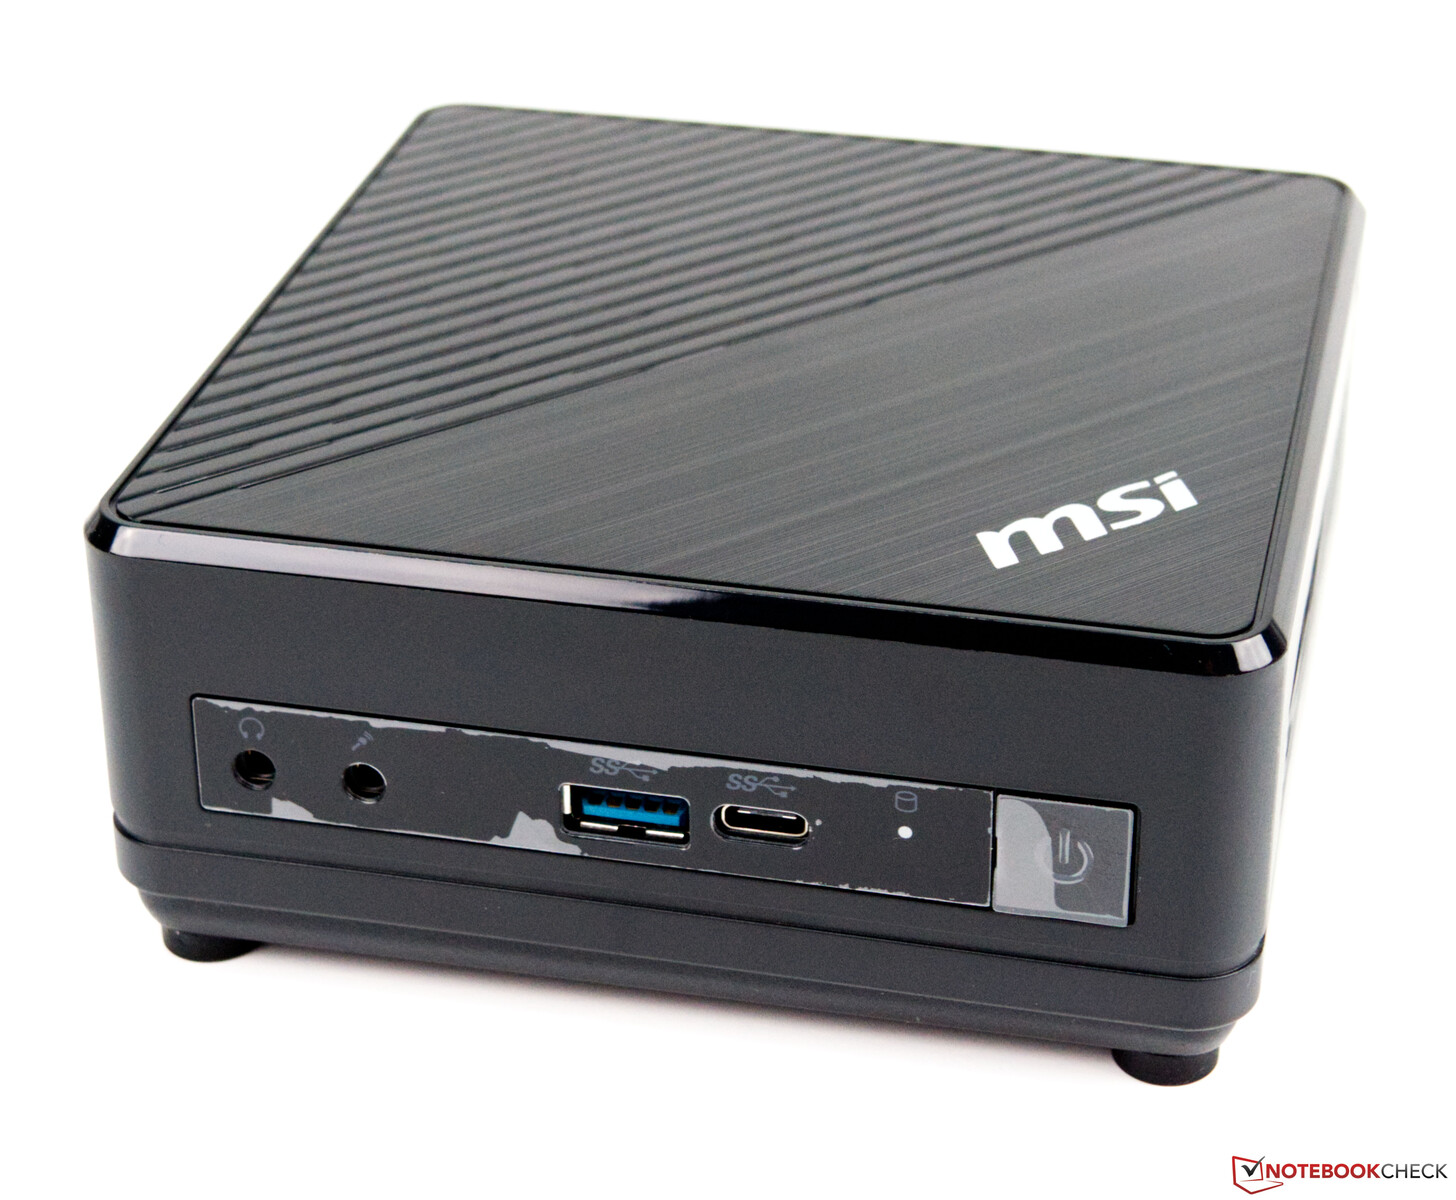
The Cubi 5 10M is a mini-PC based on Comet Lake and somewhat resembles the Intel NUC in shape and size. The SoC in our test device is the Intel Core i3-10110U, a dual-core processor with a total of 4 threads. The installed working memory is a 4 GB SO-DIMM module and can be replaced or expanded if necessary. A total of two SO-DIMM modules can be used. The 256 GB SSD offers NVMe support and thus provides fast read and write rates. Everything is installed in the small case with 124 x 54 x 124 (WxHxD) millimeters (~4.9 x 2.1 x 4.9 inches). This means that the Cubi 5 M10 is only slightly larger in direct comparison with the Intel NUC 10 Performance Kit. If the installed M.2 SSD is too small for you, you can swap it or install another 2.5-inch drive in the device. All necessary screws and cables are included. The Cubi 5 M10 Mini-PC in our test configuration is available for just under 540 Euros (~$638). However, we would like to emphasize that this is not a barebone system, which means that there are no additional costs for RAM, mass storage and operating system.
The MSI Cubi 5 M10 is available in six different configurations. You can find a list here https://de.msi.com/Business-Productivity-PC/Cubi-5-10M/Specification . However, you should be careful since the alternative options are so-called barebone systems. These come without working memory and mass storage. The operating system also has to be purchased additionally, which pushes the price up.
Case & Equipment
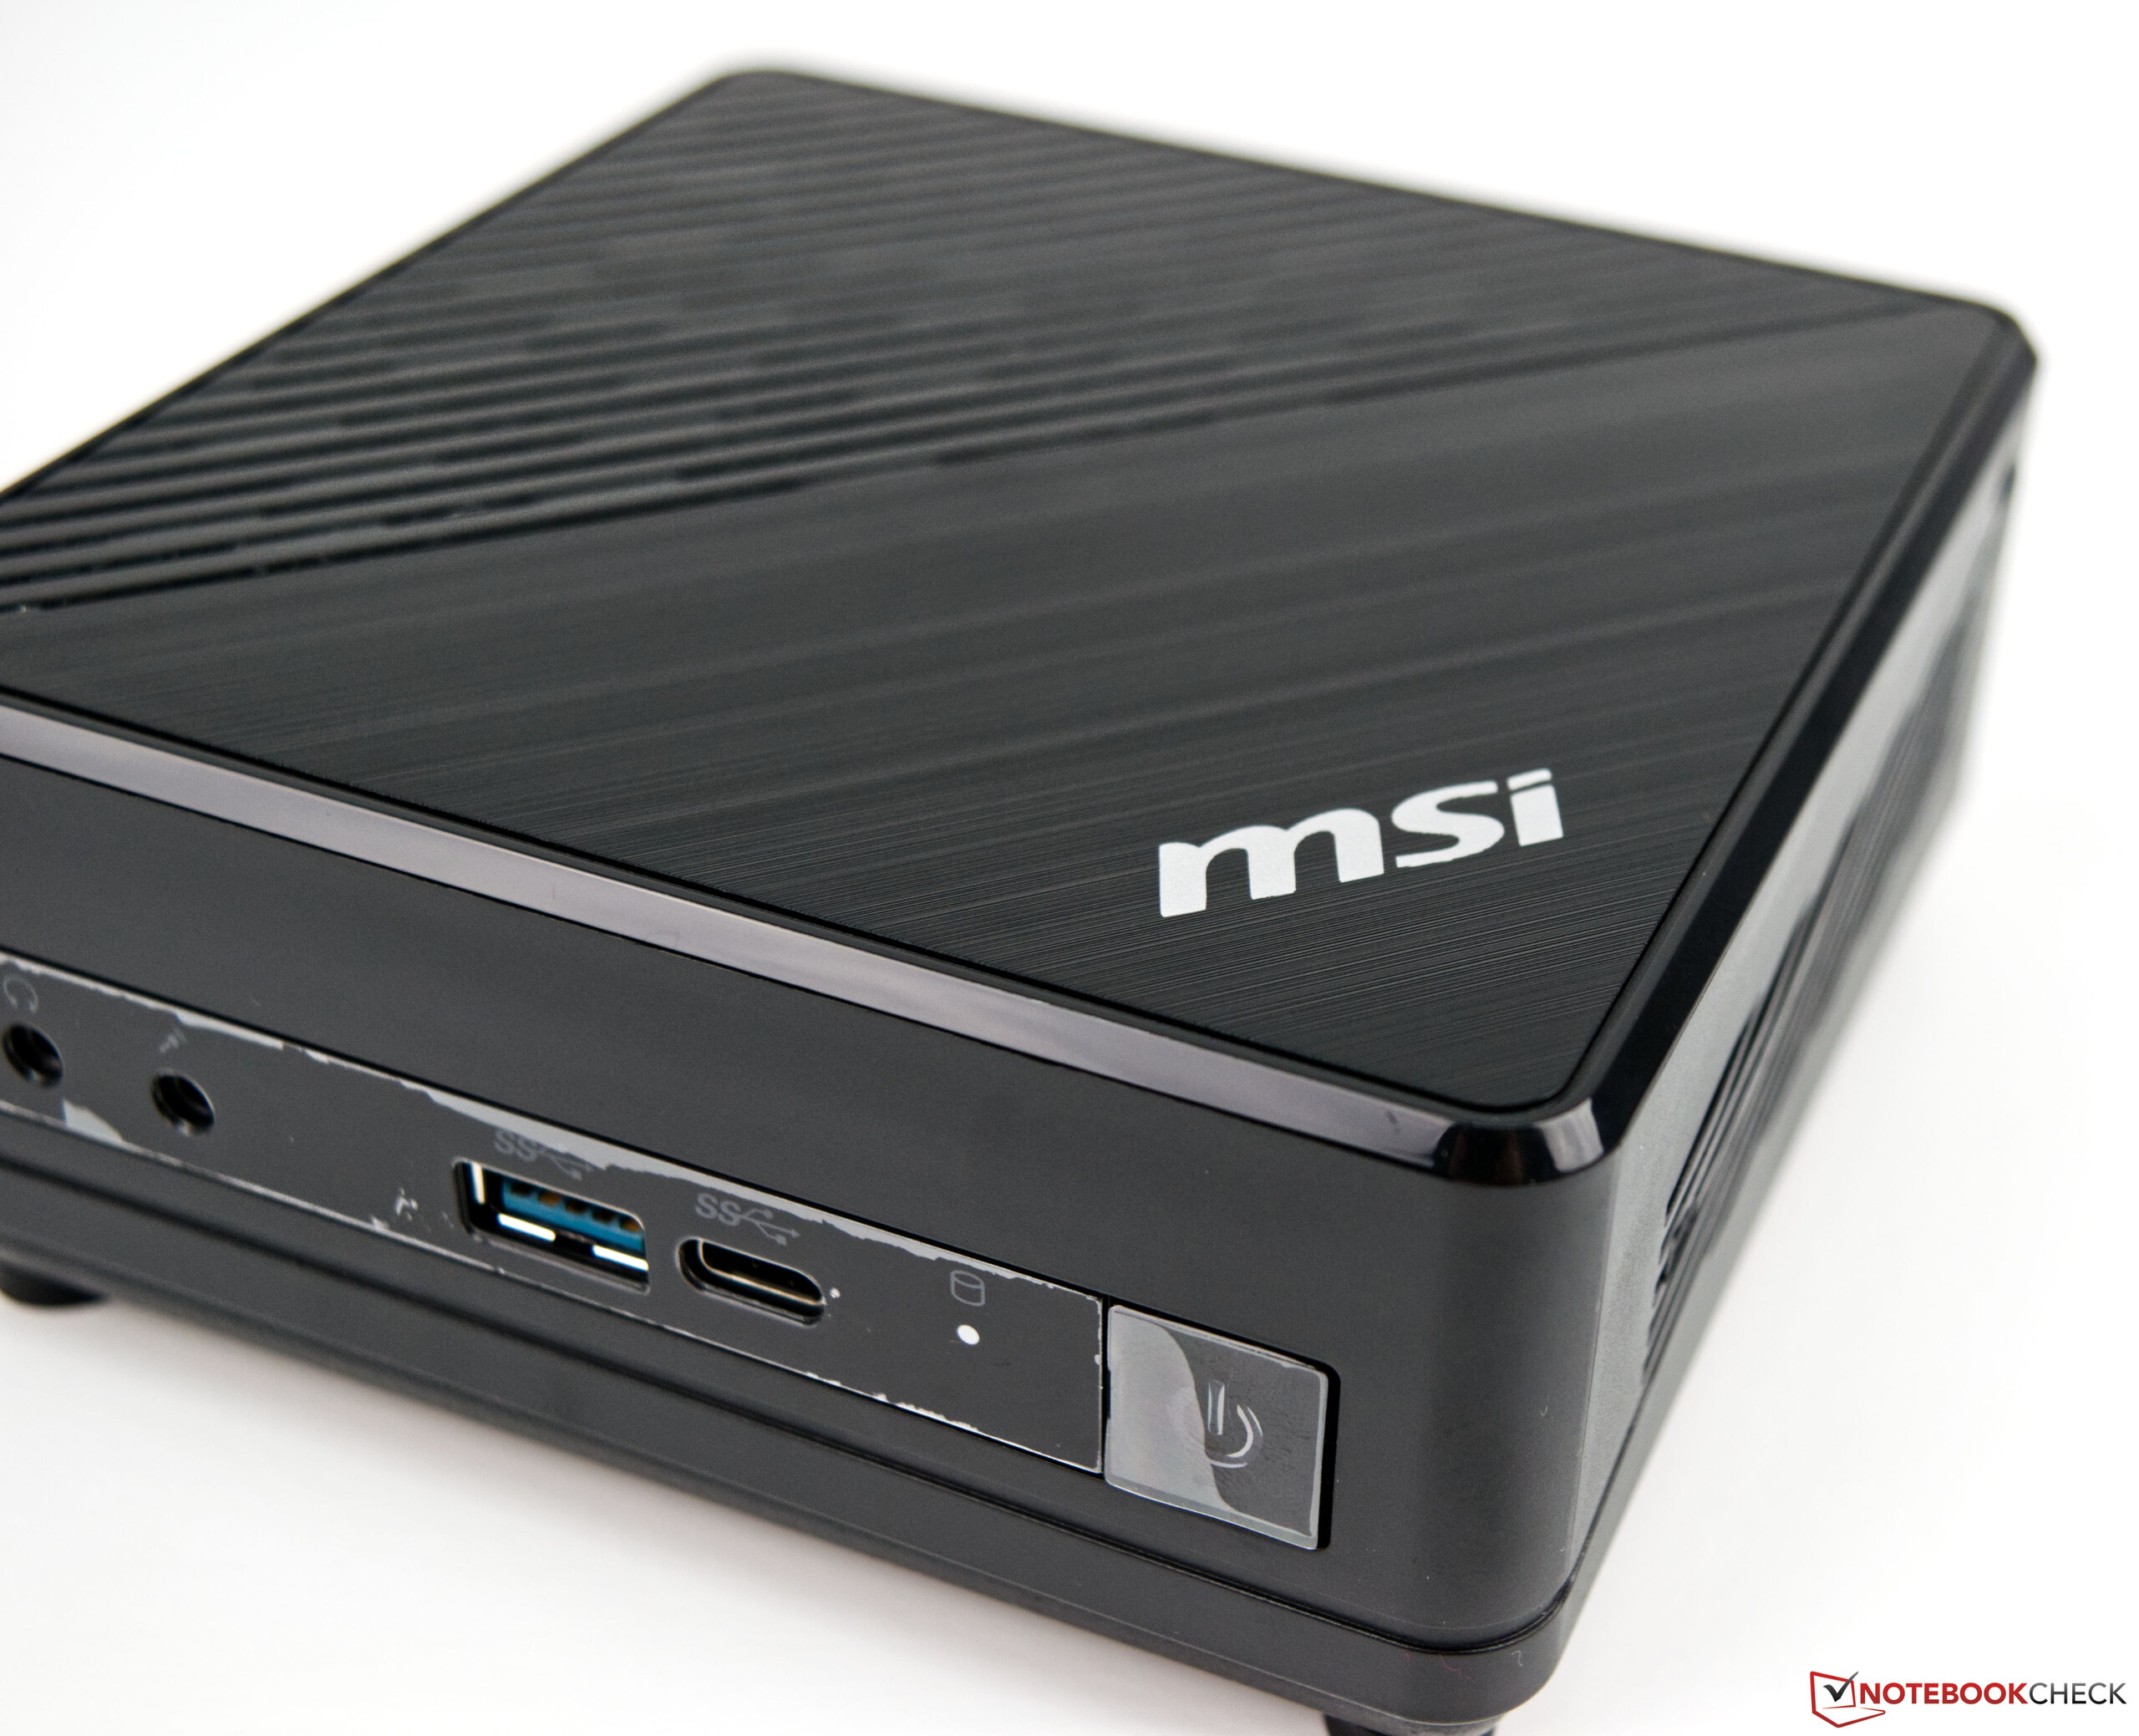
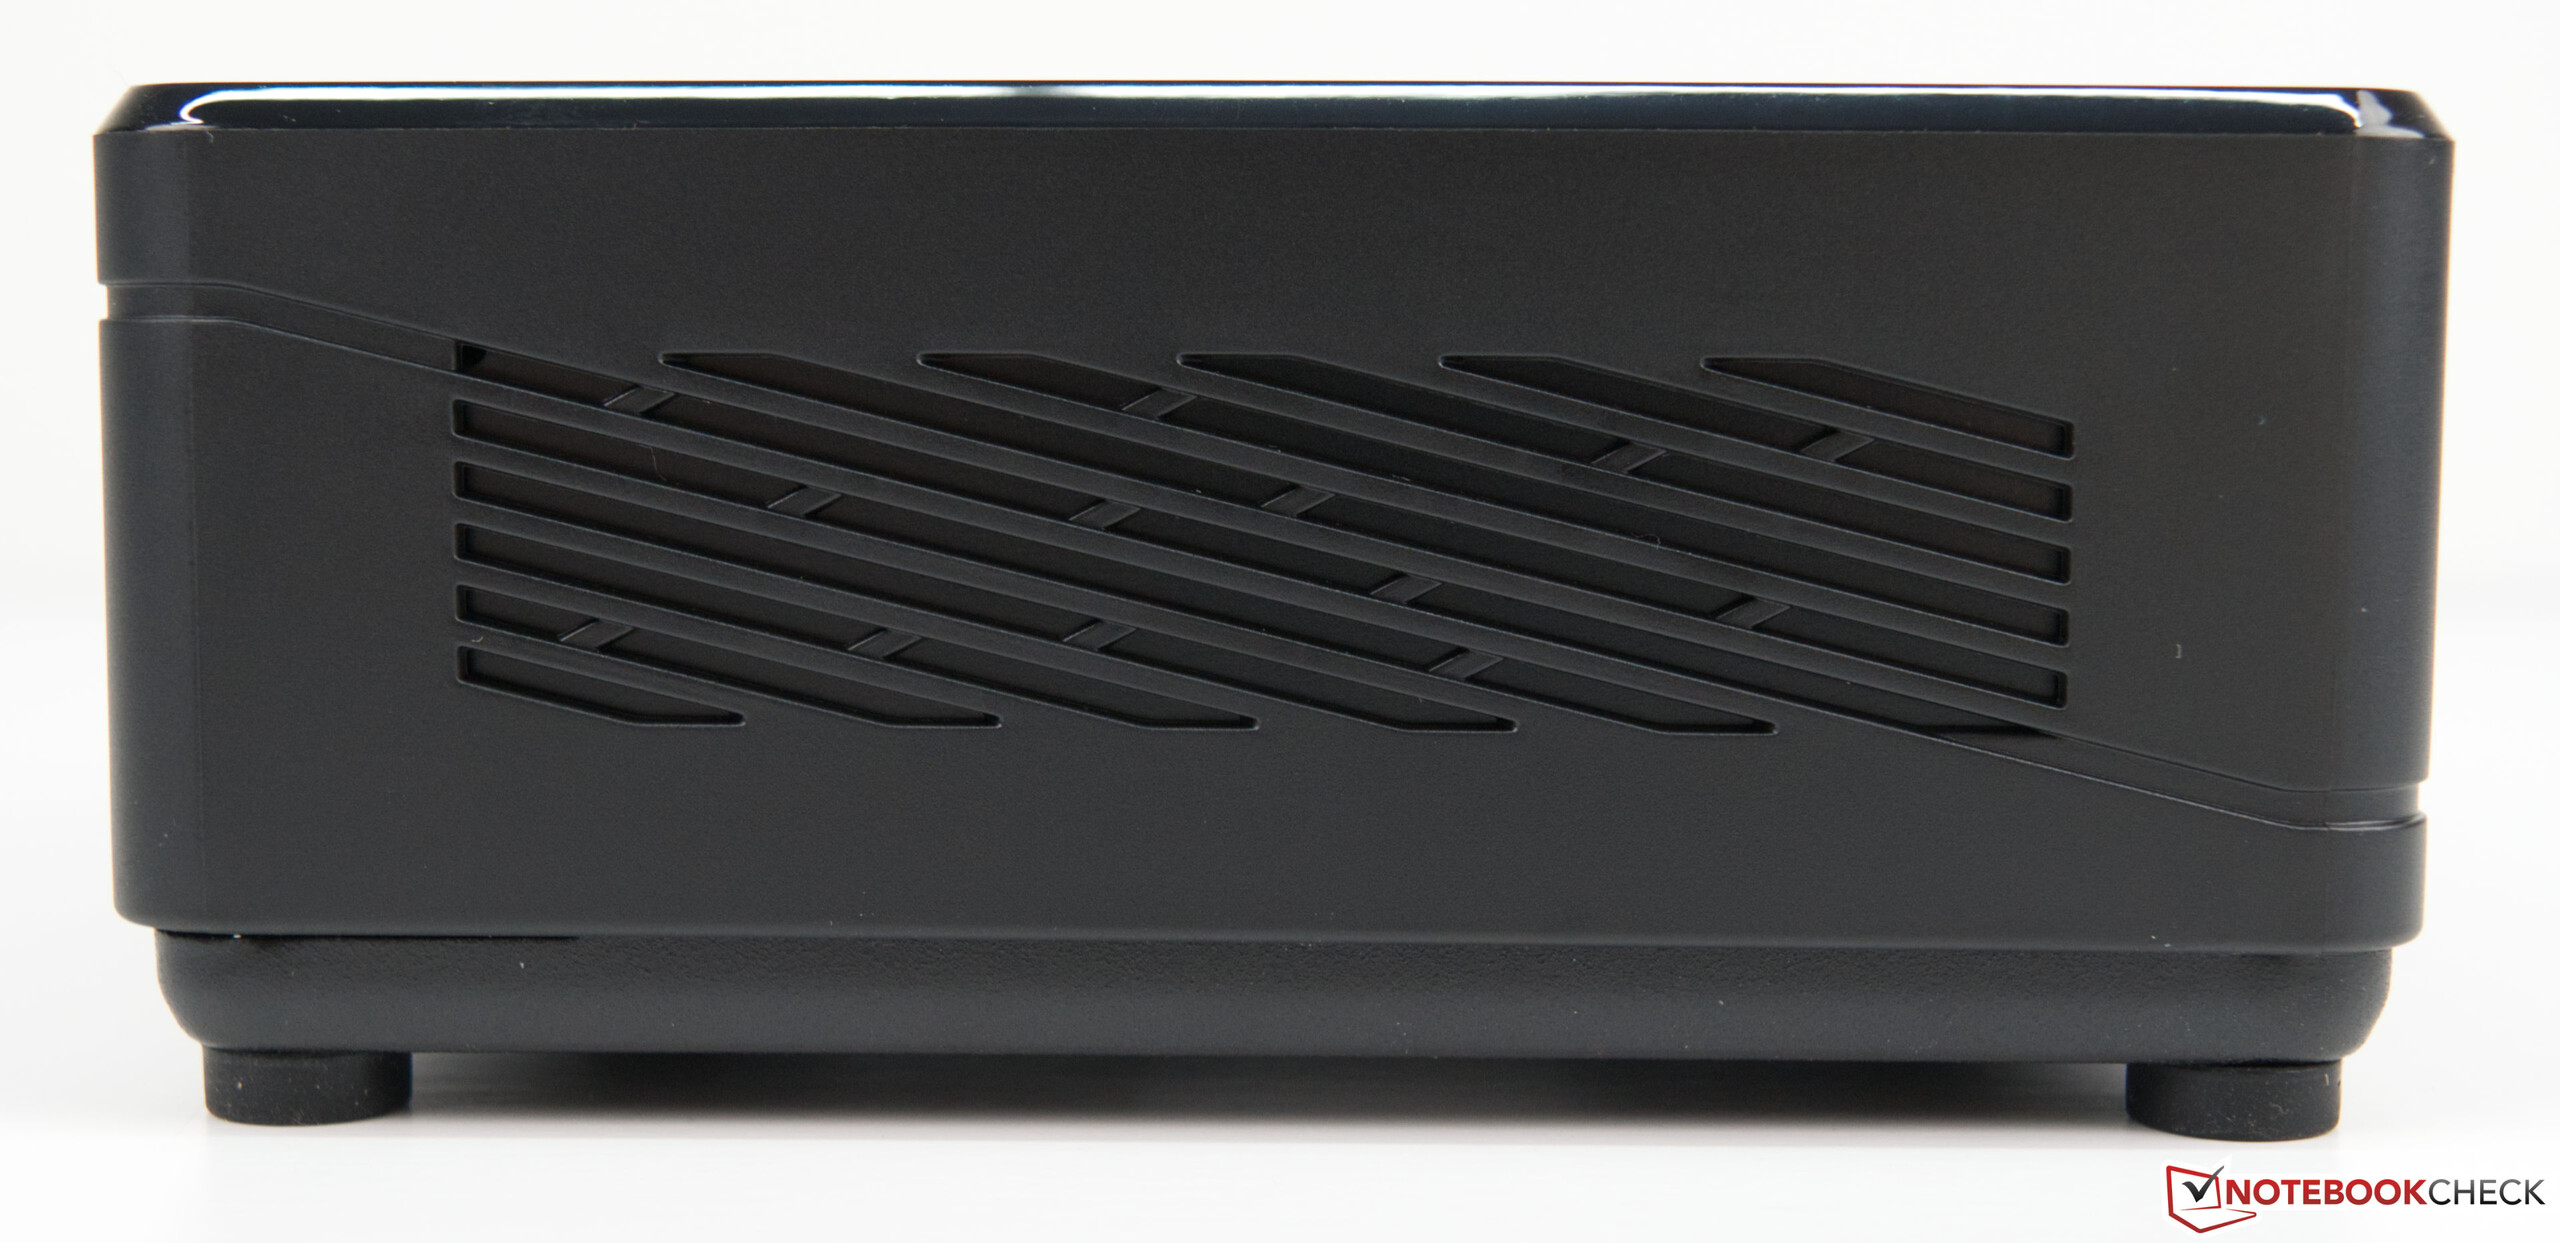
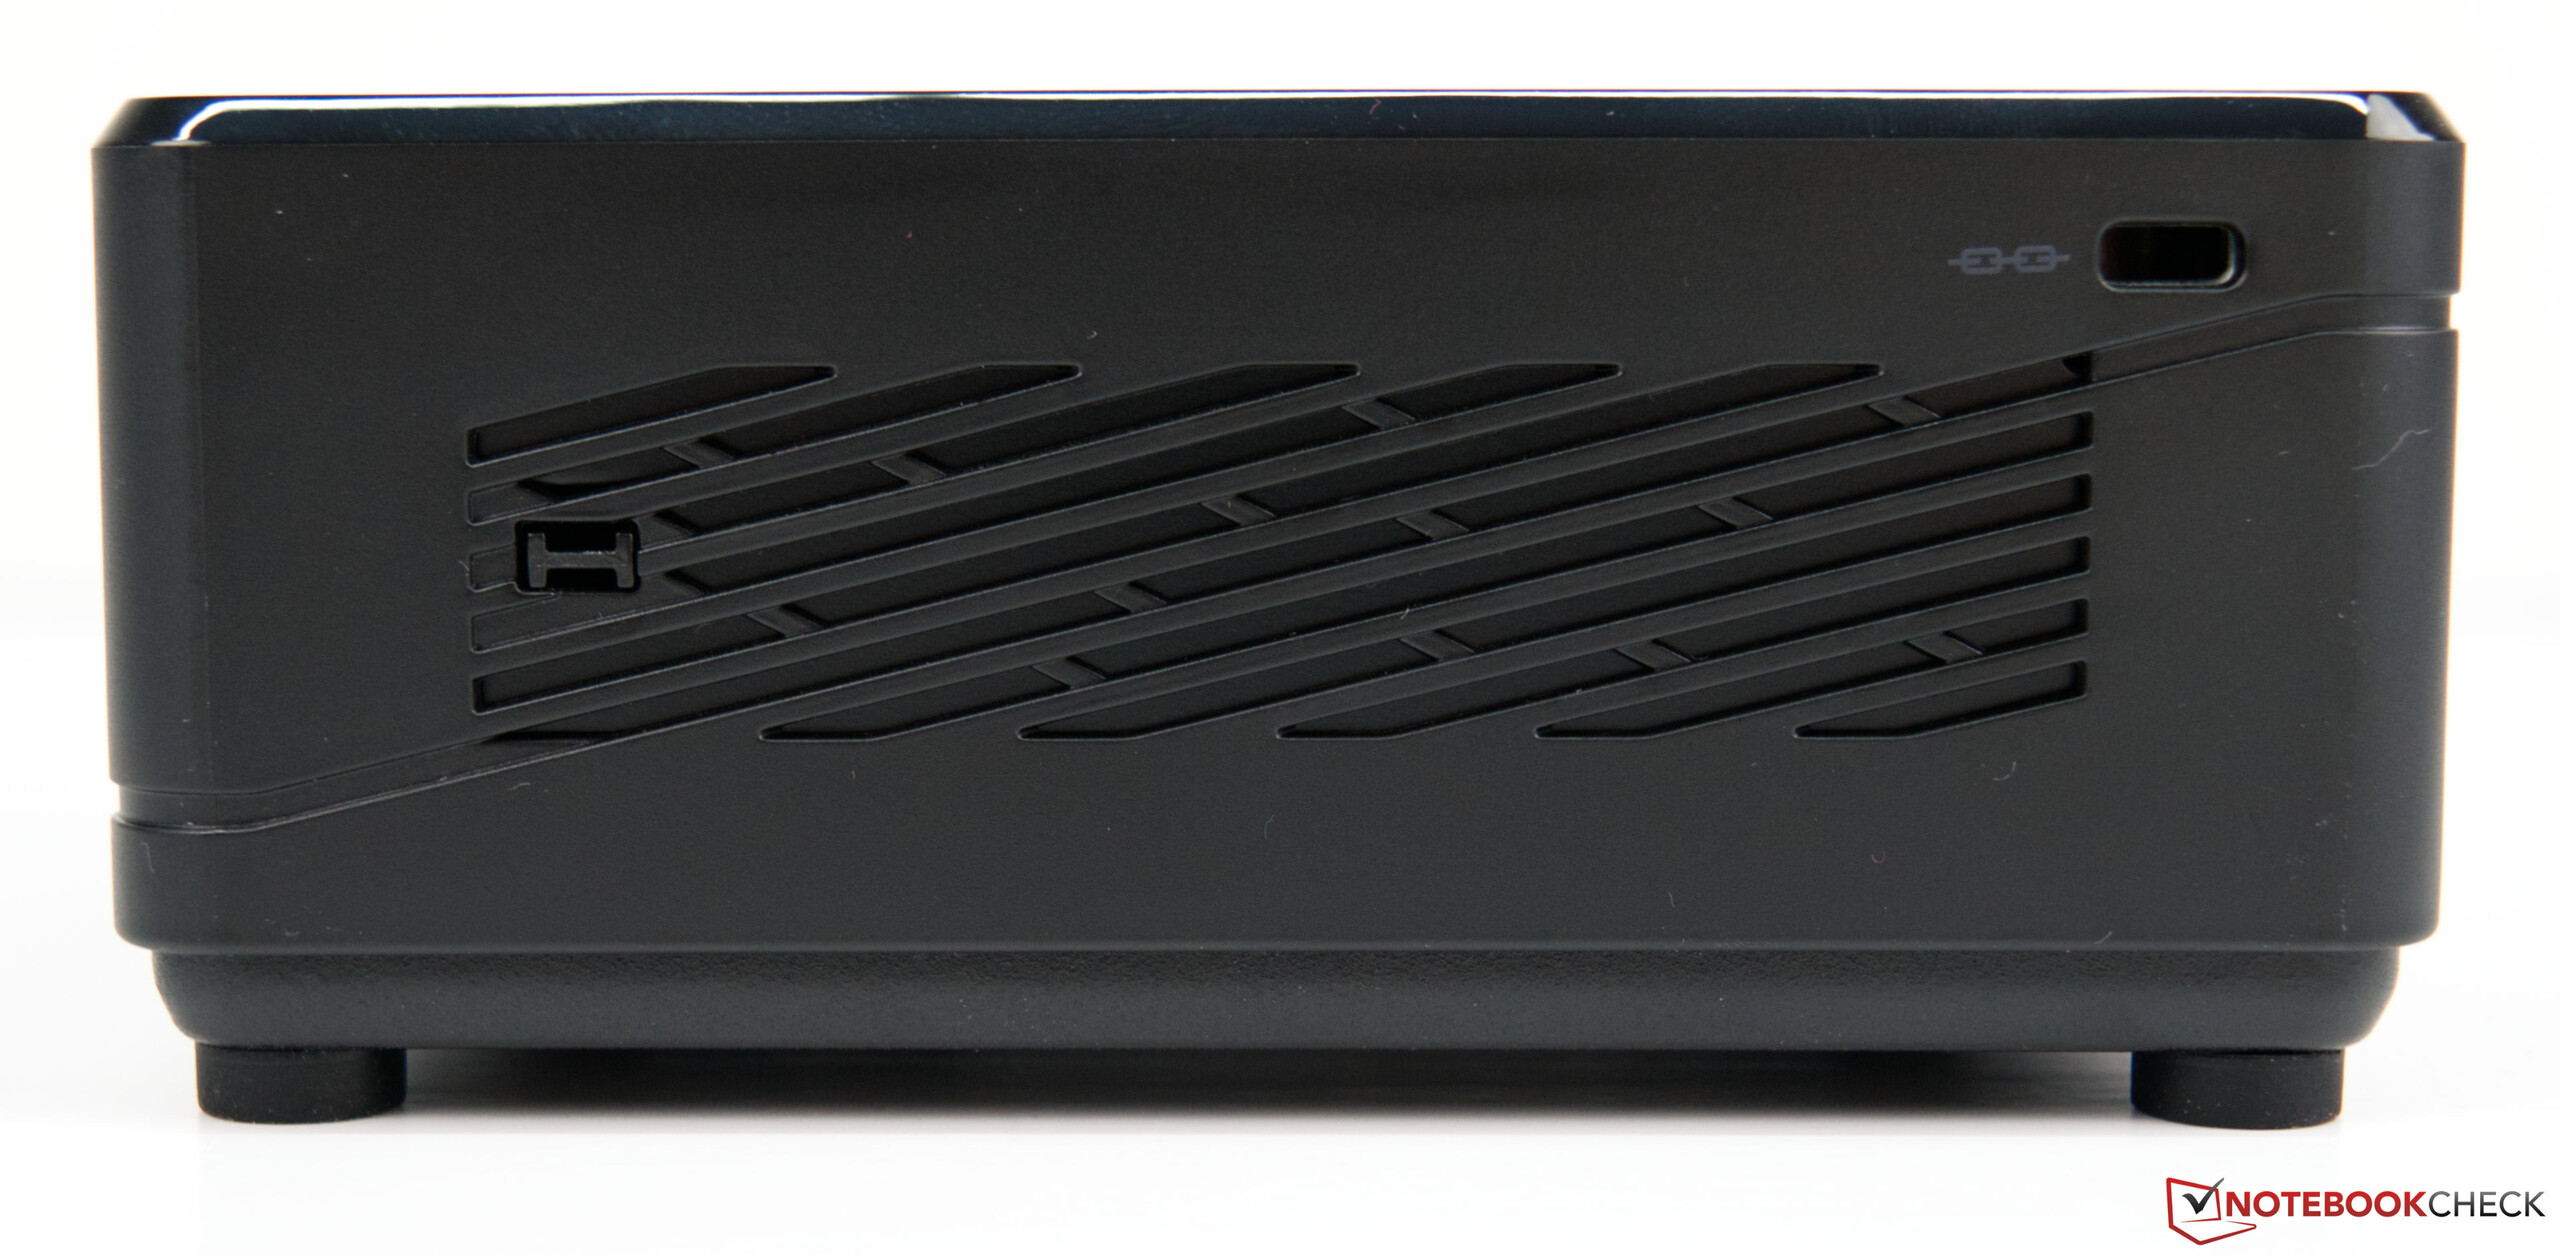
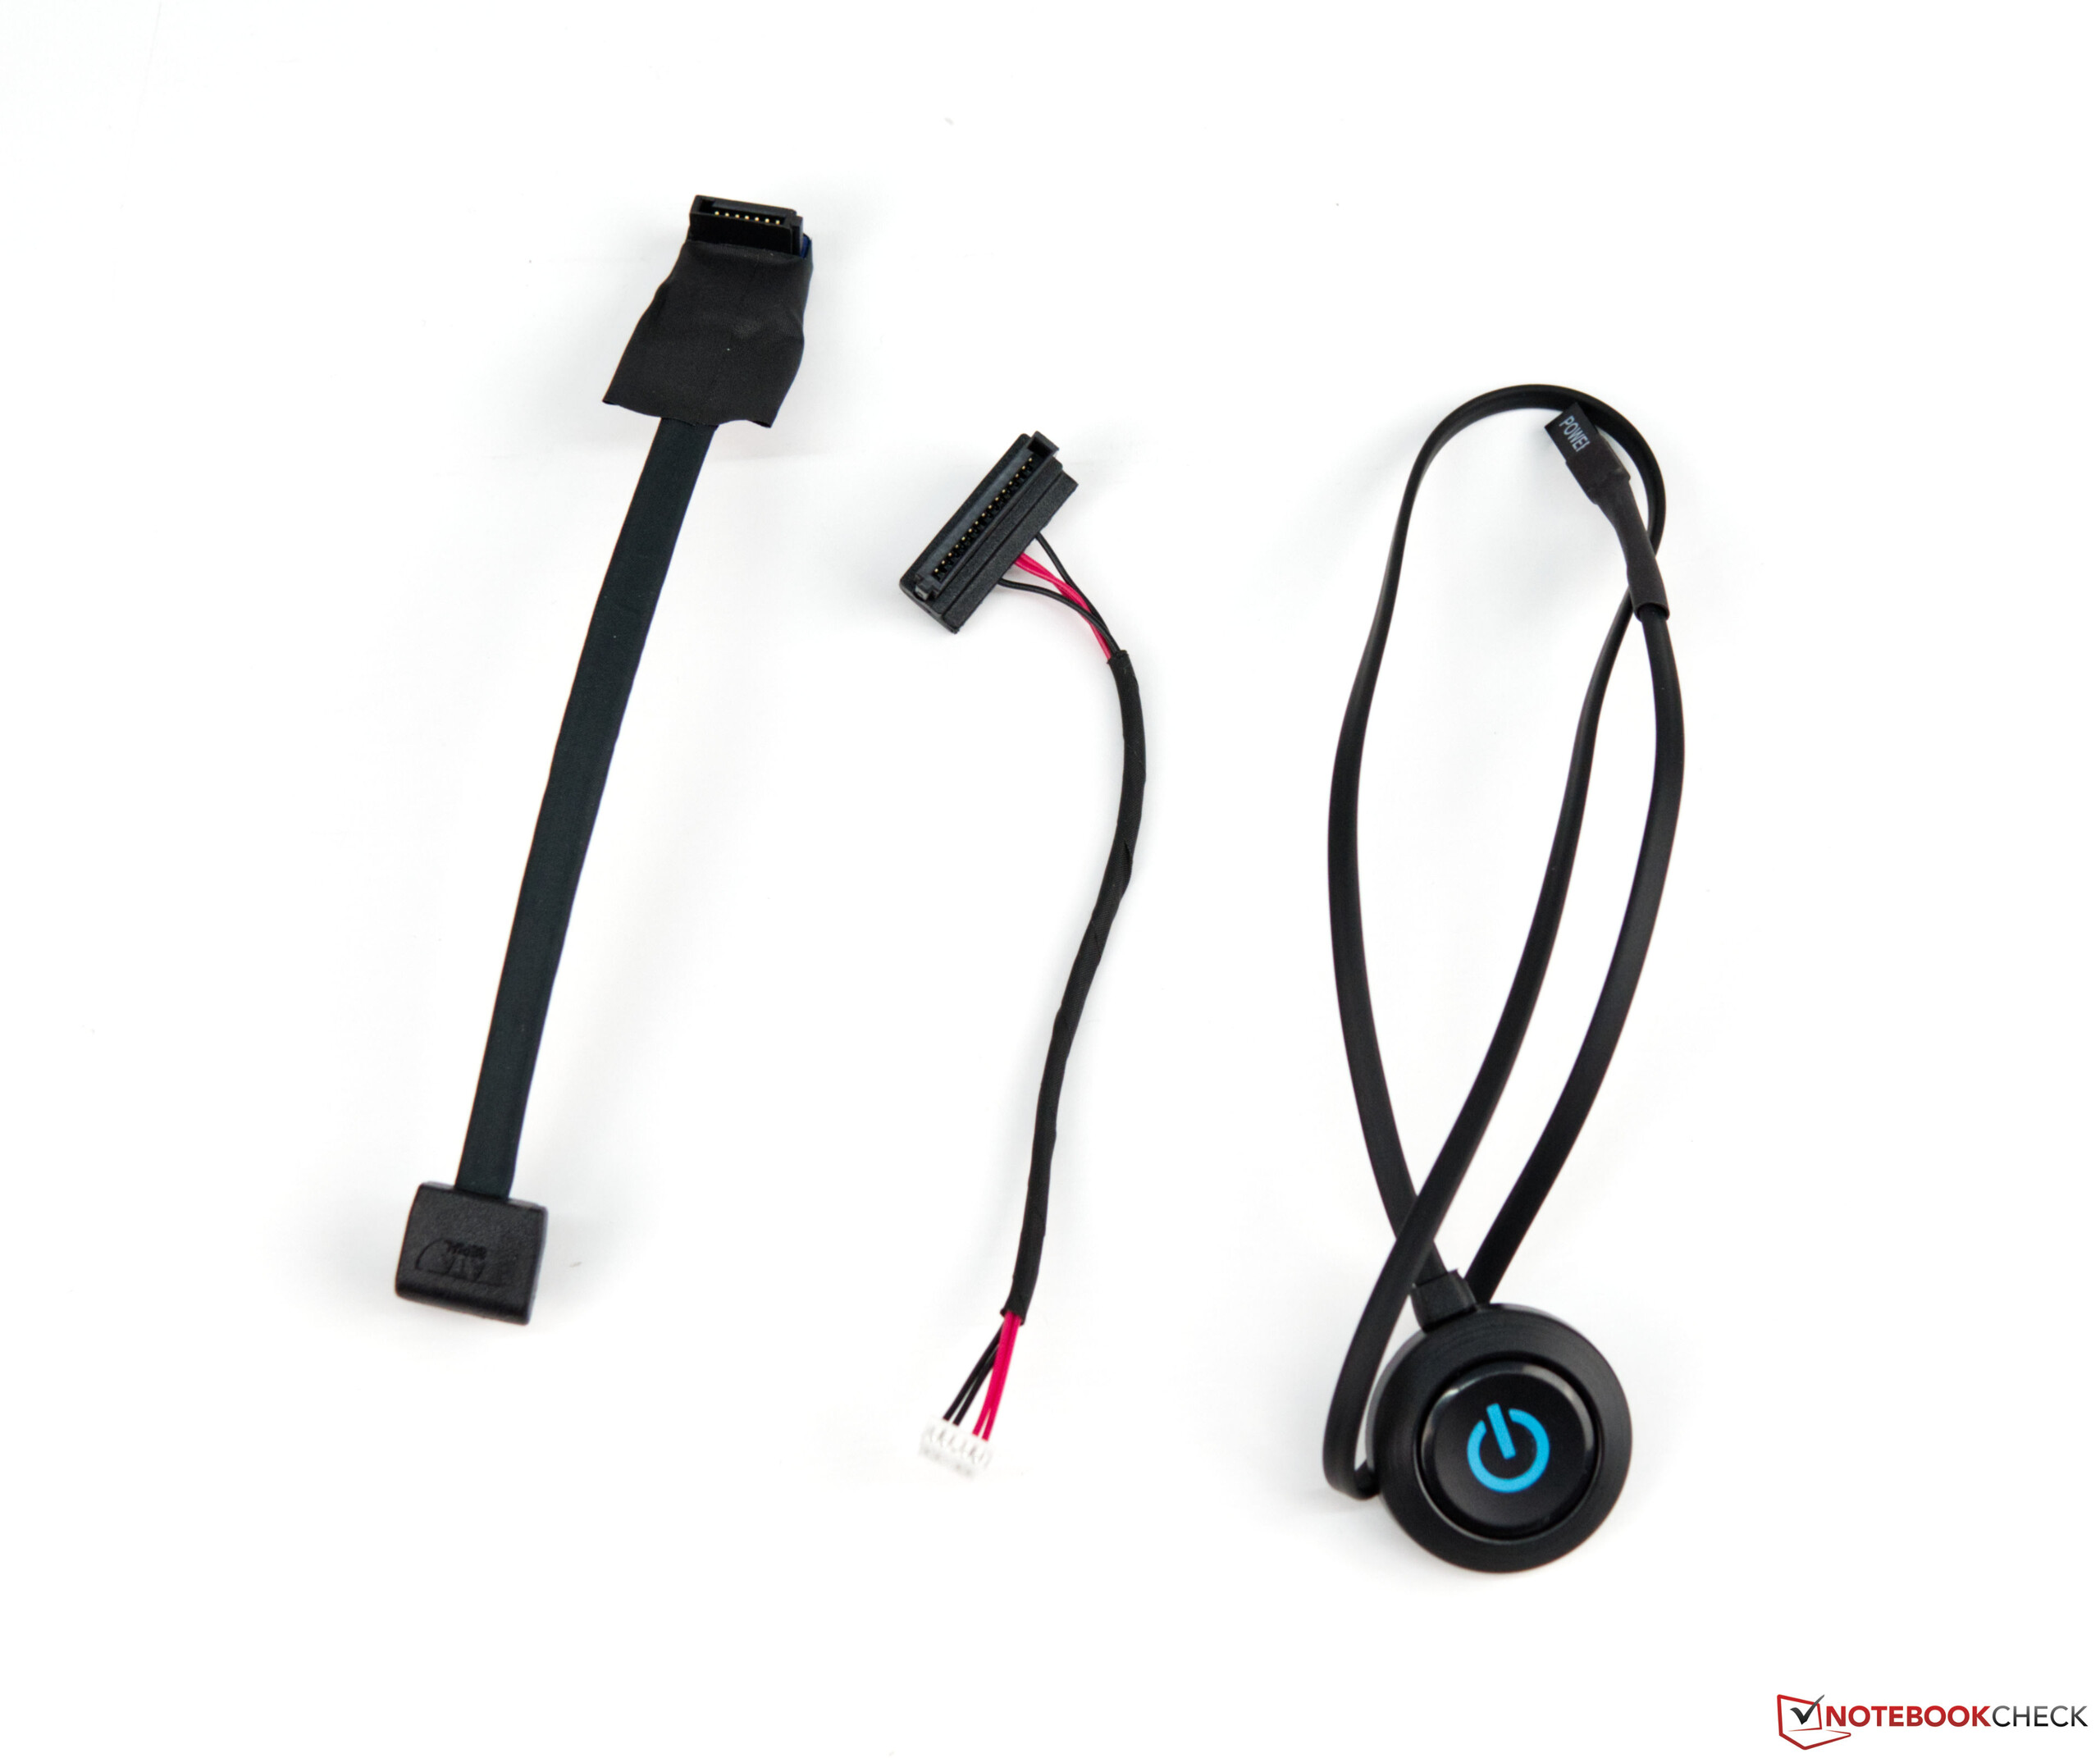
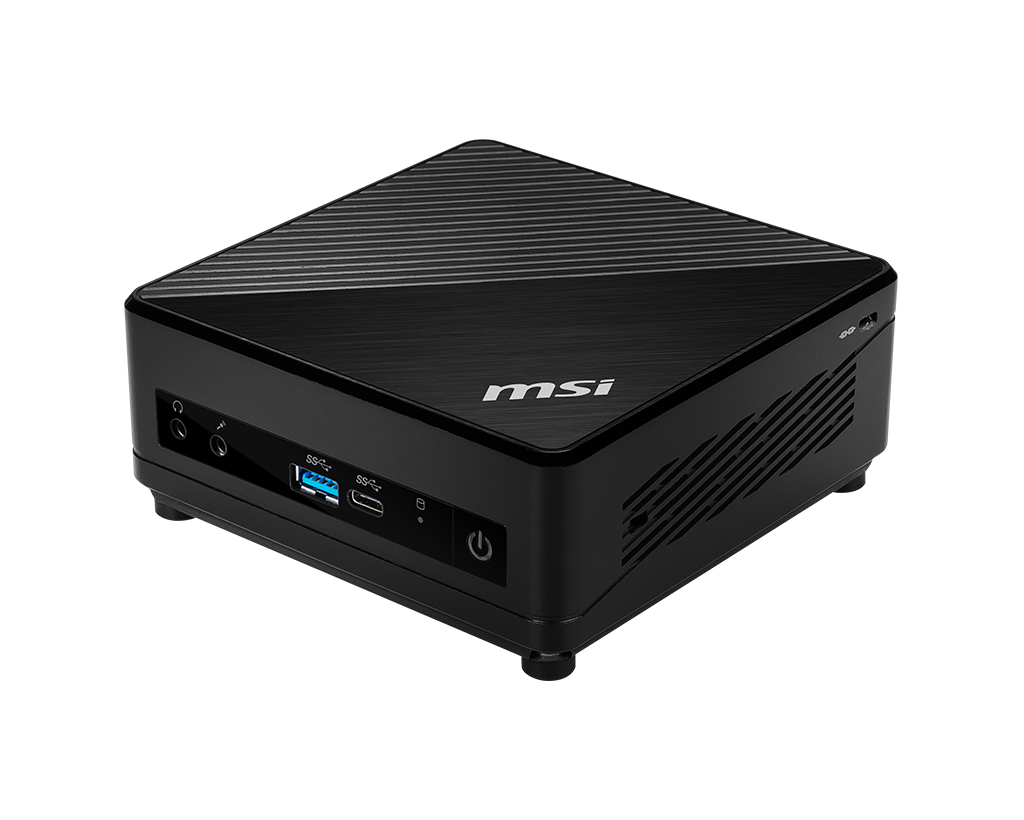
The case features a lot of plastic and metal on the inside for stability. The black case is brightened up with a few accents. Fortunately, piano lacquer surfaces are not used. These quickly get scratched over time and make fingerprints visible very quickly. The case is very robust and offers a maintenance hatch on the underside. You can then quickly access the installed components inside. The device can also be attached directly to a monitor, as long as it has a Vesa mount. An optional button can be attached to switch the device on without any problems.
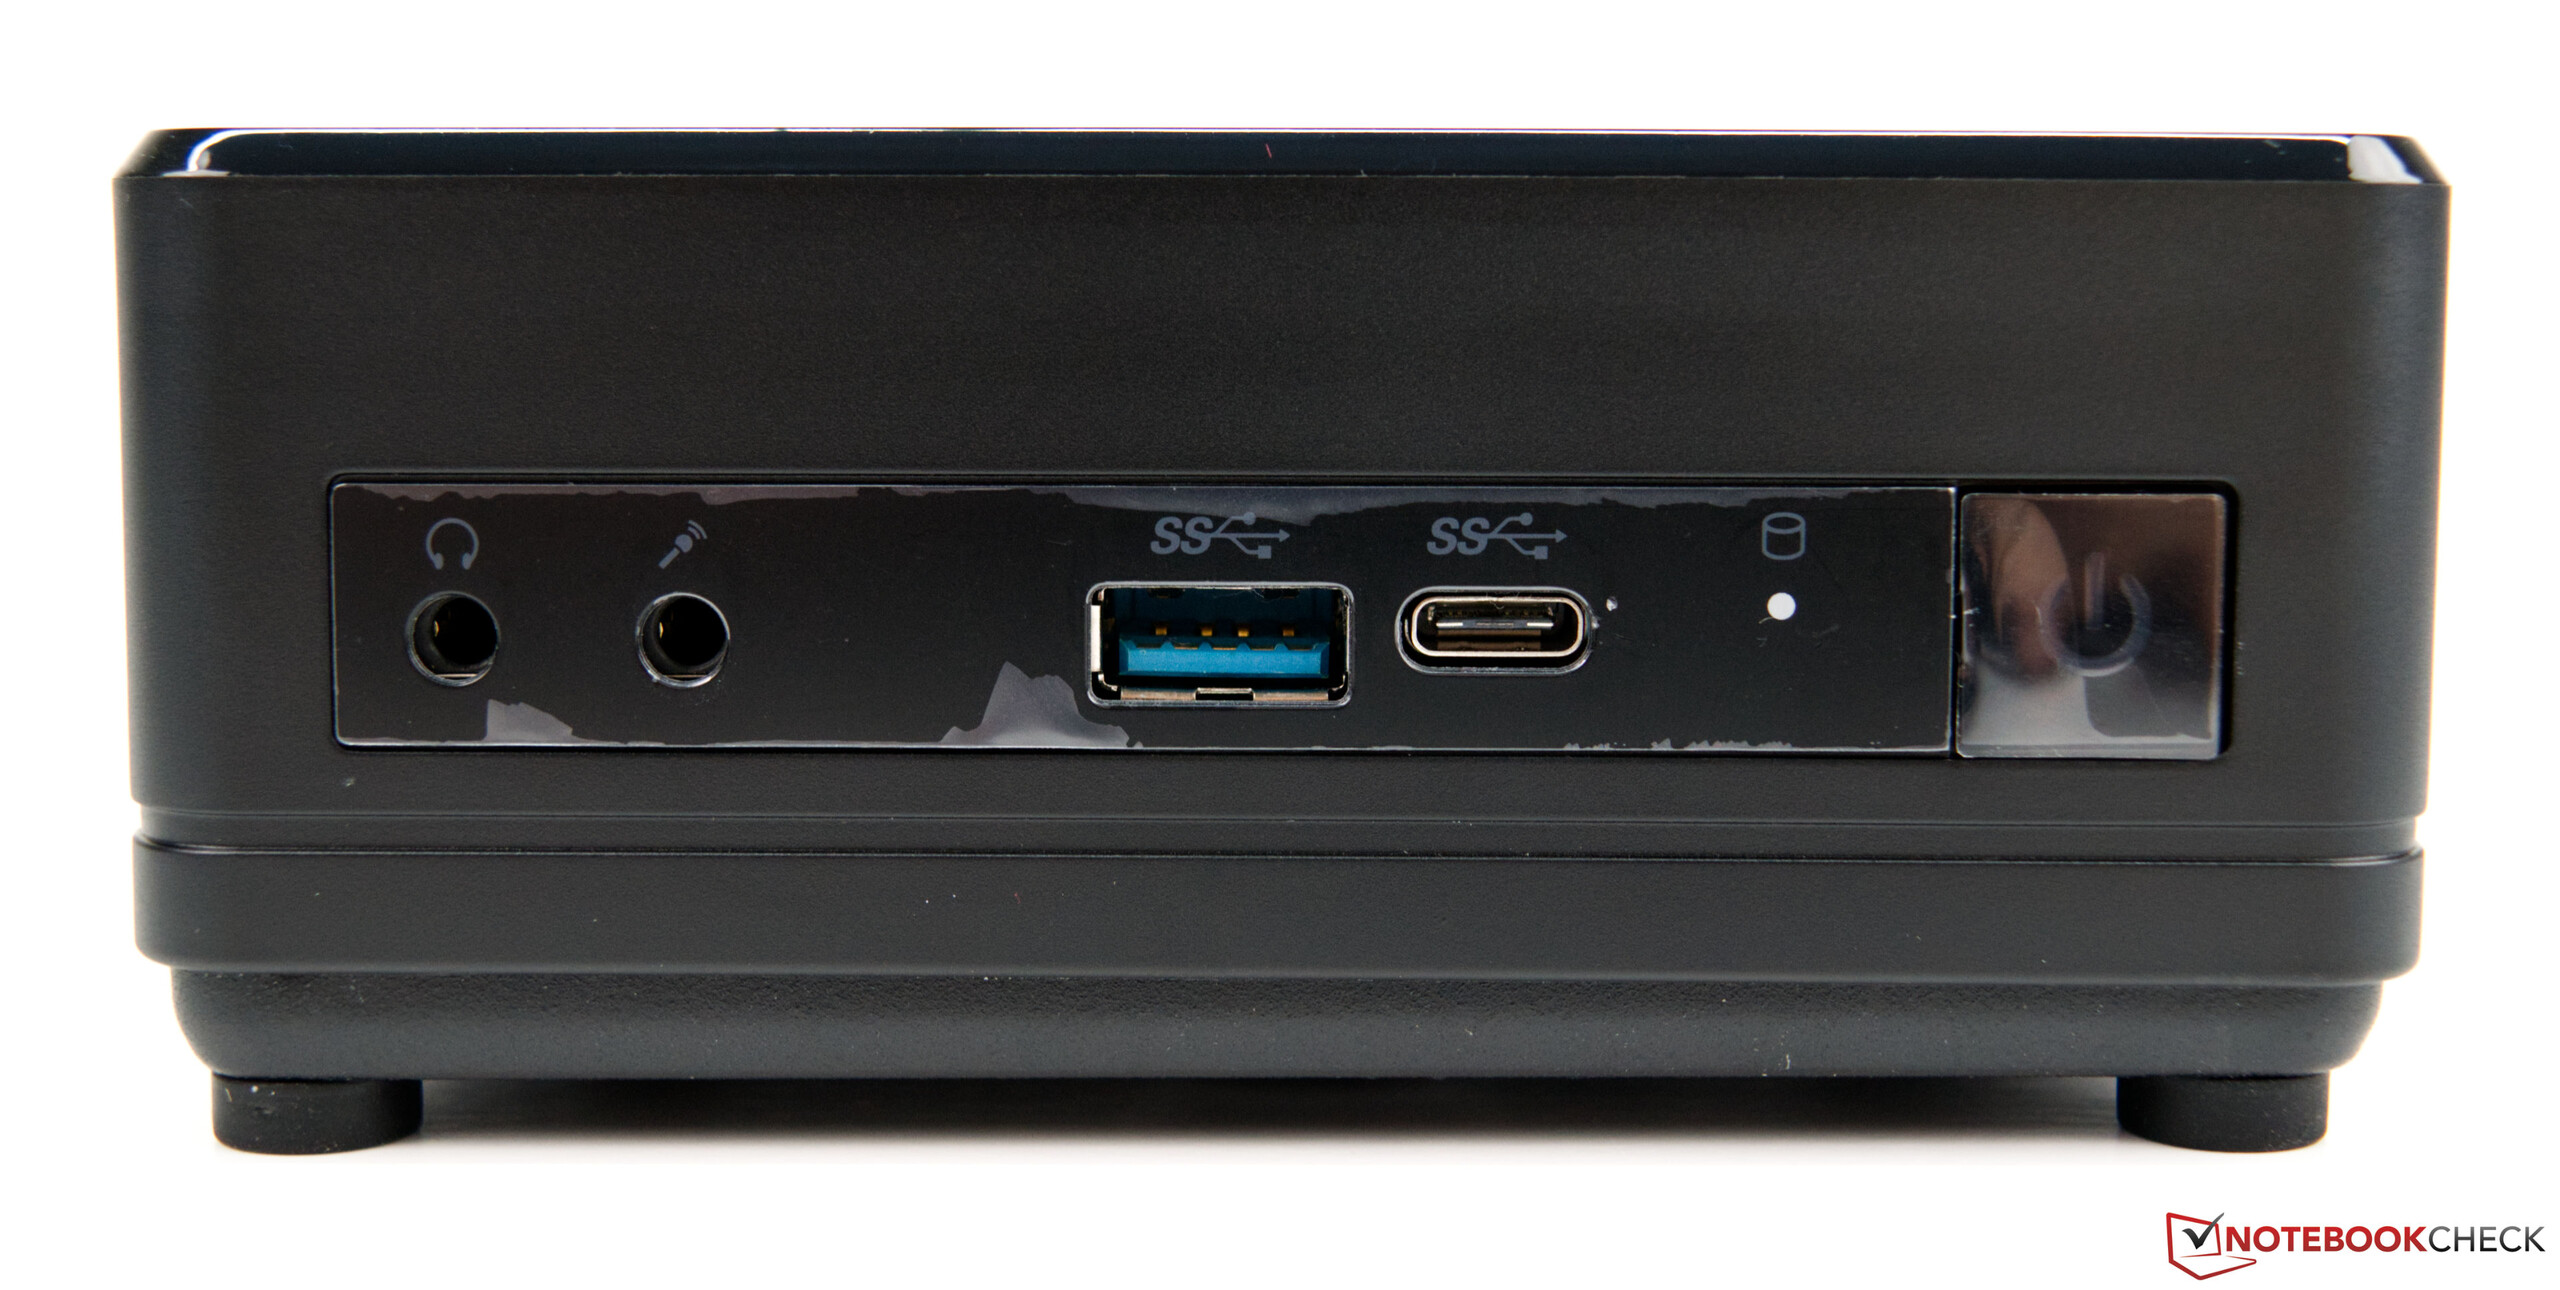
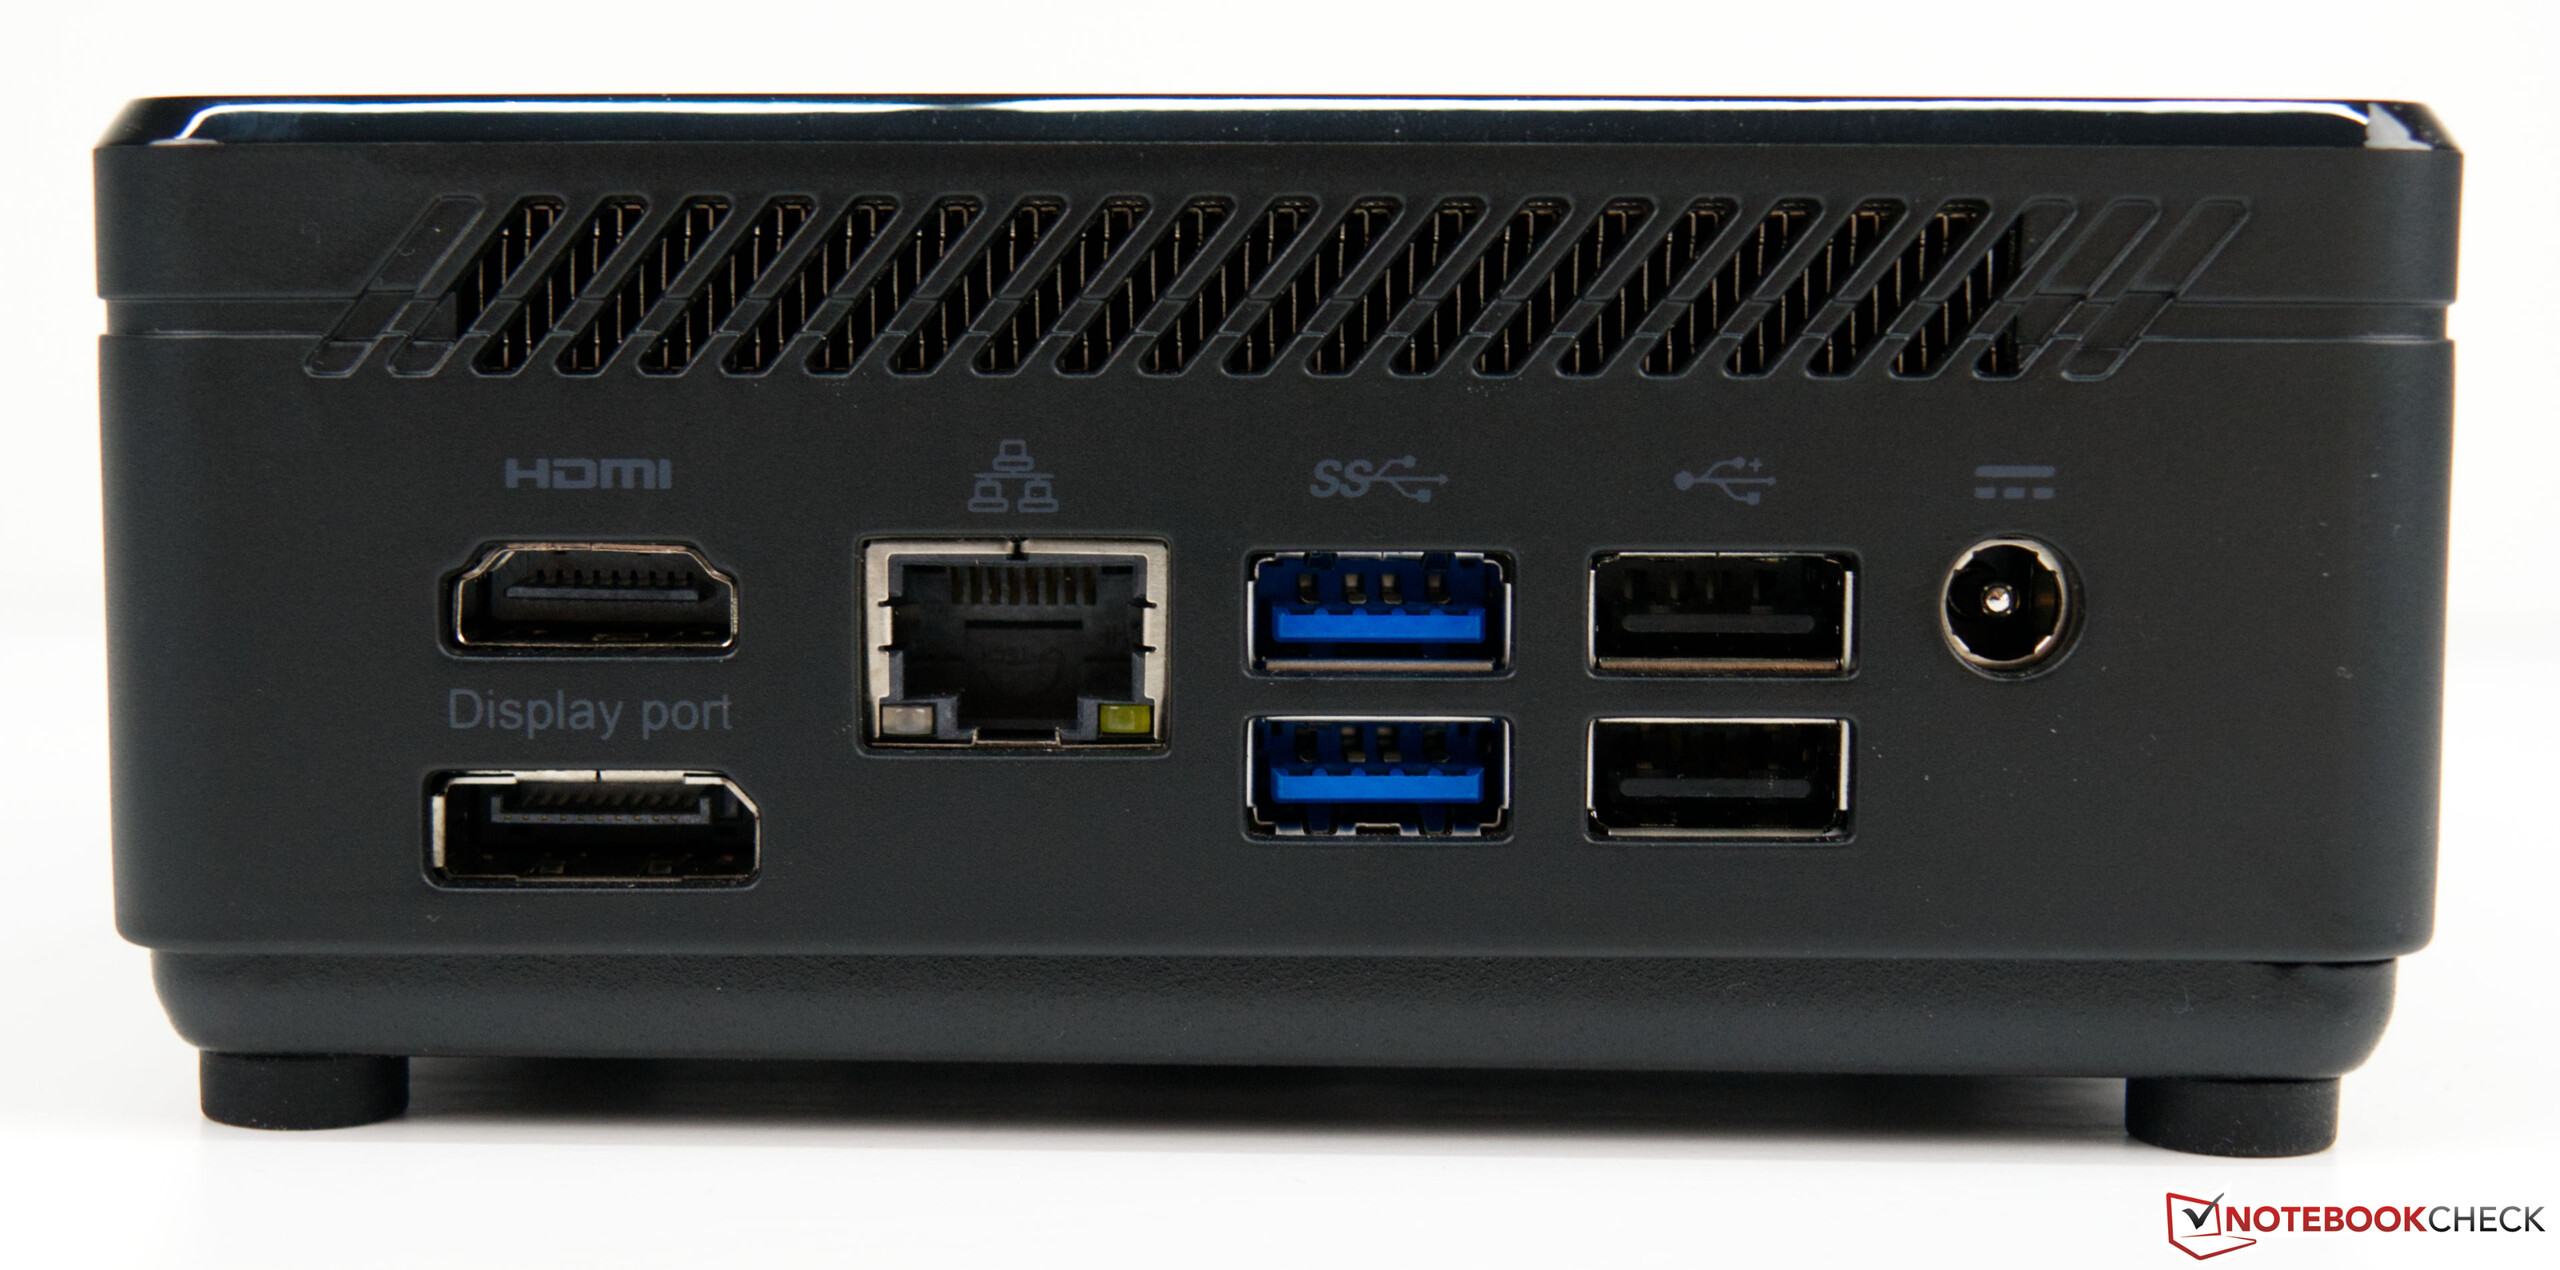
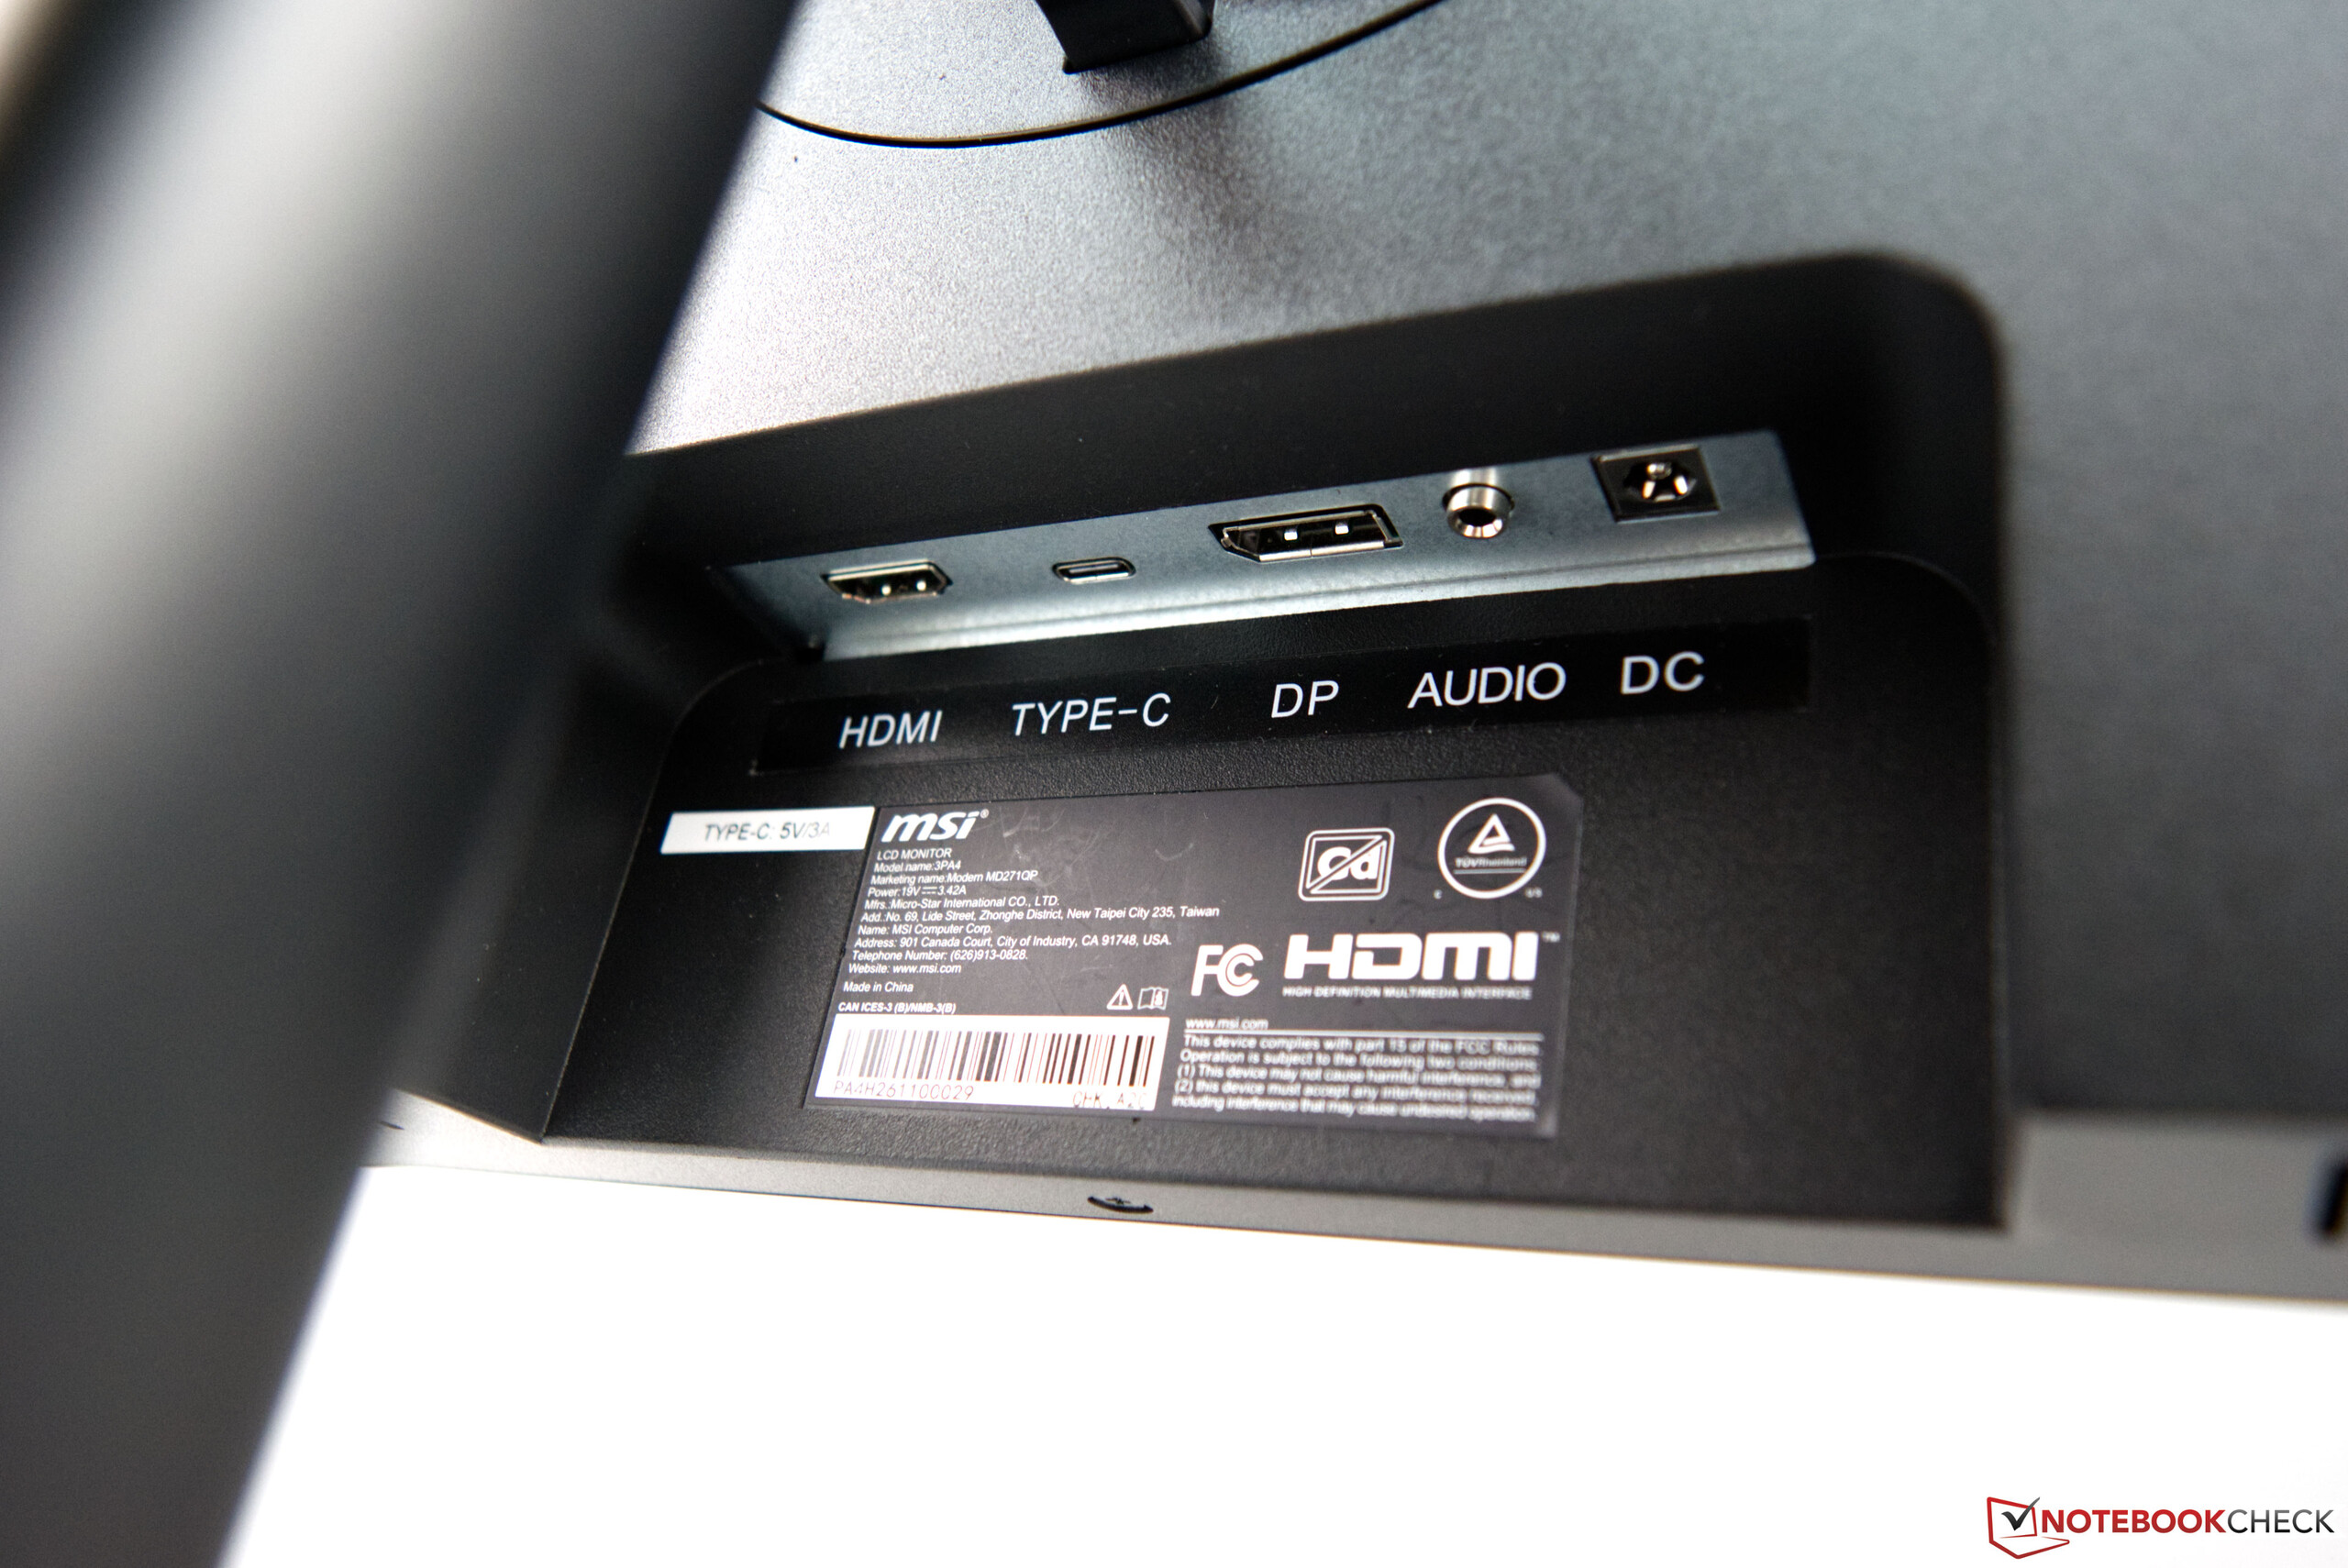
The Cubi 5 10M offers enough options for external devices. A total of five USB-A ports are more than sufficient. Nevertheless, there is also a TypeC port on the front. External screens can be connected via DisplayPort or HDMI.


Performance - Not much room for improvement
The MSI Cubi 5 10M is equipped with the Intel Core i3-10110U which is quite sufficient for simple office applications. The computing power is sufficient for everyday office work and occasional Internet surfing. However, the installed 4 GB DDR4 RAM could quickly reach its limits if you frequently use many browser tabs at the same time. An upgrade to 8 GB is recommended here, which is quickly done with a second module. Most users should be able to cope with the 256 GB SSD. Thanks to NVMe support, the SSD offers fast data transfer rates and the system is quickly ready to boot.
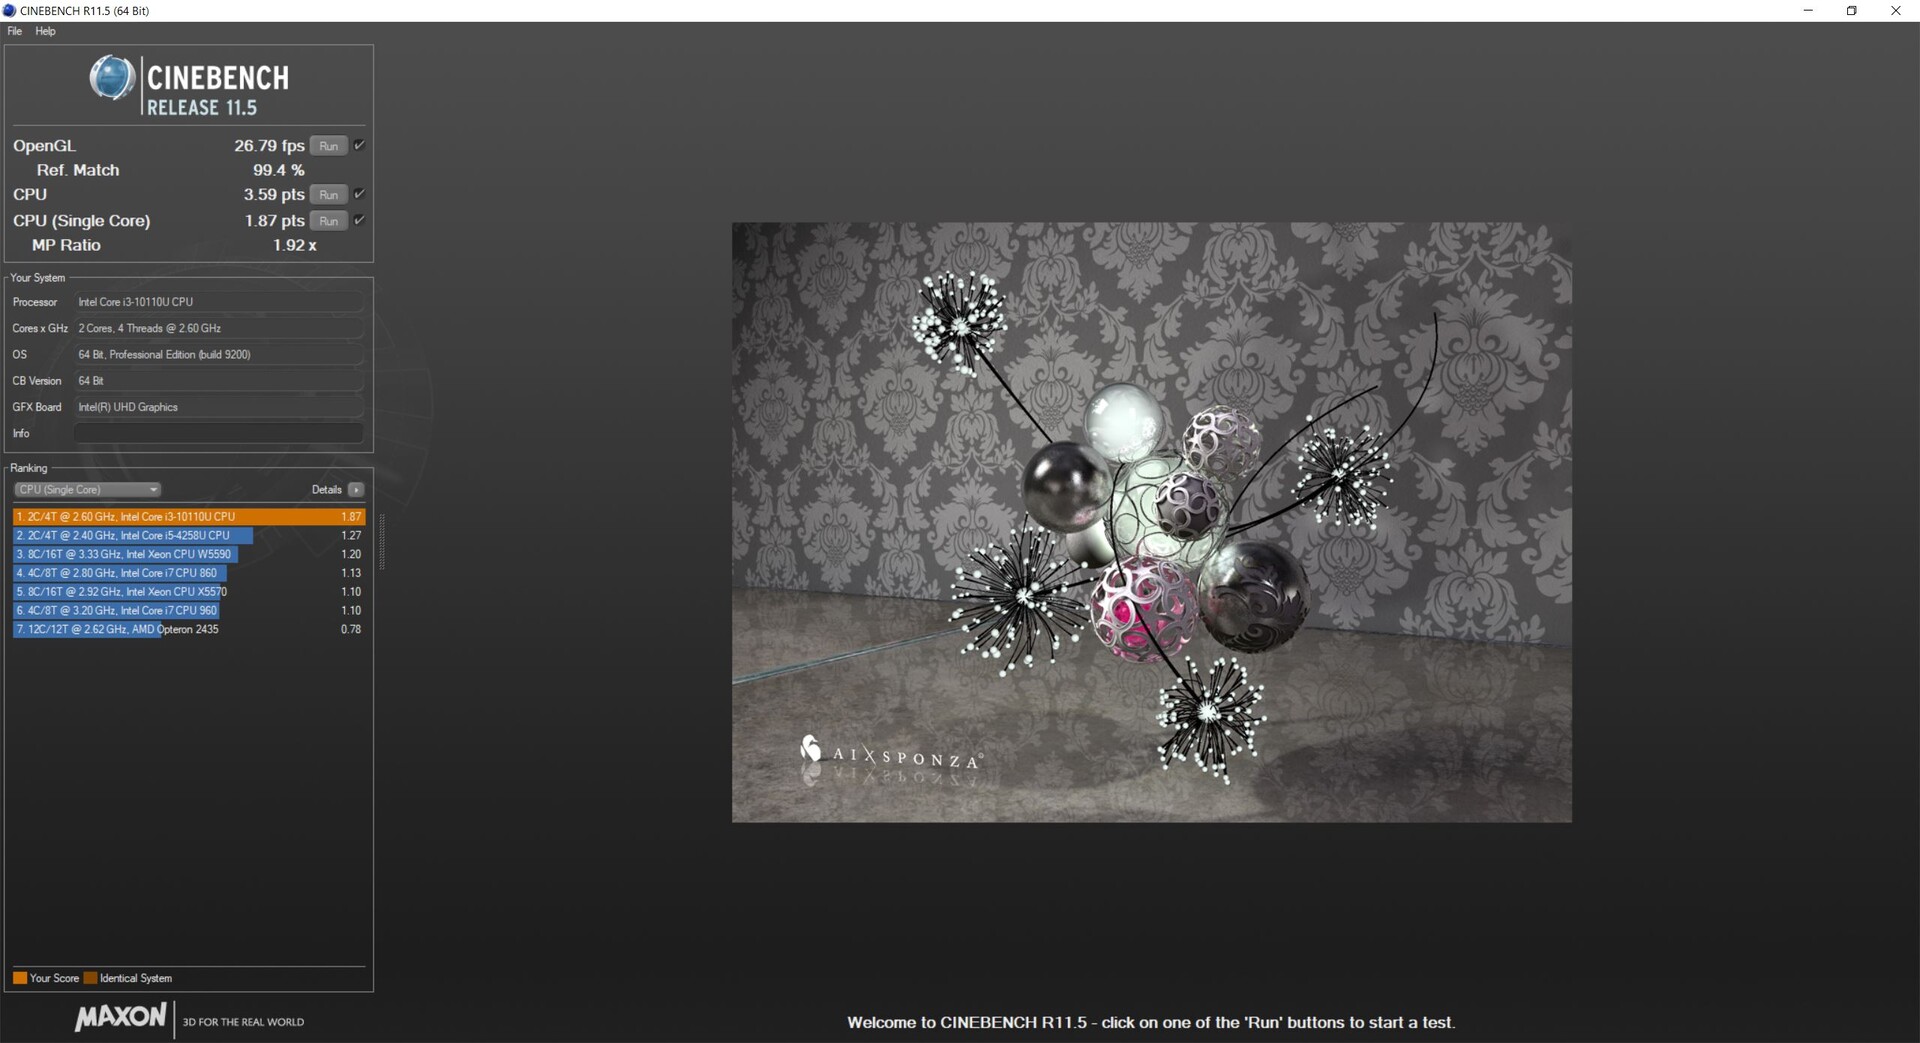
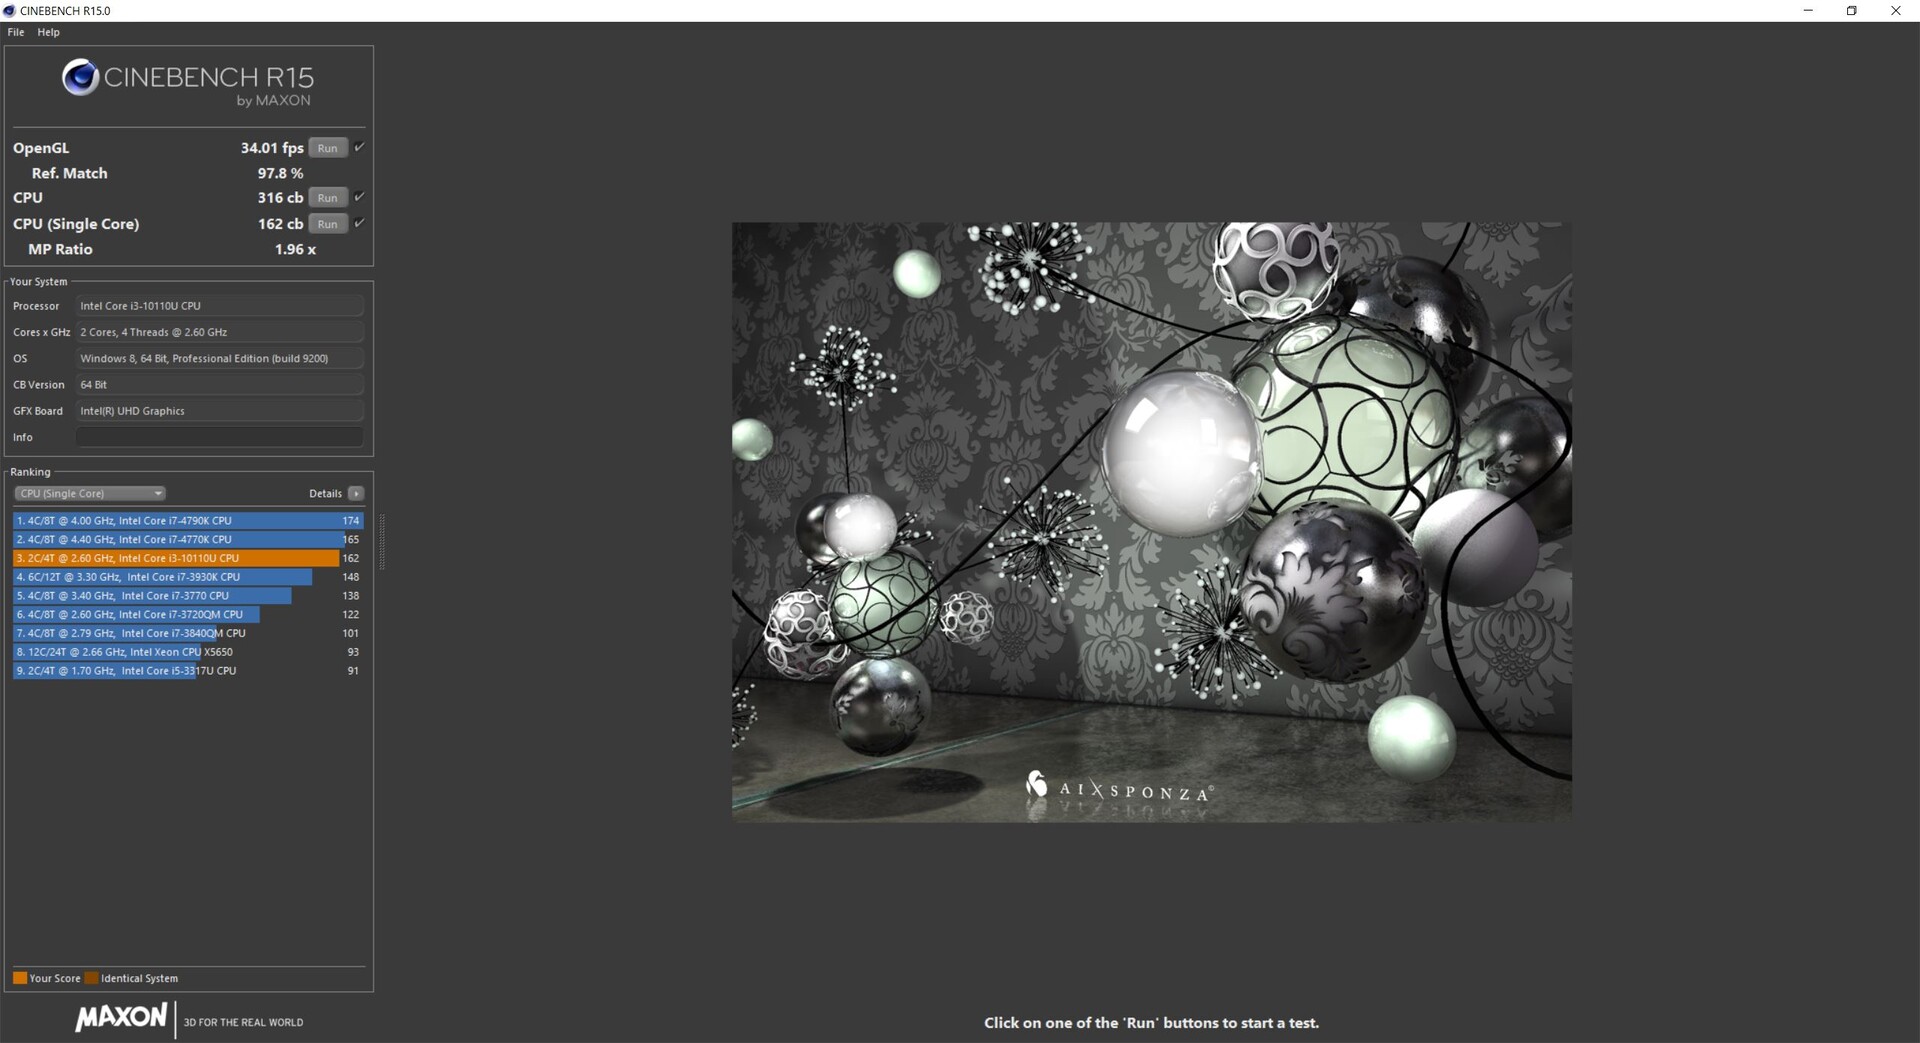
Processor
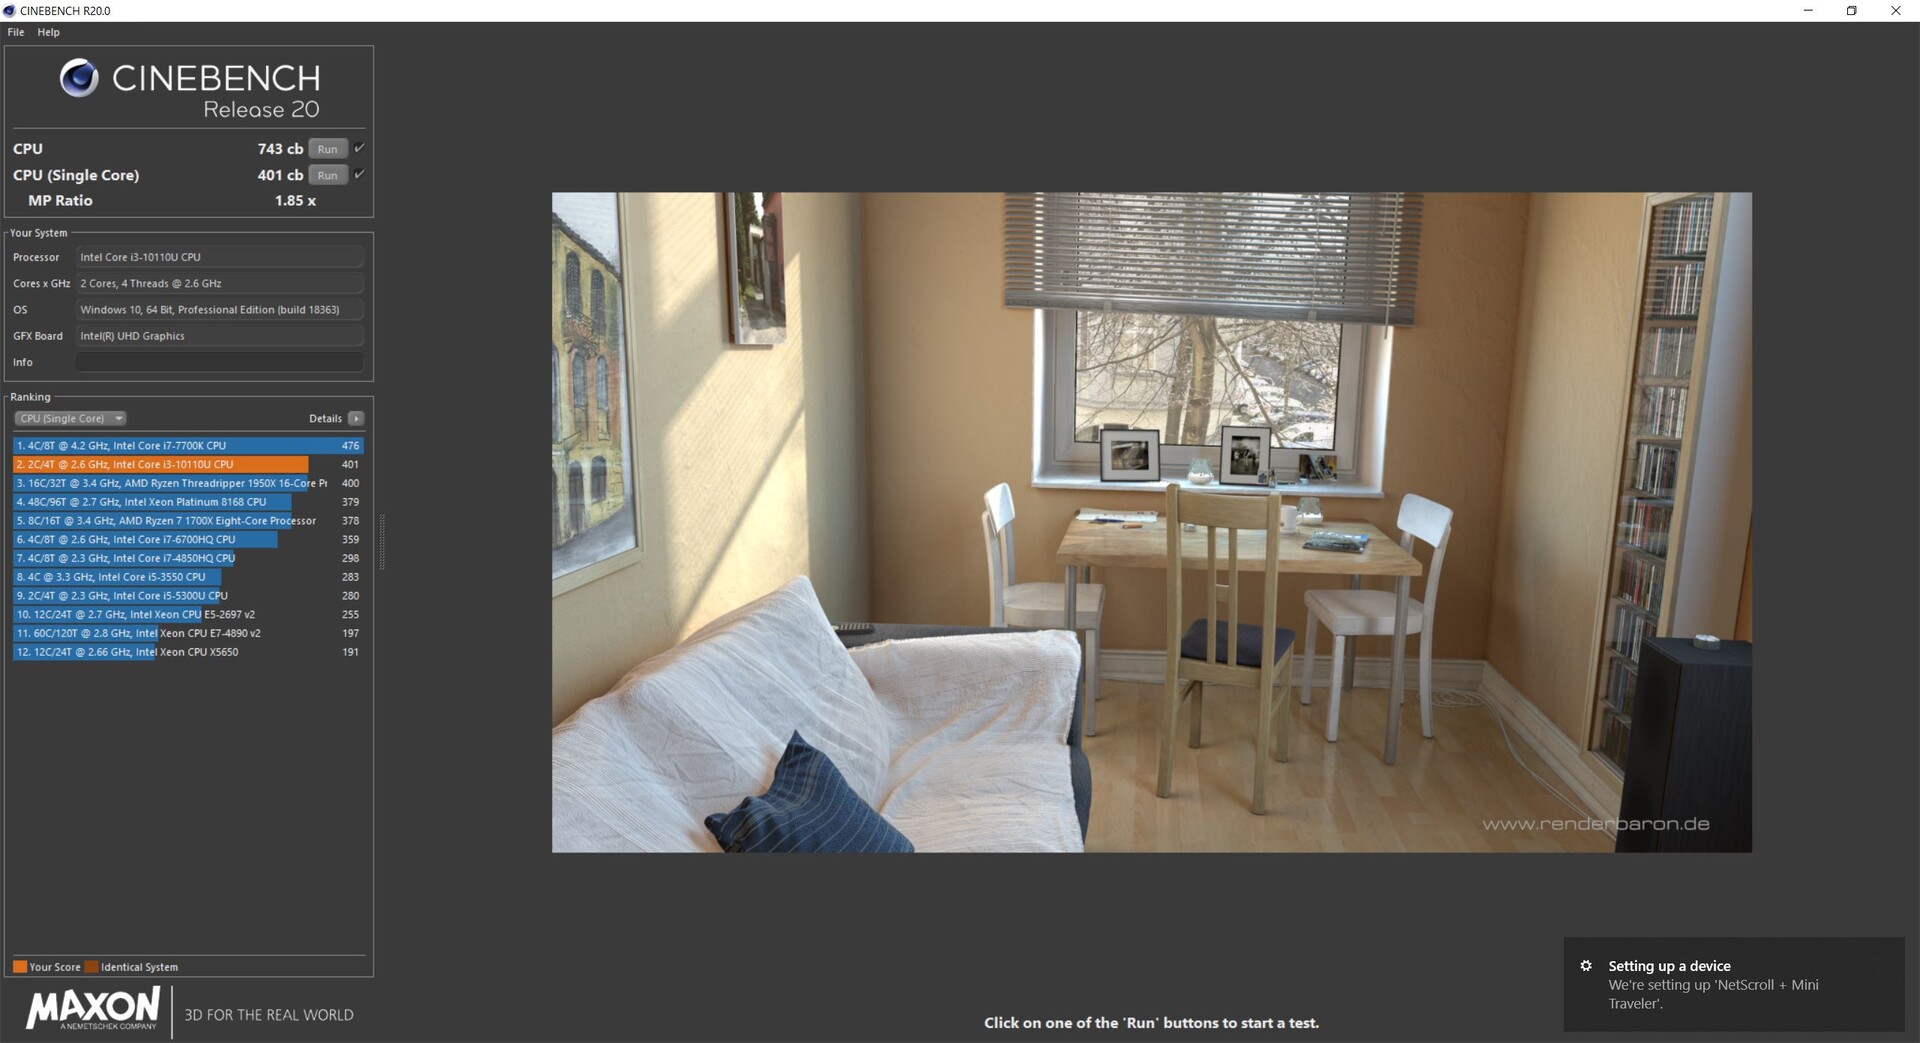
The Intel Core i3-10110U offers two native cores and a total of four threads. The SoC belongs to Intel's Comet Lake series and has a base clock of 2.1 GHz. Depending on the load, the SoC can boost up to 4.1 GHz in Turbo for a short time. As a dual-core processor, the Intel Core i3-10110U only offers a comparatively low performance, which is also reflected in the benchmarks. The gap to the somewhat larger Intel Core i5-10210U is enormous, especially in the multi-core benchmarks. Nevertheless, the performance of the Intel Core i3-10110U in the MSI Cubi 5 10M is about on par with our average rates.
| Blender - v2.79 BMW27 CPU | |
| AC6-M Mini-PC, Intel Celeron J4125 | |
| Average Intel Core i3-10110U (1174 - 1385, n=2) | |
| Intel NUC10i5FNK, Intel Core i5-10210U | |
| Intel NUC10i7FNH, Intel Core i7-10710U | |
* ... smaller is better
Cinebench R15 multi-loop
During the load test with the Cinebench R15 multi-loop, the Cubi 5 10M can keep the Intel Core i3-10110U in check quite well. The cooling system is not overloaded even after sustained load.
System performance
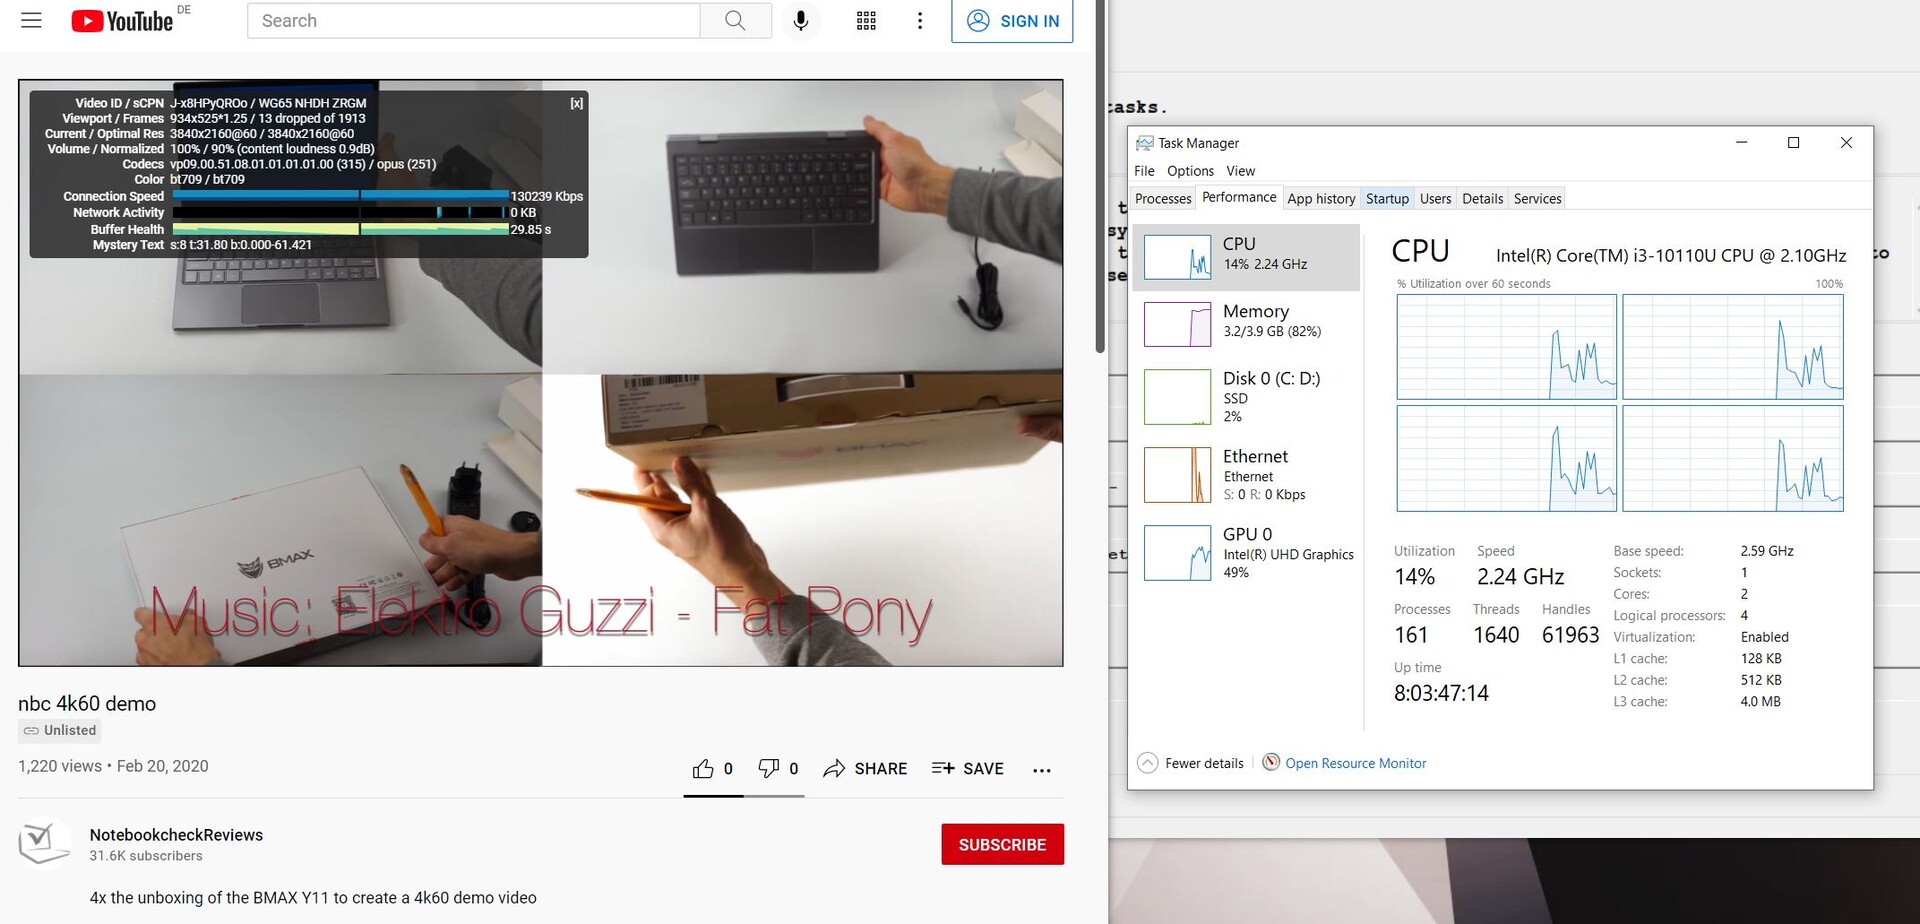
The synthetic benchmarks of the System Performance clearly show the disadvantage of the dual-core CPU. The i3-10110U can no longer keep up with the native 4-cores and has to rank behind them with a clear gap. The gap to the average performance in our database is also striking. We suspect the reason for this to be the tight working memory. The MSI Cubi 5 10M does surprisingly well in the measured latencies under load and during playback of 4K video material. We had assumed significantly higher latencies here. The Cubi 5 10M clearly wins the comparison with the Intel NUCs. However, playing high-resolution video material demands a lot of performance from the mini-PC. The SoC should be given a few seconds to buffer. After that, smooth playback is possible.
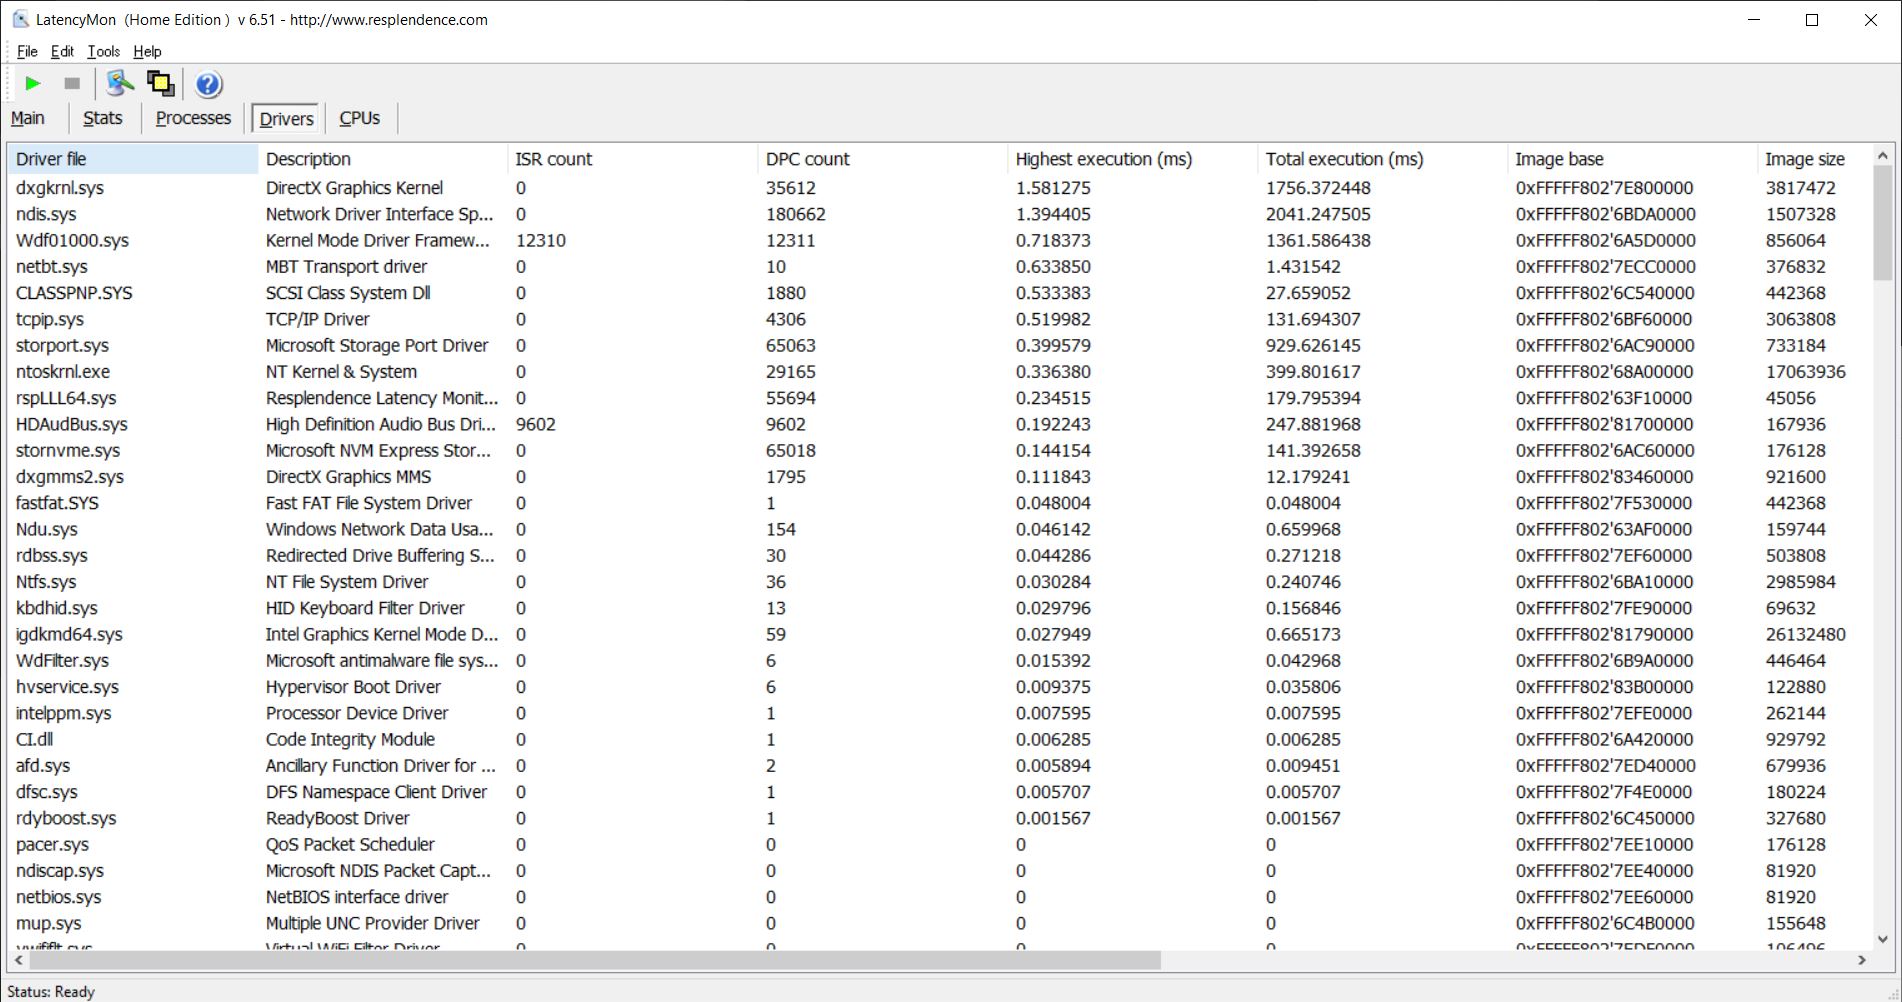
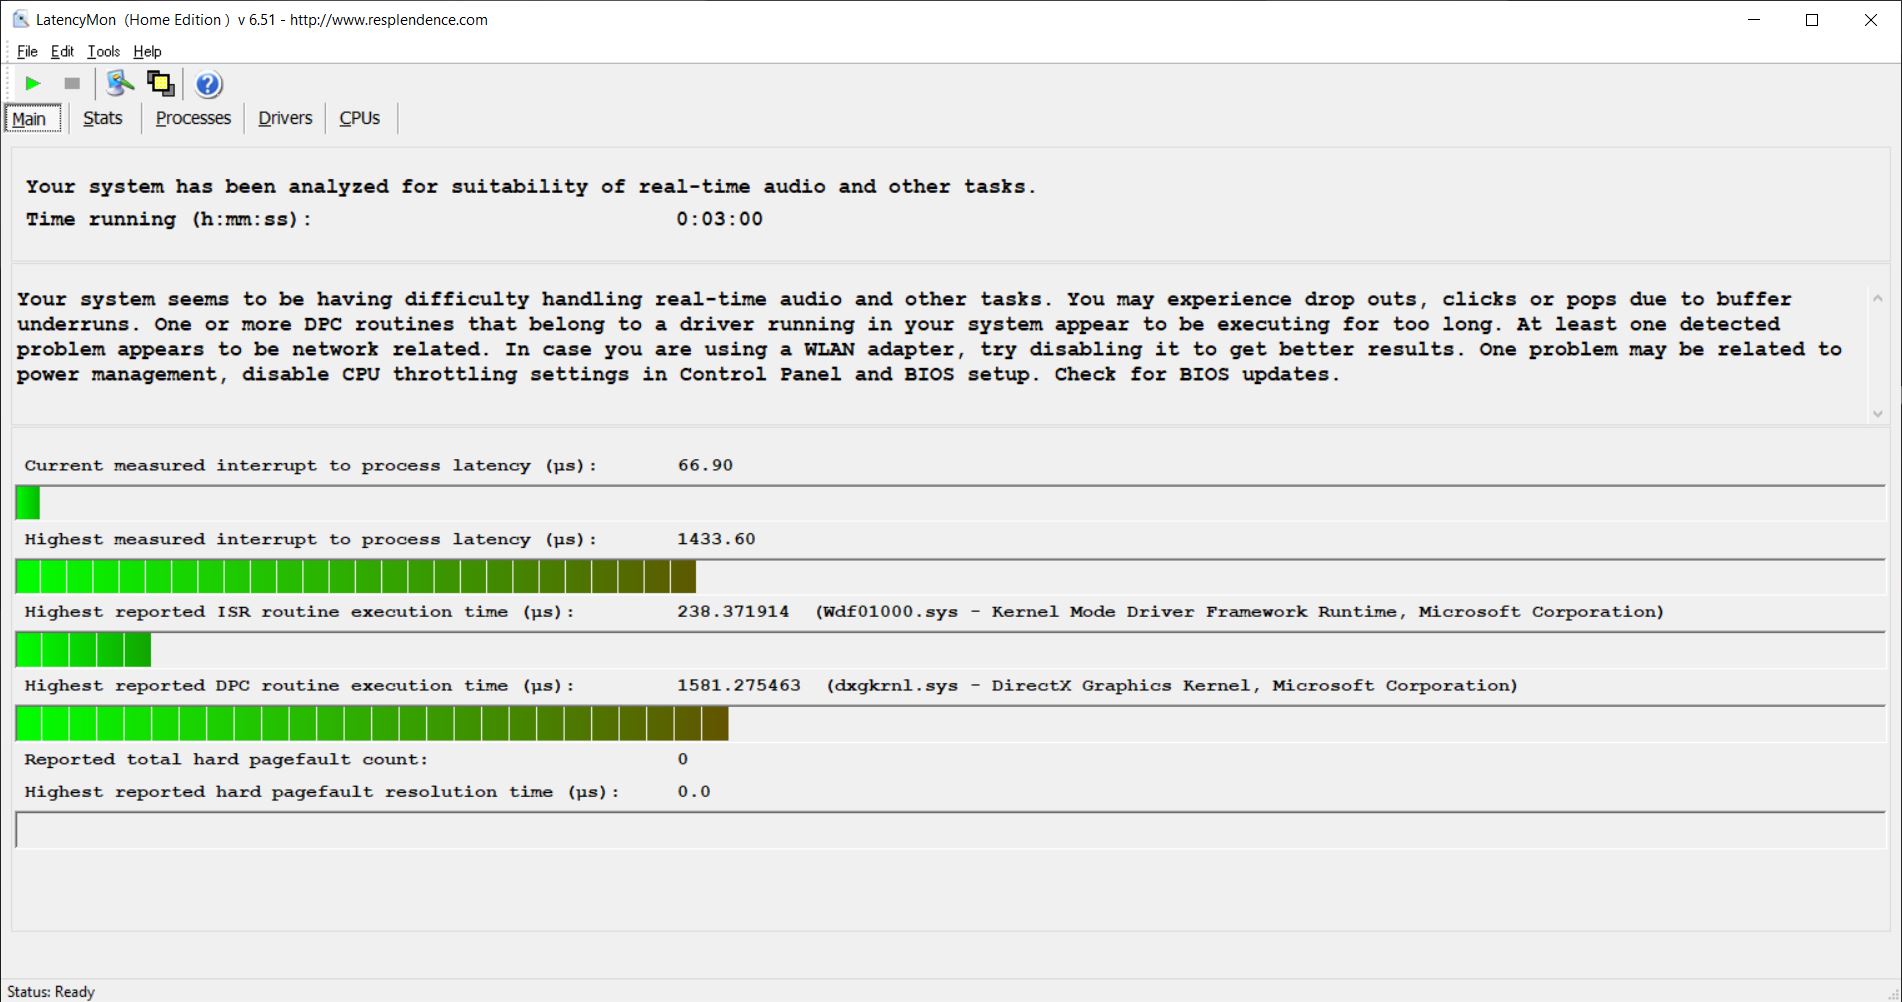
| DPC Latencies / LatencyMon - interrupt to process latency (max), Web, Youtube, Prime95 | |
| AC6-M Mini-PC, Intel Celeron J4125 | |
| Average Intel Core i3-10110U (1581 - 5347, n=3) | |
| MSI Cubi 5 10M, Intel Core i3-10110U | |
* ... smaller is better
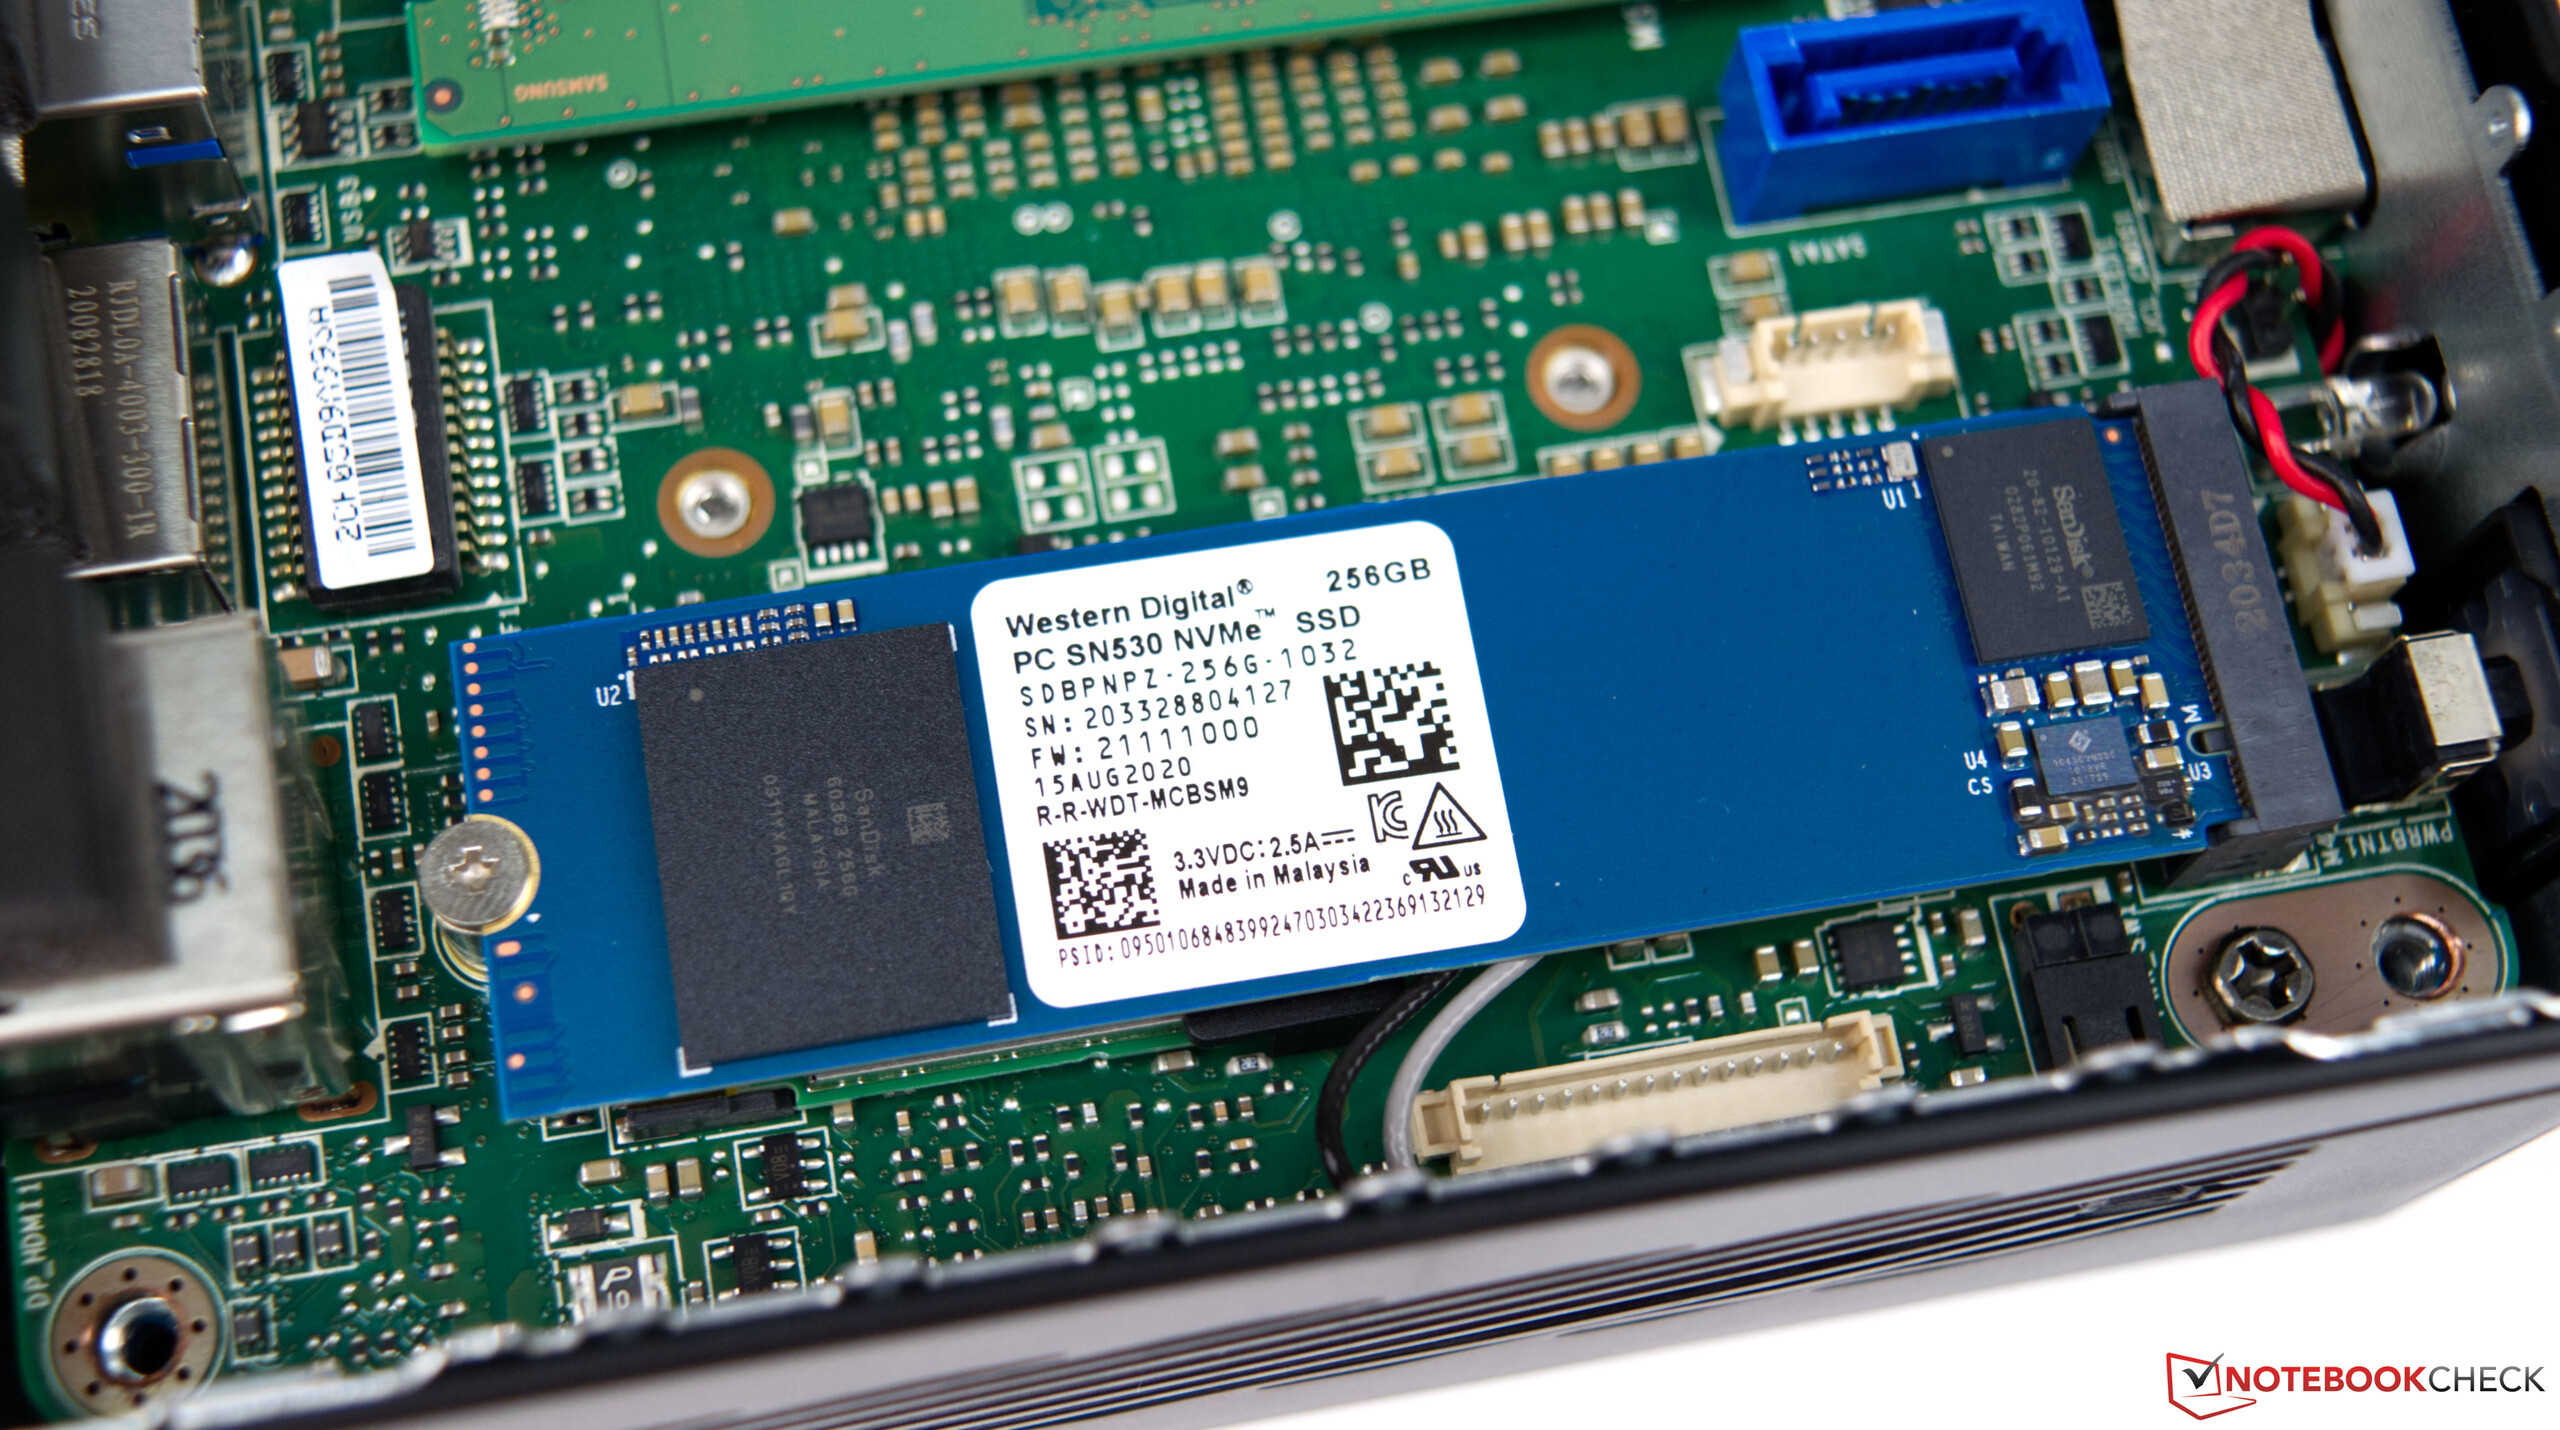
Mass storage
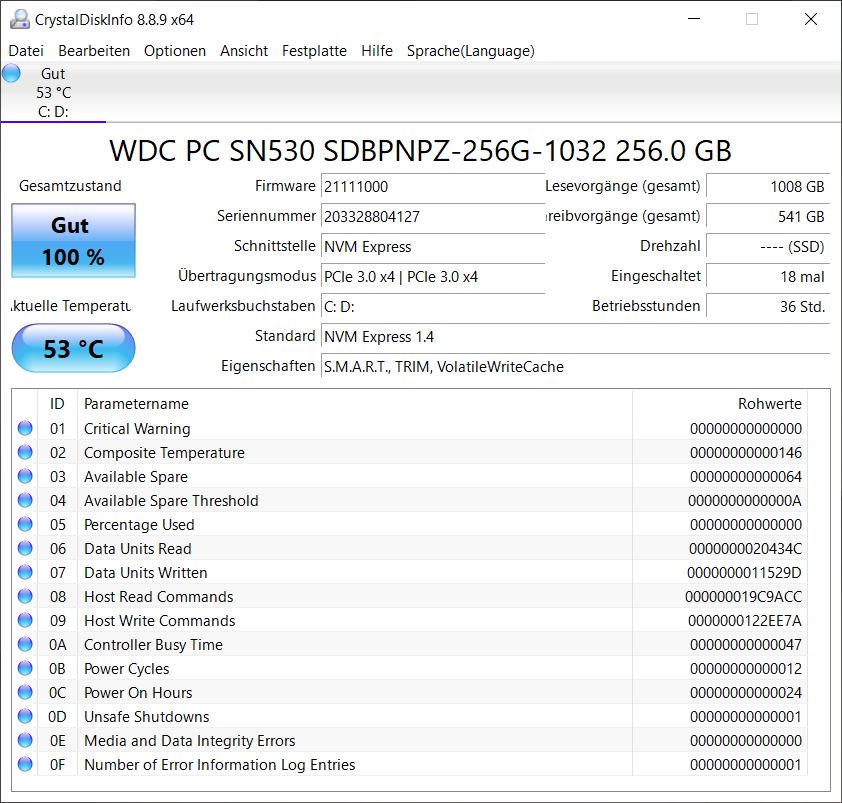
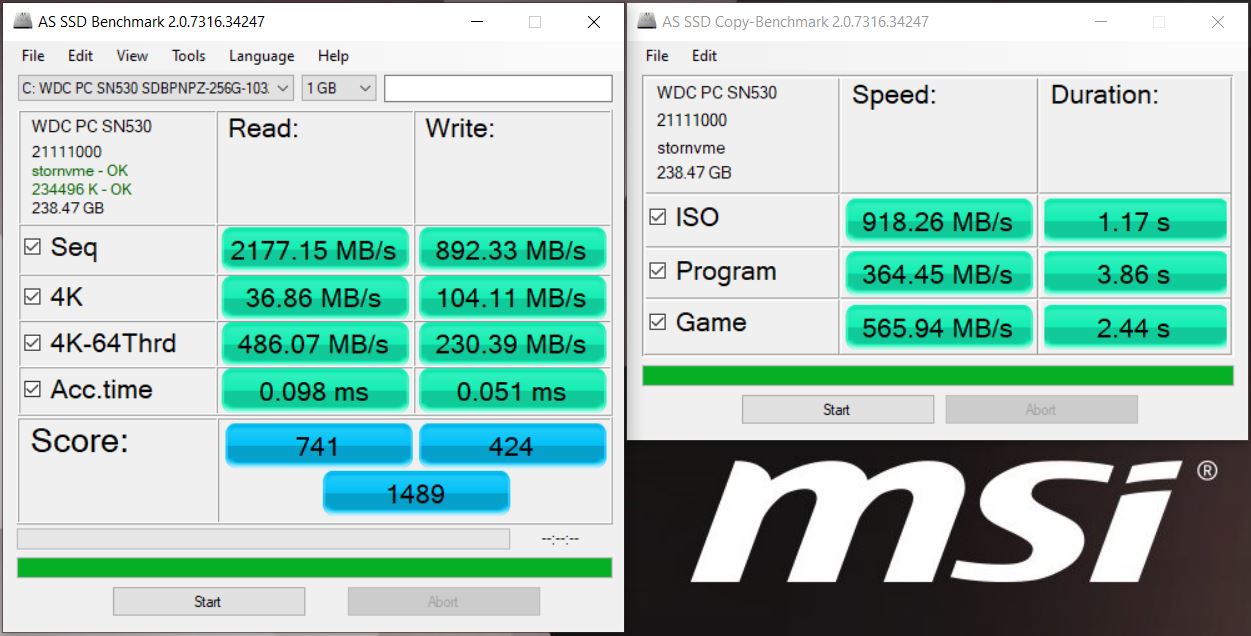
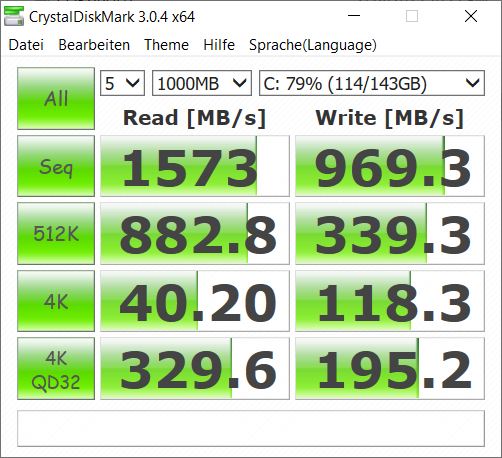
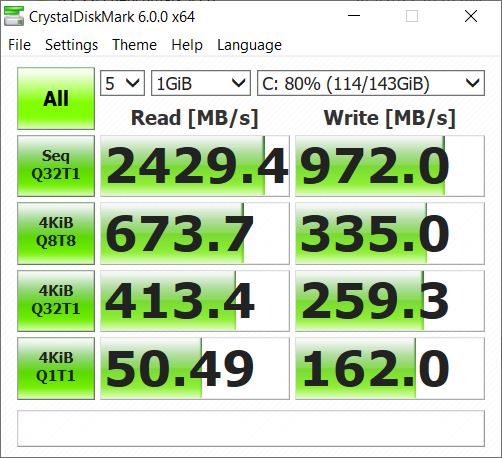
Our test system is equipped with a 256 GB SSD. This also contains the operating system, which means the user has almost 220 GB available. The SSD used is a fast NVMe SSD in M.2-2280 format from Western Digital. In the test, the SSD impressed with very good read rates, although the write rates could have been a bit better. The bottom line is that the performance is more than sufficient for a simple office PC. A second data medium in 2.5-inch format can still be stored in the case. All necessary connection cables are included in the scope of delivery.

Graphics card
The Intel UHD Graphics 620 is well known. However, the Intel Core i3-10110U only offers 23 of the 24 EUs, which can also be seen in the performance. Furthermore, our test sample only works with one RAM module, which means additional performance is lost. A second RAM module can still provide a small performance boost. Nevertheless, no miracles should be expected. However, the MSI Cube 5 10M is not suitable for gaming. Only very simple casual games can be expected from the office slave.
More benchmarks for the Intel UHD Graphics 620 can be found here.
| 3DMark 11 Performance | 1395 points | |
| 3DMark Ice Storm Standard Score | 39769 points | |
| 3DMark Cloud Gate Standard Score | 5358 points | |
| 3DMark Fire Strike Score | 725 points | |
| 3DMark Fire Strike Extreme Score | 342 points | |
| 3DMark Time Spy Score | 708 points | |
Help | ||
Emissions & Energy
Temperature
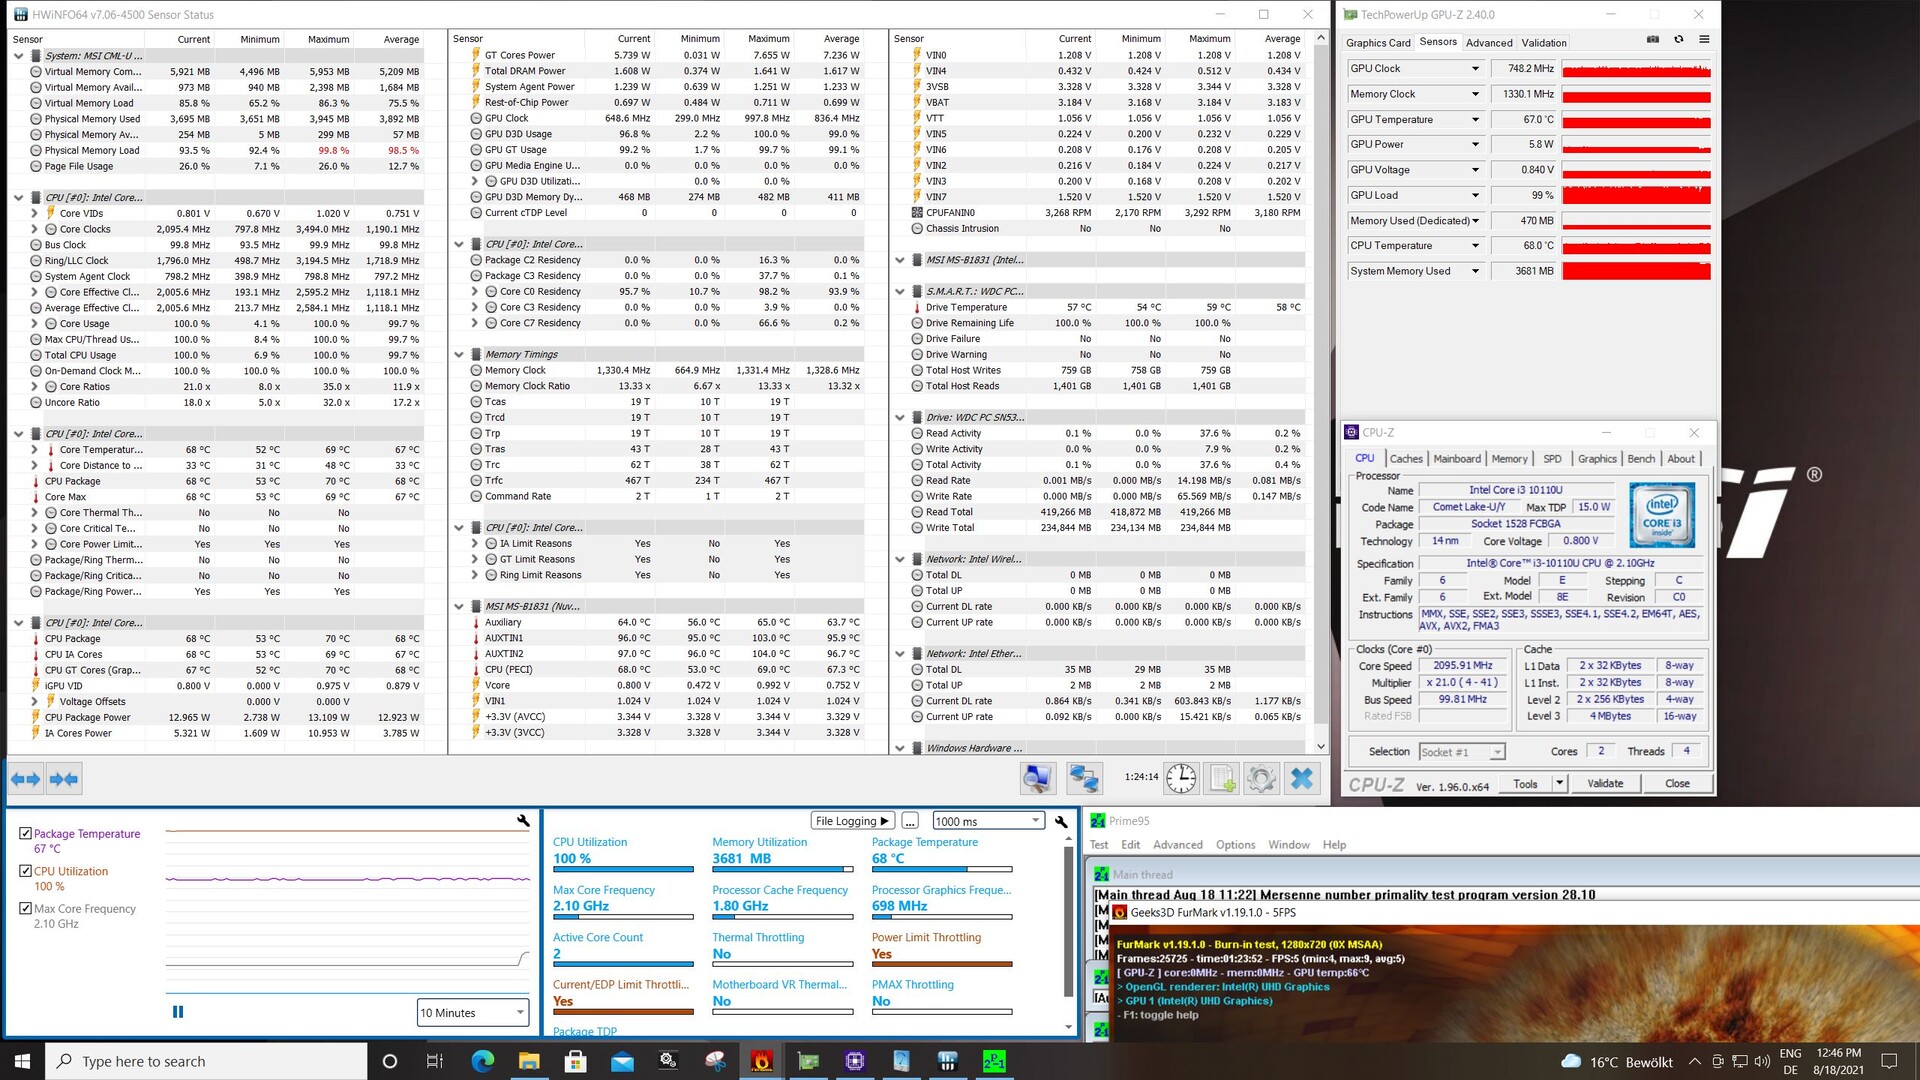
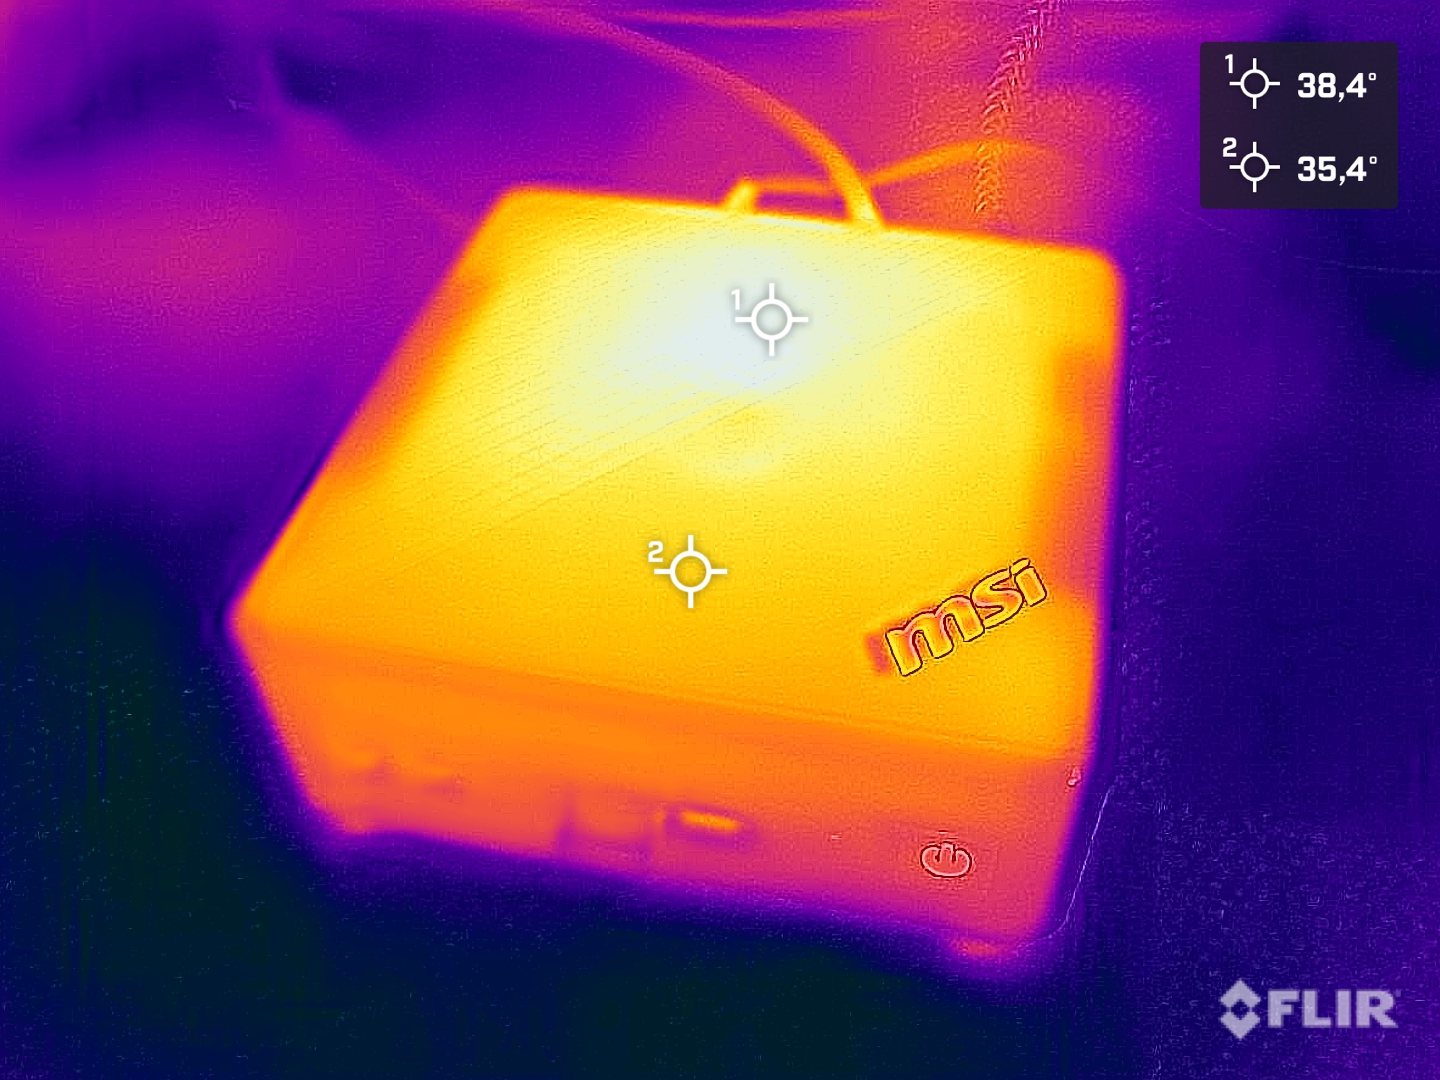
First of all, we can state that the Cubi 5 10M does not have any temperature problems with the installed hardware. The case only heats up slightly under load. The SoC does not get very hot with a maximum of 68 °C (154.4 °F) in the stress test with Prime95 and FurMark. The power limit rather applies here, which slows down the SoC a bit. The base clock of 1.1 GHz cannot be maintained when the CPU and iGPU are loaded simultaneously. As is known, this is 2.1 GHz in the Core i3-10110U. The stress test did not have a sustainable impact on the performance. The result of the 3DMark11 benchmark is on the same level compared to the cold start. We could already determine this in the Cinebench R15 multi-loop. Here, too, the CPU performance remained almost the same in all 50 runs.


Noise emissions
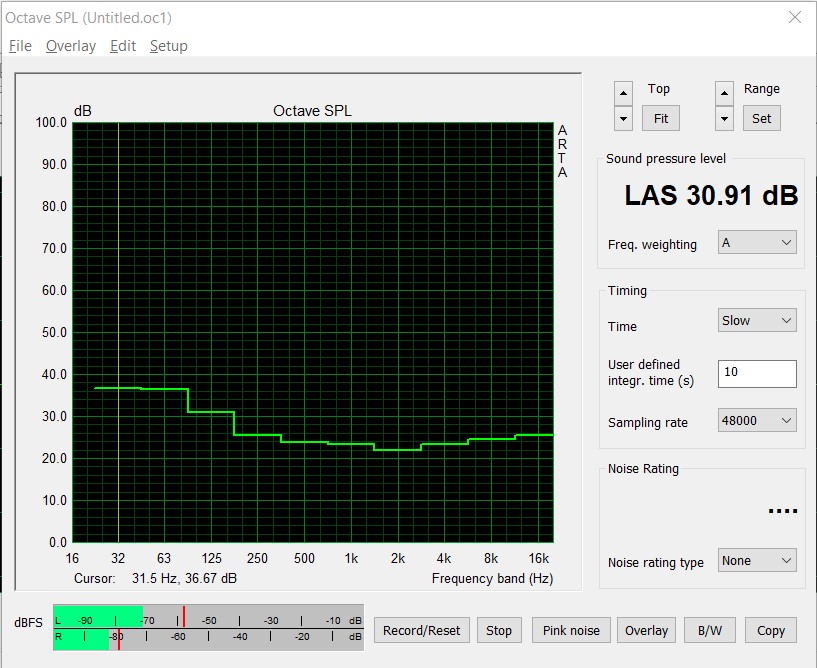
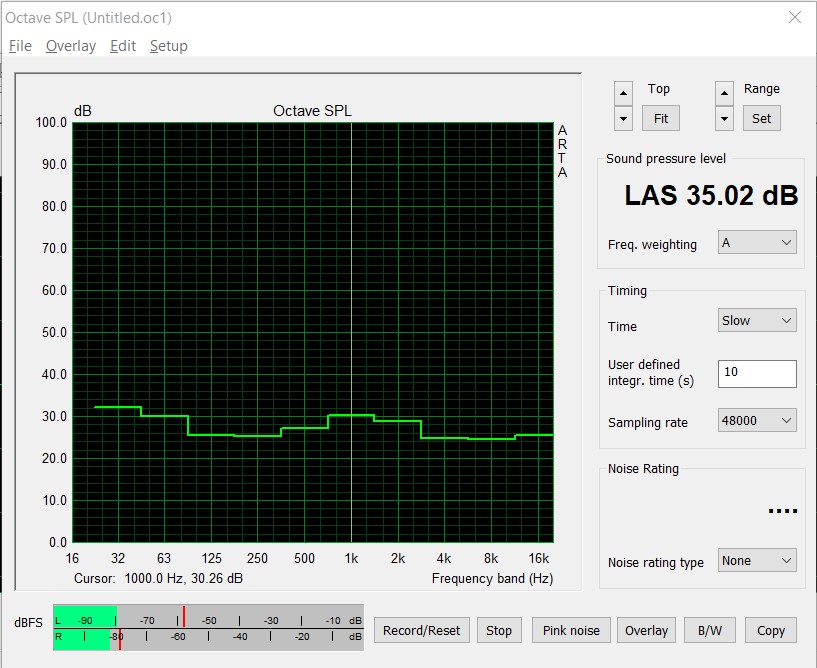
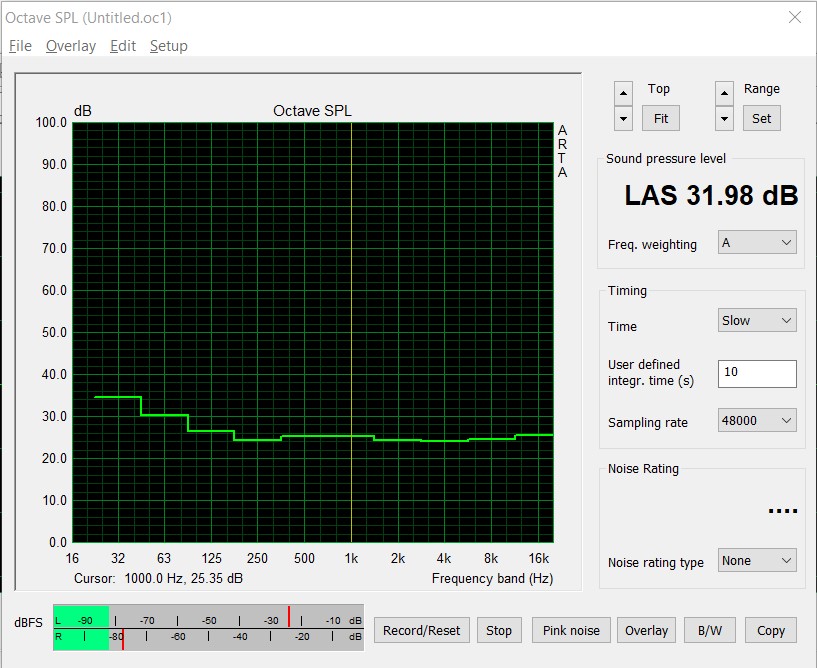
An office PC should be quiet above all else. The MSI Cubi 5 M10 can do exactly that. When idling, we measured 30.91 dB(A), which is only marginally more than in complete silence in the room (30.5 dB(A)). However, the significantly higher noise load is noticeable when we run Prime95 alone as a stress test. Here, the SoC can use all of its power, which means that the cooling unit also has to work harder due to the increased heat development. If both applications Prime95 and FurMark are run at the same time, the SoC can no longer use the full performance because the CPU and iGPU have to share the TDP of 15 watts. With 32 dB(A), the Cubi 5 10M is then significantly quieter, although the maximum 35 dB(A) was not perceived as annoying either. The fan is gently regulated up and down and does not produce any high-frequency noise.
Energy consumption
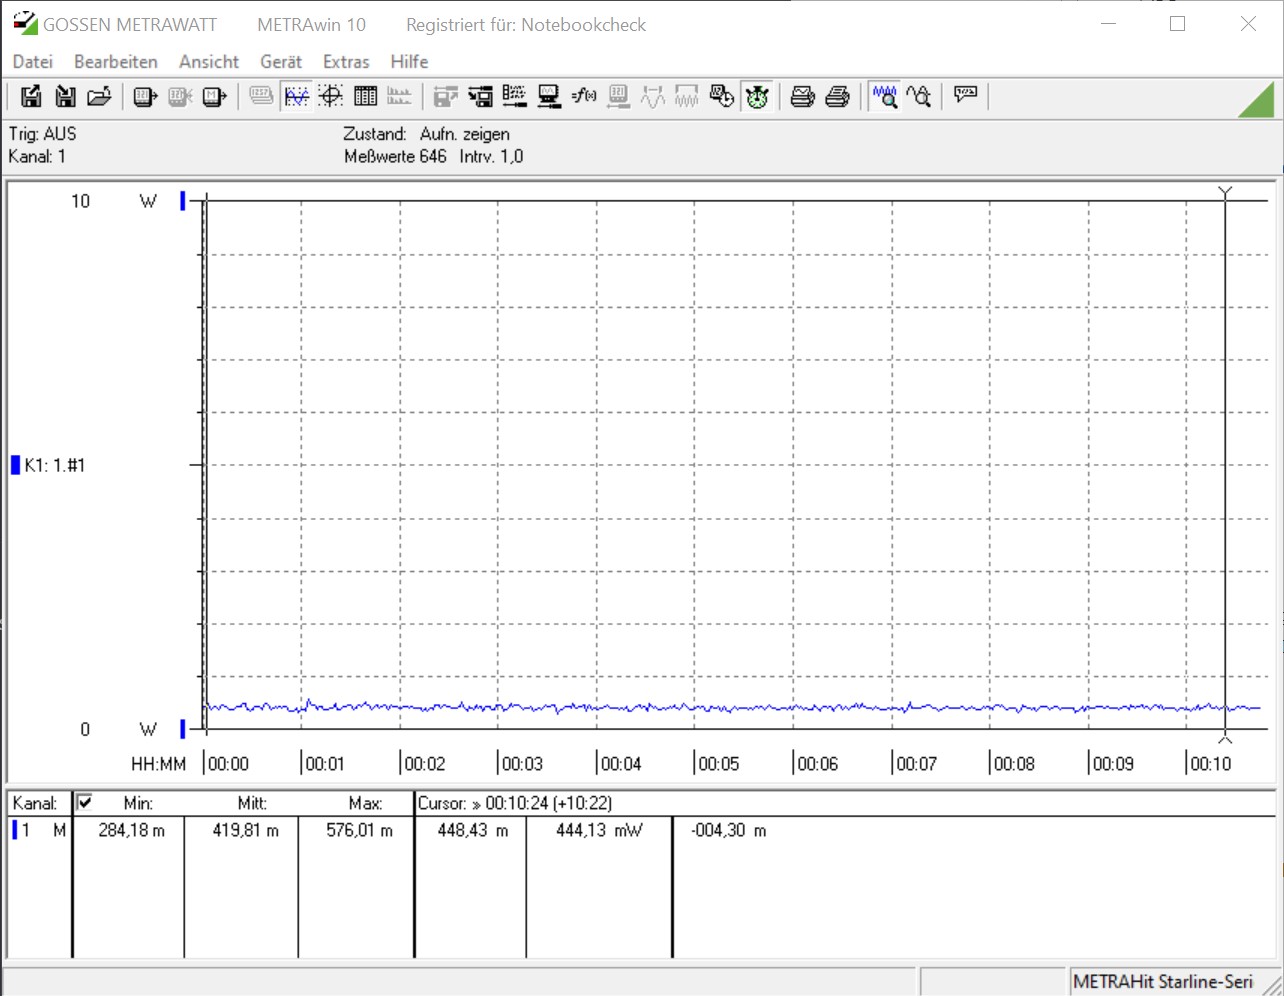
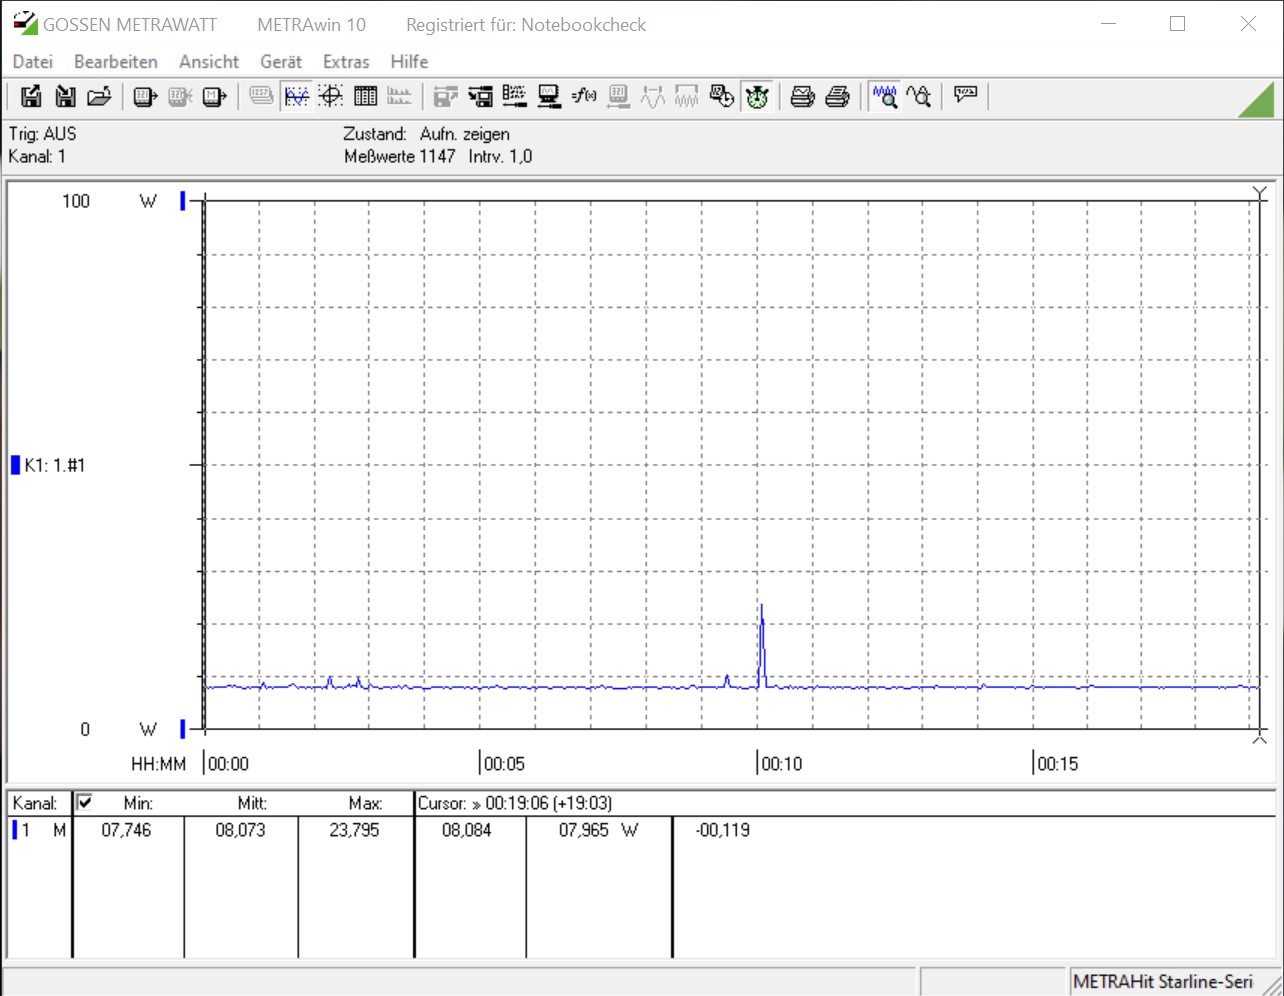
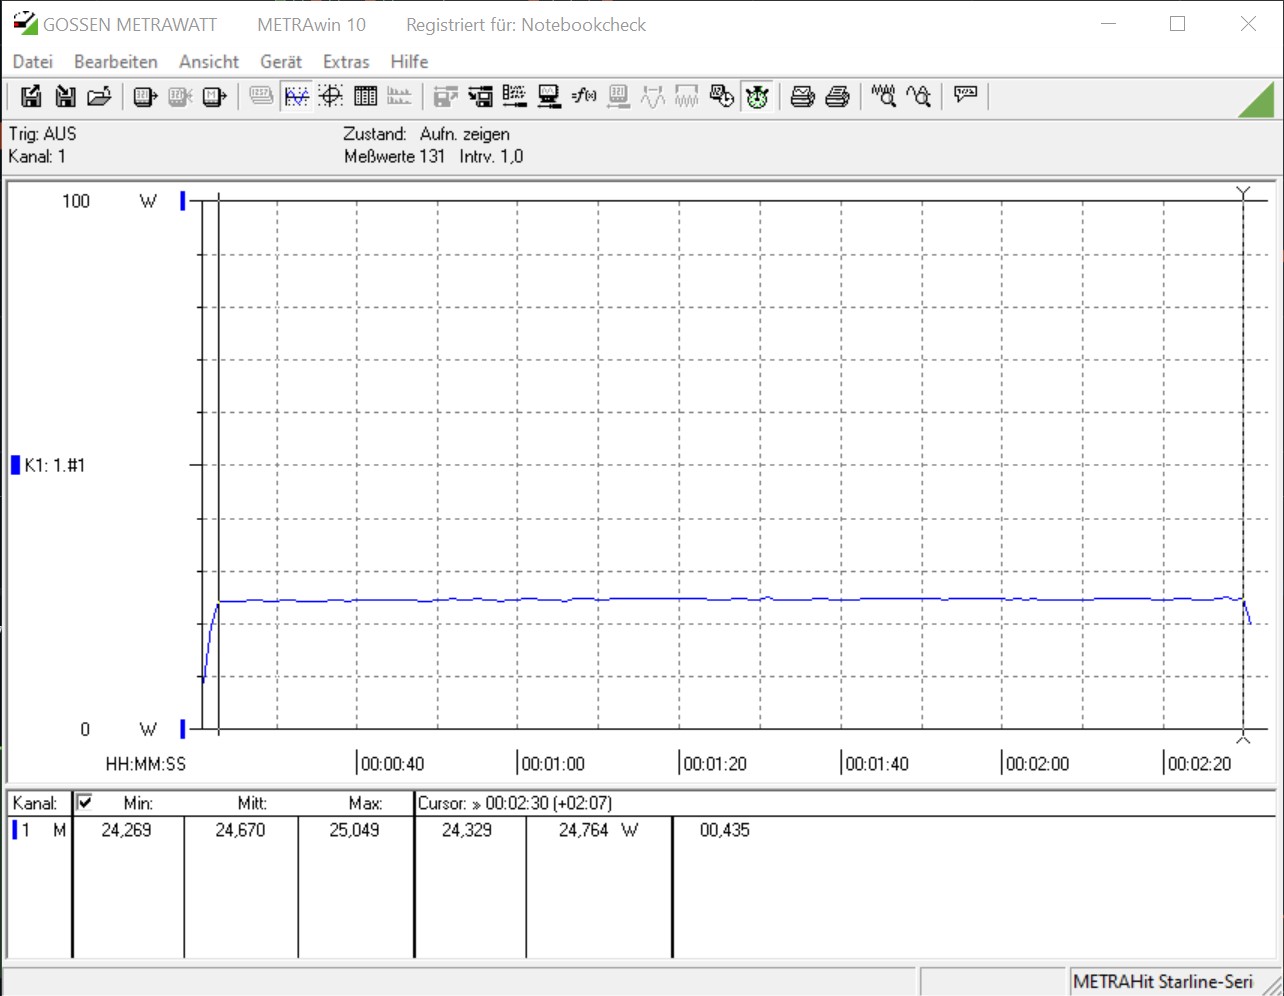
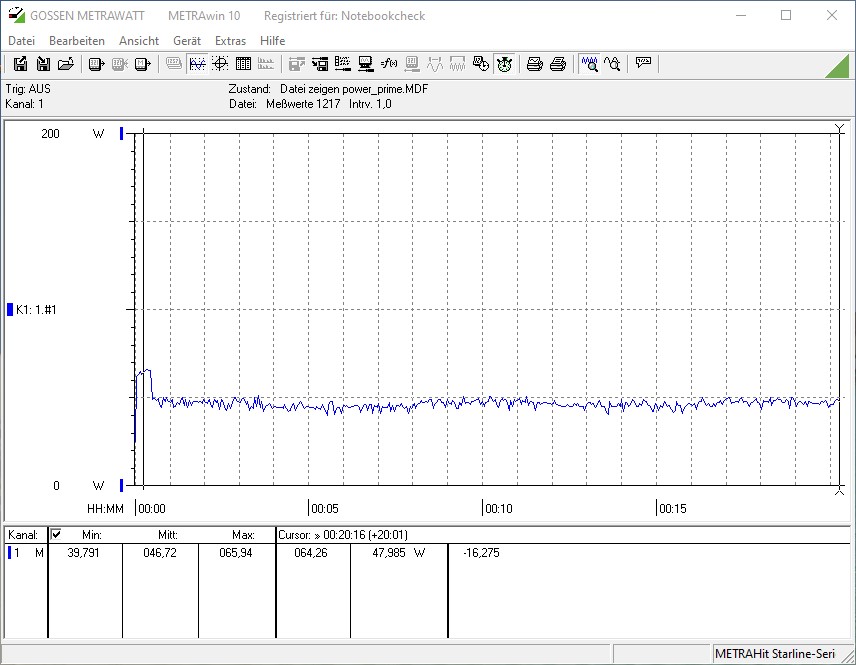
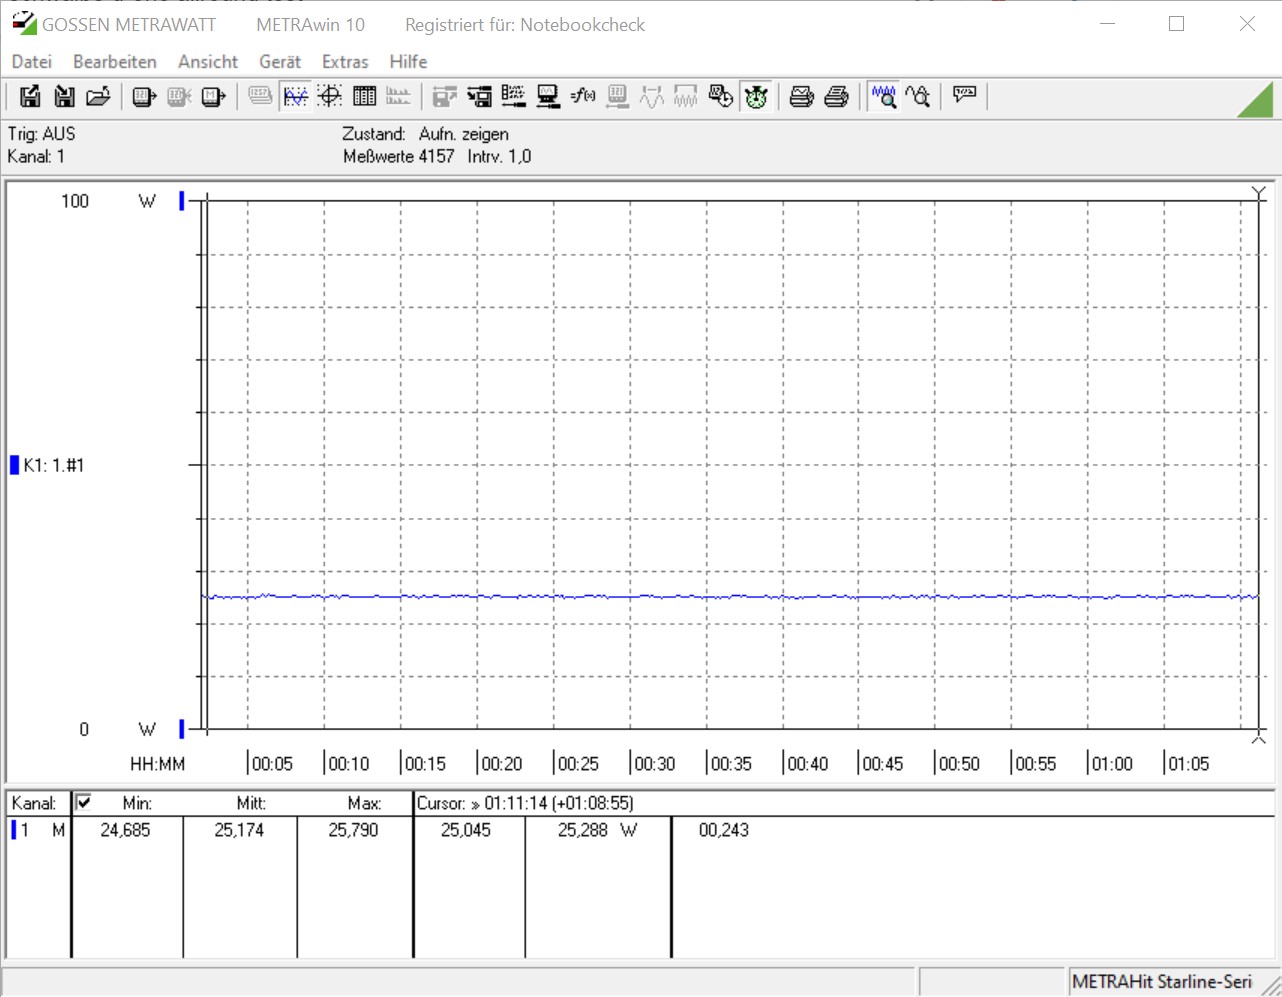
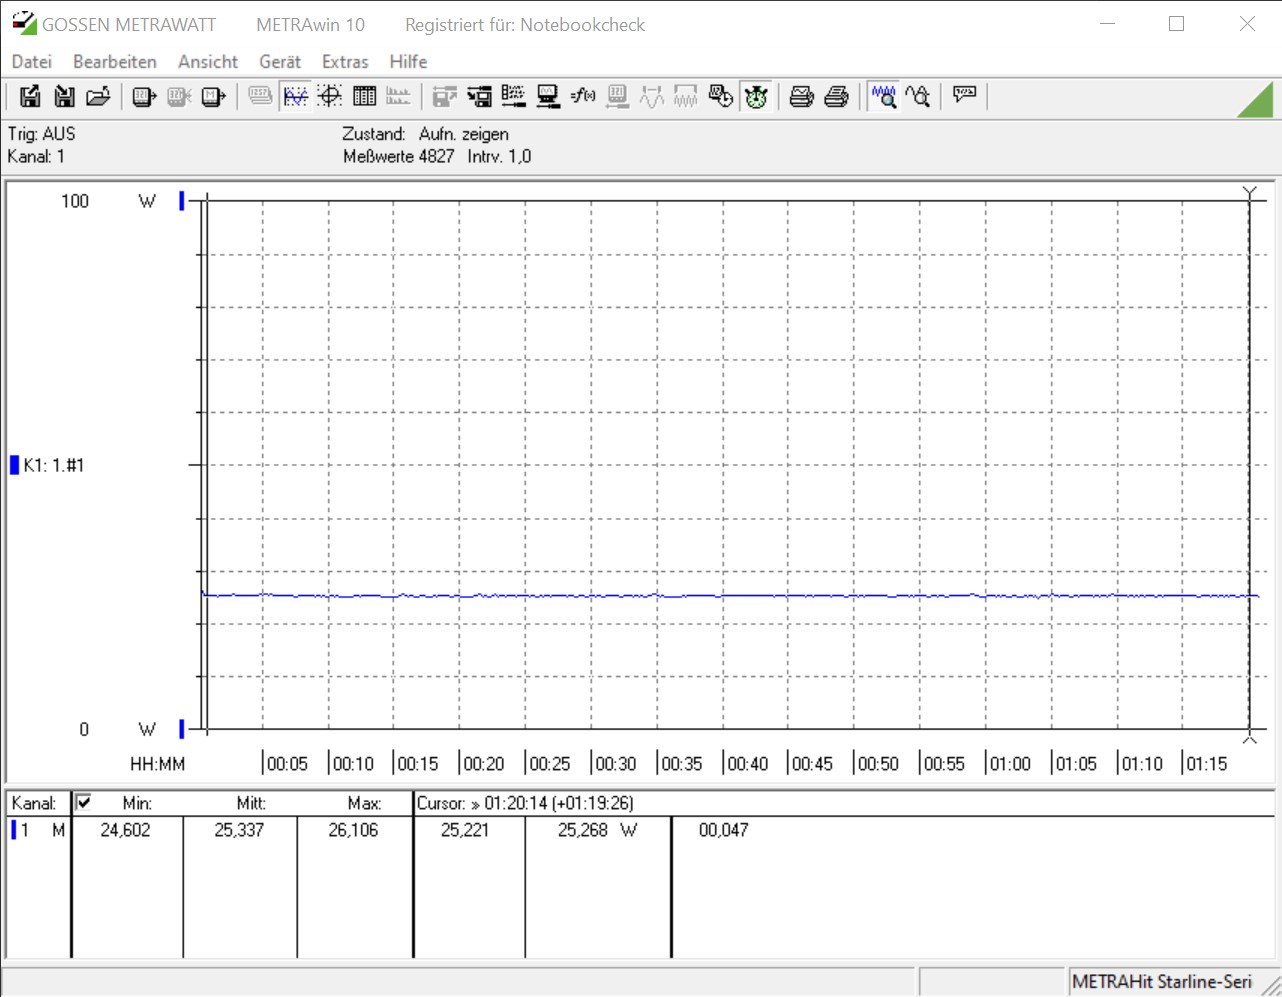
The small Cubi 5 10 M can score in terms of energy consumption due to its frugal components. The meter only shows us 8 watts in idle. Nevertheless, it can be up to 46 watts on average under full load. The power supply had to provide a maximum of 66 watts. Thus, it is still sufficiently dimensioned with 65 watts.
| Power Consumption | |
| Cinebench R15 Multi Efficiency (external Monitor) | |
| MSI Cubi 5 10M | |
| 1280x720 Prime95 28.10 and Furmark 1.25 | |
| MSI Cubi 5 10M | |
| AC6-M Mini-PC | |
| Prime95 V2810 Stress (external Monitor) | |
| Intel NUC10i7FNH (Idle: 8.4 W) | |
| Intel NUC10i5FNK (Idle: 15.7 W) | |
| MSI Cubi 5 10M (Idle: 8 W) | |
| AC6-M Mini-PC | |
| Cinebench R15 Multi (external Monitor) | |
| MSI Cubi 5 10M (Idle: 8 W) | |
| 1280x720 FurMark 1.19 GPU Stress Test (external Monitor) | |
| Intel NUC10i7FNH (Idle: 8.4 W) | |
| Intel NUC10i5FNK (Idle: 15.7 W) | |
| MSI Cubi 5 10M (Idle: 8 W) | |
* ... smaller is better
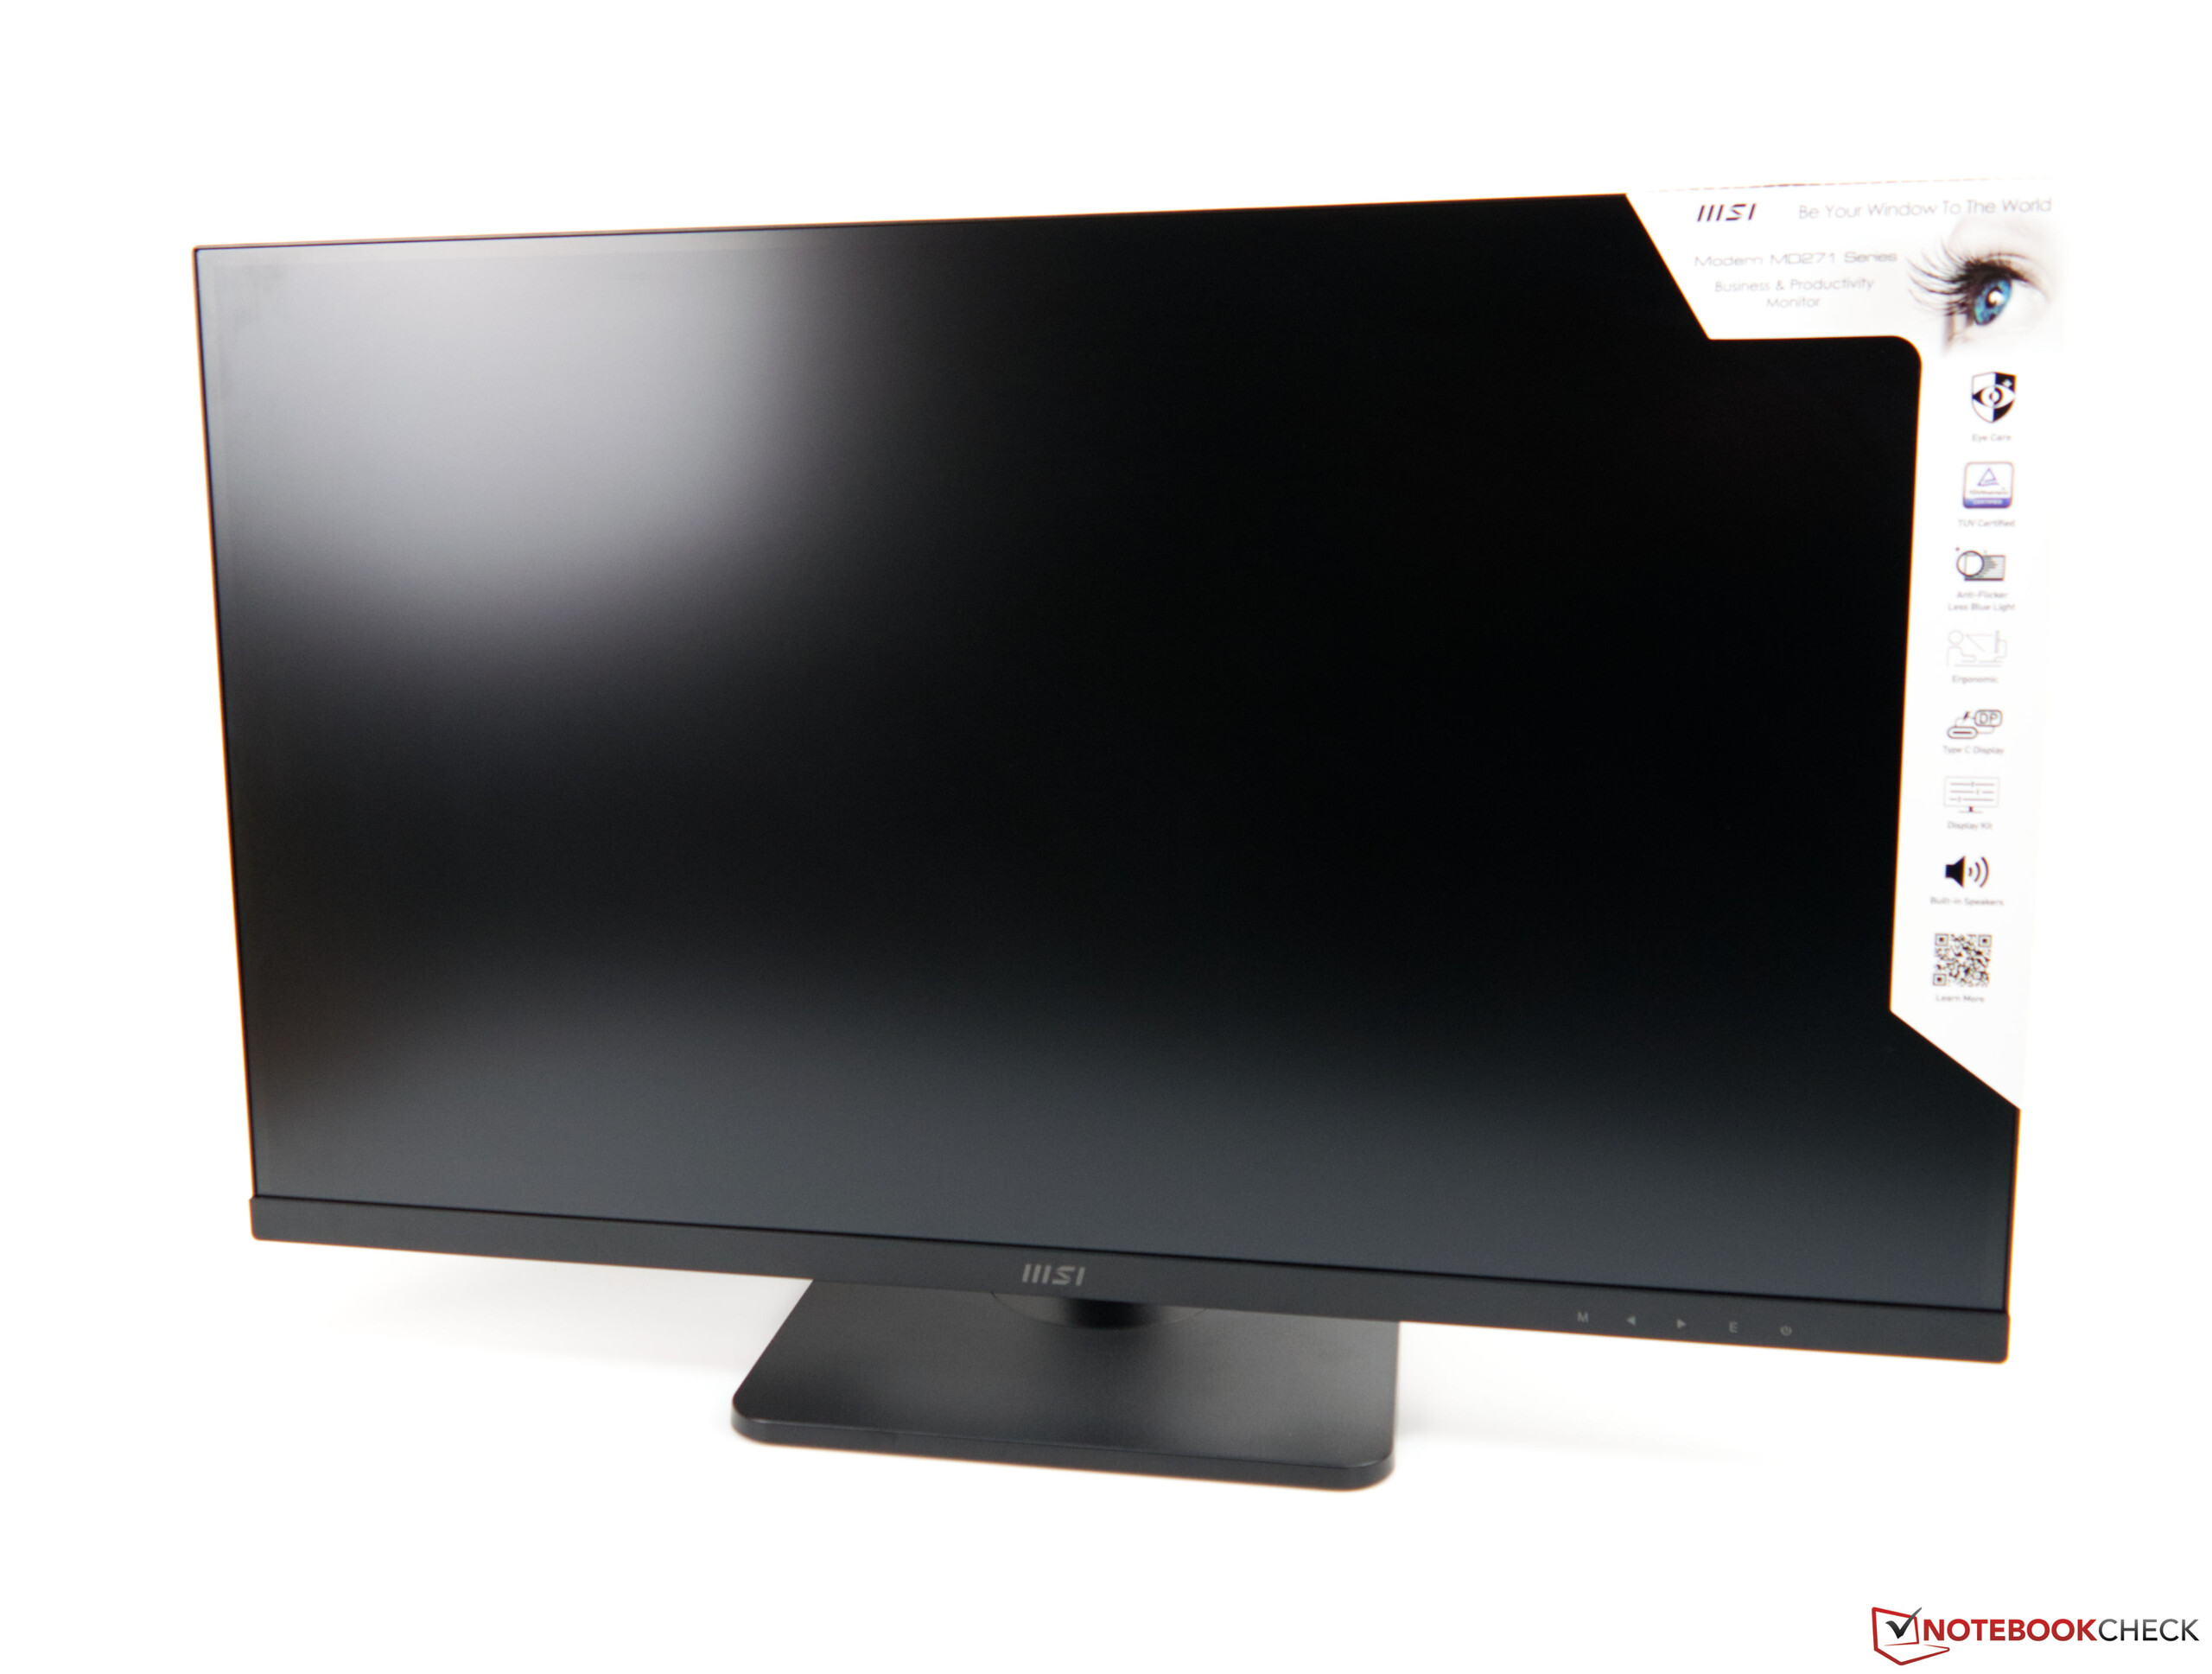
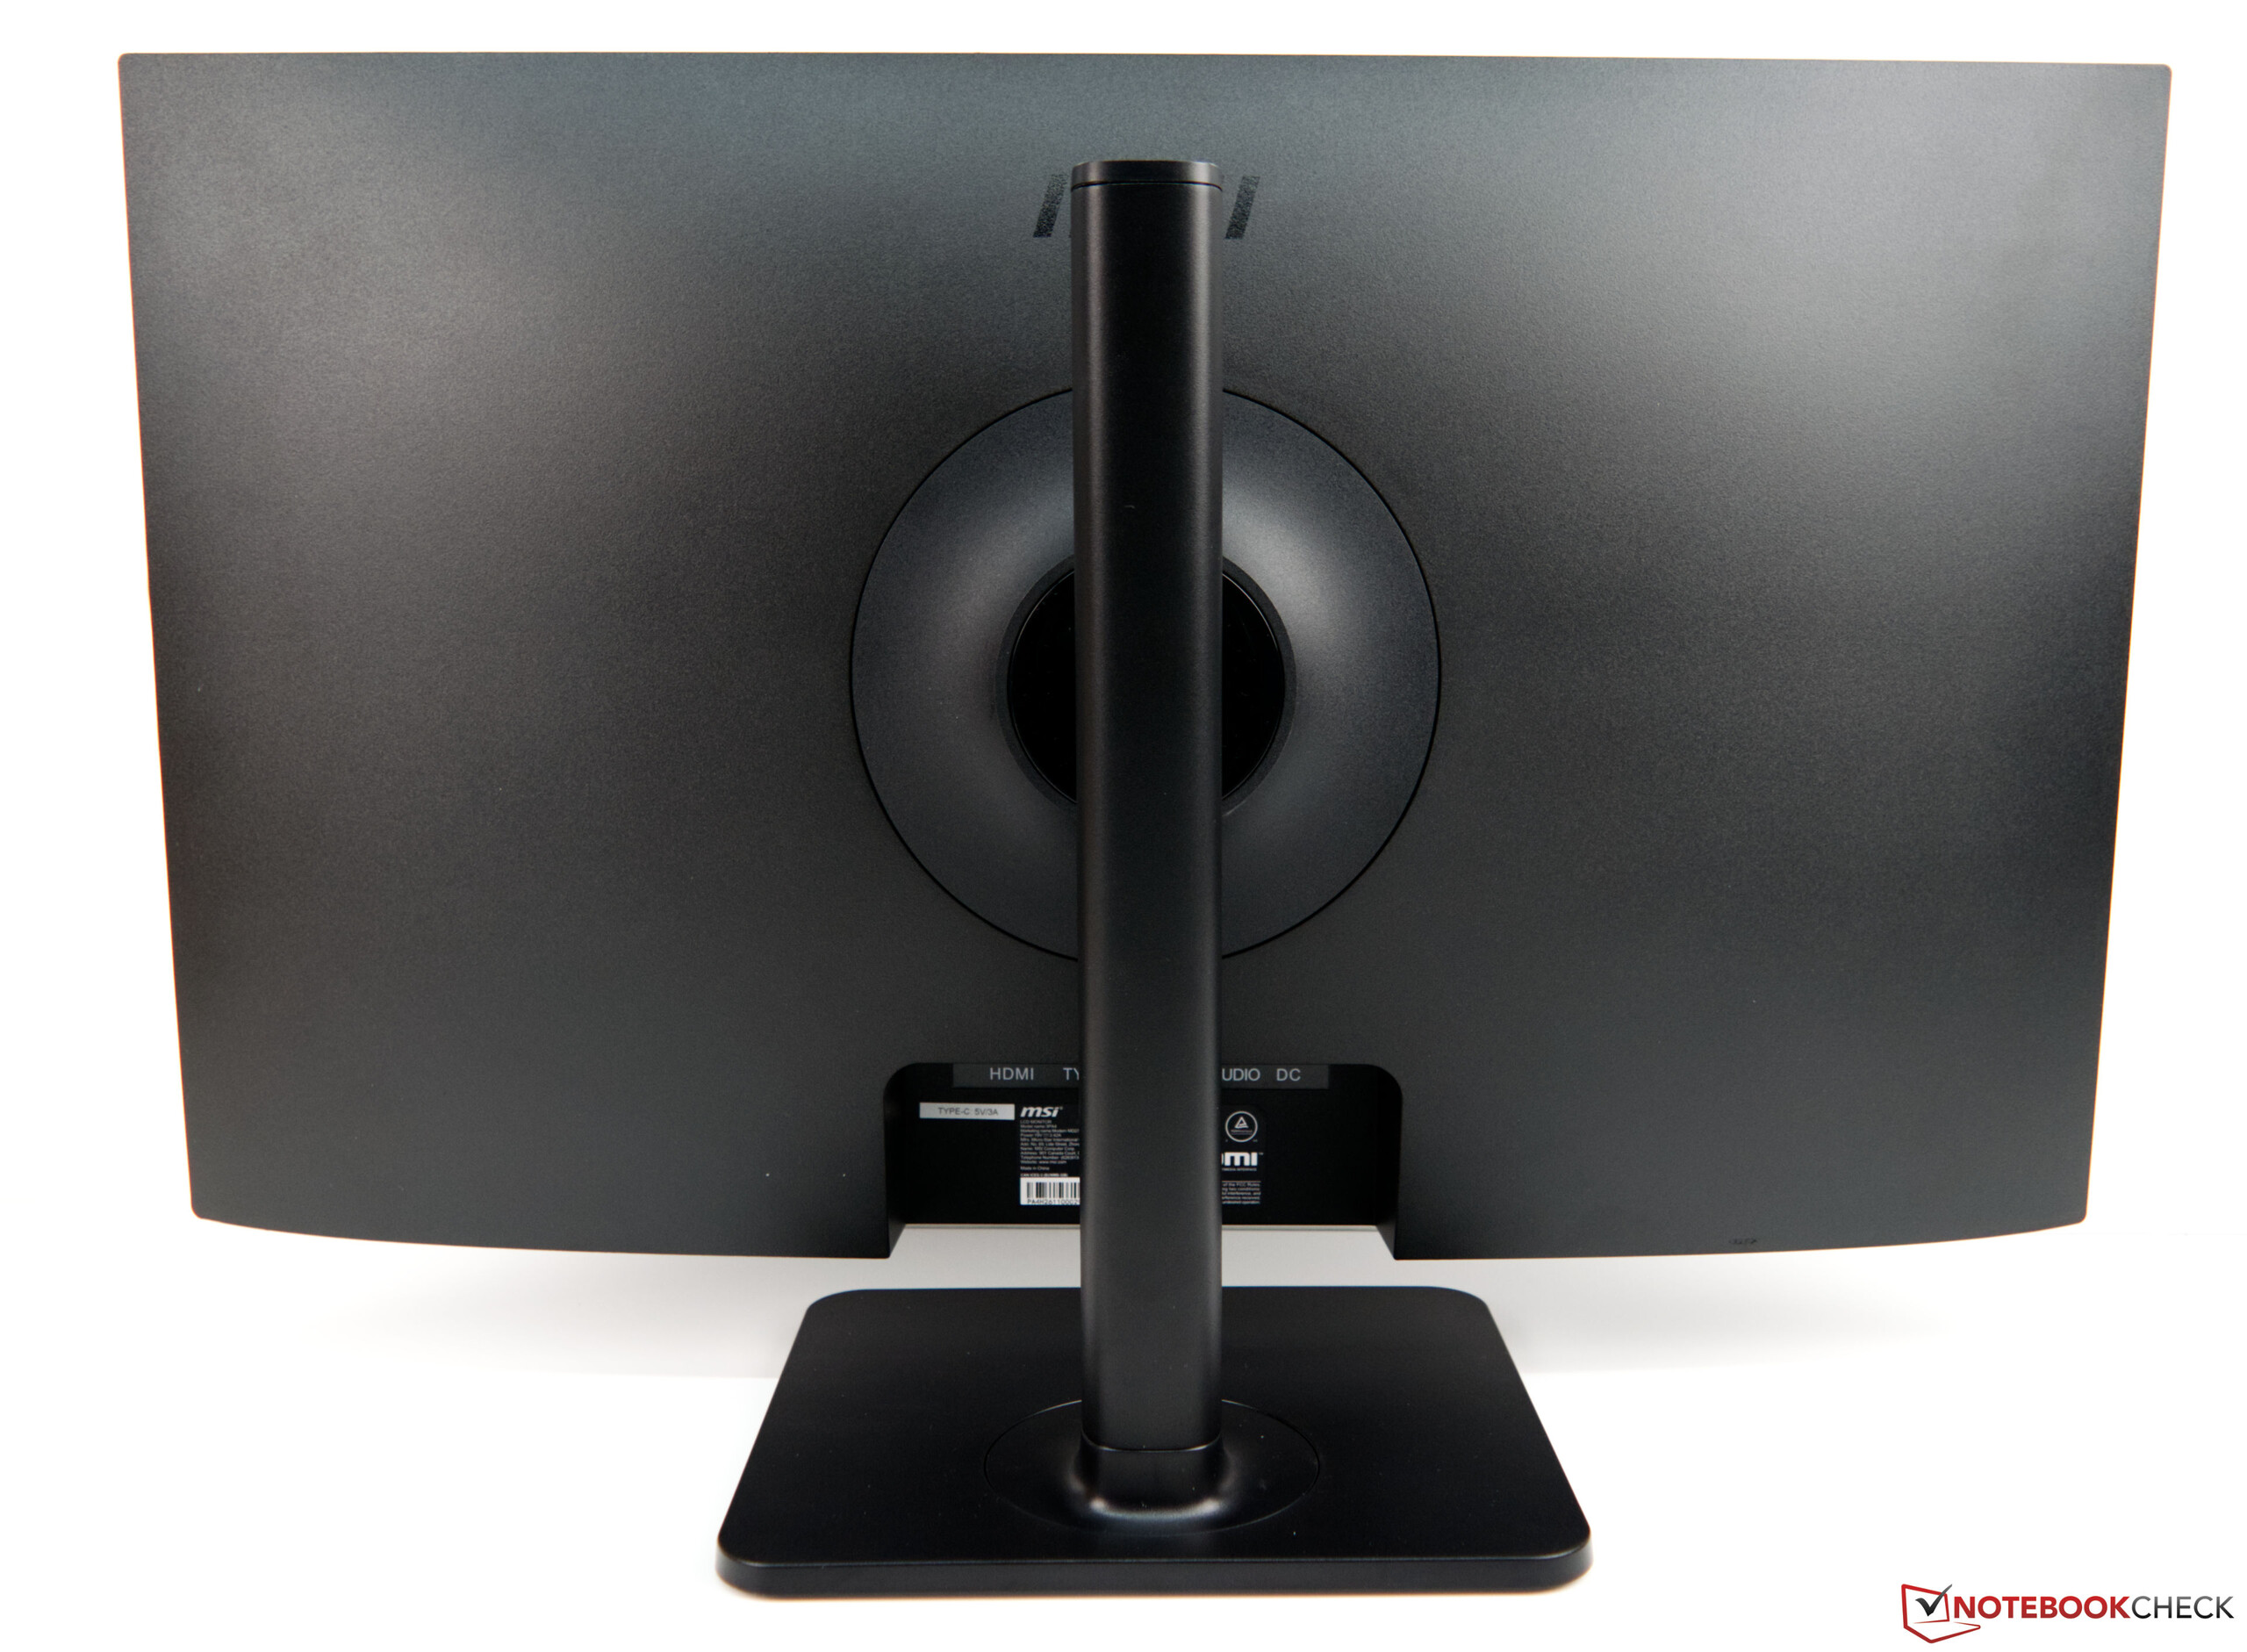
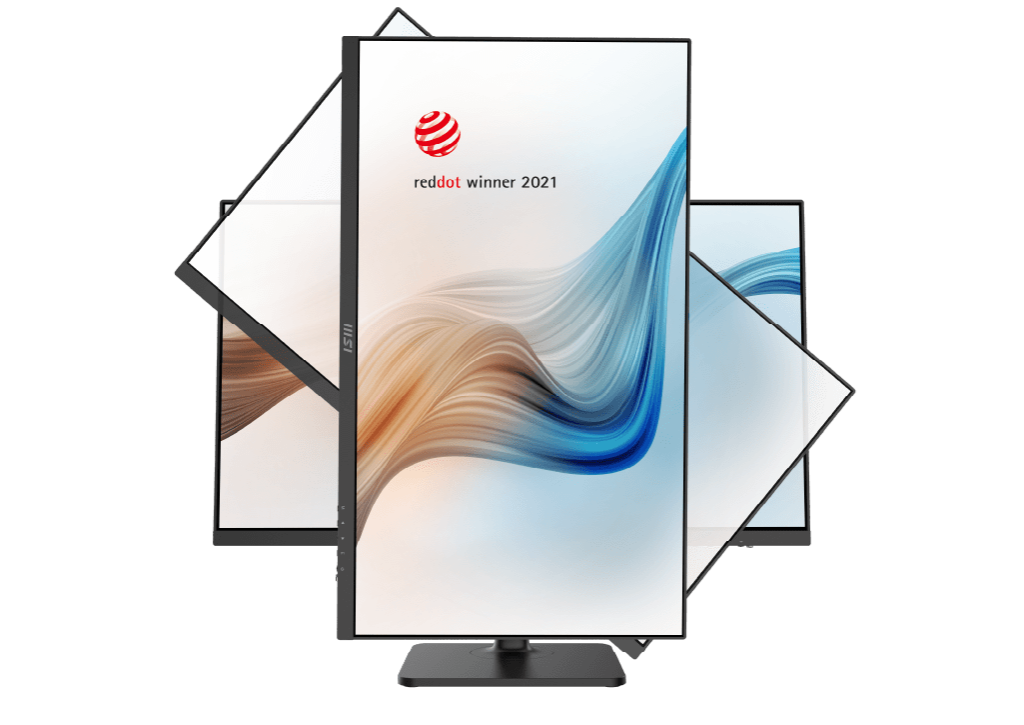
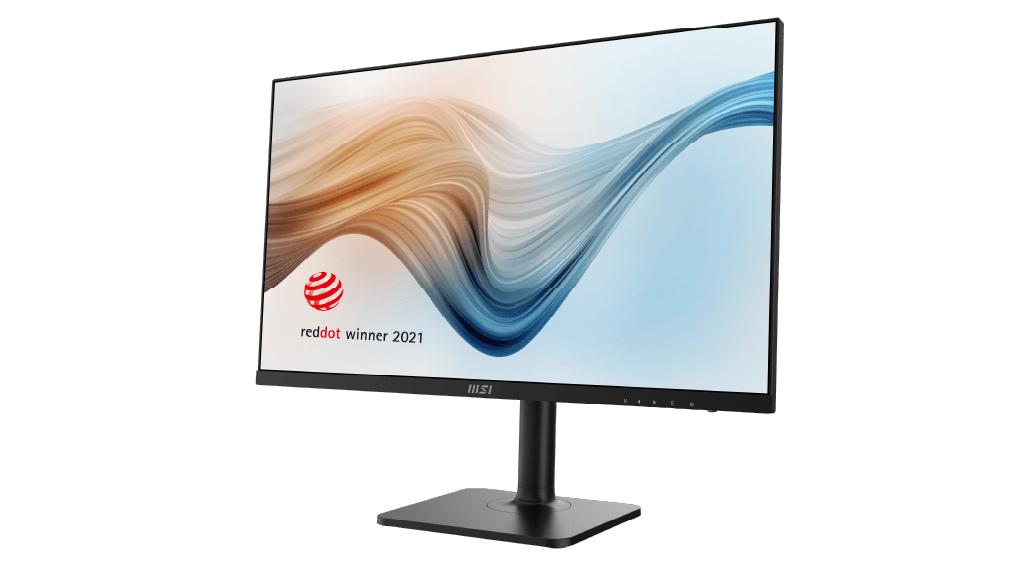
Monitor - MD271 Series for Content Creator
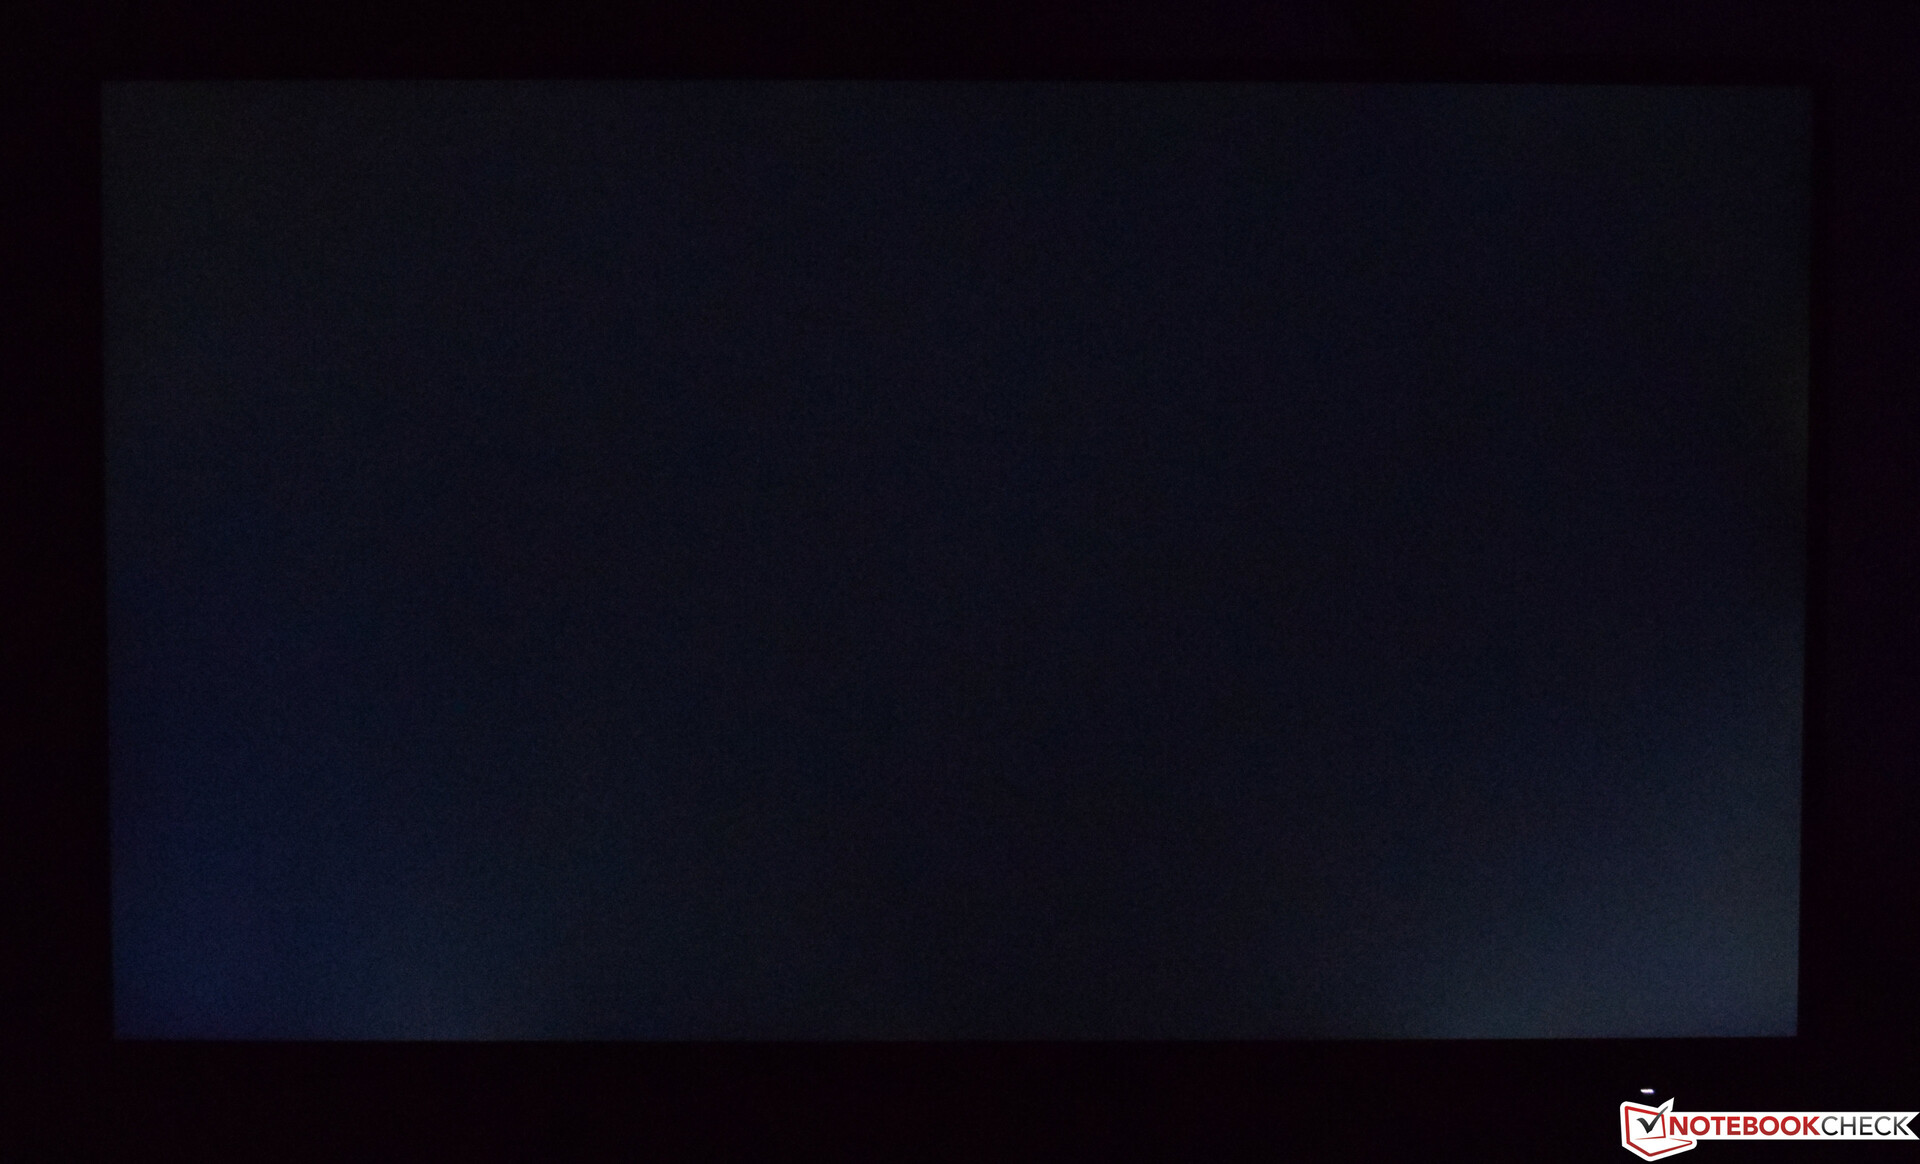
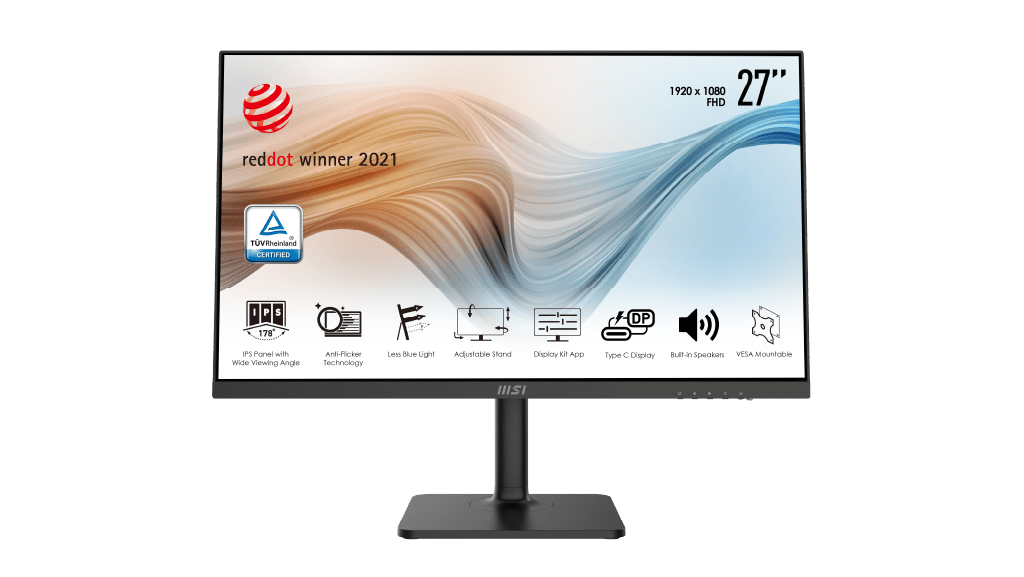
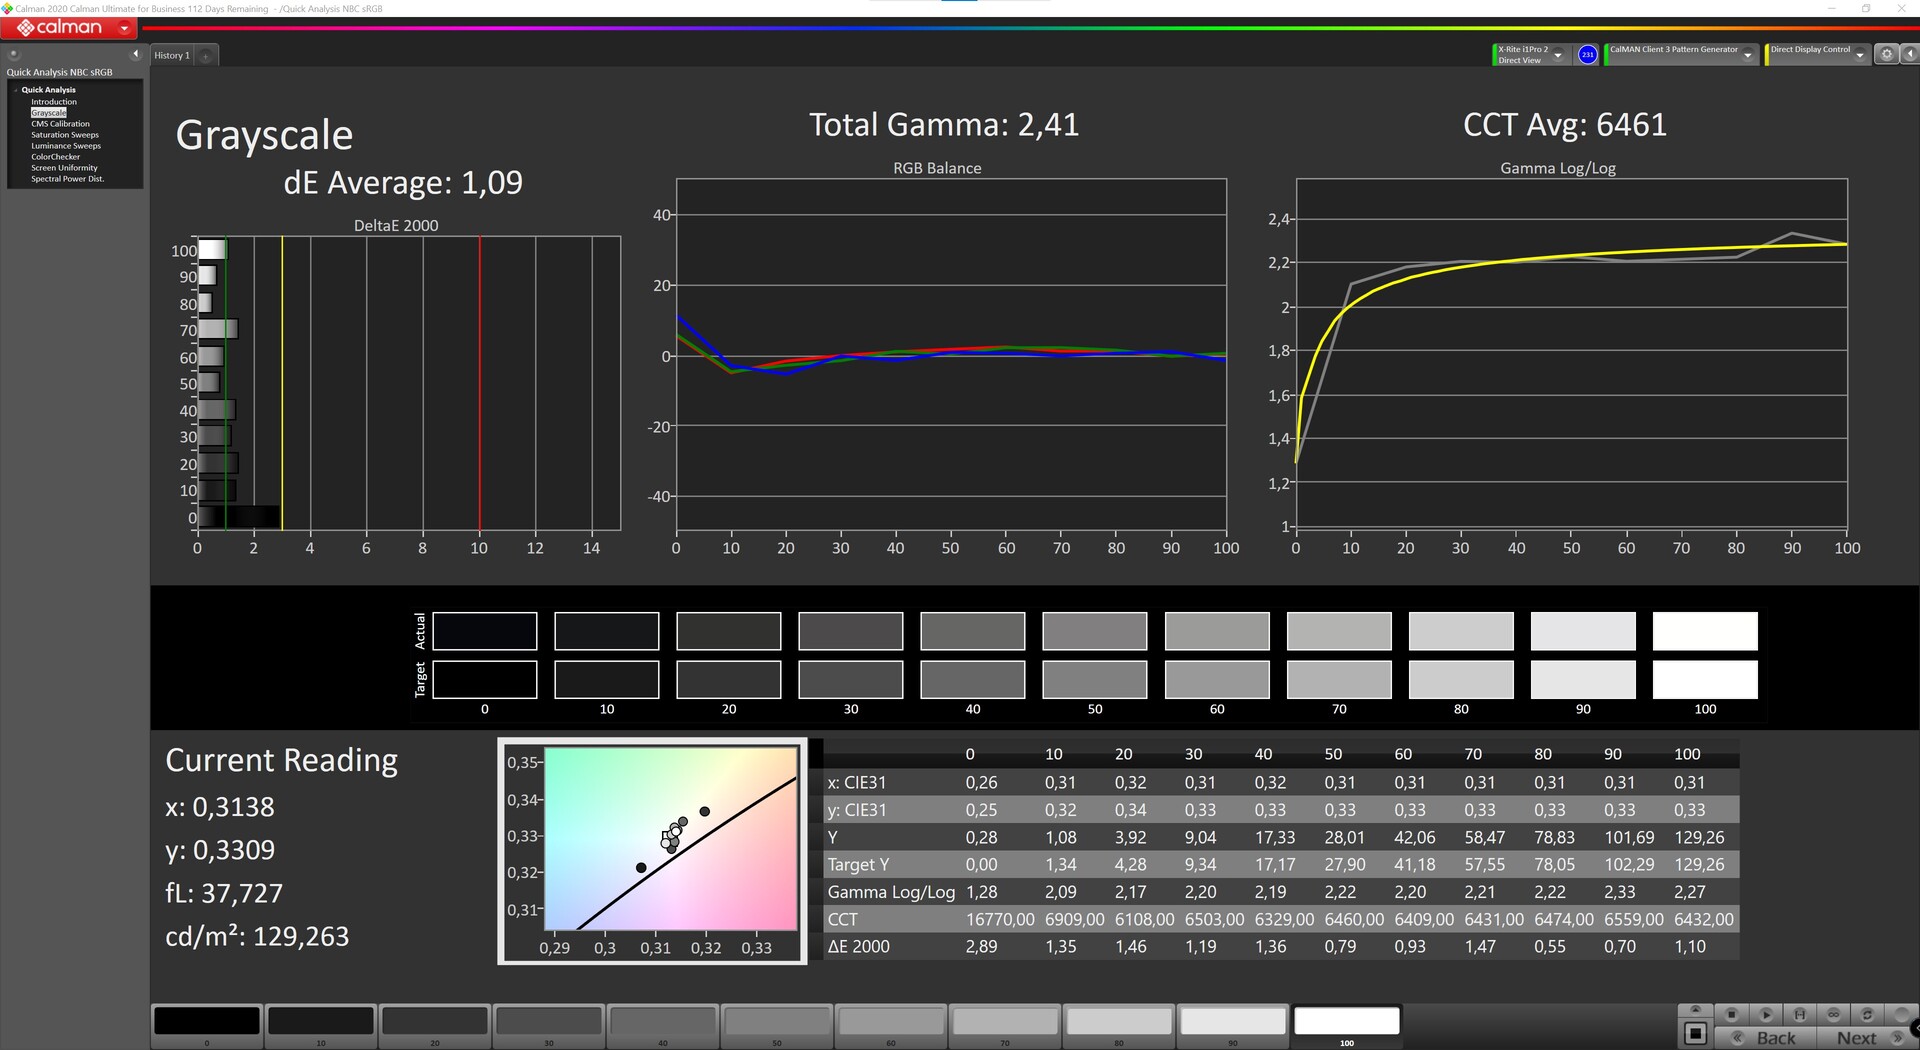
Besides the MSI Cubi 5 10M, MSI also provided us with the new MD271 monitor. This is aimed at content creators and offers a WQHD resolution and a matte IPS panel in addition to the modern design. The measured brightness is 325 cd/m². That is more than what the manufacturer states in the spec sheet (250 cd/m²). The black value of the MD271 is typical for an IPS panel. In combination with the brightness, this results in a contrast ratio of 1,161:1. The illumination of 86% is still good, although a value of over 90% should be aimed for. After all, we are talking about a monitor that is directly aimed at content creators, who often place a lot of value on quality. Nevertheless, the 86% is not annoying in everyday use, which means that there is no visible shadowing. However, the issue of halos, also known as clouding, is already an issue with the MD271. In dark scenes, there are more visibly brighter areas at the lower edge of the screen. The measured response times are good, so that one or two games can be played on the display without problems. However, we would not recommend it as a pure gaming monitor due to the maximum 75 Hz. You should rather look for a good monitor with at least 144 Hz. We couldn't measure any PWM in the brightness control, which is definitely positive. Thus, there are fewer signs of fatigue.
| |||||||||||||||||||||||||
Brightness Distribution: 86 %
Contrast: 1161:1 (Black: 0.28 cd/m²)
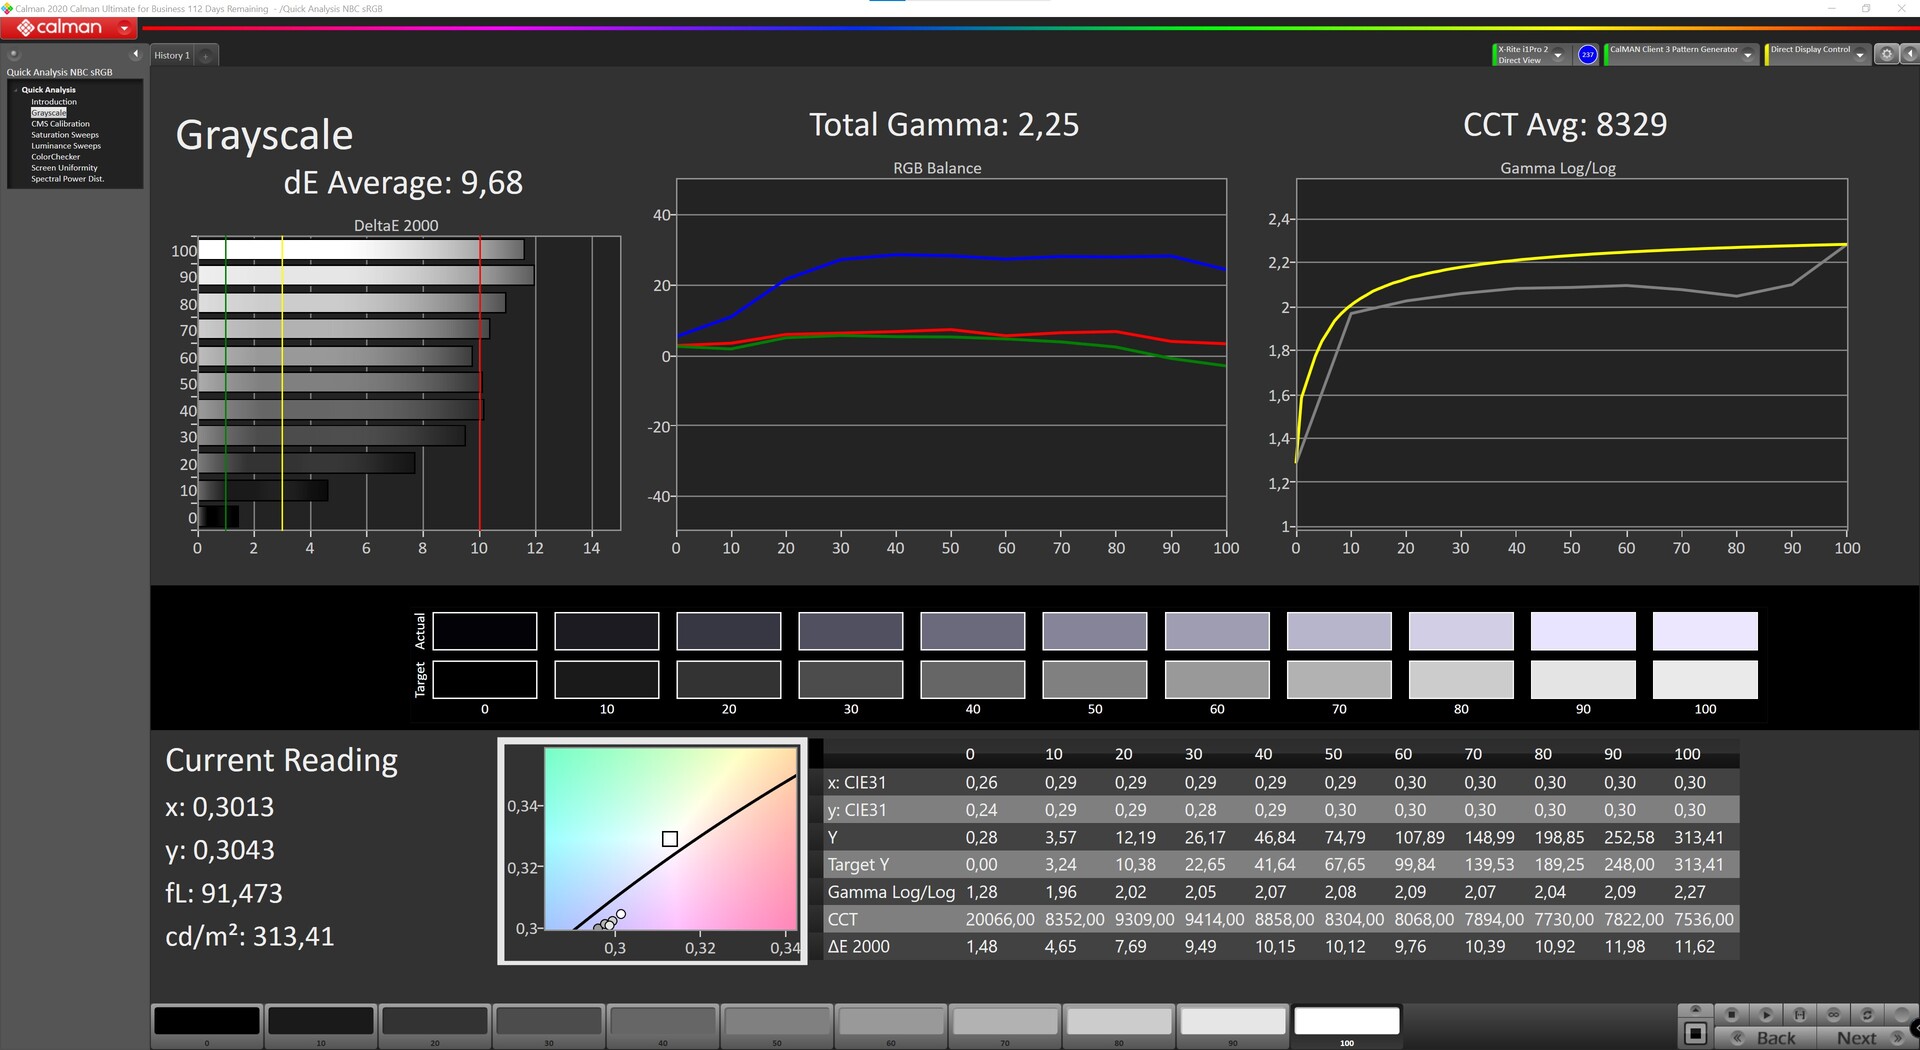
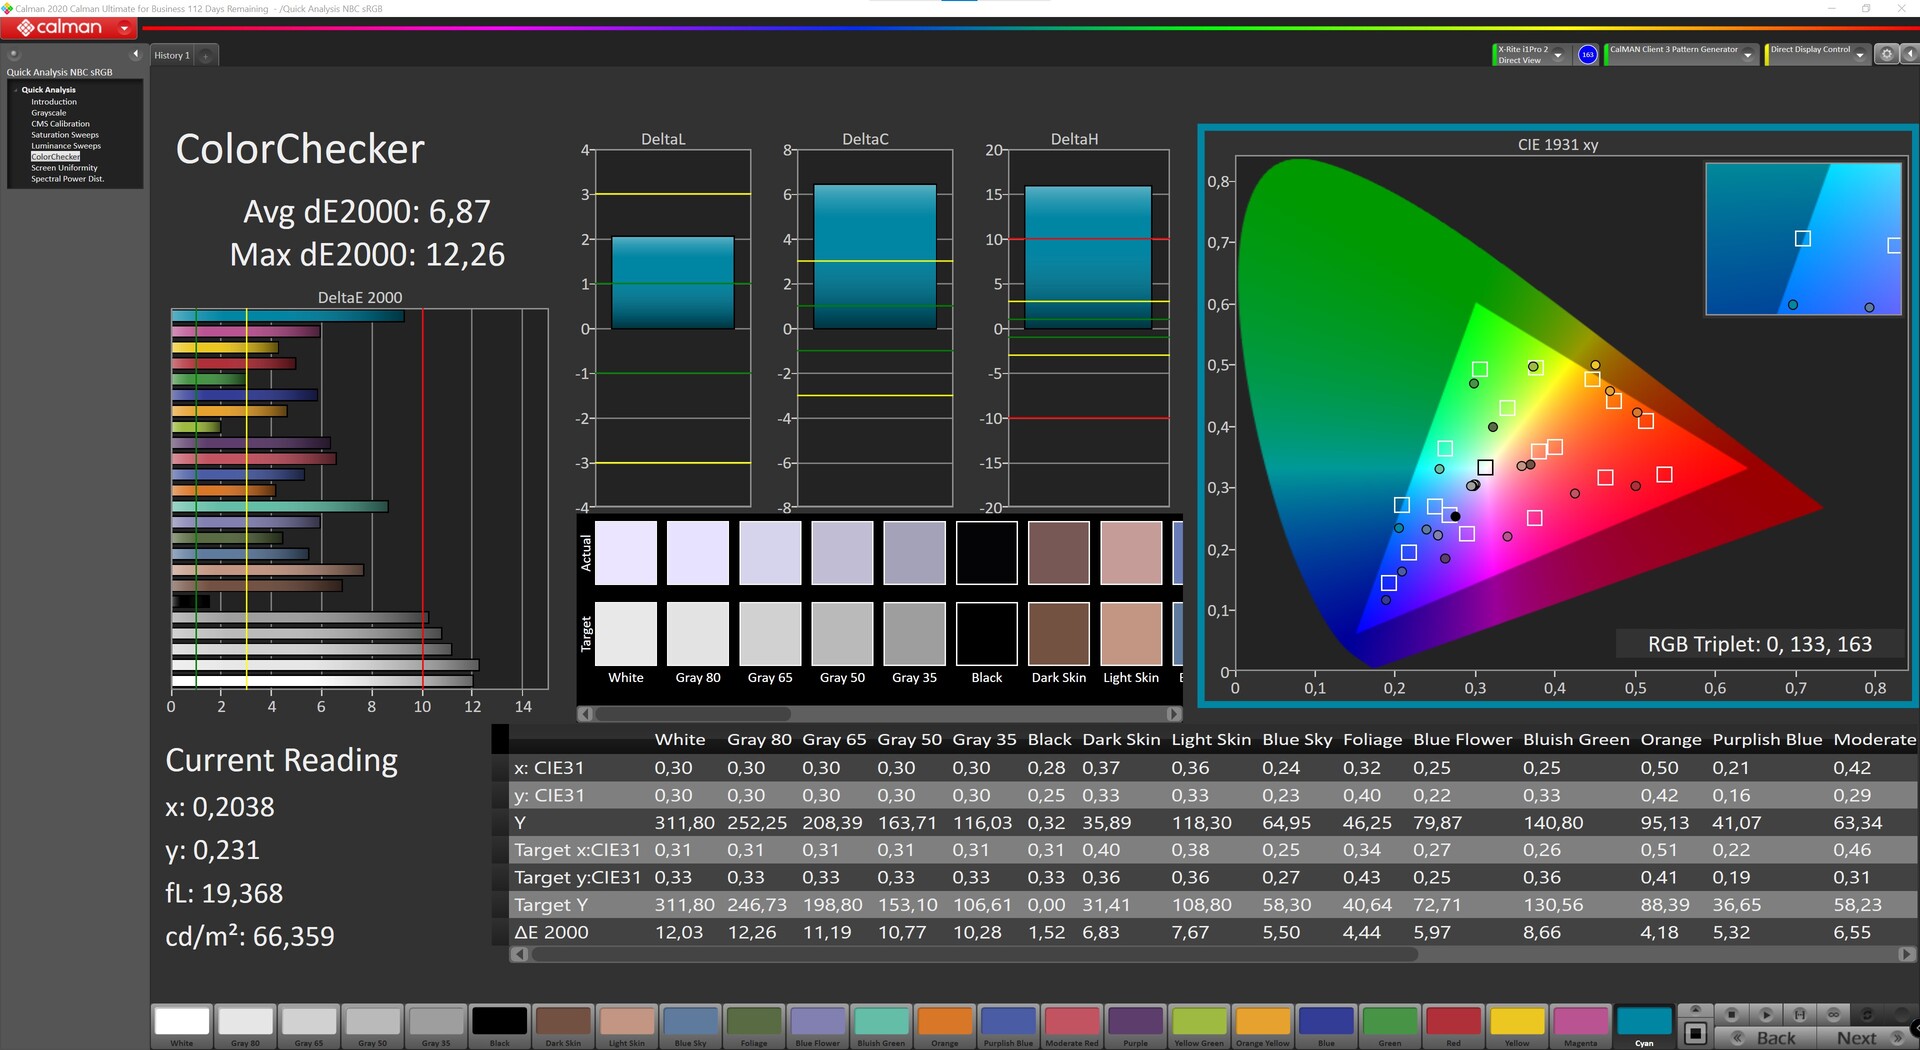
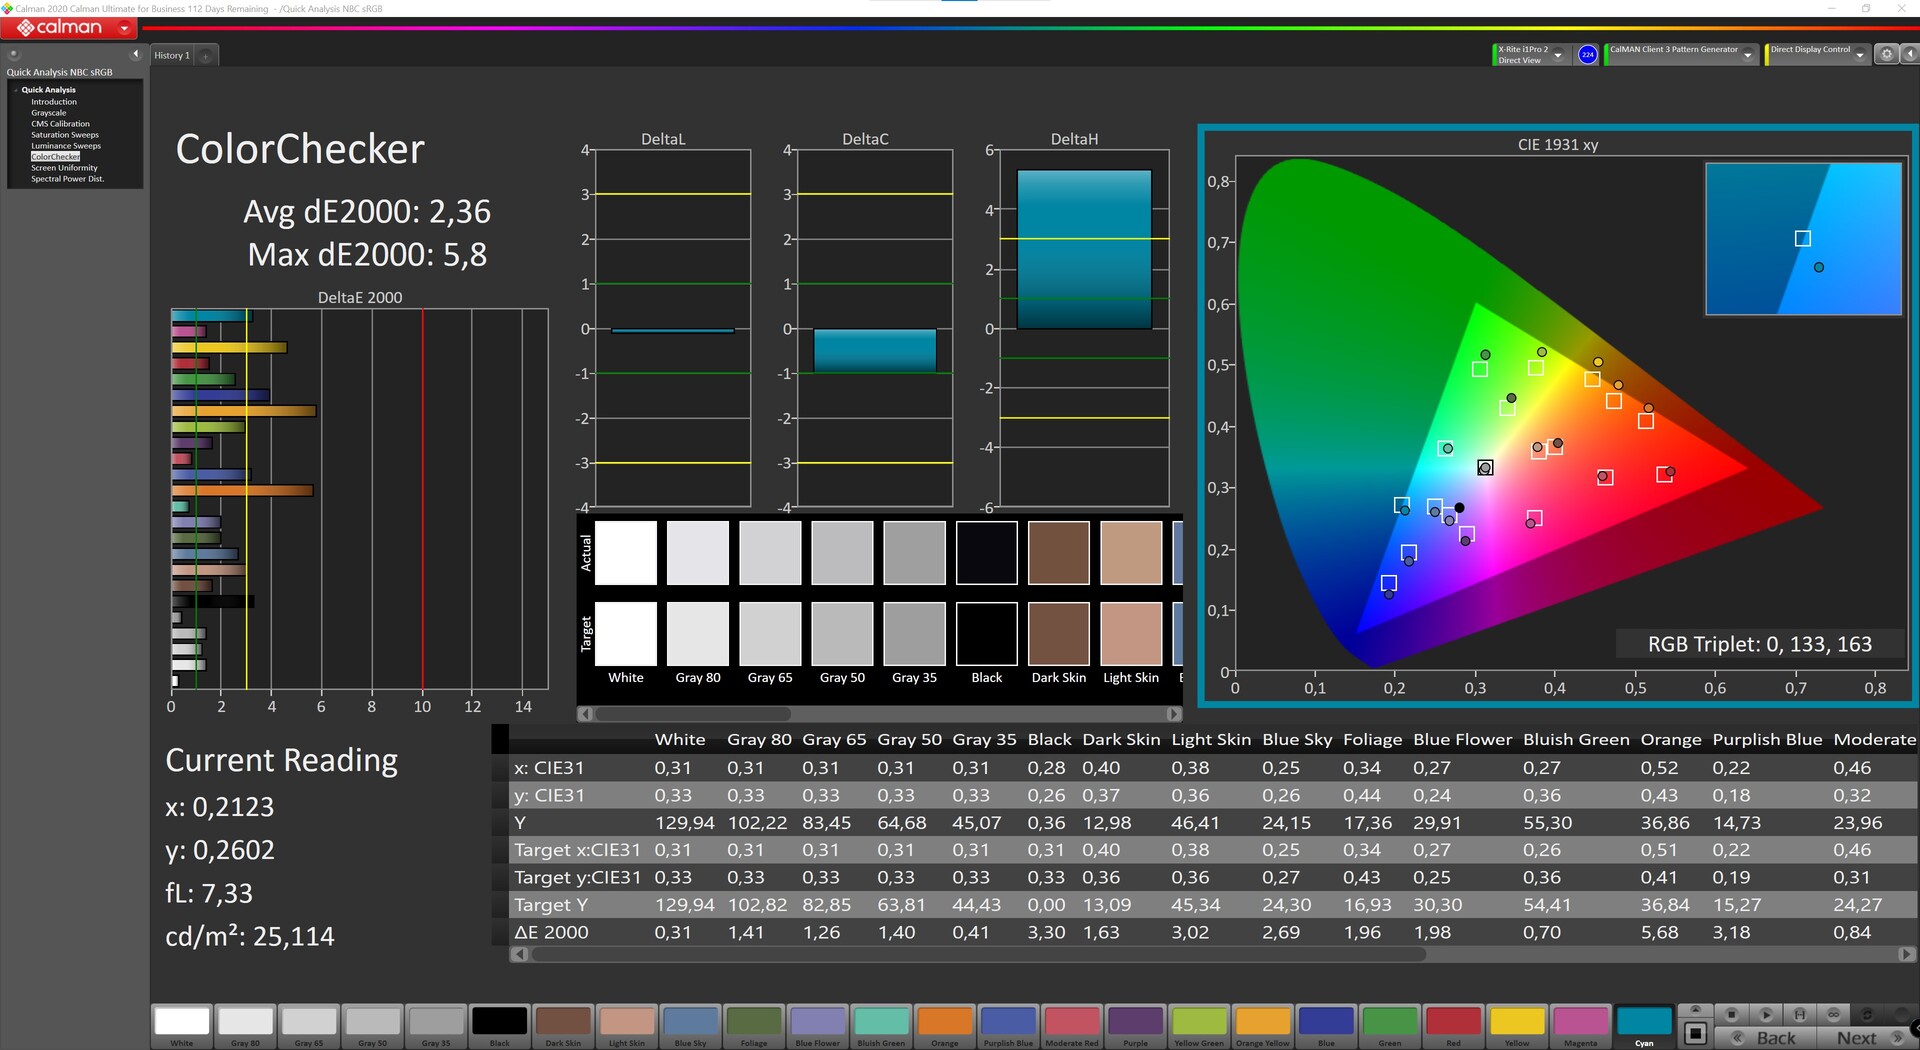
ΔE ColorChecker Calman: 6.87 | ∀{0.5-29.43 Ø4.72}
calibrated: 2.36
ΔE Greyscale Calman: 9.68 | ∀{0.09-98 Ø4.97}
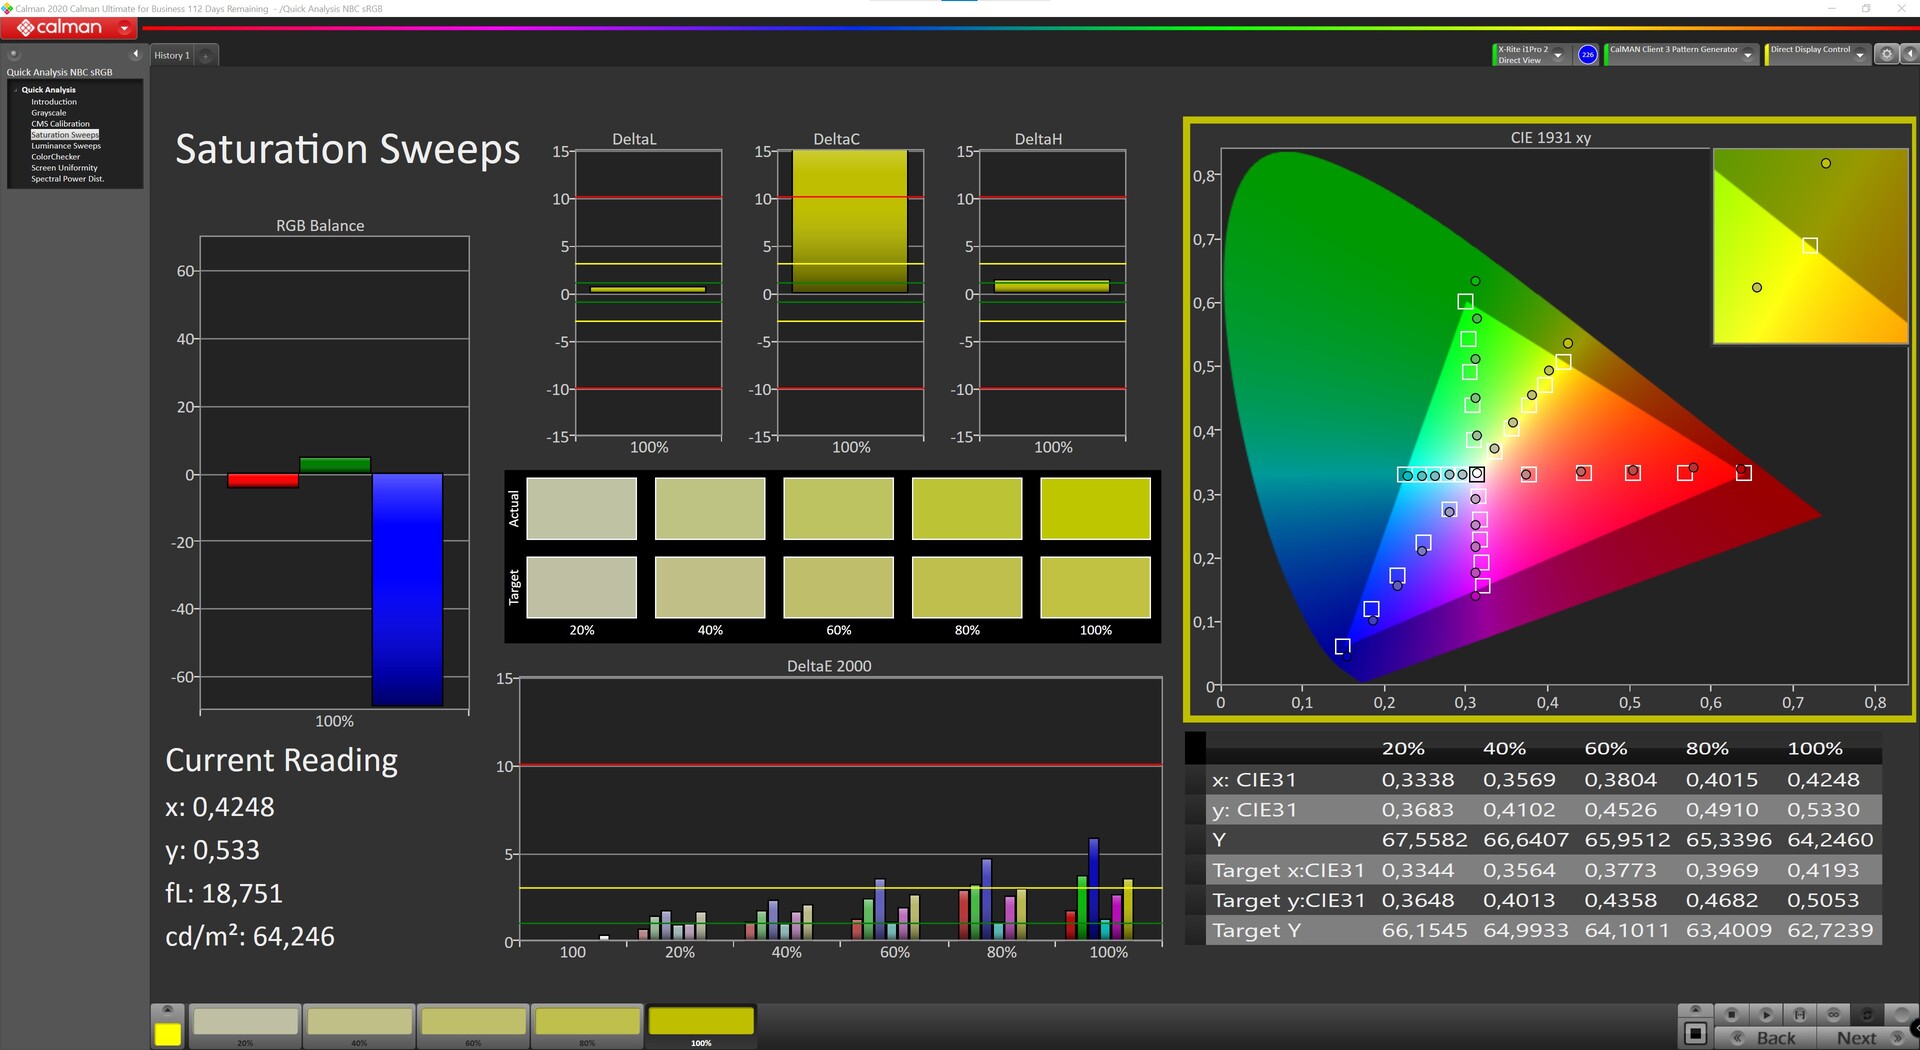
94.95% sRGB (Argyll 1.6.3 3D)
69.51% AdobeRGB 1998 (Argyll 1.6.3 3D)
69.5% AdobeRGB 1998 (Argyll 3D)
95% sRGB (Argyll 3D)
72.1% Display P3 (Argyll 3D)
Gamma: 2.25
CCT: 8329 K
| MSI Cubi 5 10M 2560x1440, 27" | |
|---|---|
| Display | |
| Display P3 Coverage (%) | 72.1 |
| sRGB Coverage (%) | 95 |
| AdobeRGB 1998 Coverage (%) | 69.5 |
| Response Times | |
| Response Time Grey 50% / Grey 80% * (ms) | 20 ? |
| Response Time Black / White * (ms) | 14 ? |
| PWM Frequency (Hz) | |
| Screen | |
| Brightness middle (cd/m²) | 325 |
| Brightness (cd/m²) | 293 |
| Brightness Distribution (%) | 86 |
| Black Level * (cd/m²) | 0.28 |
| Contrast (:1) | 1161 |
| Colorchecker dE 2000 * | 6.87 |
| Colorchecker dE 2000 max. * | 12.26 |
| Colorchecker dE 2000 calibrated * | 2.36 |
| Greyscale dE 2000 * | 9.68 |
| Gamma | 2.25 98% |
| CCT | 8329 78% |
| Color Space (Percent of AdobeRGB 1998) (%) | 69.51 |
| Color Space (Percent of sRGB) (%) | 94.95 |
| Total Average (Program / Settings) |
* ... smaller is better
Display Response Times
| ↔ Response Time Black to White | ||
|---|---|---|
| 14 ms ... rise ↗ and fall ↘ combined | ↗ 7 ms rise | 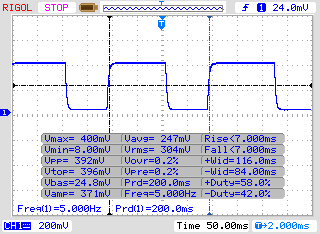 |
| ↘ 7 ms fall | ||
| The screen shows good response rates in our tests, but may be too slow for competitive gamers. In comparison, all tested devices range from 0.1 (minimum) to 240 (maximum) ms. » 34 % of all devices are better. This means that the measured response time is better than the average of all tested devices (19.8 ms). | ||
| ↔ Response Time 50% Grey to 80% Grey | ||
| 20 ms ... rise ↗ and fall ↘ combined | ↗ 9 ms rise | 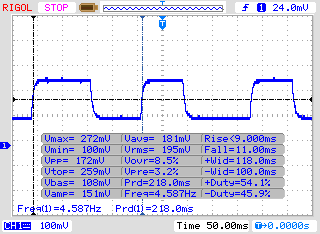 |
| ↘ 11 ms fall | ||
| The screen shows good response rates in our tests, but may be too slow for competitive gamers. In comparison, all tested devices range from 0.165 (minimum) to 636 (maximum) ms. » 33 % of all devices are better. This means that the measured response time is better than the average of all tested devices (31 ms). | ||
Screen Flickering / PWM (Pulse-Width Modulation)
| Screen flickering / PWM not detected | 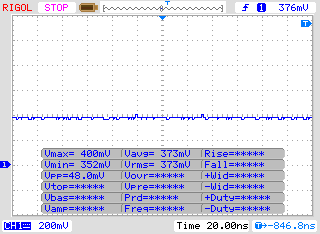 | ||
In comparison: 52 % of all tested devices do not use PWM to dim the display. If PWM was detected, an average of 7781 (minimum: 5 - maximum: 343500) Hz was measured. | |||
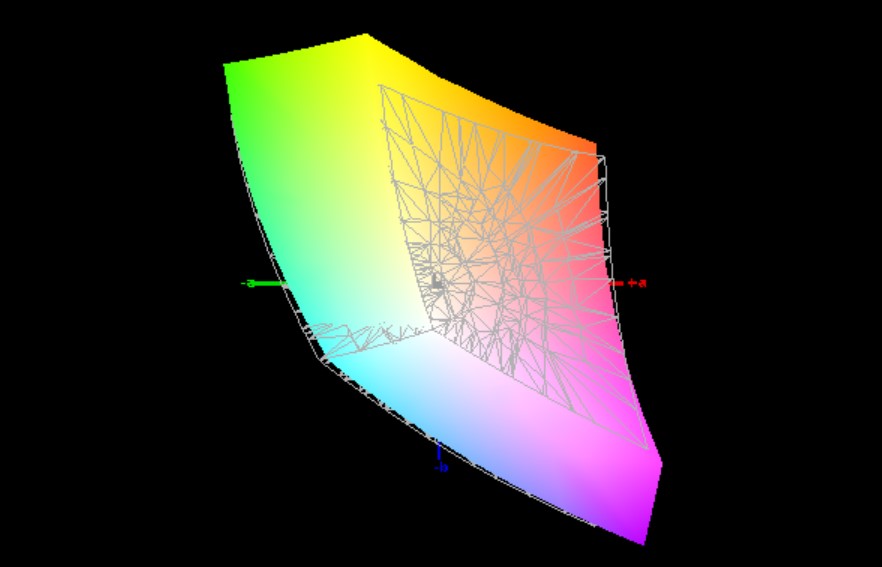
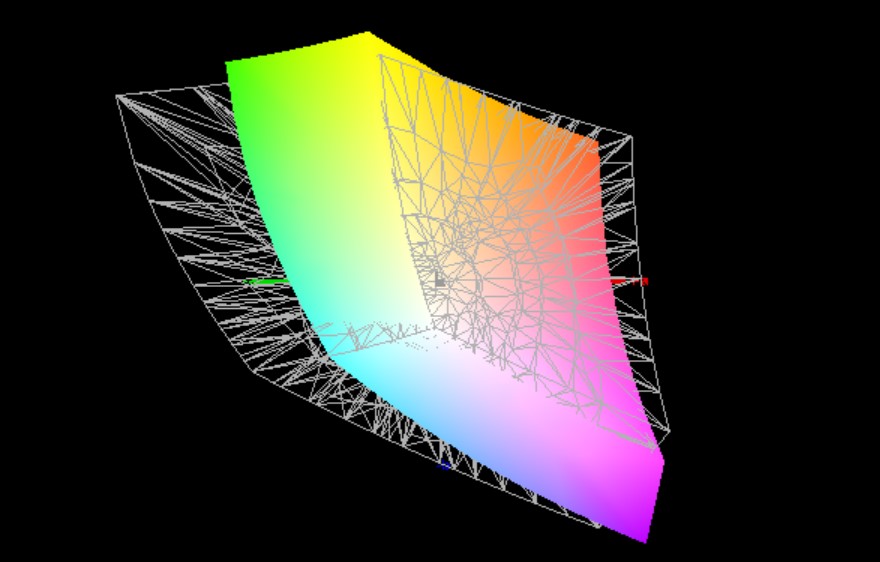
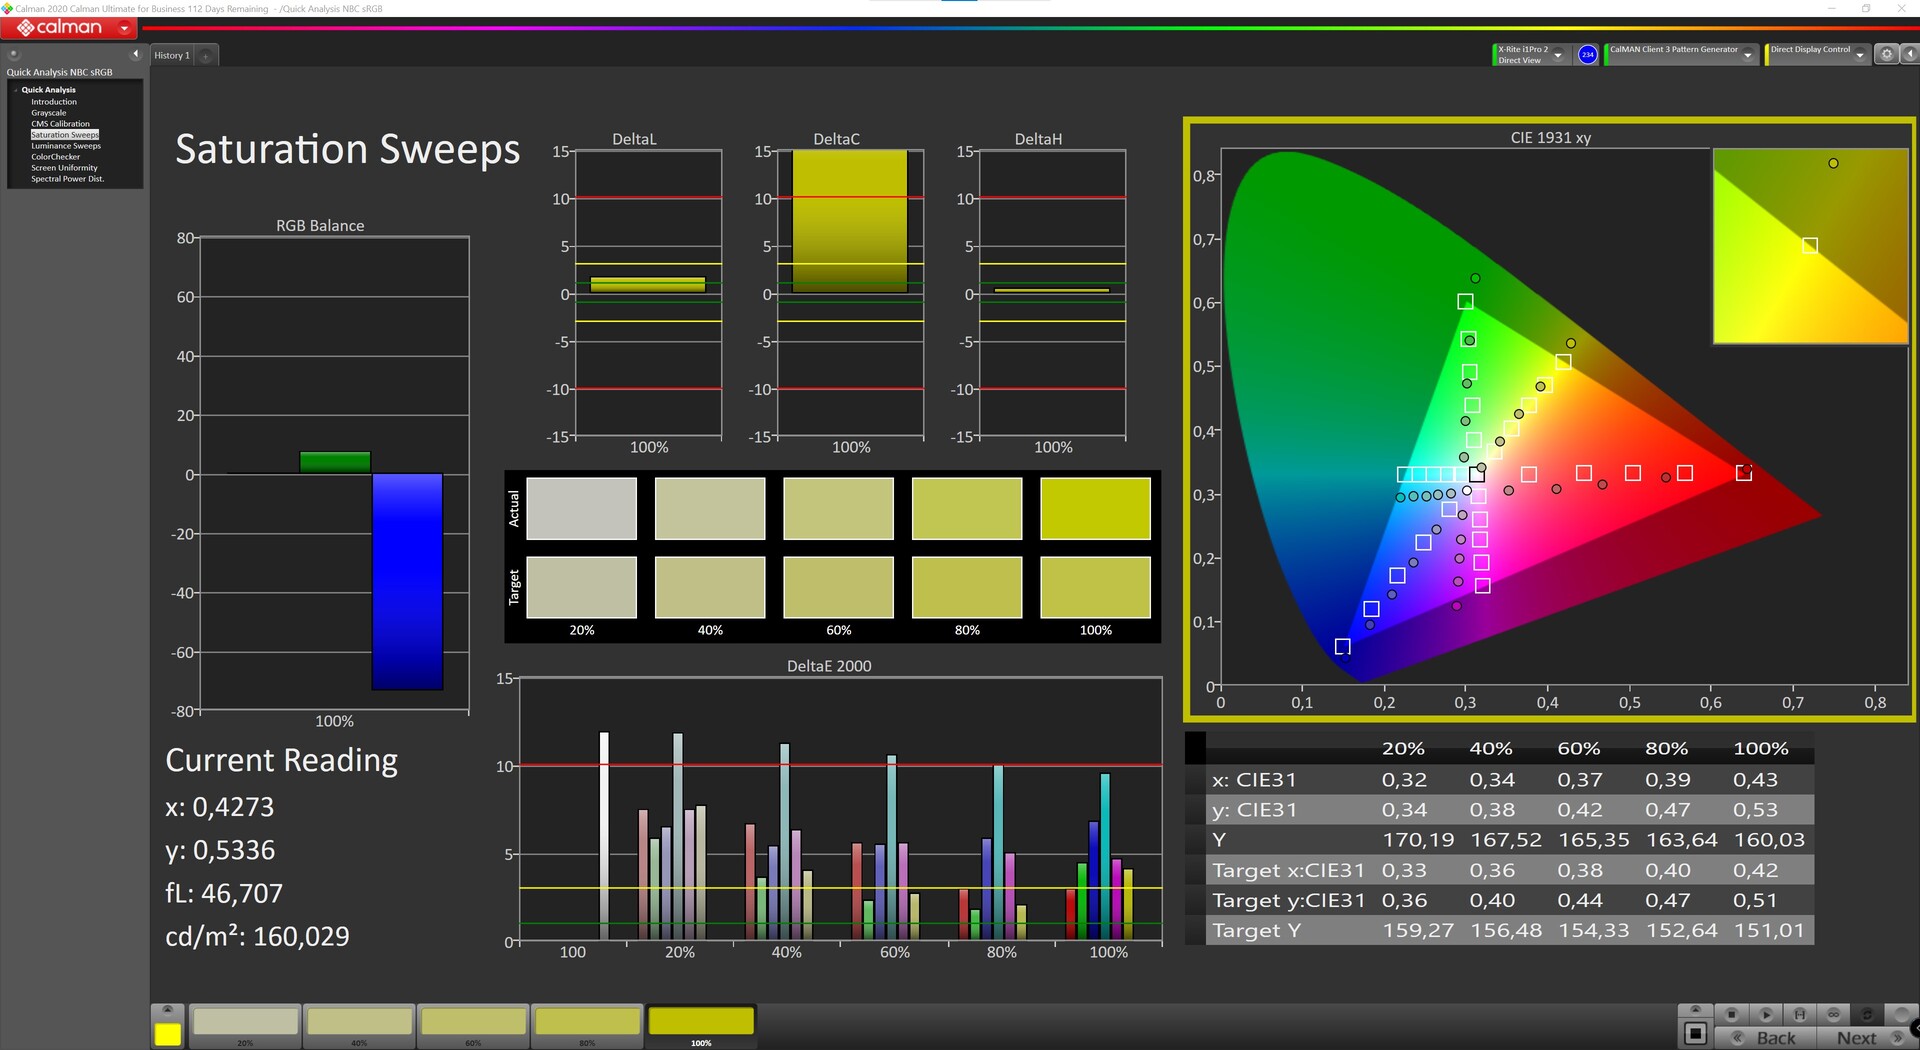
In the state of delivery, clearly increased Delta-E-2000 color deviations compared to the sRGB color space can be seen. A calibration should definitely be performed here if the display's actual purpose is pursued. After the manual calibration, the Delta-E-2000 color deviations could be clearly improved. However, the colors remain above the target value of 3 even after our calibration. In addition, the slight blue cast could be minimized a bit. In terms of the measured color space coverage, the MSI Modern MD271 does quite well with 95% in the sRGB and almost 70% in the Adobe RGB color space. Thus, nothing stands in the way of semi-professional image or video editing.
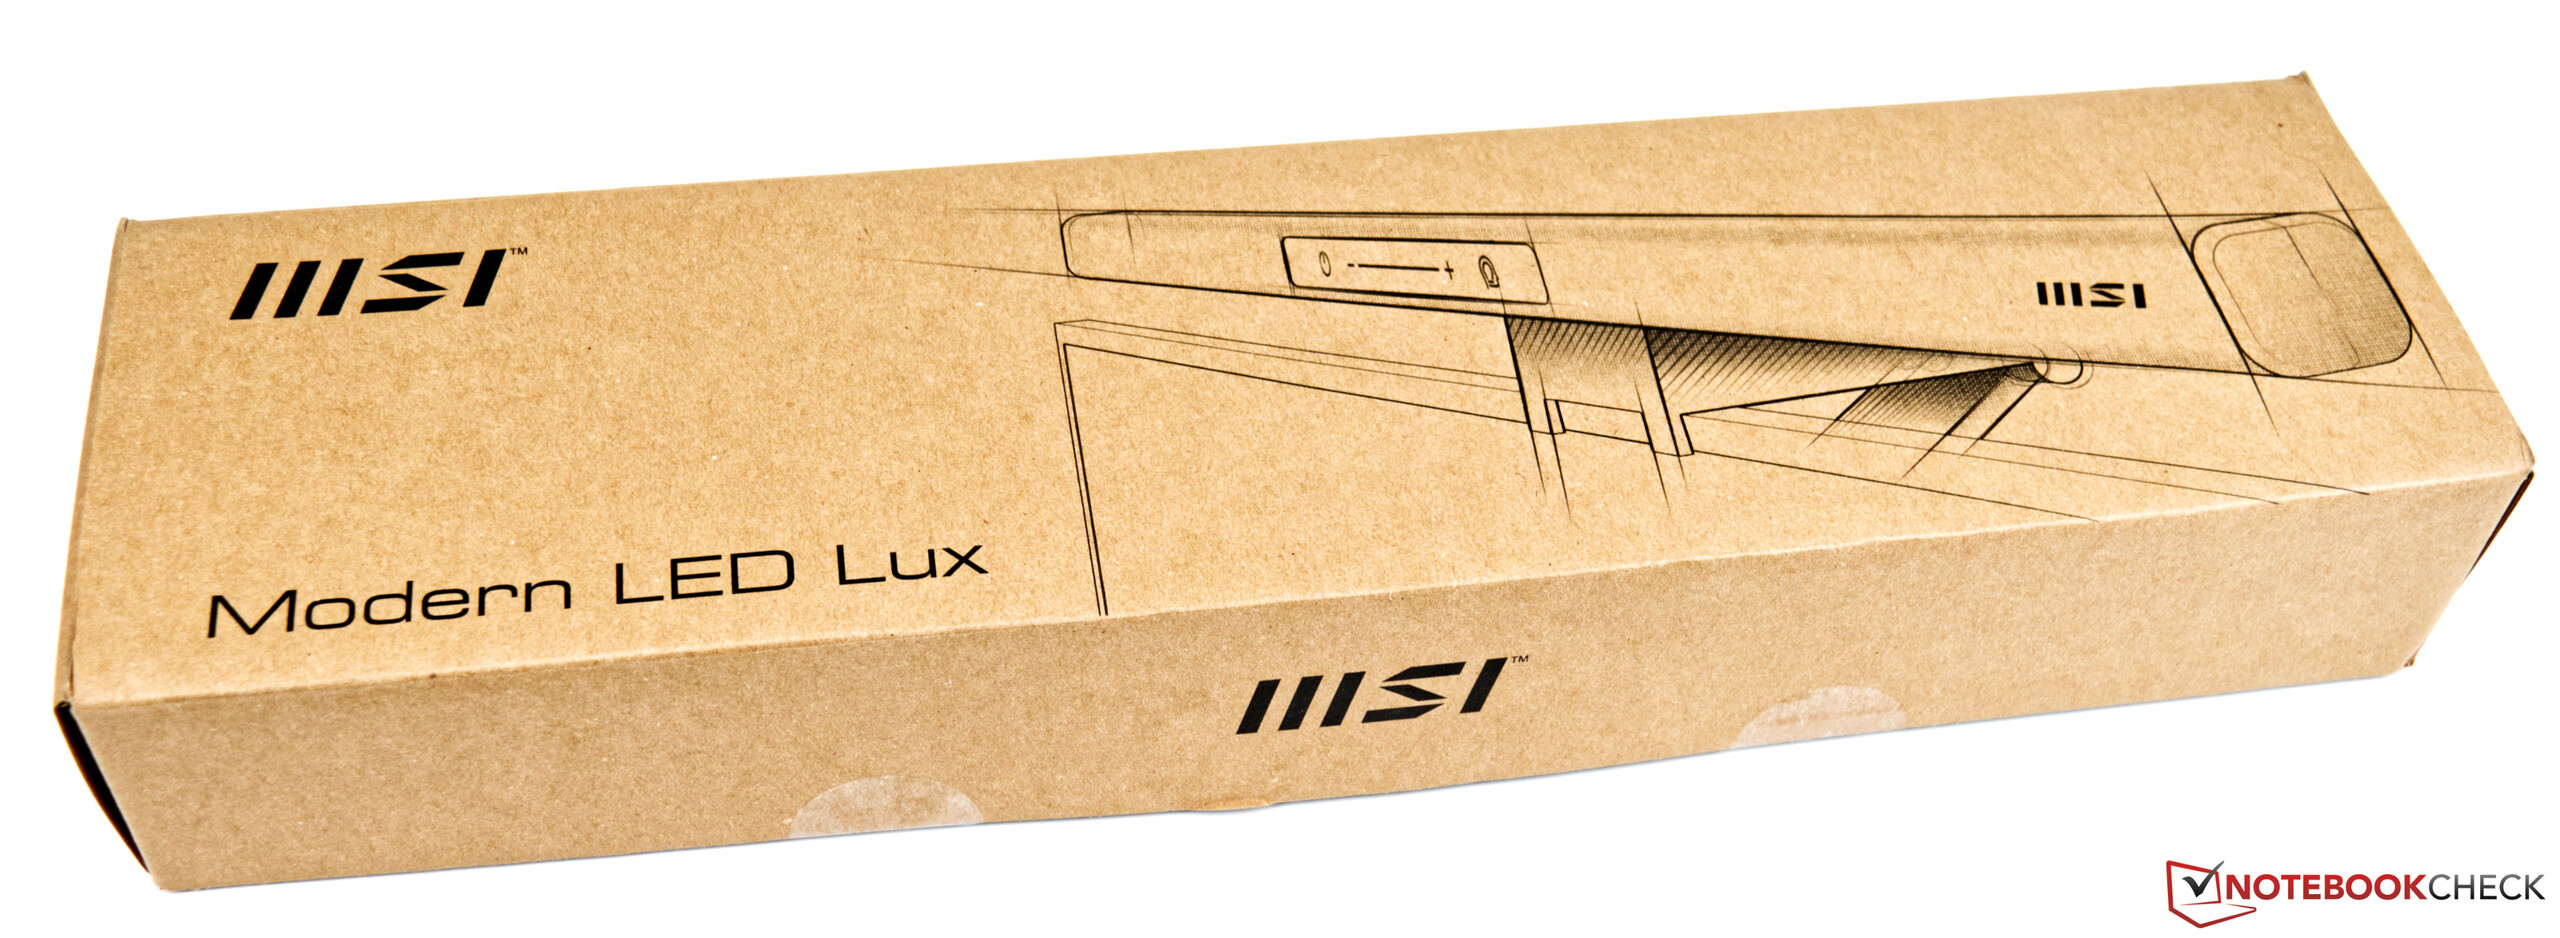
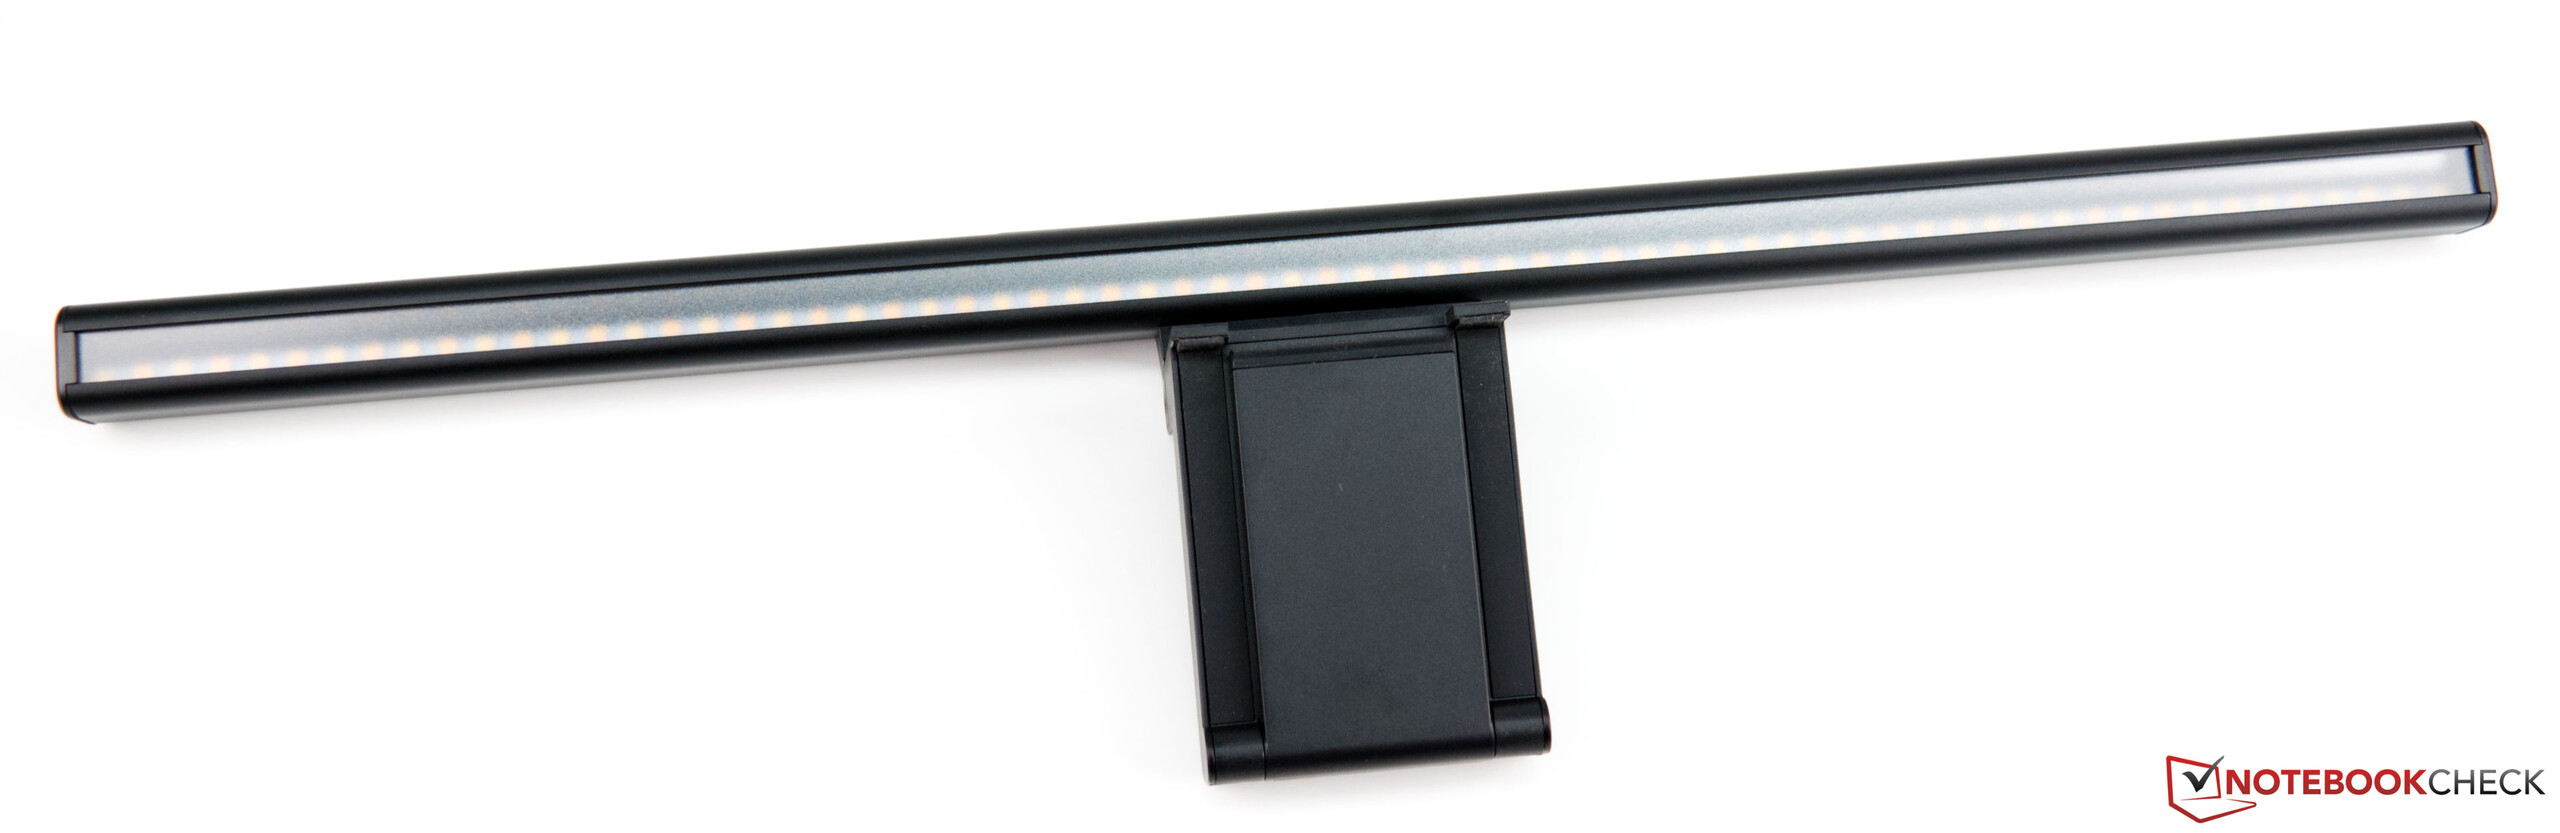
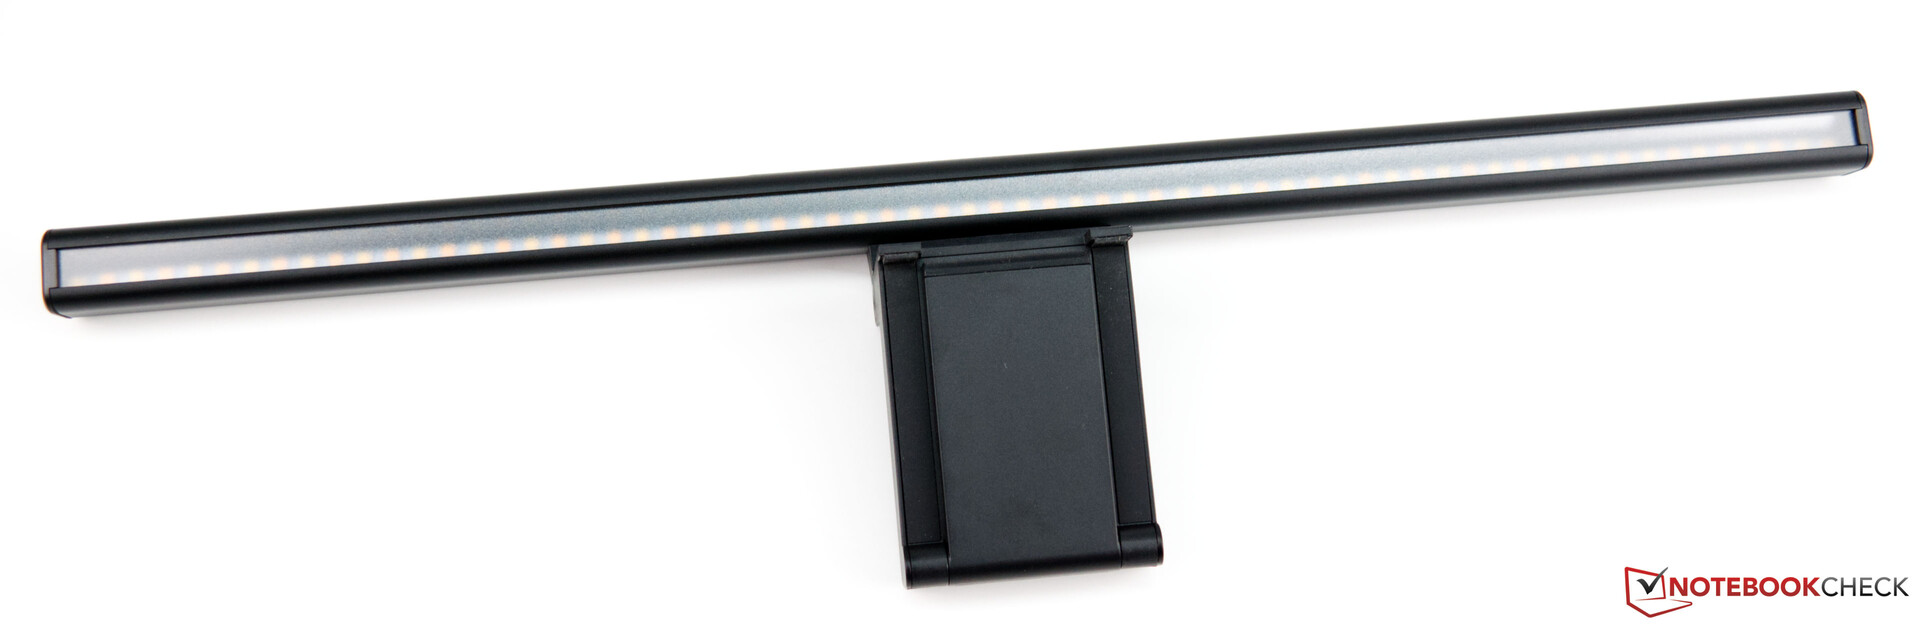
MSI Modern LED Lux Lightbar as an accessory
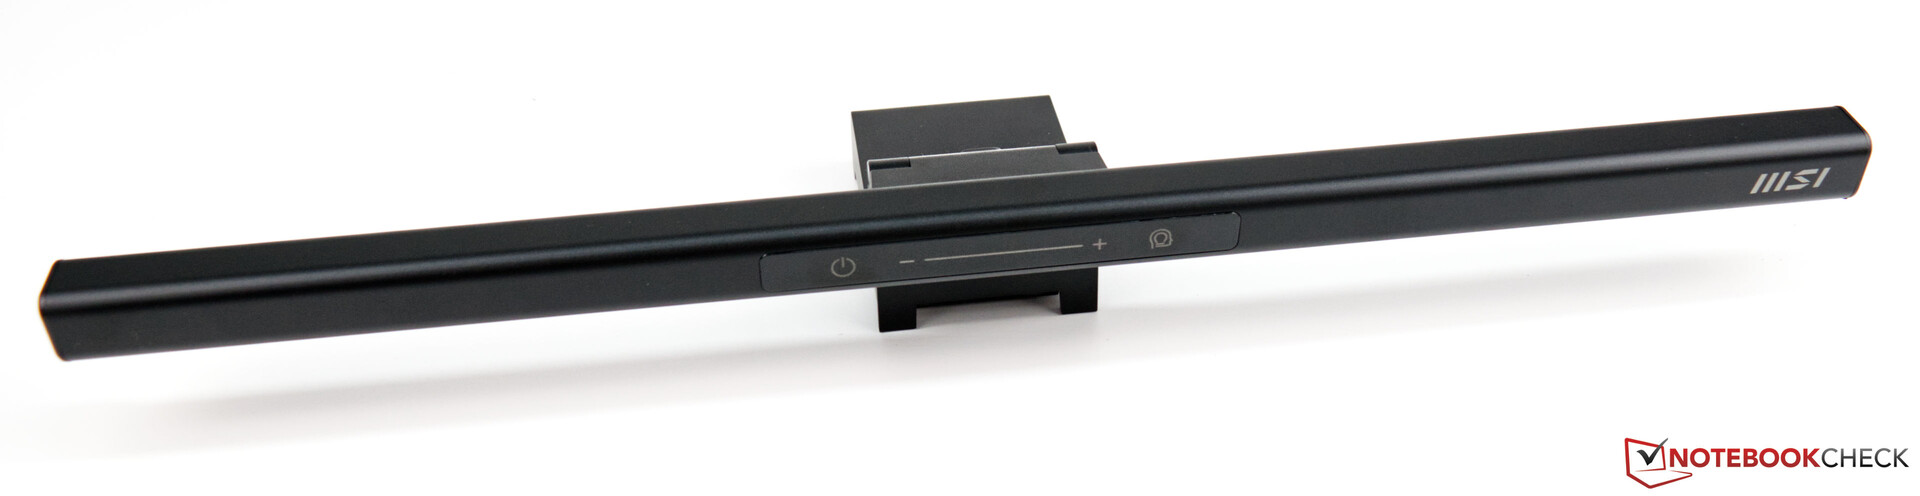
With the MSI Modern LED Lux Lightbar, the manufacturer offers a suitable extension for the workstation to optimally illuminate the keyboard area. Until the end of September, MSI offers the possibility to receive the Modern LED Lux Lightbar with the purchase of a selected MSI product. Here you can find out more details.
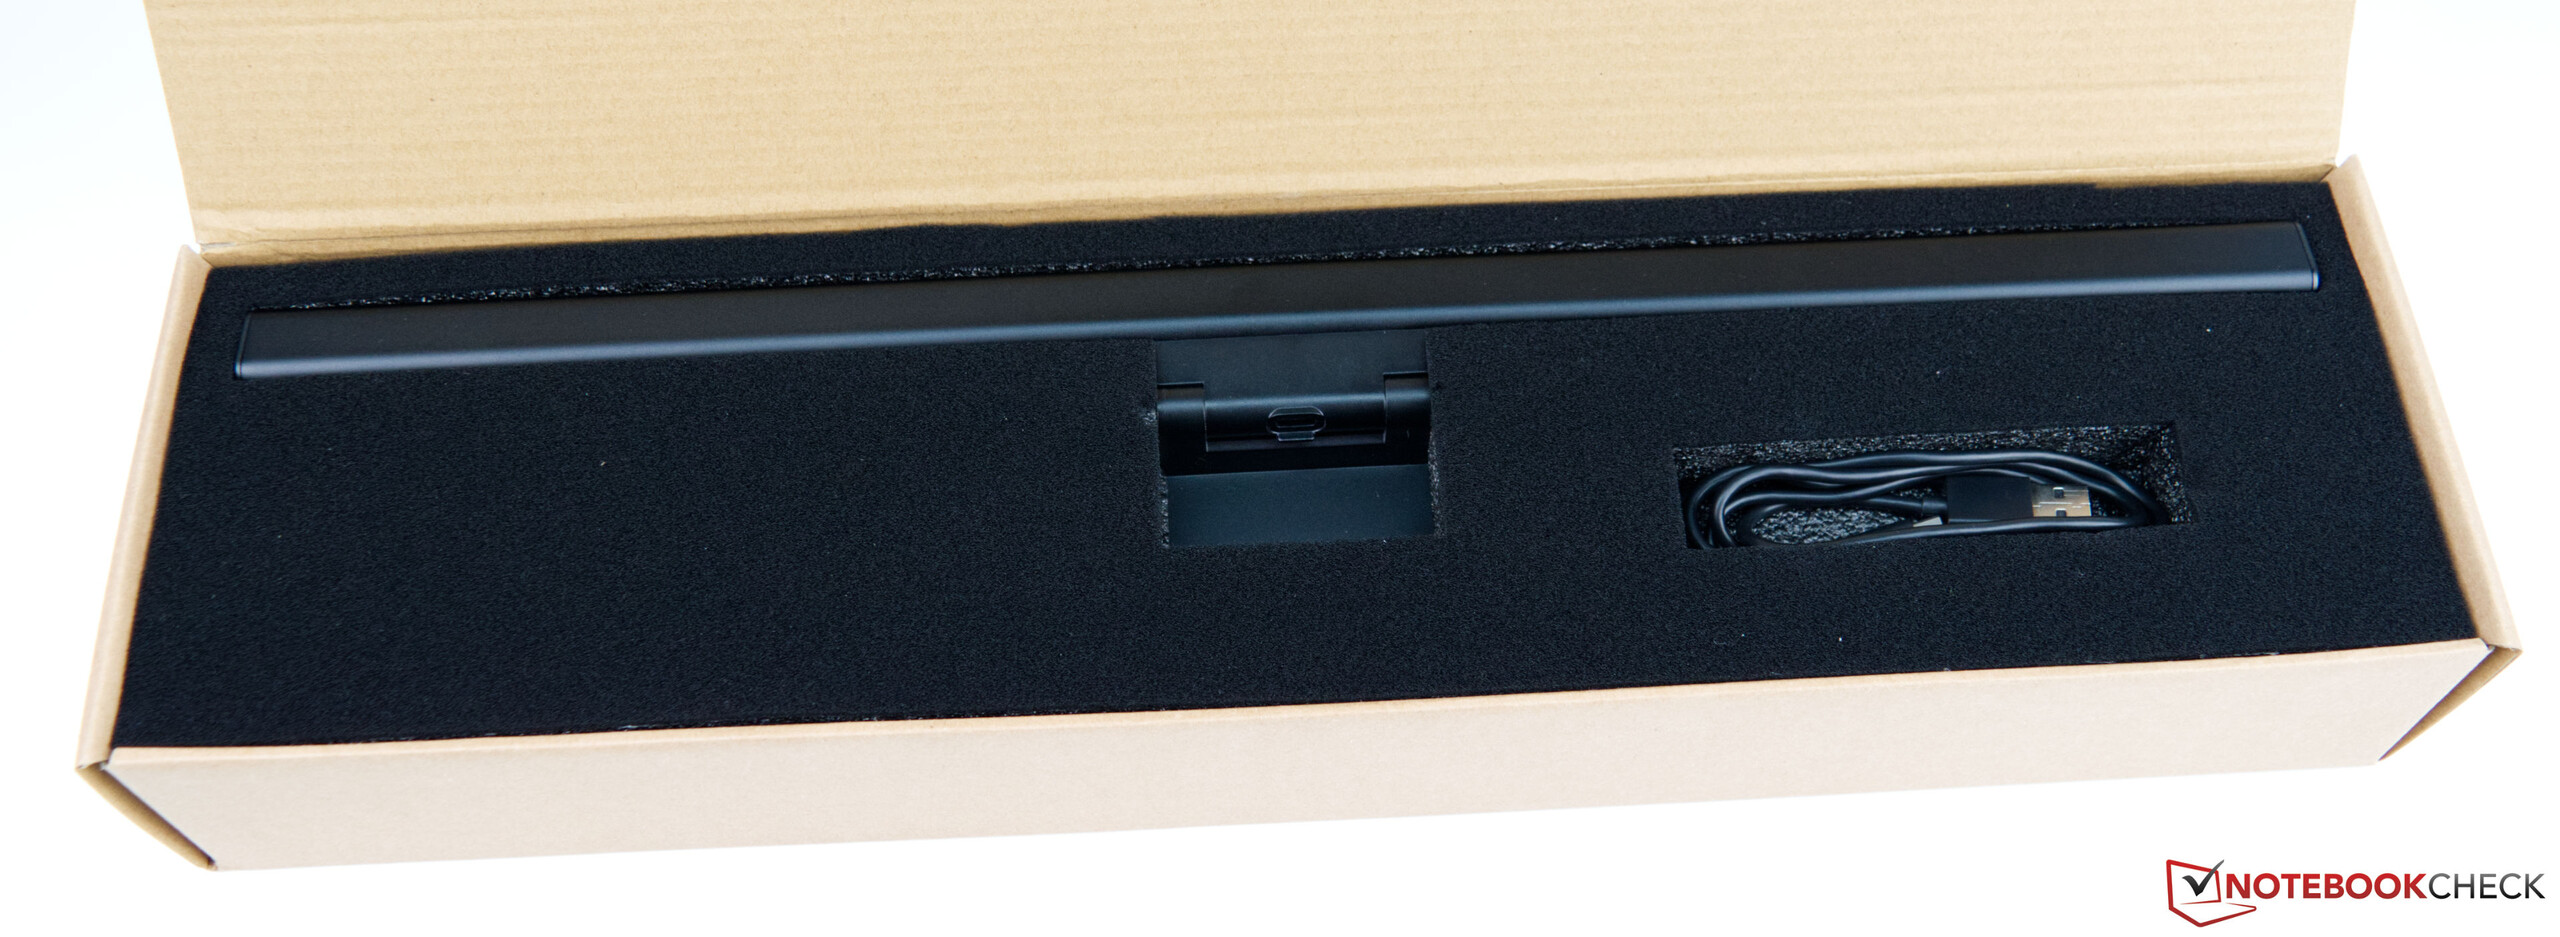
MSI has also provided us with this Lightbar. The product looks and feels very well made. The Lightbar can optionally be installed on many different monitors. For this purpose, the Lightbar is placed on top of the monitor and fixed to the monitor by means of a spring-loaded counterpart. The power is supplied via USB. You can either use a conventional power supply with USB-A port or directly the monitor, if it has USB ports. A corresponding connection cable (USB-A to USB-C) is included.
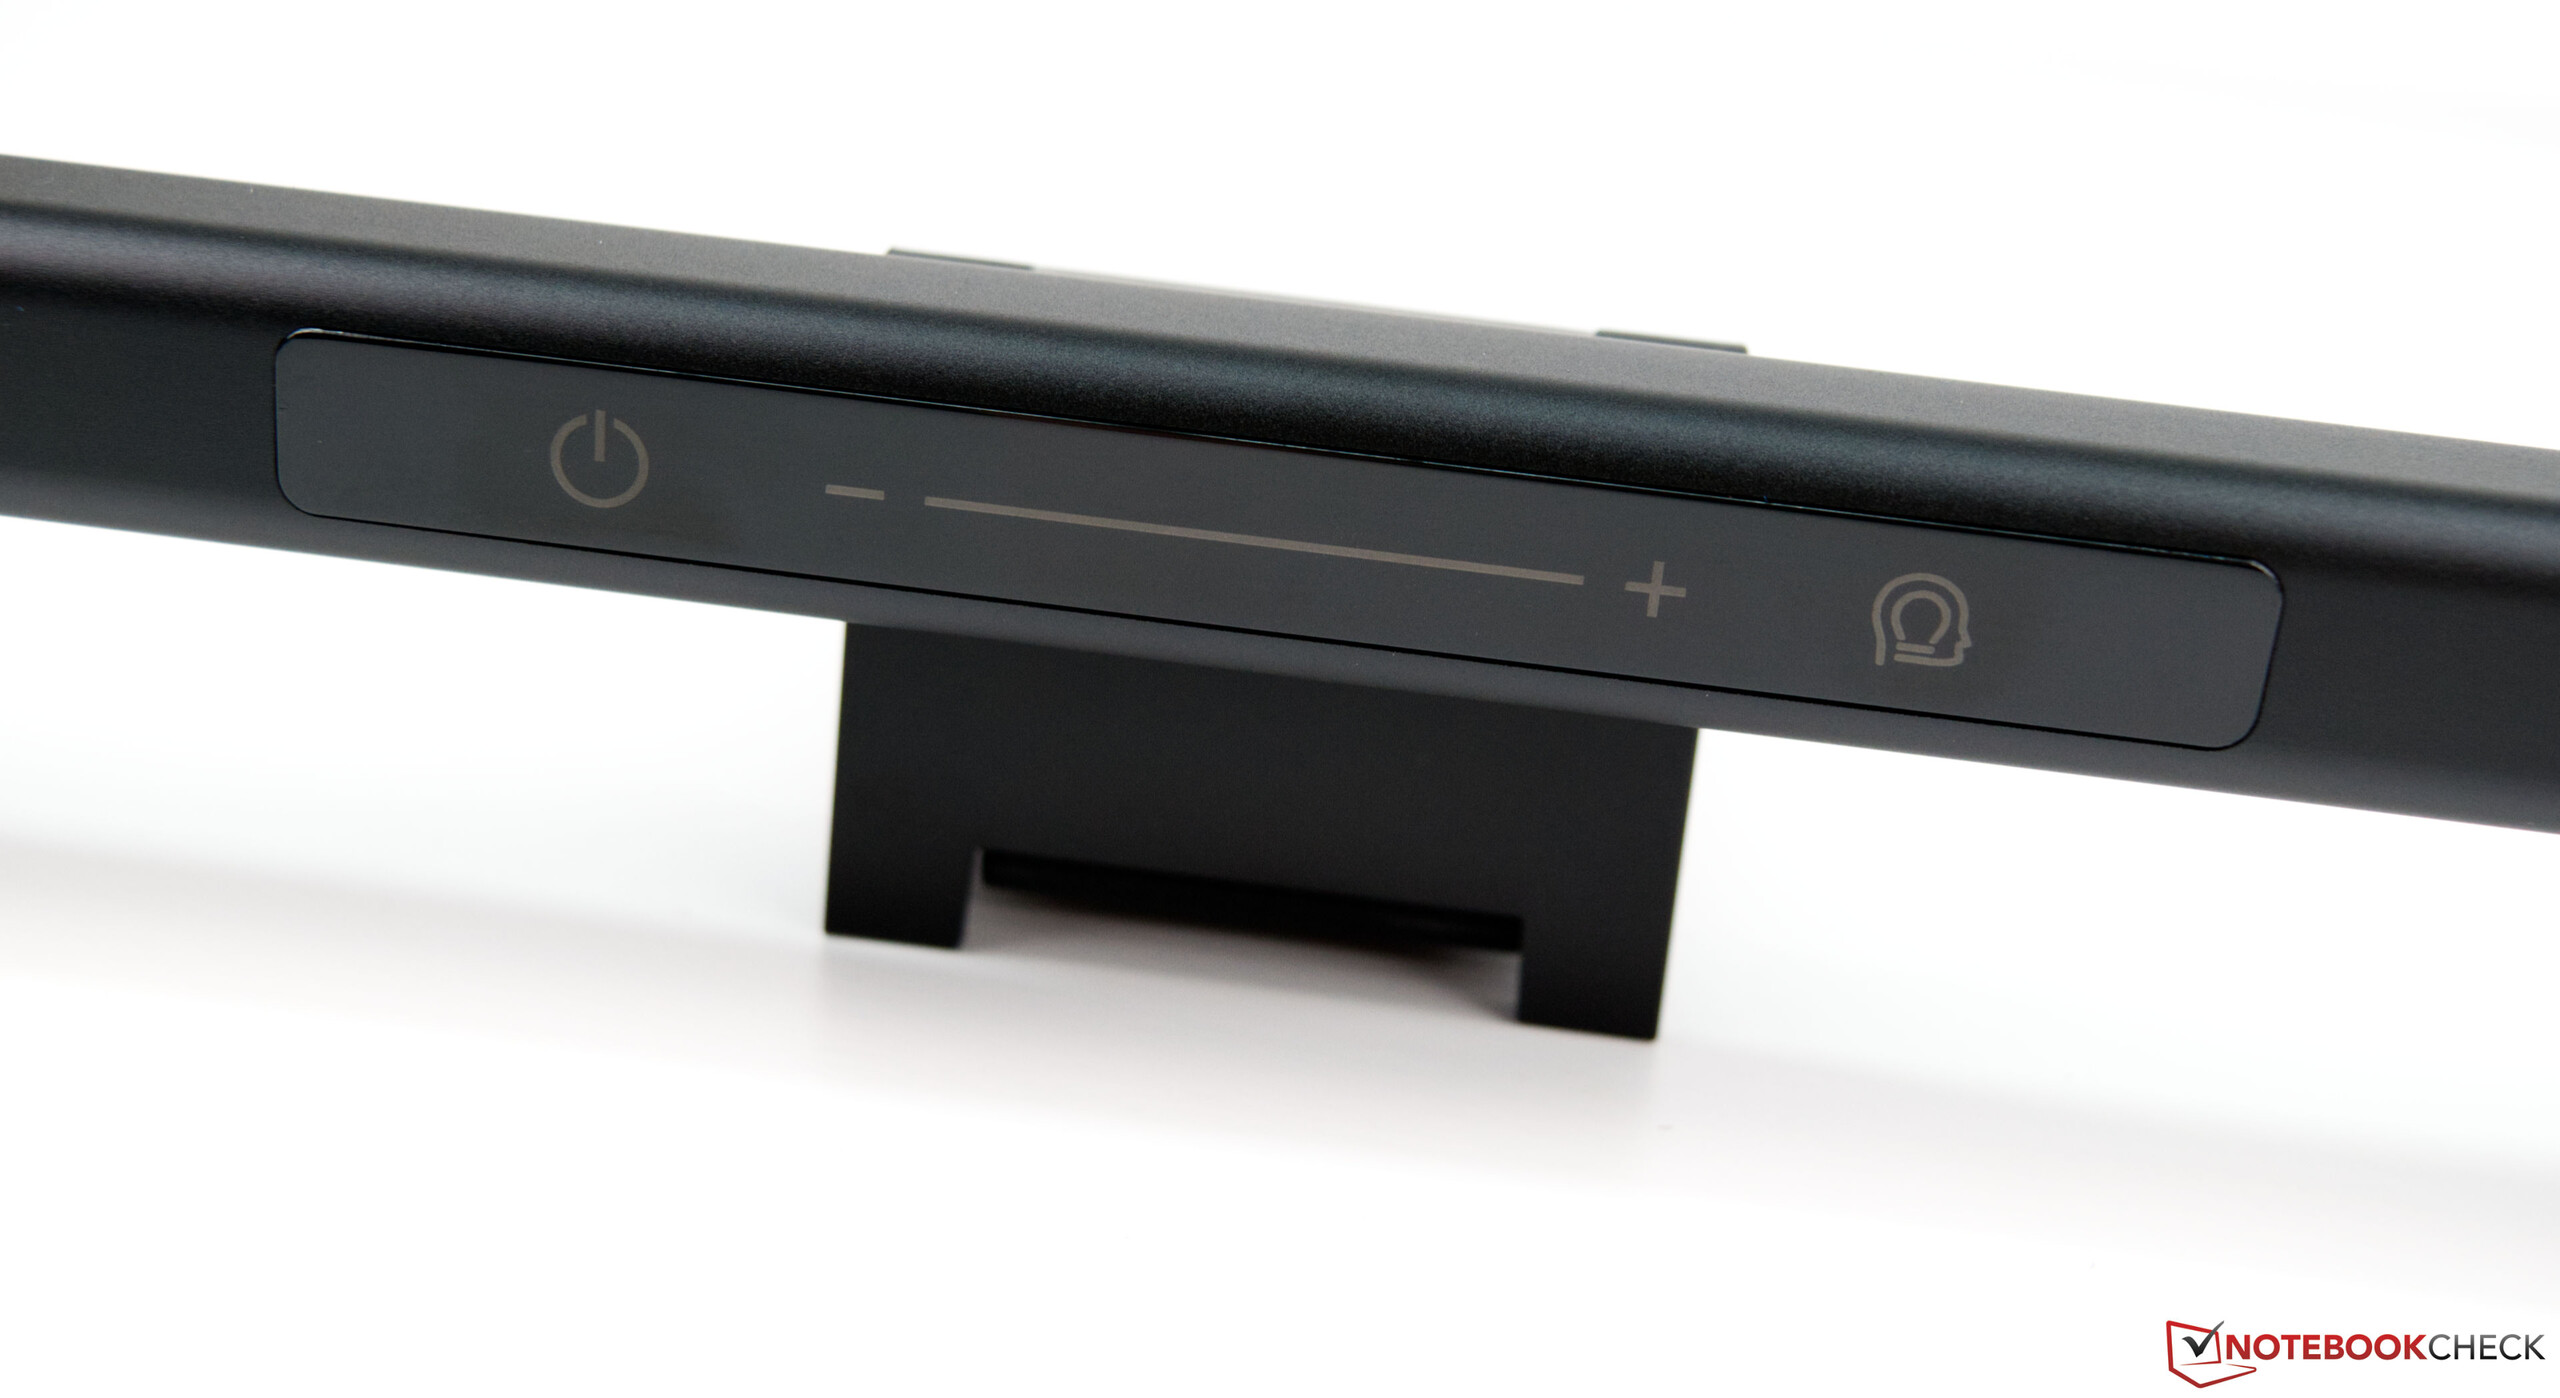
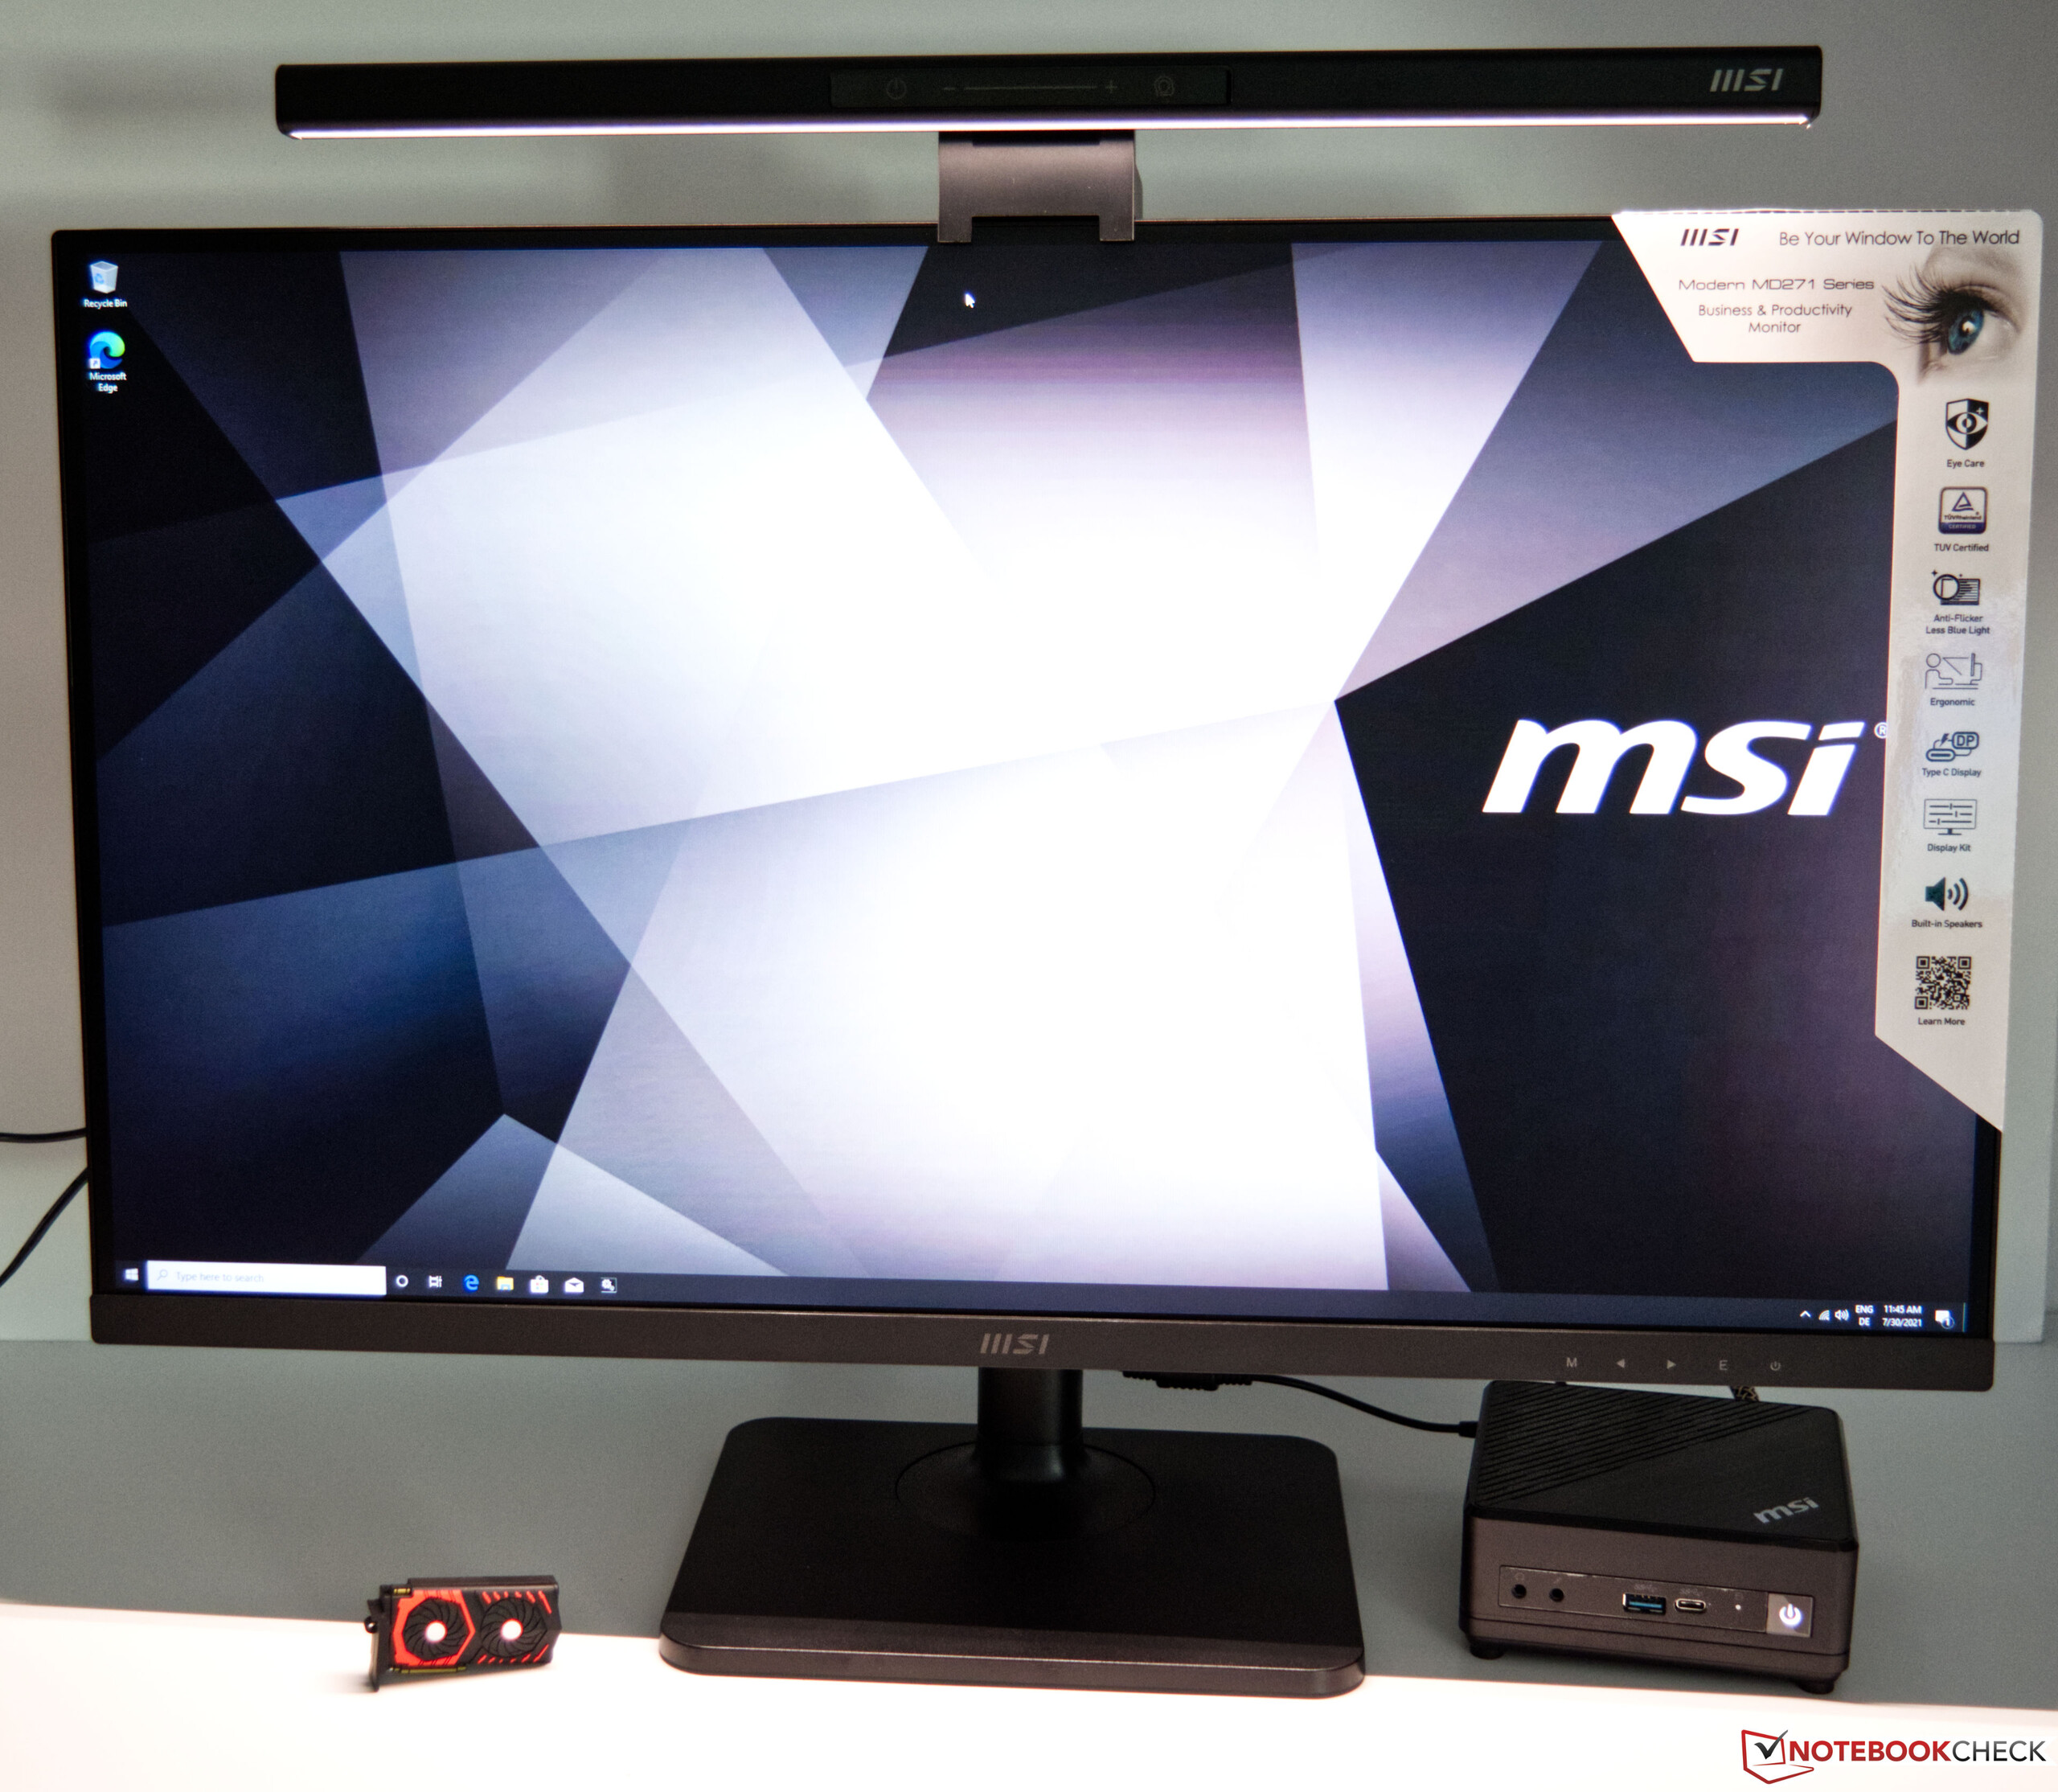
We can say that the Modern LED Lux Lightbar convinced with a pleasant light in the test. The workplace is well illuminated and good work is possible even in complete darkness. In terms of light color, there is the option to choose between warm white or cool white. It is also possible to combine the two. In our opinion, the latter offers the best option. Likewise, the brightness of the Modern LED Lux Lightbar can be continuously adjusted. Intensity and light color can be selected via the touch-sensitive surface on the front.
Pros
Cons
Conclusion - small office PC, solid monitor and useful lightbar

The MSI Cubi 5 10M is a small office PC, but nothing more. The Intel Core i3-10110U is sufficient as an SoC for everyday office work and web browsing. You can live with the working memory, even though the installed 4 GB should really be the minimum for today's work PCs. The option of 8 GB is not expensive and can be done in no time. The system scores better in terms of mass storage. Here, the NVMe SSD could convince with a solid performance. Considering the installed components, a SATA SSD would have done as well. The price difference would probably not be significant. So why not install the better product? Thanks MSI!
The MSI Cubi 5 M10 is a compact office PC. If you can live with the weaknesses, you'll get a full-fledged PC without hidden additional costs.
Visually, the device is quite inconspicuous and cuts a good figure on the desk. Nevertheless, one could consider developing a somewhat flatter version of the Cubi 5 10M. Intel has been doing this with their NUC series for a few years now. A sophisticated design should still make it possible to accommodate two mass storage devices. It doesn't necessarily have to be a 2.5-inch drive. The Cubi 5 10M's performance is where you would expect it to be according to the technical specifications. The external start button serves as a useful feature if you install the Cubi 5 M10 directly to the monitor's VESA mount.
The MSI Cubi 5 10M is currently available for just under 560 Euros (~$661) on Amazon.
The MSI Modern MD271 27-inch monitor is visually modern and offers good equipment. The measured brightness was above the manufacturer's specifications, which definitely deserves praise. Nevertheless, the Delta E-2000 color deviations are much too high in the state of delivery. You won't get around a calibration here if the monitor is to be used for content creation as advertised. The MSI Modern LED Lux Lightbar is a very useful feature. It provides a pleasant illumination of the workspace around the keyboard. And those who buy a selected MSI product until the end of September can secure it. Further information about the promotion can be found here.
Price and availability
The MSI Cubi 5 10M is currently available at Amazon for €630 (~$744).

