Nexoc B519 (Clevo N350DW) Review
For the original German review, see here.
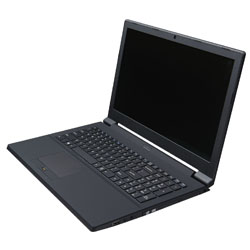
The Nexoc B519 is a 15-inch office notebook. It can be configured individually and is based on the barebone chassis N350DW from the manufacturer Clevo. The office orientation is supported by the matte FHD panel, the docking port, the fingerprint scanner, TPM 2.0 and the optional SmartCard reader. In this article, we want to have a look at the processor in particular, because you do not get the usual frugal mobile processor, but a desktop i5-6600T CPU from Intel's current Skylake generation. We had not tested this processor until now.
But what are the advantages of the desktop processor and how does it compare against its mobile siblings? Almost all the direct rivals for the 15-inch office notebook are equipped with frugal ULV processors by now, one example would be the Lenovo ThinkPad E560 with the mobile Core i7. The faster processors with a higher TDP are usually reserved for multimedia notebooks or workstations like the Dell XPS 15 with the comparable i5-6300HQ as well as the Dell Inspiron 15 with the popular Core i7-6700HQ.
Display
| |||||||||||||||||||||||||
Brightness Distribution: 87 %
Center on Battery: 332 cd/m²
Contrast: 1006:1 (Black: 0.33 cd/m²)
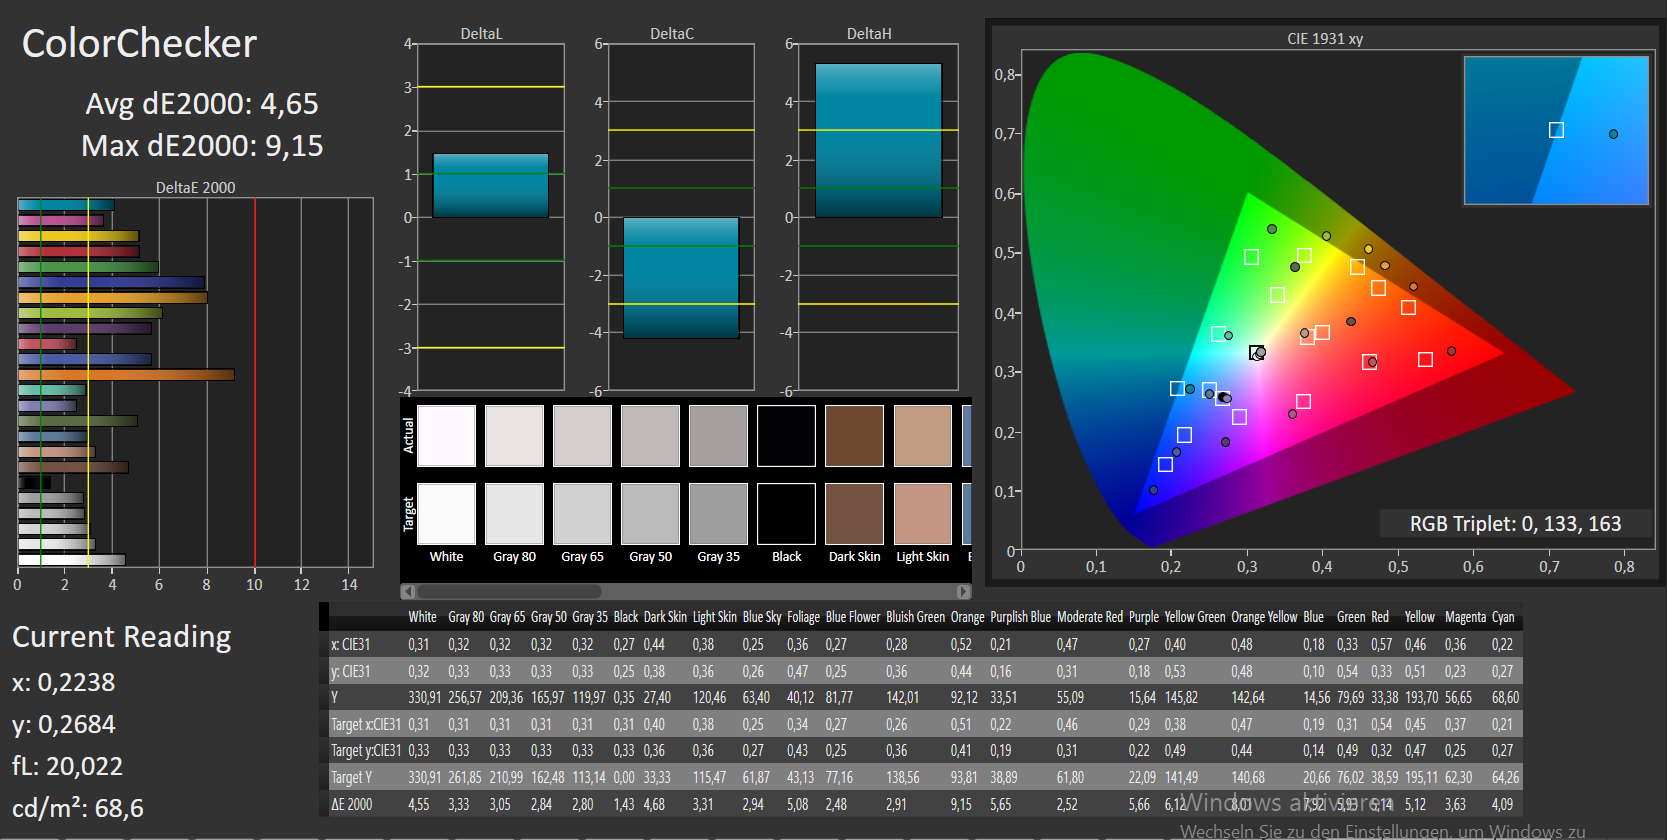
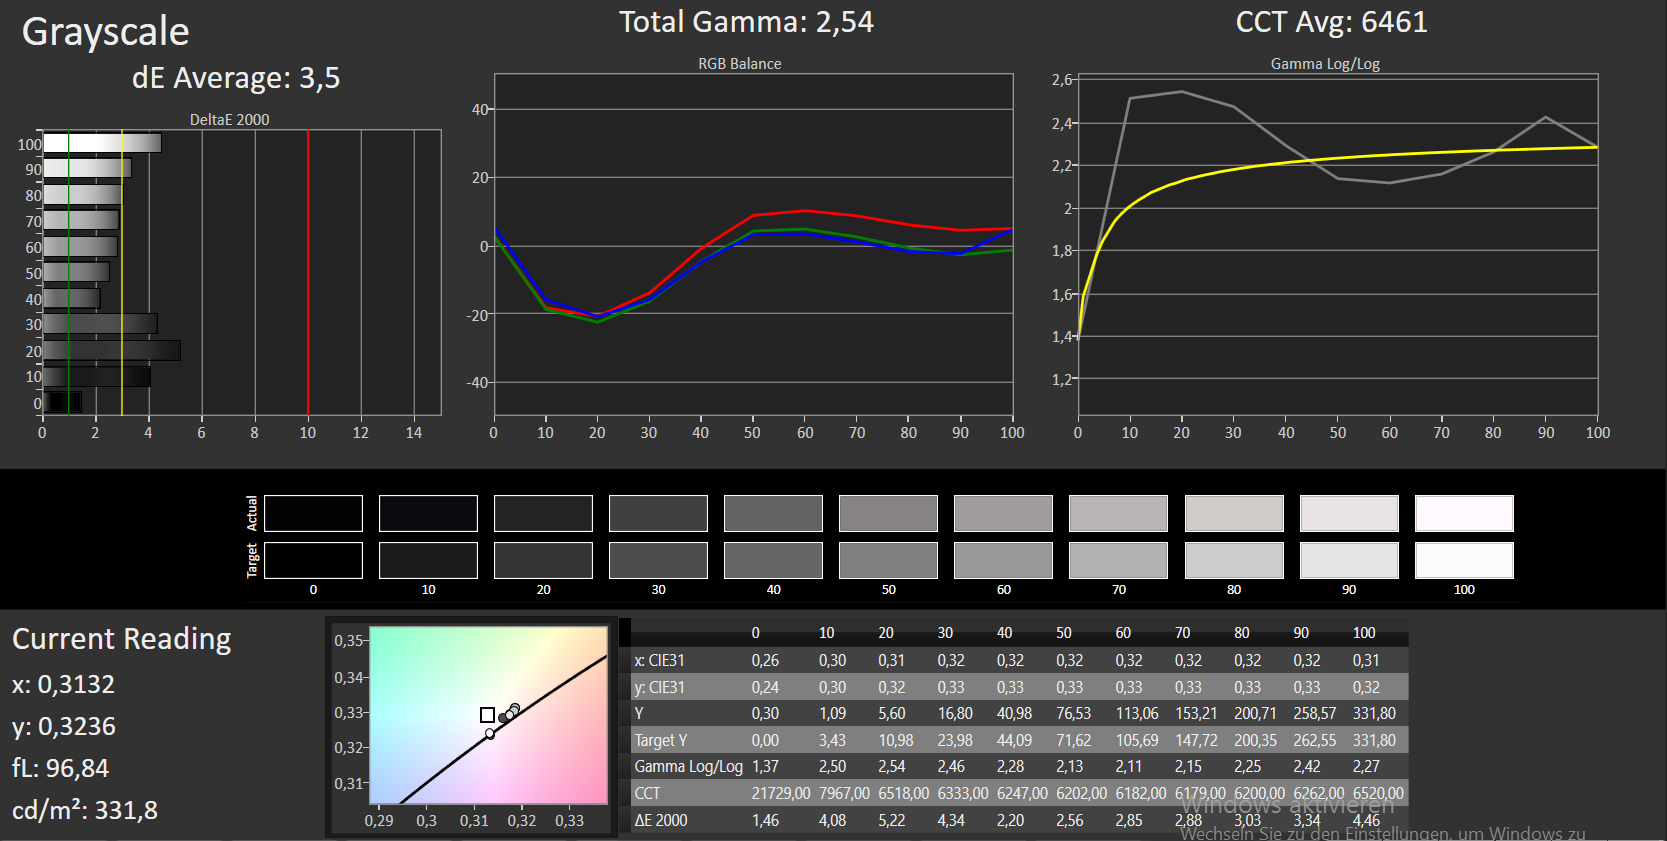
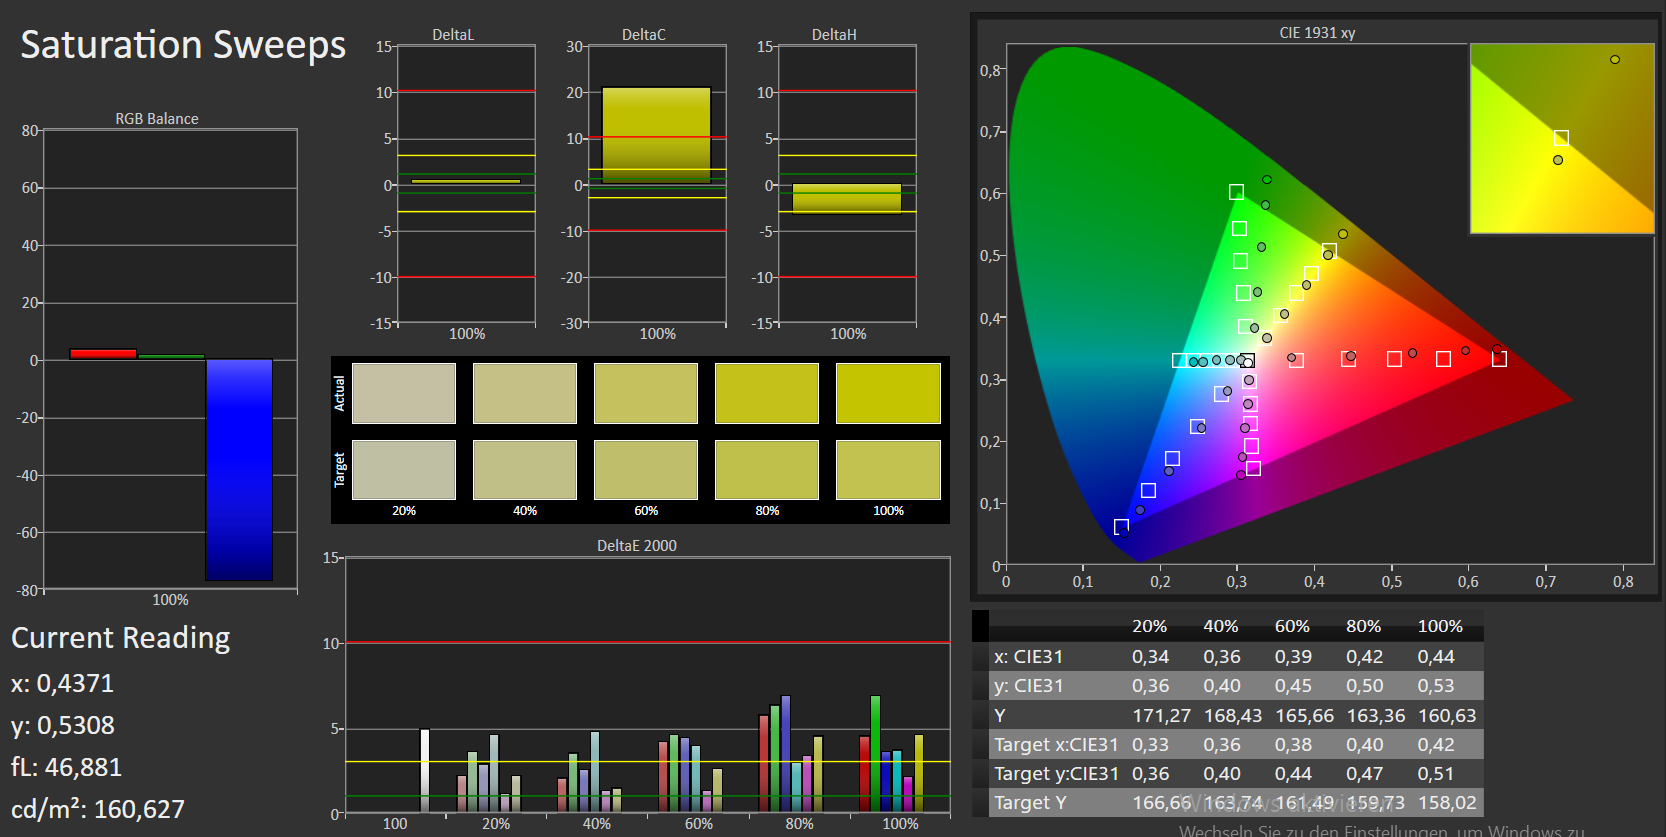
ΔE ColorChecker Calman: 4.65 | ∀{0.5-29.43 Ø4.73}
ΔE Greyscale Calman: 3.5 | ∀{0.09-98 Ø4.97}
83% sRGB (Argyll 1.6.3 3D)
54% AdobeRGB 1998 (Argyll 1.6.3 3D)
Gamma: 2.54
CCT: 6461 K
| Nexoc B519 N350DW HD Graphics 530, 6600T, Samsung SM951 MZHPV256HDGL m.2 PCI-e | Lenovo ThinkPad E560-20EWS00000 Radeon R7 M370, 6500U, Samsung CM871 MZ7LF192HCGS | Dell XPS 15 2016 9550 GeForce GTX 960M, 6300HQ, WDC WD10SPCX-75KHST0 + LiteON CS1-SP32-11 M.2 2242 32GB | Dell Inspiron 15 7559 GeForce GTX 960M, 6700HQ, SK hynix SC300 M.2 | |
|---|---|---|---|---|
| Screen | -26% | 1% | -26% | |
| Brightness middle (cd/m²) | 332 | 257 -23% | 399 20% | 276 -17% |
| Brightness (cd/m²) | 310 | 234 -25% | 394 27% | 273 -12% |
| Brightness Distribution (%) | 87 | 83 -5% | 89 2% | 85 -2% |
| Black Level * (cd/m²) | 0.33 | 0.27 18% | 0.24 27% | 0.78 -136% |
| Contrast (:1) | 1006 | 952 -5% | 1663 65% | 354 -65% |
| Colorchecker dE 2000 * | 4.65 | 7.16 -54% | 5.95 -28% | 4.05 13% |
| Greyscale dE 2000 * | 3.5 | 6.28 -79% | 8.41 -140% | 4.68 -34% |
| Gamma | 2.54 87% | 2.44 90% | 2.35 94% | 2.55 86% |
| CCT | 6461 101% | 6806 96% | 7010 93% | 6871 95% |
| Color Space (Percent of AdobeRGB 1998) (%) | 54 | 36.6 -32% | 64 19% | 58 7% |
| Color Space (Percent of sRGB) (%) | 83 | 57.3 -31% | 98 18% | 90 8% |
* ... smaller is better
Display Response Times
| ↔ Response Time Black to White | ||
|---|---|---|
| 28 ms ... rise ↗ and fall ↘ combined | ↗ 7 ms rise | 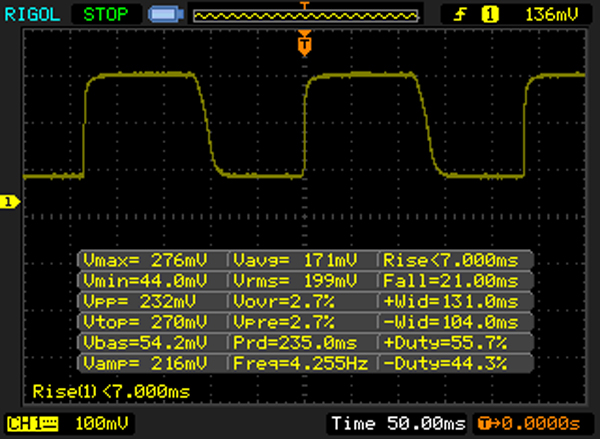 |
| ↘ 21 ms fall | ||
| The screen shows relatively slow response rates in our tests and may be too slow for gamers. In comparison, all tested devices range from 0.1 (minimum) to 240 (maximum) ms. » 71 % of all devices are better. This means that the measured response time is worse than the average of all tested devices (19.9 ms). | ||
| ↔ Response Time 50% Grey to 80% Grey | ||
| 56 ms ... rise ↗ and fall ↘ combined | ↗ 18 ms rise | 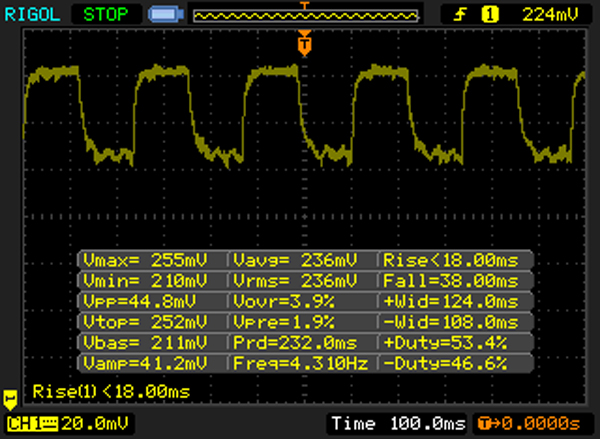 |
| ↘ 38 ms fall | ||
| The screen shows slow response rates in our tests and will be unsatisfactory for gamers. In comparison, all tested devices range from 0.165 (minimum) to 636 (maximum) ms. » 93 % of all devices are better. This means that the measured response time is worse than the average of all tested devices (31.1 ms). | ||
Screen Flickering / PWM (Pulse-Width Modulation)
| Screen flickering / PWM detected | 2083 Hz | ≤ 70 % brightness setting | 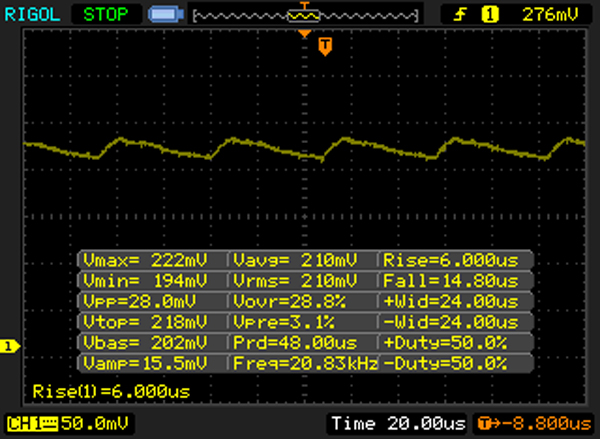 |
The display backlight flickers at 2083 Hz (worst case, e.g., utilizing PWM) Flickering detected at a brightness setting of 70 % and below. There should be no flickering or PWM above this brightness setting. The frequency of 2083 Hz is quite high, so most users sensitive to PWM should not notice any flickering. In comparison: 52 % of all tested devices do not use PWM to dim the display. If PWM was detected, an average of 7801 (minimum: 5 - maximum: 343500) Hz was measured. | |||

Performance
Processor
The Intel Core i5-6600T is a quad-core processor (Skylake) with a nominal clock of 2.7 GHz, which can be raised up to 3.5 GHz via Turbo Boost. It is a desktop chip with a TDP of 35 watts, which - contrary to the mobile ULV processors - does not support Hyperthreading.
The mobile ULV i7 benefits from its high Turbo Boost when you just stress one core and only falls behind the desktop i5 by 8% in Cinebench R15, while the 45-watt i7-6700HQ is 8% faster. Our i5 is sometimes considerably slower than its mobile counterparts are when you stress more cores, because it does not support Hyperthreading. Only the ULV i7 is 24% slower in CB R15 Multi. The nominally slightly slower i5-6300HQ (no Hyperthreading either) is on par and sometimes even a bit faster (+10% CB R15 Multi), but also consumes more power in return due to its TDP of 45 watts.
The differences in the benchmarks are therefore not that big, but the desktop processor has an advantage in the stress test. The clock is between 2.7-3.3 GHz when we only stress the processor (Prime95) and it will stabilize at 2.7 GHz when we also stress the graphics card (FurMark). You can therefore benefit from steady performance without throttling when you often use CPU-demanding applications. The ULV chips in particular are often limited by the low TDP in this scenario.
| Cinebench R10 | |
| Rendering Single CPUs 64Bit (sort by value) | |
| Nexoc B519 N350DW | |
| Lenovo ThinkPad E560-20EWS00000 | |
| Dell XPS 15 2016 9550 | |
| Rendering Multiple CPUs 64Bit (sort by value) | |
| Nexoc B519 N350DW | |
| Lenovo ThinkPad E560-20EWS00000 | |
| Dell XPS 15 2016 9550 | |
System Performance
| PCMark 8 - Home Score Accelerated v2 (sort by value) | |
| Nexoc B519 N350DW | |
| Lenovo ThinkPad E560-20EWS00000 | |
| Dell XPS 15 2016 9550 | |
| Dell Inspiron 15 7559 | |
| PCMark 7 Score | 6333 points | |
| PCMark 8 Home Score Accelerated v2 | 3824 points | |
Help | ||
Storage Devices

GPU Performance
| 3DMark 06 Standard Score | 11668 points | |
| 3DMark 11 Performance | 1761 points | |
| 3DMark Ice Storm Standard Score | 77528 points | |
| 3DMark Cloud Gate Standard Score | 7652 points | |
| 3DMark Fire Strike Score | 988 points | |
Help | ||
Emissions & Energy
System Noise
Noise level
| Idle |
| 32.7 / 33.7 / 33.7 dB(A) |
| DVD |
| 37.7 / dB(A) |
| Load |
| 44.9 / 48.9 dB(A) |
 | ||
30 dB silent 40 dB(A) audible 50 dB(A) loud |
||
min: | ||
Temperature
(-) The maximum temperature on the upper side is 45.3 °C / 114 F, compared to the average of 34.3 °C / 94 F, ranging from 21.2 to 62.5 °C for the class Office.
(-) The bottom heats up to a maximum of 49.4 °C / 121 F, compared to the average of 36.8 °C / 98 F
(+) In idle usage, the average temperature for the upper side is 30.6 °C / 87 F, compared to the device average of 29.5 °C / 85 F.
(±) The palmrests and touchpad can get very hot to the touch with a maximum of 38 °C / 100.4 F.
(-) The average temperature of the palmrest area of similar devices was 27.5 °C / 81.5 F (-10.5 °C / -18.9 F).
| Nexoc B519 N350DW HD Graphics 530, 6600T, Samsung SM951 MZHPV256HDGL m.2 PCI-e | Lenovo ThinkPad E560-20EWS00000 Radeon R7 M370, 6500U, Samsung CM871 MZ7LF192HCGS | Dell XPS 15 2016 9550 GeForce GTX 960M, 6300HQ, WDC WD10SPCX-75KHST0 + LiteON CS1-SP32-11 M.2 2242 32GB | Dell Inspiron 15 7559 GeForce GTX 960M, 6700HQ, SK hynix SC300 M.2 | |
|---|---|---|---|---|
| Power Consumption | 39% | -8% | -20% | |
| Idle Minimum * (Watt) | 11.9 | 4.2 65% | 9.9 17% | 9.4 21% |
| Idle Average * (Watt) | 15.8 | 7.5 53% | 12.6 20% | 14.4 9% |
| Idle Maximum * (Watt) | 18 | 8.2 54% | 16.8 7% | 15 17% |
| Load Average * (Watt) | 57.6 | 49.6 14% | 70 -22% | 102 -77% |
| Load Maximum * (Watt) | 70.7 | 65.8 7% | 114 -61% | 120 -70% |
* ... smaller is better
Power Consumption
| Off / Standby | |
| Idle | |
| Load |
|
Key:
min: | |
Verdict

An office notebook with a powerful desktop processor, is it worth it? The tested Intel Core i5-6600T leaves a good first impression. The performance is steady, even in the stress test, which can be an advantage when you use very CPU-demanding applications. The majority of office notebooks are equipped with frugal ULV chips nowadays, and the performance is often not much worse. They do have significant advantages in terms of power consumption in return and enable thinner cases, so they are often the better choice for office tasks.
The i5-6600T is an interesting option when you often use very CPU-demanding applications. Otherwise, the ULV chips offer the better overall package in respect to performance and emissions.
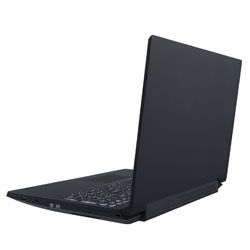
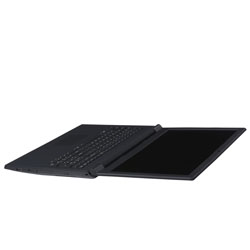
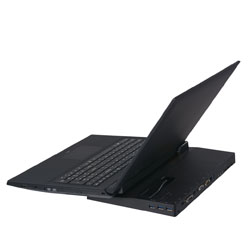
The Nexoc B519 performs well in many sections, starting with the very good FHD IPS display, the high system performance and the good maintainability. The office orientation is pretty serious as well, because the Clevo N350DW chassis is equipped with a decent keyboard, TPM 2.0, a fingerprint scanner, a docking port and an optional SmartCard reader. The touchpad buttons with their spongy pressure point are a problem though, because you never know if they triggered or not. The biggest issue, however, are the emissions, because both the temperature and the noise development are too high considering the chassis dimensions and the performance.
Price comparison
