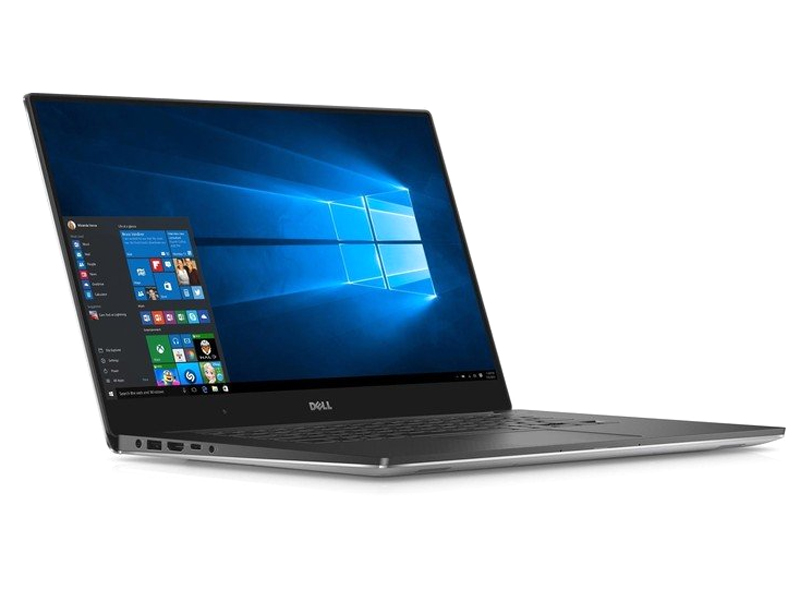
Dell XPS 15 2016 (9550) InfinityEdge Notebook Review

For the original German review, see here.
Now it is finally here, the XPS 15, probably one of the most desired devices of the year. It is supposed to be the bigger brother of the successful Infinity Edge XPS 13: Same look, similarly thin display bezel, and the same high-end build quality – all that in an extremely thin case. The 15-inch XPS 15 is obviously better and faster, because instead of the 15-Watt ULV SoC, it is equipped with an i5-6300HQ and a GeForce GTX 960M.
The first review from our colleagues at Golem.de was not glorious; the headline of the article was "a small disappointment." They criticized the slow hard drive, short battery runtime, performance throttling without the socket as well as the expensive and pretty unbalanced configurations from Dell. So many points of criticism are quite serious for such a desired notebook, where the entry-level configuration costs 1,600 Euros (~$1741).
But first things first, we will cover every aspect of the XPS 15 in detail, not only the aforementioned drawbacks, but also the possible advantages like the excellent IPS display and the absolutely solid build quality. Maybe we can find other issues, because there is heavy flickering when you dim the screen, which is even visible to the eye. It seems that Dell uses PWM or Content Adaptive Backlight Control (CABC), respectively, similar to the new XPS 13. You can be excited.
Case

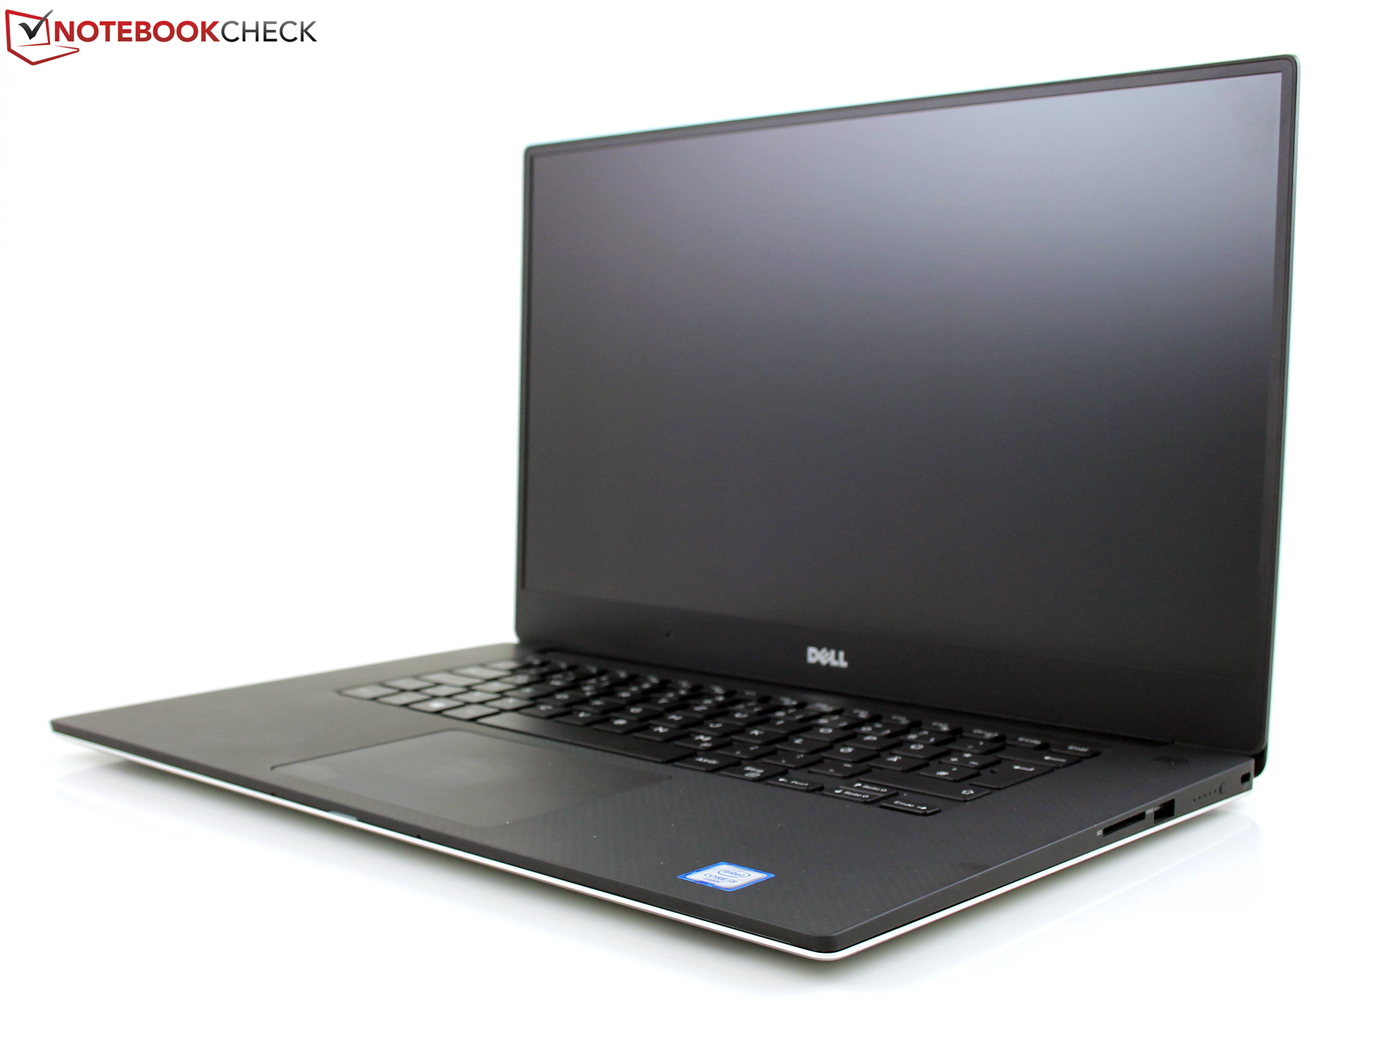
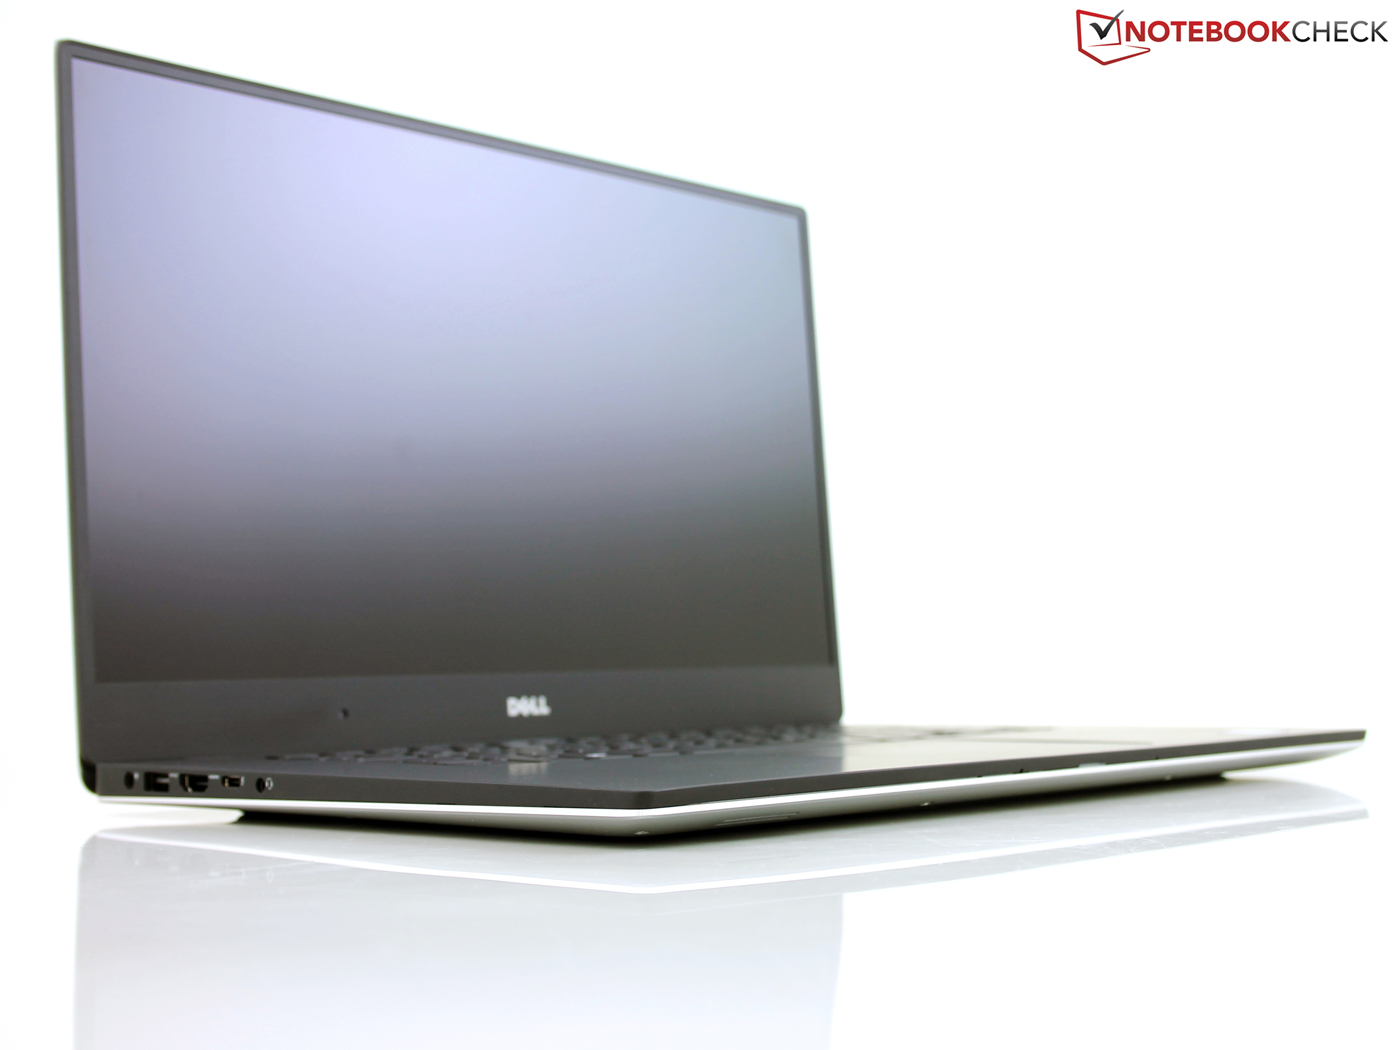
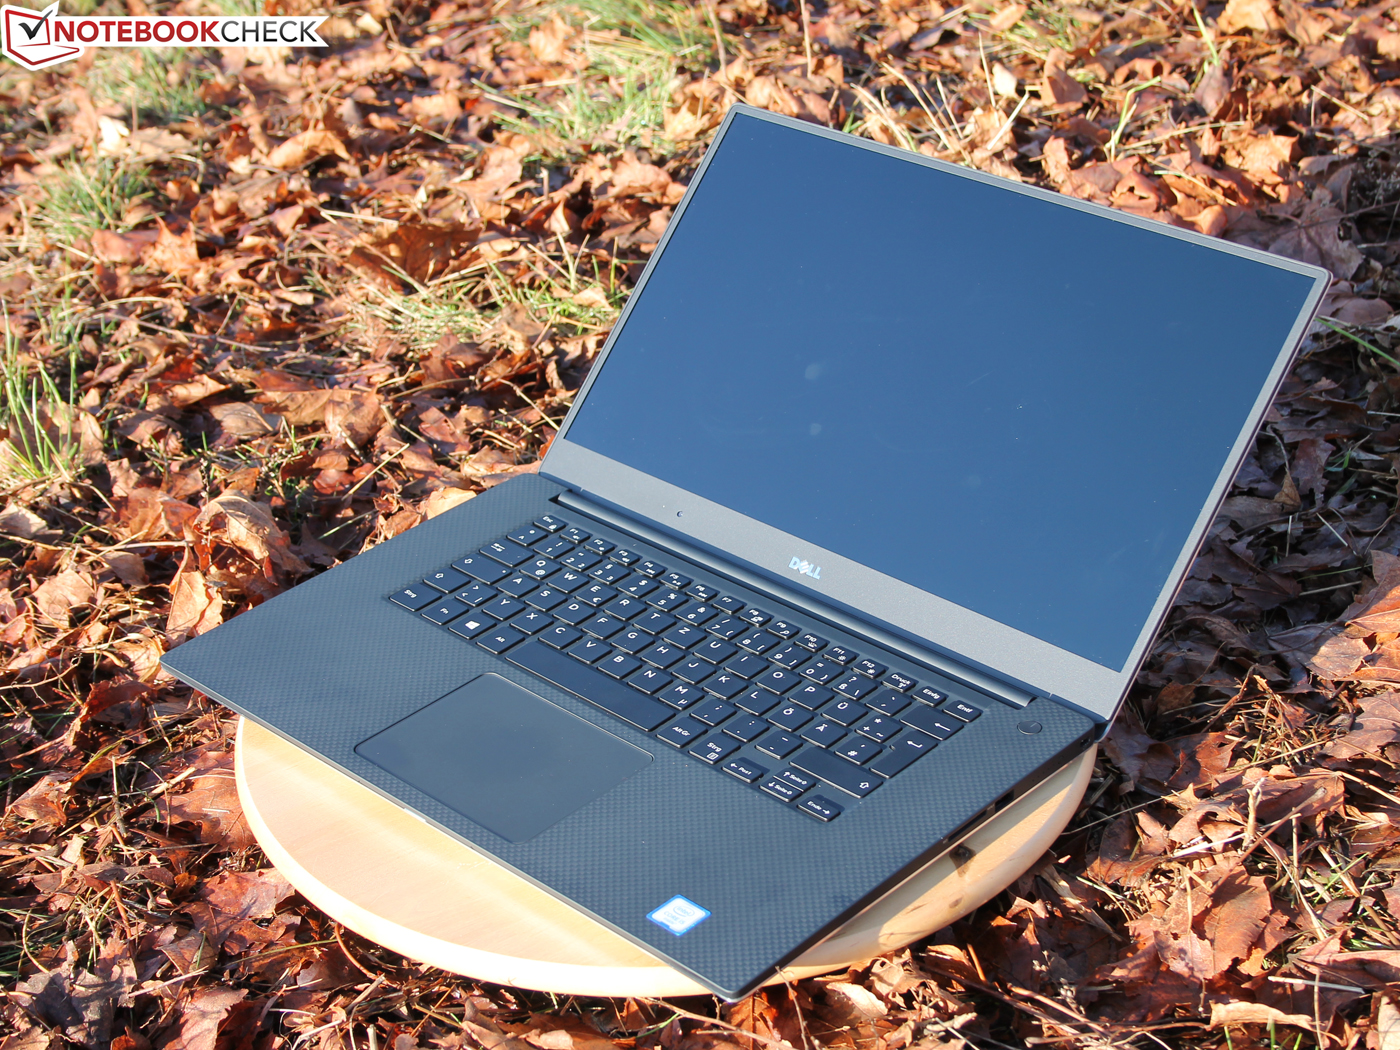
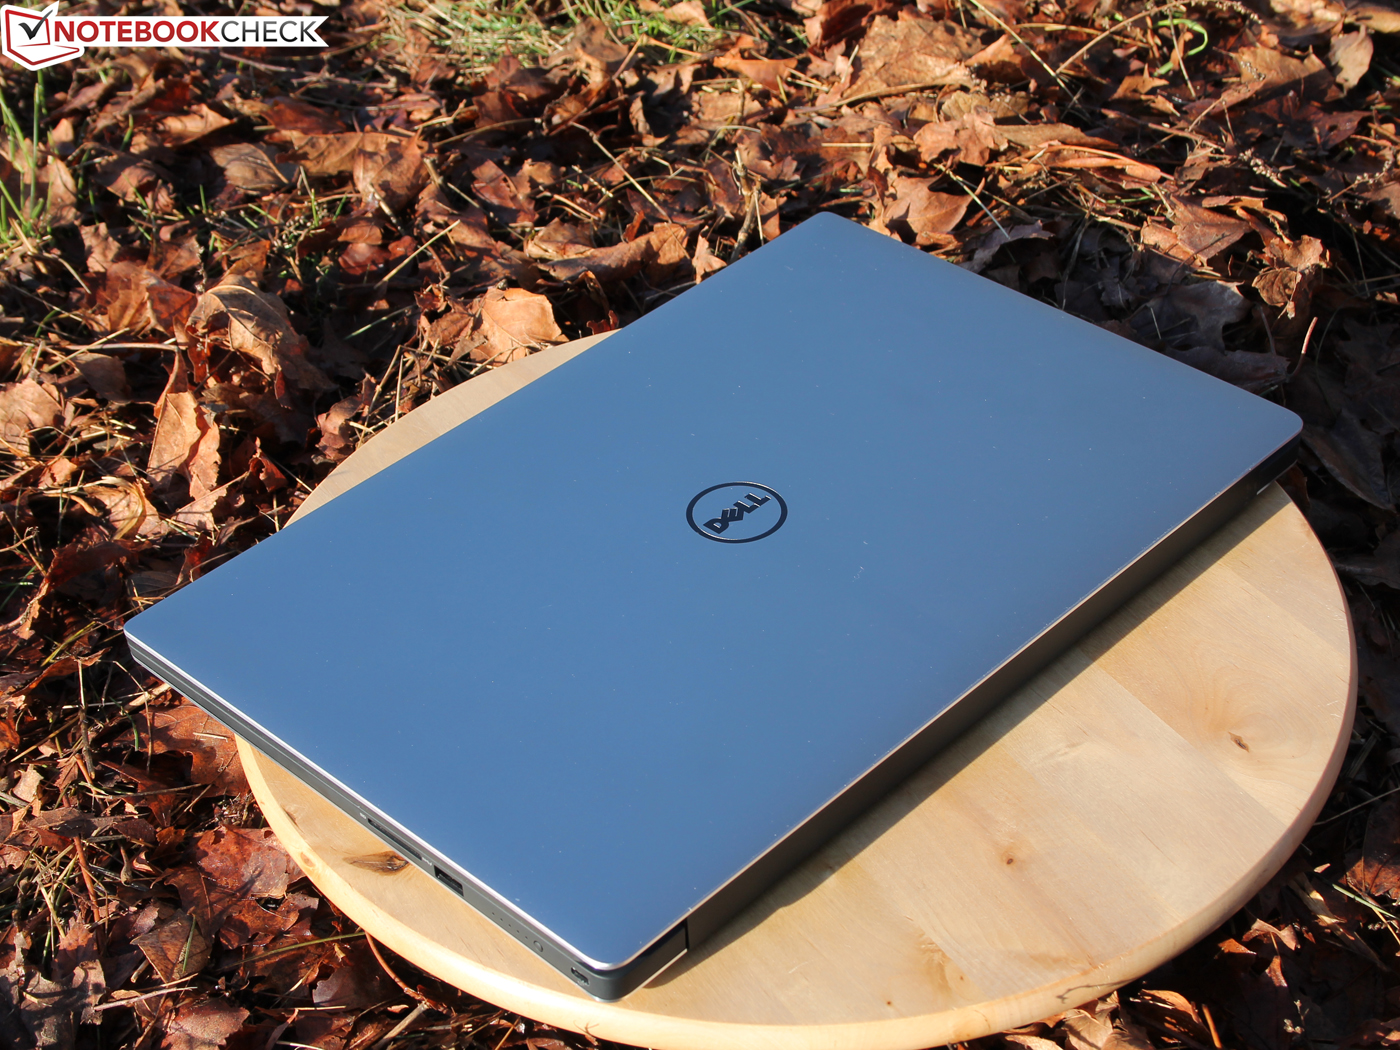
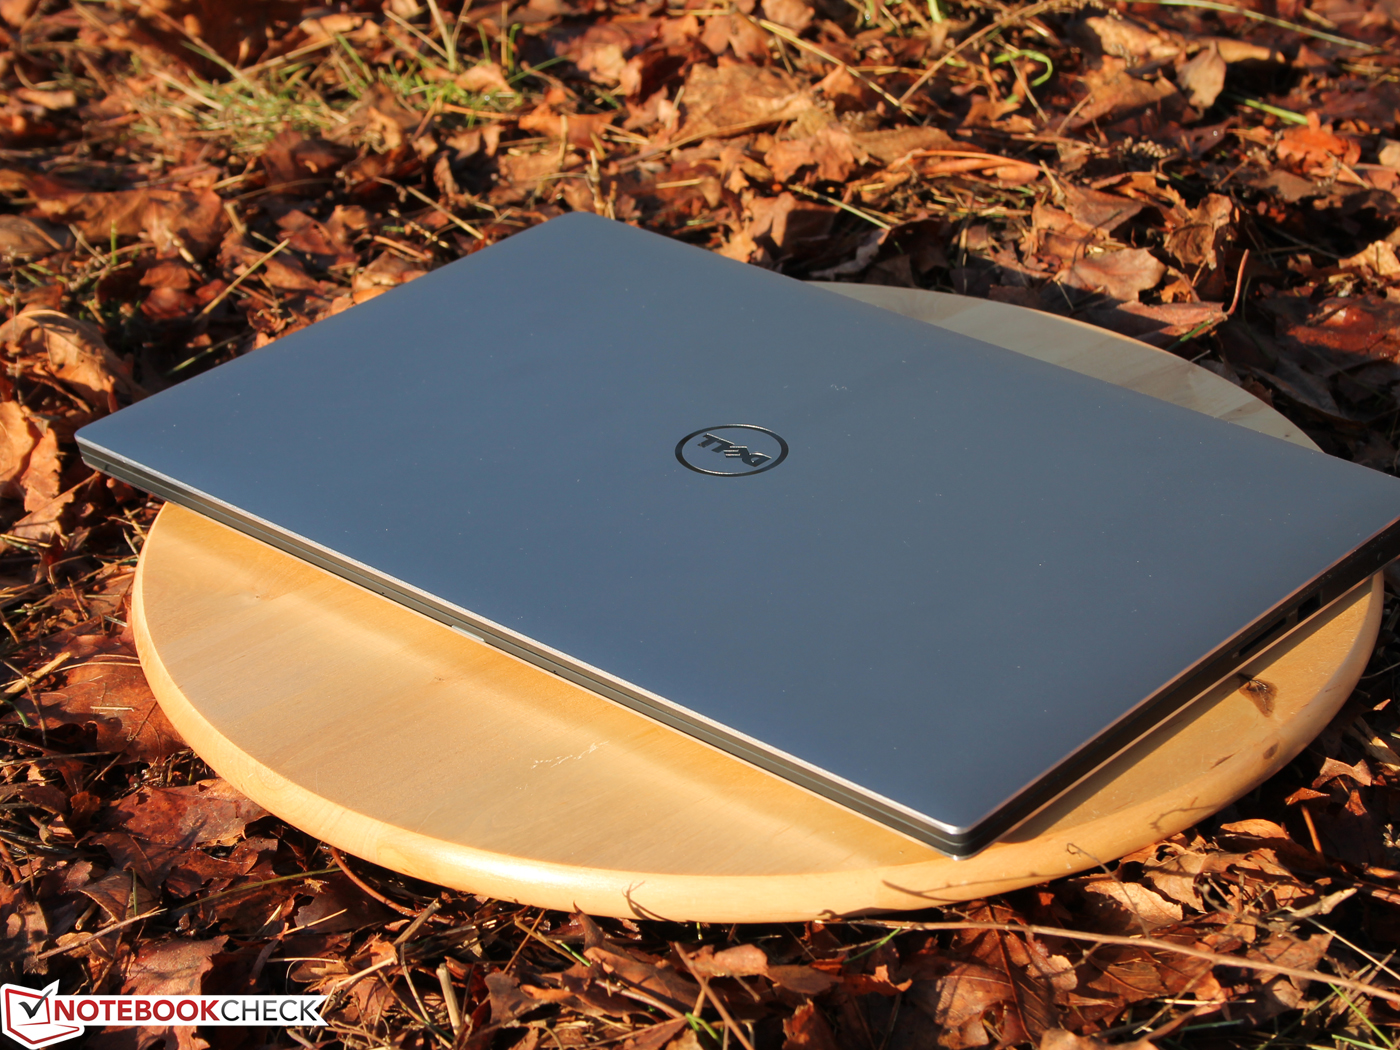
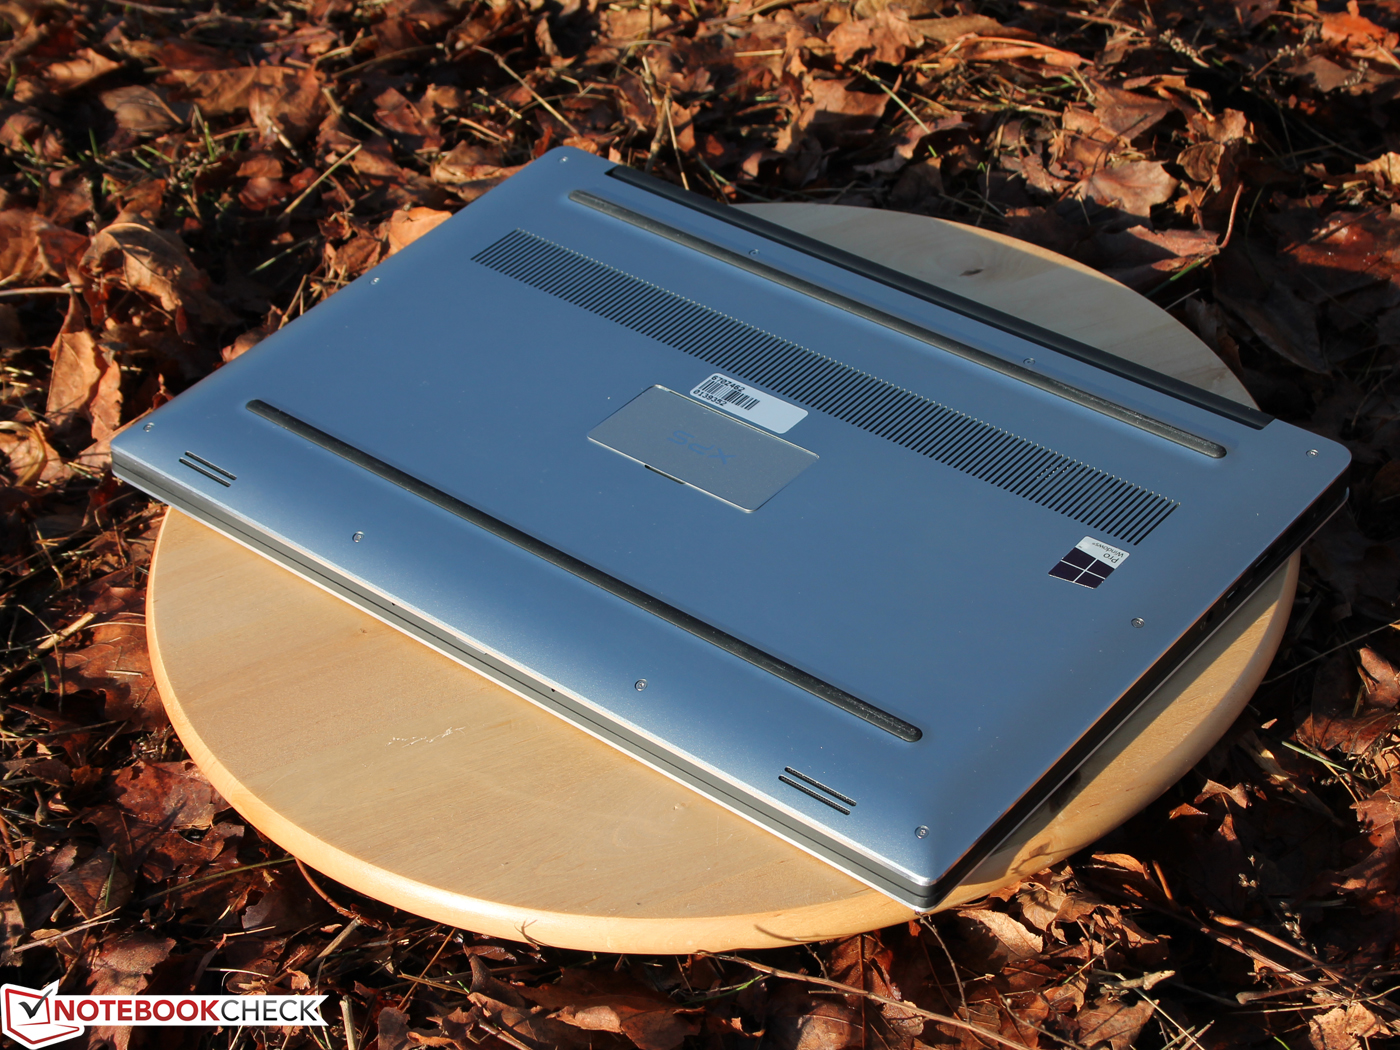
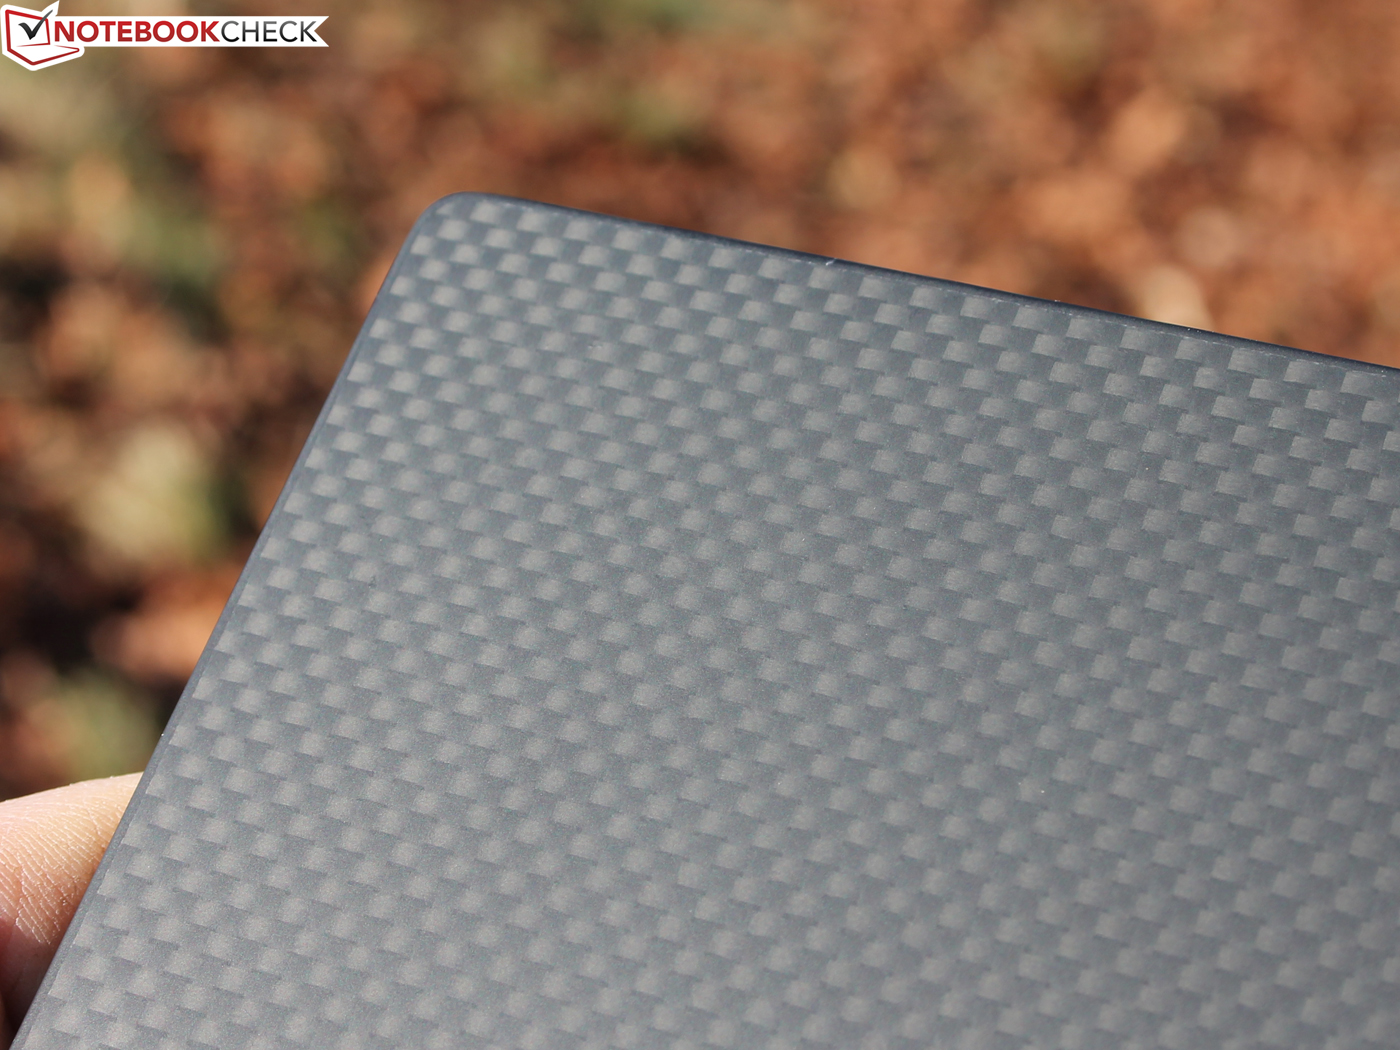
Carbon and aluminum are the materials of choice if you want to design a notebook that is not too heavy but still sophisticated to touch and torsion resistant. Dell once again decided to use the materials of the successful XPS 13. But it is not just the design, the combination of "solid", silver-colored aluminum plates at the top and bottom and the black carbon top of the base unit are similar to the XPS 13 as well.
The sophisticated tactile feel could not be better and the sturdiness of the chassis does not suffer from the larger form factor. The velvety rubberized surface with the visual grid feels very good under the hands. Fingerprints are mostly invisible or are optically hidden. The chassis still has to be cleaned though, smudgy fingers or sweat will quickly leave slightly visible stains. Those have to be cleaned with a wet cloth; a dry cloth does not help on the matte surfaces.
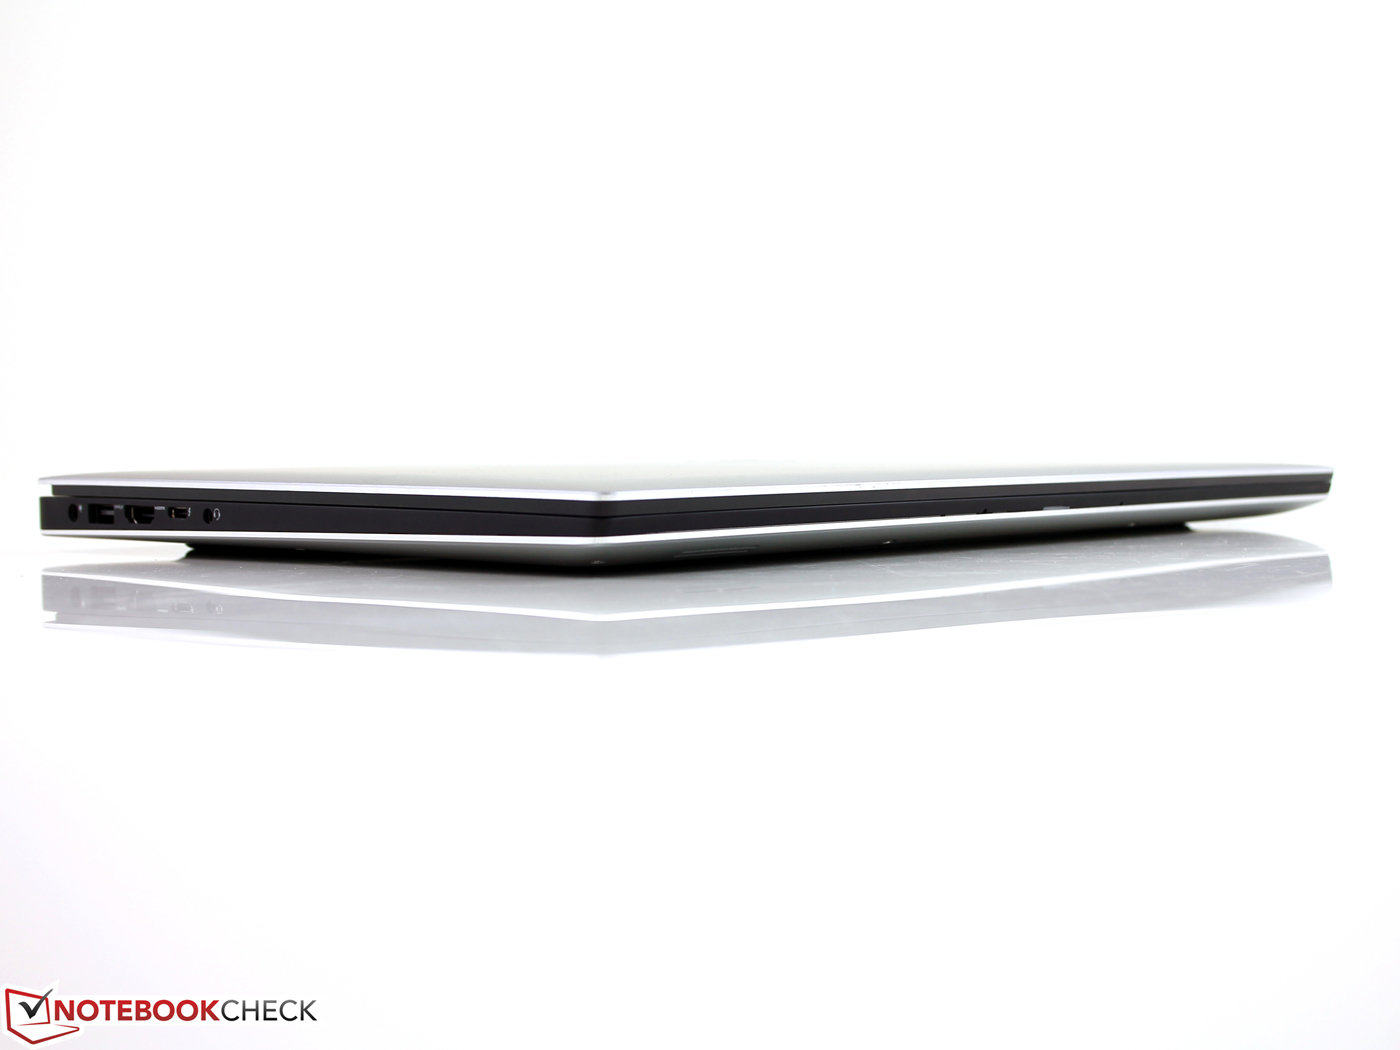
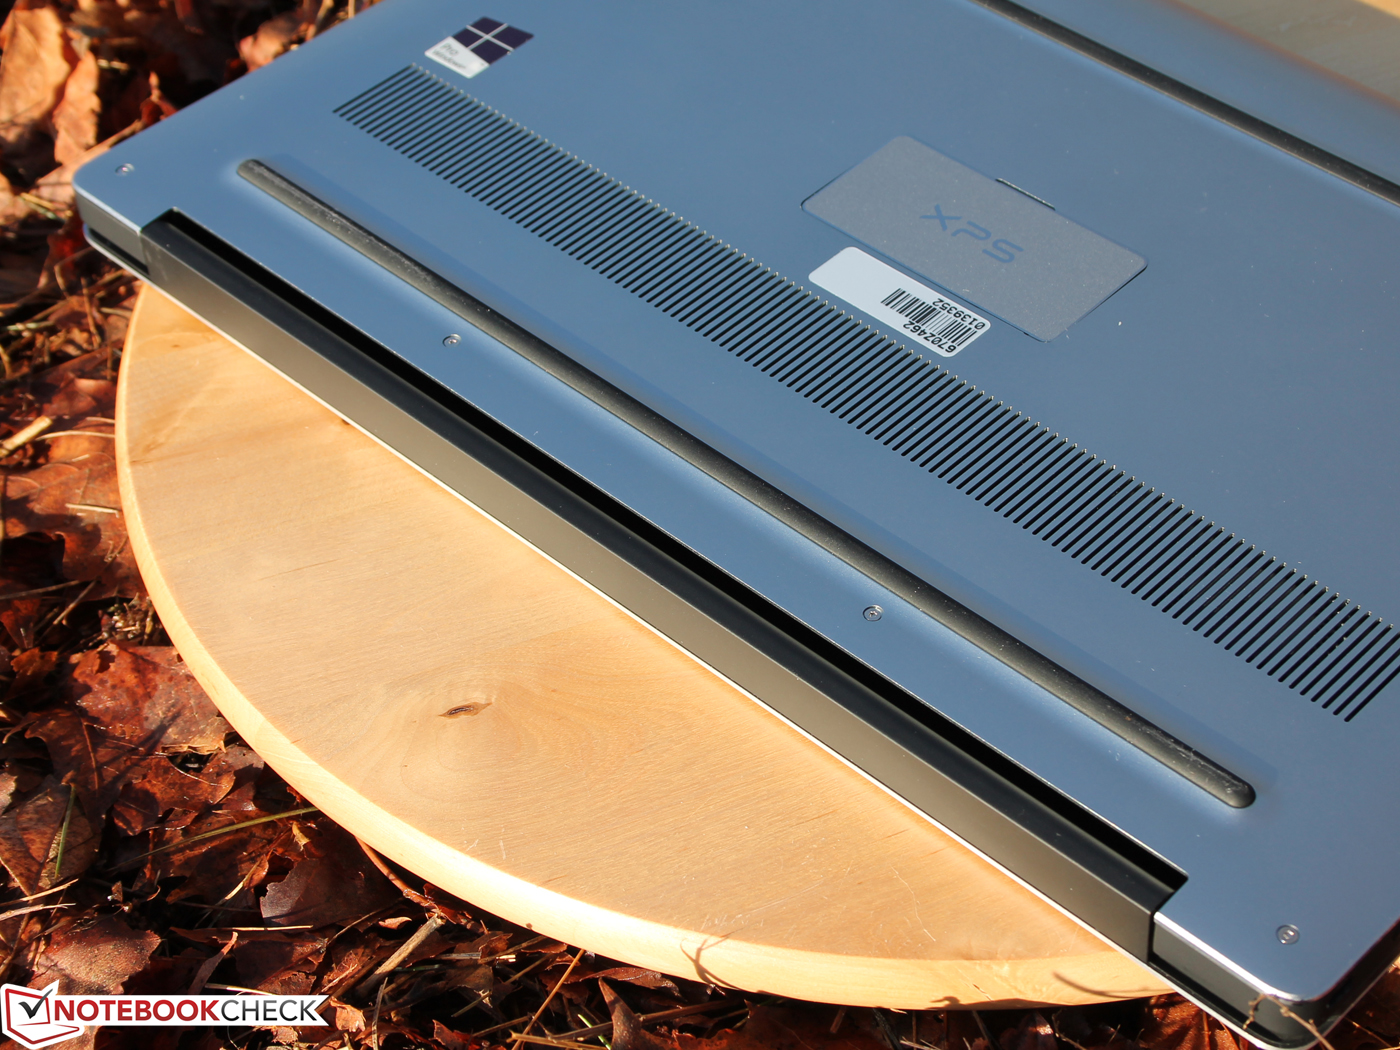
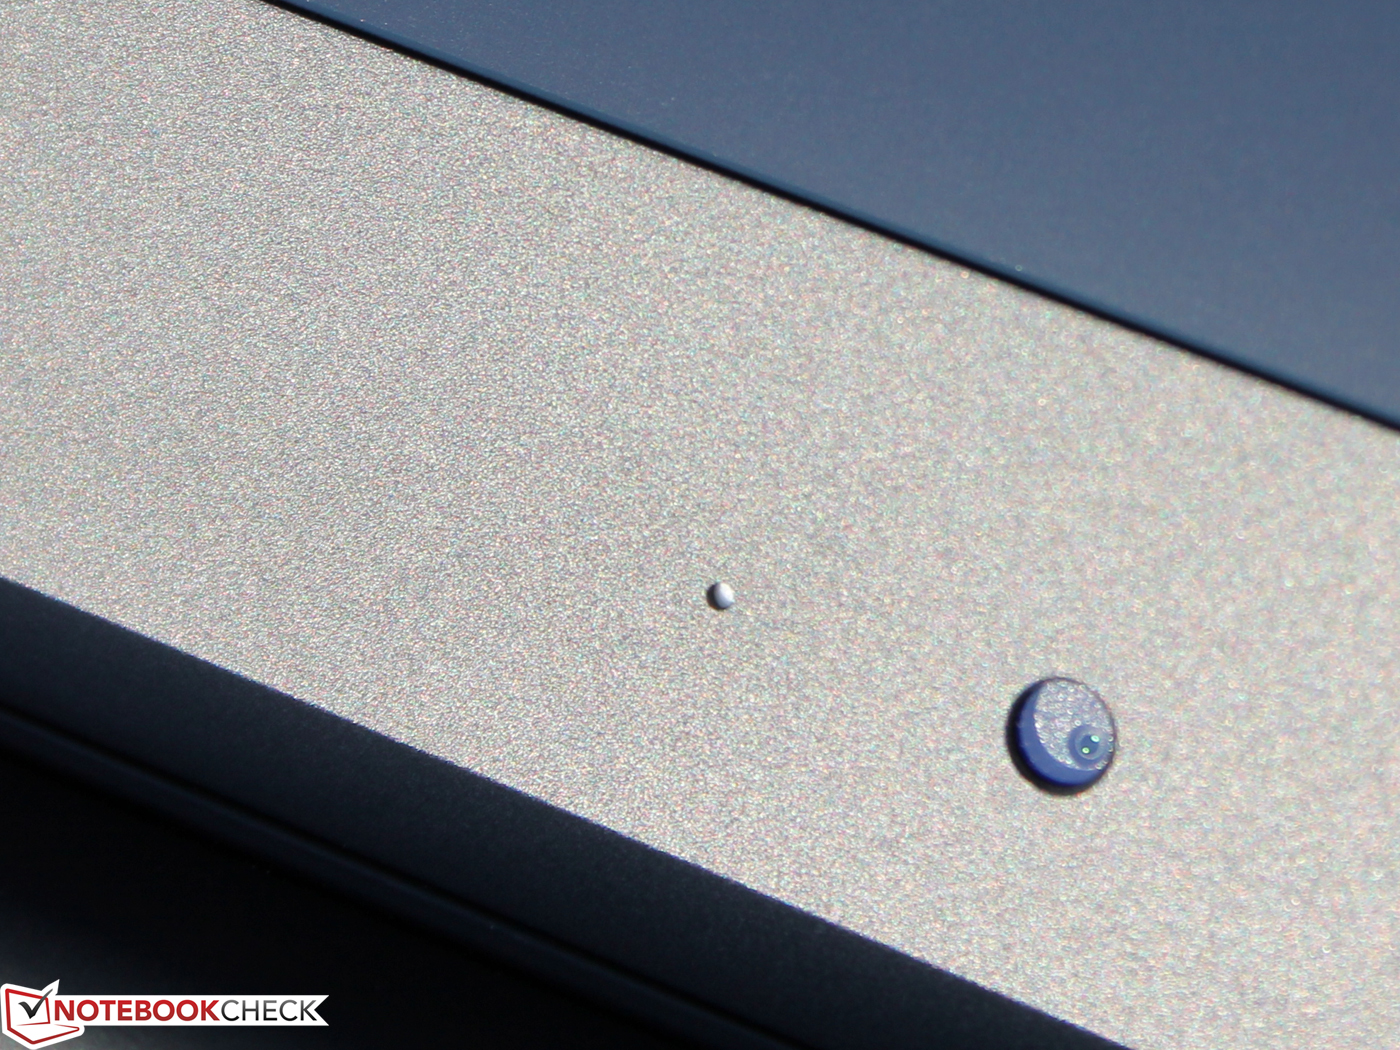
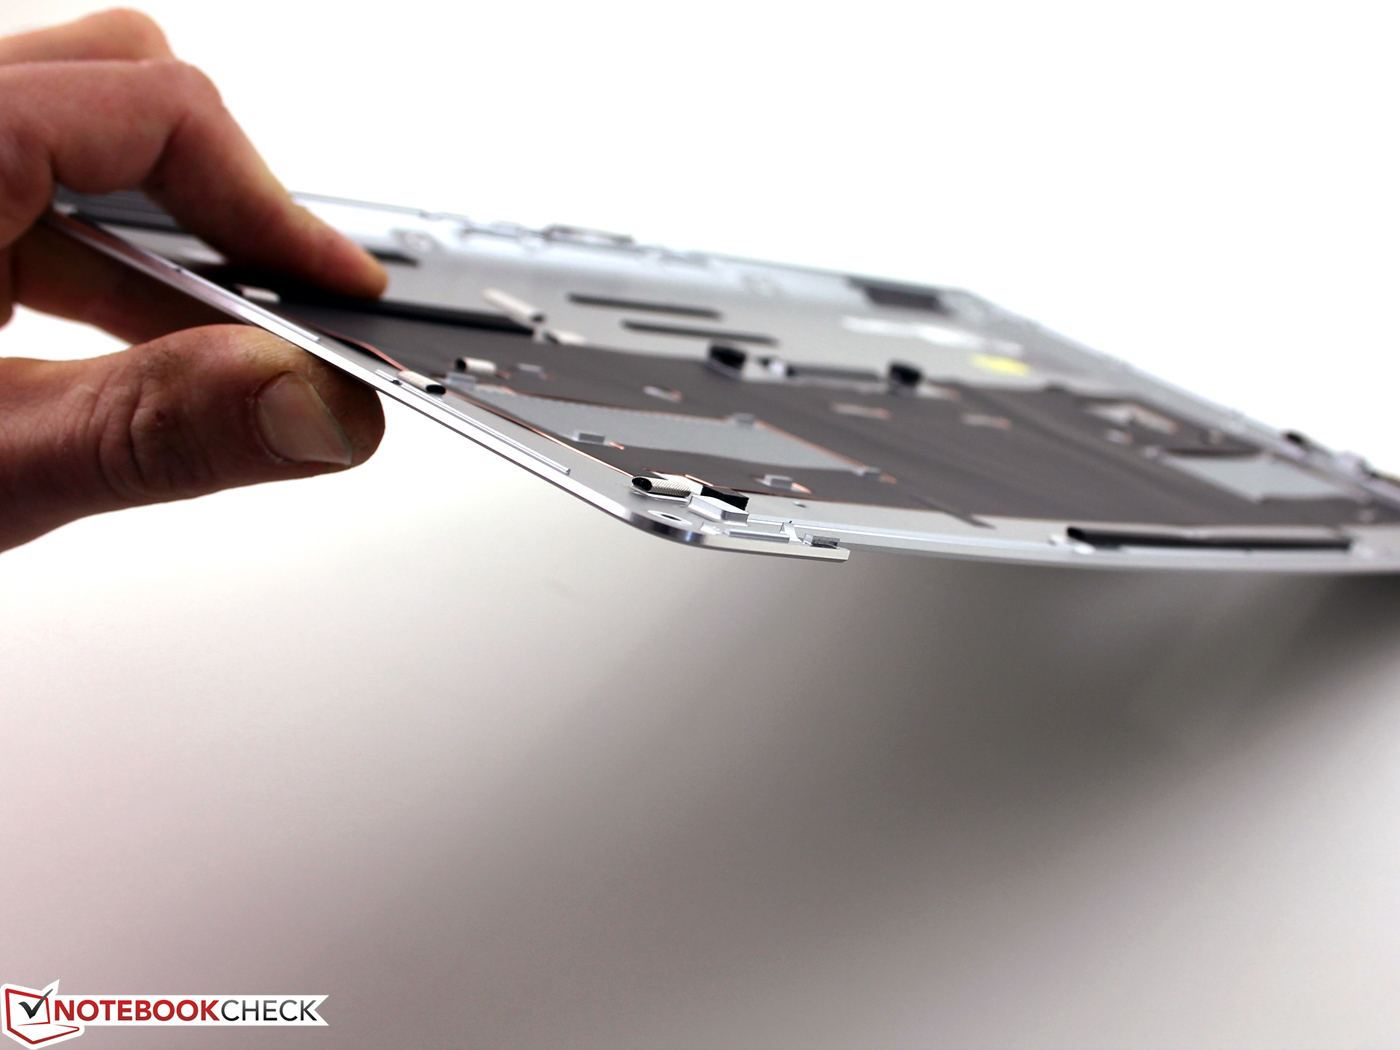
We can see a small build quality issue when we look at the bottom cover, which protrudes at the front. This creates a sharp edge. You will probably not hurt your fingers, but it easily collects dirt and just does not leave a good impression. We have already seen many laptops with aluminum covers, but the bottom cover of the XPS 15 is surprisingly thick and therefore pretty resistant to twisting attempts or concentrated pressure. It never appears to be a clattery and hollow design that could be dented at any spot.
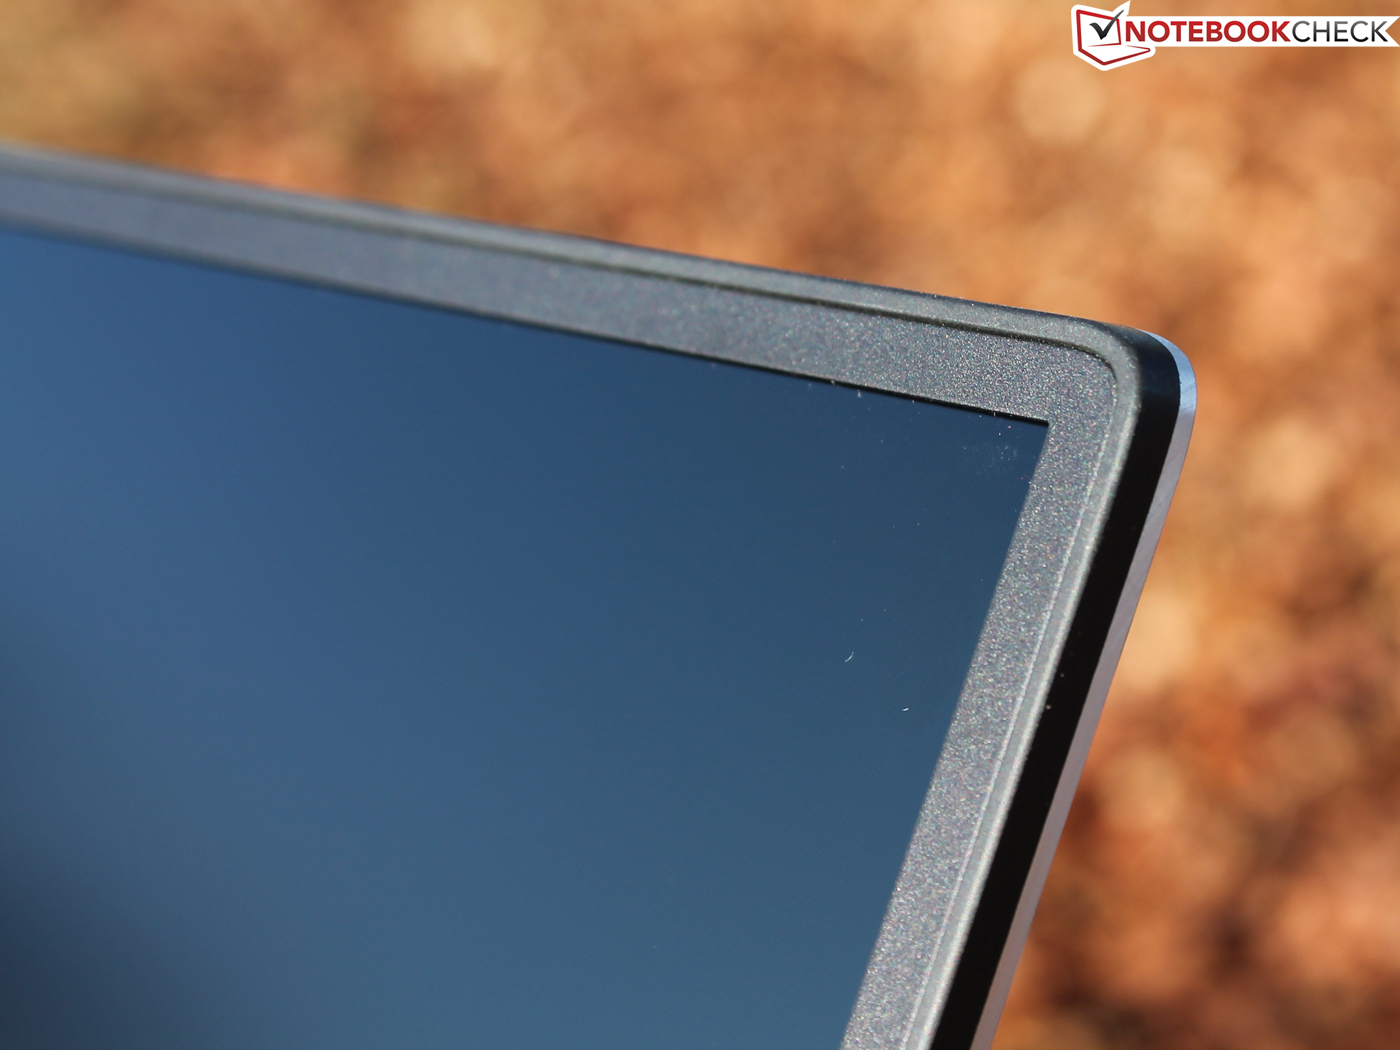
We can just slightly twist the cover; an even bigger angle would only be possible with a lot of force. Positive: Twisting the cover, and even the lifting of the device at this spot, does not result in ripples on the screen. Even more pressure at the back of the panel does not create picture deviations or noteworthy denting. The display is firmly attached to the base unit, the hinges are very taut and we need both hands to open the panel up to the maximum angle of 140 degrees.
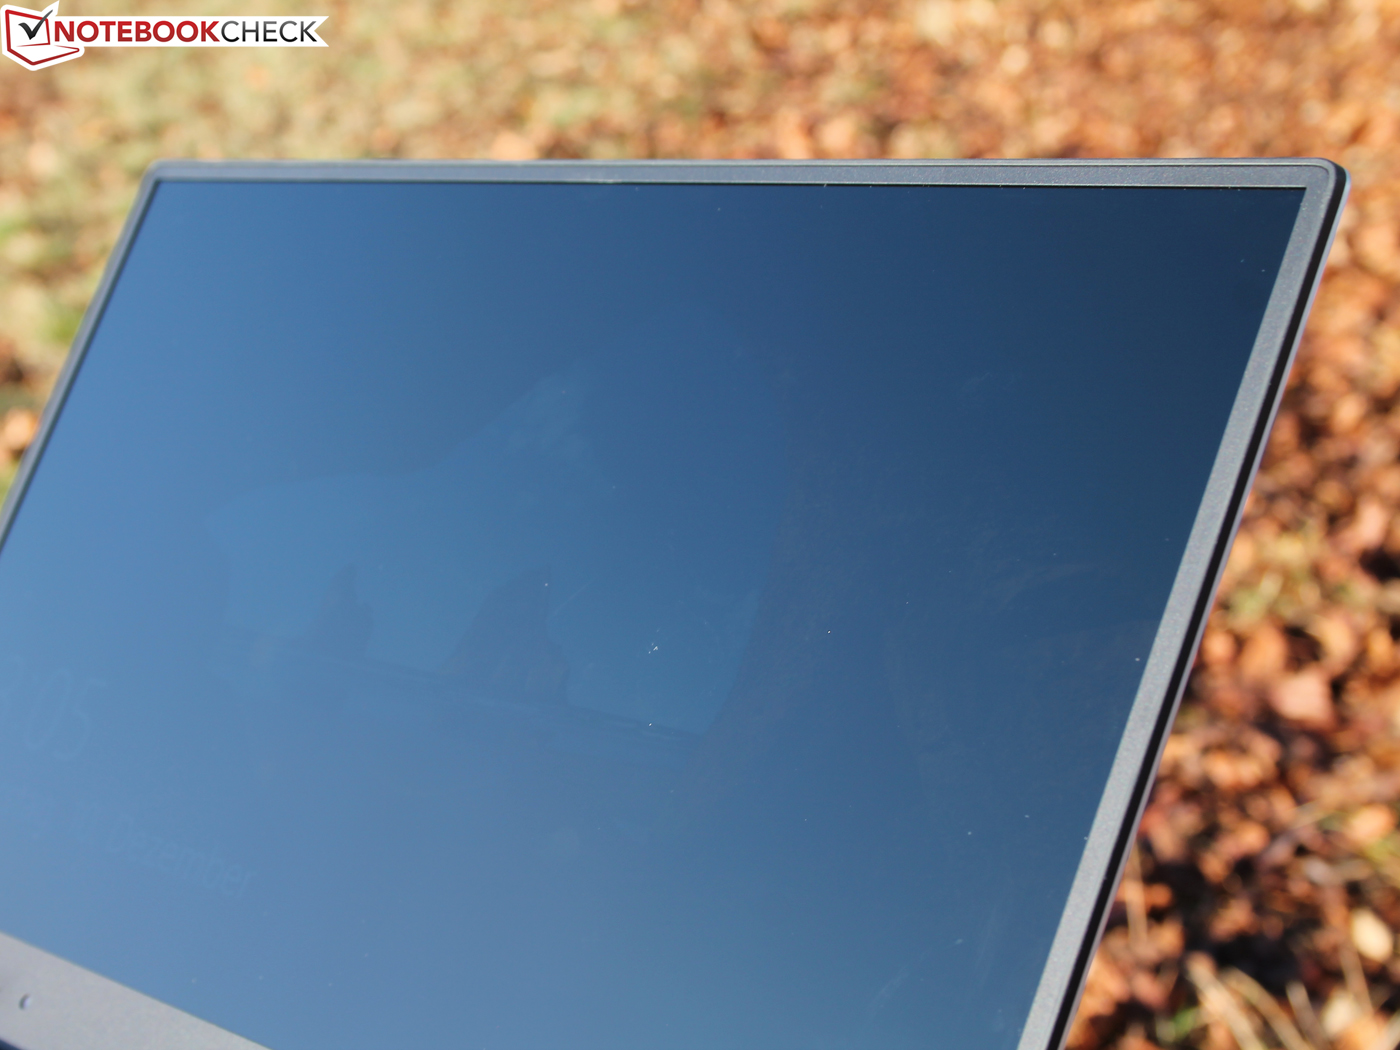
Infinity-Edge should not be taken too serious for the non-touch model: The panel does not extend up to the outer edge and the bezel measures 5 millimeters. It really surrounds the panel, which means it is slightly raised. Contrary to many other laptops, there is no additional surrounding rubber lip. The slightly raised panel sits on the rubberized chassis instead. We cannot say if this will result in ugly scratches over time.
Our non-touch model with hard drive and the smaller battery as well as the top model weigh the same. Dell advertizes a base weight of 1.79 kg (56-Wh model), so the hard drive was probably excluded.
- 56-Wh battery, SSD and non-touch display: 1,958 grams (our own measurement)
- 84-Wh battery, SSD and touch display: 2,087 grams (our own measurement)
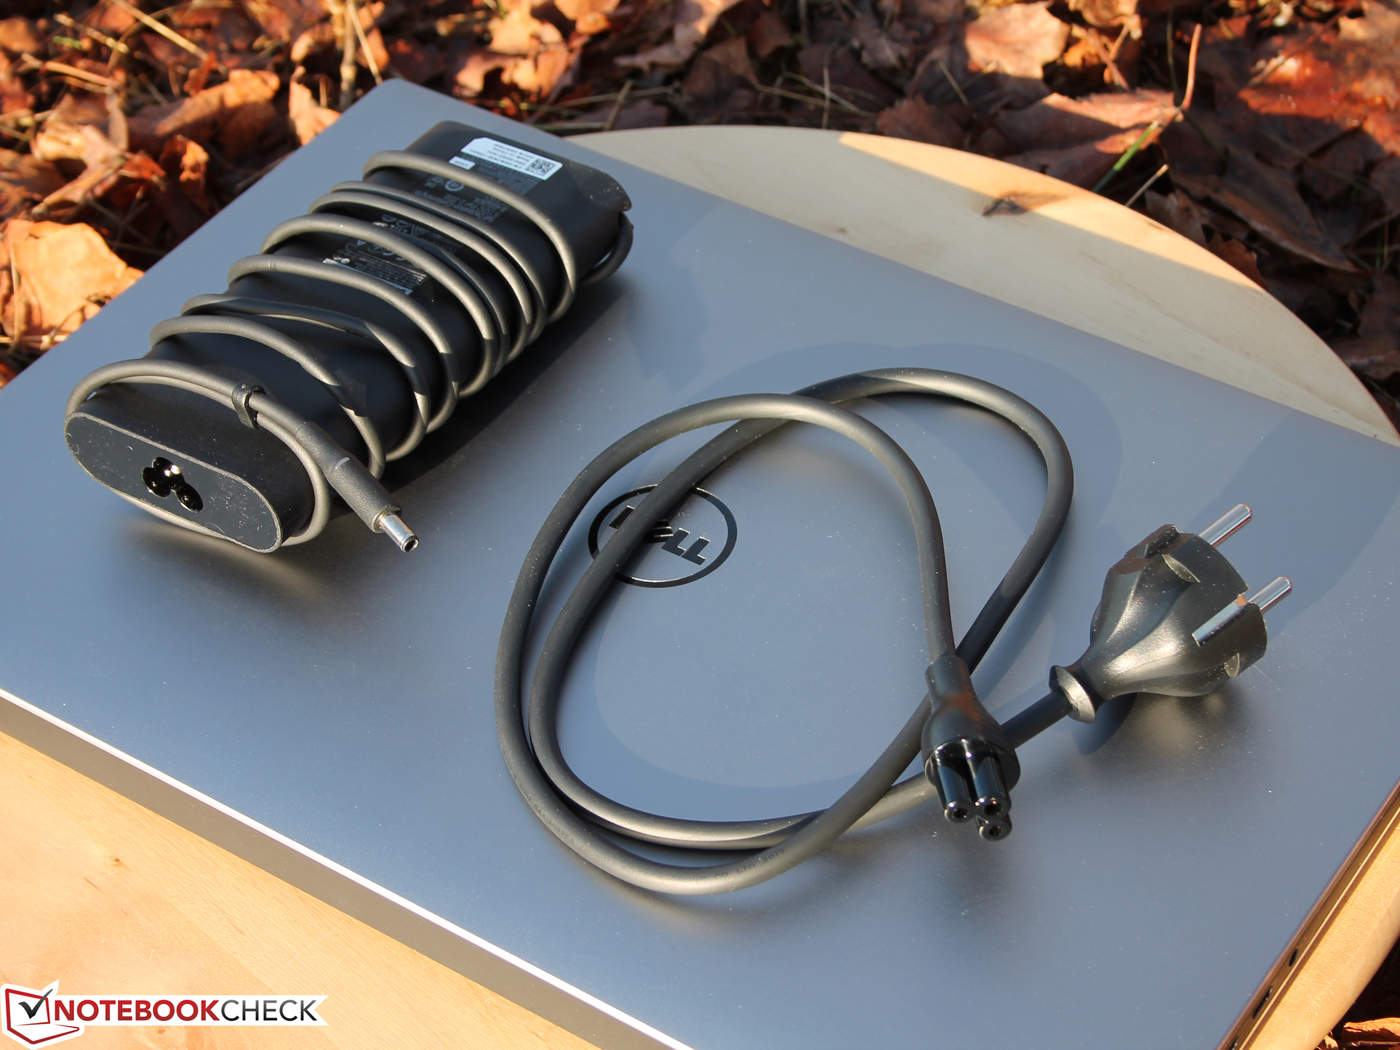
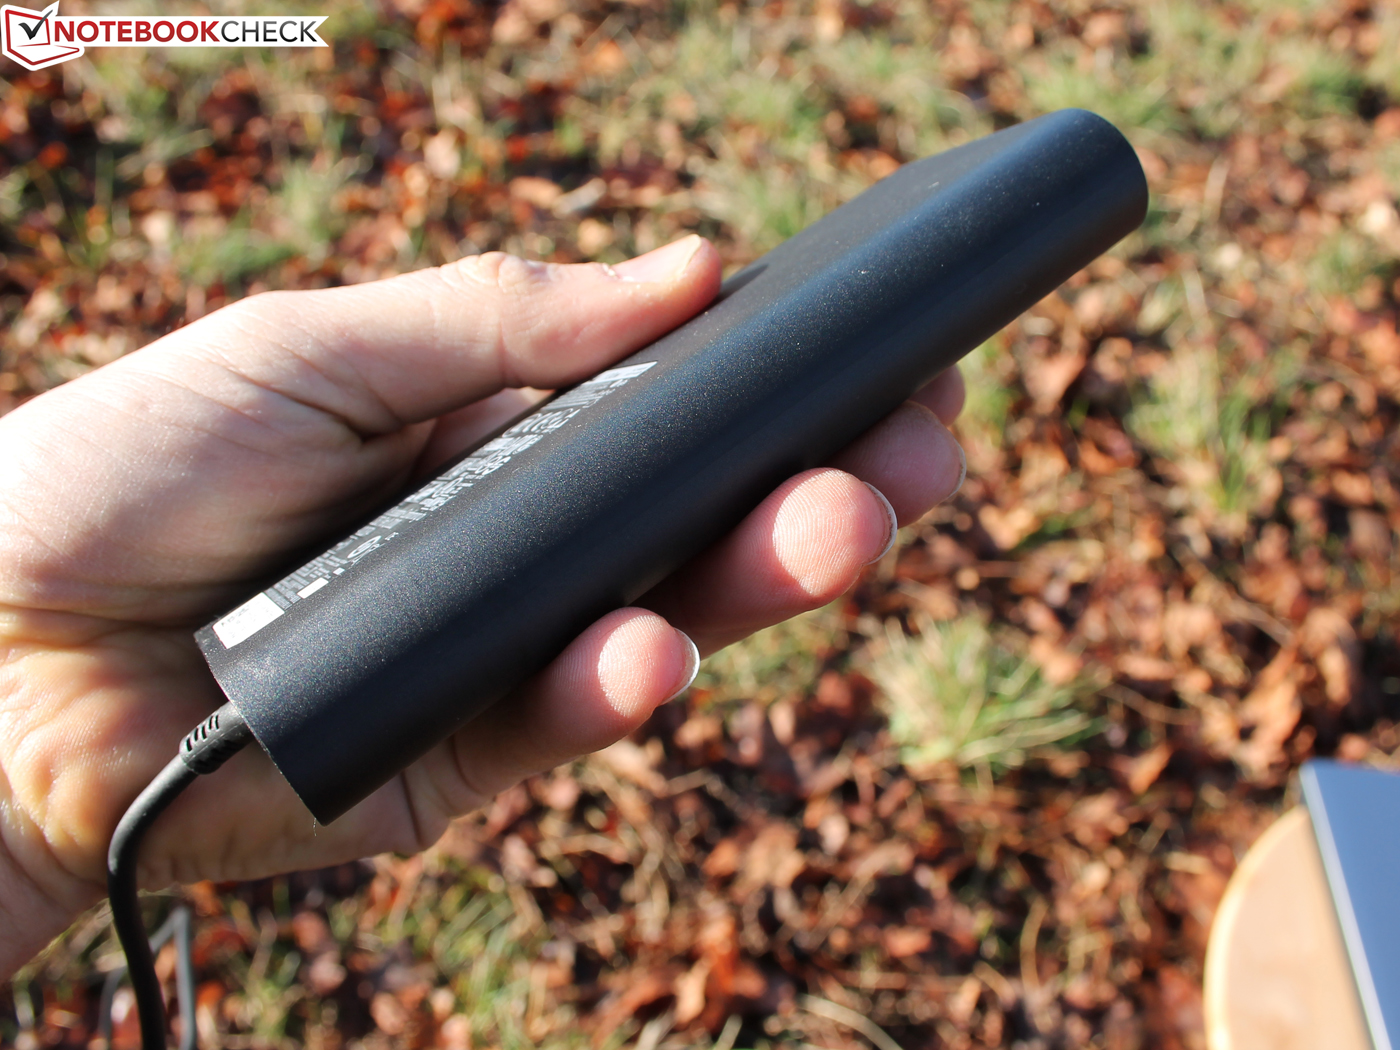
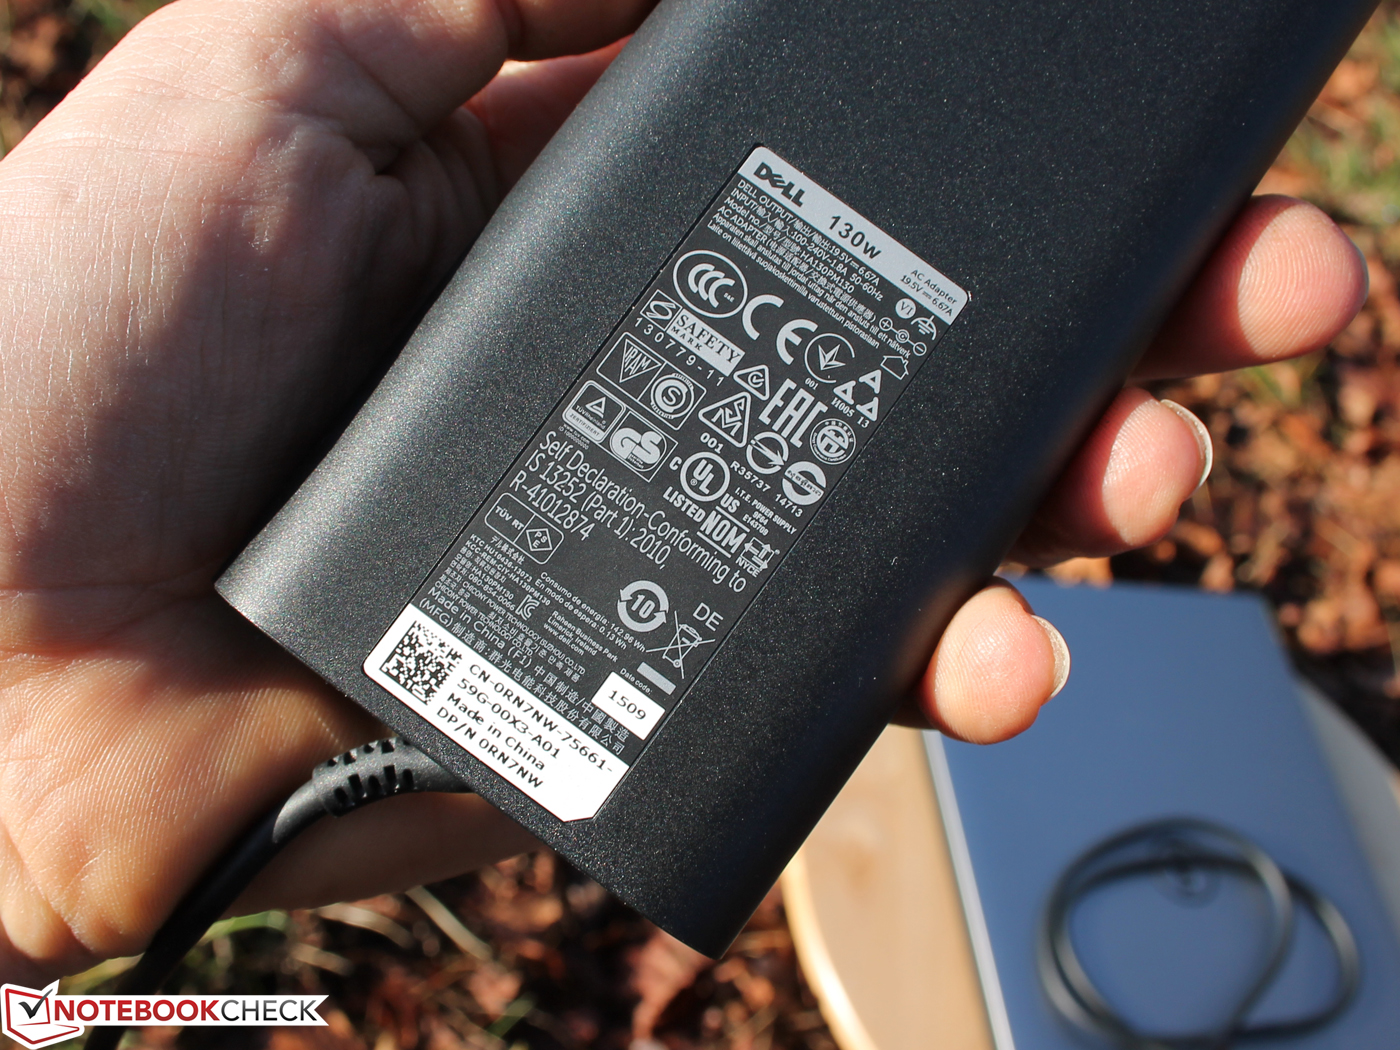
- PSU: 435 grams – very light for 130 Watts
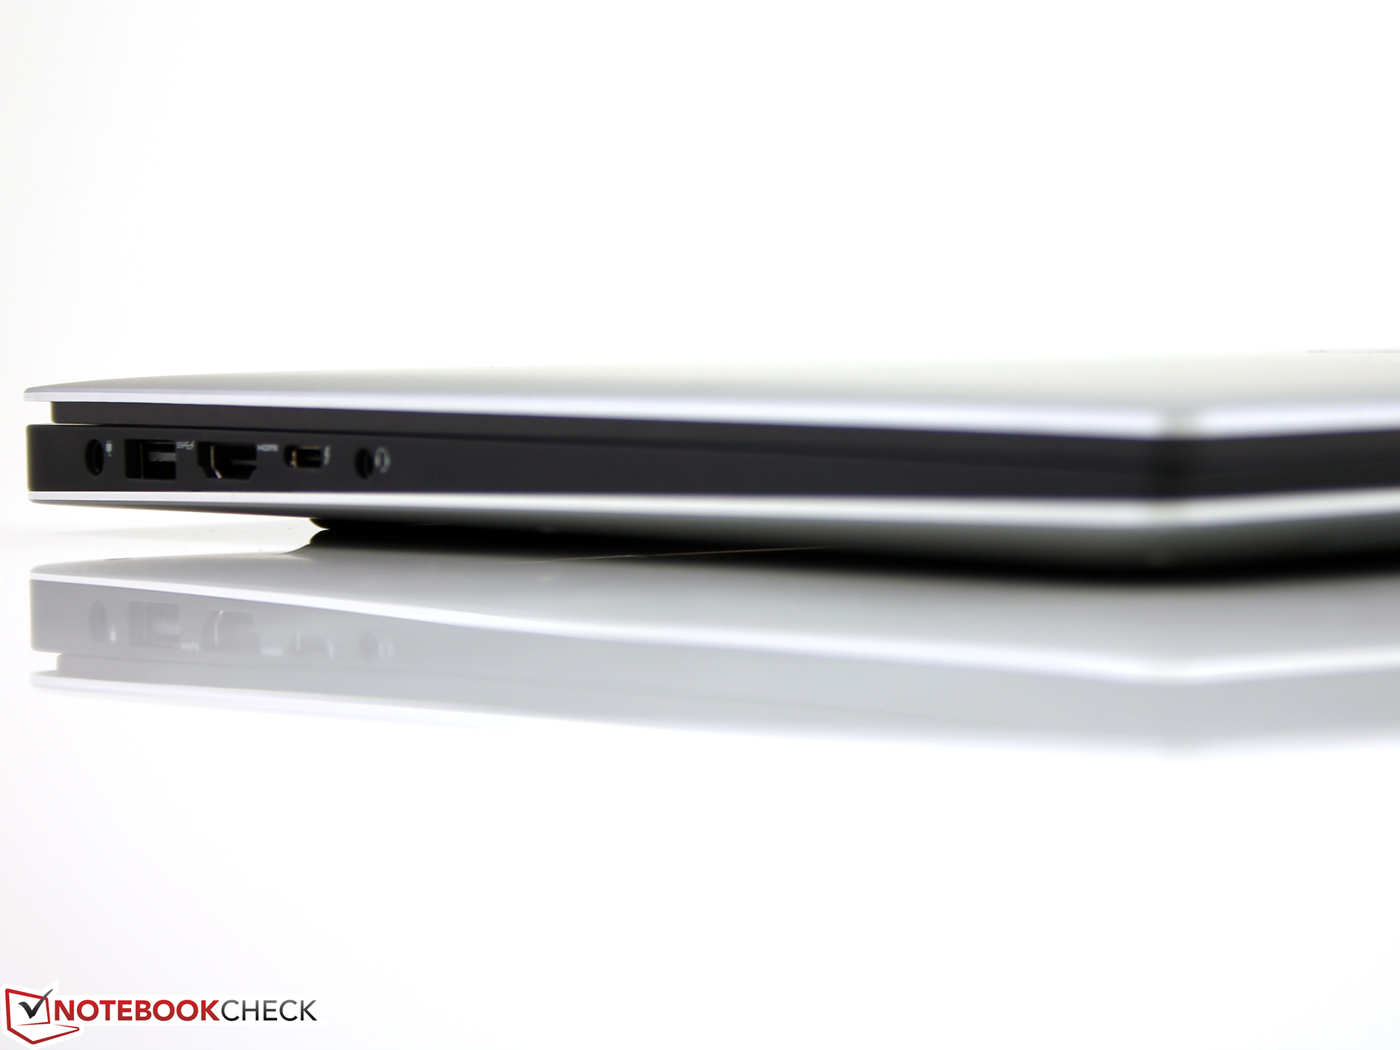
The height of just 11-17 millimeters (without rubber feet) is impressive, but wide connectors like Ethernet RJ45 are not possible. The MacBook Pro 15 Retina tips the scale at 2,040 grams (despite the 99.5-Wh battery!), has a lighter power adaptor (320 grams) and it is 18 millimeters high. The differences are very small, but the XPS 15 is not the best device in this regard. The Asus Zenbook Pro UX501JW is comparatively thick at 22 millimeters but not heavier at 1,980 grams (PSU: 544 grams).
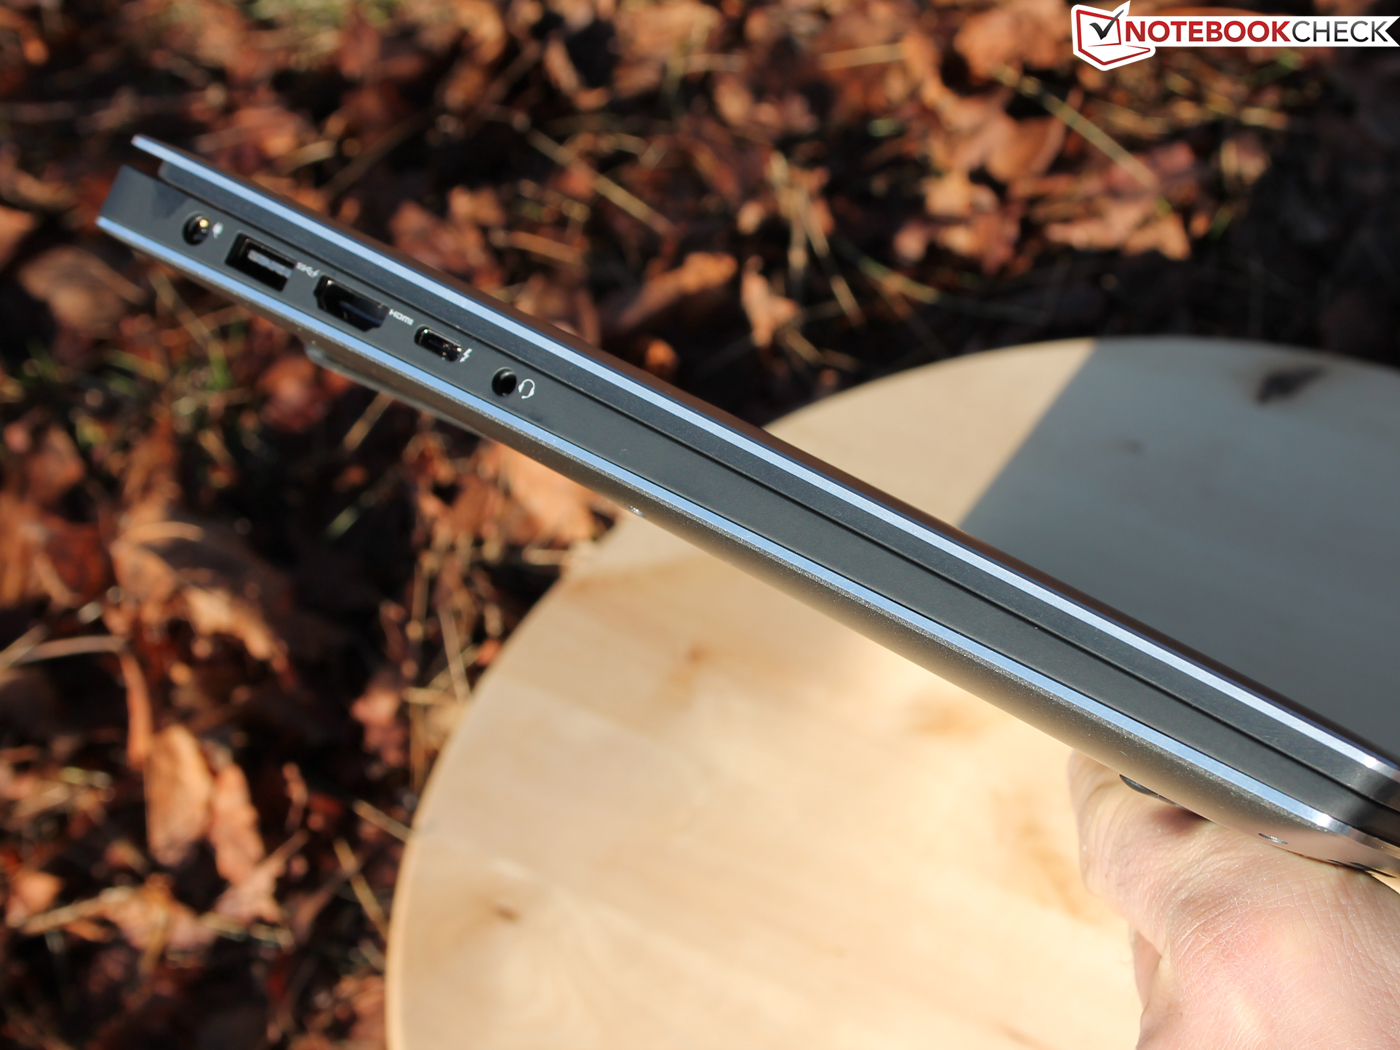
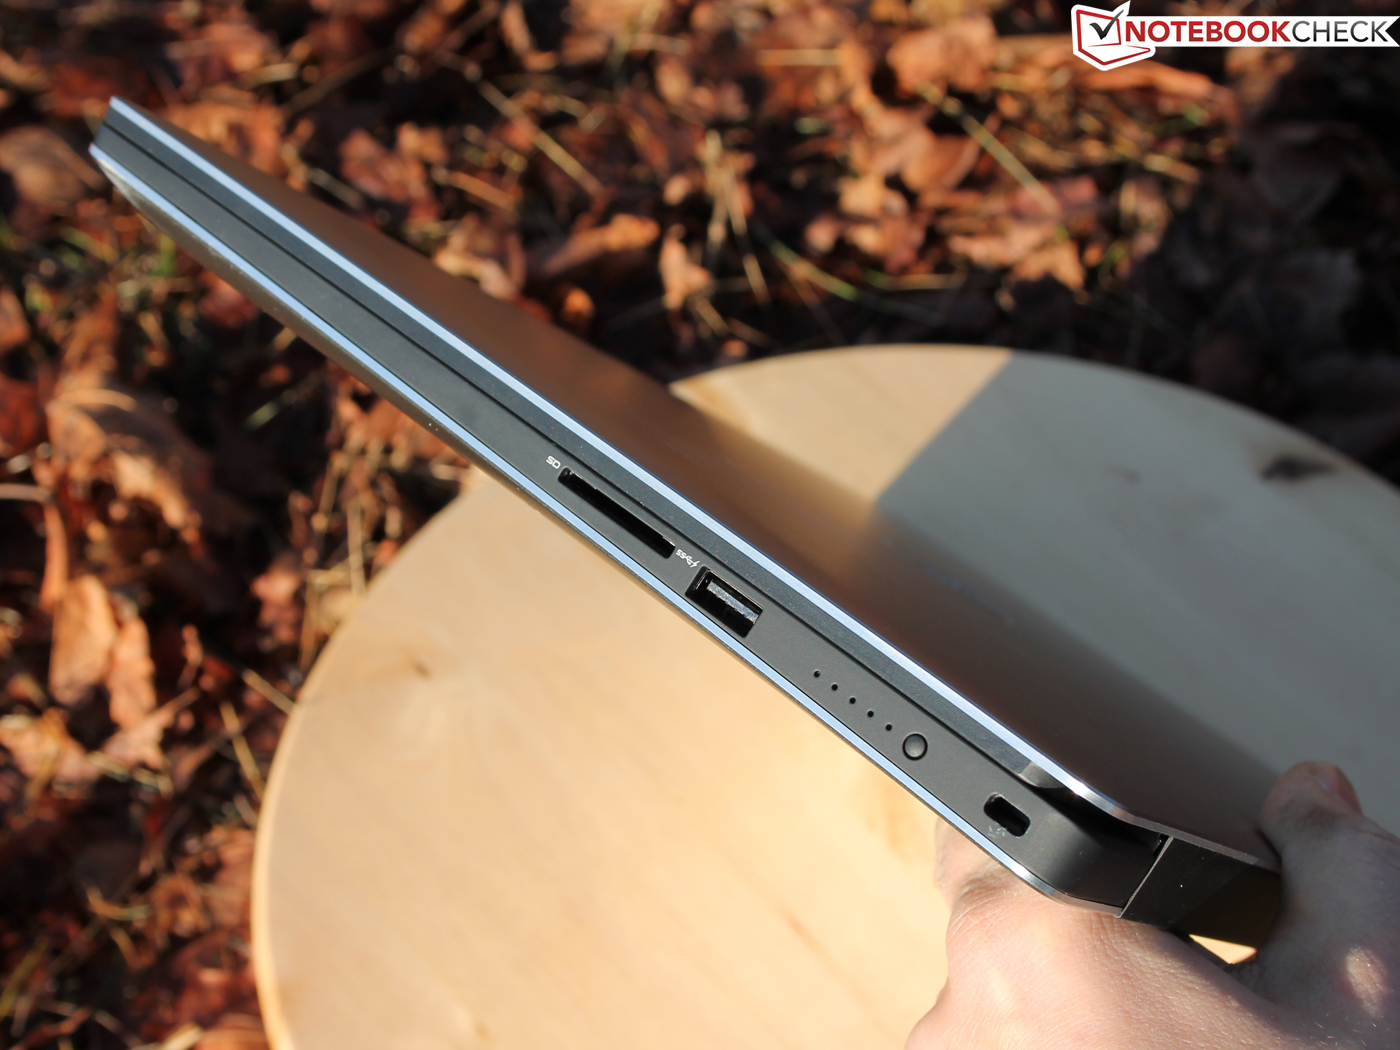
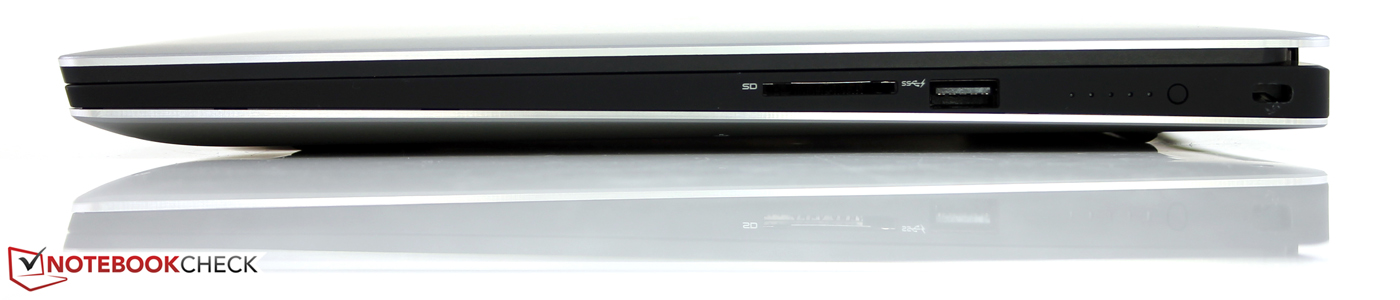
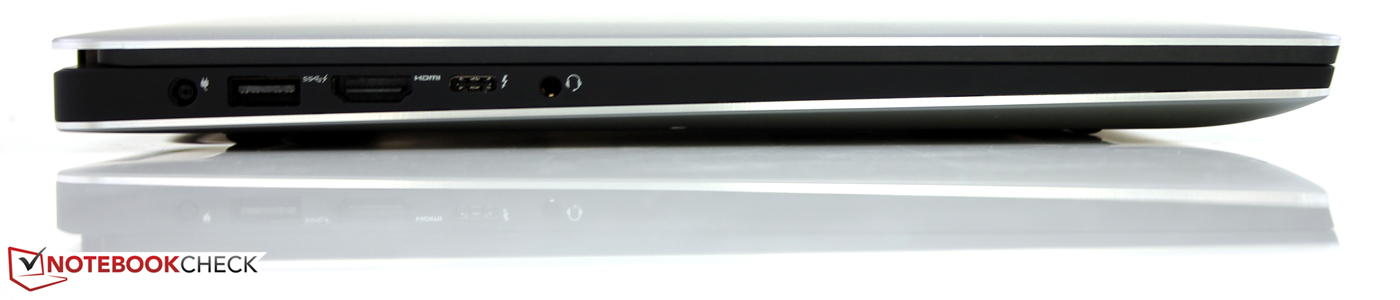
Connectivity
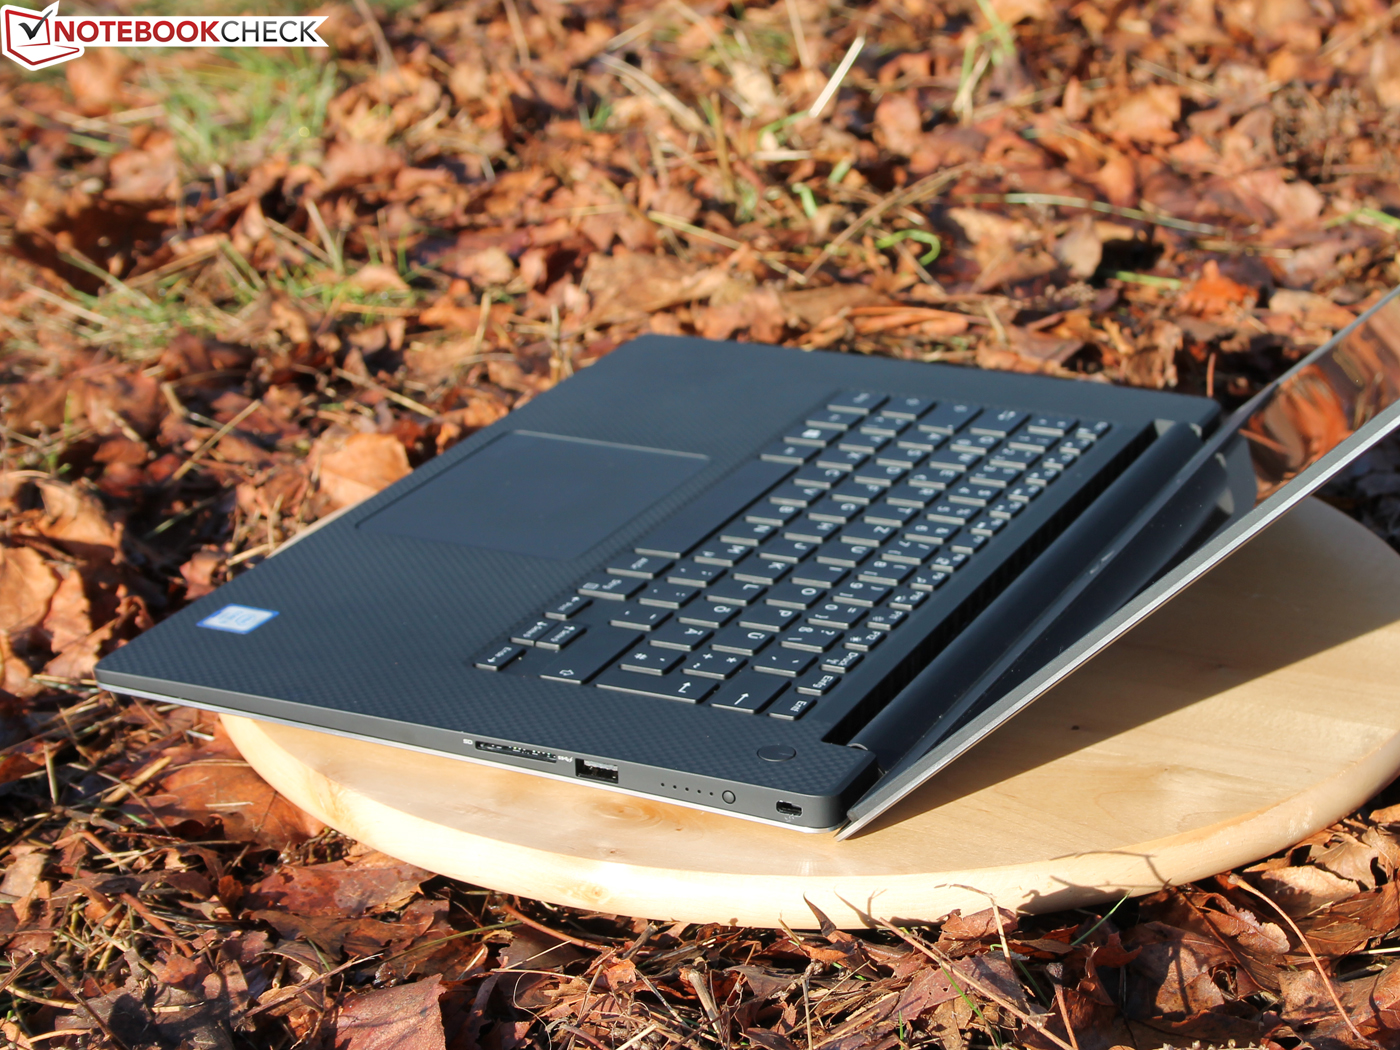
Due to the form factor, Dell decided to use only the essential ports, it seems that the battery test button at the right side was more important. We are sure that this space could have been used for a Mini-DisplayPort. At least you get the new USB Type-C port, and you get the whole package. It is not only the USB 3.1 Gen2 that accepts cables in both directions, but also a Thunderbolt 3 controller (via Intel Alpine Ridge). You can use old USB 2.0/3.0 devices via adaptor, new USB Type-C devices directly and Thunderbolt devices with a Type-C cable directly as well. Dell offers a corresponding Mini-Dock with HDMI, VGA, Gigabit-Ethernet and USB 3.0 (type A).
The HDMI port only supports the version 1.4a, so there is a limitation: UHD displays are limited to 30 Hz. 60 Hz even on two displays is only possible with DisplayPort adaptors or displays that can be attached via USB-C.
We check the performance of the card reader with our reference SD-card Toshiba Exceria Pro SDXC 64 GB UHS-II. The maximum transfer rate is up to 194 MB/s when you copy large files, while you can expect around 71 MB/s for common JPG pictures (around 5 MB each). This is a very fast SD reader; many consumer laptops only manage between 15-20 MB/s (small files).
Communication
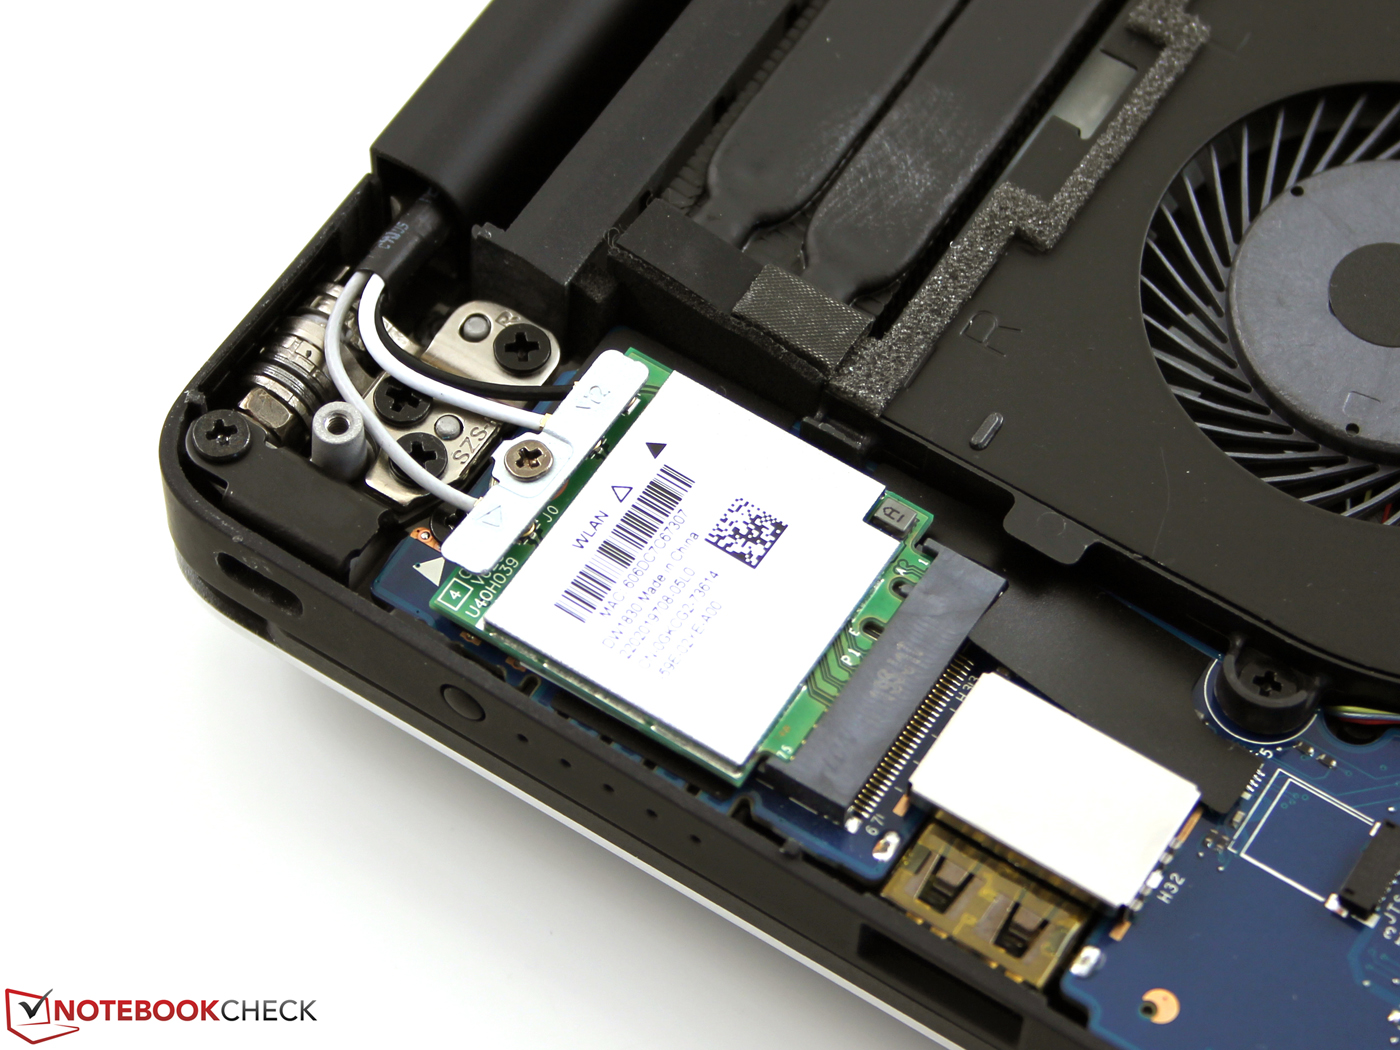
Network connections are provided by a Broadcom card with Bluetooth 4.1. The model BCM15700A2 fortunately supports ac Wi-Fi 3x3, which is still rare. The signal was just stable with a distance of 40 meters in the individual setup of the author, but the loading times of websites are very long in this case. A distance of 15 meters outdoors will result in a signal quality increase to two bars, and websites are opened at a normal speed.
Accessories
The XPS 15 is only shipped with the 130-Watt power adaptor, but Dell offers some optional accessories. The Power Companion (18,000 mAh) is an external battery for the XPS 13/15 and for other devices that can be charged via USB 5V. The previously mentioned Mini-Dock (HDMI, VGA, RJ45, USB 3.0 type A) is almost an emergency solution compared to the Dell Thunderbolt Dock TB15. It not only charges the XPS 15 via one cable but can also drive up to three Full HD displays / two 4K displays and obviously the upcoming Thunderbolt devices via Thunderbolt 3 (external storage, Thunderbolt displays, etc.).
Warranty
As usual, the base price only includes Dell's 12-month service on the next business day with a premium support via phone. It can be extended to two years for 119 Euros (~$129) and three years for 209 Euros (~$227). The 4-year Next Day In-Home service is available for 289 Euros (~$314).
Webcam
The webcam only takes mediocre 720p pictures with quite a lot of noise – even in daylight. The position of the webcam below the display creates an unusual worm's-eye view. This is no problem for video chats; you just have to open the lid a bit more. Both the focusing and the trigger speed are okay. It is unfortunate that even such a high-end laptop still gets such a bad webcam that was already being used six years ago.

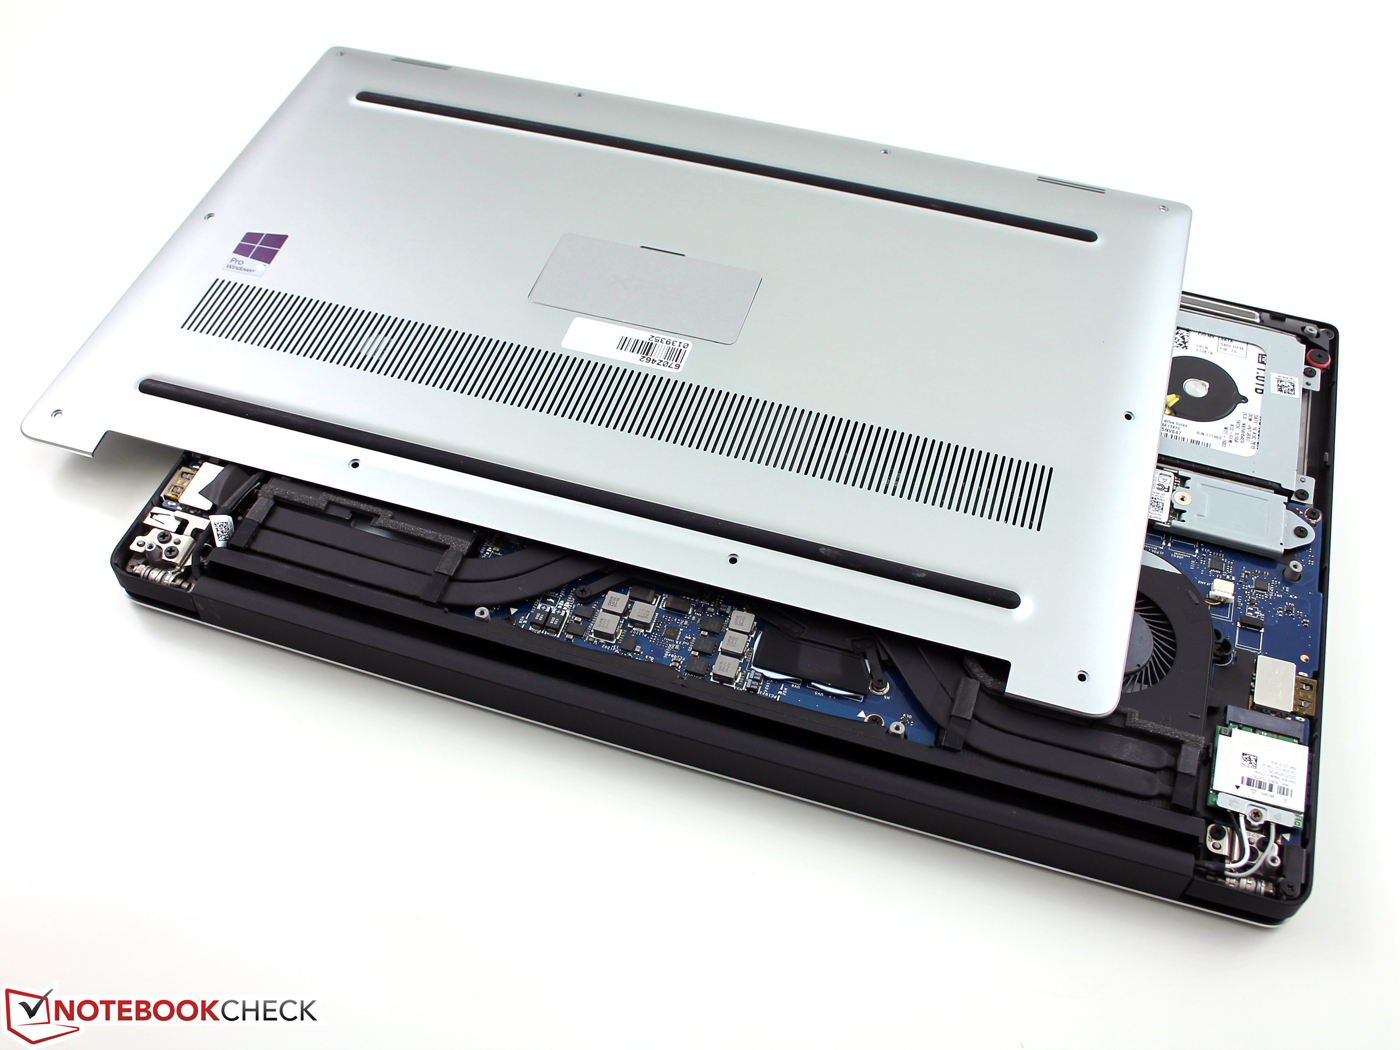
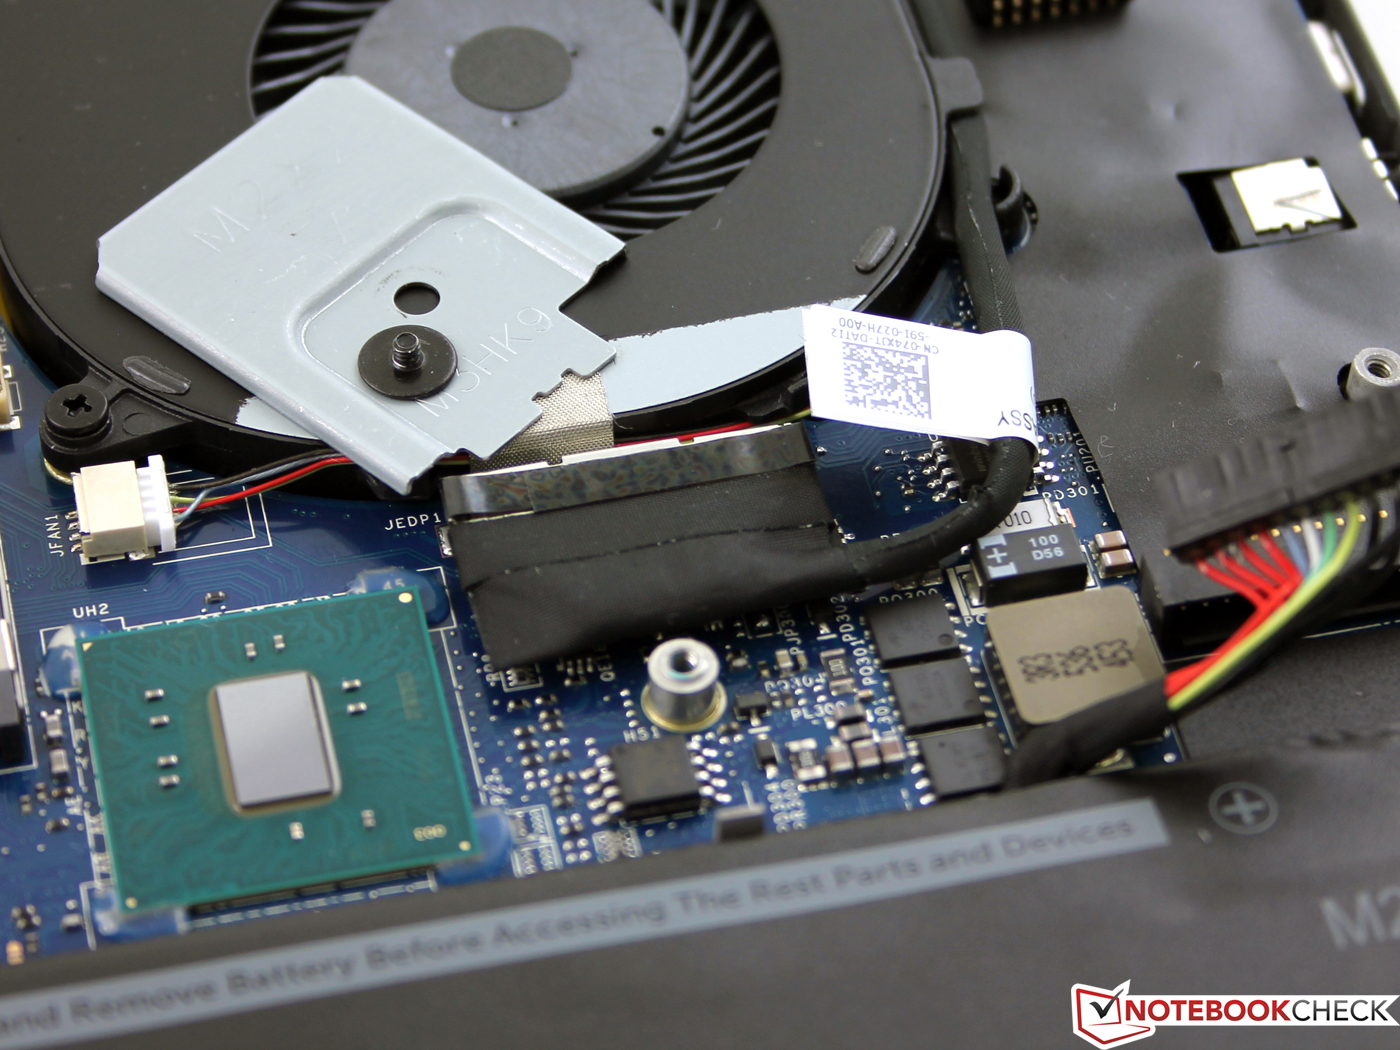
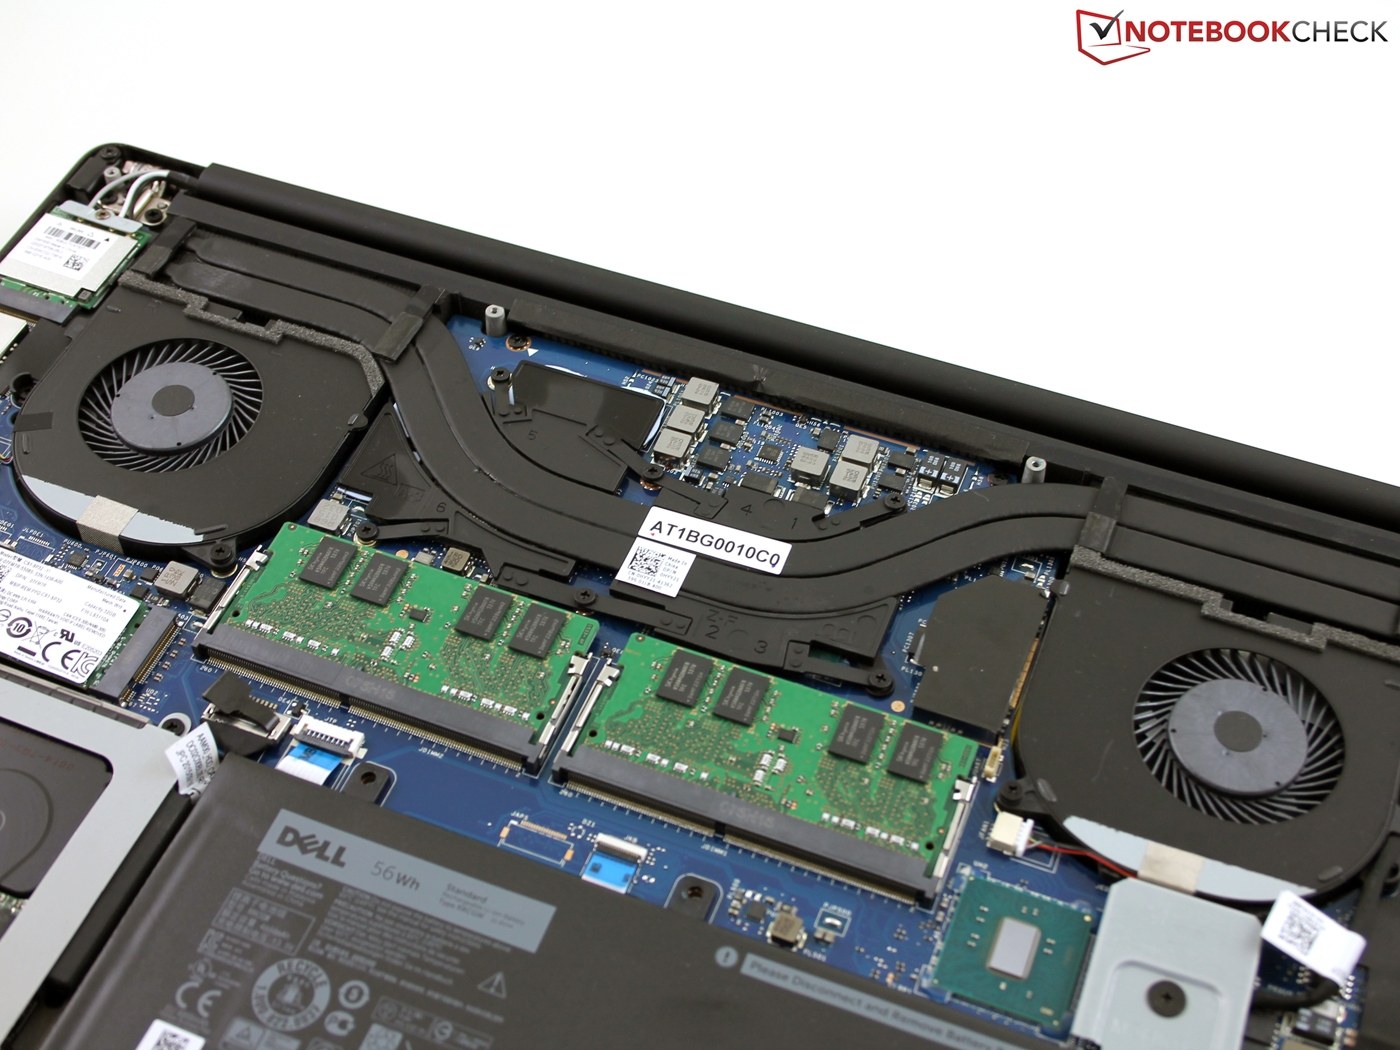
Maintenance: Internals
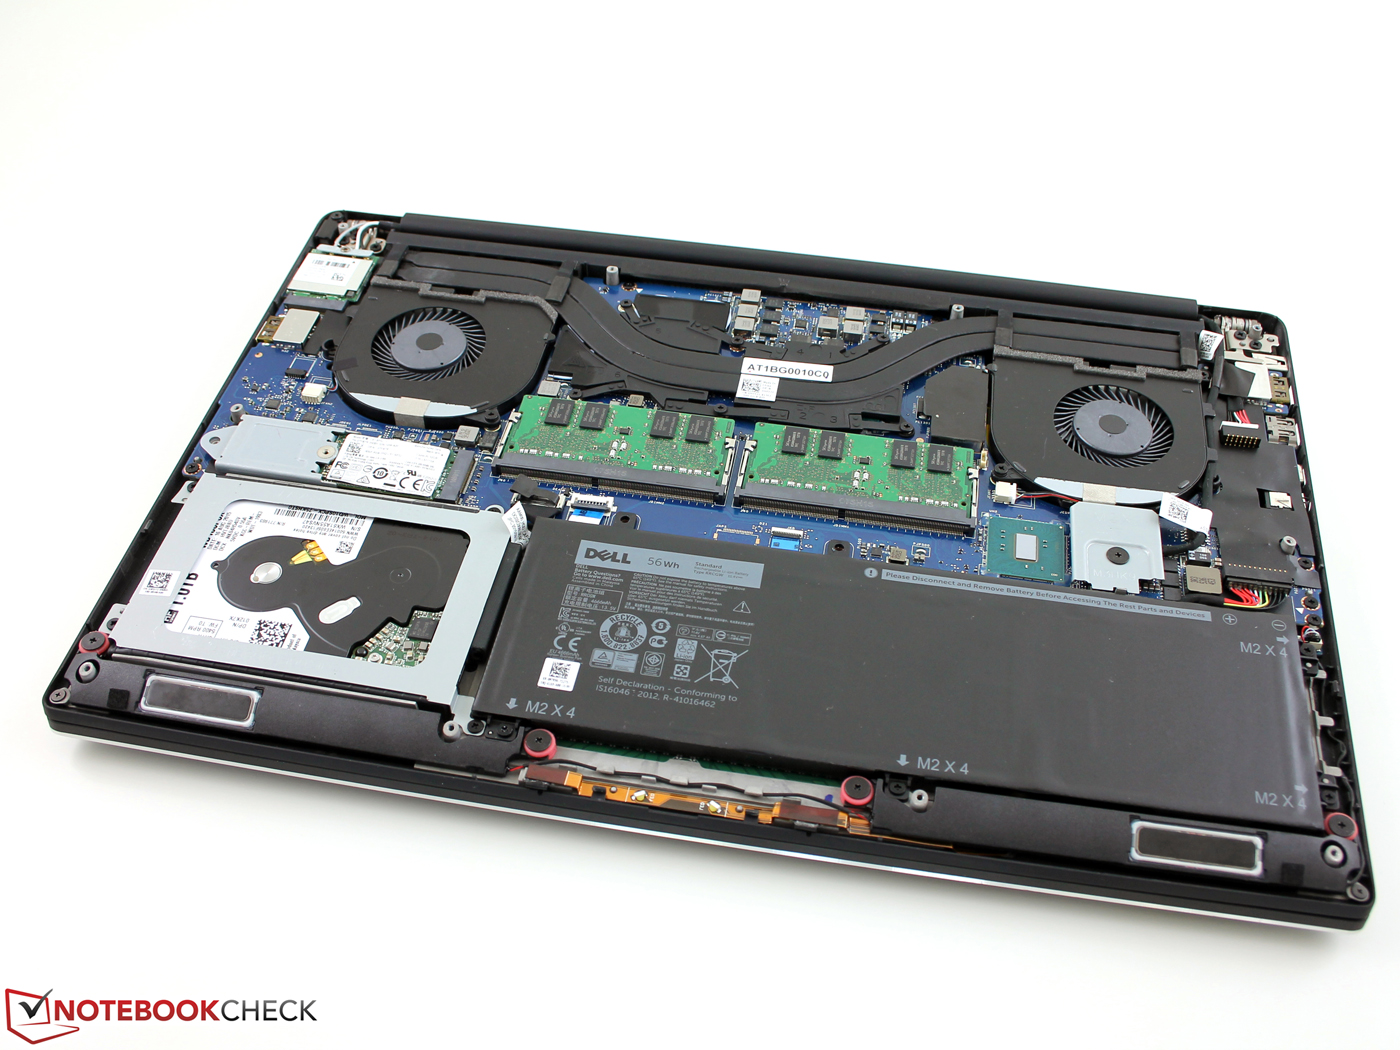
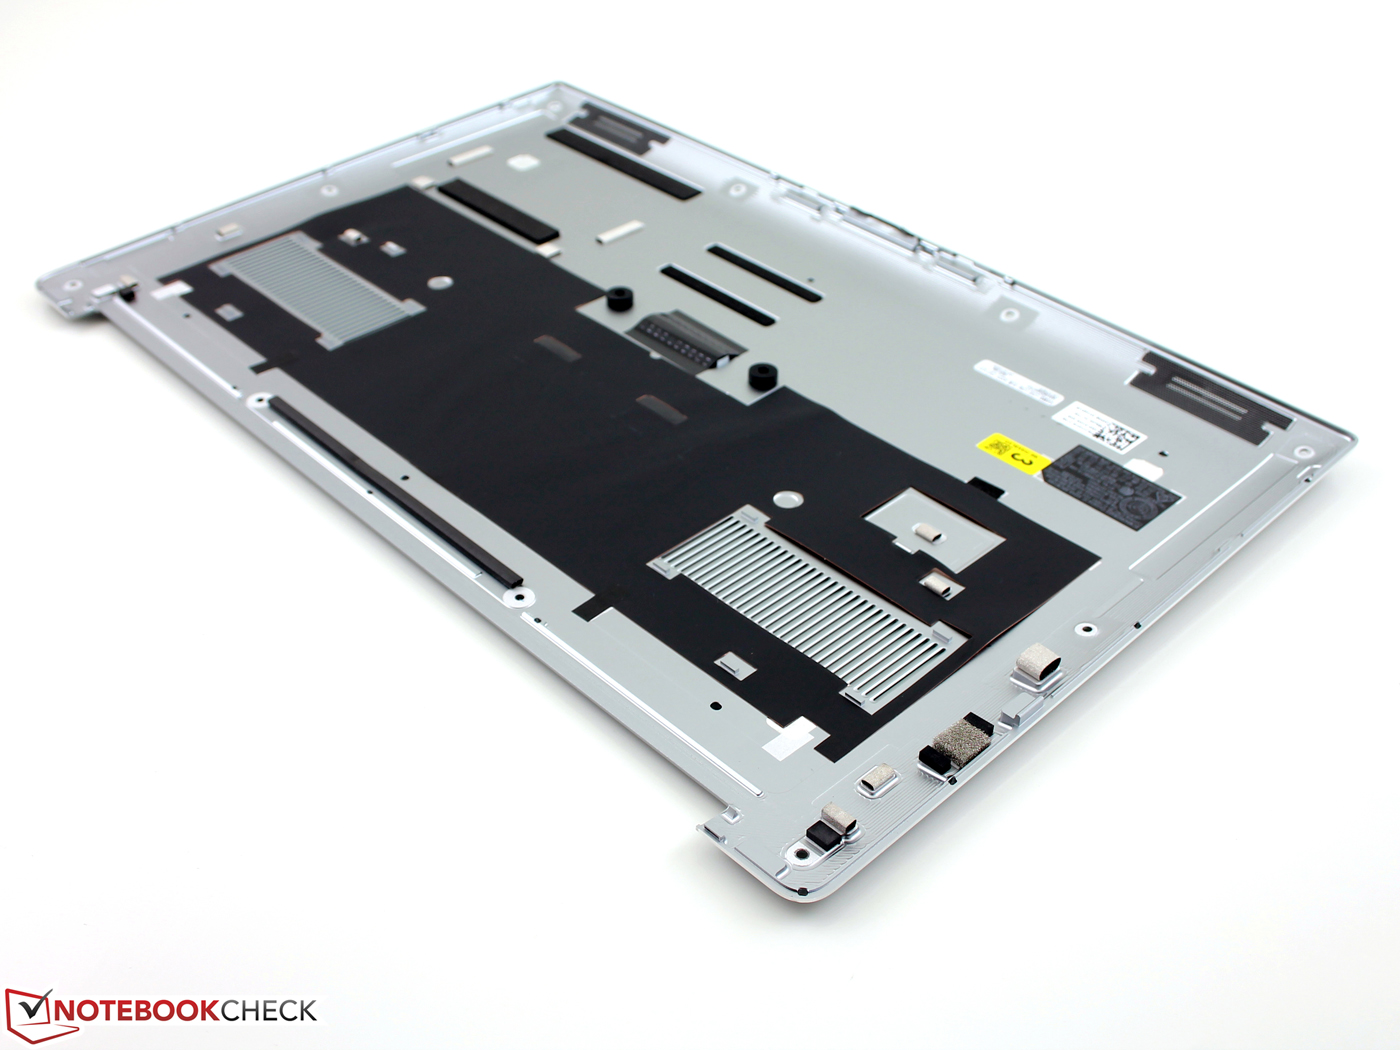
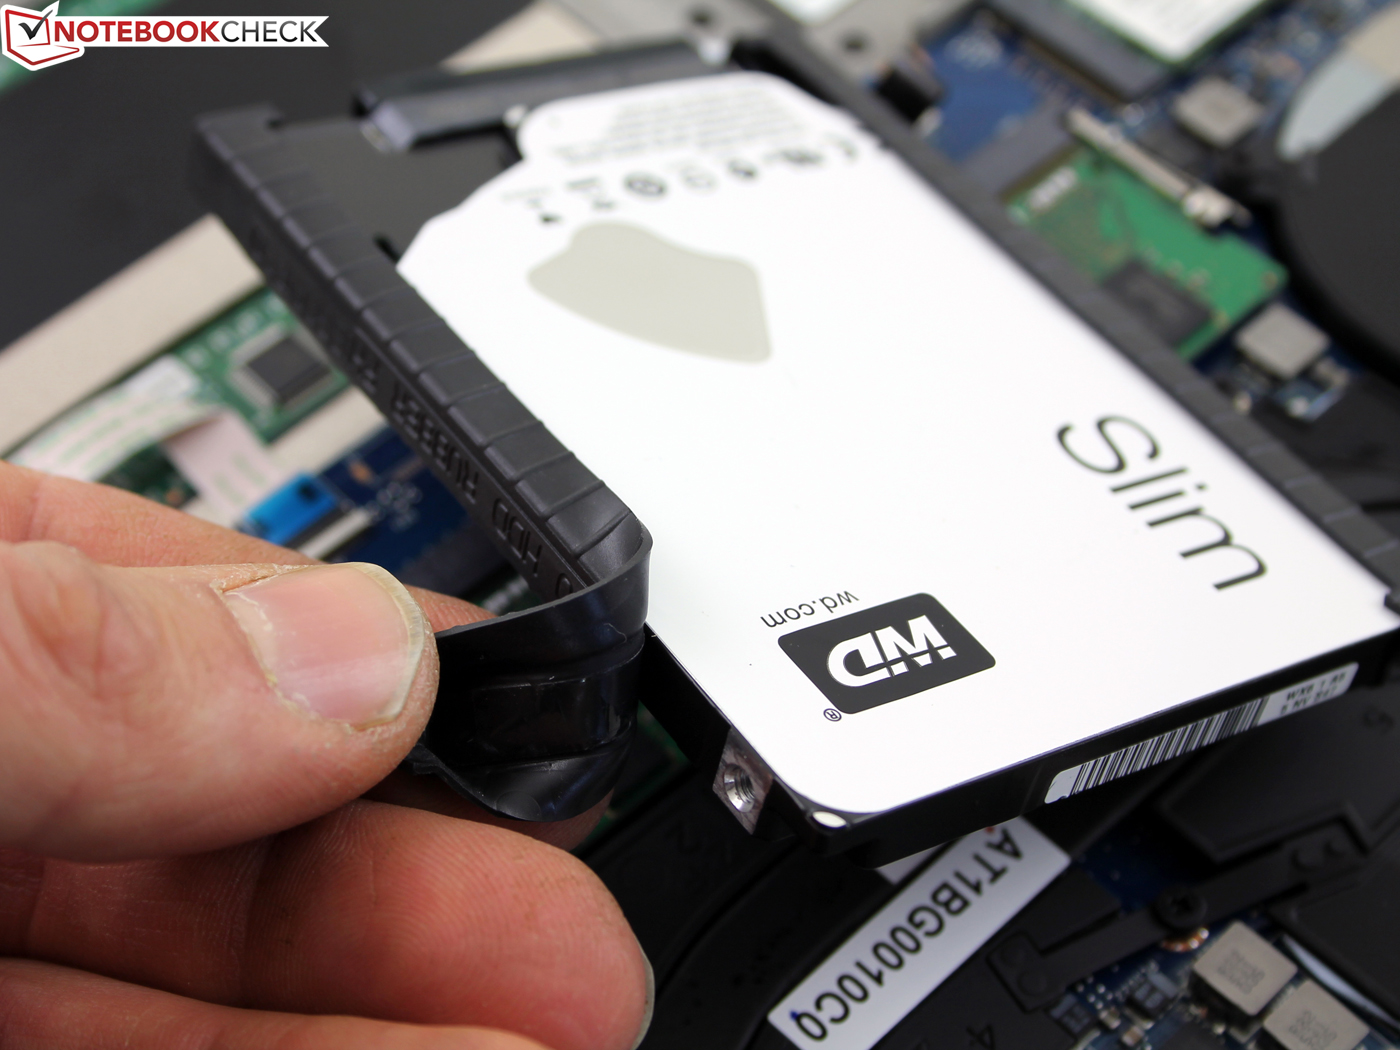
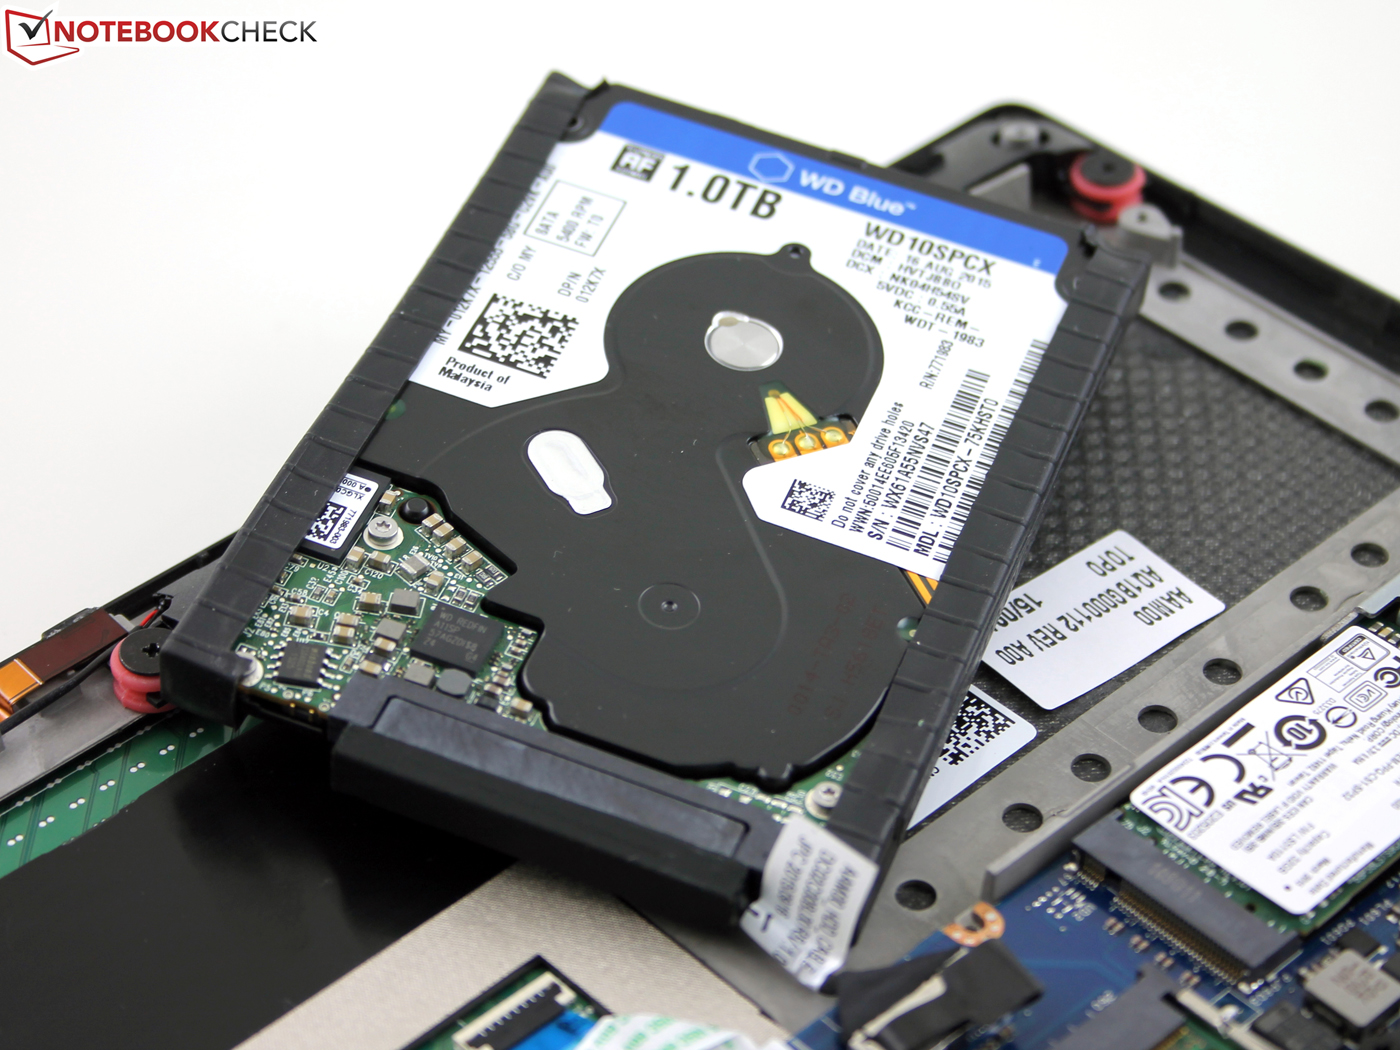
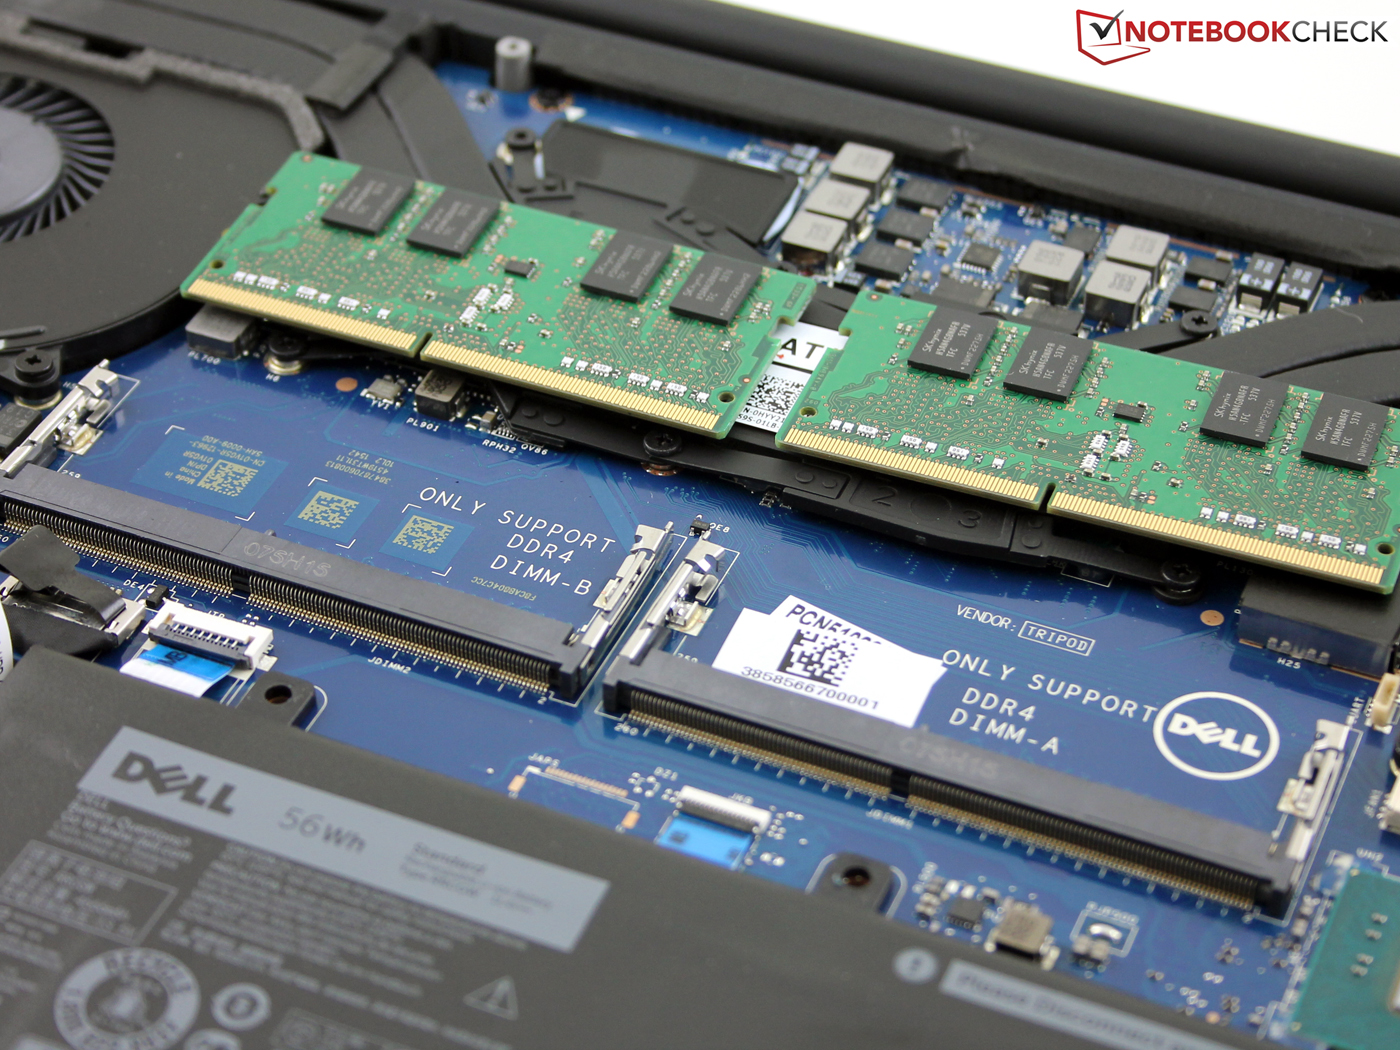
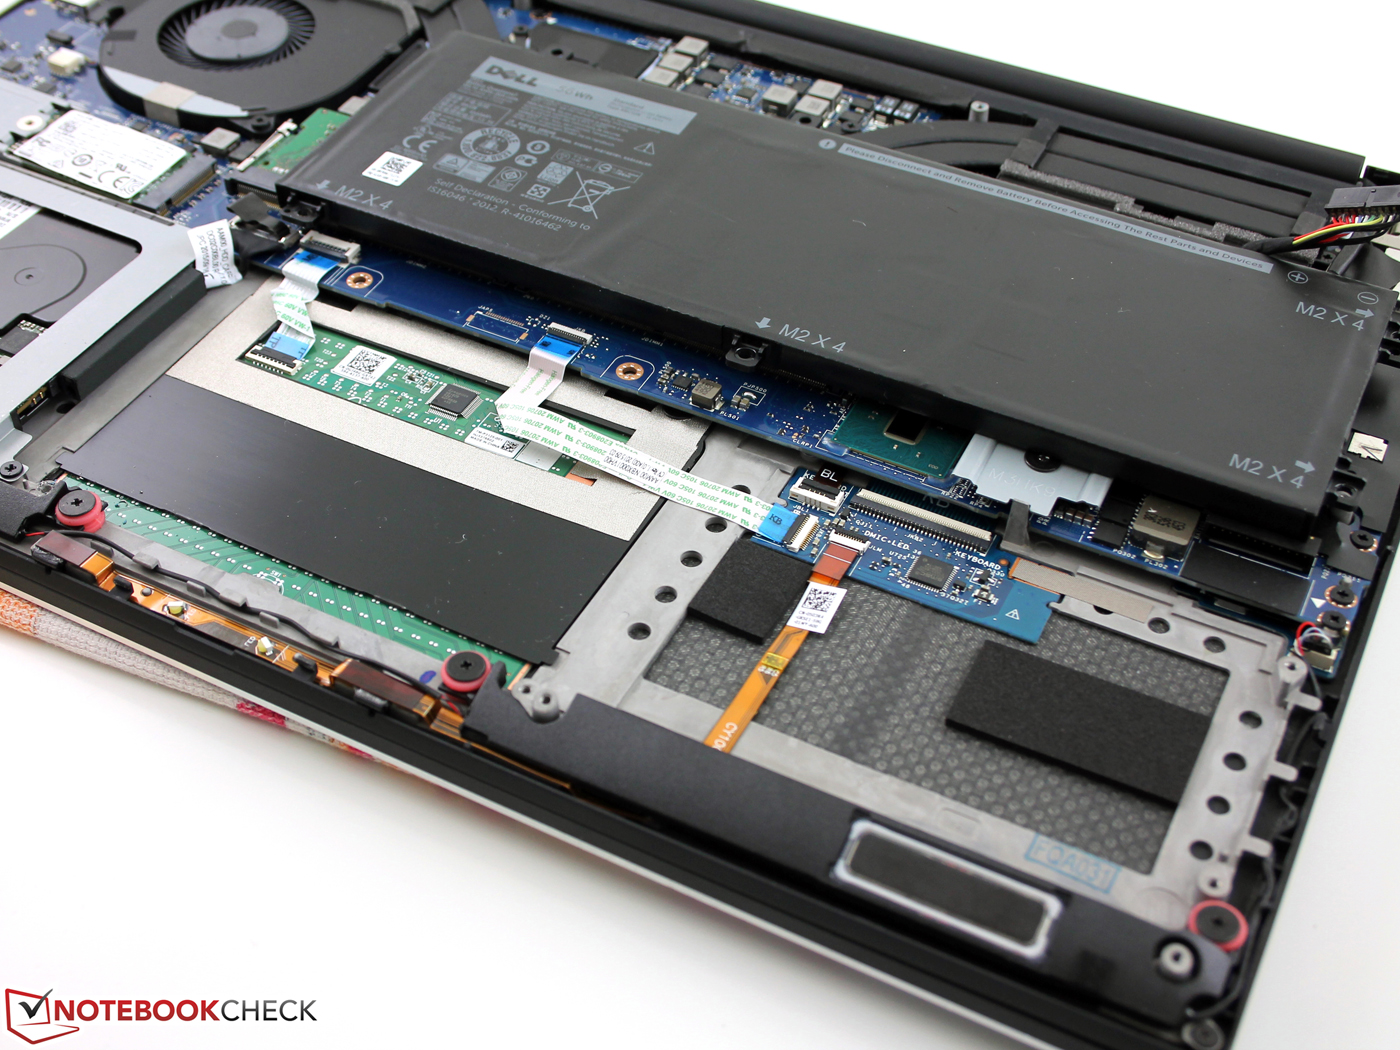
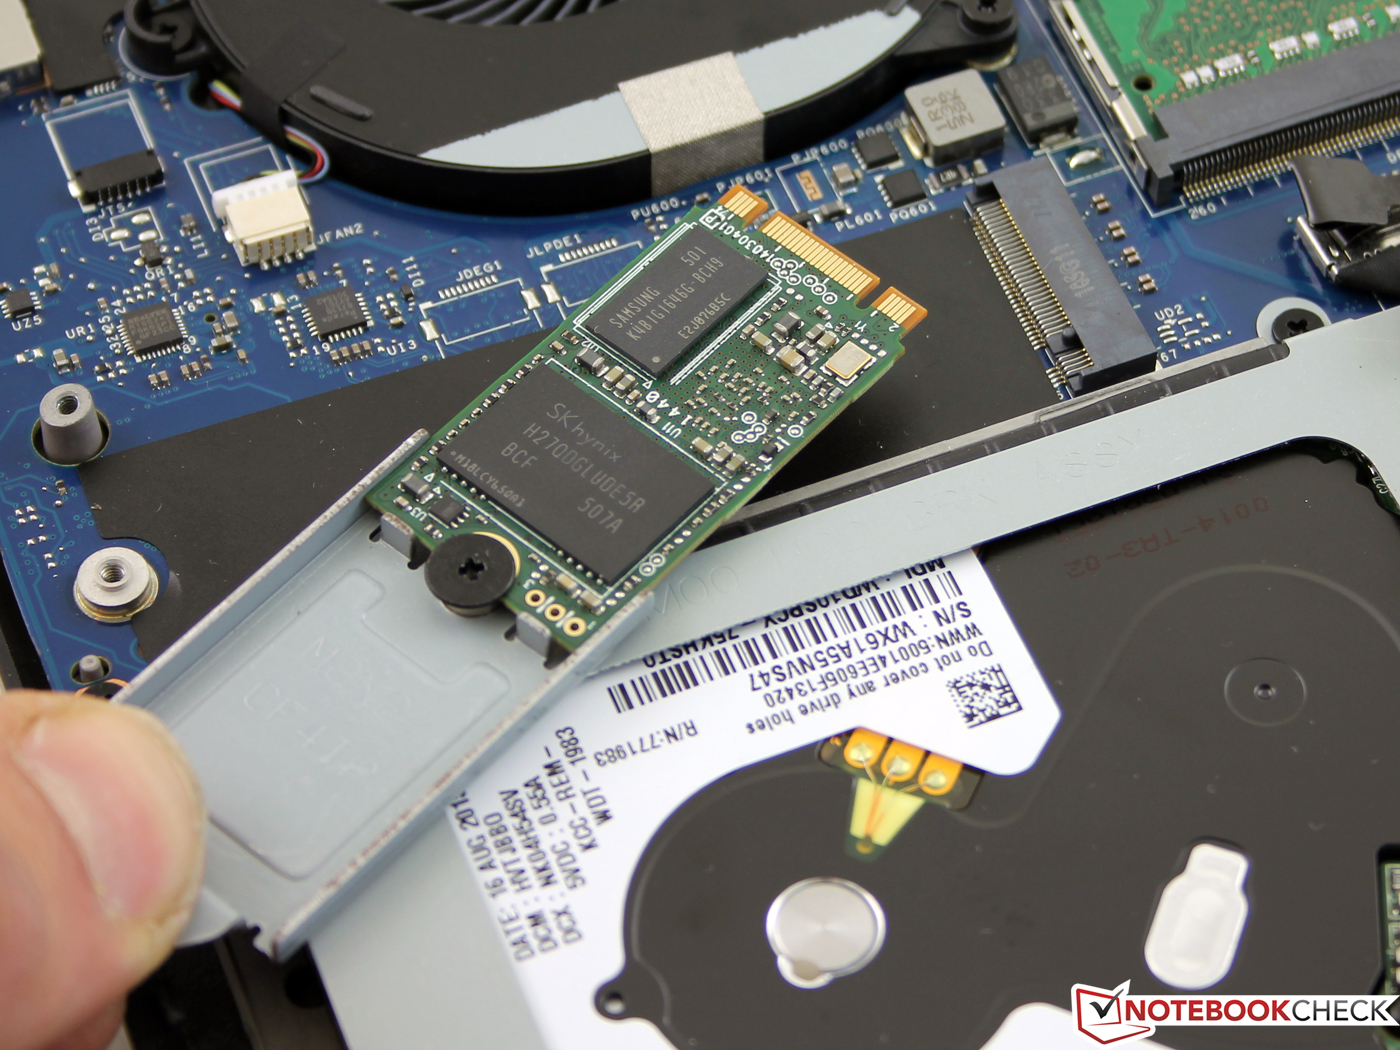
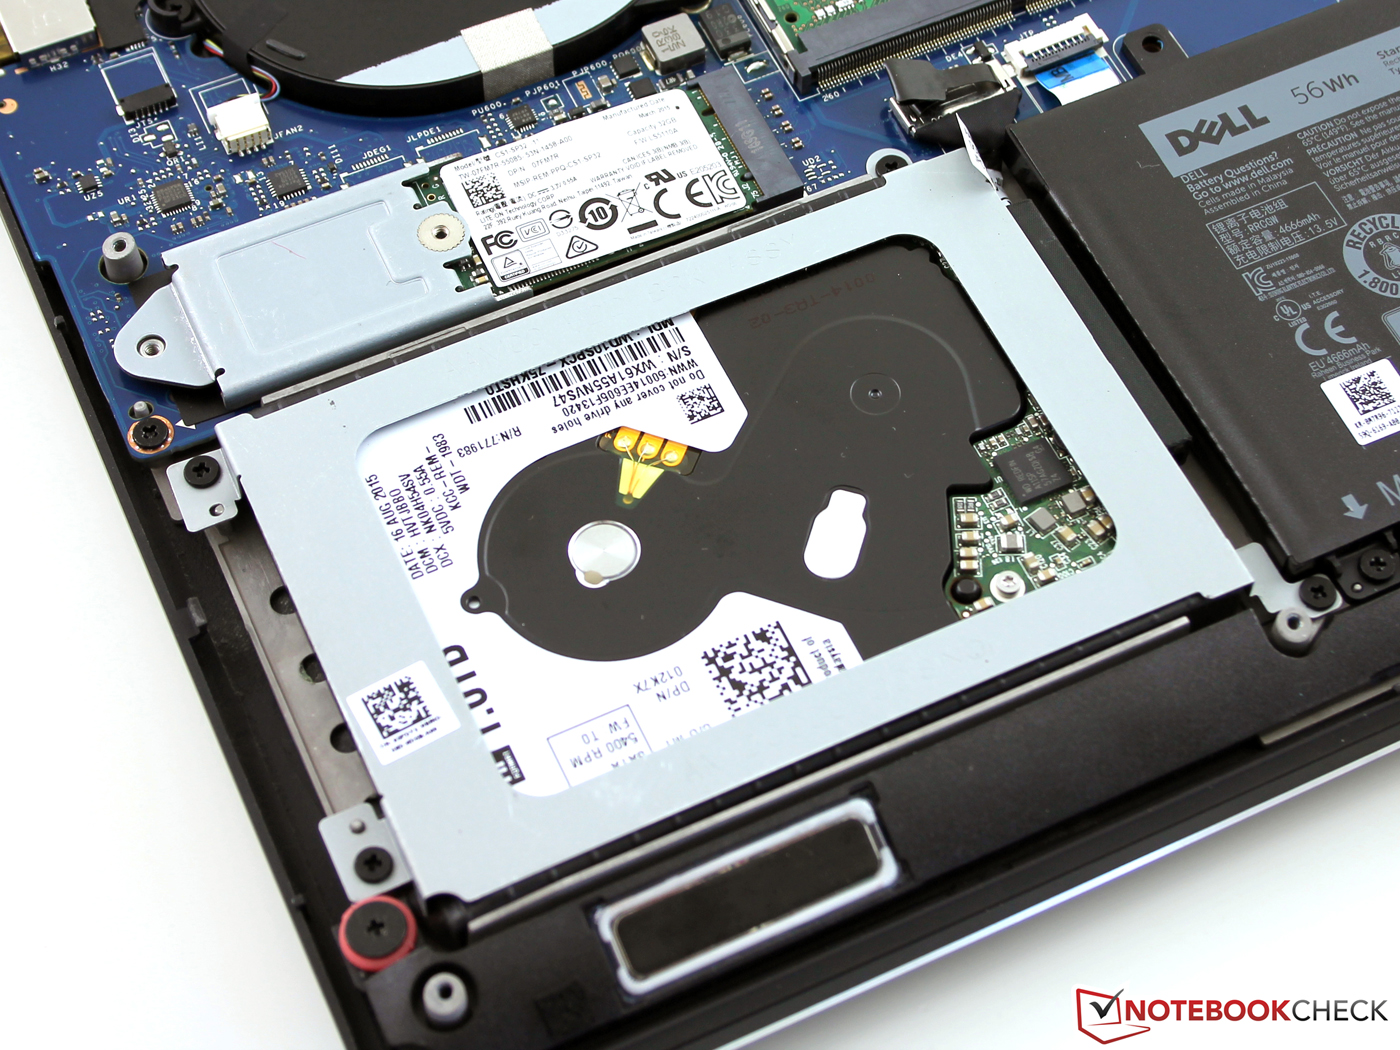
You can remove the bottom cover after loosening twelve screws. It reveals the 56-Wh battery as well as the hard drive and the small SSD. The two memory modules are socketed. You can include up to 32 GB DDR4-RAM (SO-DIMM), but the 1 TB hard drive is currently the maximum capacity. The M.2 slot can be equipped with SSDs up to a capacity of 1 TB; Dell does at least offer a corresponding configuration.
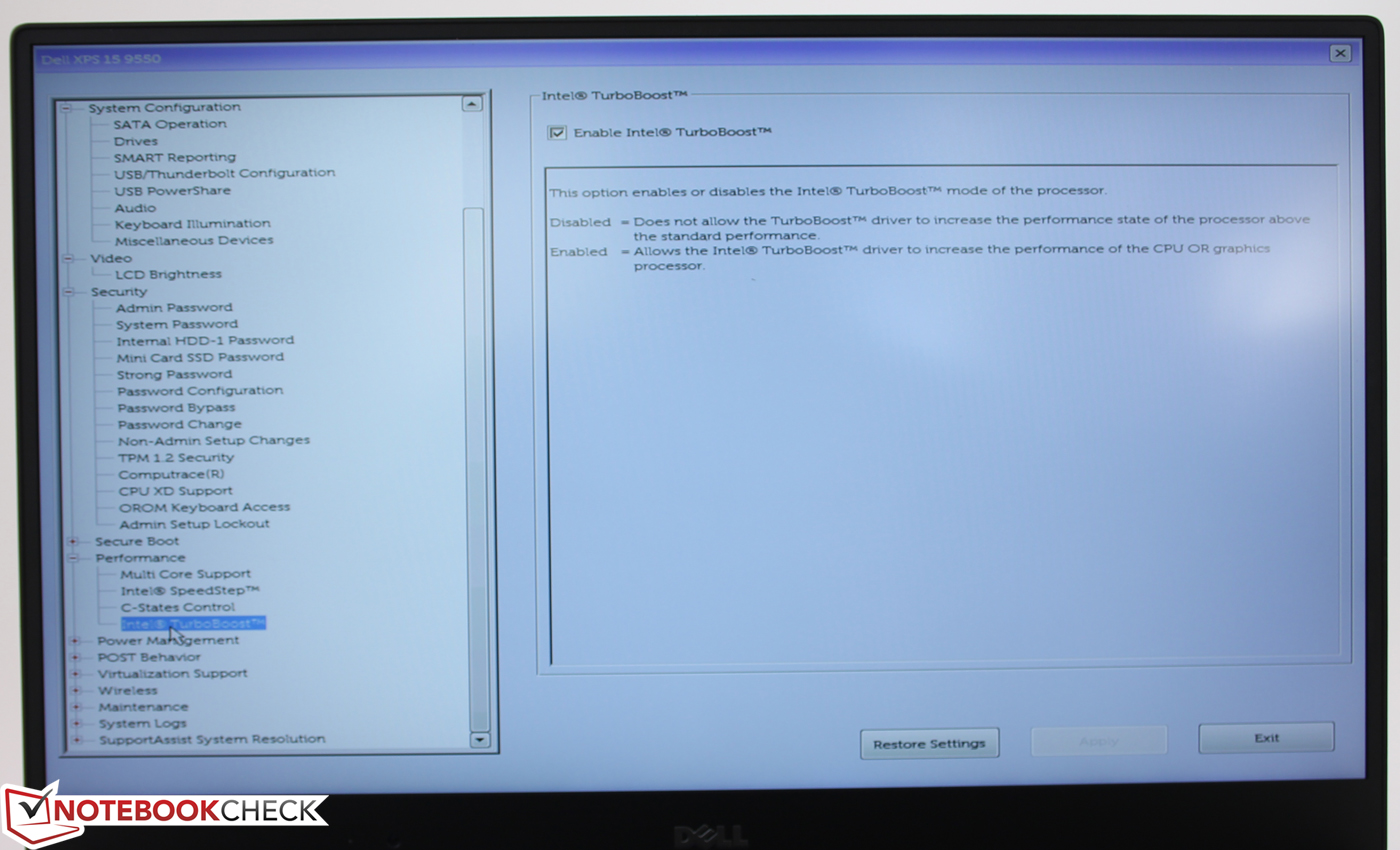
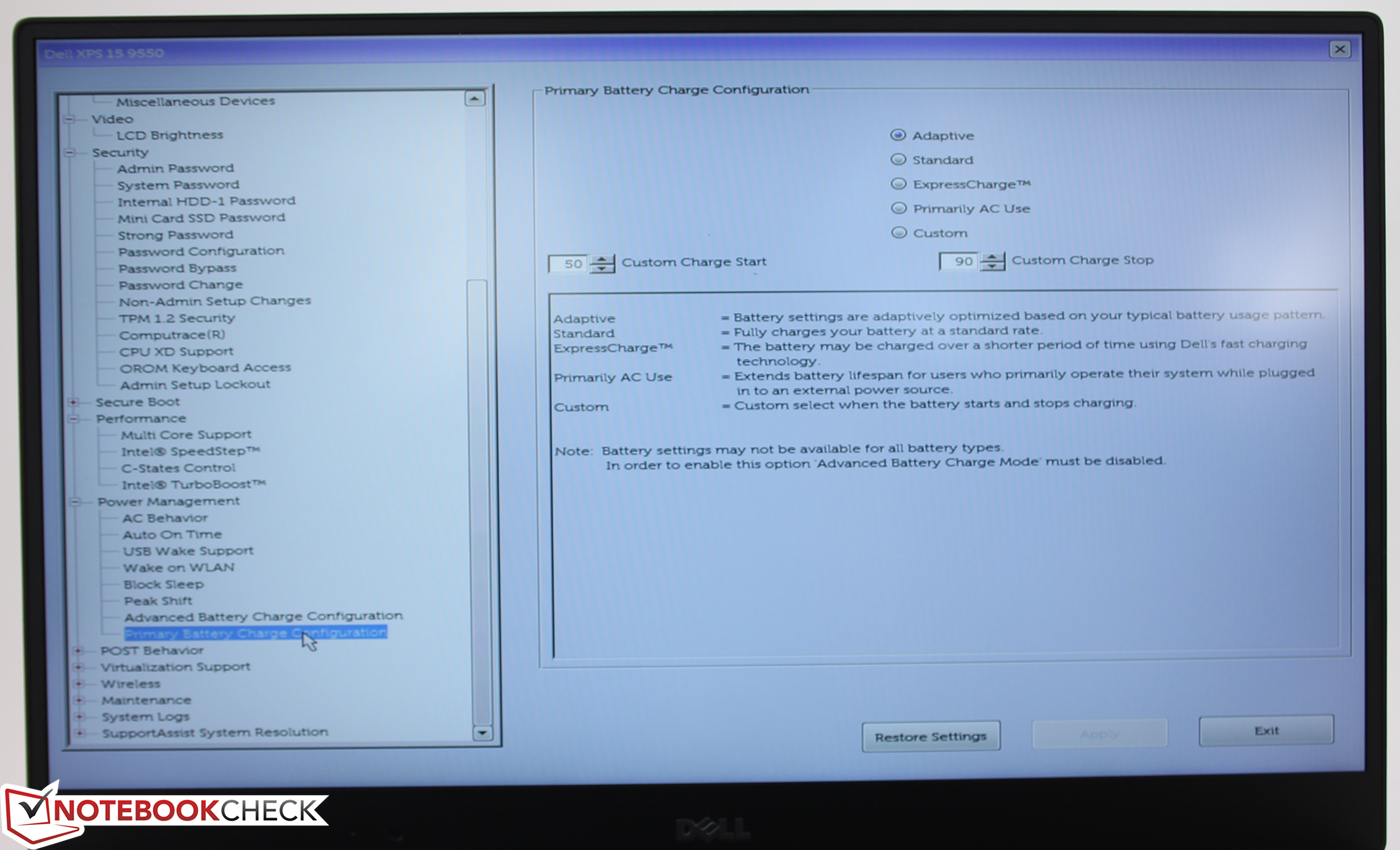
BIOS Settings


Input Devices
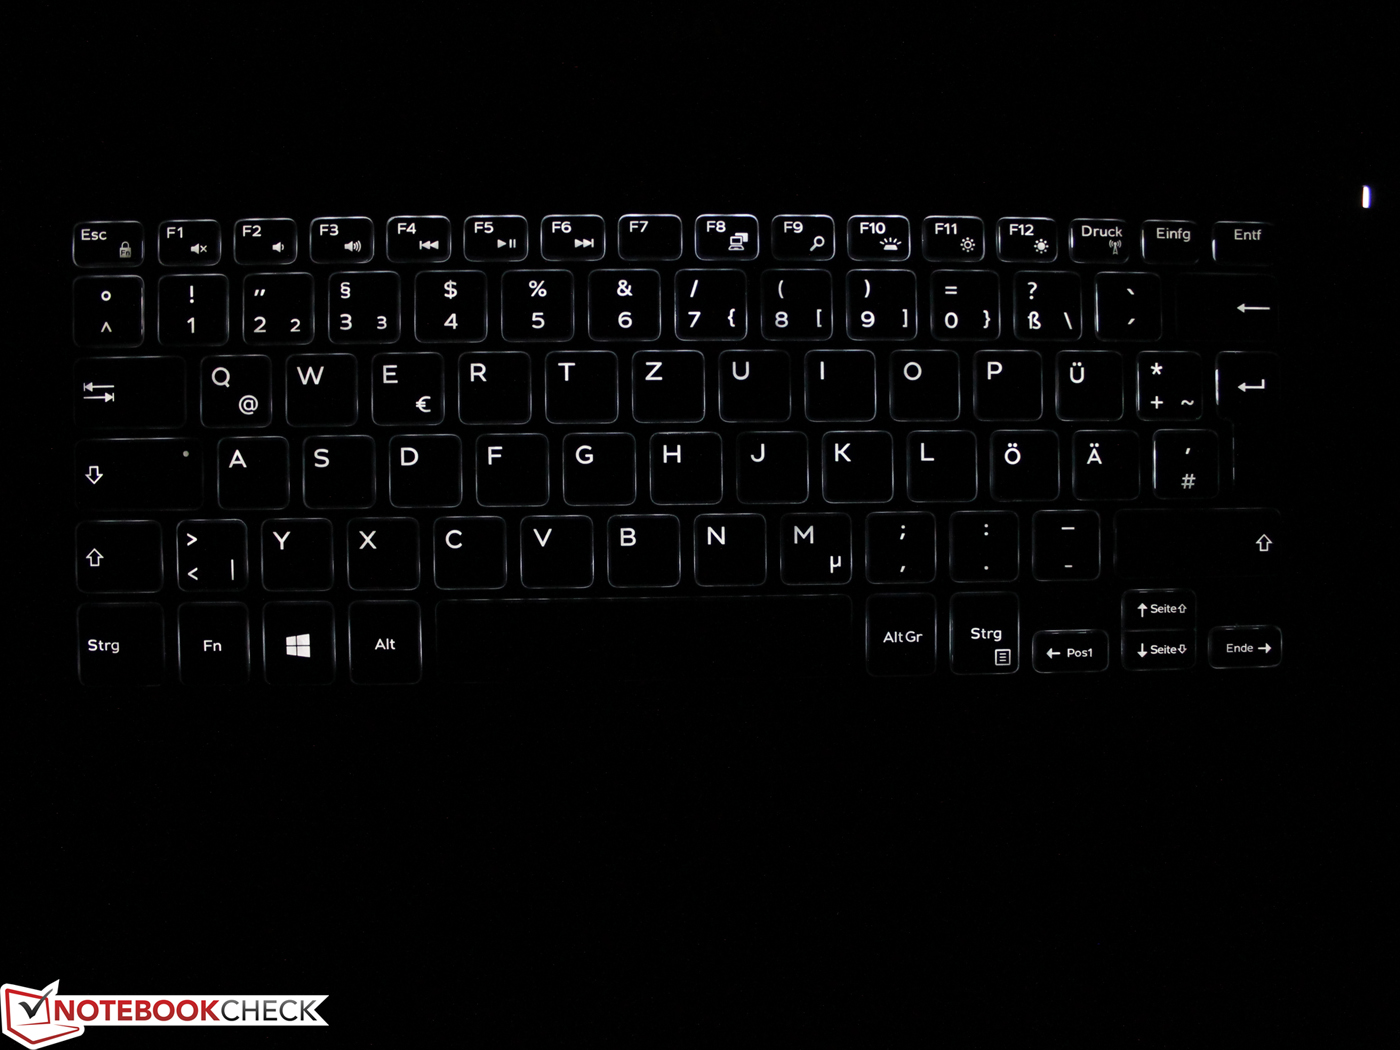
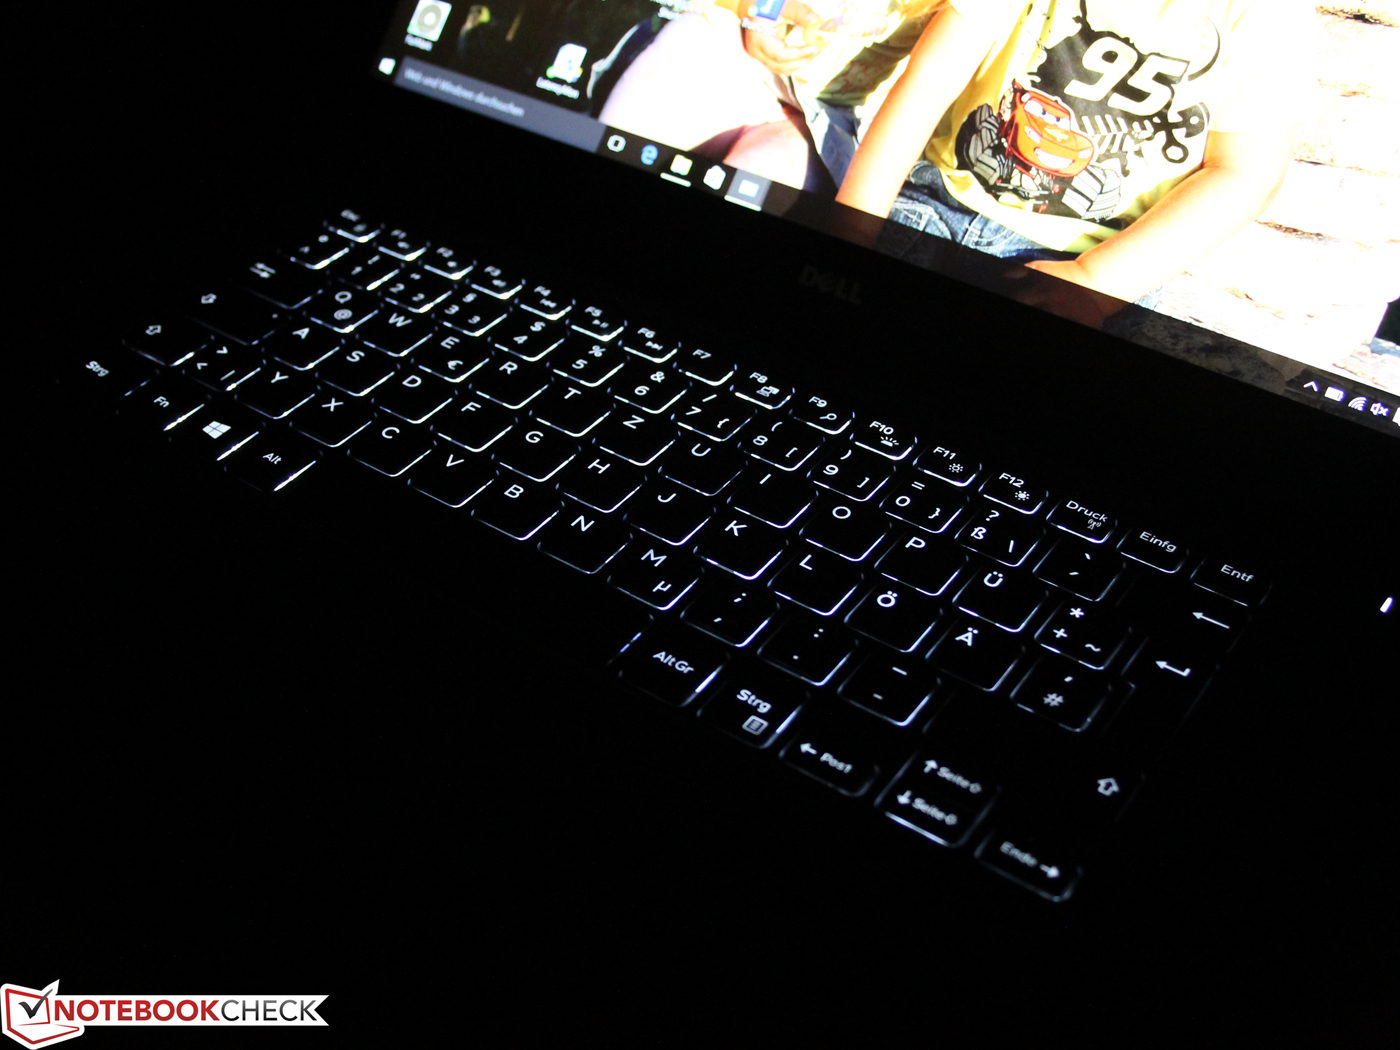
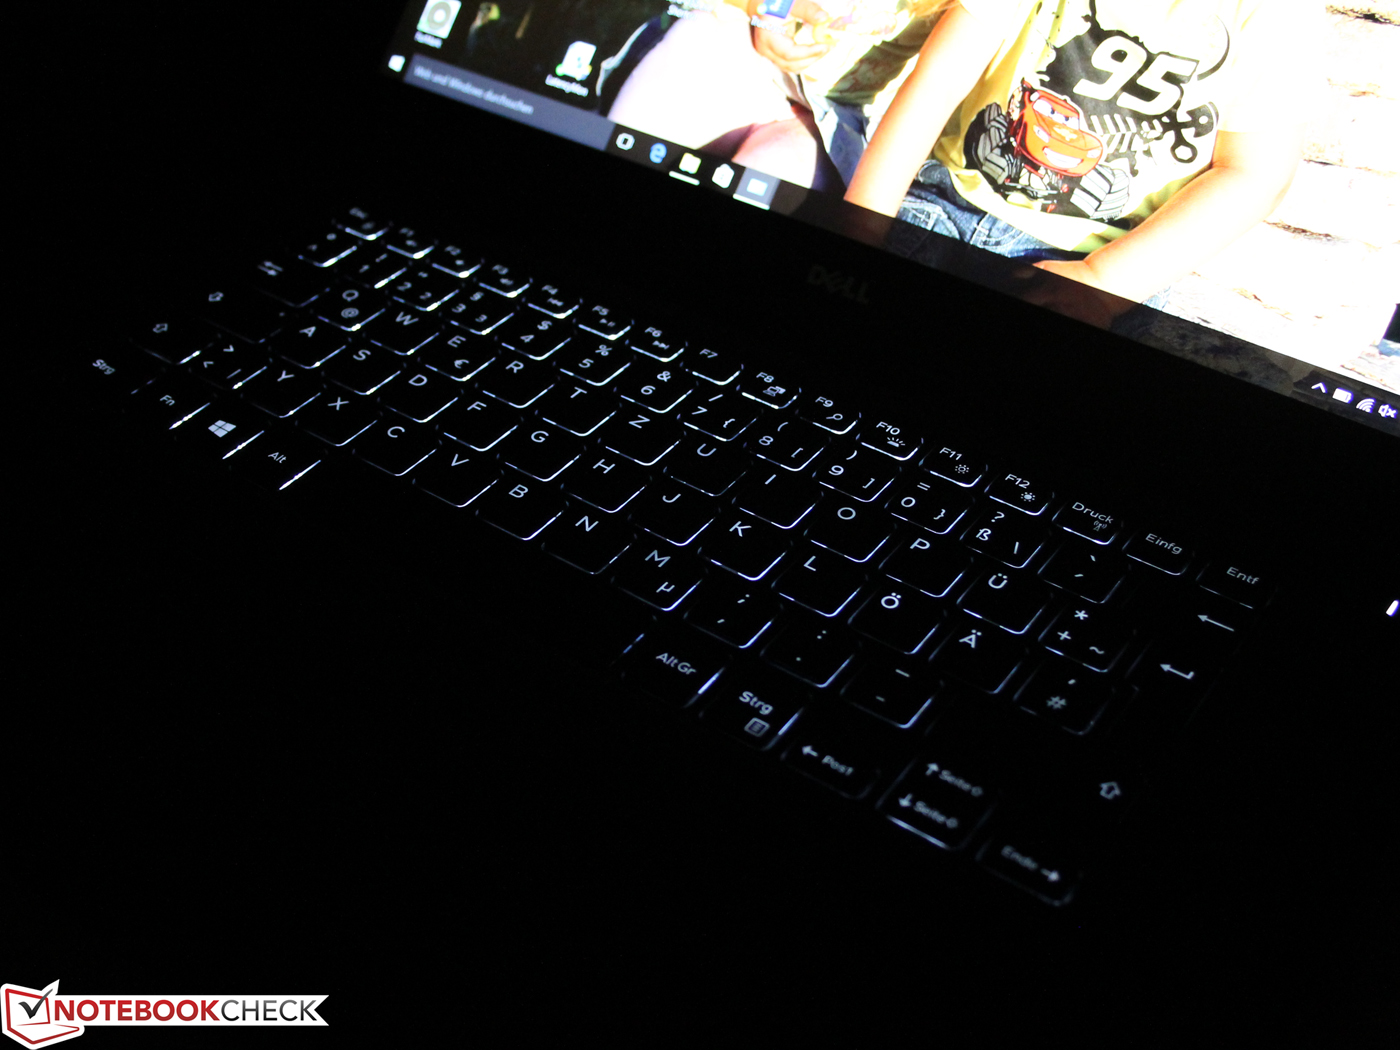
Keyboard
The keyboard leaves a pretty good impression with its firm, almost hard stroke and a crisp pressure point. Typing is pretty quiet and there is no sign of clattering or flexing. The input is not completely similar to the XPS 13, where the right Shift-key is a bit bigger. A conical curvature is still not available, so the keys are flat. We would have liked to see a longer travel for a 15-inch device, so the typing experience is – despite all the qualities of the keyboard – always a bit short-winded. This is a matter of taste though; other users love this short and firm key travel.
The white illumination can be adjusted in two steps or turned off completely. The Fn key has to be pushed for alternative functions; in this case the regular function keys F1-F12. Some users in forums reported stuck keys (Del, Space sticky), but our two review units did not have this problem.
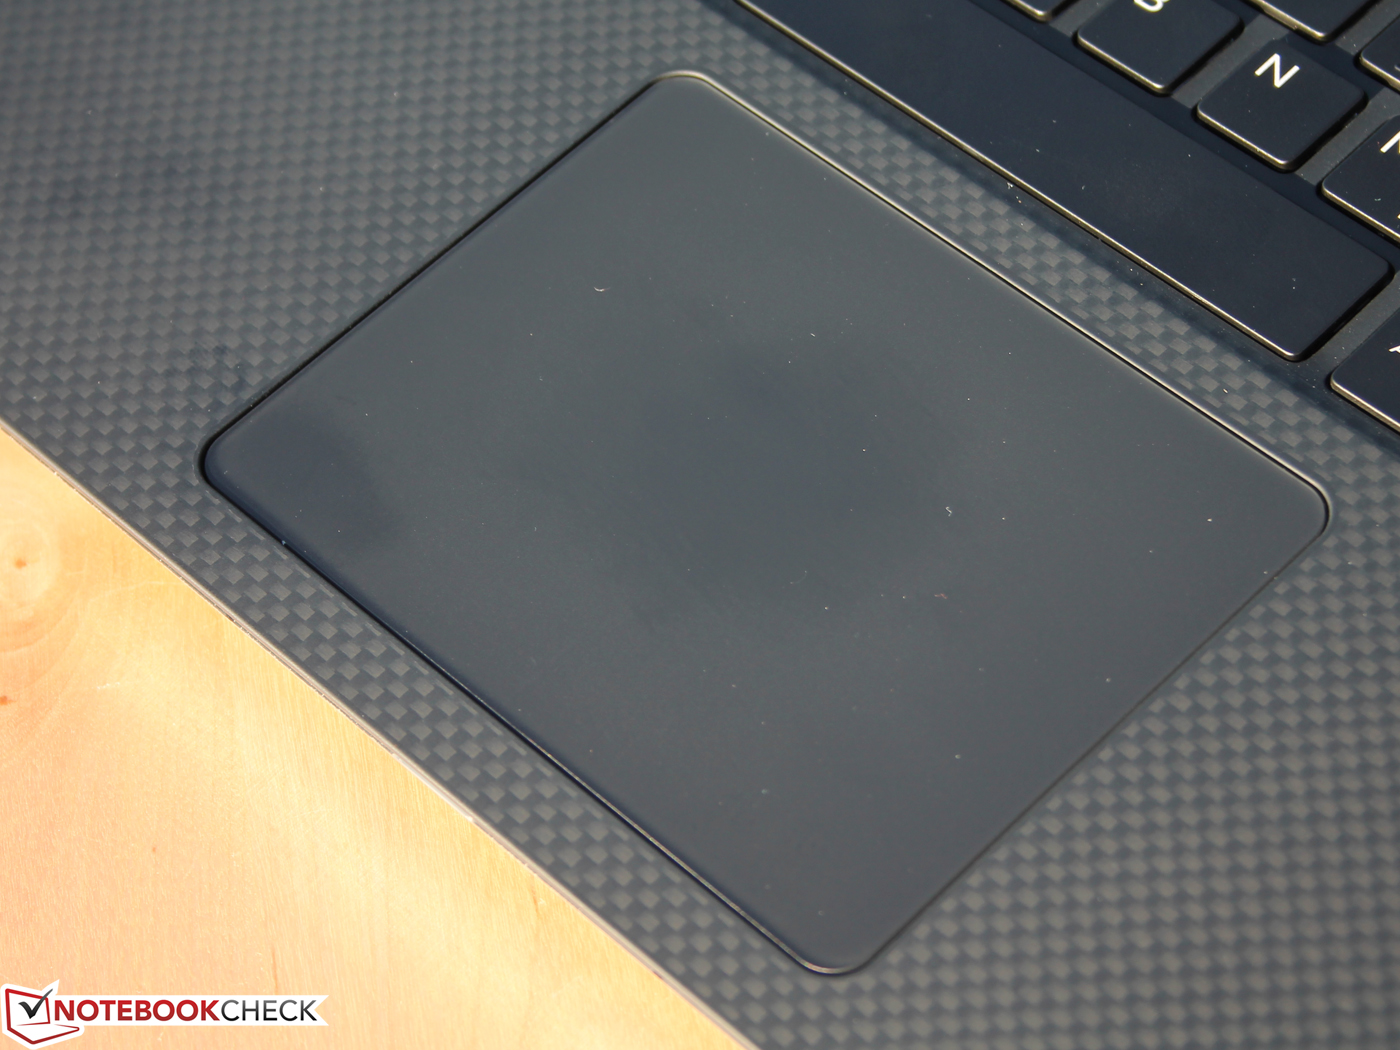
Touchpad
The very good glass ClickPad works precisely and is probably one of the best mouse replacements that you can find on a Windows device. There are hardly any settings that could be adjusted in the standard Windows driver. The surface is very smooth but not slippery or smudgy. The pad does not clatter and the pressure immediately triggers a click. The pressure point is clearly perceptible and creates a muffled and clearly audible noise.

Display
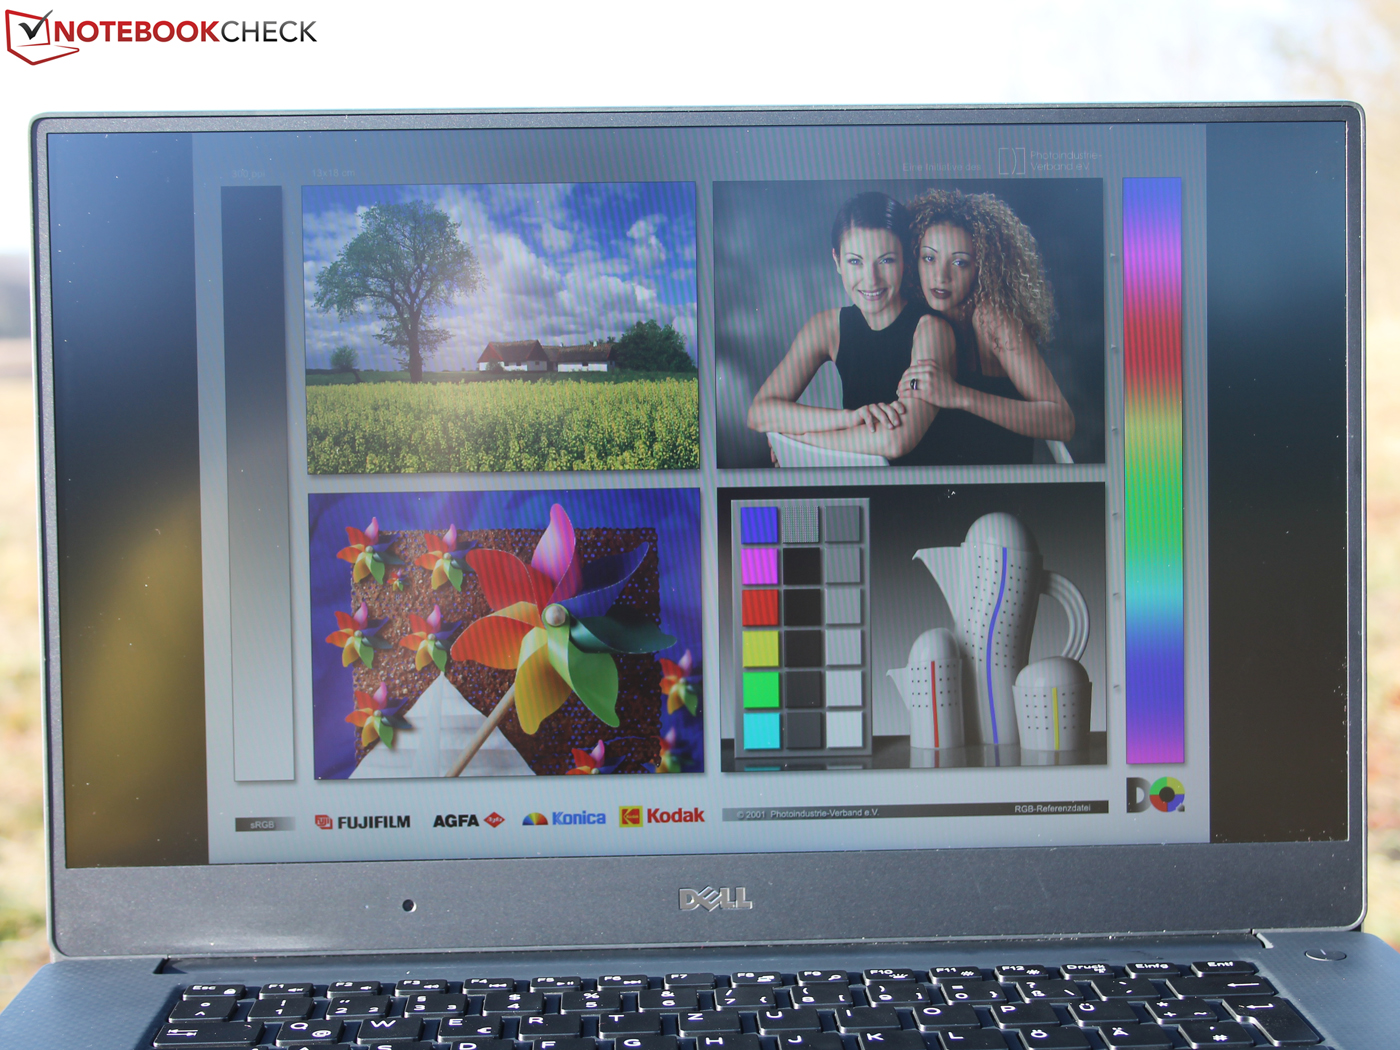
Our review unit is equipped with the matte FHD version of the IPS panel. A resolution of 1920x1080 pixels results in 141 PPI. If you are not satisfied with that, you can also opt for the 4K Ultra HD display with 3840x2160 pixels (282.4 PPI, review coming soon). While the Full HD display has a matte surface, the 4K display comes with a glossy coating. The latter also supports touch inputs, which is not the case for the FHD version. Our FHD configuration is exclusively available in combination with the i5-6300HQ and 8 GB RAM (price: 1479 Euros, ~$1608). This means you cannot combine a matte panel and the Core i7 / 16 GB, which will annoy some customers.
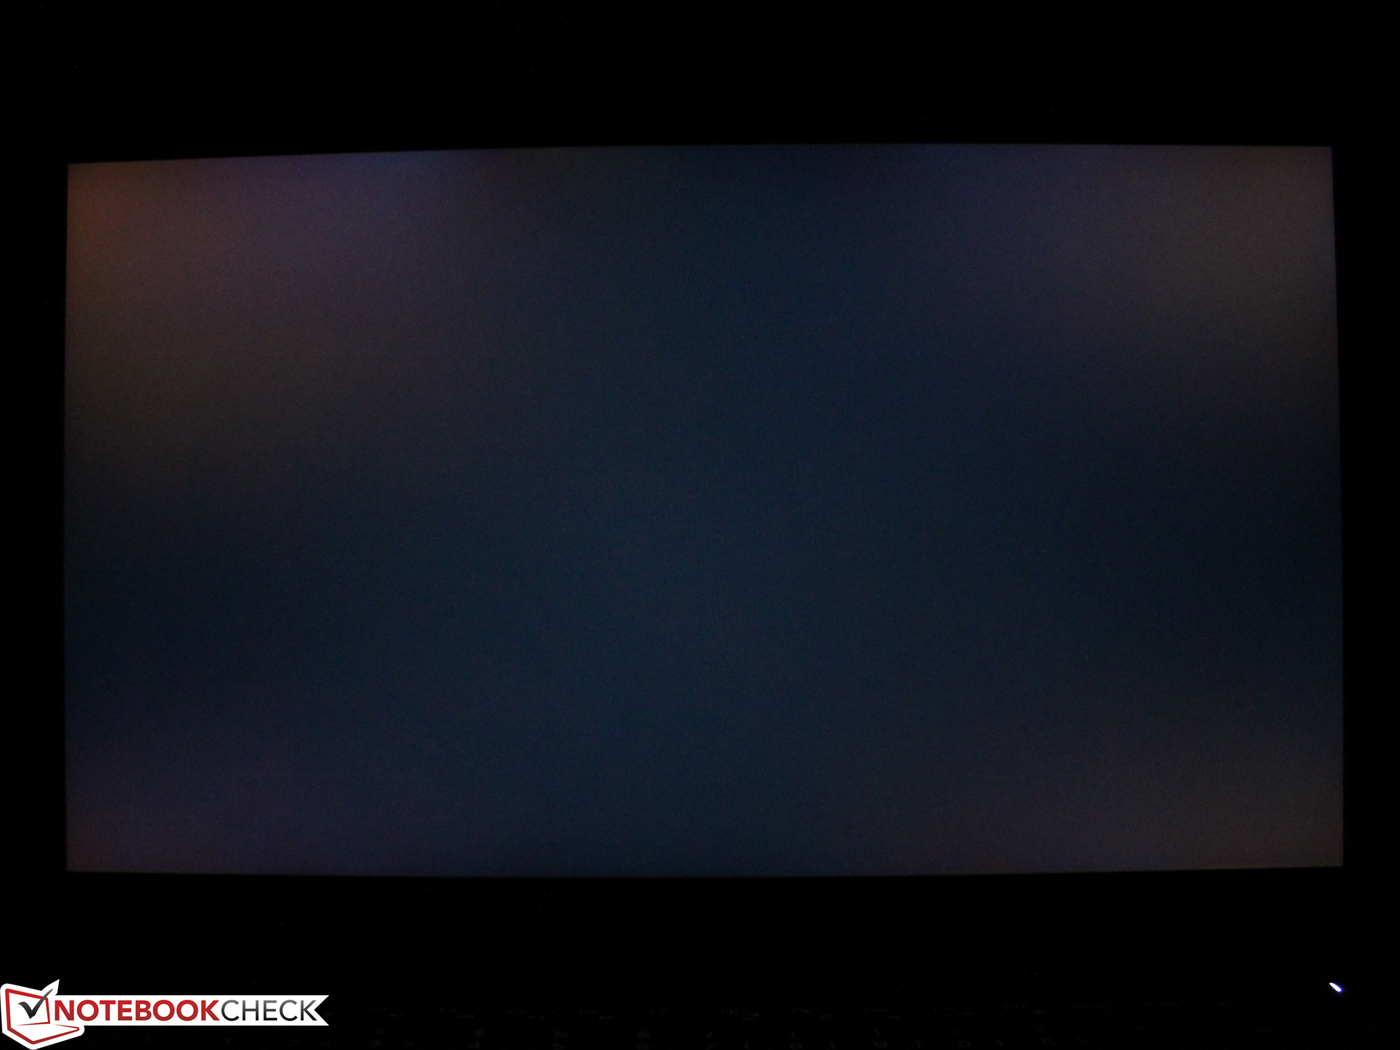
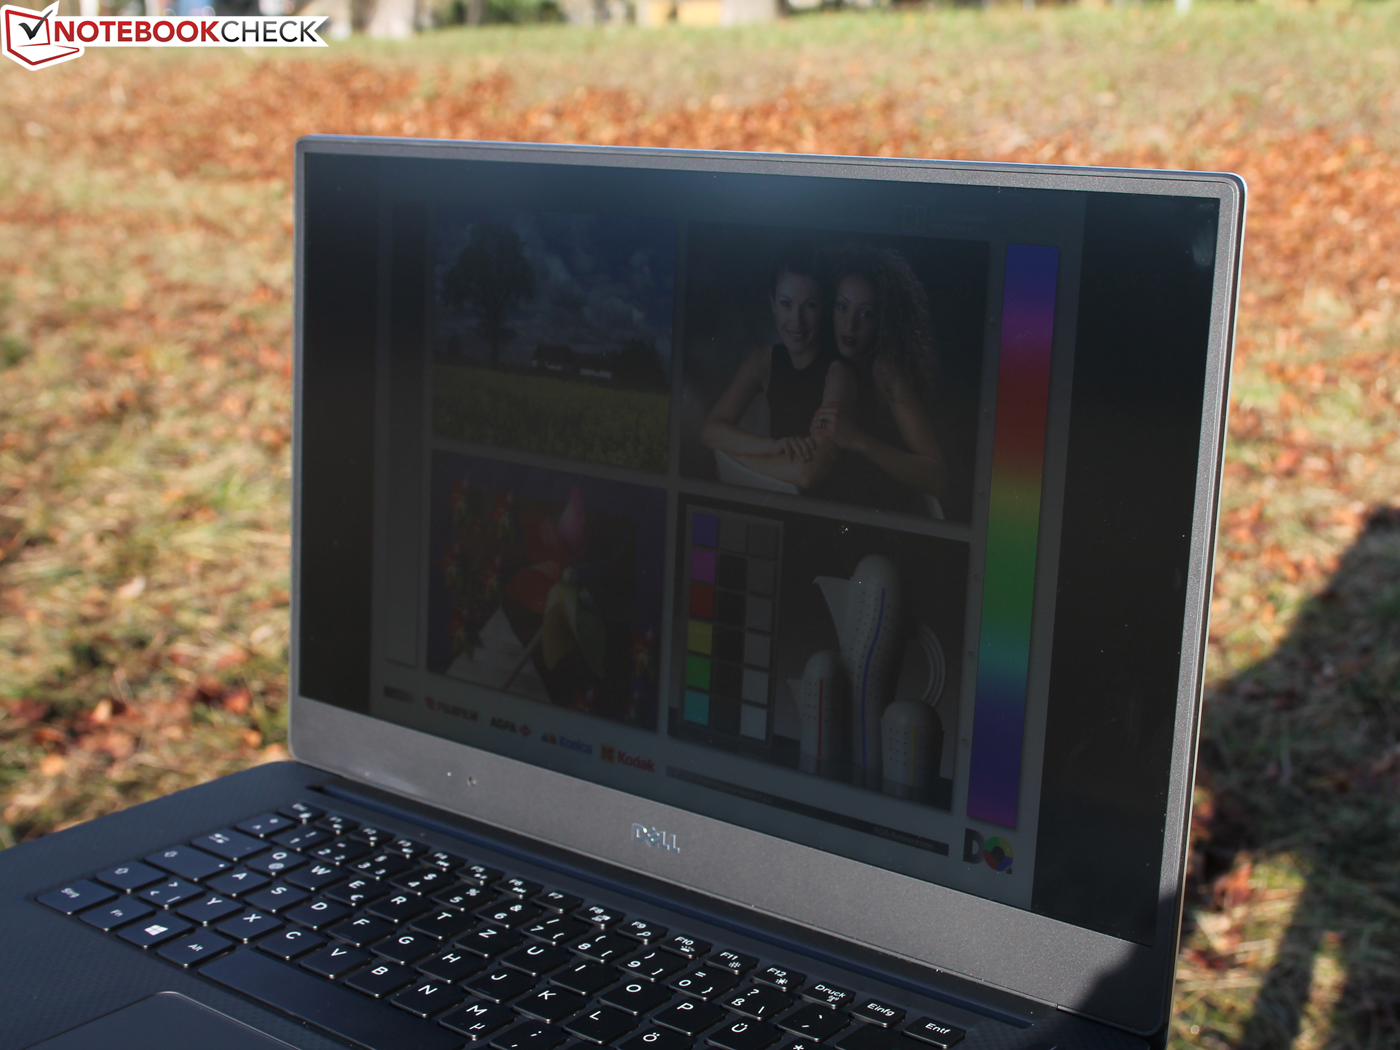
The luminance of up to 400 cd/m² and the contrast of more than 1,000:1 are a good start for the display. We can still see some backlight bleeding, even though it is only visible with a black picture and when you look for them. We used a long exposure to show it in the picture. Those areas are not visible in practice, independent of the brightness level.
| |||||||||||||||||||||||||
Brightness Distribution: 89 %
Center on Battery: 399 cd/m²
Contrast: 1663:1 (Black: 0.24 cd/m²)
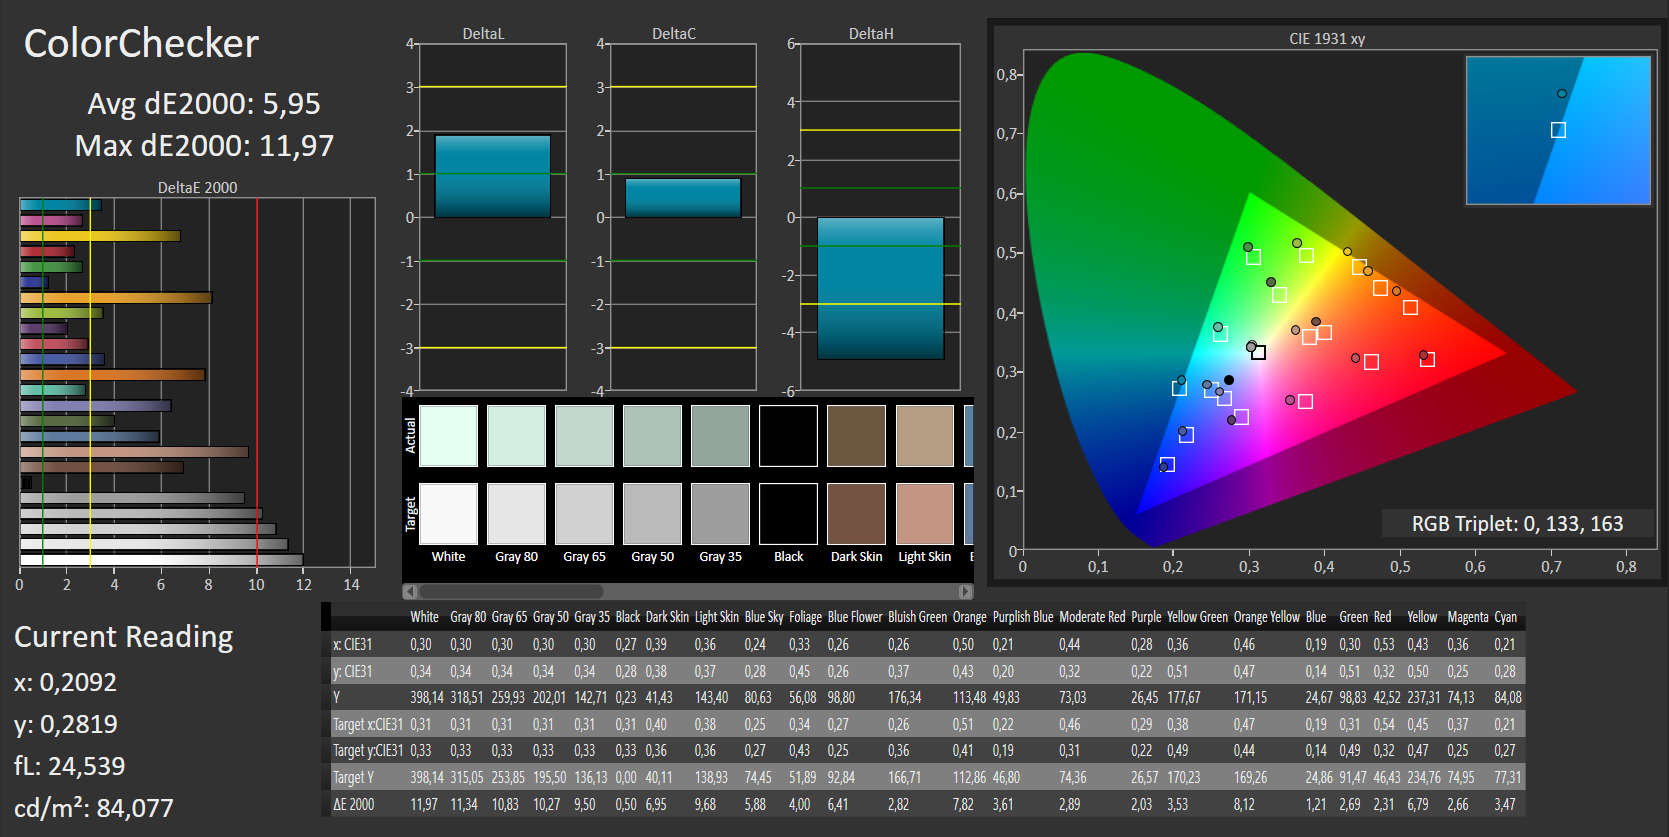
ΔE ColorChecker Calman: 5.95 | ∀{0.5-29.43 Ø4.72}
ΔE Greyscale Calman: 8.41 | ∀{0.09-98 Ø4.97}
98% sRGB (Argyll 1.6.3 3D)
64% AdobeRGB 1998 (Argyll 1.6.3 3D)
70.7% AdobeRGB 1998 (Argyll 3D)
97.9% sRGB (Argyll 3D)
68.8% Display P3 (Argyll 3D)
Gamma: 2.35
CCT: 7010 K
| Dell XPS 15 9550 1920x1080 Sharp SHP1453 LQ156M1 IPS | Apple MB Pro Retina 15 2015 2880x1800 APPA02E IPS | Asus Zenbook Pro UX501JW 3840x2160 Samsung SDC434B FL156FL02-101 IPS | XPS 13 2016 i7 QHD 3200x1800 SHP1421 LQ133Y1 IGZO | XPS 15 9530 3840x2160 Sharp SHP1431 LQ156D1 IPS | MSI PE60 1920x1080 SAMSUNG LTN156HL01 IPS True Color | Acer AS V Nitro VN7-792G 1920x1080 AUO B173HAN01 IPS | |
|---|---|---|---|---|---|---|---|
| Display | -10% | -30% | -6% | -4% | -1% | -5% | |
| Display P3 Coverage (%) | 68.8 | 61.4 -11% | 47.47 -31% | 63.6 -8% | 64.9 -6% | 67.6 -2% | 67 -3% |
| sRGB Coverage (%) | 97.9 | 90.8 -7% | 71.5 -27% | 93.6 -4% | 96.1 -2% | 97 -1% | 91.3 -7% |
| AdobeRGB 1998 Coverage (%) | 70.7 | 62.9 -11% | 49.05 -31% | 65.5 -7% | 66.9 -5% | 69.8 -1% | 66.7 -6% |
| Response Times | 31% | 30% | 18% | ||||
| Response Time Grey 50% / Grey 80% * (ms) | 62 ? | 43.2 ? 30% | 40 ? 35% | 58 ? 6% | |||
| Response Time Black / White * (ms) | 40 ? | 27.2 ? 32% | 30 ? 25% | 28 ? 30% | |||
| PWM Frequency (Hz) | 362 ? | 4900 ? | |||||
| Screen | 0% | -42% | 1% | 4% | -0% | -1% | |
| Brightness middle (cd/m²) | 399 | 341 -15% | 302 -24% | 285 -29% | 349 -13% | 300 -25% | 346 -13% |
| Brightness (cd/m²) | 394 | 315 -20% | 307 -22% | 281 -29% | 365 -7% | 282 -28% | 326 -17% |
| Brightness Distribution (%) | 89 | 82 -8% | 87 -2% | 90 1% | 87 -2% | 90 1% | 88 -1% |
| Black Level * (cd/m²) | 0.24 | 0.34 -42% | 0.79 -229% | 0.18 25% | 0.282 -17% | 0.35 -46% | 0.32 -33% |
| Contrast (:1) | 1663 | 1003 -40% | 382 -77% | 1583 -5% | 1238 -26% | 857 -48% | 1081 -35% |
| Colorchecker dE 2000 * | 5.95 | 2.07 65% | 5.4 9% | 4.89 18% | 2.65 55% | 1.8 70% | 4.01 33% |
| Greyscale dE 2000 * | 8.41 | 1.9 77% | 5.99 29% | 5.16 39% | 3.77 55% | 2.18 74% | 3.58 57% |
| Gamma | 2.35 94% | 2.62 84% | 2.32 95% | 2.15 102% | 2.41 91% | 2.37 93% | 2.23 99% |
| CCT | 7010 93% | 6514 100% | 6670 97% | 7106 91% | 6786 96% | 6837 95% | 6426 101% |
| Color Space (Percent of AdobeRGB 1998) (%) | 64 | 58 -9% | 45 -30% | 59 -8% | 61.02 -5% | 64 0% | |
| Color Space (Percent of sRGB) (%) | 98 | 91 -7% | 71 -28% | 93 -5% | 96.1 -2% | 97 -1% | |
| Colorchecker dE 2000 max. * | 3.27 | ||||||
| Total Average (Program / Settings) | -5% /
-2% | -14% /
-29% | 8% /
3% | 0% /
2% | -1% /
-1% | 4% /
1% |
* ... smaller is better
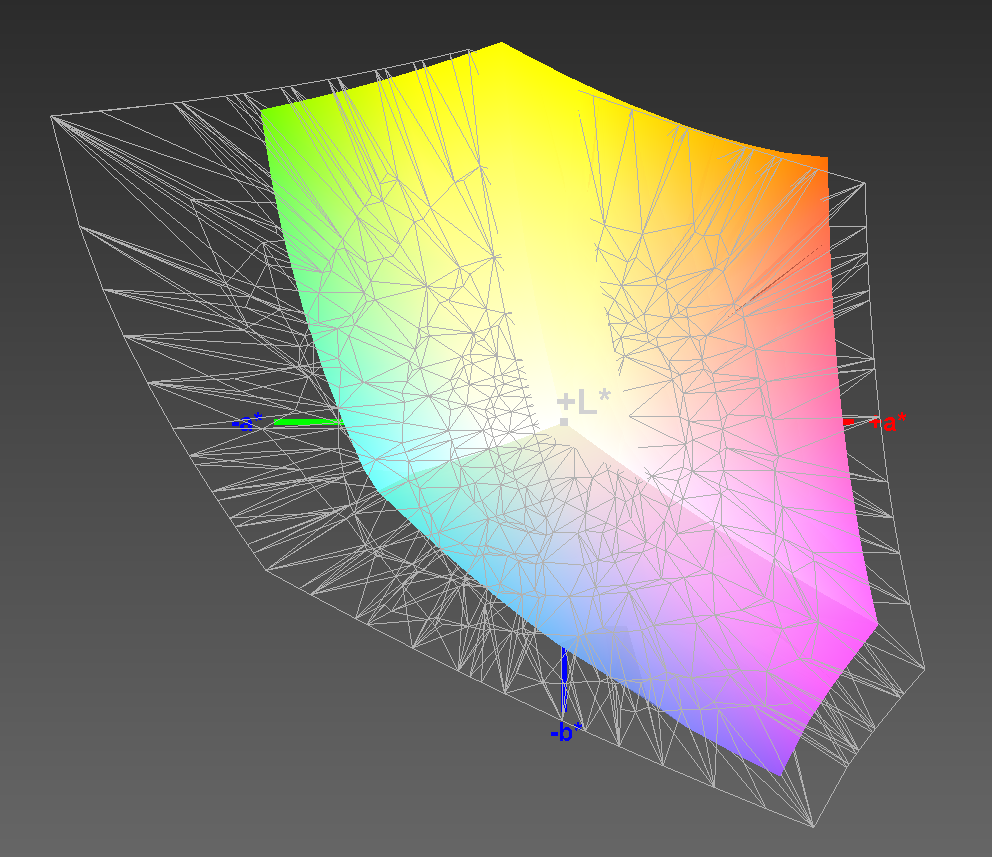
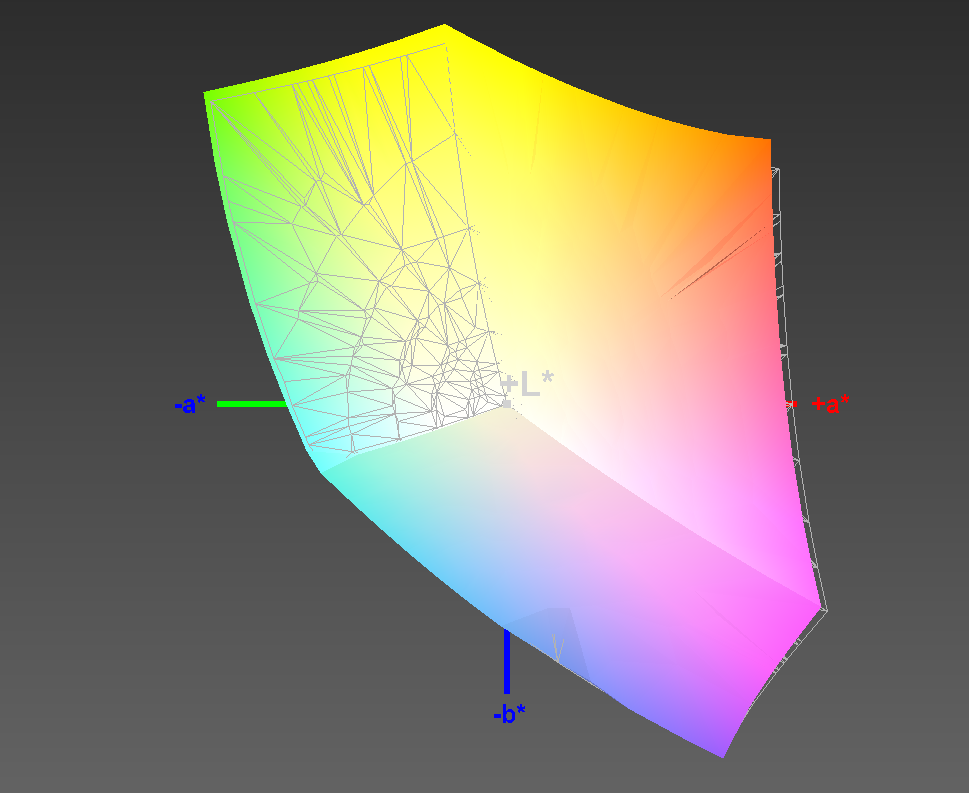
Dell advertises 100% coverage of the RGB color space. We can support that claim with 98% sRGB in our measurements, we don't want to be picky here. AdobeRGB on the other hand is only covered by 64%, so video and graphics enthusiasts should wait for our review of the 4K version.
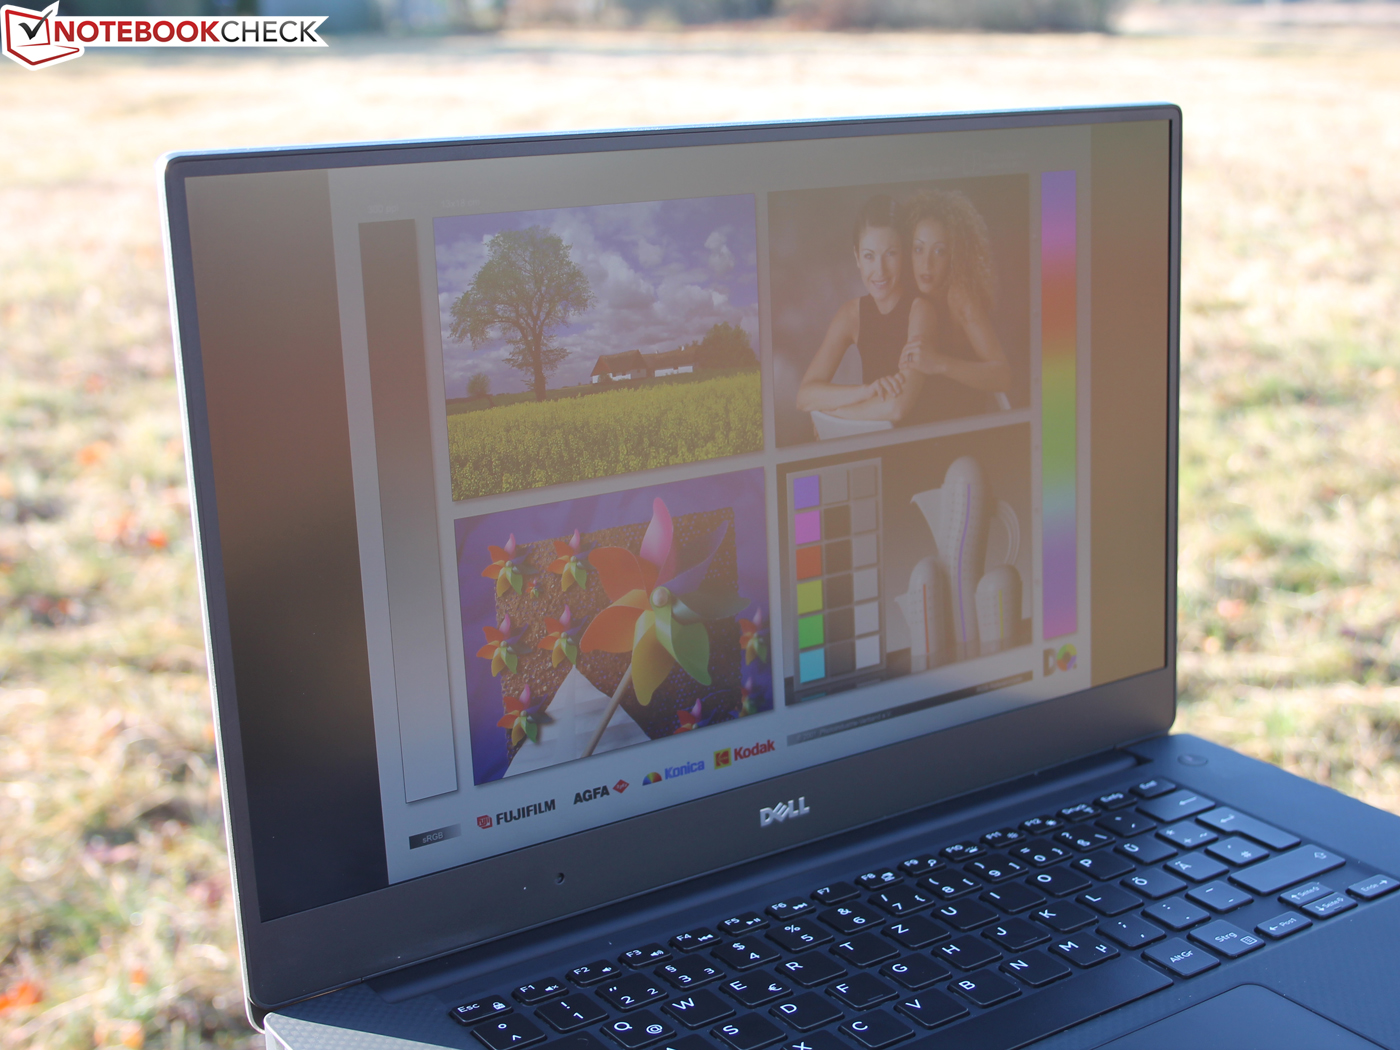
The panel of our review unit suffers from a slight yellow hue when we look at it from the side. One of our testers mentioned that as well for his review unit, even though he noticed a red hue. However, this visual impression (see screenshot) does not have an impact on the color accuracy itself.
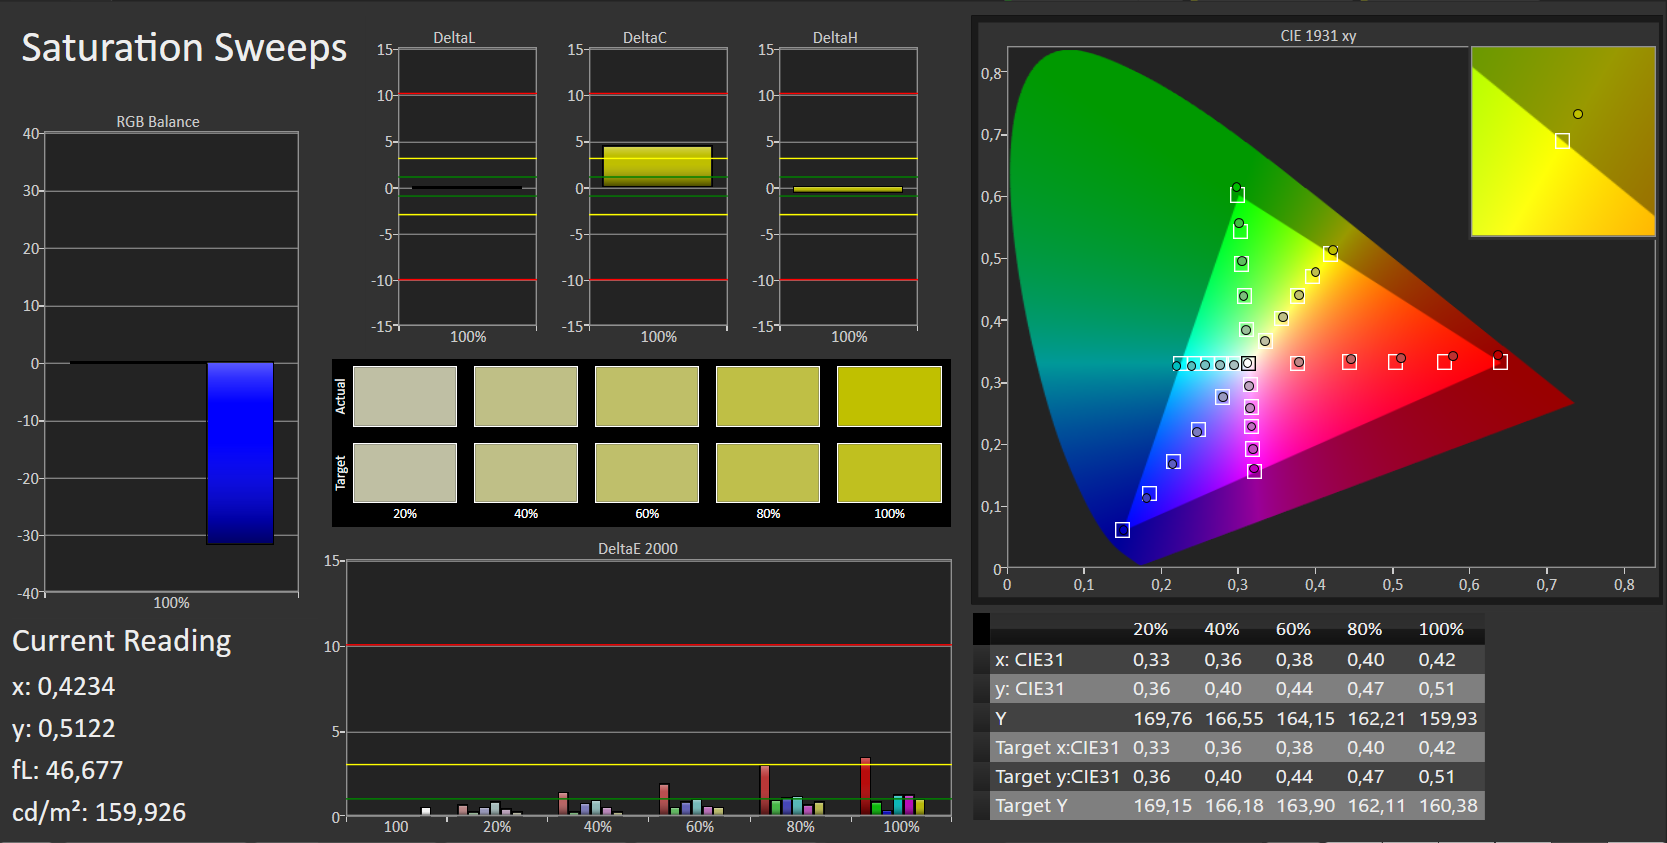
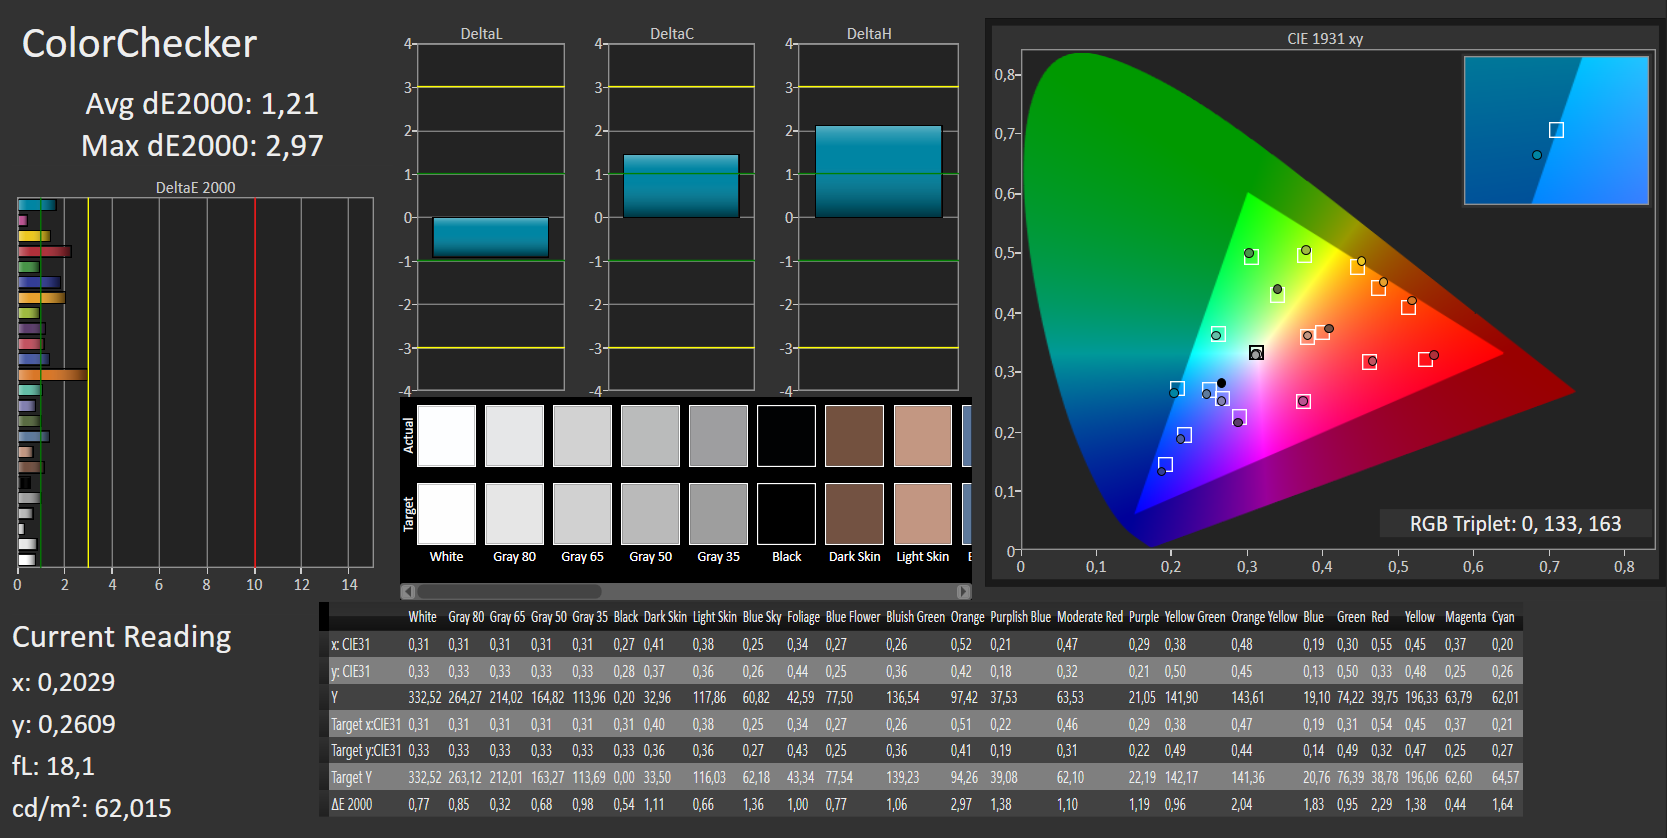
Our spectrophotometer reveals a small shift towards green/yellow in the CalMAN Saturation Sweeps. This could be solved by calibration, but the previously mentioned "visual yellow hue" is still visible from flat viewing angles. The ColorChecker DeltaE was 6 ex-works but dropped to an excellent 1.2 after calibration. The situation is even better for the Grayscale, where the high DeltaE of 8.4 ex-works (see cyan-hue in the color chart) drops to just 0.9 after calibration. Those are two excellent results, even though we would have expected them out of the box in the case of a flagship device like the XPS 15. Dell ships its XPS 15 FHD without a factory color profile, but our CalMAN screenshots show that calibration really pays off. Owners of the XPS 15 FHD can use the linked color profile to benefit from the improvements, even though it obviously cannot replace an individual calibration.
The luminance is fortunately stable, we can use 400 cd/m² (center) both on mains as well as battery power without having to fool or deactivate a sensor. The XPS 15 fortunately does not even have a brightness sensor, so an annoying control of the luminance (see XPS 13) is no problem. Office applications will have an advantage on the matte FHD display compared to the touch version. It is no problem to use the XPS 15 outdoors in daylight, but that does not include direct sunlight.
Display Response Times
| ↔ Response Time Black to White | ||
|---|---|---|
| 40 ms ... rise ↗ and fall ↘ combined | ↗ 13 ms rise |  |
| ↘ 27 ms fall | ||
| The screen shows slow response rates in our tests and will be unsatisfactory for gamers. In comparison, all tested devices range from 0.1 (minimum) to 240 (maximum) ms. » 97 % of all devices are better. This means that the measured response time is worse than the average of all tested devices (19.8 ms). | ||
| ↔ Response Time 50% Grey to 80% Grey | ||
| 62 ms ... rise ↗ and fall ↘ combined | ↗ 25 ms rise | 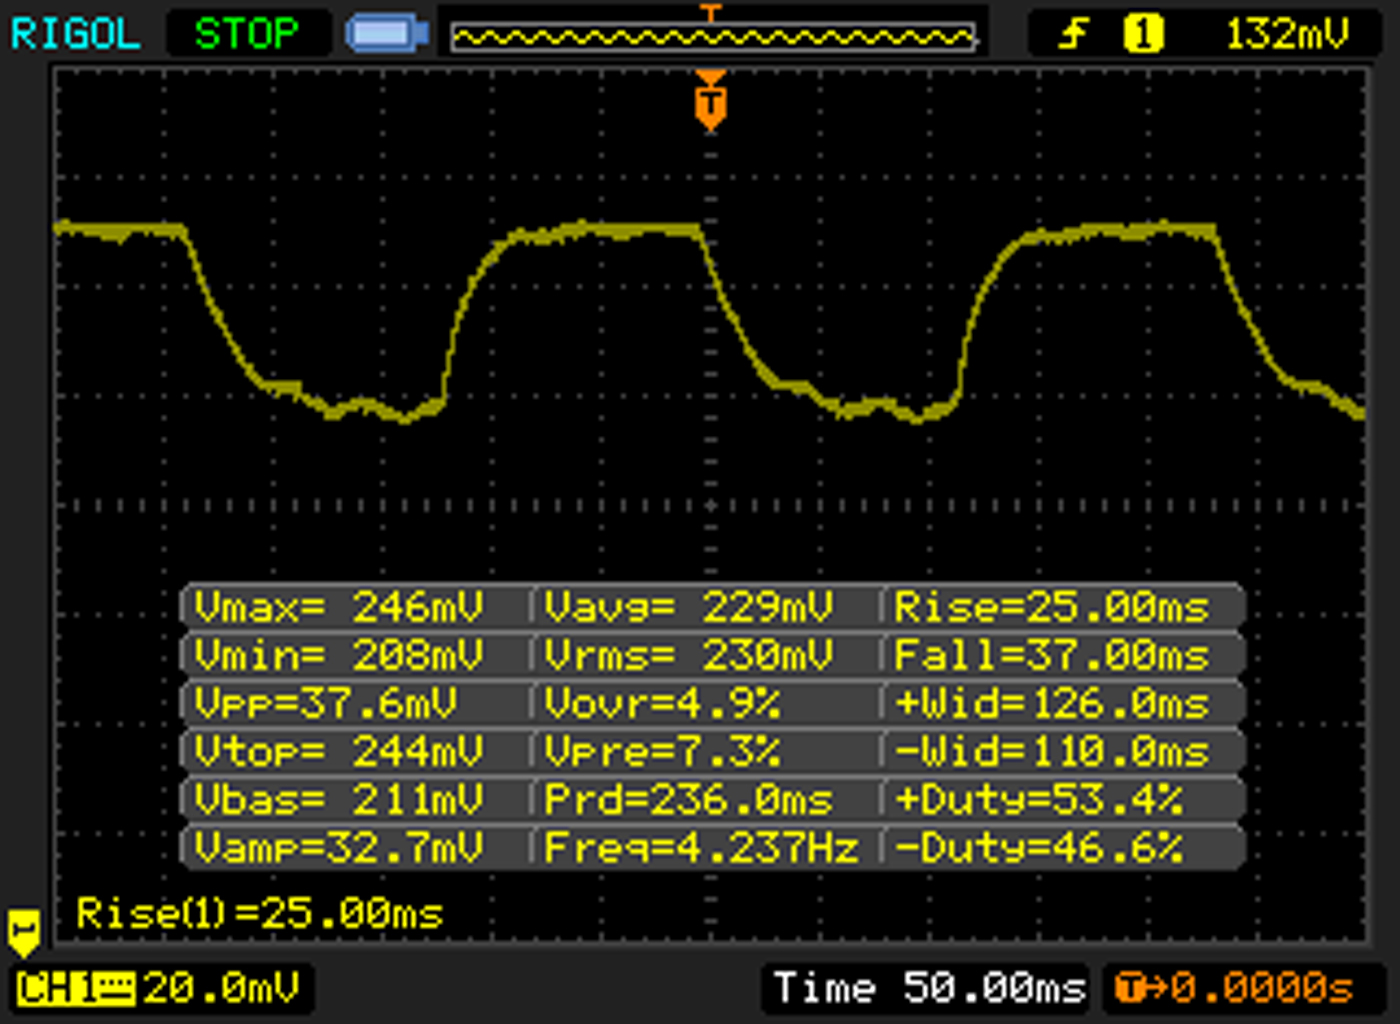 |
| ↘ 37 ms fall | ||
| The screen shows slow response rates in our tests and will be unsatisfactory for gamers. In comparison, all tested devices range from 0.165 (minimum) to 636 (maximum) ms. » 97 % of all devices are better. This means that the measured response time is worse than the average of all tested devices (31 ms). | ||
Screen Flickering / PWM (Pulse-Width Modulation)
| Screen flickering / PWM detected | 362 Hz | ≤ 10 % brightness setting | 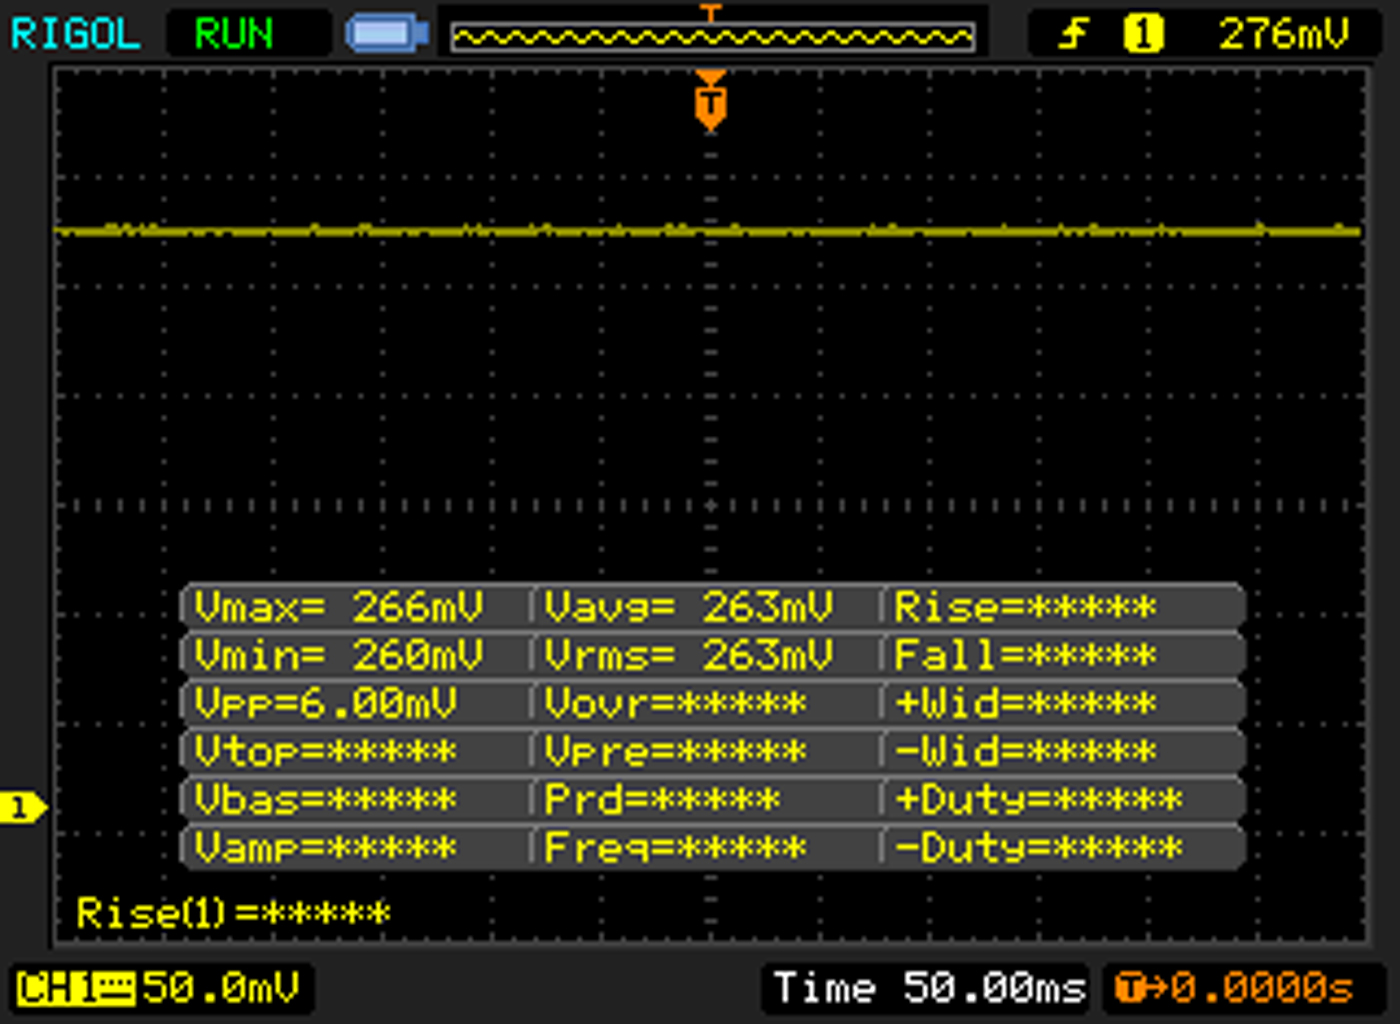 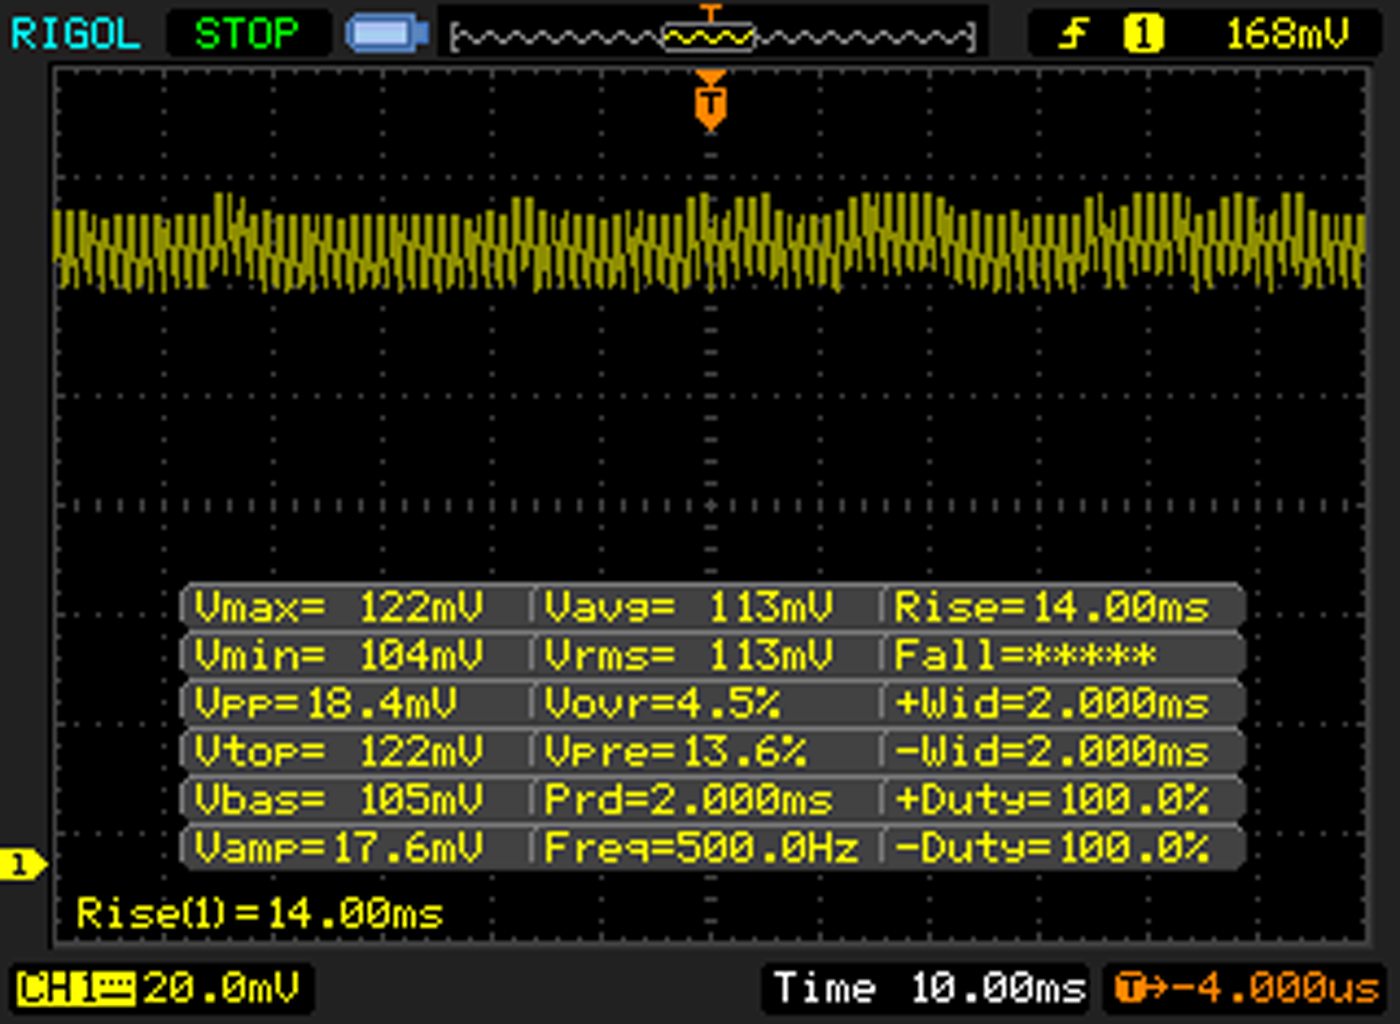 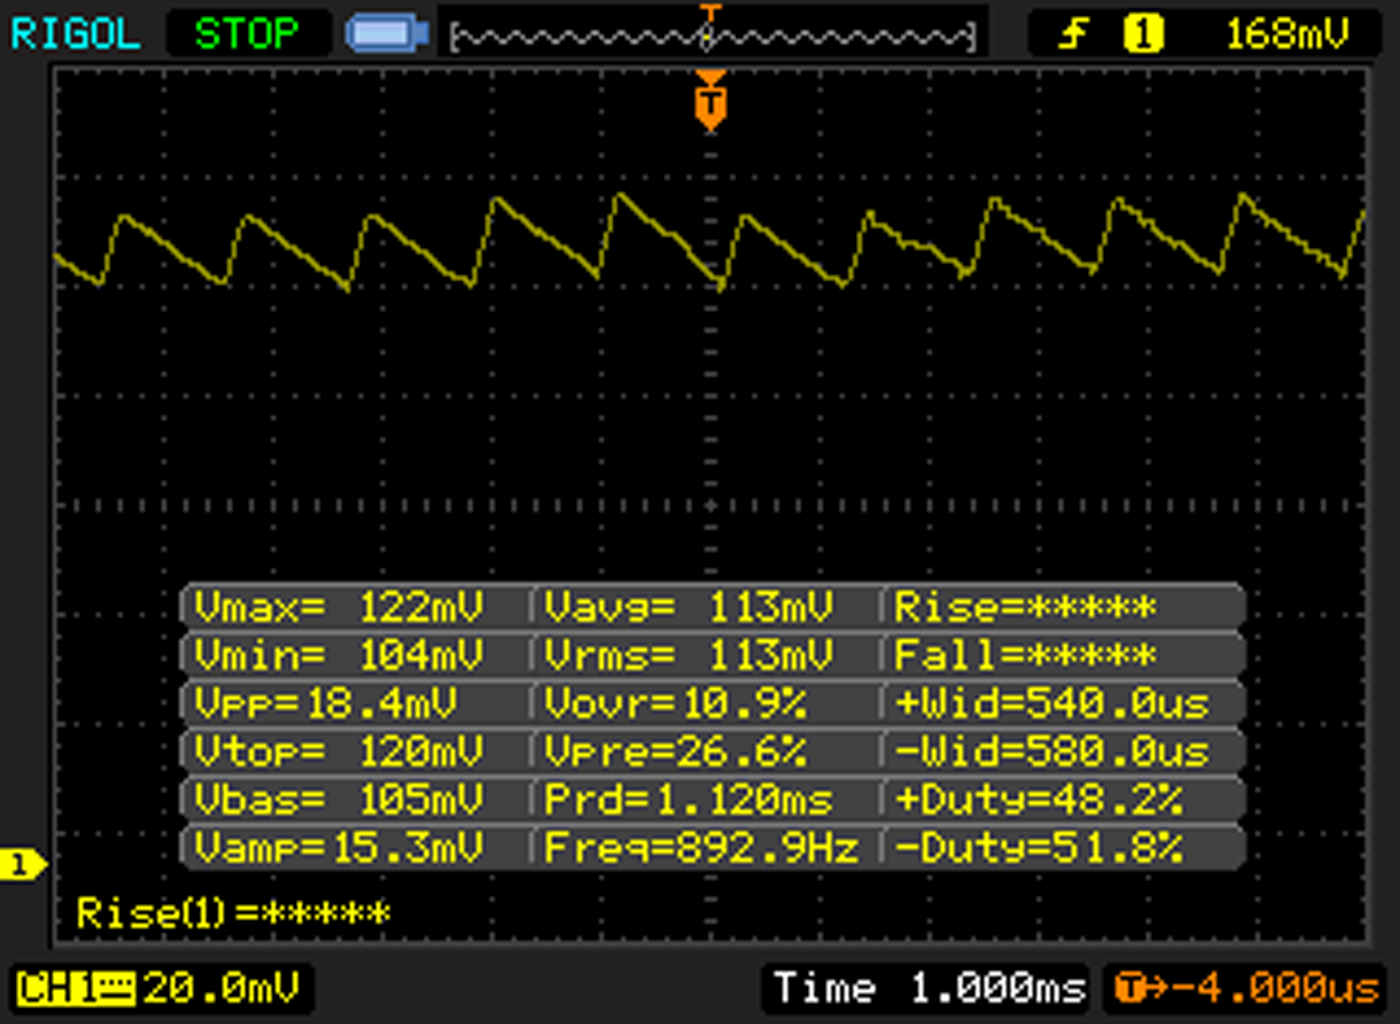 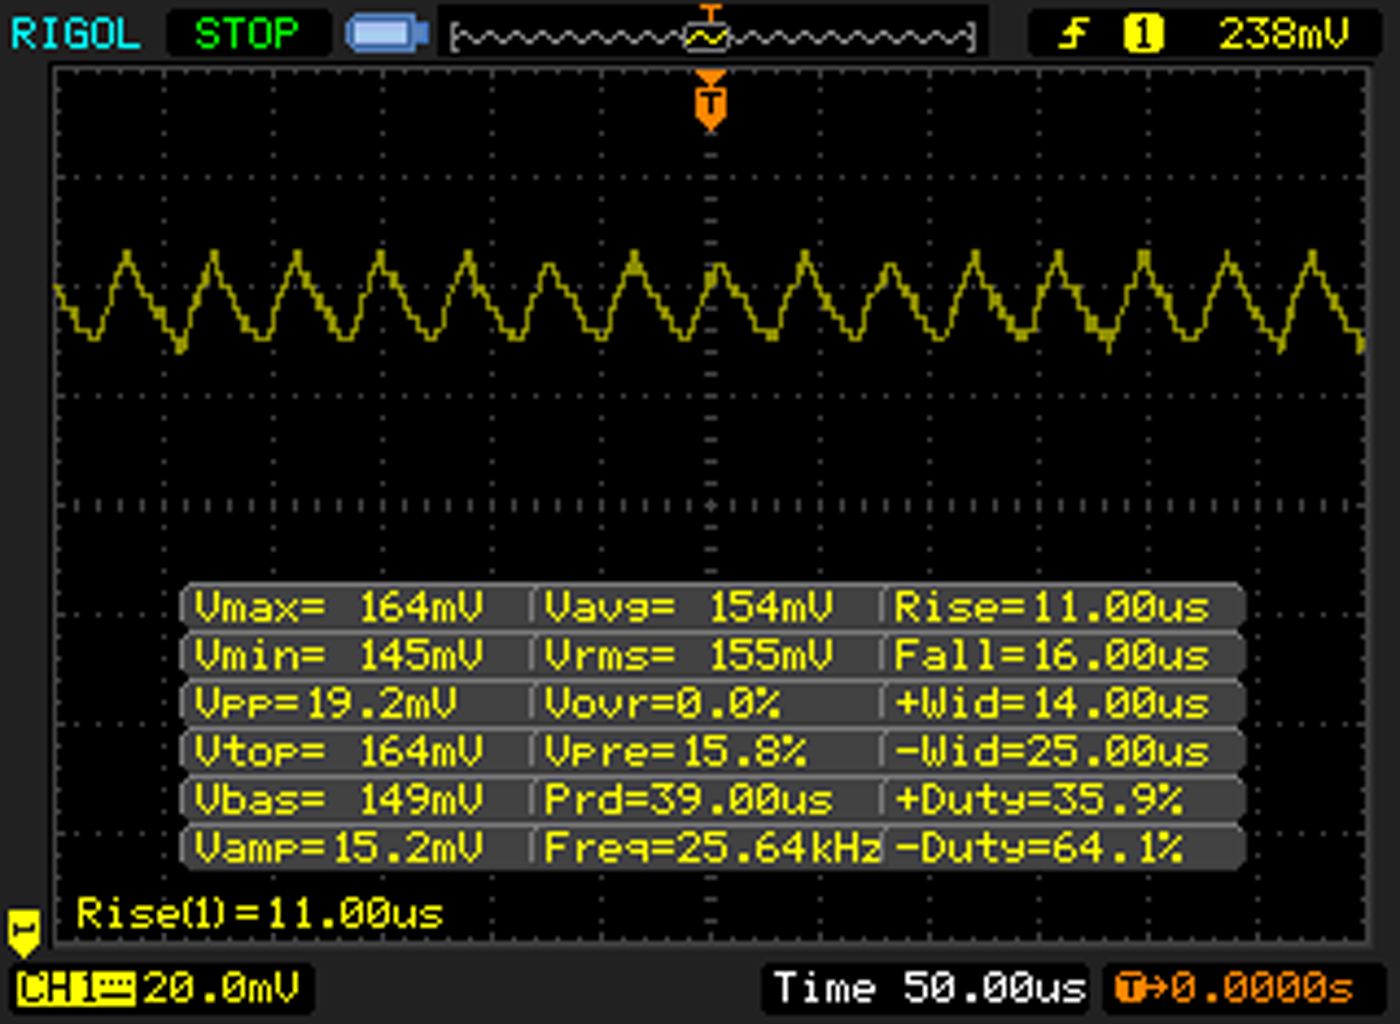 |
The display backlight flickers at 362 Hz (worst case, e.g., utilizing PWM) Flickering detected at a brightness setting of 10 % and below. There should be no flickering or PWM above this brightness setting. The frequency of 362 Hz is relatively high, so most users sensitive to PWM should not notice any flickering. However, there are reports that some users are still sensitive to PWM at 500 Hz and above, so be aware. In comparison: 52 % of all tested devices do not use PWM to dim the display. If PWM was detected, an average of 7750 (minimum: 5 - maximum: 343500) Hz was measured. | |||
The panel does not win any prizes in respect of the response times. The Gray50-to-Gray80 value in particular is conspicuously high at 62 milliseconds.
PWM is usually not a problem for IPS panels, or is it? We noticed a luminance flickering (mains and battery) when we used the XPS 15 for the first time at the lowest brightness level (10%). The XPS does not have an ambient light sensor, so we can rule out a "turbulent" sensor behavior. The oscilloscope determined PWM flickering in the range between 225 up to 1,000 Hz at a brightness level of 10% and below (penultimate level). The oscilloscope screenshots show that in detail (microsecond range).
This clearly reminds us of Dell's Content Adaptive Backlight Control (CABC), which is used for the sibling XPS 13 (9350). However, PWM was only used – and it increased gradually – when the black part of the picture was increased (enlarge a black picture). The frequency was also much higher at 4,800-5,000 Hz. Those two points do not apply for the XPS 15, so we don't assume CABC.
In the end, we want to soothe any concerns: Hardly any user will permanently work at the lowest brightness level (1/10); they would use at least step 6 at 125 cd/m². There is no PWM flickering in this case, neither visible nor measurable.
Some users reported that the virtualization software Hyper-V is supposed to cause the screen flickering. Hyper-V got some attention one month ago, because it caused screen flickering for the Microsoft Surface Pro 4 and Surface Book. Deleting Hyper-V solved the issue for those two devices, but is this also the case for our review unit? No, Hyper-V was not even active on our XPS 15, and the flickering was still there after the activation. It is also noticeable in the BIOS (exactly the same jagged line), so it cannot be a Windows problem.
The viewing angles reveal a clearly visible yellow cast. It is very strong when you look at a black picture from the side, but less of an issue with bright pictures. This yellow cast was subjectively not a big deal, we actually only noticed it the darkroom.

Performance
Processor
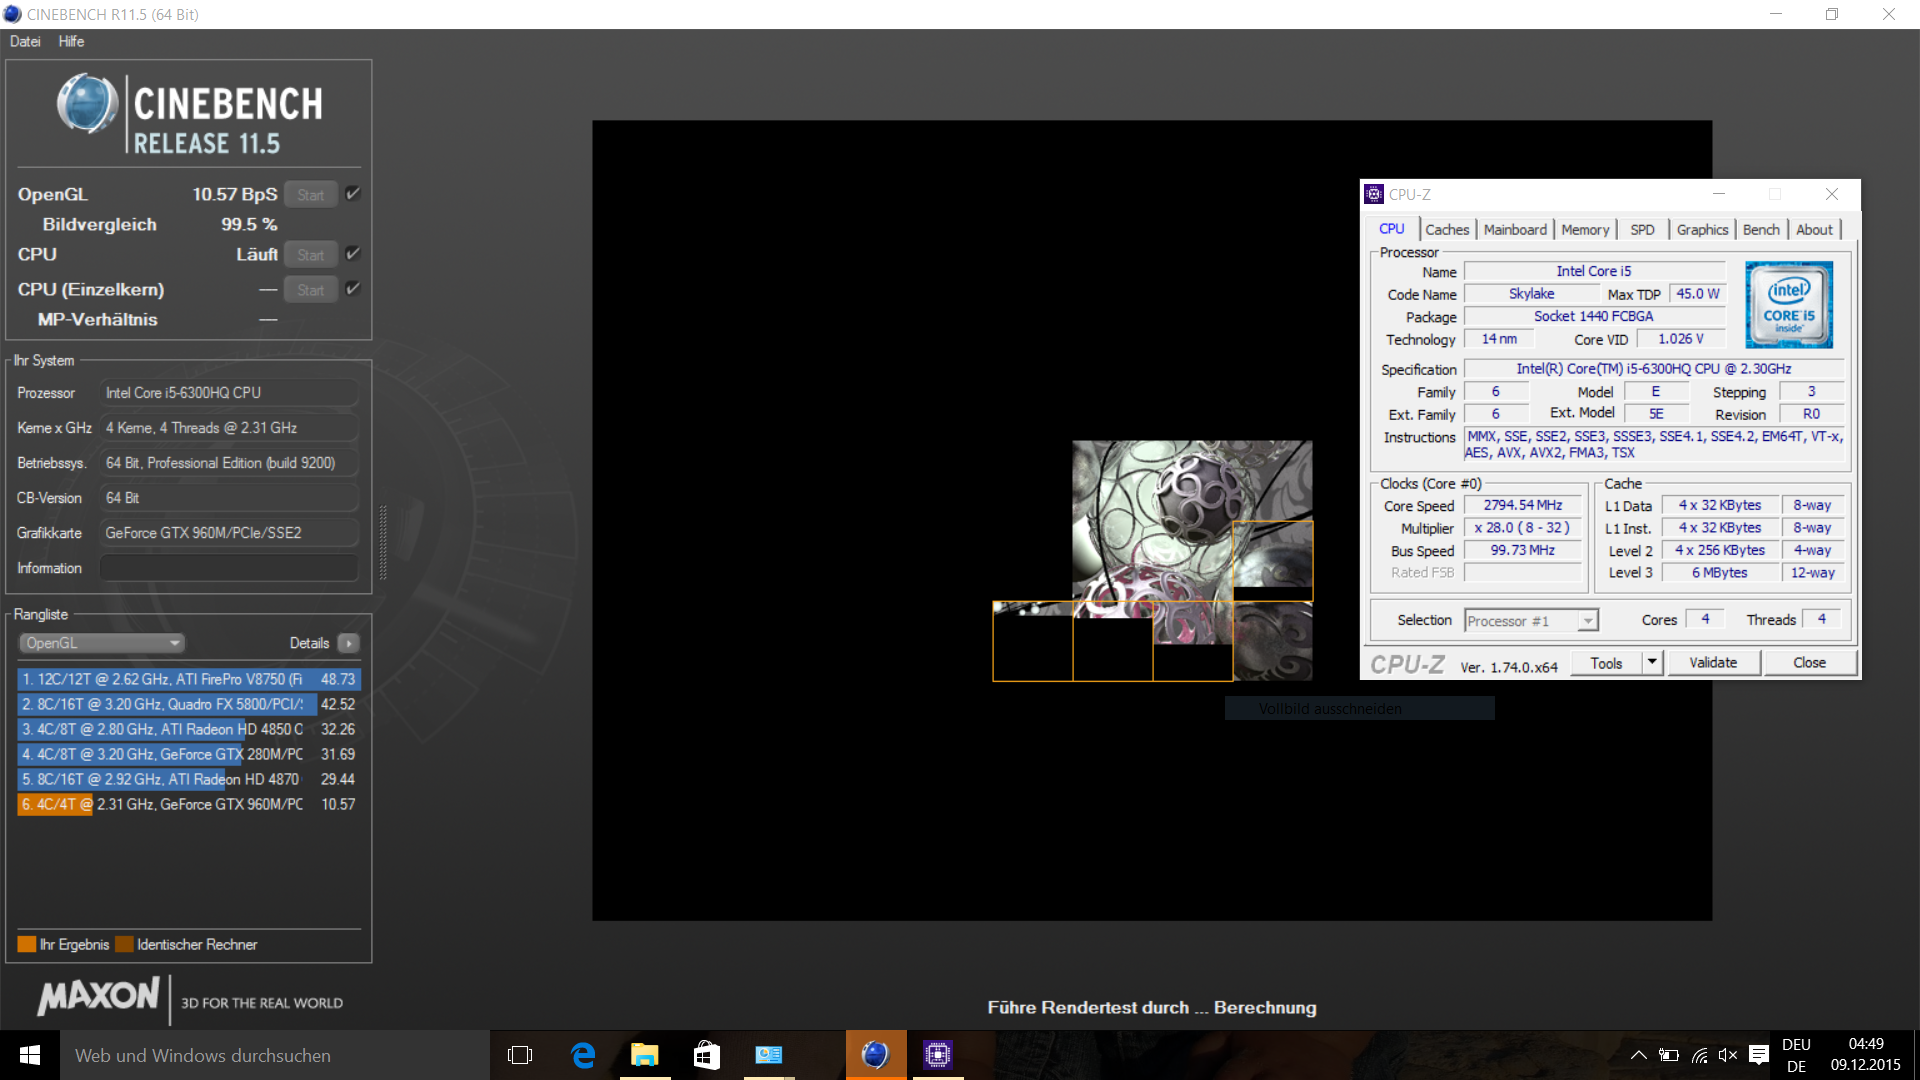
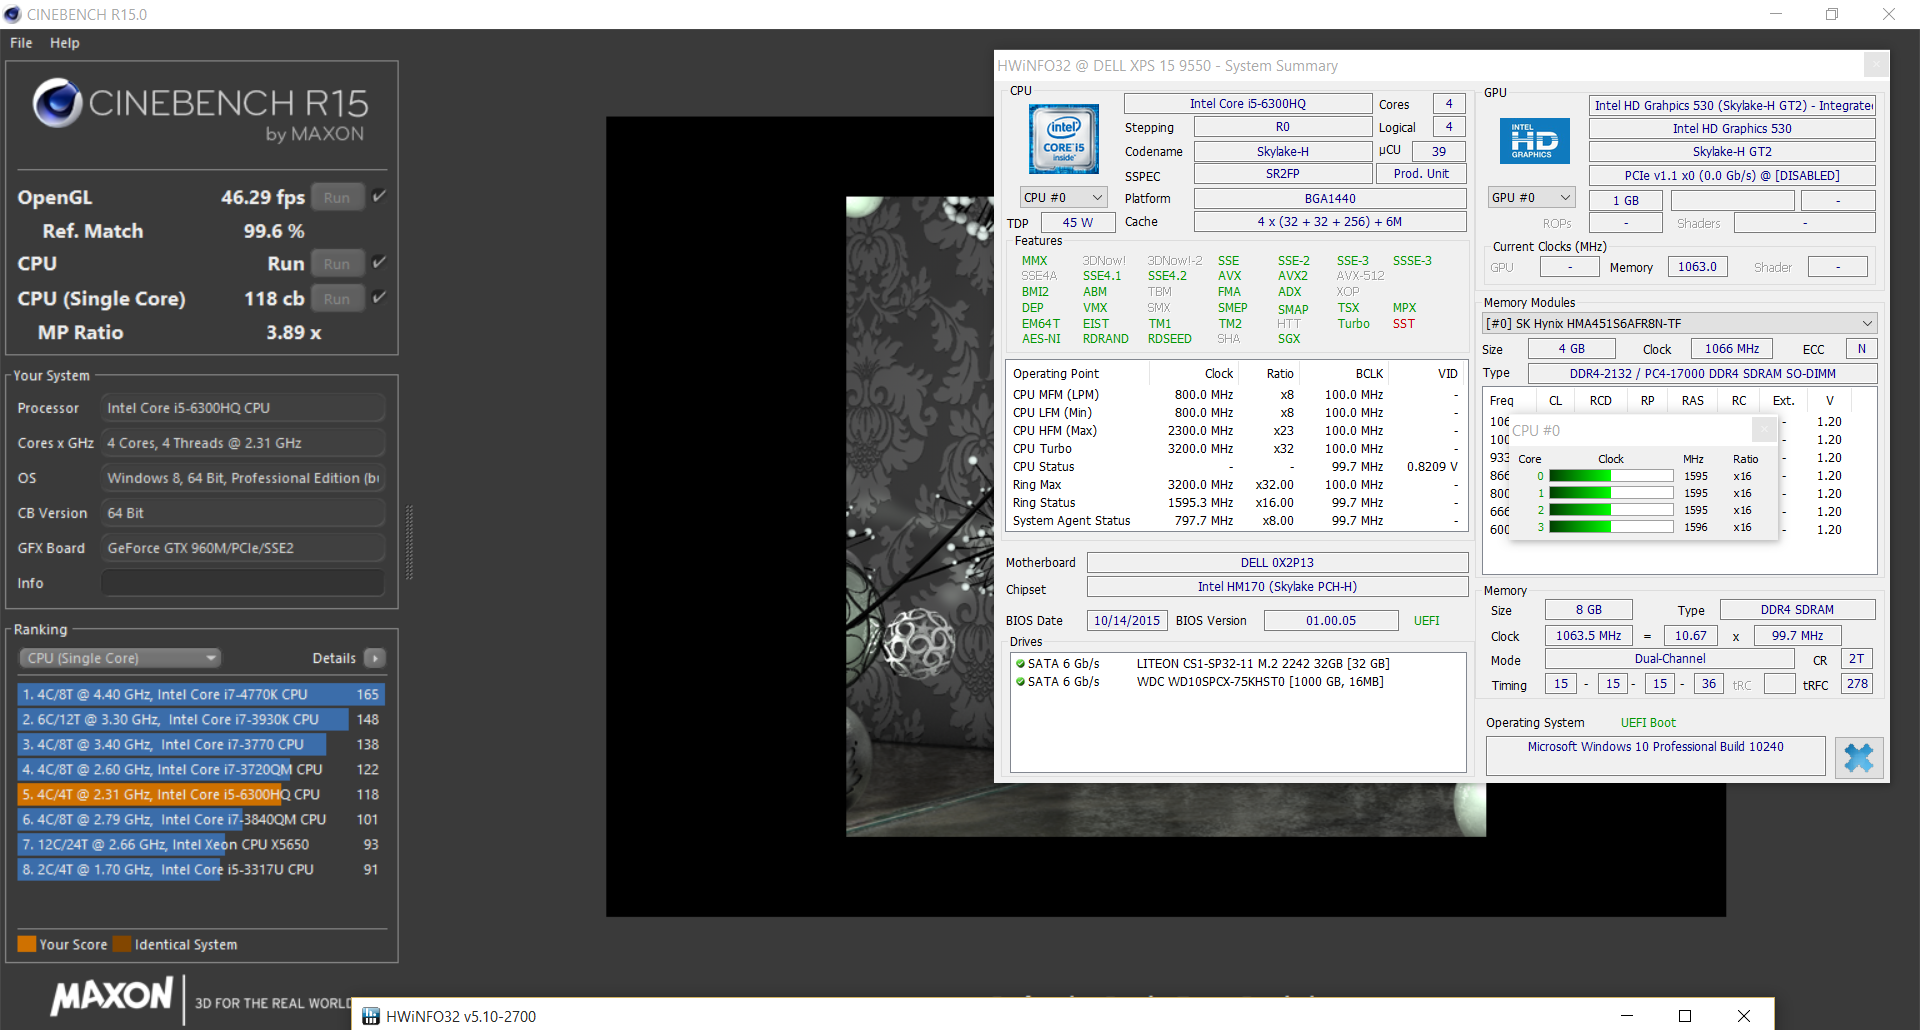
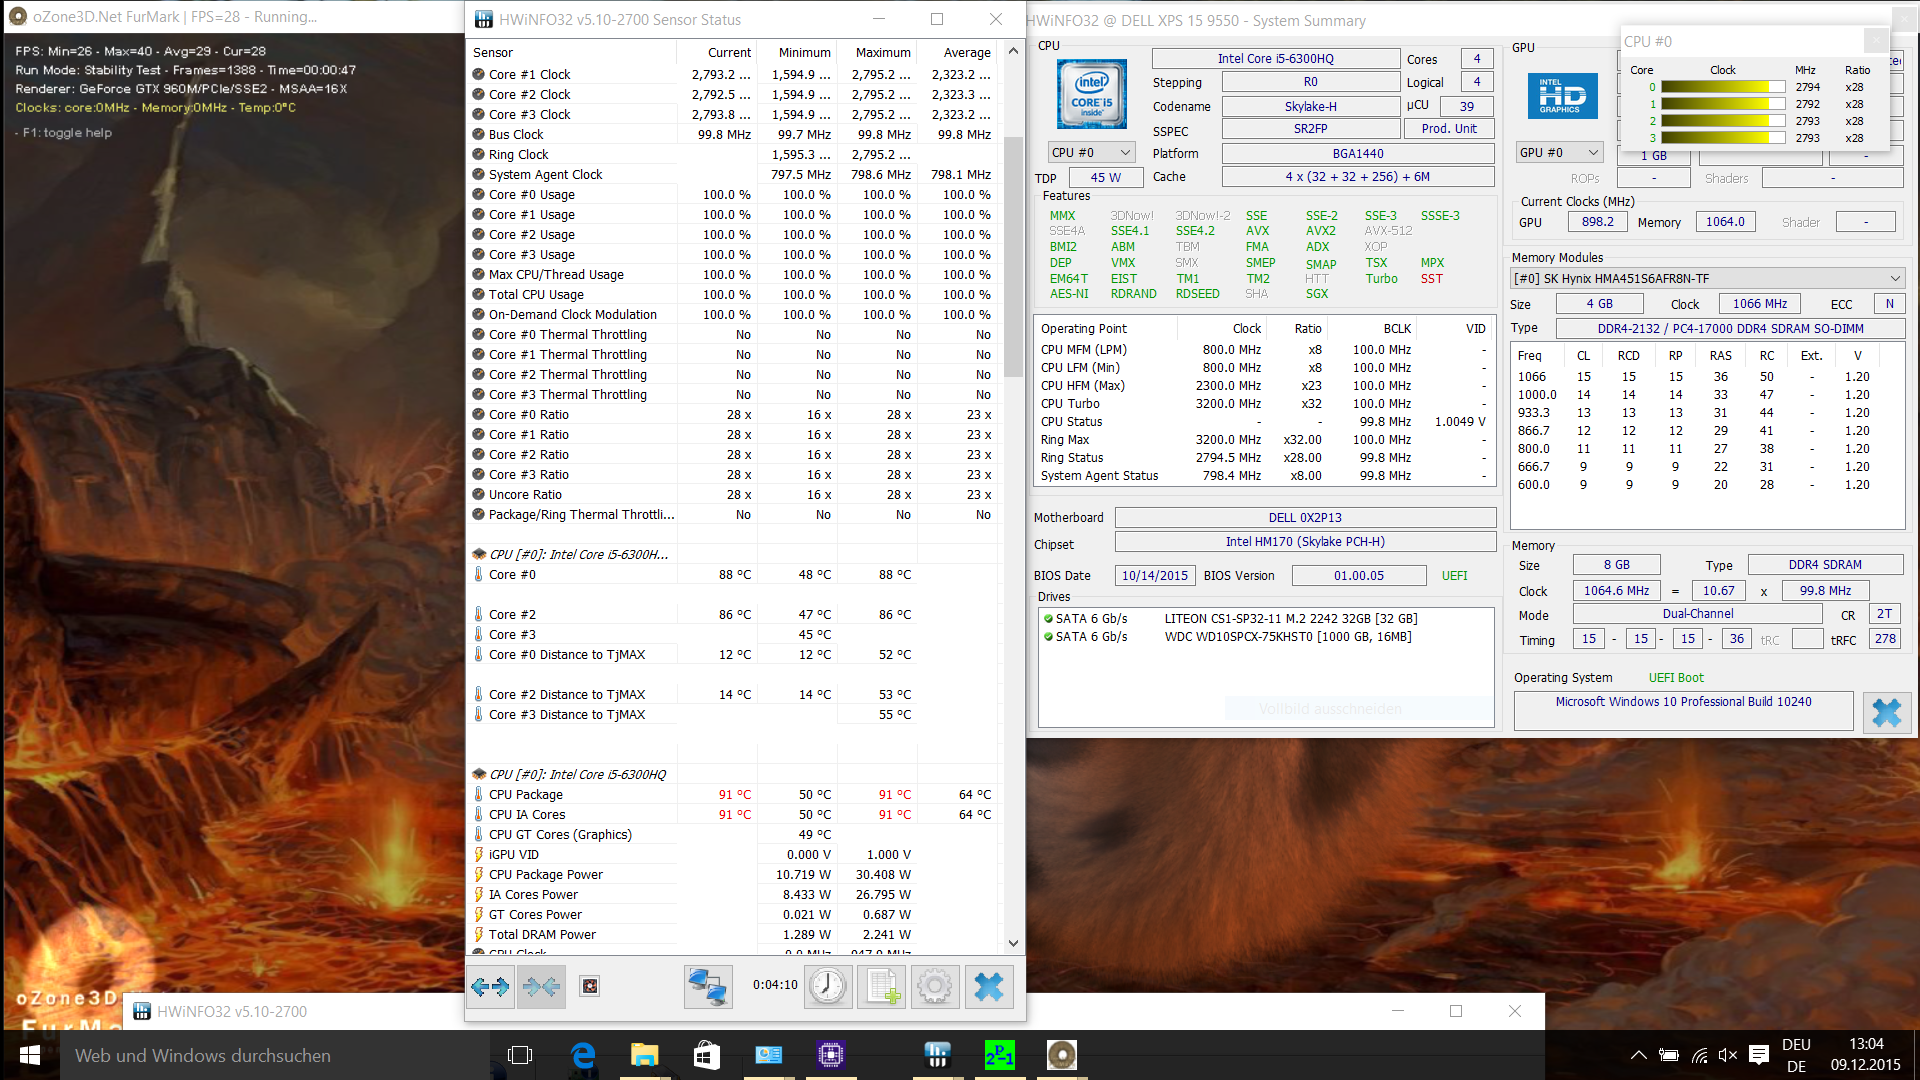
The performance is somewhat of a mixed bag. The processor runs at 2.8 GHz in the Multi-Test when the device is warmed-up, and the Single-Test is executed with 2.9 GHz. 3.0 GHz is very rare and can only be maintained for seconds, for example, when the XPS 15 is still cool. The system can therefore not utilize the full performance potential of the i5-6300HQ CPU (Turbo: 3.2 GHz).
Running on battery power will result in a throttling to just 1.6 GHz. This basically halves the possible scores; Cinebench R15 drops to 246/68 points. The system, unfortunately, does not recognize the mains power when you plug the PSU in; when the 1.6 GHz is set, it is not going to change, and it obviously reduces the performance. An application that is already running will therefore not immediately run faster when you attach the PSU. We had to put the system in standby for a short while before the XPS 15 lifted the clock reduction. Otherwise, the clock would stay at 1.6 GHz for multiple CPU benchmarks, so we had to repeat them. This limitation is independent of the power profile; we also used the "High Performance" setting on battery power. We hope that this issue will be fixed in an upcoming update.
The bar chart includes the XPS 15 from 2014 with its quad-core i7-4712HQ. Our i5-6300HQ can almost keep up with this chip, but only in the single-core benchmarks. Extensive multithread load like heavily parallelized software will not bring the system to its limits, but the Haswell rivals like the Apple MacBook Pro Retina 15 perform much better. The Aspire V Nitro VN7-792G shows: The 6300HQ is a bit faster in a thicker chassis with a more powerful cooling solution. +15% (Single R15) is the biggest difference; the other results are more or less on par. The small construction also seems to affect the performance on mains power.
The Asus Zenbook Pro UX501JW – actually an important rival because of its high-quality and thin construction – can manage an advantage of 11 (Single) and 30% (Multi). The XPS 13 with the only 15-Watt SoC in this comparison falls behind by 34% (Multi) but is almost on par in the Single-Test.
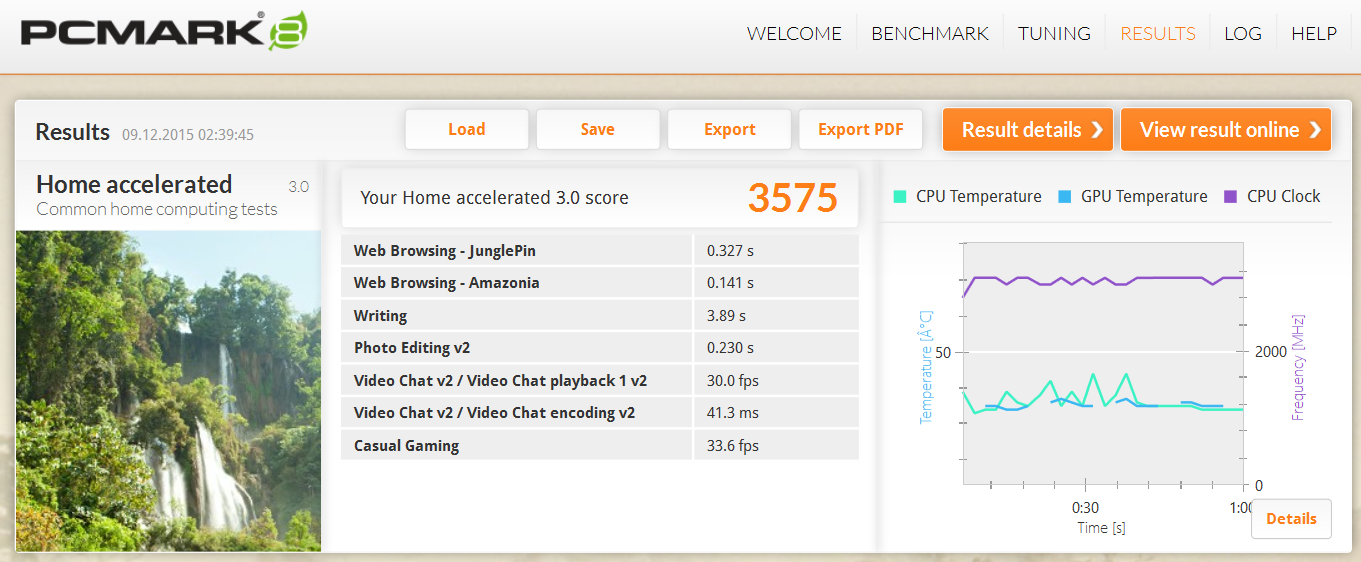
System Performance
Our review unit keeps up pretty well in this comparison, despite the hybrid storage solution. Particularly impressive is PCMark 7 since it favors systems with SSDs. Even the old XPS 15 with the Lite-ON LMT is almost in range. Dell's latest XPS 15 is amongst the fastest devices in all sub scores of PCMark 7, but the powerful Haswell chips like the 4870HQ or 4720HQ are once again faster.
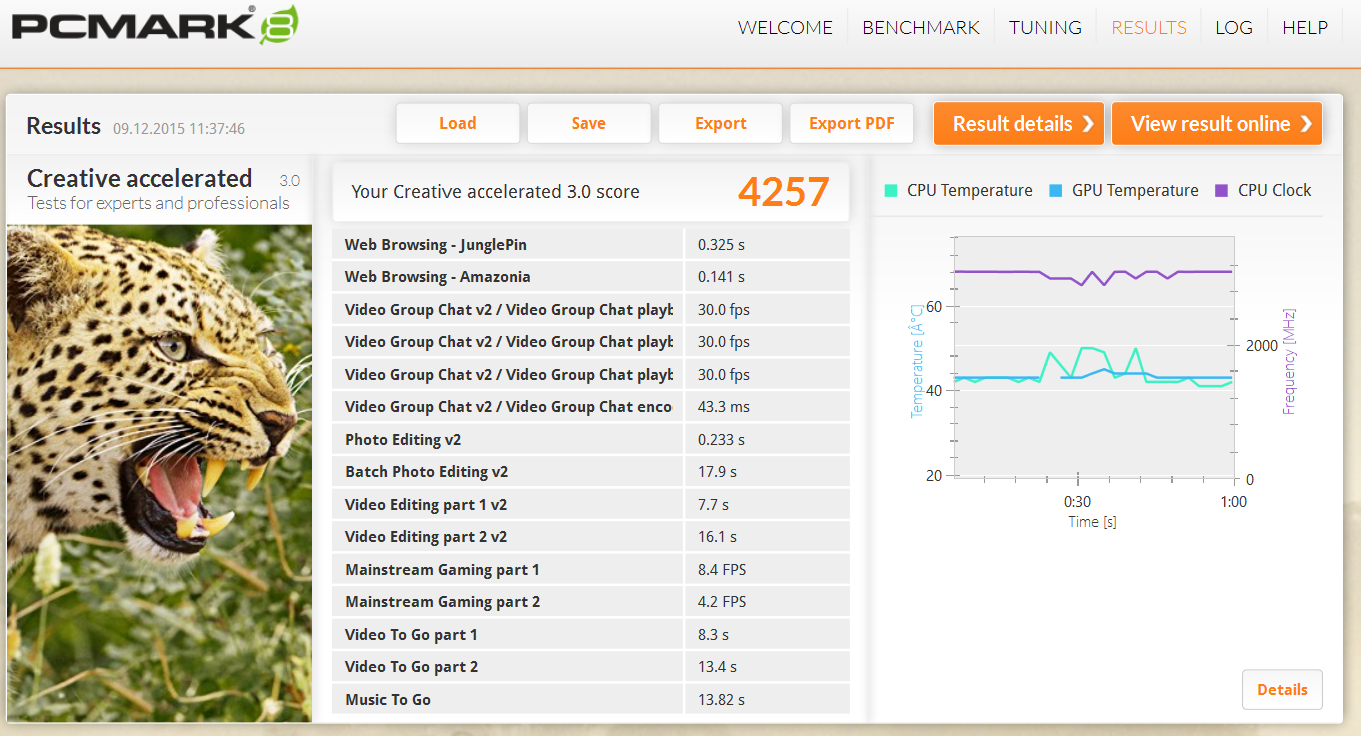
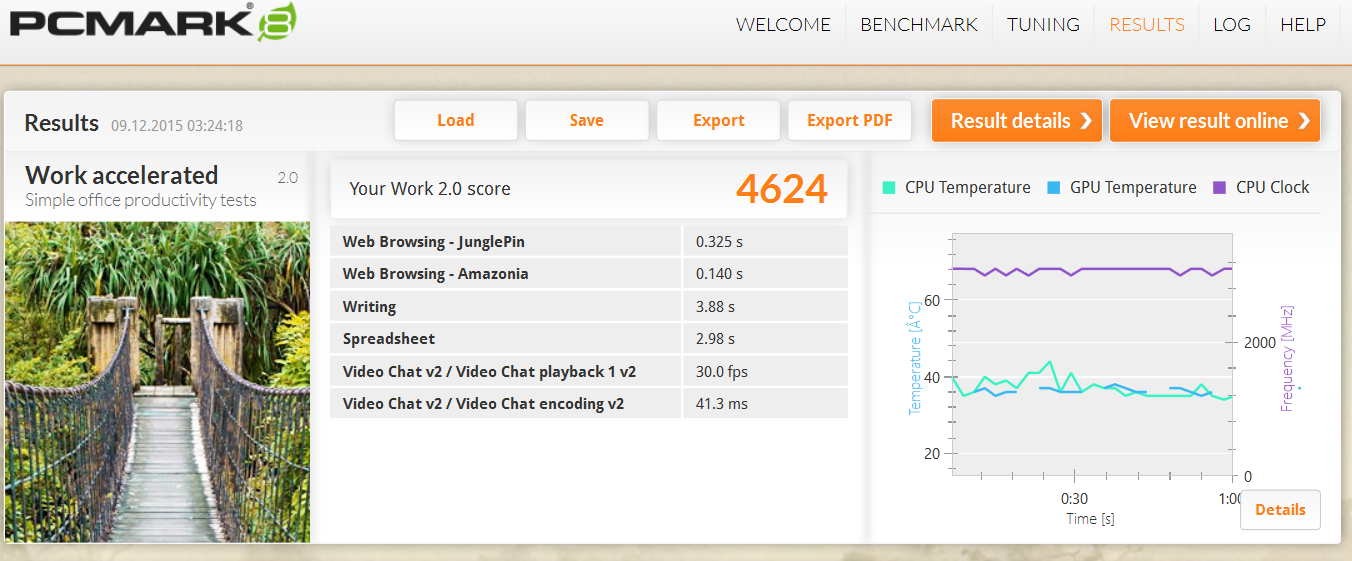
The situation is similar in PCMark 8, but the review unit is actually even a bit better. Both the Home and Work scores put the XPS 15 in the ballpark of the Apple MacBook Pro Retina 15 (4870HQ) and Aspire V Nitro Black Edition VN7-792G (6700HQ). The smaller sibling XPS 13 follows with a distance of around 20%. It is possible that the PCMarks benefit from the hybrid hard drive, more information is available in the next section.
| PCMark 7 Score | 5128 points | |
| PCMark 8 Home Score Accelerated v2 | 3575 points | |
| PCMark 8 Creative Score Accelerated v2 | 4257 points | |
Help | ||
Storage Devices
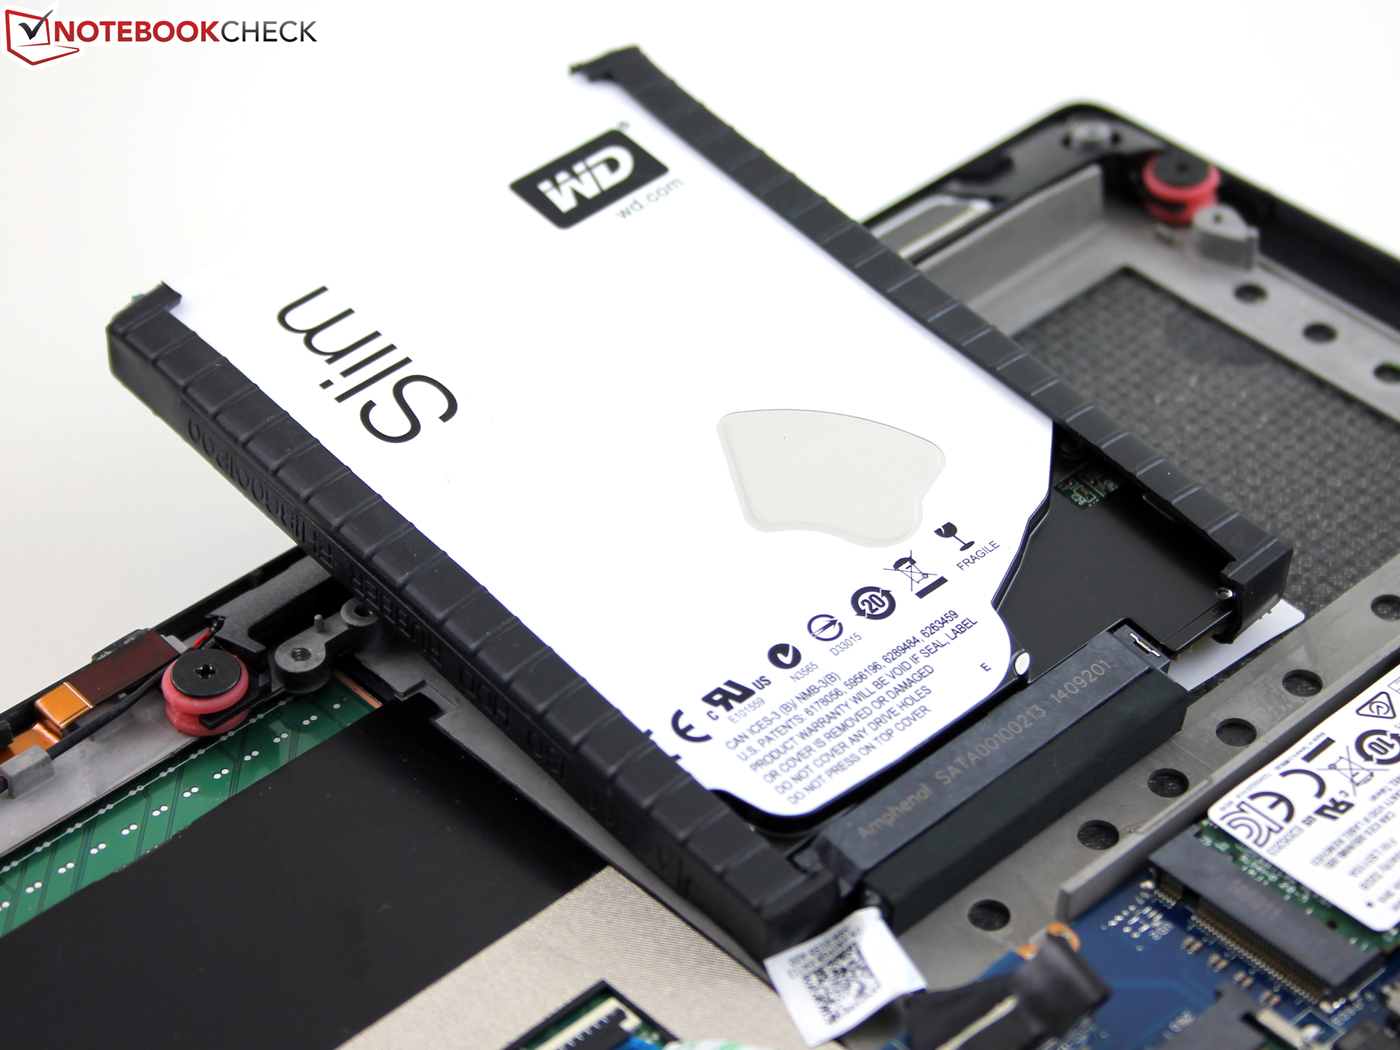
The WD Blue (WD10SPCX) is Western Digital's slim edition with a height of just 7 millimeters. It is a SATA 6 GB/s hard drive that runs at a rather slow 5400 rpm. We know that Dell also uses other hard drives from the Golem-review, where the device was equipped with the Toshiba MQ02ABF100 (Ultra Thin 7.5 mm). This is already the largest capacity you can currently get; more than 1 TB is currently not possible for a 7-mm drive. By the way, the WD model retails for almost 100 Euros (~$108) in Germany.
The WD Blue is not alone though, it is accompanied by a 32 GB SATA-SSD in the M.2 slot, which is used as a cache. The Lite-On chip uses two flash packages from Hynix, 256 MB DDR3-1333 (DRAM cache) and a Silicon Motions SM2246EN controller. The BIOS lists a RAID array, more precisely a RAID 0: Striping – acceleration without redundancy. The user can use one single drive and does not "see" the 32 GB drive in Windows. There is actually no BIOS option to deactivate the cache partner, so we would call it a hybrid system.
Slow hard drive?
Not at all, at least CrystalDiskMark and AS SDD determine high sequential and 4K / QD 32 read transfer rates. 238 MB/s (seq. read) is not managed by any other conventional hard drive in our database. Read 4K / QD32 can even compete with real SSDs. The hybrid drive manages 31 MB/s, while the HDD in the ProBook 470 only reaches 0.29 MB/s. We did, however, notice heavy fluctuations when we repeated the tests. Read 4K: 31 – 27 – 1.9 – 26 – 1.5 – 1.3 – 26 etc. We get the impression that data is proportionally written on the SSD and HDD, so some read accesses are fast and some are slow. The results in the HDD benchmarks are therefore erratic (read results).
All writing tests show the typical HDD picture. The advantage of this array is limited to the reading performance. So what happens if you only open new files? Can you benefit from this array or will you just be annoyed by the slow hard drive?
This cannot really be the case, because AS SDD and CrystalDiskMark don't give the algorithm a lot of time to learn. However, the HDD benchmarks as well as the PCMarks show reading speeds and storage scores, respectively, that can compete with the SSD-based rivals. Dell's hybrid solution manages to overcome the slowness of conventional hard drives by providing a high reading performance for applications. You also get a lot of storage, so the solution is a good compromise between performance and storage capacity.
Deactivate the SSD cache?
Can the 32 GB drive be used separately when we deactivate the array? We switched the SATA configuration to AHCI in the BIOS, but the operating system could not be booted any more. So it's not that easy. We would have liked to run benchmarks for the Lite-ON CS1-SP32-11 separately. One question that comes to mind is the reliability; would a failure of the Lite-On chip disable the whole WD drive? Users should definitely create backups, but this is also the case if the system just used one hard drive.
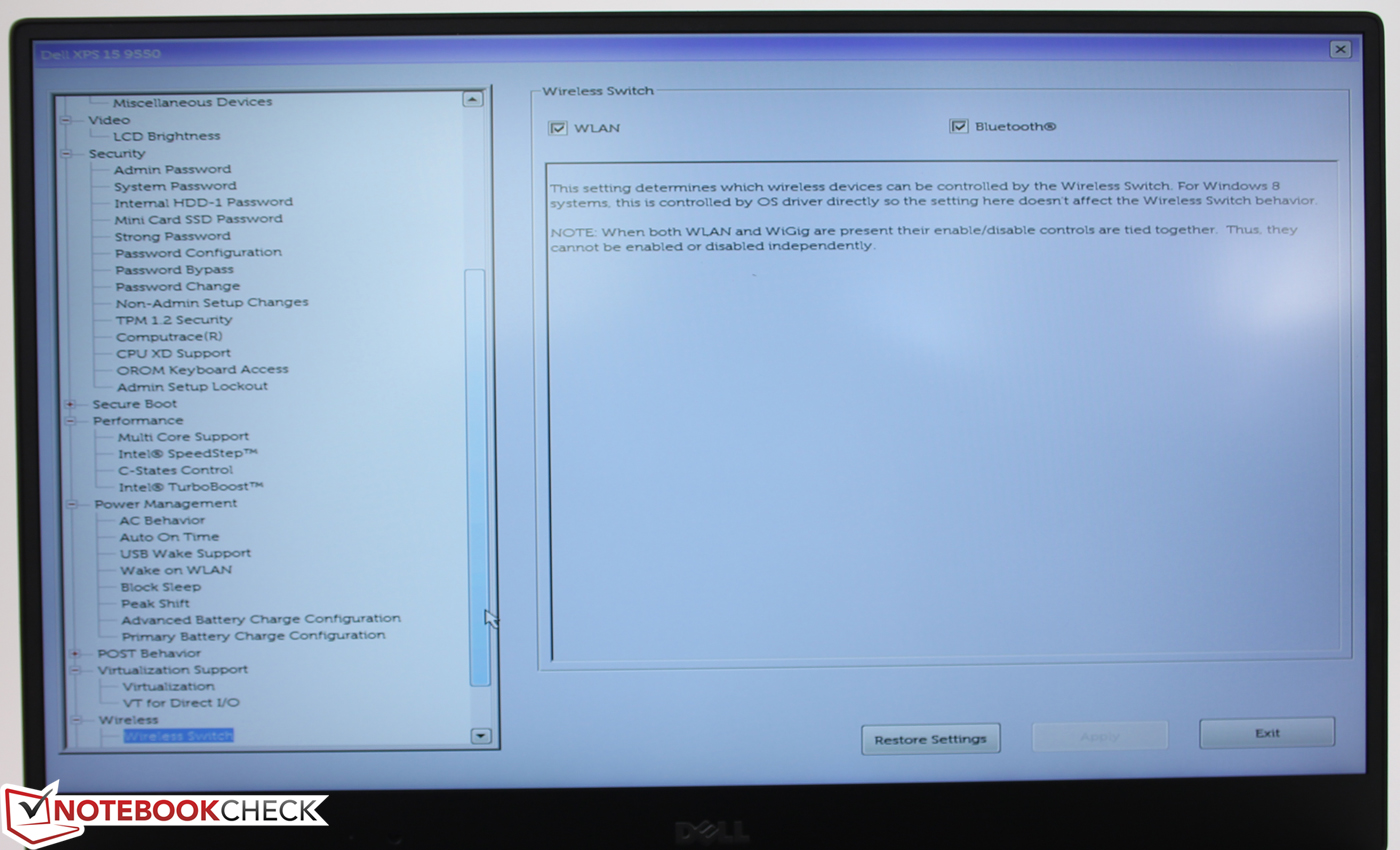
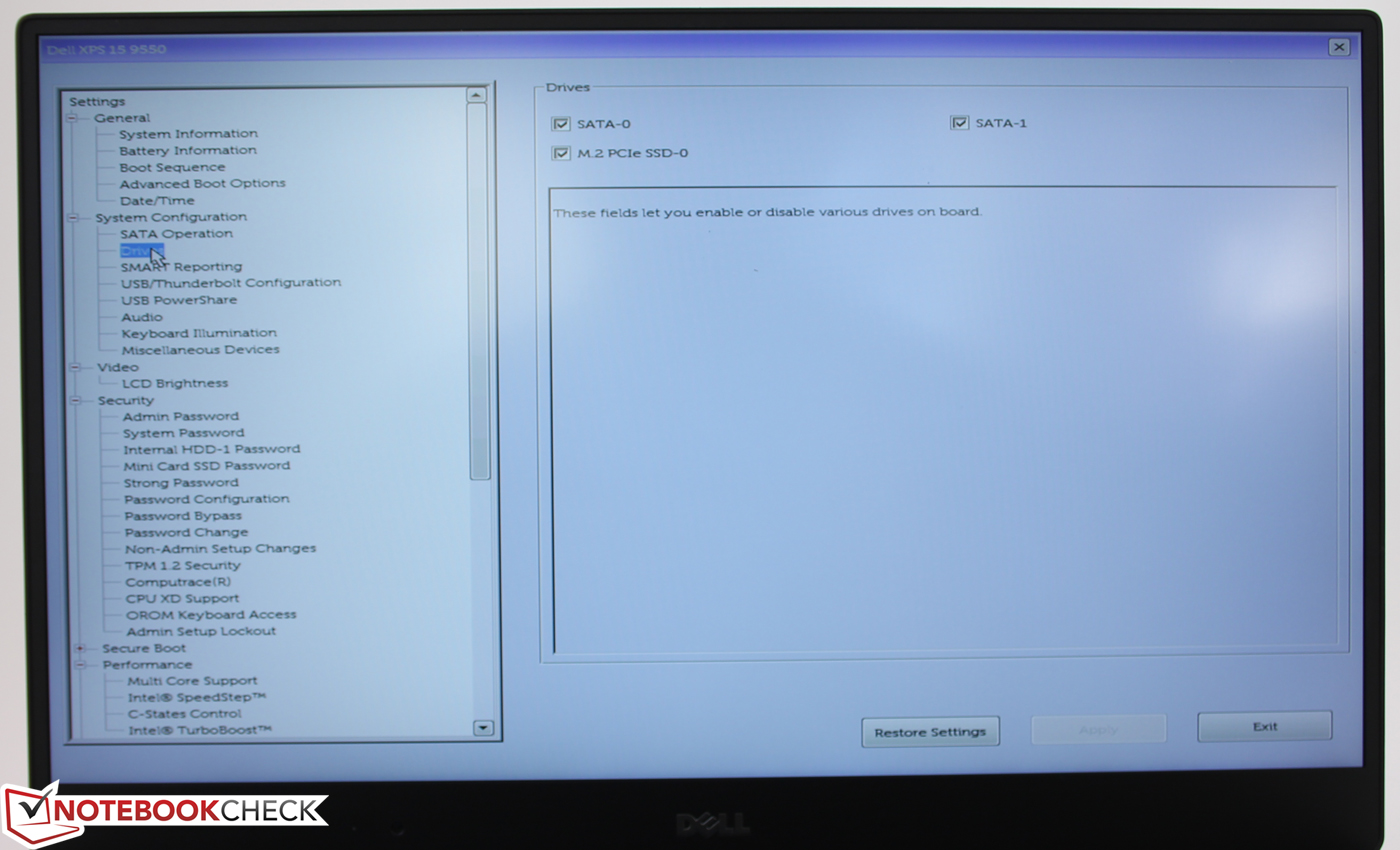
The two SATA controllers (SATA-0, SATA-1) and the SSD (M.2 PCIe SSD-0) can be activated individually in the BIOS – Dell also offers single-SSD configurations – so it is obviously also possible to deactivate the RAID array when you make a clean install of the OS. Windows could, for example, run on a bigger M.2 SSD, while the HDD is used for data.
| Dell XPS 15 2016 9550 GeForce GTX 960M, 6300HQ, WDC WD10SPCX-75KHST0 + LiteON CS1-SP32-11 M.2 2242 32GB | Apple MacBook Pro Retina 15 inch 2015-05 Radeon R9 M370X, 4870HQ, Apple SSD SM0512G | Asus Zenbook Pro UX501JW-FI218H GeForce GTX 960M, 4720HQ, SanDisk SD7SN3Q128G1002 | Lenovo IdeaPad Y50-70-59441229 GeForce GTX 960M, 4710HQ, Samsung SSD PM851 256 GB MZ7TE256HMHP | HP ProBook 470 G2 G6W52EA Radeon R5 M255, 4210U, Hitachi Travelstar Z5K500 HTS545050A7E680 | MSI PE70 2QE GeForce GTX 960M, 4720HQ, HGST Travelstar 7K1000 HTS721010A9E630 | |
|---|---|---|---|---|---|---|
| CrystalDiskMark 3.0 | 725% | 151% | 126% | -54% | -38% | |
| Read Seq (MB/s) | 238.6 | 1442 504% | 471.9 98% | 518 117% | 93.1 -61% | 129.3 -46% |
| Write Seq (MB/s) | 64 | 1558 2334% | 347 442% | 264.8 314% | 92.3 44% | 124.3 94% |
| Read 4k (MB/s) | 31.36 | 19.27 -39% | 31.19 -1% | 32.29 3% | 0.288 -99% | 0.478 -98% |
| Read 4k QD32 (MB/s) | 199.5 | 403.1 102% | 331.8 66% | 341.2 71% | 0.743 -100% | 0.899 -100% |
| AS SSD | 2971% | 1868% | 1657% | -36% | -6% | |
| Score Read (Points) | 24 | 793 3204% | 388 1517% | 420 1650% | 10 -58% | 14 -42% |
| Score Write (Points) | 10 | 517 5070% | 294 2840% | 185 1750% | 8 -20% | 14 40% |
| 4K Read (MB/s) | 1.53 | 19.3 1161% | 29.14 1805% | 28.36 1754% | 0.48 -69% | 0.45 -71% |
| 4K Write (MB/s) | 0.98 | 29 2859% | 67.6 6798% | 64.5 6482% | 0.7 -29% | 0.72 -27% |
| Seq Read (MB/s) | 122.2 | 1550 1168% | 485.9 298% | 501 310% | 89.1 -27% | 128.9 5% |
| Seq Write (MB/s) | 77.6 | 1441 1757% | 325.6 320% | 249.4 221% | 69.8 -10% | 121.8 57% |
| Copy ISO MB/s (MB/s) | 15.75 | 1395 8757% | 374.3 2277% | 329.1 1990% | ||
| Copy Program MB/s (MB/s) | 42.24 | 608 1339% | 249.8 491% | 200.6 375% | ||
| Copy Game MB/s (MB/s) | 66.4 | 1014 1427% | 375 465% | 316.5 377% | ||
| Total Average (Program / Settings) | 1848% /
2280% | 1010% /
1340% | 892% /
1186% | -45% /
-43% | -22% /
-19% |

GPU Performance
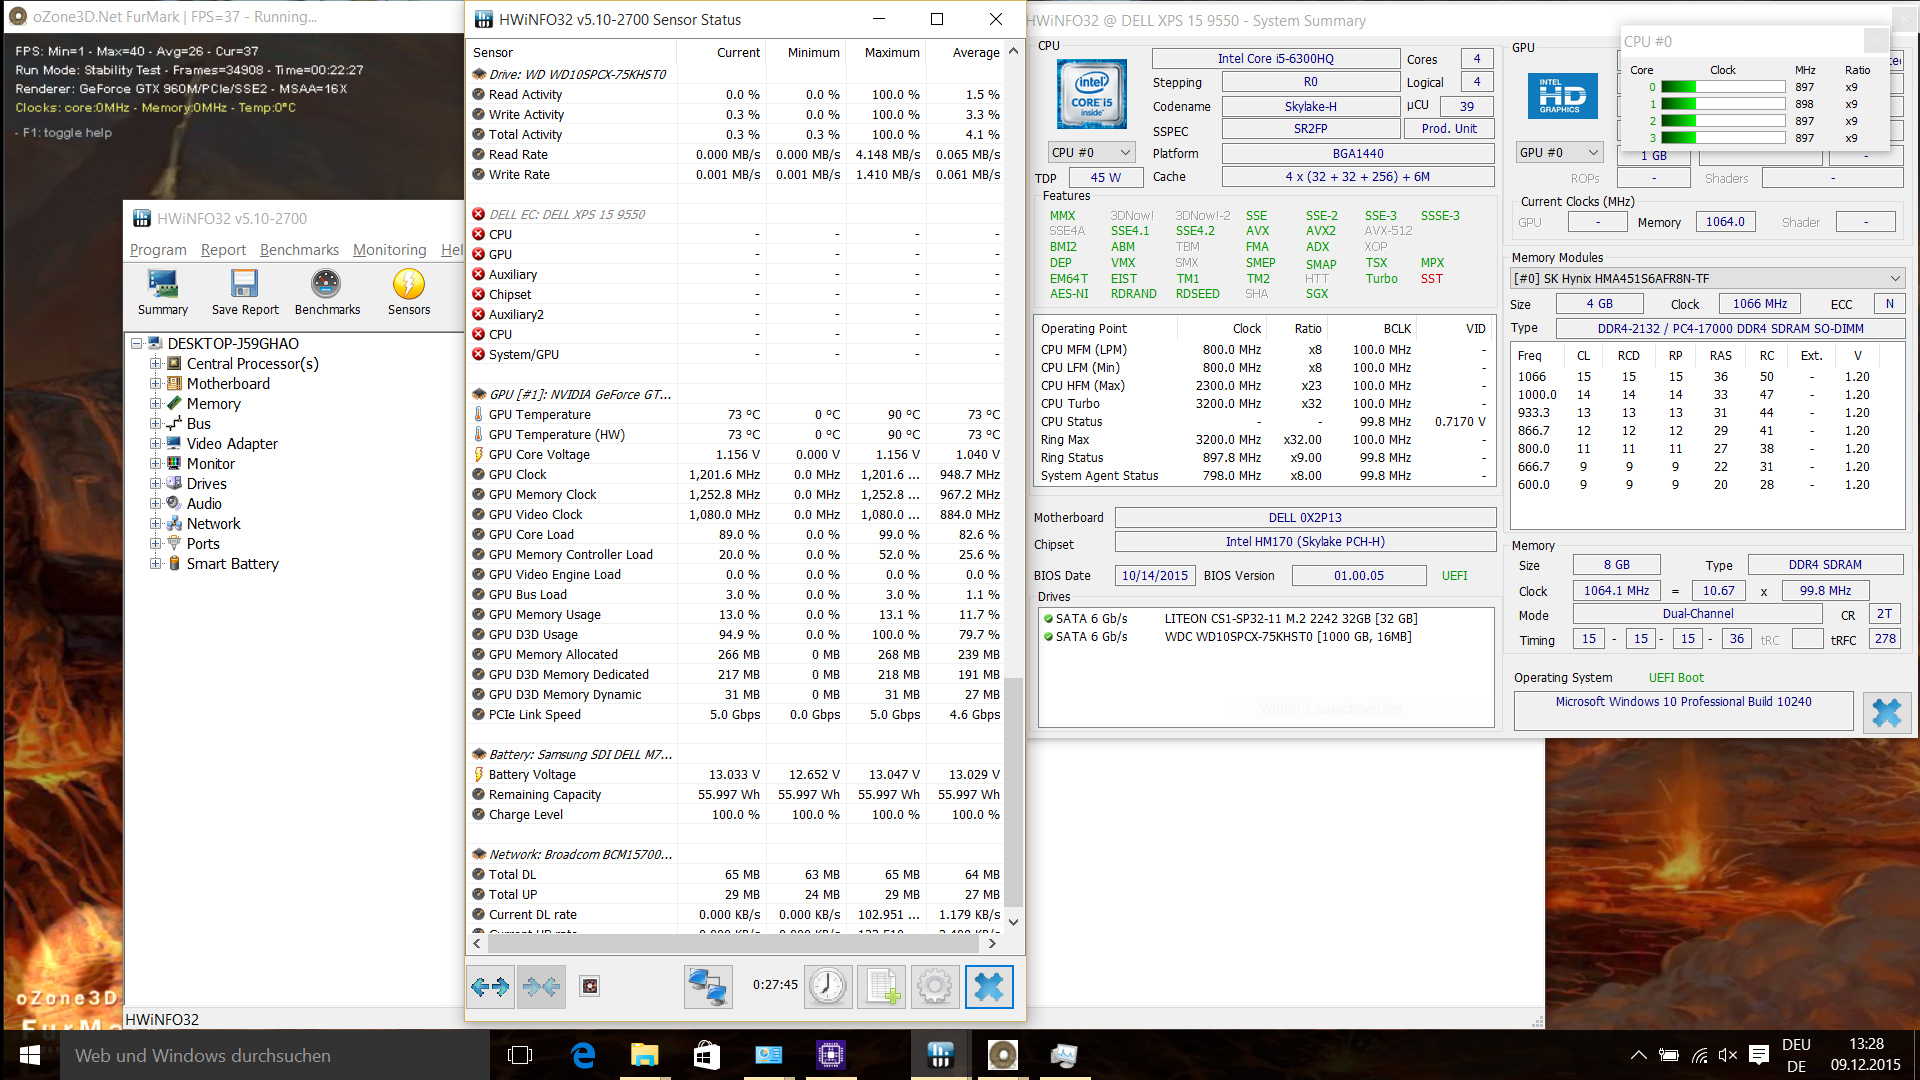
While the integrated HD Graphics 530M not only handles the graphics output but also the calculations in simple tasks, the GeForce GTX 960M with 2 GB GDDR5-VRAM is activated when you play games or run hardware-accelerated applications like Adobe Premiere Pro. The chip is based on the GM107 chip (Maxwell) with more than 640 shaders and a 128-bit memory interface. The GeForce can run at up to 1,201 MHz on mains and also maintain that level under sustained load (screenshot: FurMark GPU stress test). The exact clock seems to depend on the requirements; the Cinebench R15 OpenGL test starts at 1,097 MHz, but it finishes with 836 MHz in the second half. The clock is limited to 836 MHz on battery power. It seems that there is a temporal Turbo limitation as well as throttling on battery power. This obviously results in performance drops; the R15 OpenGL test only determined 29 instead of 46 fps.
3DMark 11 shows a tie with other GTX 960M systems, like the Nitro Black Edition VN7-792G-74Q4, in terms of the raw GPU performance. The Physics scores are, however, clearly dominated by the i7 quad-cores, which is also a result of the restrained Turbo utilization of the processor.
3DMark (2013) once again reveals the Physics score as a weak spot, but the combined or graphics scores are on par with the GTX 960M rivals. It seems that a GPU throttling is no problem for the theoretical scores. We have a look at real games in the next section.
The HD Graphics 520, which handles the graphics of the XPS 13 2016 (-60%), obviously cannot keep up. The same applies for the Radeon R9 M370X of the MacBook 15 Pro, even though the upper-mainstream chip only falls behind by 13% on average. The Radeon is not beaten in every sub-score though, and the MacBook Pro Retina 15 can secure all the Physics sub-scores thanks to the more powerful processor. Those will gloss over the disadvantage of the Radeon R9 (-30 up to 40%) in the Fire Strike Standard Graphics (-43%), for example.
| 3DMark 11 Performance | 5375 points | |
| 3DMark Ice Storm Standard Score | 80910 points | |
| 3DMark Cloud Gate Standard Score | 12993 points | |
| 3DMark Fire Strike Score | 3907 points | |
Help | ||
Gaming Performance
The GTX inside the XPS 15 seems to be doing well at a first look; the results in Thief or Dirt Rally are in the expected range for the unthrottled GPU.
The Radeon R9 of the MacBook Pro Retina falls clearly behind, it cannot keep up with Nvidia's performance even with the slightly faster processor (-38 and 47%). If you want to play with a thin notebook, there is no way around the GTX 960M, which is supported by the green/yellow table with the test games. The fps number is sometimes just smooth at Full HD, which indicates that the GTX 960M is not powerful enough for gaming in 4K. We already have the review model here and will be publishing an update soon.
| Dirt Rally - 1920x1080 Ultra Preset AA:4x MS (sort by value) | |
| Dell XPS 15 9550 | |
| Apple MB Pro Retina 15 2015 | |
| Schenker XMG A706 | |
| Schenker XMG A505 | |
| BioShock Infinite - 1920x1080 Ultra Preset, DX11 (DDOF) (sort by value) | |
| Dell XPS 15 9550 | |
| Apple MB Pro Retina 15 2015 | |
| XPS 13 2016 i7 QHD | |
| XPS 15 9530 | |
| Thief - 1920x1080 Very High Preset AA:FXAA & High SS AF:8x (sort by value) | |
| Dell XPS 15 9550 | |
| Apple MB Pro Retina 15 2015 | |
| Acer AS V Nitro VN7-792G | |
| Schenker XMG A706 | |
| Alien: Isolation - 1920x1080 Ultra, On, Shadow Map 2048, HDAO AA:2x SM AF:16x (sort by value) | |
| Dell XPS 15 9550 | |
| Apple MB Pro Retina 15 2015 | |
| MSI PE60 | |
| Metal Gear Solid V - 1920x1080 Extra High / On (sort by value) | |
| Dell XPS 15 9550 | |
| Schenker XMG A706 | |
| Schenker XMG A505 | |
| FIFA 16 - 1920x1080 High Preset AA:4x MS (sort by value) | |
| Dell XPS 15 9550 | |
| Schenker XMG A505 | |
| Star Wars Battlefront - 1920x1080 Ultra Preset AA:FX (sort by value) | |
| Dell XPS 15 9550 | |
| Schenker XMG A505 | |
| low | med. | high | ultra | |
|---|---|---|---|---|
| BioShock Infinite (2013) | 108 | 40.8 | ||
| Battlefield 4 (2013) | 80.8 | 33.8 | ||
| Thief (2014) | 52.5 | 27.8 | ||
| Middle-earth: Shadow of Mordor (2014) | 41.2 | 25.9 | ||
| Alien: Isolation (2014) | 58.6 | 52.4 | ||
| Evolve (2015) | 36.8 | 32.2 | ||
| Battlefield Hardline (2015) | 50.8 | 32.2 | ||
| Dirt Rally (2015) | 33.4 | |||
| Metal Gear Solid V (2015) | 55.3 | 35.6 | ||
| FIFA 16 (2015) | 95.7 | |||
| Star Wars Battlefront (2015) | 37.9 | 32.3 |
Emissions
System Noise

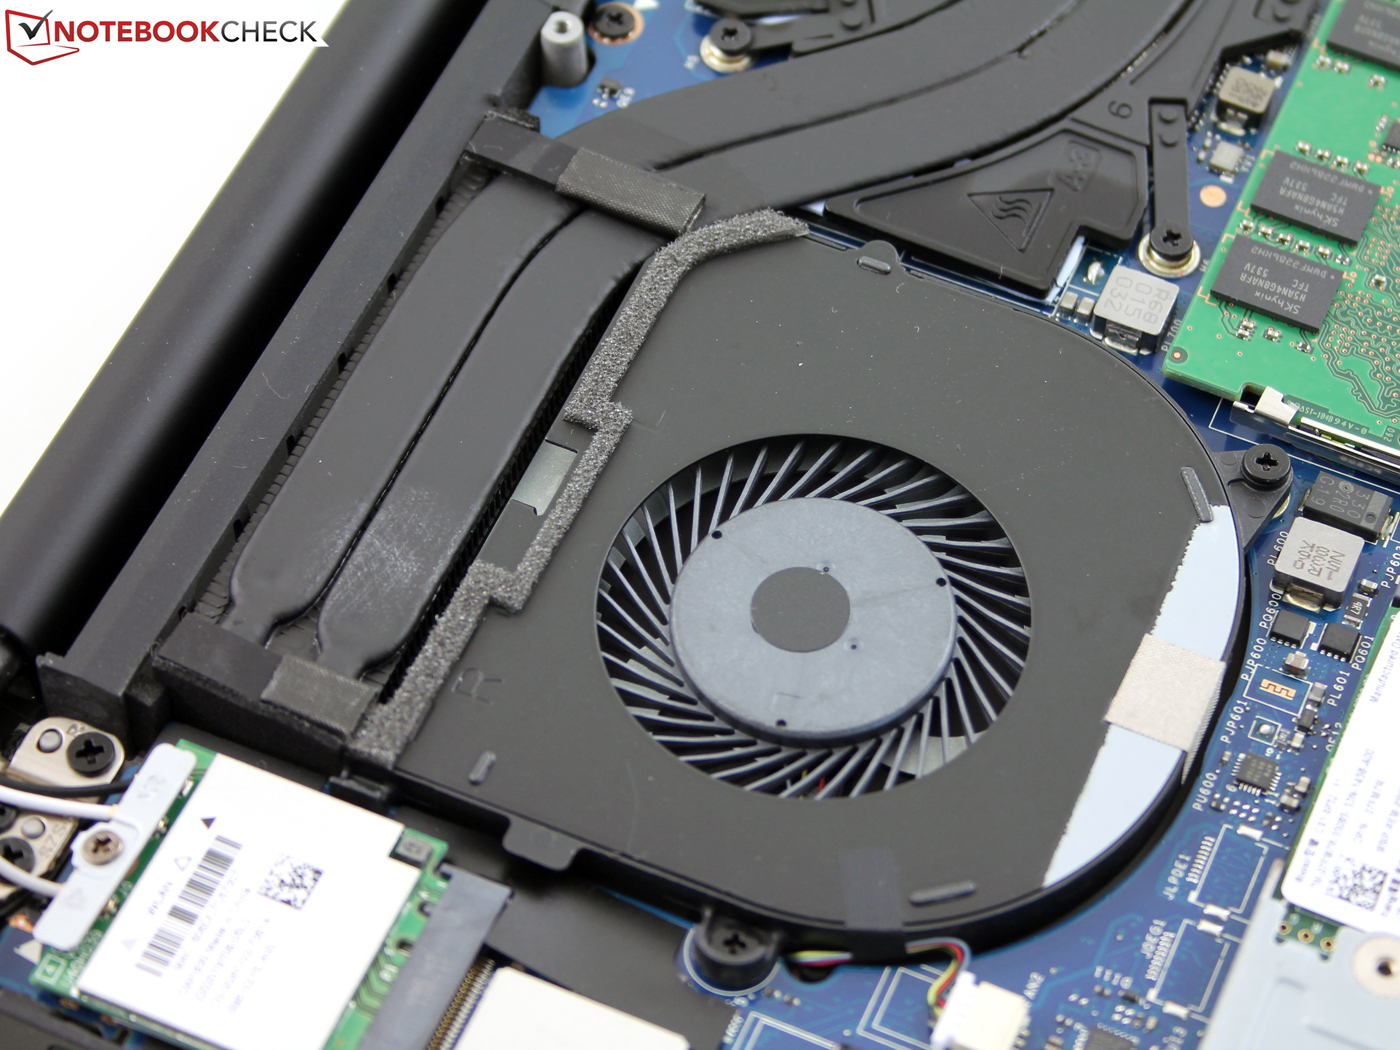
Dual-heatpipes for the processor and the graphics card transport the heat to two fans. We could not find out if those two fans act individually, the system noise was always similar. There are two components that create noise while idling: The fans and the hard drive. The lowest curve in the graphics in cyan shows the hard drive, the light green curve is Idle Max, where the fans are active in addition. The two components are on one acoustic level, neither the cooling solution nor the hard drive leaves a negative impression. The latter is also very quiet when it reads and writes; movements of the head are not louder than the rotation.
How is the situation under load (yellow = 3DMark06)? The fans start to spin up to 37 dB(A), which is audible as a quiet murmur, but sonorous and not annoying. The fan does not pulsate, and this does not change under maximum load during our stress test (red = Load Max.). The red curve is identical to the purple curve (only GPU load). The fans will hit their maximum speed when you play games, high GPU load or in the stress test (CPU + GPU). We also had this impression during the gaming benchmarks: There is hardly a louder or quieter differential, the cooling solution works at the maximum level and reaches 47.5 dB(A) in very demanding titles. Less complex titles result in 37 dB(A), just like our 3DMark06 test.
To ensure that the two fans get sufficient fresh air via the openings in the bottom cover, you should not place the XPS 15 on a blanket, carpet or the like. The warm air is dissipated to the outside via vents underneath the display cover.
In short, the situation is similar to the past: Powerful components still need a powerful cooling solution and these components usually make the most noise in a thin chassis. The MacBook Pro Retina 15, IdeaPad Y50-70 and MSI PE60 are amongst the loudest competitors. The Zenbook Pro UX501JW appears to be a bit quieter, but it already reaches 42 dB(A) while idling (median).
| Dell XPS 15 2016 9550 GTX 960M 6300HQ RAID HDD-SSD | Acer Aspire V Nitro VN7-792G-55SF 945M 6300HQ HDD | Apple MacBook Pro Retina 15 inch 2015-05 Radeon R9 M370X 4870HQ SSD | Asus Zenbook Pro UX501JW-FI218H GTX 960M 4720HQ SSD | Dell XPS 15 (9530-0538) GT 750M 4712HQ SSD | Lenovo IdeaPad Y50-70-59441229 GTX 960M 4710HQ SSD | MSI PE60-2QEi581 GTX 960M 4210H HDD | |
|---|---|---|---|---|---|---|---|
| Noise | 11% | 4% | 2% | 1% | 2% | -4% | |
| Idle Minimum * (dB) | 32.6 | 30.1 8% | 28.9 11% | 32.2 1% | 29.6 9% | 29.6 9% | 32.8 -1% |
| Idle Average * (dB) | 33.6 | 30.1 10% | 28.9 14% | 32.3 4% | 31.6 6% | 30.7 9% | 32.8 2% |
| Idle Maximum * (dB) | 33.6 | 30.9 8% | 28.9 14% | 32.3 4% | 31.6 6% | 31.3 7% | 35.4 -5% |
| Load Average * (dB) | 37.1 | 33.6 9% | 46 -24% | 41.7 -12% | 45.4 -22% | 43.1 -16% | 42.3 -14% |
| Load Maximum * (dB) | 47.5 | 38.6 19% | 46 3% | 42 12% | 45.4 4% | 47.6 -0% | 47.4 -0% |
* ... smaller is better
Noise level
| Idle |
| 32.6 / 33.6 / 33.6 dB(A) |
| HDD |
| 32.6 dB(A) |
| Load |
| 37.1 / 47.5 dB(A) |
 | ||
30 dB silent 40 dB(A) audible 50 dB(A) loud |
||
min: | ||
Temperature

Can the loud dual-fan solution keep the temperatures under control during load? This is certainly the most interesting question considering the 45-Watt processor and GTX 960M (TDP around 60 Watts). The 130-Watt PSU is powerful enough for both components, but what about the heat?
Let's have a look at the idle operation first, where the temperatures are surprisingly low. The average value at the top is just 32 °C and 34 °C at the bottom, independent of the power profile. The rivals can do that as well, the thin aluminum chassis of the Zenbook Pro UX501JW actually stays cooler, even though it is based on a Haswell processor. The MacBook Pro Retina 15 is also cooler.
Load scenarios are a real challenge for the XPS 15, the cooling can hardly manage the heat in the stress test, despite the massive throttling. A look at the temperatures shows the situation. We can measure up to 62 °C at the top and 55 °C at the bottom. This is still reasonable considering the powerful components; hardly any user will really stress the notebook for longer periods while it is on the lap.
We can see a recurring cycle of the processor and graphics card during our stress test: The i5-6300HQ quickly throttles from its 2.8 GHz (@Cinebench tests) in steps to 1.8, then 1.4 and finally 800 MHz. The temperature of the 6300HQ drops from 95 °C (limit where the throttling sets in) to 70 °C at the same time, just to rise back to 90 °C as soon as the CPU continues to run at 1.8 GHz. This recurring cycle (800 MHz – 1.8 GHz) takes place roughly every two minutes and we can see a correspondingly fluctuating power consumption between 66 and 129 Watts.
The GPU is also affected by these temperatures. Maybe the linking of the CPU and GPU heat with dual-heatpipes was not a good idea after all. A warm processor will also warm up the graphics card. The GTX 960M therefore also throttles its clock. We can see 650 MHz in the stress test with fluctuations to 1,200 MHz, but it runs at 650 MHz most of the time. The GPU temperature does not fluctuate as much as the CPU: It can reach 90 °C, where the throttling sets in and the temperature of the GPU will level off at around 70 °C.
Throttling everywhere then? No, as we described in the section "Performance," the i5-6300HQ can maintain 2.8 GHz, but only if you don't stress the GTX 960M at the same time. This is 15% under the maximum potential of this CPU (single-thread). Only stressing the GPU (screenshot FurMark only) does not seem to be an issue and the card can run at the full 1,200 MHz. We will check whether the gaming performance is affected by throttling due to the simultaneous load in an in-depth gaming review.
| Dell XPS 15 2016 9550 GTX 960M 6300HQ RAID HDD-SSD | Acer Aspire V Nitro VN7-792G-55SF 945M 6300HQ HDD | Apple MacBook Pro Retina 15 inch 2015-05 Radeon R9 M370X 4870HQ SSD | Asus Zenbook Pro UX501JW-FI218H GTX 960M 4720HQ SSD | Dell XPS 15 (9530-0538) GT 750M 4712HQ SSD | Lenovo IdeaPad Y50-70-59441229 GTX 960M 4710HQ SSD | MSI PE60-2QEi581 GTX 960M 4210H HDD | |
|---|---|---|---|---|---|---|---|
| Heat | 18% | 22% | 11% | -10% | 19% | 12% | |
| Maximum Upper Side * (°C) | 62.5 | 42.1 33% | 43.2 31% | 46.2 26% | 51.8 17% | 52.5 16% | 45.5 27% |
| Maximum Bottom * (°C) | 54.4 | 42 23% | 39 28% | 52.5 3% | 64.6 -19% | 47 14% | 37.5 31% |
| Idle Upper Side * (°C) | 33.5 | 31.2 7% | 30 10% | 32 4% | 38.4 -15% | 27.1 19% | 35.8 -7% |
| Idle Bottom * (°C) | 36.7 | 34 7% | 29.3 20% | 32.7 11% | 44.4 -21% | 27 26% | 38.7 -5% |
* ... smaller is better
(-) The maximum temperature on the upper side is 62.5 °C / 145 F, compared to the average of 36.8 °C / 98 F, ranging from 21 to 71 °C for the class Multimedia.
(-) The bottom heats up to a maximum of 54.4 °C / 130 F, compared to the average of 39.1 °C / 102 F
(+) In idle usage, the average temperature for the upper side is 31.7 °C / 89 F, compared to the device average of 31.3 °C / 88 F.
(±) The palmrests and touchpad can get very hot to the touch with a maximum of 39 °C / 102.2 F.
(-) The average temperature of the palmrest area of similar devices was 28.7 °C / 83.7 F (-10.3 °C / -18.5 F).
Speakers

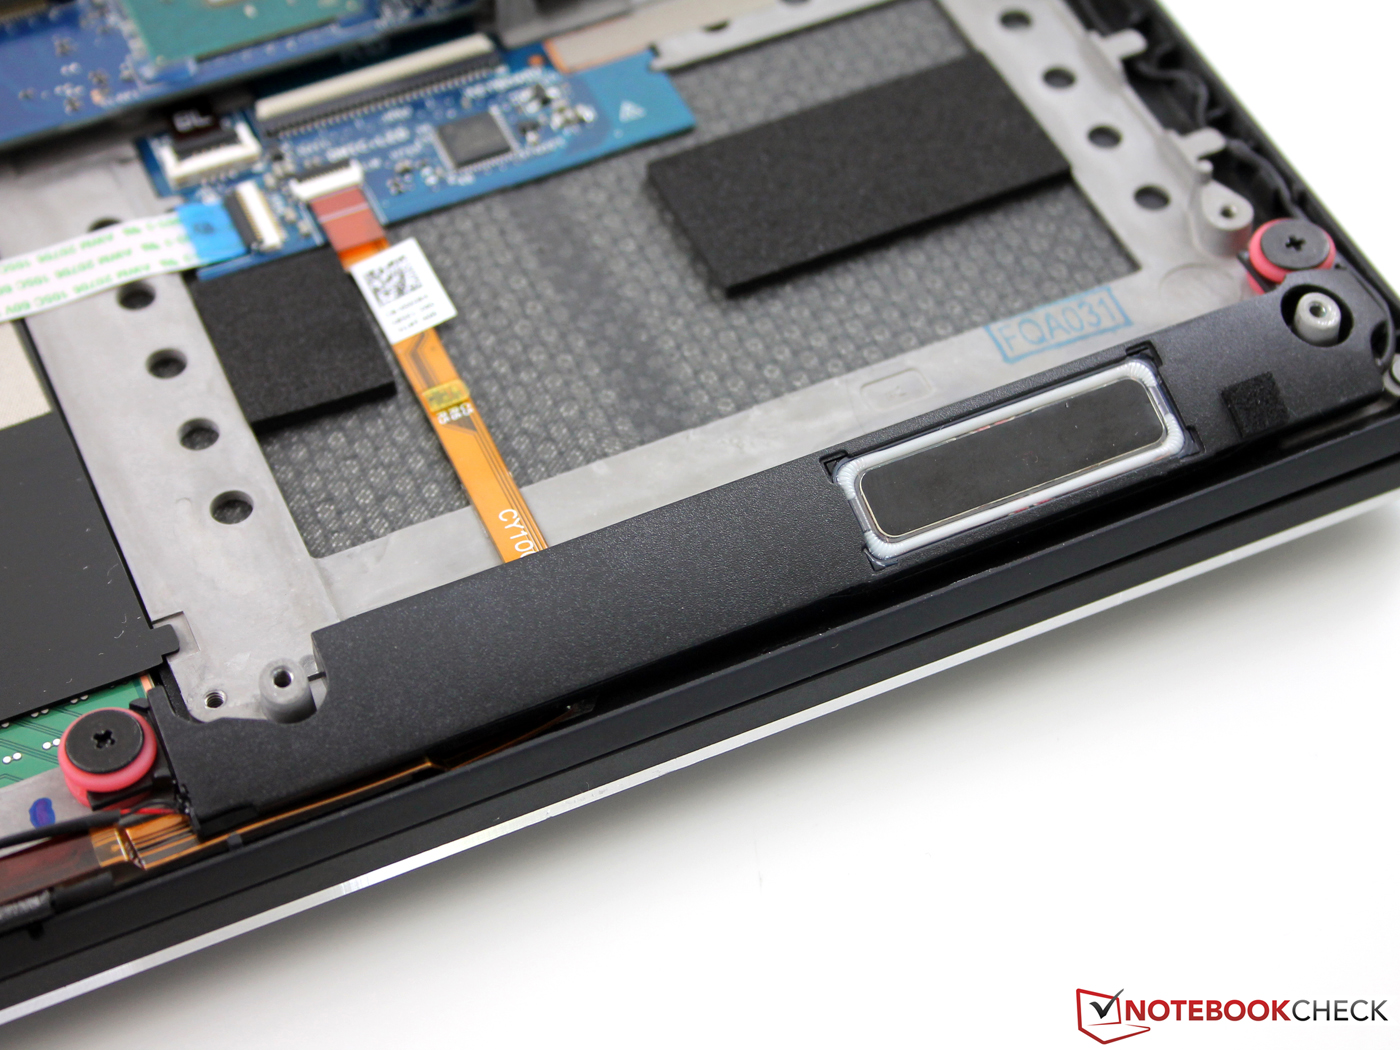
The speakers are at the front underneath the palm rest. You can see the small modules, which are connected to an elongated sound box, in the pictures of the internals. There is no rattling or the like, the speakers are softly arranged. Musical instruments are sufficiently differentiated, and you can even notice a hint of bass. You cannot deny the sound a certain richness during the playback of classic music. Due to the lack of a subwoofer or because of the limited frequencies, the small drivers leave a good impression, but not a very good one that would suit a multimedia device. The result will be sufficient for games or background music in many cases, but real high fidelity is only possible via external speakers. Those can be attached via 3.5 mm jack or Bluetooth.
Dell Audio allows numerous adjustments: Bass, high tones, deep tones, capping and the full equalizer are available. This is certainly a reasonable tool for users from the music and recording scene.
We kept the default settings for a better comparability and tried out the microphone with DeKey, DeEsser and MaxxNR. The recording of the microphone was, unfortunately, not as perfect as the XPS 13 (free of noise, roughly the same volume despite location changes). Background noises were always audible, for example the rotation of the hard drive. The optimization does not manage to create a constant volume when you change the location. We tested all microphone profiles. The XPS 13 leaves a better impression in this respect, the position of the dual-array microphone at the front of the base as well as the rotating HDD directly behind it affect the performance (murmur of the HDD is recorded).
Energy Management
Power Consumption
The power consumption at the socket fluctuates between 10 and 17 Watts while idling, depending on the power profile, the wireless modules, the brightness and finally the background processes. The XPS 15 is therefore more frugal than a similarly equipped Haswell model (Zenbook Pro UX501JW). That Haswell does not automatically consume more power is proven by the Lenovo IdeaPad Y50-70 with 4 up to 11 Watts while idling. Our review unit also consumes more power while idling than the Acer V Nitro VN7-792G (945M), despite the same Skylake platform, and the latter is a 17-inch device.
Normal workloads simulated by 3DMark06 (without charging of the battery) pull 70 Watts from the socket, which is comparatively low. An indicator for the throttled GPU performance? We will check it.
The stress test provokes throttling all the way down to 800 MHz, which lets the power consumption fluctuate in a circle: 129 Watts – 99 – 66 – 129 – 99 and so on. We noted the average value of 98 Watts. The reason for the fluctuations was described in the section "Emissions/Stress Test." Notebooks without throttling and comparable hardware consume between 112 up to 120 Watts (IdeaPad Y50-70, MSI PE60) in this maximum load scenario. The XPS 15 is similar to the Zenbook Pro UX501JW (73 Watts), which throttles in the stress test as well.
Loading Time / Energy Options
In terms of charging times, we cannot confirm the review from our Golem colleagues. The compact 130-Watt PSU cannot completely charge the XPS in about 1.5 hours. The charging prediction indicates two hours, but the device was actually charged to 100% after 2:47 hours. 95% is reached after around two hours, the last 5% takes the most time. You can adjust the charging behavior very comprehensively in the BIOS, even dependent of the weekday and the time.
But there are even more interesting possibilities, like the Peak Shift. The user can set the time (from … to …) of the peak load of its power consumption. The XPS 15 will not use any mains power during this time, as long as the battery capacity does not drop below 15%. You can adjust if the device will be charged or not during these peak times.
The standard setting in the Primary Battery Charge Configuration is "Adaptive". Our colleagues from Golem probably used the "Express Charge", where the battery is recharged to 90 % within 1.5 hours and is fully loaded after another hour.
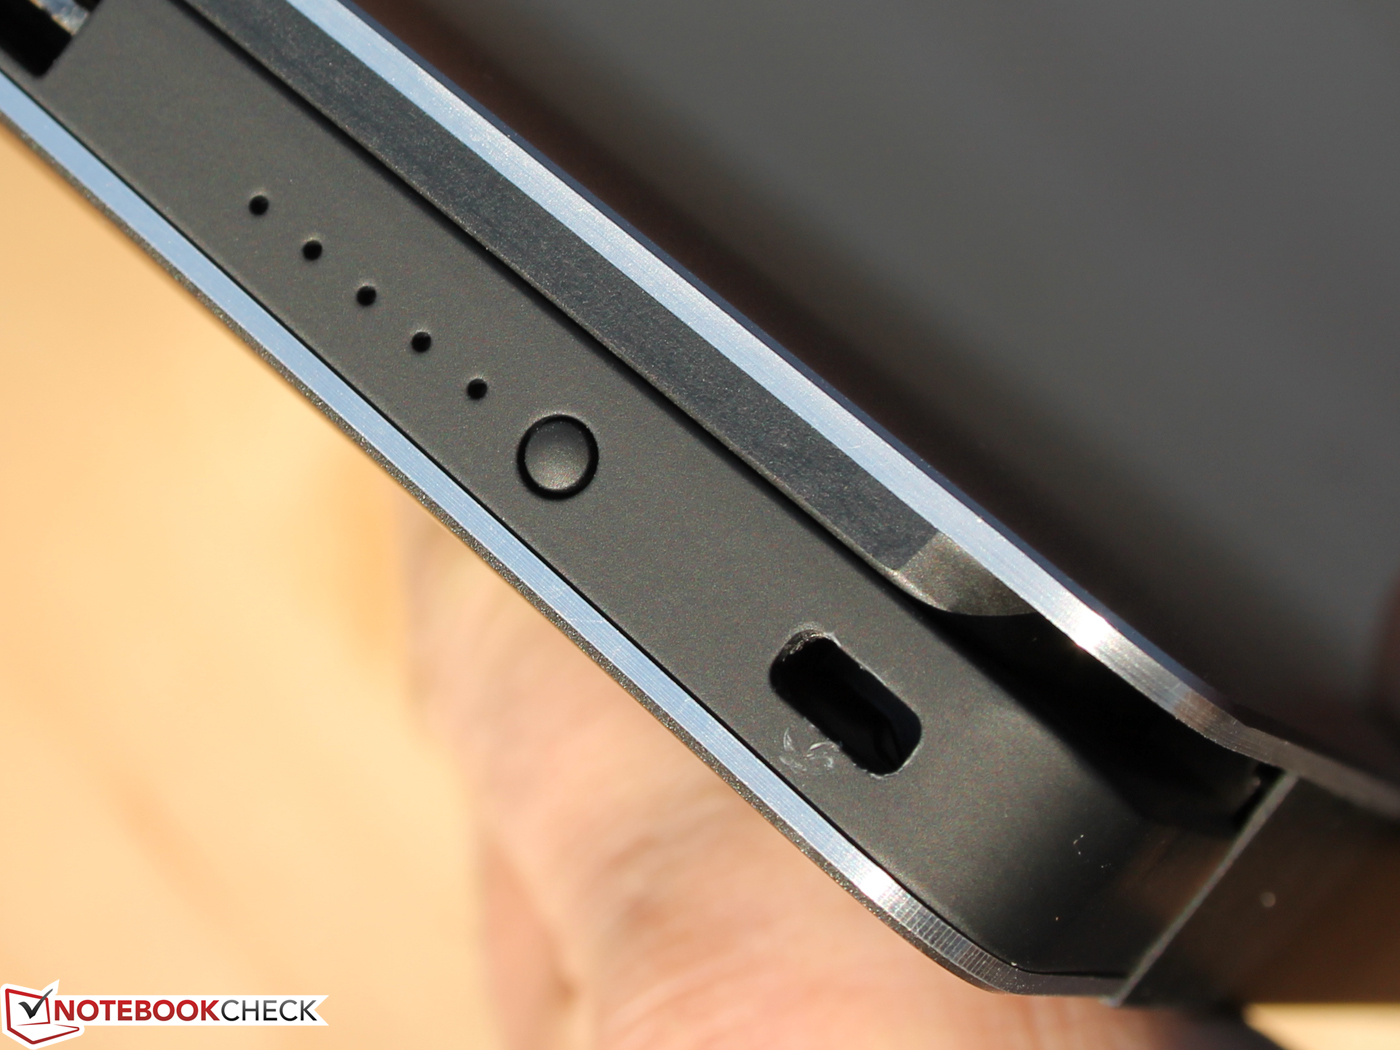
The details are sophisticated; the power connector is illuminated and easy to find in the dark. The battery button on the right side of the case shows the charging status visually via four LEDs. Also, at the front of the XPS is a wide LED that indicates a critical battery state. It glows orange and white when the power adaptor is attached.
| Dell XPS 15 2016 9550 GTX 960M 6300HQ RAID HDD-SSD | Acer Aspire V Nitro VN7-792G-55SF 945M 6300HQ HDD | Apple MacBook Pro Retina 15 inch 2015-05 Radeon R9 M370X 4870HQ SSD | Asus Zenbook Pro UX501JW-FI218H GTX 960M 4720HQ SSD | Dell XPS 15 (9530-0538) GT 750M 4712HQ SSD | Lenovo IdeaPad Y50-70-59441229 GTX 960M 4710HQ SSD | MSI PE60-2QEi581 GTX 960M 4210H HDD | |
|---|---|---|---|---|---|---|---|
| Power Consumption | 19% | 12% | -24% | -25% | 18% | -63% | |
| Idle Minimum * (Watt) | 9.9 | 6.4 35% | 6 39% | 15.6 -58% | 14.6 -47% | 4.3 57% | 21.8 -120% |
| Idle Average * (Watt) | 12.6 | 10.9 13% | 12.8 -2% | 20.5 -63% | 19.6 -56% | 7.8 38% | 26.1 -107% |
| Idle Maximum * (Watt) | 16.8 | 14.1 16% | 13.3 21% | 21.2 -26% | 19.8 -18% | 10.6 37% | 26.6 -58% |
| Load Average * (Watt) | 70 | 67.1 4% | 82.4 -18% | 75.8 -8% | 92 -31% | 99.7 -42% | 88.5 -26% |
| Load Maximum * (Watt) | 114 | 84.9 26% | 91.8 19% | 72.9 36% | 85.8 25% | 112.3 1% | 119.7 -5% |
* ... smaller is better
| Off / Standby | |
| Idle | |
| Load |
|
Key:
min: | |
Battery Runtime
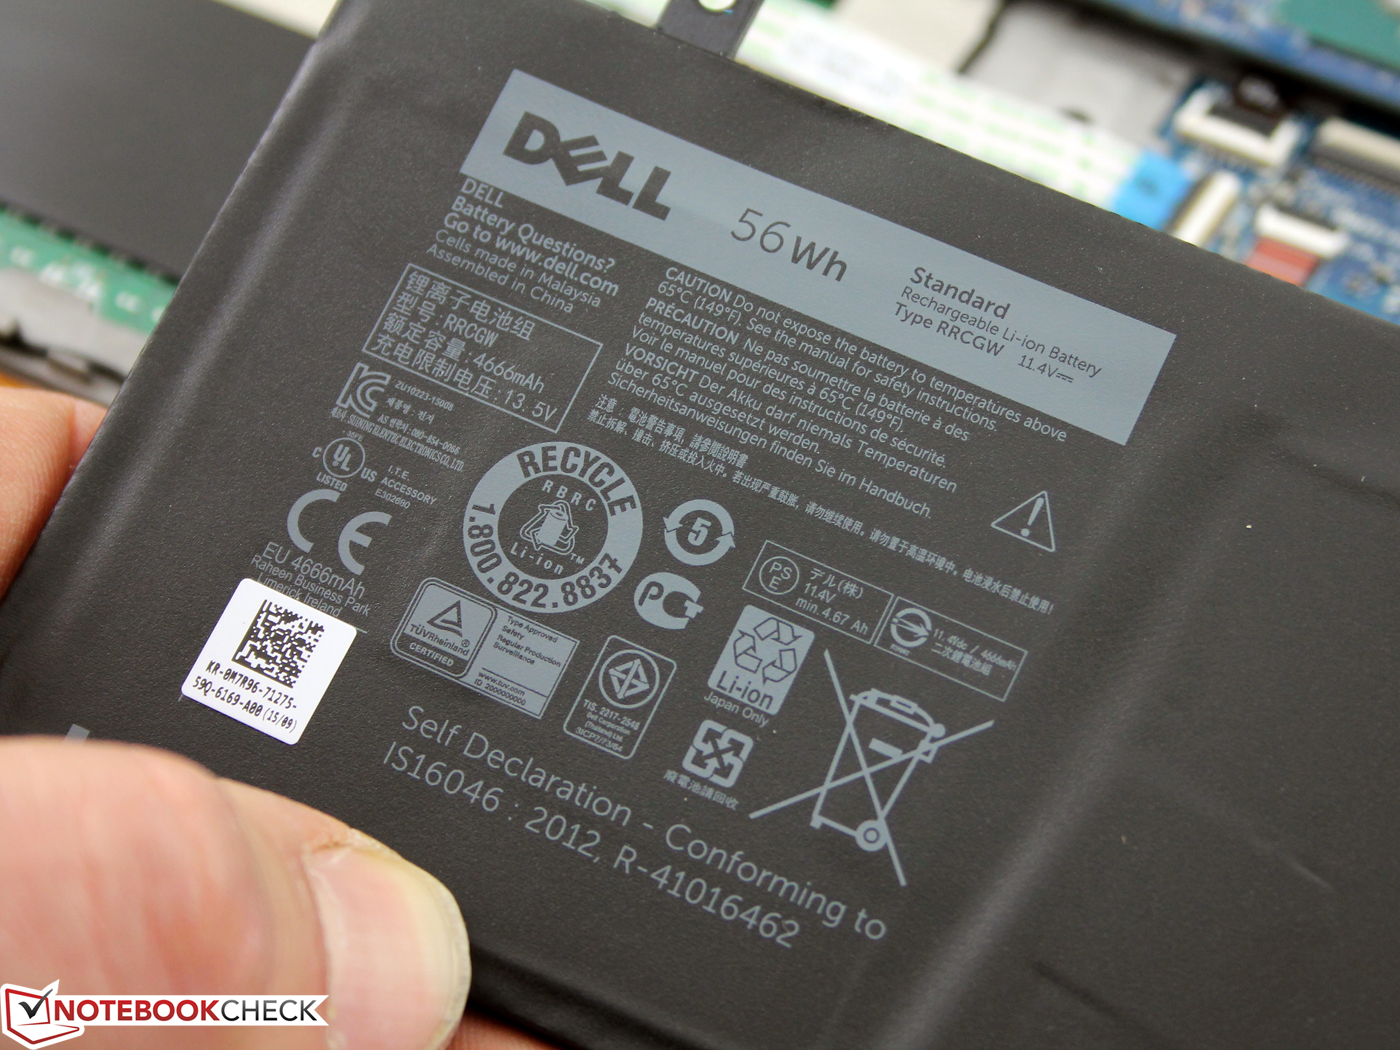
Dell equips its high-performance notebook with a 56-Wh battery, only the more expensive Core i7 version with 4K touch display and 512 GB SSD gets the big 84-Wh battery. The advantage of the higher capacity is compensated for by the higher power consumption of the 4K panel (more LEDs), which is shown by the additional runtimes of the 84-Wh model: The idle runtime is marginally shorter, Wi-Fi and video runtime even more so (-7 / -12%).
No HDD = 84-Wh battery. This equation works, because the bigger battery just occupies the space of the 7-mm hard drive Western Digital WD10SPCX.
As usual, we determine the Wi-Fi and the video (Big Buck Bunny H.264 1080p) runtimes with a reduced brightness. We could not adjust the panel to the standard of 150 cd/m², so we decided in favor of the XPS 15 and went one step below at 123 cd/m² (center, dimmed by 6 steps). The Wi-Fi test uses the “Balanced” power profile, while the energy-saving mode is active for the video playback test. The Intel processor C-states were active in the BIOS.
The two runtimes are close to each other, the 1080p video runs half-an-hour longer, probably because the flight mode is active. This means you can expect 6 hours in practice at best, which means without gaming, picture editing or video rendering. This is usable but pretty short, the Apple MacBook Pro Retina 15 2015 lasts 30% longer in the same test. It also carries a 99.5-Wh battery in return. This means the XPS 15 makes more of its battery capacity and is more efficient. But it should be, because we compare Skylake with Haswell.
The table shows: Notebooks with a similar performance have a hard time to manage long runtimes – but the manufacturers don't help with the integration of small batteries.
The runtimes are much shorter under sustained load, even though the CPU throttles to just 1.6 GHz. 140 minutes is actually not bad in comparison, but it is also a result of the throttling, which is not the case for the other rivals in the table. We also ran a loop of Cinebench R15 (Multi-Core) after Battery Eater Classic. The result was 2:38 hours (158 minutes).
We determine the idle runtime at the lowest brightness level. The notebook benefits from the active PWM (below 10% luminance). This value is not practical though and can only be used when the XPS 15 is executing tasks without necessary inputs. The Apple MacBook Pro Retina 15 2015 manages almost twice of that with its big battery. The other devices with the same form factor fall behind. It is interesting that the big 17-inch device Aspire Nitro Black Edition VN7-792G (945M) lasts 13% longer while idling.
You can order the 84-Wh battery separately at the beginning of 2016 according to Dell. This should help the runtimes, but the user will have to remove the SATA hard drive and remove the RAID array by a new installation of the OS. We might be able to test that with the 84-Wh i7 top model next week.
| XPS 15 9550 i5 6300HQ, GeForce GTX 960M, 56 Wh | XPS 15 9550 i7 SSD 6700HQ, GeForce GTX 960M, 84 Wh | XPS 15 9530 4712HQ, GeForce GT 750M, 88 Wh | XPS 13 2016 i7 QHD 6500U, HD Graphics 520, 56 Wh | Apple MB Pro Retina 15 2015 4870HQ, Radeon R9 M370X, 100 Wh | Asus Zenbook Pro UX501JW 4720HQ, GeForce GTX 960M, 60 Wh | Acer AS V Nitro VN7-792G 6300HQ, GeForce 945M, 52 Wh | V Nitro Black Edition VN7-792G 6700HQ, GeForce GTX 960M, 53 Wh | MSI PE60 4210H, GeForce GTX 960M, 42 Wh | |
|---|---|---|---|---|---|---|---|---|---|
| Battery runtime | -7% | -5% | 16% | 29% | -51% | -14% | -20% | -41% | |
| Reader / Idle (h) | 9.1 | 8.8 -3% | 13.1 44% | 17.3 90% | 10.2 12% | 6.8 -25% | 5.8 -36% | ||
| H.264 (h) | 6 | 5.3 -12% | 6.9 15% | 3.9 -35% | 5.9 -2% | ||||
| WiFi v1.3 (h) | 5.5 | 5.2 -5% | 5.2 -5% | 7.2 31% | 7.2 31% | 2.7 -51% | 4.6 -16% | 4.2 -24% | 2.8 -49% |
| Load (h) | 2.3 | 2.1 -9% | 1.7 -26% | 1.8 -22% | 1.9 -17% | 1.6 -30% | 1.4 -39% |
Pros
Cons
Verdict
You might be disappointed if you expected high-end performance from the XPS 15 at any time and in every situation. The XPS 15 not only reduces the CPU clock to 1.6 GHz on battery power, but it also acts sluggish, which will certainly not please power users. It is annoying when the system does not recognize that you attached the PSU over multiple CPU benchmarks and that it should run at 2.8 GHz, because you will lose time. This is also one of the reasons that we deduct one point from the overall rating. Unfortunately, the i5-6300HQ cannot utilize its full performance on mains either, at least in single-thread scenarios.
The matte Full-HD panel of our review configuration manages good results in respect of brightness and contrast. An sRGB coverage of almost 100% is also a positive aspect. We did not really like the (for professional users) inaccurate color accuracy ex-works. This is particularly unfortunate since calibration can really help. PWM only sets in at the lowest brightness level and should therefore not be a problem.
We also mentioned the battery runtimes before. A runtime of nine hours – but only while idling and on the lowest brightness level – is not really good, either. The notebook manages around 5.5 hours during web browsing, which is not overwhelming, but it should still be sufficient for many situations. For comparison: Apple's MacBook Pro 15 Retina lasts around 2 hours longer (Mac OS) in the same scenario.
If you want longer battery runtimes, you will either have to buy the expensive SSD-only model with 84 Wh or purchase the 84-Wh module separately in 2016 and waive the HDD. An "inexpensive" non-HDD version (e. g. FHD + i5 + 128 GB SSD (M.2)) is unfortunately not sold by Dell; the high capacity is linked to 4K touch and Core i7.
The emissions are not a big strength, because the XPS 15 has to throttle the GPU and CPU quite severely to manage the heat during the stress test, but the chassis still gets very warm. Our stress test is more of an extreme scenario and does not represent realistic conditions, but one thing is clear for power users: High parallel loads for CPU and GPU will throttle both components, and we are not speaking about running on battery power. The problem is not an insufficient power adaptor, but the thermal limit of 95 °C. We can soothe any concerns for gamers, though: The performance of the GTX 960M did not differ from any other laptops with the same GPU during the gaming tests.
Yes, the Dell XPS 15 (9550) is a sophisticated multimedia notebook. However, a closer look reveals many technical details that affect the overall impression of the XPS.
We liked the pretty balanced speakers, but the microphone cannot quite live up to the expectations. The recordings are affected by a more or less strong murmur.
The hybrid HDD is a successful compromise of performance and TB storage capacity. The read transfer rates cannot keep up with a real SSD, but they are clearly superior to those of slow conventional hard drives. Dell's "Raid array" can convince our application benchmarks, so the resulting scores are almost on par with real SSD-based systems. Hybrid drives with an integrated cache did not manage that so far.
Dell XPS 15 2016 9550
- 02/24/2016 v5 (old)
J. Simon Leitner / Sebastian Jentsch
Price comparison

