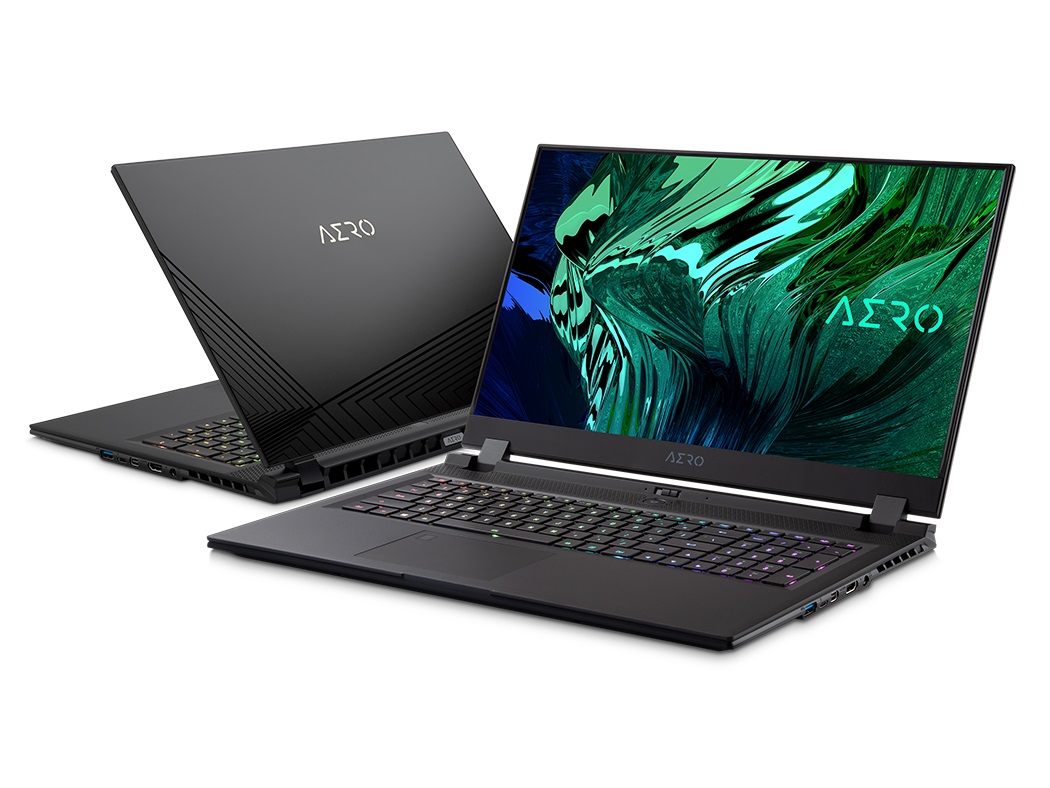
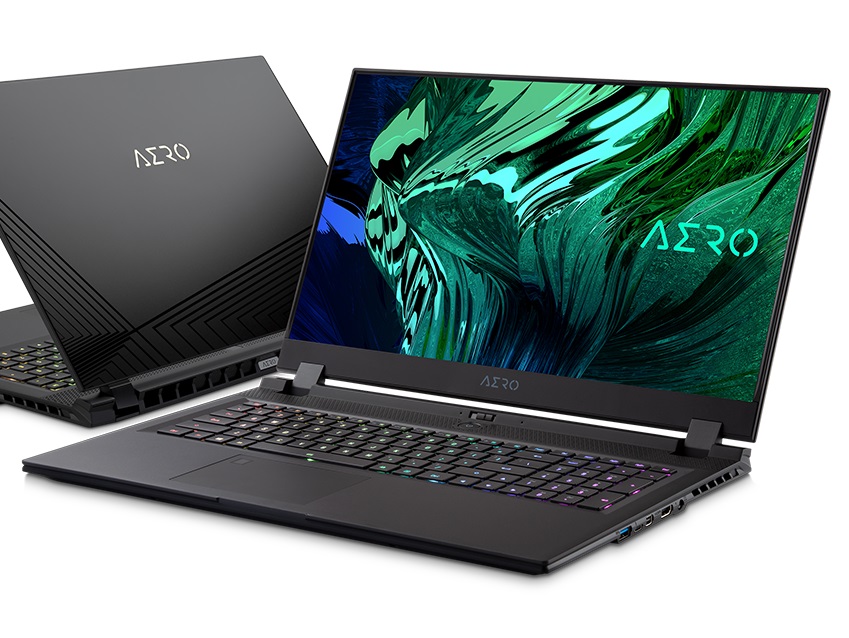
Gigabyte Aero 17 HDR YC Laptop in review: Debut for Nvidia Ampere

Gigabyte currently has two versions of the new Aero 17 HDR available on its website. The model ending in XC is equipped with a Core i7-10870H and a GeForce RTX 3070 Laptop while the model we have tested ends in YC and features a Core i9-10980HK and a GeForce RTX 3080 Laptop.
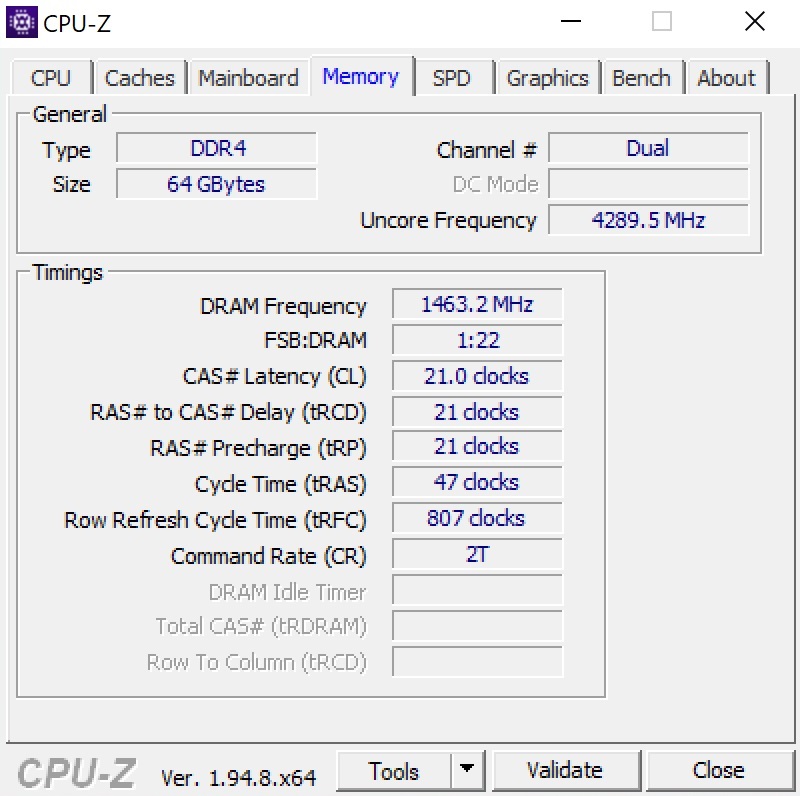
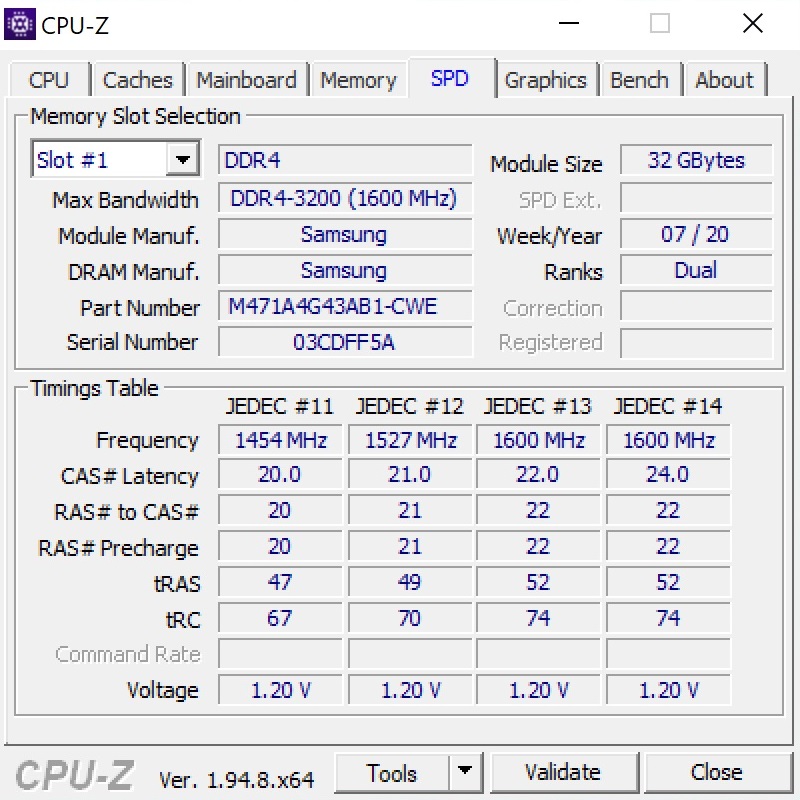
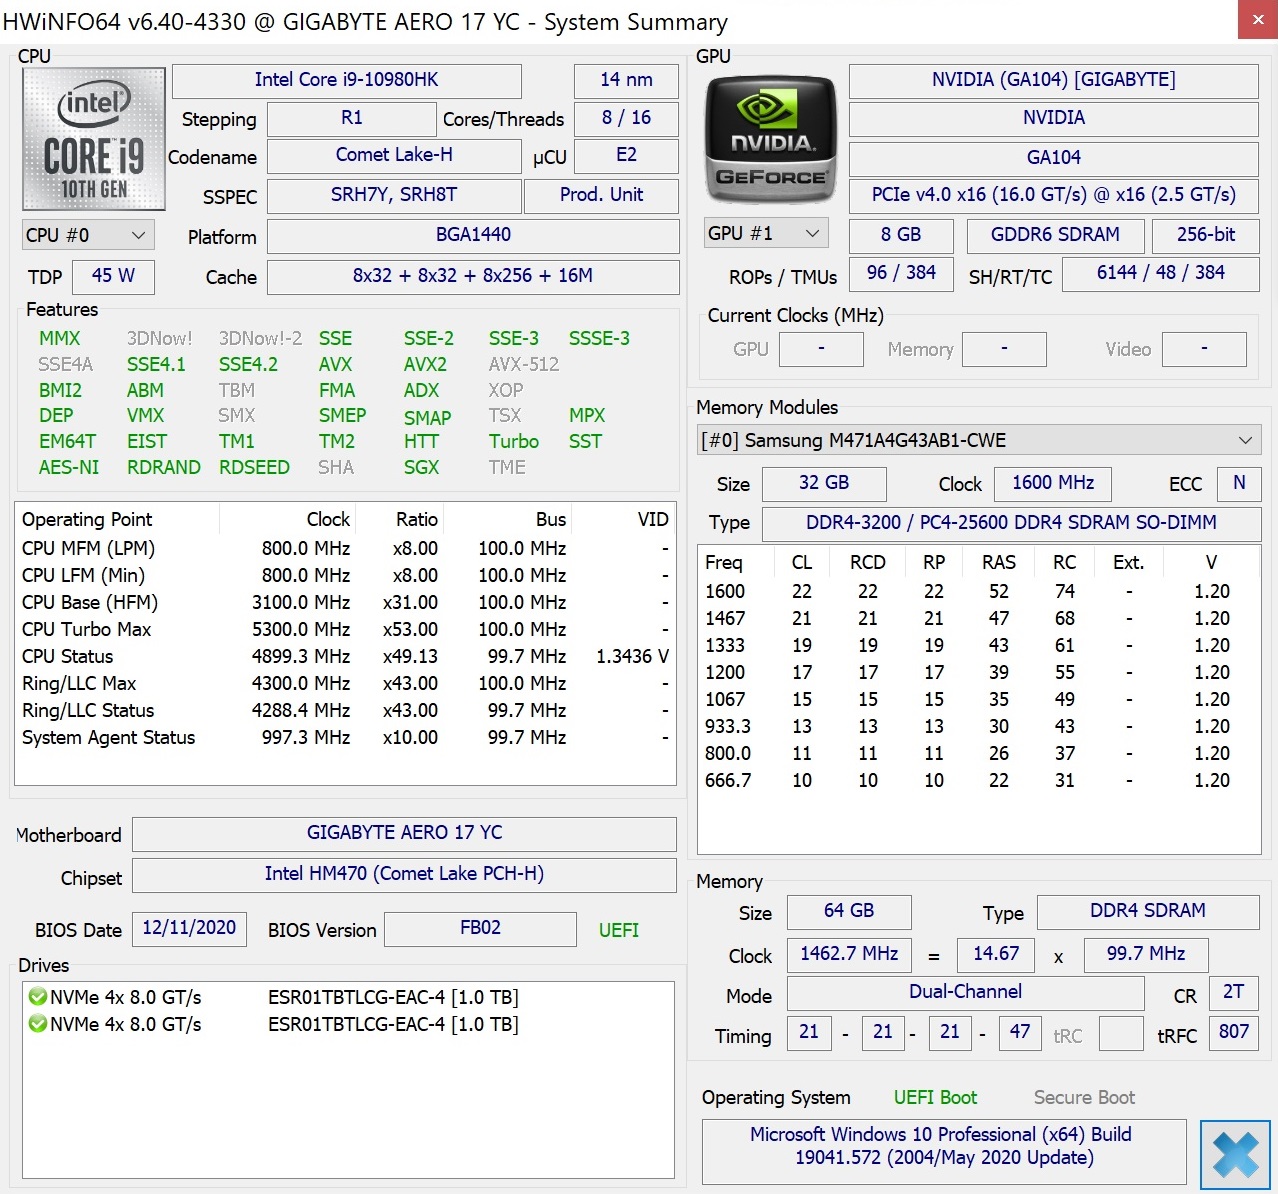
Both editions share a matte 4K display with HDR support that is supposed to cover 100% of the AdobeRGB color space (more on that in a bit). We have no precise information on the size of the storage device or RAM. Our test unit was equipped with two 1-TB SSDs and a total of 64 GB of RAM (2x 32-GB DDR4-3200). The device is available at a starting price of $3.700.
The Aero 17 HDR's competition includes other slim 17-inch notebooks with high-end GPUs such as the Asus Zephyrus S17 GX701LXS, the MSI Creator 17 A10SGS (both featuring the 2080 Super Max-Q) and the Aorus 17G XB (2070 Super Max-Q). These notebooks will appear as comparison devices in our tables.
Possible competitors in comparison
Rating | Date | Model | Weight | Height | Size | Resolution | Price |
|---|---|---|---|---|---|---|---|
| 87.6 % v7 (old) | 01 / 2021 | Gigabyte Aero 17 HDR YC i9-10980HK, GeForce RTX 3080 Laptop GPU | 2.8 kg | 21.4 mm | 17.30" | 3840x2160 | |
| 82.4 % v7 (old) | 08 / 2020 | Asus Zephyrus S17 GX701LXS i7-10875H, GeForce RTX 2080 Super Max-Q | 2.6 kg | 18.7 mm | 17.30" | 1920x1080 | |
| 82.5 % v7 (old) | 07 / 2020 | MSI Creator 17 A10SGS i7-10875H, GeForce RTX 2080 Super Max-Q | 2.4 kg | 20 mm | 17.30" | 3840x2160 | |
| 86.5 % v7 (old) | 05 / 2020 | Aorus 17G XB i7-10875H, GeForce RTX 2070 Super Max-Q | 2.7 kg | 26 mm | 17.30" | 1920x1080 | |
| 87 % v7 (old) | 04 / 2020 | Gigabyte Aero 17 HDR XB i7-10875H, GeForce RTX 2070 Super Max-Q | 2.7 kg | 21 mm | 17.30" | 3840x2160 |
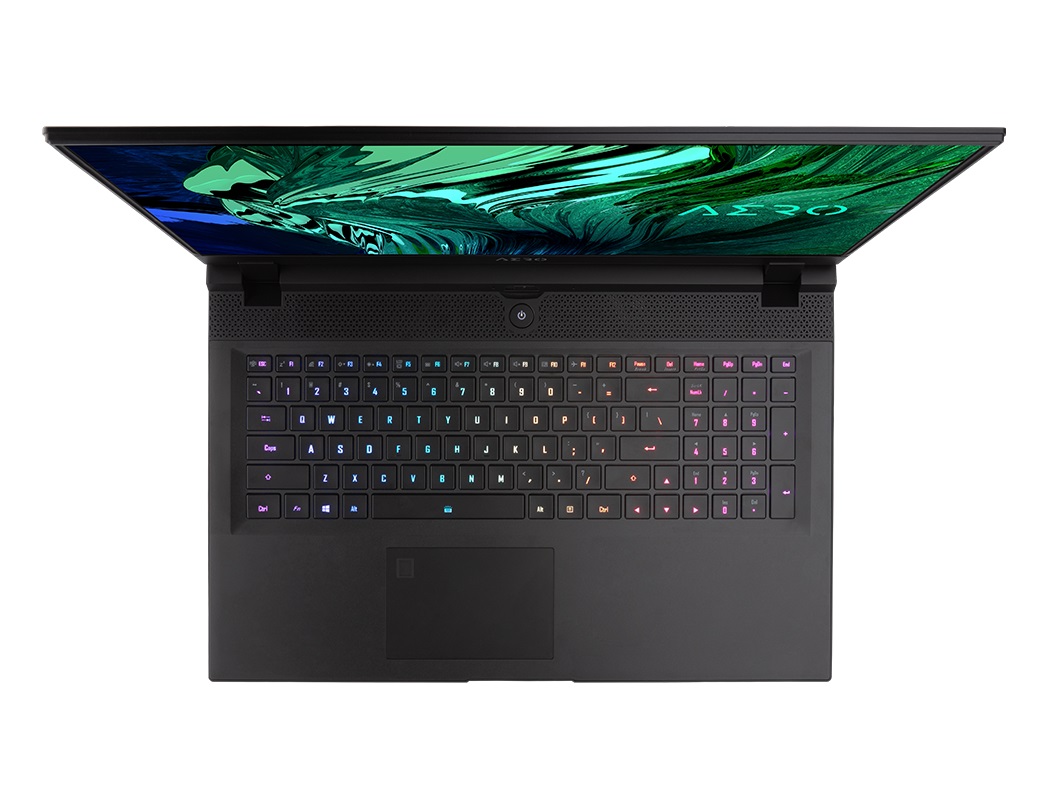
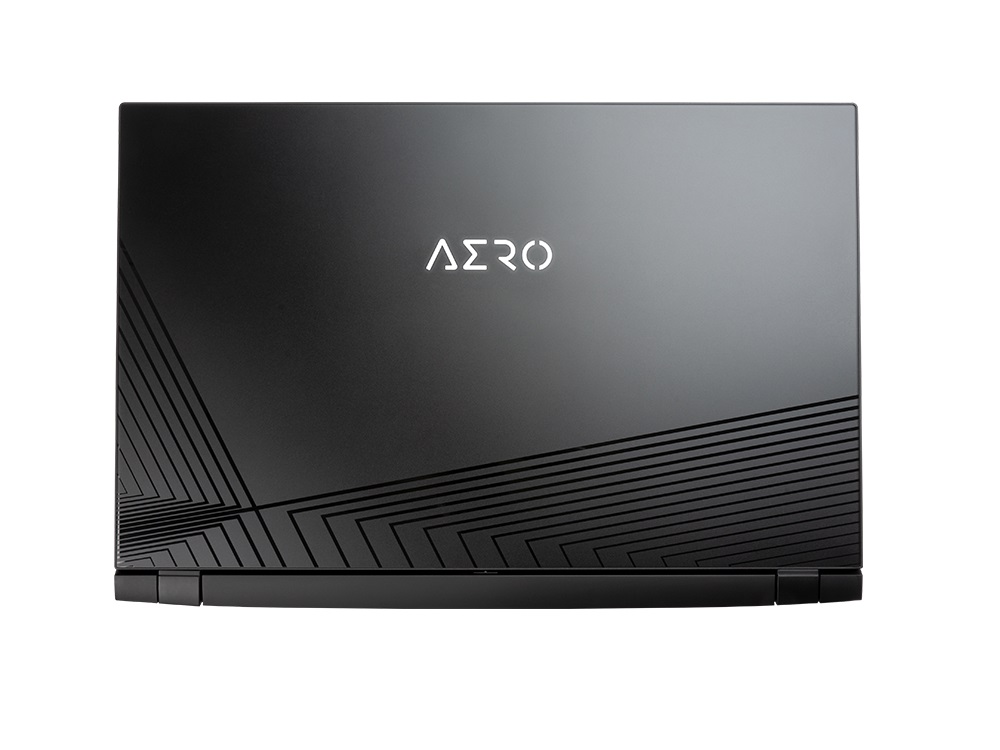
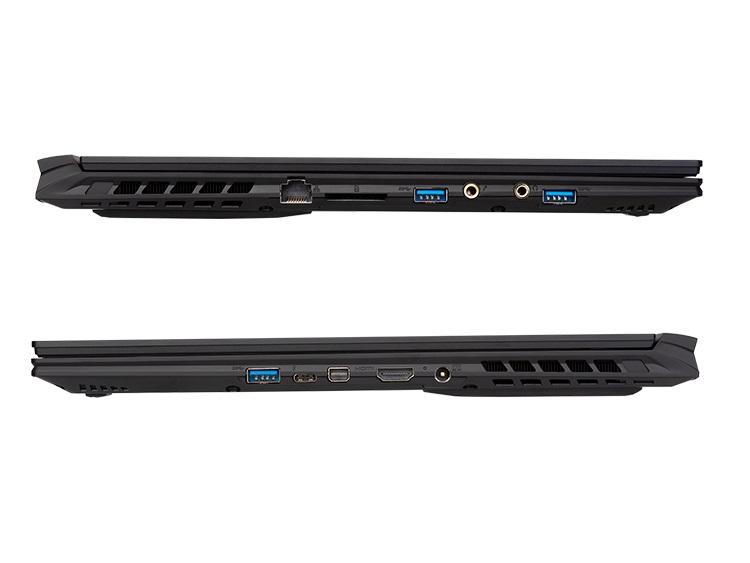
As the case is more or less identical with that of its predecessor we will not be going into detail on this, connectivity or input devices in this review. Please refer to our review of the Aero 17 HDR XA for further information on these aspects. Gigabyte only made minor changes to a few details. For example, the lid now has a new printed pattern. The ports have also been adapted slightly (one of the Type-C ports had to give way for a DisplayPort).
SDCardreader
| SD Card Reader | |
| average JPG Copy Test (av. of 3 runs) | |
| Aorus 17G XB (Toshiba Exceria Pro SDXC 64 GB UHS-II) | |
| Gigabyte Aero 17 HDR XB (Toshiba Exceria Pro SDXC 64 GB UHS-II) | |
| Gigabyte Aero 17 HDR YC (Toshiba Exceria Pro SDXC 64 GB UHS-II) | |
| Average of class Gaming (20.9 - 210, n=53, last 2 years) | |
| maximum AS SSD Seq Read Test (1GB) | |
| Aorus 17G XB (Toshiba Exceria Pro SDXC 64 GB UHS-II) | |
| Gigabyte Aero 17 HDR XB (Toshiba Exceria Pro SDXC 64 GB UHS-II) | |
| Gigabyte Aero 17 HDR YC (Toshiba Exceria Pro SDXC 64 GB UHS-II) | |
| Average of class Gaming (25.5 - 261, n=50, last 2 years) | |
Communication
Webcam


Display
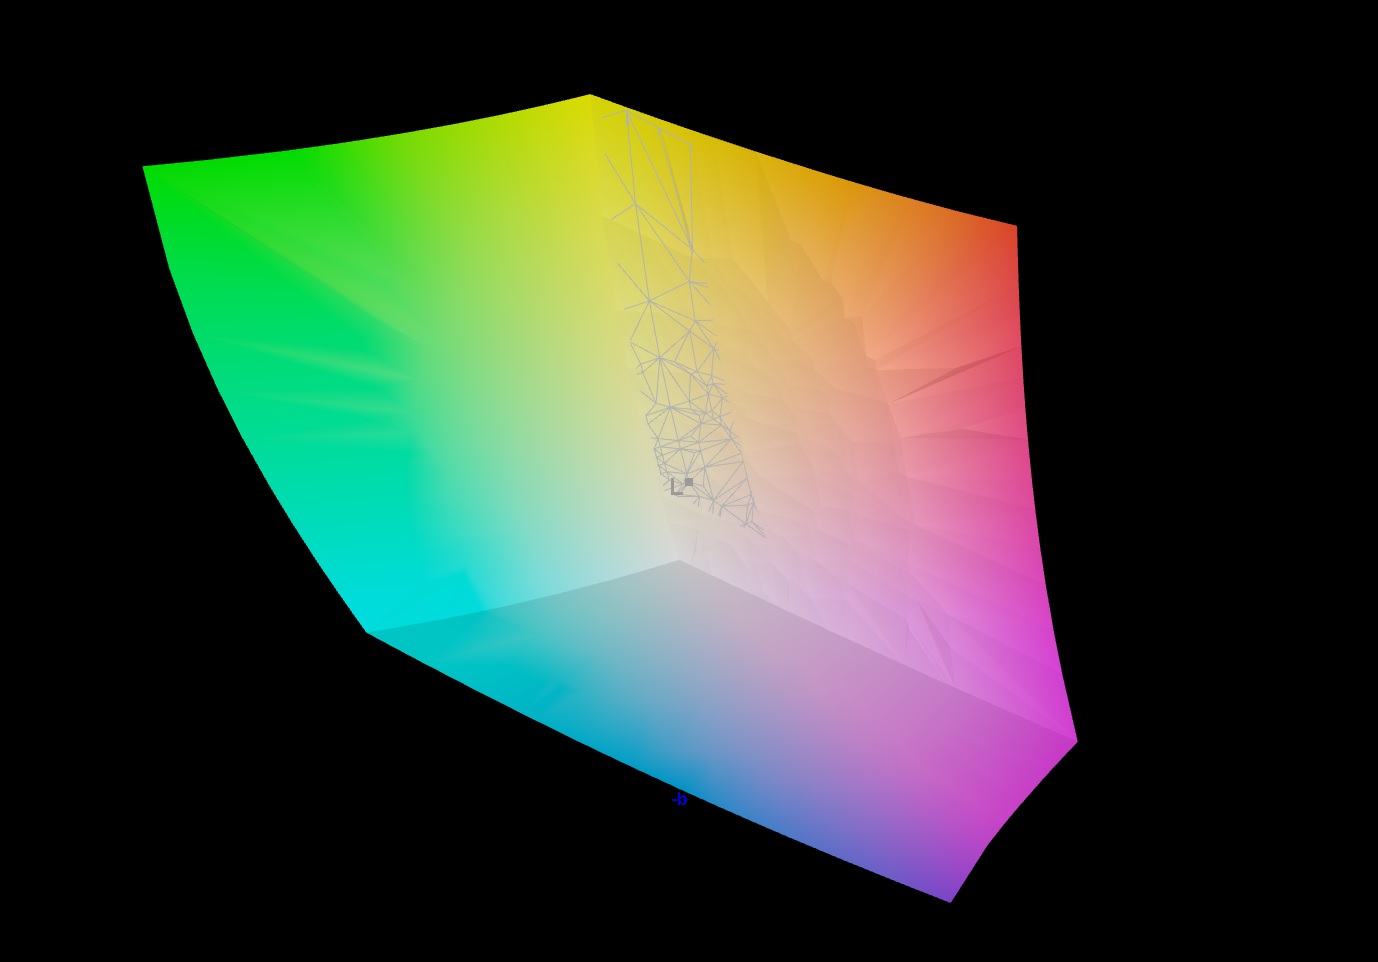
One absolute highlight of the Aero 17 HDR is its outstanding display. If you ignore the meagre response time (over 50 ms gray to gray) and frequency (60 Hz), the UHD screen delivers a good to very good performance.
| |||||||||||||||||||||||||
Brightness Distribution: 92 %
Center on Battery: 458 cd/m²
Contrast: 1238:1 (Black: 0.37 cd/m²)
ΔE ColorChecker Calman: 1.52 | ∀{0.5-29.43 Ø4.72}
calibrated: 0.66
ΔE Greyscale Calman: 1.9 | ∀{0.09-98 Ø4.97}
100% sRGB (Argyll 1.6.3 3D)
100% AdobeRGB 1998 (Argyll 1.6.3 3D)
99.9% AdobeRGB 1998 (Argyll 3D)
100% sRGB (Argyll 3D)
87.3% Display P3 (Argyll 3D)
Gamma: 2.145
CCT: 6534 K
| Gigabyte Aero 17 HDR YC AUO B173ZAN03.2 (AUO329B), IPS-Level, 3840x2160, 17.3" | Asus Zephyrus S17 GX701LXS Sharp SHP14DC, IPS, 1920x1080, 17.3" | MSI Creator 17 A10SGS B173ZAN05.0 (AUO278E), Mini-LED IPS-Level, 3840x2160, 17.3" | Aorus 17G XB AU Optronics B173HAN05.0 (AUO509D), IPS, 1920x1080, 17.3" | Gigabyte Aero 17 HDR XB AUO B173ZAN03.2 (AUO329B), IPS, 3840x2160, 17.3" | |
|---|---|---|---|---|---|
| Display | -14% | -8% | -16% | -0% | |
| Display P3 Coverage (%) | 87.3 | 73.6 -16% | 82 -6% | 70.6 -19% | 86.5 -1% |
| sRGB Coverage (%) | 100 | 99.7 0% | 97.5 -2% | 97.2 -3% | 100 0% |
| AdobeRGB 1998 Coverage (%) | 99.9 | 73.7 -26% | 84 -16% | 72.8 -27% | 100 0% |
| Response Times | 79% | 65% | 61% | -6% | |
| Response Time Grey 50% / Grey 80% * (ms) | 51.6 ? | 5 ? 90% | 16 ? 69% | 55.2 ? -7% | |
| Response Time Black / White * (ms) | 24.8 ? | 8 ? 68% | 8.8 ? 65% | 12 ? 52% | 26 ? -5% |
| PWM Frequency (Hz) | 26600 ? | ||||
| Screen | -23% | -48% | -7% | 7% | |
| Brightness middle (cd/m²) | 458 | 308 -33% | 996 117% | 293 -36% | 487 6% |
| Brightness (cd/m²) | 446 | 310 -30% | 952 113% | 285 -36% | 475 7% |
| Brightness Distribution (%) | 92 | 76 -17% | 93 1% | 95 3% | 95 3% |
| Black Level * (cd/m²) | 0.37 | 0.34 8% | 0.68 -84% | 0.24 35% | 0.38 -3% |
| Contrast (:1) | 1238 | 906 -27% | 1465 18% | 1221 -1% | 1282 4% |
| Colorchecker dE 2000 * | 1.52 | 1.49 2% | 4.21 -177% | 1.27 16% | 1.19 22% |
| Colorchecker dE 2000 max. * | 2.51 | 3.97 -58% | 6.79 -171% | 2.24 11% | 2.43 3% |
| Colorchecker dE 2000 calibrated * | 0.66 | 0.99 -50% | 2.03 -208% | 1.06 -61% | 0.5 24% |
| Greyscale dE 2000 * | 1.9 | 2.3 -21% | 4.1 -116% | 1.34 29% | 1.45 24% |
| Gamma | 2.145 103% | 2.193 100% | 2.207 100% | 2.38 92% | 2.21 100% |
| CCT | 6534 99% | 6981 93% | 7491 87% | 6542 99% | 6557 99% |
| Color Space (Percent of AdobeRGB 1998) (%) | 100 | 74 -26% | 84 -16% | 73 -27% | 88 -12% |
| Color Space (Percent of sRGB) (%) | 100 | 96 -4% | 97 -3% | 94 -6% | 100 0% |
| Total Average (Program / Settings) | 14% /
-9% | 3% /
-32% | 13% /
-0% | 0% /
4% |
* ... smaller is better
Thanks to its high luminosity of an average of 446 nits, the 17-inch device is not only suitable for use indoors but can also been taken outside. Only few high-end laptops offer this level of brightness. The mini LED panel on the MSI Creator 17 is the only one in our comparison field that offers significantly higher brightness. The Aero 17 HDR also has a good contrast ratio of 1200:1, which should satisfy most buyers. The same goes for the black value of 0.37 nits.

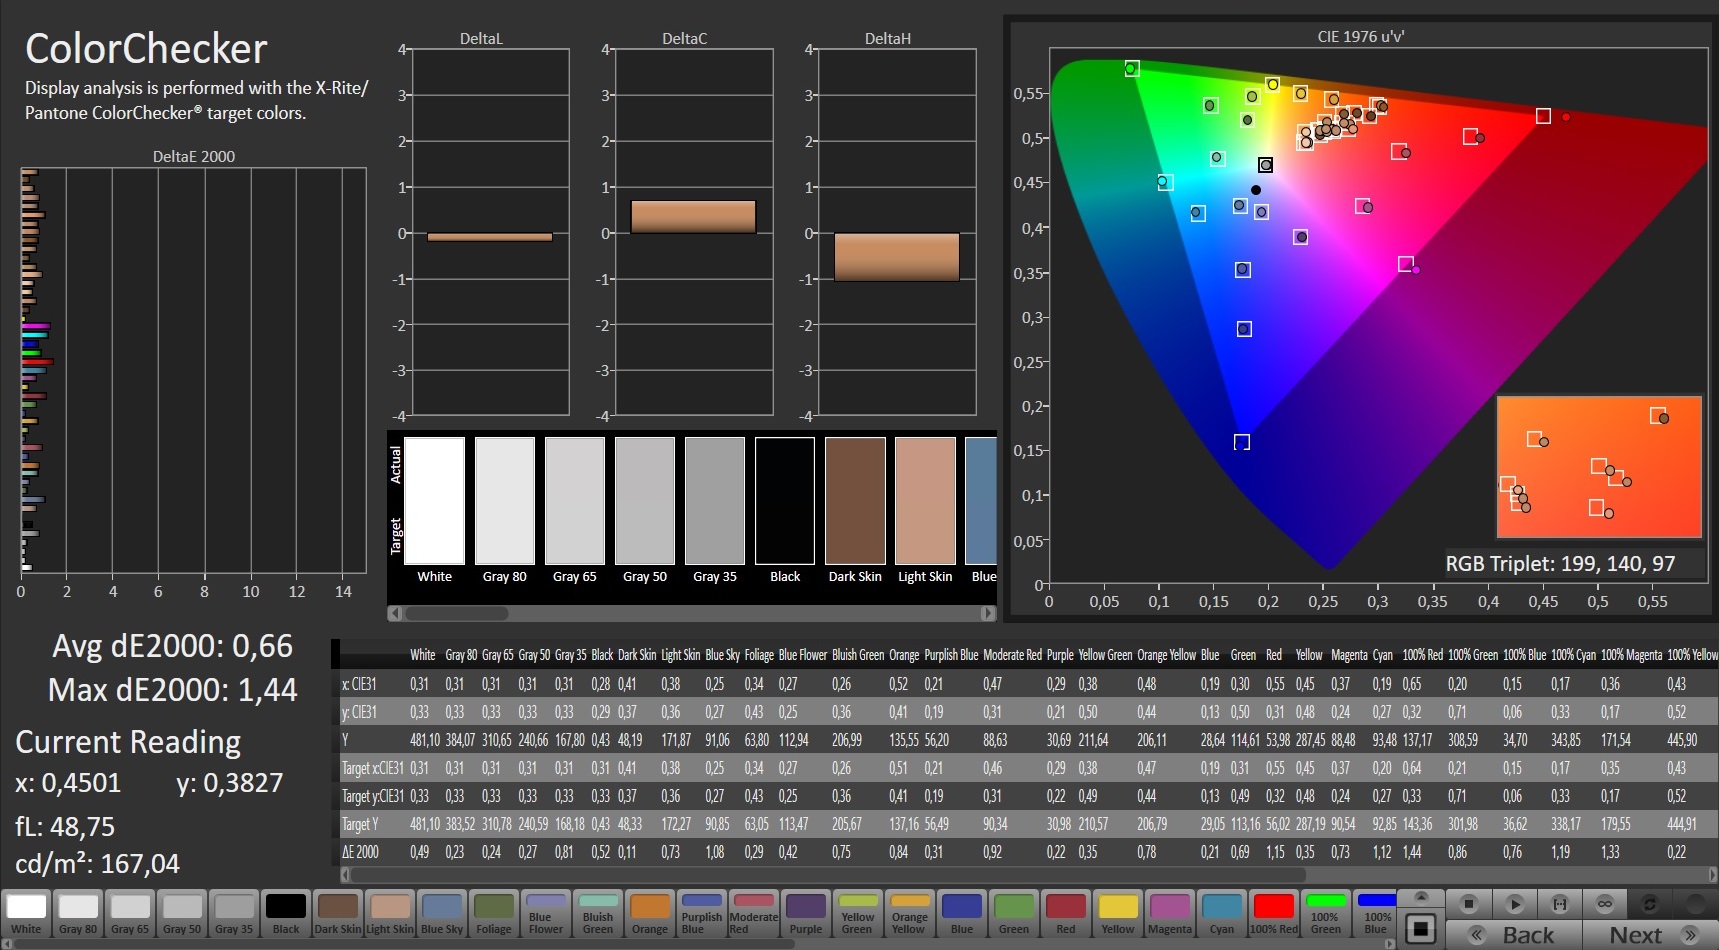
One of the panel's real fortes is its color space. Gigabyte correctly claimed that the 4K screen covers the AdobeRGB color space entirely, which hardly any laptop can do – no matter the category.

The display scores even more points for its color accuracy. The X-Rite Pantone certification means that the panel is very accurate out of the box, which our Calman measurements confirm (see screenshots). The viewing angles are on par with most IPS displays. Note: All display measurements were made while the HDR function was deactivated.
Display Response Times
| ↔ Response Time Black to White | ||
|---|---|---|
| 24.8 ms ... rise ↗ and fall ↘ combined | ↗ 10 ms rise | 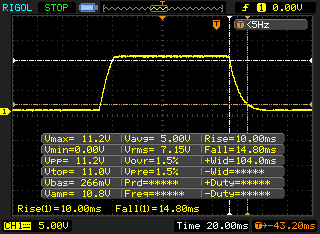 |
| ↘ 14.8 ms fall | ||
| The screen shows good response rates in our tests, but may be too slow for competitive gamers. In comparison, all tested devices range from 0.1 (minimum) to 240 (maximum) ms. » 58 % of all devices are better. This means that the measured response time is worse than the average of all tested devices (19.8 ms). | ||
| ↔ Response Time 50% Grey to 80% Grey | ||
| 51.6 ms ... rise ↗ and fall ↘ combined | ↗ 25.6 ms rise | 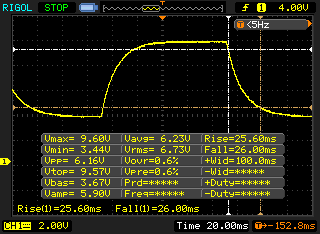 |
| ↘ 26 ms fall | ||
| The screen shows slow response rates in our tests and will be unsatisfactory for gamers. In comparison, all tested devices range from 0.165 (minimum) to 636 (maximum) ms. » 88 % of all devices are better. This means that the measured response time is worse than the average of all tested devices (31 ms). | ||
Screen Flickering / PWM (Pulse-Width Modulation)
| Screen flickering / PWM not detected | 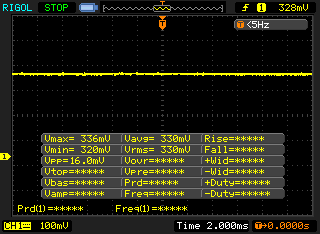 | ||
In comparison: 52 % of all tested devices do not use PWM to dim the display. If PWM was detected, an average of 7763 (minimum: 5 - maximum: 343500) Hz was measured. | |||
Testing conditions
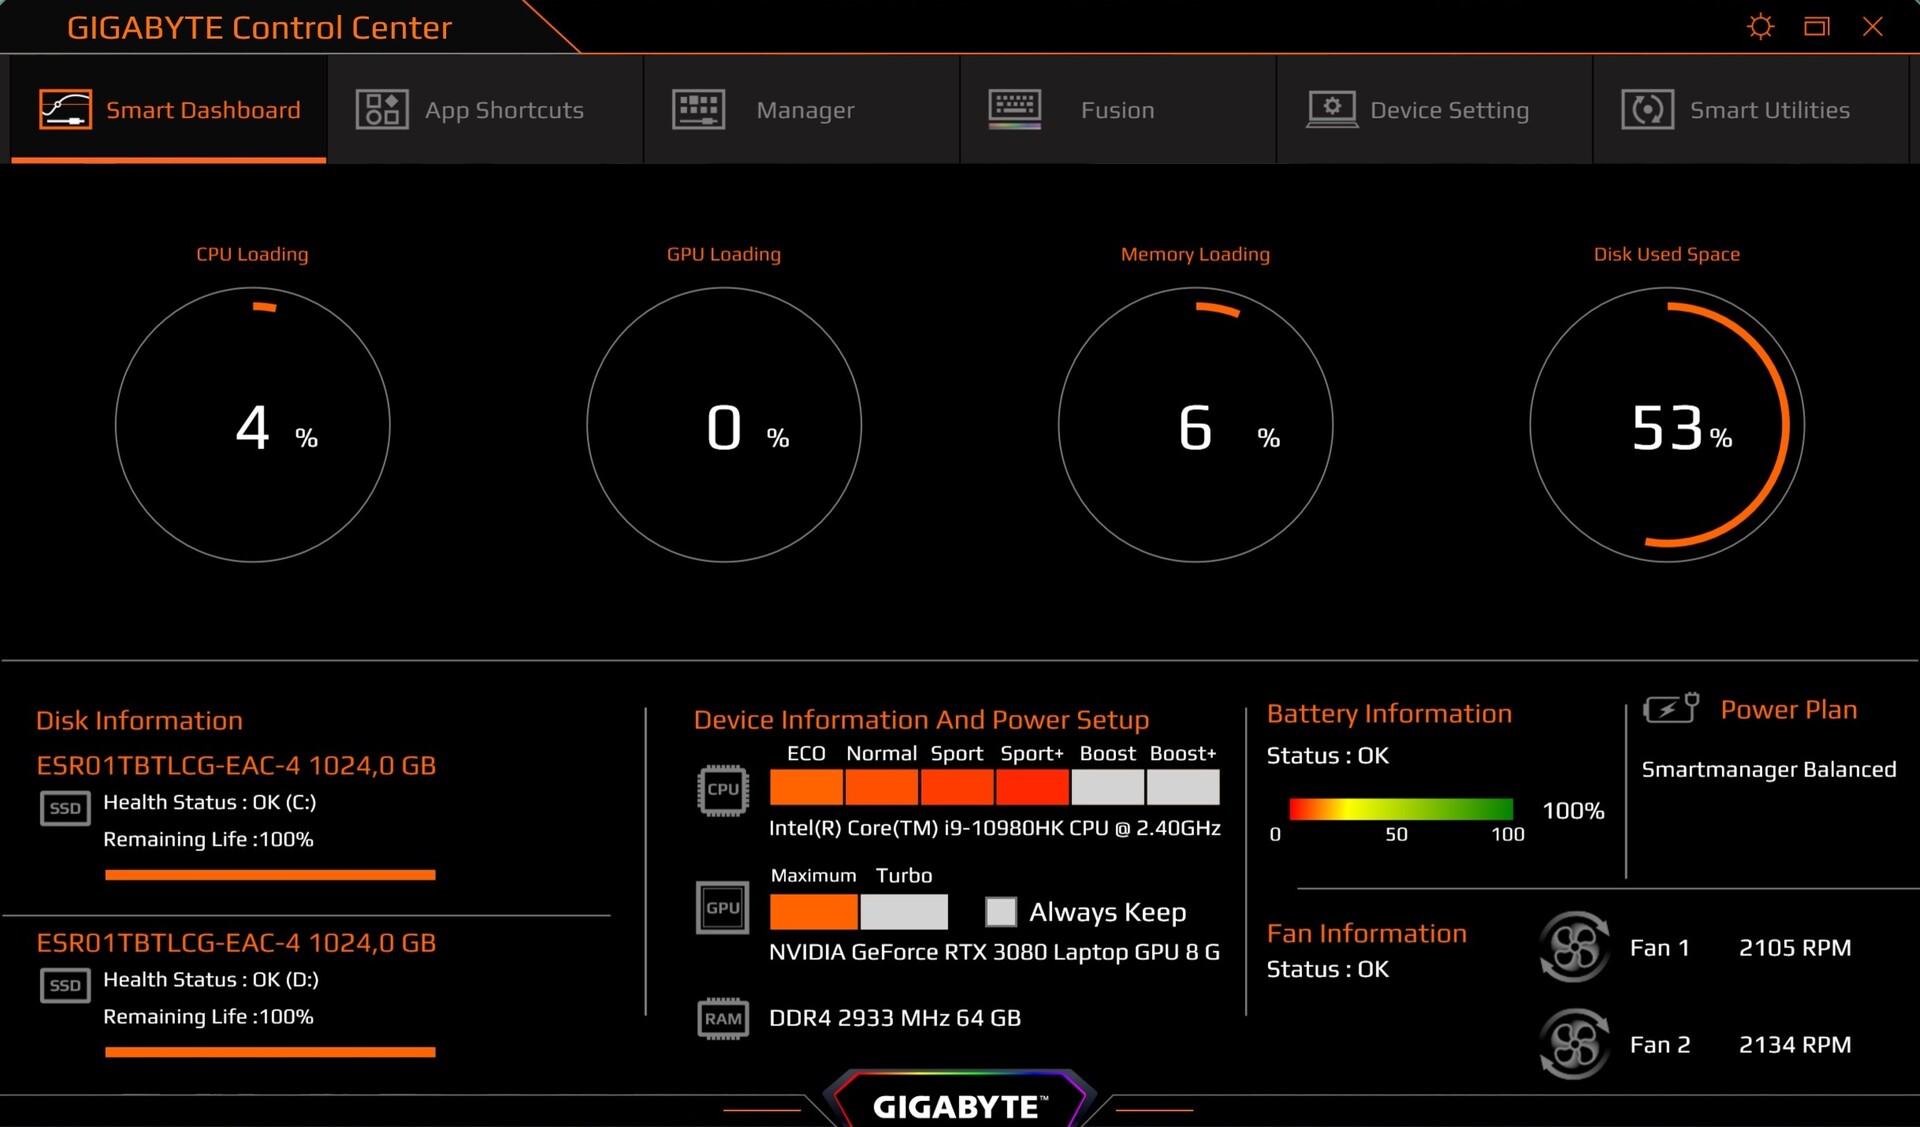
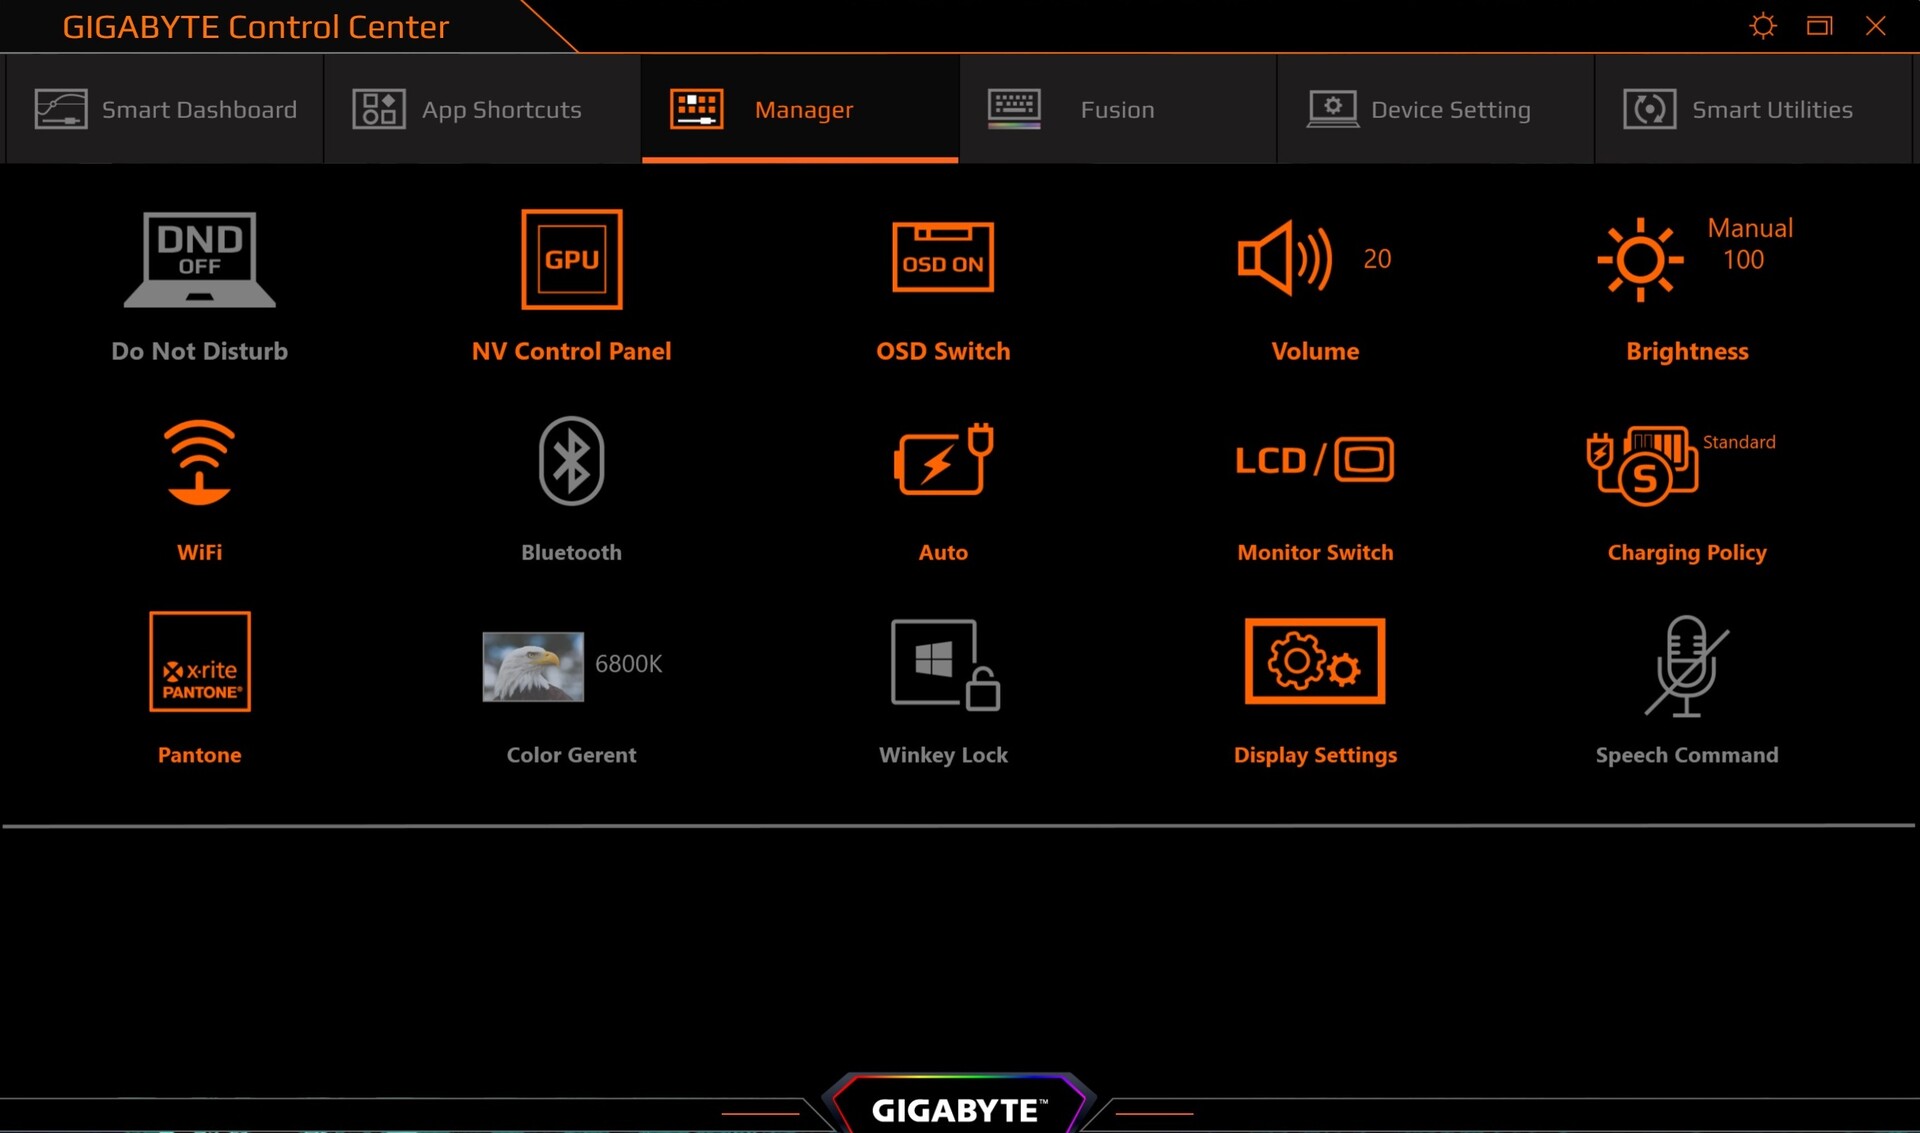
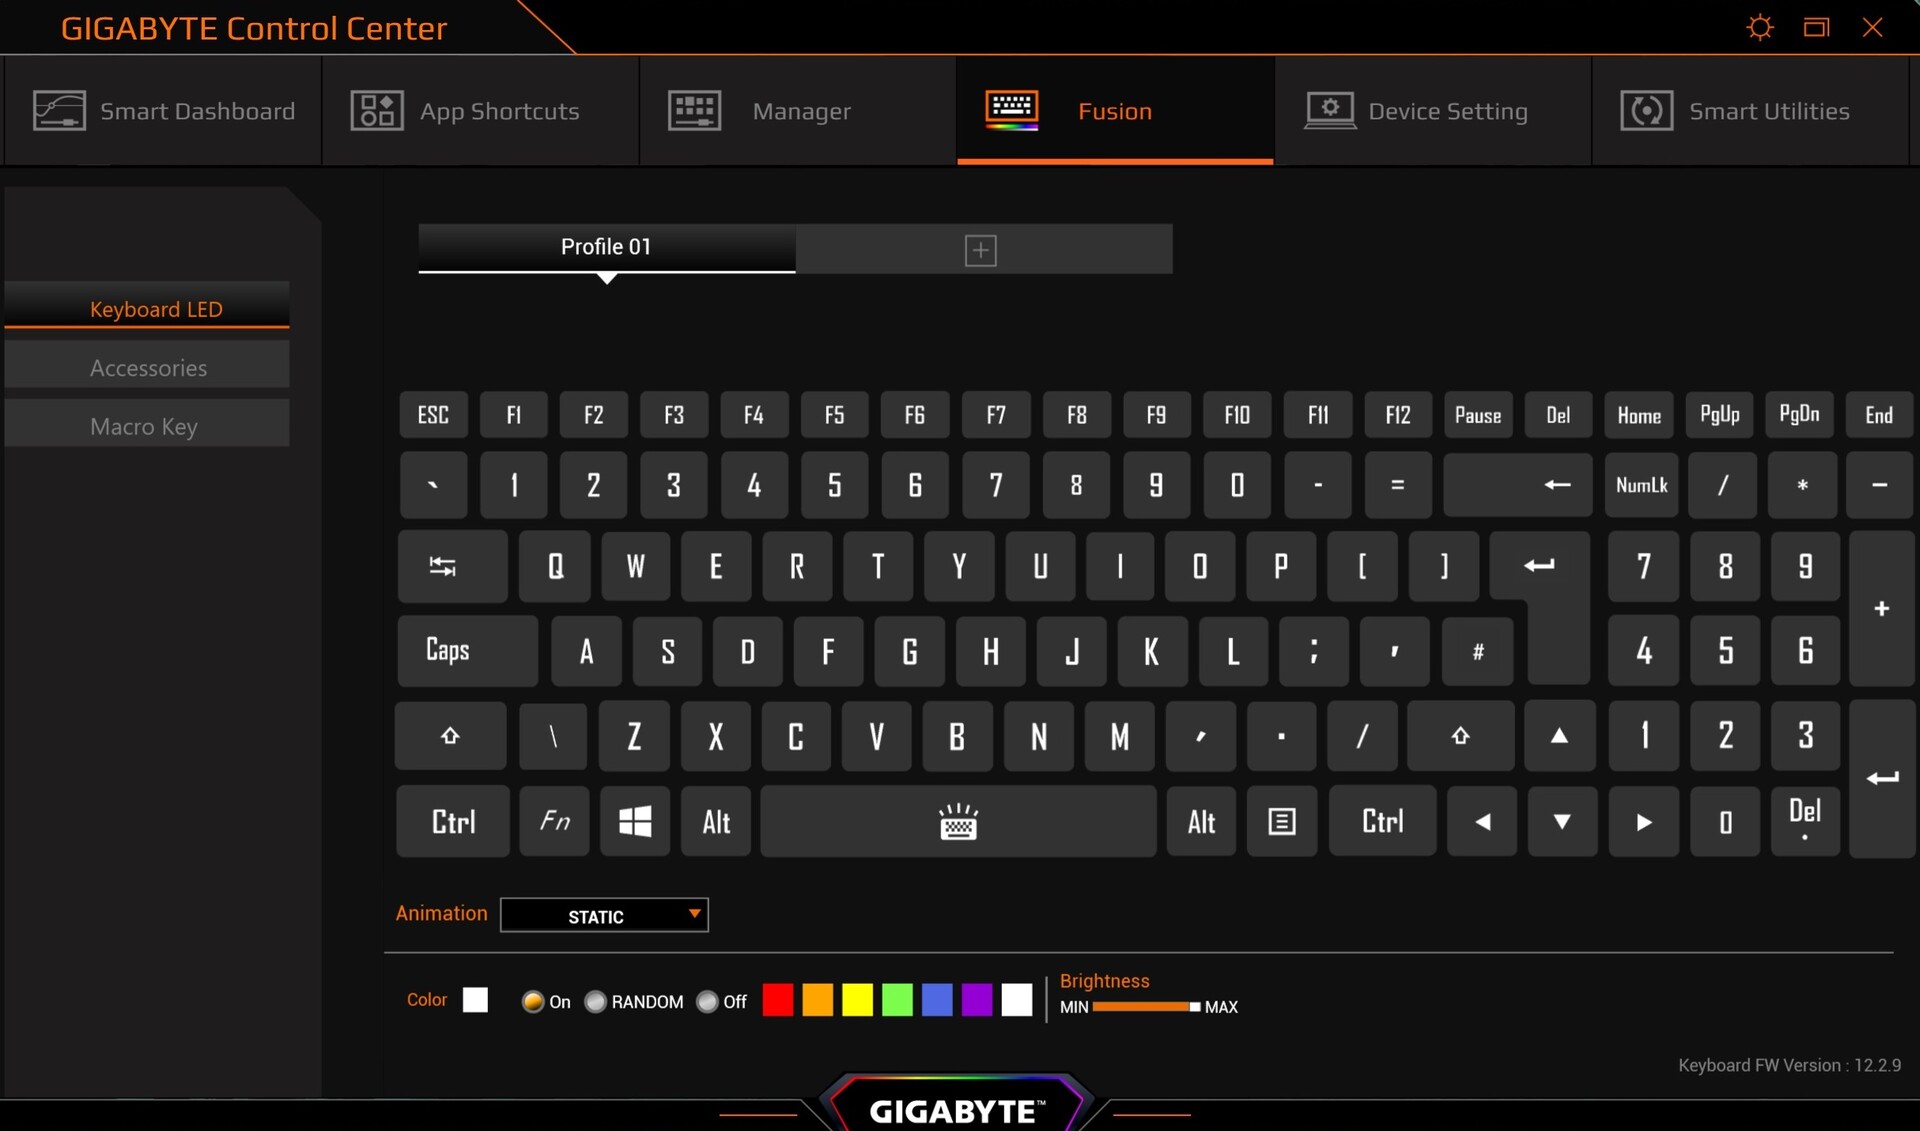
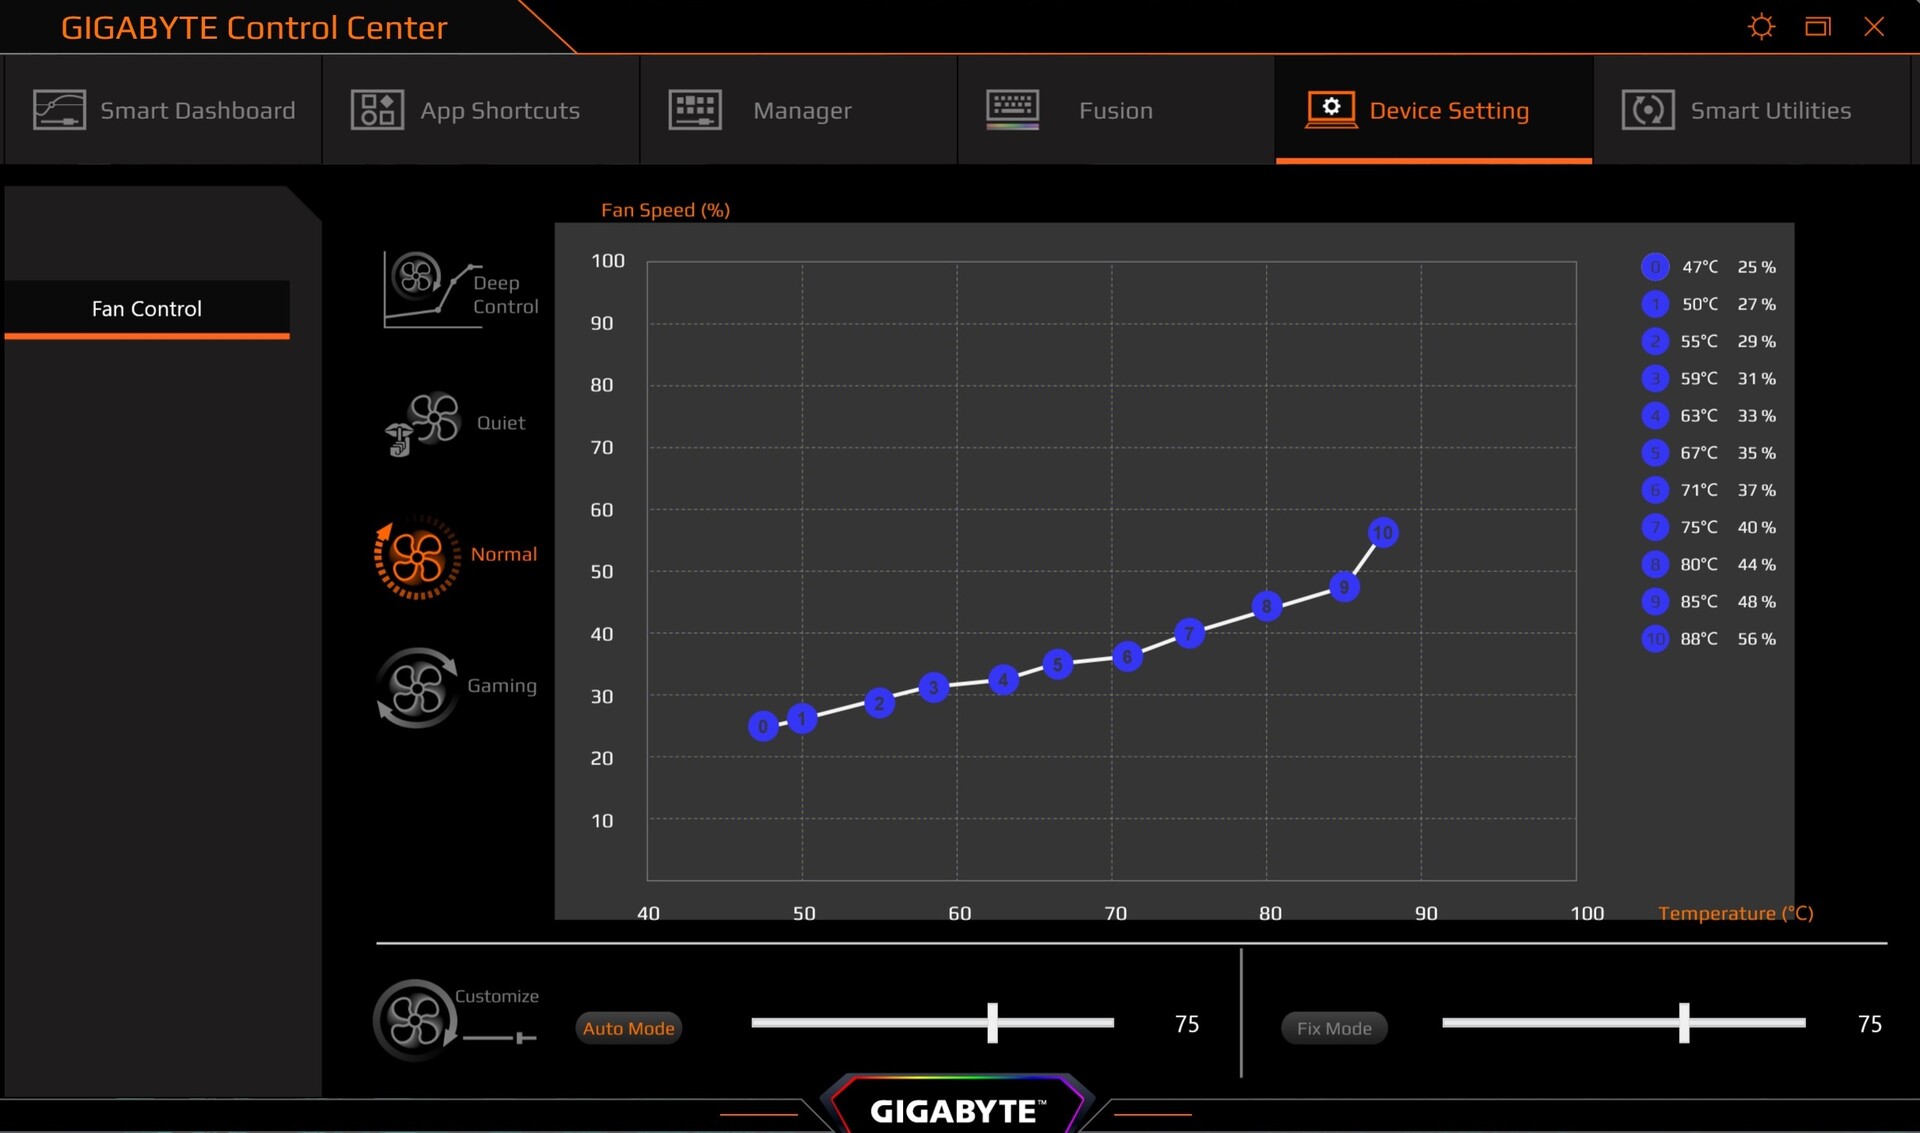
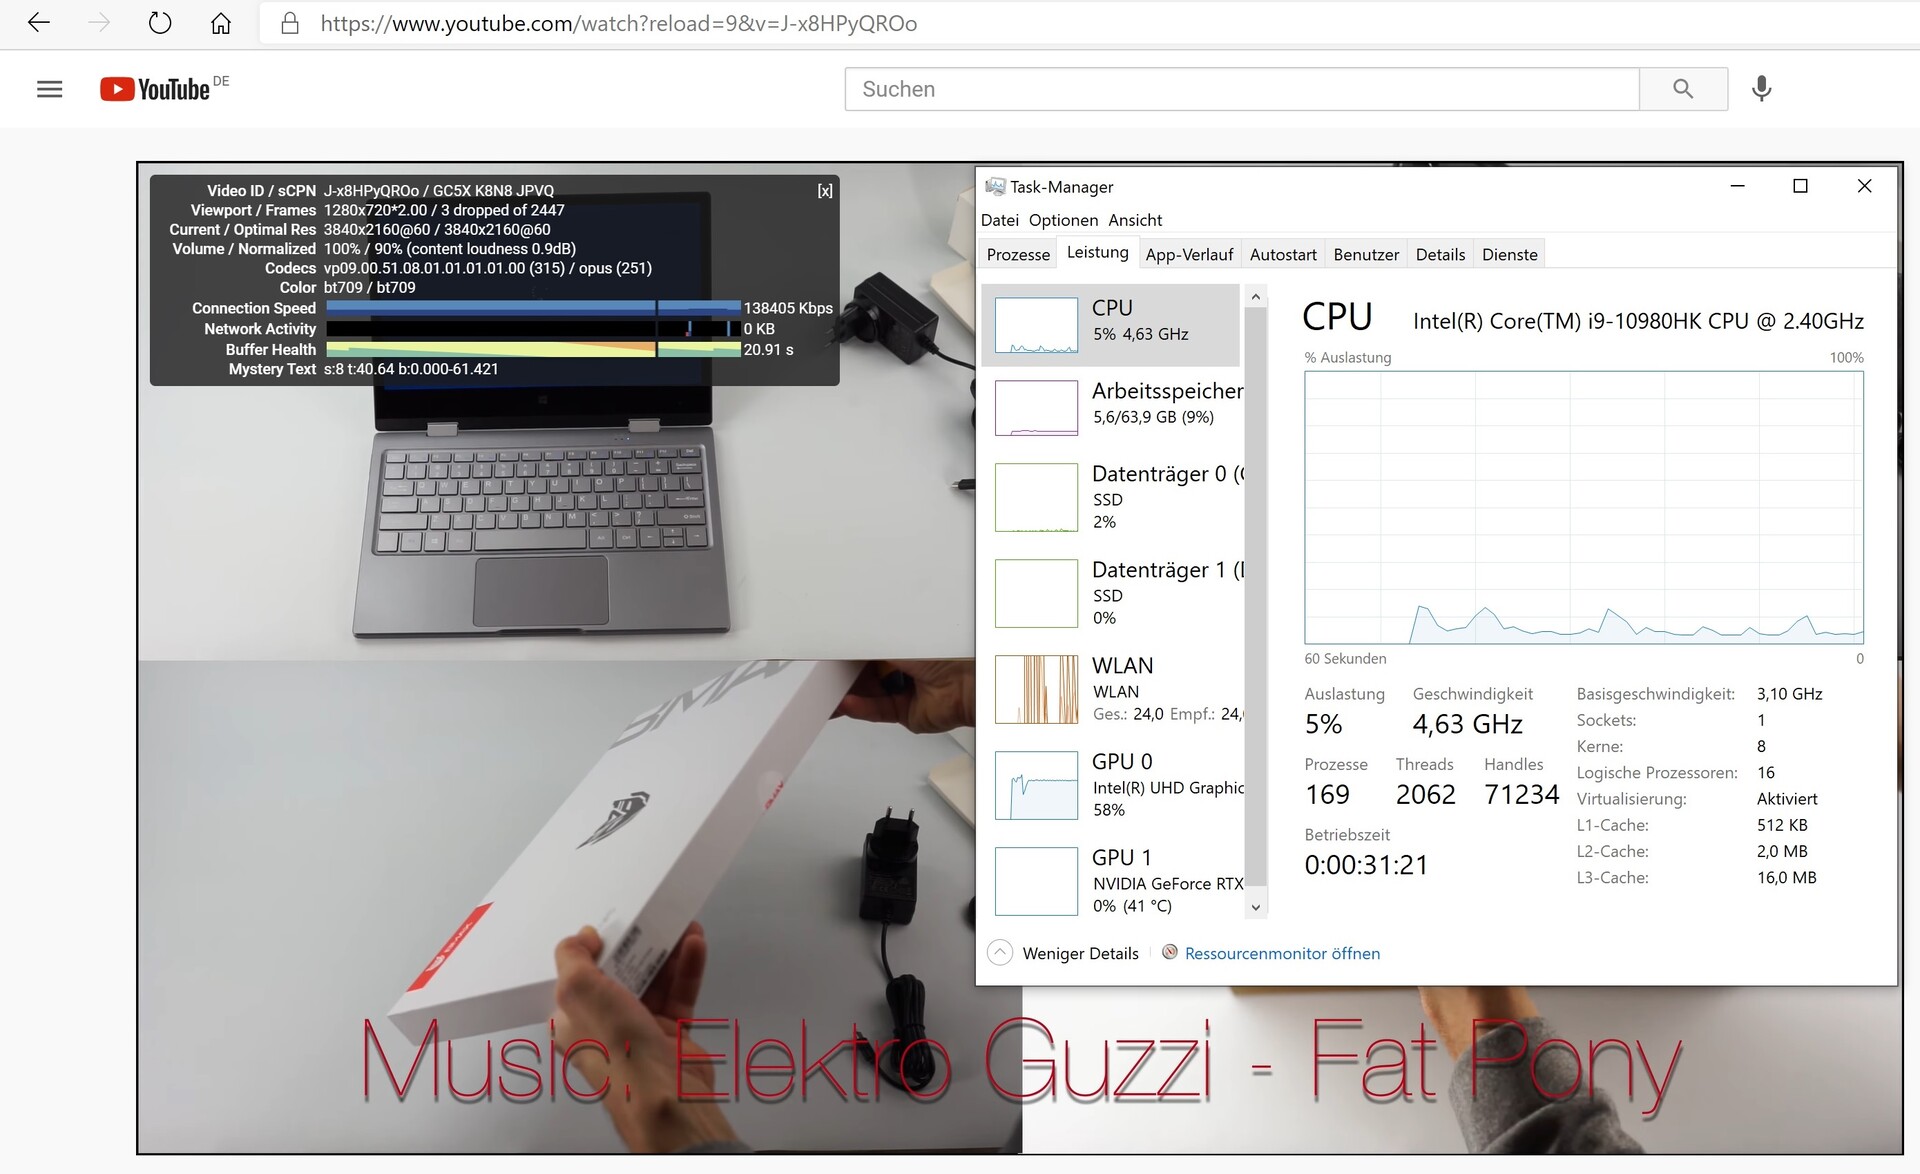
The preinstalled Control Center enables users to customize the system with numerous settings ranging from the keyboard backlighting (per key RGB), to fan settings or performance. Our tests were completed in the "auto" profile which automatically regulates things like energy settings. The fan was set to "normal" during all benchmarks except for the 3D benchmark (where it was set to "gaming").
Performance
The Aero 17 HDR YC's lavish features – for which the manufacturer is charging a handsome sum – mean that the device is very future proof. The 64 GB of DDR4 RAM should suffice for the next few years, the same goes for the 2 TB of storage capacity. In addition, we have an octa-core processor and a GPU that supports ray tracing.
Processor
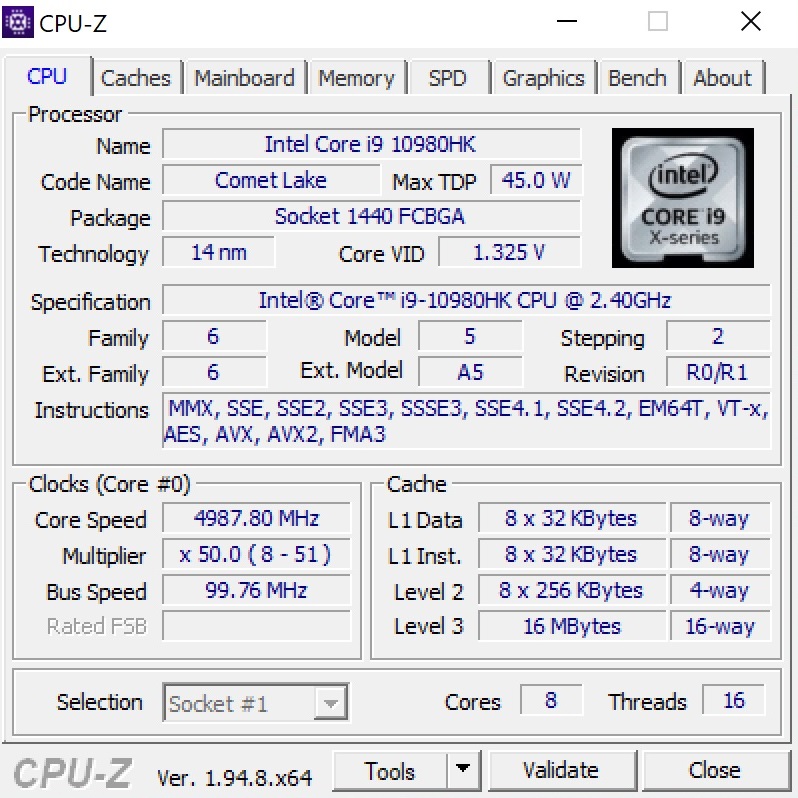
The Core i9-10980HK in our test unit is an octa-core chip from Intel's Comet Lake generation that was manufactured using the old 14-nm process (AMD now manufactures using a 7-nm process). The 45-Watt chip can work up to 16 threads simultaneously thanks to hyperthreading and had a basic clock rate of 2.4 GHz. Its Turbo Boost can increase this to up to 5.3 GHz under load.
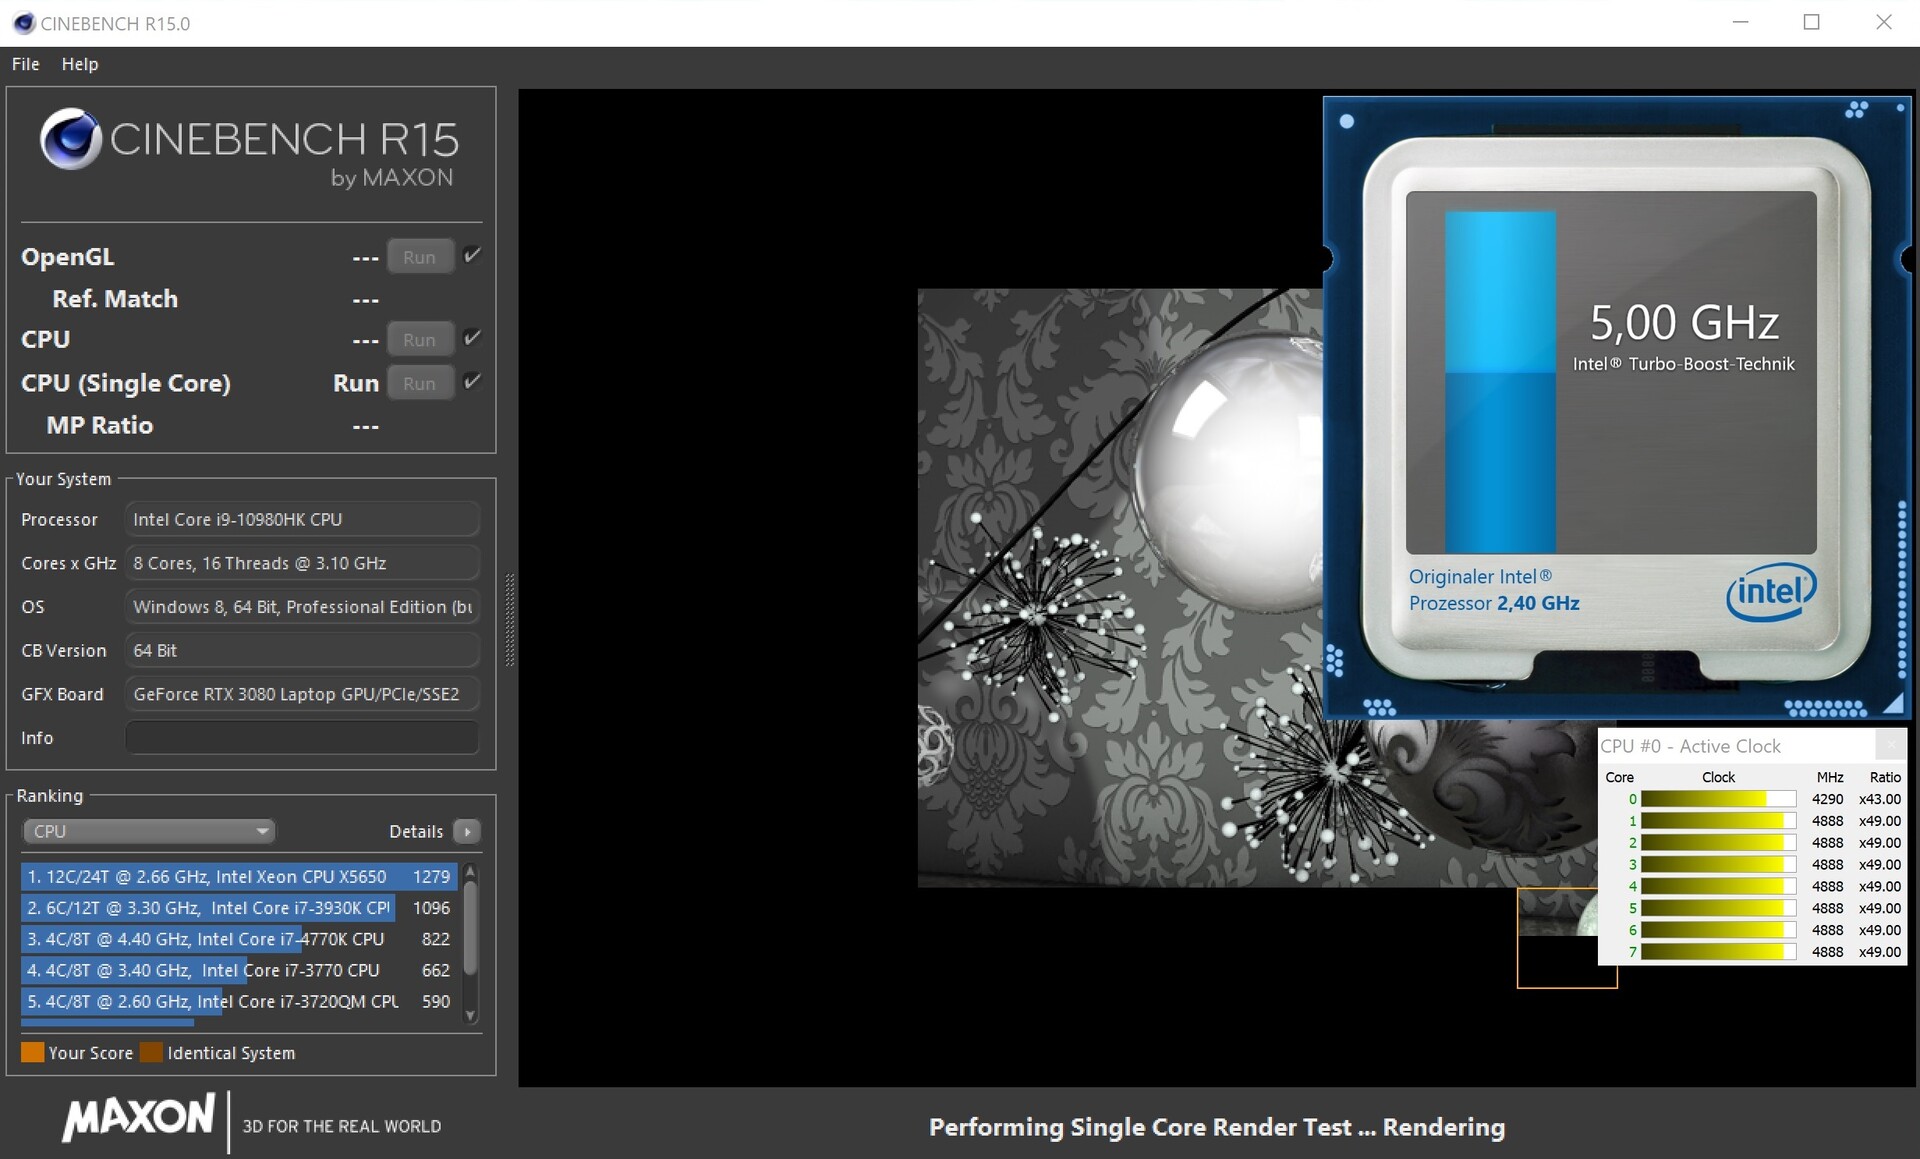
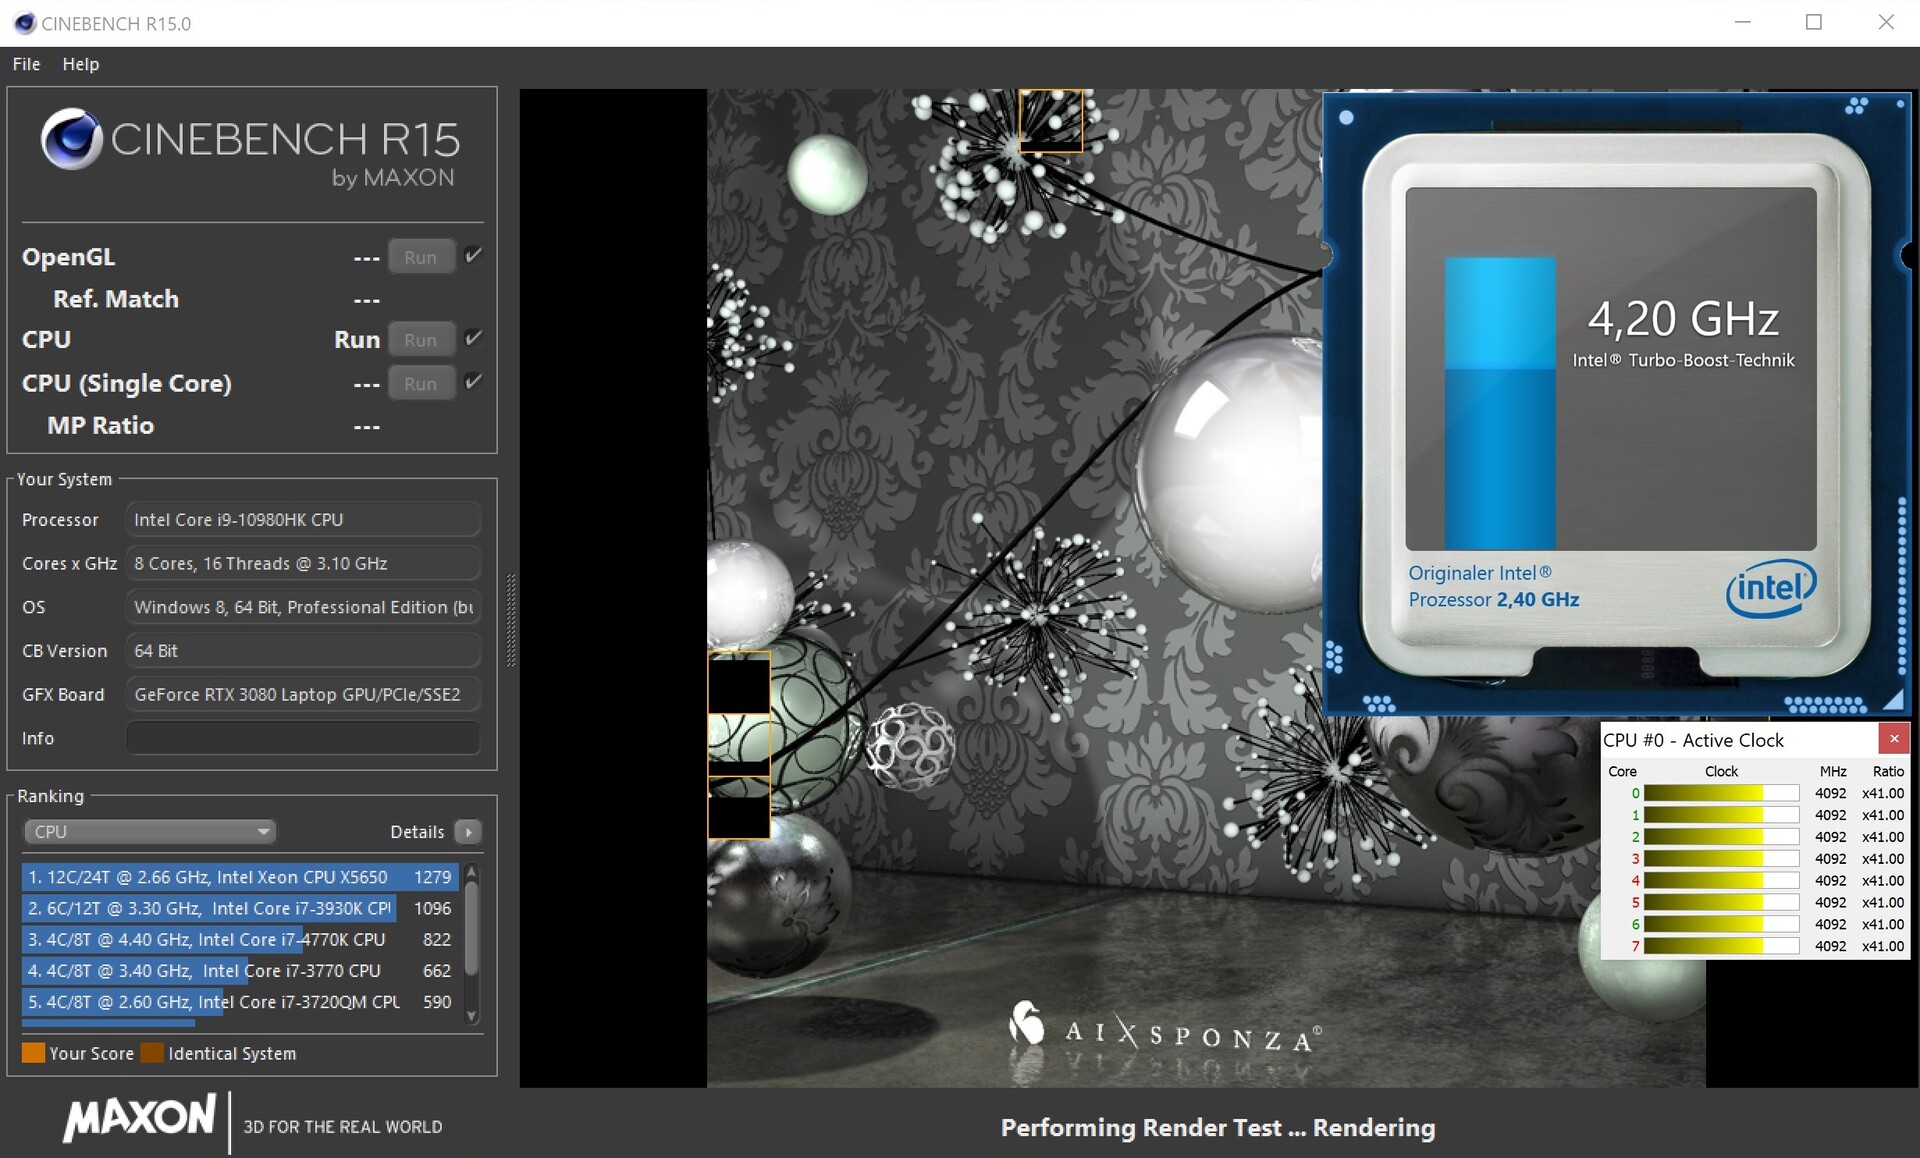
According to Cinebench R15, the CPU of the Aero 17 has a clock rate of 4.3 - 5.0 GHz during single core scenarios and 4.1 - 4.3 GHz when all cores are under load. However, the performance drops significantly after the first round. Starting with the second round of our Cinebench loop, our Core i9-10980HK performs below the level of most 10875H competitors.
Ergo: The surcharge for the expensive processor is not really worth the money. In order to offer a good price-performance ratio, Gigabyte should have either limited its configuration options to the sexta-core models or chosen an AMD CPU instead.
| Blender - v2.79 BMW27 CPU | |
| MSI Creator 17 A10SGS | |
| Gigabyte Aero 17 HDR XB | |
| Gigabyte Aero 17 HDR YC | |
| Aorus 17G XB | |
| Asus Zephyrus S17 GX701LXS | |
| Average of class Gaming (80 - 330, n=106, last 2 years) | |
| HWBOT x265 Benchmark v2.2 - 4k Preset | |
| Average of class Gaming (11.5 - 44.3, n=107, last 2 years) | |
| Aorus 17G XB | |
| Asus Zephyrus S17 GX701LXS | |
| Gigabyte Aero 17 HDR XB | |
| Gigabyte Aero 17 HDR YC | |
| MSI Creator 17 A10SGS | |
| LibreOffice - 20 Documents To PDF | |
| Gigabyte Aero 17 HDR XB | |
| MSI Creator 17 A10SGS | |
| Aorus 17G XB | |
| Gigabyte Aero 17 HDR YC | |
| Average of class Gaming (33.2 - 88.8, n=107, last 2 years) | |
| Asus Zephyrus S17 GX701LXS | |
| R Benchmark 2.5 - Overall mean | |
| Aorus 17G XB | |
| Asus Zephyrus S17 GX701LXS | |
| MSI Creator 17 A10SGS | |
| Gigabyte Aero 17 HDR YC | |
| Gigabyte Aero 17 HDR XB | |
| Average of class Gaming (0.3439 - 0.759, n=108, last 2 years) | |
* ... smaller is better
System Performance
It is not surprising that the Aero 17 HDR YC offers great system performance. The PCMark 10 result of 6512 points indicate very potent hardware. The system also feels very fast subjectively - as you would expect from a high-end notebook.
| PCMark 10 Score | 6512 points | |
Help | ||
DPC latencies
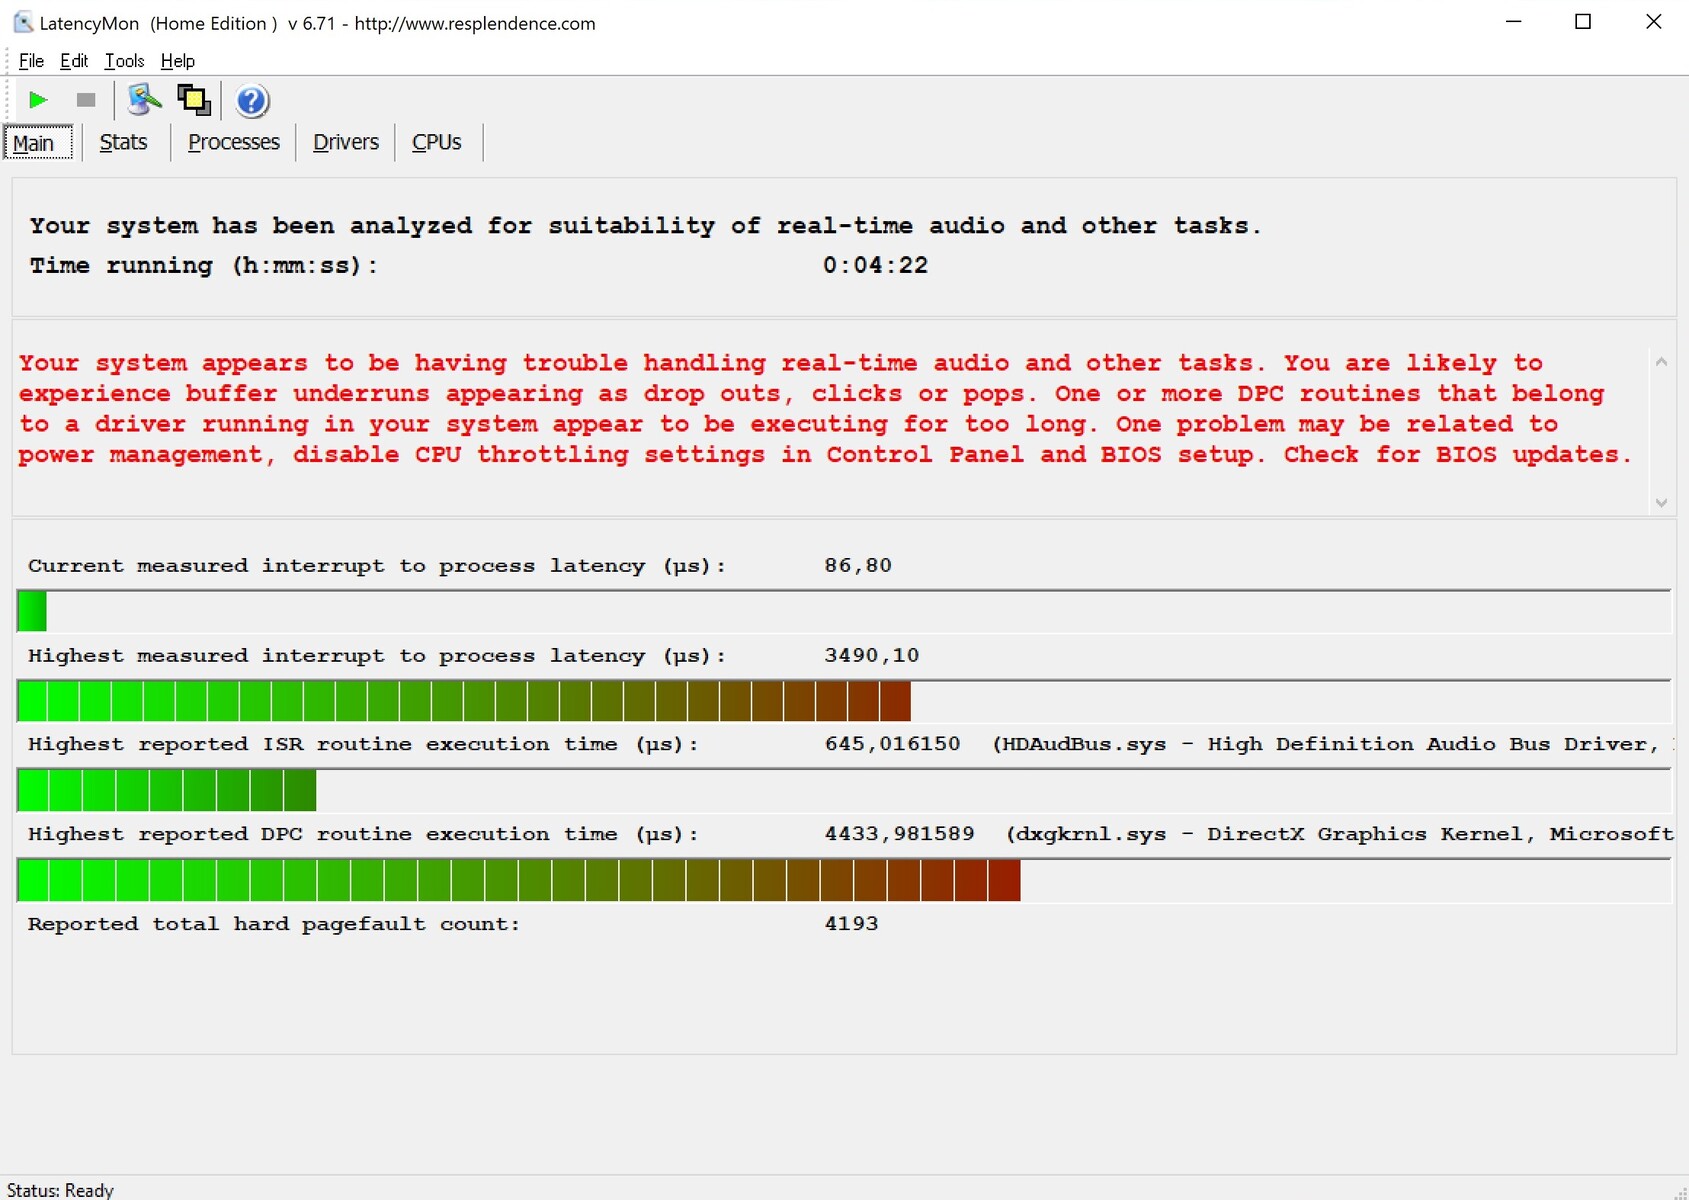
Gigabyte could have made some improvements in terms of latencies. The LatencyMon tool measures fairly high values in our latency test (surfing the web, streaming video, Prime 95) and categorizes certain real-time applications as "critical".
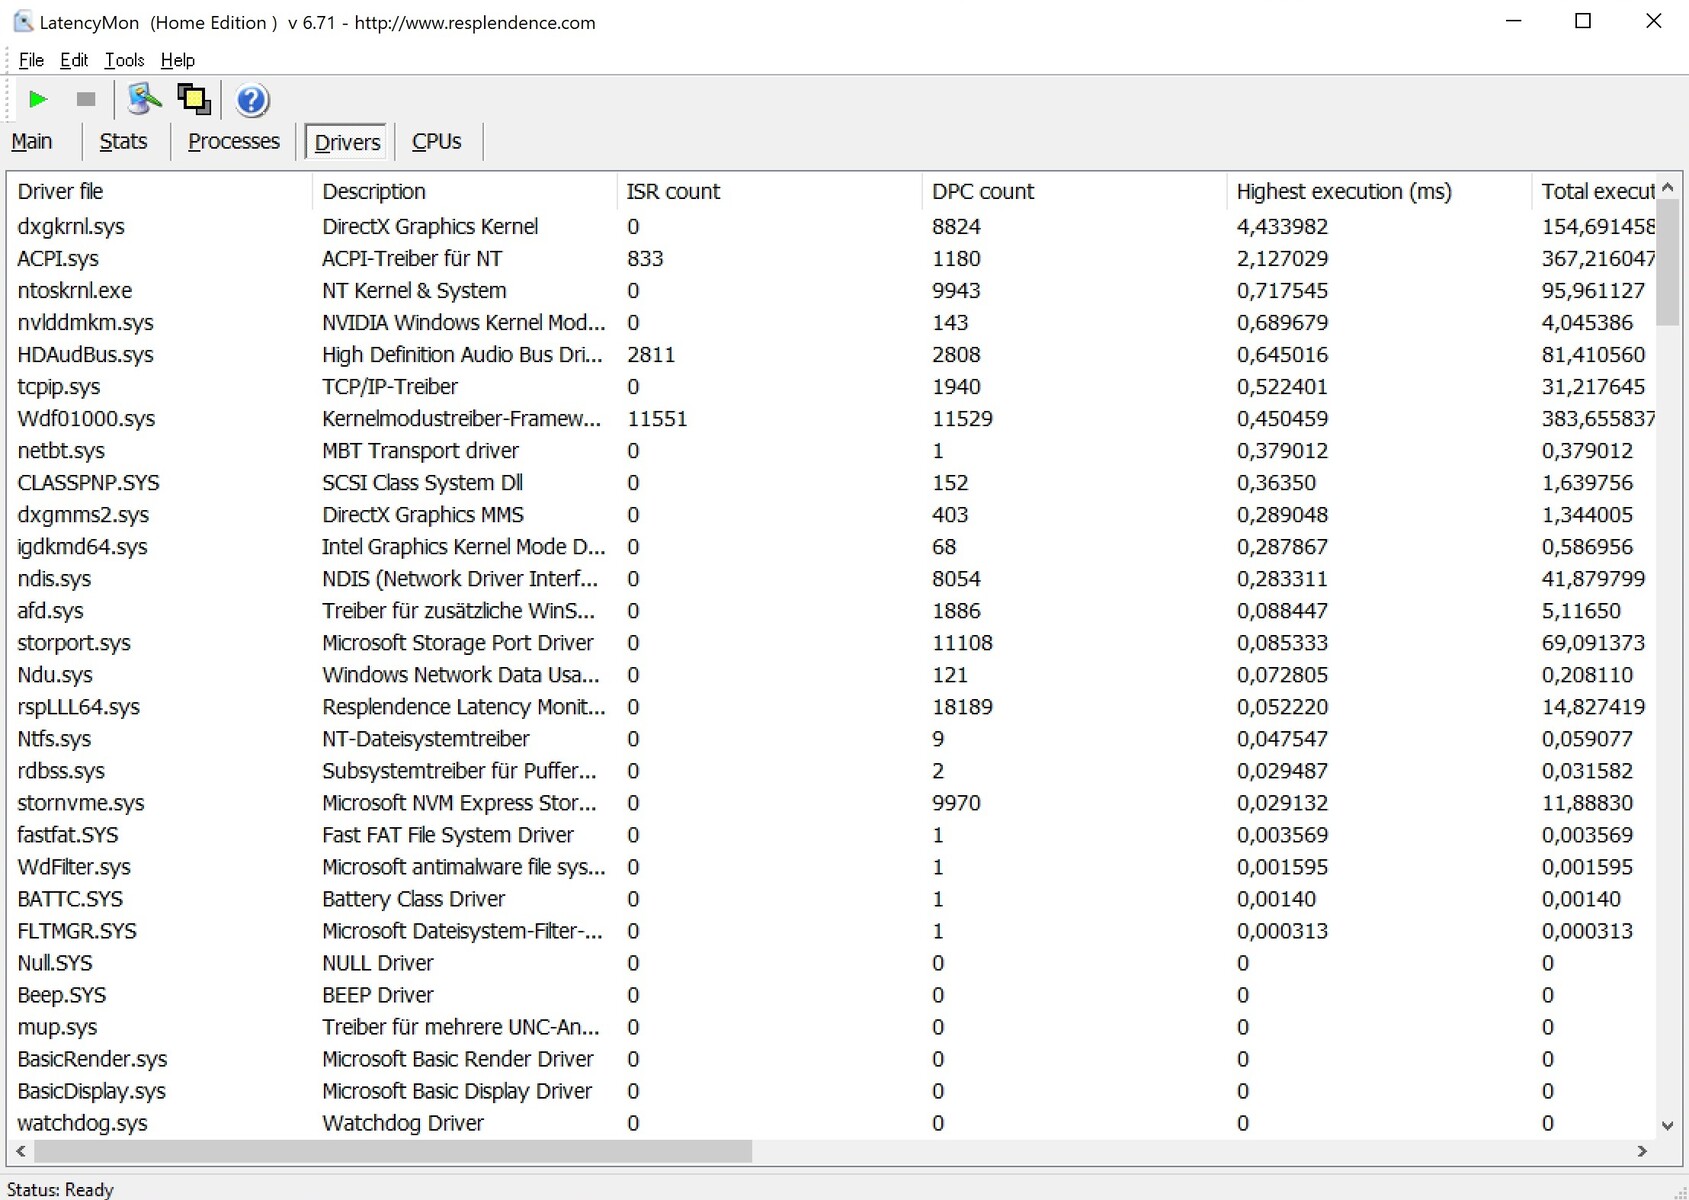
| DPC Latencies / LatencyMon - interrupt to process latency (max), Web, Youtube, Prime95 | |
| Aorus 17G XB | |
| Gigabyte Aero 17 HDR YC | |
| Gigabyte Aero 17 HDR XB | |
| MSI Creator 17 A10SGS | |
| Asus Zephyrus S17 GX701LXS | |
* ... smaller is better
Storage Devices
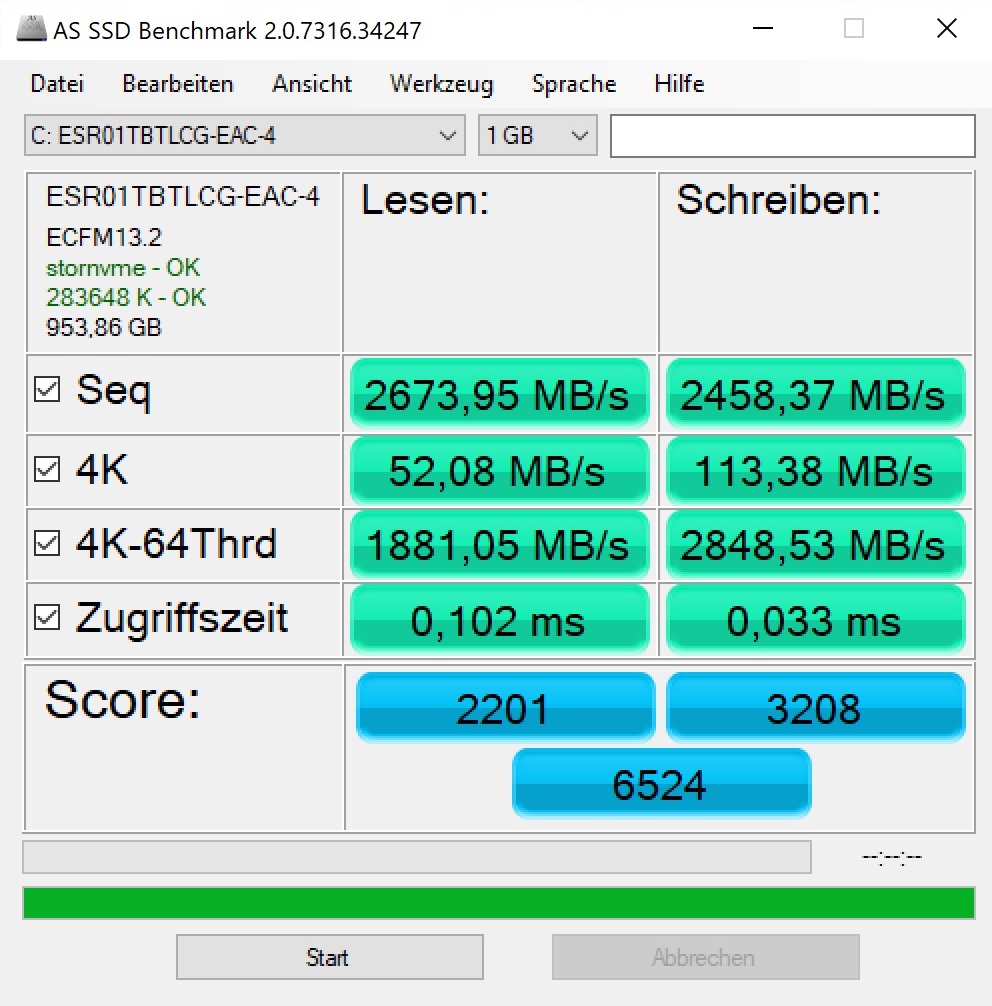
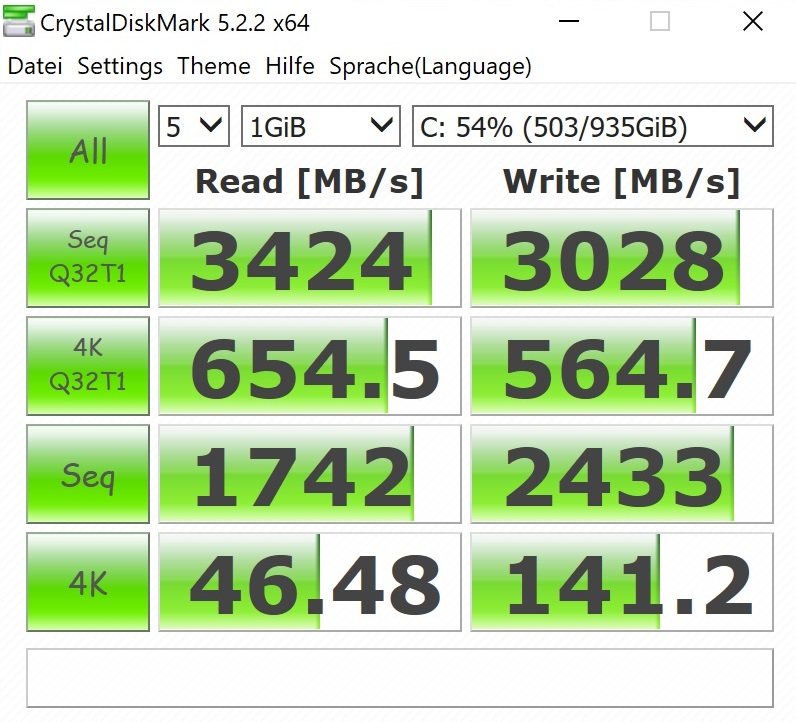
We are perfectly happy with the storage devices. Gigabyte has equipped our test configuration with two NVMe SSDs with a capacity of 1000 GB each. The M.2 drives can compete with the competition's Samsung SSDs (the PM981 is very common) for the most part. The SSD tandem in our Aero 17 HDR handles both small files and large blocks of data at the usual modern day speeds.
| Gigabyte Aero 17 HDR YC ESR01TBTLCG-EAC-4 | Asus Zephyrus S17 GX701LXS Samsung PM981a MZVLB1T0HBLR | MSI Creator 17 A10SGS Samsung SSD PM981 MZVLB2T0HMLB | Aorus 17G XB Samsung SSD PM981a MZVLB512HBJQ | Gigabyte Aero 17 HDR XB Samsung SSD PM981a MZVLB512HBJQ | |
|---|---|---|---|---|---|
| CrystalDiskMark 5.2 / 6 | -10% | -9% | -3% | -4% | |
| Write 4K (MB/s) | 141.2 | 120 -15% | 158.7 12% | 123.4 -13% | 123.4 -13% |
| Read 4K (MB/s) | 46.48 | 45.24 -3% | 41.59 -11% | 45.02 -3% | 45.59 -2% |
| Write Seq (MB/s) | 2433 | 2090 -14% | 2388 -2% | 2526 4% | 2320 -5% |
| Read Seq (MB/s) | 1742 | 2246 29% | 1623 -7% | 2062 18% | 2013 16% |
| Write 4K Q32T1 (MB/s) | 565 | 392.5 -31% | 432.6 -23% | 497.9 -12% | 489.3 -13% |
| Read 4K Q32T1 (MB/s) | 655 | 348.4 -47% | 526 -20% | 579 -12% | 559 -15% |
| Write Seq Q32T1 (MB/s) | 3028 | 3015 0% | 2438 -19% | 2982 -2% | 2979 -2% |
| Read Seq Q32T1 (MB/s) | 3424 | 3445 1% | 3457 1% | 3440 0% | 3432 0% |
| AS SSD | -18% | -5% | -12% | -15% | |
| Seq Read (MB/s) | 2674 | 2744 3% | 2815 5% | 1791 -33% | 1762 -34% |
| Seq Write (MB/s) | 2458 | 1351 -45% | 2278 -7% | 2193 -11% | 2309 -6% |
| 4K Read (MB/s) | 52.1 | 47.24 -9% | 49.59 -5% | 50.7 -3% | 49.45 -5% |
| 4K Write (MB/s) | 113.4 | 109.1 -4% | 139.1 23% | 116.8 3% | 117.1 3% |
| 4K-64 Read (MB/s) | 1881 | 1118 -41% | 1603 -15% | 1525 -19% | 1237 -34% |
| 4K-64 Write (MB/s) | 2849 | 1926 -32% | 1711 -40% | 1958 -31% | 1986 -30% |
| Access Time Read * (ms) | 0.102 | 0.064 37% | 0.059 42% | 0.07 31% | 0.076 25% |
| Access Time Write * (ms) | 0.033 | 0.034 -3% | 0.027 18% | 0.032 3% | 0.032 3% |
| Score Read (Points) | 2201 | 1439 -35% | 1934 -12% | 1755 -20% | 1463 -34% |
| Score Write (Points) | 3208 | 2170 -32% | 2078 -35% | 2294 -28% | 2334 -27% |
| Score Total (Points) | 6524 | 4283 -34% | 4977 -24% | 4972 -24% | 4581 -30% |
| Total Average (Program / Settings) | -14% /
-14% | -7% /
-6% | -8% /
-8% | -10% /
-11% |
* ... smaller is better

Continuous load read: DiskSpd Read Loop, Queue Depth 8
GPU Performance
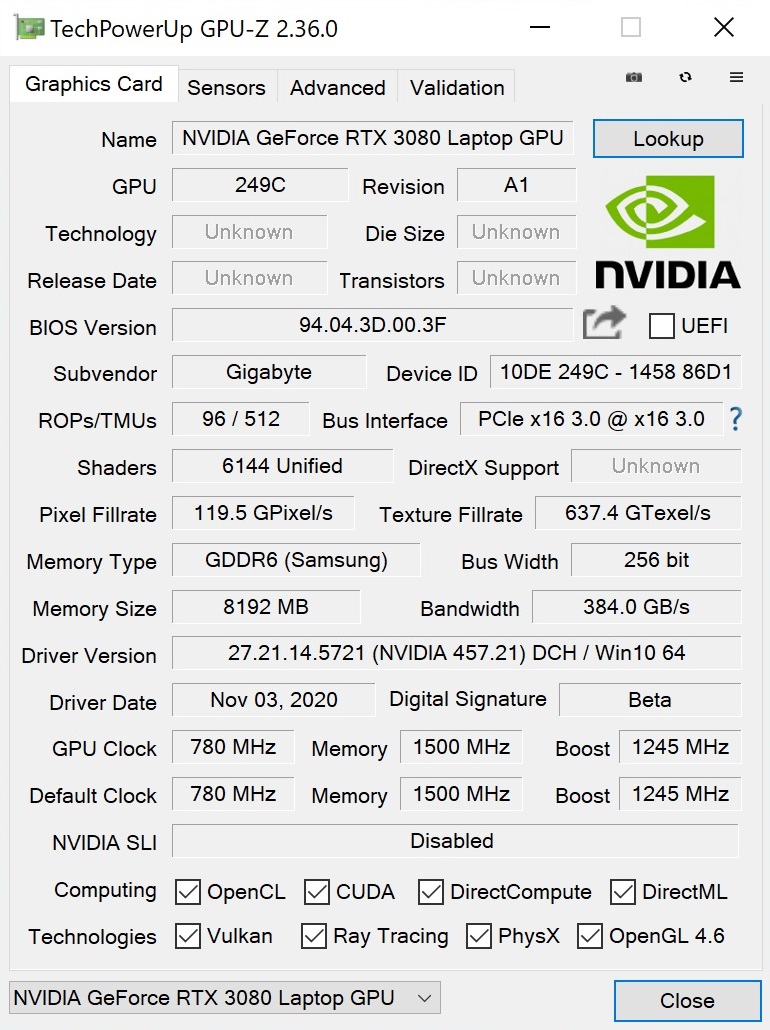
While the desktop versions that are based on Ampere architecture are quite convincing apart from the steep power consumption and the catastrophic availability (even months after the release), the notebook models will cause a lot of discussions. Due to the cooling-related limitations, Nvidia had to massively reduce the TDP of the RTX 3080 Laptop, which has lead to a similar reduction in terms of performance. The desktop version's 320 Watt have been reduced to 80 to 150 Watt for the mobile version (105 Watt @ Aerio 17 HDR YC) - that's less than half.
| 3DMark Cloud Gate Standard Score | 40788 points | |
| 3DMark Fire Strike Score | 20998 points | |
| 3DMark Time Spy Score | 9567 points | |
Help | ||
Notebook users will also have to accept cutbacks in other areas. For example, the number of shaders has been reduced from 8704 to 6144 and the base clock rate has dropped from 1440 to 780 to 1110 MHz, depending on the TDP level. Unlike the last generation, the two versions can't really be considered the same graphic card, which makes the designation 3080 inconvenient, particularly as many manufacturers often don't openly communicate the TDP. The result will be increased confusion and insecurity for potential buyers.
| 3DMark 11 - 1280x720 Performance GPU | |
| Average of class Gaming (21841 - 80022, n=106, last 2 years) | |
| Asus Zephyrus S17 GX701LXS | |
| Gigabyte Aero 17 HDR XB | |
| Aorus 17G XB | |
| MSI Creator 17 A10SGS | |
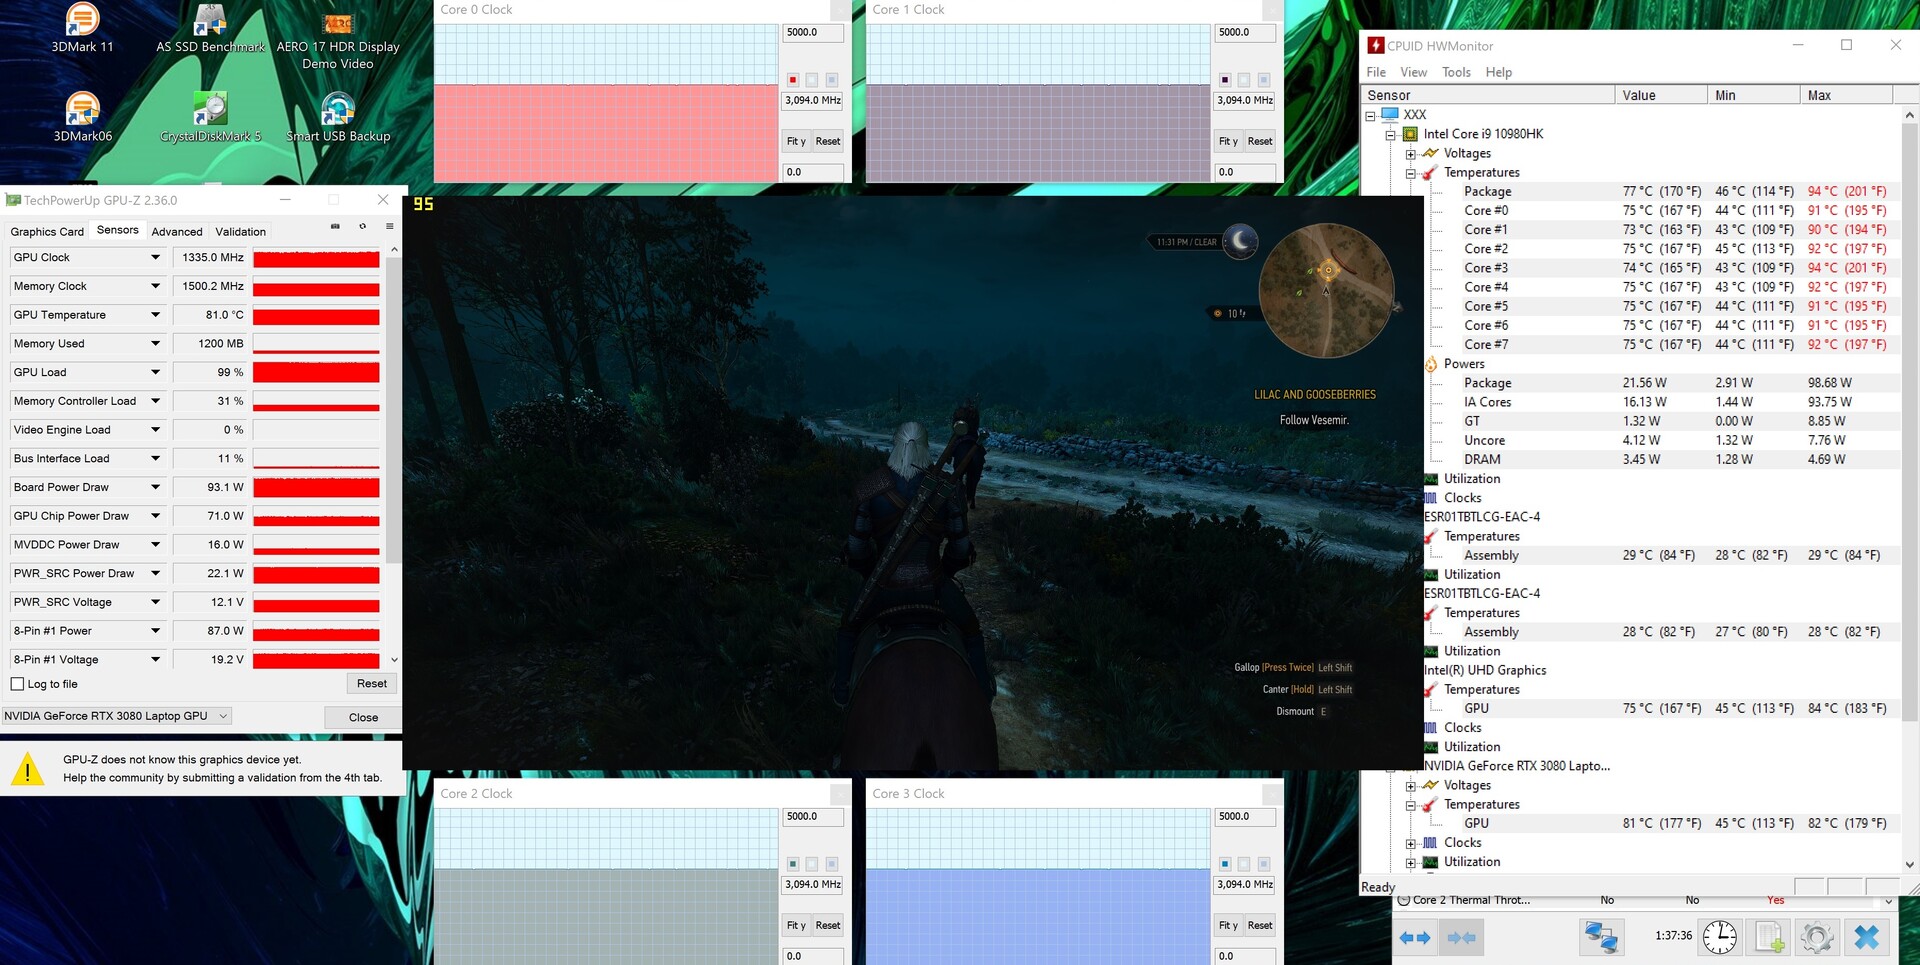
Due to the low TDP, the RTX 3080 Laptop can hardly distinguish itself from its predecessors. The Aero 17 HDR YC is only about 10 percent faster than a good 2080 Super Max Q notebook (Asus GX701LXS) and 30 percent faster than a good 2070 Super Max Q notebook (Aero 17 HDR XB) in our Time Spy 3DMark test. At least the 3D performance remains fairly constant over a long period of time, as shown in our 60-minute test of The Witcher 3 (FHD/Ultra).
Gaming Performance
Even though demanding games cannot always be displayed in maximum details at the native resolution of 3840 x 2160, the GeForce RTX 3080 Laptop does offer a lot of gaming power. Less demanding and/or older titles can be displayed smoothly at 4K in full graphic splendor. That would have been unthinkable only a few years ago. Find out how the Aero 17 HDR YC fares in individual games in the table displayed below.
| The Witcher 3 | |
| 1920x1080 Ultra Graphics & Postprocessing (HBAO+) | |
| Average of class Gaming (95 - 240, n=7, last 2 years) | |
| Gigabyte Aero 17 HDR YC | |
| Asus Zephyrus S17 GX701LXS | |
| Gigabyte Aero 17 HDR XB | |
| MSI Creator 17 A10SGS | |
| Aorus 17G XB | |
| 3840x2160 High Graphics & Postprocessing (Nvidia HairWorks Off) | |
| Average of class Gaming (114 - 169.8, n=3, last 2 years) | |
| Gigabyte Aero 17 HDR YC | |
| MSI Creator 17 A10SGS | |
| Gigabyte Aero 17 HDR XB | |
| low | med. | high | ultra | QHD | 4K | |
|---|---|---|---|---|---|---|
| GTA V (2015) | 179 | 172 | 154 | 90.7 | 88 | |
| The Witcher 3 (2015) | 175 | 96.1 | 67.5 | |||
| Dota 2 Reborn (2015) | 152 | 137 | 129 | 122 | 101 | |
| X-Plane 11.11 (2018) | 115 | 102 | 83.8 | 63.5 | ||
| Battlefield V (2018) | 149 | 142 | 117 | 74.9 | ||
| Apex Legends (2019) | 144 | 144 | 138 | 78 | ||
| Far Cry New Dawn (2019) | 113 | 100 | 90 | 58 | ||
| Metro Exodus (2019) | 92.5 | 74.2 | 57.9 | 38.2 | ||
| The Division 2 (2019) | 123 | 96 | 69 | 38 | ||
| Anno 1800 (2019) | 83.3 | 47 | 45.6 | 30.5 | ||
| Control (2019) | 94.8 | 62.3 | 30.9 | |||
| Borderlands 3 (2019) | 103 | 85.5 | 62.5 | 34.9 | ||
| Need for Speed Heat (2019) | 97.5 | 93.4 | 77.5 | 51 | ||
| Star Wars Jedi Fallen Order (2019) | 102 | 98.4 | 86.1 | 49.1 | ||
| Red Dead Redemption 2 (2019) | 93.1 | 61 | 50.3 | 32.8 | ||
| Crysis Remastered (2020) | 88.9 | 61.5 | 49.3 | 29.3 | ||
| Star Wars Squadrons (2020) | 246 | 237 | 176 | 105 | ||
| FIFA 21 (2020) | 249 | 248 | 241 | 193 | ||
| Watch Dogs Legion (2020) | 103 | 73 | 56 | 32 | ||
| Assassin´s Creed Valhalla (2020) | 72 | 65 | 54 | 36 | ||
| Call of Duty Black Ops Cold War (2020) | 100 | 92 | 68.9 | 39.8 | ||
| Immortals Fenyx Rising (2020) | 98 | 92 | 76 | 50 | ||
| Cyberpunk 2077 1.0 (2020) | 67.6 | 60.6 | 42.3 | 21.4 |
Emissions
System Noise
Although the 17-inch device cannot be considered quiet, the Aero 17 HDR YC is calmer that most of its competition despite its powerful CPU/GPU combination. We measured an average noise level of 42 dB(A) during The Witcher 3, which is similar to the Asus Zephyrus S17 (the fan mode "gaming" adds another couple of dB). Most gaming laptops reach over 45 or even 50 dB(A) in this scenario. The Aero 17 HDR YC is similarly inconspicuous while idling, where it reaches a noise level of 30 to 32 dB(A) (short peaks up to 36 dB(A)). Naturally, the noise levels vary depending on the performance and fan profile (the device can be silent in quiet mode, for example).
Noise level
| Idle |
| 30 / 32 / 36 dB(A) |
| Load |
| 45 / 49 dB(A) |
 | ||
30 dB silent 40 dB(A) audible 50 dB(A) loud |
||
min: | ||
| Gigabyte Aero 17 HDR YC i9-10980HK, GeForce RTX 3080 Laptop GPU | Asus Zephyrus S17 GX701LXS i7-10875H, GeForce RTX 2080 Super Max-Q | MSI Creator 17 A10SGS i7-10875H, GeForce RTX 2080 Super Max-Q | Aorus 17G XB i7-10875H, GeForce RTX 2070 Super Max-Q | Gigabyte Aero 17 HDR XB i7-10875H, GeForce RTX 2070 Super Max-Q | Average of class Gaming | |
|---|---|---|---|---|---|---|
| Noise | -3% | -7% | -11% | -12% | 8% | |
| off / environment * (dB) | 26 | 25 4% | 30 -15% | 30 -15% | 30 -15% | 24.1 ? 7% |
| Idle Minimum * (dB) | 30 | 32 -7% | 32 -7% | 35 -17% | 35 -17% | 25.9 ? 14% |
| Idle Average * (dB) | 32 | 35 -9% | 33 -3% | 36 -13% | 36 -13% | 27.4 ? 14% |
| Idle Maximum * (dB) | 36 | 43 -19% | 40 -11% | 41 -14% | 38 -6% | 29.9 ? 17% |
| Load Average * (dB) | 45 | 44 2% | 47 -4% | 47 -4% | 47 -4% | 43.3 ? 4% |
| Witcher 3 ultra * (dB) | 42 | 41 2% | 46 -10% | 48 -14% | 49 -17% | |
| Load Maximum * (dB) | 49 | 45 8% | 48 2% | 49 -0% | 54 -10% | 54.2 ? -11% |
* ... smaller is better
Temperature
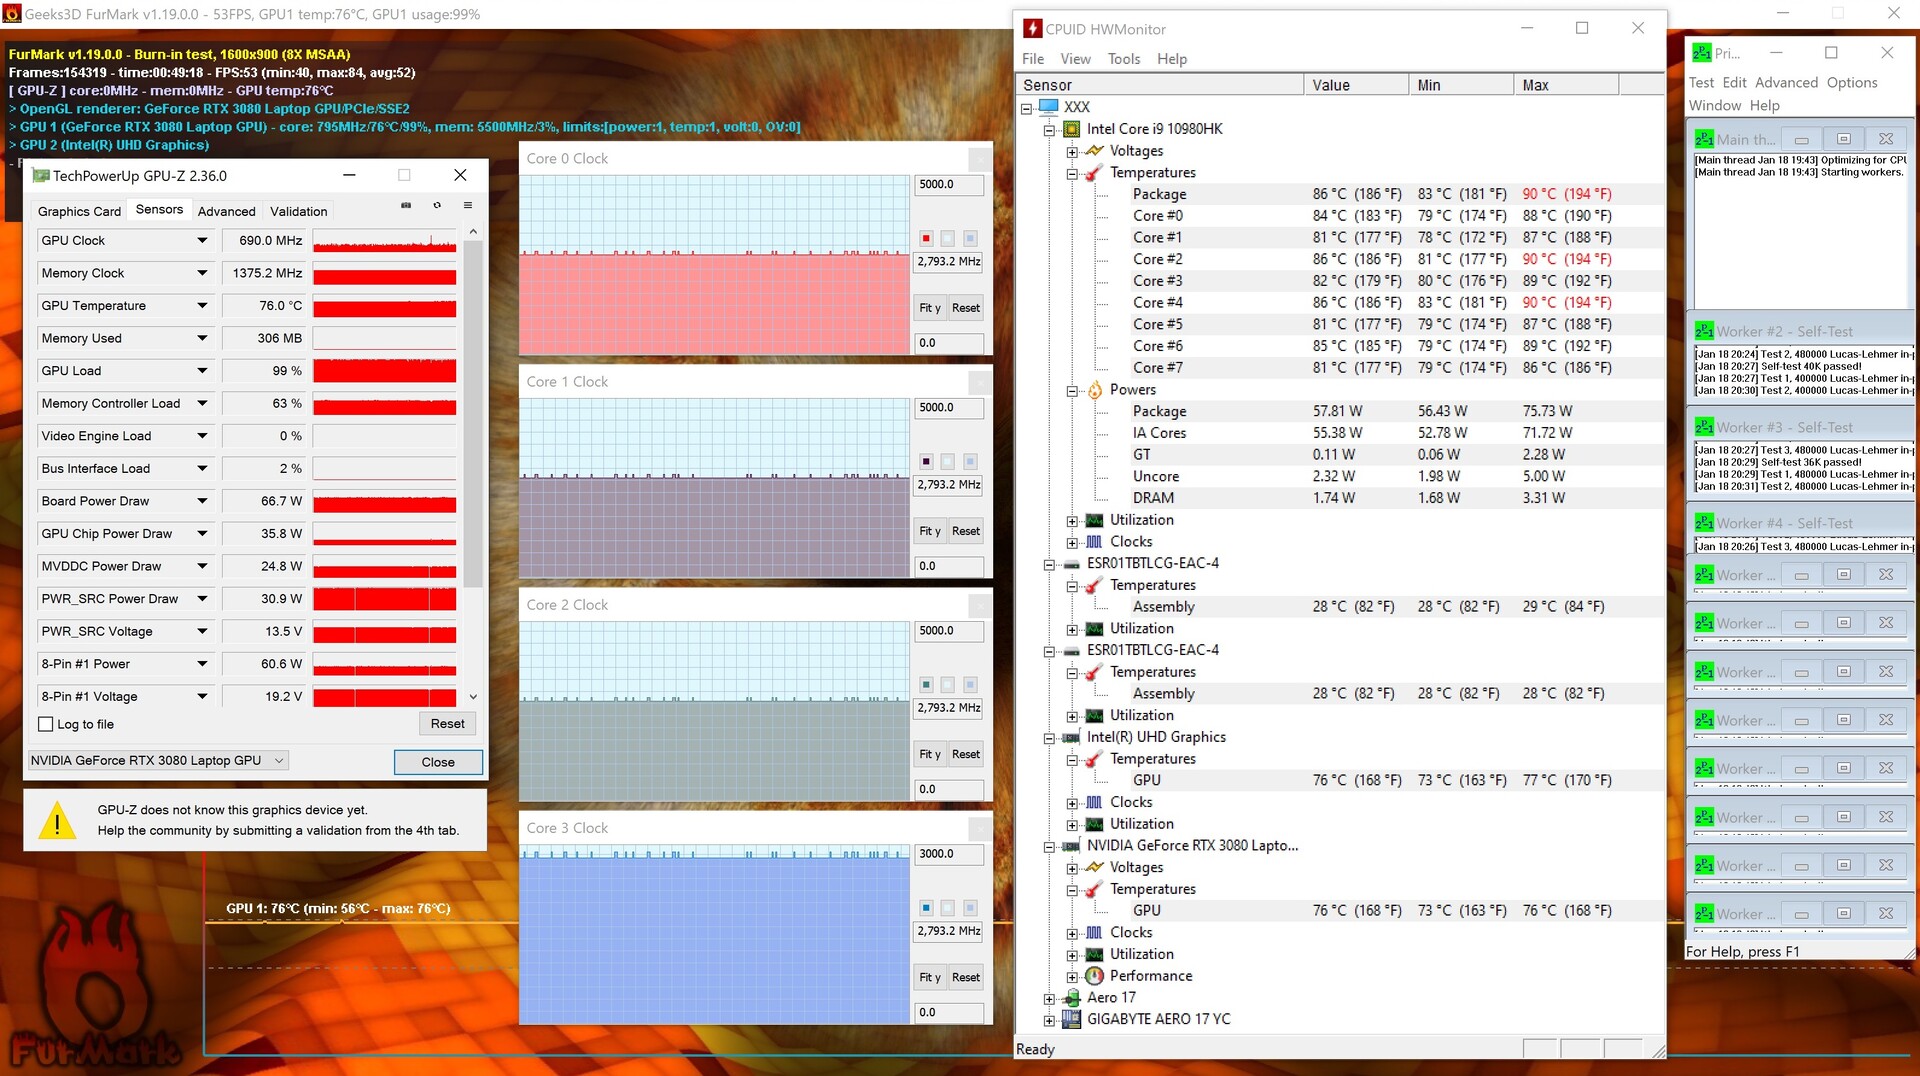
The disadvantage of the moderate noise level is that it causes high temperatures. While the surfaces remain below the 30 °C mark for the most part while idling, the bottom of the base unit heats up to 60 °C in some areas during 3D operation, which is why we wouldn't recommend keeping the device on your lap while gaming. The inside of the device heats up noticeably as well. After 60 minutes of The Witcher 3, the Core i9-10980HK and the GeForce RTX 3080 settle down at around 80 °C. The temperatures were similar during our stress test with the tools FurMark and Prime95, but the GPU throttled and the CPU turbo was hardly active at all.
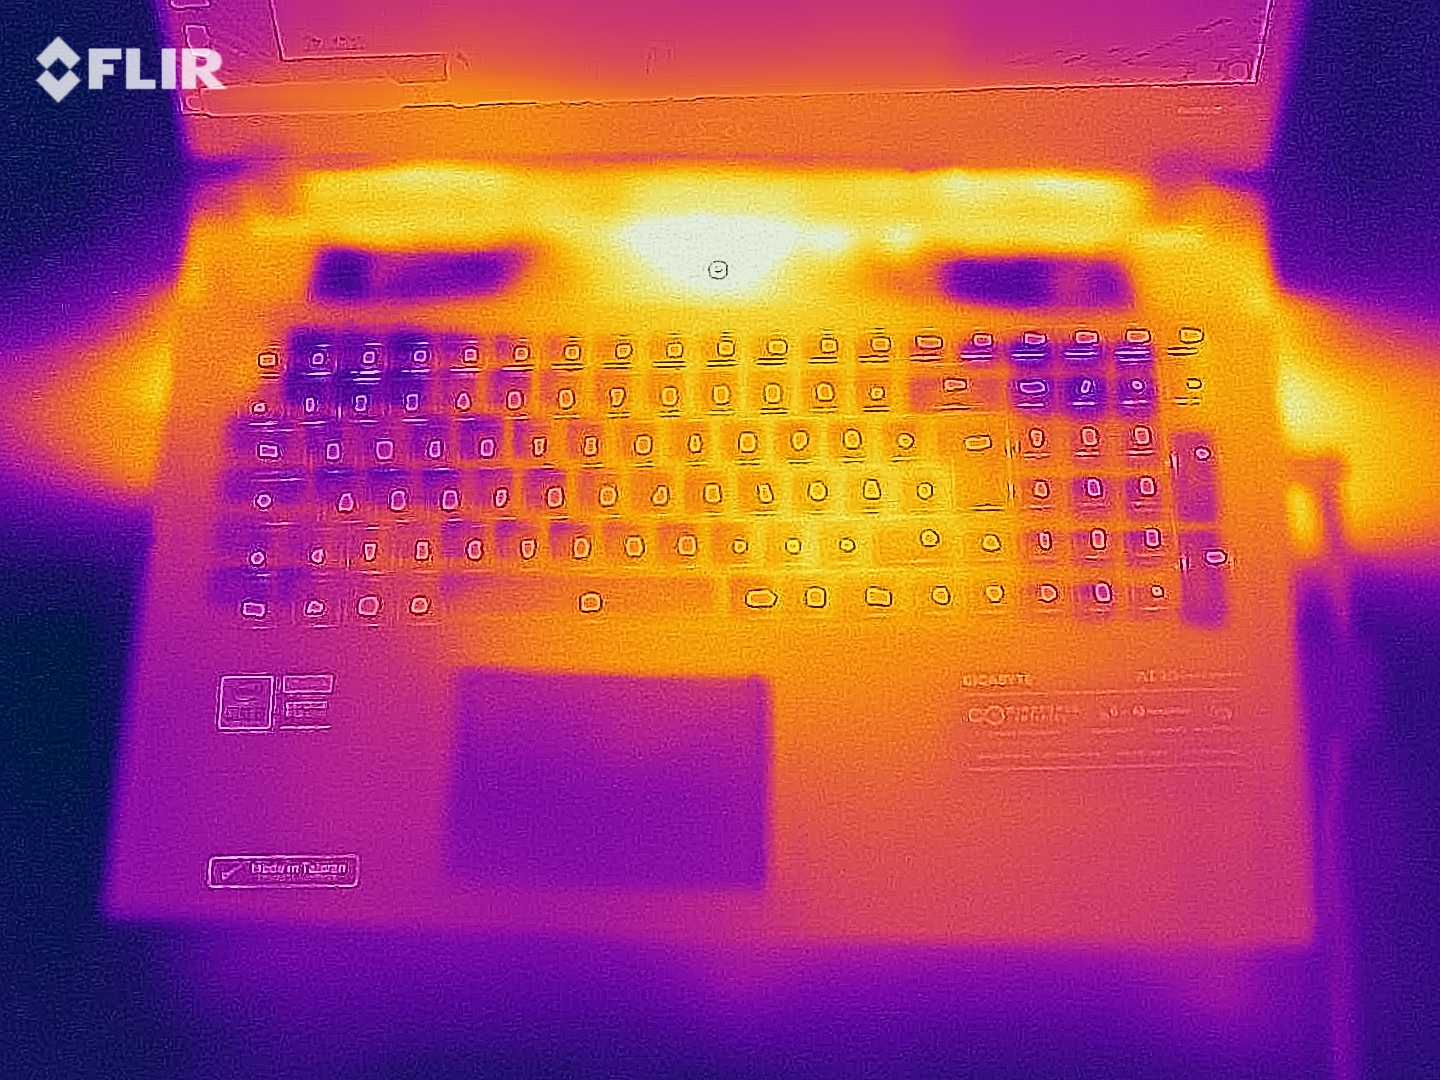
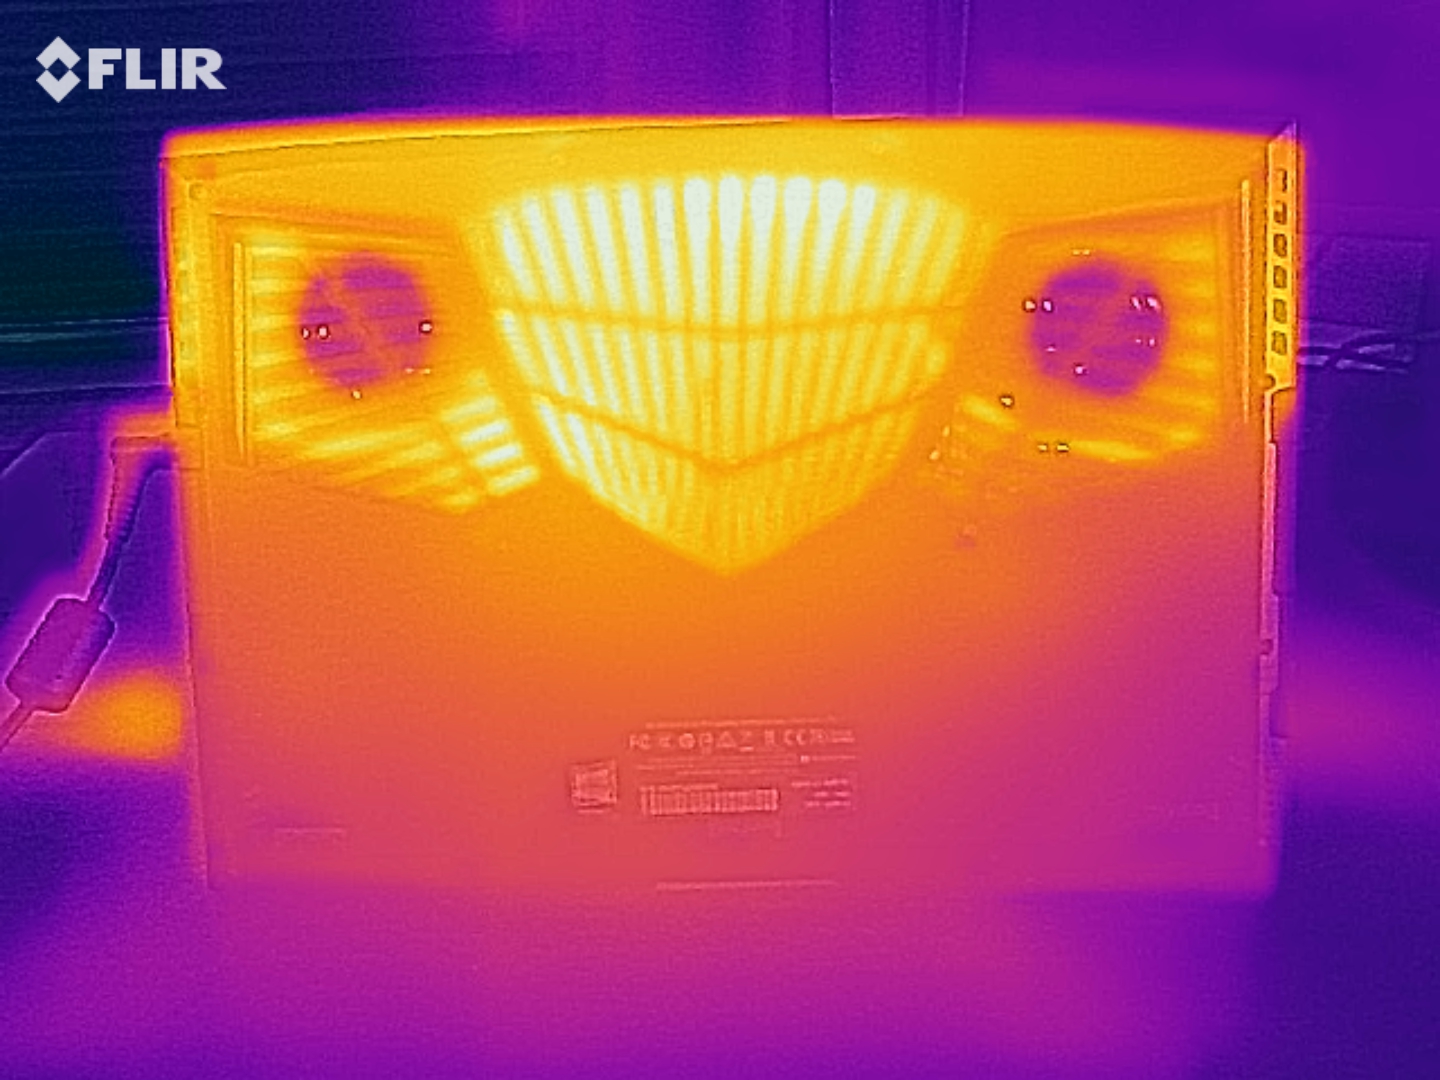
(-) The maximum temperature on the upper side is 51 °C / 124 F, compared to the average of 40.4 °C / 105 F, ranging from 21.2 to 68.8 °C for the class Gaming.
(-) The bottom heats up to a maximum of 58 °C / 136 F, compared to the average of 43.2 °C / 110 F
(+) In idle usage, the average temperature for the upper side is 26.7 °C / 80 F, compared to the device average of 33.9 °C / 93 F.
(-) Playing The Witcher 3, the average temperature for the upper side is 42.1 °C / 108 F, compared to the device average of 33.9 °C / 93 F.
(-) The palmrests and touchpad can get very hot to the touch with a maximum of 40 °C / 104 F.
(-) The average temperature of the palmrest area of similar devices was 28.8 °C / 83.8 F (-11.2 °C / -20.2 F).
| Gigabyte Aero 17 HDR YC i9-10980HK, GeForce RTX 3080 Laptop GPU | Asus Zephyrus S17 GX701LXS i7-10875H, GeForce RTX 2080 Super Max-Q | MSI Creator 17 A10SGS i7-10875H, GeForce RTX 2080 Super Max-Q | Aorus 17G XB i7-10875H, GeForce RTX 2070 Super Max-Q | Gigabyte Aero 17 HDR XB i7-10875H, GeForce RTX 2070 Super Max-Q | Average of class Gaming | |
|---|---|---|---|---|---|---|
| Heat | 5% | -5% | 7% | 4% | 5% | |
| Maximum Upper Side * (°C) | 51 | 57 -12% | 52 -2% | 48 6% | 53 -4% | 45.2 ? 11% |
| Maximum Bottom * (°C) | 58 | 51 12% | 59 -2% | 59 -2% | 59 -2% | 48.2 ? 17% |
| Idle Upper Side * (°C) | 29 | 28 3% | 34 -17% | 26 10% | 27 7% | 31 ? -7% |
| Idle Bottom * (°C) | 34 | 28 18% | 33 3% | 29 15% | 29 15% | 34.3 ? -1% |
* ... smaller is better
Speaker
Gigabyte Aero 17 HDR YC audio analysis
(+) | speakers can play relatively loud (86 dB)
Bass 100 - 315 Hz
(-) | nearly no bass - on average 20.4% lower than median
(±) | linearity of bass is average (10.2% delta to prev. frequency)
Mids 400 - 2000 Hz
(±) | higher mids - on average 5.3% higher than median
(+) | mids are linear (5.2% delta to prev. frequency)
Highs 2 - 16 kHz
(+) | balanced highs - only 4.2% away from median
(±) | linearity of highs is average (7.7% delta to prev. frequency)
Overall 100 - 16.000 Hz
(±) | linearity of overall sound is average (16.3% difference to median)
Compared to same class
» 41% of all tested devices in this class were better, 6% similar, 53% worse
» The best had a delta of 6%, average was 18%, worst was 132%
Compared to all devices tested
» 27% of all tested devices were better, 6% similar, 68% worse
» The best had a delta of 4%, average was 23%, worst was 134%
Apple MacBook 12 (Early 2016) 1.1 GHz audio analysis
(+) | speakers can play relatively loud (83.6 dB)
Bass 100 - 315 Hz
(±) | reduced bass - on average 11.3% lower than median
(±) | linearity of bass is average (14.2% delta to prev. frequency)
Mids 400 - 2000 Hz
(+) | balanced mids - only 2.4% away from median
(+) | mids are linear (5.5% delta to prev. frequency)
Highs 2 - 16 kHz
(+) | balanced highs - only 2% away from median
(+) | highs are linear (4.5% delta to prev. frequency)
Overall 100 - 16.000 Hz
(+) | overall sound is linear (10.2% difference to median)
Compared to same class
» 7% of all tested devices in this class were better, 2% similar, 91% worse
» The best had a delta of 5%, average was 18%, worst was 53%
Compared to all devices tested
» 5% of all tested devices were better, 1% similar, 94% worse
» The best had a delta of 4%, average was 23%, worst was 134%
Energy Management
Power Consumption
Thanks to the graphics switching technology (Nvidia Optimus), the 17-inch device is very frugal in idle mode and during simple applications that are taken care of by the processor's integrated graphics chip. Under load, the positive side of the RTX 3080 Laptop's low TDP becomes visible. We measured a consumption of 113 - 237 Watt, which is very decent for the available performance.
| Off / Standby | |
| Idle | |
| Load |
|
Key:
min: | |
| Gigabyte Aero 17 HDR YC i9-10980HK, GeForce RTX 3080 Laptop GPU | Asus Zephyrus S17 GX701LXS i7-10875H, GeForce RTX 2080 Super Max-Q | MSI Creator 17 A10SGS i7-10875H, GeForce RTX 2080 Super Max-Q | Aorus 17G XB i7-10875H, GeForce RTX 2070 Super Max-Q | Gigabyte Aero 17 HDR XB i7-10875H, GeForce RTX 2070 Super Max-Q | Average of class Gaming | |
|---|---|---|---|---|---|---|
| Power Consumption | 12% | -7% | -7% | 3% | 12% | |
| Idle Minimum * (Watt) | 17 | 10 41% | 15 12% | 20 -18% | 16 6% | 12.8 ? 25% |
| Idle Average * (Watt) | 21 | 16 24% | 20 5% | 23 -10% | 19 10% | 18.5 ? 12% |
| Idle Maximum * (Watt) | 33 | 29 12% | 42 -27% | 38 -15% | 30 9% | 24 ? 27% |
| Load Average * (Watt) | 113 | 143 -27% | 150 -33% | 105 7% | 109 4% | 108.2 ? 4% |
| Witcher 3 ultra * (Watt) | 157 | 146 7% | 170 -8% | 158 -1% | 167 -6% | |
| Load Maximum * (Watt) | 237 | 205 14% | 210 11% | 243 -3% | 246 -4% | 254 ? -7% |
* ... smaller is better
Battery Life
Graphics switching technology and the large 99-Wh battery (was 94 Wh) make the Aero 17 HDR YC a mobile companion that doesn't always have to rely on mains power supply. The battery lasts over 10 hours while idling at minimum brightness and around 6 hours while browsing the web at average brightness. Both these results are very good for a gaming notebook.
| Gigabyte Aero 17 HDR YC i9-10980HK, GeForce RTX 3080 Laptop GPU, 99 Wh | Asus Zephyrus S17 GX701LXS i7-10875H, GeForce RTX 2080 Super Max-Q, 76 Wh | MSI Creator 17 A10SGS i7-10875H, GeForce RTX 2080 Super Max-Q, 82 Wh | Aorus 17G XB i7-10875H, GeForce RTX 2070 Super Max-Q, 94 Wh | Gigabyte Aero 17 HDR XB i7-10875H, GeForce RTX 2070 Super Max-Q, 94 Wh | Average of class Gaming | |
|---|---|---|---|---|---|---|
| Battery runtime | -40% | -27% | 24% | 18% | 2% | |
| Reader / Idle (h) | 10.3 | 3.5 -66% | 7.2 -30% | 10 -3% | 9.9 -4% | 8.71 ? -15% |
| WiFi v1.3 (h) | 5.9 | 2.8 -53% | 4.4 -25% | 7.5 27% | 6.2 5% | 7.09 ? 20% |
| Load (h) | 1.5 | 1.5 0% | 1.1 -27% | 2.2 47% | 2.3 53% | 1.51 ? 1% |
Pros
Cons
Verdict
Despite the availability of Ampere notebooks being all but secure, Gigabyte has presented their Aero 17 HDR YC with a technical update. This is a well-made high-end notebook that - like its predecessor - is characterized by its particularly outstanding 4K display and the strong battery.
The flat, high-quality case also offers good input devices and sufficient ports (including Thunderbolt 3). The device's other elements (RAM, storage device etc.) are good as well.
We have mixed feelings about the GeForce RTX 3080 Laptop. Sure, its graphics performance is very good for notebook standards, but its speeds are nonetheless extremely limited compared to the desktop version.
Price and availability
The device is available on Newegg for $3.700 at the time of testing.
Gigabyte Aero 17 HDR YC
- 01/26/2021 v7 (old)
Florian Glaser
Price comparison

