HP EliteBook 840 G3 Notebook Review

For the original German review, see here.
After the review of the 14-inch Latitude E7470, which scored a very good 89%, we continue with one of the biggest rivals: The EliteBook 840 G3 is HP's answer to Dell's business Ultrabook. A look at the final score immediately shows: 87%, so Dell has the upper hand in terms of build quality and choice of components. Why does the EliteBook 840 G3 miss a very good rating? Read on to find out.
Rivals for the EliteBook are the ThinkPad T450s (1300 Euros/~$1477) or T460s respectively, the Latitude E7470 (2300 Euros/~$2614) and the Acer TravelMate P645 (1329 Euros/~$1510). HP also offers the Ultrabook HP EliteBook Folio 1040 G3 (2000 Euros/~$2273), which is currently under review. Our test model of the 840 G3 is not defined as an Ultrabook, but HP also offers a touch version for a small premium. 1500 Euros (~$1704) is the online price for our version, T9X59ET#ABD, with a Core i7-6500U, 256 GB SSD and FHD panel. Not a bargain, but not too expensive compared with the mentioned rivals (review configurations), either.
We will find out why the EliteBook 840 G3 can meet high requirements on the one hand, but also fails to meet its own goals in some areas.
Update 04/18/2016: Excellent WQHD panel
The HP EliteBook 840 G3 turned out to be a versatile business notebook, but it was not a fully convincing package with the TN panel (1920 x 1080). Now we had the chance to test the version with the WQHD panel (non-touch, T9X23ET#ABD) and we are impressed. All the information is available in the sections Display, Battery Runtime and Verdict.
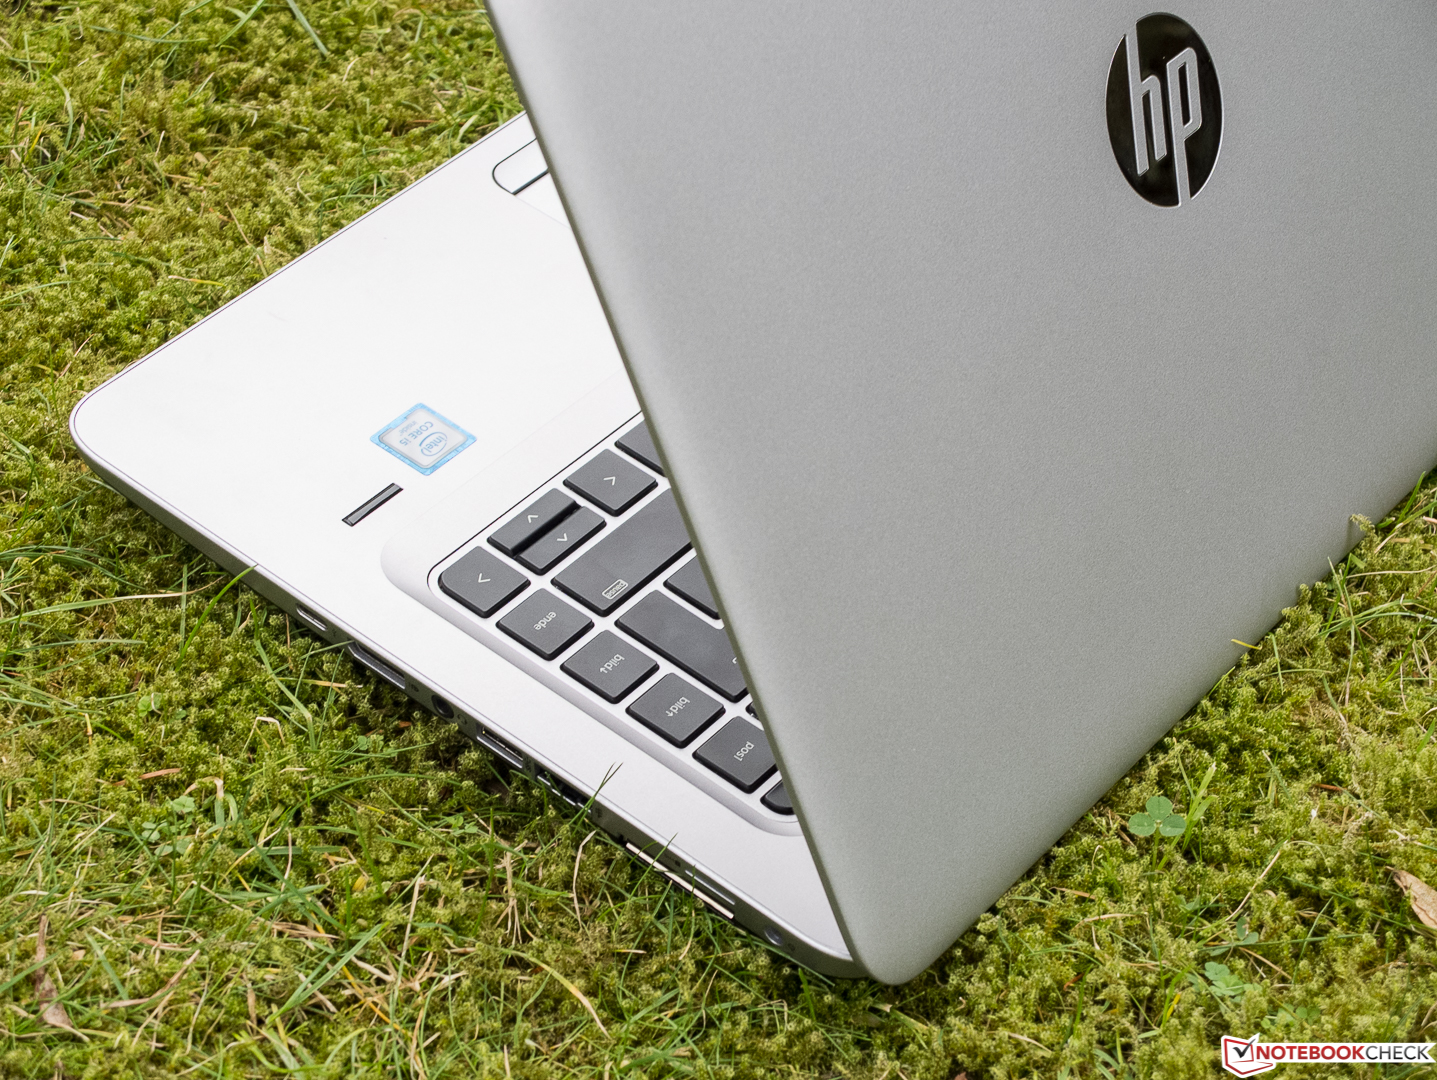
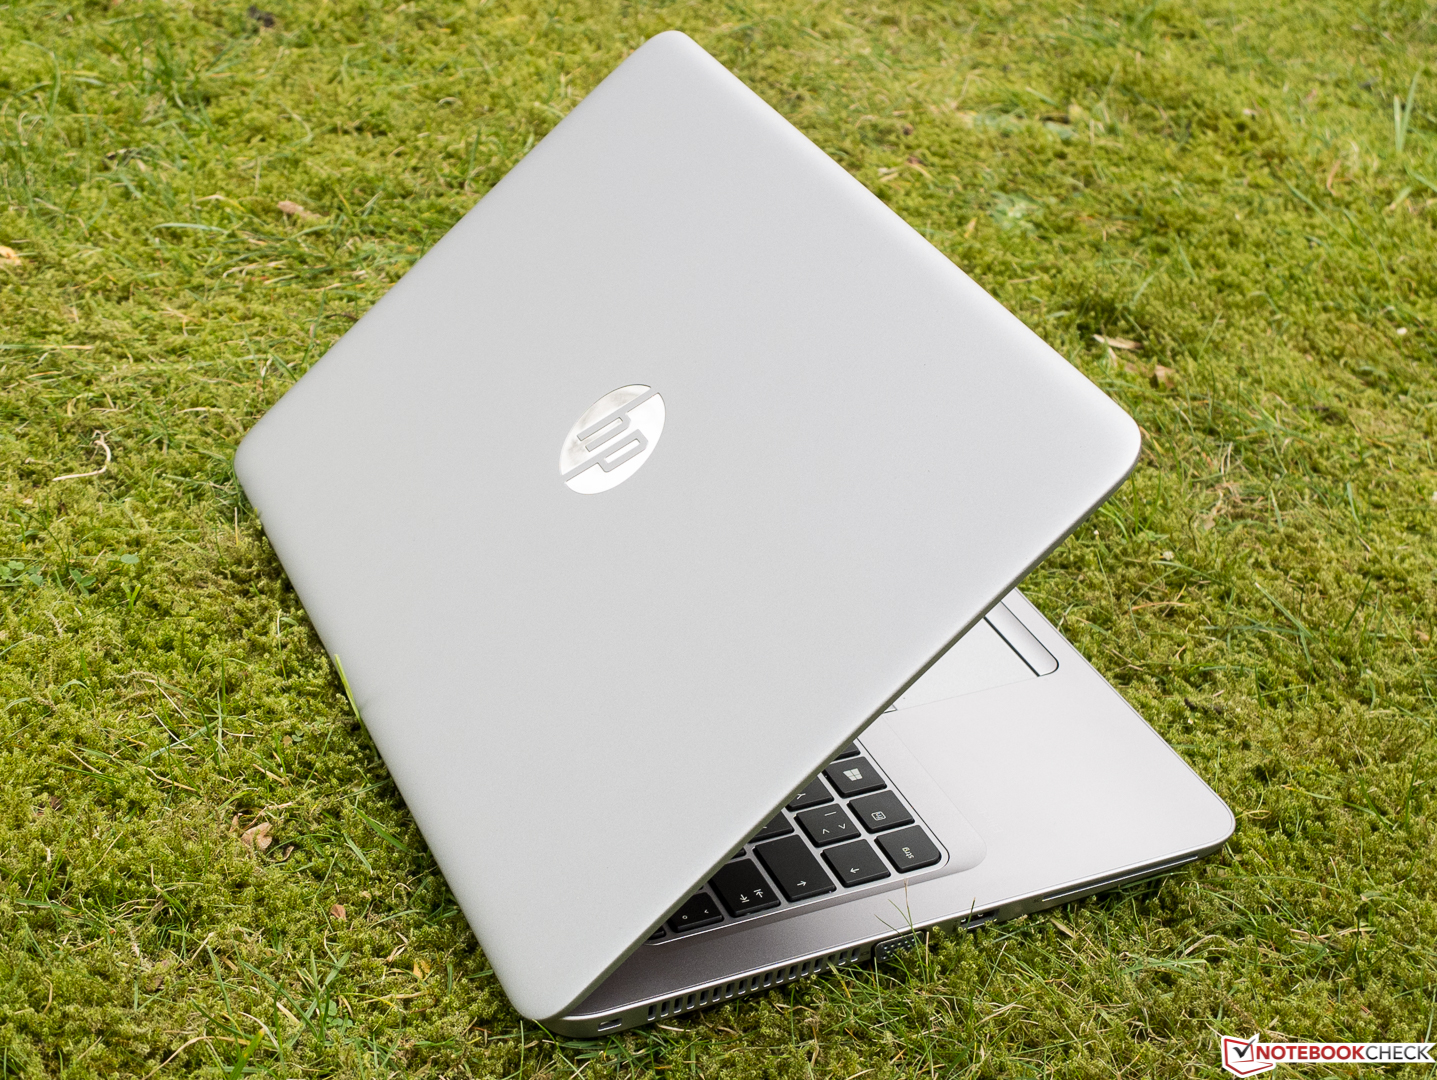
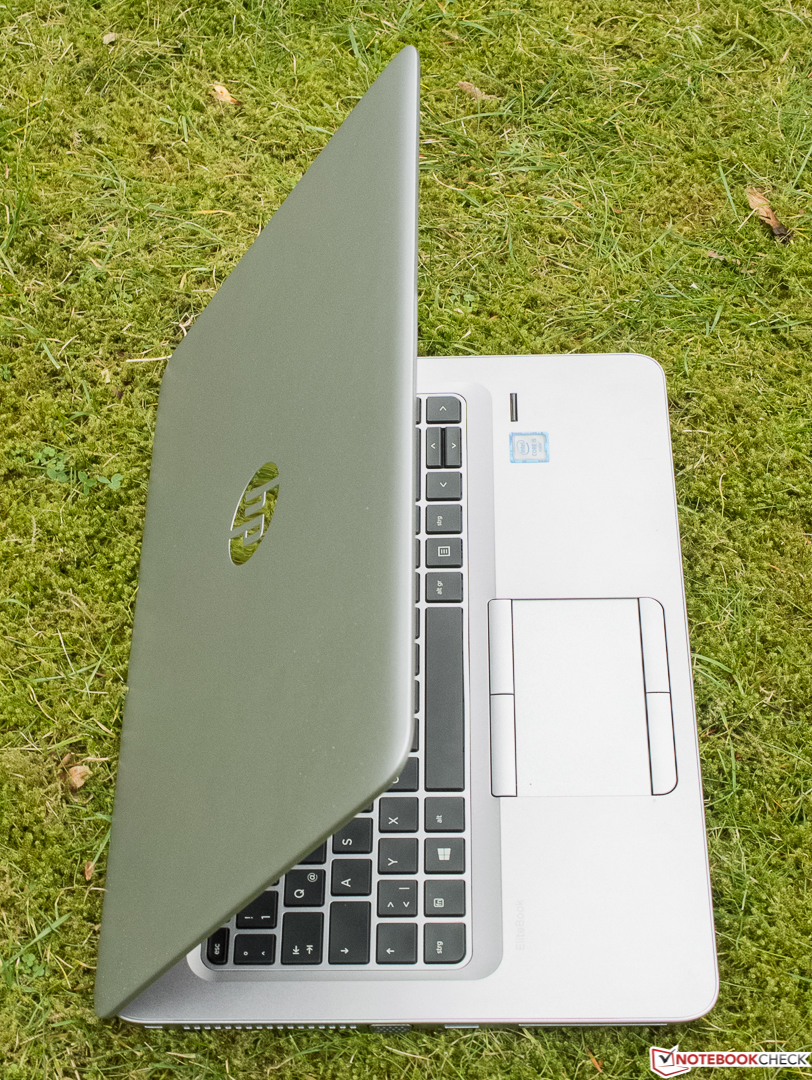
Case
No flaws here, which is true for many parts of the chassis. The 14-inch notebook is surprisingly light, but 1.58 kilograms (~3.5 lb) is still easily beaten by the EliteBook Folio 1040 G3 (1.4 kg/~3.1 lb). The real rivals ThinkPad T450s (1.8 kg/~4 lb) and Dell Latitude 14 E7470 (1.7 kg/~3.7 lb) on the other hand are much heavier. One of the main reasons is the lower battery capacity of the 840 G3 (46 Wh); Latitude and T450s come with 55 and 96 Wh modules, respectively, so the weight difference would be very small with similar batteries.
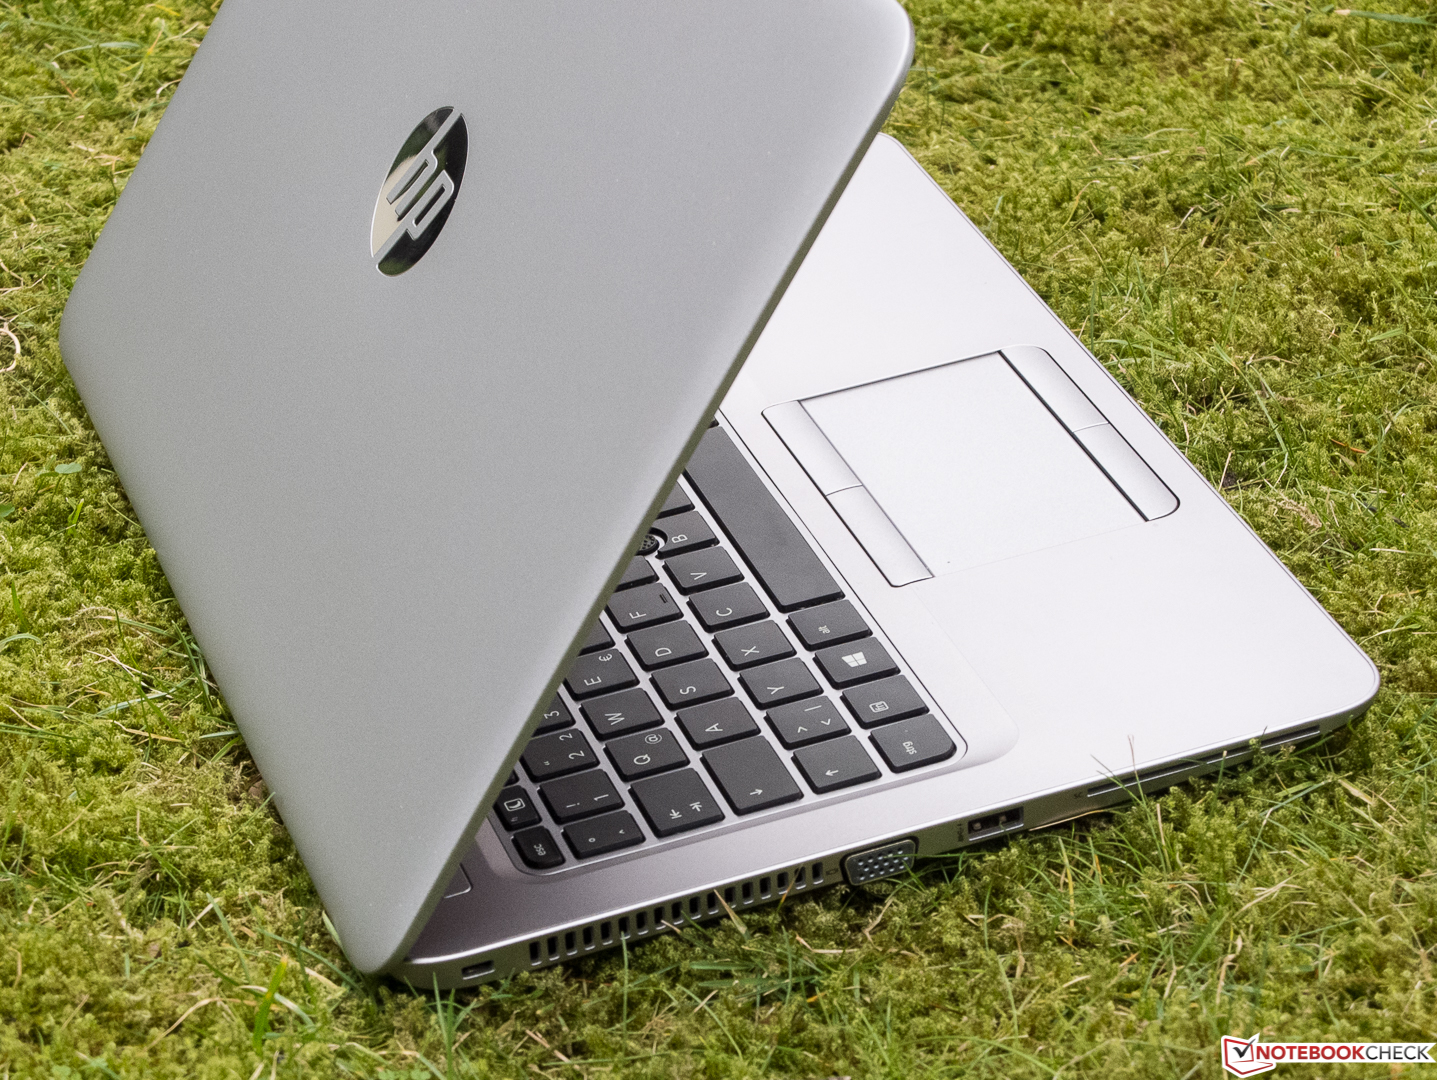
The base is made of plastics, only the silver top of the base unit has a painted aluminum finish. The former is solid and torsion-resistant, while the latter provides a cool tactile feel for the hands. All the keys are well-integrated, which ensure a firm and hard key stroke.
The lid is very thin, somewhat flexible and the hinges are smooth. Pressure on the frame will result in pressure points on the screen. This can be particularly noticeable when handling the notebook at the upper frame, where TFT is probably connected too tightly to the frame. Pressure on the back of the lid does not create ripples on the screen. You can easily open the lid with one hand, but it is still well-adjusted so there is no bouncing. However, the lid will open to its maximum angle of around 145 degrees when you carry it around.

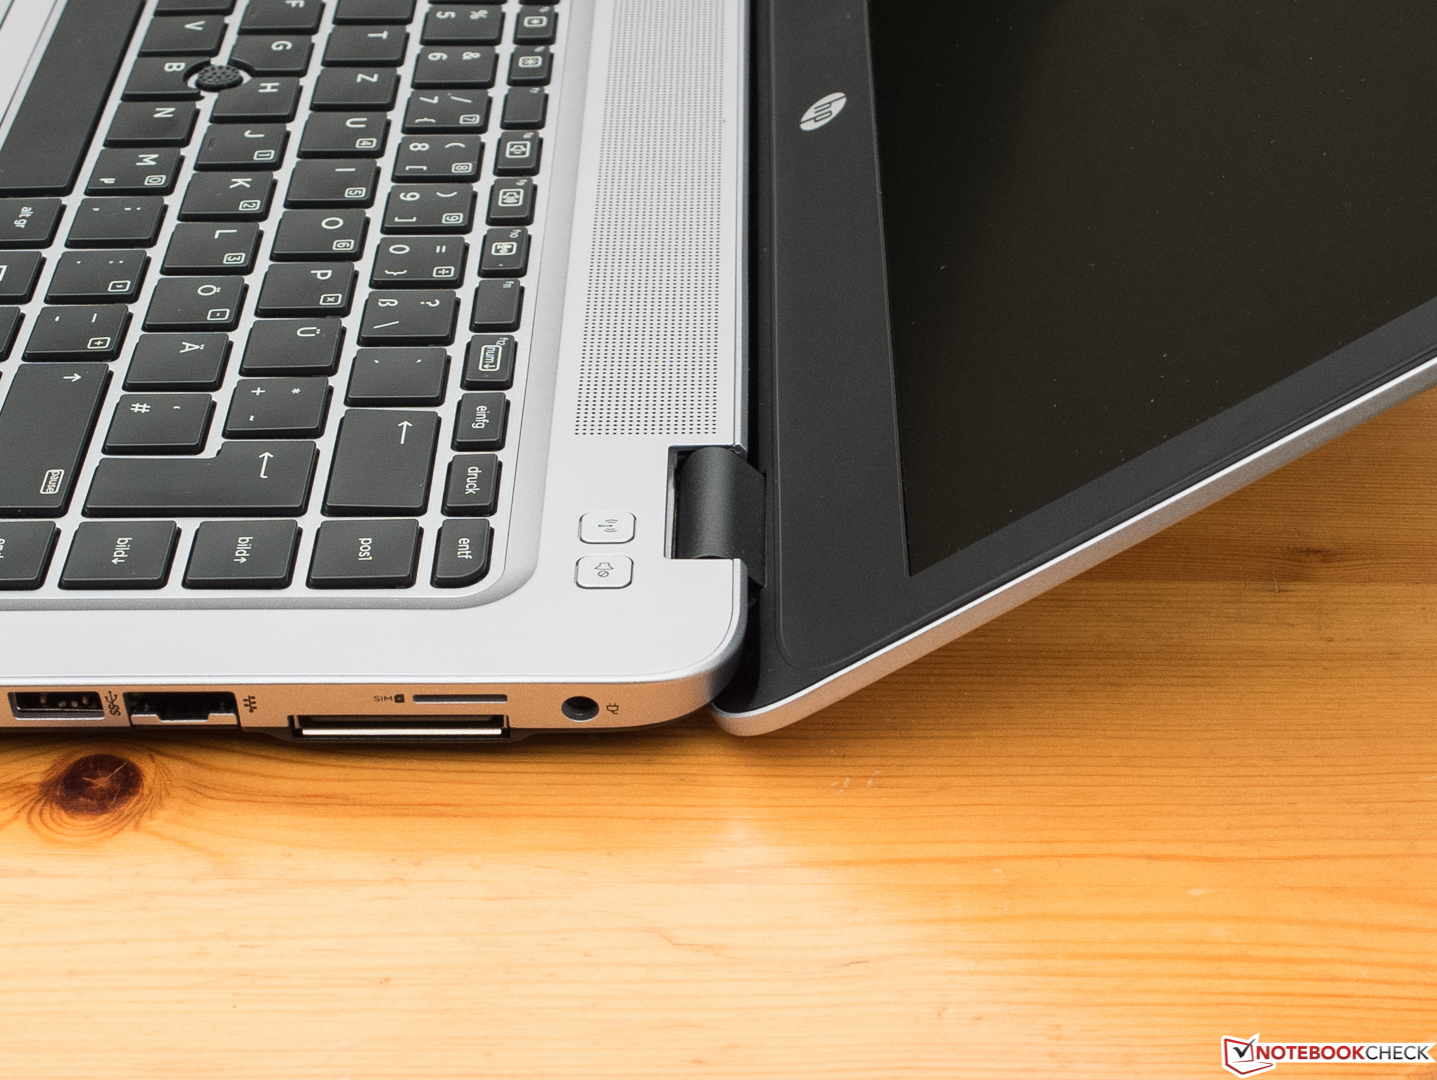
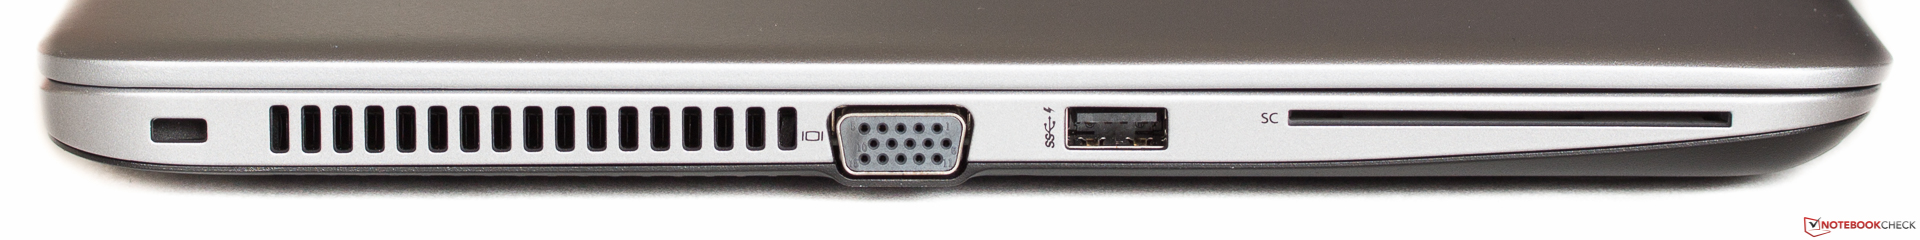
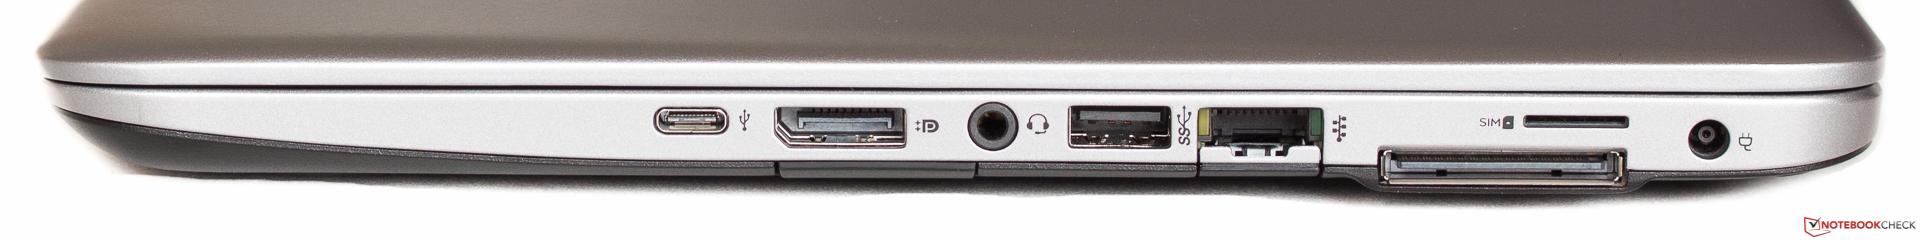
Connectivity
HP has implemented a modern USB Type-C port 3.1, but only Gen. 1, which is a typical USB 3.0 in terms of performance with another connector. DisplayPort or Thunderbolt are not supported by the port and you cannot use it to charge the device via USB Type-C. But there is no reason to moan, because you also get a full-size DisplayPort. This is rare since most notebooks – if at all –come with only a Mini-DisplayPort. The UltraSlim docking station, where you can put the 840 G3 on, comes with all the necessary ports including VGA d-Sub, DisplayPort or 4x USB 3.0. The dock retails for 140 to 150 Euros (~$159 to ~$170).
We use our Toshiba Exceria Pro SDXC 64 GB UHS-II reference SD card to check the performance of the card reader. The maximum transfer rate is up to 83.6 MB/s when you copy large files, while typical jpg-pictures (~5 MB each) are transferred at 61 MB/s. These are average results that we can see from many card readers.
Communication
Thanks to Ethernet (1 Gbps) and Dual-Band Wireless-AC 8260 as well as Bluetooth 4.1, you should not have any problems to establish wired or wireless connections. The Wi-Fi module supports Wireless Display, but the antennas do not seem to be as good as the recently reviewed Latitude E7470. The connection dropped at around 35 meters (~115 ft; outside the building) to the router (Fritz!Box 7490 AC). The E7470 still had a connection at 50 to 60 meters (~164 to 197 ft) in the same environment. An LTE modem is an optional extra, and the antennas are already integrated. The hs3110 HSPA+ broadband module costs around 103 Euros (~$117) from HP.
Webcam
The webcam produces mediocre results with low sharpness and washed-out colors. This is sufficient for Skype or similar applications, but you should take your smartphone for pictures.


Security
Kensington Lock and fingerprint are the obvious security features of the EliteBook 840 G3. There are even more when we look at the BIOS; the software as well as the sensors. An accelerometer is supposed to park the read/write heads of the HDD when the device is dropped. However, this would only be useful if the test device had such an HDD. As per usual for EliteBooks, the BIOS (controlled with the mouse) has numerous possibilities to activate/deactivate ports and hardware as well as the configuration of individual components, such as the Turbo Boost settings of the processor, for instance. The item Security includes the setup of a DriveLock for the storage drive or performs a Secure Erase. TPM 1.2 can be activated just like a Power-On password.
Accessories
Except for the 45-watt power adaptor, the EliteBook does not come with any accessories, but the manufacturer offers various additional items.
- HP DisplayPort-to-VDI-Adapter
- HP SATA-HDD, 500 GB, 7200 rpm
- HP SED Opal 2 Solid-State Disk 256 GB
- HP Display and Notebook II Stand
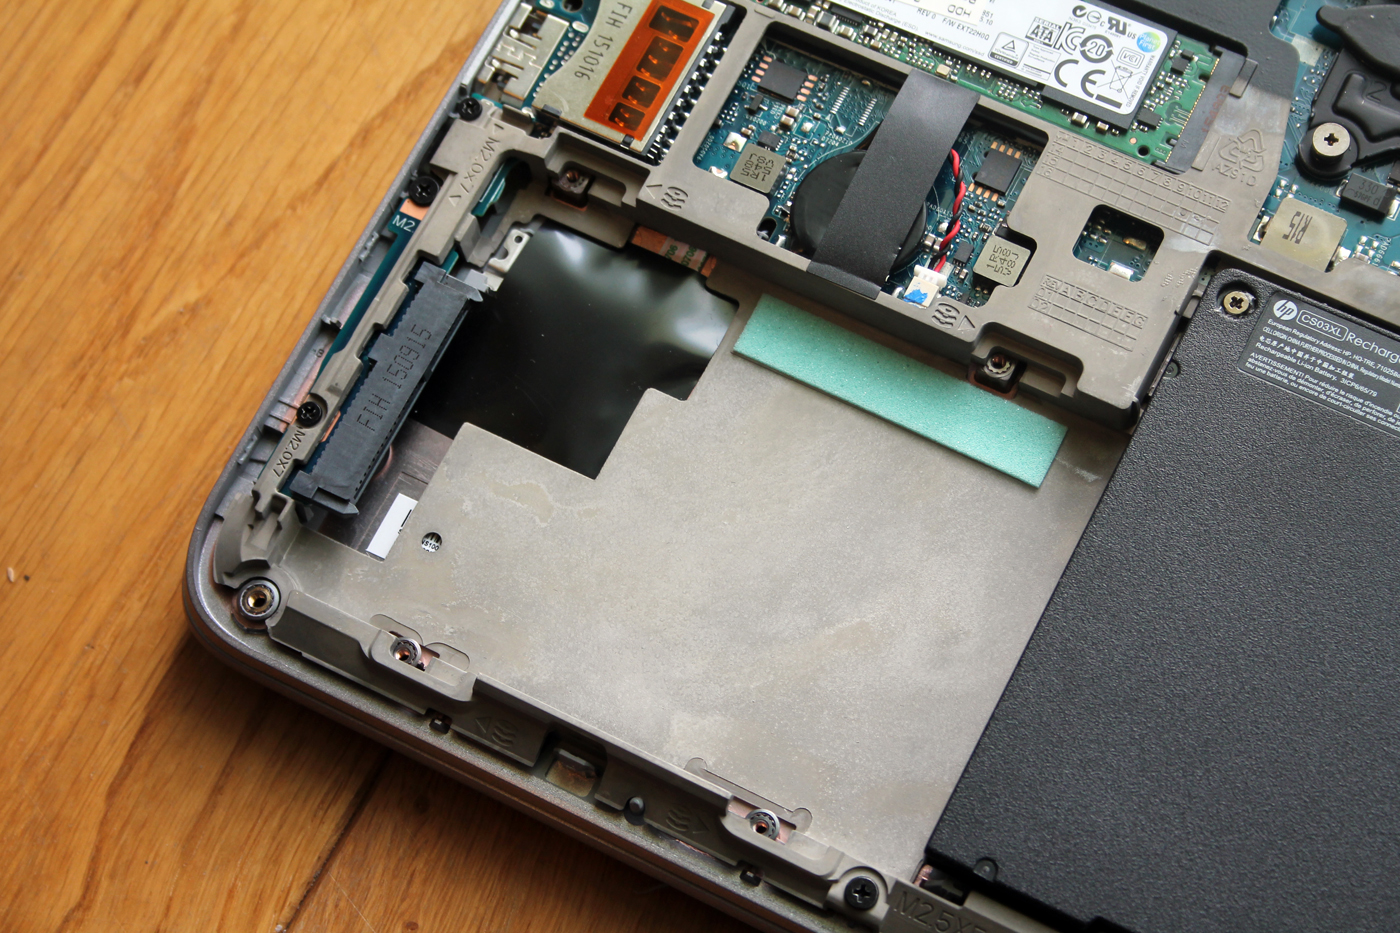
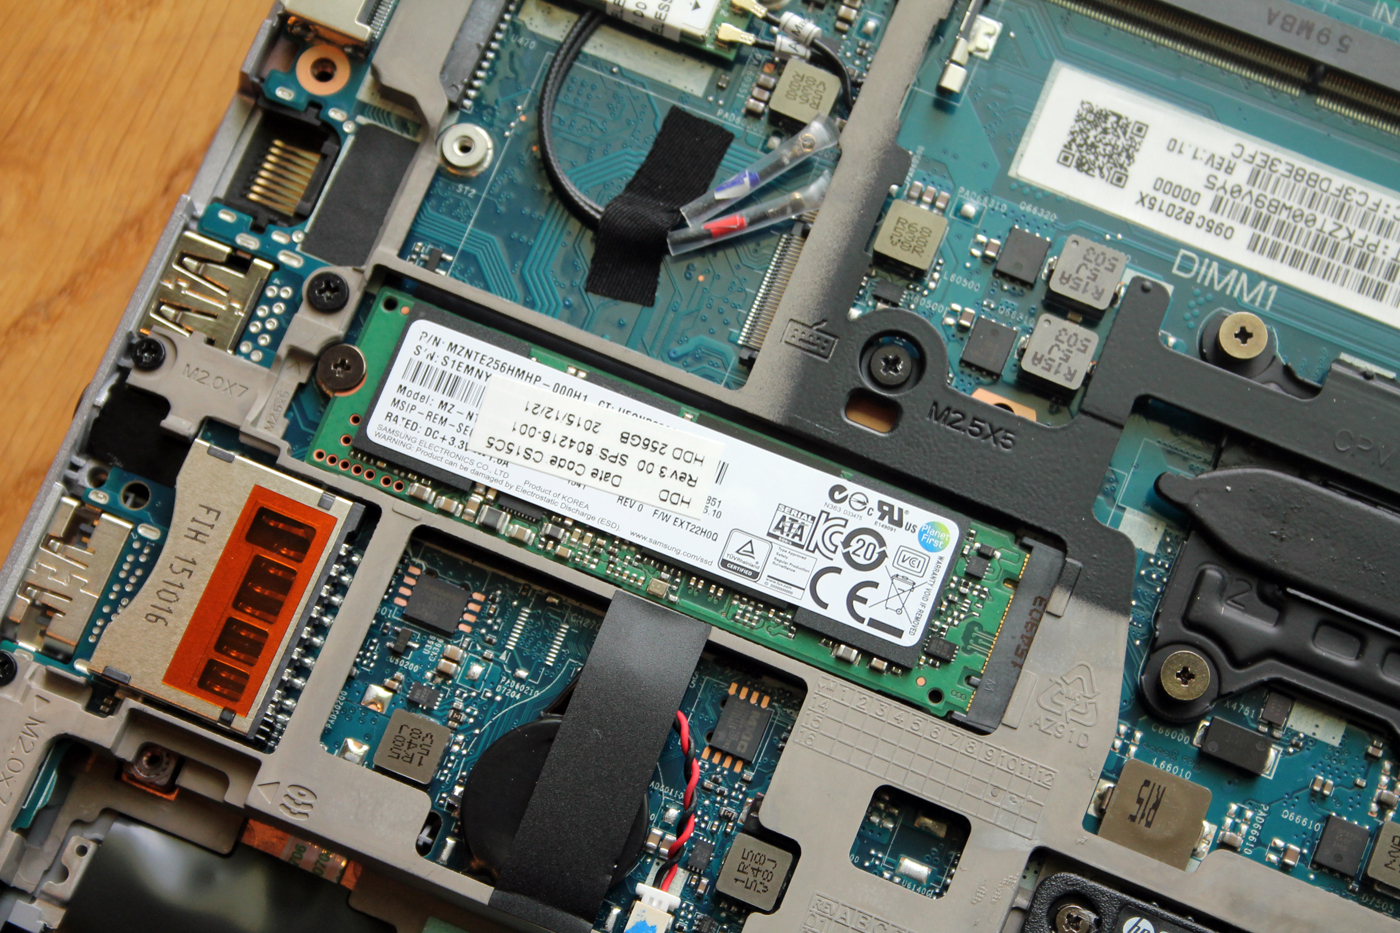
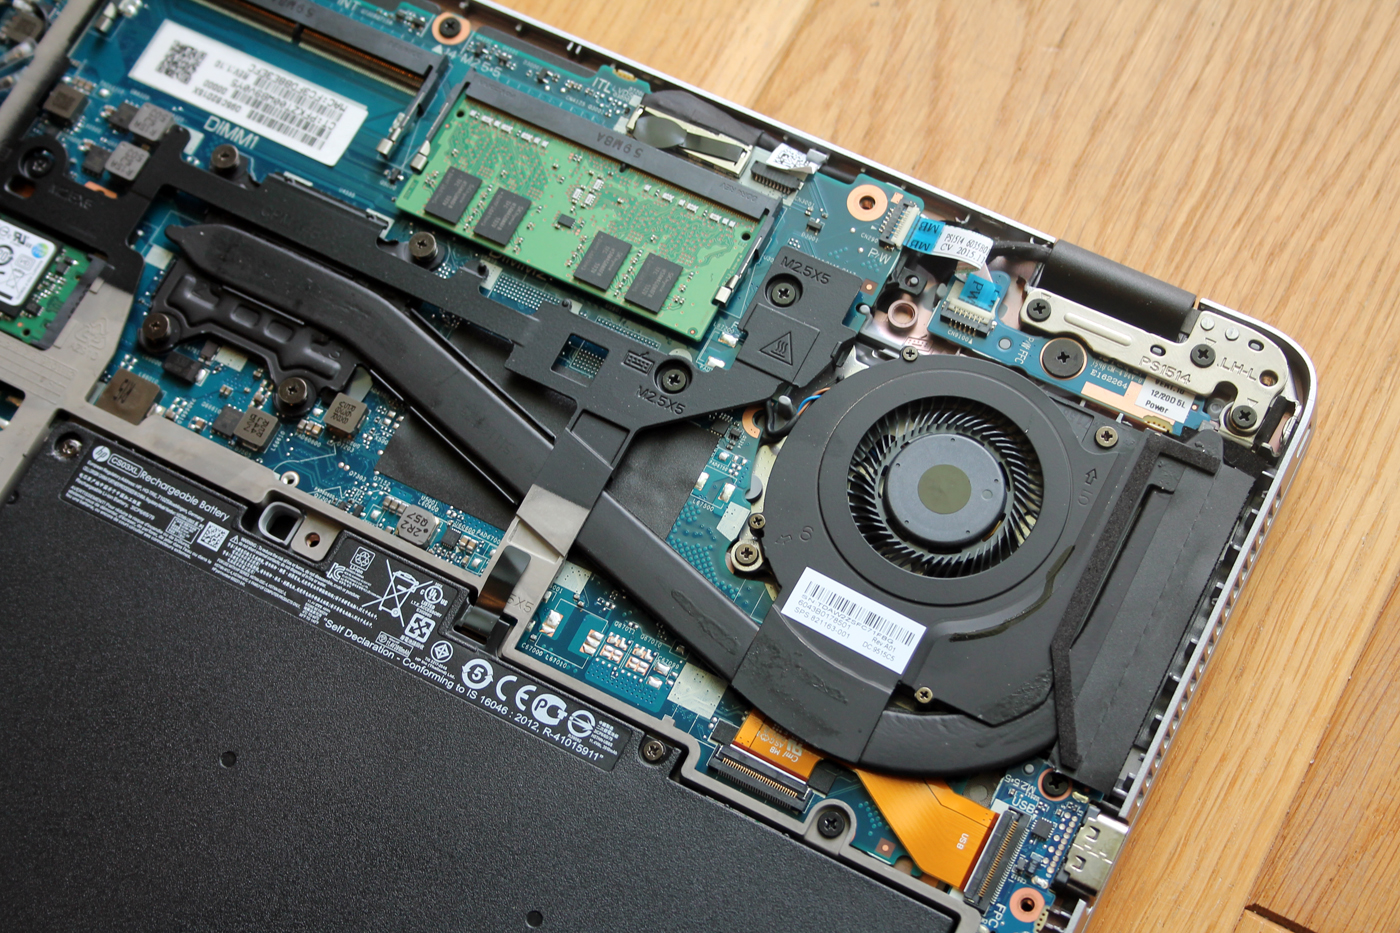
Maintenance
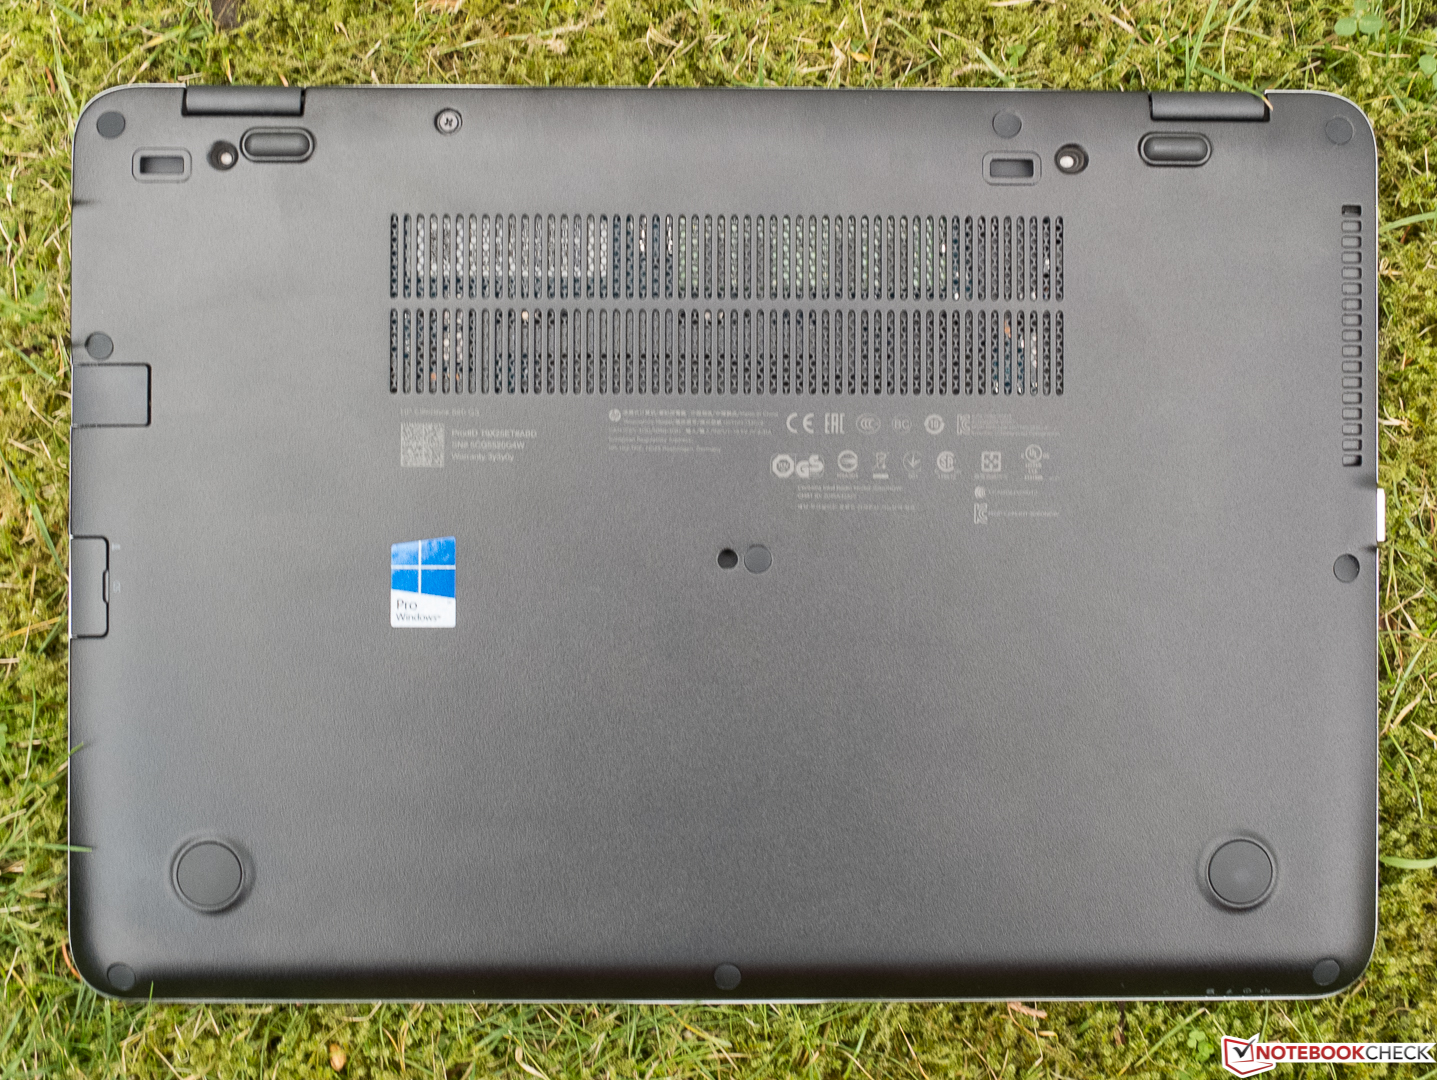
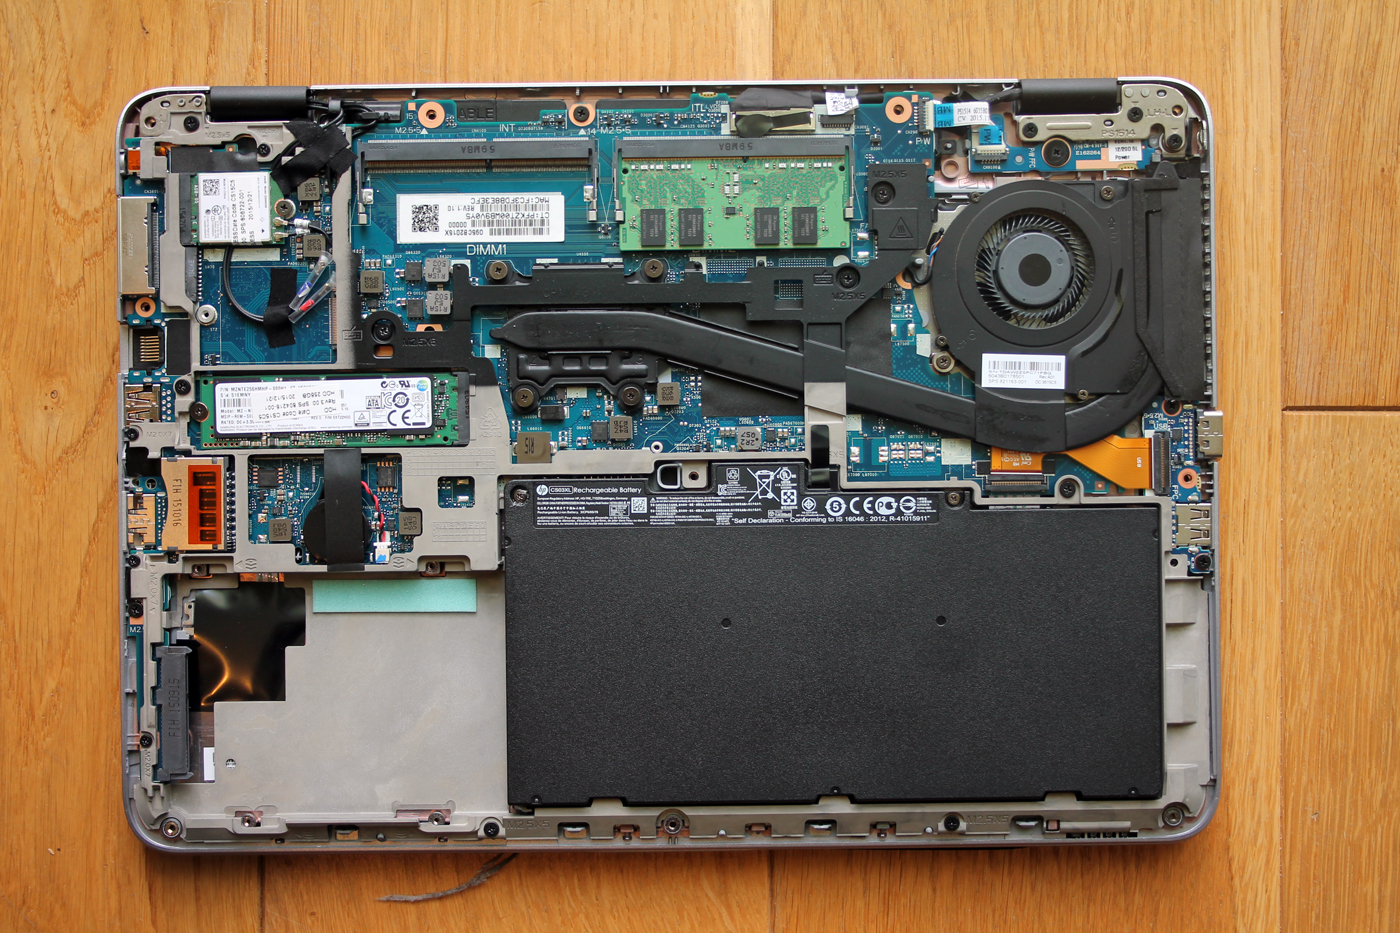
HP has dispensed with maintenance hatches for RAM upgrades and the like, the same as an easily replaceable battery. You have to remove the entire bottom cover, which is quite simple after the removal of rubber covers and Philips screws. After that you will find a nice collection of components that you can replace or upgrade, including the bolted battery.
Warranty
HP sells the EliteBook 840 G3 with a three-year warranty. Business customers can benefit from CarePacks when buying directly from the manufacturer. A one-year international hardware support (next business day) after the original warranty, for example, retails for around 260 Euros (~$295).
Input Devices
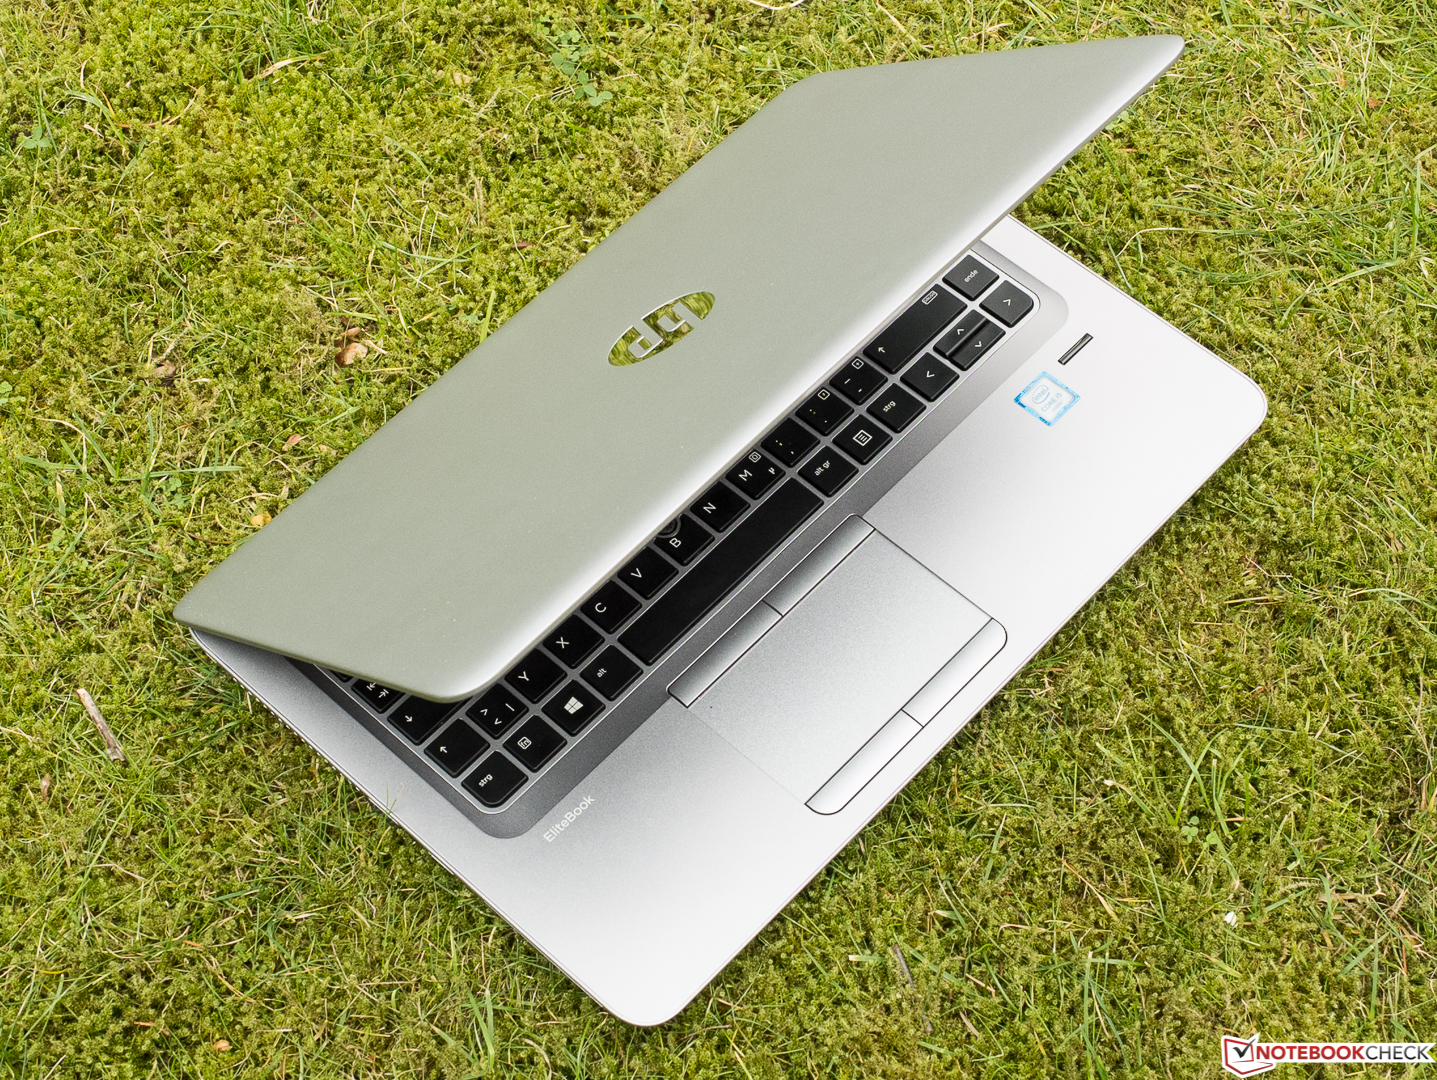
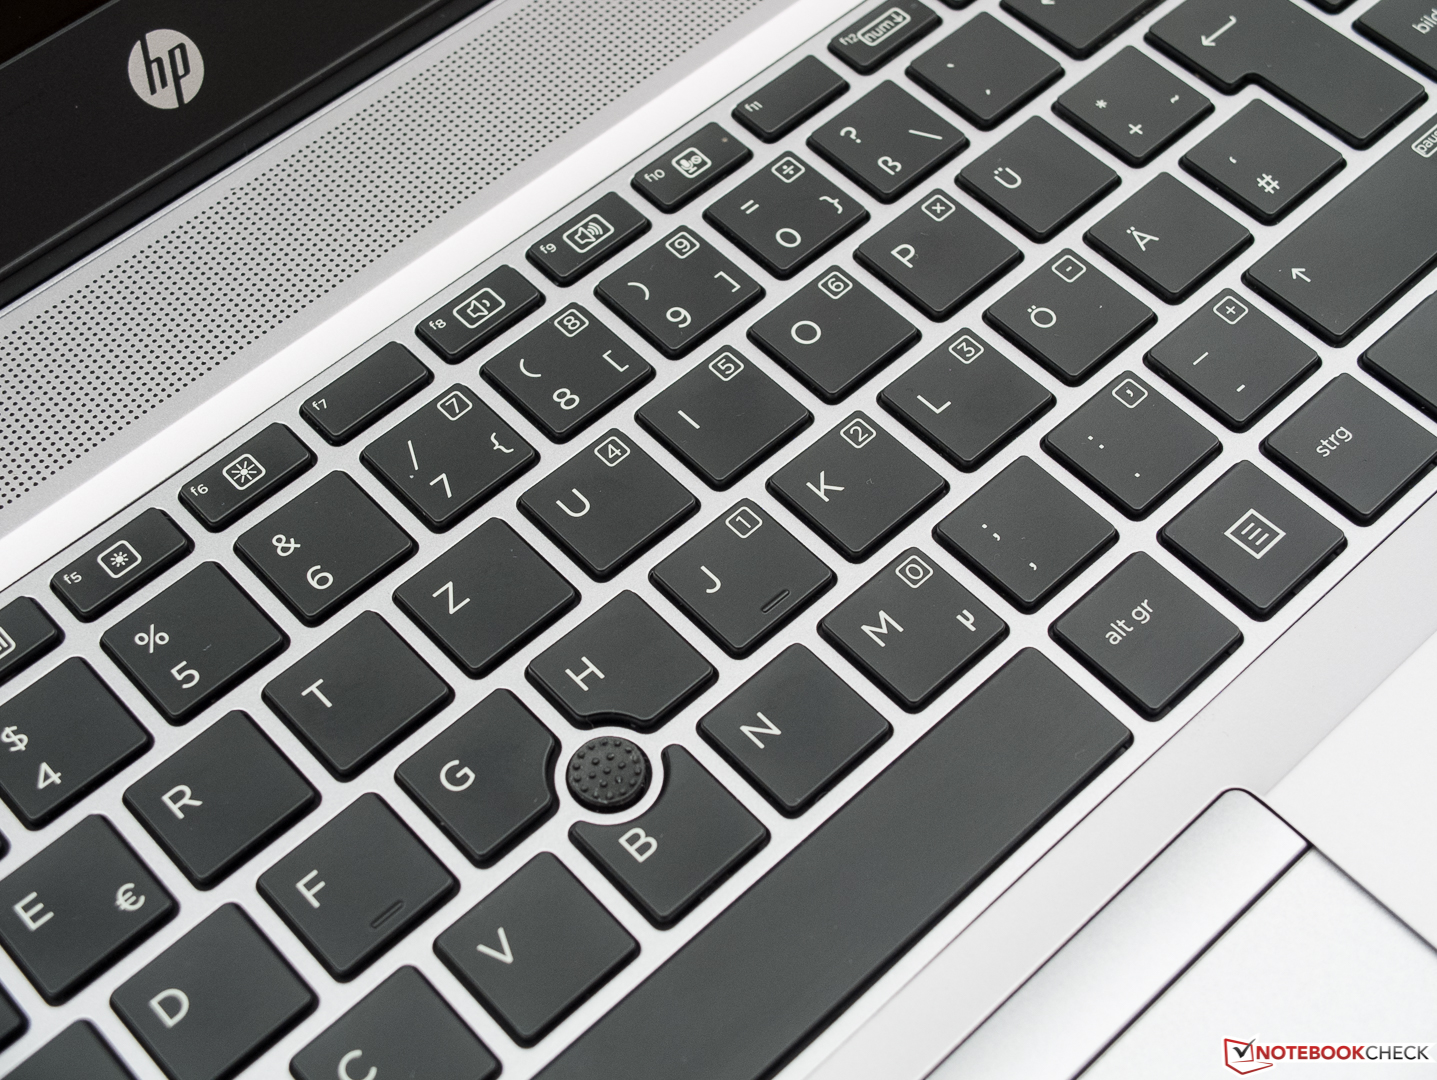
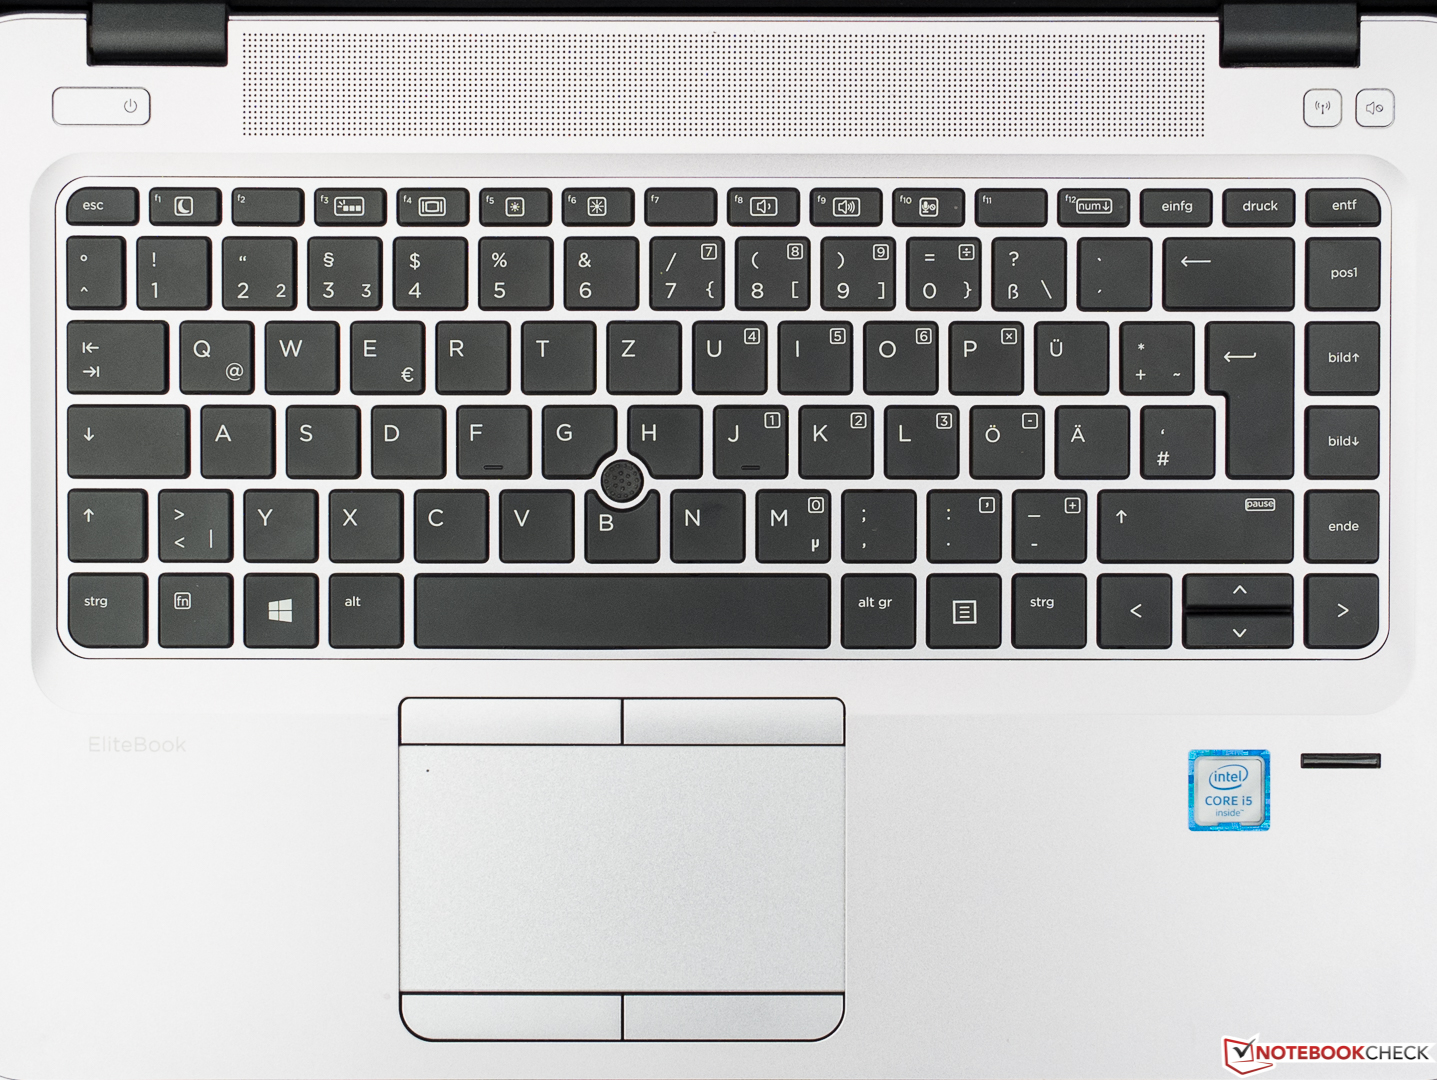
Keyboard
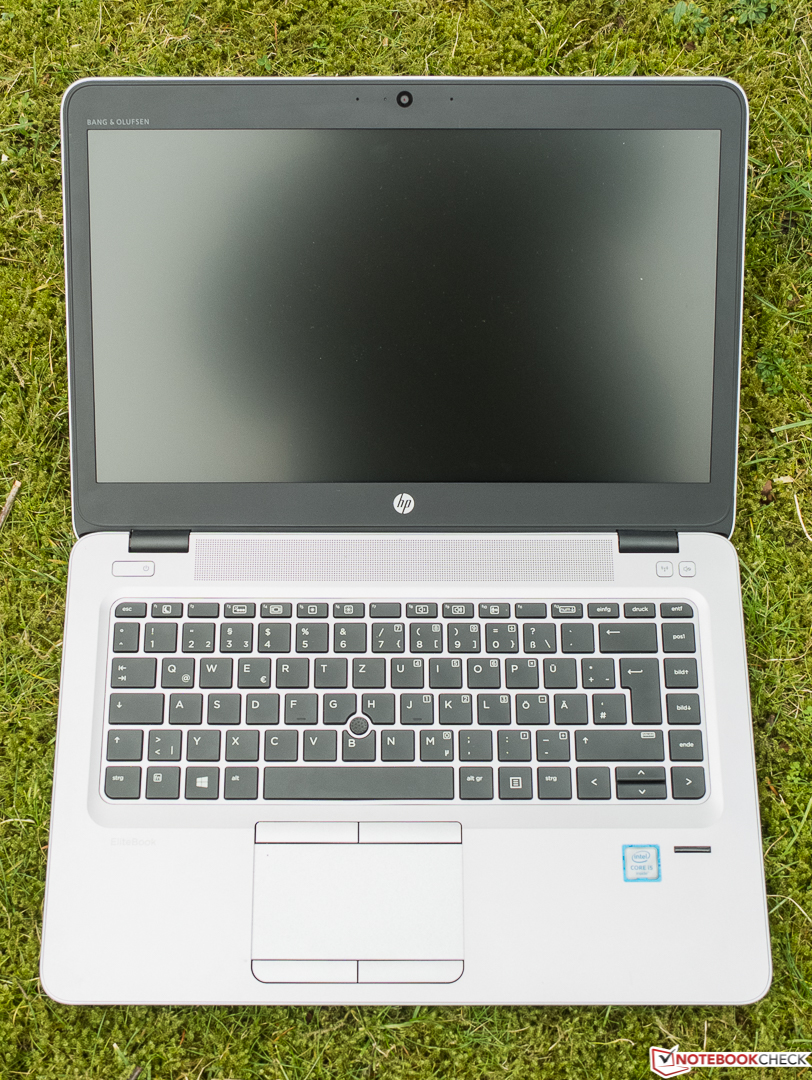
Very good input devices do not have to be changed constantly. HP follows this principle and has not changed them compared to the old G1/G2. Well, not quite, since the keys are on a silver perforated grid made of plastic and not on a black surface. The contours of the keys are now easier to see, but this is not important for 10-finger typing. The layout is identical, only the vertical arrow keys and the right Shift key are slightly wider. The keys are now sitting in a gently sloping depression, which was formerly created by a black plastic bed.
After these little changes, the keyboard with its firm pressure point and the average travel is still a convenient input device. A slight bouncing in the center – as in the predecessor – is no longer a problem. The keys are completely flat and there is no conical curvature. Unfortunate, since the Latitude E7470 and the T460s are better in this respect. The latter also provides more travel and a better feedback in general.
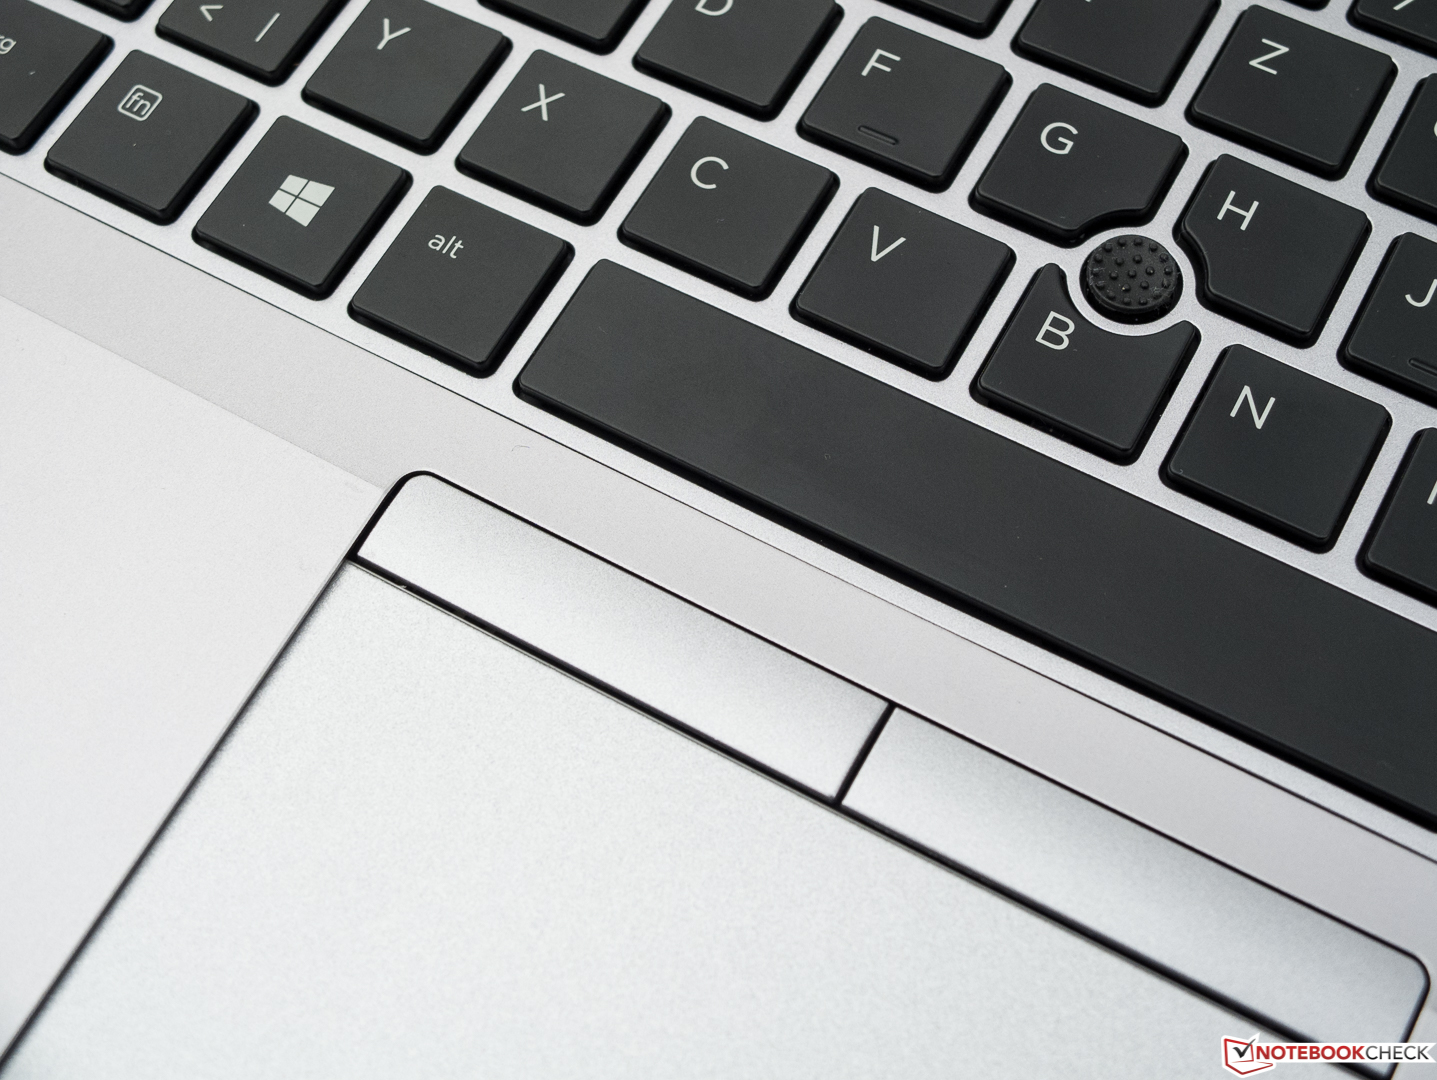
Touchpad & TrackPoint
The touchpad provides excellent gliding capabilities and precision. The two corresponding mouse buttons have a conveniently firm but cushioned stroke and a well-defined pressure point. The pad is responsive up into the peripheral areas and has a smooth surface. It can be deactivated via a double tap on a small dot (which will then light up).
Another alternative to control the cursor is the so called Pointstick. It is a matter of getting used to, but a precise and very ergonomic control of the cursor is definitely possible. The small joystick has two dedicated buttons. Unfortunately, unlike the Latitude E7470, there is no scroll functionality.
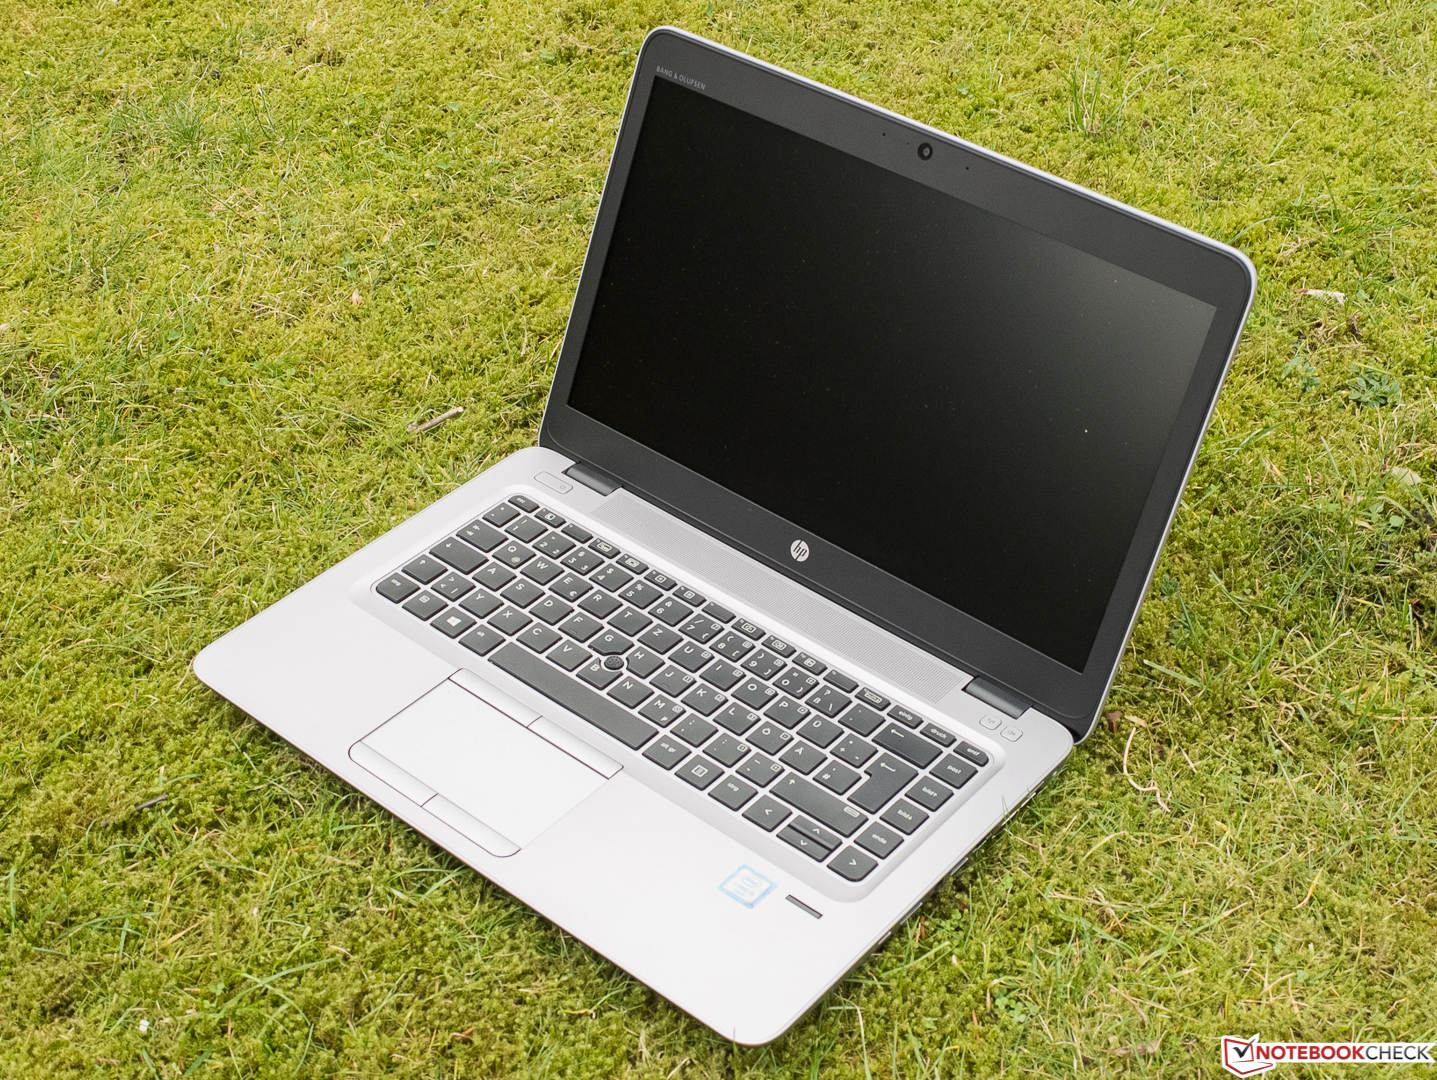
Display
The 14-inch device (16:9) has 1920x1080 pixels (Full HD). The Chi Mei CMN14C0 panel has an anti-reflective surface and a high luminance, which is not reduced on battery power. Other display options are HD (1366x768 TN matte) and WQHD (2560x1440 IPS matte). HP uses PWM to reduce the luminance when the brightness is reduced to below 90%. Unfortunately, the frequency is low at 204 Hz, which some users will notice as flickering.
The black value of 0.65 is bad, because it is far too high, so the resulting contrast ratio is quite low at 563:1. Subjectively, you can notice pale colors and a gray hue on black surfaces. The competition performs better; all the comparison devices are equipped with IPS panels and mange contrast values of above 800:1.
Update 04/18/2016: Information about the WQHD panel in the Display section II below.
| |||||||||||||||||||||||||
Brightness Distribution: 87 %
Center on Battery: 346 cd/m²
Contrast: 563:1 (Black: 0.65 cd/m²)
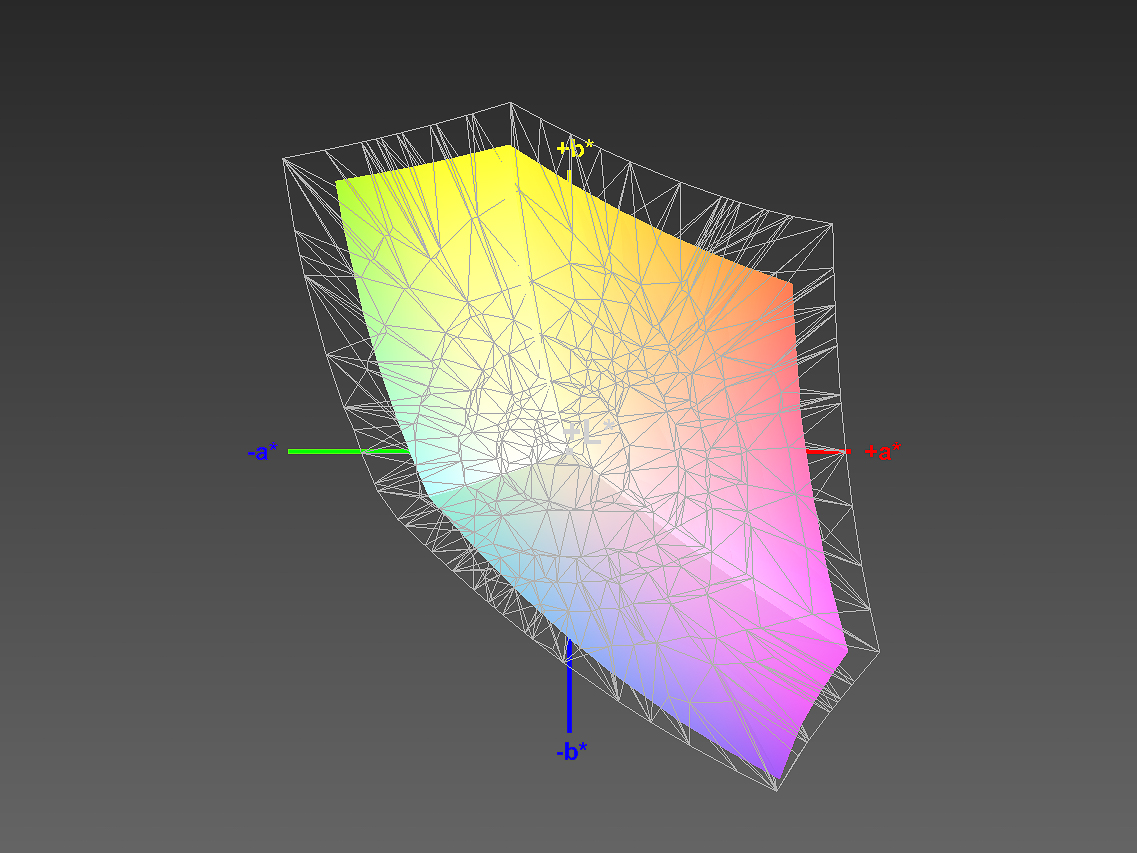
ΔE ColorChecker Calman: 10.26 | ∀{0.5-29.43 Ø4.75}
ΔE Greyscale Calman: 11.51 | ∀{0.09-98 Ø5}
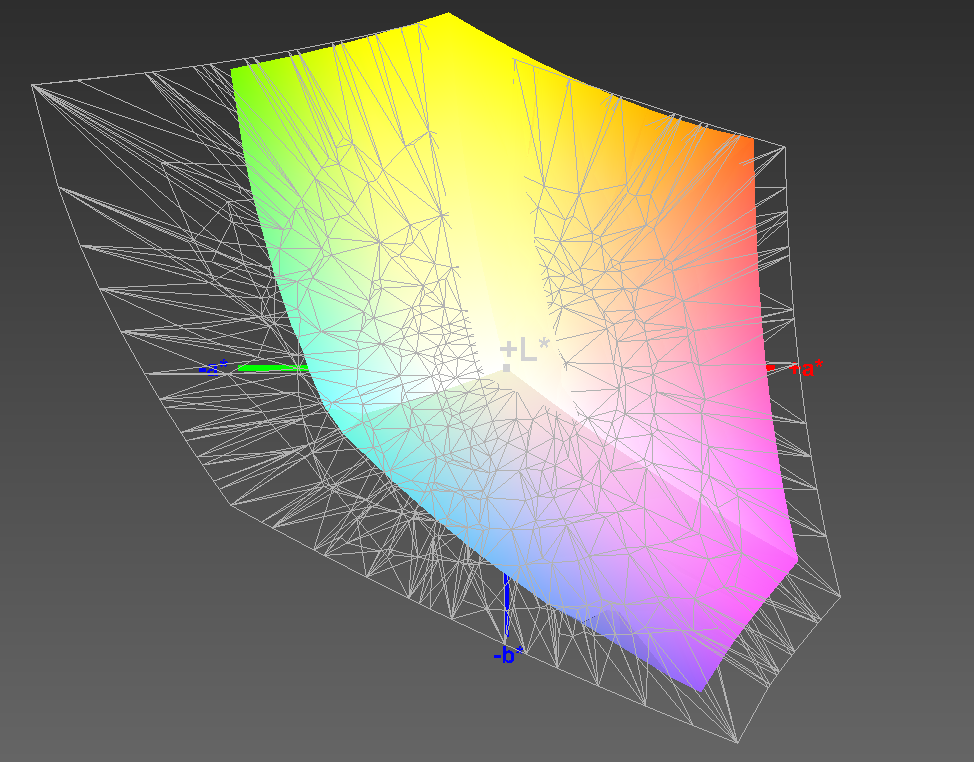
74% sRGB (Argyll 1.6.3 3D)
47% AdobeRGB 1998 (Argyll 1.6.3 3D)
50.5% AdobeRGB 1998 (Argyll 3D)
73.7% sRGB (Argyll 3D)
48.93% Display P3 (Argyll 3D)
Gamma: 2.4
CCT: 12725 K
| HP EliteBook 840 G3 T9X59ET#ABD FHD 1920x1080 TN | Dell Latitude 14 7000 Series E7470 WQHD 2560x1440 IPS Touch | Lenovo ThinkPad T460s-20F9003SGE FHD 1920x1080 IPS | Lenovo ThinkPad T460s-20FA003GGE WQHD 2560x1440 IPS | HP EliteBook Folio 1040 G3 WQHD 2560x1440 IPS | Acer TravelMate P645-S-58HK FHD 1920x1080 IPS | |
|---|---|---|---|---|---|---|
| Display | 35% | -15% | 37% | 36% | 30% | |
| Display P3 Coverage (%) | 48.93 | 67.2 37% | 41.65 -15% | 68.7 40% | 67.9 39% | 66.7 36% |
| sRGB Coverage (%) | 73.7 | 95.9 30% | 61.6 -16% | 98.1 33% | 96.8 31% | 90.8 23% |
| AdobeRGB 1998 Coverage (%) | 50.5 | 69.3 37% | 43.14 -15% | 70.4 39% | 70 39% | 66.5 32% |
| Response Times | -10% | -8% | 0% | -7% | ||
| Response Time Grey 50% / Grey 80% * (ms) | 43 ? | 48 ? -12% | 42 ? 2% | 35.6 ? 17% | 46.4 ? -8% | |
| Response Time Black / White * (ms) | 25 ? | 27 ? -8% | 29.2 ? -17% | 29.2 ? -17% | 26.4 ? -6% | |
| PWM Frequency (Hz) | 204 ? | 220 ? | ||||
| Screen | 46% | 14% | 29% | 31% | 25% | |
| Brightness middle (cd/m²) | 366 | 380 4% | 226 -38% | 257 -30% | 327 -11% | 331 -10% |
| Brightness (cd/m²) | 336 | 354 5% | 211 -37% | 248 -26% | 316 -6% | 309 -8% |
| Brightness Distribution (%) | 87 | 81 -7% | 89 2% | 94 8% | 87 0% | 82 -6% |
| Black Level * (cd/m²) | 0.65 | 0.26 60% | 0.22 66% | 0.26 60% | 0.35 46% | 0.4 38% |
| Contrast (:1) | 563 | 1462 160% | 1027 82% | 988 75% | 934 66% | 828 47% |
| Colorchecker dE 2000 * | 10.26 | 3.11 70% | 6.44 37% | 4.59 55% | 4.39 57% | 4.07 60% |
| Greyscale dE 2000 * | 11.51 | 4.35 62% | 5.87 49% | 6.38 45% | 4.69 59% | 4.86 58% |
| Gamma | 2.4 92% | 2.37 93% | 2.37 93% | 2.51 88% | 2.15 102% | 2.49 88% |
| CCT | 12725 51% | 6771 96% | 6856 95% | 6238 104% | 7101 92% | 6109 106% |
| Color Space (Percent of AdobeRGB 1998) (%) | 47 | 62 32% | 39.58 -16% | 65 38% | 62.52 33% | 59 26% |
| Color Space (Percent of sRGB) (%) | 74 | 96 30% | 61.15 -17% | 98 32% | 96.71 31% | 90.6 22% |
| Colorchecker dE 2000 max. * | 6.73 | 17.18 | 9.72 | 7.27 | ||
| Total Average (Program / Settings) | 24% /
36% | -3% /
5% | 22% /
26% | 20% /
26% | 28% /
27% |
* ... smaller is better
We use a spectrophotometer to determine the color space, and the result is just as bad as the contrast. sRGB is covered by just 74%, which will not be sufficient for professional graphic artists, because the panel just cannot display some colors. Other colors suffer from a distinct blue cast. This is the situation ex-works, but the effect can be reduced significantly with the linked color profile. This will not help much though, because the panel has DeltaE deviations of 10 and 11.5 (ColorChecker and Grayscale), respectively. The target area should be a value less than 3. The IPS based rivals do not manage this either, but they are much closer with results between 3 to 5. This means that the colors on the panel do not really represent defined colors of the sRGB reference. The differences are easy to see with the naked eye, which is supported by the high DeltaE and you can see it in the CalMAN saturation screenshot under Target and Actual.

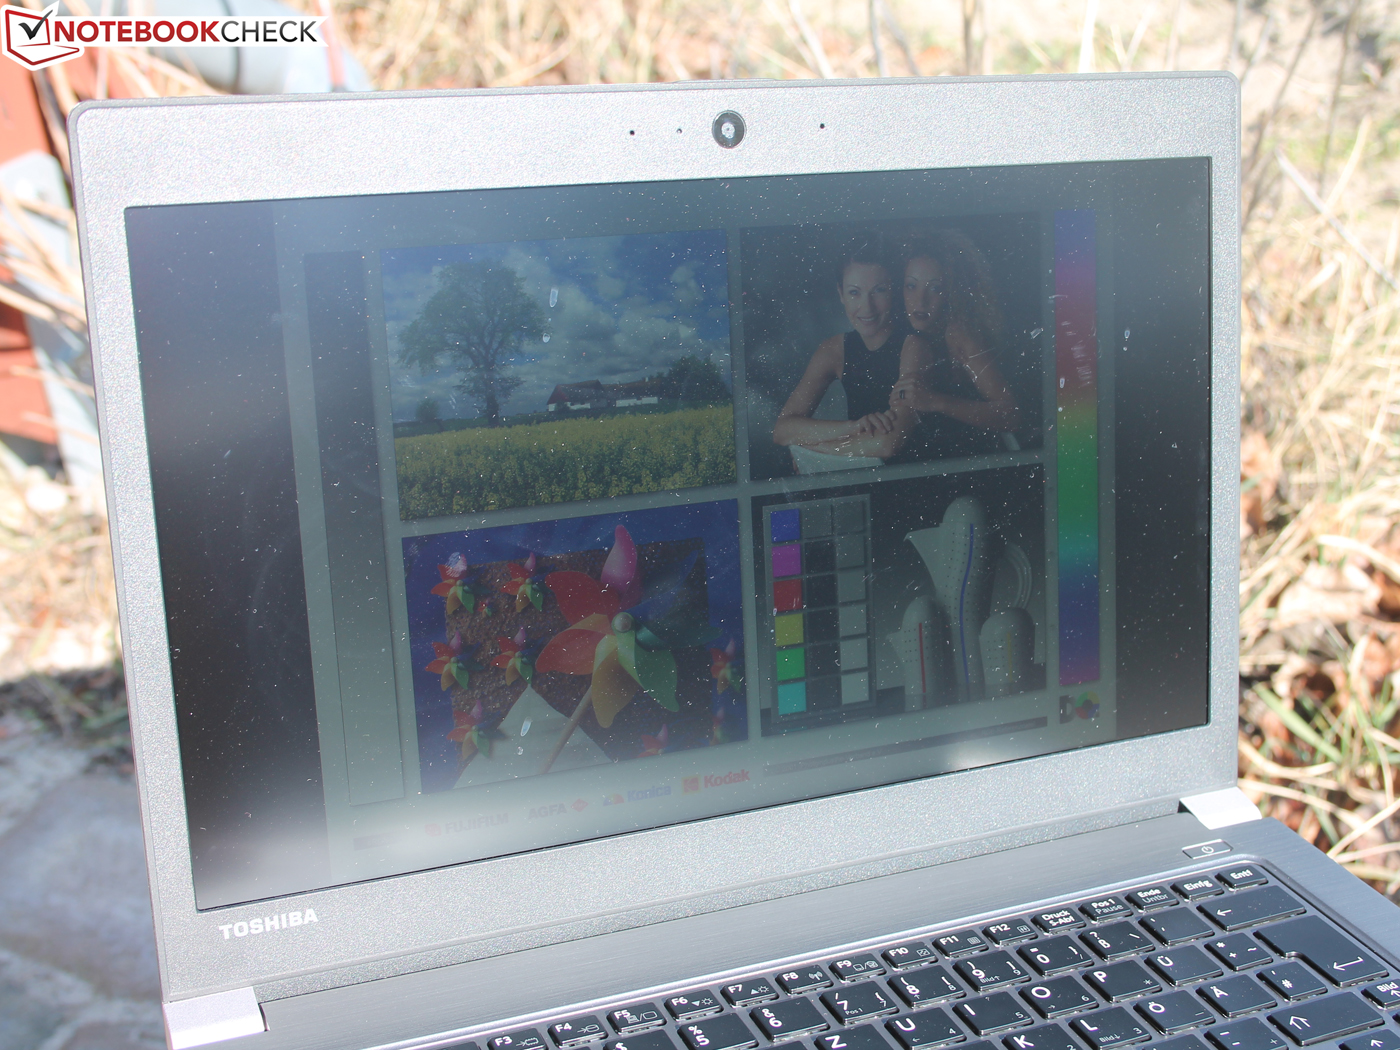
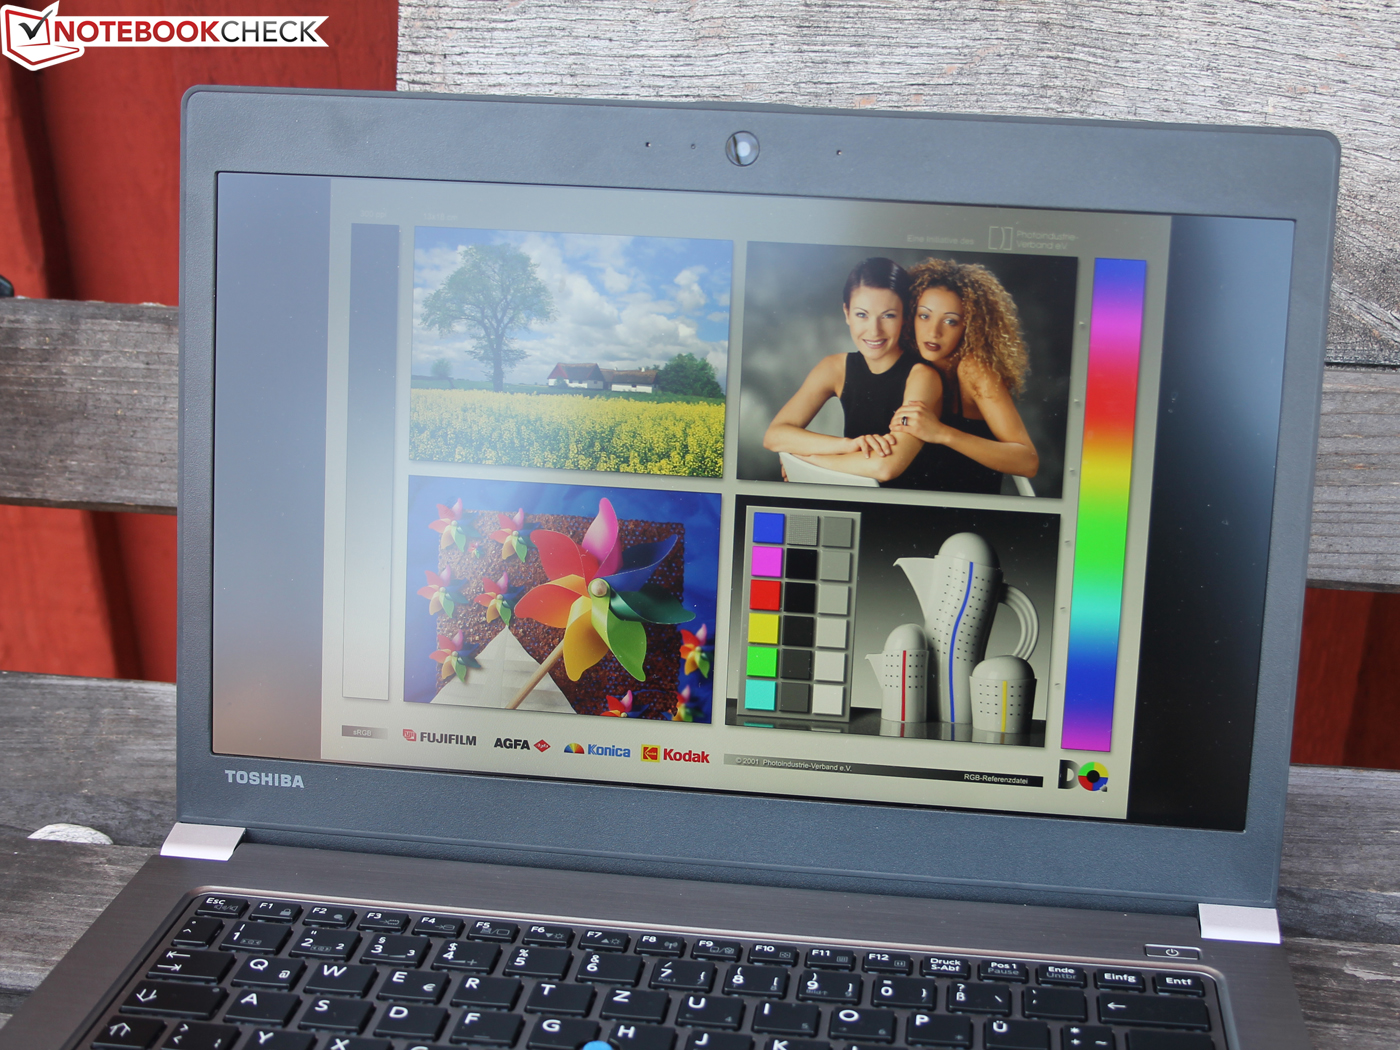
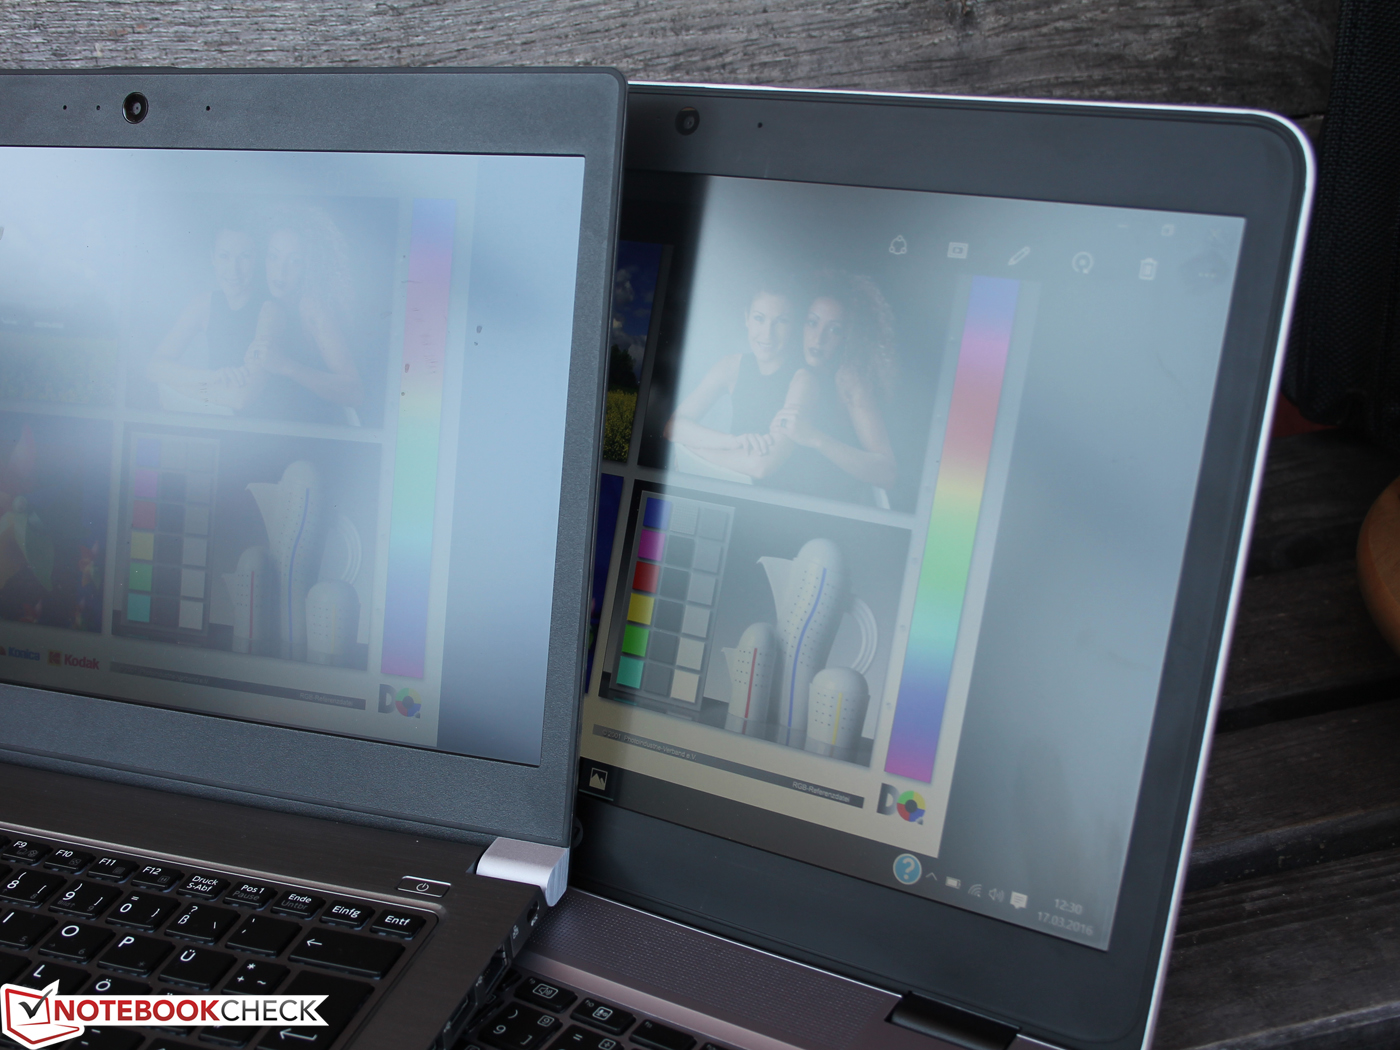
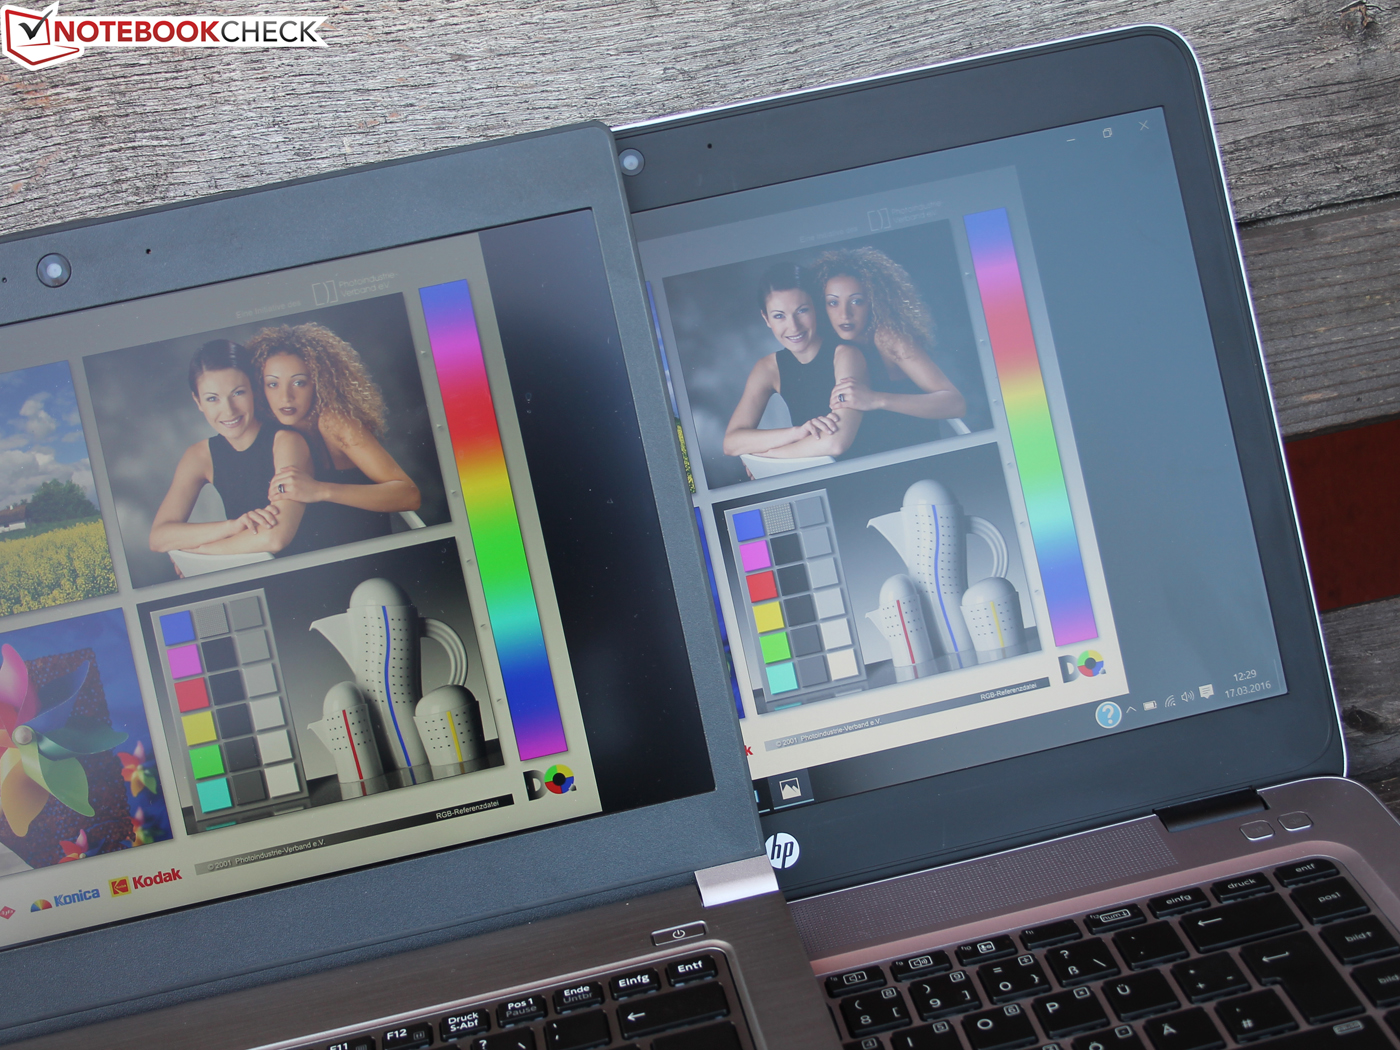
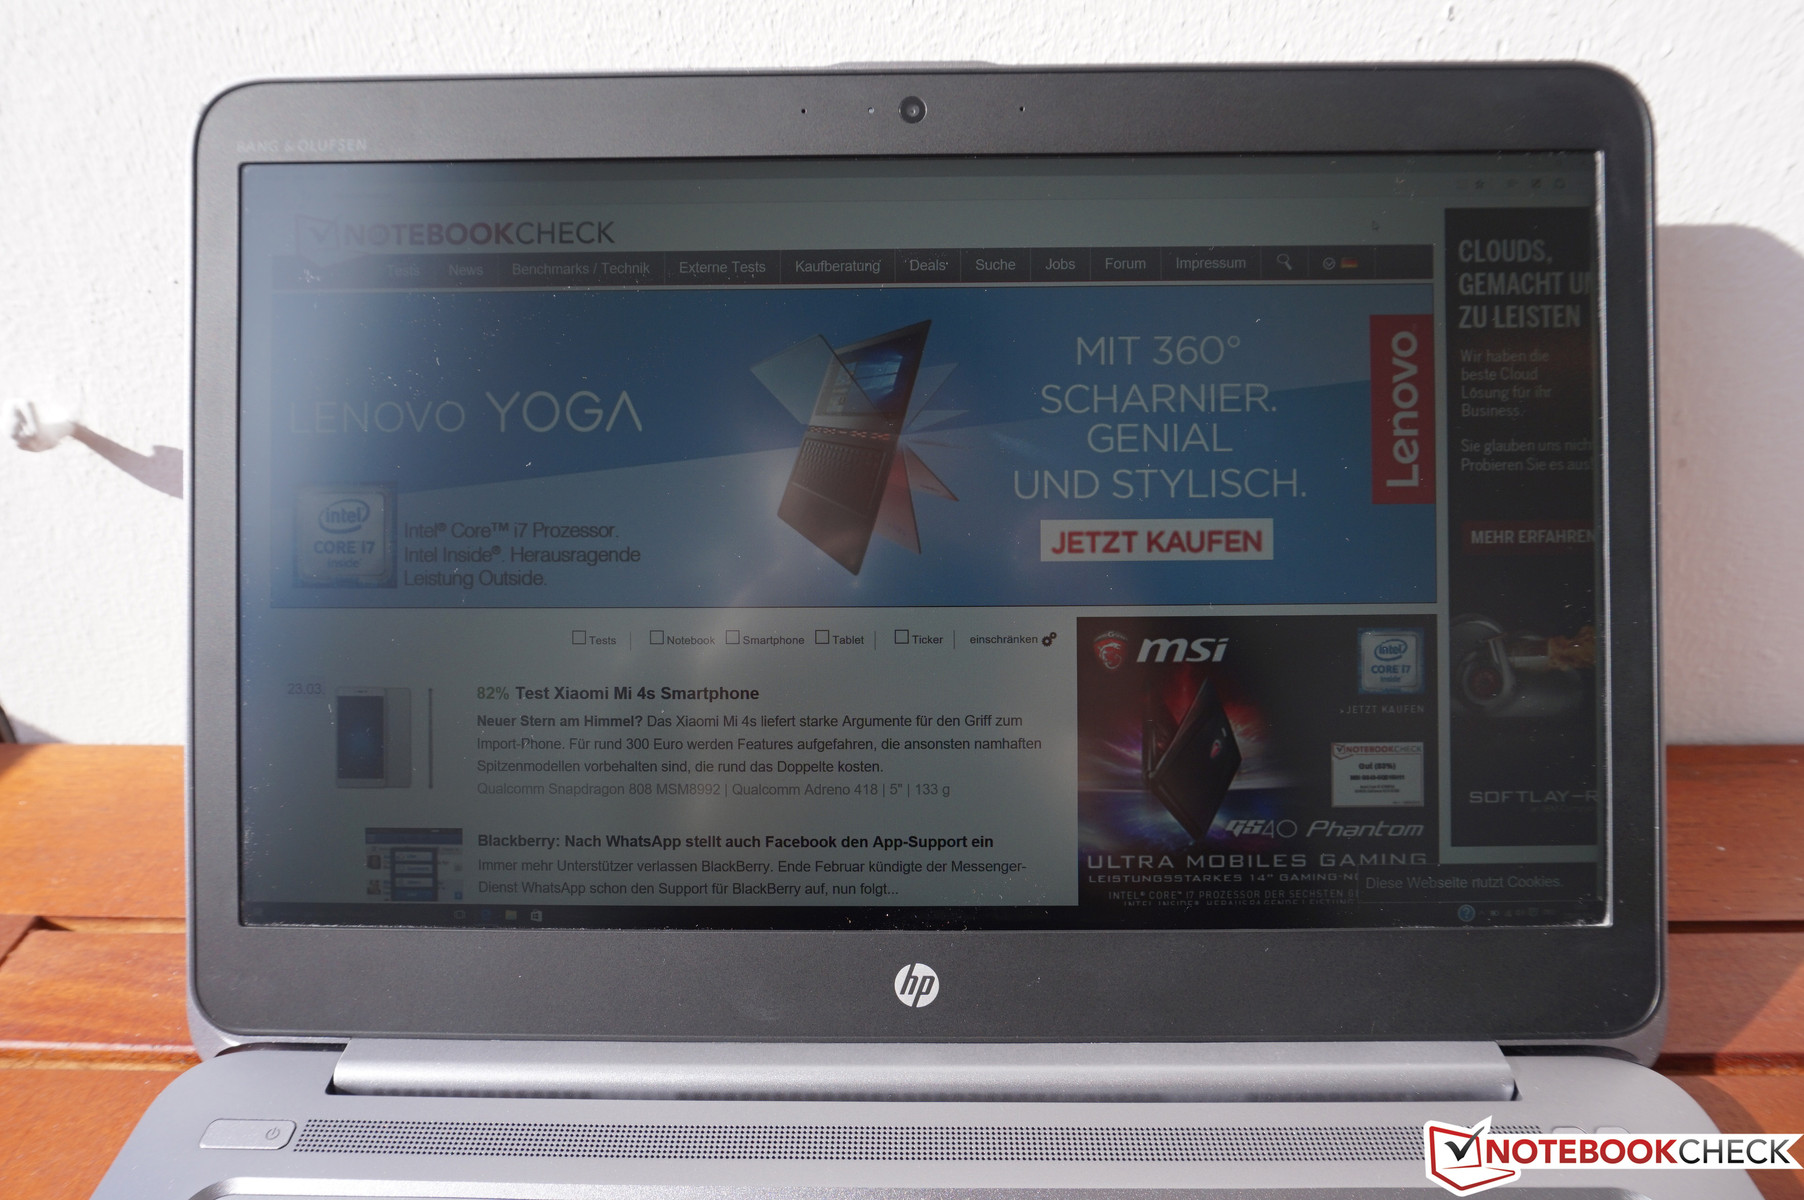
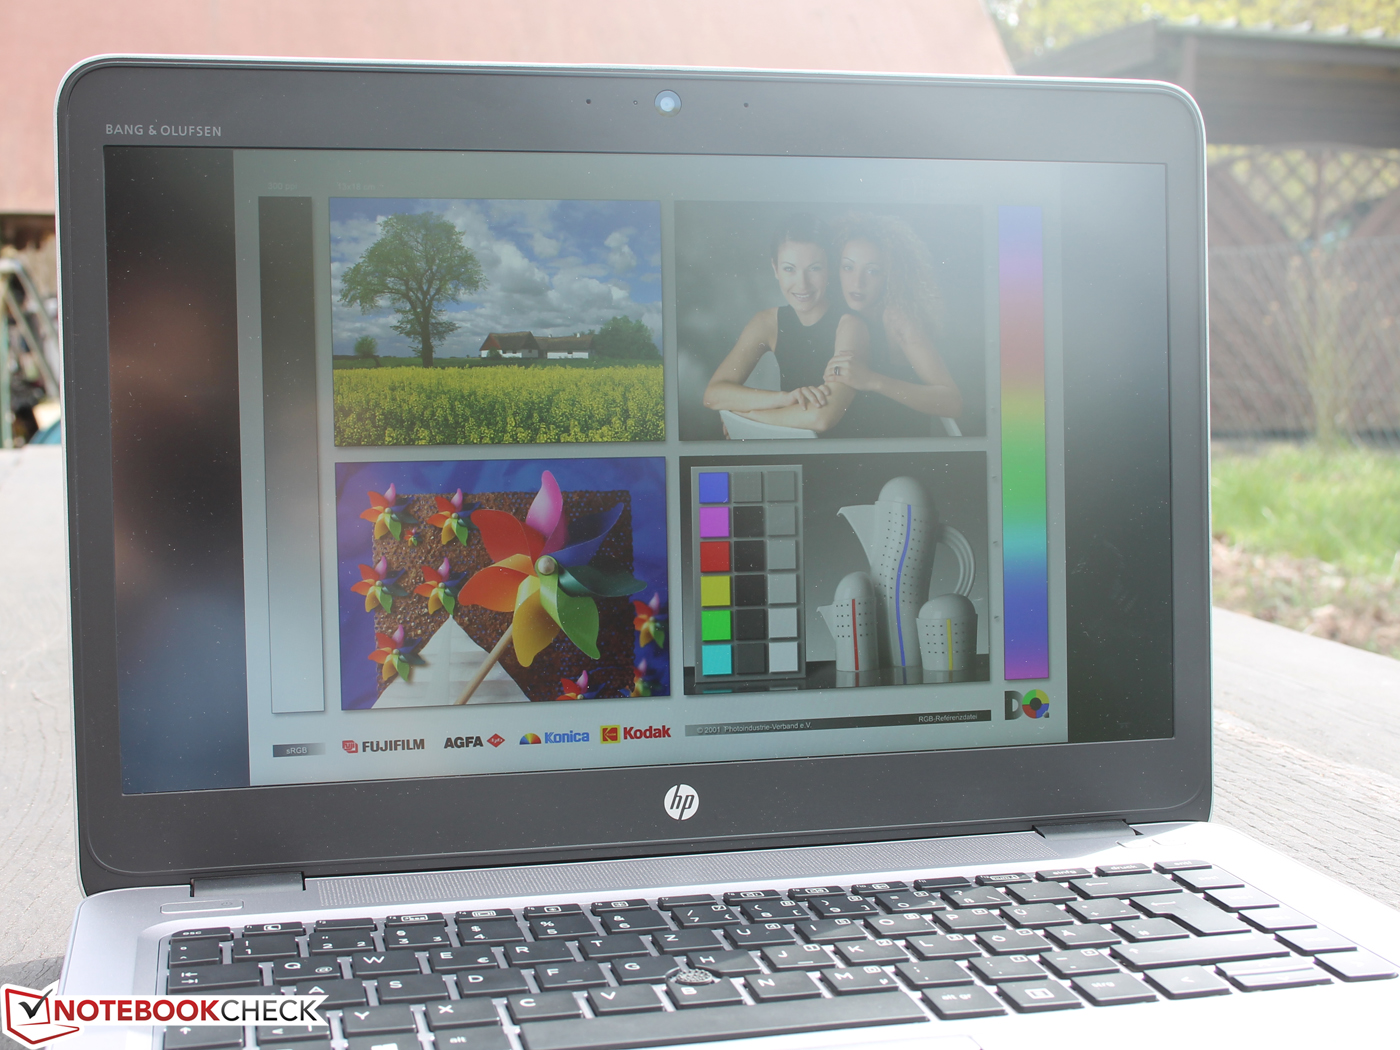
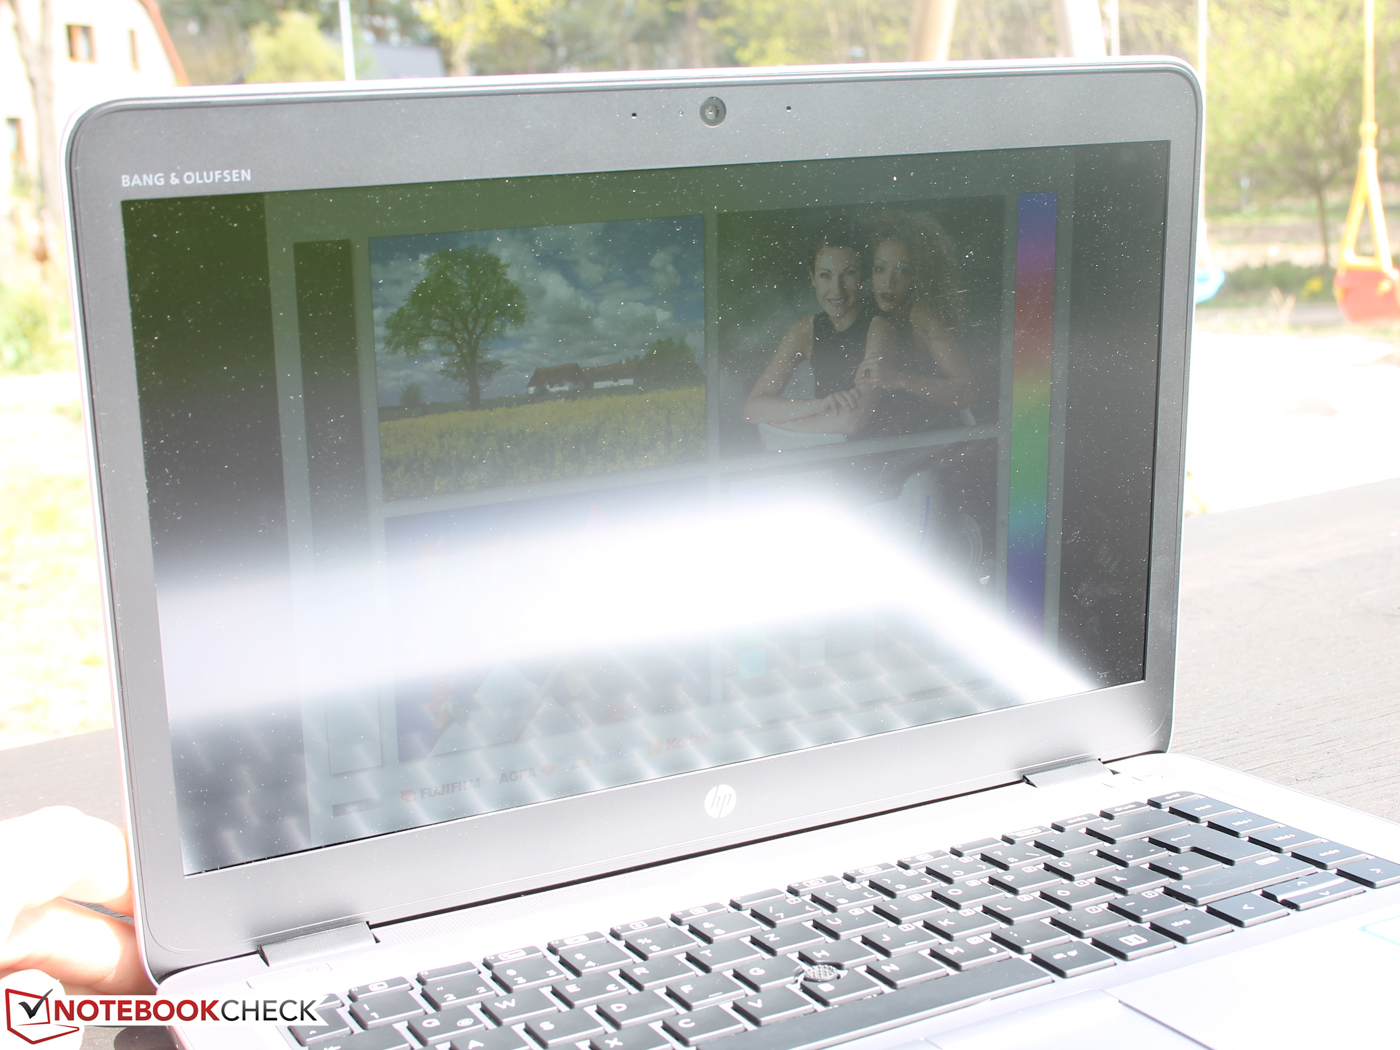
High luminance and anti-reflective surface ensure good outdoor capabilities, especially since there is no brightness sensor interfering, where the luminance is adjusted to the ambient light, for example. You can see a comparison between the matte IPS panel of the Toshiba Z30-C and the matte TN panel of the review unit on the last screenshot. The paler colors of the review unit are quite easy to see. HP uses matte IPS panels, such as the one in the Folio 1040 G3. It would be a real advancement if this WQHD panel was inside the 840 G3. The contrast is much better and sRGB is covered almost completely.
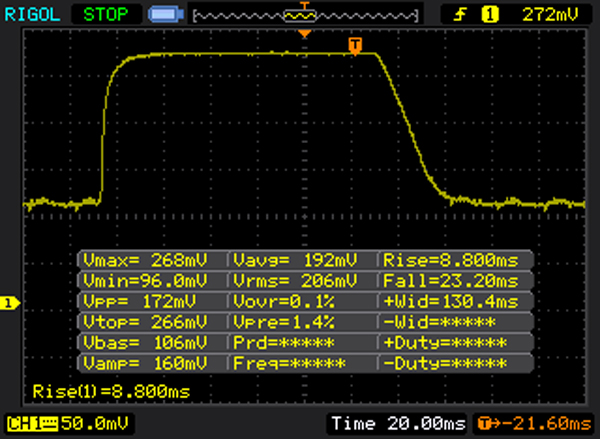
Display Response Times
| ↔ Response Time Black to White | ||
|---|---|---|
| 25 ms ... rise ↗ and fall ↘ combined | ↗ 9 ms rise | 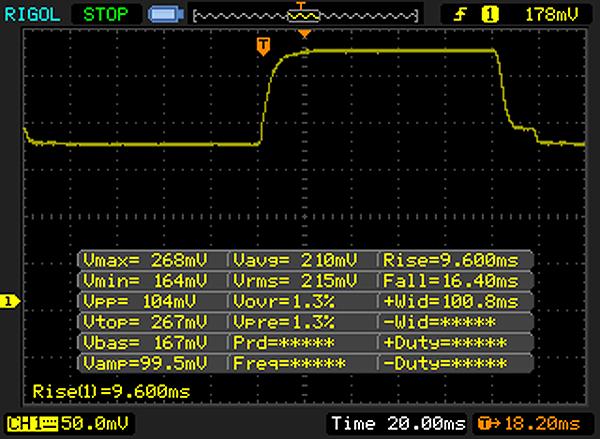 |
| ↘ 16 ms fall | ||
| The screen shows relatively slow response rates in our tests and may be too slow for gamers. In comparison, all tested devices range from 0.1 (minimum) to 240 (maximum) ms. » 58 % of all devices are better. This means that the measured response time is worse than the average of all tested devices (20 ms). | ||
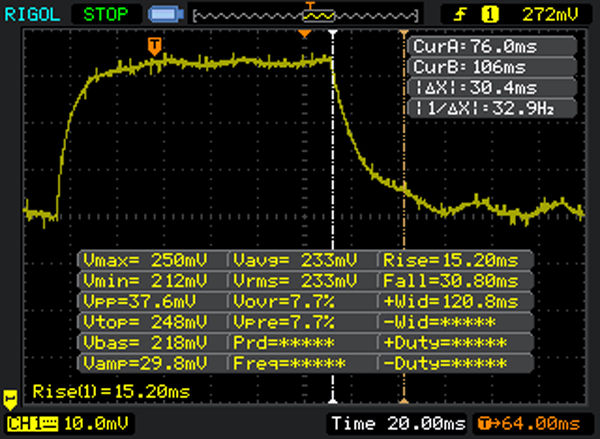
| ↔ Response Time 50% Grey to 80% Grey | ||
| 43 ms ... rise ↗ and fall ↘ combined | ↗ 20 ms rise | 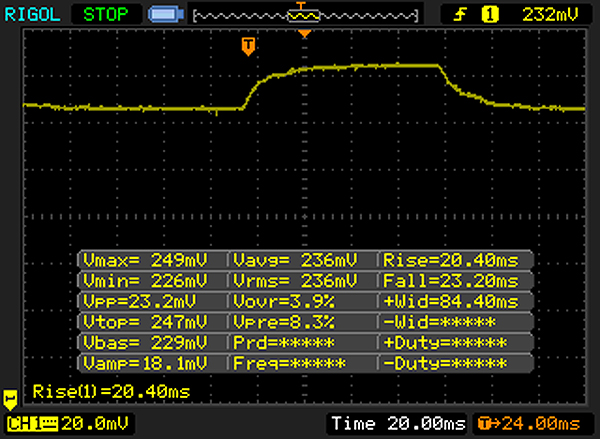 |
| ↘ 23 ms fall | ||
| The screen shows slow response rates in our tests and will be unsatisfactory for gamers. In comparison, all tested devices range from 0.165 (minimum) to 636 (maximum) ms. » 70 % of all devices are better. This means that the measured response time is worse than the average of all tested devices (31.4 ms). | ||
Screen Flickering / PWM (Pulse-Width Modulation)
| Screen flickering / PWM detected | 204 Hz | ≤ 90 % brightness setting | 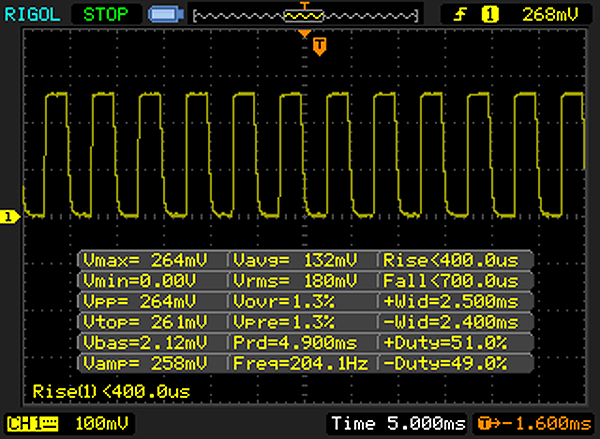 |
The display backlight flickers at 204 Hz (worst case, e.g., utilizing PWM) Flickering detected at a brightness setting of 90 % and below. There should be no flickering or PWM above this brightness setting. The frequency of 204 Hz is relatively low, so sensitive users will likely notice flickering and experience eyestrain at the stated brightness setting and below. In comparison: 53 % of all tested devices do not use PWM to dim the display. If PWM was detected, an average of 7979 (minimum: 5 - maximum: 343500) Hz was measured. | |||
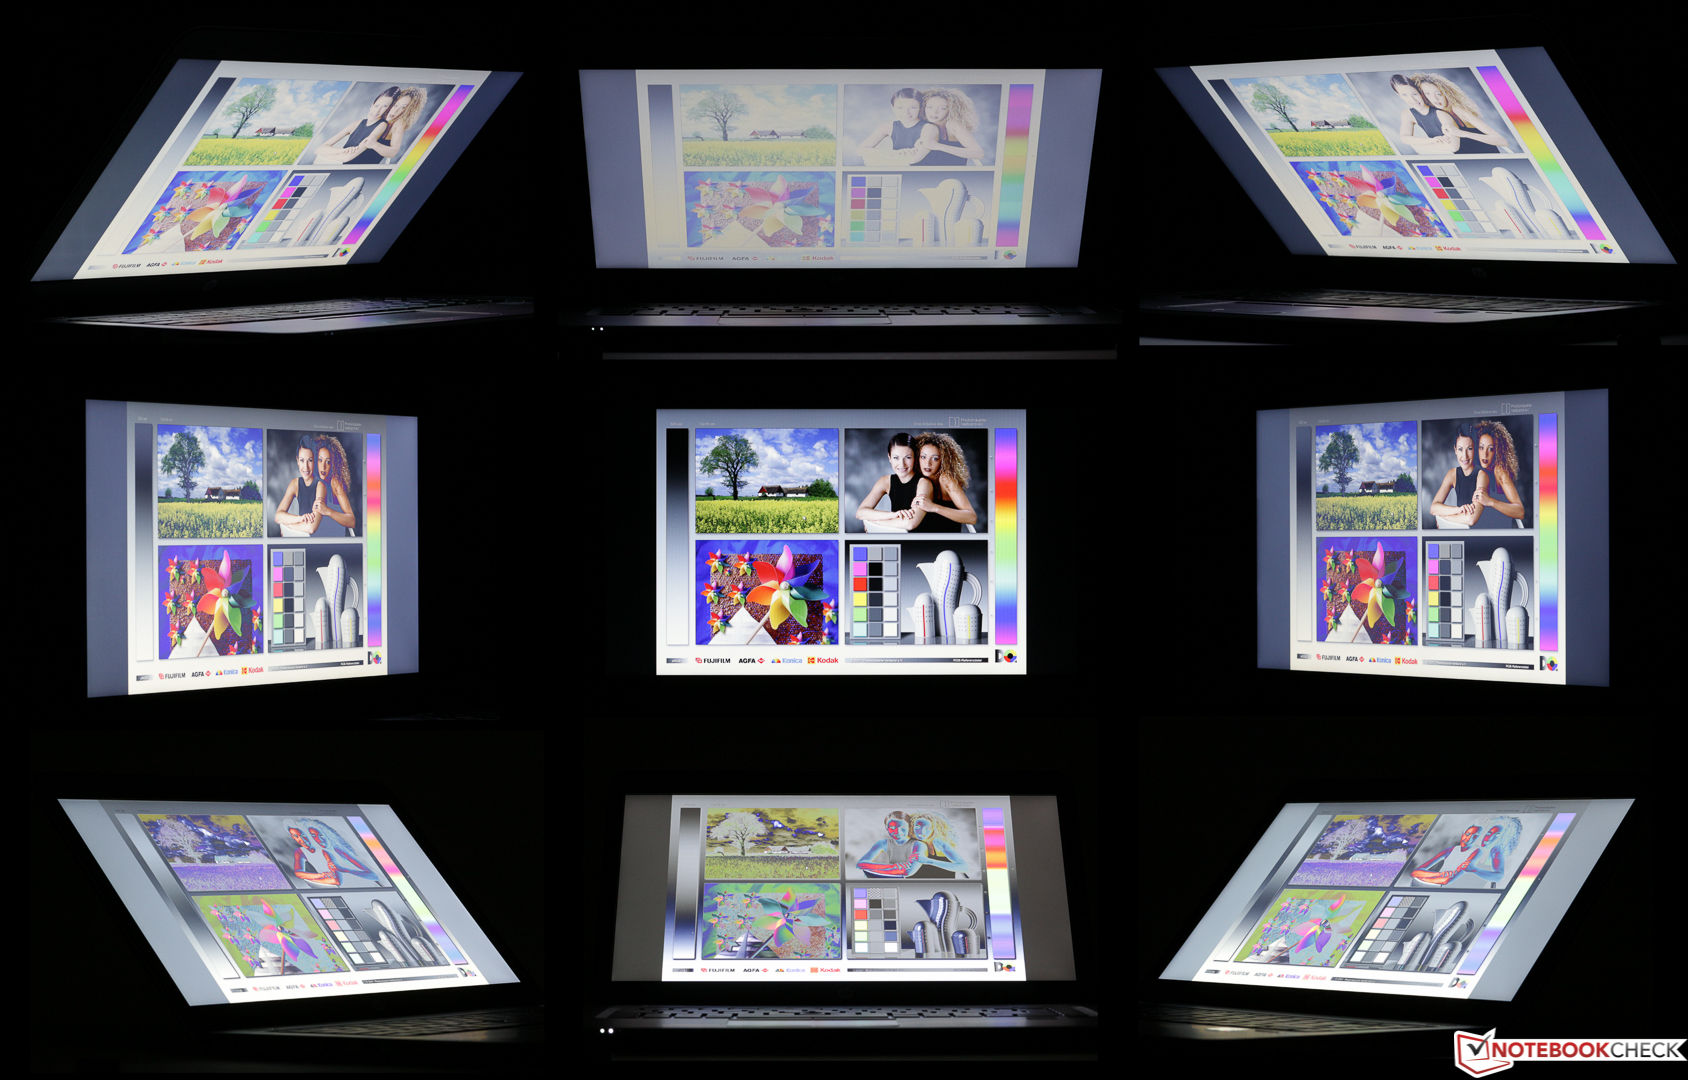
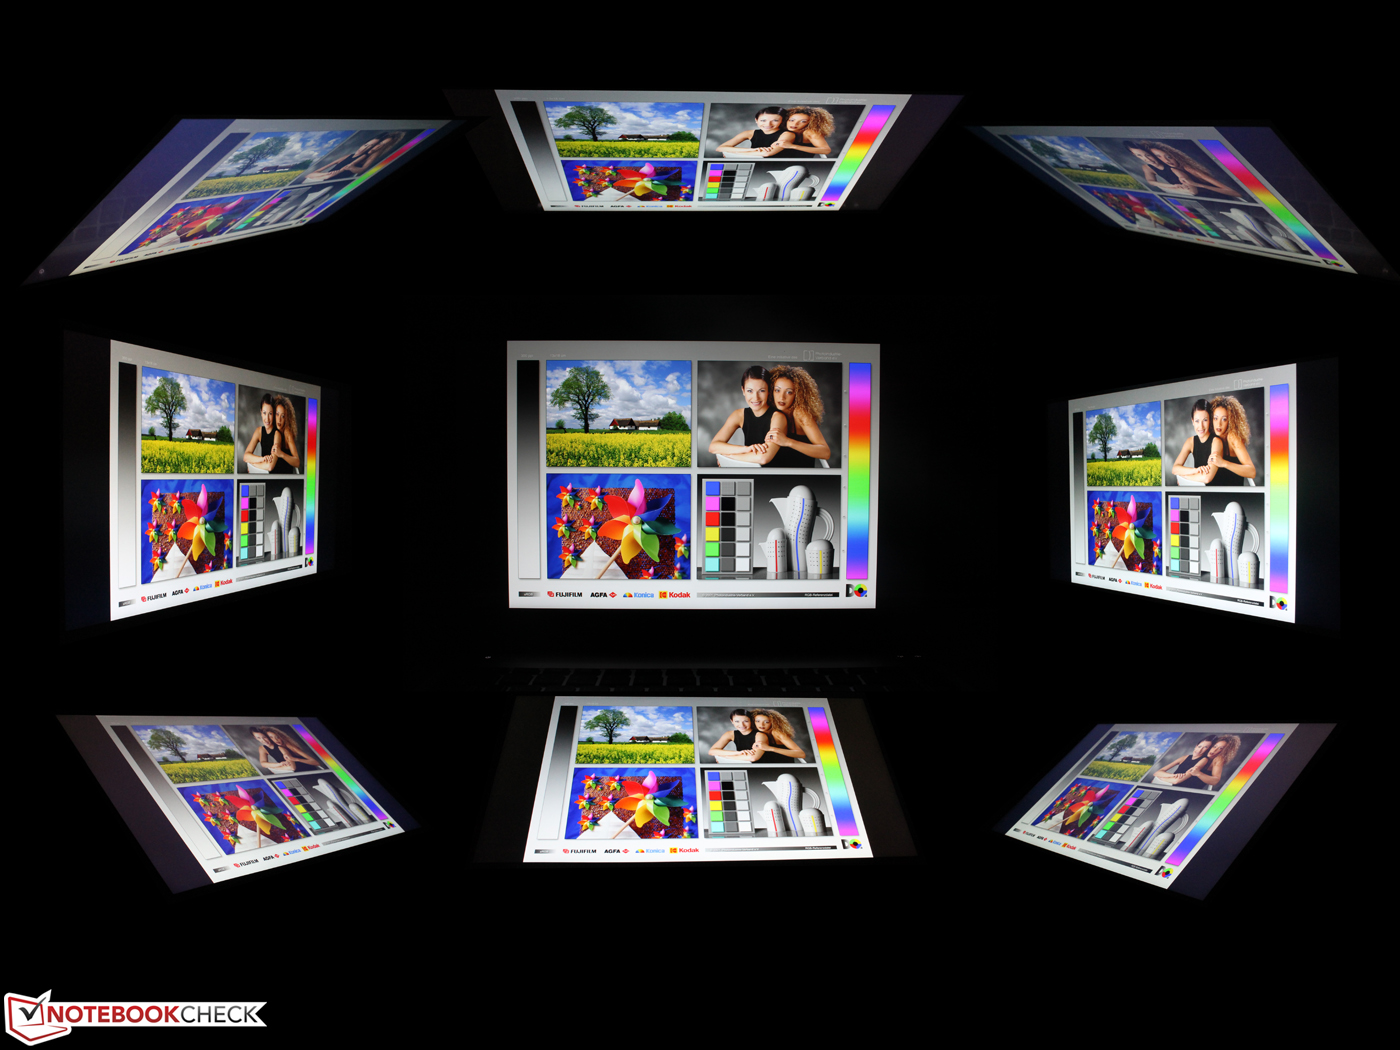
The picture with contours, colors and the luminance is pretty good when you look from the side, but only up to a 45 degree angle, where colors will start to invert. The situation is really bad with vertical shifts, where colors will invert even with small movements and the result does not look very good anymore. It will be tricky to watch a movie or show colleagues a presentation, because not everyone will have an ideal viewing position.
Update 04/18/2016: Measurements of the WQHD panel
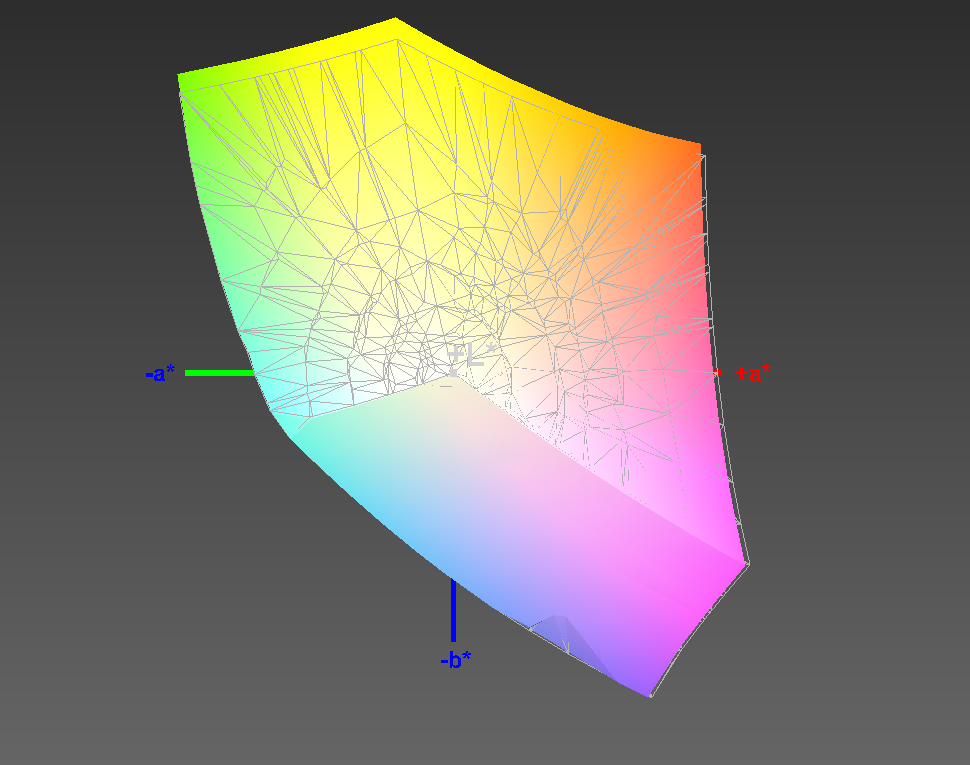
The display of the model T9X23ET#ABD for 1,700 Euros has 2560 x 1440 pixels and an anti-reflective surface. It is the IPS model without a touchscreen. The luminance is similar to the TN model, just like the matte surface. But that is all, all the other aspects like contrast, DeltaE, PWM (not determined), sRGB coverage and brightness distribution are better on the WQHD model. This results in a display rating of 82 % for TN-HD vs. 87.6 % for the WQHD IPS.
| |||||||||||||||||||||||||
Brightness Distribution: 82 %
Center on Battery: 355 cd/m²
Contrast: 1268:1 (Black: 0.28 cd/m²)
ΔE ColorChecker Calman: 3.75 | ∀{0.5-29.43 Ø4.75}
ΔE Greyscale Calman: 4.84 | ∀{0.09-98 Ø5}
98% sRGB (Argyll 1.6.3 3D)
63% AdobeRGB 1998 (Argyll 1.6.3 3D)
70.3% AdobeRGB 1998 (Argyll 3D)
98.3% sRGB (Argyll 3D)
68.2% Display P3 (Argyll 3D)
Gamma: 2.33
CCT: 7536 K
| HP EliteBook 840 G3 T9X59ET#ABD FHD 1920x1080 TN | HP EliteBook 840 G3 T9X23ET WQHD 2560x1440 IPS | Dell Latitude 14 7000 Series E7470 WQHD 2560x1440 IPS Touch | Lenovo ThinkPad T460s-20F9003SGE FHD 1920x1080 IPS | Lenovo ThinkPad T460s-20FA003GGE WQHD 2560x1440 IPS | HP EliteBook Folio 1040 G3 WQHD 2560x1440 IPS | Acer TravelMate P645-S-58HK FHD 1920x1080 IPS | |
|---|---|---|---|---|---|---|---|
| Display | 37% | 35% | -15% | 37% | 36% | 30% | |
| Display P3 Coverage (%) | 48.93 | 68.2 39% | 67.2 37% | 41.65 -15% | 68.7 40% | 67.9 39% | 66.7 36% |
| sRGB Coverage (%) | 73.7 | 98.3 33% | 95.9 30% | 61.6 -16% | 98.1 33% | 96.8 31% | 90.8 23% |
| AdobeRGB 1998 Coverage (%) | 50.5 | 70.3 39% | 69.3 37% | 43.14 -15% | 70.4 39% | 70 39% | 66.5 32% |
| Response Times | -15% | -10% | -8% | 0% | -7% | ||
| Response Time Grey 50% / Grey 80% * (ms) | 43 ? | 45 ? -5% | 48 ? -12% | 42 ? 2% | 35.6 ? 17% | 46.4 ? -8% | |
| Response Time Black / White * (ms) | 25 ? | 31 ? -24% | 27 ? -8% | 29.2 ? -17% | 29.2 ? -17% | 26.4 ? -6% | |
| PWM Frequency (Hz) | 204 ? | 220 ? | |||||
| Screen | 40% | 46% | 14% | 29% | 31% | 25% | |
| Brightness middle (cd/m²) | 366 | 355 -3% | 380 4% | 226 -38% | 257 -30% | 327 -11% | 331 -10% |
| Brightness (cd/m²) | 336 | 335 0% | 354 5% | 211 -37% | 248 -26% | 316 -6% | 309 -8% |
| Brightness Distribution (%) | 87 | 82 -6% | 81 -7% | 89 2% | 94 8% | 87 0% | 82 -6% |
| Black Level * (cd/m²) | 0.65 | 0.28 57% | 0.26 60% | 0.22 66% | 0.26 60% | 0.35 46% | 0.4 38% |
| Contrast (:1) | 563 | 1268 125% | 1462 160% | 1027 82% | 988 75% | 934 66% | 828 47% |
| Colorchecker dE 2000 * | 10.26 | 3.75 63% | 3.11 70% | 6.44 37% | 4.59 55% | 4.39 57% | 4.07 60% |
| Greyscale dE 2000 * | 11.51 | 4.84 58% | 4.35 62% | 5.87 49% | 6.38 45% | 4.69 59% | 4.86 58% |
| Gamma | 2.4 92% | 2.33 94% | 2.37 93% | 2.37 93% | 2.51 88% | 2.15 102% | 2.49 88% |
| CCT | 12725 51% | 7536 86% | 6771 96% | 6856 95% | 6238 104% | 7101 92% | 6109 106% |
| Color Space (Percent of AdobeRGB 1998) (%) | 47 | 63 34% | 62 32% | 39.58 -16% | 65 38% | 62.52 33% | 59 26% |
| Color Space (Percent of sRGB) (%) | 74 | 98 32% | 96 30% | 61.15 -17% | 98 32% | 96.71 31% | 90.6 22% |
| Colorchecker dE 2000 max. * | 8.58 | 6.73 | 17.18 | 9.72 | 7.27 | ||
| Total Average (Program / Settings) | 21% /
32% | 24% /
36% | -3% /
5% | 22% /
26% | 20% /
26% | 28% /
27% |
* ... smaller is better
The response time black to white is slightly slower compared to the TN version, but the 50 % grey to 80% grey response time is very similar.
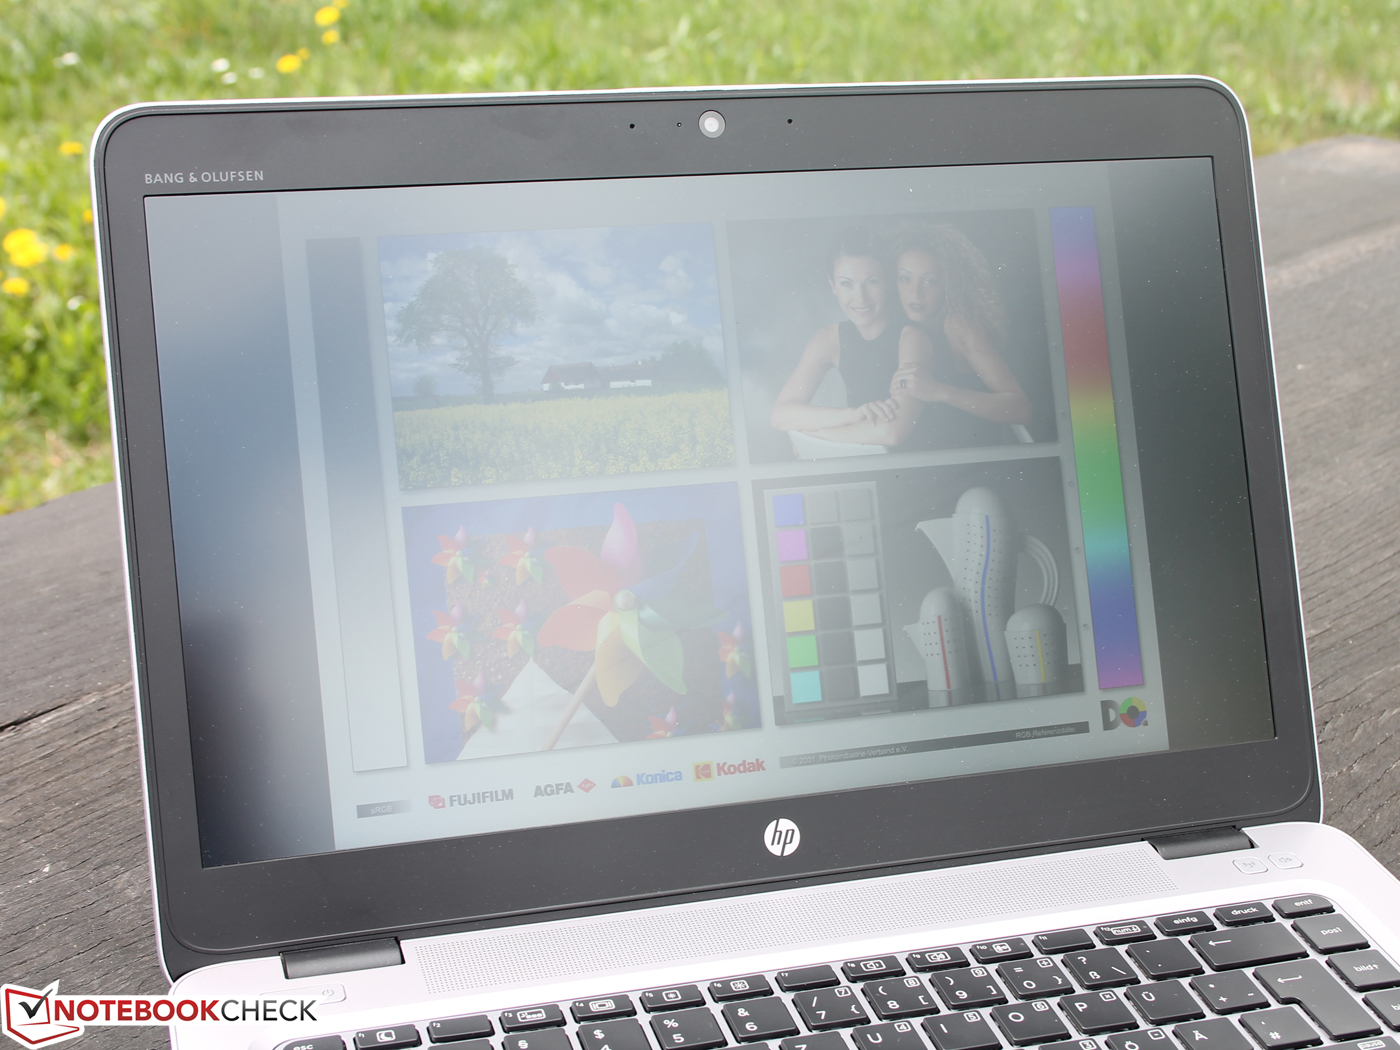
We would describe the surface as semi-matte, so not completely matte. This is also visible in our outdoor screenshots. The TN panel was a bit better in this respect. The luminance is not reduced on battery power, so there is no artificial limitation to save power. The viewing angles are excellent, which can be expected from an IPS panel.
Performance
EliteBooks from the 840 G3 series start at 1260 Euros (~$1432). Entry-level configurations are equipped with a conventional hard drive, Core i5-6200U as well as 4 GB of RAM. You get a free M.2-slot, a second memory slot and a slot for the LTE modem, so upgrades are no problem. The current top model is equipped with a Core i7-6500U, 256 GB SSD, 8 GB of RAM and a matte high-resolution panel with 2560x1440 pixels. Our review unit has only the FHD screen and no LTE modem (but is WWAN-ready).
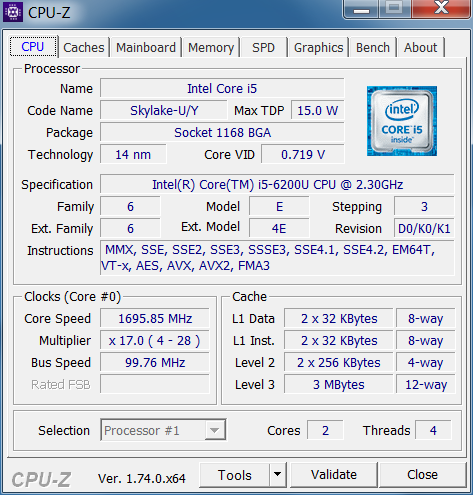
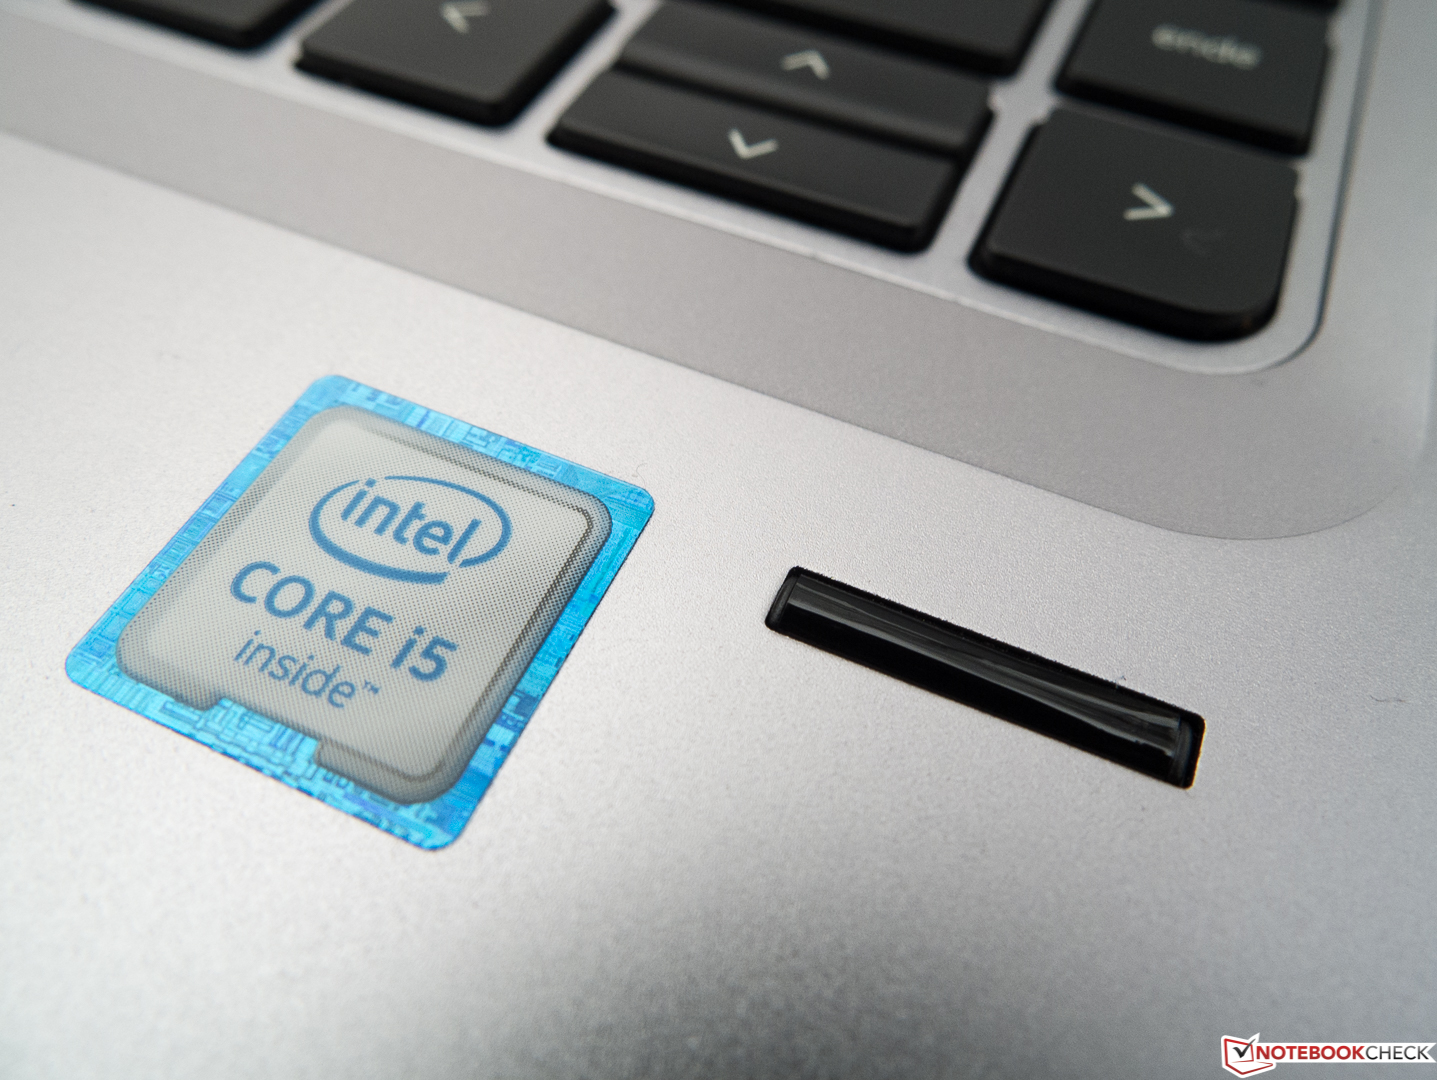
Processor
The 6500U is currently the second-fastest 15-watt mobile processor, so users are well-equipped for demanding standard applications. The performance is not on a workstation level, which would require a 45-watt Skylake or Broadwell processor. Those are available in HP's workstations such as the HP ZBook 15 G2, which is currently ranked third in our Workstation Top 10.
Looking at the performance of the 6500U, it will be interesting to see if the SoC can utilize the performance. The Turbo Boost is often limited, depending on the cooling solution or cautious temperature limits, so the performance of the 6500U can vary depending on the device. Such a thermal throttling can drop the clock below the nominal value in the worst case, which would be a significant performance limitation compared to the specifications.
However, this is not the case for our HP 840 G3, so there should not be any issues here. Cinebench Multi is executed with 3.0 GHz and determines 322 points, which is almost on par with the high-end Core i7 inside the Latitude 14 or the T460s, respectively. This clock can be maintained for quite a while; our Cinebench Multi loop ran for 30 minutes and the processor was still running at 3.0 GHz with the activated fans.
The single-core performance, which is important in practice, is about 19% behind the 6600U, which seems to be acceptable. The iGPU runs with clocks between 998 and 1047 MHz, which is also the case when we stress the CPU simultaneously. No criticism here.
System Performance
The application performance is first-rate, which is clearly shown by PCMark 8. The rivals (also with SSDs) are pretty much on par and the differences are in the single-digit range, which is negligible. Only the Broadwell based Acer TravelMate P645-S can fall behind by 10 to 13%, but even this difference is not that important in practice. The T460s with its i7-6600U and the PCIe 3.0 x3 NVMe-SSD from Samsung (SM951a) is really fast.
| PCMark 8 Home Score Accelerated v2 | 3231 points | |
| PCMark 8 Work Score Accelerated v2 | 4275 points | |
Help | ||
Storage Devices
Samsung's SSD PM851 (256 GB, 164 GB free for the user) does not perform very well in the storage benchmarks. It usually falls behind the PM851 M.2 2280 and clearly behind the SM951 (T460s / Folio 1040 G3) in most sub-scores. The result is a general performance advantage for the rivals, which is – see PCMark 8 – also reflected in the measured application performance. HP EliteBook Folio 1040 G3 and the ThinkPad T460s manage much higher transfer rates thanks to their NVMe modules with Samsung's UBX controller, both for read and write operations.
| HP EliteBook 840 G3 T9X59ET#ABD HD Graphics 520, 6500U, Samsung SSD PM851 256 GB MZNTE256HMHP | Dell Latitude 14 7000 Series E7470 HD Graphics 520, 6600U, Samsung SSD PM851 M.2 2280 256GB | Lenovo ThinkPad T460s-20FA003GGE HD Graphics 520, 6600U, Samsung SSD SM951a 512GB M.2 PCIe 3.0 x4 NVMe (MZVKV512) | HP EliteBook Folio 1040 G3 HD Graphics 520, 6300U, Samsung SM951 MZVPV256HDGL m.2 PCI-e | Acer TravelMate P645-S-58HK HD Graphics 5500, 5200U, Kingston RBU-SNS8100S3256GD | |
|---|---|---|---|---|---|
| CrystalDiskMark 3.0 | 18% | 285% | 246% | 10% | |
| Read Seq (MB/s) | 497.8 | 518 4% | 1778 257% | 1649 231% | 506 2% |
| Write Seq (MB/s) | 241.4 | 300.7 25% | 1530 534% | 1265 424% | 343.2 42% |
| Read 4k (MB/s) | 27.02 | 36.32 34% | 51.3 90% | 53.3 97% | 28.73 6% |
| Write 4k (MB/s) | 82.6 | 110.9 34% | 139.3 69% | 159.9 94% | 66.4 -20% |
| Read 512 (MB/s) | 396 | 470.8 19% | 1339 238% | 1252 216% | 336.8 -15% |
| Write 512 (MB/s) | 241.8 | 214 -11% | 1506 523% | 1244 414% | 346.8 43% |
| AS SSD | 7% | 202% | 223% | -2% | |
| Seq Read (MB/s) | 505 | 495.5 -2% | 2039 304% | 1839 264% | 502 -1% |
| Seq Write (MB/s) | 231.6 | 283.7 22% | 1407 508% | 1190 414% | 324.6 40% |
| 4K Read (MB/s) | 25.24 | 30.91 22% | 45.41 80% | 47.72 89% | 31.82 26% |
| 4K Write (MB/s) | 72.4 | 85.1 18% | 114.4 58% | 126.6 75% | 58 -20% |
| 4K-64 Read (MB/s) | 362 | 336.1 -7% | 968 167% | 1858 413% | 194.7 -46% |
| 4K-64 Write (MB/s) | 190.6 | 170 -11% | 366 92% | 344.3 81% | 169.2 -11% |
| Total Average (Program / Settings) | 13% /
12% | 244% /
243% | 235% /
234% | 4% /
4% |

GPU Performance
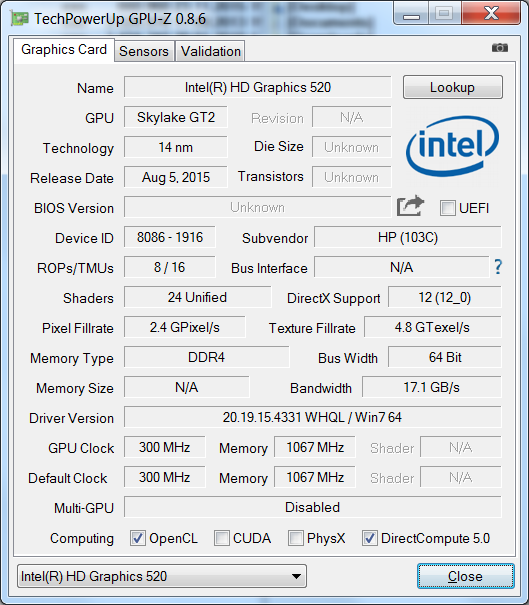
The benchmark scores of the HD Graphics 520 are not overwhelming, but on the expected level. It runs with a core clock of up to 1047 MHz, also on battery. Because of the single-channel memory configuration (1 memory module) though, it cannot utilize its maximum performance, so the results are slightly worse in both the 3D benchmarks as well as the gaming tests. The disadvantage could be compensated by a secondary memory module, and you can expect about 10% more performance with a dual-channel system.
The HD Graphics 5500 GPU of the Broadwell based TravelMate P645-S is just beaten (19 and 6 %, respectively), if the latter runs in a dual-channel memory configuration. One new feature of the Skylake GPUs is the integrated H.265 decoder. The H.265 format is the successor to the familiar H.264 format. The decoder relieves the CPU during the playback of corresponding videos. We can also see the single-channel disadvantage in our gaming tests, because the T460s and the XPS 13 have dual-channel memory. The T450s with the dedicated Nvidia GPU is obviously the fastest device in this comparison.
| 3DMark 11 Performance | 1468 points | |
| 3DMark Cloud Gate Standard Score | 5346 points | |
| 3DMark Fire Strike Score | 751 points | |
Help | ||
| BioShock Infinite - 1280x720 Very Low Preset (sort by value) | |
| HP EliteBook 840 G3 T9X59ET#ABD | |
| HP EliteBook Folio 1040 G3 | |
| Lenovo ThinkPad T460s-20FA003GGE | |
| Dell XPS 13 2016 i7 256GB QHD | |
| Dell Latitude 14 E5470 | |
| The Witcher 3 - 1024x768 Low Graphics & Postprocessing (sort by value) | |
| HP EliteBook 840 G3 T9X59ET#ABD | |
| HP EliteBook Folio 1040 G3 | |
| Rise of the Tomb Raider - 1024x768 Lowest Preset (sort by value) | |
| HP EliteBook 840 G3 T9X59ET#ABD | |
| Lenovo ThinkPad T460s-20FA003GGE | |
| Dell Latitude 14 E5470 | |
| low | med. | high | ultra | |
|---|---|---|---|---|
| BioShock Infinite (2013) | 44 | 22.6 | 18.5 | |
| The Witcher 3 (2015) | 8.3 | 6.1 | ||
| Rise of the Tomb Raider (2016) | 10.9 | 8 |
Emissions
System Noise
The noise development of the HP 840 G3 is restrained; the fans will often be completely deactivated while idling, but sometimes also with the High-Performance power profile. Thanks to the SSD, the system will be silent in these cases. The BIOS option "Fan always on while on AC Power" was deactivated for our review device. The cooling solution is pretty busy under load and the noise with CPU load only (no throttling) will be higher compared to the stress test. We can determine 37.8 dB(A) with a loop of Prime95, while the stress test results in only 35.3 dB(A).
| HP EliteBook 840 G3 T9X59ET#ABD HD Graphics 520, 6500U, Samsung SSD PM851 256 GB MZNTE256HMHP | Dell Latitude 14 7000 Series E7470 HD Graphics 520, 6600U, Samsung SSD PM851 M.2 2280 256GB | Lenovo ThinkPad T460s-20FA003GGE HD Graphics 520, 6600U, Samsung SSD SM951a 512GB M.2 PCIe 3.0 x4 NVMe (MZVKV512) | HP EliteBook Folio 1040 G3 HD Graphics 520, 6300U, Samsung SM951 MZVPV256HDGL m.2 PCI-e | Acer TravelMate P645-S-58HK HD Graphics 5500, 5200U, Kingston RBU-SNS8100S3256GD | |
|---|---|---|---|---|---|
| Noise | 6% | 6% | 8% | 6% | |
| off / environment * (dB) | 31.2 | 31.2 -0% | 29.2 6% | 29.1 7% | |
| Idle Minimum * (dB) | 31.2 | 31.2 -0% | 29.2 6% | 29.1 7% | 29.6 5% |
| Idle Average * (dB) | 32.1 | 31.2 3% | 29.2 9% | 29.1 9% | 29.6 8% |
| Idle Maximum * (dB) | 33.1 | 31.2 6% | 29.2 12% | 29.1 12% | 30.2 9% |
| Load Average * (dB) | 36.2 | 31.9 12% | 33.7 7% | 32.6 10% | 35.6 2% |
| Load Maximum * (dB) | 37.8 | 31.9 16% | 38.5 -2% | 37.8 -0% | 35.9 5% |
* ... smaller is better
Noise level
| Idle |
| 31.2 / 32.1 / 33.1 dB(A) |
| DVD |
| 0 / dB(A) |
| Load |
| 36.2 / 37.8 dB(A) |
 | ||
30 dB silent 40 dB(A) audible 50 dB(A) loud |
||
min: | ||
Temperature
The higher noise under normal load (3DMark or Prime95) has the following reason: The SoC drops to 2.4 GHz within seconds in the stress test, which is 100 MHz below the nominal clock. Many laptops in the 15-watt class show a similar behavior, simultaneous maximum load for the graphics card (IGP) and the processor creates too much heat, so the system will throttle. We do not think this is a problem unless the load will also drop when we only stress one of the components, but this is not the case here. As soon as we turn off the FurMark part of the stress test, the CPU clock will return to the Turbo range of 3.0 GHz. The integrated GPU runs at 998 to 1047 MHz when we stress the CPU at the same time, so there is no criticism here.
| HP EliteBook 840 G3 T9X59ET#ABD HD Graphics 520, 6500U, Samsung SSD PM851 256 GB MZNTE256HMHP | Dell Latitude 14 7000 Series E7470 HD Graphics 520, 6600U, Samsung SSD PM851 M.2 2280 256GB | Lenovo ThinkPad T460s-20FA003GGE HD Graphics 520, 6600U, Samsung SSD SM951a 512GB M.2 PCIe 3.0 x4 NVMe (MZVKV512) | HP EliteBook Folio 1040 G3 HD Graphics 520, 6300U, Samsung SM951 MZVPV256HDGL m.2 PCI-e | Acer TravelMate P645-S-58HK HD Graphics 5500, 5200U, Kingston RBU-SNS8100S3256GD | |
|---|---|---|---|---|---|
| Heat | 1% | -9% | -21% | -12% | |
| Maximum Upper Side * (°C) | 37 | 38.2 -3% | 40.8 -10% | 43.2 -17% | 41.6 -12% |
| Maximum Bottom * (°C) | 37.1 | 36.5 2% | 40.3 -9% | 47.1 -27% | 41.7 -12% |
| Idle Upper Side * (°C) | 25.3 | 25.1 1% | 27.6 -9% | 30.5 -21% | 30.6 -21% |
| Idle Bottom * (°C) | 26.6 | 25.8 3% | 28.7 -8% | 31.5 -18% | 27.5 -3% |
* ... smaller is better
(+) The maximum temperature on the upper side is 37 °C / 99 F, compared to the average of 34.3 °C / 94 F, ranging from 21.2 to 62.5 °C for the class Office.
(+) The bottom heats up to a maximum of 37.1 °C / 99 F, compared to the average of 36.8 °C / 98 F
(+) In idle usage, the average temperature for the upper side is 24.4 °C / 76 F, compared to the device average of 29.5 °C / 85 F.
(+) The palmrests and touchpad are cooler than skin temperature with a maximum of 27.8 °C / 82 F and are therefore cool to the touch.
(±) The average temperature of the palmrest area of similar devices was 27.5 °C / 81.5 F (-0.3 °C / -0.5 F).
Speakers

The clear, but only sufficiently loud stereo speakers perform well for common office tasks, and the sound for videos is also okay. However, you should not expect powerful bass or differentiated high tones from the sound system. The stereo jack for external speakers delivers a clear and noise-free signal.
Voice recordings with the dual array microphone are loud and clear, even when the speaker is 2 meters (~6.5 ft) away with their back towards the laptop. The only criticism is a slight echo. We have not experienced better microphone recordings for a laptop so far, which would require a high-quality headset or a directional microphone.
Energy Management
Power Consumption
The good runtimes already indicate a frugal power consumption. And the measured values are actually very low with about 4 up to 7 watts while idling. 28 watts under maximum load is the result of throttling and the 3DMark 2006 scene consumes up to 34 watts. We had already noticed this behavior in the review of the Latitude 14 7000 Series E7470, where the SoC of the 14-inch device would throttle as well. This is not the case for the T460s, which is evident when you look at the maximum consumption. Its 6600U runs at the nominal clock of 2.6 GHz, while the GPU fluctuates between 300 and 1050 MHz and the consumption will vary between 20 and 25 watts. The 6600 can increase the TDP to 25 watts (configurable TDP, cTDP) for short periods.
| HP EliteBook 840 G3 T9X59ET#ABD HD Graphics 520, 6500U, Samsung SSD PM851 256 GB MZNTE256HMHP | Dell Latitude 14 7000 Series E7470 HD Graphics 520, 6600U, Samsung SSD PM851 M.2 2280 256GB | Lenovo ThinkPad T460s-20FA003GGE HD Graphics 520, 6600U, Samsung SSD SM951a 512GB M.2 PCIe 3.0 x4 NVMe (MZVKV512) | HP EliteBook Folio 1040 G3 HD Graphics 520, 6300U, Samsung SM951 MZVPV256HDGL m.2 PCI-e | Acer TravelMate P645-S-58HK HD Graphics 5500, 5200U, Kingston RBU-SNS8100S3256GD | |
|---|---|---|---|---|---|
| Power Consumption | -26% | -19% | -47% | -1% | |
| Idle Minimum * (Watt) | 3.8 | 5.1 -34% | 3.8 -0% | 6.3 -66% | 3.2 16% |
| Idle Average * (Watt) | 6.3 | 8.5 -35% | 7.1 -13% | 9.4 -49% | 6.3 -0% |
| Idle Maximum * (Watt) | 6.8 | 10.1 -49% | 7.8 -15% | 10.1 -49% | 8.6 -26% |
| Load Average * (Watt) | 34.4 | 35.2 -2% | 36.3 -6% | 33.3 3% | 30.3 12% |
| Load Maximum * (Watt) | 28.3 | 31 -10% | 46 -63% | 49.5 -75% | 30.4 -7% |
* ... smaller is better
| Off / Standby | |
| Idle | |
| Load |
|
Key:
min: | |
Battery Runtime
The battery runtime is quite good with 7:33 hours, especially when you consider the comparatively small battery capacity (46 Wh): Latitude E7470 and ThinkPad T460s have 55 and 49 Wh modules, but both fall behind by around 25% in the Wi-Fi test. The Folio G3 also has a 46 Wh battery, but also falls behind. Acer (54 Wh) shows that an inexpensive system can manage extreme battery runtimes as well, because it runs almost 1.5 hours longer.
Update 04/18/2016: The Wi-Fi runtime with the WQHD panel is 6:06 hours, which is about 1.5 hours shorter than the TN-FHD version with the same settings.
Pros
Cons
Verdict
Unfortunately, HP does not present a balanced configuration that would justify the high price tag. It is clearly an ambitious device, but in our opinion, the TN panel with its limited viewing angles, poor contrast and low color accuracy is not a good choice for this price range, which is also reflected by the rating. The Latitude E7470 managed a display rating of 86% despite the glossy touchscreen, and the HP 840 G3 scores "only" 82%. The webcam is also pretty bad and the connectivity is not that good, either. All these things are the reason why the 840 G3 business device misses a very good rating and has to live with the second place behind the Latitude E7470.
The EliteBook is definitely not a bad notebook, which is supported by the items on our pro-list. Runtimes, docking options, upgradeability, best input devices and obviously a lot of performance – many positive aspects of the 14-inch notebook. The 3K version of the 840 G3 with 2560x1440 pixels might be a candidate for a very good rating, because the manufacturer uses an IPS panel without touchscreen (WQHD-UWVA).
The biggest rivals with a similar price tag are the Latitude 14 7000 Series E7470 (rating 89%) and the ThinkPad T460s (rating 91%). Both of these 14-inch notebooks can be configured comprehensively. Dell and Lenovo already use IPS panels for their FHD models, which is a big advantage over the 840 G3. Latitude E7470 and ThinkPad T460s do not have a 2.5-inch SATA slot, so the 840 G3 is the only device that can be equipped with a SATA HDD/SSD besides the M.2-SSD.
Update 04/18/2016: Excellent WQHD panel
HP offers an excellent semi-matte WQHD panel for the EliteBook 840 G3. It is superior to the Full-HD TN version in almost every respect. Only the outdoor capabilities of the TN model are slightly better at the same luminance, because the anti-reflective coating is more effective. The display rating would be higher with the WQHD panel, even though we did not even use the excellent calibrated values (DeltaE) for our database (but the factory results for comparability). The WQHD panel can be calibrated very well.
The battery runtime unfortunately drops by 1.5 hours in the Wi-Fi test with the WQHD panel. This does eat affect the advantage of the IPS panel a bit, but the display quality will probably be more important for the user. With these results, the HP 840 G3 WQHD would get a total score of 88.0 %.
HP EliteBook 840 G3 T9X59ET#ABD
- 04/18/2016 v5.1 (old)
Sebastian Jentsch
Price comparison

