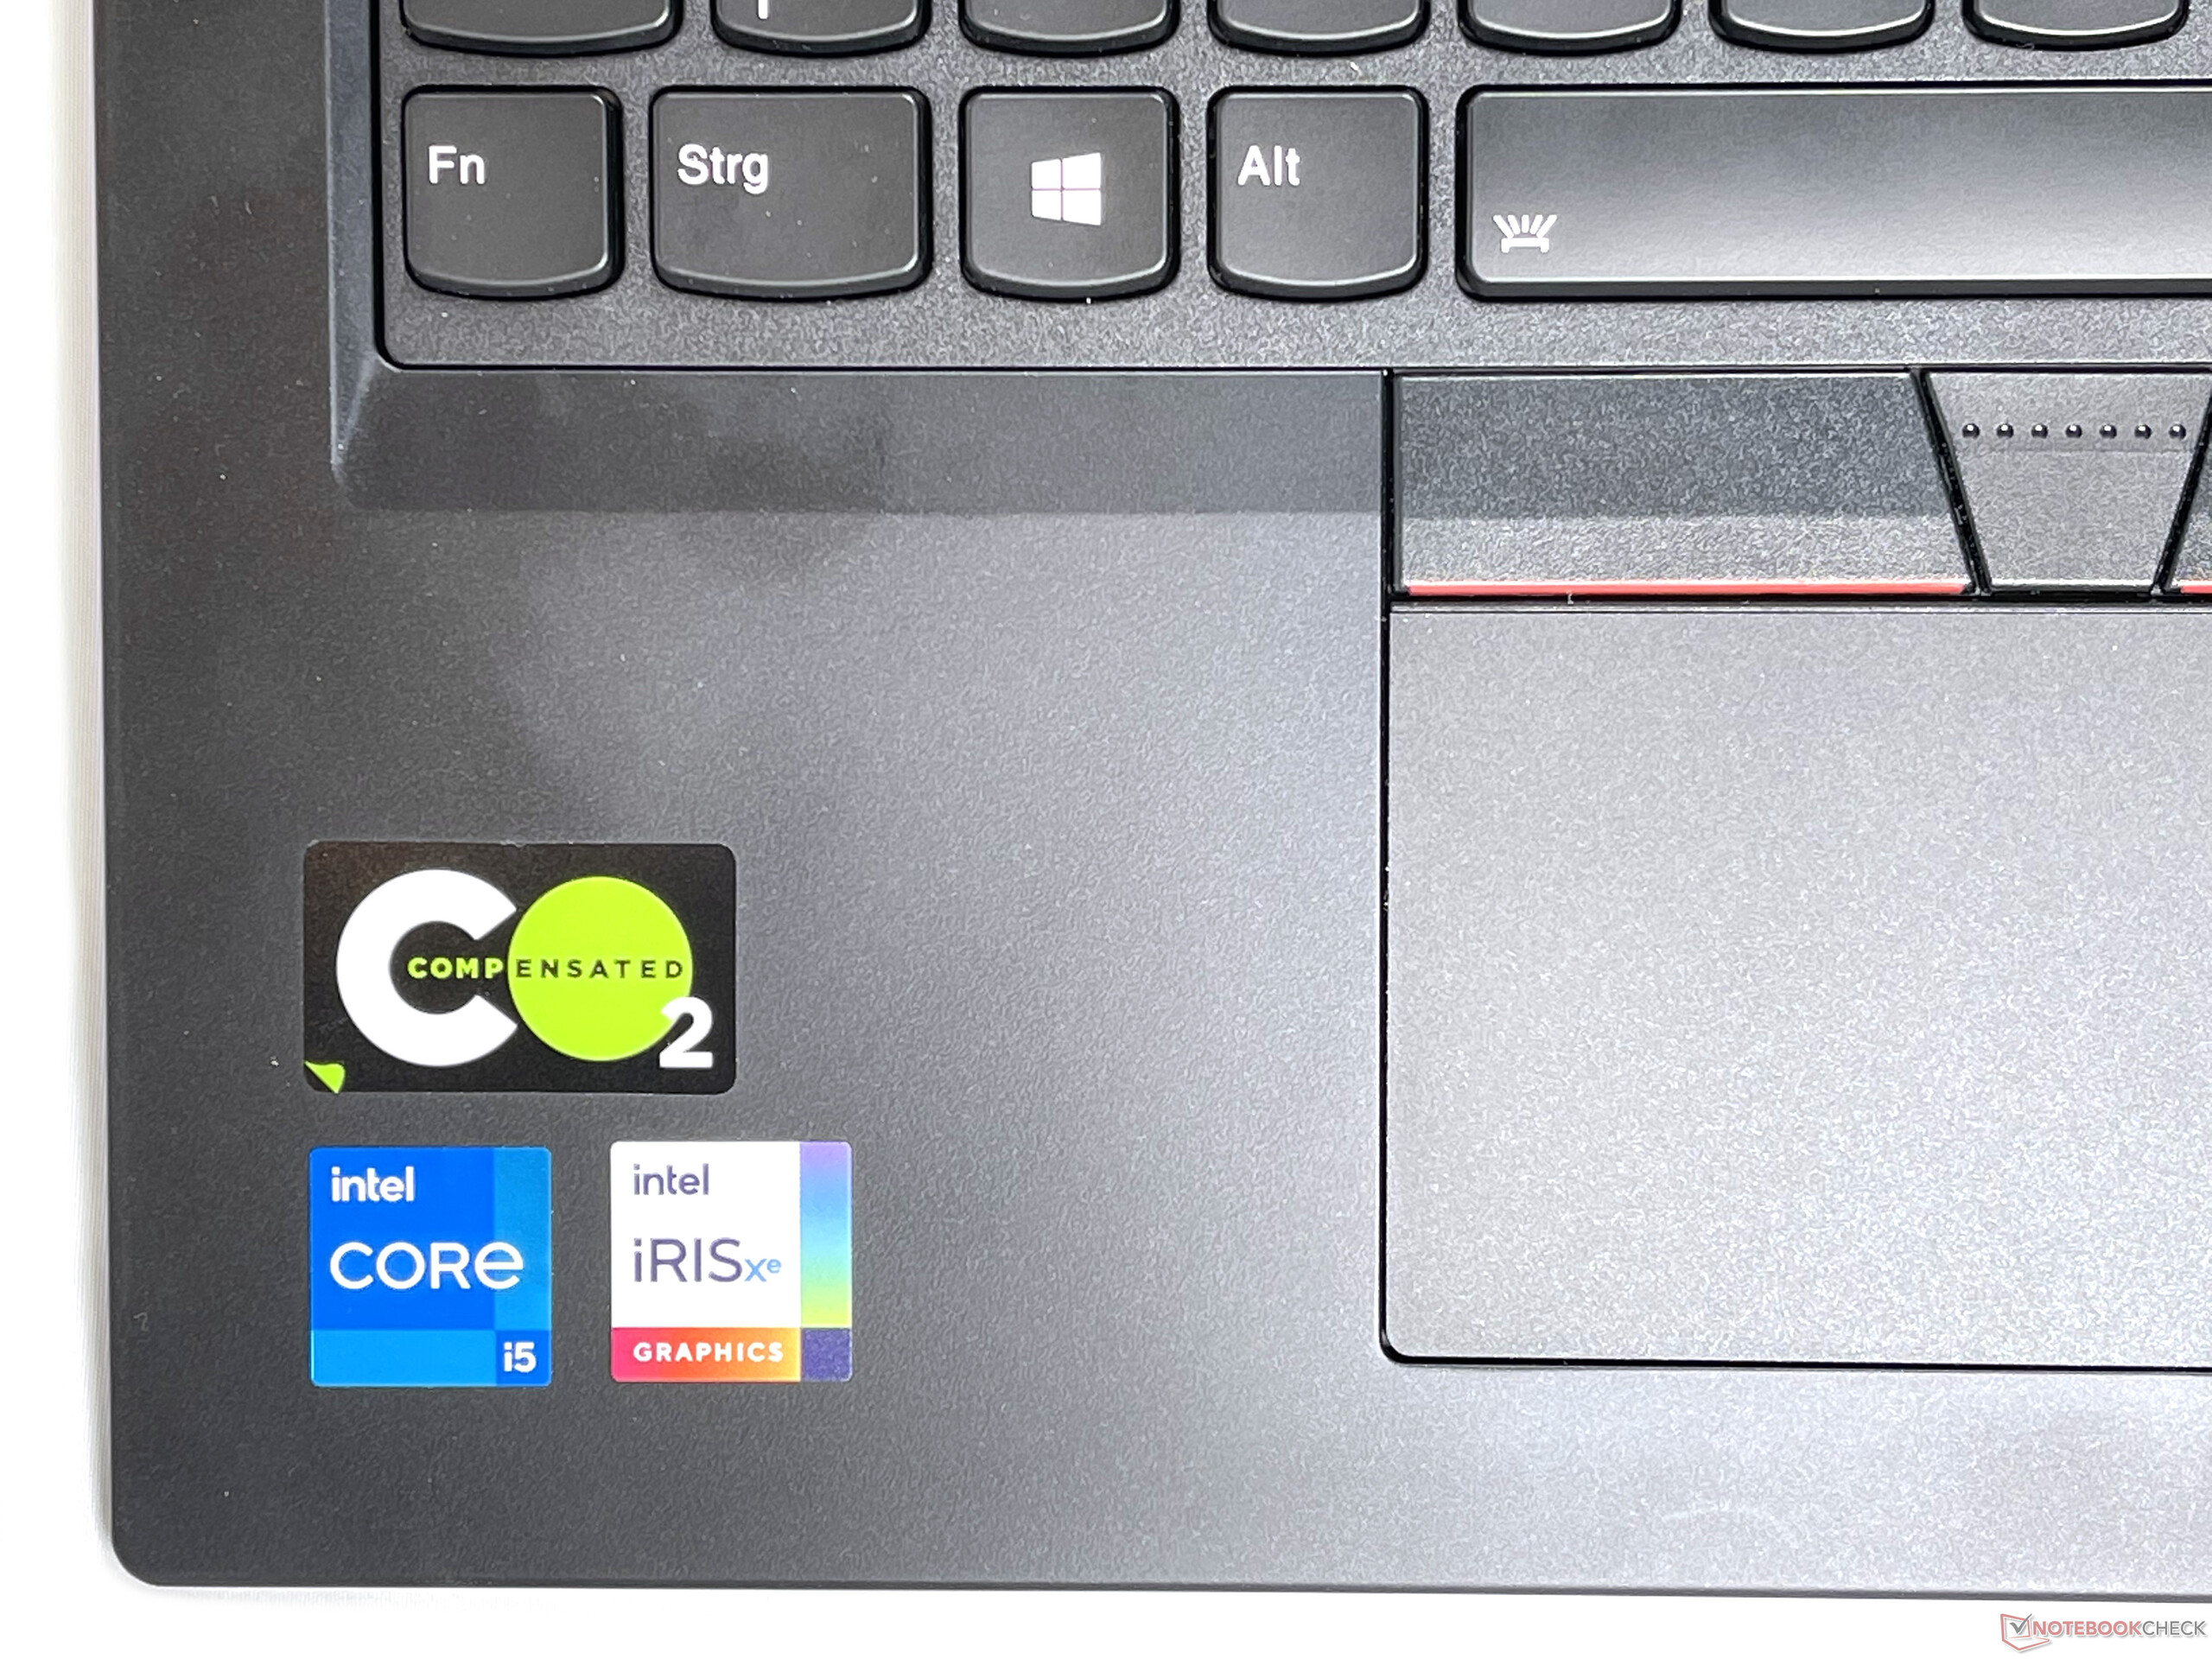
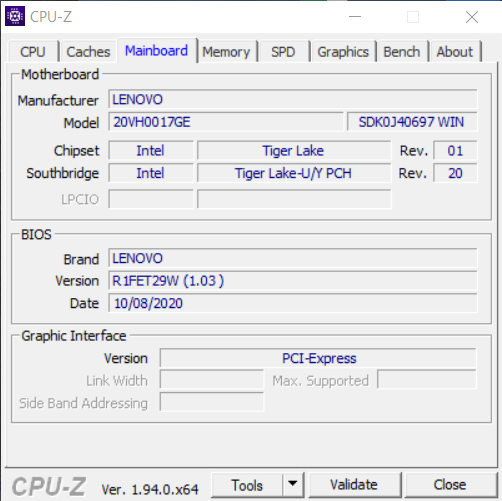
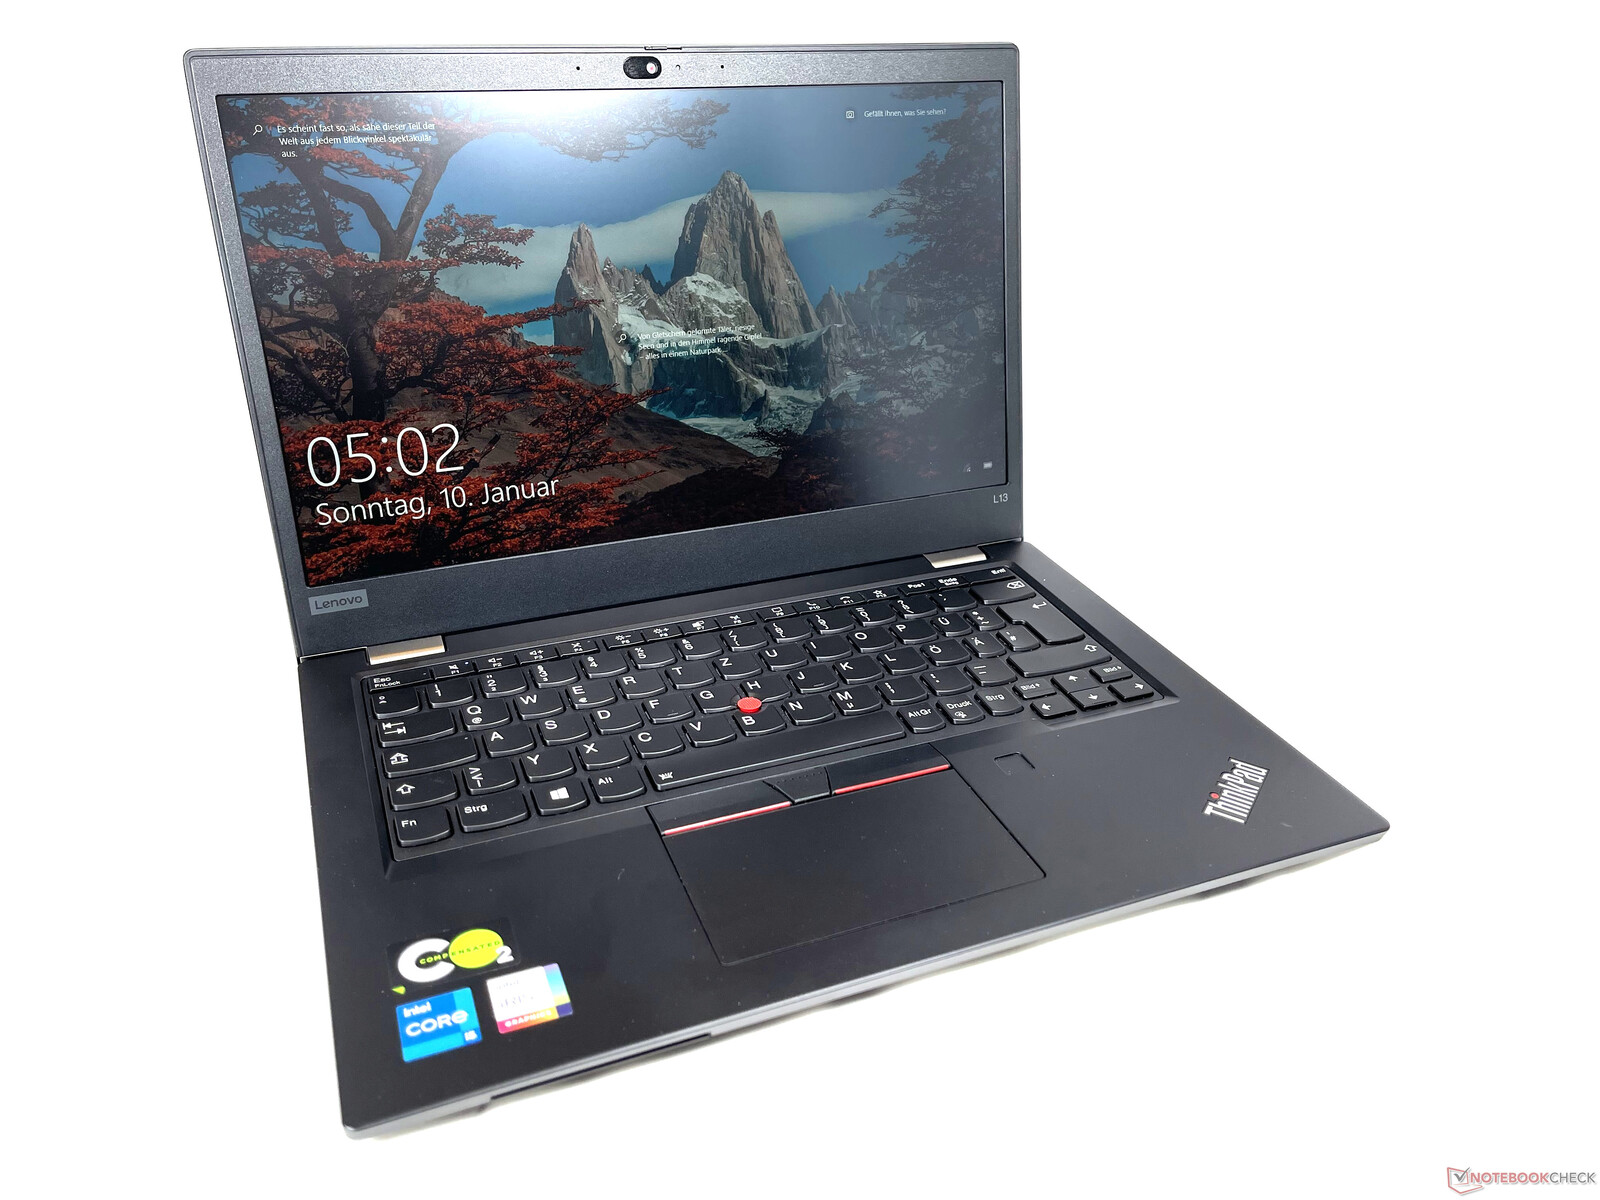
Lenovo ThinkPad L13 Gen 2 laptop review: Stylish ultrabook now with Intel Tiger Lake
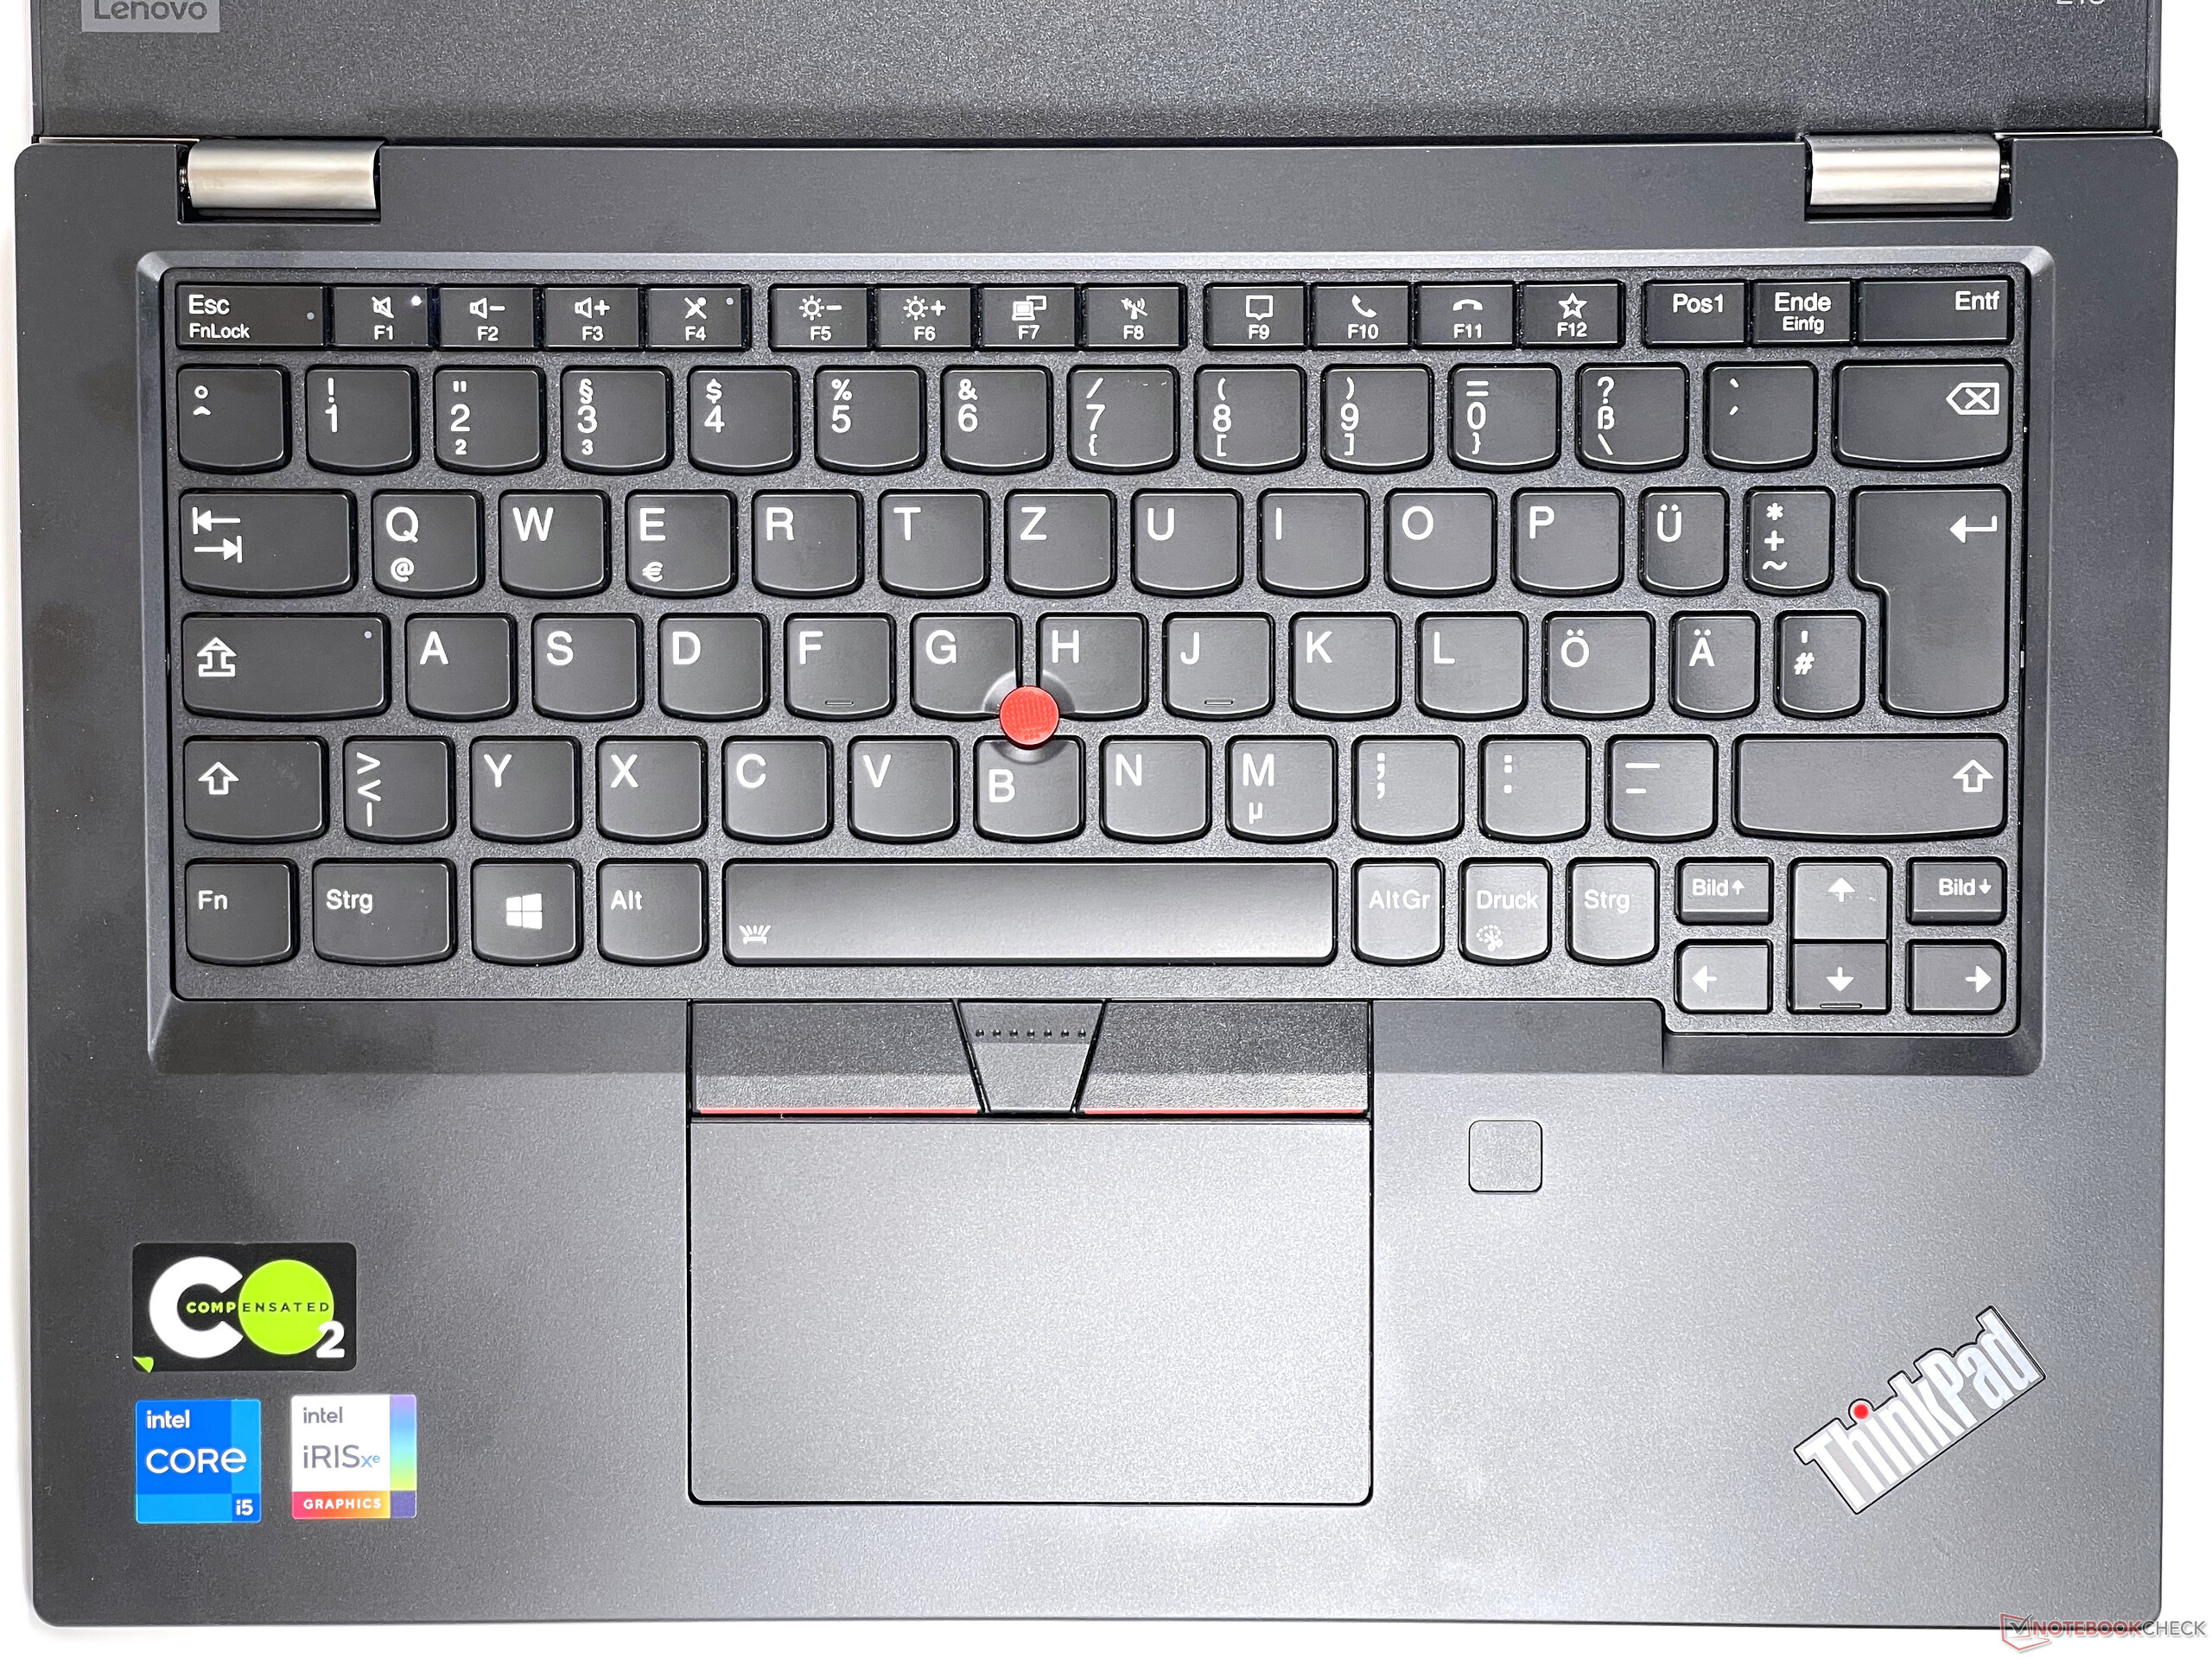
The Lenovo ThinkPad L13 Gen 2 is a compact ultrabook in the 13-inch format. The ThinkPad series focuses on good input devices and is especially known for its high-quality keyboards. The ThinkPad L13 Gen 2 is the successor to the ThinkPad L13 Gen 1, which features a slightly different design compared to the ThinkPad L390 series. Our test device with the model number 20VH0017GE is available for 975 Euros (~$1,181); the Campus version for the education sector costs around 900 Euros (~$1,090).
Possible competitors in comparison
Rating | Date | Model | Weight | Height | Size | Resolution | Price |
|---|---|---|---|---|---|---|---|
| 86.1 % v7 (old) | 01 / 2021 | Lenovo ThinkPad L13 Gen2-20VH0017GE i5-1135G7, Iris Xe G7 80EUs | 1.4 kg | 17.6 mm | 13.30" | 1920x1080 | |
| 81.5 % v7 (old) | 12 / 2020 | HP Pavilion 13-bb0015cl i7-1165G7, Iris Xe G7 96EUs | 1.2 kg | 17.7 mm | 13.30" | 3840x2160 | |
| 85 % v7 (old) | 06 / 2020 | Acer Swift 3 SF314-42-R27B R3 4300U, Vega 5 | 1.2 kg | 16.55 mm | 14.00" | 1920x1080 | |
| 84.5 % v7 (old) | 05 / 2020 | HP ProBook 430 G7-8VU53EA i7-10510U, UHD Graphics 620 | 1.4 kg | 18 mm | 13.30" | 1920x1080 | |
| 88.2 % v7 (old) | 03 / 2020 | Lenovo ThinkPad L13 Yoga 20R6S00800 i5-10210U, UHD Graphics 620 | 1.4 kg | 17.6 mm | 13.30" | 1920x1080 | |
| 88.4 % v6 (old) | 02 / 2019 | Lenovo ThinkPad L390-20NR0013GE i5-8265U, UHD Graphics 620 | 1.5 kg | 18.8 mm | 13.30" | 1920x1080 |
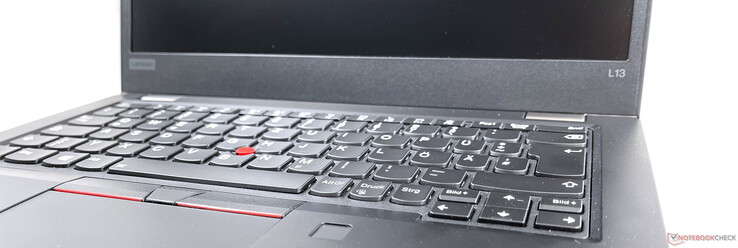
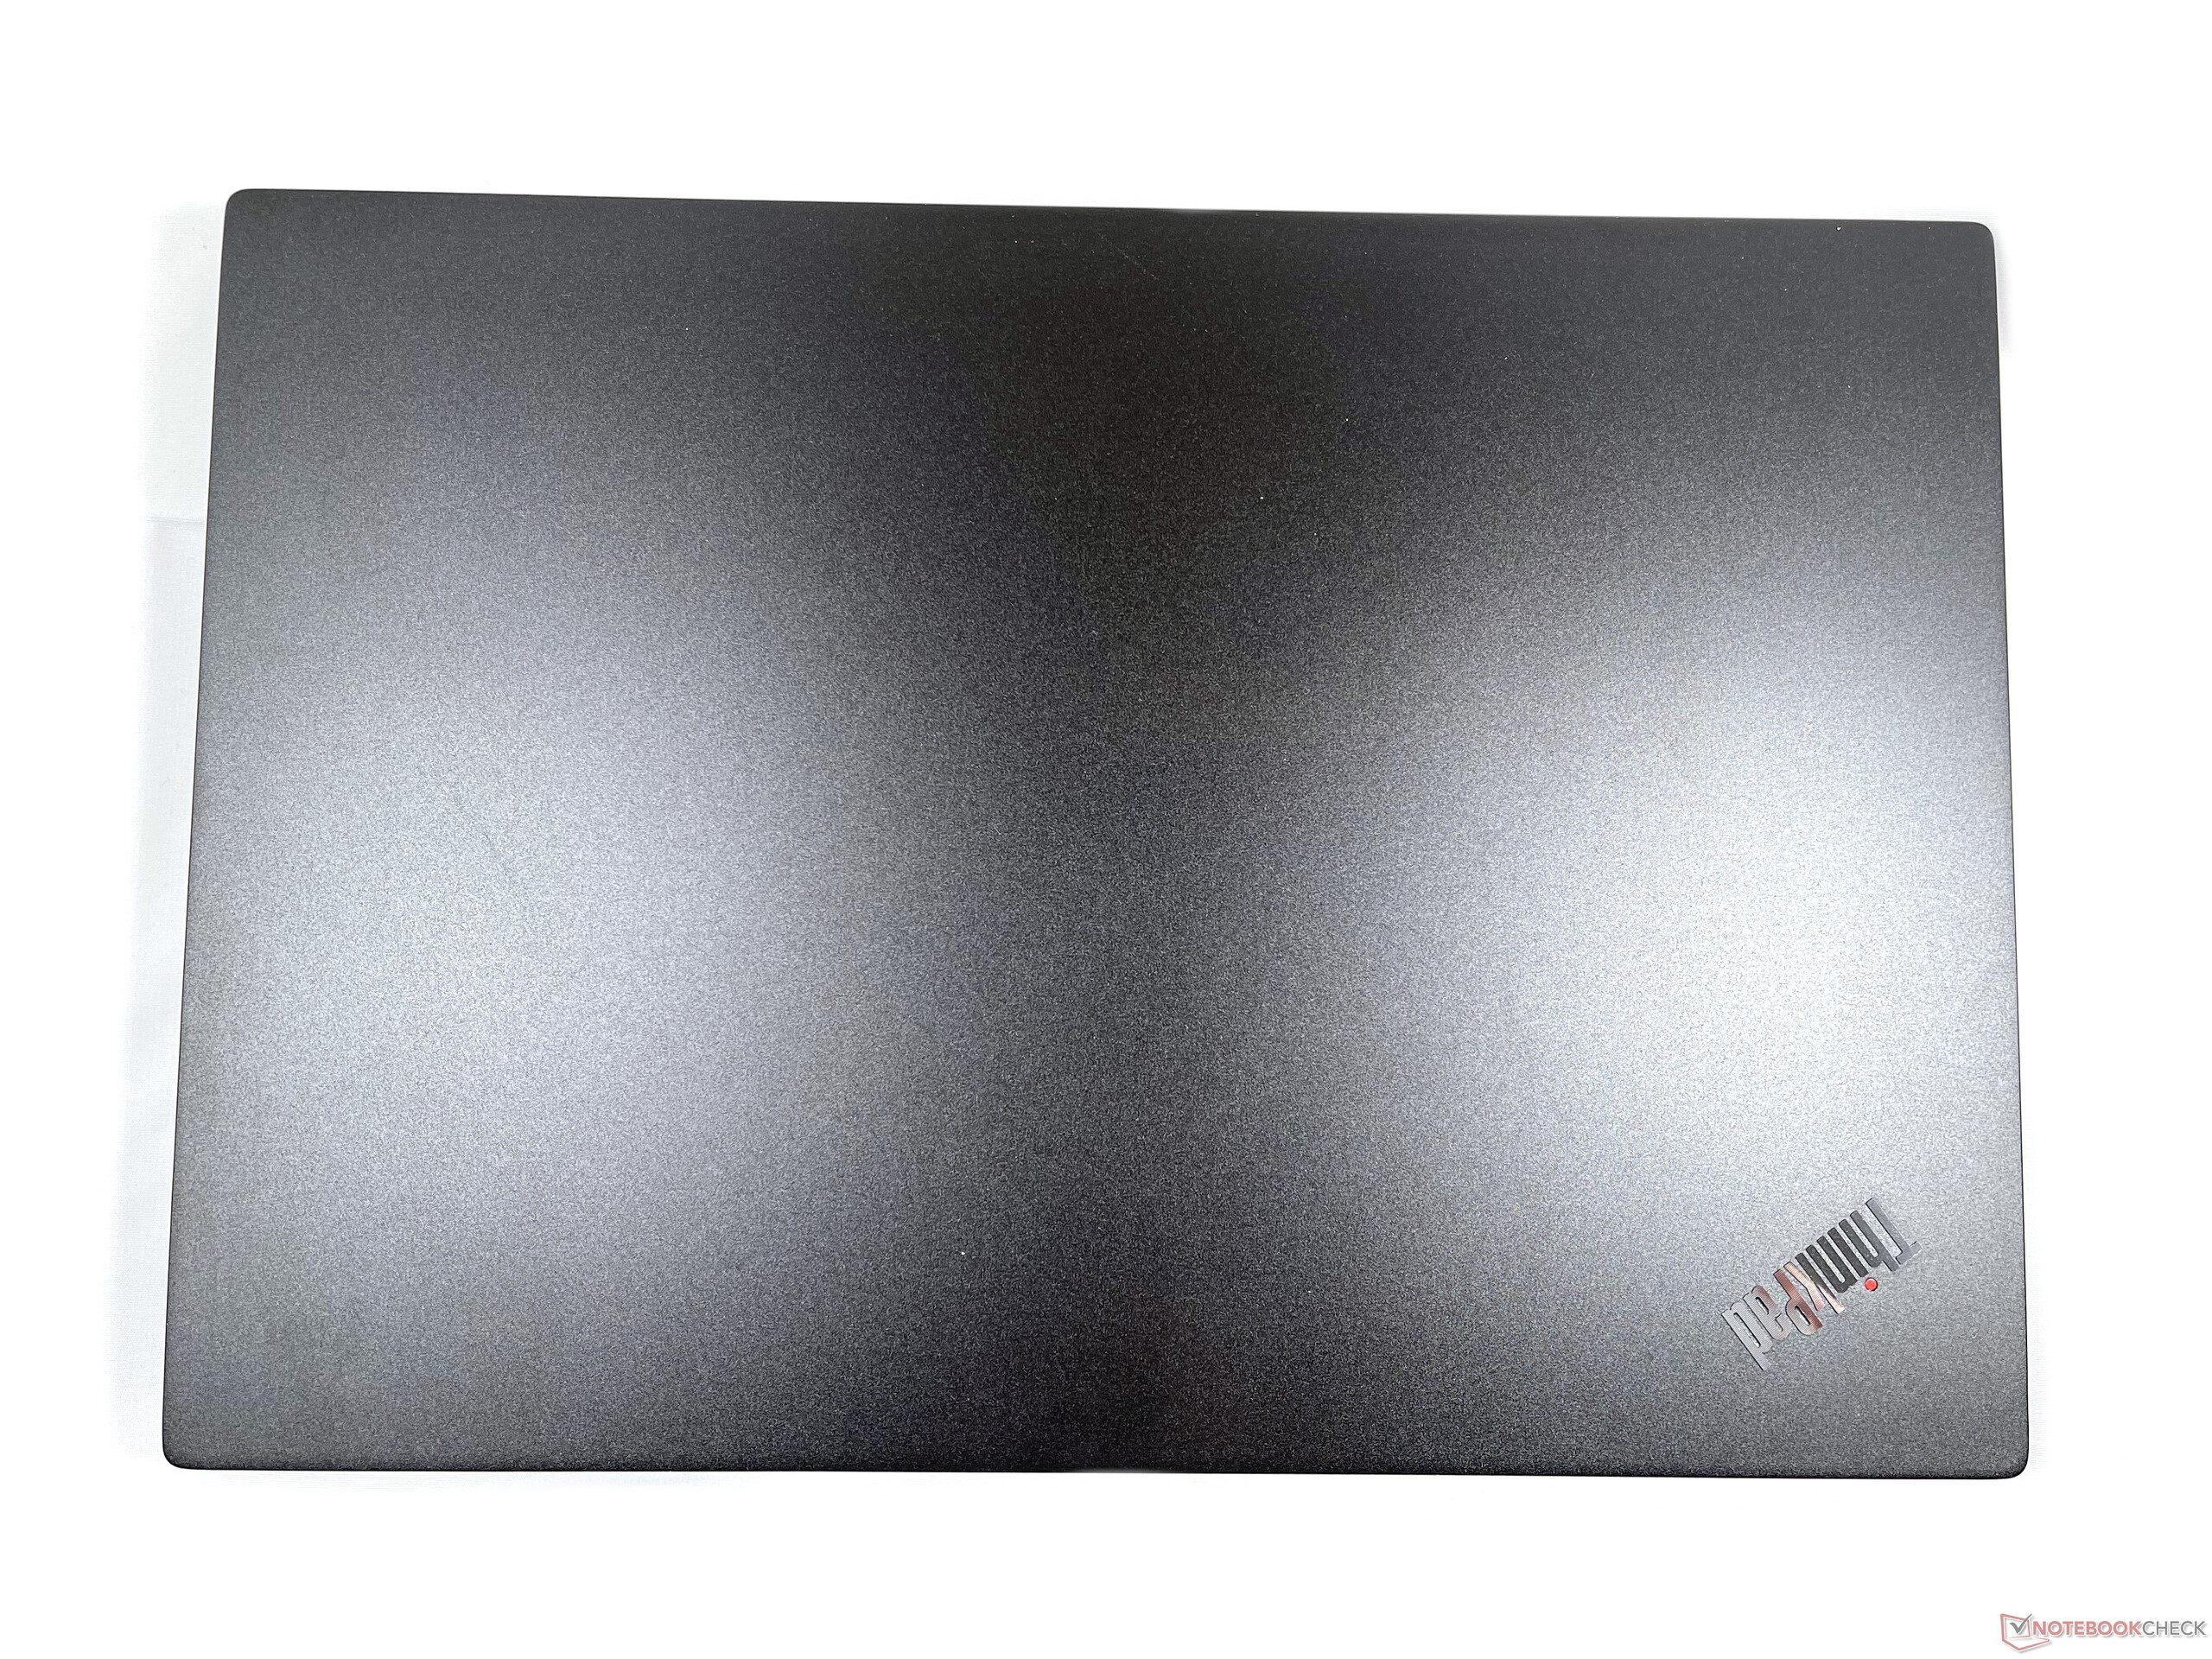
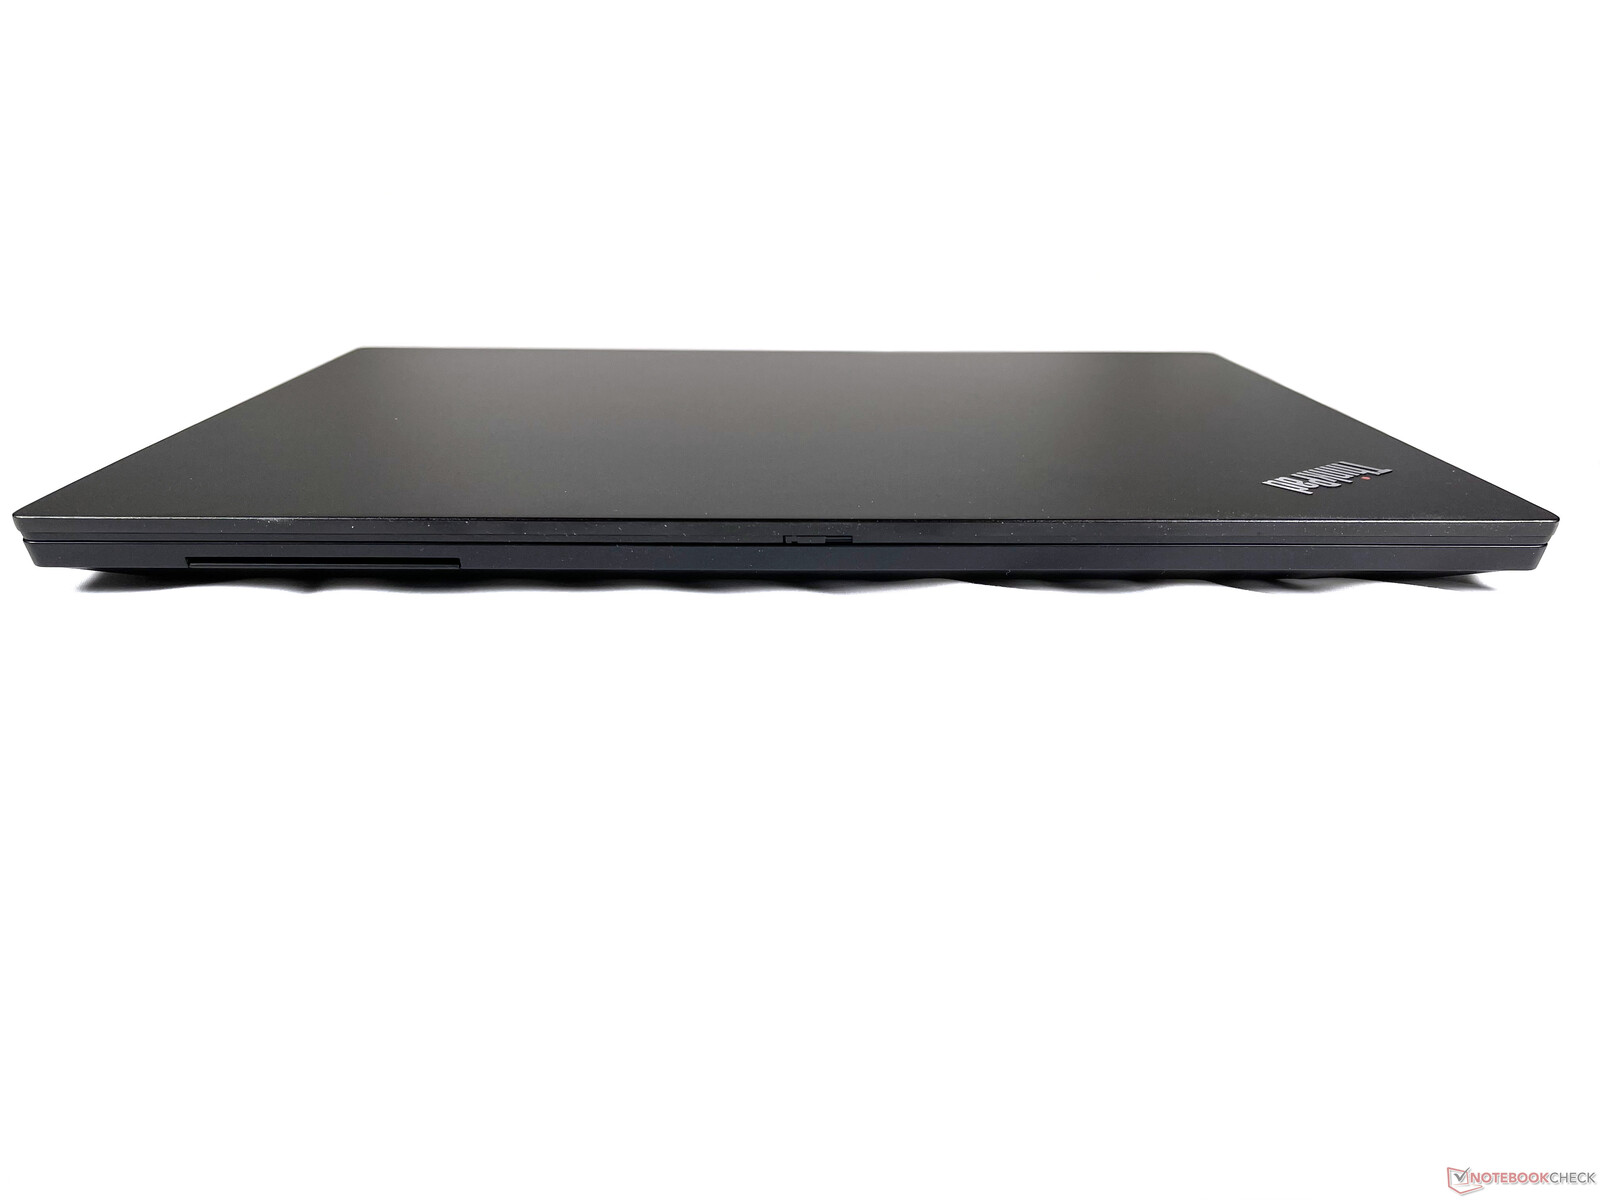
Case - ThinkPad L13 with solid build
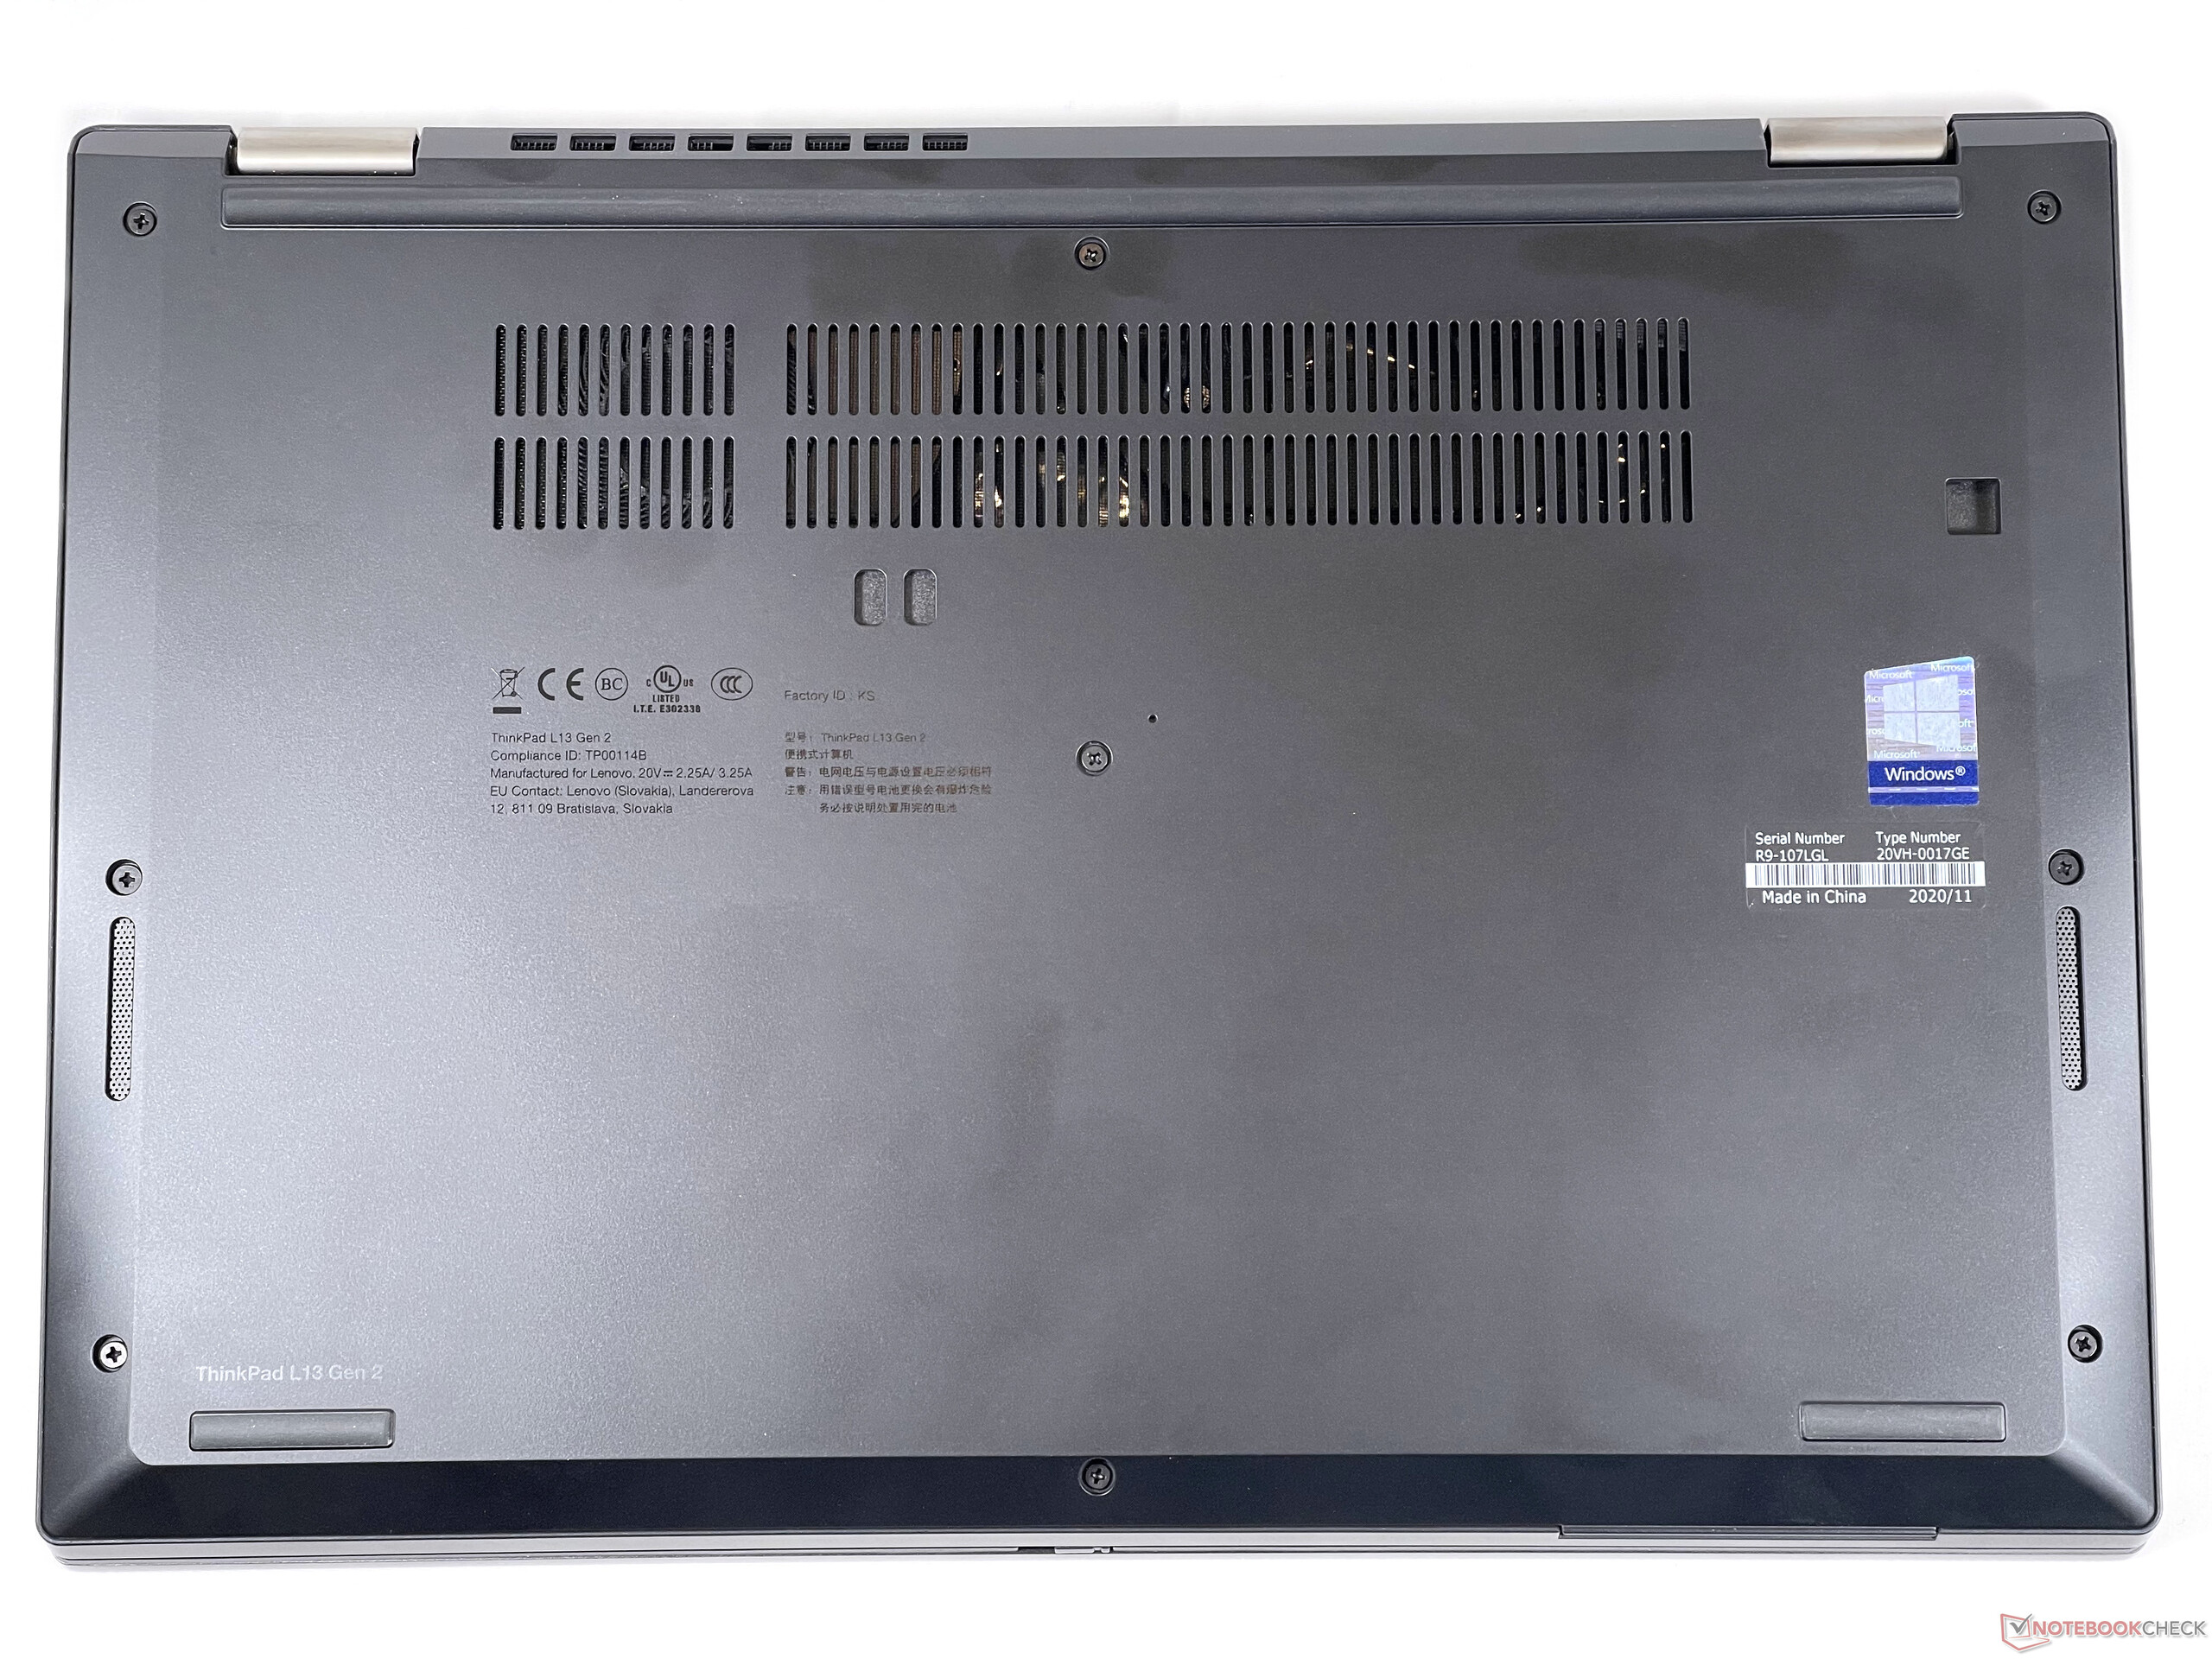
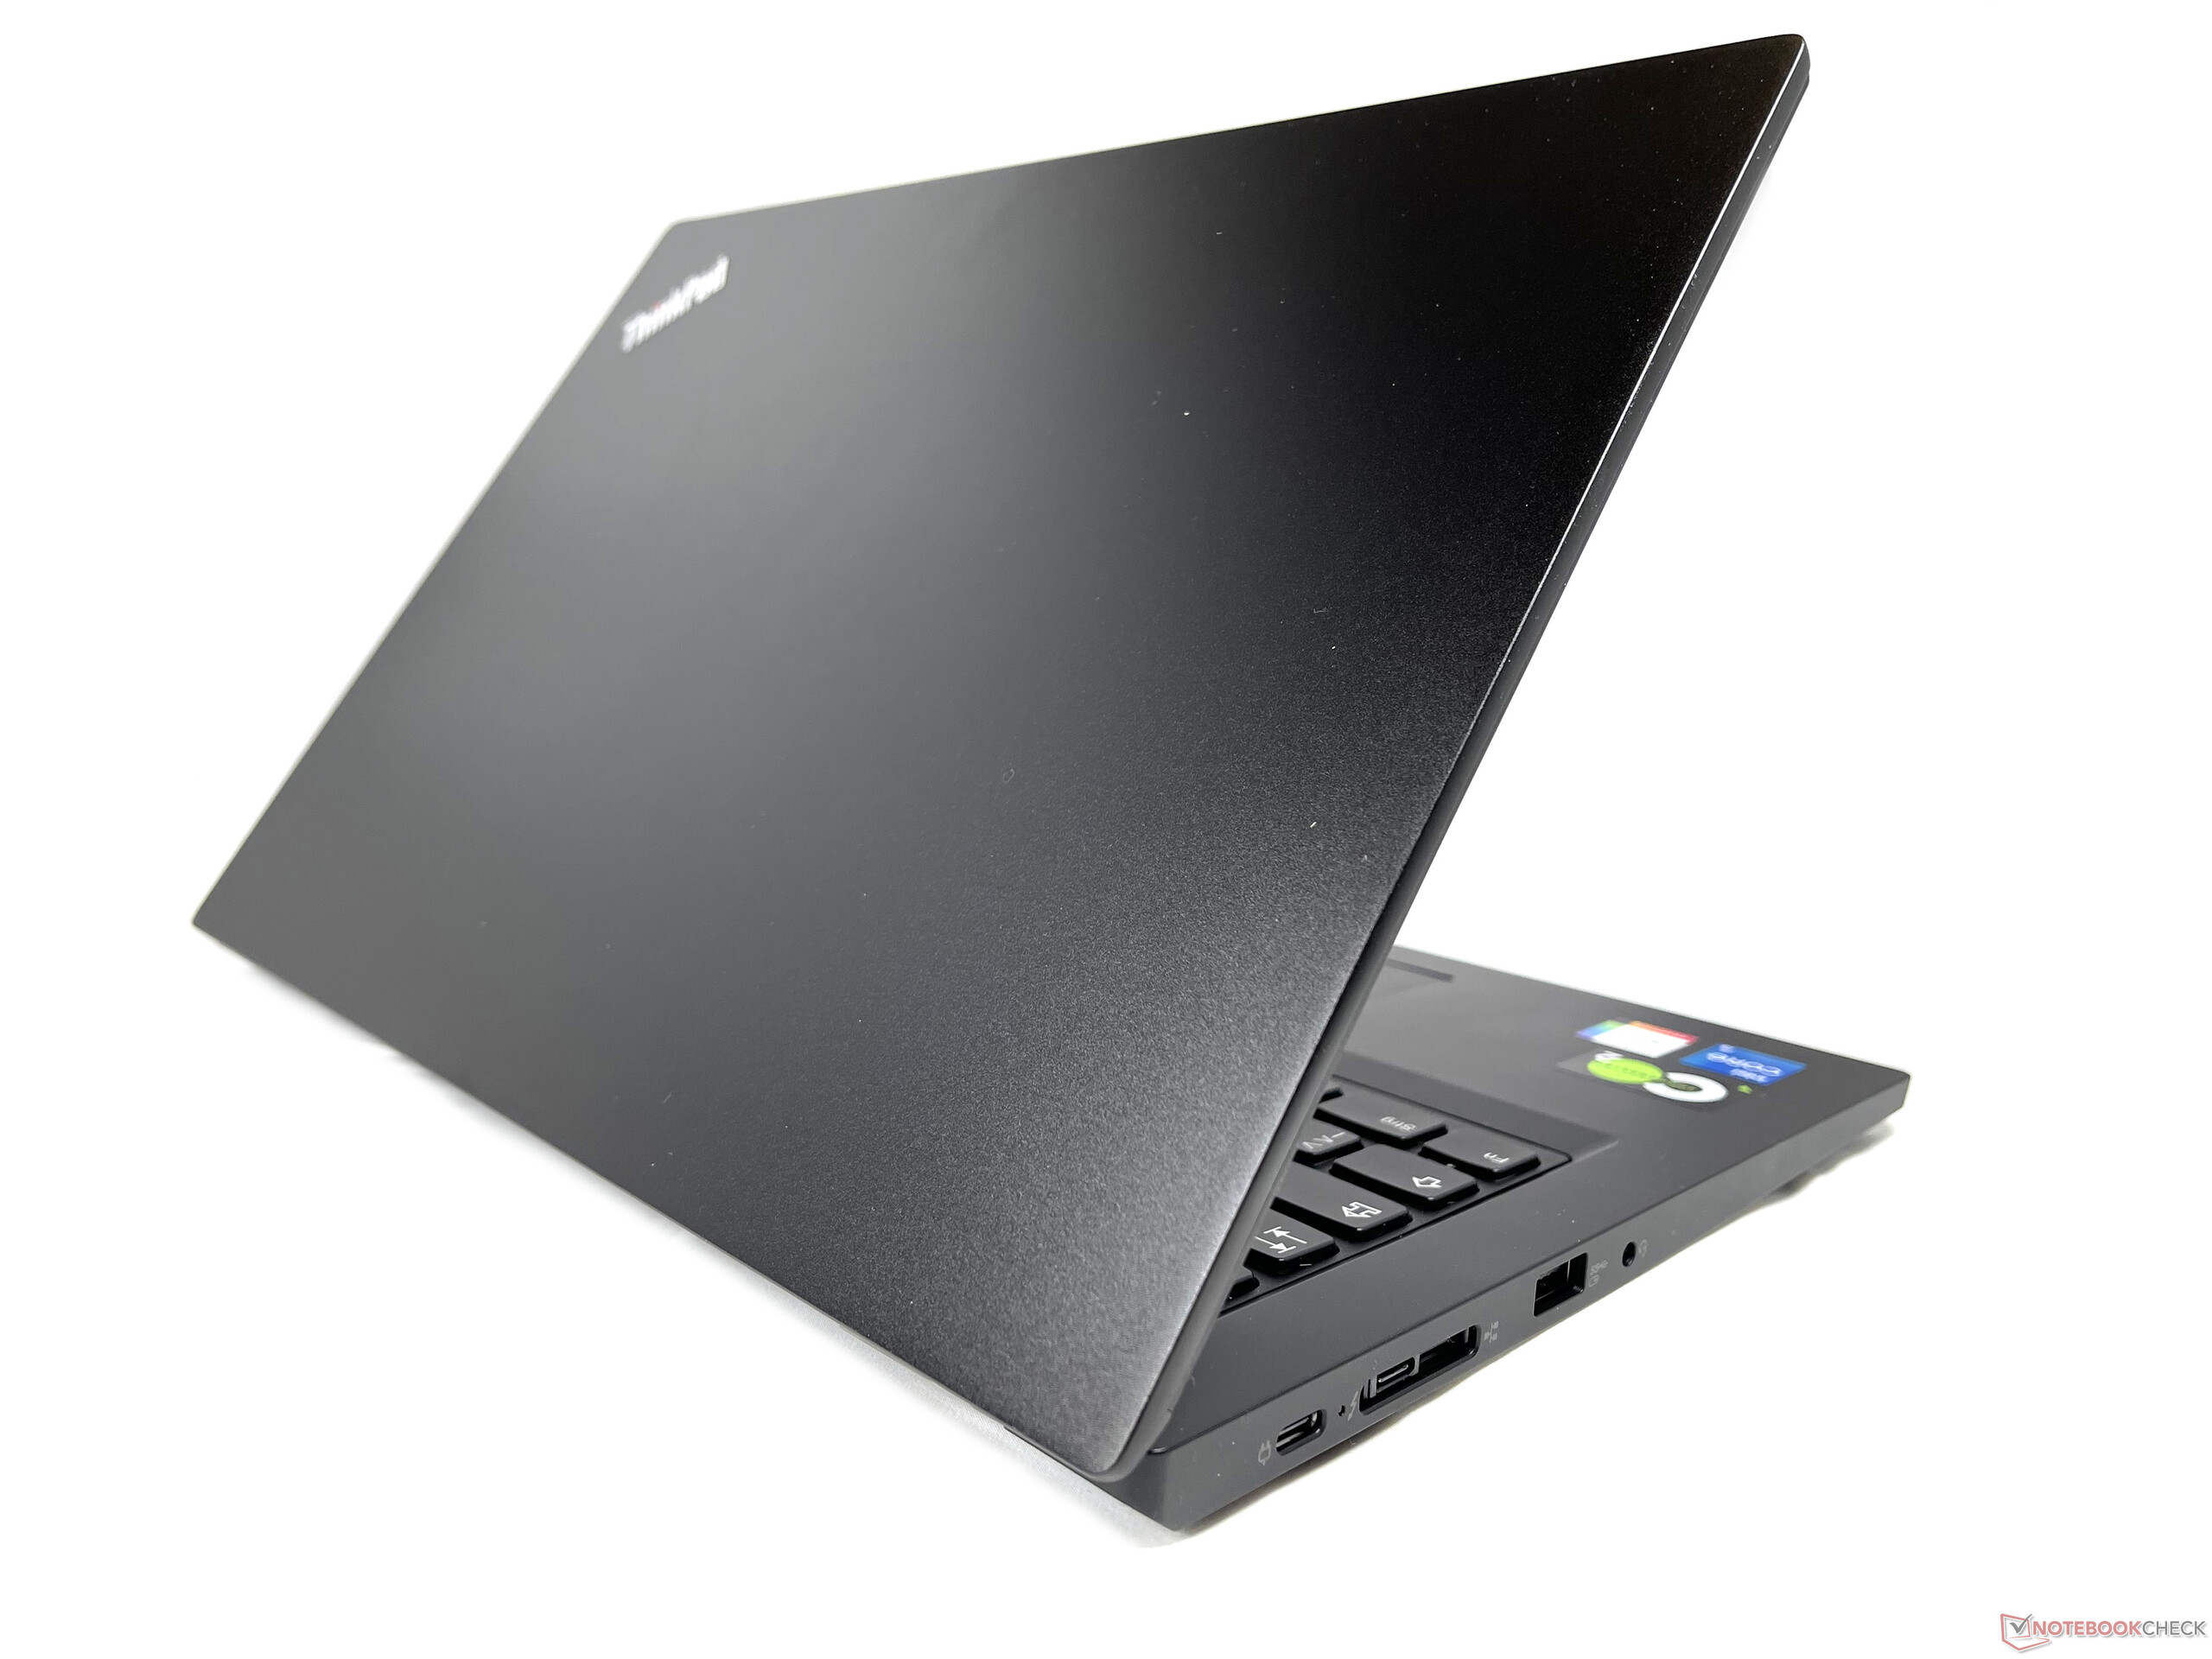
Compared to the predecessor, the ThinkPad L390, the case has only changed minimally. Additional ventilation slots on the underside are supposed to improve cooling performance. Apart from that, the stability of the plastic construction is still good, and only the lateral display bezels have shrunk a bit, which makes the ultrabook look more modern overall. The matte, black plastic surfaces are extremely susceptible to fingerprints. Due to the low overall weight, the ThinkPad L13 is difficult to open with one hand.
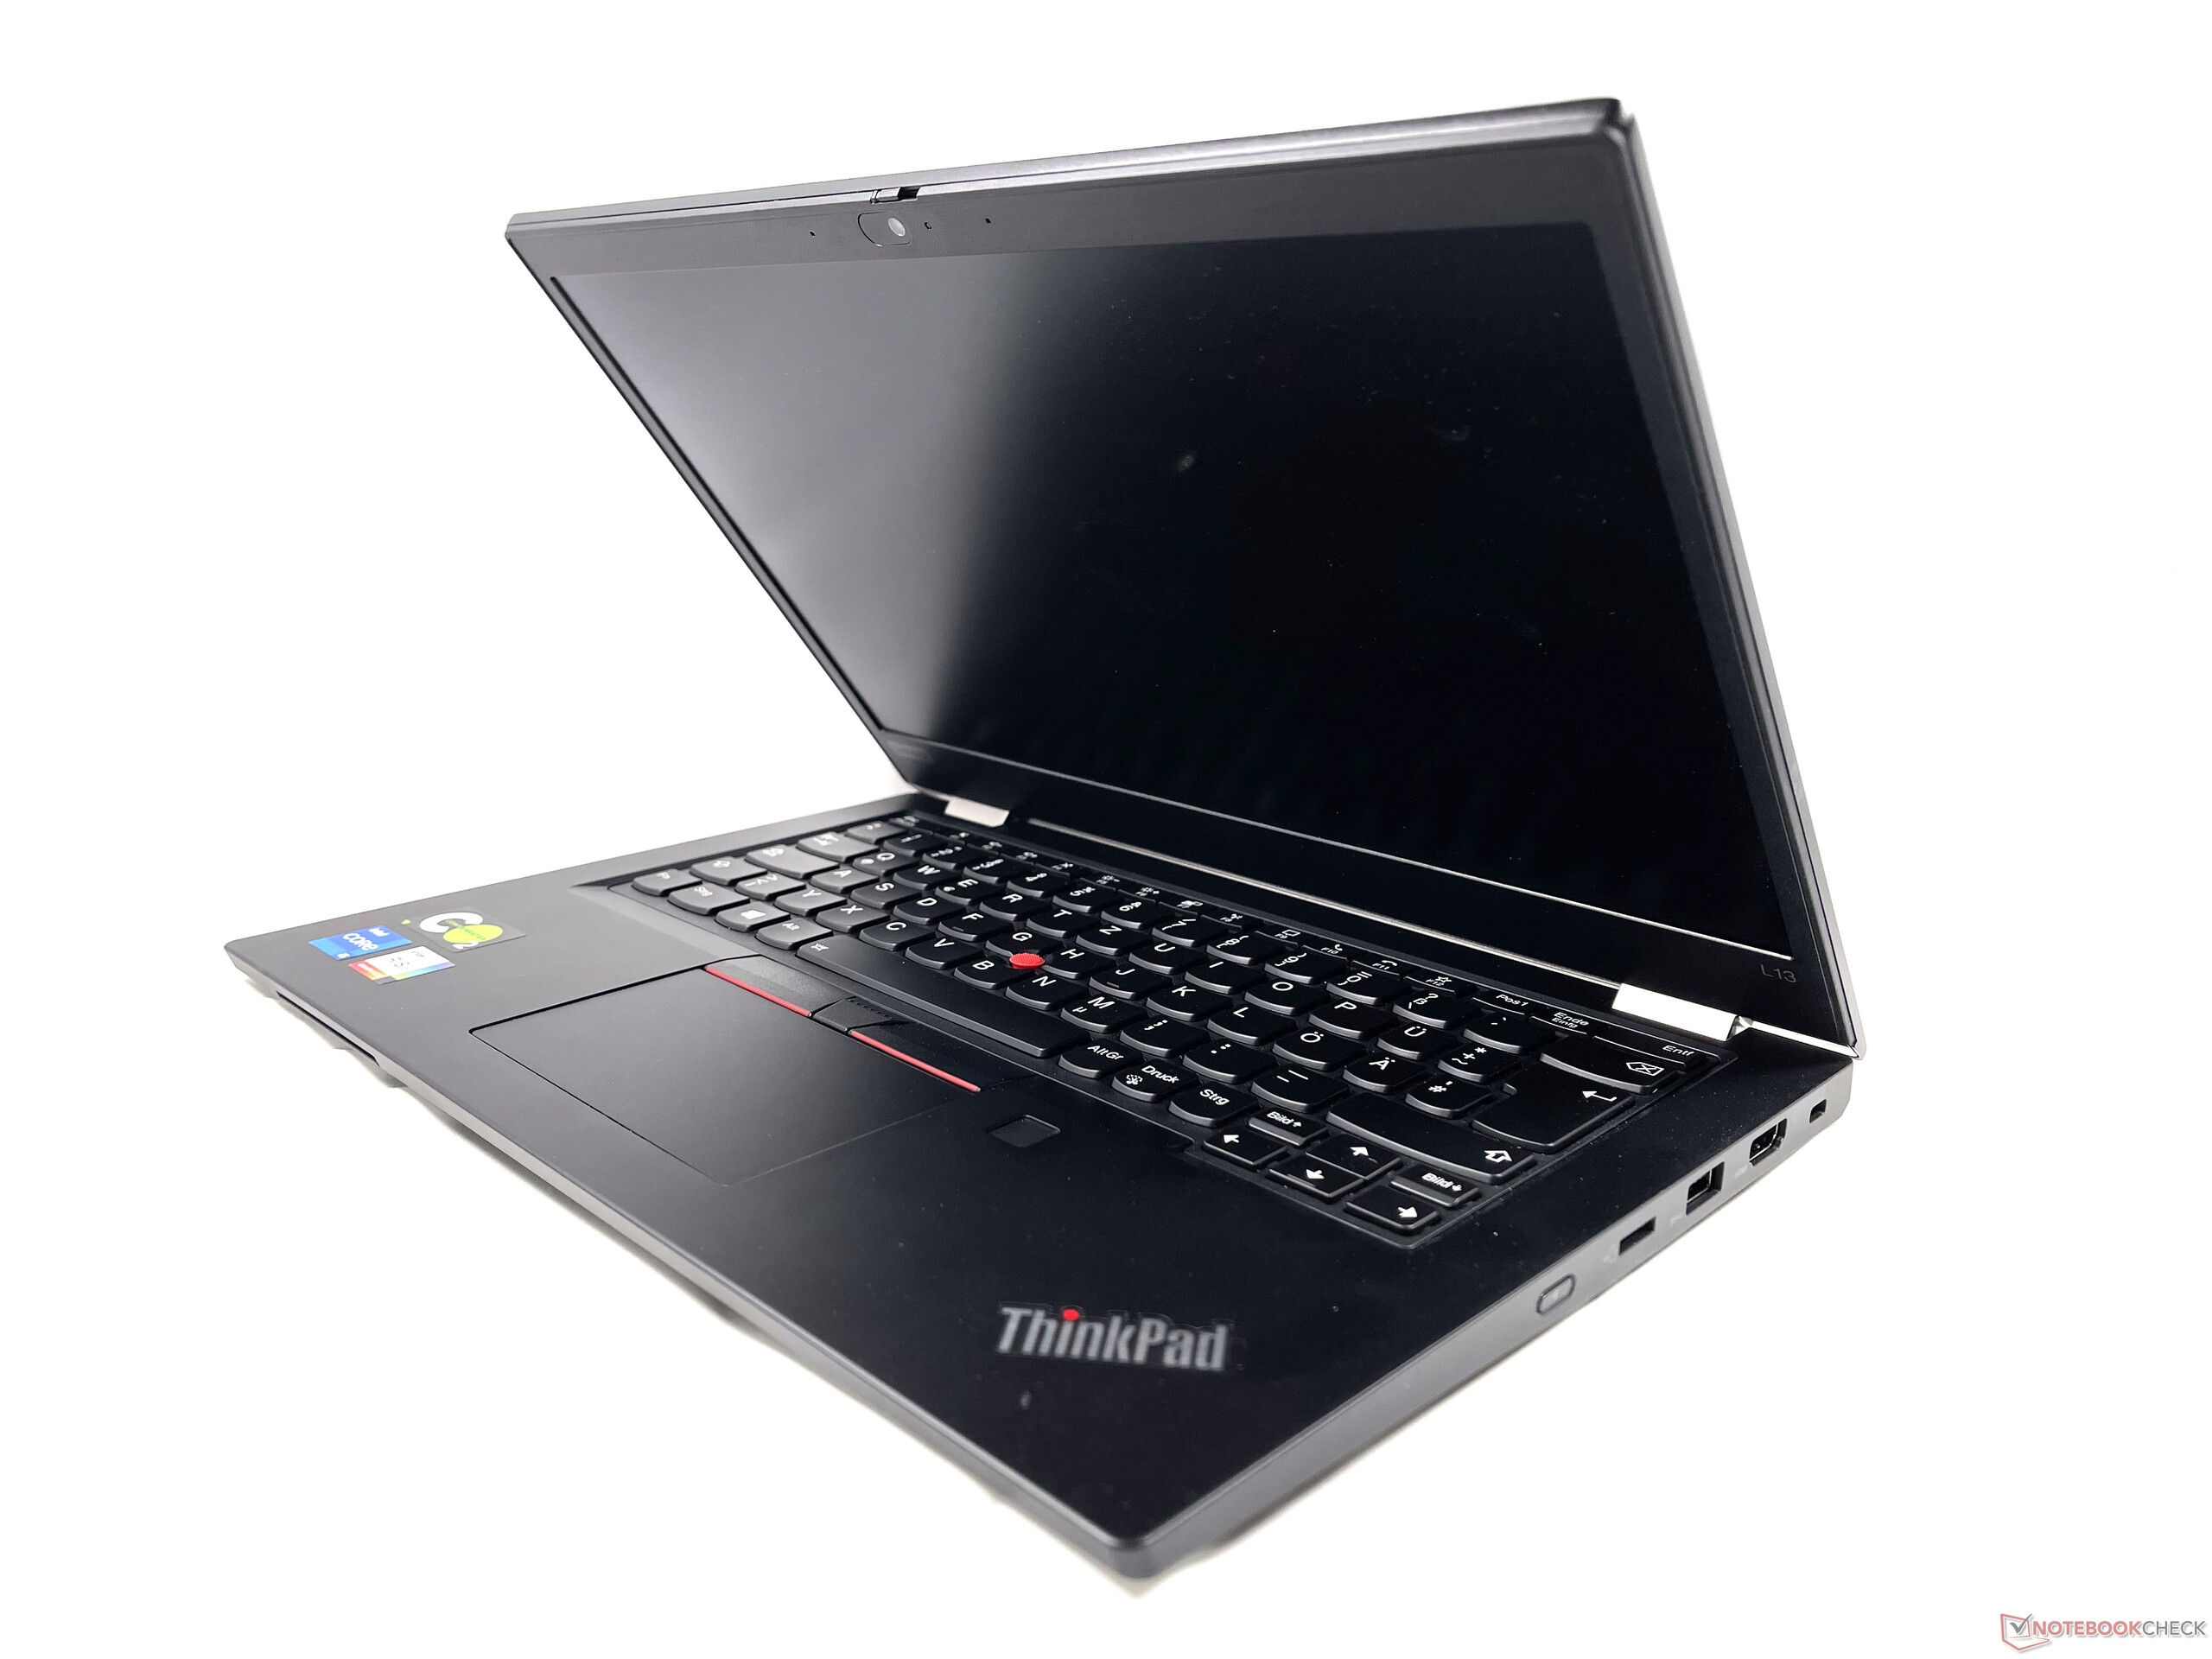
The dimensions of all the laptops in the comparison field are very similar, with the exception of those of the Acer Swift SF314, which is a bit bigger as a 14-inch model on the one hand, but on the other hand, it's also thinner. Compared with the ThinkPad L390, our test device is a bit more compact thanks to the revised design. Users who place a lot of value on low weight might find what they're looking for in the HP Pavilion 13 or the Acer Swift SF314, since at approximately 1.2 kg, both models are about 200 grams lighter than our ThinkPad L13.
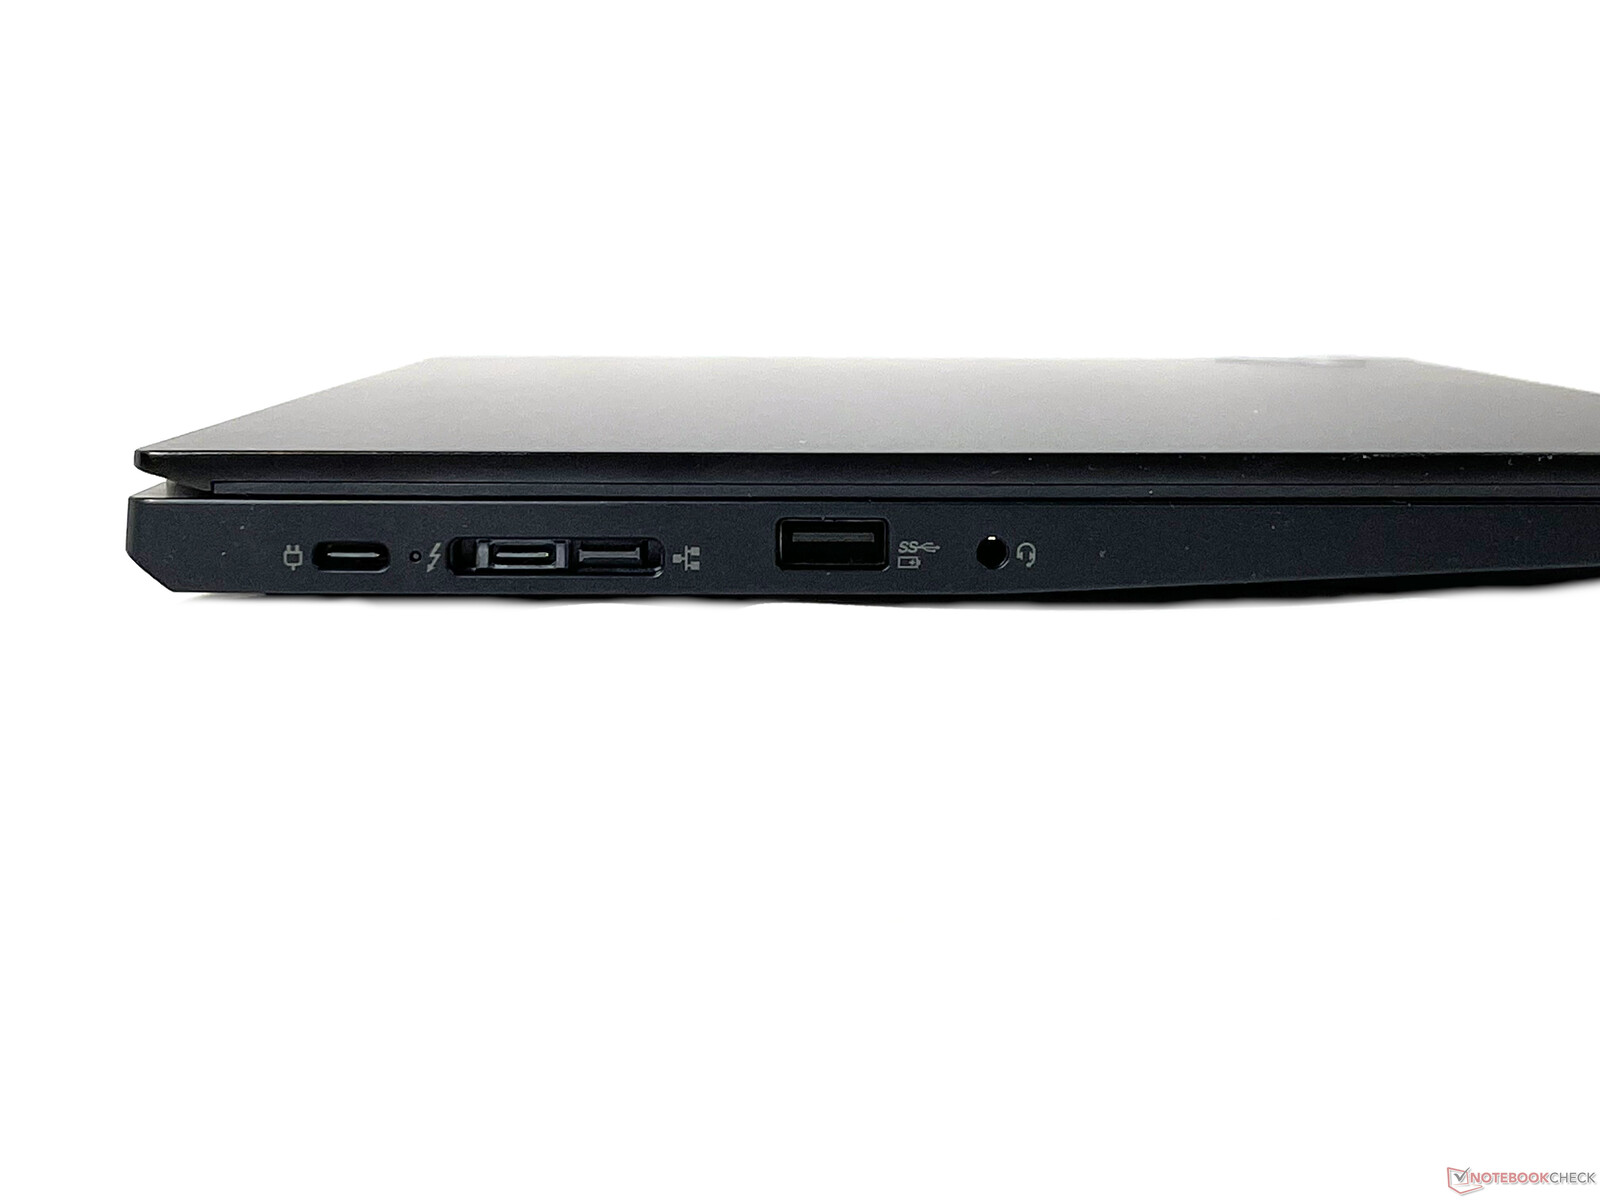
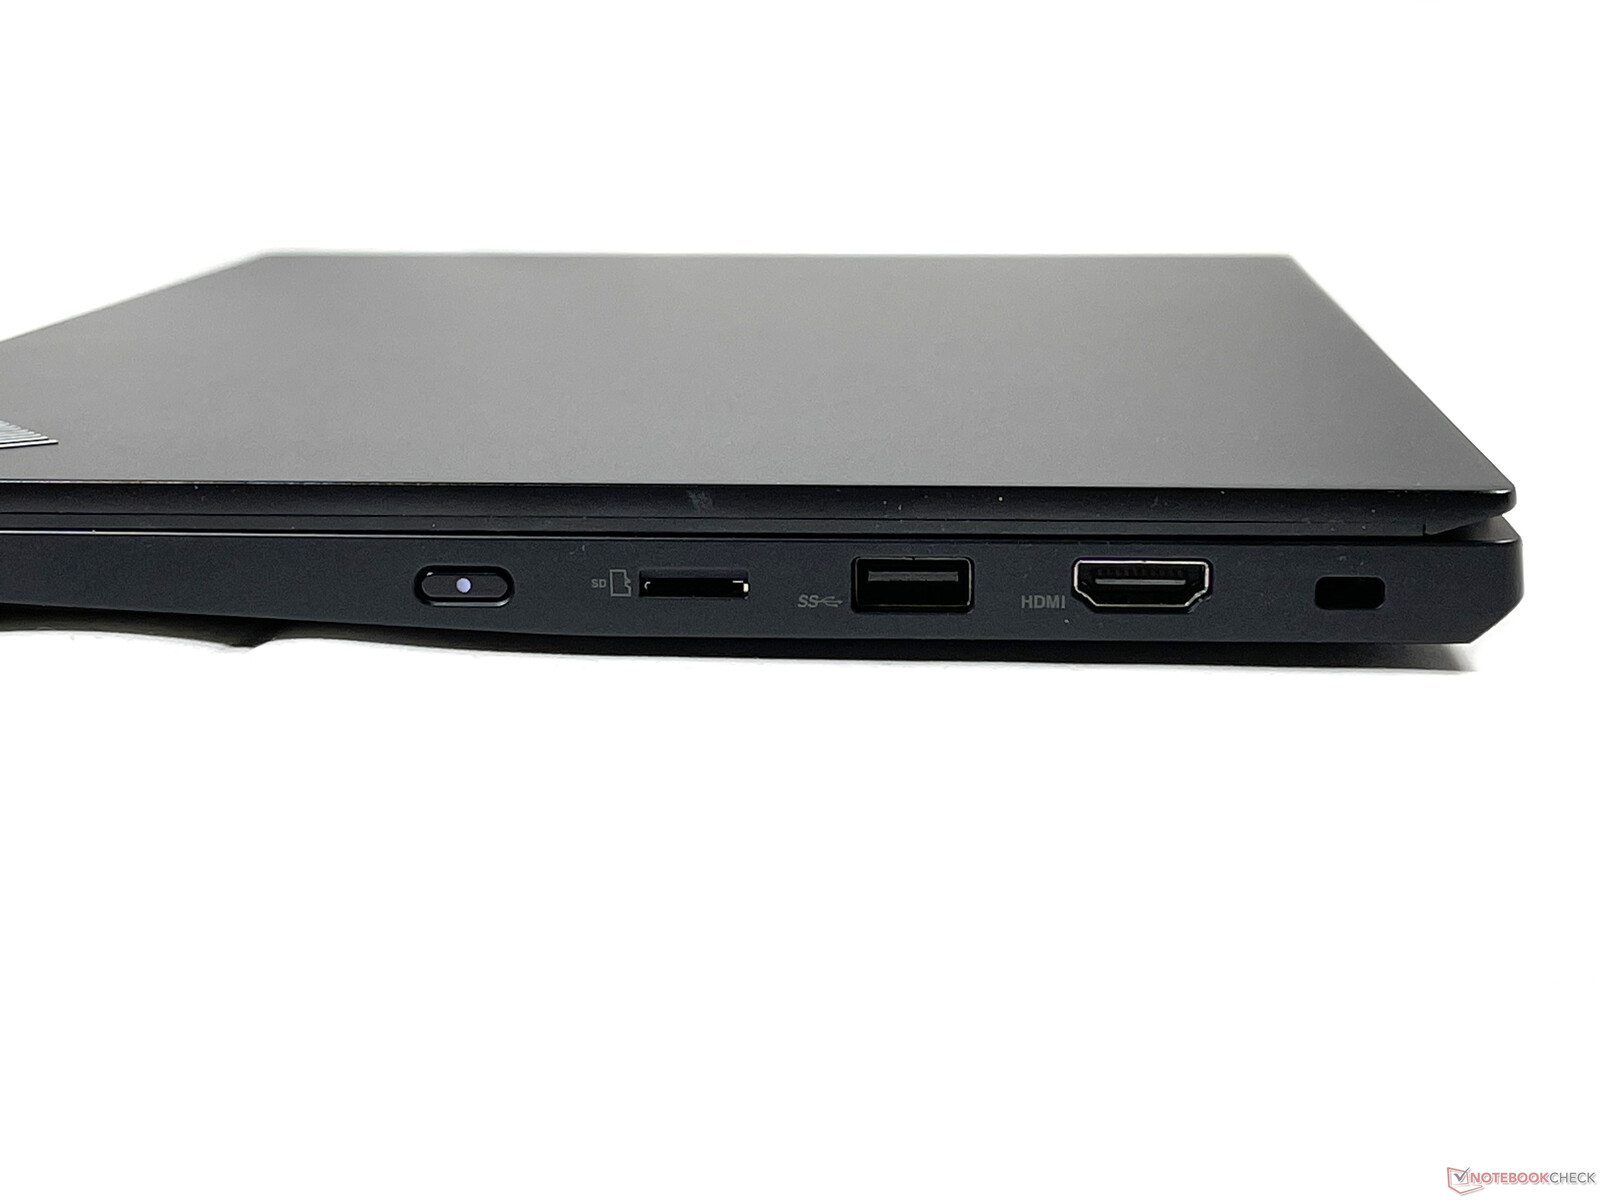
Connectivity - Smart card reader and USB 4/Thunderbolt 4
| SD Card Reader | |
| average JPG Copy Test (av. of 3 runs) | |
| HP Pavilion 13-bb0015cl (Toshiba Exceria Pro M501 32 GB UHS-II) | |
| Lenovo ThinkPad L13 Gen2-20VH0017GE (Toshiba Exceria Pro M501 64 GB UHS-II) | |
| Lenovo ThinkPad L390-20NR0013GE (Toshiba Exceria Pro M501 UHS-II) | |
| Lenovo ThinkPad L13 Yoga 20R6S00800 | |
| HP ProBook 430 G7-8VU53EA | |
| Average of class Office (22.4 - 198.5, n=22, last 2 years) | |
| maximum AS SSD Seq Read Test (1GB) | |
| Lenovo ThinkPad L390-20NR0013GE (Toshiba Exceria Pro M501 UHS-II) | |
| HP Pavilion 13-bb0015cl (Toshiba Exceria Pro M501 32 GB UHS-II) | |
| Lenovo ThinkPad L13 Yoga 20R6S00800 (Toshiba Exceria Pro M501 64 GB UHS-II) | |
| Lenovo ThinkPad L13 Gen2-20VH0017GE (Toshiba Exceria Pro M501 64 GB UHS-II) | |
| HP ProBook 430 G7-8VU53EA (Toshiba Exceria Pro SDXC 64 GB UHS-II) | |
| Average of class Office (27.4 - 249, n=20, last 2 years) | |
Communication
Intel's AX201 module offers WLAN 6 and Bluetooth 5.1 compatibility. WWAN solutions are not available within this model series.
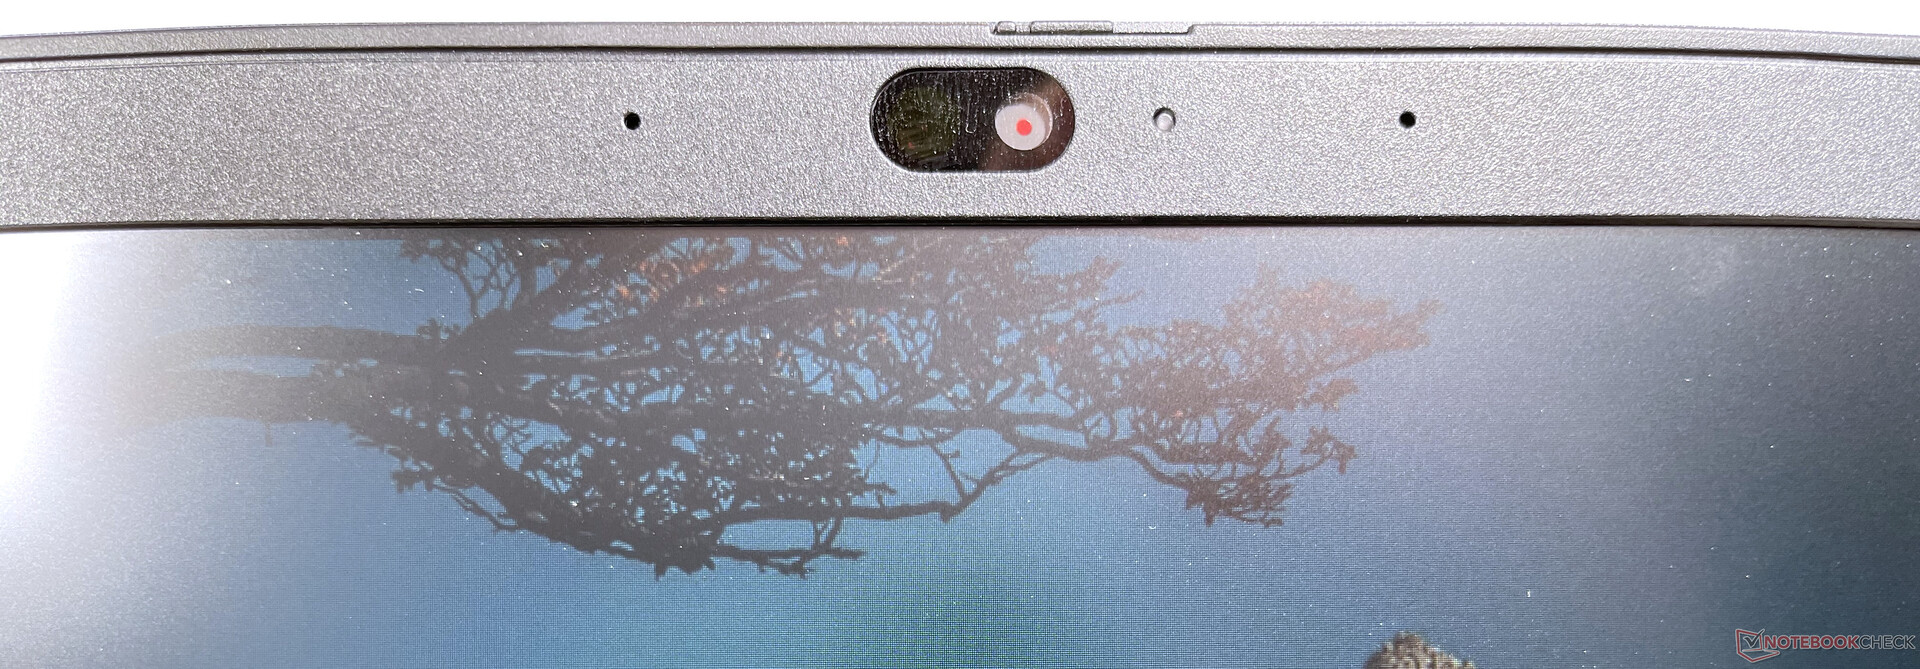
Webcam


Security
As a business laptop, the ThinkPad L13 also features TPM 2.0, an infrared camera (certain models) for Windows Hello, and a smart card reader in addition to a fingerprint scanner. The built-in security lock mechanism also promises increased theft protection.
Maintenance
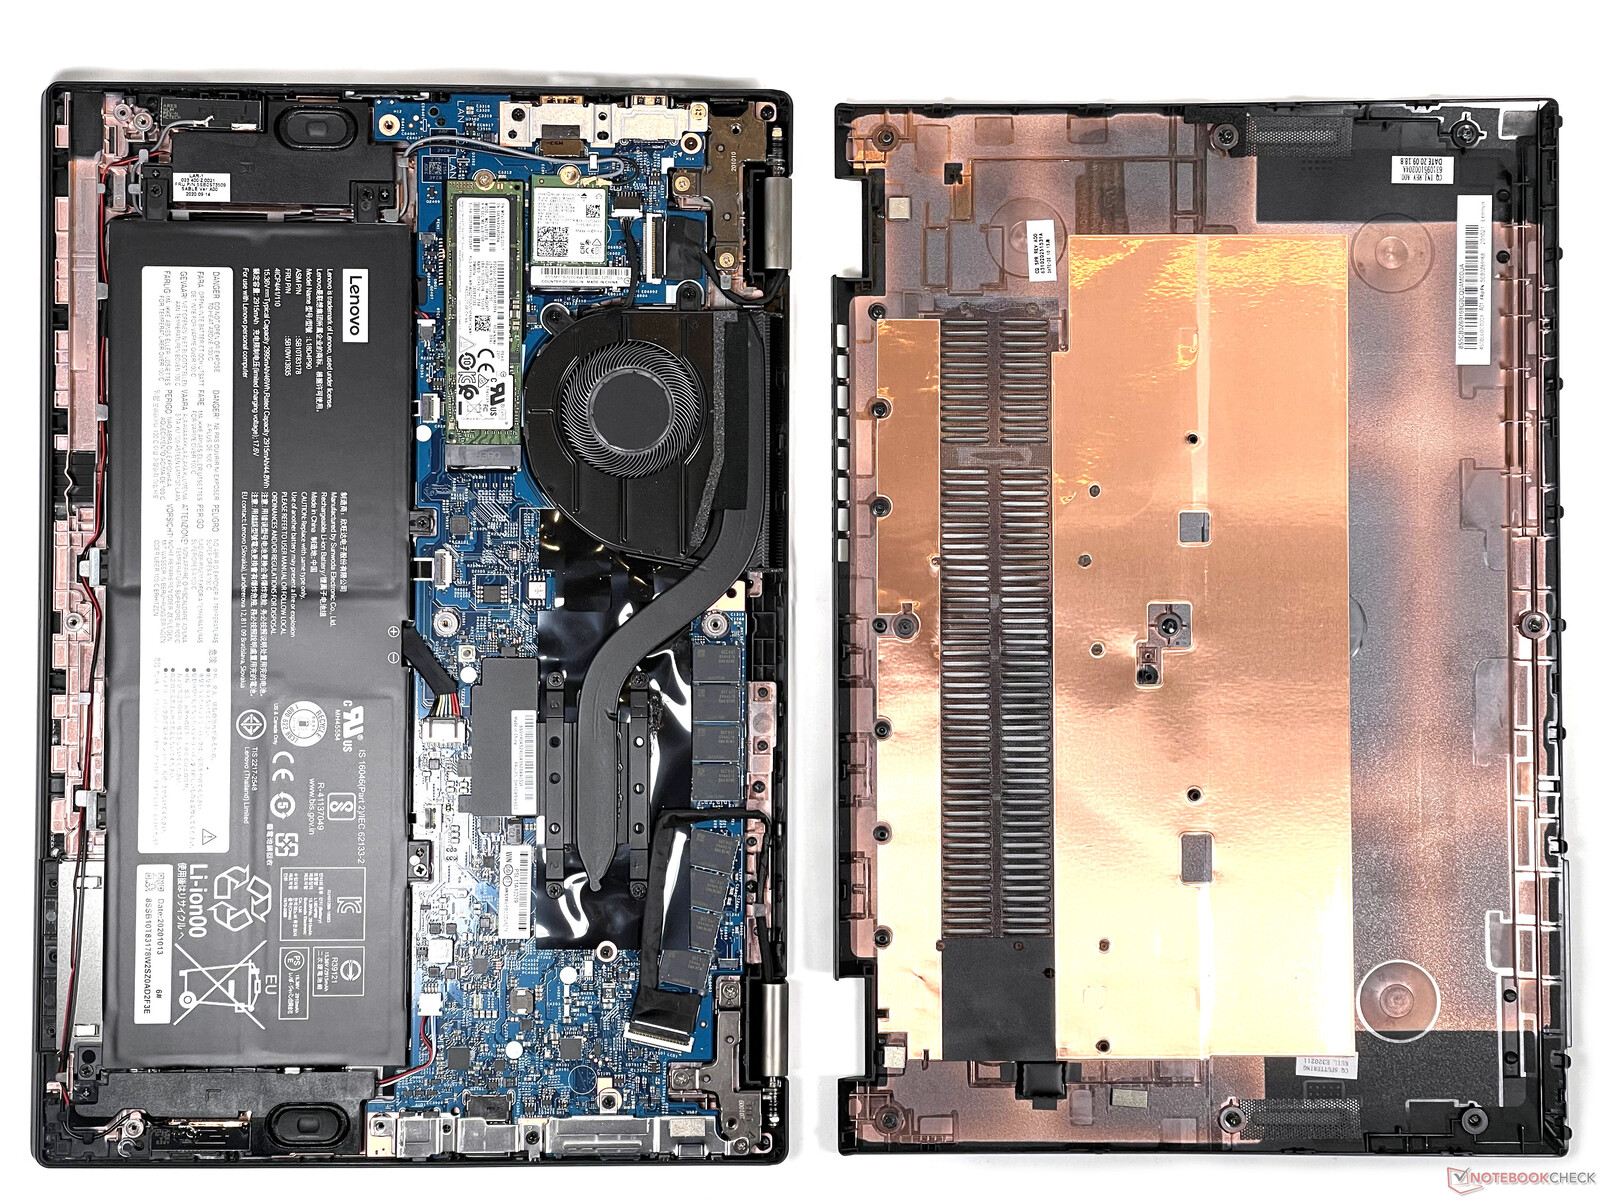
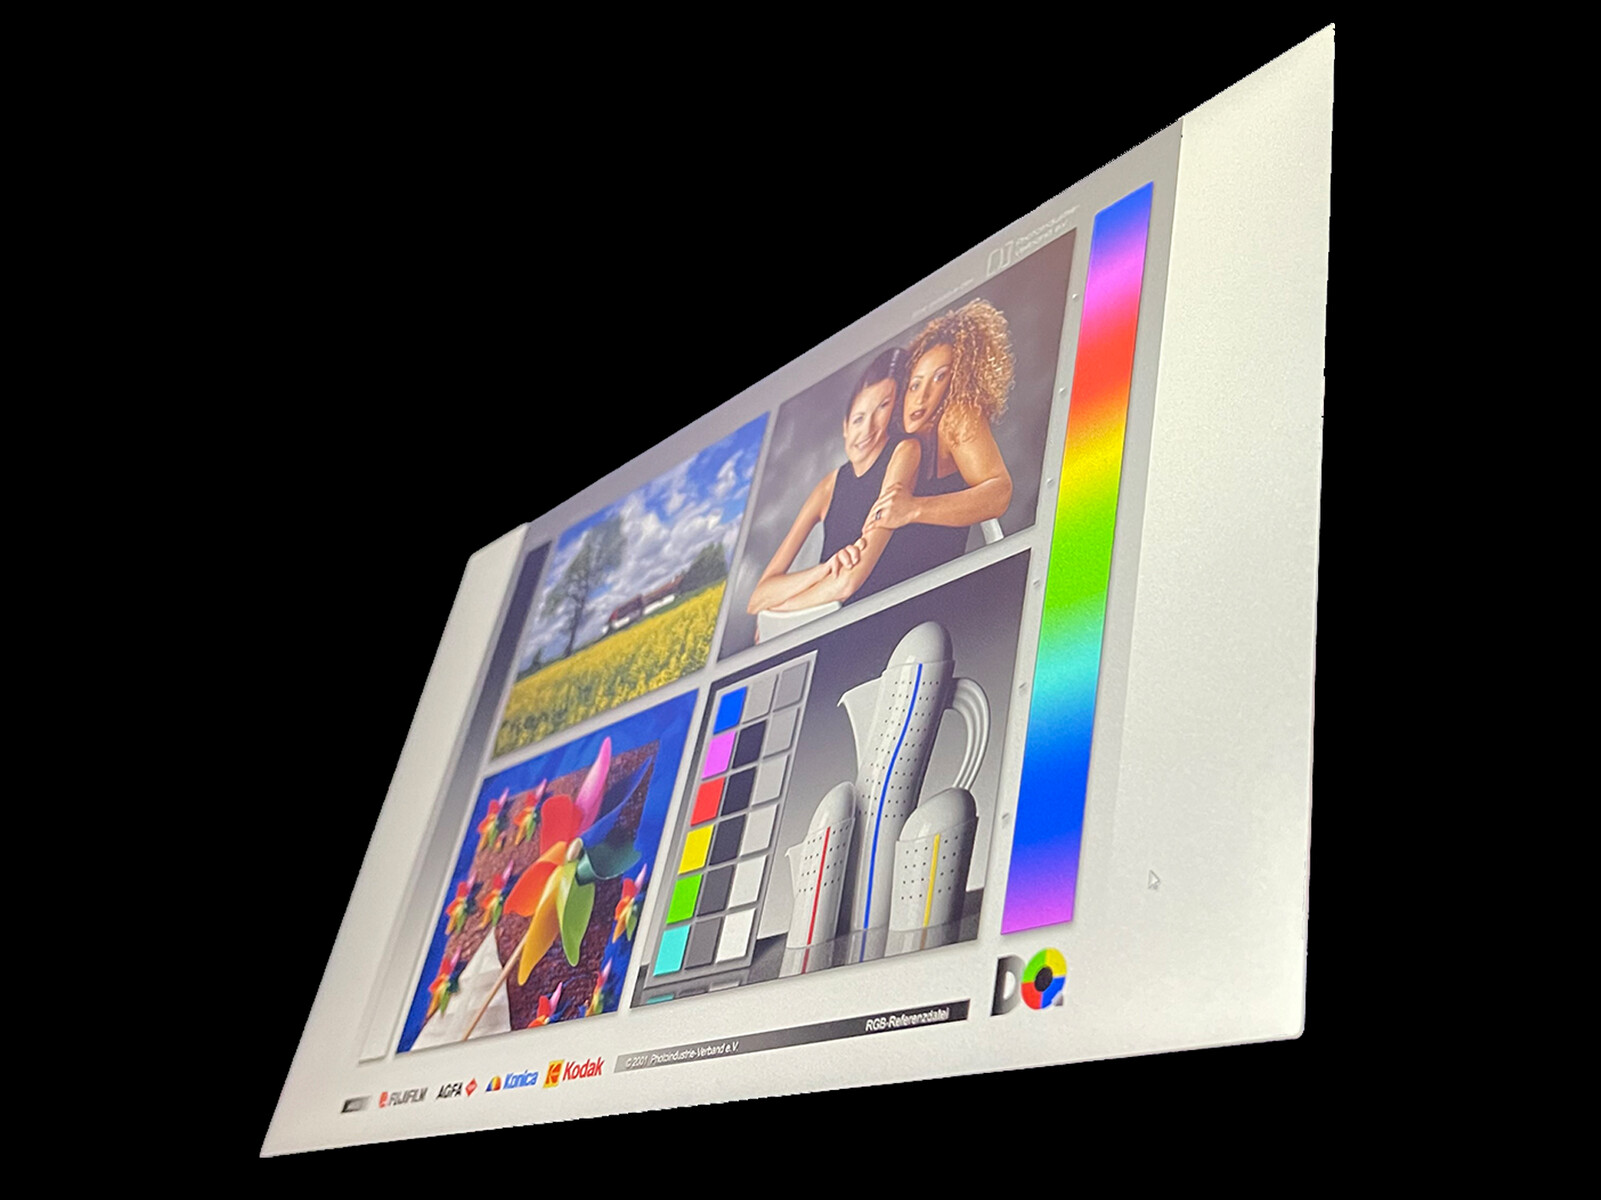
Display - Full HD panel with optional touchscreen
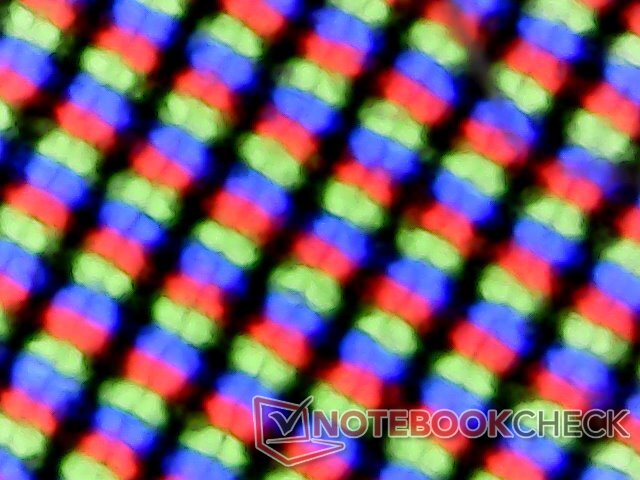
Our test device's matte 13.3-inch IPS display has a native resolution of 1920x1080 pixels (Full HD). Prospective buyers can alternatively choose a Full HD touchscreen with a marginally higher brightness or a cheaper TN panel with a resolution of 1366x768 pixels (HD). In contrast to the HP Pavilion 13, Lenovo doesn't offer a 4K display within this model range.
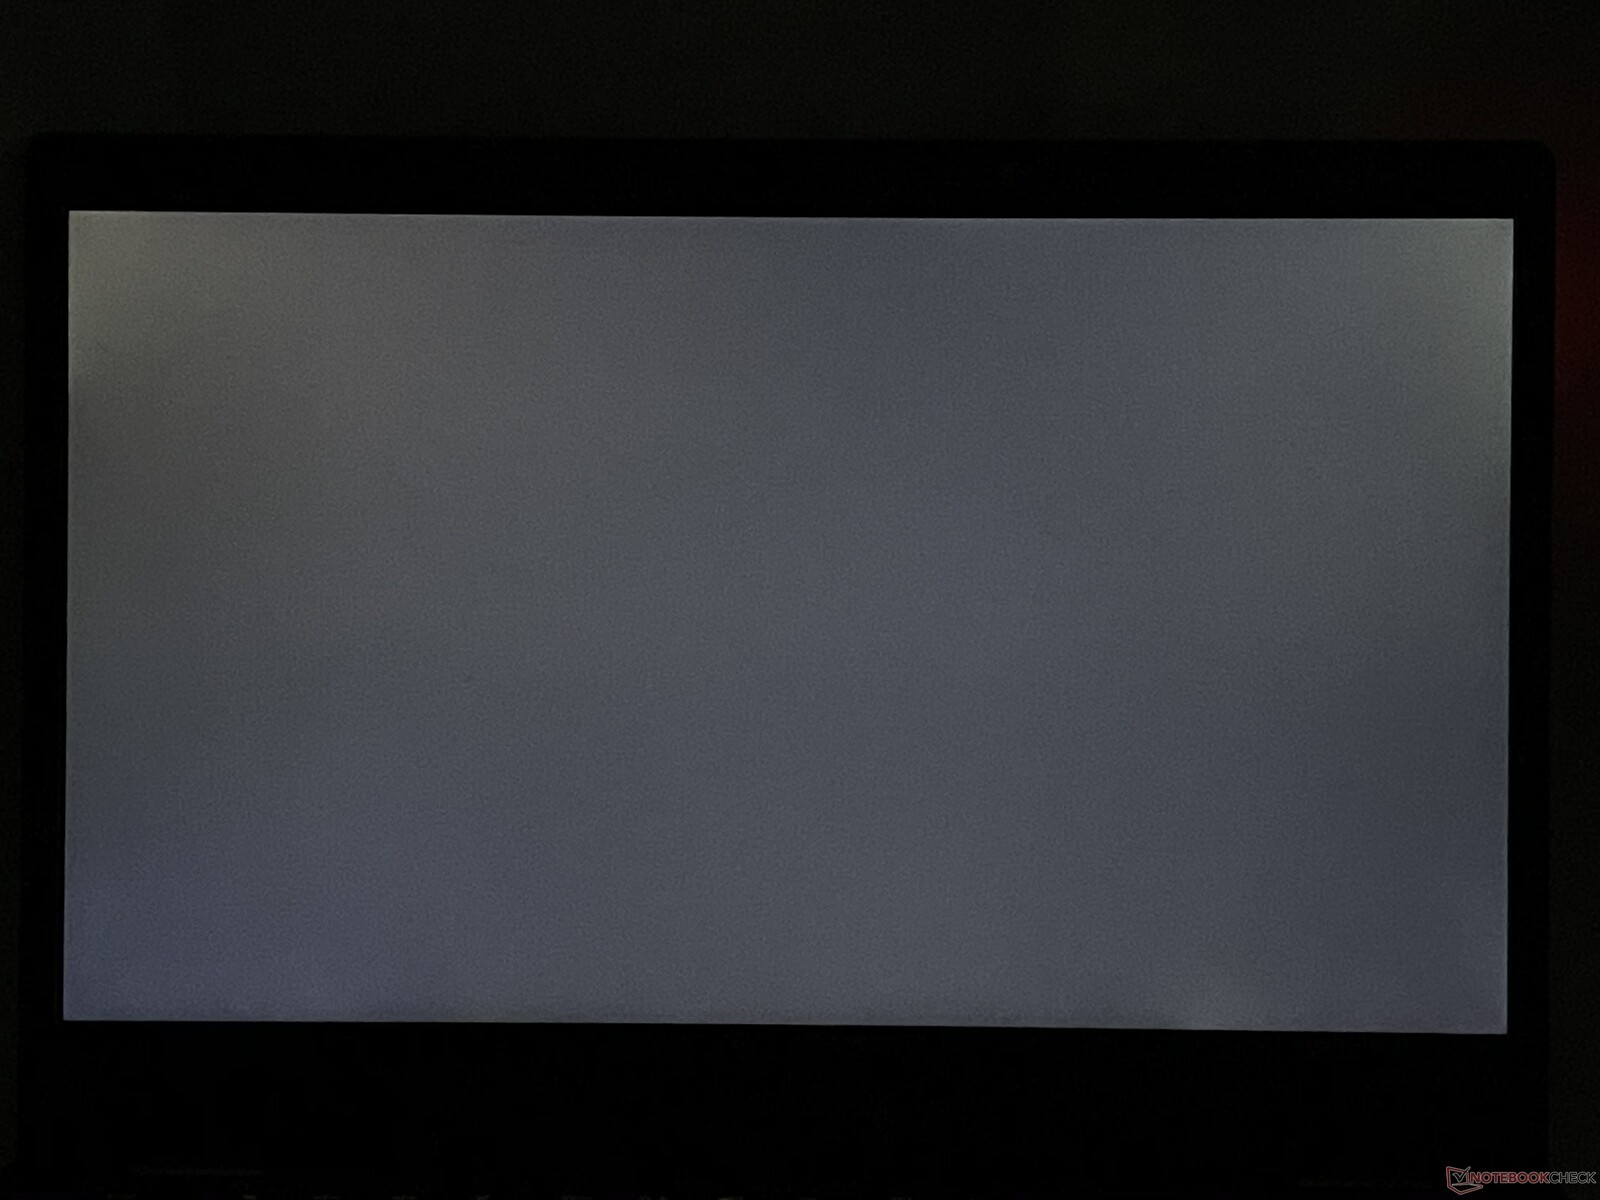
There is no PWM, and screen bleeding isn't a big problem either. The subjective image impression is good, but bright areas look minimally grainy on the matte screen.
| |||||||||||||||||||||||||
Brightness Distribution: 93 %
Center on Battery: 246 cd/m²
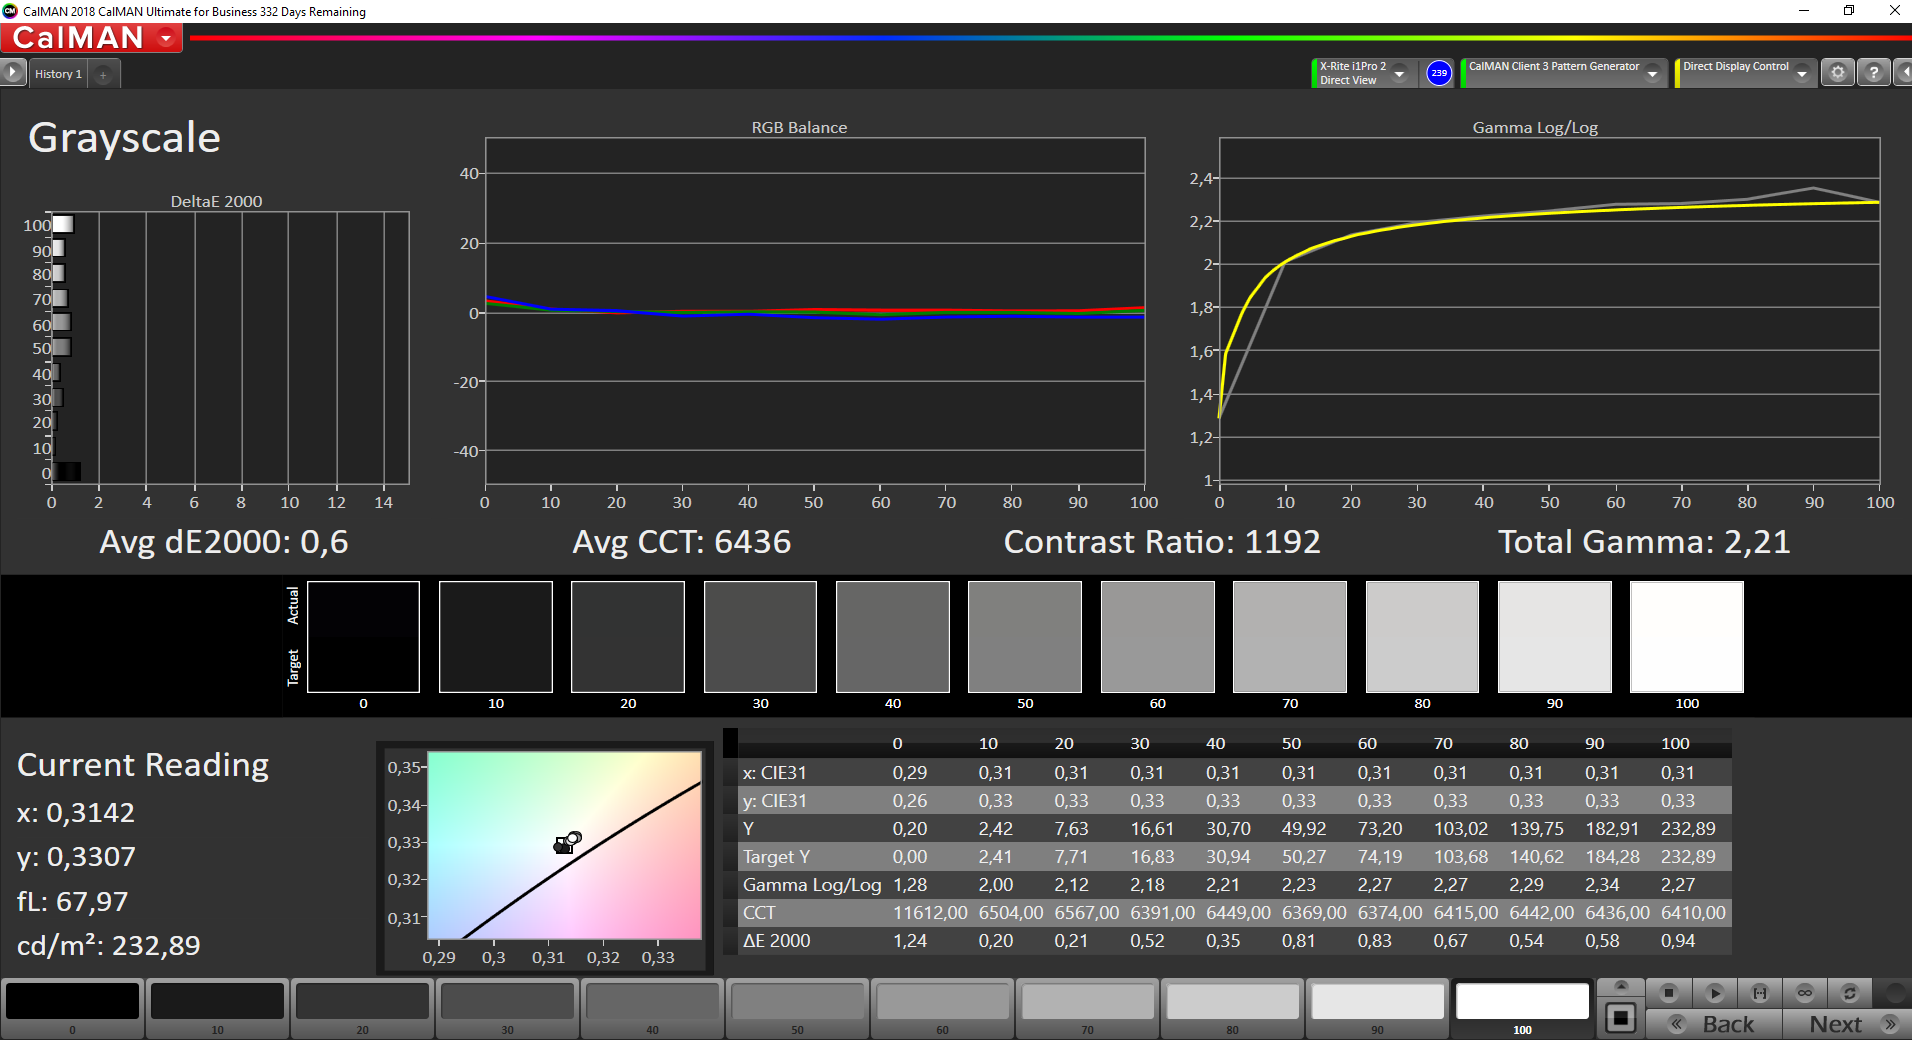
Contrast: 1162:1 (Black: 0.21 cd/m²)
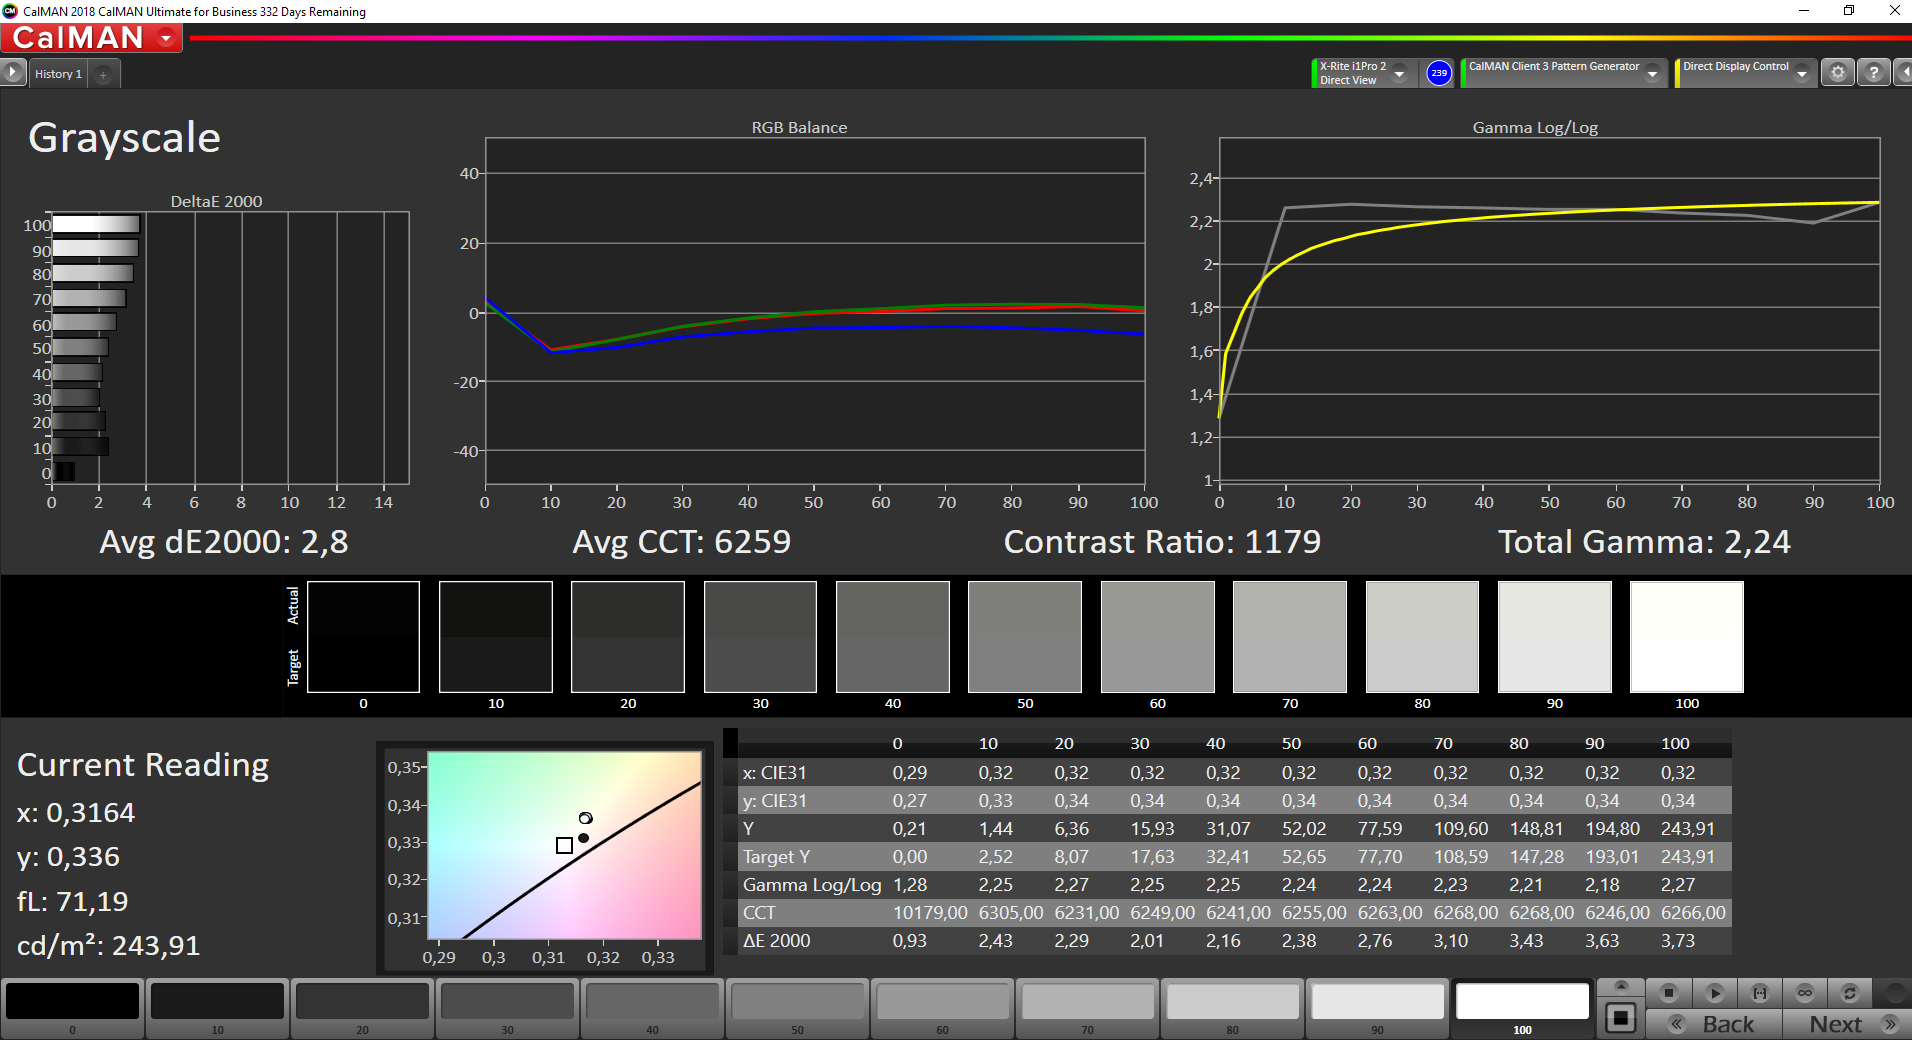
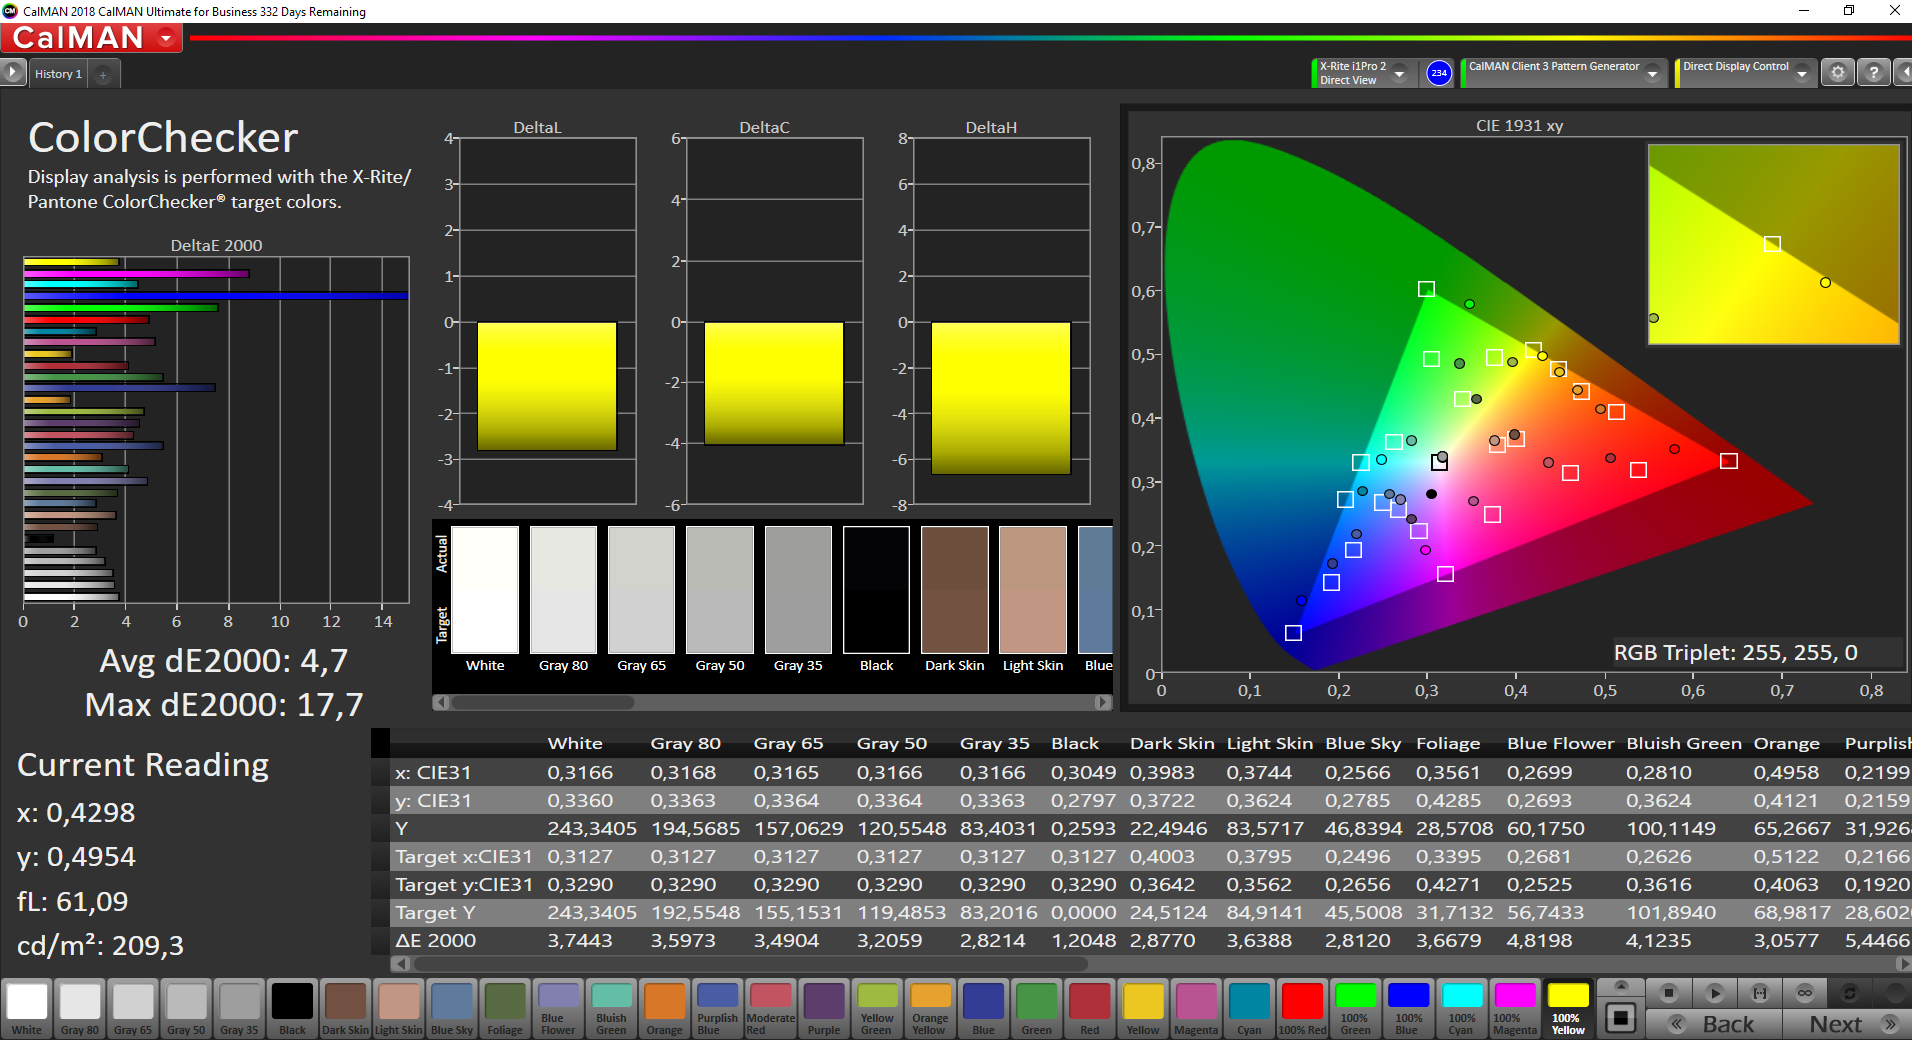
ΔE ColorChecker Calman: 4.7 | ∀{0.5-29.43 Ø4.73}
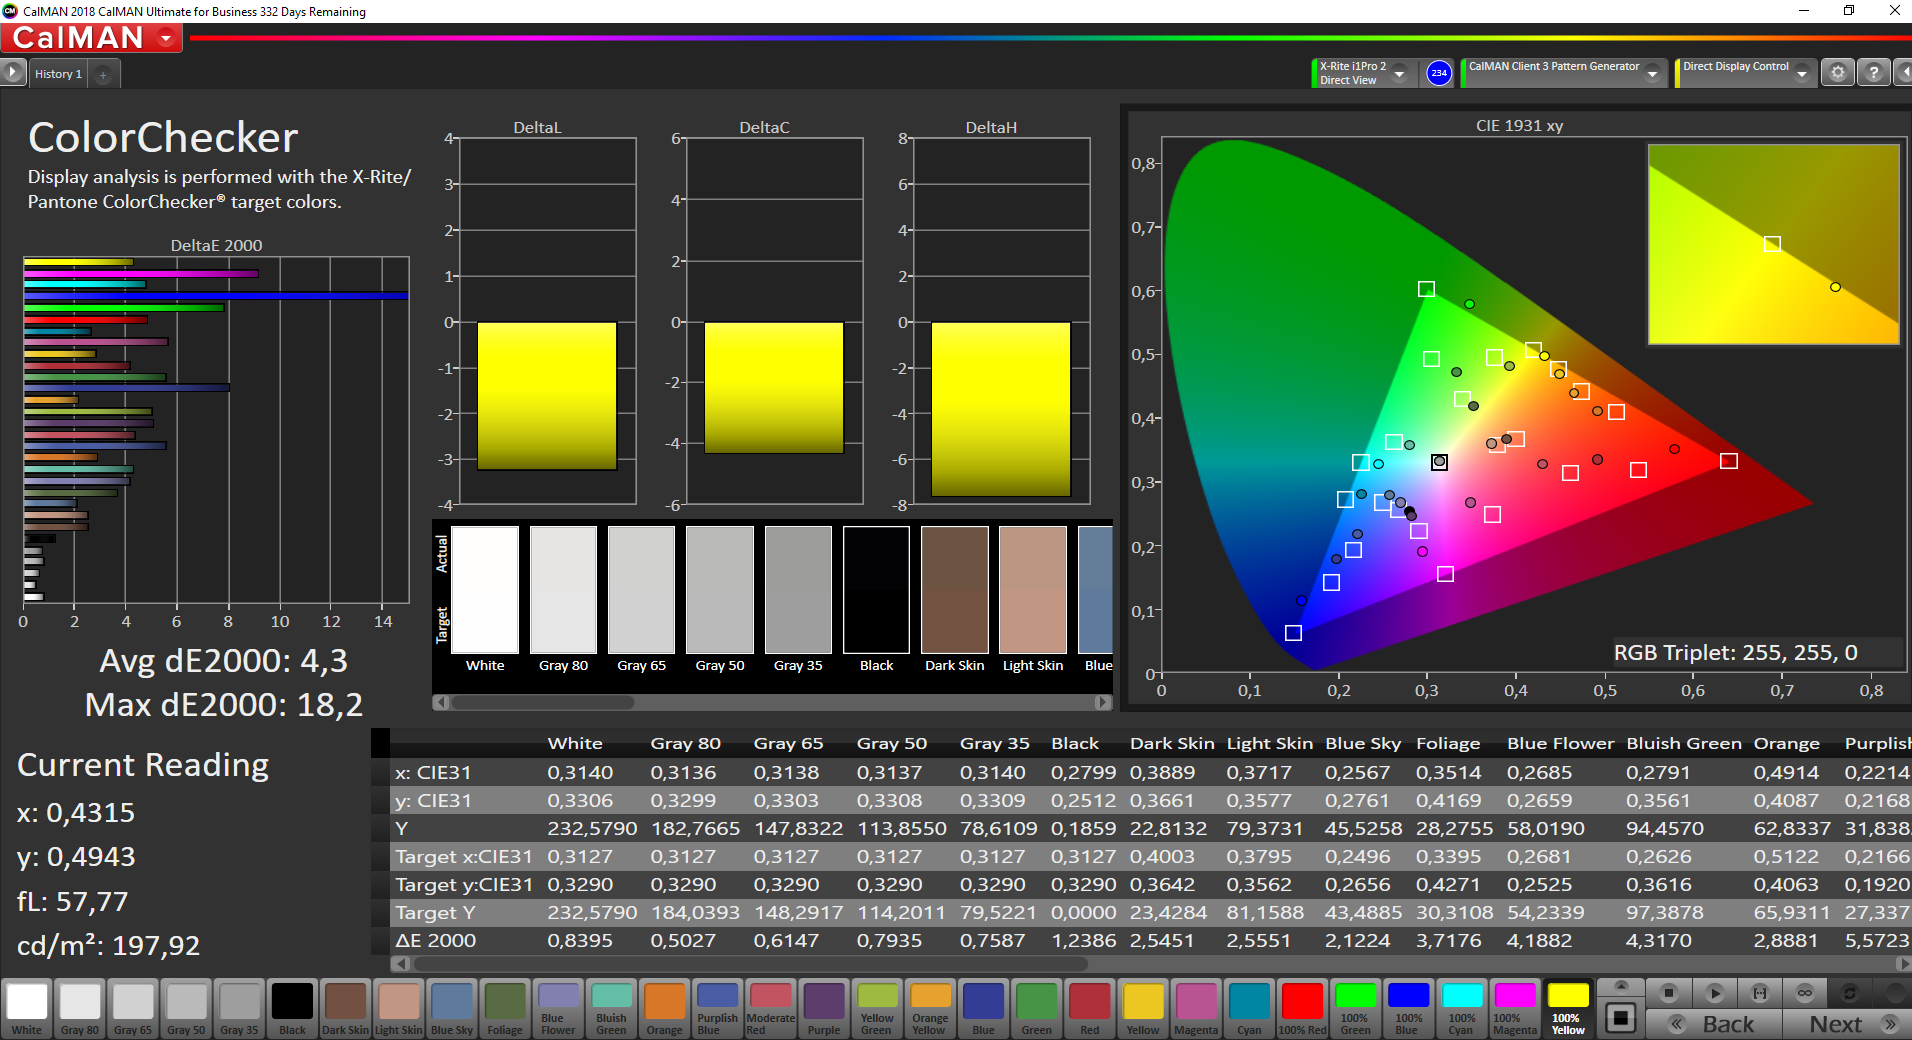
calibrated: 4.3
ΔE Greyscale Calman: 2.8 | ∀{0.09-98 Ø4.97}
63% sRGB (Argyll 1.6.3 3D)
40.3% AdobeRGB 1998 (Argyll 1.6.3 3D)
43.92% AdobeRGB 1998 (Argyll 3D)
42.49% Display P3 (Argyll 3D)
Gamma: 2.24
CCT: 6259 K
| Lenovo ThinkPad L13 Gen2-20VH0017GE B133HAN06.6, IPS, 1920x1080, 13.3" | HP Pavilion 13-bb0015cl AUOCA8D, IPS, 3840x2160, 13.3" | Acer Swift 3 SF314-42-R27B AU Optronics B140HAN04.0, IPS, 1920x1080, 14" | HP ProBook 430 G7-8VU53EA BOE08A6, IPS LED, 1920x1080, 13.3" | Lenovo ThinkPad L13 Yoga 20R6S00800 N133HCE-EP2, IPS, 1920x1080, 13.3" | Lenovo ThinkPad L390-20NR0013GE LP133WF2-SPL8, IPS LED, 1920x1080, 13.3" | |
|---|---|---|---|---|---|---|
| Display | 52% | -11% | 1% | 60% | -5% | |
| Display P3 Coverage (%) | 42.49 | 65 53% | 37.78 -11% | 42.79 1% | 68.1 60% | 40.42 -5% |
| sRGB Coverage (%) | 93.4 | 56.8 | 62.8 | 94.7 | 60.4 | |
| AdobeRGB 1998 Coverage (%) | 43.92 | 66.5 51% | 39.03 -11% | 44.21 1% | 70.2 60% | 41.8 -5% |
| Response Times | -17% | 15% | 2% | 17% | 11% | |
| Response Time Grey 50% / Grey 80% * (ms) | 52.4 ? | 52.4 ? -0% | 42 ? 20% | 48.8 ? 7% | 40 ? 24% | 42.8 ? 18% |
| Response Time Black / White * (ms) | 31.2 ? | 41.6 ? -33% | 28 ? 10% | 32 ? -3% | 28 ? 10% | 30 ? 4% |
| PWM Frequency (Hz) | 1000 ? | 25000 ? | 30490 ? | |||
| Screen | 27% | -3% | -6% | 49% | -23% | |
| Brightness middle (cd/m²) | 244 | 514.1 111% | 256 5% | 300 23% | 340 39% | 298 22% |
| Brightness (cd/m²) | 237 | 501 111% | 237 0% | 285 20% | 336 42% | 278 17% |
| Brightness Distribution (%) | 93 | 91 -2% | 81 -13% | 90 -3% | 90 -3% | 81 -13% |
| Black Level * (cd/m²) | 0.21 | 0.37 -76% | 0.17 19% | 0.25 -19% | 0.18 14% | 0.33 -57% |
| Contrast (:1) | 1162 | 1389 20% | 1506 30% | 1200 3% | 1889 63% | 903 -22% |
| Colorchecker dE 2000 * | 4.7 | 4.35 7% | 5.43 -16% | 5.9 -26% | 1.3 72% | 6.5 -38% |
| Colorchecker dE 2000 max. * | 17.7 | 6.5 63% | 19.73 -11% | 20 -13% | 2.8 84% | 23.9 -35% |
| Colorchecker dE 2000 calibrated * | 4.3 | 2.26 47% | 4.8 -12% | 4.6 -7% | 0.7 84% | 4.9 -14% |
| Greyscale dE 2000 * | 2.8 | 5.2 -86% | 3.29 -18% | 4 -43% | 1.9 32% | 5.6 -100% |
| Gamma | 2.24 98% | 2.12 104% | 2.52 87% | 2.23 99% | 2.15 102% | 2.08 106% |
| CCT | 6259 104% | 6308 103% | 6840 95% | 7154 91% | 6735 97% | 6669 97% |
| Color Space (Percent of AdobeRGB 1998) (%) | 40.3 | 60.6 50% | 36 -11% | 40.4 0% | 64.1 59% | 38.4 -5% |
| Color Space (Percent of sRGB) (%) | 63 | 93.3 48% | 57 -10% | 62.4 -1% | 99.6 58% | 60.1 -5% |
| Total Average (Program / Settings) | 21% /
24% | 0% /
-2% | -1% /
-4% | 42% /
47% | -6% /
-16% |
* ... smaller is better
In a class comparison, the ThinkPad L13's display stands out with a good brightness distribution of 93% and a decent black level of 0.21. The major weakness, however, is still the low display brightness that averages just under 240 cd/m². Therefore, the wish for having a brighter display can already be felt in very bright rooms.
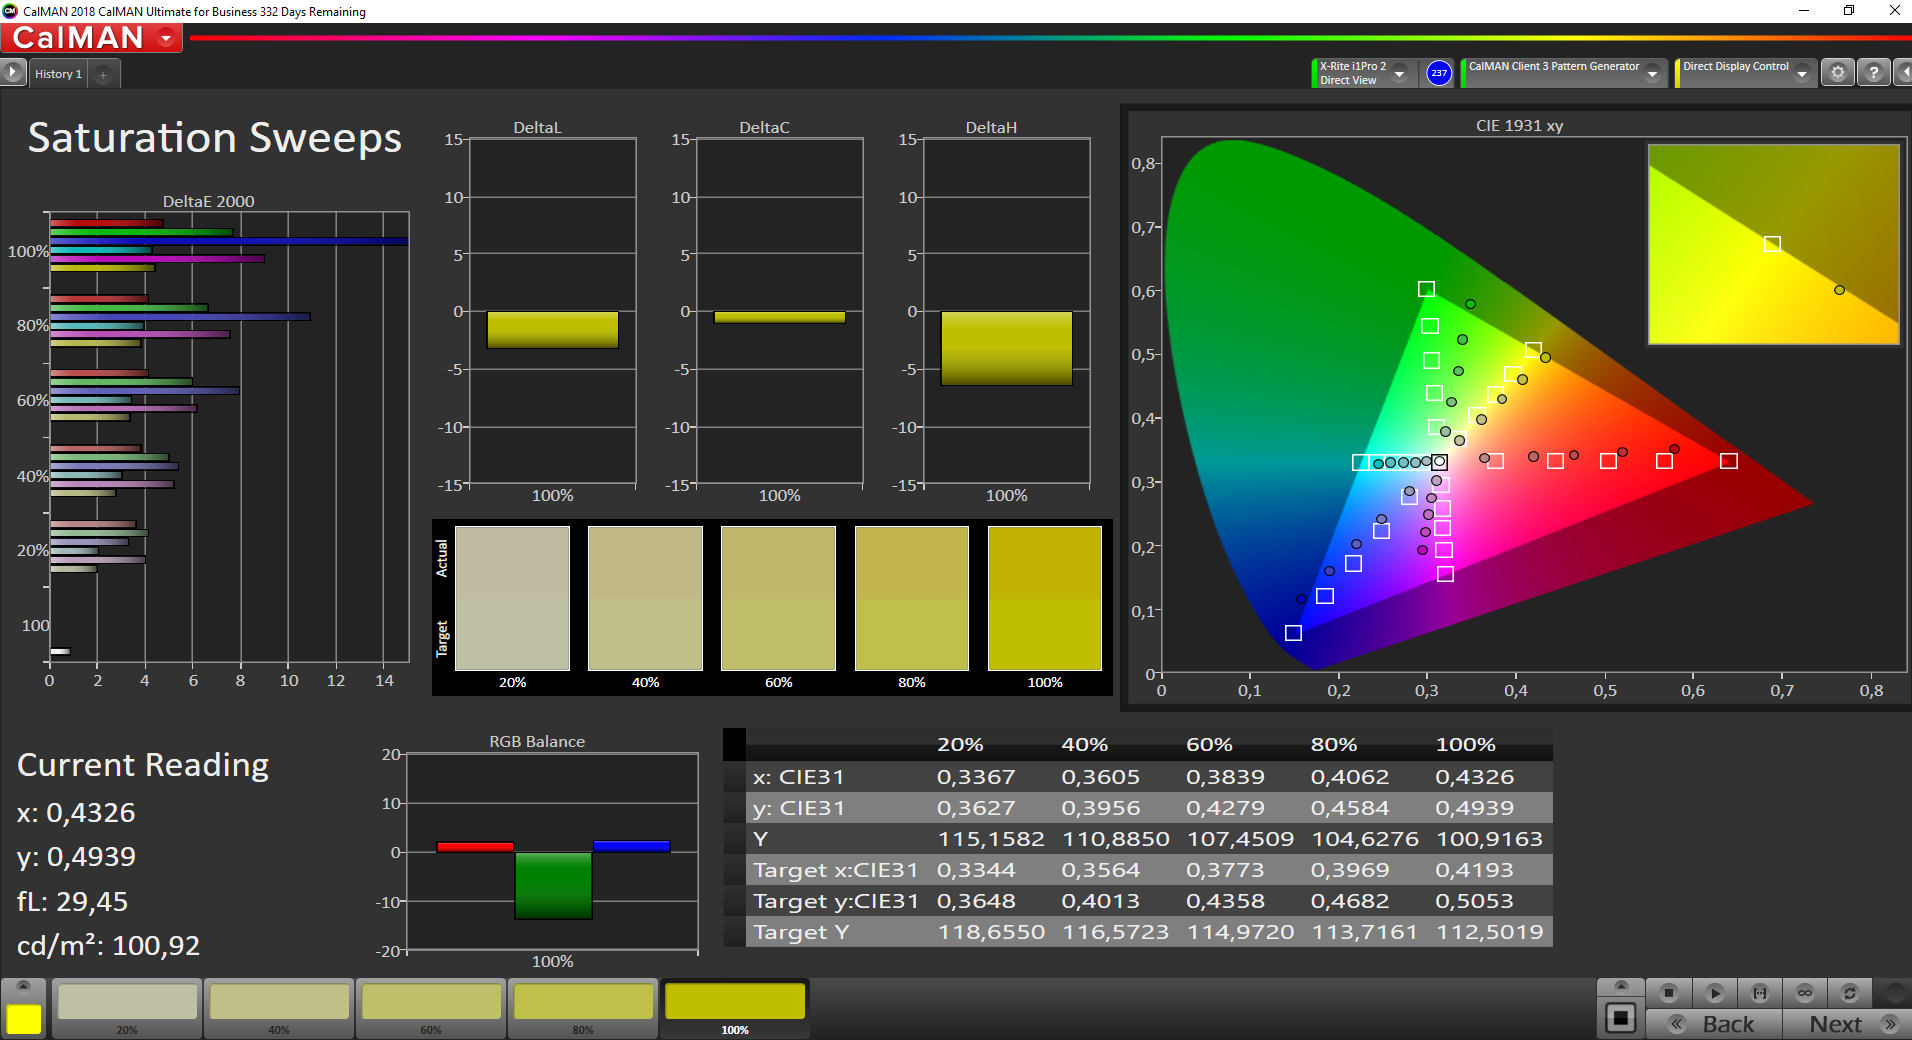
Our analysis also shows that the panel simply can't display colors accurately. Together with the low color-space coverage (only 63% of sRGB), the panel is, therefore, not suitable for editing images/videos. However, there are no limitations for normal office use.

Display Response Times
| ↔ Response Time Black to White | ||
|---|---|---|
| 31.2 ms ... rise ↗ and fall ↘ combined | ↗ 17.2 ms rise | 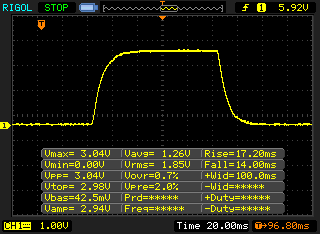 |
| ↘ 14 ms fall | ||
| The screen shows slow response rates in our tests and will be unsatisfactory for gamers. In comparison, all tested devices range from 0.1 (minimum) to 240 (maximum) ms. » 84 % of all devices are better. This means that the measured response time is worse than the average of all tested devices (19.9 ms). | ||
| ↔ Response Time 50% Grey to 80% Grey | ||
| 52.4 ms ... rise ↗ and fall ↘ combined | ↗ 26.4 ms rise | 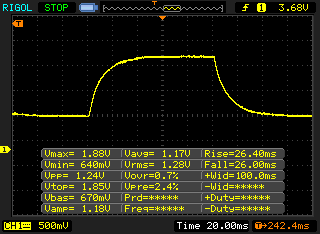 |
| ↘ 26 ms fall | ||
| The screen shows slow response rates in our tests and will be unsatisfactory for gamers. In comparison, all tested devices range from 0.165 (minimum) to 636 (maximum) ms. » 89 % of all devices are better. This means that the measured response time is worse than the average of all tested devices (31.1 ms). | ||
Screen Flickering / PWM (Pulse-Width Modulation)
| Screen flickering / PWM not detected | 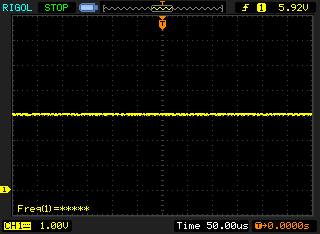 | ||
In comparison: 52 % of all tested devices do not use PWM to dim the display. If PWM was detected, an average of 7798 (minimum: 5 - maximum: 343500) Hz was measured. | |||
The viewing angles of the ThinkPad L13 are excellent thanks to the IPS panel. This makes the ultrabook usable from almost any position in practice.
Outdoors, the ThinkPad L13 is at most suitable for use in the shade, since the display brightness of approximately 250 cd/m² is too low for bright environments. The bright displays of some HP Pavilion 13 and HP ProBook 430 models are much more flexible here.

Performance - New Intel Iris Xe graphics
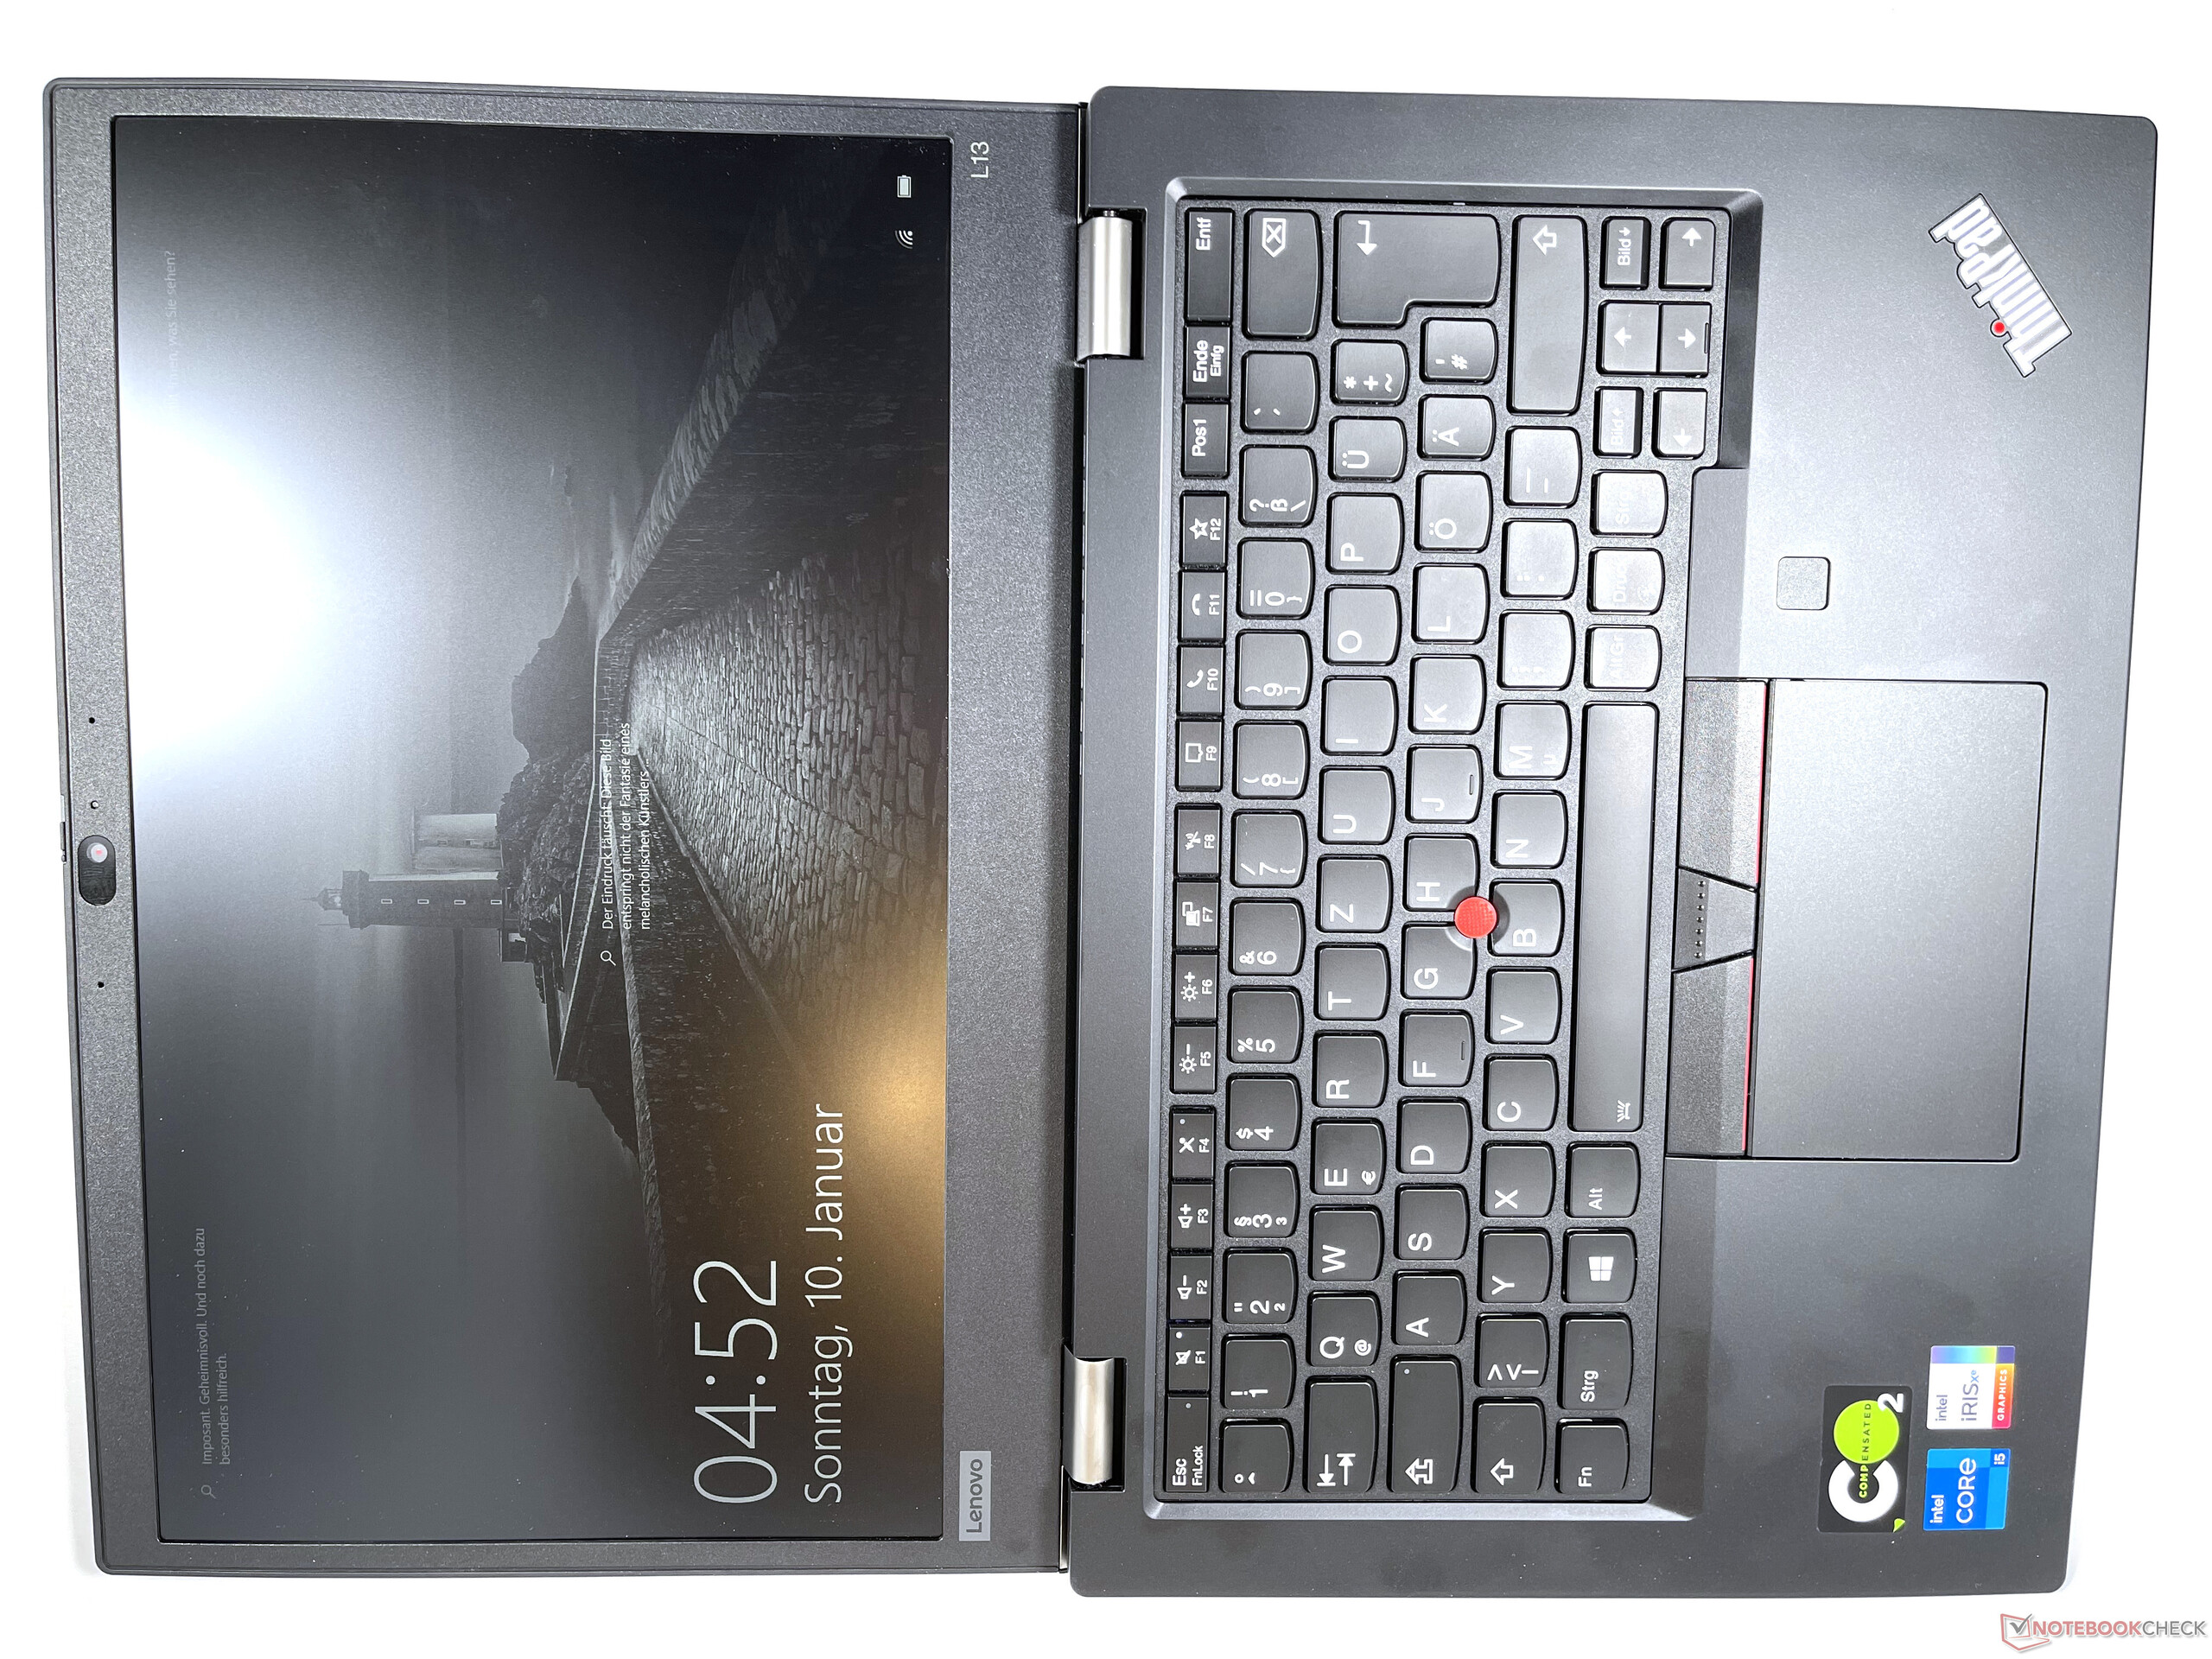
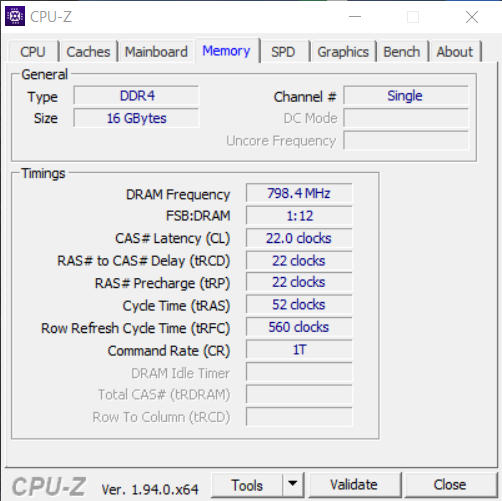
At the heart of the configuration of our ThinkPad L13 Gen 2 is an Intel Core i5-1135G7 that provides enough performance for everyday office tasks. Lenovo offers the more powerful Core i7-1165G7 and the dual-core Core i3-1115G4 processors as alternatives. Since memory is soldered, you should also consider well in advance whether you can manage with 8 GB or whether you need a model with 16 GB of RAM.
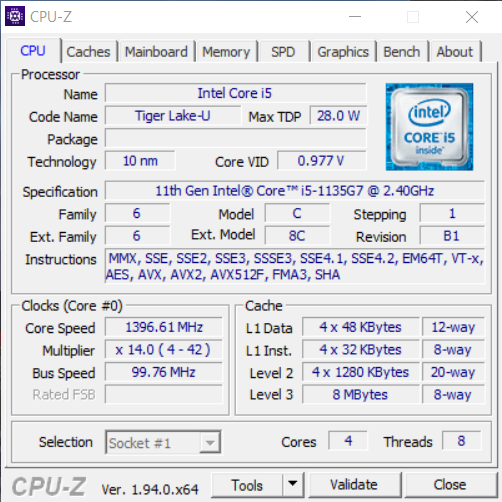
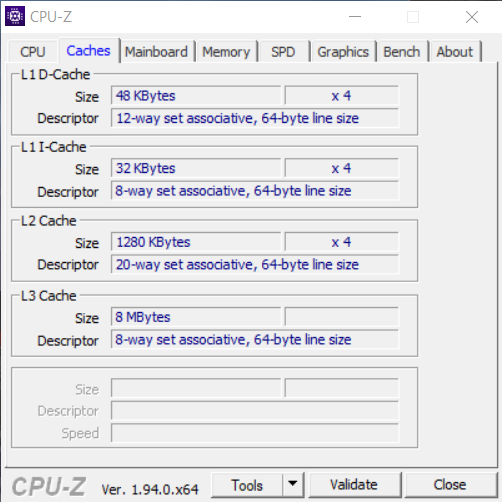
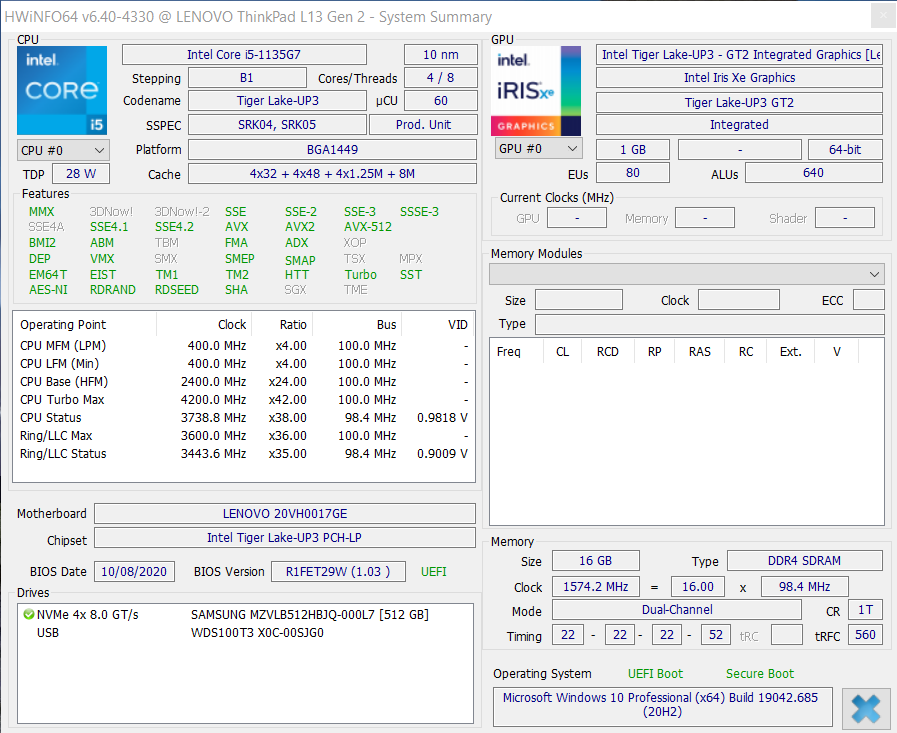
Processor
The Core i5-1135G7 is an 11th generation quad-core processor with a new Intel Iris Xe graphics chip. The four CPU cores clock at a frequency of up to 2.4 to 4.2 GHz, and each can process two tasks simultaneously thanks to Hyper-Threading.
In the Cinebench R15 multi-thread benchmark, the clock speed is briefly around 4.2 GHz (TDP 40 watts); then it quickly drops to around 3.3 GHz (30 watts) and settles at 2.2 GHz (15 watts) after a few minutes. As a result, the CPU performance is only slightly higher than in the ThinkPad L390 under prolonged load, which was equipped with the somewhat outdated Core i5-8265U. Furthermore, the performance level is also less consistent than with the other comparison devices.
The application benchmarks show that the processor lags behind an average Core i5-1135G7 in multi-thread benchmarks in particular. On battery power, the CPU performance is slightly limited (by 5-15%).
Cinebench R15: CPU Single 64Bit | CPU Multi 64Bit
Blender: v2.79 BMW27 CPU
7-Zip 18.03: 7z b 4 -mmt1 | 7z b 4
Geekbench 5.5: Single-Core | Multi-Core
HWBOT x265 Benchmark v2.2: 4k Preset
LibreOffice : 20 Documents To PDF
R Benchmark 2.5: Overall mean
| Cinebench R20 / CPU (Single Core) | |
| Average of class Office (345 - 816, n=72, last 2 years) | |
| HP Pavilion 13-bb0015cl | |
| Lenovo ThinkPad L13 Gen2-20VH0017GE | |
| Lenovo ThinkPad L13 Gen2-20VH0017GE | |
| Average Intel Core i5-1135G7 (375 - 527, n=62) | |
| HP ProBook 430 G7-8VU53EA | |
| HP ProBook 430 G7-8VU53EA | |
| Acer Swift 3 SF314-42-R27B | |
| Lenovo ThinkPad L13 Yoga 20R6S00800 | |
| Cinebench R20 / CPU (Multi Core) | |
| Average of class Office (648 - 8840, n=72, last 2 years) | |
| HP Pavilion 13-bb0015cl | |
| Average Intel Core i5-1135G7 (979 - 2382, n=62) | |
| Lenovo ThinkPad L13 Gen2-20VH0017GE | |
| Lenovo ThinkPad L13 Gen2-20VH0017GE | |
| Acer Swift 3 SF314-42-R27B | |
| HP ProBook 430 G7-8VU53EA | |
| HP ProBook 430 G7-8VU53EA | |
| Lenovo ThinkPad L13 Yoga 20R6S00800 | |
| Cinebench R15 / CPU Single 64Bit | |
| Average of class Office (99.5 - 312, n=74, last 2 years) | |
| HP Pavilion 13-bb0015cl | |
| Lenovo ThinkPad L13 Gen2-20VH0017GE | |
| Lenovo ThinkPad L13 Gen2-20VH0017GE | |
| Average Intel Core i5-1135G7 (141.4 - 205, n=61) | |
| HP ProBook 430 G7-8VU53EA | |
| Acer Swift 3 SF314-42-R27B | |
| Lenovo ThinkPad L13 Yoga 20R6S00800 | |
| Lenovo ThinkPad L390-20NR0013GE | |
| Cinebench R15 / CPU Multi 64Bit | |
| Average of class Office (250 - 3380, n=74, last 2 years) | |
| Average Intel Core i5-1135G7 (431 - 941, n=65) | |
| HP Pavilion 13-bb0015cl | |
| Lenovo ThinkPad L13 Gen2-20VH0017GE | |
| Lenovo ThinkPad L13 Gen2-20VH0017GE | |
| Lenovo ThinkPad L390-20NR0013GE | |
| HP ProBook 430 G7-8VU53EA | |
| Acer Swift 3 SF314-42-R27B | |
| Lenovo ThinkPad L13 Yoga 20R6S00800 | |
| Blender / v2.79 BMW27 CPU | |
| Acer Swift 3 SF314-42-R27B | |
| HP ProBook 430 G7-8VU53EA | |
| HP ProBook 430 G7-8VU53EA | |
| Lenovo ThinkPad L13 Gen2-20VH0017GE | |
| Lenovo ThinkPad L13 Gen2-20VH0017GE | |
| Lenovo ThinkPad L13 Yoga 20R6S00800 | |
| Average Intel Core i5-1135G7 (499 - 1044, n=60) | |
| HP Pavilion 13-bb0015cl | |
| Average of class Office (158 - 1940, n=73, last 2 years) | |
| 7-Zip 18.03 / 7z b 4 -mmt1 | |
| HP Pavilion 13-bb0015cl | |
| Average of class Office (3387 - 6469, n=74, last 2 years) | |
| Lenovo ThinkPad L13 Gen2-20VH0017GE | |
| Lenovo ThinkPad L13 Gen2-20VH0017GE | |
| HP ProBook 430 G7-8VU53EA | |
| HP ProBook 430 G7-8VU53EA | |
| Average Intel Core i5-1135G7 (3924 - 4921, n=62) | |
| Lenovo ThinkPad L13 Yoga 20R6S00800 | |
| Acer Swift 3 SF314-42-R27B | |
| 7-Zip 18.03 / 7z b 4 | |
| Average of class Office (7098 - 76886, n=75, last 2 years) | |
| HP Pavilion 13-bb0015cl | |
| Average Intel Core i5-1135G7 (14745 - 24873, n=62) | |
| Lenovo ThinkPad L13 Yoga 20R6S00800 | |
| Lenovo ThinkPad L13 Gen2-20VH0017GE | |
| Lenovo ThinkPad L13 Gen2-20VH0017GE | |
| HP ProBook 430 G7-8VU53EA | |
| HP ProBook 430 G7-8VU53EA | |
| Acer Swift 3 SF314-42-R27B | |
| Geekbench 5.5 / Single-Core | |
| Average of class Office (811 - 2128, n=71, last 2 years) | |
| HP Pavilion 13-bb0015cl | |
| Average Intel Core i5-1135G7 (1147 - 1428, n=58) | |
| Lenovo ThinkPad L13 Gen2-20VH0017GE | |
| Lenovo ThinkPad L13 Gen2-20VH0017GE | |
| HP ProBook 430 G7-8VU53EA | |
| HP ProBook 430 G7-8VU53EA | |
| HP ProBook 430 G7-8VU53EA | |
| Lenovo ThinkPad L13 Yoga 20R6S00800 | |
| Acer Swift 3 SF314-42-R27B | |
| Geekbench 5.5 / Multi-Core | |
| Average of class Office (1483 - 16999, n=71, last 2 years) | |
| HP Pavilion 13-bb0015cl | |
| Average Intel Core i5-1135G7 (3475 - 5472, n=58) | |
| Lenovo ThinkPad L13 Gen2-20VH0017GE | |
| Lenovo ThinkPad L13 Gen2-20VH0017GE | |
| Lenovo ThinkPad L13 Yoga 20R6S00800 | |
| Acer Swift 3 SF314-42-R27B | |
| HP ProBook 430 G7-8VU53EA | |
| HP ProBook 430 G7-8VU53EA | |
| HP ProBook 430 G7-8VU53EA | |
| HWBOT x265 Benchmark v2.2 / 4k Preset | |
| Average of class Office (2.21 - 26, n=73, last 2 years) | |
| HP Pavilion 13-bb0015cl | |
| Average Intel Core i5-1135G7 (3.57 - 7.6, n=57) | |
| Lenovo ThinkPad L13 Gen2-20VH0017GE | |
| Lenovo ThinkPad L13 Gen2-20VH0017GE | |
| HP ProBook 430 G7-8VU53EA | |
| HP ProBook 430 G7-8VU53EA | |
| Lenovo ThinkPad L13 Yoga 20R6S00800 | |
| Acer Swift 3 SF314-42-R27B | |
| LibreOffice / 20 Documents To PDF | |
| HP ProBook 430 G7-8VU53EA | |
| HP ProBook 430 G7-8VU53EA | |
| Acer Swift 3 SF314-42-R27B | |
| Average of class Office (41.5 - 102.3, n=73, last 2 years) | |
| Average Intel Core i5-1135G7 (44.2 - 62.9, n=60) | |
| Lenovo ThinkPad L13 Gen2-20VH0017GE | |
| Lenovo ThinkPad L13 Gen2-20VH0017GE | |
| HP Pavilion 13-bb0015cl | |
| R Benchmark 2.5 / Overall mean | |
| Lenovo ThinkPad L13 Yoga 20R6S00800 | |
| Acer Swift 3 SF314-42-R27B | |
| HP ProBook 430 G7-8VU53EA | |
| HP ProBook 430 G7-8VU53EA | |
| Average Intel Core i5-1135G7 (0.619 - 0.727, n=59) | |
| Lenovo ThinkPad L13 Gen2-20VH0017GE | |
| Lenovo ThinkPad L13 Gen2-20VH0017GE | |
| HP Pavilion 13-bb0015cl | |
| Average of class Office (0.4098 - 0.888, n=73, last 2 years) | |
* ... smaller is better
System performance
In contrast to the CPU performance, the overall system performance is at the expected level compared with other laptops that are equipped with the same CPU. In practice, all comparison devices are fast and able to implement input almost without delays, and we didn't notice any problems during testing.
| PCMark 10 Score | 4601 points | |
Help | ||
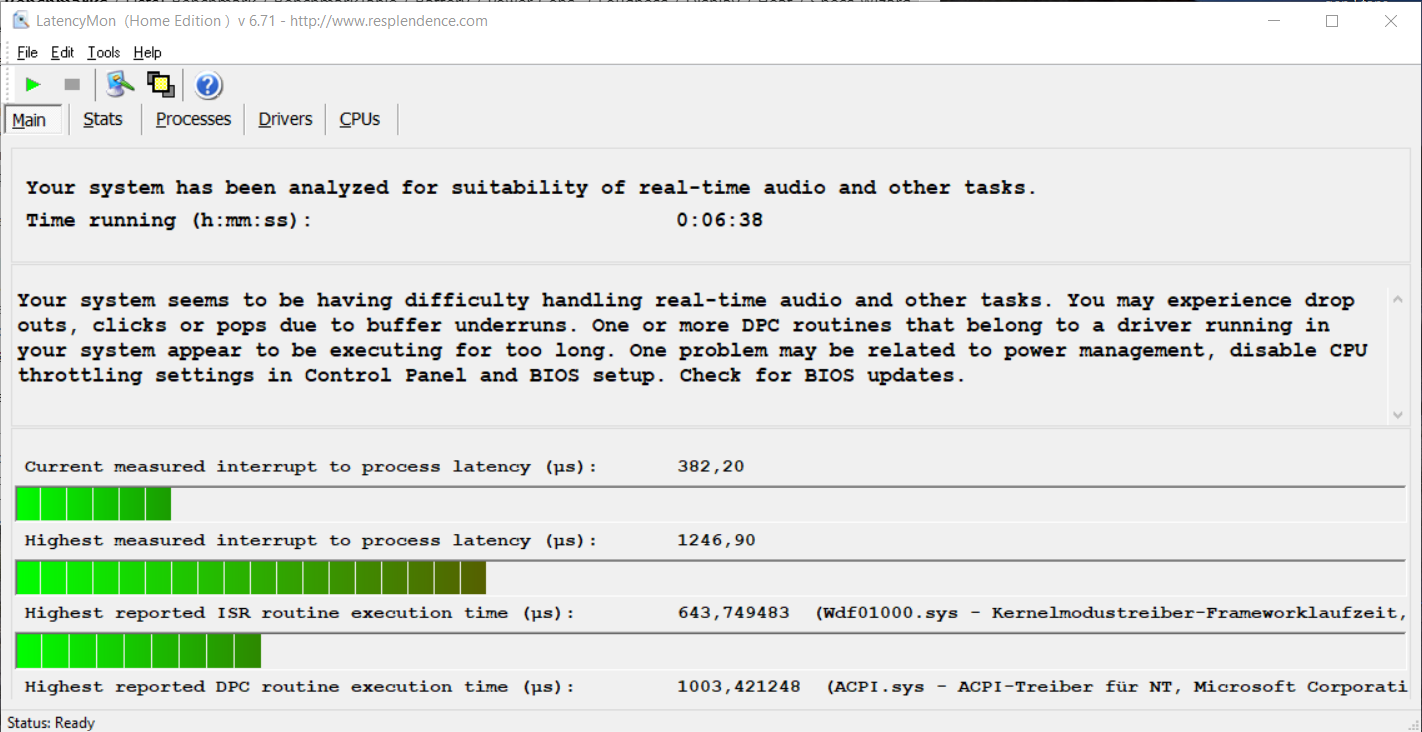
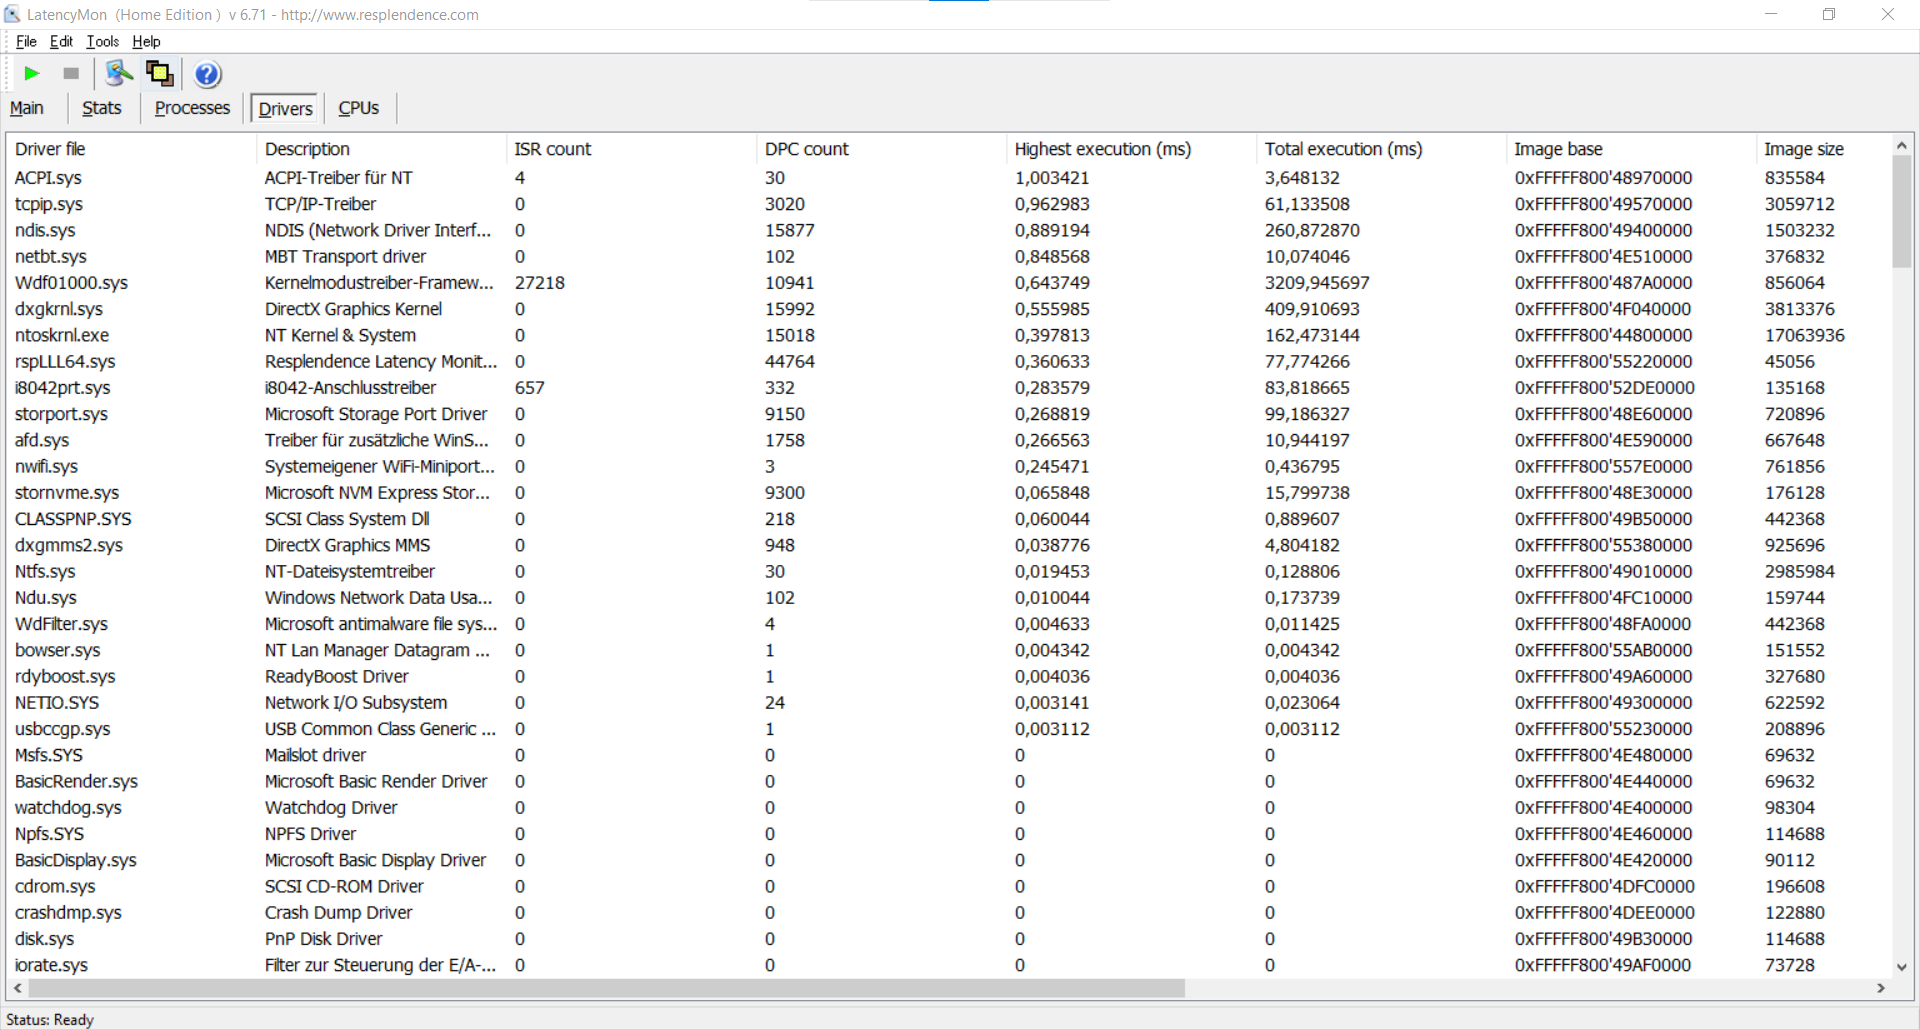
DPC latencies
In our standardized test, LatencyMon reports that the laptop is not entirely suitable for editing music and video files in real time in the configuration that we tested.
| DPC Latencies / LatencyMon - interrupt to process latency (max), Web, Youtube, Prime95 | |
| HP ProBook 430 G7-8VU53EA | |
| HP Pavilion 13-bb0015cl | |
| Lenovo ThinkPad L13 Gen2-20VH0017GE | |
| Acer Swift 3 SF314-42-R27B | |
* ... smaller is better
Storage
A 512 GB Samsung PM981a serves as the system drive in our ThinkPad L13, and it achieves excellent rates in the benchmarks. Only the Toshiba XG6 in the Lenovo ThinkPad L13 Yoga is still slightly faster overall, although the advantage is hardly relevant in practice, since programs are also started almost immediately in our test device, and the laptop is ready to use quickly after powering it on.
Further information and benchmark comparisons can be found in our HDD/SSD table.
| Lenovo ThinkPad L13 Gen2-20VH0017GE Samsung SSD PM981a MZVLB512HBJQ | HP Pavilion 13-bb0015cl Samsung PM991 MZVLQ512HALU | Acer Swift 3 SF314-42-R27B SK hynix BC511 HFM256GDJTNI-82A0 | HP ProBook 430 G7-8VU53EA Toshiba KBG30ZMV256G | Lenovo ThinkPad L13 Yoga 20R6S00800 Toshiba XG6 KXG6AZNV512G | Lenovo ThinkPad L390-20NR0013GE Samsung SSD PM981 MZVLB256HAHQ | Average Samsung SSD PM981a MZVLB512HBJQ | |
|---|---|---|---|---|---|---|---|
| CrystalDiskMark 5.2 / 6 | -20% | -17% | -13% | 59% | 2% | 28% | |
| Write 4K (MB/s) | 131.2 | 96.5 -26% | 96.3 -27% | 124.7 -5% | 172.3 31% | 99.6 -24% | 140.8 ? 7% |
| Read 4K (MB/s) | 35.92 | 36.81 2% | 35.06 -2% | 48.17 34% | 44.37 24% | 37.22 4% | 48.6 ? 35% |
| Write Seq (MB/s) | 1168 | 1001 | 694 | 1492 | 1432 | 2106 ? | |
| Read Seq (MB/s) | 1476 | 1072 | 757 | 1471 | 2072 | 2099 ? | |
| Write 4K Q32T1 (MB/s) | 417.7 | 389.5 -7% | 423.9 1% | 311 -26% | 483.1 16% | 439.7 5% | 451 ? 8% |
| Read 4K Q32T1 (MB/s) | 352 | 347.8 -1% | 464.7 32% | 495.5 41% | 551 57% | 264.8 -25% | 482 ? 37% |
| Write Seq Q32T1 (MB/s) | 2926 | 1398 -52% | 967 -67% | 1017 -65% | 2951 1% | 1549 -47% | 2903 ? -1% |
| Read Seq Q32T1 (MB/s) | 3533 | 2364 -33% | 2179 -38% | 1530 -57% | 3289 -7% | 3318 -6% | 3511 ? -1% |
| Write 4K Q8T8 (MB/s) | 383.7 | 1498 290% | 828 116% | 914 ? 138% | |||
| Read 4K Q8T8 (MB/s) | 981 | 1531 56% | 897 -9% | 1017 ? 4% | |||
| AS SSD | -28% | -42% | -114% | 11% | -14% | 2% | |
| Seq Read (MB/s) | 2651 2648 | 1632 -38% | 1682 -37% | 1342 -49% | 2719 3% | 1779 -33% | 2412 ? -9% |
| Seq Write (MB/s) | 1417 1417 | 896 -37% | 931 -34% | 768 -46% | 2441 72% | 1185 -16% | 1983 ? 40% |
| 4K Read (MB/s) | 54.3 44.39 | 44.66 -18% | 41.53 -24% | 48.56 -11% | 51.5 -5% | 53.8 -1% | 53.1 ? -2% |
| 4K Write (MB/s) | 178.9 111.4 | 128.4 -28% | 109.1 -39% | 127.7 -29% | 142.8 -20% | 137.5 -23% | 131.1 ? -27% |
| 4K-64 Read (MB/s) | 1009 615 | 862 -15% | 603 -40% | 644 -36% | 1426 41% | 786 -22% | 1201 ? 19% |
| 4K-64 Write (MB/s) | 1651 1536 | 778 -53% | 713 -57% | 317.3 -81% | 1287 -22% | 1296 -22% | 1726 ? 5% |
| Access Time Read * (ms) | 0.063 0.059 | 0.064 -2% | 0.417 -562% | 0.041 35% | 0.048 24% | 0.05525 ? 12% | |
| Access Time Write * (ms) | 0.034 0.02 | 0.081 -138% | 0.035 -3% | 0.174 -412% | 0.029 15% | 0.027 21% | 0.05394 ? -59% |
| Score Read (Points) | 1328 925 | 1070 -19% | 813 -39% | 827 -38% | 1749 32% | 1018 -23% | 1495 ? 13% |
| Score Write (Points) | 1904 1857 | 996 -48% | 915 -52% | 522 -73% | 1674 -12% | 1552 -18% | 2055 ? 8% |
| Score Total (Points) | 3815 3252 | 2586 -32% | 2118 -44% | 1757 -54% | 4310 13% | 3076 -19% | 4303 ? 13% |
| Copy ISO MB/s (MB/s) | 2188 | 1283 -41% | 692 -68% | 839 -62% | 2028 -7% | 1495 -32% | 1894 ? -13% |
| Copy Program MB/s (MB/s) | 547 | 806 47% | 226.5 -59% | 106.9 -80% | 499.1 -9% | 389.7 -29% | 539 ? -1% |
| Copy Game MB/s (MB/s) | 900 | 1182 31% | 391.5 -56% | 314.4 -65% | 1022 14% | 893 -1% | 1193 ? 33% |
| Total Average (Program / Settings) | -24% /
-25% | -30% /
-34% | -64% /
-84% | 35% /
28% | -6% /
-8% | 15% /
12% |
* ... smaller is better

Continuous load read: DiskSpd Read Loop, Queue Depth 8
Graphics card
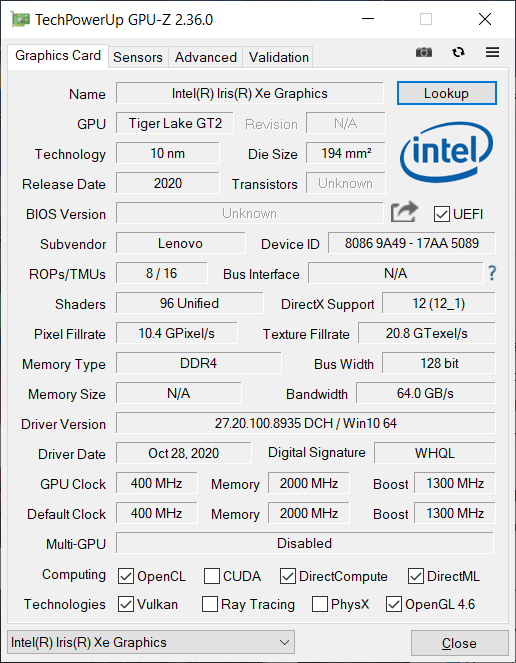
Thanks to the integrated Intel Iris Xe G7 graphics chip (80 EUs), current Intel processors can now once again keep up with the graphics performance of their AMD rivals. Compared with competitors with an Intel CPU from the previous generation, the graphics performance of our ThinkPad L13 is a good 50% higher in most tests.
Looking at the results, we also see that other devices with the Iris Xe G7 (80 EUs) are faster. The RAM configuration is responsible for this, because the iGPU can't use its full potential with the DDR4-3200 RAM installed here. Devices with the LPDDR4x type (like the Lenovo Yoga 9i) have an advantage here. On battery power, the GPU performance is slightly limited (~15%).
| 3DMark 11 Performance | 4669 points | |
| 3DMark Cloud Gate Standard Score | 14952 points | |
| 3DMark Fire Strike Score | 2780 points | |
| 3DMark Time Spy Score | 1081 points | |
Help | ||
Gaming performance
As a productivity-oriented ultrabook, the ThinkPad L13 is hardly suitable for gaming. However, with the current integrated GPU, at least some older titles are playable on low settings.
| low | med. | high | ultra | |
|---|---|---|---|---|
| The Witcher 3 (2015) | 47 | 29.8 | 15.3 | |
| Dota 2 Reborn (2015) | 71.9 | 41.4 | 30.1 | 29 |
| X-Plane 11.11 (2018) | 38.4 | 25.9 | 23.4 | |
| Far Cry 5 (2018) | 28 |
Emissions - The ThinkPad L13 Gen 2 remains cool and quiet
Noise emissions
In idle usage, the single fan is silent, and it behaves sluggishly overall. This is appropriate for the typical usage scenario of an ultrabook and ensures that the ThinkPad L13 always remains pleasantly quiet during operation. We couldn't detect any other electronic noises such as coil whine.
Noise level
| Idle |
| 29.3 / 29.3 / 29.3 dB(A) |
| Load |
| 34.3 / 36.3 dB(A) |
 | ||
30 dB silent 40 dB(A) audible 50 dB(A) loud |
||
min: | ||
Temperature
Under full load, the warmest spot on the underside reaches a maximum of 58 °C (~136 °F). This means that the cooling is at its limit despite the low TDP configuration. During normal use, however, the operating temperatures are significantly lower, and all surfaces that you come into contact with remain pleasantly cool.
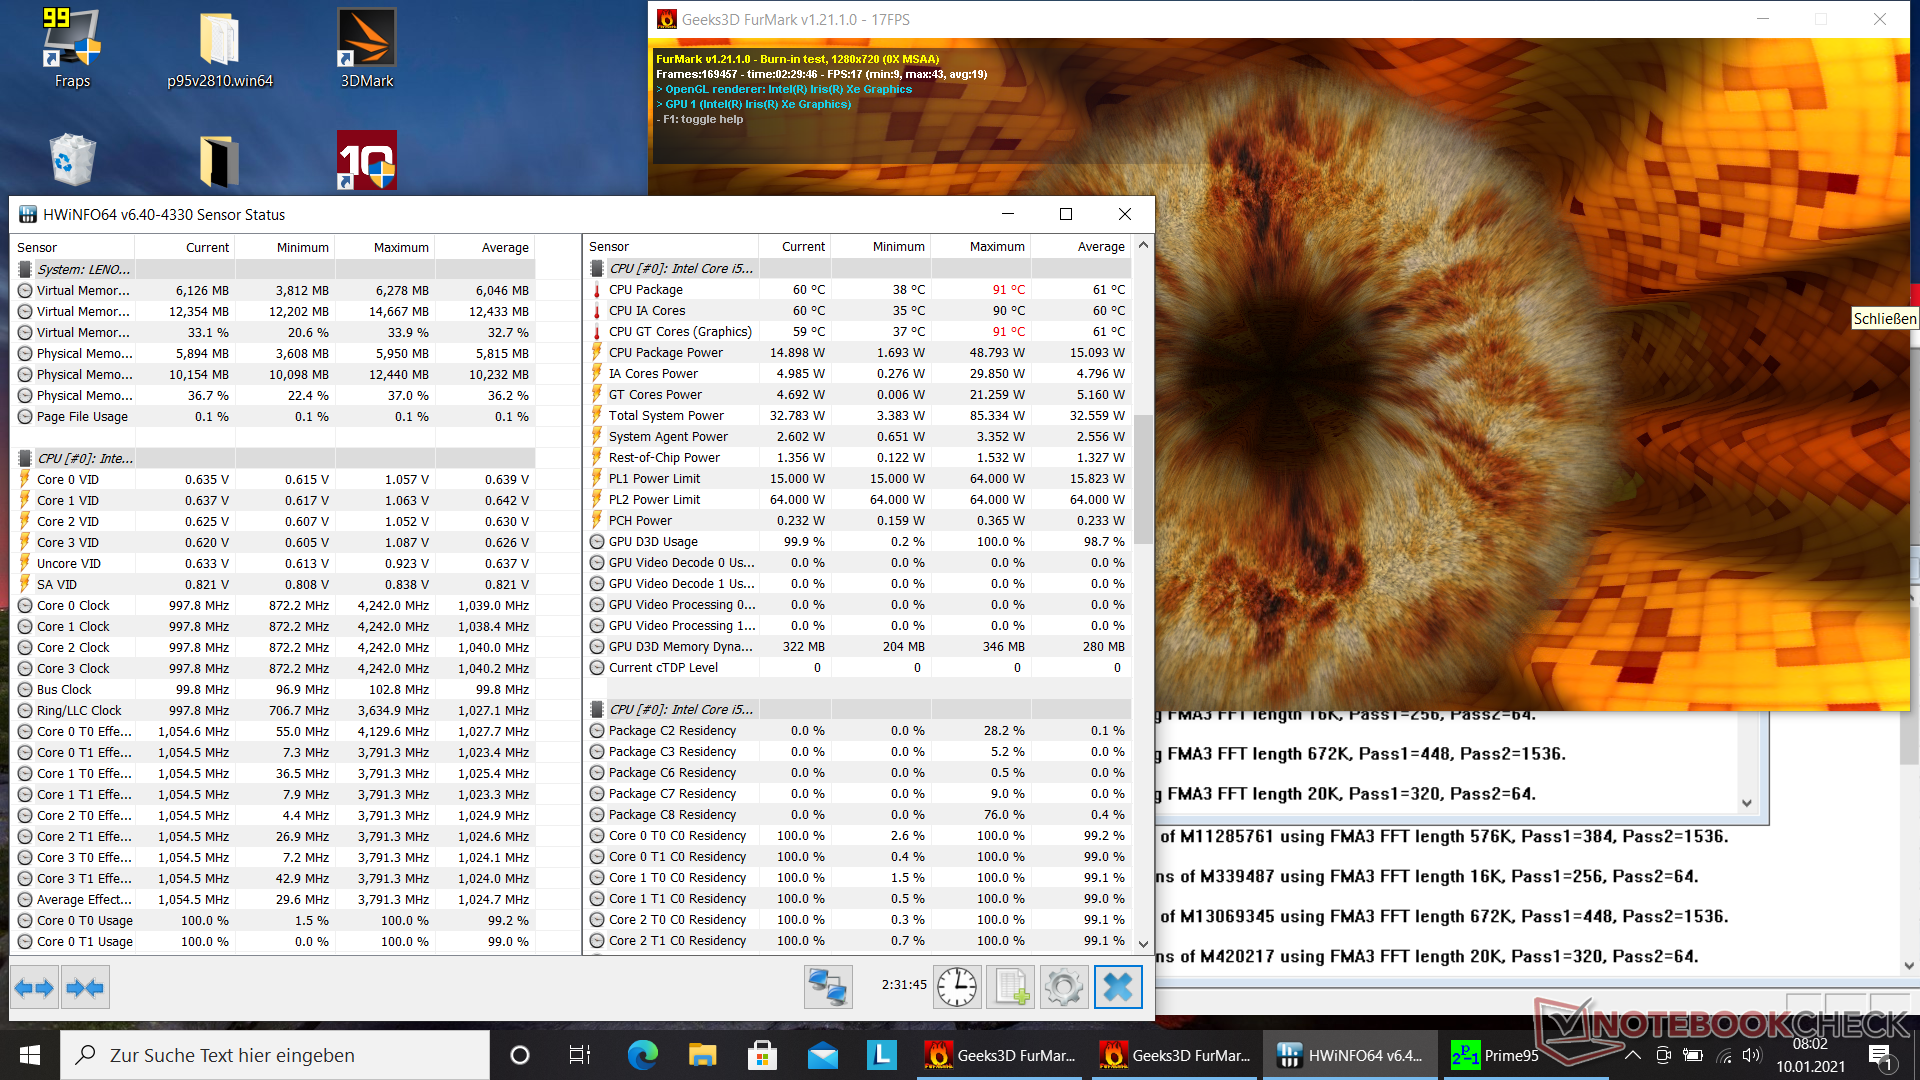
At the beginning of the stress test, the CPU and GPU clock rates are 4.2 GHz and up to 1,300 MHz, respectively. The CPU briefly reaches a temperature of 91 °C (~196 °F) here, and then the clock rates drop to around 900 MHz to 1.1 GHz and 600 MHz, respectively. Although the CPU falls below its base clock speed of 2.4 GHz in the stress test, you don't have to expect restrictions in everyday use, as long as you don't use the laptop at 100% capacity for a prolonged period of time.
(±) The maximum temperature on the upper side is 43.3 °C / 110 F, compared to the average of 34.3 °C / 94 F, ranging from 21.2 to 62.5 °C for the class Office.
(-) The bottom heats up to a maximum of 58 °C / 136 F, compared to the average of 36.8 °C / 98 F
(+) In idle usage, the average temperature for the upper side is 23.8 °C / 75 F, compared to the device average of 29.5 °C / 85 F.
(+) The palmrests and touchpad are cooler than skin temperature with a maximum of 26.8 °C / 80.2 F and are therefore cool to the touch.
(±) The average temperature of the palmrest area of similar devices was 27.5 °C / 81.5 F (+0.7 °C / 1.3 F).
Lenovo ThinkPad L13 Gen2-20VH0017GE audio analysis
(±) | speaker loudness is average but good (77.6 dB)
Bass 100 - 315 Hz
(-) | nearly no bass - on average 19.5% lower than median
(-) | bass is not linear (15% delta to prev. frequency)
Mids 400 - 2000 Hz
(+) | balanced mids - only 4.6% away from median
(+) | mids are linear (3.4% delta to prev. frequency)
Highs 2 - 16 kHz
(±) | reduced highs - on average 6.7% lower than median
(±) | linearity of highs is average (10.7% delta to prev. frequency)
Overall 100 - 16.000 Hz
(±) | linearity of overall sound is average (25.6% difference to median)
Compared to same class
» 78% of all tested devices in this class were better, 6% similar, 16% worse
» The best had a delta of 7%, average was 21%, worst was 53%
Compared to all devices tested
» 78% of all tested devices were better, 4% similar, 17% worse
» The best had a delta of 4%, average was 24%, worst was 134%
HP Pavilion 13-bb0015cl audio analysis
(+) | speakers can play relatively loud (82.6 dB)
Bass 100 - 315 Hz
(-) | nearly no bass - on average 17.1% lower than median
(±) | linearity of bass is average (12% delta to prev. frequency)
Mids 400 - 2000 Hz
(+) | balanced mids - only 1% away from median
(+) | mids are linear (1.5% delta to prev. frequency)
Highs 2 - 16 kHz
(+) | balanced highs - only 2.6% away from median
(+) | highs are linear (6.1% delta to prev. frequency)
Overall 100 - 16.000 Hz
(+) | overall sound is linear (12% difference to median)
Compared to same class
» 14% of all tested devices in this class were better, 4% similar, 82% worse
» The best had a delta of 5%, average was 18%, worst was 53%
Compared to all devices tested
» 9% of all tested devices were better, 2% similar, 88% worse
» The best had a delta of 4%, average was 24%, worst was 134%
Energy management - Mediocre battery life
Energy consumption
Depending on the keyboard illumination, between 8 and 9.8 watts are consumed in idle usage. In the stress test, consumption fluctuates strongly in the range of 26 to 63 watts after briefly reaching a consumption peak of 66.6 watts. Consequently, the included 65-watt power adapter has sufficient capacity.
| Off / Standby | |
| Idle | |
| Load |
|
Key:
min: | |
| Lenovo ThinkPad L13 Gen2-20VH0017GE i5-1135G7, Iris Xe G7 80EUs, Samsung SSD PM981a MZVLB512HBJQ, IPS, 1920x1080, 13.3" | HP Pavilion 13-bb0015cl i7-1165G7, Iris Xe G7 96EUs, Samsung PM991 MZVLQ512HALU, IPS, 3840x2160, 13.3" | Acer Swift 3 SF314-42-R27B R3 4300U, Vega 5, SK hynix BC511 HFM256GDJTNI-82A0, IPS, 1920x1080, 14" | HP ProBook 430 G7-8VU53EA i7-10510U, UHD Graphics 620, Toshiba KBG30ZMV256G, IPS LED, 1920x1080, 13.3" | Lenovo ThinkPad L13 Yoga 20R6S00800 i5-10210U, UHD Graphics 620, Toshiba XG6 KXG6AZNV512G, IPS, 1920x1080, 13.3" | Lenovo ThinkPad L390-20NR0013GE i5-8265U, UHD Graphics 620, Samsung SSD PM981 MZVLB256HAHQ, IPS LED, 1920x1080, 13.3" | Average Intel Iris Xe Graphics G7 80EUs | Average of class Office | |
|---|---|---|---|---|---|---|---|---|
| Power Consumption | -16% | 26% | 17% | -4% | 8% | -1% | -4% | |
| Idle Minimum * (Watt) | 4.4 | 4.6 -5% | 3.7 16% | 3.3 25% | 3.7 16% | 3.8 14% | 4.49 ? -2% | 4.4 ? -0% |
| Idle Average * (Watt) | 7.2 | 10.6 -47% | 5.6 22% | 6.1 15% | 6.2 14% | 6.8 6% | 7.4 ? -3% | 7.32 ? -2% |
| Idle Maximum * (Watt) | 9.8 | 11.4 -16% | 7.8 20% | 8.6 12% | 11.2 -14% | 9.8 -0% | 9.26 ? 6% | 8.56 ? 13% |
| Load Average * (Watt) | 31.7 | 43.2 -36% | 26.4 17% | 32.4 -2% | 44.3 -40% | 32.4 -2% | 36.6 ? -15% | 42.5 ? -34% |
| Witcher 3 ultra * (Watt) | 33.3 | 39.9 -20% | ||||||
| Load Maximum * (Watt) | 66.6 | 46 31% | 31.4 53% | 42.7 36% | 65 2% | 52 22% | 61.7 ? 7% | 64.1 ? 4% |
* ... smaller is better
Battery life
In our standardized WLAN test, the ThinkPad L13 achieves a runtime of 6:04 h at 150 cd/m² and 5:49 h at maximum brightness. It lasts 7:33 h in the video test with the short film Big Buck Bunny. As the table shows, most rivals offer slightly higher battery life. The exception here is the HP Pavilion 13, which is probably due to its 4K panel. Under full load, the L13 shuts down after 1:29 h.
| Lenovo ThinkPad L13 Gen2-20VH0017GE i5-1135G7, Iris Xe G7 80EUs, 46 Wh | HP Pavilion 13-bb0015cl i7-1165G7, Iris Xe G7 96EUs, 43 Wh | Acer Swift 3 SF314-42-R27B R3 4300U, Vega 5, 48.85 Wh | HP ProBook 430 G7-8VU53EA i7-10510U, UHD Graphics 620, 45 Wh | Lenovo ThinkPad L13 Yoga 20R6S00800 i5-10210U, UHD Graphics 620, 46 Wh | Lenovo ThinkPad L390-20NR0013GE i5-8265U, UHD Graphics 620, 45 Wh | Average of class Office | |
|---|---|---|---|---|---|---|---|
| Battery runtime | -20% | 98% | 49% | 18% | 11% | 76% | |
| H.264 (h) | 7.6 | 9.8 29% | 6.6 -13% | 9.4 24% | 15 ? 97% | ||
| WiFi v1.3 (h) | 6.1 | 4.5 -26% | 12.1 98% | 7.9 30% | 7.7 26% | 7 15% | 12.9 ? 111% |
| Load (h) | 1.5 | 1.3 -13% | 2.8 87% | 2.1 40% | 1.4 -7% | 1.807 ? 20% | |
| Reader / Idle (h) | 10.8 | 15.2 | 16.2 | 23.7 ? |
Pros
Cons
Verdict - Modern hardware meets good laptop keyboard

The Lenovo ThinkPad L13 G2 is a well-built ultrabook that primarily stands out from its predecessors with a slightly higher graphics performance. The input devices are at the high level of the ThinkPad series, just like in the larger models. The keyboard in particular is excellent by laptop standards. The presence of modern connectivity standards like WLAN 6 and USB 4/Thunderbolt 4 is also nice.
On the technical aspect, we can only really criticize the use of soldered RAM and the mediocre battery life. In addition, the matte black case is extremely susceptible to fingerprints, and the low display brightness is still a weak point.
The current ThinkPad L13 G2 has great input devices, modern ports, and much higher graphics performance than its predecessors.
For those looking for a reliable ultrabook for typing and browsing, and who can also take advantage of the new ports, the L13 Gen 2 is a very good choice.
Price and availability
Different configuration variants of the Lenovo ThinkPad L13 Gen 2 are available at a starting price of around $700 in Lenovo's online store.
Lenovo ThinkPad L13 Gen2-20VH0017GE
- 02/07/2022 v7 (old)
Marius Schell
Price comparison

