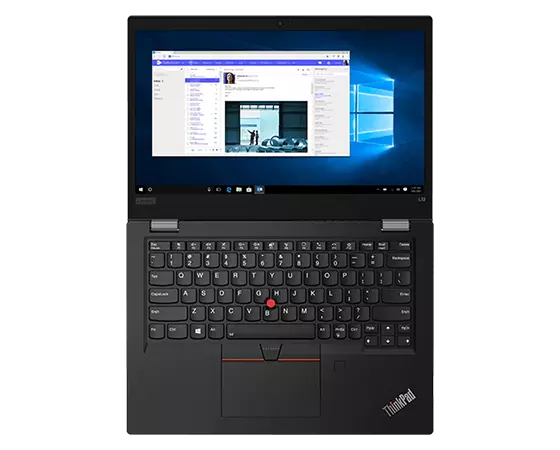
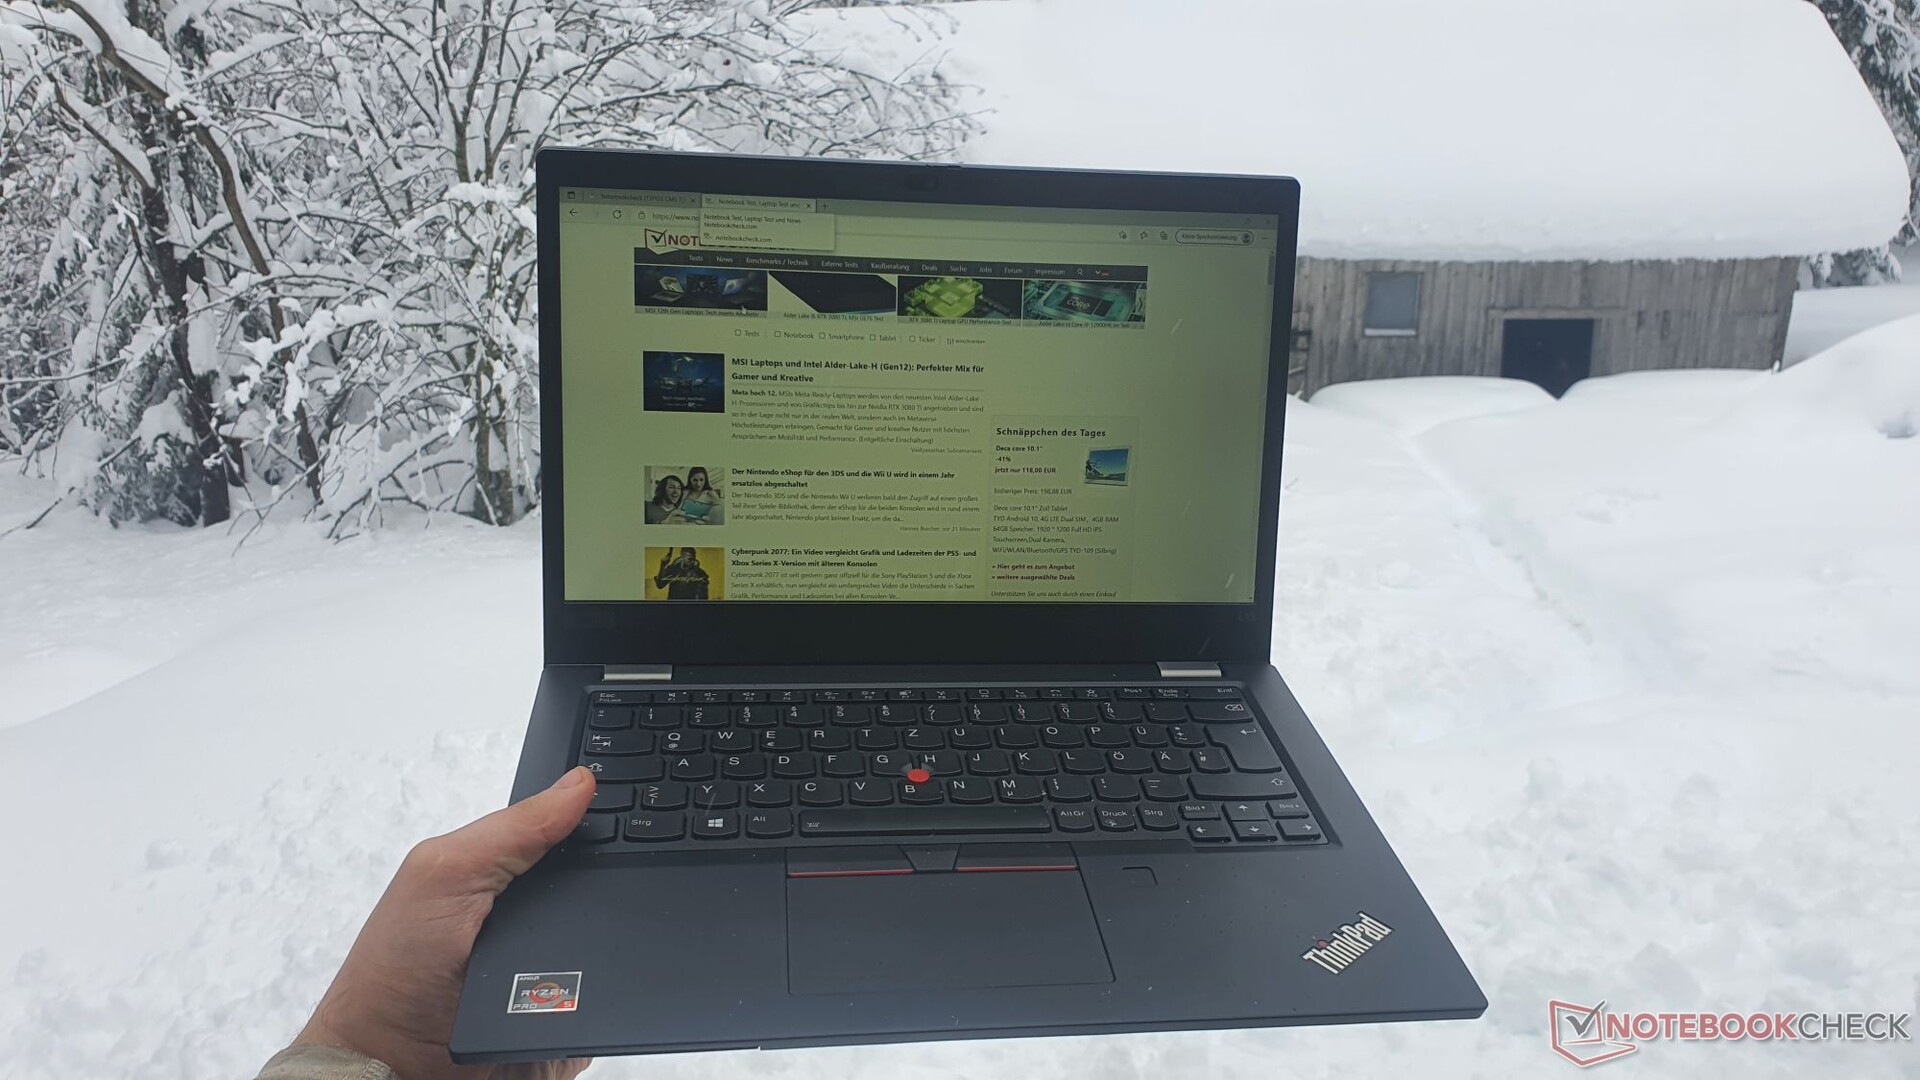
Lenovo ThinkPad L13 Gen2 AMD laptop in review - Fast, enduring Ryzen ultrabook
The Lenovo ThinkPad L13 Gen 2 AMD is a compact 13-inch ultrabook. The ThinkPad lineup focuses on very good input devices and a robust, durable build. It is the successor of the ThinkPad L13 Gen1, which has been upgraded compared to the ThinkPad L390 with a slightly slimmer and lighter design and is now also powered by AMD processors including Vega graphics for the first time in this series.
Private customers are more likely to purchase the E-series as another budget variant, while the L-series, however, is even more oriented towards the T-series and has, for example, a replaceable (maintainable) keyboard. Besides companies, authorities and schools, the L-series, especially the compact 13-inch class, is also interesting for students. Our test device with the model number 21AB000PGE is available for 999 Euros (~$1106) ; the campus version for the education sector costs 949 Euros (~$1051). Of course, it will also be interesting to see how the AMD model fares against the Intel version of the ThinkPad L13 Gen2 as we will test and discuss in this review, among other things.
Other interesting competitors in the mid-priced business segment are certainly the HP ProBook x360 435 G8 the HP EliteBook 845 G7 the ultra-light HP Pavilion Aero 13 - all three with AMD CPU - as well as Dell's Inspiron 13 7306 with an Intel processor.
Possible competitors in comparison
Rating | Date | Model | Weight | Height | Size | Resolution | Price |
|---|---|---|---|---|---|---|---|
| 87.5 % v7 (old) | 03 / 2022 | Lenovo ThinkPad L13 Gen2-21AB000PGE R5 PRO 5650U, Vega 7 | 1.4 kg | 17.6 mm | 13.30" | 1920x1080 | |
| 86.1 % v7 (old) | 01 / 2021 | Lenovo ThinkPad L13 Gen2-20VH0017GE i5-1135G7, Iris Xe G7 80EUs | 1.4 kg | 17.6 mm | 13.30" | 1920x1080 | |
| 88.3 % v7 (old) | 04 / 2021 | Lenovo ThinkPad L13 Yoga Gen2-20VK000VGE i5-1135G7, Iris Xe G7 80EUs | 1.5 kg | 17.6 mm | 13.30" | 1920x1080 | |
| 90.6 % v7 (old) | 11 / 2021 | Lenovo ThinkPad X13 G2 AMD 20XH001KGE R5 PRO 5650U, Vega 7 | 1.4 kg | 18.19 mm | 13.30" | 1920x1200 | |
| 88.2 % v7 (old) | 11 / 2020 | HP EliteBook 845 G7 Ryzen 7 Pro 4750U R7 PRO 4750U, Vega 7 | 1.4 kg | 17.9 mm | 14.00" | 1920x1080 | |
| 85.7 % v7 (old) | 08 / 2021 | HP ProBook x360 435 G8 R7-5800U R7 5800U, Vega 8 | 1.5 kg | 18 mm | 13.30" | 1920x1080 | |
| 84.4 % v7 (old) | 08 / 2021 | HP Pavilion Aero 13 be0097nr R7 5800U, Vega 8 | 953 g | 17 mm | 13.30" | 1920x1200 | |
| 86.8 % v7 (old) | 12 / 2021 | Dell Inspiron 13 7306-6TYH5 i7-1165G7, Iris Xe G7 96EUs | 1.4 kg | 18 mm | 13.30" | 3840x2160 |
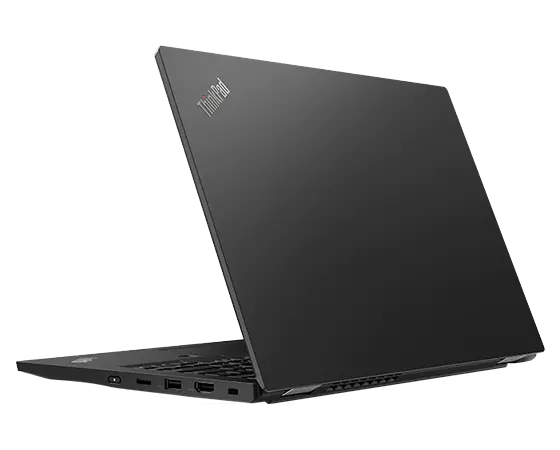
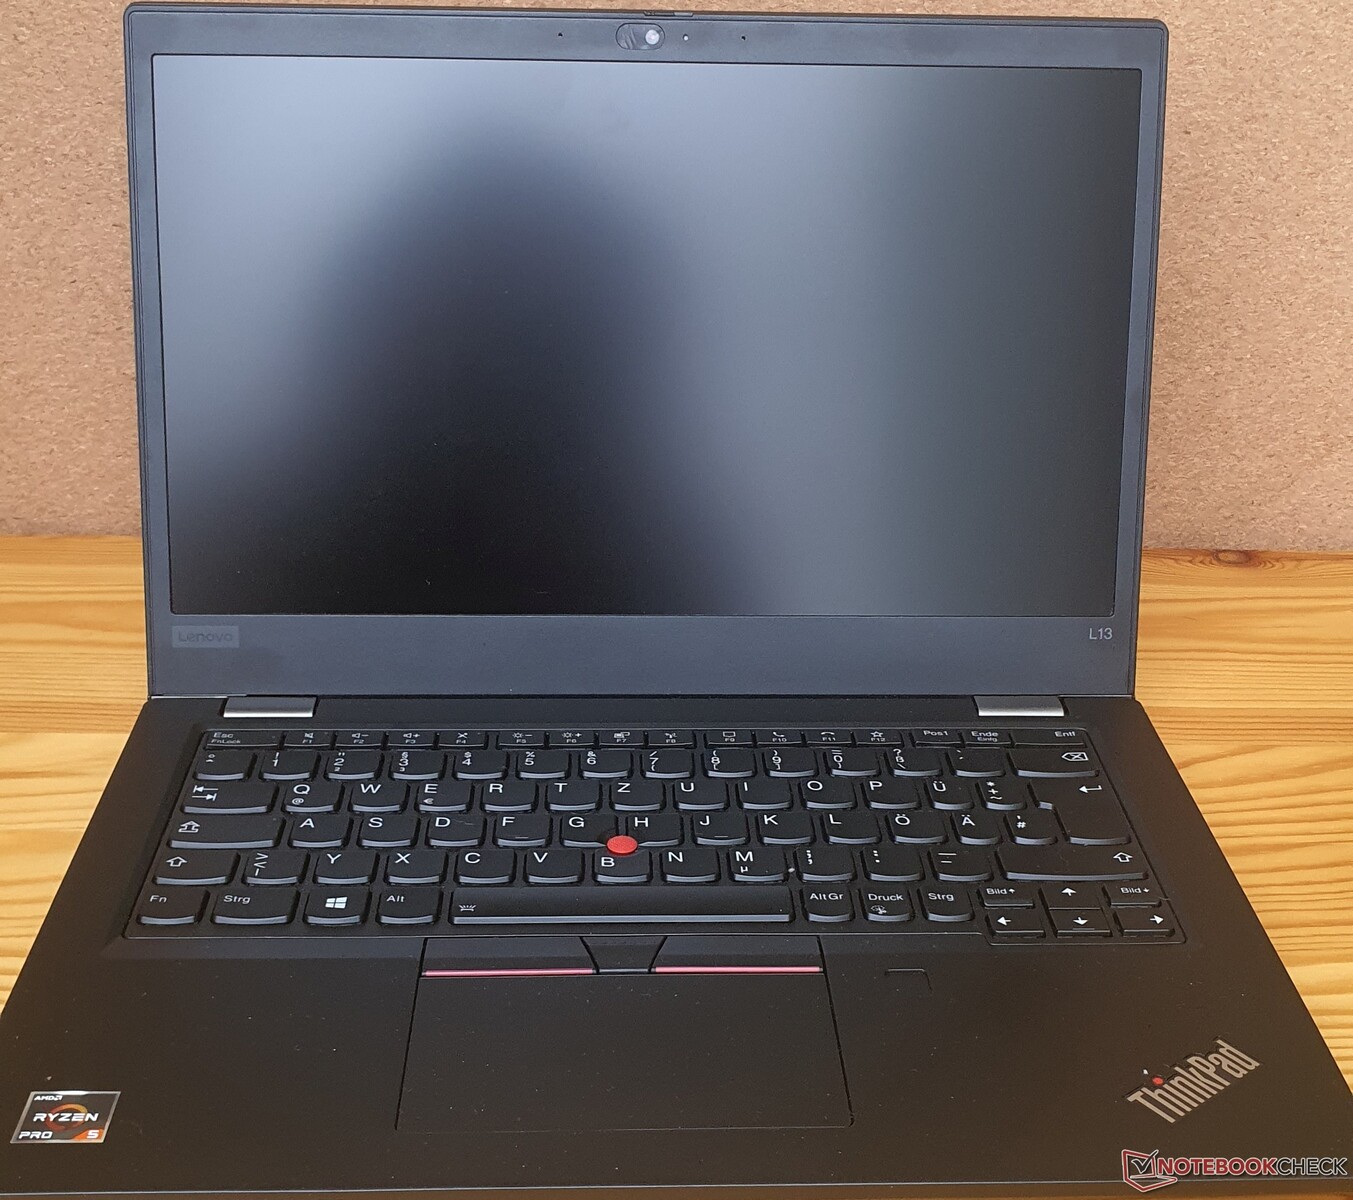
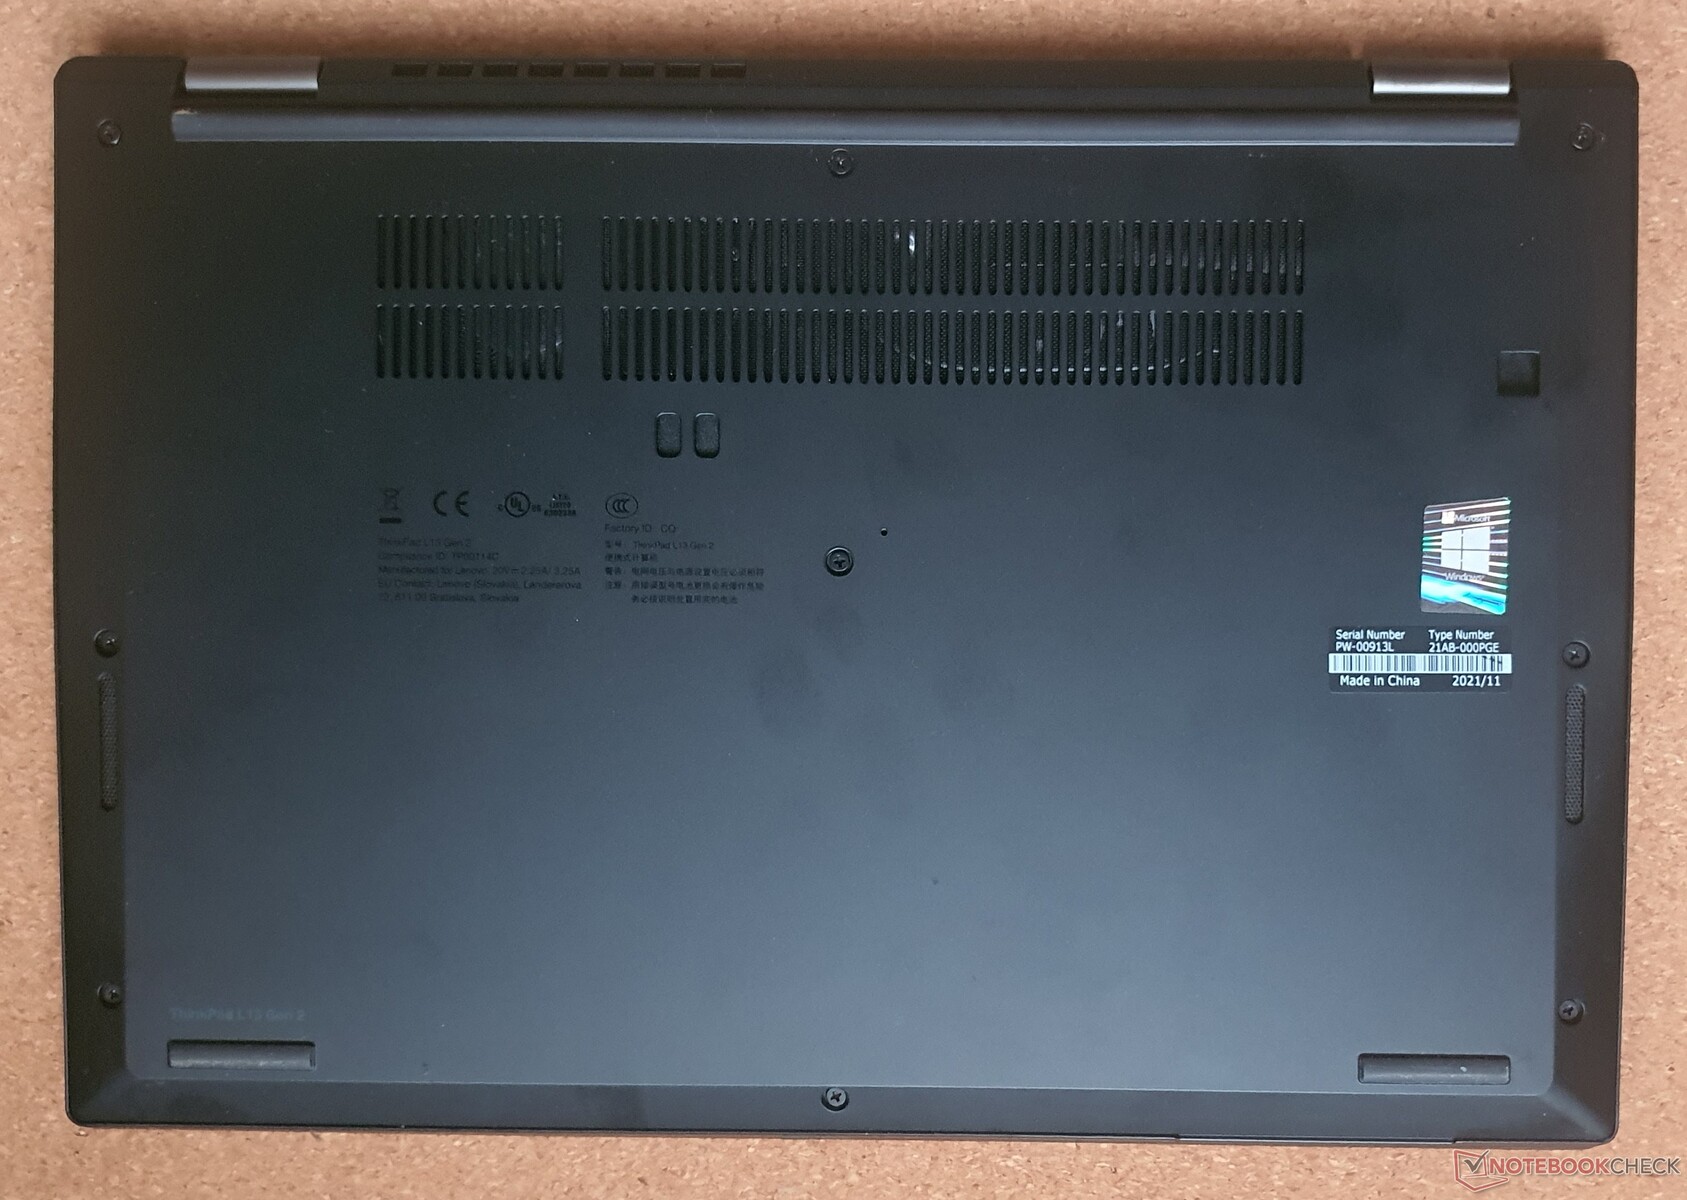
Case - Very robust with slim footprint
Compared to the predecessor, the ThinkPad L390 the case has been slimmed down, so that its dimensions are now on the more modern level of the ThinkPad X390 instead of the 14-inch ultrabook level (such as the X1 Carbon G6). Additional ventilation slots on the underside should improve the cooling performance.
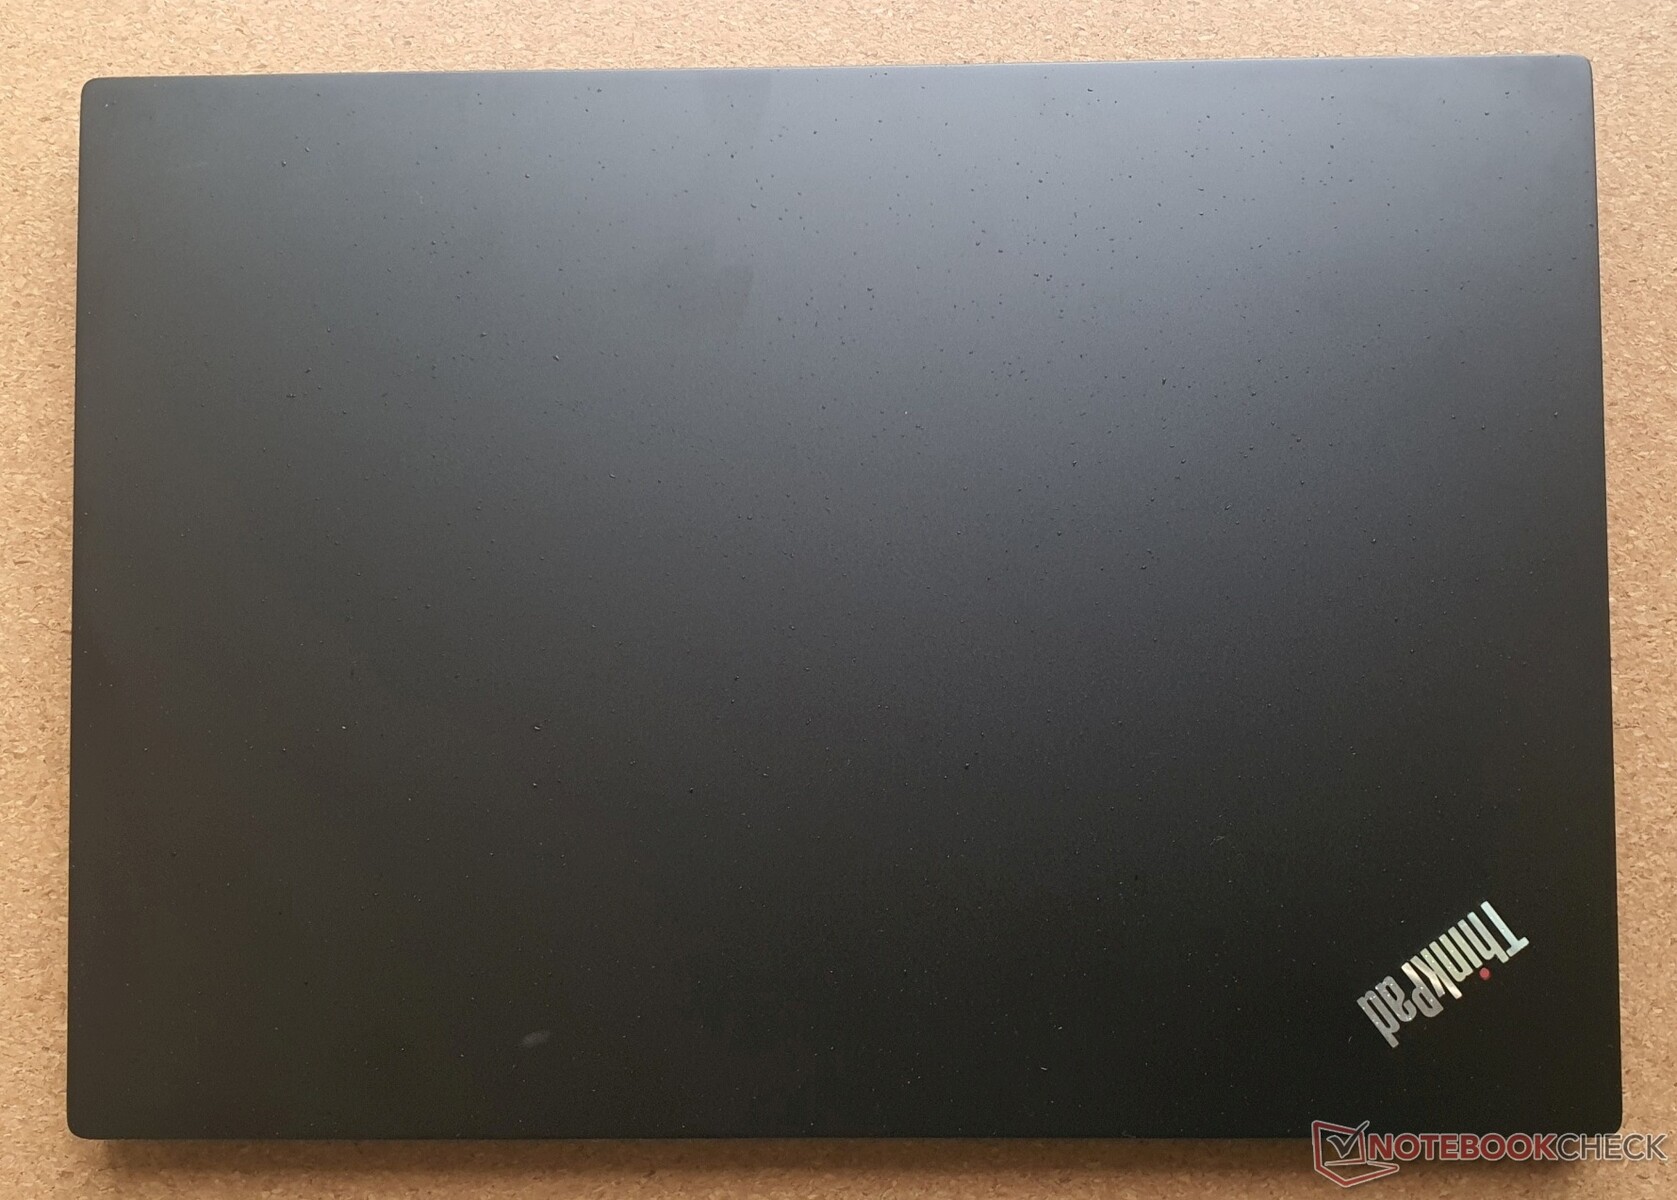
The construction includes a lot of plastic instead of the rubberized plastic-glass fiber composite (GFRP) of the T-series. Only the display lid is reinforced with aluminum, making it difficult to twist. The bottom is made of GFRP plastic. Overall, the device is very robust, the base unit as well as the keyboard deck don't give in at all even under greater pressure. However, the matte black plastic surfaces are extremely susceptible to fingerprints. Due to the low overall weight in combination with very strongly adjusted hinges, the ThinkPad L13 Gen 2 AMD cannot really be opened with one hand.
You can see in the dimensions that the distance to the Dell Inspiron 13 and the in-house ThinkPad X13 G2 is no longer as wide as it was with the ThinkPad L390. All business devices also have a similar weight in comparison. If you are looking for an ultra-light device in this price range, you will be satisfied with HP's Aero 13, especially since its dimensions are even smaller, and because of its 16:10 display.
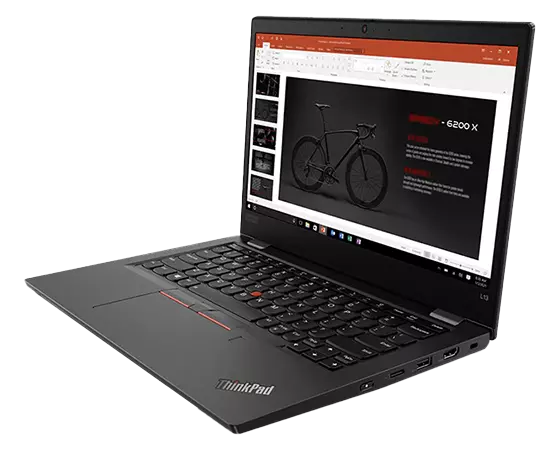
Equipment - Connectivity with legacy ports without Thunderbolt
The 2nd generation L-series offers Thunderbolt 4 for the first time - but not (yet) in the AMD variants. Our ThinkPad L13 manages with normal USB-C ports. Otherwise, the connectivity is broad. We would have only liked to see a full-size SD card reader, but that has not been common for a 13-inch ultrabook for a long time, just like the "missing" LAN port.
The port positioning can be described as good. The power button is located a bit further forward on the right side and cannot be pressed accidentally in our opinion.


SD Card Reader
The microSD card reader delivers good speeds that are average for the tested device class. Premium workstations like the ThinkPad P1 G4 however, bring more than double the speeds to the table.
| SD Card Reader | |
| average JPG Copy Test (av. of 3 runs) | |
| Lenovo ThinkPad L13 Yoga Gen2-20VK000VGE (AV PRO V60) | |
| Lenovo ThinkPad L13 Gen2-20VH0017GE (Toshiba Exceria Pro M501 64 GB UHS-II) | |
| Average of class Subnotebook (23.7 - 188, n=9, last 2 years) | |
| Lenovo ThinkPad L13 Gen2-21AB000PGE | |
| HP ProBook x360 435 G8 R7-5800U (AV Pro UHS-II V60) | |
| maximum AS SSD Seq Read Test (1GB) | |
| Average of class Subnotebook (24.9 - 195, n=8, last 2 years) | |
| HP ProBook x360 435 G8 R7-5800U (AV Pro UHS-II V60) | |
| Lenovo ThinkPad L13 Gen2-21AB000PGE | |
| Lenovo ThinkPad L13 Gen2-20VH0017GE (Toshiba Exceria Pro M501 64 GB UHS-II) | |
| Lenovo ThinkPad L13 Yoga Gen2-20VK000VGE (AV PRO V60) | |
| Dell Inspiron 13 7306-6TYH5 (AV Pro SD microSD 128 GB V60) | |
Communication
The WLAN test also shows a rather average performance of the RealTek WiFi-6 card with Bluetooth 5.1. The AX201 Wi-Fi card of the L13 Gen2 with Intel processor is significantly faster here.
Webcam
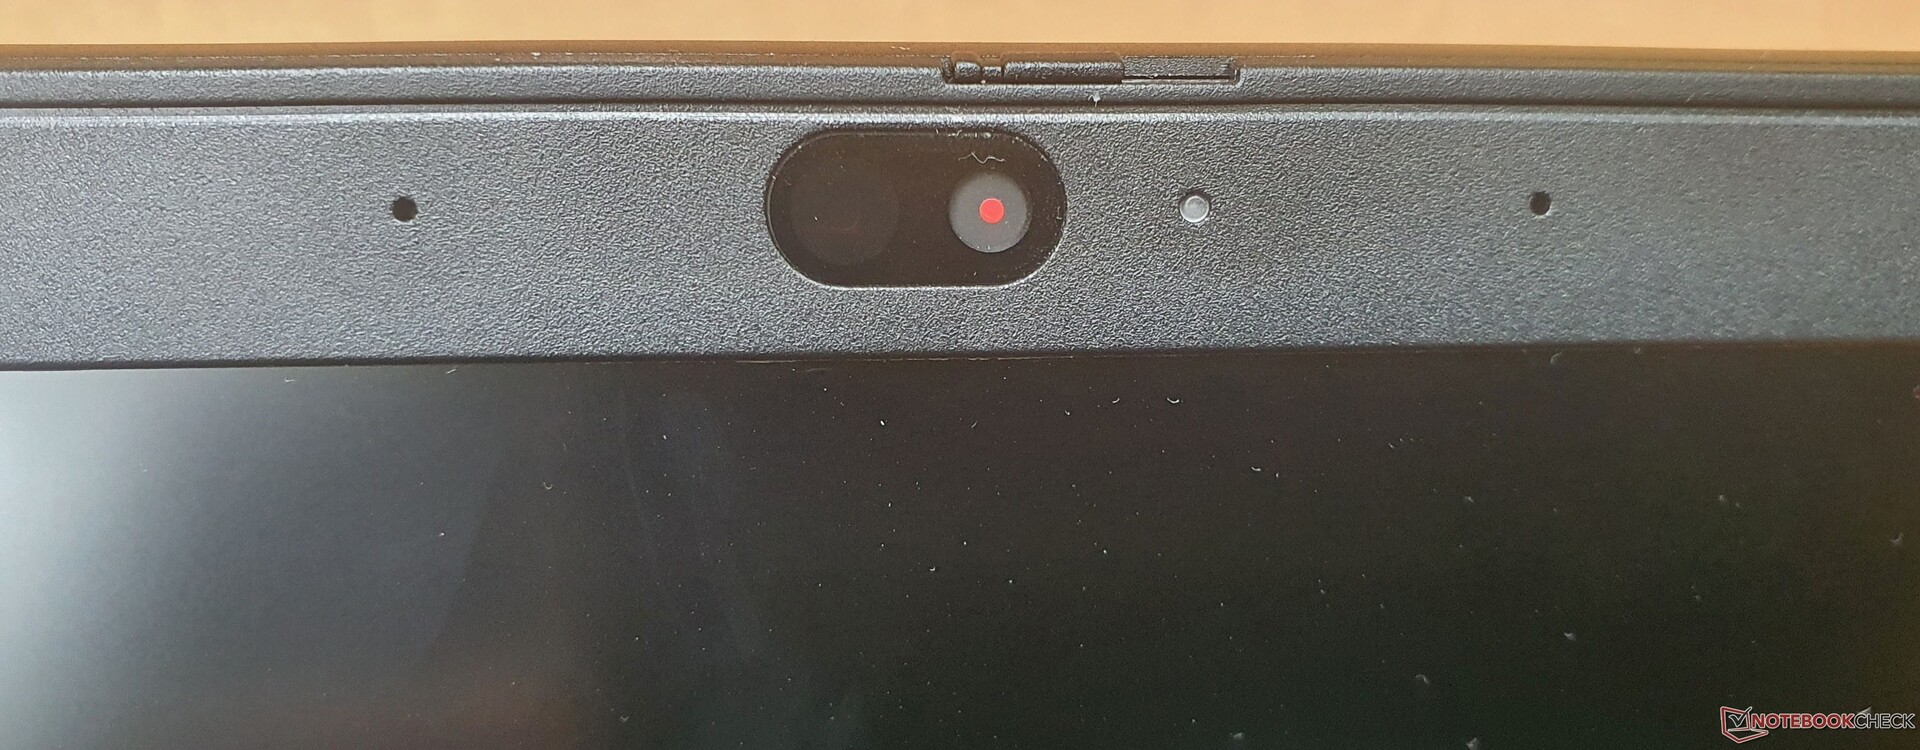
The 720p webcam of the Lenovo ThinkPad L13 Gen2 AMD produces an image with incorrect colors and a blurry display. It is just about sufficient for video conferencing. Additionally, there is the "ThinkShutter" to permanently cover the webcam when it is not needed. An infrared module for Windows Hello is also present.


Security
As a business device, the ThinkPad L13 has the same security features as the T-series in contrast to the E-series: fingerprint scanner, TPM 2.0, an infrared camera (optional) for Windows Hello, a smartcard reader, a built-in device for a security lock and the ThinkShutter for the webcam.
Accessories
Besides the 65 watt USB-C power supply, there are no other accessories in the cardboard packaging. the packaging is not yet 100% ecological, but Lenovo will probably change that in the future.
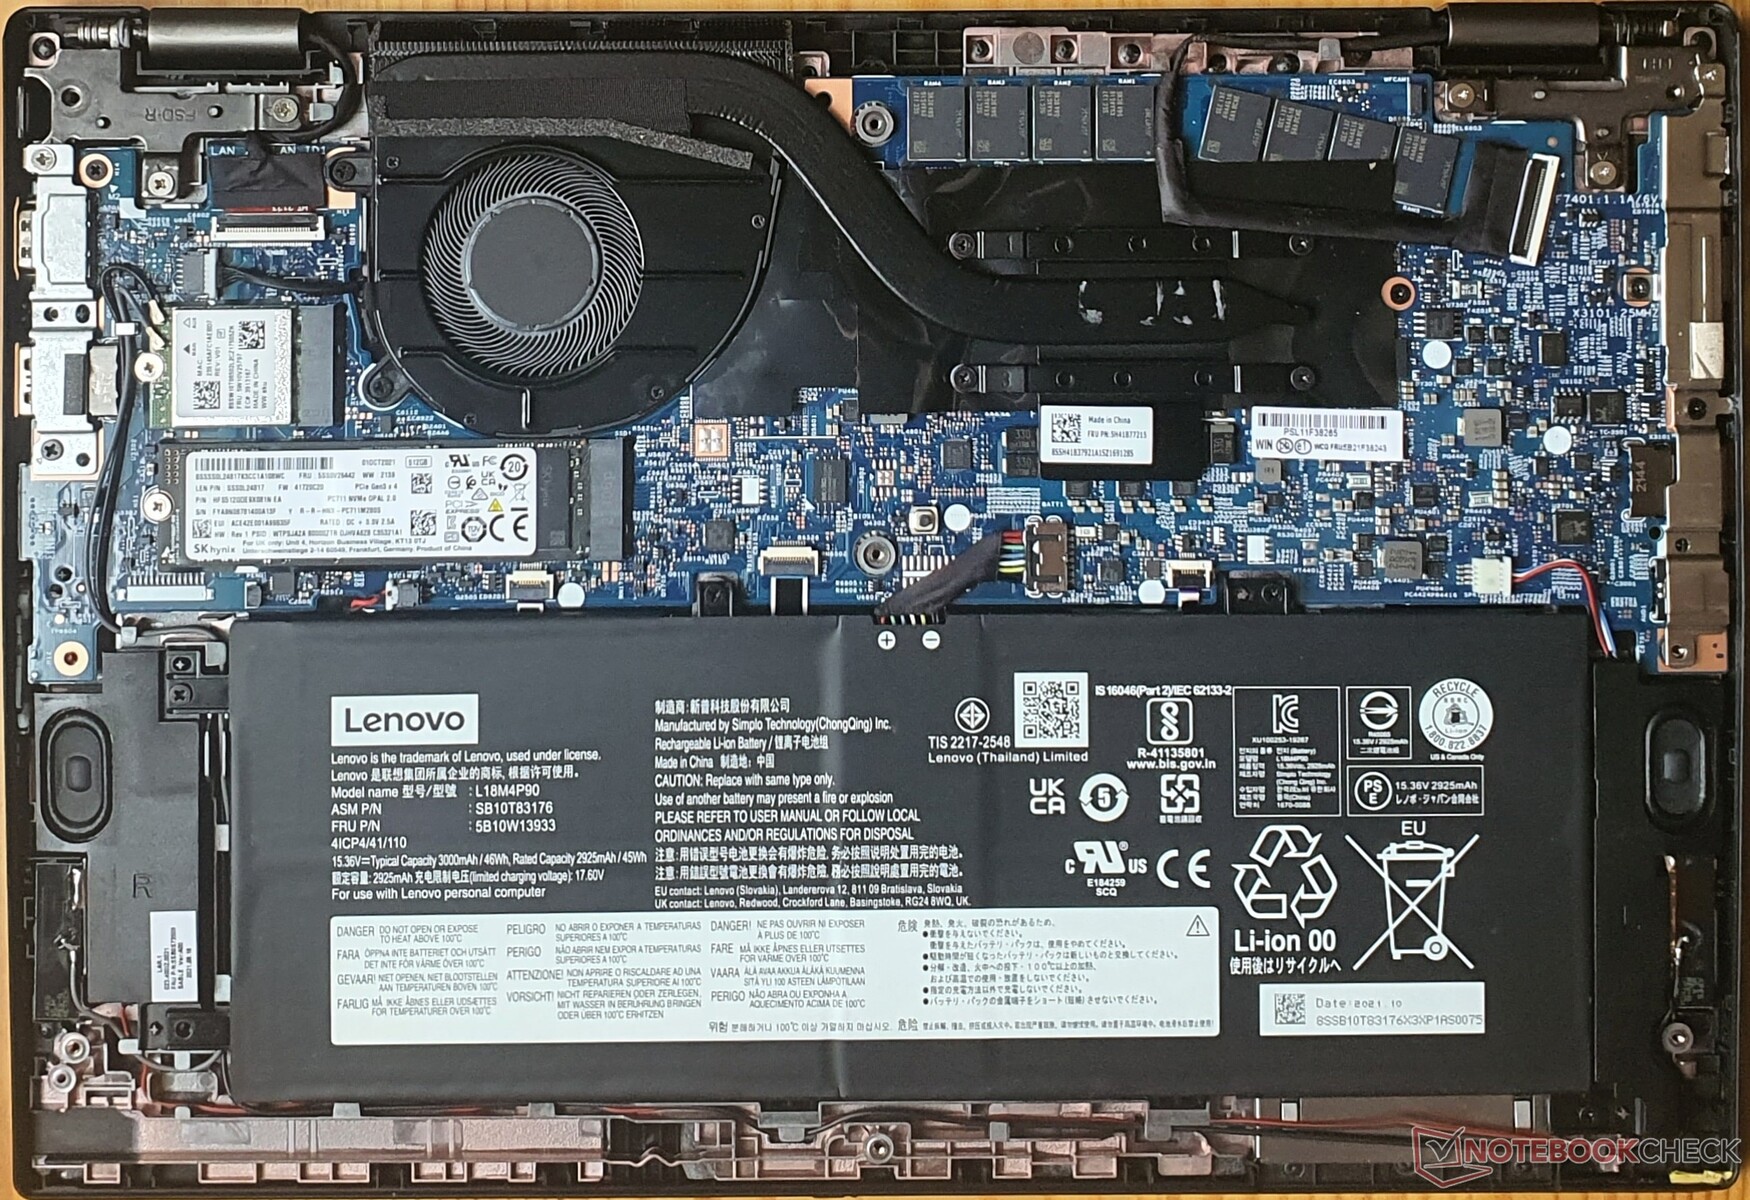
Maintenance
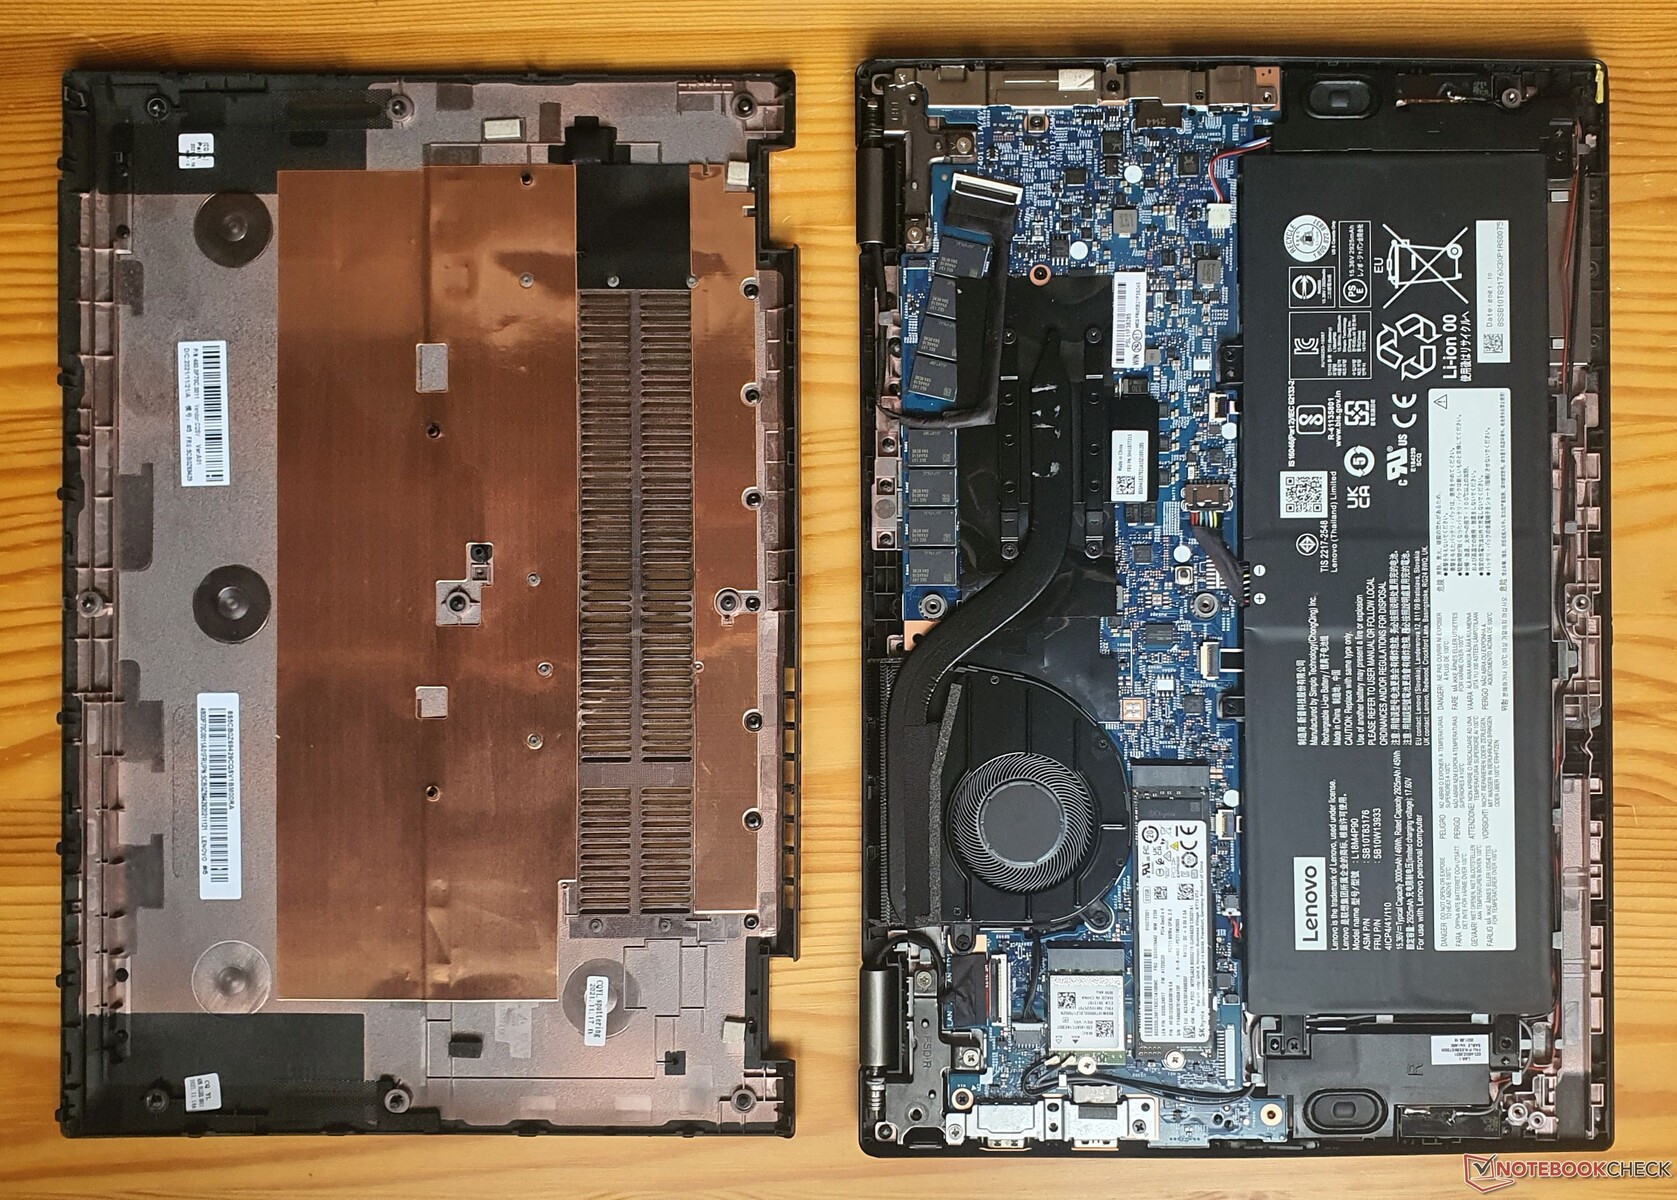
Exchangeable here are: Wi-Fi, the M.2-2280 SSD as well as the battery. There are no RAM slots or a slot for WWAN. The fan is easily accessible for cleaning.
To access the inside of the ThinkPad, the base plate is removed by unscrewing nine screws; the screws remain stuck in the case, which is why they are not lost. There are also quite a few plastic clips all around, which are best opened carefully one by one with a plastic spudger tool. In a pinch, you can also try using an old credit card.
While this requires a bit of patience, removing the keyboard is very simple: Two screws on the bottom have to be loosened and the internal keyboard can be removed. This not only allows repairs in the area, but also changing to other keyboard layouts (such as QWERTY).
Warranty
Unlike the ThinkPad T-series, the L-series is sold with only one year of bring-in service. An extension to three to five years is available for an additional charge, as well as on-site service and extras like accident protection.
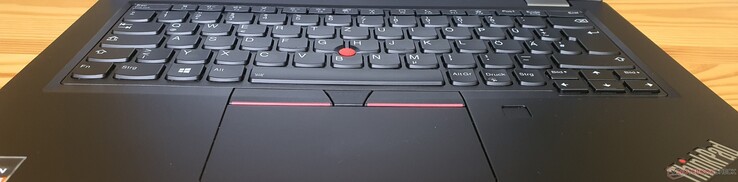
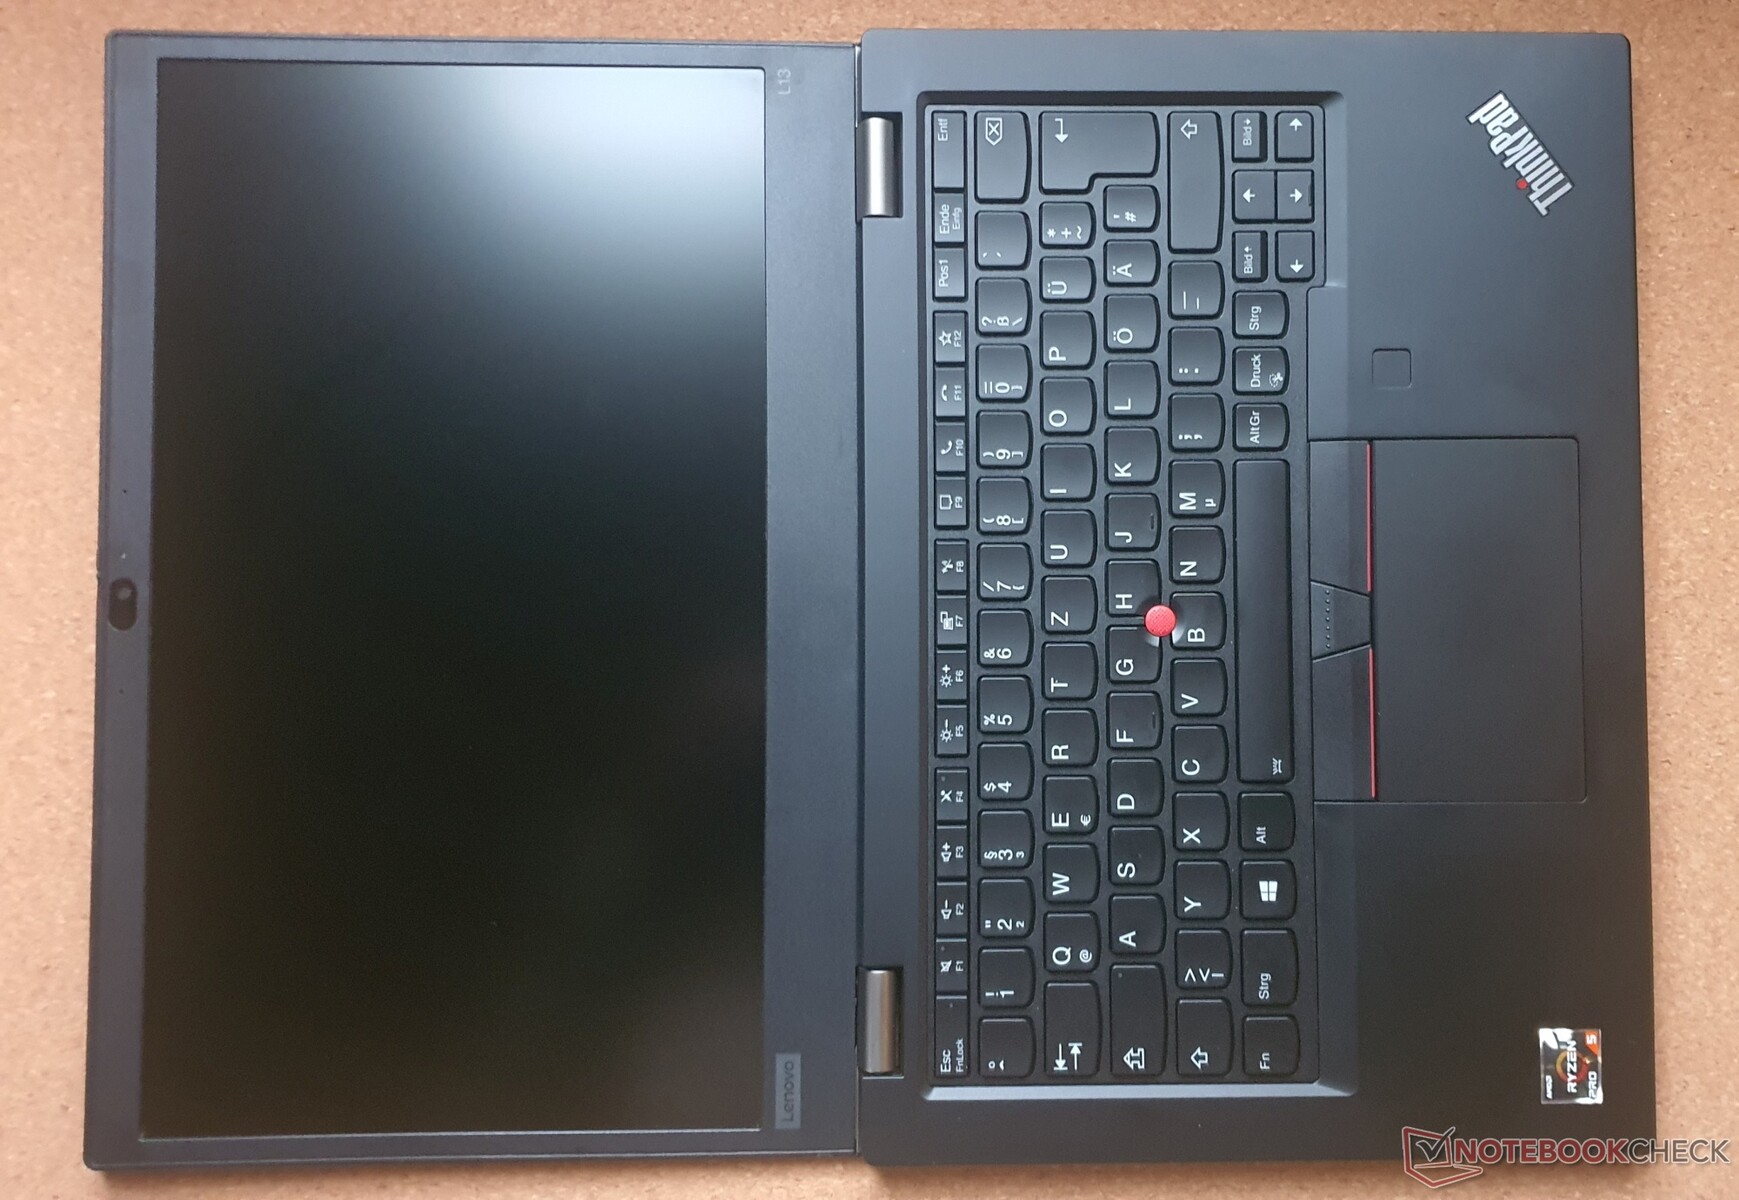
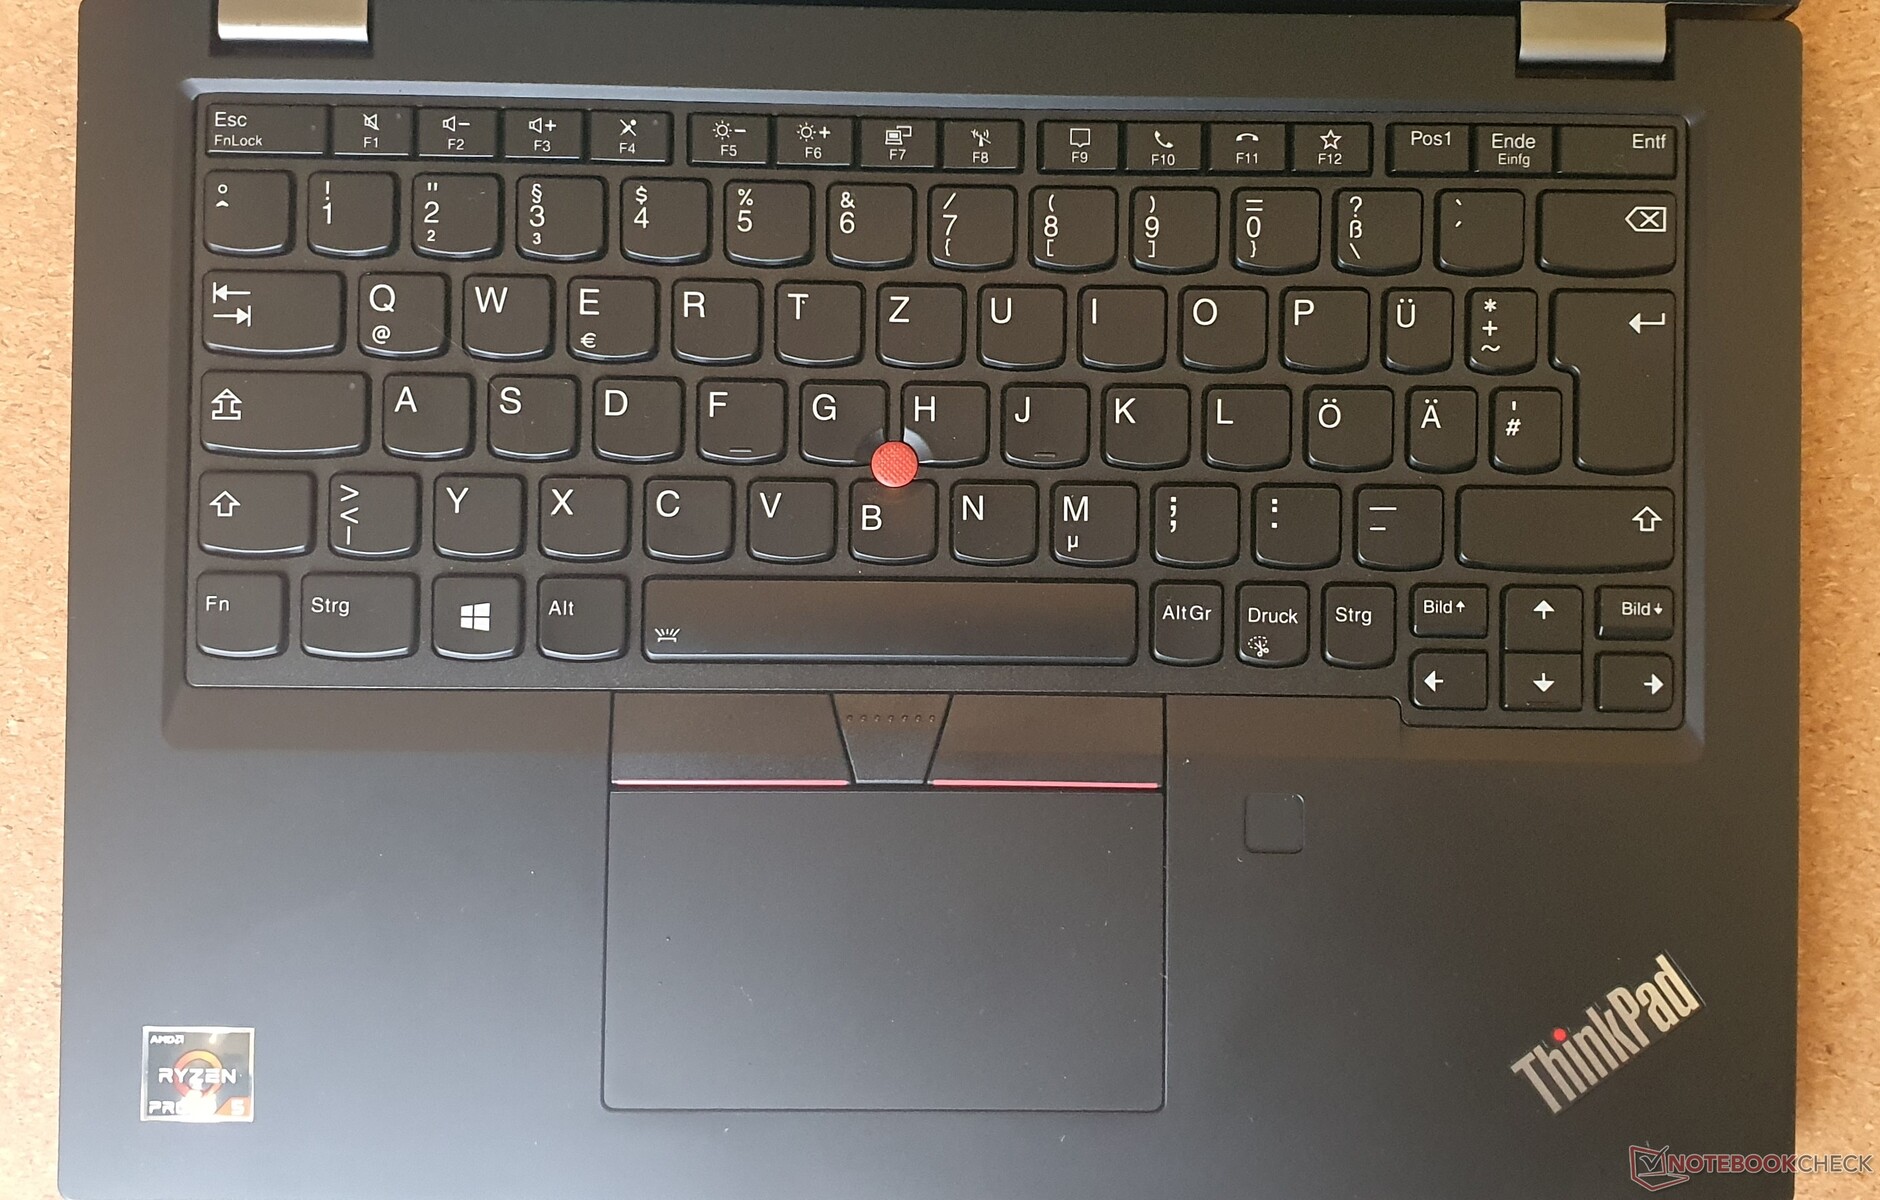
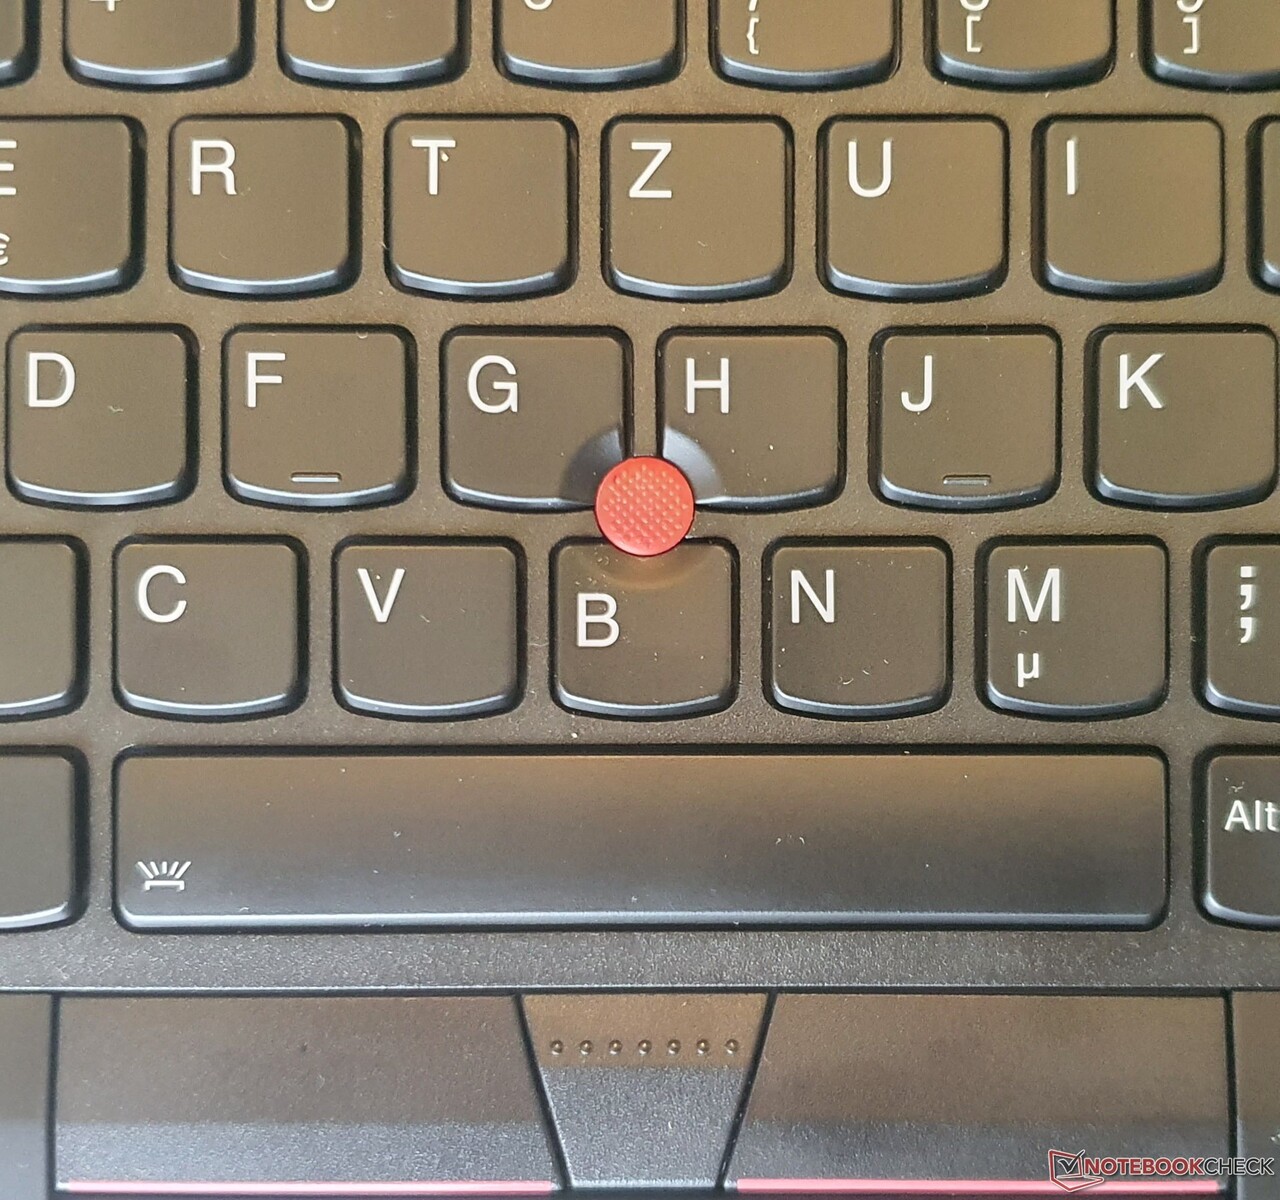
Input devices - Crisp pressure point with 1.8 mm stroke along with precise touchpad
Keyboard
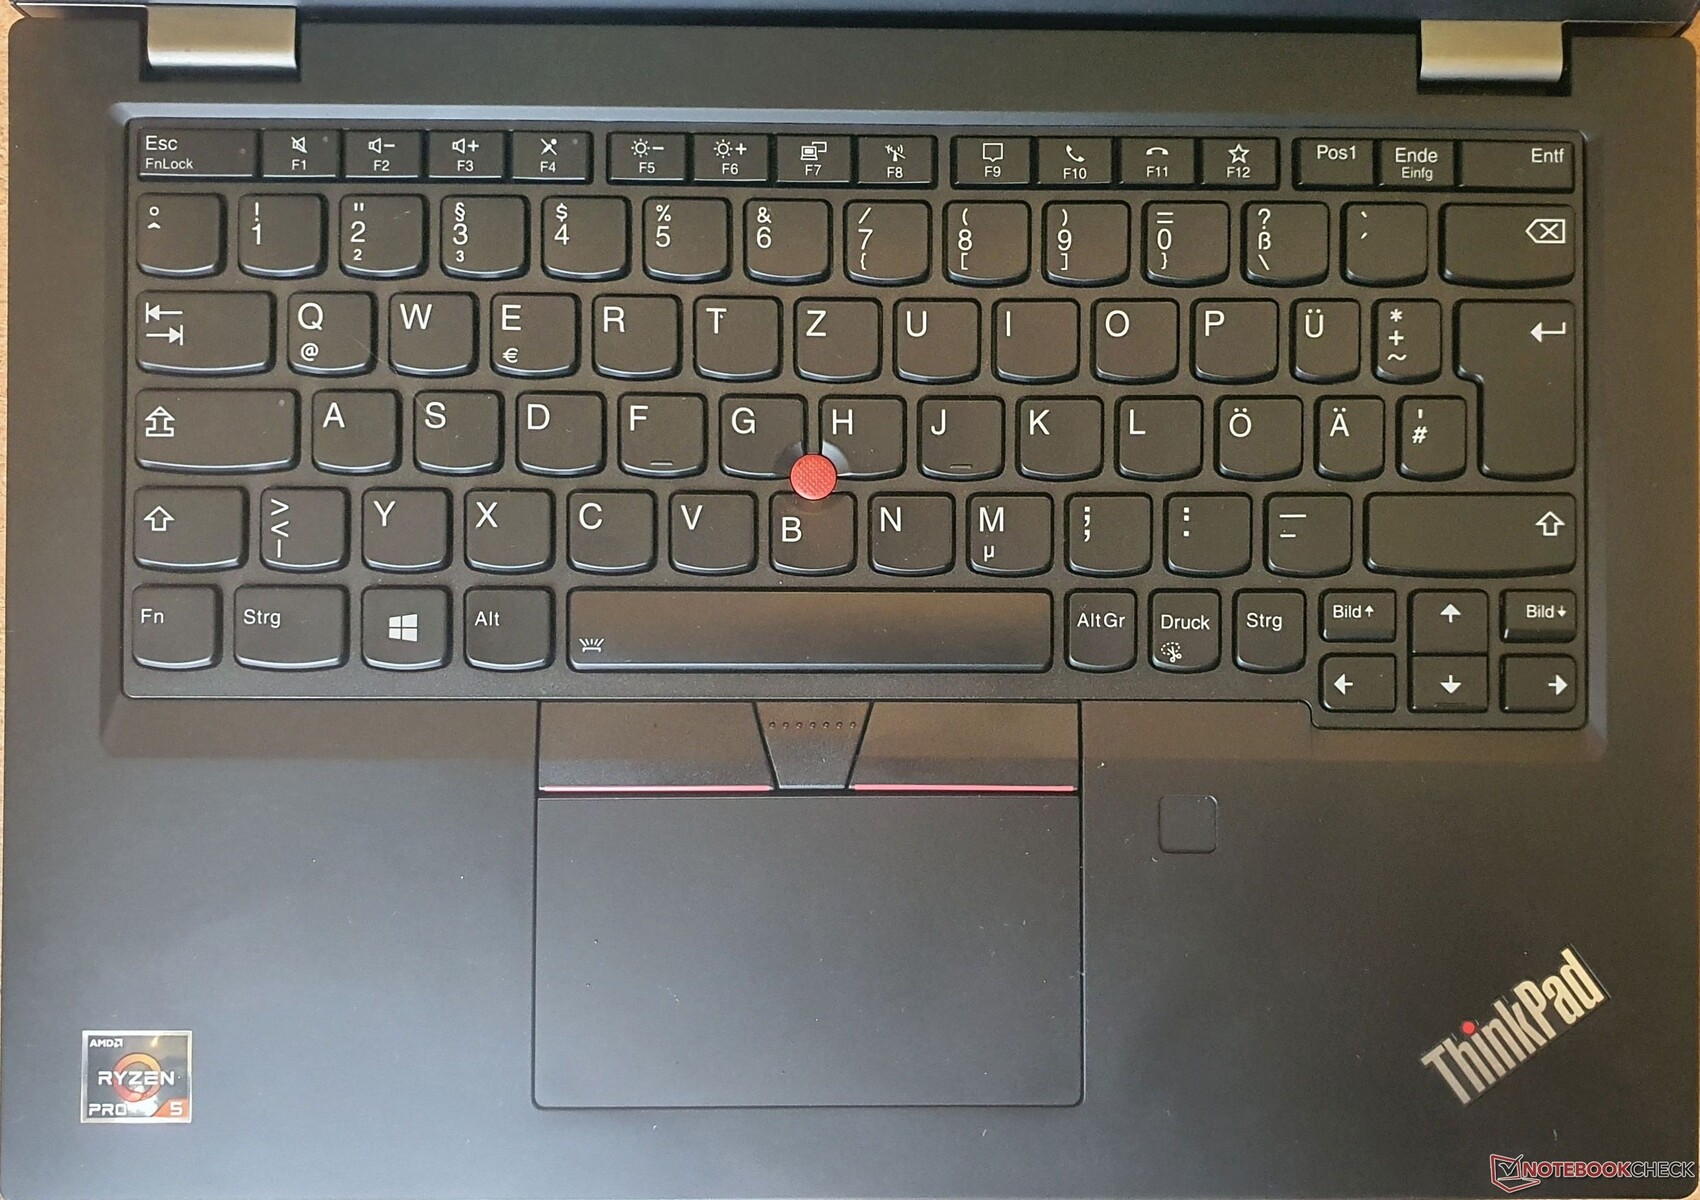
The slightly concave keys, typical for ThinkPads, feel very "grippy" as they accommodate the shape of the fingertips. The keyboard has a two-level adjustable backlight. It has a travel of a very good 1.8 mm, whereas many modern ThinkPads as well as notebooks from other manufacturers only offer around 1.5 mm and less here. The pressure point is very good and the tester even likes it better than the "classic" ThinkPad T430 (2.5 mm travel), which is often used as a reference for one of the best chiclet keyboards.
The initial actuation force is very well measured and thus offers an excellent typing feel, which is overall much better than on an X1 Carbon G9 or T14s Gen 2. The keyboard does not yield when typing. However, the keys turn out a bit smaller (95% of the standard width), as is the case with most notebooks of this size.
Touchpad & TrackPoint
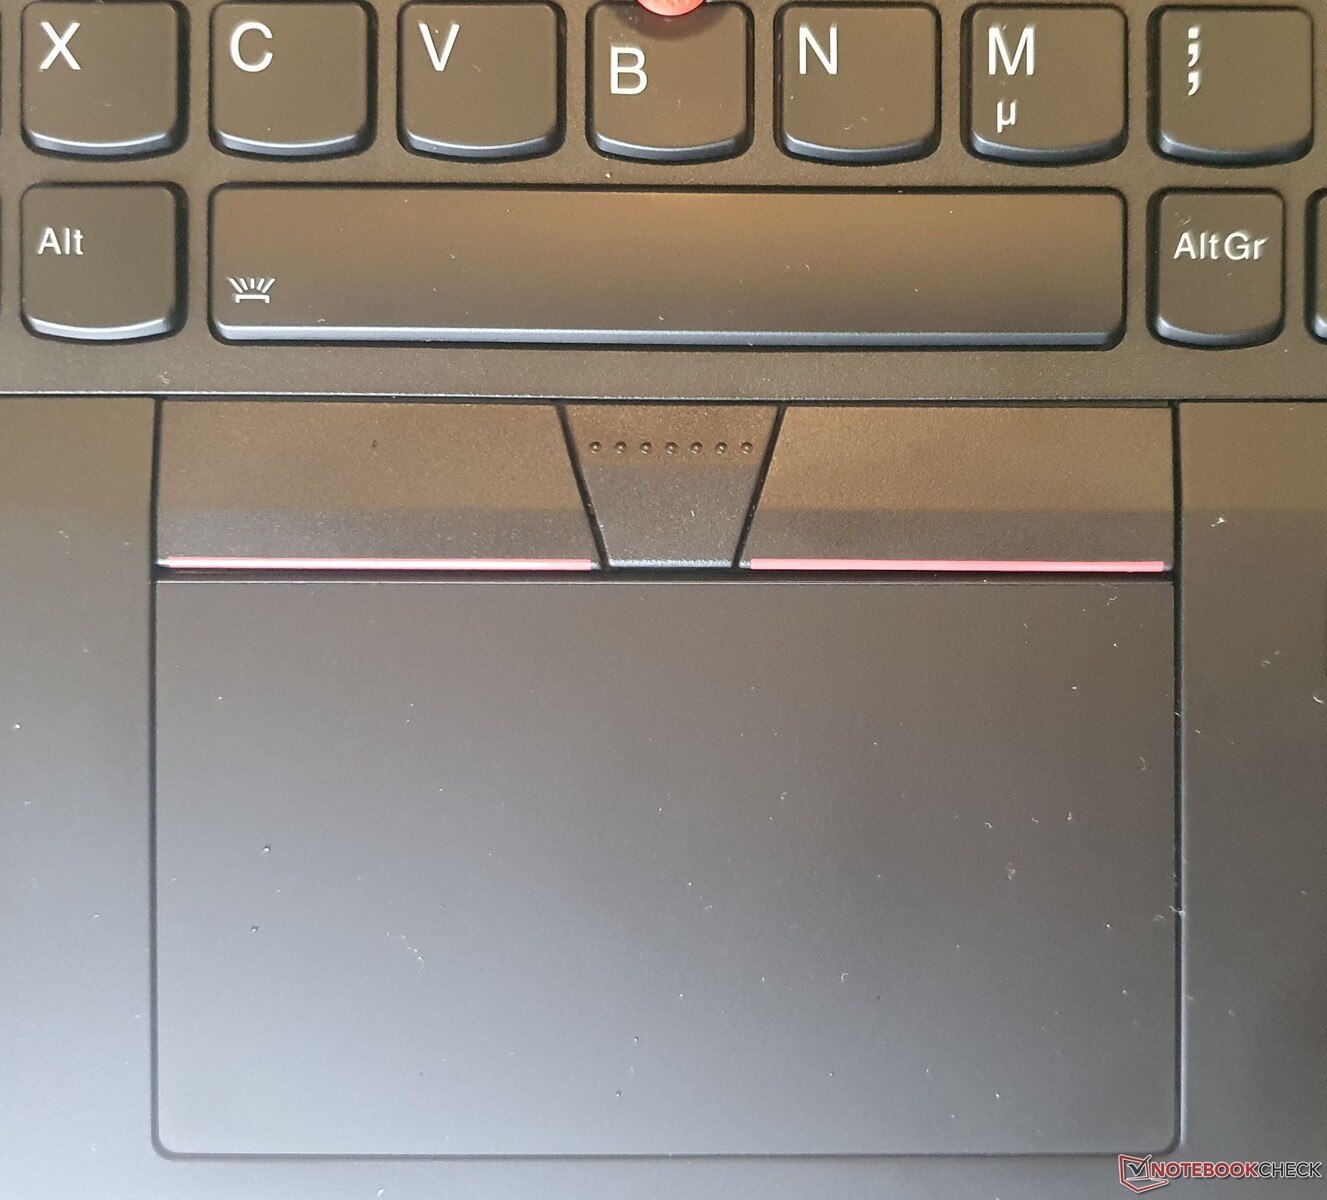
The Mylar surface of the touchpad is very slightly roughened and the gliding properties are even better than a completely smooth glass surface in the tester's opinion, but this also depends on personal taste. It is sufficiently large, especially for such a compact device.
Precision, responsiveness, scrolling and muti-touch gestures all work extremely well. The mouse buttons integrated into the touchpad trigger quite precisely, but the right click is implemented a bit duller, which could be due to the test device. It should also be noted that Lenovo often has several suppliers for the touchpad and keyboard, so the same model can differ from our test model in the end.
The familiar TrackPoint on Lenovo ThinkPads allows for more precise and faster mouse control with a bit of practice, especially since you never have to remove your hands from the keyboard to slide the cursor across the screen. Fortunately, this is not set too deep into the keyboard, so it is very grippy. The associated three buttons (above the touchpad) trigger unerringly, but more vaguely than on older ThinkPads. The right mouse button was also a bit vague. They are comparable to the buttons in the ThinkPad T480. The center button, which is used for scrolling with the TrackPoint but can also be reprogrammed as a center click, on the other hand, offers very good feedback.
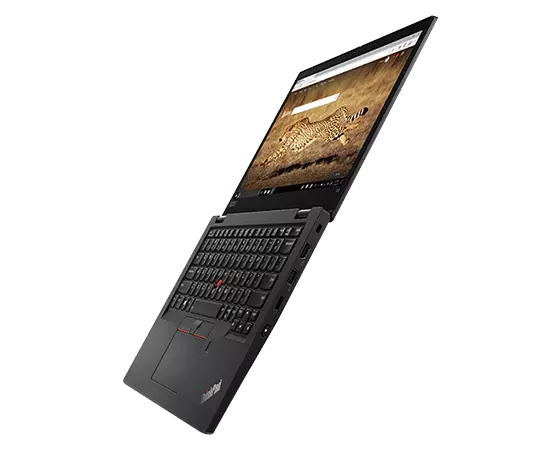
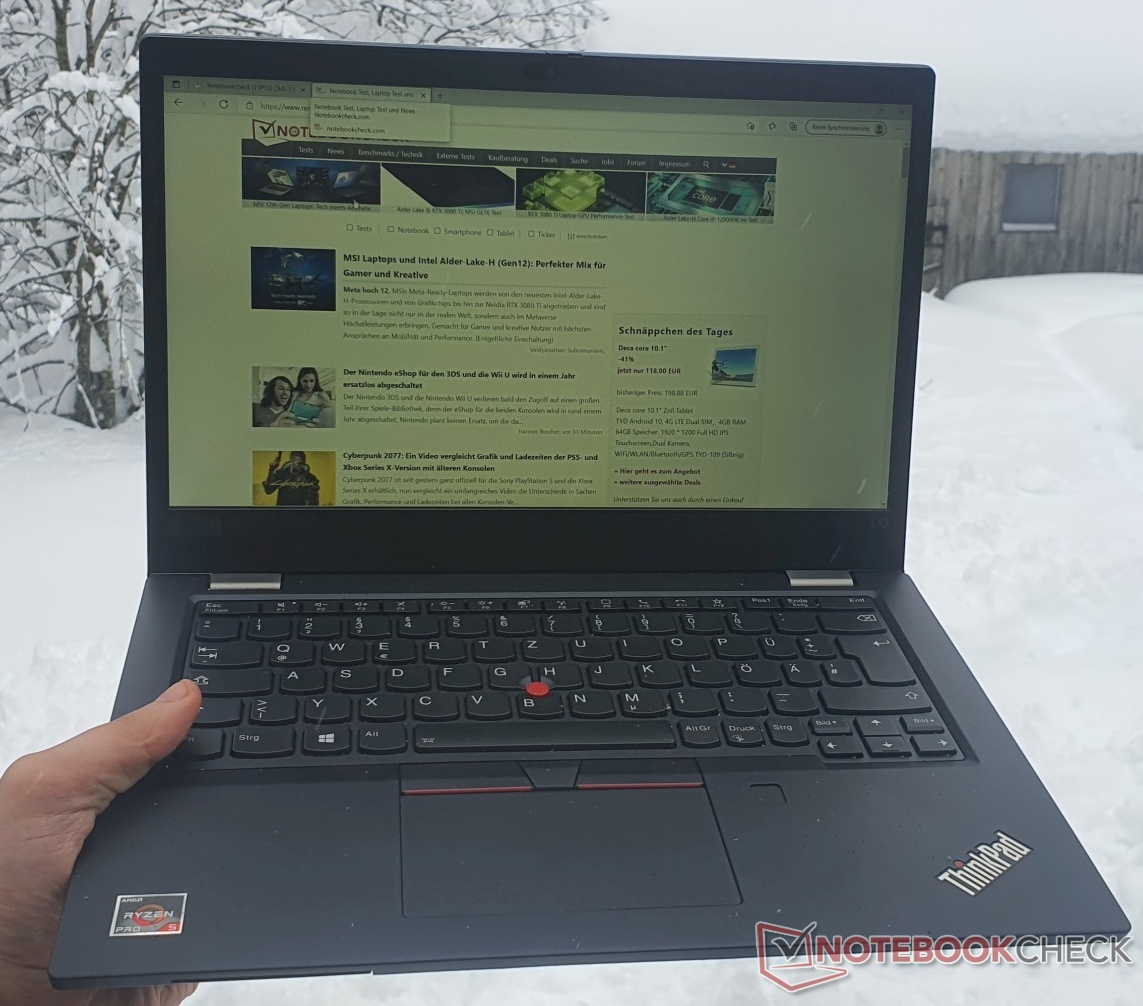
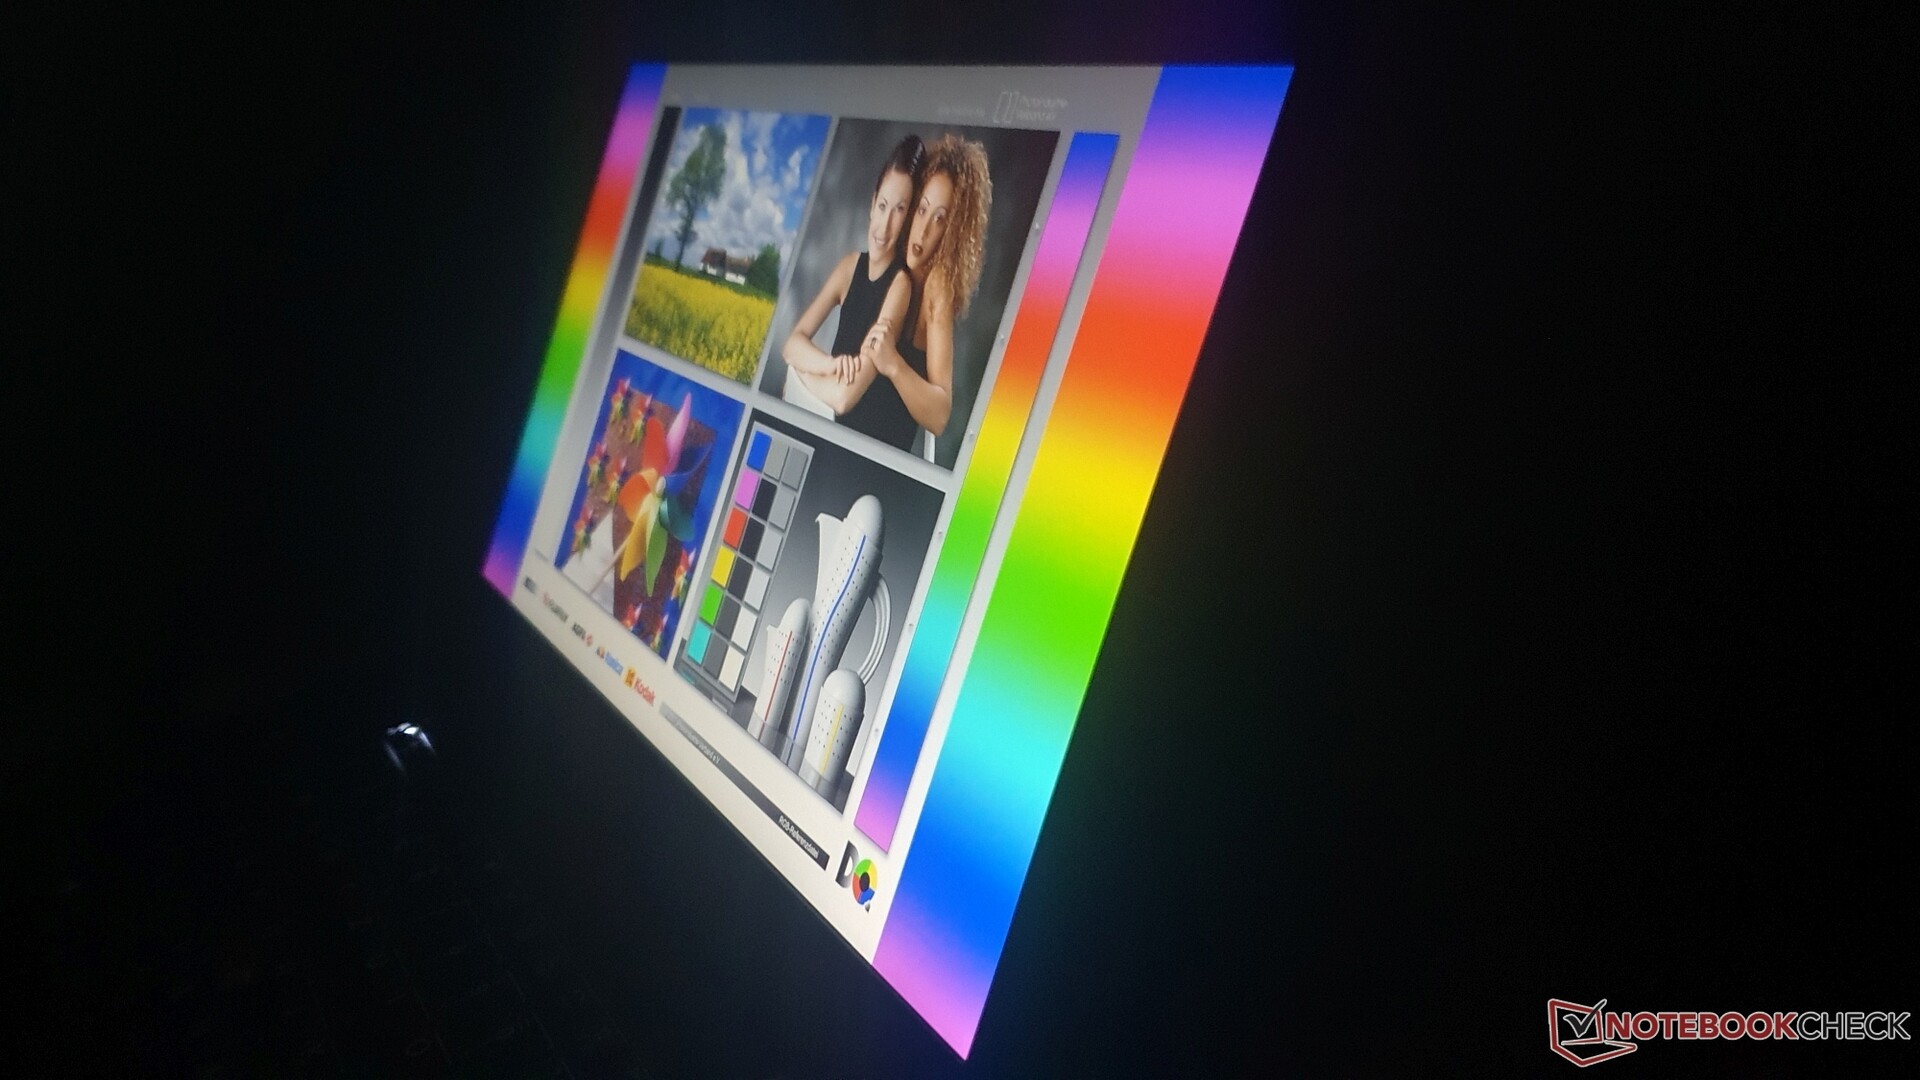
Display - Moderately bright FHD panel with optional touch
There are three panel options for the ThinkPad L13 Gen2, just like the Intel model:
13.3" HD (1366 x 768) TN, antiglare, 250 nits
13.3" FHD (1920 x 1080) IPS, antiglare, 250 nits
13.3" FHD (1920 x 1080) IPS, antiglare, touchscreen, 300 nits
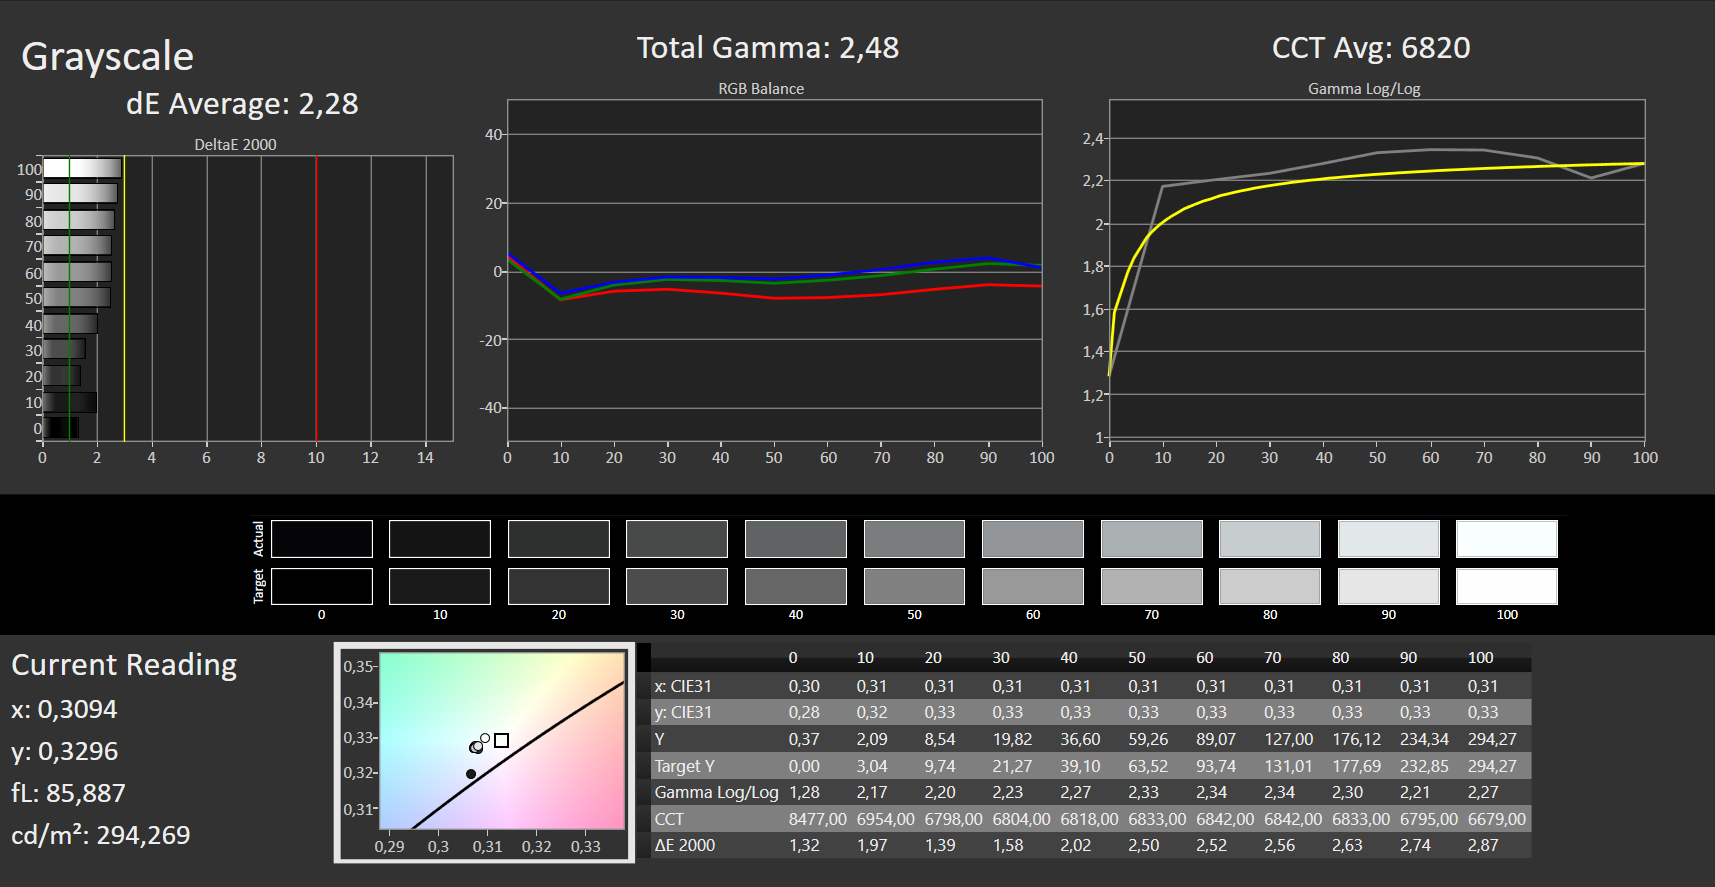
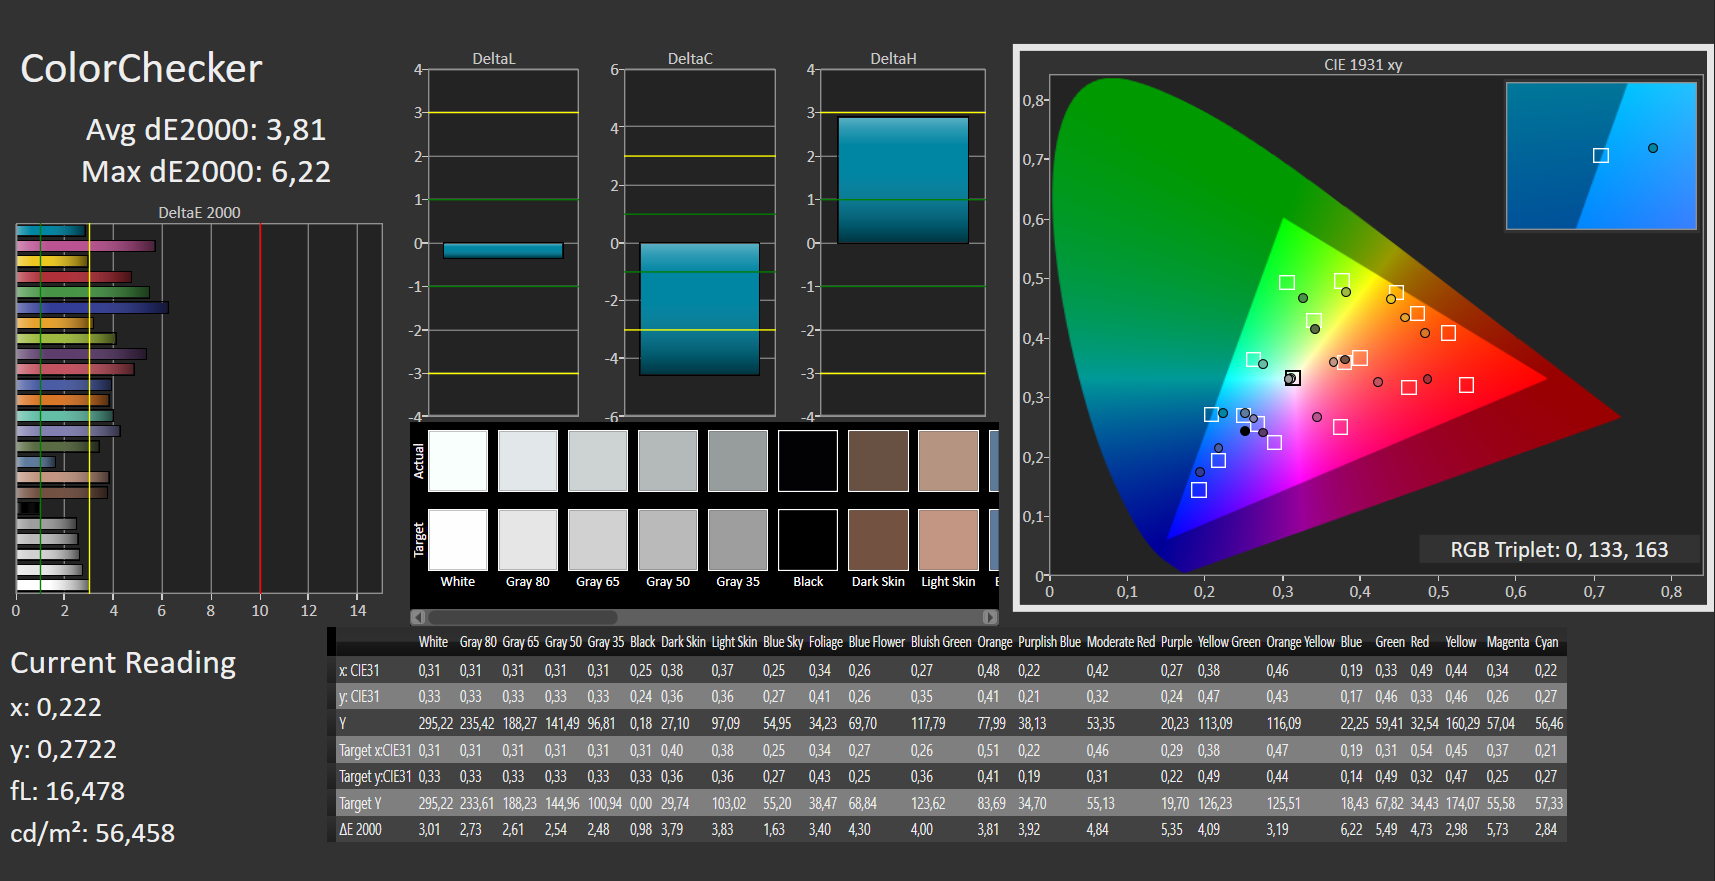
All variants offer a matte display including the on-cell touchscreen model, although the HD display with viewing-angle-weak TN technology should be avoided at all costs. According to the manufacturer, our FHD model with IPS technology has a brightness of around 250 nits, but this is exceeded in practice, as our measurements show an average of 273 nits. That is sufficient for closed rooms in most cases and the display is thus clearly above the 237 nits of the Intel model and on par with the measured value of the predecessor.
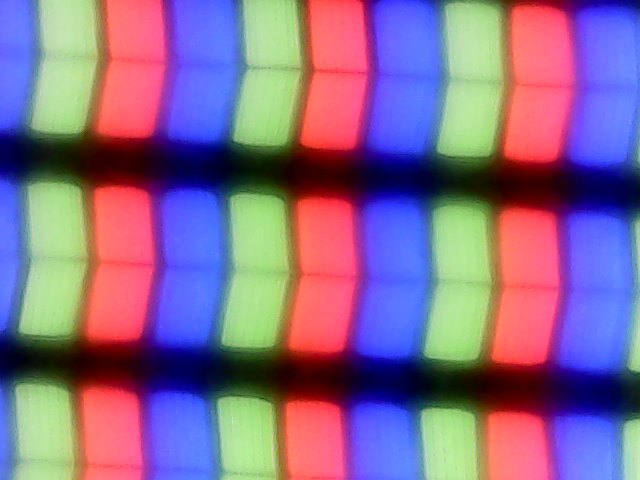
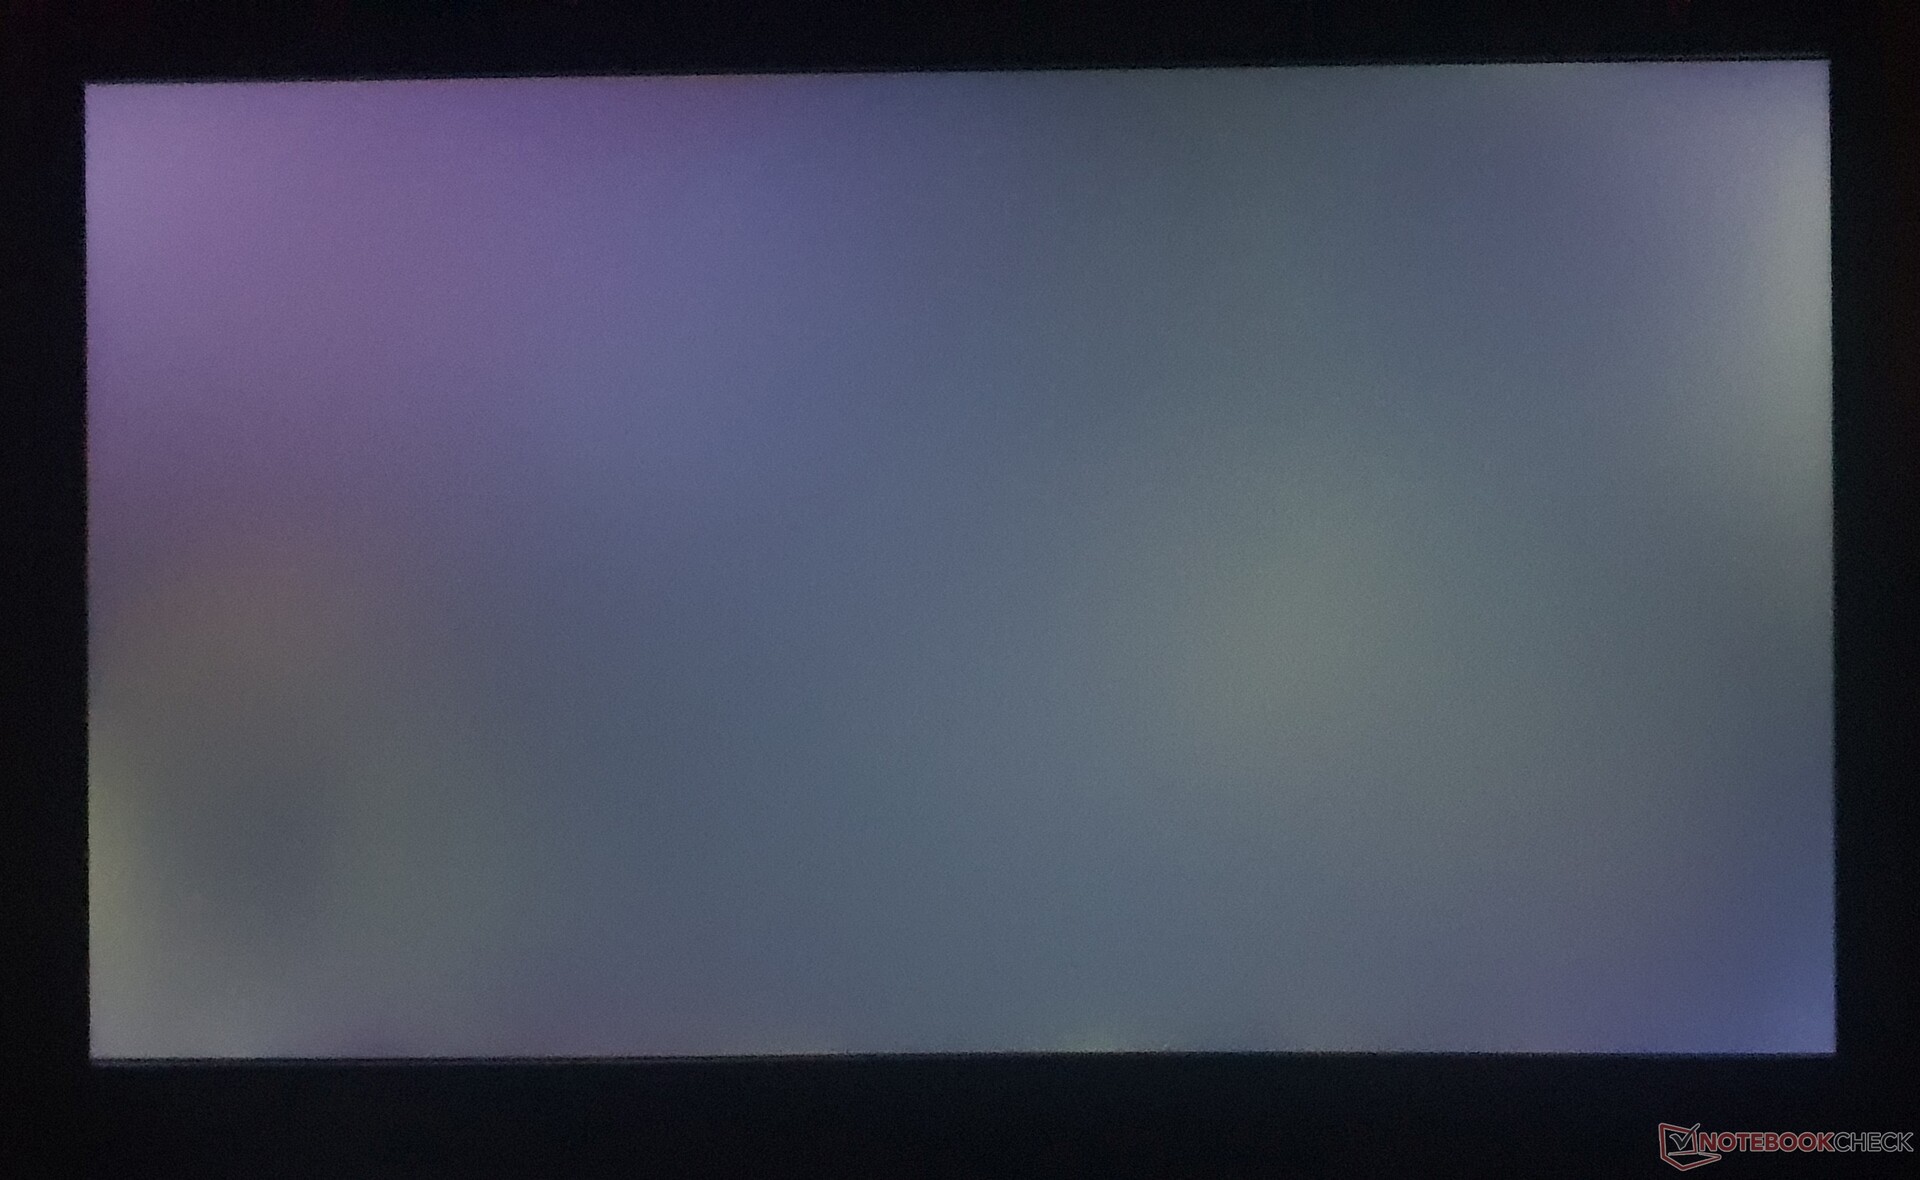
The L13 Yoga Gen2 is another 10 percent brighter with almost 300 nits, the Dell Inspiron 13 7306 manages 312 nits, as does the ThinkPad X13 G2. HP's Pavilion Aero 13 completely sets itself apart from the competition with 474 nits. It is interesting that the touchscreen version of the L13 is supposed to be a whole 50 nits brighter. The illumination homogeneity of 87% is good to very good, and the display does not suffer from PWM or backlight bleeding. Bright areas look minimally grainy on the matte display, but without being distracting.
| |||||||||||||||||||||||||
Brightness Distribution: 87 %
Center on Battery: 292 cd/m²
Contrast: 1069:1 (Black: 0.275 cd/m²)
ΔE ColorChecker Calman: 3.81 | ∀{0.5-29.43 Ø4.71}
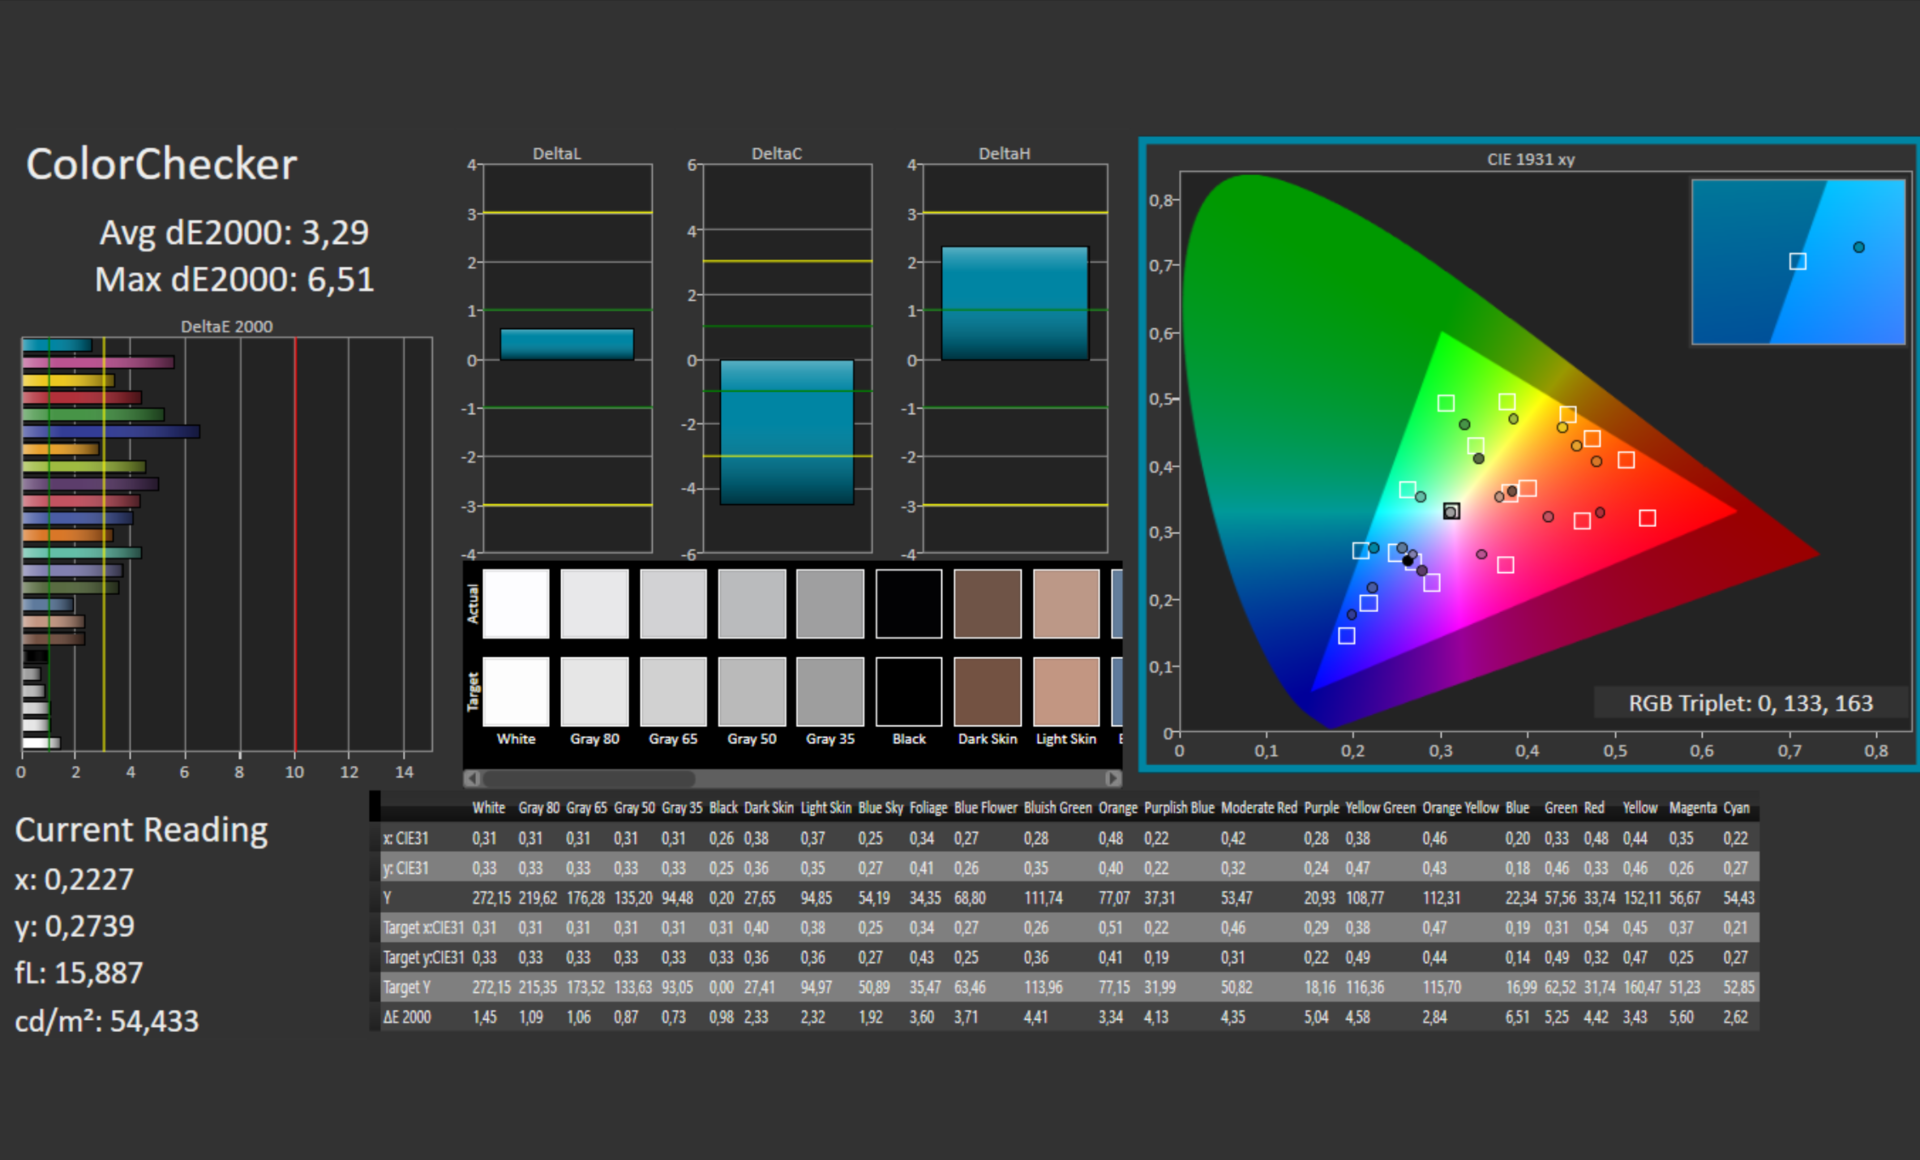
calibrated: 3.29
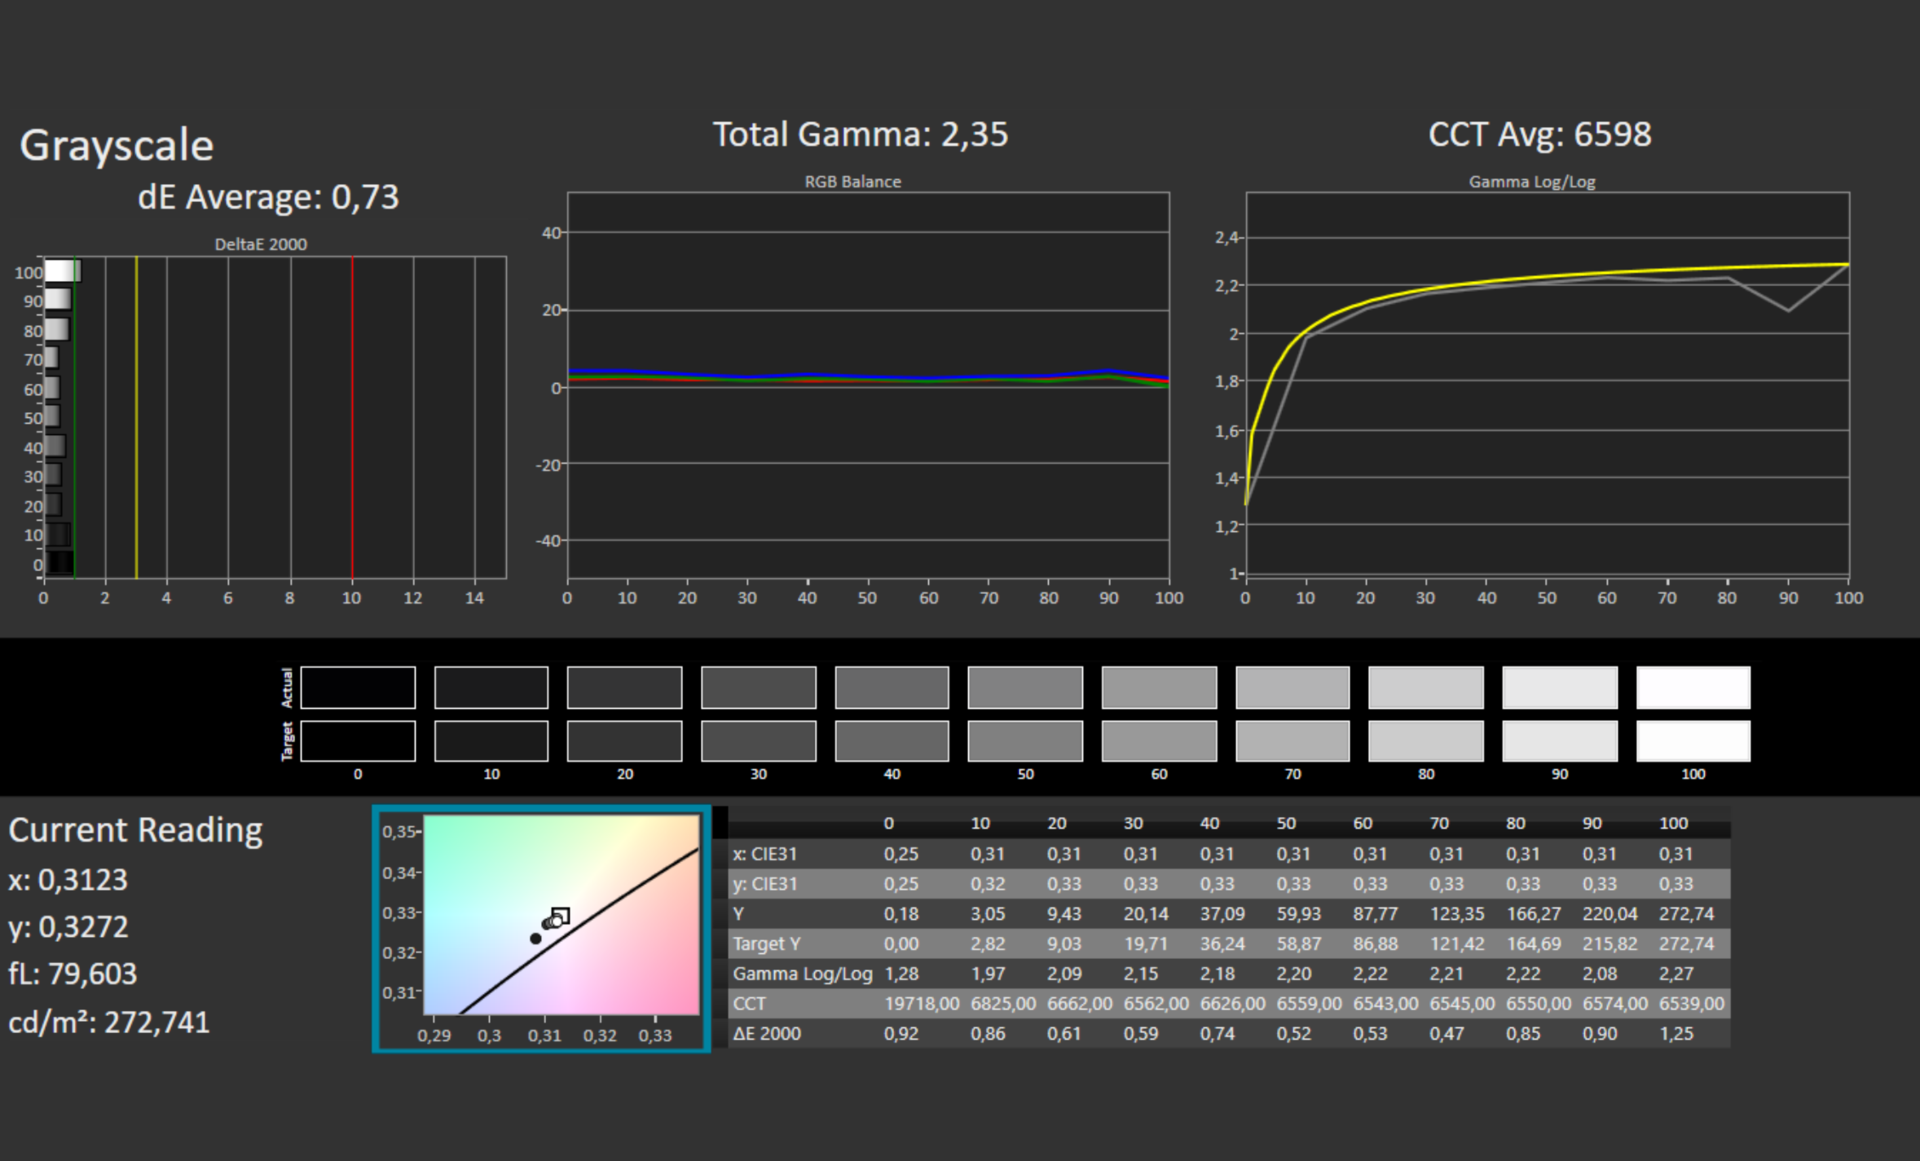
ΔE Greyscale Calman: 2.28 | ∀{0.09-98 Ø4.96}
38.7% AdobeRGB 1998 (Argyll 3D)
56.3% sRGB (Argyll 3D)
37.47% Display P3 (Argyll 3D)
Gamma: 2.48
CCT: 6820 K
| Lenovo ThinkPad L13 Gen2-21AB000PGE IVO M133NWF4 RA, IPS, 1920x1080, 13.3" | Lenovo ThinkPad L13 Gen2-20VH0017GE B133HAN06.6, IPS, 1920x1080, 13.3" | Lenovo ThinkPad L13 Yoga Gen2-20VK000VGE N133HCE-EP2, IPS, 1920x1080, 13.3" | Dell Inspiron 13 7306-6TYH5 AUO2B2B, IPS-Grade, 3840x2160, 13.3" | Lenovo ThinkPad X13 G2 AMD 20XH001KGE NV133WUM-N61, IPS LED, 1920x1200, 13.3" | HP Pavilion Aero 13 be0097nr AU Optronics AUO6496, IPS, 1920x1200, 13.3" | |
|---|---|---|---|---|---|---|
| Display | 13% | 81% | 66% | 83% | 89% | |
| Display P3 Coverage (%) | 37.47 | 42.49 13% | 68.5 83% | 63.8 70% | 70.1 87% | 73.4 96% |
| sRGB Coverage (%) | 56.3 | 99.4 77% | 90.9 61% | 99.4 77% | 99.8 77% | |
| AdobeRGB 1998 Coverage (%) | 38.7 | 43.92 13% | 70.7 83% | 64.9 68% | 71.3 84% | 74.8 93% |
| Response Times | -1% | 8% | -1% | 32% | 9% | |
| Response Time Grey 50% / Grey 80% * (ms) | 49.2 ? | 52.4 ? -7% | 44.4 ? 10% | 52 ? -6% | 34 ? 31% | 42.4 ? 14% |
| Response Time Black / White * (ms) | 32.8 ? | 31.2 ? 5% | 31.2 ? 5% | 31 ? 5% | 22 ? 33% | 31.6 ? 4% |
| PWM Frequency (Hz) | 25000 ? | |||||
| Screen | -28% | 22% | -5% | 25% | 19% | |
| Brightness middle (cd/m²) | 294 | 244 -17% | 316 7% | 312 6% | 309 5% | 473.9 61% |
| Brightness (cd/m²) | 273 | 237 -13% | 299 10% | 313 15% | 297 9% | 458 68% |
| Brightness Distribution (%) | 87 | 93 7% | 92 6% | 95 9% | 81 -7% | 91 5% |
| Black Level * (cd/m²) | 0.275 | 0.21 24% | 0.25 9% | 0.29 -5% | 0.26 5% | 0.36 -31% |
| Contrast (:1) | 1069 | 1162 9% | 1264 18% | 1076 1% | 1188 11% | 1316 23% |
| Colorchecker dE 2000 * | 3.81 | 4.7 -23% | 1.7 55% | 3.91 -3% | 1.6 58% | 2.99 22% |
| Colorchecker dE 2000 max. * | 6.22 | 17.7 -185% | 3.8 39% | 6.83 -10% | 3 52% | 4.35 30% |
| Colorchecker dE 2000 calibrated * | 3.29 | 4.3 -31% | 0.7 79% | 0.8 76% | 1.1 67% | |
| Greyscale dE 2000 * | 2.28 | 2.8 -23% | 2.8 -23% | 3.42 -50% | 2 12% | 4 -75% |
| Gamma | 2.48 89% | 2.24 98% | 2.25 98% | 2.18 101% | 2.24 98% | 2.35 94% |
| CCT | 6820 95% | 6259 104% | 6654 98% | 6194 105% | 6315 103% | 6269 104% |
| Color Space (Percent of AdobeRGB 1998) (%) | 40.3 | 64.5 | ||||
| Color Space (Percent of sRGB) (%) | 63 | 99.4 | ||||
| Total Average (Program / Settings) | -5% /
-18% | 37% /
33% | 20% /
12% | 47% /
38% | 39% /
32% |
* ... smaller is better
The black value of 0.275 cd/m² and the resulting contrast of 1069:1 is good and is in the middle of the class comparison. The resolution is perfectly fine for a 13.3-inch diagonal, but with a PPI value of 166, it cannot be called ultra-high-resolution. The advantage of this is that it avoids scaling, although you need good eyes for that. The tester preferred 125 percent here.
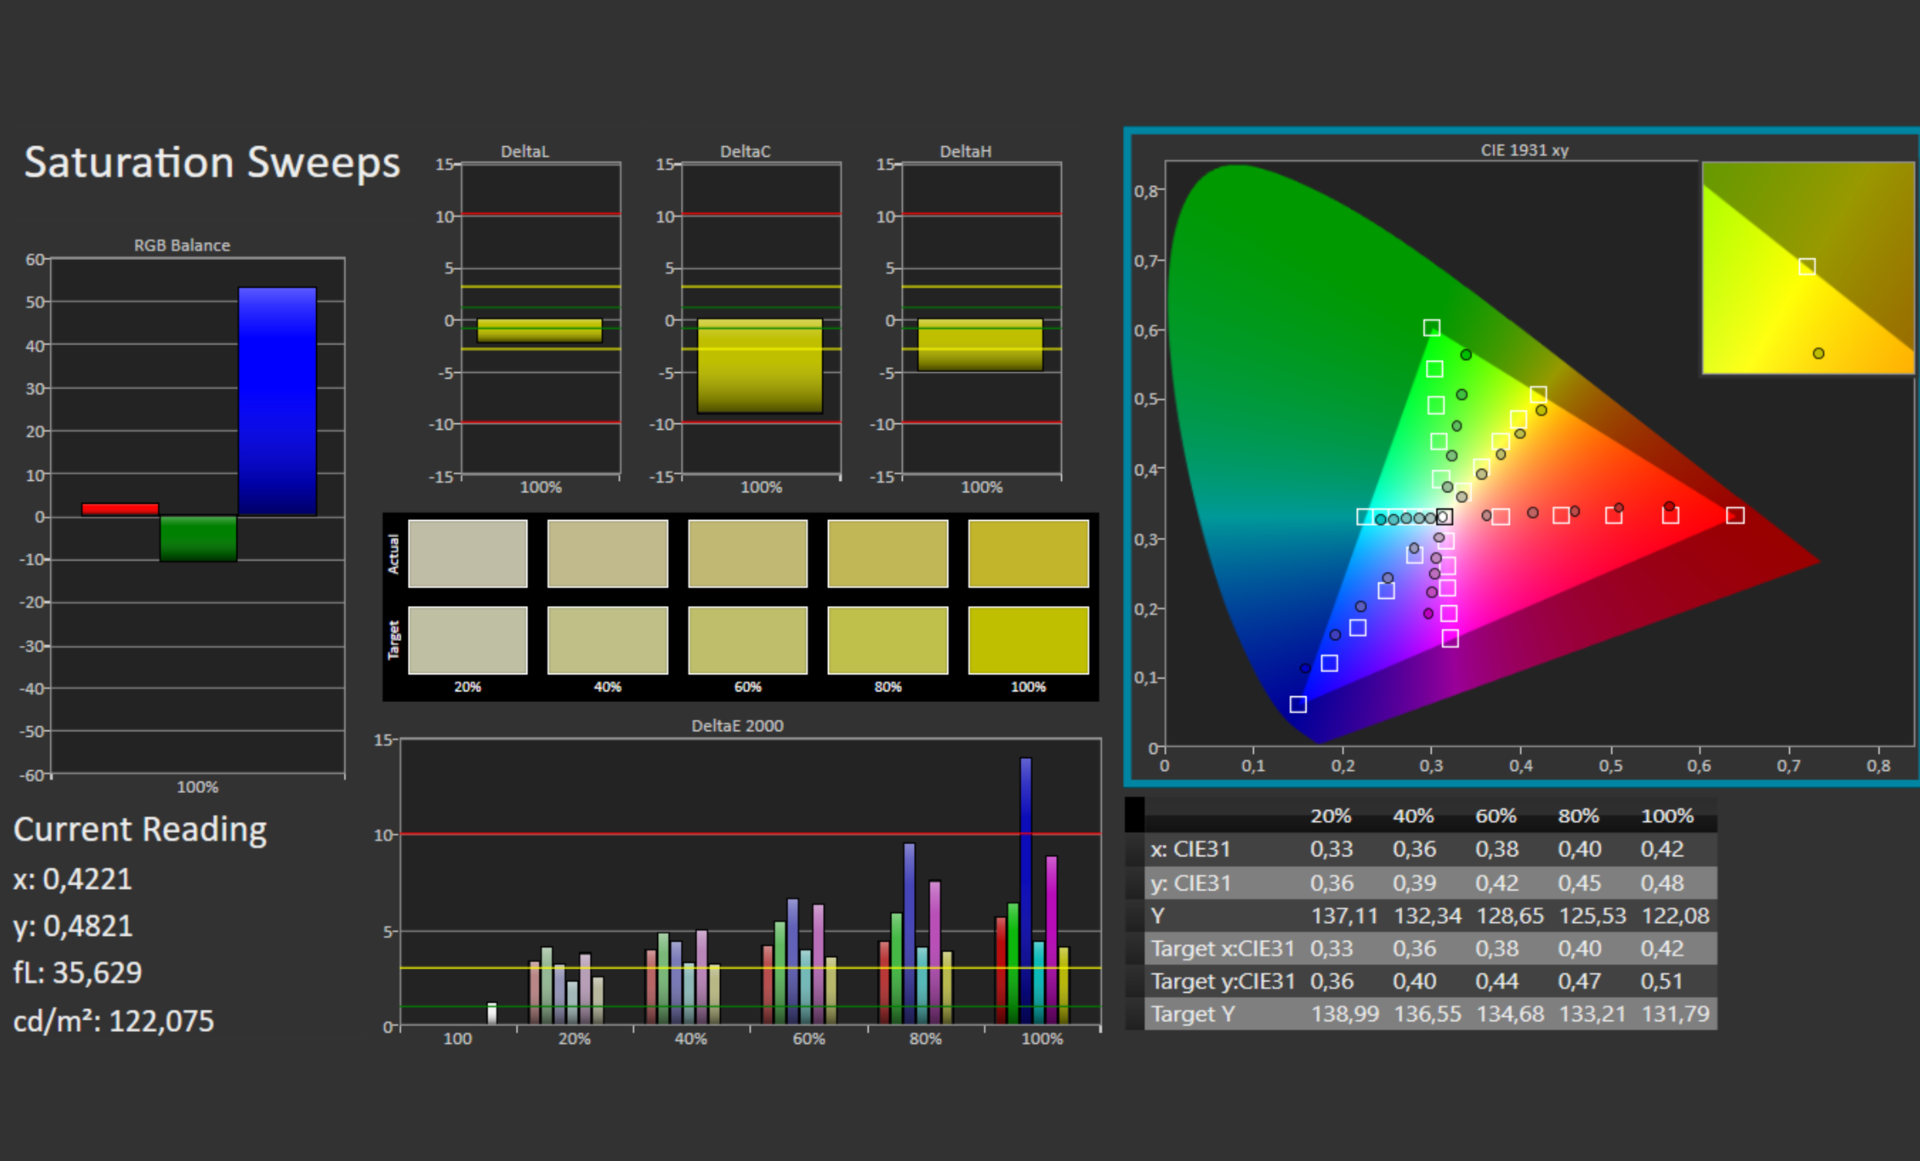
Our analysis also revealed that the panel cannot display colors accurately. Together with the low color space coverage (sRGB only 56%), the panel is therefore not suitable for editing pictures/videos. However, there are no restrictions for normal office use. All comparison models, such as the L13 Yoga Gen2 perform much better with a 90% to 99% coverage of the sRGB color space. Subjectively, the display image was very pleasant in all scenarios (office, Internet, videos, pictures).

Display Response Times
| ↔ Response Time Black to White | ||
|---|---|---|
| 32.8 ms ... rise ↗ and fall ↘ combined | ↗ 17.8 ms rise |  |
| ↘ 15 ms fall | ||
| The screen shows slow response rates in our tests and will be unsatisfactory for gamers. In comparison, all tested devices range from 0.1 (minimum) to 240 (maximum) ms. » 88 % of all devices are better. This means that the measured response time is worse than the average of all tested devices (19.8 ms). | ||
| ↔ Response Time 50% Grey to 80% Grey | ||
| 49.2 ms ... rise ↗ and fall ↘ combined | ↗ 23.4 ms rise |  |
| ↘ 25.8 ms fall | ||
| The screen shows slow response rates in our tests and will be unsatisfactory for gamers. In comparison, all tested devices range from 0.165 (minimum) to 636 (maximum) ms. » 85 % of all devices are better. This means that the measured response time is worse than the average of all tested devices (30.9 ms). | ||
Screen Flickering / PWM (Pulse-Width Modulation)
| Screen flickering / PWM not detected |  | ||
In comparison: 52 % of all tested devices do not use PWM to dim the display. If PWM was detected, an average of 7741 (minimum: 5 - maximum: 343500) Hz was measured. | |||
The matte display with 273 nits brightness is definitely usable for outdoor use, but it needs a bit more brightness in direct sunlight.
The viewing angles can be described as very good, as is typical for IPS panels, even though OLEDs offer noticeably better viewing angles and some high-end IPS panels are even more "capable". However, there are no restrictions for conventional tasks.
Performance - AMD doubles Intel's CPU performance
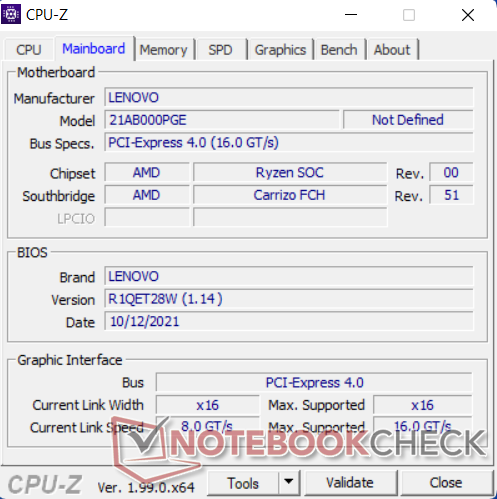
Our test device comes with the AMD Ryzen 5 PRO 5650U which leaves nothing to be desired in terms of performance for an ultrabook, since the CPU almost works at the workstation level of the last few years. Alternatively, there is an even stronger processor with another two cores, AMD's Ryzen 7 PRO 5850U which is also used in mobile workstations, such as the ThinkPad P14s G2 for example.
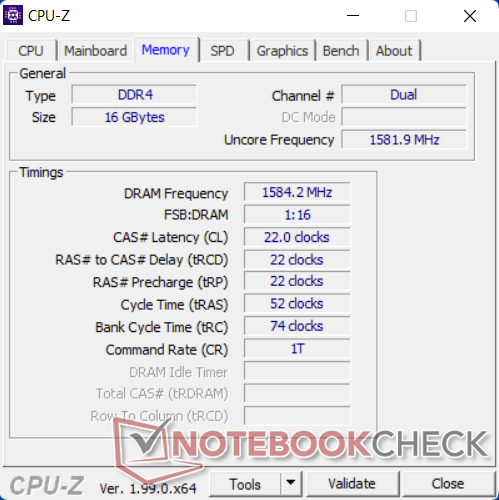
A Ryzen 3 5450U with "only" four CPU cores is also possible and is already sufficient for most tasks, while it should be noticeably easy on the wallet. The ThinkPad L13 Gen2 is available with 8 GB or 16 GB of soldered working memory, whereby 8 GB is only enough for lighter office work and surfing. With the predecessor, the ThinkPad L390, 64 GB was still possible by upgrading via two RAM slots.
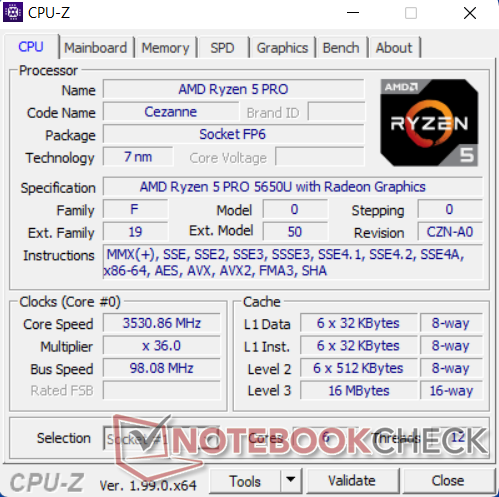
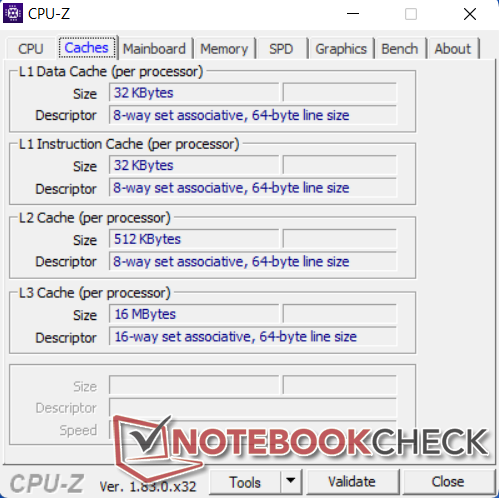
Processor
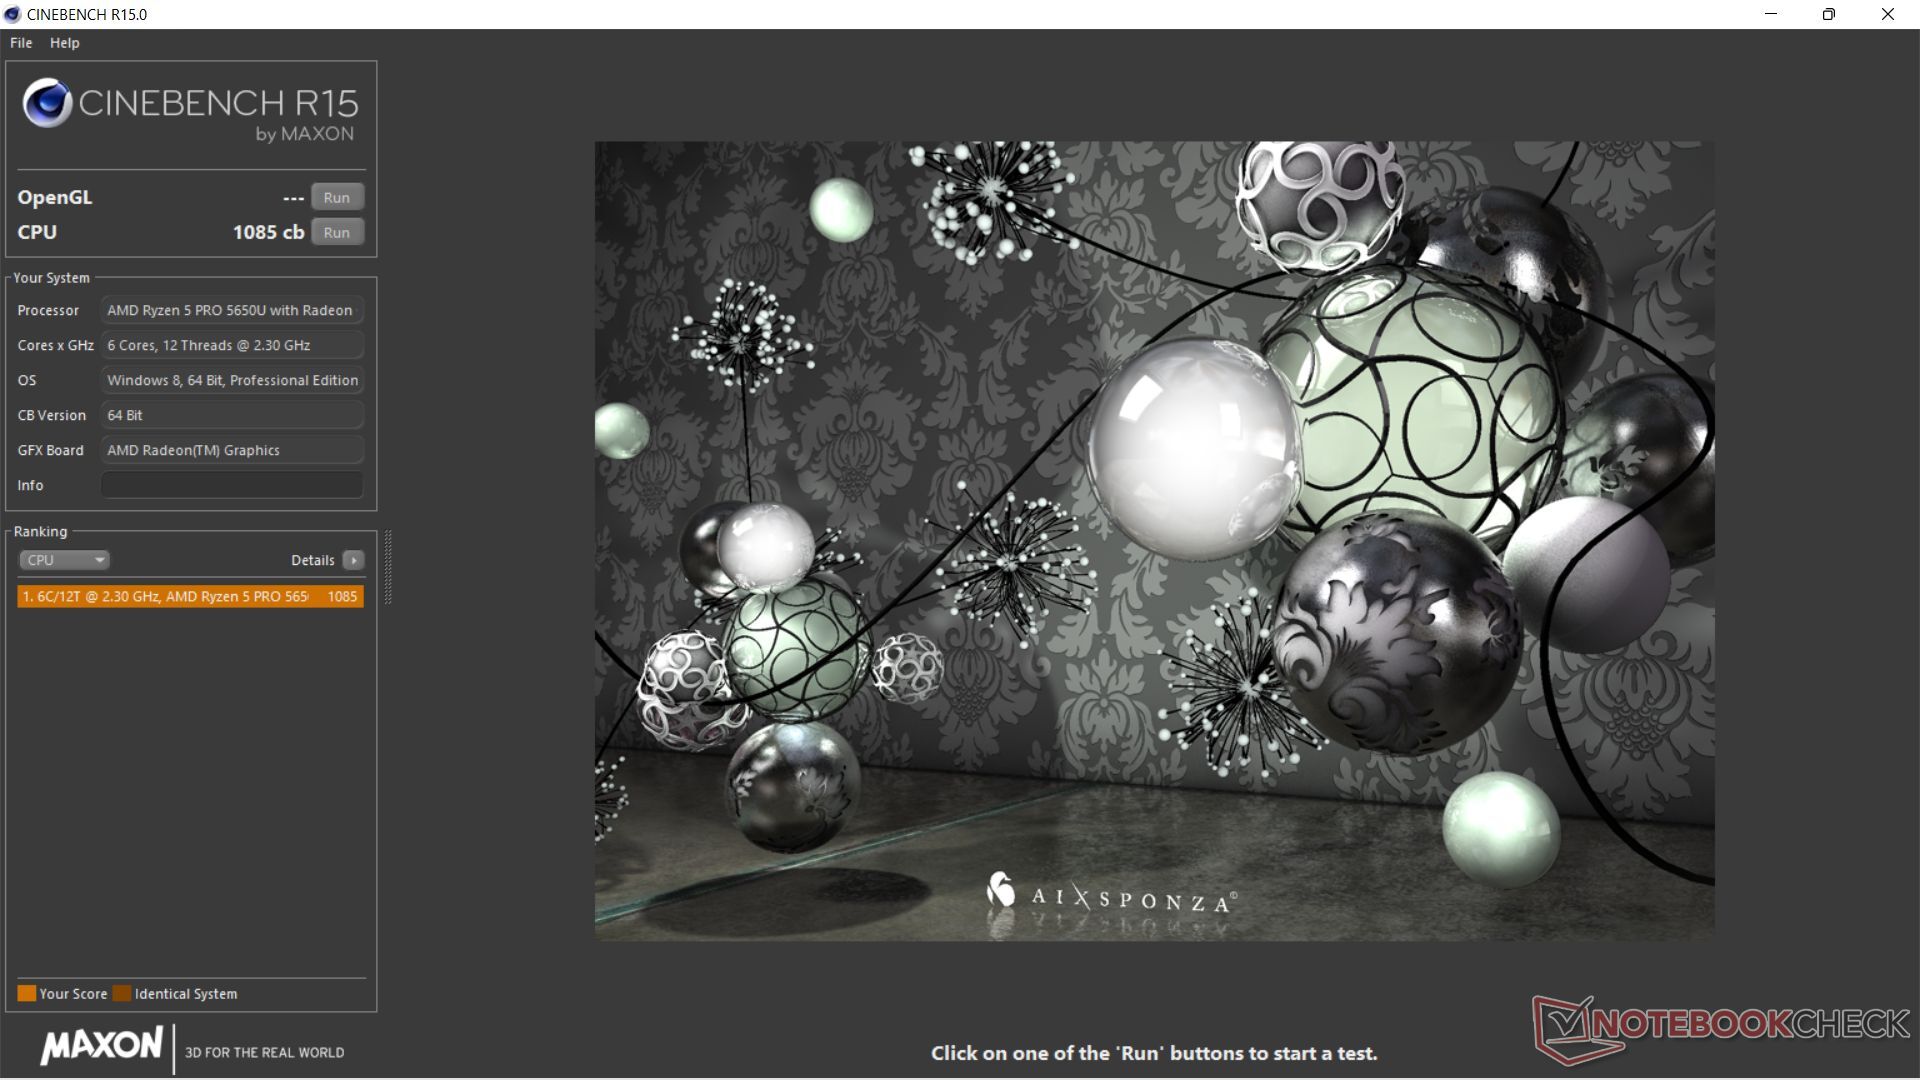
The Ryzen 5 PRO 5650U is a six-core processor with AMD's Zen 3 architecture and a Vega-7 graphics chip. The six CPU cores clock with a frequency of up to 2.3 to 4.2 GHz. In the Cinebench R15 multi-thread benchmark, the clock is briefly at 3.6 GHz (30 watts), drops to around 2.65 GHz (15 watts) after some seconds and stays there for the entire test period. The performance level is thus constant, but other comparison devices like the ThinkPad X13 G2, with the same CPU, reveal about 15 percent more performance in Cinebench. In the SingleCore loop, 3.55 GHz is present with a consumption of 12.5 watts.
In the application benchmarks, you can see that the processor usually outperforms its Intel-based sister model by up to 75 to 95 percent in multi-thread benchmarks under continuous load (such as Cinebench Multi Loop), which is very impressive. Only AMD's in-house eight-core processor can clearly outperform this again in the comparison field. The CPU performance is not limited in battery mode. Rather, a TDP limit of 15 watts is set right from the start, so the full performance is not unleashed in favor of the operating volume.
Cinebench R15 Multi Endurance test
Cinebench R23: Multi Core | Single Core
Cinebench R20: CPU (Multi Core) | CPU (Single Core)
Cinebench R15: CPU Multi 64Bit | CPU Single 64Bit
Blender: v2.79 BMW27 CPU
7-Zip 18.03: 7z b 4 | 7z b 4 -mmt1
Geekbench 5.5: Multi-Core | Single-Core
HWBOT x265 Benchmark v2.2: 4k Preset
LibreOffice : 20 Documents To PDF
R Benchmark 2.5: Overall mean
| CPU Performance rating | |
| Average of class Subnotebook | |
| HP ProBook x360 435 G8 R7-5800U | |
| HP Pavilion Aero 13 be0097nr -2! | |
| Lenovo ThinkPad X13 G2 AMD 20XH001KGE | |
| Average AMD Ryzen 5 PRO 5650U | |
| HP EliteBook 845 G7 Ryzen 7 Pro 4750U -2! | |
| Lenovo ThinkPad L13 Gen2-21AB000PGE | |
| Dell Inspiron 13 7306-6TYH5 | |
| HP Elitebook x360 1040 G5 -12! | |
| Lenovo ThinkPad L13 Gen2-20VH0017GE | |
| Lenovo ThinkPad L13 Yoga Gen2-20VK000VGE | |
| Cinebench R23 / Multi Core | |
| Average of class Subnotebook (1555 - 21812, n=59, last 2 years) | |
| HP ProBook x360 435 G8 R7-5800U | |
| HP Pavilion Aero 13 be0097nr | |
| Lenovo ThinkPad X13 G2 AMD 20XH001KGE | |
| Average AMD Ryzen 5 PRO 5650U (6210 - 7140, n=3) | |
| Lenovo ThinkPad L13 Gen2-21AB000PGE | |
| Dell Inspiron 13 7306-6TYH5 | |
| Lenovo ThinkPad L13 Yoga Gen2-20VK000VGE | |
| Lenovo ThinkPad L13 Gen2-20VH0017GE | |
| Cinebench R23 / Single Core | |
| Average of class Subnotebook (358 - 2213, n=60, last 2 years) | |
| Dell Inspiron 13 7306-6TYH5 | |
| HP ProBook x360 435 G8 R7-5800U | |
| HP Pavilion Aero 13 be0097nr | |
| Lenovo ThinkPad X13 G2 AMD 20XH001KGE | |
| Average AMD Ryzen 5 PRO 5650U (1356 - 1367, n=3) | |
| Lenovo ThinkPad L13 Gen2-20VH0017GE | |
| Lenovo ThinkPad L13 Gen2-21AB000PGE | |
| Lenovo ThinkPad L13 Yoga Gen2-20VK000VGE | |
| Cinebench R20 / CPU (Multi Core) | |
| Average of class Subnotebook (579 - 8541, n=56, last 2 years) | |
| HP ProBook x360 435 G8 R7-5800U | |
| HP EliteBook 845 G7 Ryzen 7 Pro 4750U | |
| HP Pavilion Aero 13 be0097nr | |
| Lenovo ThinkPad X13 G2 AMD 20XH001KGE | |
| Average AMD Ryzen 5 PRO 5650U (2415 - 2771, n=3) | |
| Lenovo ThinkPad L13 Gen2-21AB000PGE | |
| Dell Inspiron 13 7306-6TYH5 | |
| Lenovo ThinkPad L13 Yoga Gen2-20VK000VGE | |
| Lenovo ThinkPad L13 Gen2-20VH0017GE | |
| Lenovo ThinkPad L13 Gen2-20VH0017GE | |
| Cinebench R20 / CPU (Single Core) | |
| Average of class Subnotebook (128 - 832, n=56, last 2 years) | |
| Dell Inspiron 13 7306-6TYH5 | |
| HP ProBook x360 435 G8 R7-5800U | |
| HP Pavilion Aero 13 be0097nr | |
| Lenovo ThinkPad X13 G2 AMD 20XH001KGE | |
| Average AMD Ryzen 5 PRO 5650U (524 - 533, n=3) | |
| Lenovo ThinkPad L13 Gen2-21AB000PGE | |
| Lenovo ThinkPad L13 Gen2-20VH0017GE | |
| Lenovo ThinkPad L13 Gen2-20VH0017GE | |
| Lenovo ThinkPad L13 Yoga Gen2-20VK000VGE | |
| HP EliteBook 845 G7 Ryzen 7 Pro 4750U | |
| Blender / v2.79 BMW27 CPU | |
| Lenovo ThinkPad L13 Gen2-20VH0017GE | |
| Lenovo ThinkPad L13 Gen2-20VH0017GE | |
| Lenovo ThinkPad L13 Yoga Gen2-20VK000VGE | |
| Dell Inspiron 13 7306-6TYH5 | |
| Lenovo ThinkPad L13 Gen2-21AB000PGE | |
| Average AMD Ryzen 5 PRO 5650U (422 - 455, n=3) | |
| Lenovo ThinkPad X13 G2 AMD 20XH001KGE | |
| Average of class Subnotebook (159 - 2271, n=57, last 2 years) | |
| HP EliteBook 845 G7 Ryzen 7 Pro 4750U | |
| HP Pavilion Aero 13 be0097nr | |
| HP ProBook x360 435 G8 R7-5800U | |
| 7-Zip 18.03 / 7z b 4 -mmt1 | |
| Average of class Subnotebook (2643 - 6699, n=58, last 2 years) | |
| HP Pavilion Aero 13 be0097nr | |
| HP ProBook x360 435 G8 R7-5800U | |
| Dell Inspiron 13 7306-6TYH5 | |
| Lenovo ThinkPad X13 G2 AMD 20XH001KGE | |
| Average AMD Ryzen 5 PRO 5650U (5021 - 5081, n=3) | |
| Lenovo ThinkPad L13 Gen2-21AB000PGE | |
| Lenovo ThinkPad L13 Gen2-20VH0017GE | |
| Lenovo ThinkPad L13 Gen2-20VH0017GE | |
| Lenovo ThinkPad L13 Yoga Gen2-20VK000VGE | |
| HP EliteBook 845 G7 Ryzen 7 Pro 4750U | |
| Geekbench 5.5 / Multi-Core | |
| Average of class Subnotebook (2557 - 17218, n=49, last 2 years) | |
| HP EliteBook 845 G7 Ryzen 7 Pro 4750U | |
| HP ProBook x360 435 G8 R7-5800U | |
| Dell Inspiron 13 7306-6TYH5 | |
| Lenovo ThinkPad X13 G2 AMD 20XH001KGE | |
| Average AMD Ryzen 5 PRO 5650U (5634 - 5788, n=3) | |
| Lenovo ThinkPad L13 Gen2-21AB000PGE | |
| Lenovo ThinkPad L13 Gen2-20VH0017GE | |
| Lenovo ThinkPad L13 Gen2-20VH0017GE | |
| Lenovo ThinkPad L13 Yoga Gen2-20VK000VGE | |
| Geekbench 5.5 / Single-Core | |
| Average of class Subnotebook (726 - 2224, n=49, last 2 years) | |
| Dell Inspiron 13 7306-6TYH5 | |
| HP ProBook x360 435 G8 R7-5800U | |
| Lenovo ThinkPad L13 Yoga Gen2-20VK000VGE | |
| Lenovo ThinkPad L13 Gen2-20VH0017GE | |
| Lenovo ThinkPad L13 Gen2-20VH0017GE | |
| Average AMD Ryzen 5 PRO 5650U (1352 - 1384, n=3) | |
| Lenovo ThinkPad X13 G2 AMD 20XH001KGE | |
| Lenovo ThinkPad L13 Gen2-21AB000PGE | |
| HP EliteBook 845 G7 Ryzen 7 Pro 4750U | |
| HWBOT x265 Benchmark v2.2 / 4k Preset | |
| Average of class Subnotebook (0.97 - 25.1, n=56, last 2 years) | |
| HP ProBook x360 435 G8 R7-5800U | |
| HP Pavilion Aero 13 be0097nr | |
| HP EliteBook 845 G7 Ryzen 7 Pro 4750U | |
| Lenovo ThinkPad X13 G2 AMD 20XH001KGE | |
| Average AMD Ryzen 5 PRO 5650U (8.36 - 9.27, n=3) | |
| Lenovo ThinkPad L13 Gen2-21AB000PGE | |
| Dell Inspiron 13 7306-6TYH5 | |
| Lenovo ThinkPad L13 Yoga Gen2-20VK000VGE | |
| Lenovo ThinkPad L13 Gen2-20VH0017GE | |
| Lenovo ThinkPad L13 Gen2-20VH0017GE | |
| LibreOffice / 20 Documents To PDF | |
| HP EliteBook 845 G7 Ryzen 7 Pro 4750U | |
| HP ProBook x360 435 G8 R7-5800U | |
| Lenovo ThinkPad L13 Gen2-21AB000PGE | |
| Average of class Subnotebook (39.9 - 220, n=55, last 2 years) | |
| Lenovo ThinkPad L13 Yoga Gen2-20VK000VGE | |
| HP Pavilion Aero 13 be0097nr | |
| Lenovo ThinkPad X13 G2 AMD 20XH001KGE | |
| Average AMD Ryzen 5 PRO 5650U (35.3 - 57.6, n=4) | |
| Lenovo ThinkPad L13 Gen2-20VH0017GE | |
| Lenovo ThinkPad L13 Gen2-20VH0017GE | |
| Dell Inspiron 13 7306-6TYH5 | |
| R Benchmark 2.5 / Overall mean | |
| Lenovo ThinkPad L13 Yoga Gen2-20VK000VGE | |
| Lenovo ThinkPad L13 Gen2-20VH0017GE | |
| Lenovo ThinkPad L13 Gen2-20VH0017GE | |
| HP EliteBook 845 G7 Ryzen 7 Pro 4750U | |
| Dell Inspiron 13 7306-6TYH5 | |
| Lenovo ThinkPad L13 Gen2-21AB000PGE | |
| Average AMD Ryzen 5 PRO 5650U (0.555 - 0.569, n=3) | |
| Lenovo ThinkPad X13 G2 AMD 20XH001KGE | |
| HP ProBook x360 435 G8 R7-5800U | |
| HP Pavilion Aero 13 be0097nr | |
| Average of class Subnotebook (0.4024 - 1.456, n=57, last 2 years) | |
* ... smaller is better
AIDA64: FP32 Ray-Trace | FPU Julia | CPU SHA3 | CPU Queen | FPU SinJulia | FPU Mandel | CPU AES | CPU ZLib | FP64 Ray-Trace | CPU PhotoWorxx
| Performance rating | |
| Average of class Subnotebook | |
| HP Pavilion Aero 13 be0097nr | |
| HP ProBook x360 435 G8 R7-5800U | |
| Lenovo ThinkPad X13 G2 AMD 20XH001KGE | |
| Average AMD Ryzen 5 PRO 5650U | |
| Lenovo ThinkPad L13 Gen2-21AB000PGE | |
| Dell Inspiron 13 7306-6TYH5 | |
| Lenovo ThinkPad L13 Gen2-20VH0017GE | |
| Lenovo ThinkPad L13 Yoga Gen2-20VK000VGE | |
| AIDA64 / FP32 Ray-Trace | |
| Average of class Subnotebook (1135 - 32888, n=57, last 2 years) | |
| HP ProBook x360 435 G8 R7-5800U | |
| HP Pavilion Aero 13 be0097nr | |
| Lenovo ThinkPad X13 G2 AMD 20XH001KGE | |
| Average AMD Ryzen 5 PRO 5650U (7205 - 8274, n=3) | |
| Lenovo ThinkPad L13 Gen2-21AB000PGE | |
| Lenovo ThinkPad L13 Gen2-20VH0017GE | |
| Lenovo ThinkPad L13 Gen2-20VH0017GE | |
| Dell Inspiron 13 7306-6TYH5 | |
| Lenovo ThinkPad L13 Yoga Gen2-20VK000VGE | |
| AIDA64 / FPU Julia | |
| HP ProBook x360 435 G8 R7-5800U | |
| HP Pavilion Aero 13 be0097nr | |
| Average of class Subnotebook (5218 - 123315, n=57, last 2 years) | |
| Lenovo ThinkPad X13 G2 AMD 20XH001KGE | |
| Average AMD Ryzen 5 PRO 5650U (46649 - 53123, n=3) | |
| Lenovo ThinkPad L13 Gen2-21AB000PGE | |
| Dell Inspiron 13 7306-6TYH5 | |
| Lenovo ThinkPad L13 Gen2-20VH0017GE | |
| Lenovo ThinkPad L13 Gen2-20VH0017GE | |
| Lenovo ThinkPad L13 Yoga Gen2-20VK000VGE | |
| AIDA64 / CPU SHA3 | |
| Average of class Subnotebook (444 - 5287, n=57, last 2 years) | |
| HP ProBook x360 435 G8 R7-5800U | |
| HP Pavilion Aero 13 be0097nr | |
| Dell Inspiron 13 7306-6TYH5 | |
| Lenovo ThinkPad X13 G2 AMD 20XH001KGE | |
| Lenovo ThinkPad L13 Gen2-20VH0017GE | |
| Lenovo ThinkPad L13 Gen2-20VH0017GE | |
| Average AMD Ryzen 5 PRO 5650U (1553 - 1829, n=3) | |
| Lenovo ThinkPad L13 Yoga Gen2-20VK000VGE | |
| Lenovo ThinkPad L13 Gen2-21AB000PGE | |
| AIDA64 / CPU Queen | |
| HP Pavilion Aero 13 be0097nr | |
| HP ProBook x360 435 G8 R7-5800U | |
| Average AMD Ryzen 5 PRO 5650U (67818 - 70596, n=3) | |
| Lenovo ThinkPad L13 Gen2-21AB000PGE | |
| Lenovo ThinkPad X13 G2 AMD 20XH001KGE | |
| Average of class Subnotebook (10579 - 95002, n=47, last 2 years) | |
| Dell Inspiron 13 7306-6TYH5 | |
| Lenovo ThinkPad L13 Yoga Gen2-20VK000VGE | |
| Lenovo ThinkPad L13 Gen2-20VH0017GE | |
| Lenovo ThinkPad L13 Gen2-20VH0017GE | |
| AIDA64 / FPU SinJulia | |
| HP ProBook x360 435 G8 R7-5800U | |
| HP Pavilion Aero 13 be0097nr | |
| Lenovo ThinkPad X13 G2 AMD 20XH001KGE | |
| Average AMD Ryzen 5 PRO 5650U (7289 - 7931, n=3) | |
| Lenovo ThinkPad L13 Gen2-21AB000PGE | |
| Average of class Subnotebook (744 - 18418, n=57, last 2 years) | |
| Lenovo ThinkPad L13 Gen2-20VH0017GE | |
| Lenovo ThinkPad L13 Gen2-20VH0017GE | |
| Dell Inspiron 13 7306-6TYH5 | |
| Lenovo ThinkPad L13 Yoga Gen2-20VK000VGE | |
| AIDA64 / FPU Mandel | |
| HP ProBook x360 435 G8 R7-5800U | |
| HP Pavilion Aero 13 be0097nr | |
| Average of class Subnotebook (3341 - 65433, n=57, last 2 years) | |
| Lenovo ThinkPad X13 G2 AMD 20XH001KGE | |
| Average AMD Ryzen 5 PRO 5650U (25763 - 29311, n=3) | |
| Lenovo ThinkPad L13 Gen2-21AB000PGE | |
| Dell Inspiron 13 7306-6TYH5 | |
| Lenovo ThinkPad L13 Gen2-20VH0017GE | |
| Lenovo ThinkPad L13 Gen2-20VH0017GE | |
| Lenovo ThinkPad L13 Yoga Gen2-20VK000VGE | |
| AIDA64 / CPU AES | |
| HP Pavilion Aero 13 be0097nr | |
| Lenovo ThinkPad X13 G2 AMD 20XH001KGE | |
| Dell Inspiron 13 7306-6TYH5 | |
| Lenovo ThinkPad L13 Gen2-20VH0017GE | |
| Lenovo ThinkPad L13 Gen2-20VH0017GE | |
| Lenovo ThinkPad L13 Yoga Gen2-20VK000VGE | |
| Average AMD Ryzen 5 PRO 5650U (27927 - 73719, n=3) | |
| Average of class Subnotebook (638 - 96917, n=57, last 2 years) | |
| HP ProBook x360 435 G8 R7-5800U | |
| Lenovo ThinkPad L13 Gen2-21AB000PGE | |
| AIDA64 / CPU ZLib | |
| Average of class Subnotebook (164.9 - 1379, n=57, last 2 years) | |
| HP ProBook x360 435 G8 R7-5800U | |
| HP Pavilion Aero 13 be0097nr | |
| Lenovo ThinkPad X13 G2 AMD 20XH001KGE | |
| Average AMD Ryzen 5 PRO 5650U (414 - 473, n=3) | |
| Lenovo ThinkPad L13 Gen2-21AB000PGE | |
| Dell Inspiron 13 7306-6TYH5 | |
| Lenovo ThinkPad L13 Gen2-20VH0017GE | |
| Lenovo ThinkPad L13 Gen2-20VH0017GE | |
| Lenovo ThinkPad L13 Yoga Gen2-20VK000VGE | |
| AIDA64 / FP64 Ray-Trace | |
| Average of class Subnotebook (610 - 17495, n=57, last 2 years) | |
| HP ProBook x360 435 G8 R7-5800U | |
| HP Pavilion Aero 13 be0097nr | |
| Lenovo ThinkPad X13 G2 AMD 20XH001KGE | |
| Average AMD Ryzen 5 PRO 5650U (3893 - 4383, n=3) | |
| Lenovo ThinkPad L13 Gen2-21AB000PGE | |
| Lenovo ThinkPad L13 Gen2-20VH0017GE | |
| Lenovo ThinkPad L13 Gen2-20VH0017GE | |
| Dell Inspiron 13 7306-6TYH5 | |
| Lenovo ThinkPad L13 Yoga Gen2-20VK000VGE | |
| AIDA64 / CPU PhotoWorxx | |
| Average of class Subnotebook (6569 - 85600, n=57, last 2 years) | |
| Dell Inspiron 13 7306-6TYH5 | |
| Lenovo ThinkPad L13 Gen2-20VH0017GE | |
| Lenovo ThinkPad L13 Gen2-20VH0017GE | |
| Lenovo ThinkPad L13 Yoga Gen2-20VK000VGE | |
| Lenovo ThinkPad X13 G2 AMD 20XH001KGE | |
| Average AMD Ryzen 5 PRO 5650U (14215 - 17421, n=3) | |
| HP Pavilion Aero 13 be0097nr | |
| Lenovo ThinkPad L13 Gen2-21AB000PGE | |
| HP ProBook x360 435 G8 R7-5800U | |
System performance
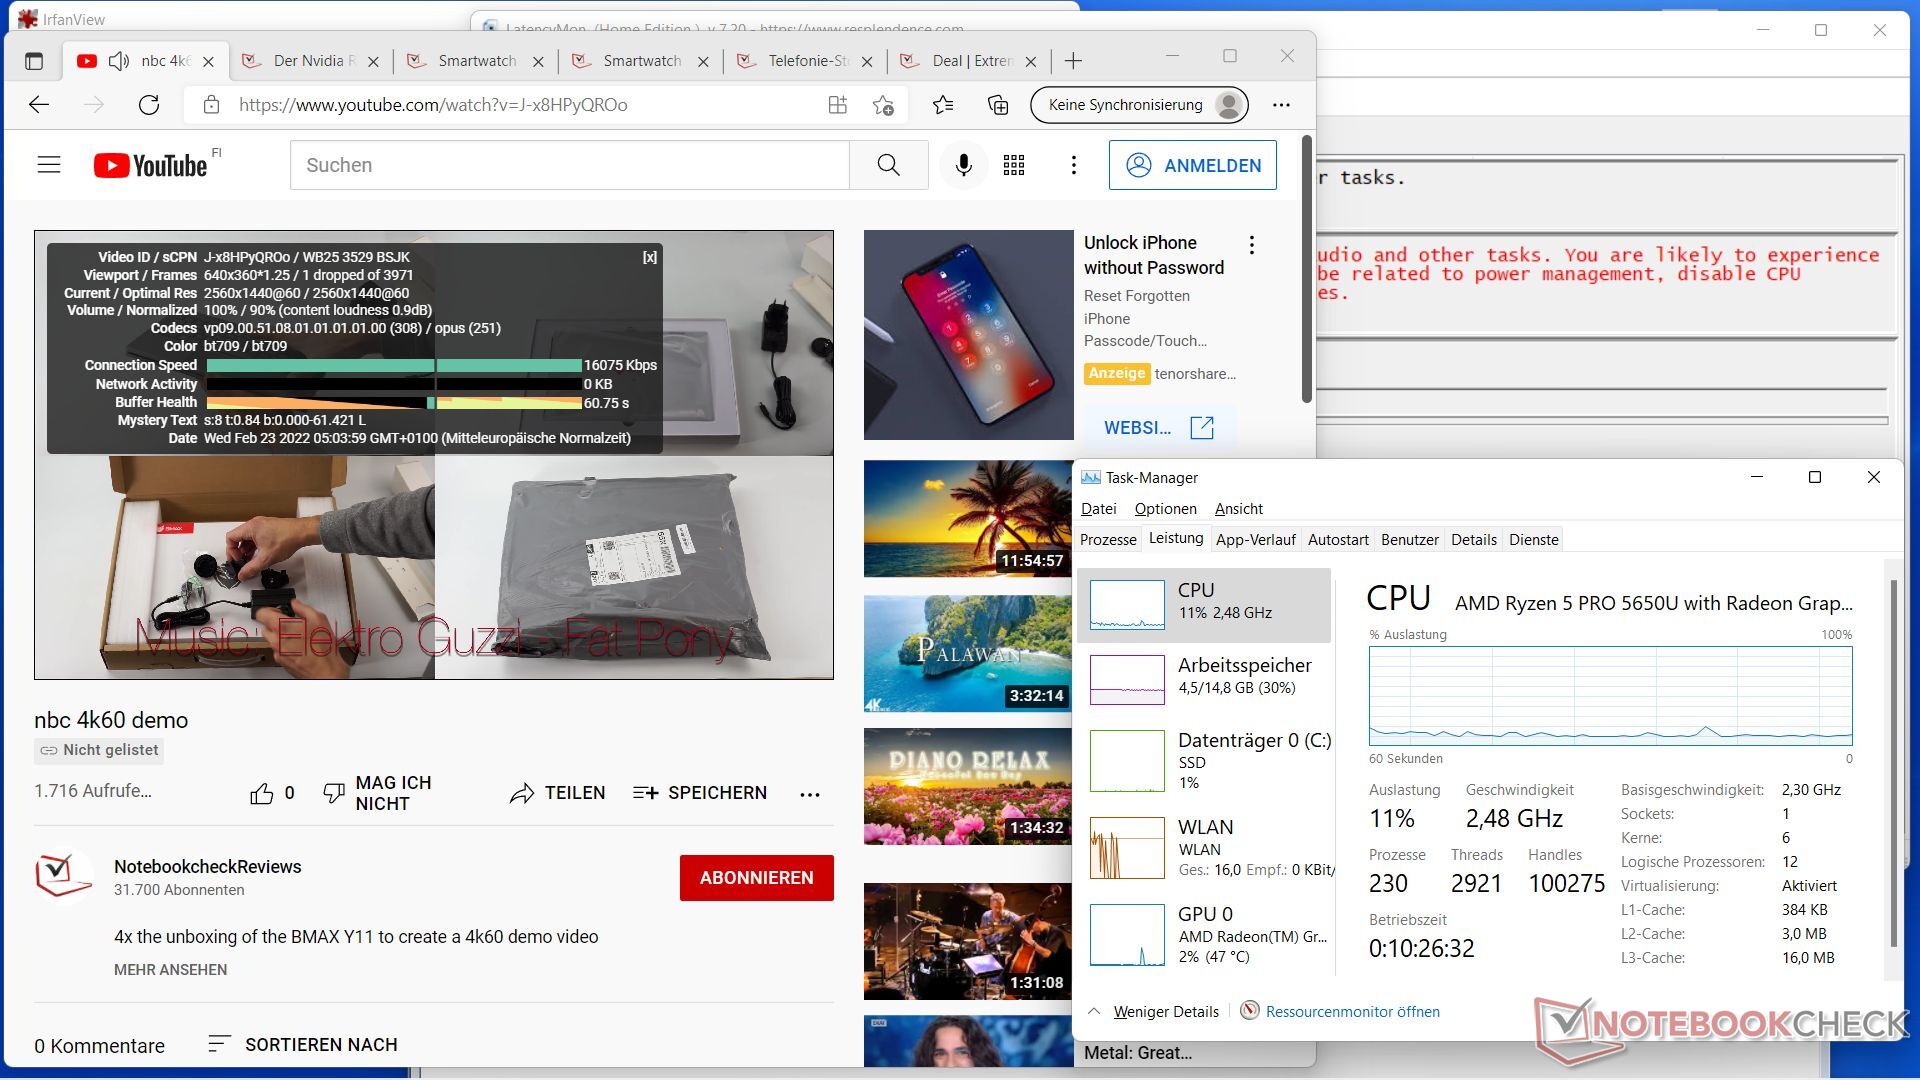
The system performance in the PCMark test as well as in subjective working and browsing, even with demanding applications in multitasking including playing 4K videos, is on the expected level.
Almost everything runs without lags and subjectively, even current high-end workstations did not seem faster to the tester, but on the contrary, AMD systems are generally a bit faster in terms of interaction with Windows interfaces and browsing. However, this experience remains subjective and can have special backgrounds like AMD's GPU drivers, which "optically" display everything very smoothly and without delays according to the tester's experience.
Only Apple's M1-based laptops within macOS were found to be slightly snappier, but not by much either. 4K videos cause just a CPU load of 6 percent, for comparison: A Core i9-10885H in a ThinkPad P1 G3 (without dGPU), which is about 50 percent faster, caused 4 percent CPU load.
| PCMark 10 / Score | |
| Average of class Subnotebook (4920 - 9939, n=46, last 2 years) | |
| HP Pavilion Aero 13 be0097nr | |
| Lenovo ThinkPad X13 G2 AMD 20XH001KGE | |
| Average AMD Ryzen 5 PRO 5650U, AMD Radeon RX Vega 7 (5320 - 5720, n=3) | |
| HP ProBook x360 435 G8 R7-5800U | |
| Lenovo ThinkPad L13 Gen2-21AB000PGE | |
| Dell Inspiron 13 7306-6TYH5 | |
| HP EliteBook 845 G7 Ryzen 7 Pro 4750U | |
| Lenovo ThinkPad L13 Gen2-20VH0017GE | |
| Lenovo ThinkPad L13 Yoga Gen2-20VK000VGE | |
| HP Elitebook x360 1040 G5 | |
| PCMark 10 / Essentials | |
| Average of class Subnotebook (8552 - 11646, n=46, last 2 years) | |
| Lenovo ThinkPad X13 G2 AMD 20XH001KGE | |
| Average AMD Ryzen 5 PRO 5650U, AMD Radeon RX Vega 7 (9576 - 10750, n=3) | |
| Dell Inspiron 13 7306-6TYH5 | |
| HP Pavilion Aero 13 be0097nr | |
| Lenovo ThinkPad L13 Yoga Gen2-20VK000VGE | |
| Lenovo ThinkPad L13 Gen2-21AB000PGE | |
| HP ProBook x360 435 G8 R7-5800U | |
| Lenovo ThinkPad L13 Gen2-20VH0017GE | |
| HP Elitebook x360 1040 G5 | |
| HP EliteBook 845 G7 Ryzen 7 Pro 4750U | |
| PCMark 10 / Productivity | |
| Average of class Subnotebook (5435 - 16606, n=46, last 2 years) | |
| HP Pavilion Aero 13 be0097nr | |
| Lenovo ThinkPad X13 G2 AMD 20XH001KGE | |
| Average AMD Ryzen 5 PRO 5650U, AMD Radeon RX Vega 7 (8729 - 9087, n=3) | |
| Lenovo ThinkPad L13 Gen2-21AB000PGE | |
| HP ProBook x360 435 G8 R7-5800U | |
| HP EliteBook 845 G7 Ryzen 7 Pro 4750U | |
| Dell Inspiron 13 7306-6TYH5 | |
| HP Elitebook x360 1040 G5 | |
| Lenovo ThinkPad L13 Gen2-20VH0017GE | |
| Lenovo ThinkPad L13 Yoga Gen2-20VK000VGE | |
| PCMark 10 / Digital Content Creation | |
| Average of class Subnotebook (5722 - 13779, n=46, last 2 years) | |
| HP Pavilion Aero 13 be0097nr | |
| Lenovo ThinkPad X13 G2 AMD 20XH001KGE | |
| HP EliteBook 845 G7 Ryzen 7 Pro 4750U | |
| HP ProBook x360 435 G8 R7-5800U | |
| Average AMD Ryzen 5 PRO 5650U, AMD Radeon RX Vega 7 (4891 - 5495, n=3) | |
| Dell Inspiron 13 7306-6TYH5 | |
| Lenovo ThinkPad L13 Gen2-21AB000PGE | |
| Lenovo ThinkPad L13 Gen2-20VH0017GE | |
| Lenovo ThinkPad L13 Yoga Gen2-20VK000VGE | |
| HP Elitebook x360 1040 G5 | |
| PCMark 10 Score | 5320 points | |
Help | ||
| AIDA64 / Memory Copy | |
| Average of class Subnotebook (14554 - 131023, n=57, last 2 years) | |
| Dell Inspiron 13 7306-6TYH5 | |
| HP Pavilion Aero 13 be0097nr | |
| Lenovo ThinkPad L13 Gen2-20VH0017GE | |
| Lenovo ThinkPad L13 Gen2-20VH0017GE | |
| Lenovo ThinkPad L13 Gen2-21AB000PGE | |
| Average AMD Ryzen 5 PRO 5650U (31262 - 33245, n=3) | |
| Lenovo ThinkPad L13 Yoga Gen2-20VK000VGE | |
| Lenovo ThinkPad X13 G2 AMD 20XH001KGE | |
| HP ProBook x360 435 G8 R7-5800U | |
| AIDA64 / Memory Read | |
| Average of class Subnotebook (15948 - 127174, n=57, last 2 years) | |
| Dell Inspiron 13 7306-6TYH5 | |
| Lenovo ThinkPad L13 Gen2-20VH0017GE | |
| Lenovo ThinkPad L13 Gen2-20VH0017GE | |
| Lenovo ThinkPad L13 Yoga Gen2-20VK000VGE | |
| HP Pavilion Aero 13 be0097nr | |
| Lenovo ThinkPad L13 Gen2-21AB000PGE | |
| Average AMD Ryzen 5 PRO 5650U (36338 - 37610, n=3) | |
| Lenovo ThinkPad X13 G2 AMD 20XH001KGE | |
| HP ProBook x360 435 G8 R7-5800U | |
| AIDA64 / Memory Write | |
| Average of class Subnotebook (15709 - 135141, n=57, last 2 years) | |
| Dell Inspiron 13 7306-6TYH5 | |
| Lenovo ThinkPad L13 Gen2-20VH0017GE | |
| Lenovo ThinkPad L13 Gen2-20VH0017GE | |
| Lenovo ThinkPad L13 Yoga Gen2-20VK000VGE | |
| Lenovo ThinkPad L13 Gen2-21AB000PGE | |
| HP Pavilion Aero 13 be0097nr | |
| Average AMD Ryzen 5 PRO 5650U (25594 - 32670, n=3) | |
| Lenovo ThinkPad X13 G2 AMD 20XH001KGE | |
| HP ProBook x360 435 G8 R7-5800U | |
| AIDA64 / Memory Latency | |
| Lenovo ThinkPad L13 Gen2-21AB000PGE | |
| Lenovo ThinkPad X13 G2 AMD 20XH001KGE | |
| Average AMD Ryzen 5 PRO 5650U (100 - 120, n=3) | |
| Average of class Subnotebook (6.1 - 159.9, n=55, last 2 years) | |
| Dell Inspiron 13 7306-6TYH5 | |
| HP Pavilion Aero 13 be0097nr | |
| HP ProBook x360 435 G8 R7-5800U | |
| Lenovo ThinkPad L13 Gen2-20VH0017GE | |
| Lenovo ThinkPad L13 Gen2-20VH0017GE | |
| Lenovo ThinkPad L13 Yoga Gen2-20VK000VGE | |
* ... smaller is better
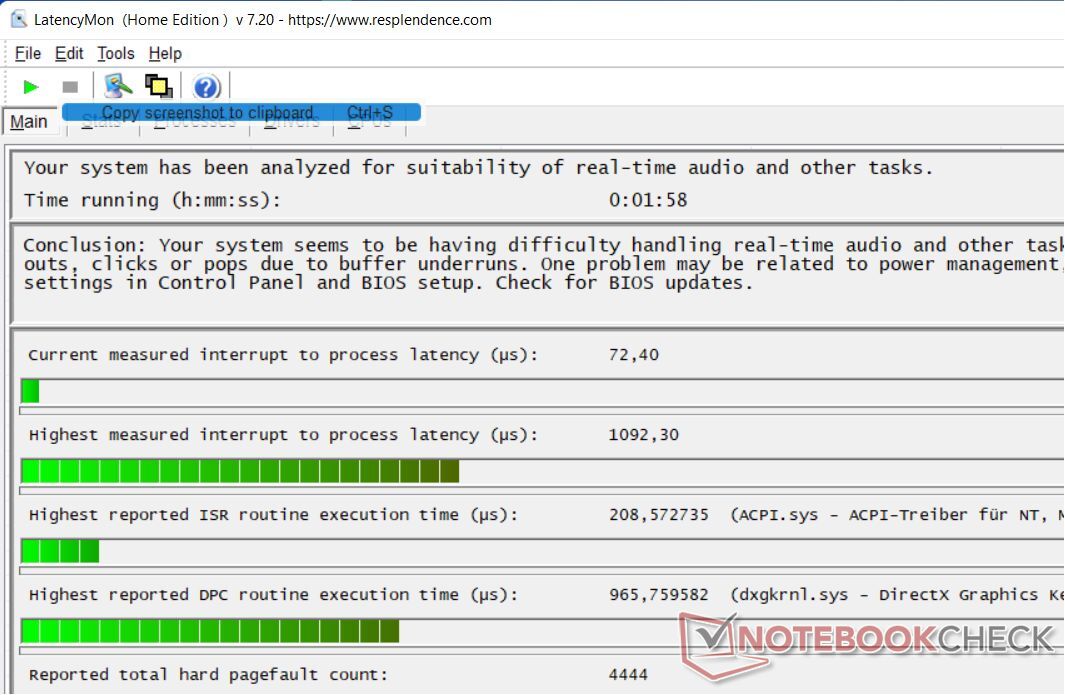
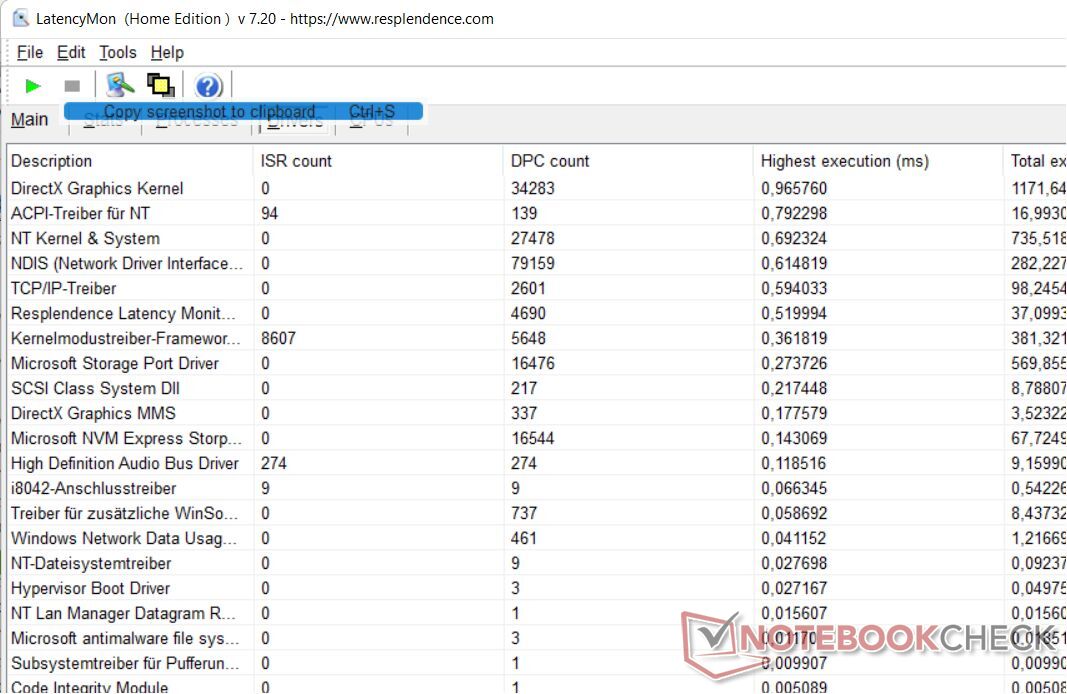
DPC latencies
The DPC latencies are generally in the green to slightly yellow range, but there could be slight delays in real-time video and audio. Responsible, besides the usual suspects (ACPI, kernel module driver), the DirectX driver as well as the network driver is listed here. Some of the competitors perform a bit better, some a lot better. Only the Intel version of the L13 Gen2 performs a bit worse.
| DPC Latencies / LatencyMon - interrupt to process latency (max), Web, Youtube, Prime95 | |
| Lenovo ThinkPad L13 Gen2-20VH0017GE | |
| Lenovo ThinkPad L13 Gen2-21AB000PGE | |
| HP Pavilion Aero 13 be0097nr | |
| Lenovo ThinkPad X13 G2 AMD 20XH001KGE | |
| Dell Inspiron 13 7306-6TYH5 | |
| Lenovo ThinkPad L13 Yoga Gen2-20VK000VGE | |
| HP ProBook x360 435 G8 R7-5800U | |
* ... smaller is better
Mass storage

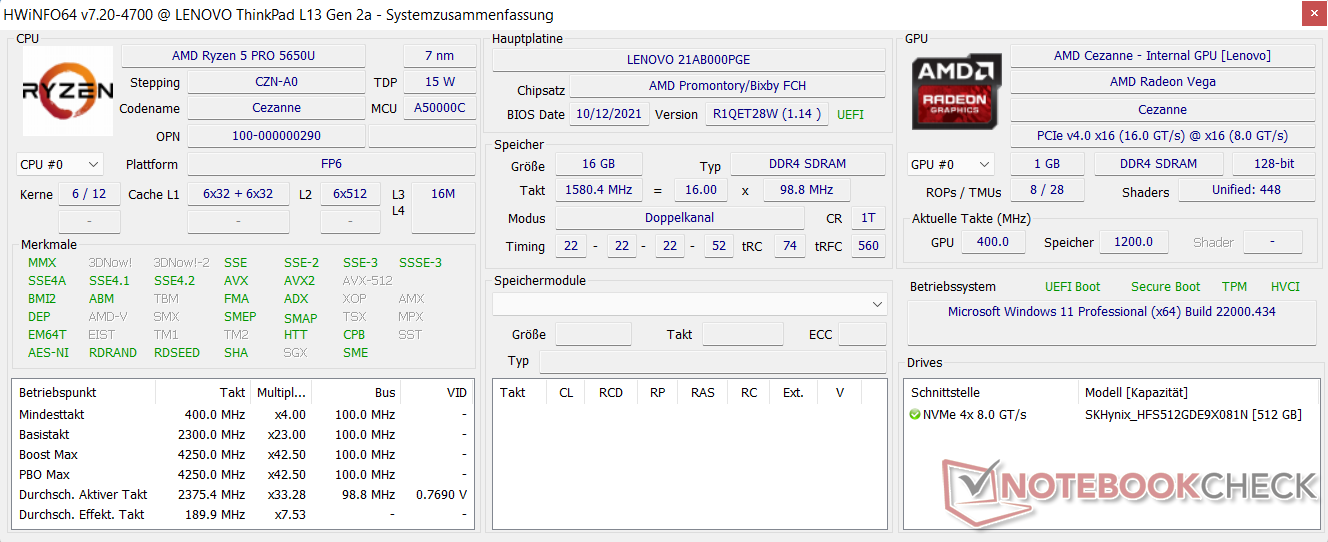
The 512 GB system drive from Hynix, which is connected with PCI-E 3.0 x4, performs very well in the tests and is only surpassed by the SSD in the ThinkPad X13 G2 beaten. However, the difference remains unnoticed in practice. In any case, it does not cause any delays in the system, apps start almost immediately and the laptop boots in no time.
More information and benchmark comparisons can be found in our hard drive and SSD table.
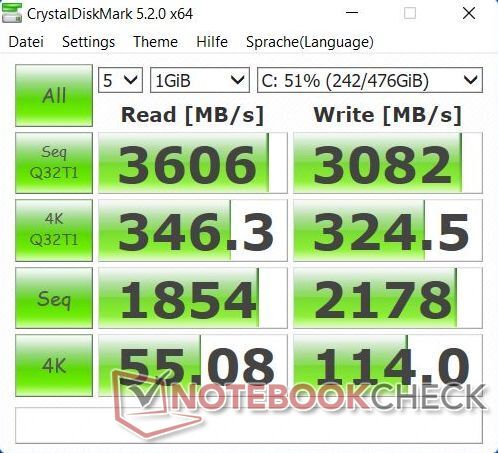
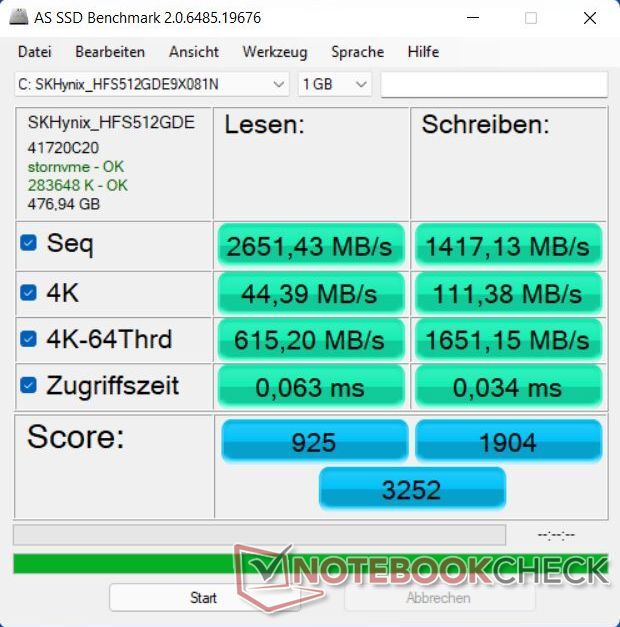
| Lenovo ThinkPad L13 Gen2-21AB000PGE Vega 7, R5 PRO 5650U, SK Hynix HFS512 GDE9X081N | Lenovo ThinkPad L13 Yoga Gen2-20VK000VGE Iris Xe G7 80EUs, i5-1135G7, WDC PC SN730 SDBPNTY-256G | Lenovo ThinkPad X13 G2 AMD 20XH001KGE Vega 7, R5 PRO 5650U, Samsung SSD PM981a MZVLB512HBJQ | HP ProBook x360 435 G8 R7-5800U Vega 8, R7 5800U, Samsung PM991 MZVLQ512HALU | HP Pavilion Aero 13 be0097nr Vega 8, R7 5800U, Intel SSD 660p SSDPEKNW512G8 | Dell Inspiron 13 7306-6TYH5 Iris Xe G7 96EUs, i7-1165G7, Toshiba KBG40ZNS512G NVMe | |
|---|---|---|---|---|---|---|
| CrystalDiskMark 5.2 / 6 | -5% | -27% | -15% | -14% | ||
| Write 4K (MB/s) | 114 | 119.7 5% | 86.7 -24% | 128.3 13% | 127 11% | |
| Read 4K (MB/s) | 55.1 | 38.54 -30% | 32.45 -41% | 50.9 -8% | 52.7 -4% | |
| Write Seq (MB/s) | 2179 | 1754 -20% | 1235 -43% | 971 -55% | ||
| Read Seq (MB/s) | 1854 | 1709 -8% | 1417 -24% | 1540 -17% | ||
| Write 4K Q32T1 (MB/s) | 324.5 | 461.9 42% | 390.8 20% | 538 66% | 312.1 -4% | |
| Read 4K Q32T1 (MB/s) | 346.3 | 390.5 13% | 291 -16% | 344.4 -1% | 445.2 29% | |
| Write Seq Q32T1 (MB/s) | 3082 | 2185 -29% | 1384 -55% | 980 -68% | 683 -78% | |
| Read Seq Q32T1 (MB/s) | 3607 | 3118 -14% | 2350 -35% | 1829 -49% | 2327 -35% | |
| Write 4K Q8T8 (MB/s) | 341.8 | |||||
| Read 4K Q8T8 (MB/s) | 658 | |||||
| AS SSD | 2% | 11% | -38% | -49% | -128% | |
| Copy Game MB/s (MB/s) | 1144 | 1360 19% | 326.7 -71% | 539 -53% | 842 -26% | |
| Copy Program MB/s (MB/s) | 444.9 | 565 27% | 132.1 -70% | 614 38% | 343 -23% | |
| Copy ISO MB/s (MB/s) | 2101 | 1855 -12% | 708 -66% | 906 -57% | 11031 425% | |
| Score Total (Points) | 3252 | 2384 -27% | 3902 20% | 1892 -42% | 1798 -45% | 2477 -24% |
| Score Write (Points) | 1904 | 941 -51% | 2086 10% | 589 -69% | 1018 -47% | 527 -72% |
| Score Read (Points) | 925 | 961 4% | 1244 34% | 879 -5% | 533 -42% | 1322 43% |
| Access Time Write * (ms) | 0.034 | 0.025 26% | 0.034 -0% | 0.038 -12% | 0.135 -297% | 0.718 -2012% |
| Access Time Read * (ms) | 0.063 | 0.051 19% | 0.075 -19% | 0.104 -65% | 0.074 -17% | 0.085 -35% |
| 4K-64 Write (MB/s) | 1651 | 571 -65% | 1829 11% | 365.8 -78% | 815 -51% | 335.2 -80% |
| 4K-64 Read (MB/s) | 615 | 681 11% | 903 47% | 645 5% | 324.6 -47% | 1078 75% |
| 4K Write (MB/s) | 111.4 | 169.6 52% | 110.6 -1% | 99.5 -11% | 126.6 14% | 106.7 -4% |
| 4K Read (MB/s) | 44.39 | 41.18 -7% | 47.96 8% | 40.35 -9% | 46.87 6% | 47.53 7% |
| Seq Write (MB/s) | 1417 | 2000 41% | 1457 3% | 1237 -13% | 761 -46% | 850 -40% |
| Seq Read (MB/s) | 2651 | 2387 -10% | 2936 11% | 1936 -27% | 1616 -39% | 1967 -26% |
| Total Average (Program / Settings) | -2% /
-1% | 11% /
11% | -33% /
-34% | -32% /
-36% | -71% /
-94% |
* ... smaller is better

* ... smaller is better
Graphics card
AMD's Vega-7 iGPU is interestingly compared with the Intel Xe-G7 GPU (80 EUs) almost on par. In general, the ThinkPad delivers the expected performance for a device with dual-channel RAM. Fortunately, the performance is not reduced in battery mode.
| 3DMark 11 Performance | 4927 points | |
| 3DMark Cloud Gate Standard Score | 17289 points | |
| 3DMark Fire Strike Score | 2863 points | |
| 3DMark Time Spy Score | 1048 points | |
Help | ||
Gaming performance
Our standardized Witcher 3 benchmark shows that the Vega 7 Graphics computes 15% slower than the average of this iGPU depending on the settings. The devices in the test field also generally perform much better here, with the Vega 8 graphics of the HP Pavilion Aero 13 computing a whole 50 percent faster. All in all, the sister model with Intel Xe7 graphics (80 EUs) calculates about as fast as our test model with AMD's APU. However, AMD consumes much less power, so you can game longer in battery mode.
It can be observed that the core clock of 1800 MHz is not quite reached, but is 1500 MHz, while the CPU initially clocks with 3.6 GHz and quickly throttles to a constant 1.4 GHz. Overall, some games that are a few years old can definitely be played well and smoothly on the work device at low to medium settings.
| low | med. | high | ultra | |
|---|---|---|---|---|
| The Witcher 3 (2015) | 49.4 | 31 | 13.6 | 10.2 |
| Dota 2 Reborn (2015) | 101 | 75.3 | 44.3 | 41.8 |
| X-Plane 11.11 (2018) | 39.7 | 29 | 26 | |
| Far Cry 5 (2018) | 35 | 15 | 14 | |
| Strange Brigade (2018) | 69.2 | 26.4 | 22 | 19 |
Emissions - AMD APU helps to keep the device cool
Noise emissions
Without load, the fan is either completely off or it behaves quietly. Light web browsing and watching YouTube in up to 4K quality does not start the fan either.
However, when you start multitasking or surfing the web very quickly (opening multiple pages in 1-second intervals or constantly clicking on links, for example), the fan becomes quite audible and thus behaves more obtrusively than some devices in the 14-inch premium business class. Although it's not considered too much of a nuisance, many comparison devices also have better fan curves here.
However, you can easily get around it by either unplugging the power cord or manually switching to power-saving mode. The tool "ThinkPad Fan Control" can also help. However, the test result naturally takes the manufacturer's factory settings into account.
Noise level
| Idle |
| 25 / 25 / 27.8 dB(A) |
| Load |
| 44.1 / 44.3 dB(A) |
 | ||
30 dB silent 40 dB(A) audible 50 dB(A) loud |
||
min: | ||
| Lenovo ThinkPad L13 Gen2-21AB000PGE Vega 7, R5 PRO 5650U, SK Hynix HFS512 GDE9X081N | Lenovo ThinkPad L13 Gen2-20VH0017GE Iris Xe G7 80EUs, i5-1135G7, Samsung SSD PM981a MZVLB512HBJQ | Dell Inspiron 13 7306-6TYH5 Iris Xe G7 96EUs, i7-1165G7, Toshiba KBG40ZNS512G NVMe | Lenovo ThinkPad X13 G2 AMD 20XH001KGE Vega 7, R5 PRO 5650U, Samsung SSD PM981a MZVLB512HBJQ | HP Pavilion Aero 13 be0097nr Vega 8, R7 5800U, Intel SSD 660p SSDPEKNW512G8 | |
|---|---|---|---|---|---|
| Noise | -3% | 6% | 14% | 12% | |
| off / environment * (dB) | 25 | 29.3 -17% | 25 -0% | 24.17 3% | 23.9 4% |
| Idle Minimum * (dB) | 25 | 29.3 -17% | 25 -0% | 24.17 3% | 23.9 4% |
| Idle Average * (dB) | 25 | 29.3 -17% | 25 -0% | 24.17 3% | 23.9 4% |
| Idle Maximum * (dB) | 27.8 | 29.3 -5% | 25 10% | 24.17 13% | 23.9 14% |
| Load Average * (dB) | 44.1 | 34.3 22% | 35.7 19% | 29.92 32% | 32.2 27% |
| Load Maximum * (dB) | 44.3 | 36.3 18% | 41.8 6% | 31.52 29% | 34.8 21% |
| Witcher 3 ultra * (dB) | 34.7 |
* ... smaller is better
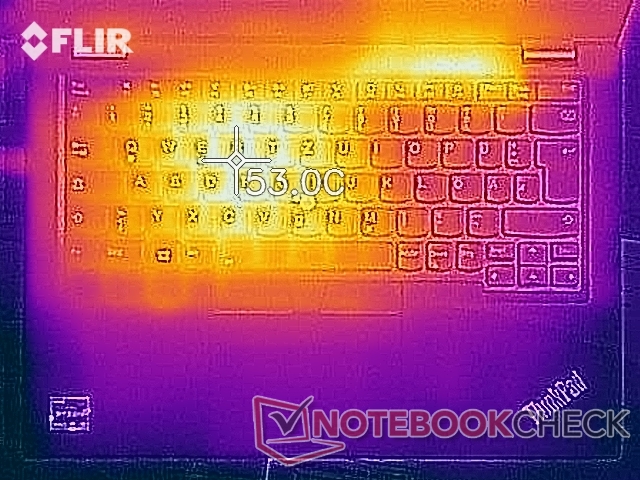
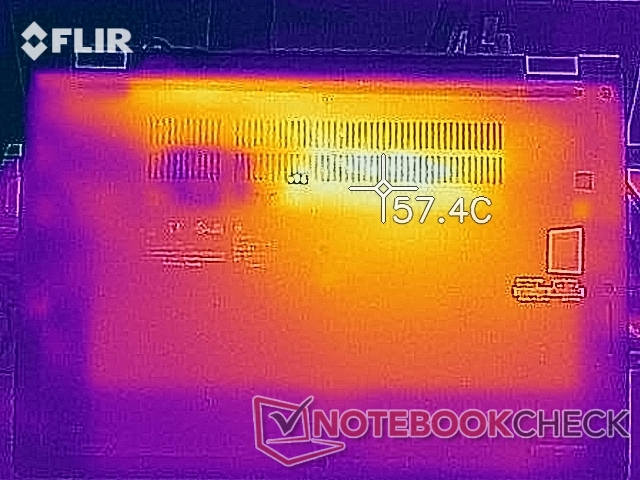
Temperature
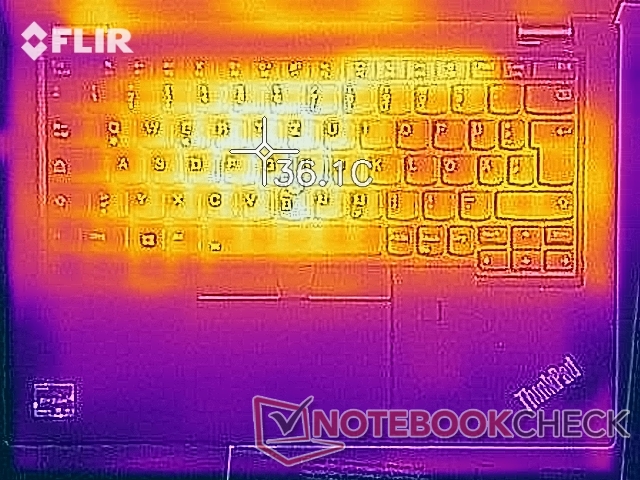
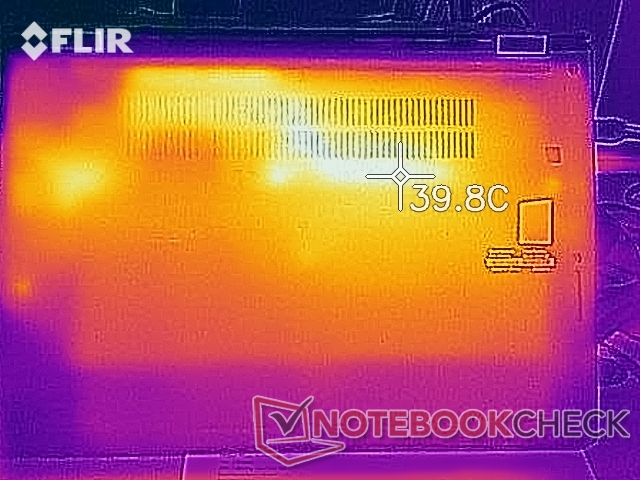
The general warming of the device is very restrained. A slight, quasi pleasant warming can be felt in the keyboard's upper center area. The rest of the laptop remained completely cool, except for the area of the ventilation inlet on the underside as well as the ventilation outlet on the device's back. However, it did not get too hot here either since the performance is throttled beforehand.
(±) The maximum temperature on the upper side is 42.7 °C / 109 F, compared to the average of 35.9 °C / 97 F, ranging from 21.4 to 59 °C for the class Subnotebook.
(±) The bottom heats up to a maximum of 44.9 °C / 113 F, compared to the average of 39.2 °C / 103 F
(+) In idle usage, the average temperature for the upper side is 28 °C / 82 F, compared to the device average of 30.8 °C / 87 F.
(+) The palmrests and touchpad are cooler than skin temperature with a maximum of 27.1 °C / 80.8 F and are therefore cool to the touch.
(±) The average temperature of the palmrest area of similar devices was 28.2 °C / 82.8 F (+1.1 °C / 2 F).
| Lenovo ThinkPad L13 Gen2-21AB000PGE AMD Ryzen 5 PRO 5650U, AMD Radeon RX Vega 7 | Lenovo ThinkPad L13 Yoga Gen2-20VK000VGE Intel Core i5-1135G7, Intel Iris Xe Graphics G7 80EUs | Lenovo ThinkPad L13 Gen2-20VH0017GE Intel Core i5-1135G7, Intel Iris Xe Graphics G7 80EUs | HP ProBook x360 435 G8 R7-5800U AMD Ryzen 7 5800U, AMD Radeon RX Vega 8 (Ryzen 4000/5000) | Dell Inspiron 13 7306-6TYH5 Intel Core i7-1165G7, Intel Iris Xe Graphics G7 96EUs | Lenovo ThinkPad X13 G2 AMD 20XH001KGE AMD Ryzen 5 PRO 5650U, AMD Radeon RX Vega 7 | HP Pavilion Aero 13 be0097nr AMD Ryzen 7 5800U, AMD Radeon RX Vega 8 (Ryzen 4000/5000) | |
|---|---|---|---|---|---|---|---|
| Heat | 1% | 2% | 11% | 9% | 14% | 14% | |
| Maximum Upper Side * (°C) | 42.7 | 43.3 -1% | 43.3 -1% | 43.8 -3% | 39 9% | 43.7 -2% | 35.6 17% |
| Maximum Bottom * (°C) | 44.9 | 54.5 -21% | 58 -29% | 47.4 -6% | 42.9 4% | 38 15% | 38.6 14% |
| Idle Upper Side * (°C) | 32.6 | 26.6 18% | 25.6 21% | 24.6 25% | 29.8 9% | 25.8 21% | 29.6 9% |
| Idle Bottom * (°C) | 33.9 | 30.7 9% | 28.8 15% | 25.2 26% | 29.4 13% | 26.2 23% | 29 14% |
* ... smaller is better
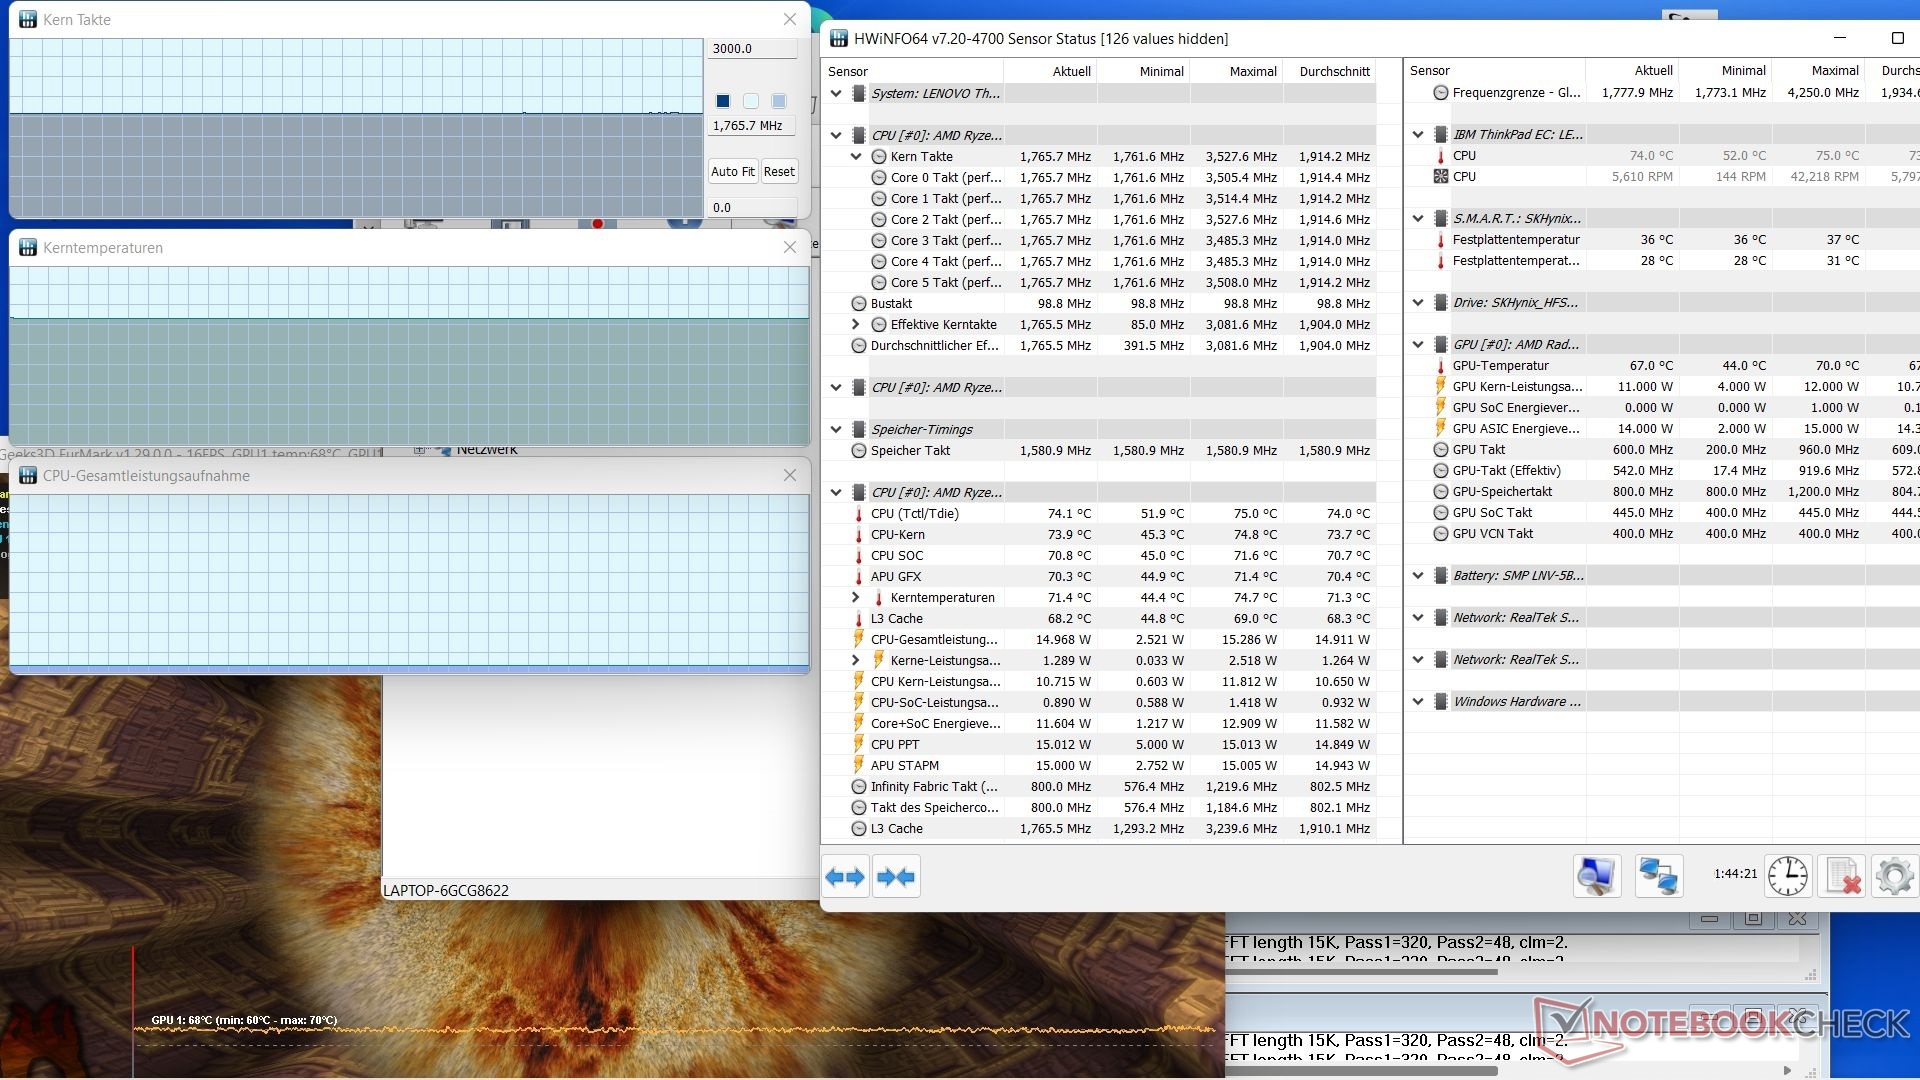
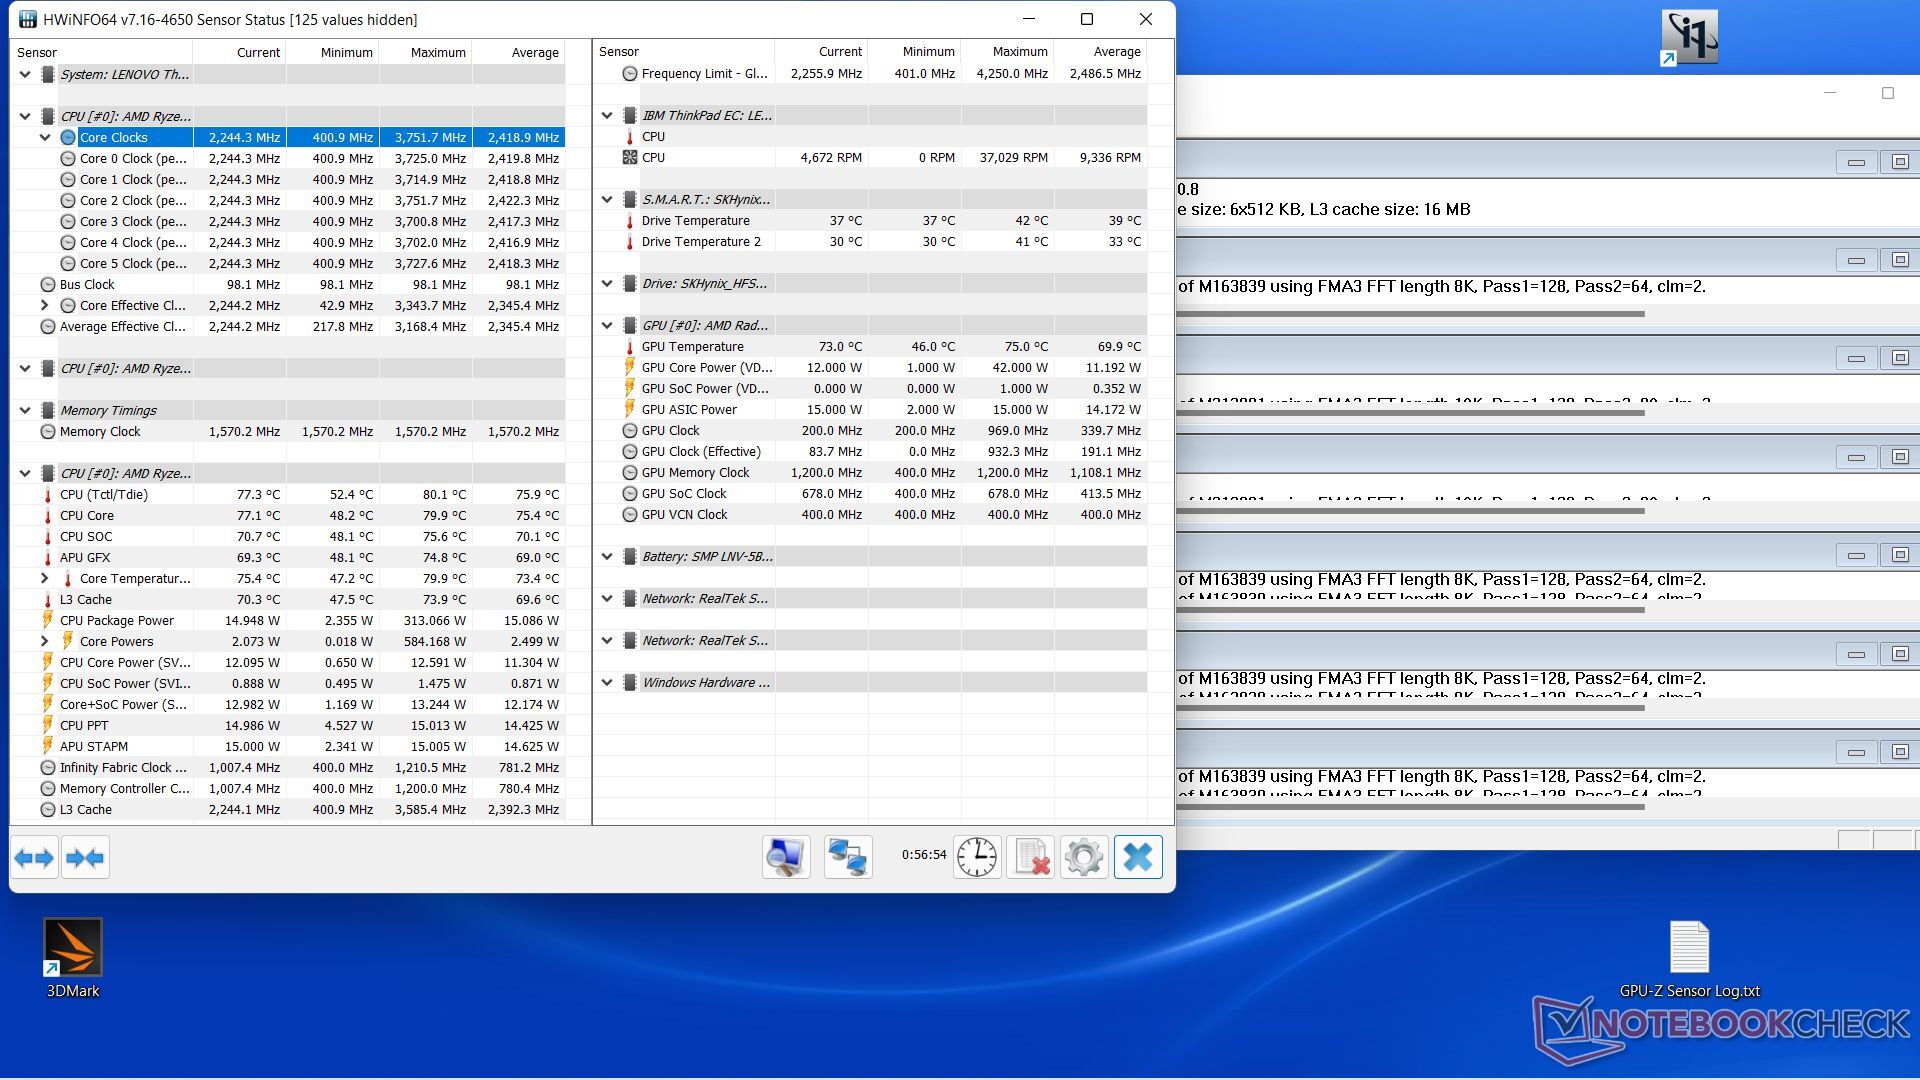
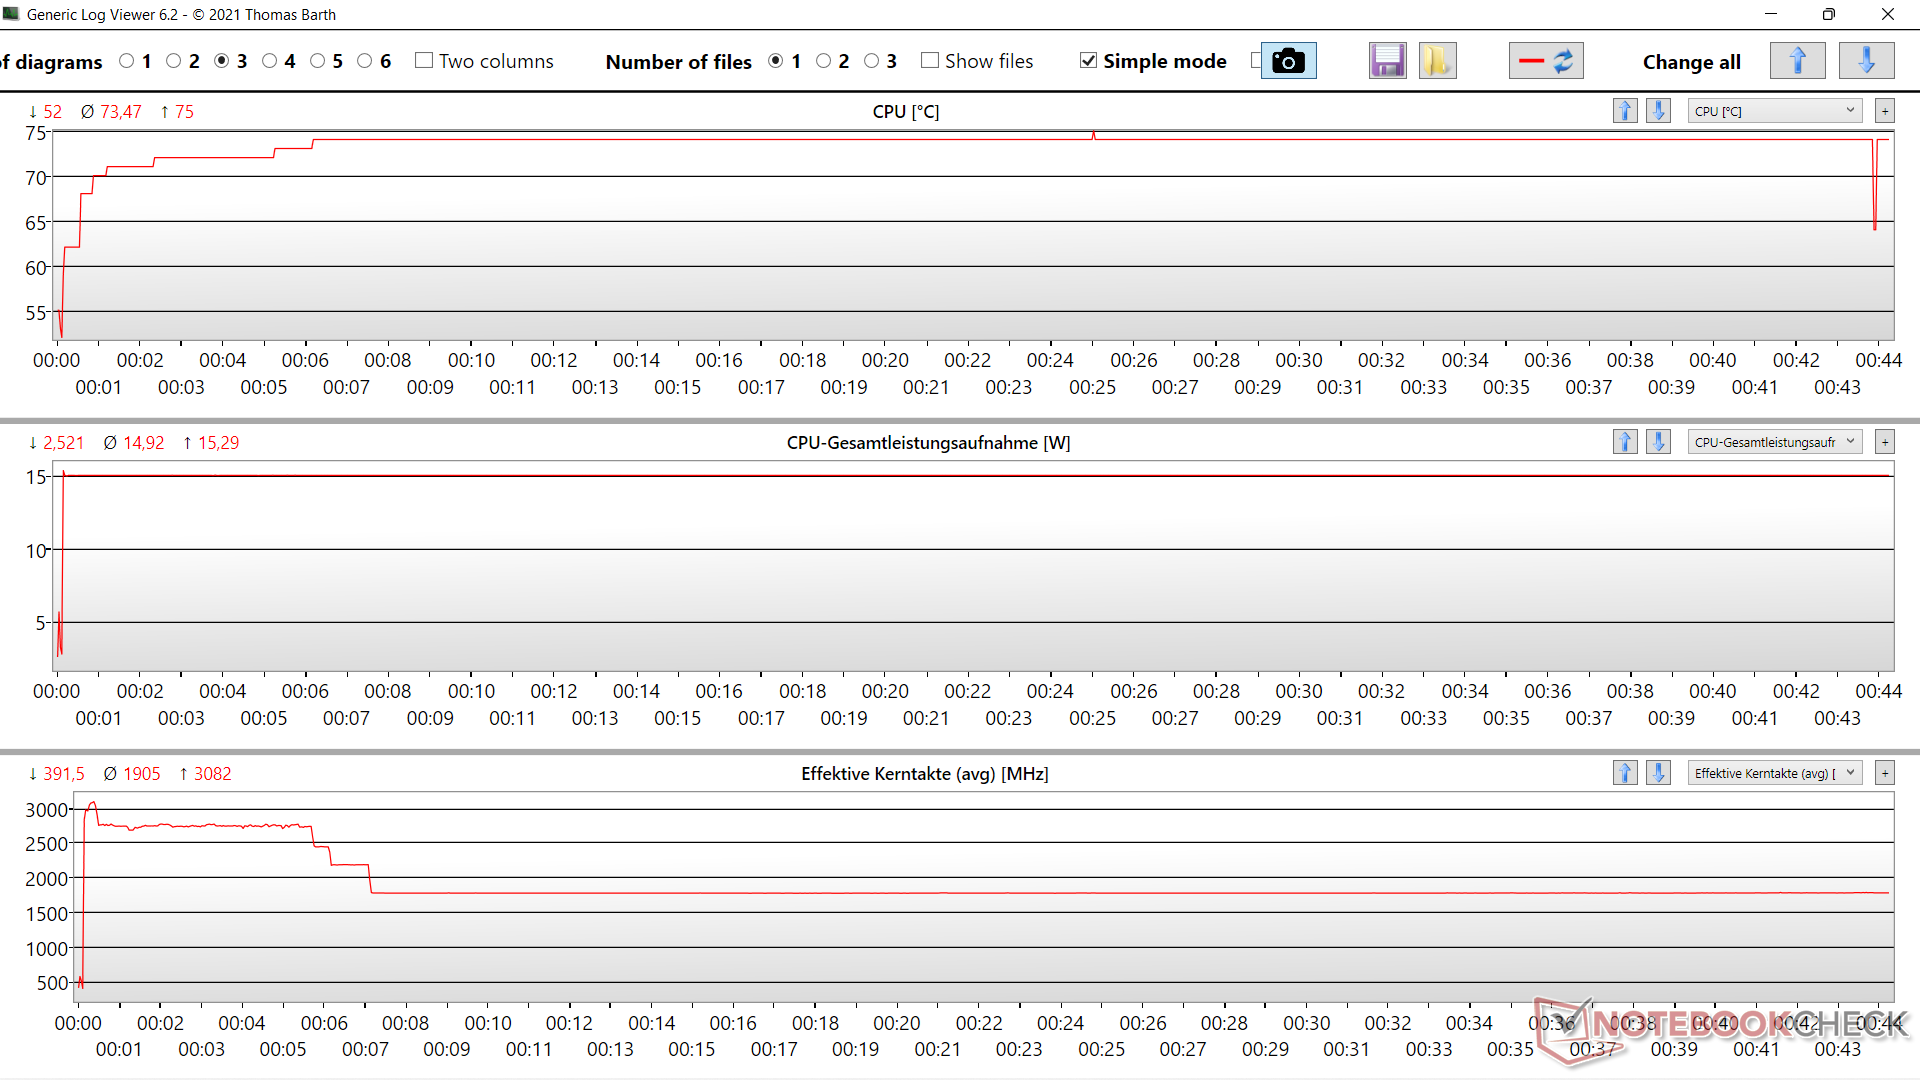
Stress test
Under combined load (Prime95 + FurMark), the AMD processor consumes about 23 watts initially and quickly settles at 15 watts. The CPU clock is 3.7 GHz for a few seconds, drops to 2.75 GHz and stays there for about 12 minutes until it is successively throttled to a final 1.8 GHz. This is slightly less than the base clock of 2.3 GHz, but in everyday scenarios we do not notice any clock drop below the base clock, which is a permanent 2.75 GHz under pure CPU load. These are good results. After an initial 82 °C (~180 °F), the core temperature settles at 74 °C (~165 °F). The Vega iGPU clocks at 900 MHz for a full 7 minutes under combined load and then stably at 550 MHz, while remaining very cool at 67 °C (~153 °F), however. The iGPU alone draws 14 to 15 watts in the stress test.
There is still room for improvement in both cases, both in terms of clock and temperature - but Lenovo seems to have prioritized quiet operation over maximum performance output in its business ultrabook: This is also reflected in the fan behavior, which is relatively loud in the stress test, but by no means really annoying. The fan spins at about 5650 RPM (analogous to the CPU designation ;) ).
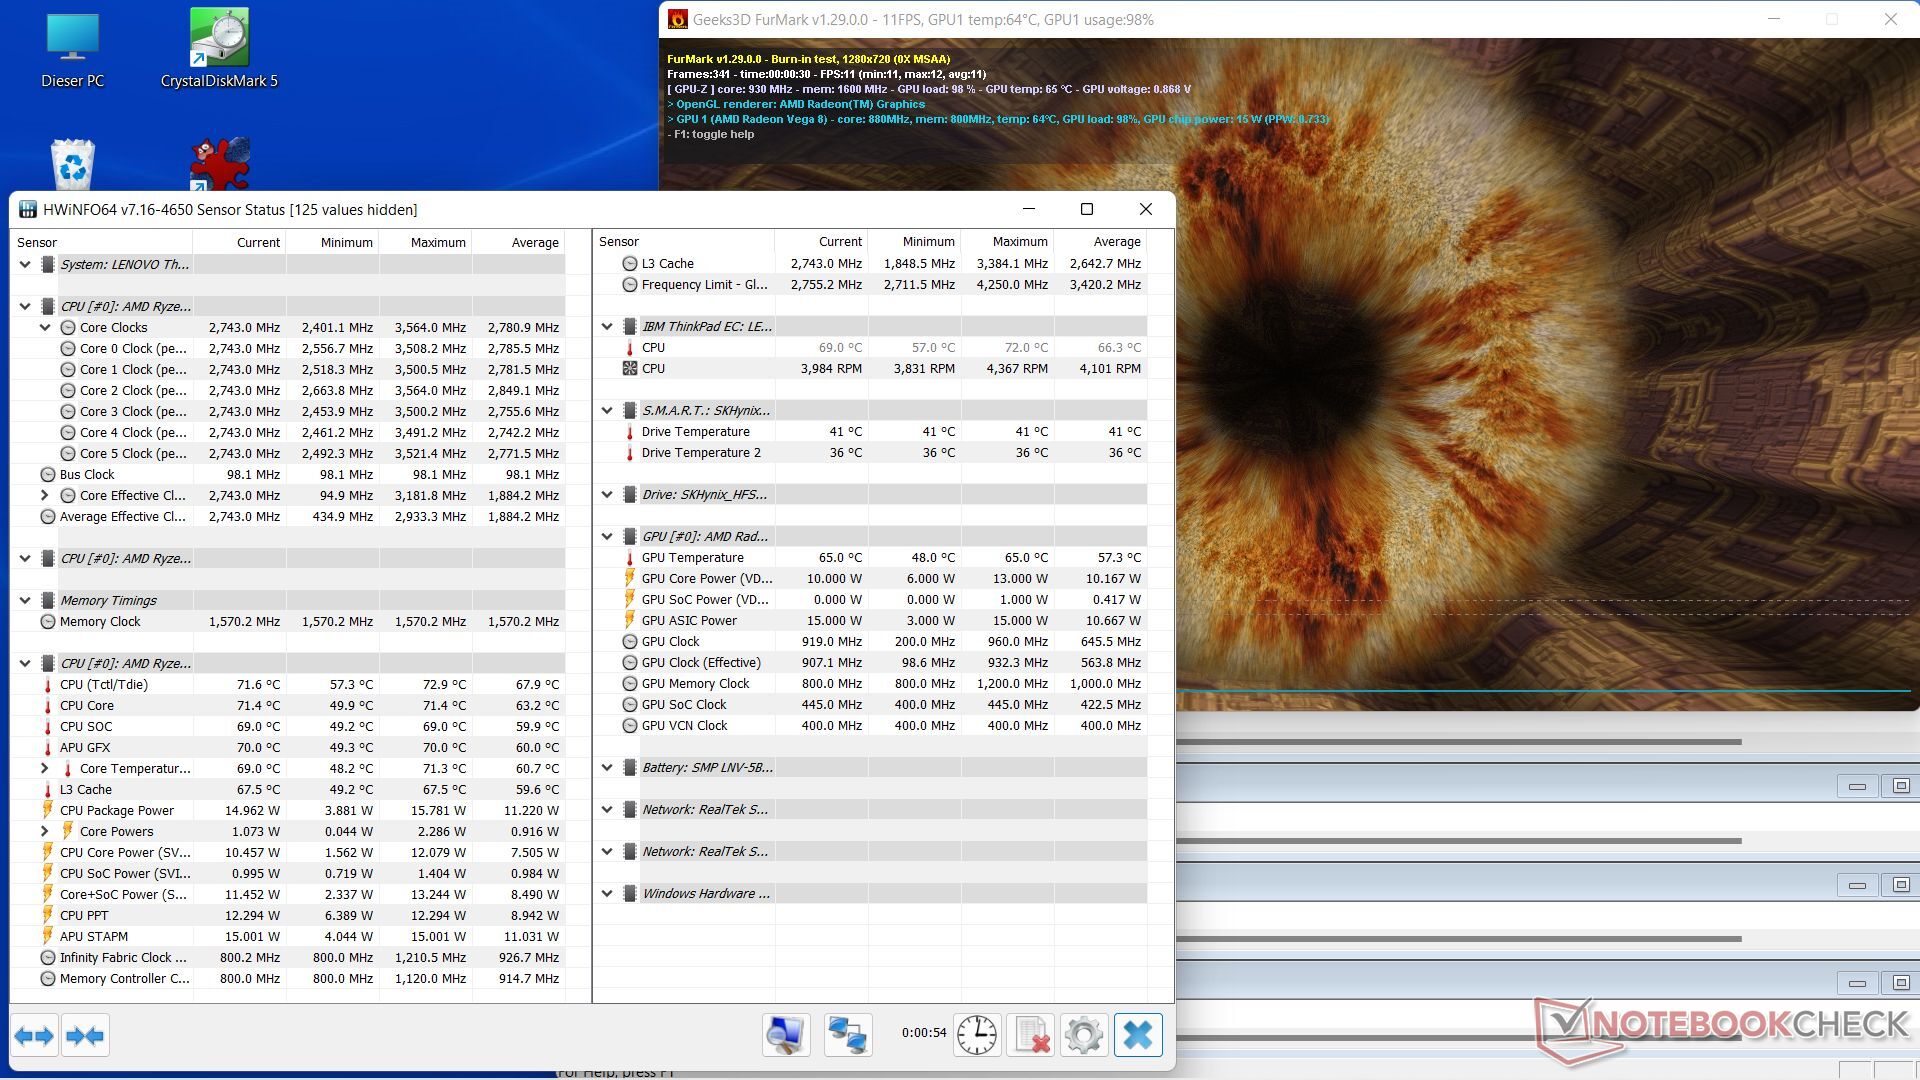
| CPU Clock (GHz) | GPU Clock (MHz) | Average CPU Temperature (°C) | Average GPU Temperature (°C) | |
| System Idle | 2.3 GHz | 200 MHz | 43 °C | 40 °C |
| Prime95 Stress | 2.25 GHz | 200 MHz | 75 °C | 73 °C |
| Prime95 + FurMark Stress | 1.8 GHz | 550 MHz | 74 °C | 70 °C |
| Witcher 3 Stress | 1.4 GHz | 1.5 GHz | 70 °C | 64 °C |
Speaker
The speakers are rather basic and do not offer any bass. However, the trebles and mids are reproduced clearly. The volume itself is high enough, even for movies and music of all kinds. The rival devices from Dell and HP perform better here, and the in-house ThinkPad X13 Gen2 also offers a much better sound quality. If in doubt, we recommend using headphones or another external audio system.
Lenovo ThinkPad L13 Gen2-21AB000PGE audio analysis
(+) | speakers can play relatively loud (82.4 dB)
Bass 100 - 315 Hz
(-) | nearly no bass - on average 25.6% lower than median
(±) | linearity of bass is average (13.8% delta to prev. frequency)
Mids 400 - 2000 Hz
(+) | balanced mids - only 3.3% away from median
(+) | mids are linear (4.6% delta to prev. frequency)
Highs 2 - 16 kHz
(+) | balanced highs - only 4.1% away from median
(+) | highs are linear (6.5% delta to prev. frequency)
Overall 100 - 16.000 Hz
(±) | linearity of overall sound is average (19% difference to median)
Compared to same class
» 58% of all tested devices in this class were better, 6% similar, 36% worse
» The best had a delta of 5%, average was 18%, worst was 53%
Compared to all devices tested
» 45% of all tested devices were better, 7% similar, 47% worse
» The best had a delta of 4%, average was 23%, worst was 134%
Lenovo ThinkPad L13 Gen2-20VH0017GE audio analysis
(±) | speaker loudness is average but good (77.6 dB)
Bass 100 - 315 Hz
(-) | nearly no bass - on average 19.5% lower than median
(-) | bass is not linear (15% delta to prev. frequency)
Mids 400 - 2000 Hz
(+) | balanced mids - only 4.6% away from median
(+) | mids are linear (3.4% delta to prev. frequency)
Highs 2 - 16 kHz
(±) | reduced highs - on average 6.7% lower than median
(±) | linearity of highs is average (10.7% delta to prev. frequency)
Overall 100 - 16.000 Hz
(±) | linearity of overall sound is average (25.6% difference to median)
Compared to same class
» 78% of all tested devices in this class were better, 6% similar, 16% worse
» The best had a delta of 7%, average was 21%, worst was 53%
Compared to all devices tested
» 79% of all tested devices were better, 4% similar, 17% worse
» The best had a delta of 4%, average was 23%, worst was 134%
Power management - Ryzen ensures twice the battery life
Energy consumption
The APU consumes between 8 and 9.5 watts when idling, and a maximum of 33 watts under full load, with the CPU and iGPU consuming just under 15 watts each. The 65 watt power supply is therefore more than sufficient, so even smaller USB-C power supply solutions are sufficient.
| Off / Standby | |
| Idle | |
| Load |
|
Key:
min: | |
| Lenovo ThinkPad L13 Gen2-21AB000PGE R5 PRO 5650U, Vega 7, SK Hynix HFS512 GDE9X081N, IPS, 1920x1080, 13.3" | Lenovo ThinkPad L13 Gen2-20VH0017GE i5-1135G7, Iris Xe G7 80EUs, Samsung SSD PM981a MZVLB512HBJQ, IPS, 1920x1080, 13.3" | Lenovo ThinkPad L13 Yoga Gen2-20VK000VGE i5-1135G7, Iris Xe G7 80EUs, WDC PC SN730 SDBPNTY-256G, IPS, 1920x1080, 13.3" | HP ProBook x360 435 G8 R7-5800U R7 5800U, Vega 8, Samsung PM991 MZVLQ512HALU, IPS, 1920x1080, 13.3" | HP Pavilion Aero 13 be0097nr R7 5800U, Vega 8, Intel SSD 660p SSDPEKNW512G8, IPS, 1920x1200, 13.3" | Average AMD Radeon RX Vega 7 | Average of class Subnotebook | |
|---|---|---|---|---|---|---|---|
| Power Consumption | -17% | -19% | 4% | -3% | -16% | -16% | |
| Idle Minimum * (Watt) | 4.4 | 4.4 -0% | 4.6 -5% | 3.2 27% | 3.4 23% | 4.79 ? -9% | 3.73 ? 15% |
| Idle Average * (Watt) | 7.6 | 7.2 5% | 7.3 4% | 5.5 28% | 6.9 9% | 7.72 ? -2% | 6.57 ? 14% |
| Idle Maximum * (Watt) | 9.5 | 9.8 -3% | 10.2 -7% | 6.4 33% | 8 16% | 9.12 ? 4% | 7.93 ? 17% |
| Load Average * (Watt) | 33 | 31.7 4% | 32.3 2% | 35.5 -8% | 42.6 -29% | 38.4 ? -16% | 42.1 ? -28% |
| Witcher 3 ultra * (Watt) | 33.4 33.3 | 33.3 -0% | 35 -5% | 36.4 -9% | 35.2 -5% | ||
| Load Maximum * (Watt) | 32.5 | 66.6 -105% | 65.3 -101% | 47.5 -46% | 43.1 -33% | 51.7 ? -59% | 65.1 ? -100% |
* ... smaller is better
Power consumption - The Witcher 3 / Stress test
Power consumption with external monitor
Battery life
In our standardized WLAN test, the ThinkPad L13 achieves a runtime of 11:02 h at 150 cd/m², which is almost double the 6:04 h of the Intel model. It is still 9:14 h at maximum brightness. In the video test with the short film Big Buck Bunny, it lasted a whole 15:38 hours. The table shows roughly the same battery runtimes for all rivals with AMD processors, so we can generally attest Intel-based ultrabooks a significantly worse runtime. The L13 runs out of steam after 1:40 h under full load.
| Lenovo ThinkPad L13 Gen2-21AB000PGE R5 PRO 5650U, Vega 7, 46 Wh | Lenovo ThinkPad L13 Gen2-20VH0017GE i5-1135G7, Iris Xe G7 80EUs, 46 Wh | HP ProBook x360 435 G8 R7-5800U R7 5800U, Vega 8, 45 Wh | Dell Inspiron 13 7306-6TYH5 i7-1165G7, Iris Xe G7 96EUs, 60 Wh | Lenovo ThinkPad X13 G2 AMD 20XH001KGE R5 PRO 5650U, Vega 7, 54.7 Wh | HP Pavilion Aero 13 be0097nr R7 5800U, Vega 8, 43 Wh | Average of class Subnotebook | |
|---|---|---|---|---|---|---|---|
| Battery runtime | -36% | -28% | -13% | -15% | -1% | 24% | |
| Reader / Idle (h) | 17.2 | 13.8 -20% | 18.9 10% | 26.4 ? 53% | |||
| H.264 (h) | 15.6 | 7.6 -51% | 10.3 -34% | 13.6 -13% | 15.3 ? -2% | ||
| WiFi v1.3 (h) | 11 | 6.1 -45% | 9.5 -14% | 6.9 -37% | 9.3 -15% | 9 -18% | 13.9 ? 26% |
| Load (h) | 1.7 | 1.5 -12% | 1.1 -35% | 2 18% | 1.4 -18% | 1.8 6% | 2.04 ? 20% |
Pros
Cons
Verdict - Enduring business ThinkPad with AMD power

Our test model from Campuspoint does well to very well in most tests: It is robustly built with a very good build quality, the input devices are in the highest league, especially the keyboard, the display is adequate, although a bit more brightness would be an advantage. Thanks to AMD's HexaCore CPU, the performance is virtually doubled compared to the Intel model, even on battery power, and the battery life is doubled as well. The device also stays cooler and runs quietly since the CPU is content with 15 watts. The integrated Vega 7 iGPU is also fast enough for this notebook class. The only shortcoming that AMD Cezanne brings with it is the lack of Thunderbolt. Other negative points are the soldered RAM, the strong susceptibility to fingerprints and that the screen does not quite reach 300 nits. The speakers and webcam are sub-par, but tolerable for a business device. A premium ultrabook like the ThinkPad X1 Carbon is simply not the goal here.
The ThinkPad L13 G2 AMD offers high performance with an equally high battery duration, combined with an outstanding keyboard and a durable design.
The business device is perfect for anyone looking for a mobile and reliable work companion, whether for web research or a lot of typing and office use in college or at work. All in all, we can recommend the AMD version of the ThinkPad L13 G2 over the Intel variant. For those who want to use the ThinkPad with external input and output devices as a home workstation as well, we recommend the even faster OctaCore version with AMD's Ryzen 7 5850U. Alternatives in the same price segment are the HP ProBook x360 435 G8 AMD and the HP Pavilion Aero 13 and in the convertible sector the Dell Inspiron 13 7306 2n1 with a 4K display and the Yoga variant of the test device, the Lenovo ThinkPad L13 Yoga Gen2.
Price and availability
Our configuration of the ThinkPad L13 Gen2 with 512 GB SSD and 16 GB working memory is currently available at Campuspoint for 999 Euro (~$1106) or at Cyberport for about 1,019 Euro (~$1128). The special Campus model already starts at around 949 Euros (~$1051). You can also treat yourself to the OctaCore model for only 40 Euros (~$44) more.
Lenovo ThinkPad L13 Gen2-21AB000PGE
- 02/25/2022 v7 (old)
Marvin Gollor
Price comparison

