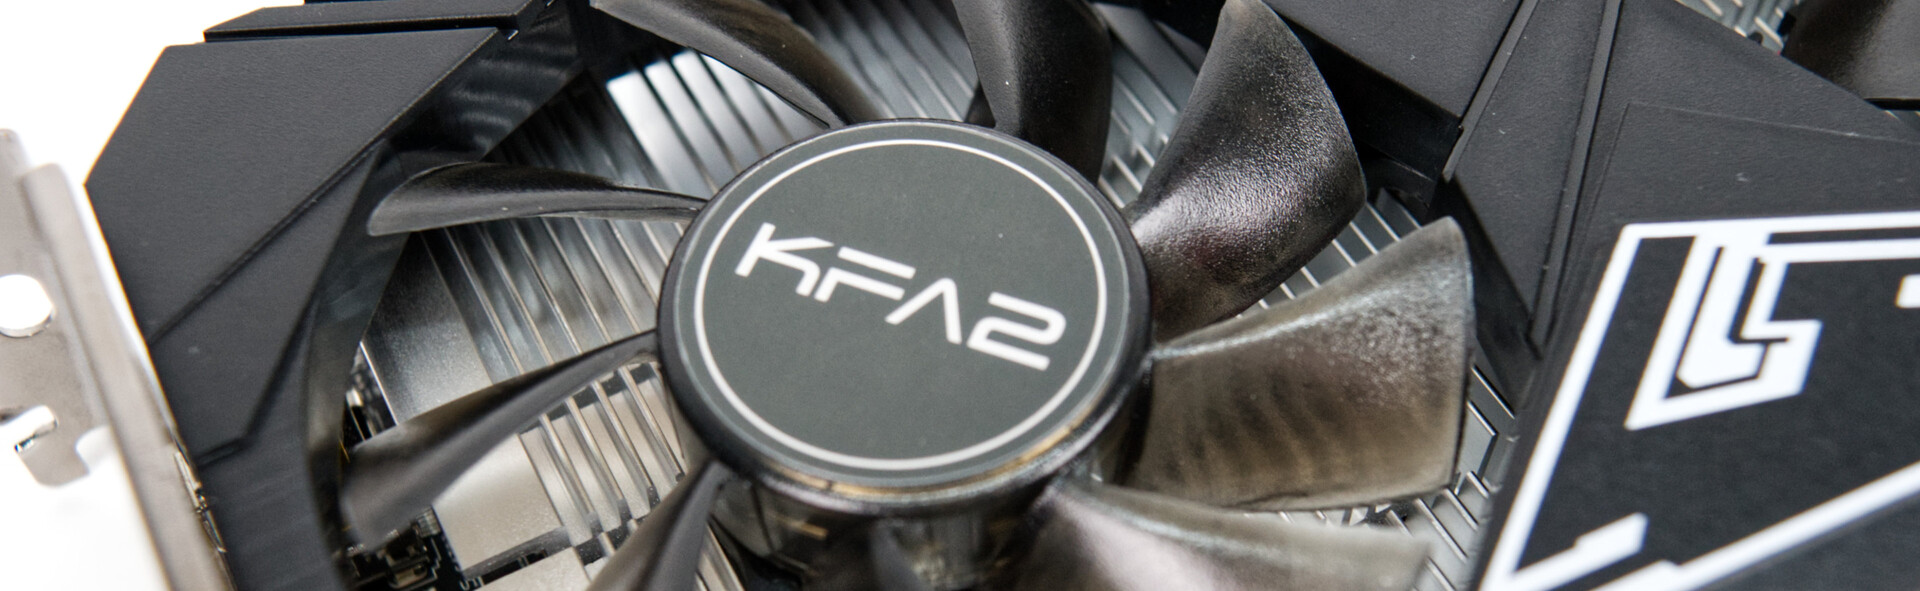
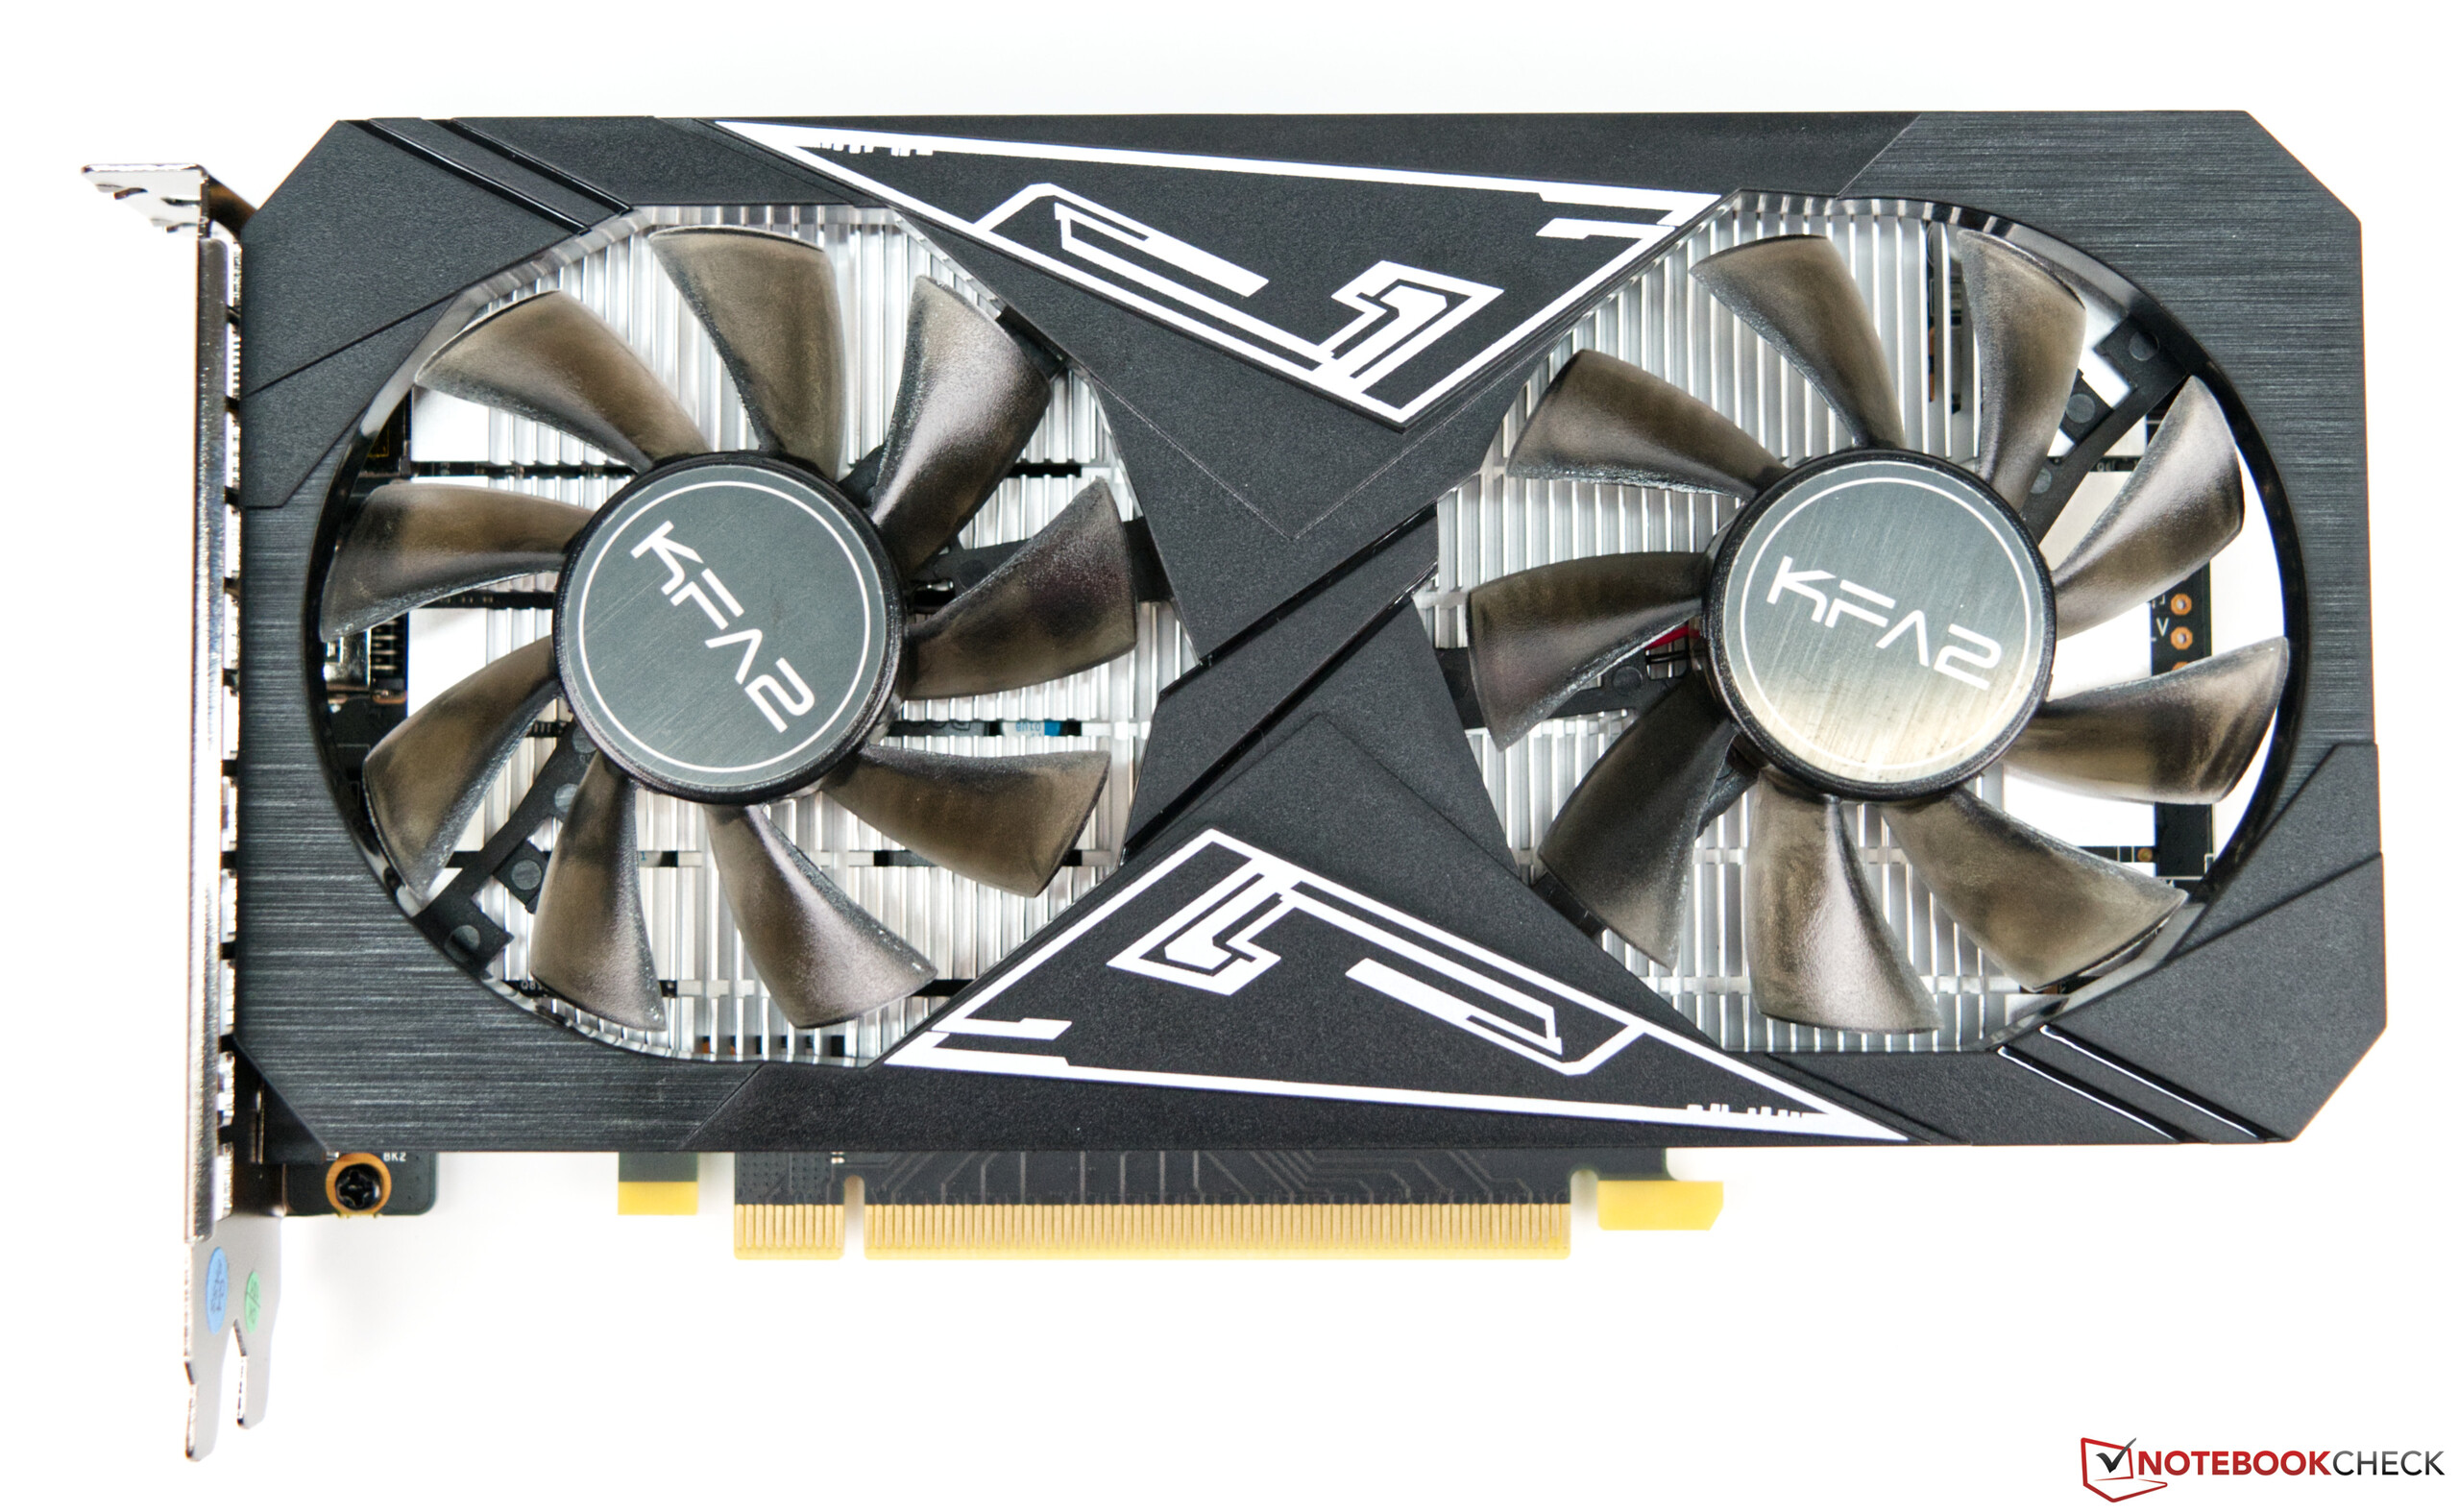
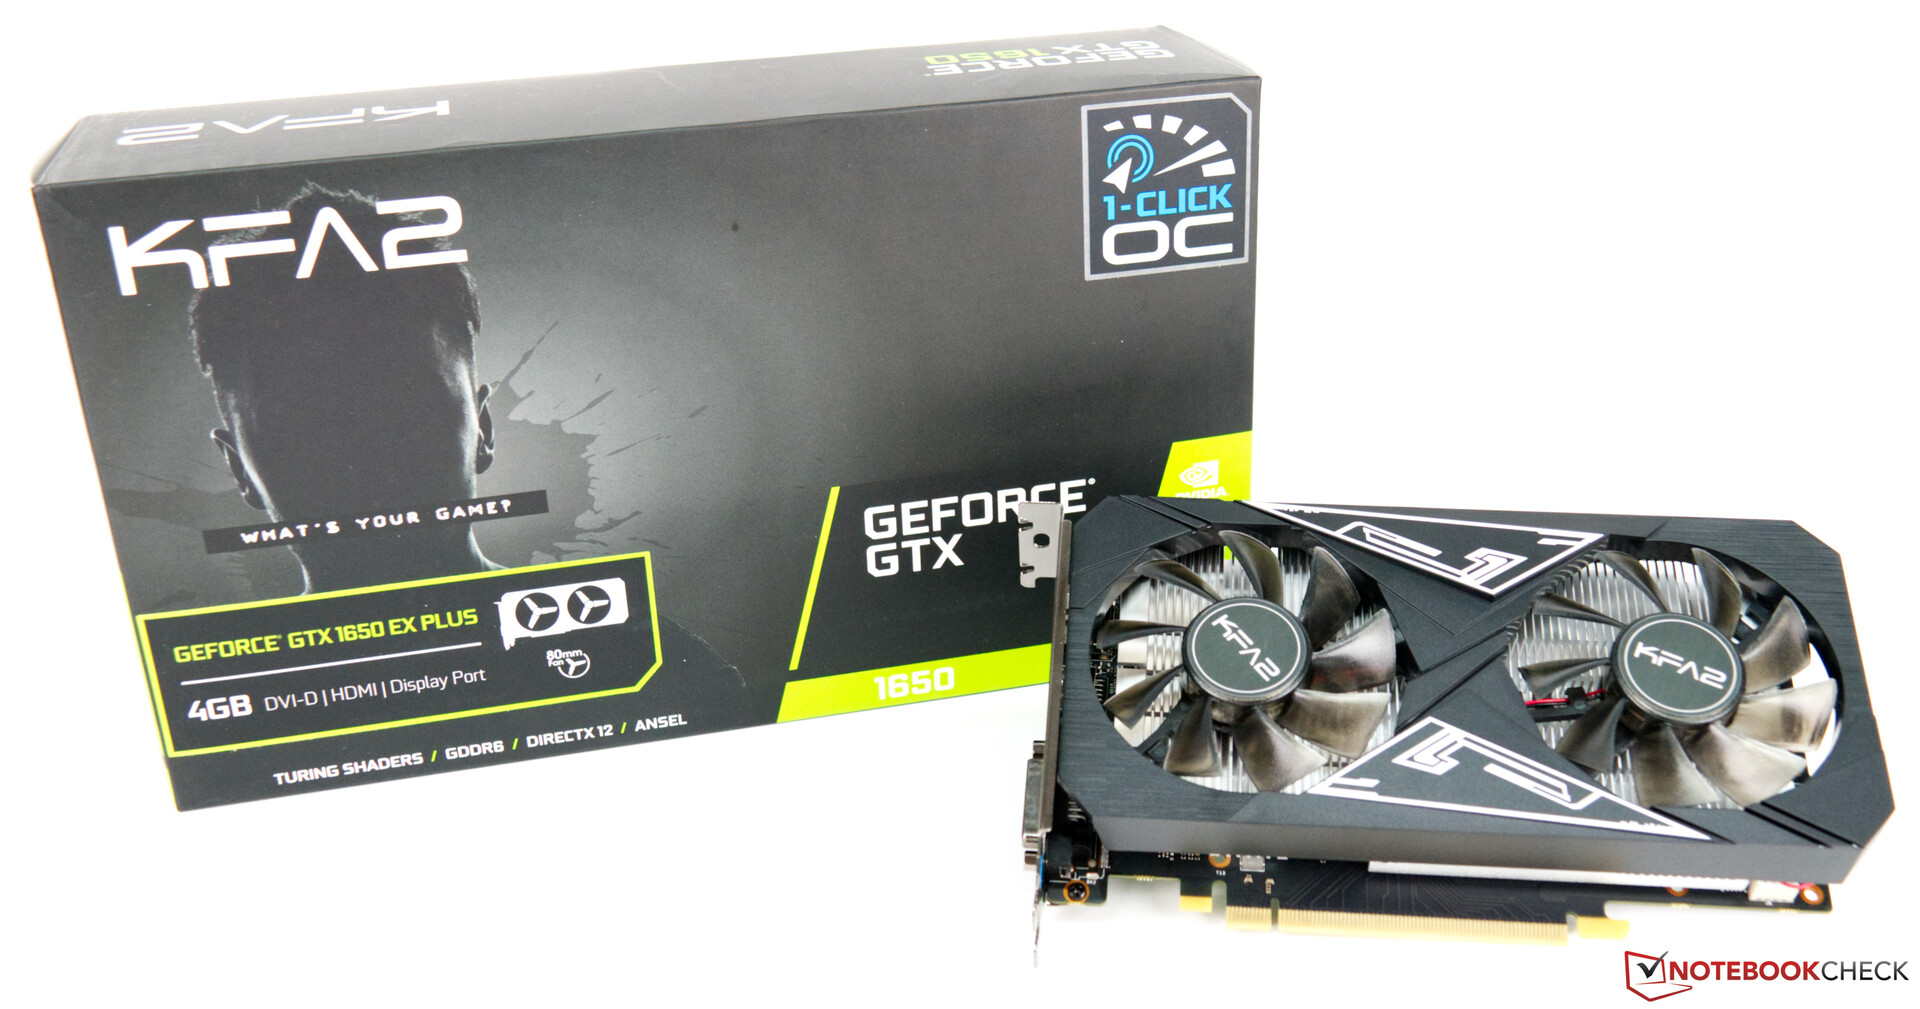
KFA2 GeForce GTX 1650 EX Plus Review - more performance and faster VRAM for the smallest Turing-based desktop GPU
The entry-level Turing-based GPUs can be found in the GTX series from NVIDIA. Unlike the RTX models, the GTX graphics cards do not feature support for hardware-based ray tracing acceleration and deep learning super sampling (DLSS). The lack of these features can be forgiven, given the fact that the GTX video cards are much slower than the RTX GPUs. Since the release of the architecture NVIDIA and board partners have brought many updated models to the markets. The KFA2 GeForce GTX 1650 EX Plus (1-Click OC) is one of those models.
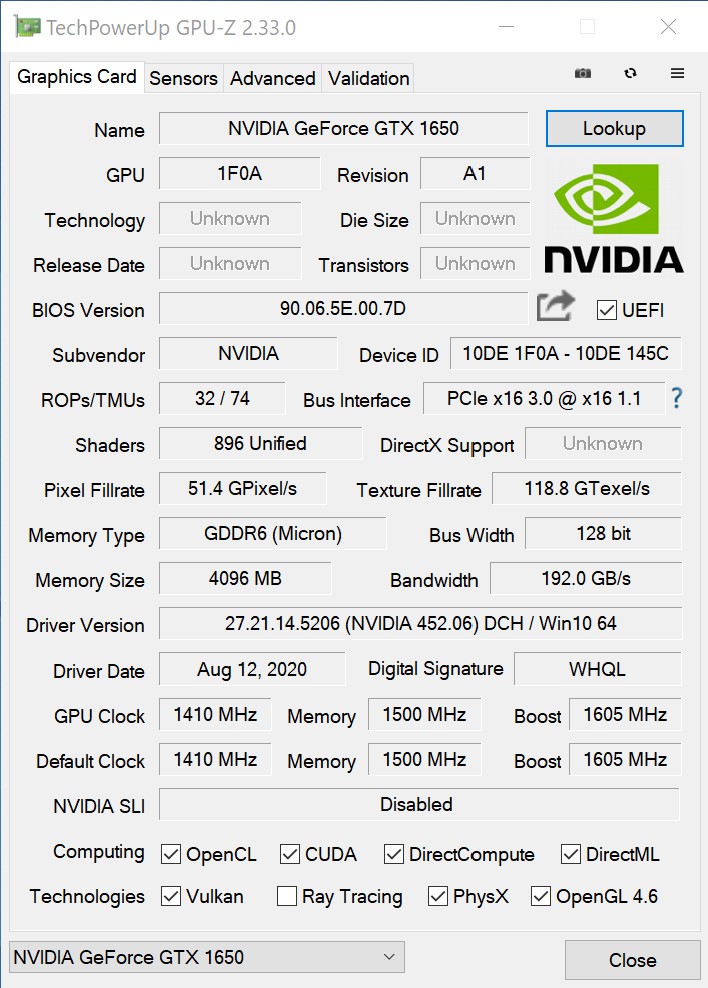
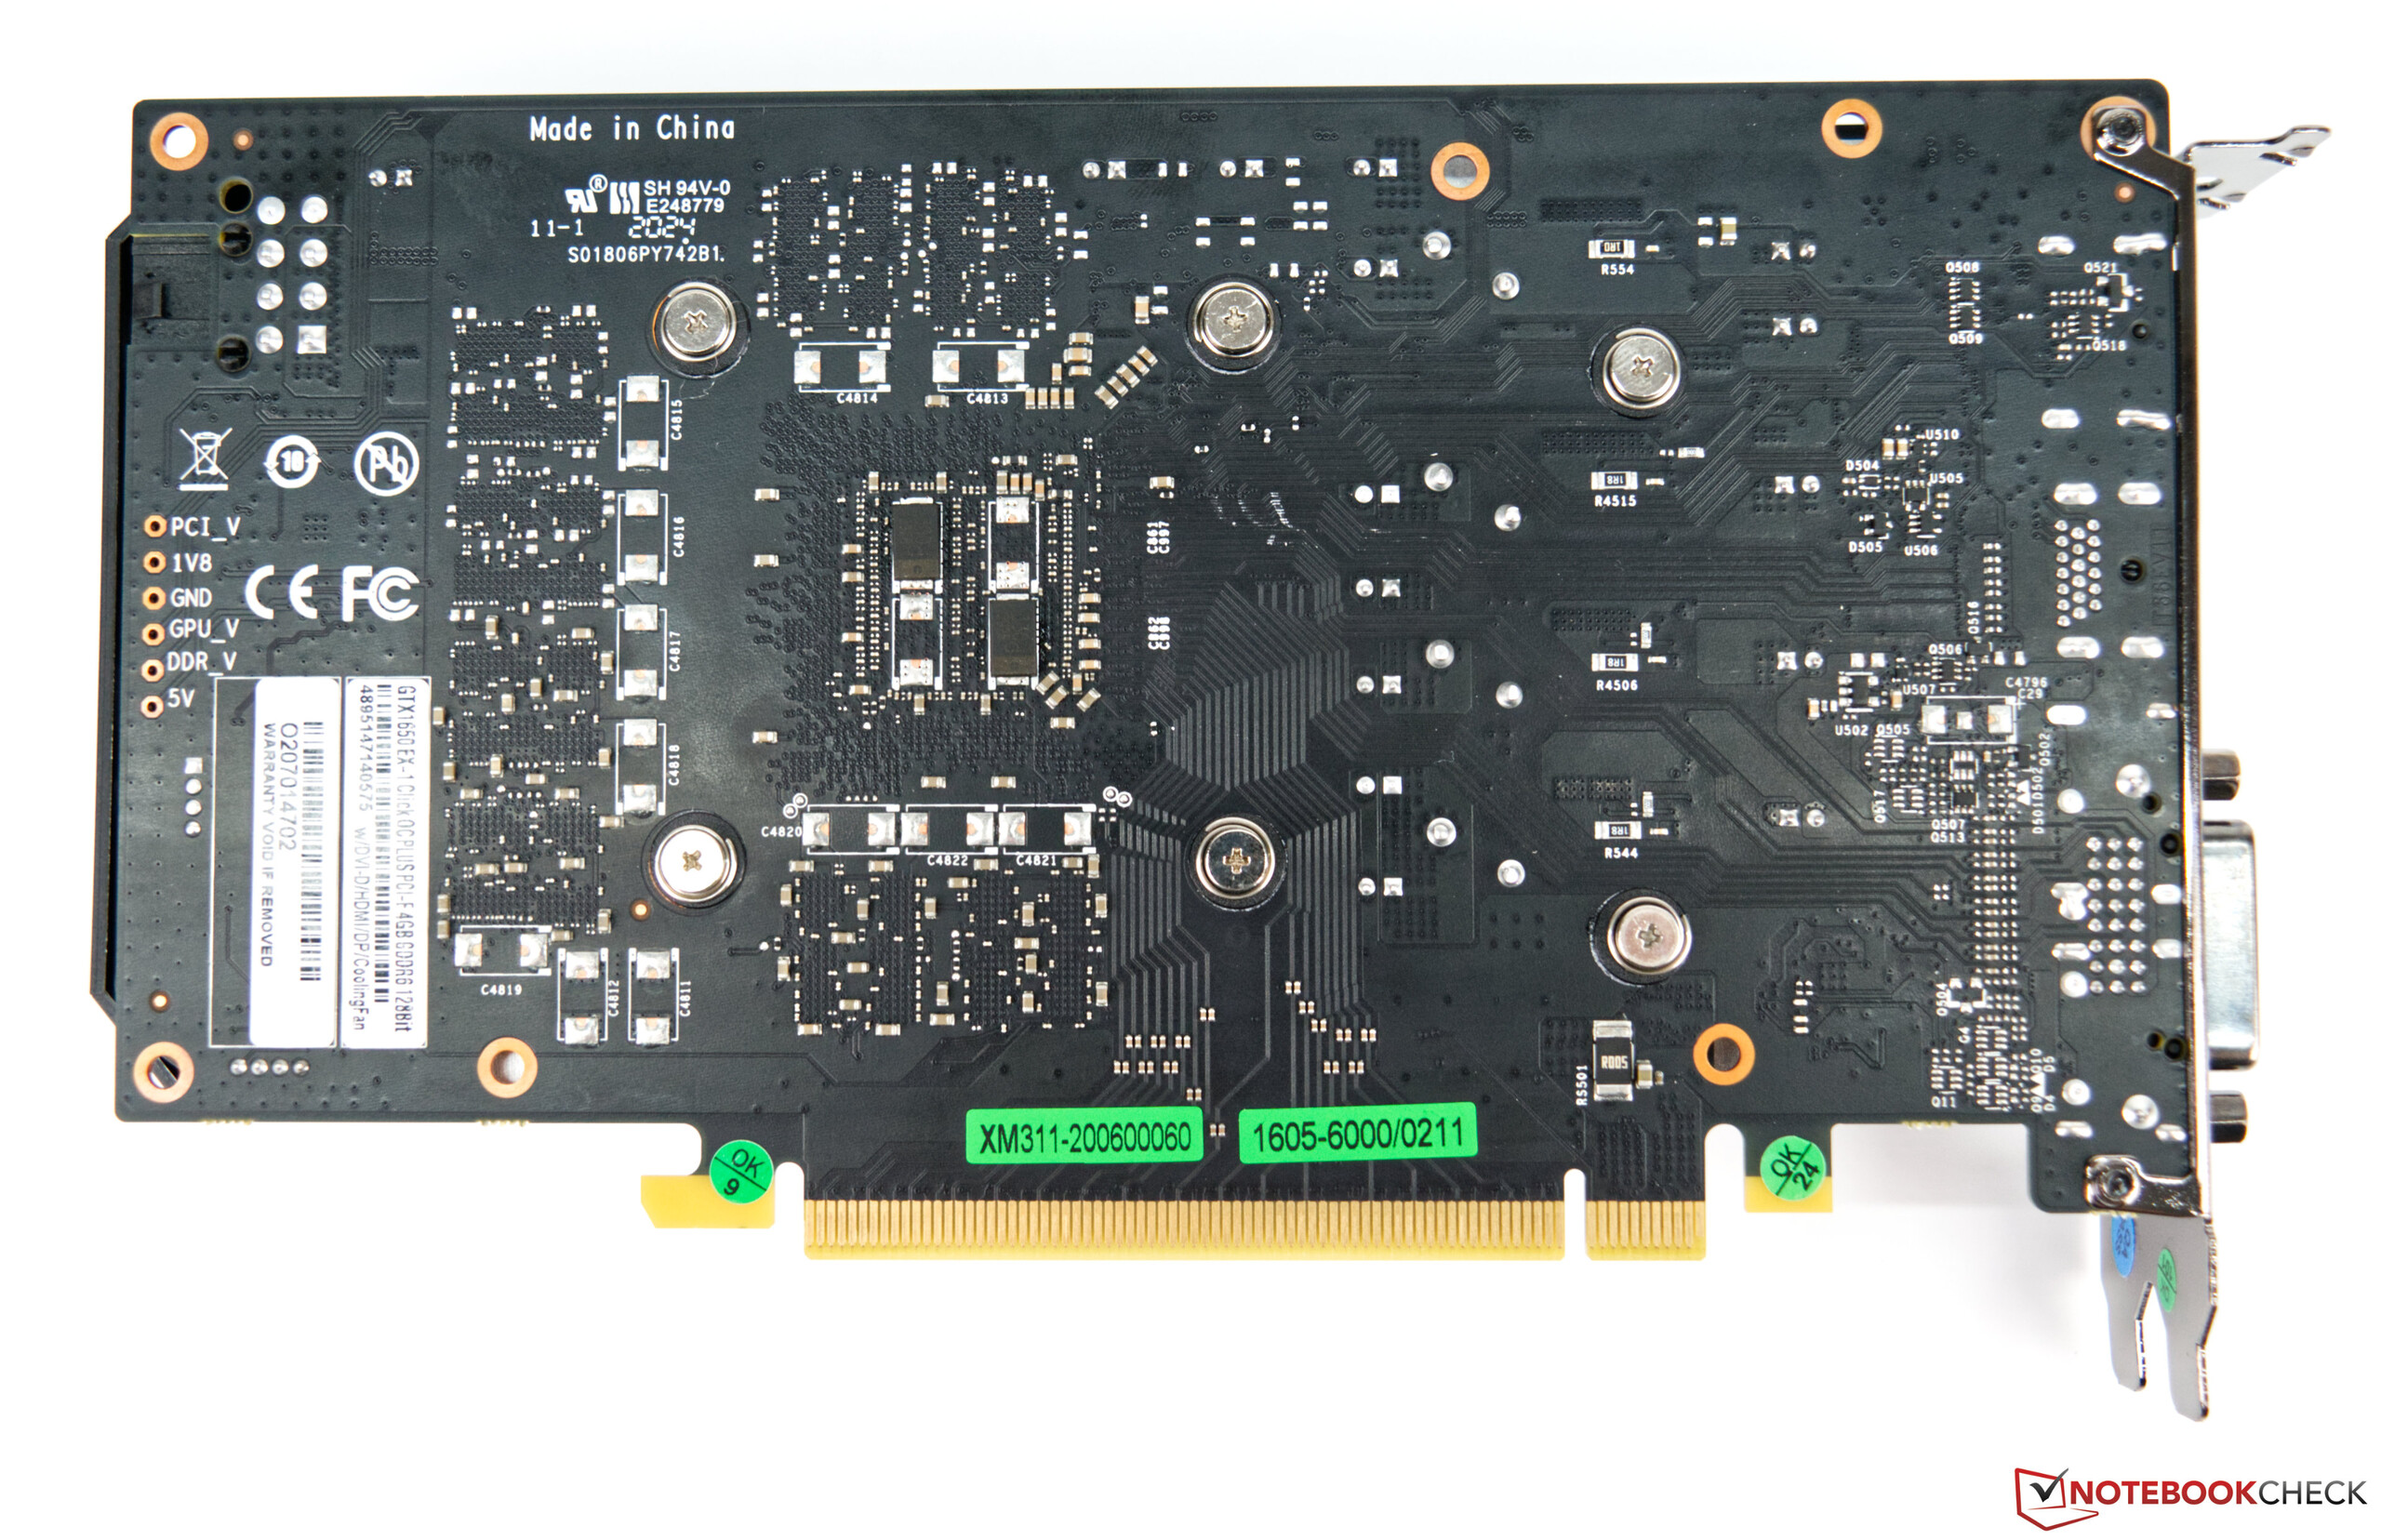
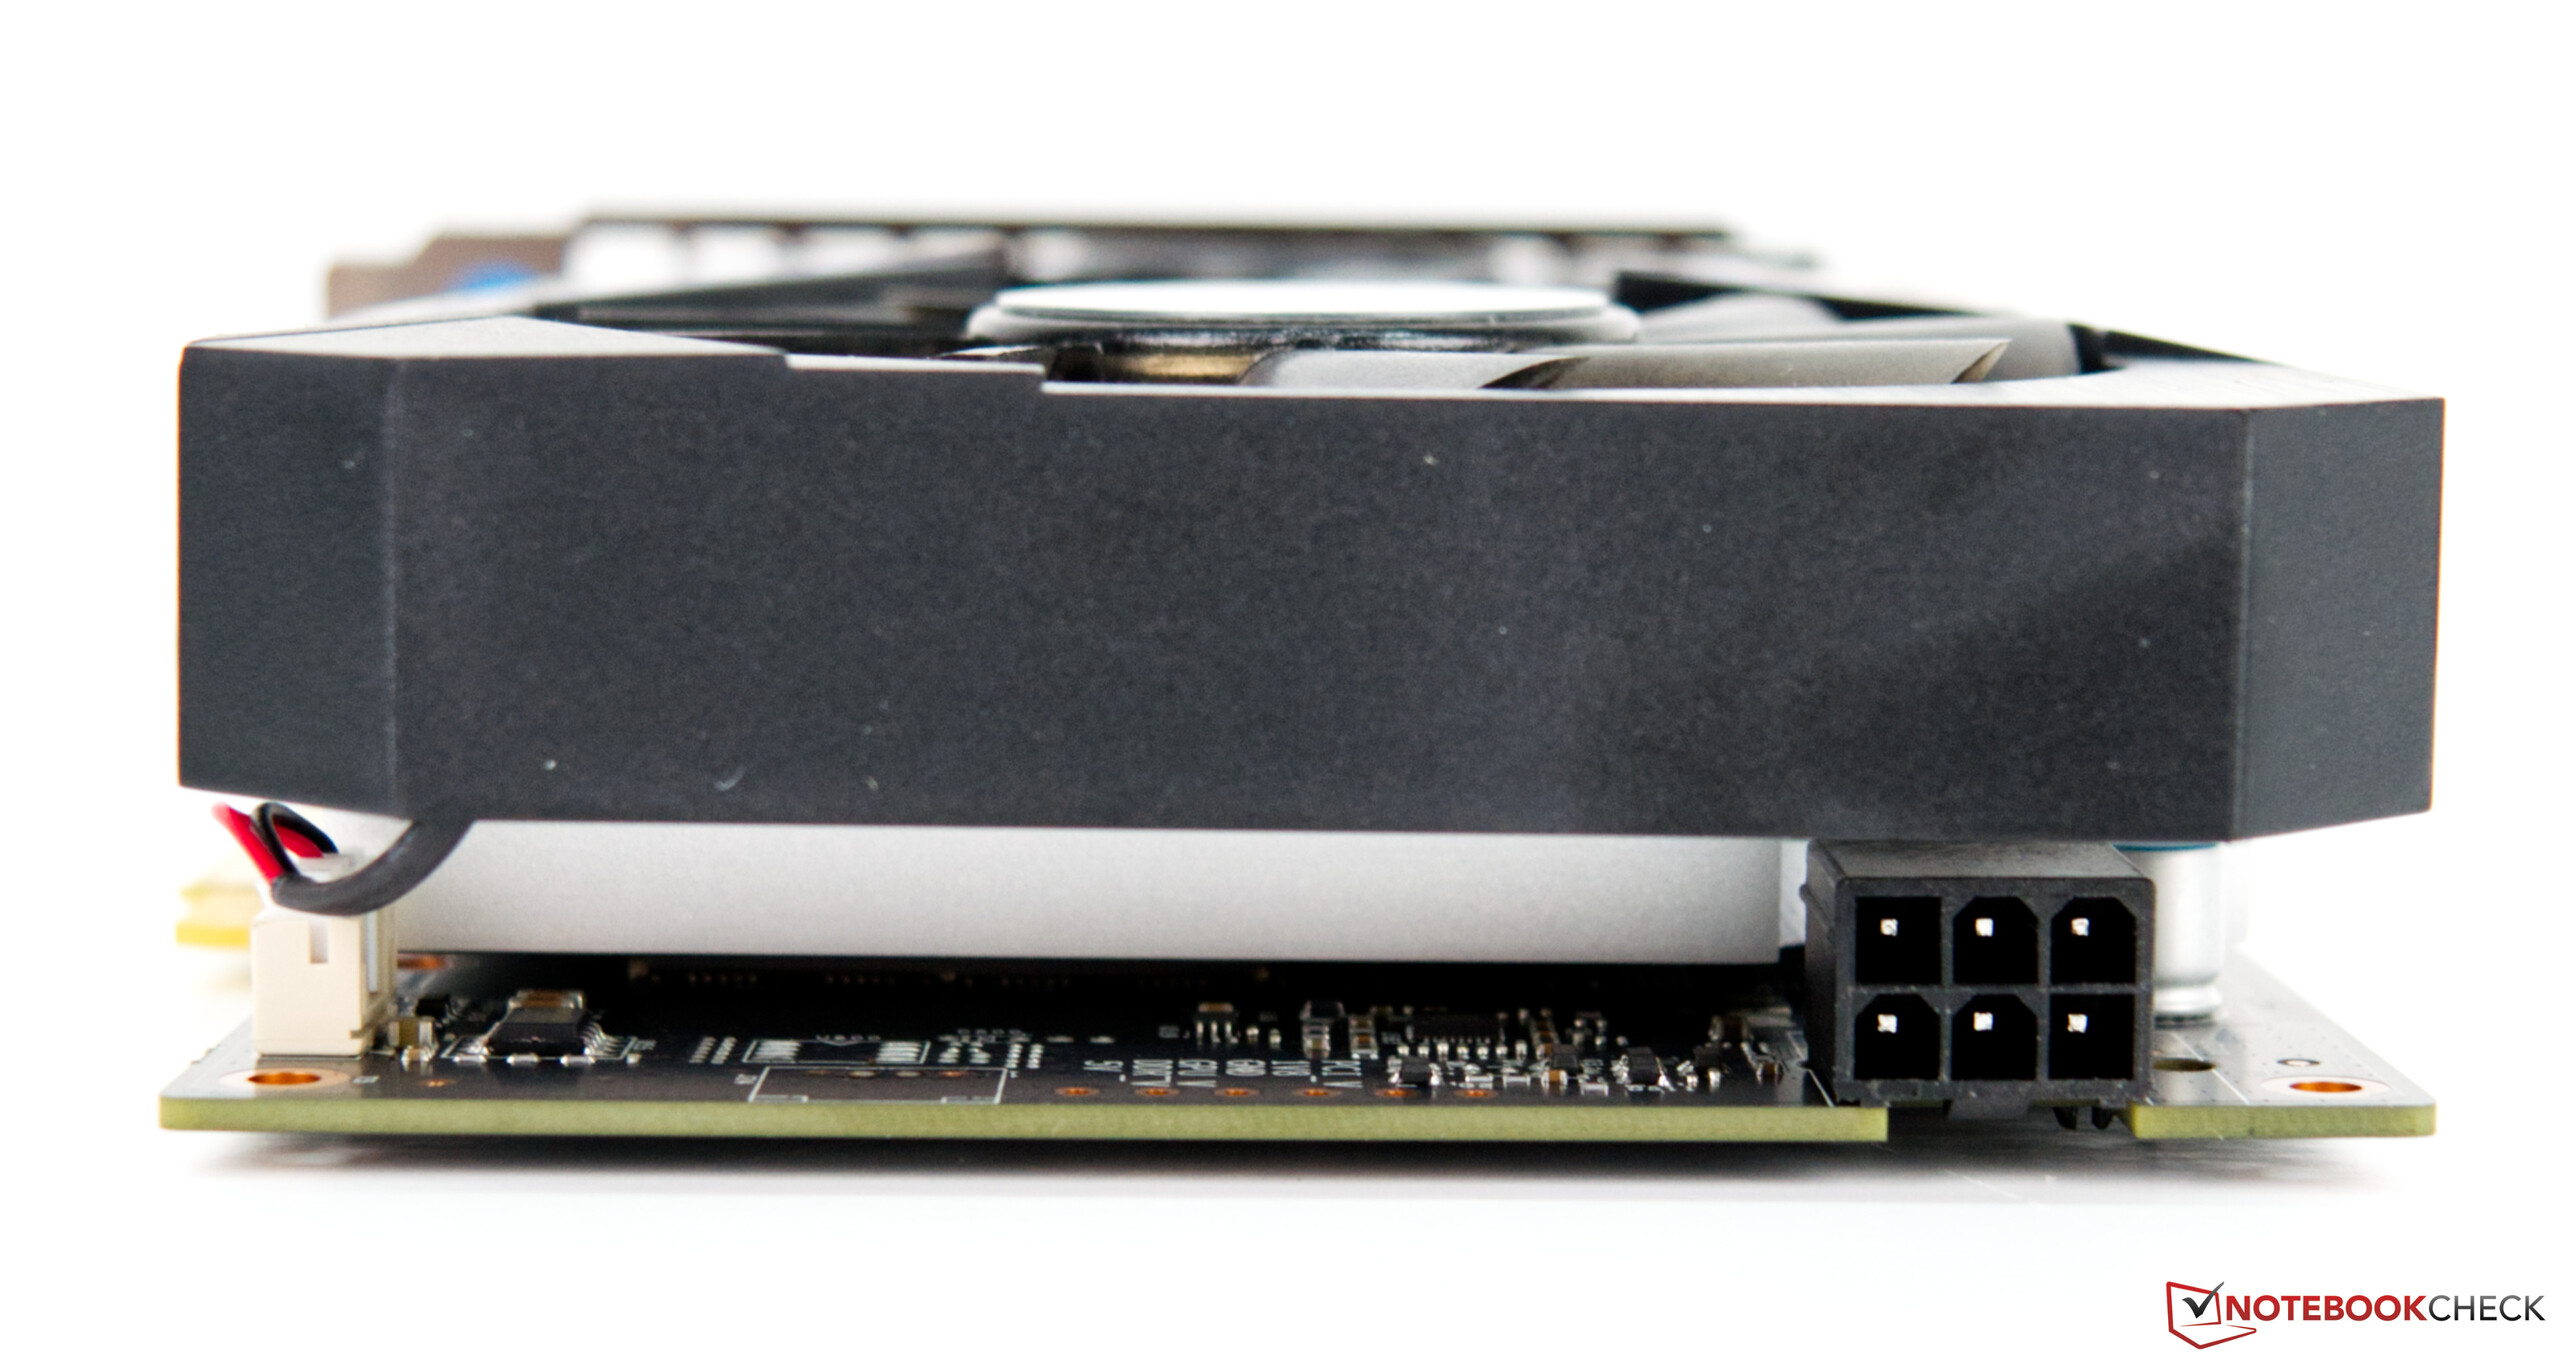
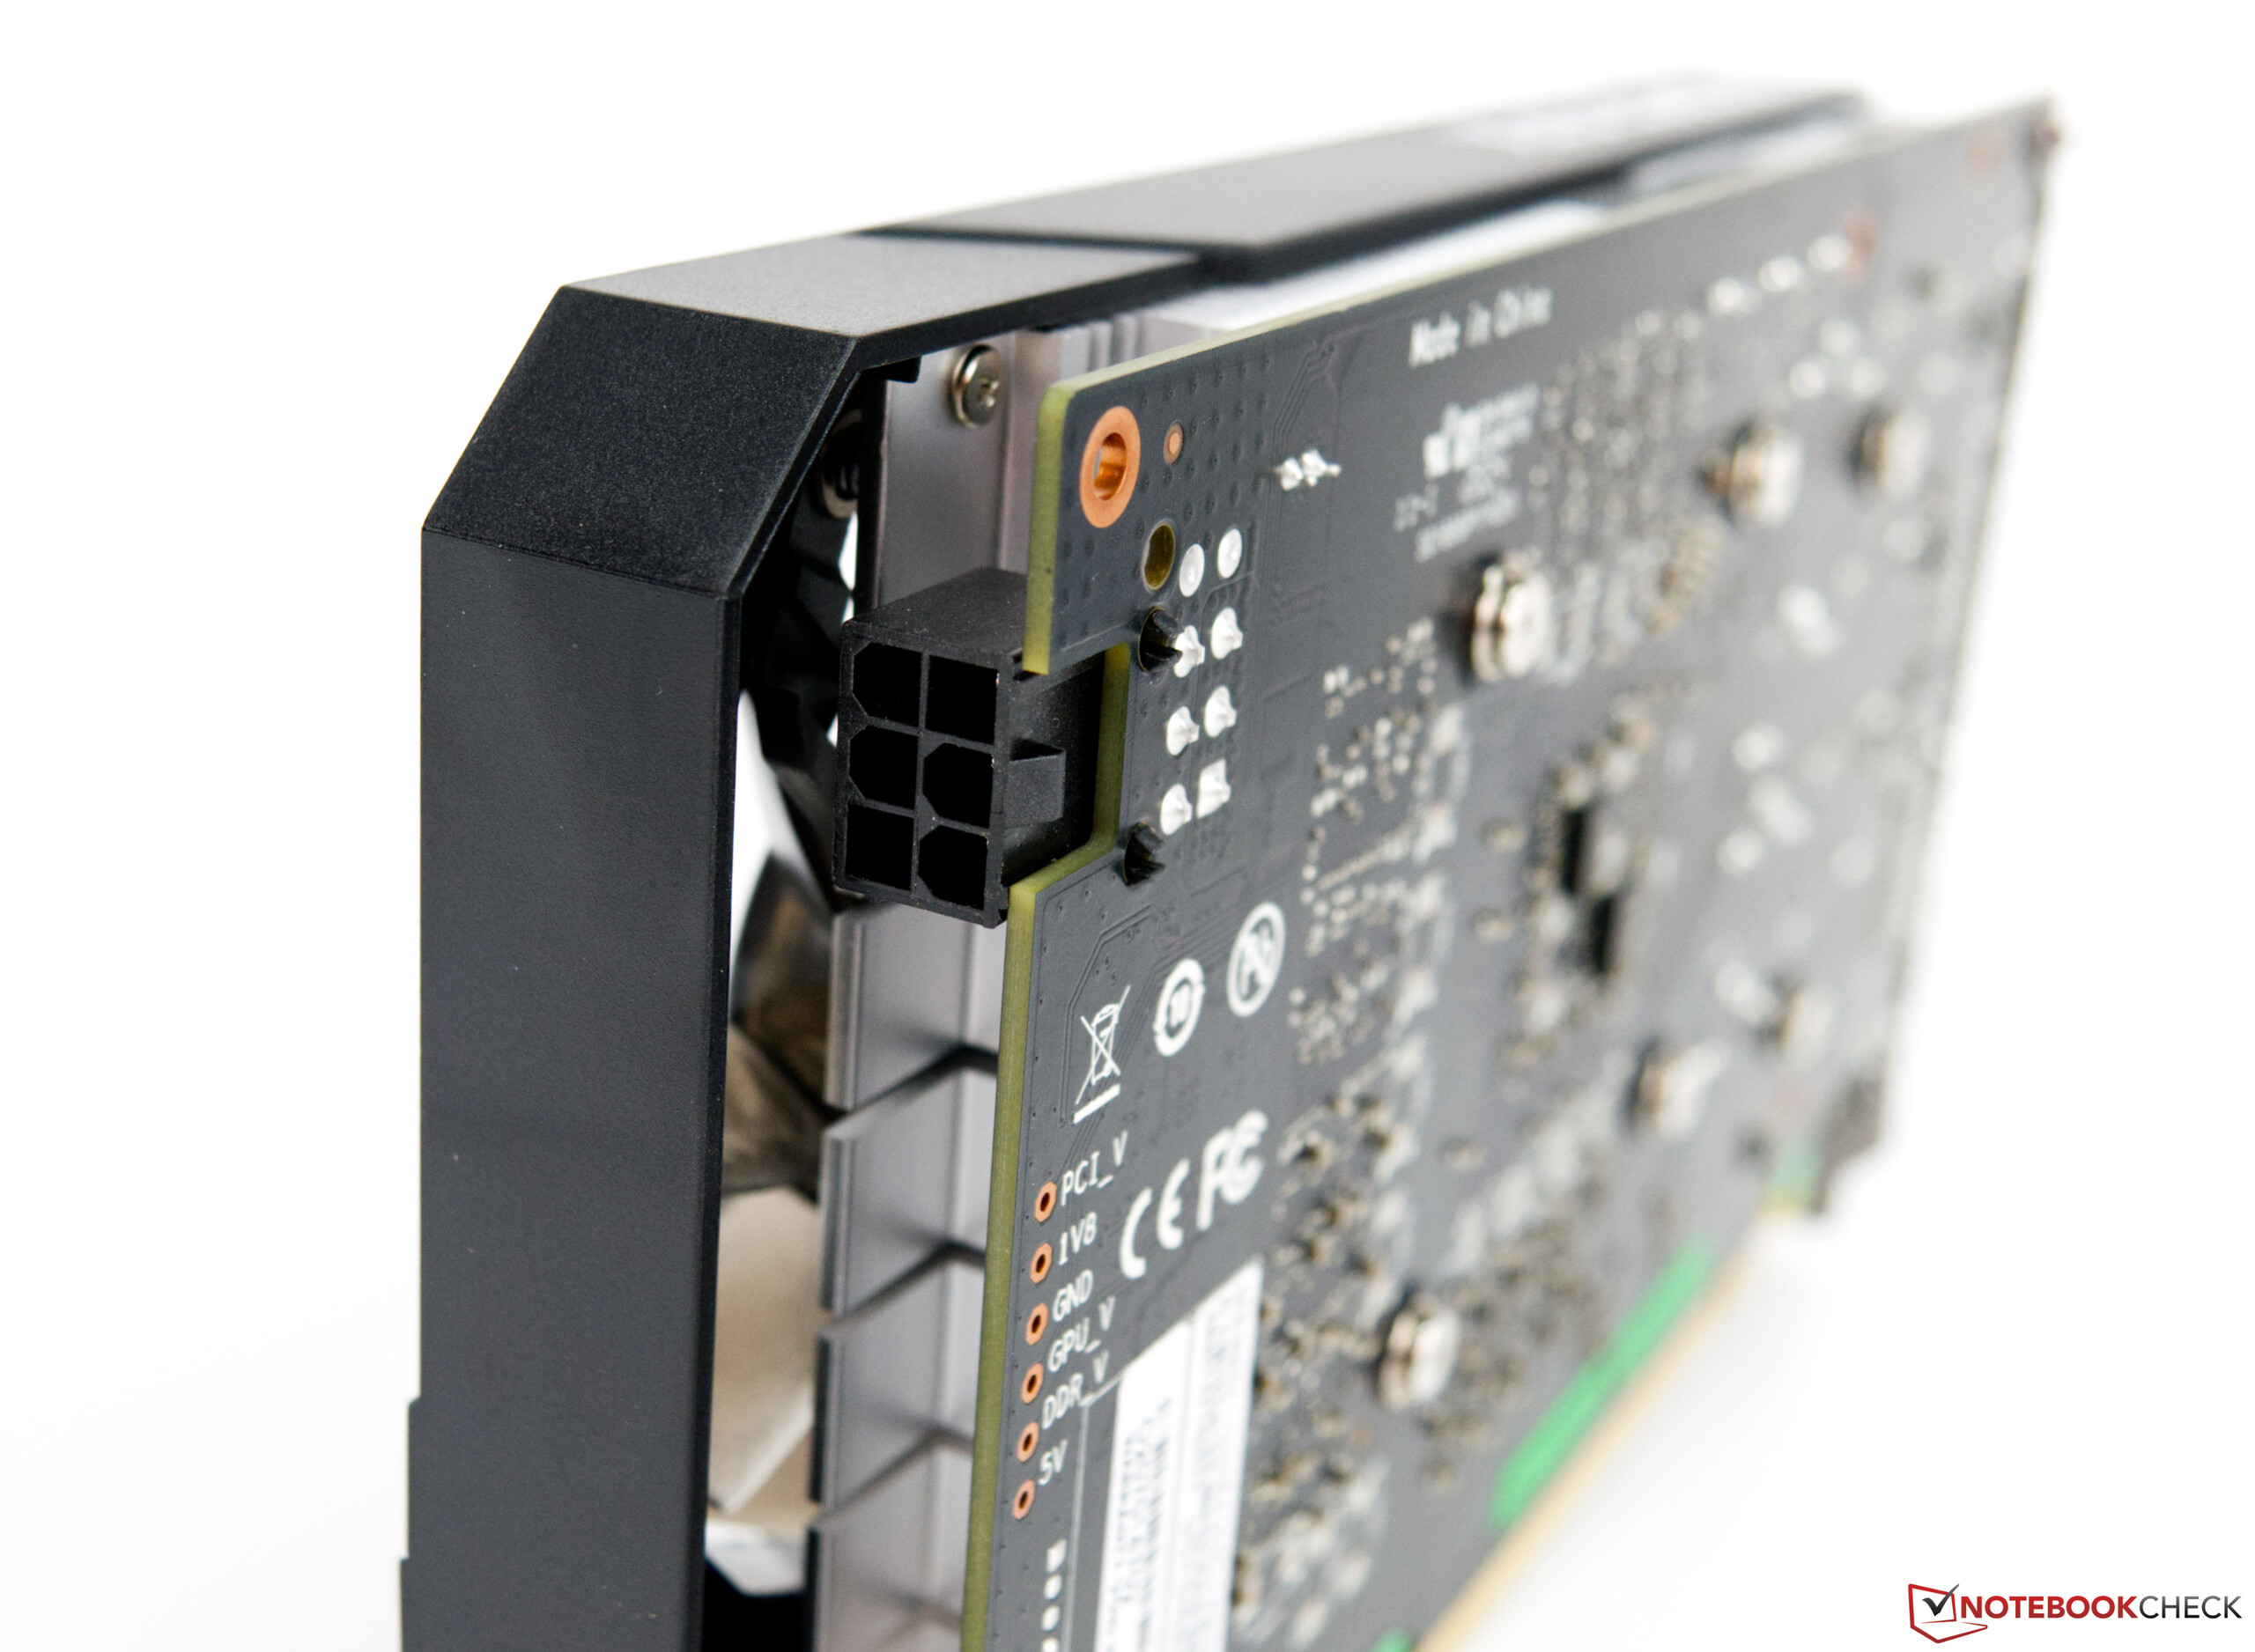
What we have here is a version of the GeForce GTX 1650 with more texture mapping units. The GPU still has 896 CUDA cores. The next step up is the GeForce GTX 1650 Super, which offers somewhat more performance thanks to its 1280 steam processors. The biggest difference between the two non-Super models is the VRAM configuration. The GTX 1650 EX Plus from KFA2 has 4 GB of faster GDDR6 VRAM with a memory bandwidth of 192 GB/s. However, there is a disadvantage to all of this. The KFA2 model requires 15 more watts of power, which is why it comes with a 6-pin power connector. The GPU can only draw 75 watts of power from the PCI slot.
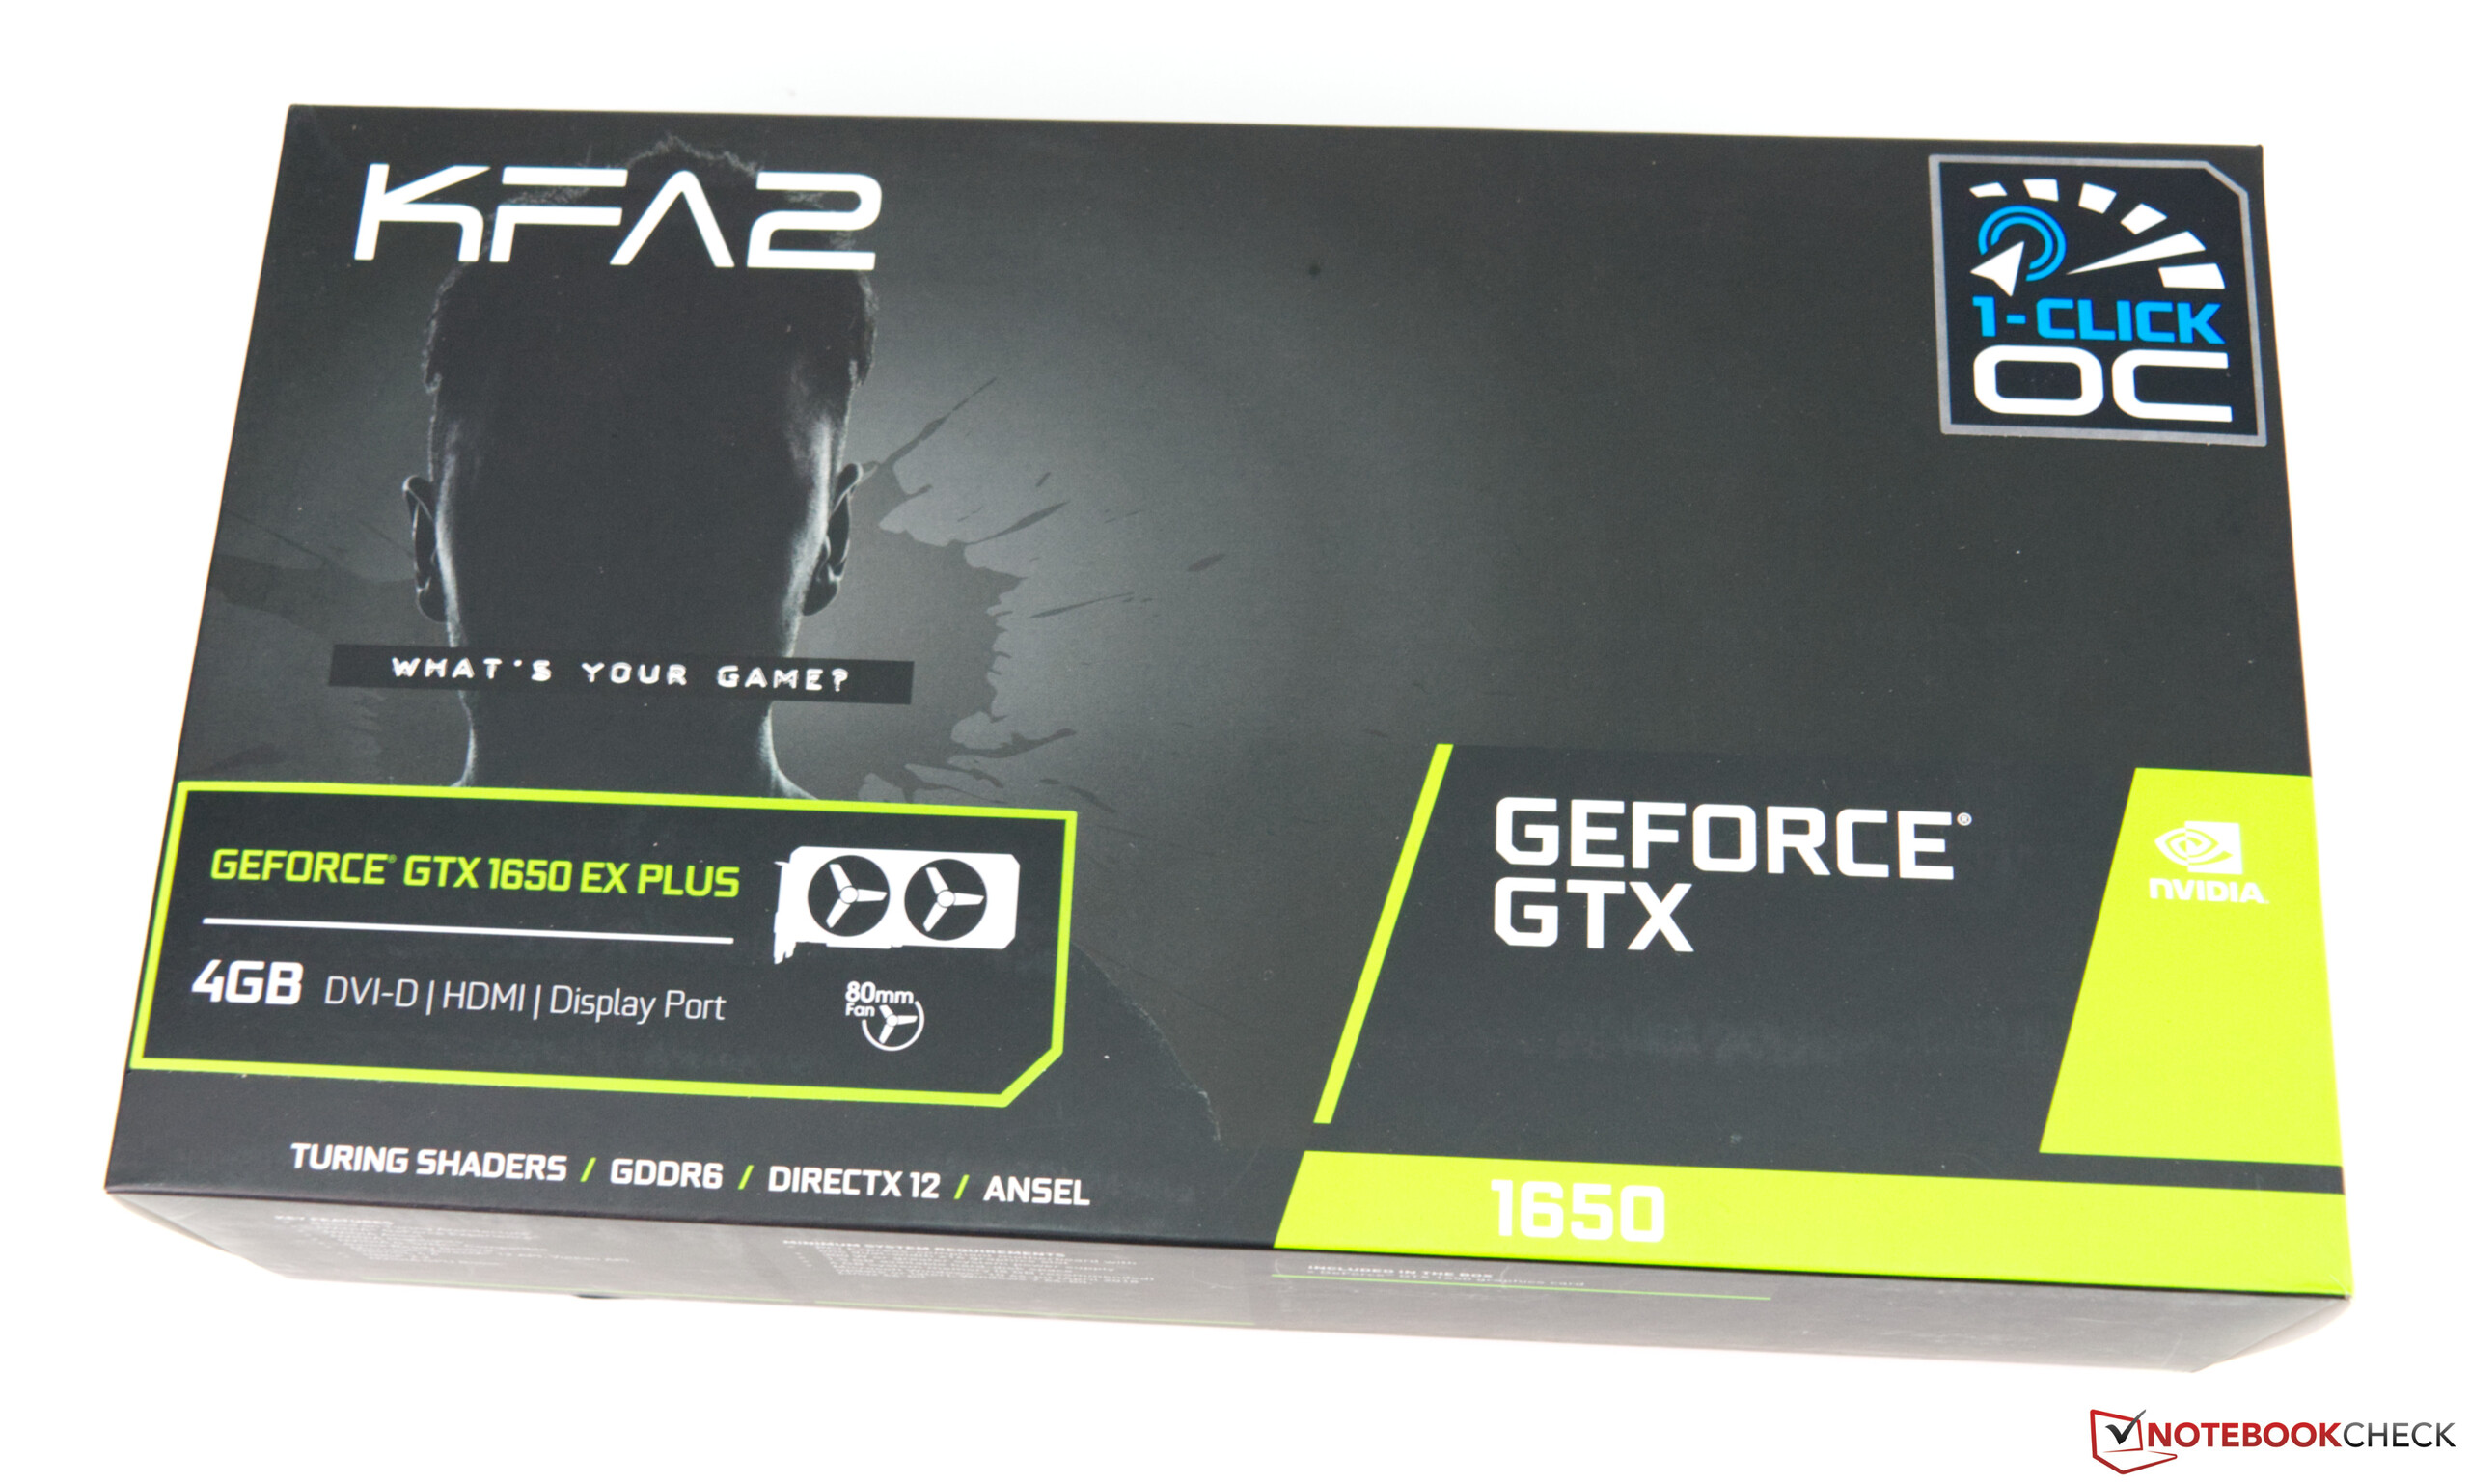
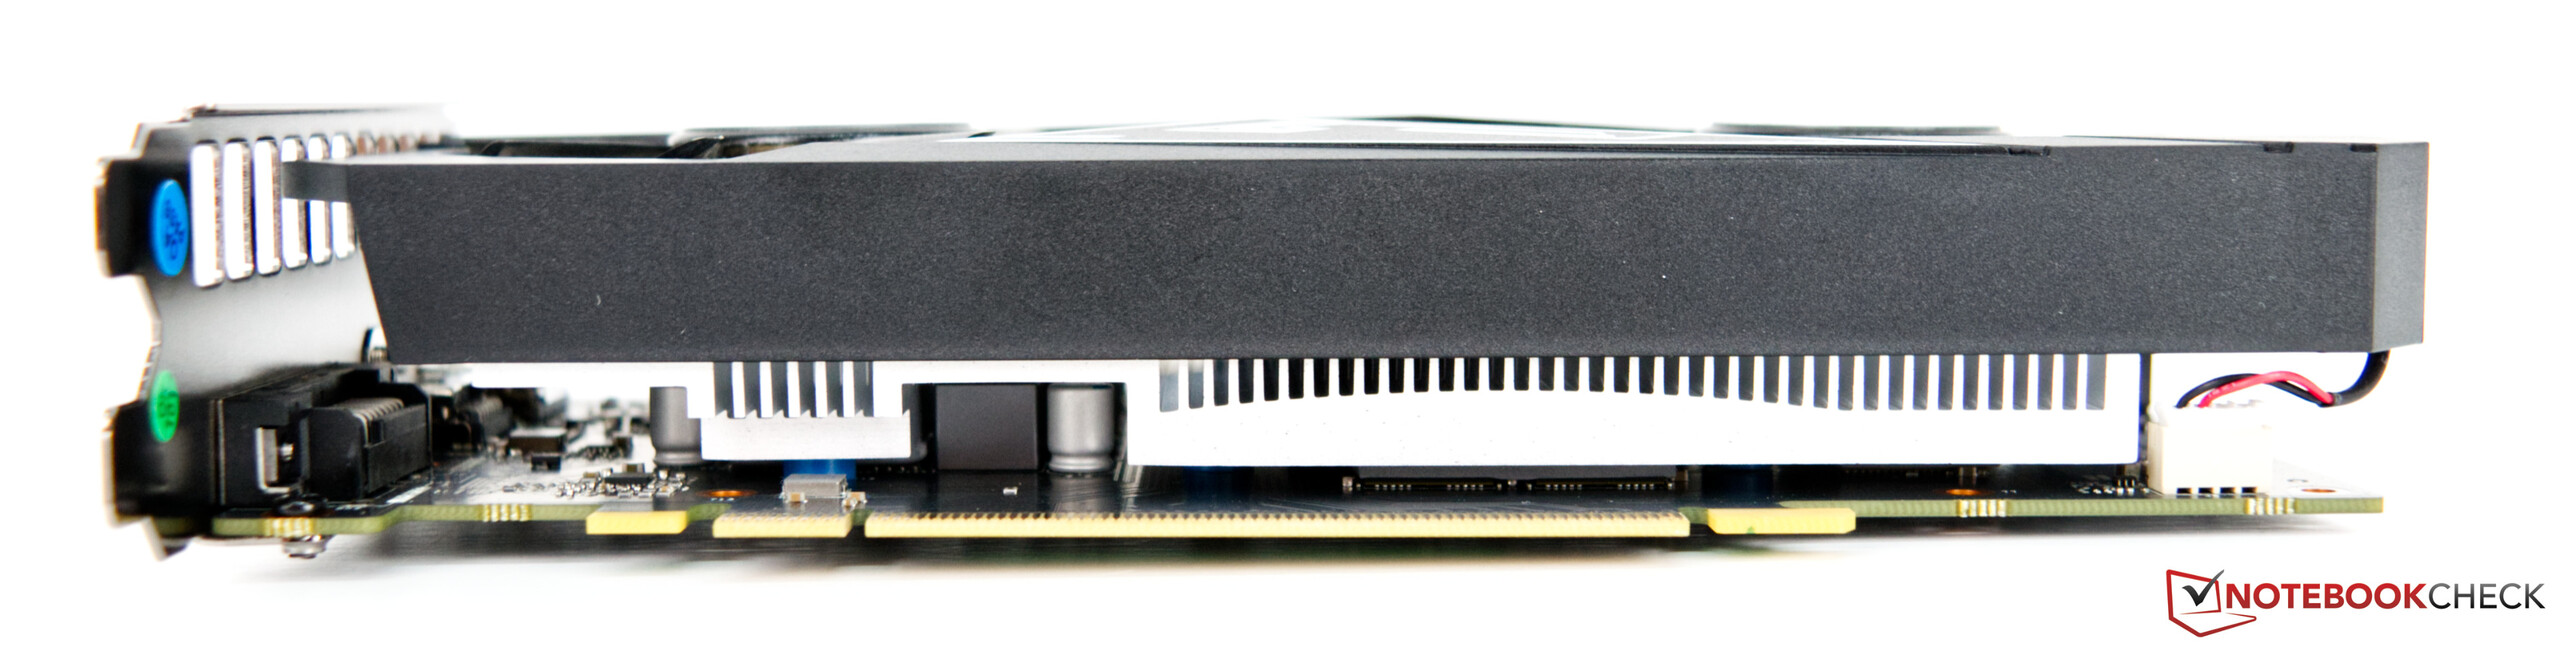
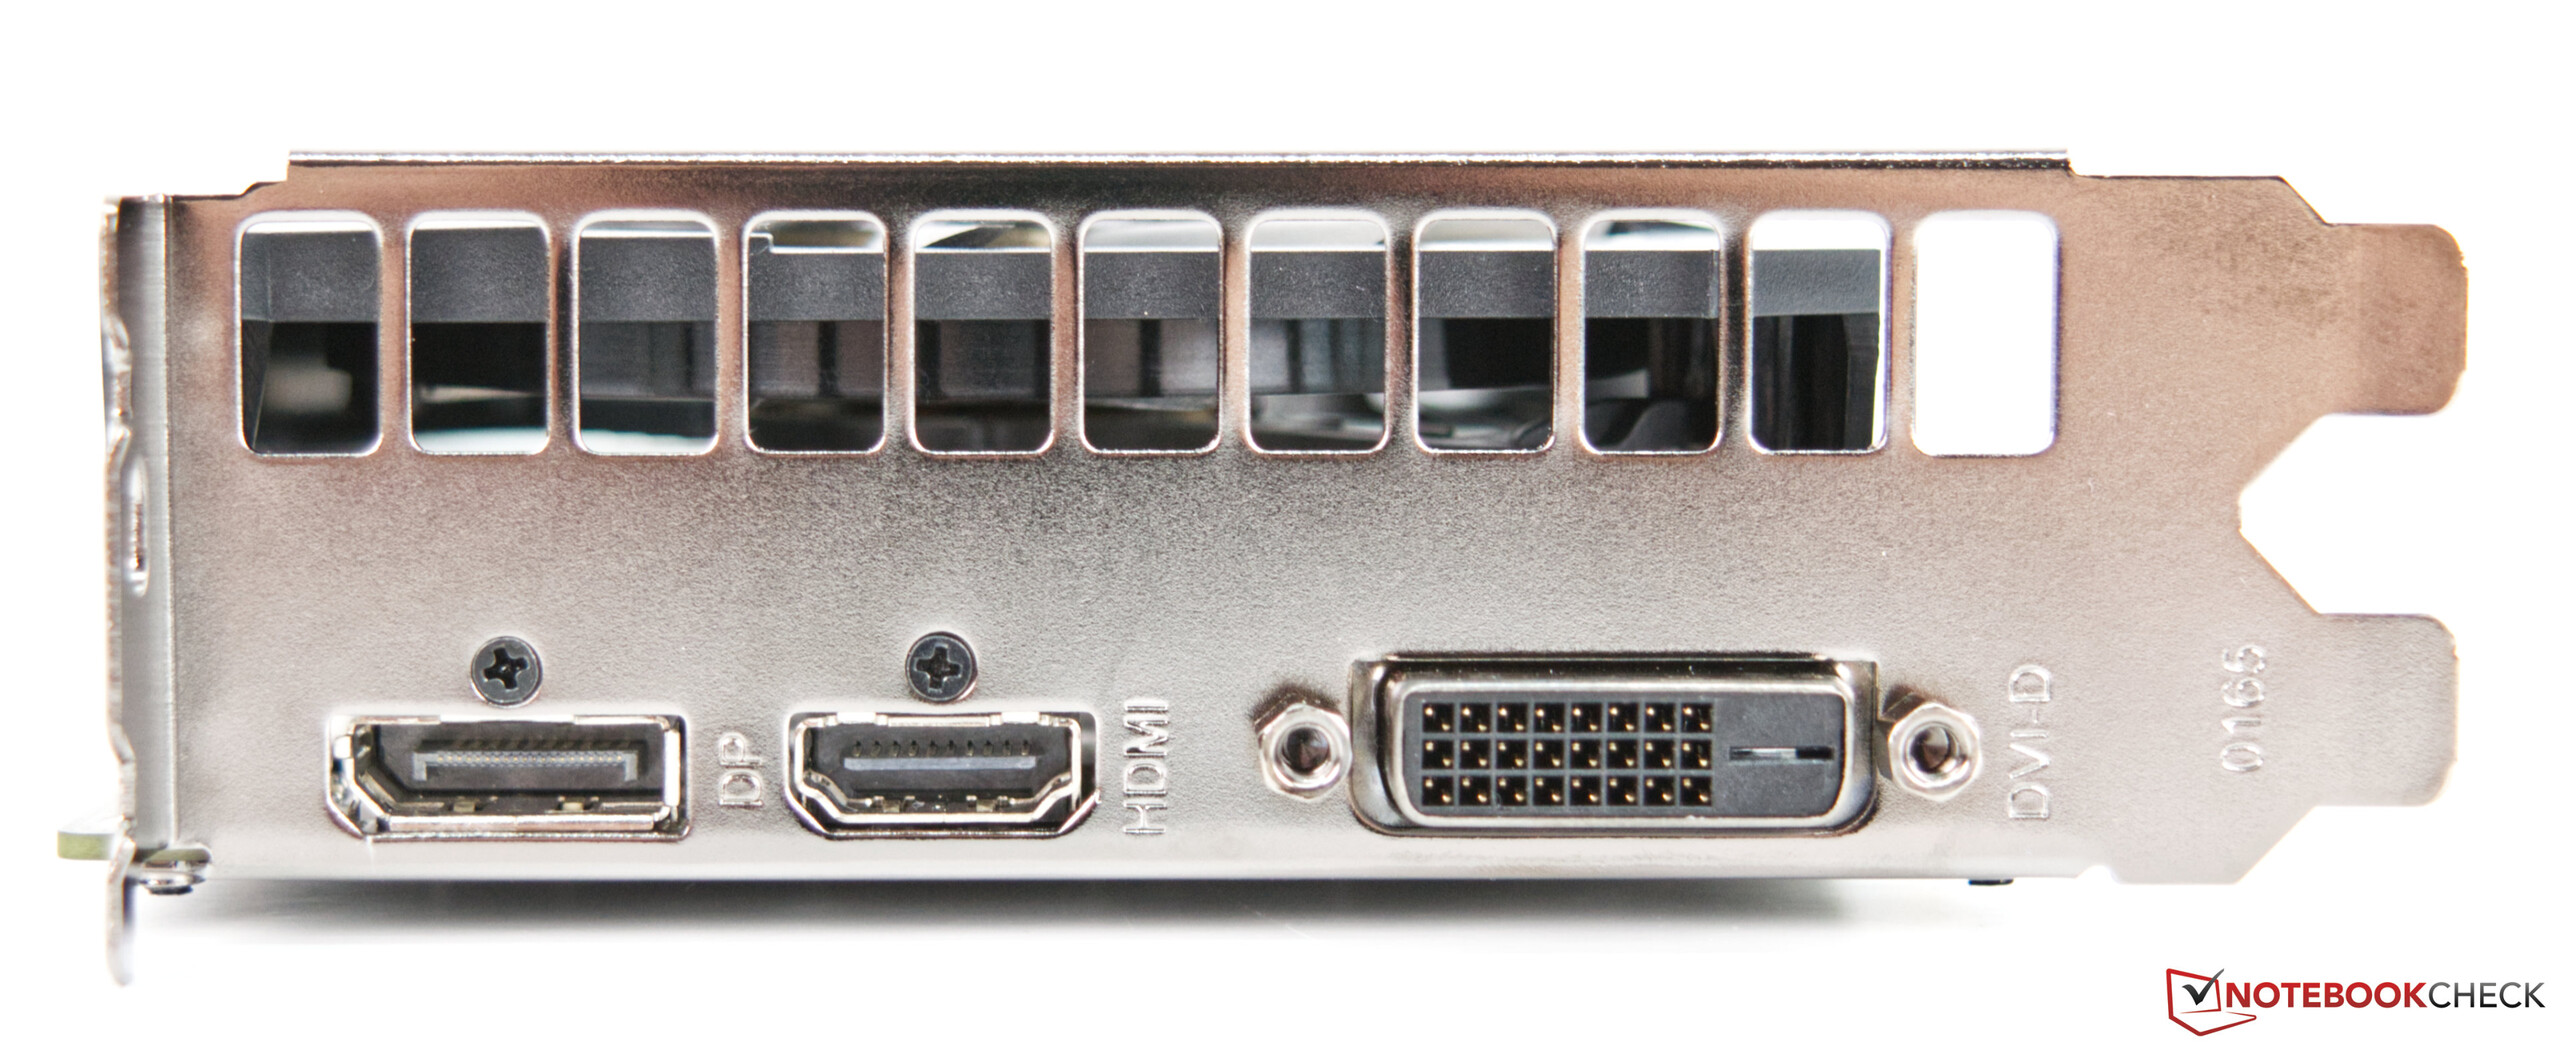
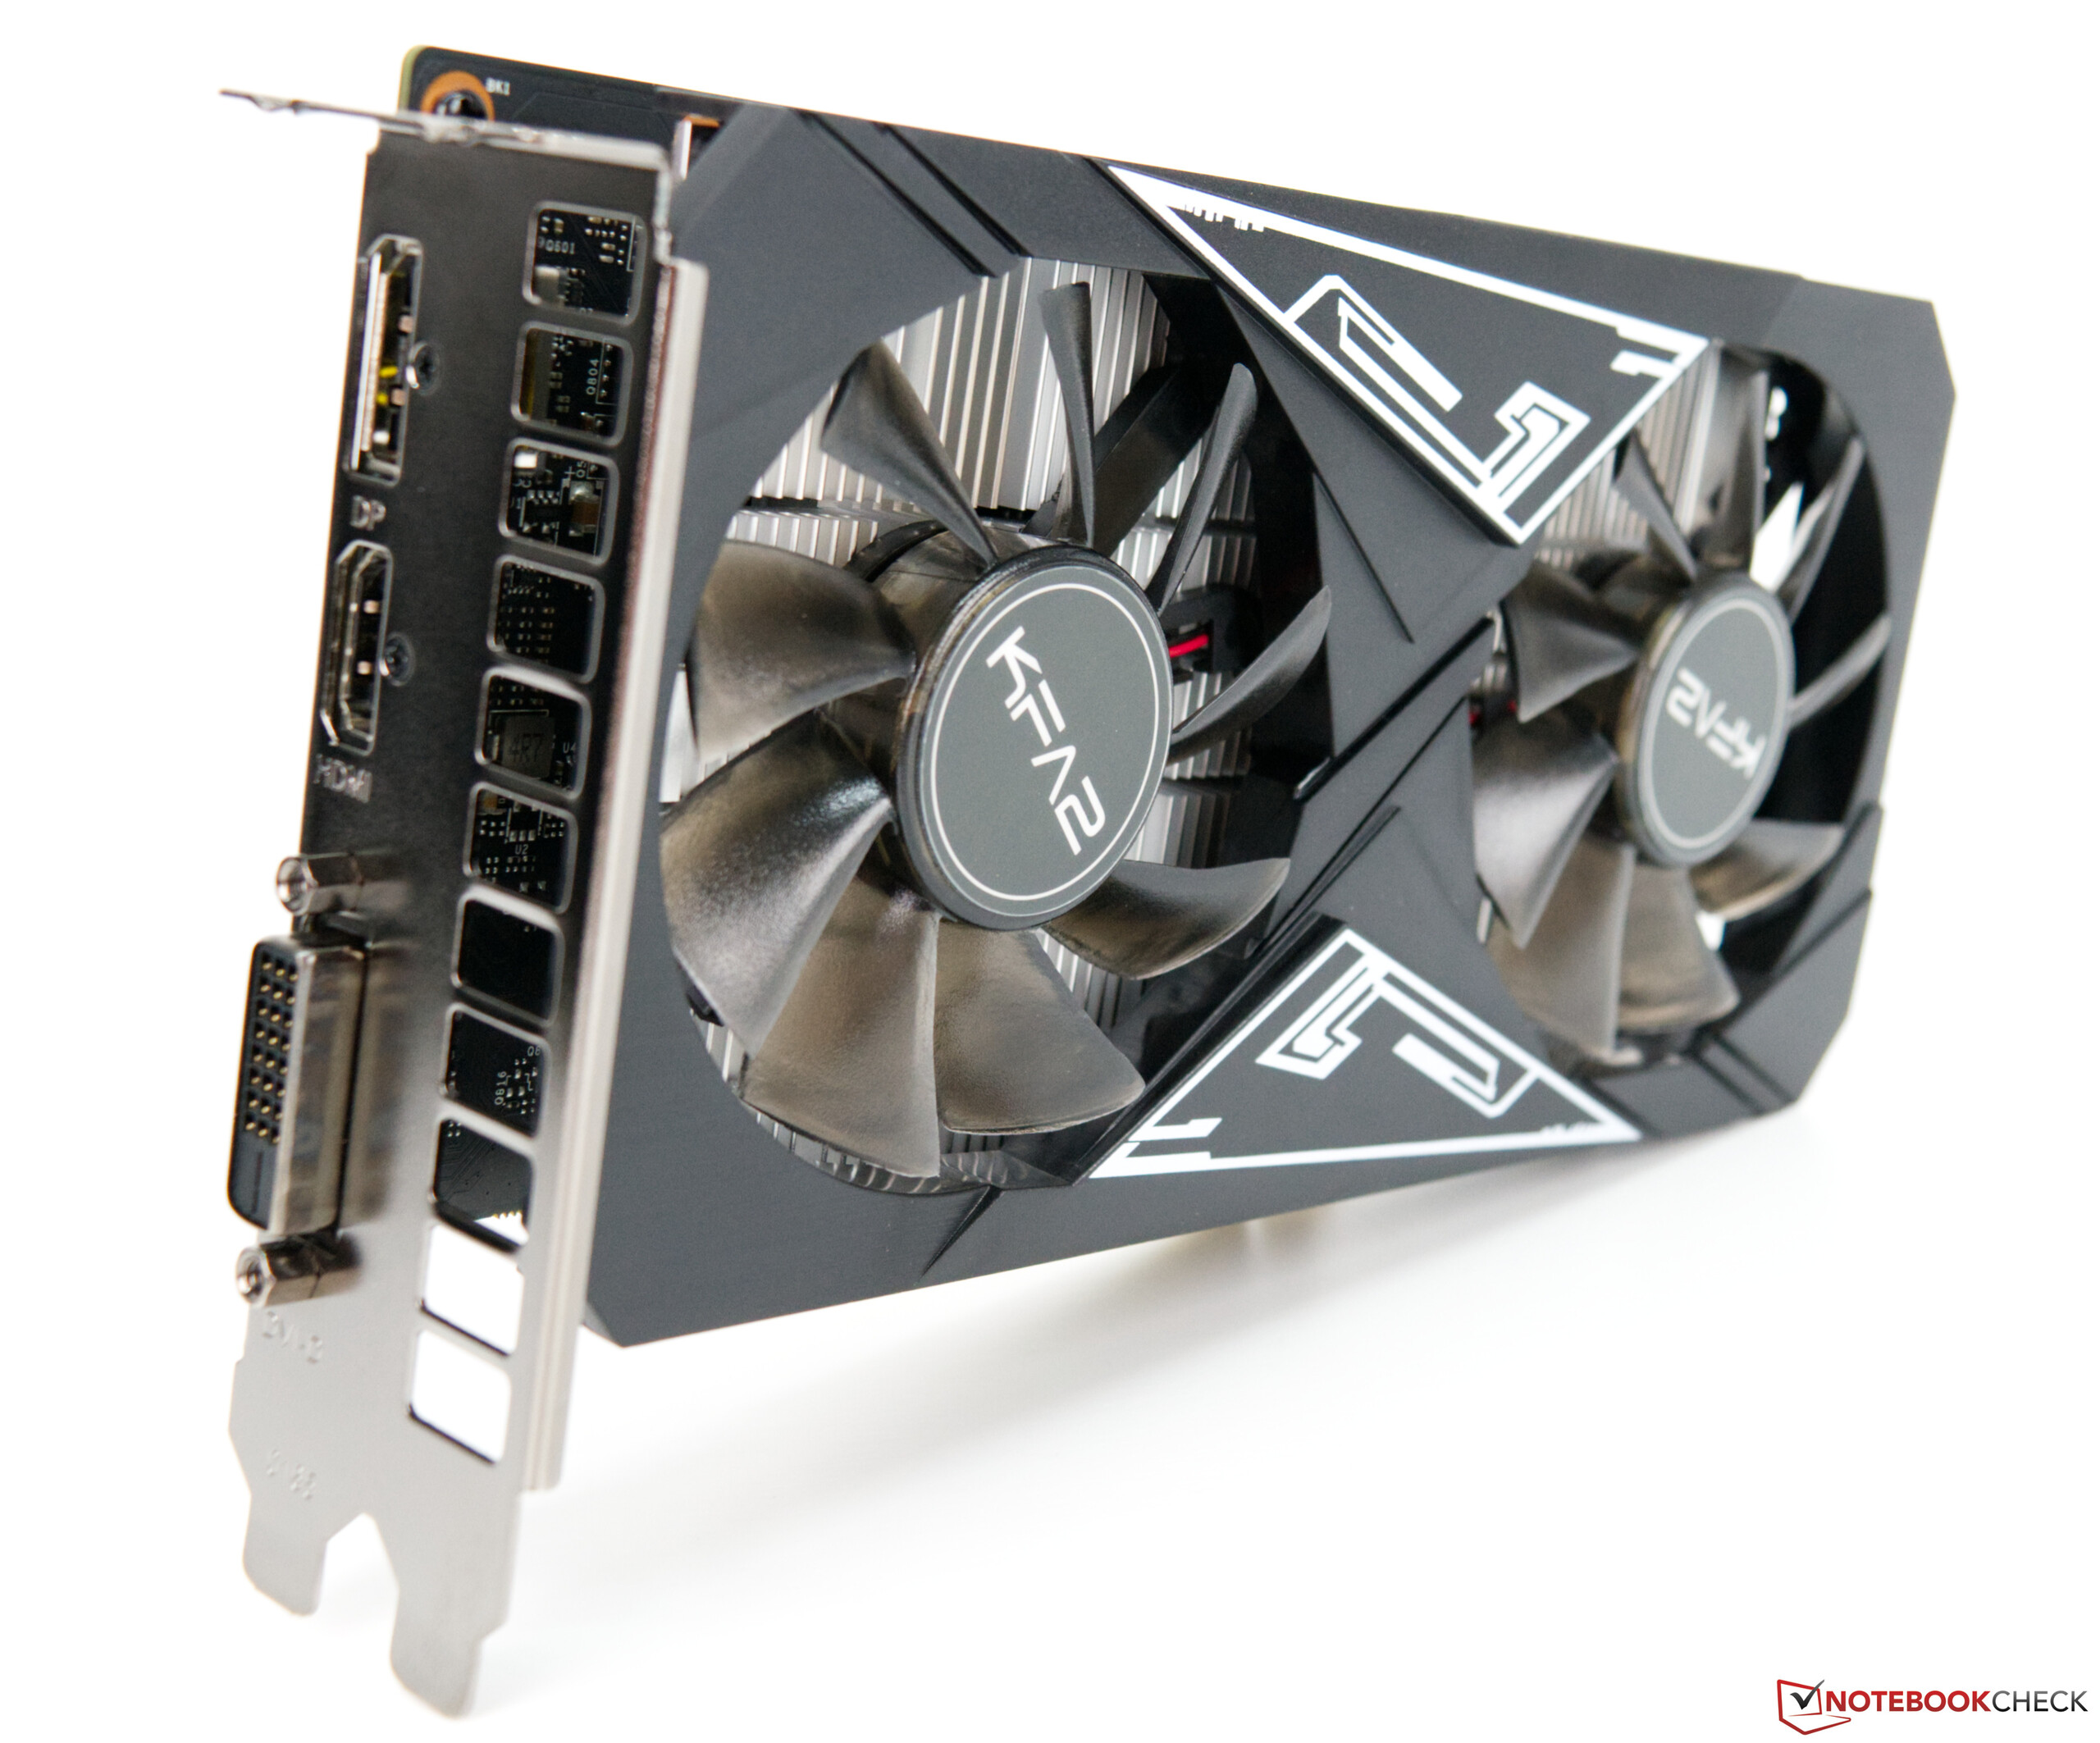
At the time of writing, the graphics card can be bought for as low as 130 Euros (~$154) from various online retailers. The video card features a DP 1.4 port, an HDMI 2.0b port and a DVI port.

Overview of the Turing GPU range
| Specifications | GTX 1650 | KFA2 GTX 1650 EX Plus | GTX 1650 Super | GTX 1660 | GTX 1660 Super | GTX 1660 Ti | RTX 2060 | RTX 2060 Super | RTX 2070 | RTX 2070 Super | RTX 2080 | RTX 2080 Super | RTX 2080 Ti |
| GPU name | TU117 | TU117 | TU116 | TU116 | TU116 | TU116 | TU106 | TU106 | TU106 | TU104 | TU104 | TU104 | TU102 |
| Manufacturing process | 12 nm | 12 nm | 12 nm | 12 nm | 12 nm | 12 nm | 12 nm | 12 nm | 12 nm | 12 nm | 12 nm | 12 nm | 12 nm |
| CUDA Cores | 896 | 896 | 1.280 | 1.408 | 1.408 | 1.536 | 1.920 | 2.176 | 2.304 | 2.560 | 2.944 | 3.072 | 4.352 |
| TMUs | 56 | 74 | 80 | 88 | 88 | 96 | 120 | 136 | 144 | 160 | 184 | 192 | 272 |
| Tensor Cores | - | - | - | - | - | - | 240 | 272 | 288 | 320 | 368 | 384 | 544 |
| RT Cores | - | - | - | - | - | - | 30 | 34 | 36 | 40 | 46 | 48 | 68 |
| Base Clock | 1.485 MHz | 1.410 MHz | 1.530 MHz | 1.530 MHz | 1.530 MHz | 1.500 MHz | 1.365 MHz | 1.470 MHz | 1.410 MHz | 1.605 MHz | 1.515 MHz | 1.650 MHz | 1.350 MHz |
| Boost Clock | 1.665 MHz | 1.605 MHz | 1.725 MHz | 1.785 MHz | 1.785 MHz | 1.770 MHz | 1.680 MHz | 1.650 MHz | 1.620 MHz | 1.770 MHz | 1.710 MHz | 1.815 MHz | 1.545 MHz |
| Memory Bus Width | 128 Bits | 128 Bits | 128 Bits | 192 Bits | 192 Bits | 192 Bits | 192 Bits | 256 Bits | 256 Bits | 256 Bits | 256 Bits | 256 Bits | 352 Bits |
| Memory Bandwidth | 128 GB/s | 192 GB/s | 192 GB/s | 192.1 GB/s | 336 GB/s | 288 GB/s | 336 GB/s | 448 GB/s | 448 GB/s | 448 GB/s | 448 GB/s | 496,1 GB/s | 616 GB/s |
| Frame Buffer | 4 GB GDDR5 | 4 GB GDDR6 | 4 GB GDDR6 | 6 GB GDDR5 | 6 GB GDDR6 | 6 GB GDDR6 | 6 GB GDDR6 | 6 GB GDDR6 | 8 GB GDDR6 | 8 GB GDDR6 | 8 GB GDDR6 | 8 GB GDDR6 | 11 GB GDDR6 |
| GCP (in watts) | 75 W | 90 W | 100 W | 120 W | 120 W | 125 W | 160 W | 175 W | 175 W | 215 W | 215 W | 250 W | 250 W |
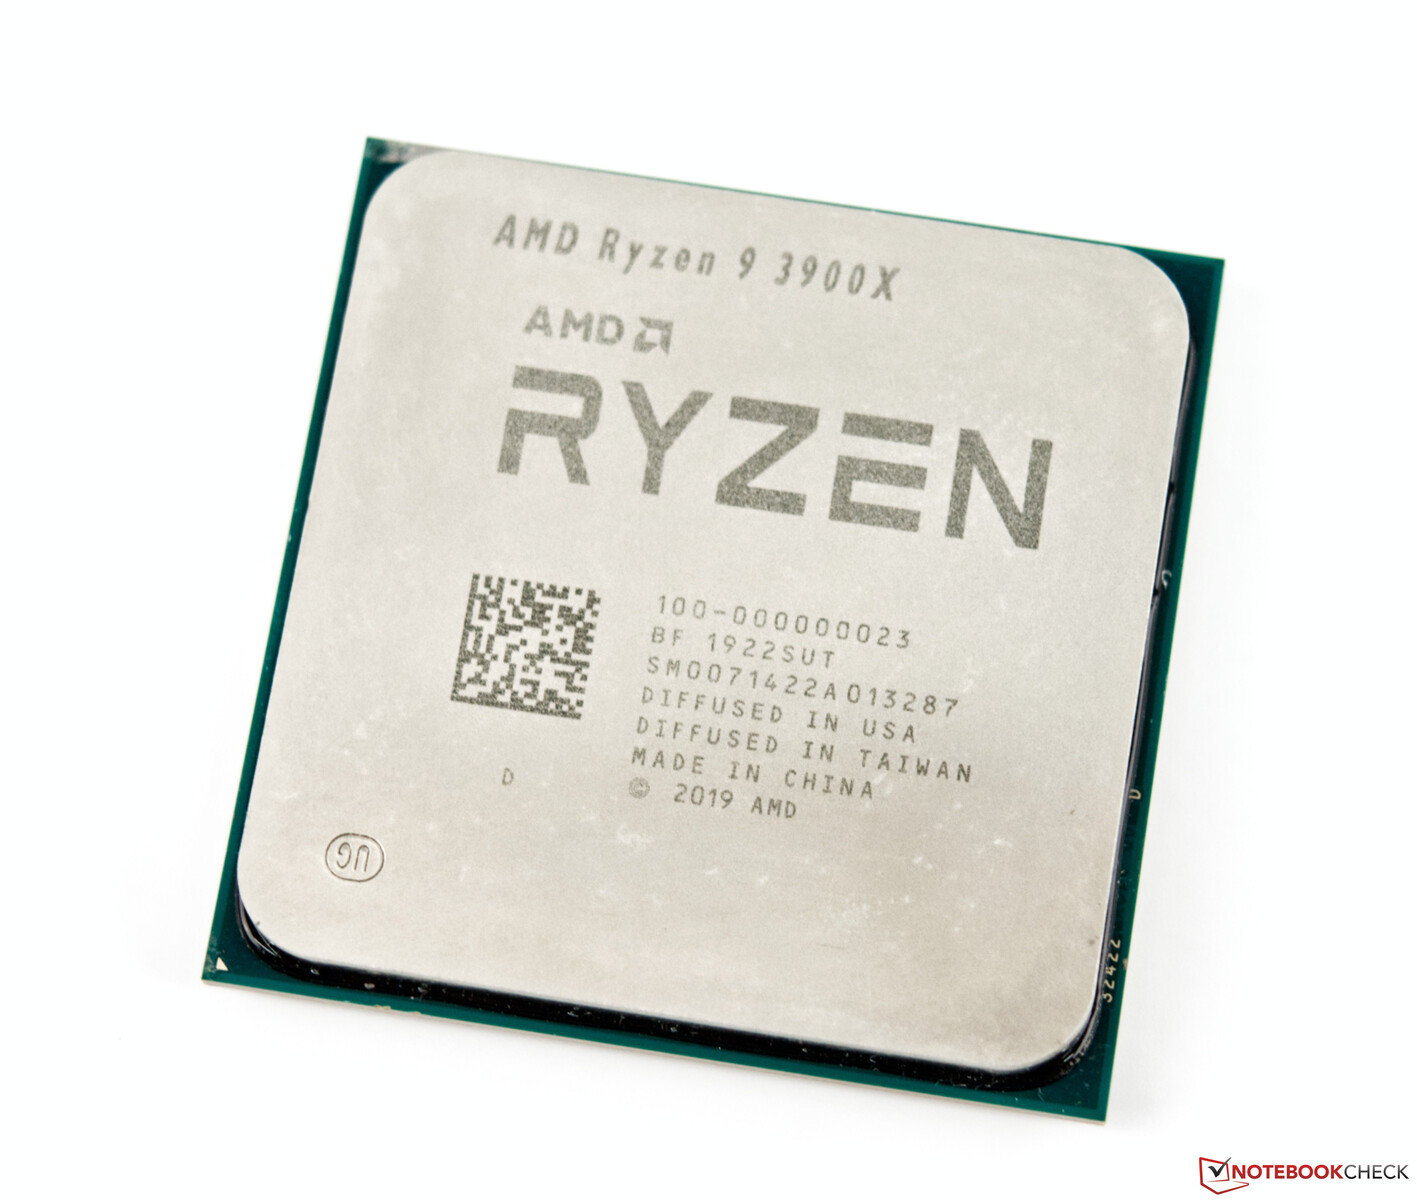
Our test bench is based on the AMD Ryzen 9 3900X
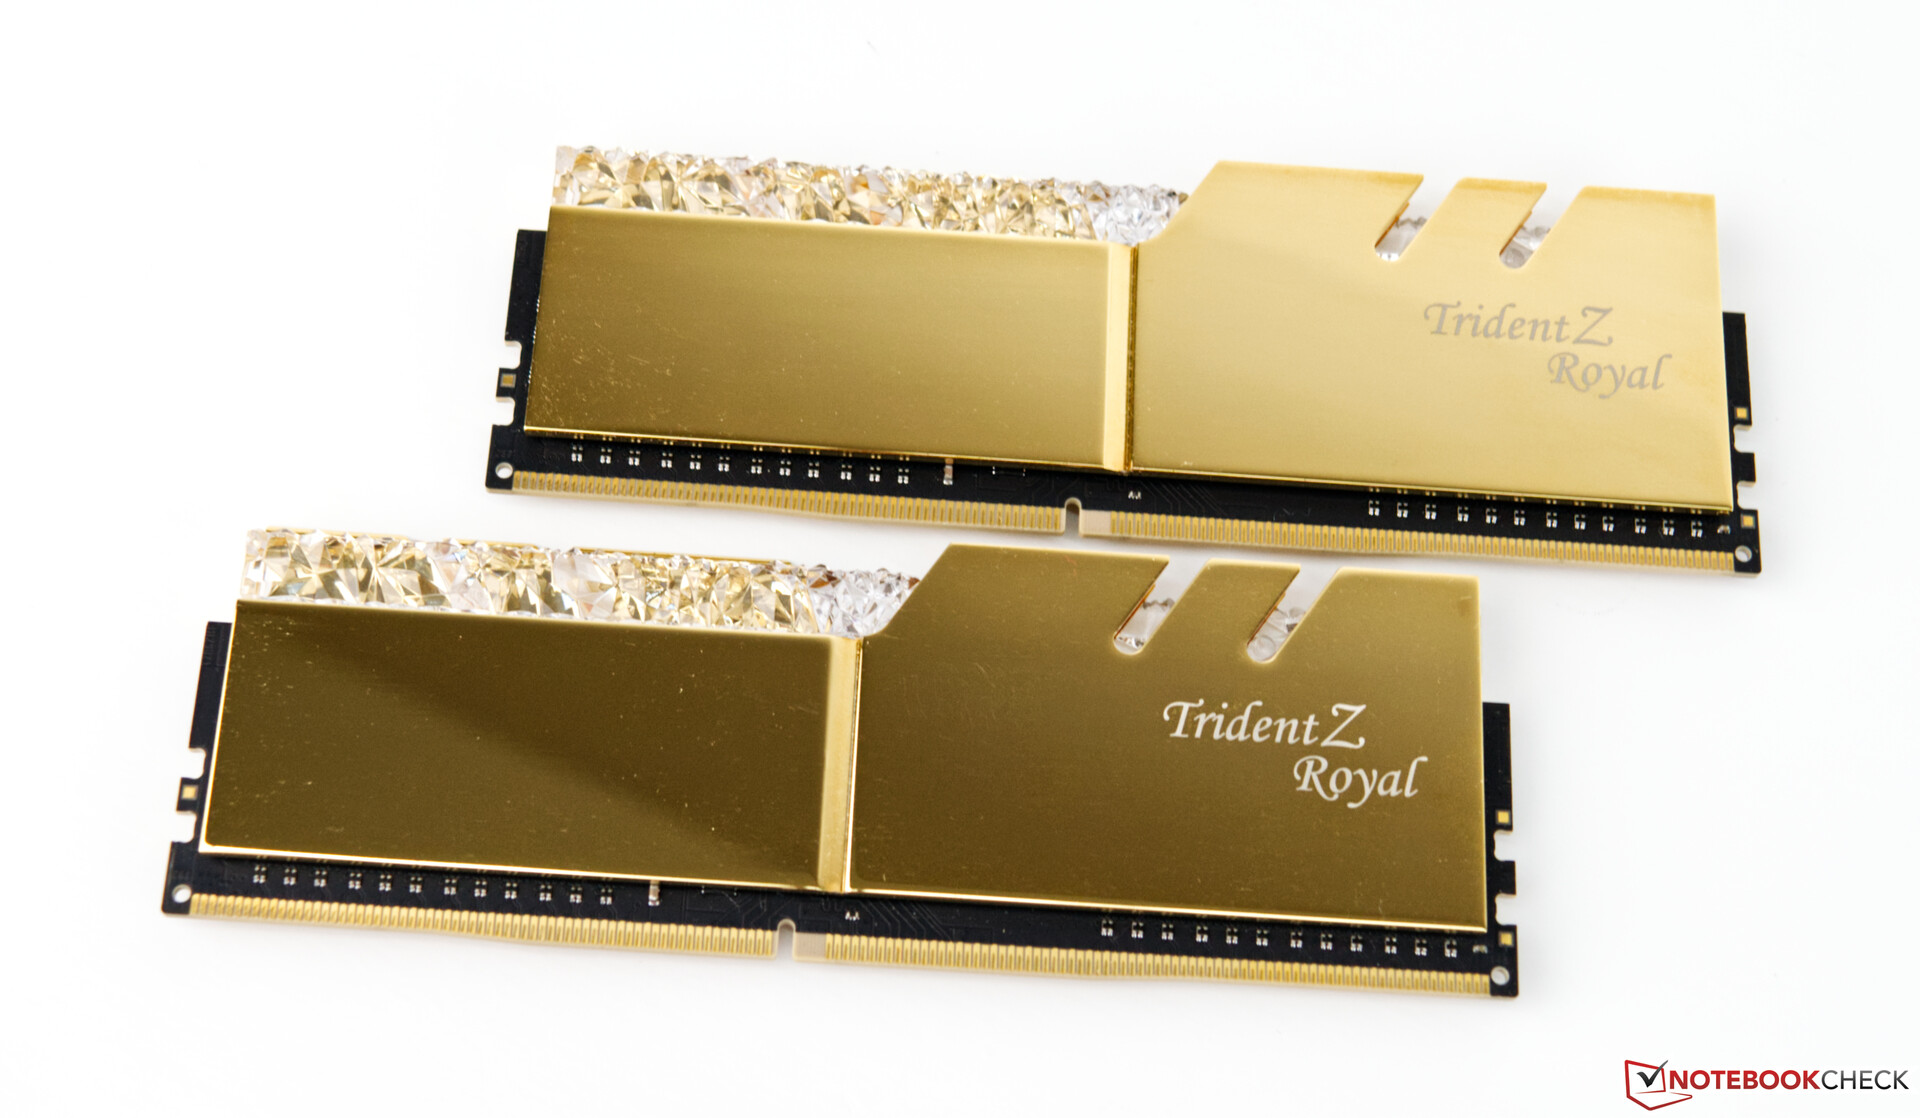
Our test bench is based on a current AMD platform. The Asus ROG Crosshair VIII Hero WiFi serves as the motherboard. The CPU, which is known as the AMD Ryzen 9 3900X, offers a lot of performance. The system is cooled by an all-in-one water cooler from Alphacool (Eisbear Aurora 360). The 16 GB of 3600 MHz RAM comes from G-Skill. Our monitor, (Acer Predator XB321HK) does not represent a bottleneck, thanks to its 4K resolution.
More information about our test bench - AMD vs. Intel
We used the following system to carry out our benchmarks:
- Raijintek Pean benchtable
- AMD Ryzen 9 3950X
- Asus ROG Crosshair VIII Hero WiFi
- Alphacool Eisbear Aurora 360
- KFA2 GeForce GTX 1650 EX Plus (1-Click OC)
- Corsair RM 1000X power supply
- G-Skill Trident Z Royal Gold DDR4 3600 memory kit, 2 x 8 GB, frequency: 3600 MHz; timings: CL16-16-16-36
- Corsair MP600 2TB M.2 PCIe 4.0 SSD
- Crucial MX500 2TB (for gaming)
- 64-it version of Microsoft Windows 10 Professional (Build 2004)
We thank Caseking for providing us with the Raijintek Pean test bench, which features custom laser engravings. AMD provided us with the Ryzen 9 3900X, the mother board, the RAM and the Corsair MP600. Our cooling solution, Alphacool Eisbear Aurora 360, was provided to us courtesy of Alphacool.
The Core Clocks of the KFA2 GeForce GTX 1650 EX Plus (1-Click OC)
The KFA2 model has lower core clocks than the reference model. However, it uses faster GDDR6 VRAM. The numbers of TMUs has been increased from 56 to 74, which should result in a significant boost in performance when compared to the older GeForce GTX 1650. To remove power bottlenecks, the TGP has been upped to 90 watts, which allows the GPU to achieve stable boost clocks of 1605 MHz in our particular case. Just like almost all other KFA2 GPUs, the GeForce GTX 1650 EX Plus comes with the 1-Click OC feature. It can be activated in the utility known as Xtreme Tuner. Doing so will increase the GPU clocks by 30 MHz. This is a step in the right direction, because ofttimes the 1-Click OC feature offered only a 15 MHz clock boost. In our view, a 50 or 75 MHz core clock boost in combination with a simultaneous increase in memory speed would have been more tenable. However, the memory speed is not changed.

Synthetic Benchmarks
By looking at the specifications sheet one can infer the KFA2 GeForce GTX 1650 EX Plus is likely to slot in between the GeForce GTX 1650 and the GeForce GTX 1660. This is exactly the case in our synthetic benchmarks. The KFA2 GeForce GTX 1650 EX Plus is beaten by the AMD Radeon RX 570. The first NVIDIA GPU, which is able to outperform the RX 570, is the GTX 1660 Super.
| Performance rating - Percent | |
| AMD Radeon RX 5700 XT -1! | |
| Nvidia GeForce RTX 2060 Super -31! | |
| KFA2 GeForce RTX 2060 Super | |
| AMD Radeon RX 5700 -1! | |
| Sapphire AMD Radeon RX 5600 XT -9! | |
| MSI RTX 2060 Gaming Z 6G | |
| Zotac GeForce GTX 1660 Ti 6 GB | |
| XFX AMD Radeon RX 590 OC+ 8 GB -3! | |
| KFA 2 GeForce GTX 1660 Super | |
| Sapphire NITRO+ RX 570 8 GB -1! | |
| PNY GeForce GTX 1660 | |
| KFA2 GeForce GTX 1650 EX One Click Plus | |
| Gainward GeForce GTX 1650 4 GB | |
| 3DMark 11 - 1280x720 Performance GPU | |
| AMD Radeon RX 5700 XT | |
| AMD Radeon RX 5700 | |
| Sapphire AMD Radeon RX 5600 XT | |
| Nvidia GeForce RTX 2060 Super | |
| KFA2 GeForce RTX 2060 Super | |
| MSI RTX 2060 Gaming Z 6G | |
| XFX AMD Radeon RX 590 OC+ 8 GB | |
| Zotac GeForce GTX 1660 Ti 6 GB | |
| KFA 2 GeForce GTX 1660 Super | |
| PNY GeForce GTX 1660 | |
| Sapphire NITRO+ RX 570 8 GB | |
| Gainward GeForce GTX 1650 4 GB | |
| KFA2 GeForce GTX 1650 EX One Click Plus | |
| Unigine Heaven 4.0 | |
| Extreme Preset OpenGL | |
| KFA2 GeForce RTX 2060 Super | |
| MSI RTX 2060 Gaming Z 6G | |
| AMD Radeon RX 5700 XT | |
| AMD Radeon RX 5700 | |
| Zotac GeForce GTX 1660 Ti 6 GB | |
| Sapphire AMD Radeon RX 5600 XT | |
| KFA 2 GeForce GTX 1660 Super | |
| PNY GeForce GTX 1660 | |
| XFX AMD Radeon RX 590 OC+ 8 GB | |
| KFA2 GeForce GTX 1650 EX One Click Plus | |
| Sapphire NITRO+ RX 570 8 GB | |
| Gainward GeForce GTX 1650 4 GB | |
| Extreme Preset DX11 | |
| KFA2 GeForce RTX 2060 Super | |
| AMD Radeon RX 5700 XT | |
| MSI RTX 2060 Gaming Z 6G | |
| AMD Radeon RX 5700 | |
| Sapphire AMD Radeon RX 5600 XT | |
| Zotac GeForce GTX 1660 Ti 6 GB | |
| KFA 2 GeForce GTX 1660 Super | |
| PNY GeForce GTX 1660 | |
| XFX AMD Radeon RX 590 OC+ 8 GB | |
| Sapphire NITRO+ RX 570 8 GB | |
| KFA2 GeForce GTX 1650 EX One Click Plus | |
| Gainward GeForce GTX 1650 4 GB | |
| Unigine Valley 1.0 | |
| 1920x1080 Extreme HD DirectX AA:x8 | |
| KFA2 GeForce RTX 2060 Super | |
| AMD Radeon RX 5700 XT | |
| AMD Radeon RX 5700 | |
| MSI RTX 2060 Gaming Z 6G | |
| Sapphire AMD Radeon RX 5600 XT | |
| KFA 2 GeForce GTX 1660 Super | |
| Zotac GeForce GTX 1660 Ti 6 GB | |
| PNY GeForce GTX 1660 | |
| XFX AMD Radeon RX 590 OC+ 8 GB | |
| Sapphire NITRO+ RX 570 8 GB | |
| KFA2 GeForce GTX 1650 EX One Click Plus | |
| Gainward GeForce GTX 1650 4 GB | |
| 1920x1080 Extreme HD Preset OpenGL AA:x8 | |
| KFA2 GeForce RTX 2060 Super | |
| AMD Radeon RX 5700 XT | |
| MSI RTX 2060 Gaming Z 6G | |
| AMD Radeon RX 5700 | |
| Sapphire AMD Radeon RX 5600 XT | |
| Zotac GeForce GTX 1660 Ti 6 GB | |
| KFA 2 GeForce GTX 1660 Super | |
| PNY GeForce GTX 1660 | |
| XFX AMD Radeon RX 590 OC+ 8 GB | |
| KFA2 GeForce GTX 1650 EX One Click Plus | |
| Sapphire NITRO+ RX 570 8 GB | |
| Gainward GeForce GTX 1650 4 GB | |
| LuxMark v2.0 64Bit | |
| Room GPUs-only | |
| KFA2 GeForce RTX 2060 Super | |
| MSI RTX 2060 Gaming Z 6G | |
| KFA 2 GeForce GTX 1660 Super | |
| Zotac GeForce GTX 1660 Ti 6 GB | |
| AMD Radeon RX 5700 XT | |
| PNY GeForce GTX 1660 | |
| XFX AMD Radeon RX 590 OC+ 8 GB | |
| AMD Radeon RX 5700 | |
| Sapphire AMD Radeon RX 5600 XT | |
| Sapphire NITRO+ RX 570 8 GB | |
| Gainward GeForce GTX 1650 4 GB | |
| KFA2 GeForce GTX 1650 EX One Click Plus | |
| Sala GPUs-only | |
| KFA2 GeForce RTX 2060 Super | |
| AMD Radeon RX 5700 XT | |
| MSI RTX 2060 Gaming Z 6G | |
| AMD Radeon RX 5700 | |
| Sapphire AMD Radeon RX 5600 XT | |
| KFA 2 GeForce GTX 1660 Super | |
| Zotac GeForce GTX 1660 Ti 6 GB | |
| XFX AMD Radeon RX 590 OC+ 8 GB | |
| PNY GeForce GTX 1660 | |
| Sapphire NITRO+ RX 570 8 GB | |
| KFA2 GeForce GTX 1650 EX One Click Plus | |
| Gainward GeForce GTX 1650 4 GB | |
| SiSoft Sandra 2016 | |
| Image Processing | |
| KFA2 GeForce RTX 2060 Super | |
| AMD Radeon RX 5700 XT | |
| MSI RTX 2060 Gaming Z 6G | |
| AMD Radeon RX 5700 | |
| Zotac GeForce GTX 1660 Ti 6 GB | |
| KFA 2 GeForce GTX 1660 Super | |
| PNY GeForce GTX 1660 | |
| Sapphire AMD Radeon RX 5600 XT | |
| Gainward GeForce GTX 1650 4 GB | |
| KFA2 GeForce GTX 1650 EX One Click Plus | |
| GP Cryptography (Higher Security AES256+SHA2-512) | |
| KFA2 GeForce RTX 2060 Super | |
| MSI RTX 2060 Gaming Z 6G | |
| PNY GeForce GTX 1660 | |
| KFA 2 GeForce GTX 1660 Super | |
| Zotac GeForce GTX 1660 Ti 6 GB | |
| KFA2 GeForce GTX 1650 EX One Click Plus | |
| Sapphire NITRO+ RX 570 8 GB | |
| Gainward GeForce GTX 1650 4 GB | |
| GP Financial Analysis (FP High/Double Precision) | |
| Sapphire NITRO+ RX 570 8 GB | |
| KFA2 GeForce RTX 2060 Super | |
| MSI RTX 2060 Gaming Z 6G | |
| Zotac GeForce GTX 1660 Ti 6 GB | |
| PNY GeForce GTX 1660 | |
| KFA 2 GeForce GTX 1660 Super | |
| KFA2 GeForce GTX 1650 EX One Click Plus | |
| Gainward GeForce GTX 1650 4 GB | |
| AMD Radeon RX 5700 XT | |
| AMD Radeon RX 5700 | |
| Sapphire AMD Radeon RX 5600 XT | |
| 3DMark 06 Standard Score | 44842 points | |
| 3DMark Vantage P Result | 47363 points | |
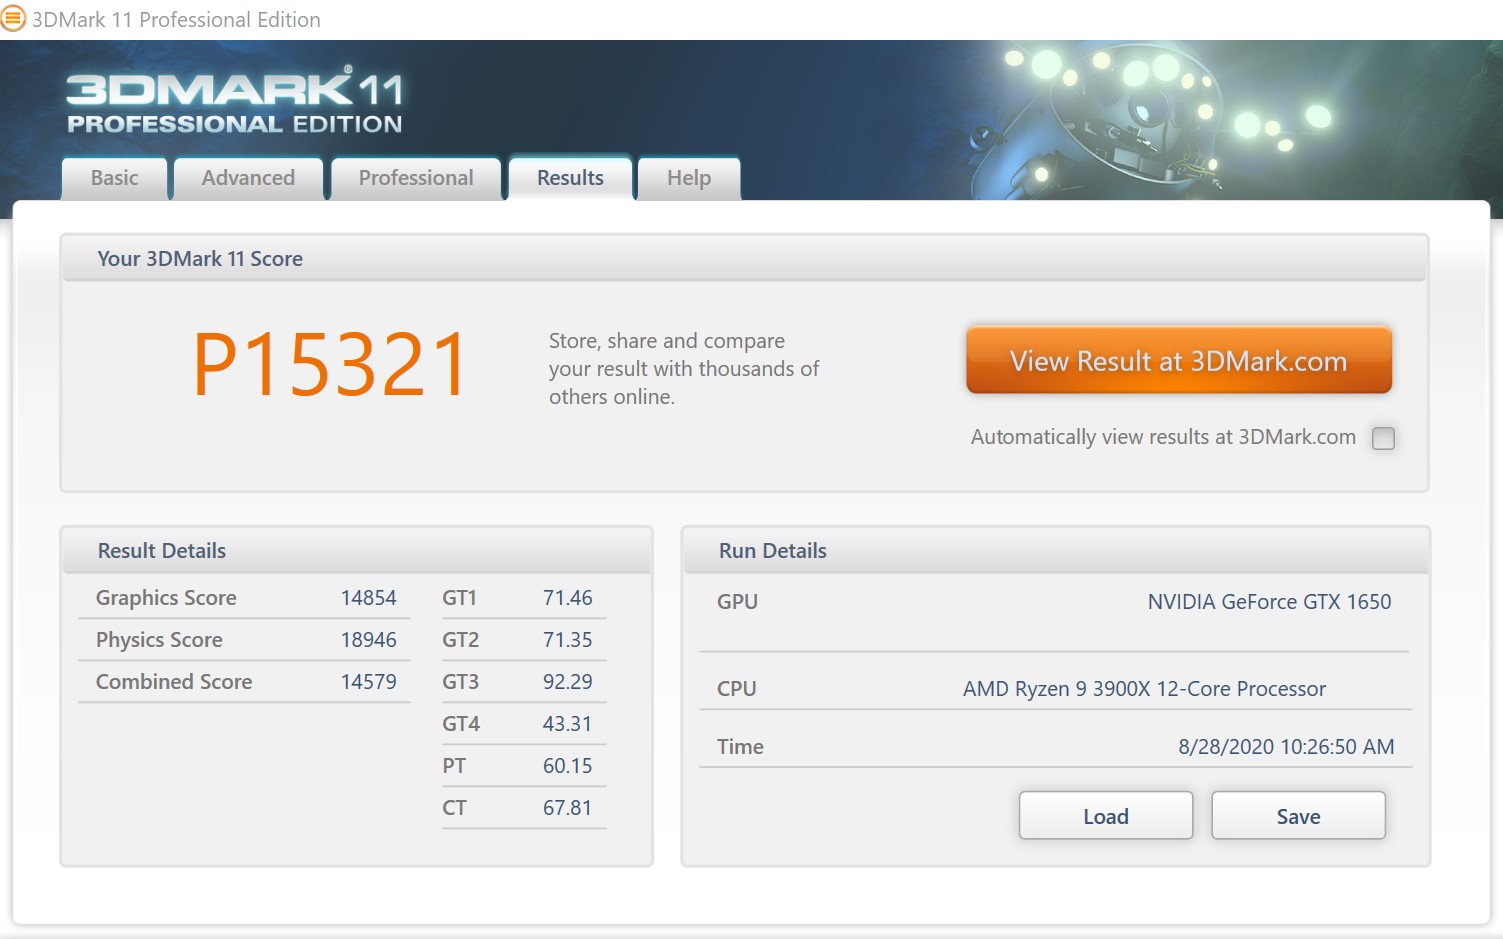
| 3DMark 11 Performance | 14069 points | |
| 3DMark Ice Storm Standard Score | 164494 points | |
| 3DMark Cloud Gate Standard Score | 39148 points | |
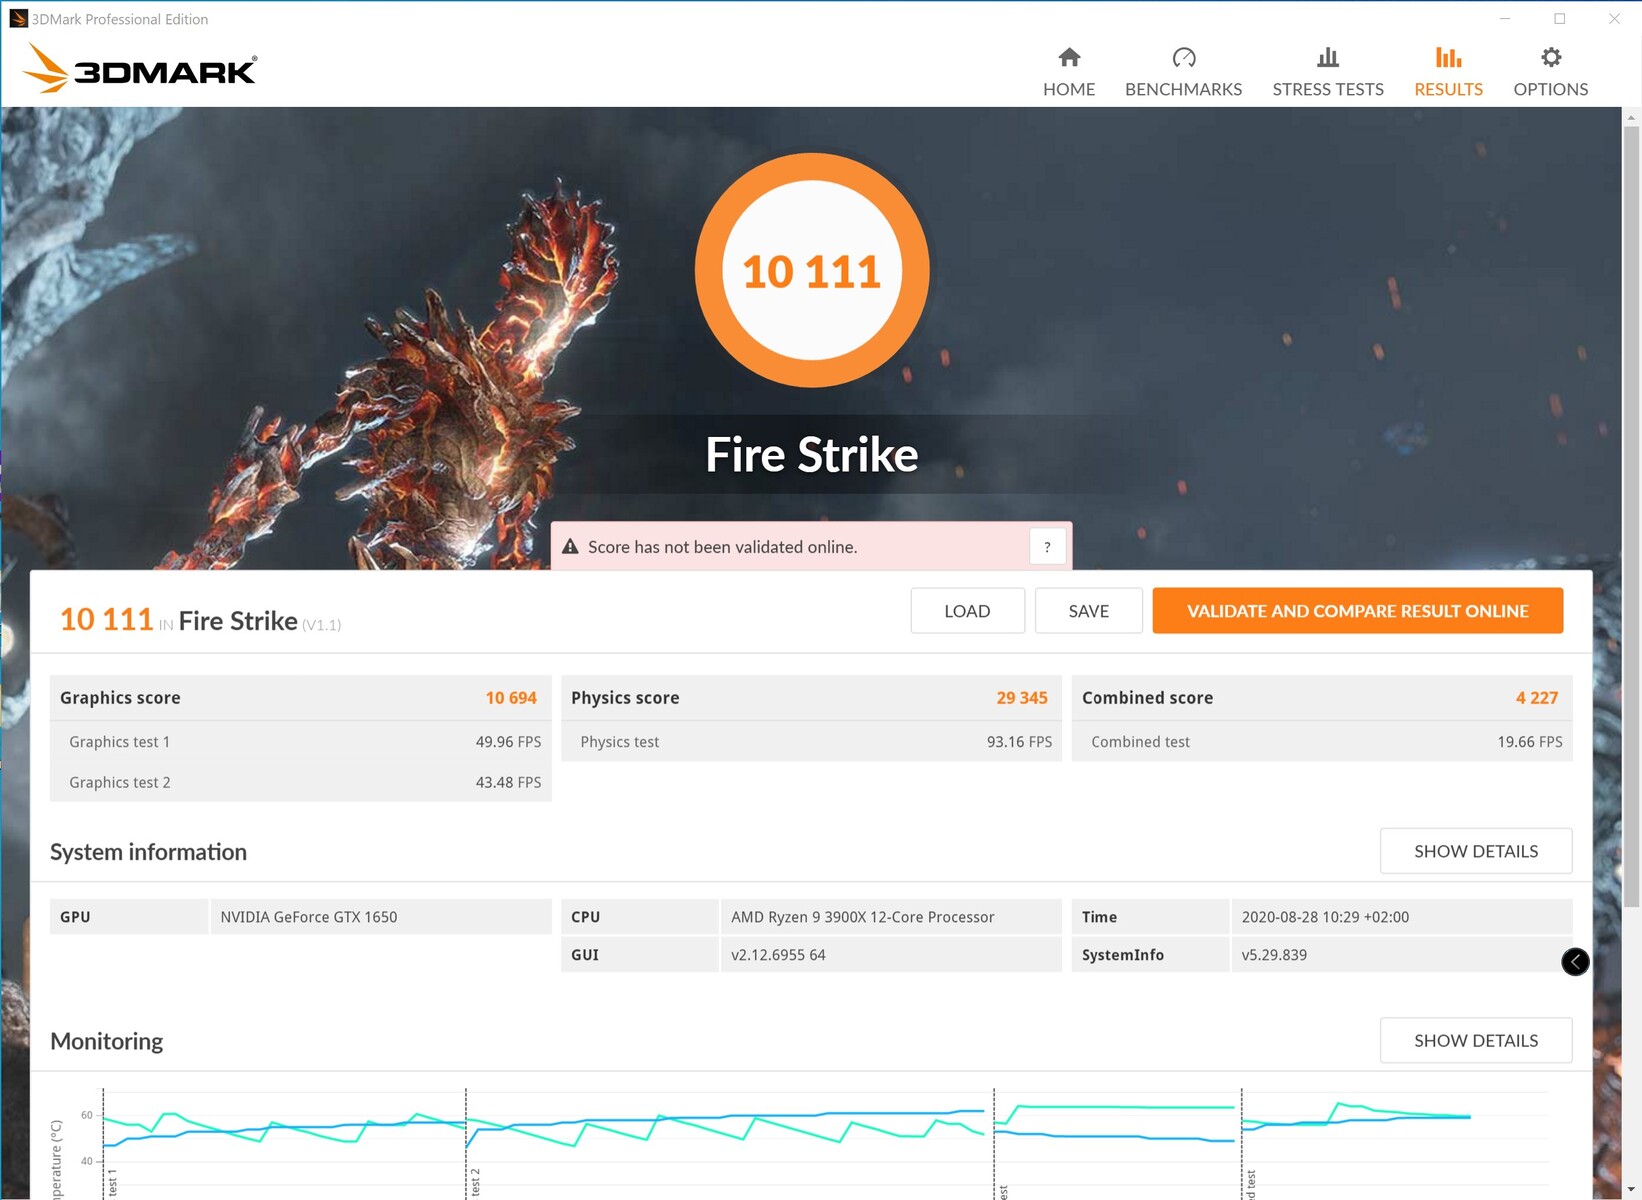
| 3DMark Fire Strike Score | 9209 points | |
| 3DMark Fire Strike Extreme Score | 4368 points | |
| 3DMark Time Spy Score | 3927 points | |
Help | ||
Gaming Benchmarks
The increase in performance that the KFA2 GeForce GTX 1650 EX Plus exhibited in the synthetic benchmarks carries over to the gaming benchmarks. By and large, the new model is faster than the older version of the GTX 1650. This is not surprising because the new model comes with faster VRAM. The performance gap between the KFA2 GeForce GTX 1650 and the AMD Radeon RX 570 is also smaller. The higher the resolution and the graphics settings, the more the GTX 1650 struggles to achieve playable frame rates in current titles. Reducing graphics settings often results in a noticeable increase in performance. All of this goes to show that 4 GB of VRAM is not going to go very far these days.
Nevertheless, the KFA2 GeForce GTX 1650 EX Plus is suitable for 1080p gaming, provided you can live with slightly reduced graphics settings. Here, users should examine each title individually, because certain games such as FIFA 20 can run even at 2160p.
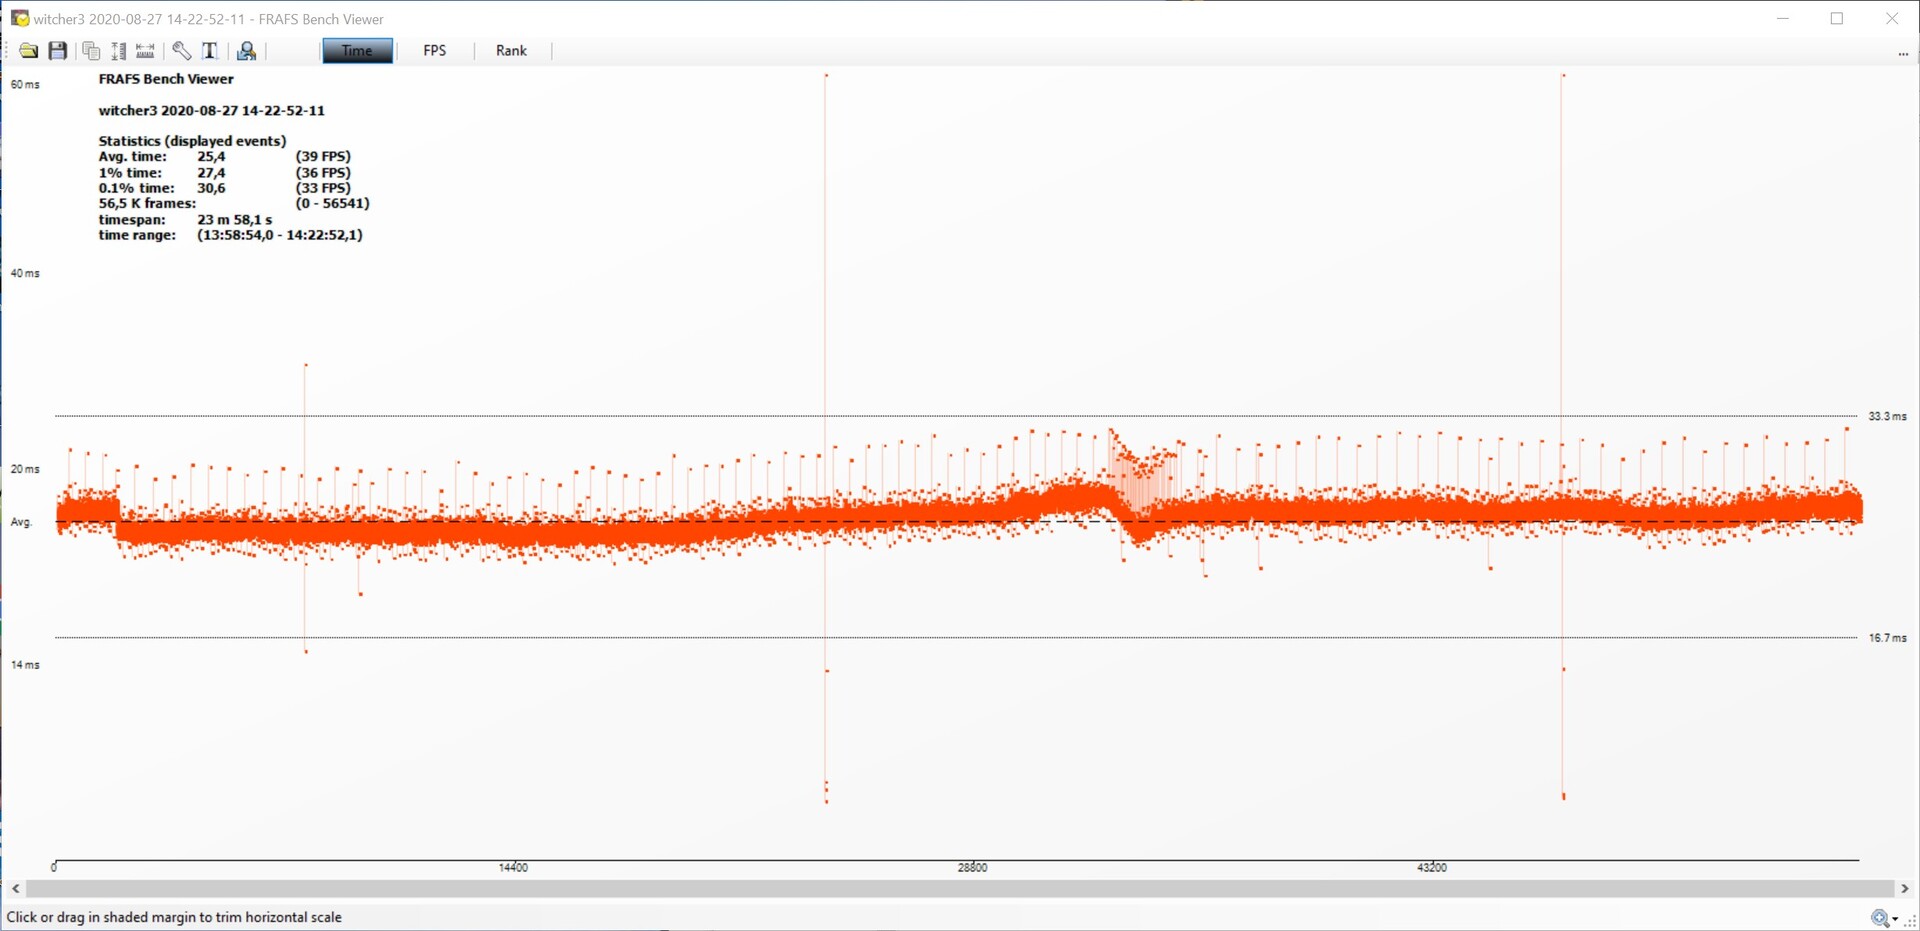
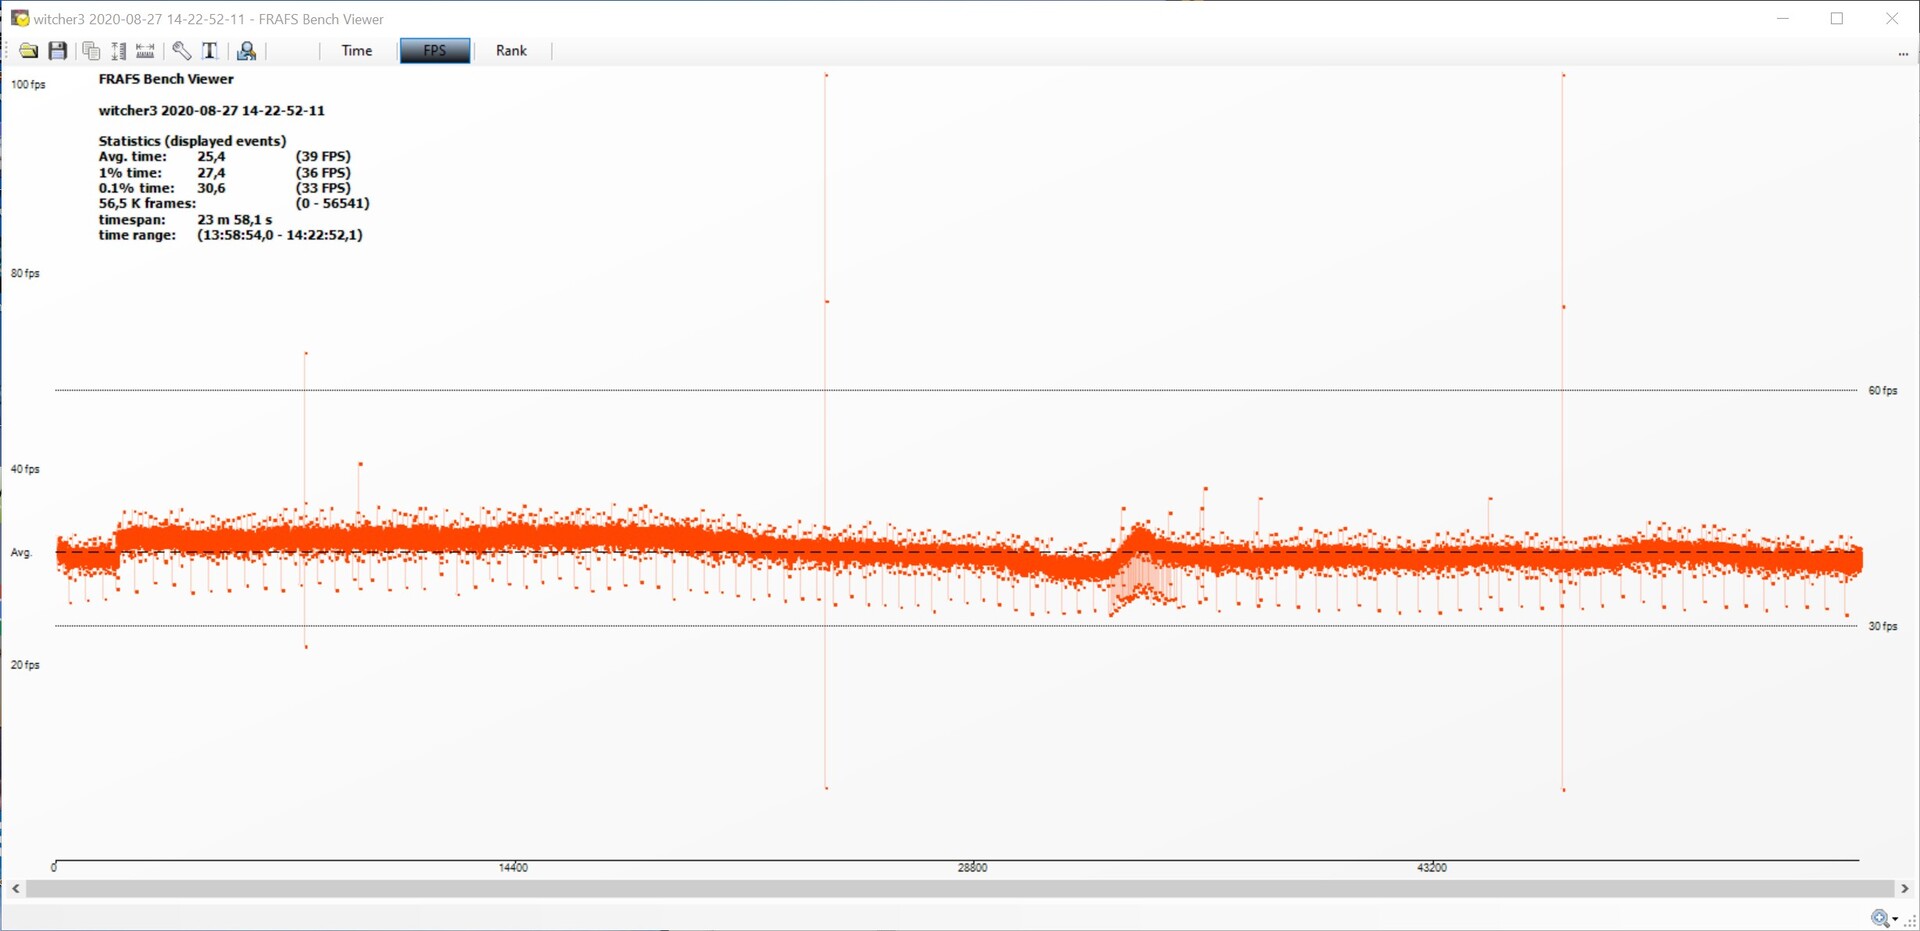
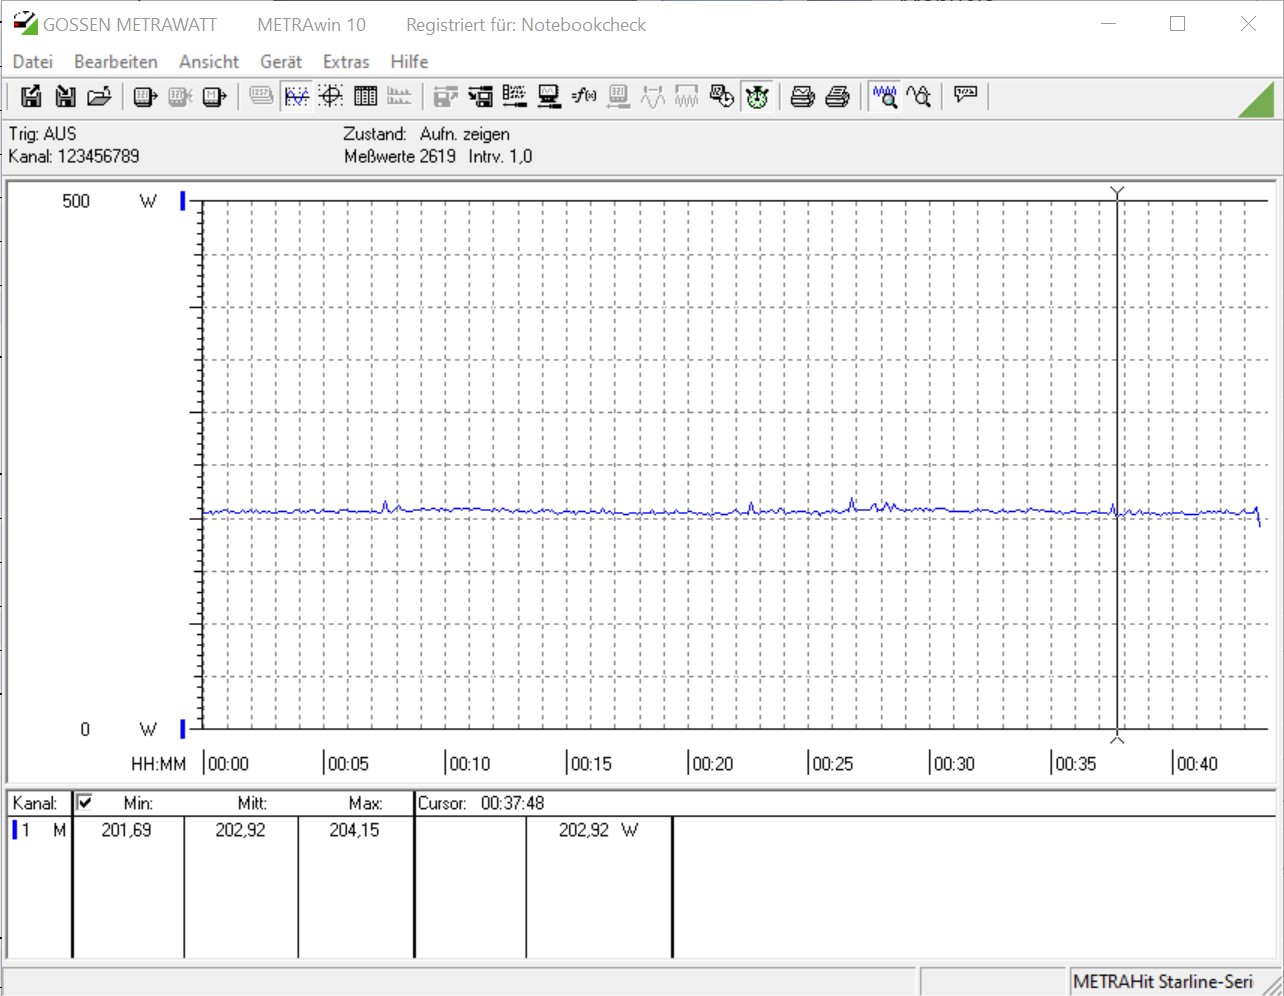
When looking at the frame rate graph, which shows the results of our gaming stress test with The Witcher 3 (ultra preset), one can see that the dual-fan cooler has no trouble keeping the KFA2 GeForce GTX 1650 EX Plus cool. There was a slight drop in performance on one occasion, after which the performance quickly returned to a normal level. Users should not experience any significant drops in performance under load. There were no issues with the frame time performance.
You can find out how the KFA2 GeForce GTX 1650 EX Plus stacks up against other graphics cards on our GPU Benchmarks page.
The Witcher 3 - Frame rates on the highest settings
| Far Cry 5 - 1920x1080 Ultra Preset AA:T | |
| AMD Radeon RX 5700 XT | |
| KFA2 GeForce RTX 2060 Super | |
| Sapphire AMD Radeon RX 5600 XT | |
| Nvidia GeForce RTX 2060 Super | |
| AMD Radeon RX 5700 XT | |
| MSI RTX 2060 Gaming Z 6G | |
| KFA 2 GeForce GTX 1660 Super | |
| Zotac GeForce GTX 1660 Ti 6 GB | |
| AMD Radeon RX 5700 | |
| PNY GeForce GTX 1660 | |
| XFX AMD Radeon RX 590 OC+ 8 GB | |
| Sapphire NITRO+ RX 570 8 GB | |
| KFA2 GeForce GTX 1650 EX One Click Plus | |
| Gainward GeForce GTX 1650 4 GB | |
| The Witcher 3 - 1920x1080 Ultra Graphics & Postprocessing (HBAO+) | |
| AMD Radeon RX 5700 XT | |
| AMD Radeon RX 5700 XT | |
| KFA2 GeForce RTX 2060 Super | |
| AMD Radeon RX 5700 | |
| Nvidia GeForce RTX 2060 Super | |
| Sapphire AMD Radeon RX 5600 XT | |
| MSI RTX 2060 Gaming Z 6G | |
| Zotac GeForce GTX 1660 Ti 6 GB | |
| KFA 2 GeForce GTX 1660 Super | |
| PNY GeForce GTX 1660 | |
| XFX AMD Radeon RX 590 OC+ 8 GB | |
| Gainward GeForce GTX 1650 4 GB | |
| Sapphire NITRO+ RX 570 8 GB | |
| KFA2 GeForce GTX 1650 EX One Click Plus | |
| Apex Legends - 1920x1080 Maximum Settings AA:TS AF:16x | |
| Nvidia GeForce RTX 2060 Super | |
| AMD Radeon RX 5700 XT | |
| KFA2 GeForce RTX 2060 Super | |
| AMD Radeon RX 5700 | |
| MSI RTX 2060 Gaming Z 6G | |
| Sapphire AMD Radeon RX 5600 XT | |
| KFA 2 GeForce GTX 1660 Super | |
| Zotac GeForce GTX 1660 Ti 6 GB | |
| PNY GeForce GTX 1660 | |
| XFX AMD Radeon RX 590 OC+ 8 GB | |
| Sapphire NITRO+ RX 570 8 GB | |
| KFA2 GeForce GTX 1650 EX One Click Plus | |
| Gainward GeForce GTX 1650 4 GB | |
| Far Cry New Dawn - 1920x1080 Ultra Preset | |
| AMD Radeon RX 5700 XT | |
| KFA2 GeForce RTX 2060 Super | |
| MSI RTX 2060 Gaming Z 6G | |
| KFA 2 GeForce GTX 1660 Super | |
| Sapphire AMD Radeon RX 5600 XT | |
| Nvidia GeForce RTX 2060 Super | |
| Zotac GeForce GTX 1660 Ti 6 GB | |
| AMD Radeon RX 5700 | |
| PNY GeForce GTX 1660 | |
| AMD Radeon RX 5700 XT | |
| XFX AMD Radeon RX 590 OC+ 8 GB | |
| Sapphire NITRO+ RX 570 8 GB | |
| KFA2 GeForce GTX 1650 EX One Click Plus | |
| Gainward GeForce GTX 1650 4 GB | |
| Metro Exodus - 1920x1080 Ultra Quality AF:16x | |
| AMD Radeon RX 5700 XT | |
| Nvidia GeForce RTX 2060 Super | |
| AMD Radeon RX 5700 | |
| KFA2 GeForce RTX 2060 Super | |
| Sapphire AMD Radeon RX 5600 XT | |
| MSI RTX 2060 Gaming Z 6G | |
| Zotac GeForce GTX 1660 Ti 6 GB | |
| KFA 2 GeForce GTX 1660 Super | |
| PNY GeForce GTX 1660 | |
| XFX AMD Radeon RX 590 OC+ 8 GB | |
| Sapphire NITRO+ RX 570 8 GB | |
| KFA2 GeForce GTX 1650 EX One Click Plus | |
| Gainward GeForce GTX 1650 4 GB | |
| X-Plane 11.11 - 1920x1080 high (fps_test=3) | |
| KFA 2 GeForce GTX 1660 Super | |
| PNY GeForce GTX 1660 | |
| KFA2 GeForce RTX 2060 Super | |
| KFA2 GeForce GTX 1650 EX One Click Plus | |
| Nvidia GeForce RTX 2060 Super | |
| AMD Radeon RX 5700 XT | |
| Sapphire AMD Radeon RX 5600 XT | |
| AMD Radeon RX 5700 XT | |
| AMD Radeon RX 5700 | |
| FIFA 20 - 1920x1080 Ultra Preset AA:4xMS | |
| AMD Radeon RX 5700 | |
| AMD Radeon RX 5700 XT | |
| XFX AMD Radeon RX 590 OC+ 8 GB | |
| Sapphire AMD Radeon RX 5600 XT | |
| Nvidia GeForce RTX 2060 Super | |
| PNY GeForce GTX 1660 | |
| KFA 2 GeForce GTX 1660 Super | |
| Sapphire NITRO+ RX 570 8 GB | |
| Gainward GeForce GTX 1650 4 GB | |
| KFA2 GeForce GTX 1650 EX One Click Plus | |
| Borderlands 3 - 1920x1080 Badass Overall Quality (DX11) | |
| AMD Radeon RX 5700 XT | |
| Nvidia GeForce RTX 2060 Super | |
| AMD Radeon RX 5700 | |
| Sapphire AMD Radeon RX 5600 XT | |
| KFA 2 GeForce GTX 1660 Super | |
| PNY GeForce GTX 1660 | |
| XFX AMD Radeon RX 590 OC+ 8 GB | |
| Sapphire NITRO+ RX 570 8 GB | |
| Gainward GeForce GTX 1650 4 GB | |
| GRID 2019 - 1920x1080 Ultra High Preset | |
| AMD Radeon RX 5700 XT | |
| AMD Radeon RX 5700 | |
| Nvidia GeForce RTX 2060 Super | |
| Sapphire AMD Radeon RX 5600 XT | |
| KFA 2 GeForce GTX 1660 Super | |
| PNY GeForce GTX 1660 | |
| XFX AMD Radeon RX 590 OC+ 8 GB | |
| Sapphire NITRO+ RX 570 8 GB | |
| KFA2 GeForce GTX 1650 EX One Click Plus | |
| Gainward GeForce GTX 1650 4 GB | |
| Need for Speed Heat - 1920x1080 Ultra Preset | |
| Nvidia GeForce RTX 2060 Super | |
| AMD Radeon RX 5700 XT | |
| AMD Radeon RX 5700 | |
| Sapphire AMD Radeon RX 5600 XT | |
| KFA 2 GeForce GTX 1660 Super | |
| PNY GeForce GTX 1660 | |
| XFX AMD Radeon RX 590 OC+ 8 GB | |
| Gainward GeForce GTX 1650 4 GB | |
| KFA2 GeForce GTX 1650 EX One Click Plus | |
| Star Wars Jedi Fallen Order - 1920x1080 Epic Preset | |
| Nvidia GeForce RTX 2060 Super | |
| AMD Radeon RX 5700 XT | |
| AMD Radeon RX 5700 | |
| Sapphire AMD Radeon RX 5600 XT | |
| PNY GeForce GTX 1660 | |
| XFX AMD Radeon RX 590 OC+ 8 GB | |
| KFA 2 GeForce GTX 1660 Super | |
| KFA2 GeForce GTX 1650 EX One Click Plus | |
| Gainward GeForce GTX 1650 4 GB | |
| Total War: Three Kingdoms - 1920x1080 Ultra (incl textures) | |
| Nvidia GeForce RTX 2060 Super | |
| AMD Radeon RX 5700 | |
| AMD Radeon RX 5700 XT | |
| Sapphire AMD Radeon RX 5600 XT | |
| KFA 2 GeForce GTX 1660 Super | |
| PNY GeForce GTX 1660 | |
| XFX AMD Radeon RX 590 OC+ 8 GB | |
| Gainward GeForce GTX 1650 4 GB | |
| KFA2 GeForce GTX 1650 EX One Click Plus | |
| Final Fantasy XV Benchmark - 1920x1080 High Quality | |
| KFA2 GeForce RTX 2060 Super | |
| Nvidia GeForce RTX 2060 Super | |
| MSI RTX 2060 Gaming Z 6G | |
| AMD Radeon RX 5700 XT | |
| Zotac GeForce GTX 1660 Ti 6 GB | |
| AMD Radeon RX 5700 | |
| XFX AMD Radeon RX 590 OC+ 8 GB | |
| KFA2 GeForce GTX 1650 EX One Click Plus | |
| Gainward GeForce GTX 1650 4 GB | |
| Sapphire NITRO+ RX 570 8 GB | |
| Call of Duty Modern Warfare 2019 - 1920x1080 Maximum Settings AA:T2X Filmic SM | |
| AMD Radeon RX 5700 XT | |
| Nvidia GeForce RTX 2060 Super | |
| AMD Radeon RX 5700 | |
| Sapphire AMD Radeon RX 5600 XT | |
| KFA 2 GeForce GTX 1660 Super | |
| PNY GeForce GTX 1660 | |
| XFX AMD Radeon RX 590 OC+ 8 GB | |
| Sapphire NITRO+ RX 570 8 GB | |
| KFA2 GeForce GTX 1650 EX One Click Plus | |
| Gainward GeForce GTX 1650 4 GB | |
| Red Dead Redemption 2 - 1920x1080 Maximum Settings | |
| AMD Radeon RX 5700 XT | |
| Nvidia GeForce RTX 2060 Super | |
| AMD Radeon RX 5700 | |
| Sapphire AMD Radeon RX 5600 XT | |
| KFA 2 GeForce GTX 1660 Super | |
| PNY GeForce GTX 1660 | |
| XFX AMD Radeon RX 590 OC+ 8 GB | |
| KFA2 GeForce GTX 1650 EX One Click Plus | |
| Gainward GeForce GTX 1650 4 GB | |
| F1 2020 - 1920x1080 Ultra High Preset AA:T AF:16x | |
| AMD Radeon RX 5700 XT | |
| AMD Radeon RX 5700 | |
| Sapphire AMD Radeon RX 5600 XT | |
| Nvidia GeForce RTX 2060 Super | |
| XFX AMD Radeon RX 590 OC+ 8 GB | |
| KFA 2 GeForce GTX 1660 Super | |
| PNY GeForce GTX 1660 | |
| KFA2 GeForce GTX 1650 EX One Click Plus | |
| Death Stranding - 1920x1080 Very High Preset | |
| AMD Radeon RX 5700 XT | |
| AMD Radeon RX 5700 | |
| Sapphire AMD Radeon RX 5600 XT | |
| Nvidia GeForce RTX 2060 Super | |
| KFA 2 GeForce GTX 1660 Super | |
| PNY GeForce GTX 1660 | |
| XFX AMD Radeon RX 590 OC+ 8 GB | |
| XFX AMD Radeon RX 590 OC+ 8 GB | |
| KFA2 GeForce GTX 1650 EX One Click Plus | |
| Horizon Zero Dawn - 1920x1080 Ultimate Quality | |
| AMD Radeon RX 5700 XT | |
| AMD Radeon RX 5700 | |
| Sapphire AMD Radeon RX 5600 XT | |
| Nvidia GeForce RTX 2060 Super | |
| KFA 2 GeForce GTX 1660 Super | |
| PNY GeForce GTX 1660 | |
| XFX AMD Radeon RX 590 OC+ 8 GB | |
| KFA2 GeForce GTX 1650 EX One Click Plus | |
| low | med. | high | ultra | QHD | 4K | |
|---|---|---|---|---|---|---|
| The Witcher 3 (2015) | 216 | 128 | 70.1 | 40.4 | 23.6 | |
| Dota 2 Reborn (2015) | 156.7 | 114.3 | 112.6 | 106.9 | 59.1 | |
| Final Fantasy XV Benchmark (2018) | 108 | 55.3 | 41.2 | 28.9 | 15.8 | |
| X-Plane 11.11 (2018) | 123 | 110 | 89.6 | 66.9 | ||
| Far Cry 5 (2018) | 135 | 69 | 63 | 59 | 40 | 19 |
| Strange Brigade (2018) | 245 | 94.4 | 74 | 62.2 | 44.7 | 25.7 |
| Apex Legends (2019) | 144 | 111 | 76 | 71.3 | 50.4 | 27 |
| Far Cry New Dawn (2019) | 120 | 68 | 63 | 58 | 42 | 21 |
| Metro Exodus (2019) | 107 | 48 | 35.2 | 27.7 | 21.3 | 12.1 |
| Total War: Three Kingdoms (2019) | 202.1 | 68.5 | 41.5 | 26.4 | 15.7 | 15 |
| FIFA 20 (2019) | 237 | 215 | 192 | 137 | 107 | 69.9 |
| GRID 2019 (2019) | 155 | 86 | 70 | 45 | 32 | 18 |
| Call of Duty Modern Warfare 2019 (2019) | 118 | 78 | 65 | 54 | 37 | 21 |
| Need for Speed Heat (2019) | 114 | 64.4 | 53.6 | 39 | 17.7 | 17.1 |
| Star Wars Jedi Fallen Order (2019) | 77.7 | 65.5 | 54.9 | 36.3 | 17 | |
| Red Dead Redemption 2 (2019) | 111 | 54 | 34 | 22 | ||
| Hunt Showdown (2020) | 153 | 60.8 | 46.7 | 29.3 | 25.7 | |
| Doom Eternal (2020) | 116 | 80.4 | 61.4 | |||
| Gears Tactics (2020) | 252.9 | 86.7 | 56 | 40.1 | 27.8 | 15 |
| Valorant (2020) | 341.7 | 291.8 | 260.1 | 176.6 | 82.8 | |
| F1 2020 (2020) | 219 | 115 | 88.1 | 60.3 | 42.9 | 23.4 |
| Death Stranding (2020) | 98.2 | 58.7 | 54.4 | 52.7 | 35.6 | 17.3 |
| Horizon Zero Dawn (2020) | 99 | 55 | 46 | 36 | 26 | 15 |
| Flight Simulator 2020 (2020) | 76.7 | 35.6 | 25.3 | 17 | 12.3 | 5 |
| Serious Sam 4 (2020) | 138.7 | 57.5 | 43.3 | 17.8 | 13.7 | 9.9 |
| Mafia Definitive Edition (2020) | 103.8 | 49.7 | 45.2 | 29 | 14.5 | |
| Star Wars Squadrons (2020) | 312 | 146 | 123 | 114 | 72.9 | 39.6 |
| FIFA 21 (2020) | 231 | 224 | 206 | 184 | 145 | 86.3 |
| Watch Dogs Legion (2020) | 92.9 | 56 | 47.6 | 21.2 | 14.3 | 8.02 |
Emissions of the KFA2 GeForce GTX 1650 EX Plus (1-Click OC)

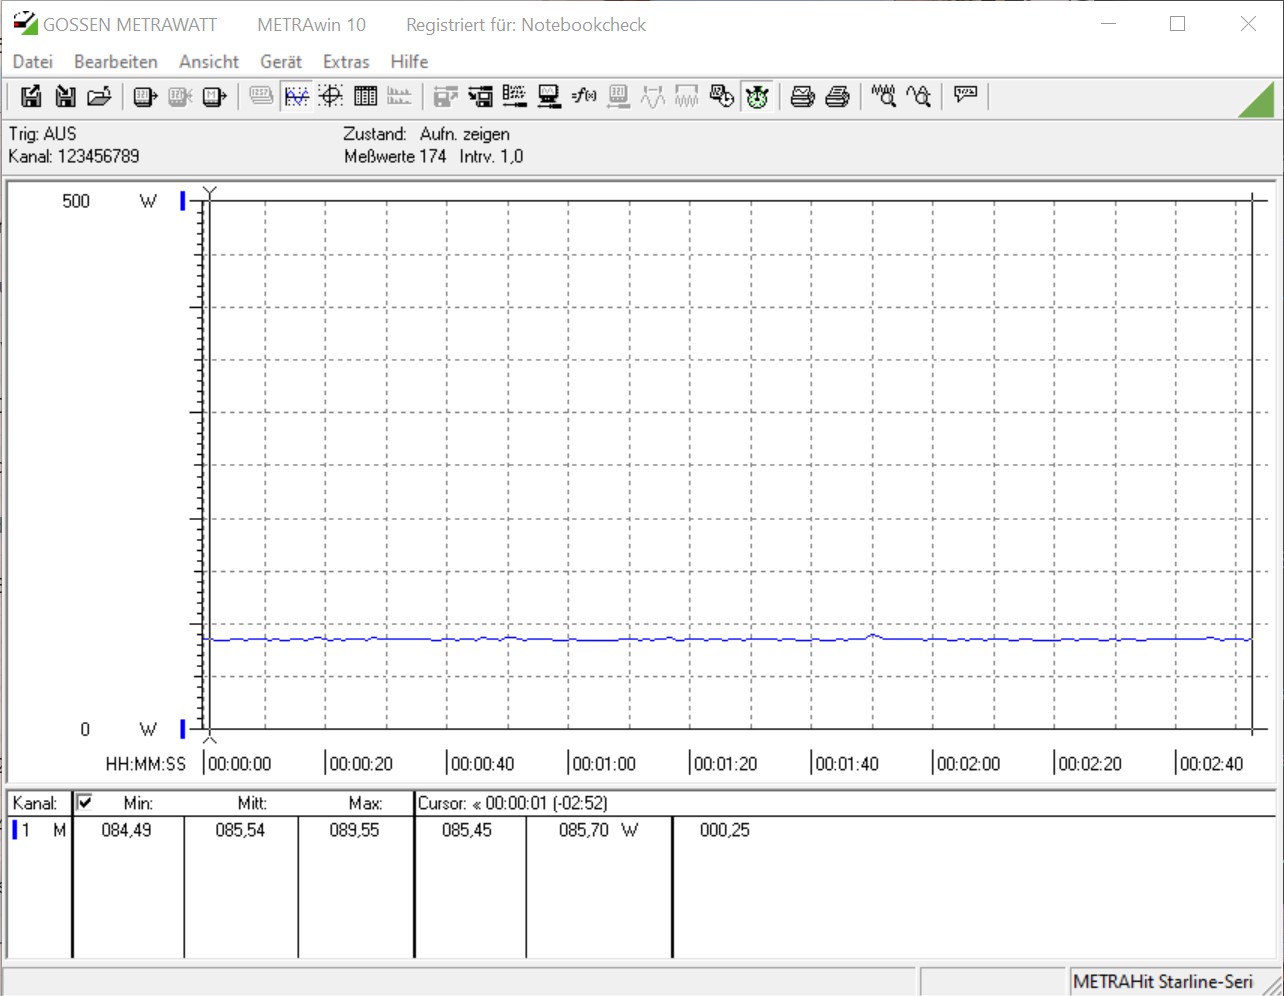
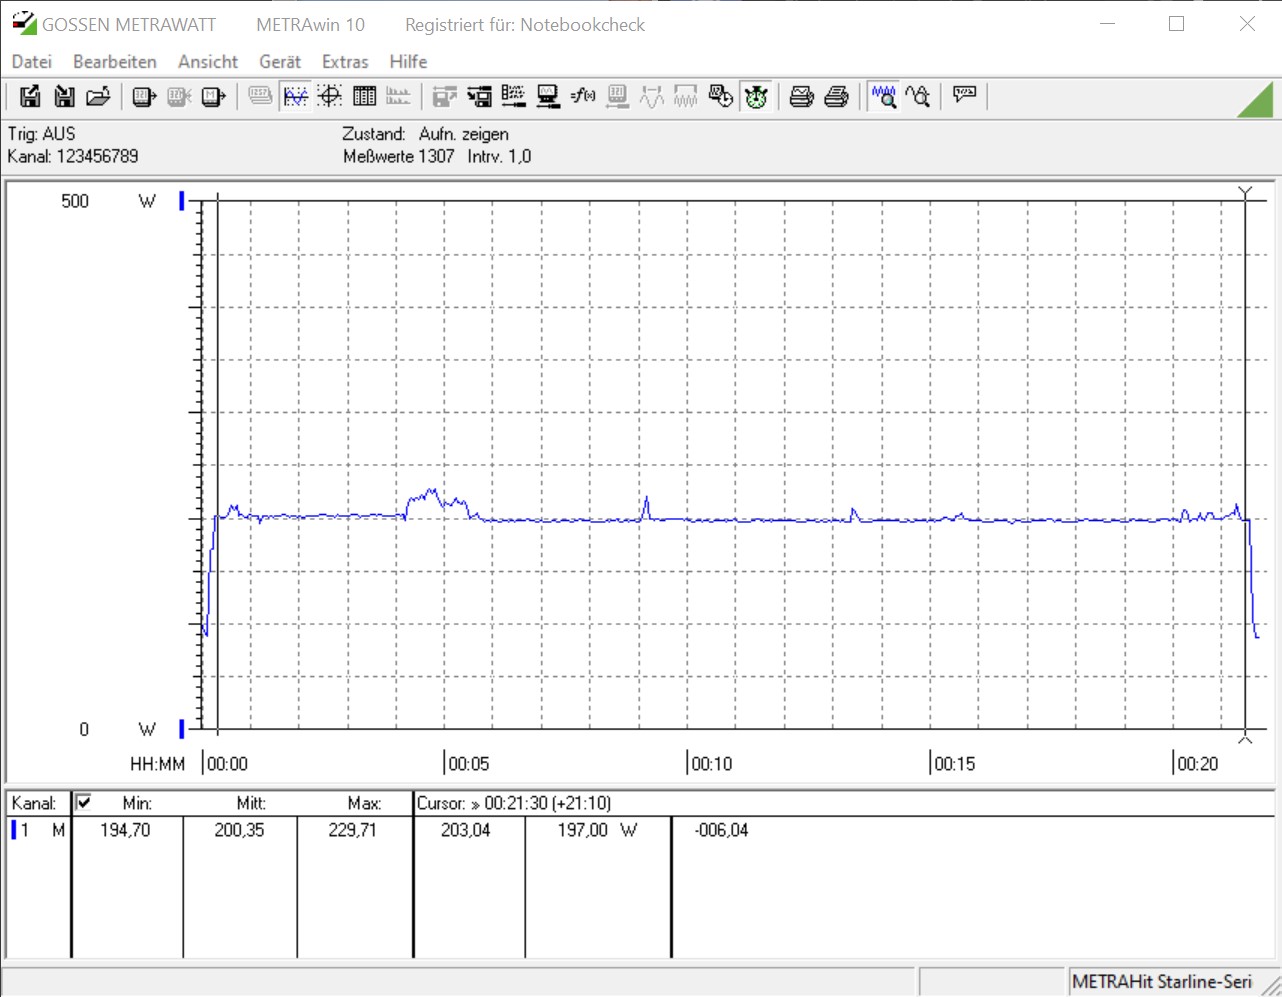
Anyone who wants to get a GTX 1650 is probably concerned about the energy consumption. The 90-watt TGP and an additional power connector do not make the comparison to the standard GTX 1650 without a 6-pin connector seem very favorable. However, in reality, the KFA2 GeForce GTX 1650 EX Plus brings no disadvantages to the table. The older model has a very similar power draw in the system that we are using currently.
When idle, the power consumption of our system amounts to 85 watts with either version of the GTX 1650. When we were gaming or stress-testing the system, the draw power reached a little over 200 watts, which is a good result. The AMD Radeon RX 570, which is marginally faster in the gaming benchmarks, requires significantly more energy. This is proof that technology is moving forward.
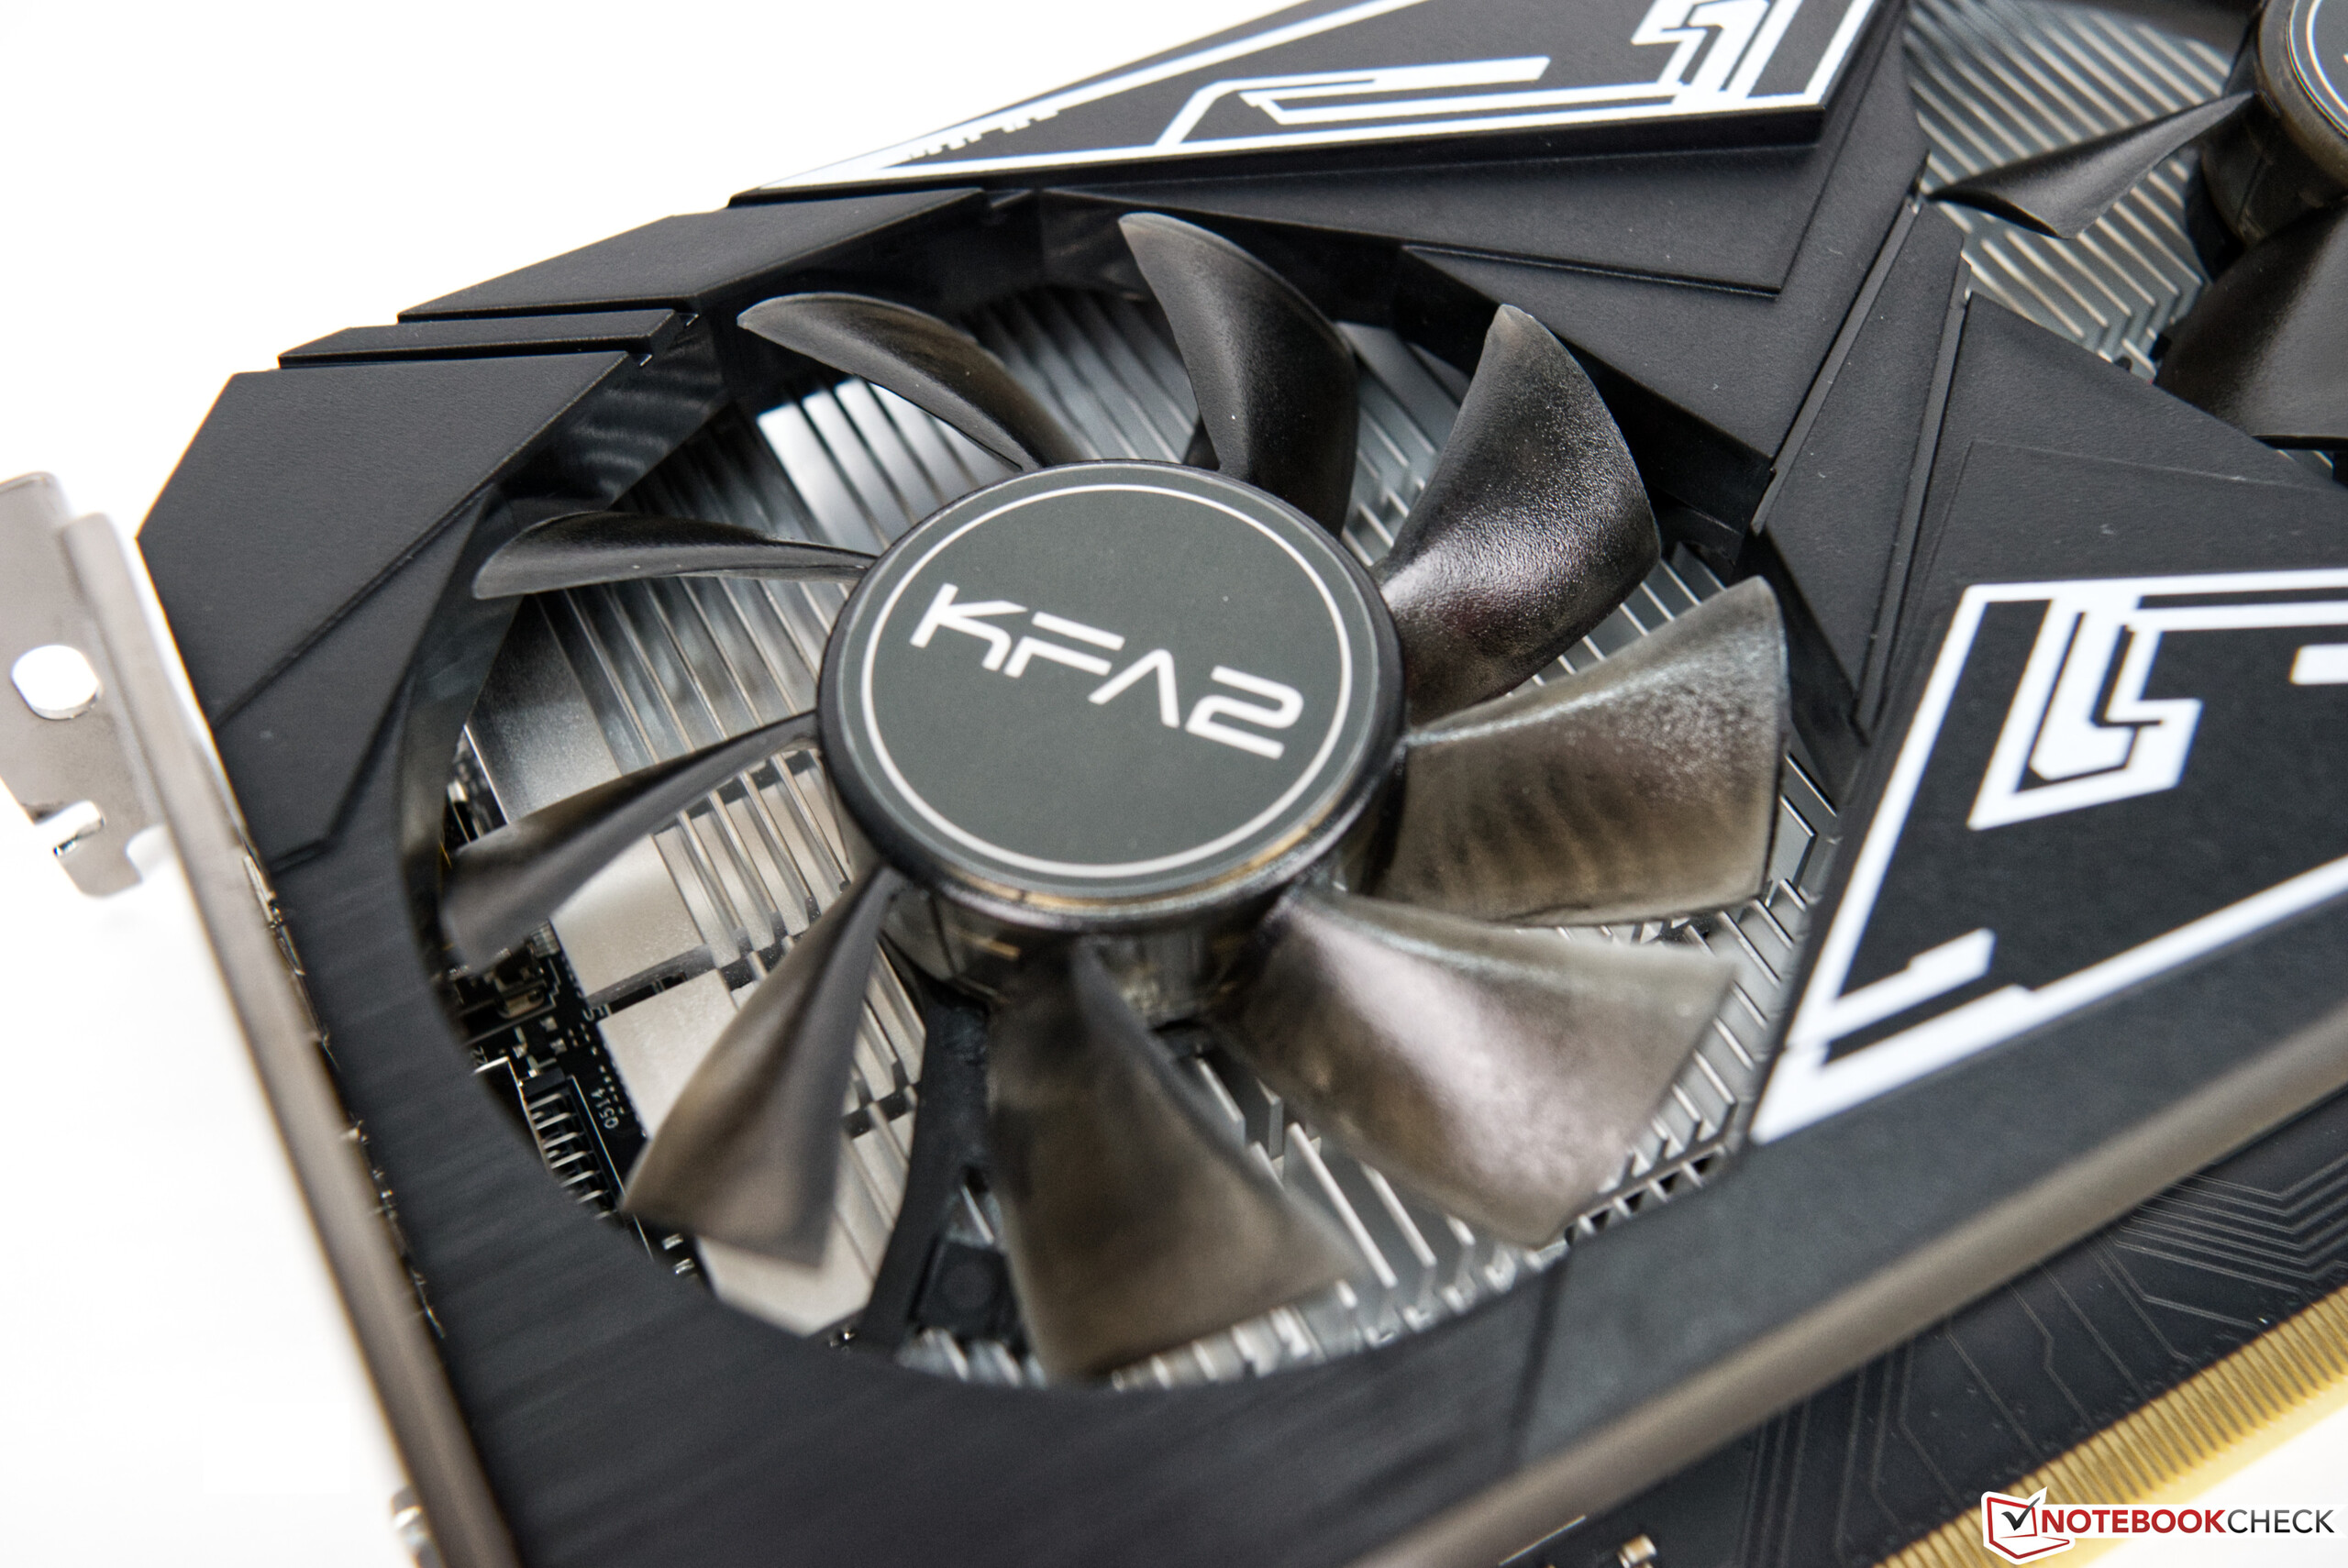
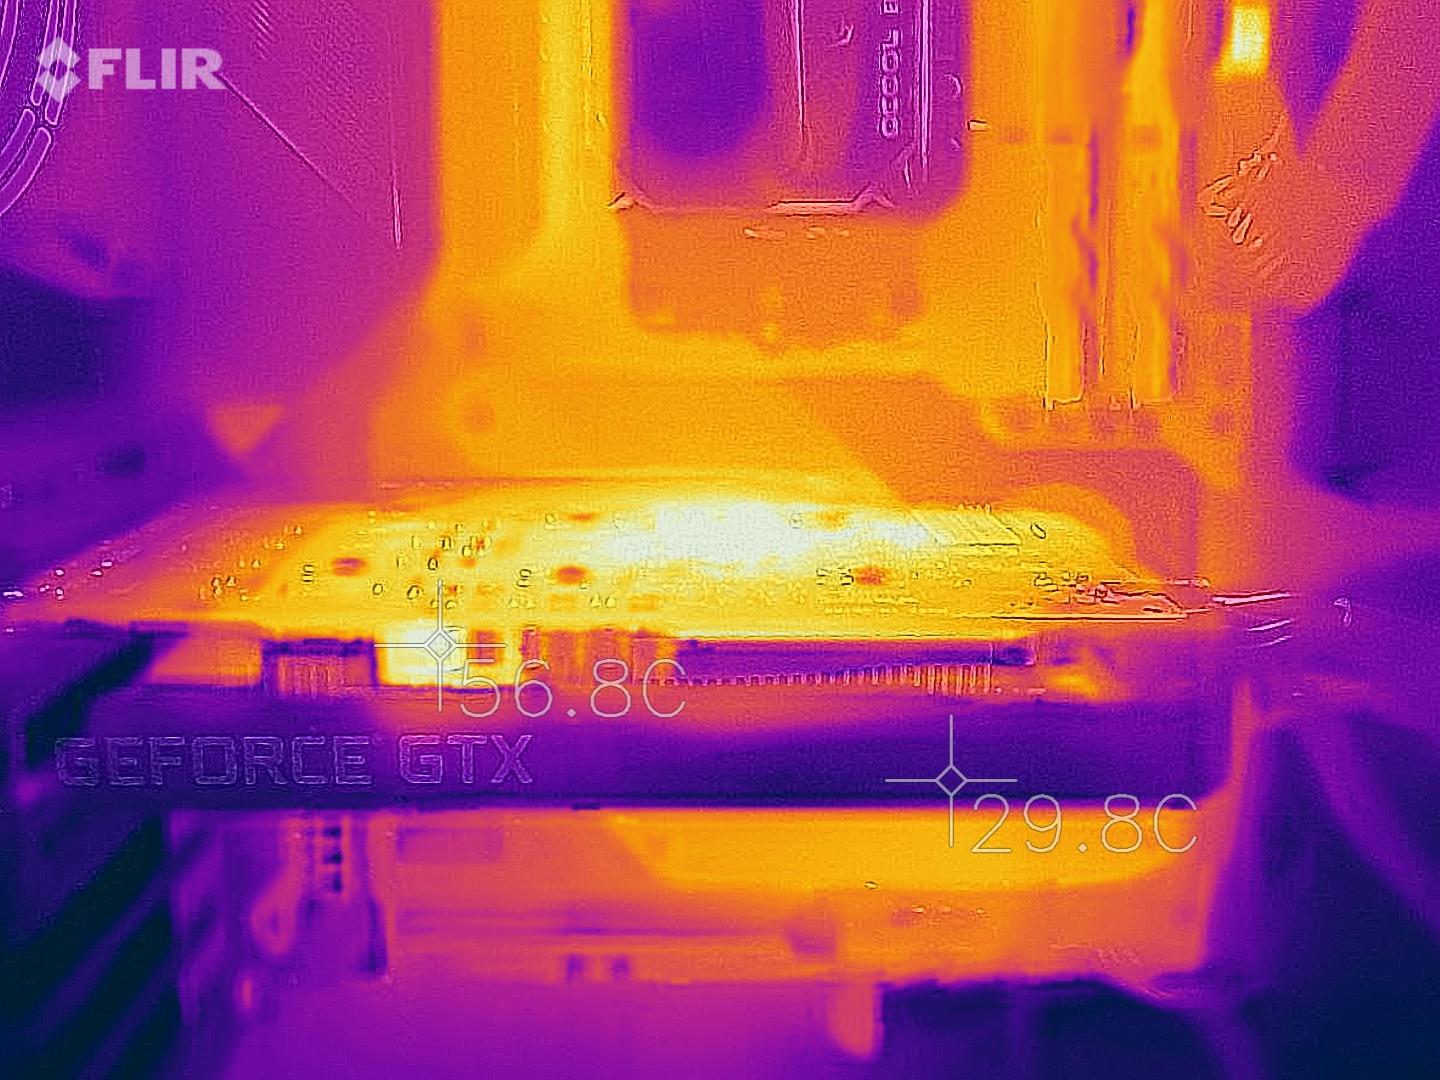
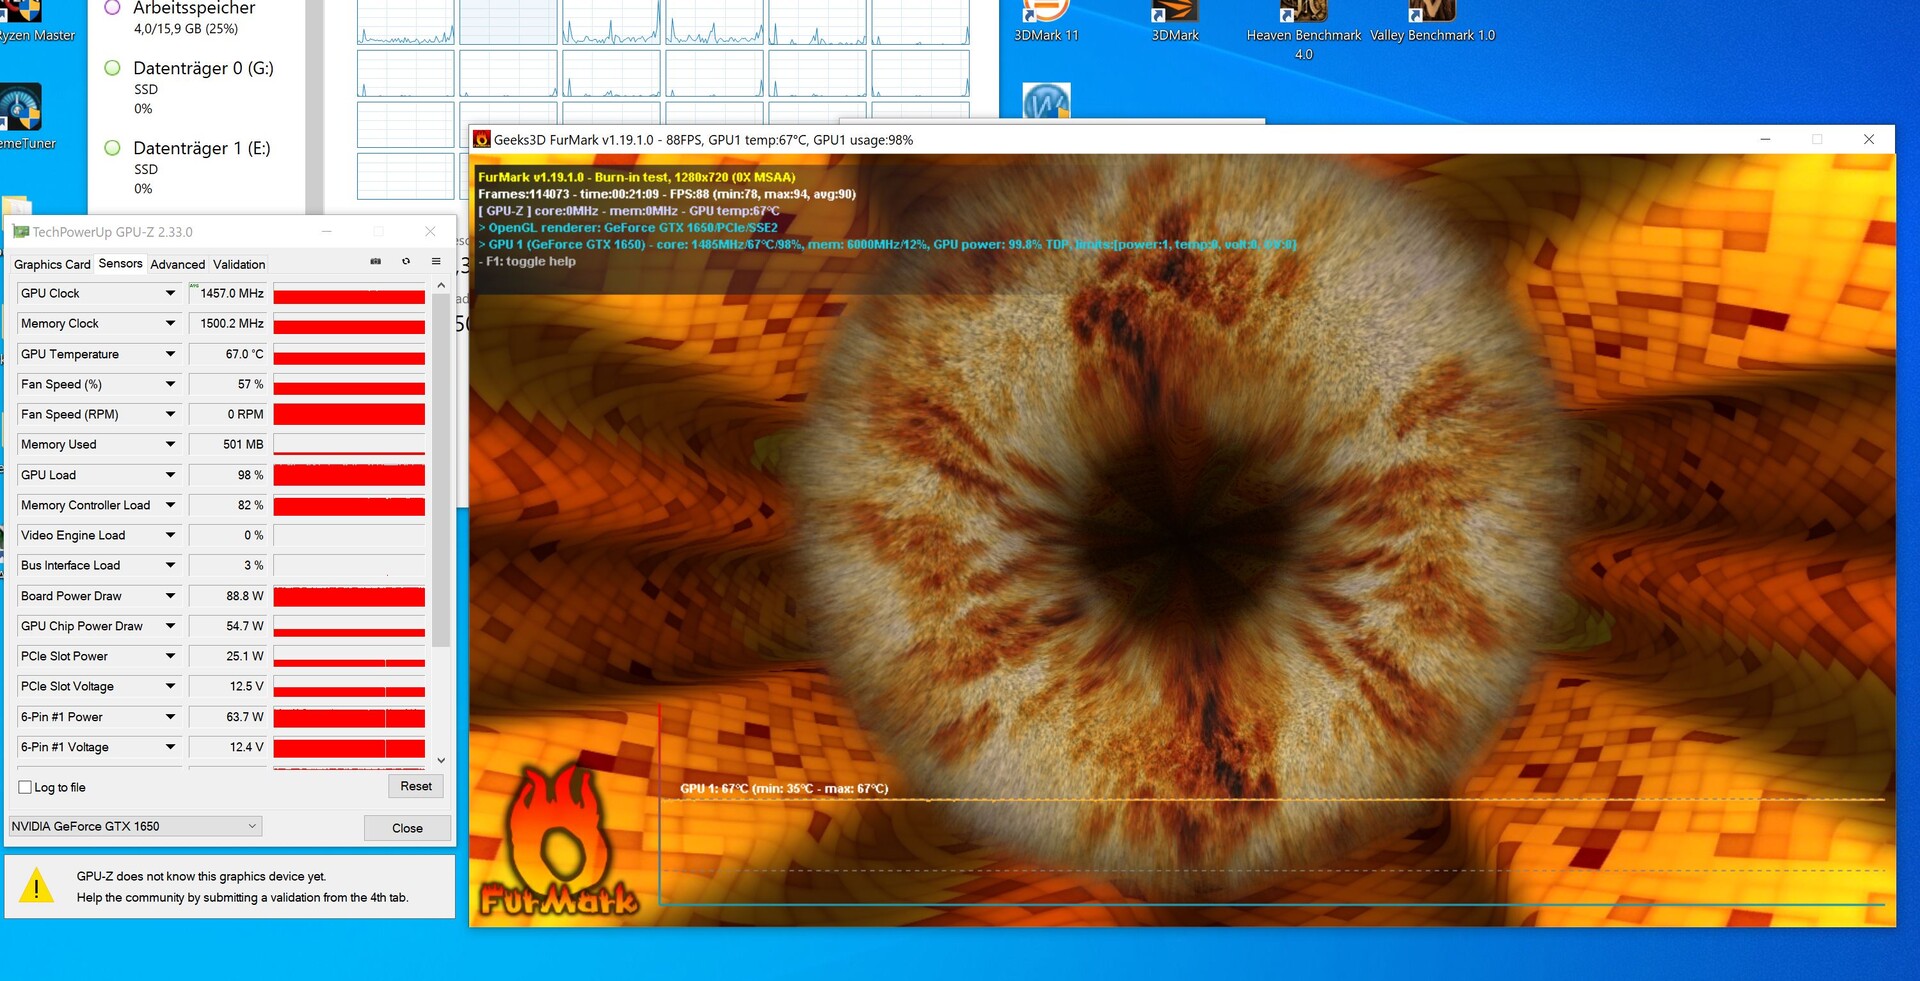
There were no thermal issues with the KFA2 GeForce GTX 1650 EX Plus. During the stress test, the temperatures peaked at 67 °C (152.6 °F) and both axial fans ran at 57% of their maximum speed. However, we could hear a quiet whirring sound coming from the case. We would not describe it as annoying.
| Power Consumption | |
| 1920x1080 The Witcher 3 ultra (external Monitor) | |
| AMD Radeon RX 5700 XT (Idle: 83.2 W) | |
| XFX AMD Radeon RX 590 OC+ 8 GB (Idle: 85.9 W) | |
| AMD Radeon RX 5700 XT (Idle: 69.8 W) | |
| XFX AMD Radeon RX 590 OC+ 8 GB | |
| KFA2 GeForce RTX 2060 Super (81.7 fps, Idle: 93.8 W) | |
| Nvidia GeForce RTX 2060 Super (Idle: 86.7 W) | |
| AMD Radeon RX 5700 (Idle: 77.9 W) | |
| Sapphire NITRO+ RX 570 8 GB (Idle: 85.5 W) | |
| Nvidia GeForce RTX 2060 Super (82.7 fps, Idle: 77.12 W) | |
| AMD Radeon RX 5700 (84.2 fps, Idle: 64.5 W) | |
| MSI RTX 2060 Gaming Z 6G (Idle: 74.66 W) | |
| Sapphire AMD Radeon RX 5600 XT (Idle: 112 W) | |
| Sapphire NITRO+ RX 570 8 GB (Idle: 72.61 W) | |
| KFA 2 GeForce GTX 1660 Super (Idle: 84.76 W) | |
| PNY GeForce GTX 1660 (Idle: 79.88 W) | |
| Zotac GeForce GTX 1660 Ti 6 GB (Idle: 68.3 W) | |
| Gainward GeForce GTX 1650 4 GB (Idle: 82.4 W) | |
| KFA2 GeForce GTX 1650 EX One Click Plus (Idle: 85.5 W) | |
| Gainward GeForce GTX 1650 4 GB (Idle: 64.63 W) | |
| 1280x720 FurMark 1.19 GPU Stress Test (external Monitor) | |
| XFX AMD Radeon RX 590 OC+ 8 GB (Idle: 85.9 W) | |
| XFX AMD Radeon RX 590 OC+ 8 GB | |
| AMD Radeon RX 5700 XT (Idle: 83.2 W) | |
| AMD Radeon RX 5700 XT (239 fps, Idle: 69.8 W) | |
| Sapphire NITRO+ RX 570 8 GB (Idle: 85.5 W) | |
| Sapphire AMD Radeon RX 5600 XT (Idle: 112 W) | |
| KFA2 GeForce RTX 2060 Super (234 fps, Idle: 93.8 W) | |
| Nvidia GeForce RTX 2060 Super (Idle: 86.7 W) | |
| Sapphire NITRO+ RX 570 8 GB (Idle: 72.61 W) | |
| AMD Radeon RX 5700 (Idle: 77.9 W) | |
| MSI RTX 2060 Gaming Z 6G (Idle: 74.66 W) | |
| Nvidia GeForce RTX 2060 Super (237 fps, Idle: 77.12 W) | |
| AMD Radeon RX 5700 (207 fps, Idle: 64.5 W) | |
| PNY GeForce GTX 1660 (Idle: 79.88 W) | |
| KFA 2 GeForce GTX 1660 Super (Idle: 84.76 W) | |
| Zotac GeForce GTX 1660 Ti 6 GB (Idle: 68.3 W) | |
| Gainward GeForce GTX 1650 4 GB (Idle: 82.4 W) | |
| KFA2 GeForce GTX 1650 EX One Click Plus (Idle: 85.5 W) | |
| Gainward GeForce GTX 1650 4 GB (Idle: 64.63 W, Idle: 64.63 W) | |
* ... smaller is better
Overclocking - 10 to 15% more performance
Unfortunately, the power target of the KFA2 GeForce GTX 1650 EX Plus cannot be raised beyond 90 watts. In KFA2’s Xtreme Tuner, users can activate the 1-Click OC feature, which increases the core clock by 30 MHz. However, there is no observable boost in performance.
When overclocking manually, the core clock can be increased by 220 MHz and the memory frequency by 1200 MHz. The GPU was stable with these overclocks and we ran two benchmarks to gauge the performance. Depending the application, users can expect to see 10 to 15% more performance. Nevertheless, the GeForce GTX 1660 still offers a higher level of performance.
Pros
Cons
Verdict - The better GeForce GTX 1650
The KFA2 GeForce GTX 1650 EX Plus is a better version of the GeForce GTX 1650. Due to the poor availability of GDDR5 VRAM, the Turing-based entry-level GPU had to use faster GDDR6 VRAM. In combination with an increase in the number of texture mapping units, the GPU offers a small boost in performance. In the pure gaming benchmarks, the KFA2 GeForce GTX 1650 is sometimes able to equal the AMD Radeon RX 570. 4 GB of VRAM is not a lot, but, given the level of performance on offer, it is sufficient. The GPU can run modern games at 1080p with reduced graphics settings.
The KFA2 GeForce GTX 1650 EX Plus is a low-priced graphics card, which is a perfect option for a certain type of gamer.
All in all, the KFA2 GeForce GTX 1650 EX Plus leaves a very solid impression. The cooling solution does not become overwhelmed and is not very loud. The prices start at 130 Euros (~$154). Those who are happy with this level of performance and can live with the fact that the GPU comes with a 6-pin power connector should take a much closer look at the KFA2 GeForce GTX 1650 EX Plus.
