Notebookcheck Logo

Intel Arc Graphics 140T vs Intel Arc Graphics 130T

Intel Arc Graphics 140T

► remove from comparison Intel Arc 140T

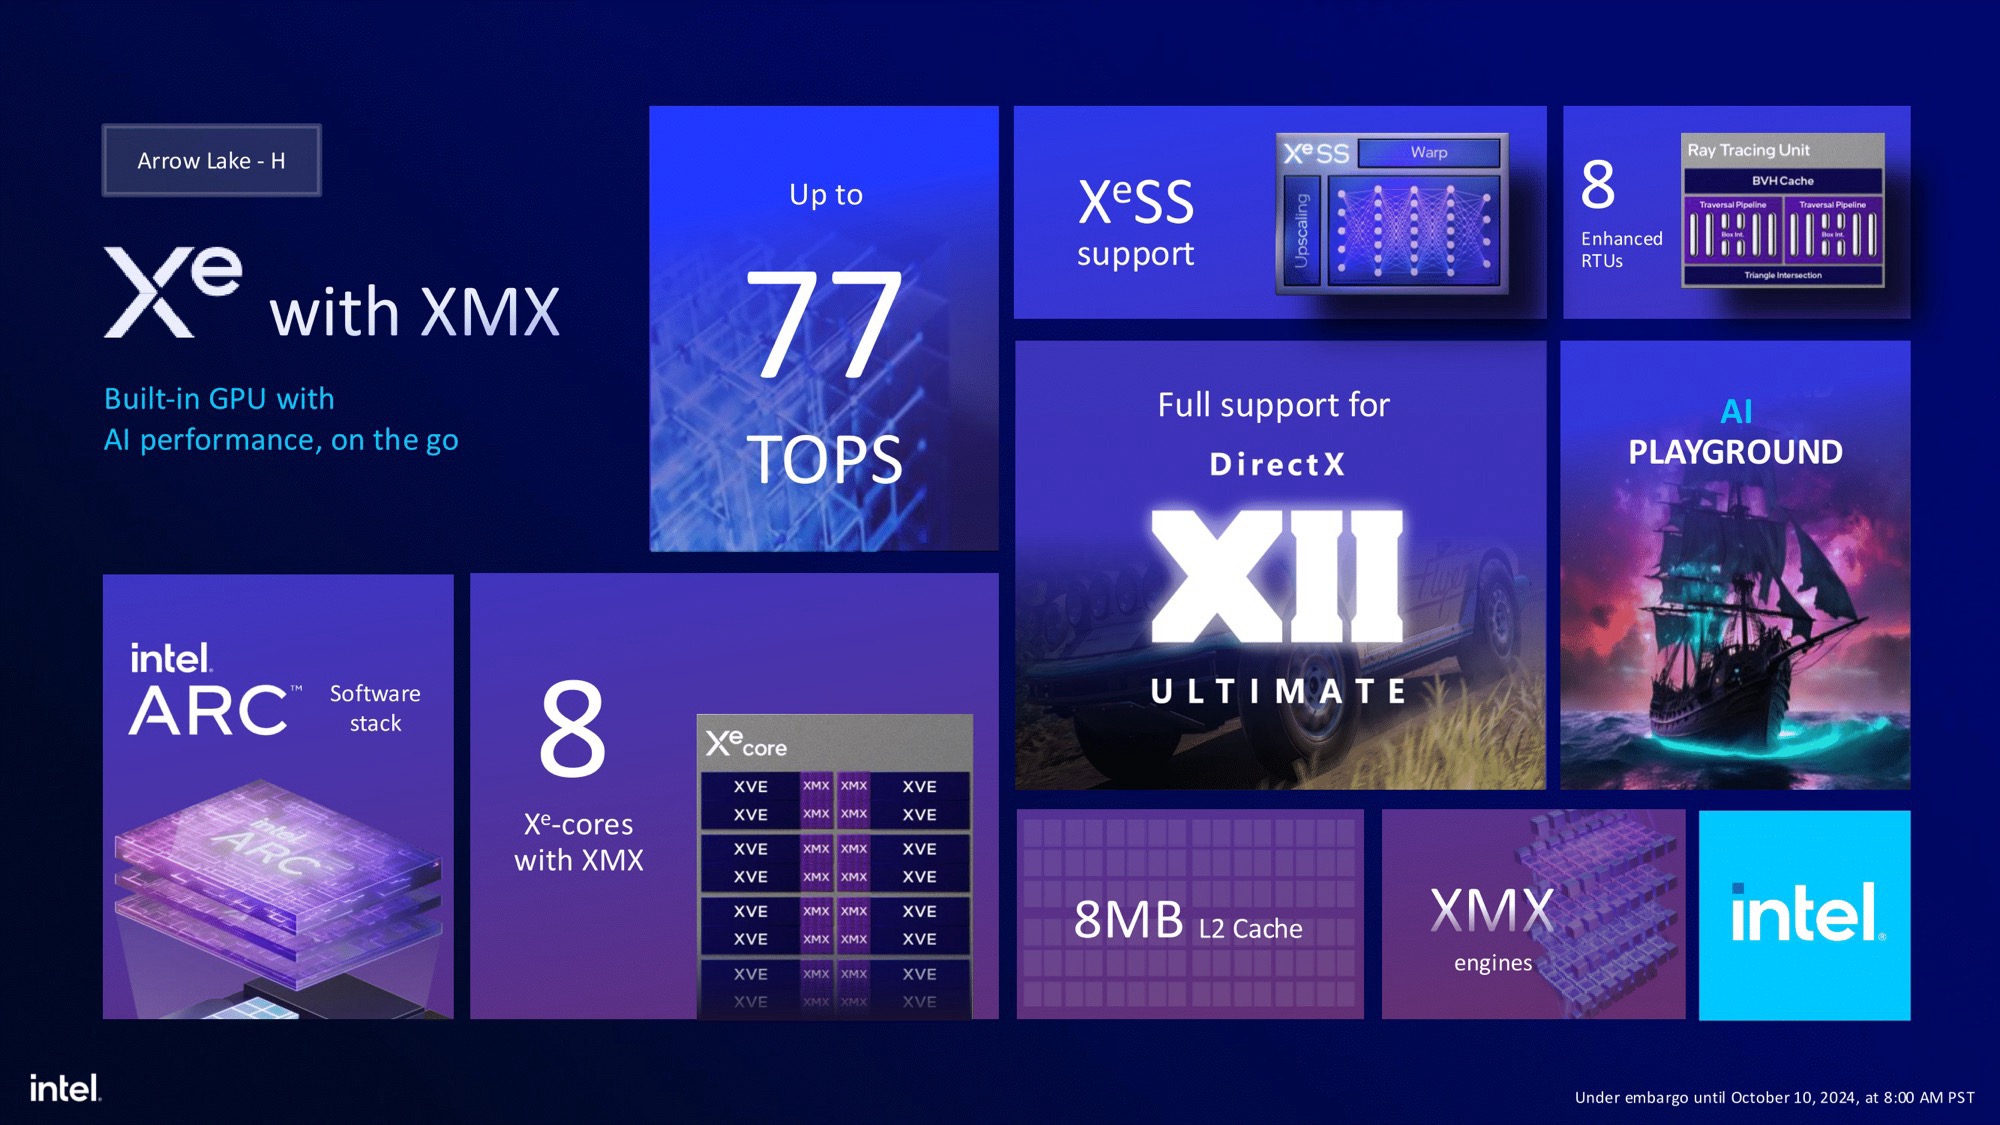
Intel Arc 140T is the iGPU used in the Intel Arrow Lake H/HX processor series. It is based on the Xe+ architecture (and not the newer Xe2 architecture that e.g. the Arc Graphics 140V in Lunar Lake uses). The graphics adapter features 8 cores (128 CUs, 8 Raytracing units) with XMX instructions for improved AI performance and 8 MB L2-Cache.

Thanks to the similar core count and clock speed but higher TDP, the performance should be similar to the Xe2 based Intel Arc 140V iGPU. First leaked benchmarks even showed a vastly better performance. All in all, we think that the Arc 140T will be only suited for entry level gaming in lowest settings.

The Arc 140T is integrated in the H and HX series of CPUs but use an own chiplet that is manufactured at TSMC in 5nm (N5P process).

Intel Arc Graphics 130T

► remove from comparison Intel Arc 130T

Intel Arc 130T is the iGPU used in the Intel Arrow Lake H/HX processor series. It is based on the Xe+ architecture (and not the newer Xe2 architecture that e.g. the Arc Graphics 130V in Lunar Lake uses). The graphics adapter features 7 of the 8 cores (112 CUs, 7 Raytracing units) with XMX instructions for improved AI performance.

Thanks to the similar core count and clock speed but higher TDP, the performance should be similar to the Xe2 based Intel Arc 130V iGPU. First leaked benchmarks even showed a vastly better performance. All in all, we think that the Arc 130T will be only suited for entry level gaming in lowest settings.

The Arc 130T is integrated in the H and HX series of CPUs but use an own chiplet that is manufactured at TSMC in 5nm (N5P process).

Intel Arc Graphics 140TIntel Arc Graphics 130T
ArchitectureXe+Xe+
Pipelines128 - unified112 - unified
Raytracing Cores87
CacheL2: 8 MB
Shared Memoryyesyes
APIDirectX 12 Ultrimate
Date of Announcement06.01.2025 06.01.2025
CPU in Arc 140TGPU Base SpeedGPU Boost / Turbo
Intel Core Ultra 9 285H16 x 4500 MHz, 45 W? MHz2350 MHz
Intel Core Ultra 7 265H16 x 4500 MHz, 28 W? MHz2300 MHz
Intel Core Ultra 7 255H16 x 4400 MHz, 28 W? MHz2250 MHz
Intel Core Ultra 5 235H14 x 4400 MHz, 28 W? MHz2250 MHz
min. - max.? MHz2250 - 2350 MHz
CPU in Arc 130TGPU Base SpeedGPU Boost / Turbo
Intel Core Ultra 5 225H14 x 4300 MHz, 28 W? MHz2200 MHz

Benchmarks

Performance Rating - 3DMark 11 + Fire Strike + Time Spy - Arc 140T
3.2 pt (10%)
Restrict / Search: Model: Max. age: years
3DMark - 3DMark Speed Way Score
min: 354     avg: 576     median: 641 (4%)     max: 784 Points
3DMark - 3DMark Steel Nomad
min: 591     avg: 807     median: 838 (6%)     max: 919 Points
544 Points (4%)
3DMark - 3DMark Steel Nomad Light
min: 2278     avg: 3281     median: 3620 (8%)     max: 3692 Points
2207 Points (5%)
3DMark - 3DMark Wild Life Unlimited
25439 Points (13%)
3DMark - 3DMark Wild Life Extreme Unlimited
min: 3927     avg: 5780     median: 5779.5 (7%)     max: 7632 Points
3DMark - 3DMark Solar Bay
min: 14569     avg: 15140     median: 15012.5 (7%)     max: 15966 Points
3DMark - 3DMark Fire Strike Standard Score
min: 4899     avg: 8020     median: 8089.5 (12%)     max: 10166 Points
4719 Points (7%)
3DMark - 3DMark Fire Strike Standard Graphics
min: 5433     avg: 8661     median: 8663.5 (8%)     max: 10742 Points
5173 Points (5%)
3DMark - 3DMark Ice Storm Graphics
min: 231964     avg: 260387     median: 251664 (28%)     max: 316591 Points
3DMark - 3DMark Time Spy Score
min: 2769     avg: 4123     median: 4238 (11%)     max: 4876 Points
2697 Points (7%)
3DMark - 3DMark Time Spy Graphics
min: 2466     avg: 3725     median: 3843 (8%)     max: 4387 Points
2402 Points (5%)
3DMark - 3DMark Ice Storm Unlimited Graphics
min: 497297     avg: 512796     median: 517616 (52%)     max: 518657 Points
3DMark - 3DMark Ice Storm Extreme Graphics
min: 193121     avg: 207526     median: 199219 (23%)     max: 237569 Points
138215 Points (16%)
3DMark - 3DMark Cloud Gate Score
min: 31110     avg: 37584     median: 38257.5 (36%)     max: 41407 Points
25527 Points (24%)
3DMark - 3DMark Cloud Gate Graphics
min: 45411     avg: 50811     median: 50818.5 (13%)     max: 55397 Points
27791 Points (7%)
3DMark - 3DMark Night Raid
min: 29556     avg: 32858     median: 33550 (32%)     max: 34774 Points
3DMark - 3DMark Night Raid Graphics Score
min: 35478     avg: 38789     median: 39732.5 (15%)     max: 40212 Points
3DMark 11 - 3DM11 Performance Score
min: 9776     avg: 12835     median: 13138.5 (16%)     max: 15552 Points
9338 Points (11%)
3DMark 11 - 3DM11 Performance GPU
min: 9684     avg: 12357     median: 12490 (10%)     max: 14935 Points
9106 Points (7%)
3DMark Vantage
3DM Vant. Perf. total + Intel Arc Graphics 140T
3DMark Vantage - 3DM Vant. Perf. total
min: 52307     avg: 55366     median: 55385 (16%)     max: 58039 Points
3DM Vant. Perf. total + Intel Arc Graphics 130T
30169 Points (9%)
3DM Vant. Perf. GPU no PhysX + Intel Arc Graphics 140T
3DMark Vantage - 3DM Vant. Perf. GPU no PhysX
min: 46778     avg: 49135     median: 49094 (27%)     max: 52086 Points
3DM Vant. Perf. GPU no PhysX + Intel Arc Graphics 130T
24931 Points (14%)
3DMark 05 - 3DMark 05 - Standard
min: 48490     avg: 53834     median: 54646 (60%)     max: 57554 Points
3DMark 06 3DMark 06 - Standard 1280x1024 + Intel Arc Graphics 140T
3DMark 06
min: 45558     avg: 47409     median: 47698 (62%)     max: 48766 Points
3DMark 06 - Standard 1280x1024 + Intel Arc Graphics 130T
35258 Points (46%)
Unigine Valley 1.0 - Unigine Valley 1.0 DX
min: 25.4     avg: 27.2     median: 26.5 (8%)     max: 30.4 fps
14.3 fps (4%)
SPECviewperf 12
specvp12 sw-03 + Intel Arc Graphics 140T
SPECviewperf 12 - specvp12 sw-03
min: 59.6     avg: 68.7     median: 65 (16%)     max: 81.6 fps
specvp12 snx-02 + Intel Arc Graphics 140T
SPECviewperf 12 - specvp12 snx-02
min: 3.75     avg: 3.9     median: 3.9 (1%)     max: 4.02 fps
specvp12 showcase-01 + Intel Arc Graphics 140T
SPECviewperf 12 - specvp12 showcase-01
min: 25.9     avg: 29.3     median: 27.7 (5%)     max: 34.2 fps
specvp12 mediacal-01 + Intel Arc Graphics 140T
SPECviewperf 12 - specvp12 mediacal-01
19.3 fps (5%)
specvp12 maya-04 + Intel Arc Graphics 140T
SPECviewperf 12 - specvp12 maya-04
min: 61.4     avg: 69.5     median: 69 (19%)     max: 78.2 fps
specvp12 energy-01 + Intel Arc Graphics 140T
SPECviewperf 12 - specvp12 energy-01
min: 0.79     avg: 0.8     median: 0.8 (1%)     max: 0.92 fps
specvp12 creo-01 + Intel Arc Graphics 140T
SPECviewperf 12 - specvp12 creo-01
min: 32     avg: 34.7     median: 36.1 (14%)     max: 36.1 fps
specvp12 catia-04 + Intel Arc Graphics 140T
SPECviewperf 12 - specvp12 catia-04
min: 64.2     avg: 69.1     median: 71.4 (12%)     max: 71.8 fps
specvp12 3dsmax-05 + Intel Arc Graphics 140T
SPECviewperf 12 - specvp12 3dsmax-05
min: 64.9     avg: 67.9     median: 69 (10%)     max: 69.9 fps
SPECviewperf 13 specvp13 sw-04 + Intel Arc Graphics 140T
SPECviewperf 13 - specvp13 sw-04
min: 66.5     avg: 69     median: 67.1 (18%)     max: 73.4 fps
specvp13 snx-03 + Intel Arc Graphics 140T
SPECviewperf 13 - specvp13 snx-03
min: 6.43     avg: 6.7     median: 6.6 (1%)     max: 7.05 fps
specvp13 showcase-02 + Intel Arc Graphics 140T
SPECviewperf 13 - specvp13 showcase-02
min: 24.5     avg: 27.3     median: 26.9 (5%)     max: 30.5 fps
specvp13 medical-02 + Intel Arc Graphics 140T
SPECviewperf 13 - specvp13 medical-02
min: 31     avg: 31.1     median: 31.1 (5%)     max: 31.1 fps
specvp13 maya-05 + Intel Arc Graphics 140T
SPECviewperf 13 - specvp13 maya-05
min: 64.6     avg: 75.2     median: 78.3 (9%)     max: 82.7 fps
specvp13 energy-02 + Intel Arc Graphics 140T
SPECviewperf 13 - specvp13 energy-02
min: 6.33     avg: 6.5     median: 6.4 (2%)     max: 6.81 fps
specvp13 creo-02 + Intel Arc Graphics 140T
SPECviewperf 13 - specvp13 creo-02
min: 47.1     avg: 49     median: 48.8 (7%)     max: 51 fps
specvp13 catia-05 + Intel Arc Graphics 140T
SPECviewperf 13 - specvp13 catia-05
min: 94.7     avg: 97.1     median: 96.9 (11%)     max: 99.6 fps
specvp13 3dsmax-06 + Intel Arc Graphics 140T
SPECviewperf 13 - specvp13 3dsmax-06
min: 51     avg: 56.5     median: 58.1 (9%)     max: 60.5 fps
SPECviewperf 2020 specvp2020 solidworks-05 1080p + Intel Arc Graphics 140T
SPECviewperf 2020 - specvp2020 solidworks-05 1080p
50.6 fps (9%)
specvp2020 snx-04 1080p + Intel Arc Graphics 140T
SPECviewperf 2020 - specvp2020 snx-04 1080p
min: 6.26     avg: 20.6     median: 6.8 (1%)     max: 76.6 fps
specvp2020 medical-03 1080p + Intel Arc Graphics 140T
SPECviewperf 2020 - specvp2020 medical-03 1080p
min: 15.9     avg: 20.5     median: 17.3 (5%)     max: 34.73 fps
specvp2020 maya-06 1080p + Intel Arc Graphics 140T
SPECviewperf 2020 - specvp2020 maya-06 1080p
min: 107     avg: 117.2     median: 117.8 (13%)     max: 128 fps
specvp2020 energy-03 1080p + Intel Arc Graphics 140T
SPECviewperf 2020 - specvp2020 energy-03 1080p
min: 5.59     avg: 8.6     median: 6.8 (1%)     max: 17.28 fps
specvp2020 creo-03 1080p + Intel Arc Graphics 140T
SPECviewperf 2020 - specvp2020 creo-03 1080p
min: 30.8     avg: 38.1     median: 37.1 (13%)     max: 49.18 fps
specvp2020 catia-06 1080p + Intel Arc Graphics 140T
SPECviewperf 2020 - specvp2020 catia-06 1080p
min: 21.5     avg: 24.1     median: 23.8 (12%)     max: 27.09 fps
specvp2020 3dsmax-07 1080p + Intel Arc Graphics 140T
SPECviewperf 2020 - specvp2020 3dsmax-07 1080p
min: 23.9     avg: 25.3     median: 25.3 (7%)     max: 26.6 fps
specvp2020 snx-04 4k + Intel Arc Graphics 140T
SPECviewperf 2020 - specvp2020 snx-04 4k
min: 6.07     avg: 6.3     median: 6.2 (1%)     max: 6.81 fps
specvp2020 medical-03 4k + Intel Arc Graphics 140T
SPECviewperf 2020 - specvp2020 medical-03 4k
min: 6.59     avg: 6.9     median: 6.9 (4%)     max: 7.08 fps
specvp2020 maya-06 4k + Intel Arc Graphics 140T
SPECviewperf 2020 - specvp2020 maya-06 4k
min: 44.9     avg: 49.2     median: 49.4 (7%)     max: 53.1 fps
specvp2020 energy-03 4k + Intel Arc Graphics 140T
SPECviewperf 2020 - specvp2020 energy-03 4k
min: 6.61     avg: 7.3     median: 7.3 (2%)     max: 7.94 fps
specvp2020 creo-03 4k + Intel Arc Graphics 140T
SPECviewperf 2020 - specvp2020 creo-03 4k
min: 19.9     avg: 23.1     median: 22.9 (10%)     max: 26.7 fps
specvp2020 catia-06 4k + Intel Arc Graphics 140T
SPECviewperf 2020 - specvp2020 catia-06 4k
min: 12.8     avg: 14.2     median: 14.5 (9%)     max: 15.2 fps
specvp2020 3dsmax-07 4k + Intel Arc Graphics 140T
SPECviewperf 2020 - specvp2020 3dsmax-07 4k
min: 14.6     avg: 16.9     median: 17.2 (6%)     max: 18.4 fps
Cinebench R10 Cinebench R10 Shading (32bit) + Intel Arc Graphics 140T
Cinebench R10 - Cinebench R10 Shading (32bit)
min: 13323     avg: 17073     median: 16147 (11%)     max: 21927 Points
Cinebench R10 Shading (32bit) + Intel Arc Graphics 130T
16344 Points (12%)
Cinebench R11.5 Cinebench R11.5 OpenGL 64 Bit + Intel Arc Graphics 140T
Cinebench R11.5 - Cinebench R11.5 OpenGL 64 Bit
min: 155.37     avg: 161.8     median: 159.1 (52%)     max: 174.65 fps
Cinebench R11.5 OpenGL 64 Bit + Intel Arc Graphics 130T
117.6 fps (39%)
Cinebench R15
Cinebench R15 OpenGL 64 Bit + Intel Arc Graphics 140T
Cinebench R15 - Cinebench R15 OpenGL 64 Bit
min: 152     avg: 191.5     median: 198.3 (12%)     max: 219.75 fps
Cinebench R15 OpenGL 64 Bit + Intel Arc Graphics 130T
150.4 fps (9%)
Cinebench R15 OpenGL Ref. Match 64 Bit + Intel Arc Graphics 140T
Cinebench R15 - Cinebench R15 OpenGL Ref. Match 64 Bit
97.8 % (98%)
Cinebench R15 OpenGL Ref. Match 64 Bit + Intel Arc Graphics 130T
97.8 % (98%)
GFXBench - GFXBench 5.0 4K Aztec Ruins High Tier Offscreen
min: 38.3     avg: 40.6     median: 39.5 (15%)     max: 44.1 fps
23.3 fps (9%)
GFXBench - GFXBench 5.0 Aztec Ruins High Tier Offscreen
min: 81.3     avg: 88     median: 82.3 (15%)     max: 100.3 fps
50 fps (9%)
GFXBench - GFXBench 5.0 Aztec Ruins Normal Tier Offscreen
min: 208.5     avg: 225.3     median: 216.8 (16%)     max: 250.7 fps
120.2 fps (9%)
GFXBench - GFXBench Car Chase Offscreen
min: 155.2     avg: 162.4     median: 157.3 (15%)     max: 174.6 fps
105 fps (10%)
GFXBench 3.1 - GFXBench Manhattan ES 3.1 Offscreen
min: 249.6     avg: 266.6     median: 260.8 (6%)     max: 289.3 fps
152.4 fps (3%)
GFXBench 3.0 - GFXBench 3.0 Manhattan Offscreen
min: 374.3     avg: 400.4     median: 390.8 (16%)     max: 436.2 fps
220 fps (9%)
GFXBench (DX / GLBenchmark) 2.7
GFXBench T-Rex HD Offscreen C24Z16 + Intel Arc Graphics 140T
GFXBench (DX / GLBenchmark) 2.7 - GFXBench T-Rex HD Offscreen C24Z16
min: 822.6     avg: 873     median: 870.3 (7%)     max: 927 fps
GFXBench T-Rex HD Offscreen C24Z16 + Intel Arc Graphics 130T
495.4 fps (4%)
Basemark GPU 1.2 - Basemark GPU 1.2 Vulkan Official Medium Offscreen 1080
min: 104.6     avg: 473.3     median: 315 (8%)     max: 1528 fps
193.6 fps (5%)
Basemark GPU 1.2 - Basemark GPU 1.2 Vulkan Official High Offscreen 2160
min: 3.64     avg: 63.6     median: 3.6 (1%)     max: 143.6 fps
Geekbench 6.5 - Geekbench 6.5 GPU OpenCL
min: 28049     avg: 39344     median: 41013 (10%)     max: 43279 Points
29540 Points (8%)
Geekbench 6.5 - Geekbench 6.5 GPU Vulkan
min: 26352     avg: 34707     median: 35003 (9%)     max: 40404 Points
23036 Points (6%)
LuxMark v2.0 64Bit - LuxMark v2.0 Room GPU
min: 965     avg: 1082     median: 1074 (4%)     max: 1203 Samples/s
487 Samples/s (2%)
LuxMark v2.0 64Bit - LuxMark v2.0 Sala GPU
min: 3657     avg: 3851     median: 3809 (7%)     max: 4137 Samples/s
2124 Samples/s (4%)
ComputeMark v2.1 - ComputeMark v2.1 Result
min: 7612     avg: 7745     median: 7751 (6%)     max: 7948 Points
5377 Points (4%)
Power Consumption - Furmark Stress Test Power Consumption - external Monitor *
min: 42.7     avg: 50.7     median: 49.9 (7%)     max: 62.5 Watt
38.9 Watt (5%)
Power Consumption - Cyberpunk 2077 Power Consumption 150cd *
min: 32.7     avg: 58     median: 57.7 (16%)     max: 76.3 Watt
50.3 Watt (14%)
Power Consumption - Cyberpunk 2077 Power Consumption - external Monitor *
min: 44.3     avg: 58.2     median: 56.7 (7%)     max: 72.6 Watt
50.9 Watt (6%)
Power Consumption - Power Efficiency - Cyberpunk 2077 ultra
min: 0.2983     avg: 0.4     median: 0.4 (1%)     max: 0.4468 fps per Watt
0.3 fps per Watt (1%)
Emissions Witcher 3 Fan Noise + Intel Arc Graphics 140T
Emissions - Witcher 3 Fan Noise
min: 38.7     avg: 43.2     median: 43.2 (62%)     max: 47.7 dB(A)

Average Benchmarks Intel Arc Graphics 140T → 100% n=32

Average Benchmarks Intel Arc Graphics 130T → 65% n=32

- Range of benchmark values for this graphics card
red legend - Average benchmark values for this graphics card
* Smaller numbers mean a higher performance
1 This benchmark is not used for the average calculation

Game Benchmarks

The following benchmarks stem from our benchmarks of review laptops. The performance depends on the used graphics memory, clock rate, processor, system settings, drivers, and operating systems. So the results don't have to be representative for all laptops with this GPU. For detailed information on the benchmark results, click on the fps number.

F1 25

F1 25

2025
low 1920x1080
100%
Arc 140T:
52.4 57.6 70.3 70.8 ~ 63 fps
med. 1920x1080
100%
Arc 140T:
45.3 49.1 59.4 60.9 ~ 54 fps
high 1920x1080
100%
Arc 140T:
37.7 37.9 46.9 47.2 ~ 42 fps
ultra 1920x1080
100%
Arc 140T:
30.2  fps
QHD 2560x1440
100%
Arc 140T:
9.6  fps
low 1920x1080
100%
Arc 140T:
37.3  fps
med. 1920x1080
100%
Arc 140T:
29.8  fps
high 1920x1080
100%
Arc 140T:
24.5  fps
ultra 1920x1080
100%
Arc 140T:
18  fps
F1 24

F1 24

2024
low 1920x1080
100%
Arc 140T:
53.5 69.6 75.5 76 76.5 77.7 77.7 78.7 78.9 82.3 83 86.4 86.5 ~ 77 fps
69%
Arc 130T:
52.9  fps
med. 1920x1080
100%
Arc 140T:
47.4 66.7 69.3 69.4 69.5 69.6 70.3 71.5 72.8 74.1 74.9 77.6 79 ~ 70 fps
69%
Arc 130T:
48.3  fps
high 1920x1080
100%
Arc 140T:
37.5 51.7 53.3 53.8 54.2 54.5 55.2 56.6 57.7 58.9 59.3 59.6 ~ 54 fps
69%
Arc 130T:
37.2  fps
ultra 1920x1080
100%
Arc 140T:
16.4 17.1 17.8 18.1 18.1 18.2 19.2 19.3 19.5 19.9 ~ 18 fps
low 1920x1080
100%
Arc 140T:
107.8 127.8 ~ 118 fps
med. 1920x1080
100%
Arc 140T:
82.9 88.3 ~ 86 fps
high 1920x1080
100%
Arc 140T:
63.3 66.5 ~ 65 fps
ultra 1920x1080
100%
Arc 140T:
55.7 59.8 ~ 58 fps
low 1920x1080
100%
Arc 140T:
24.8 30.3 32.5 33.8 35.8 35.9 35.9 37.3 37.3 37.6 38 38.4 38.8 40.5 40.8 41.7 42.3 ~ 37 fps
70%
Arc 130T:
25.9  fps
med. 1920x1080
100%
Arc 140T:
21.8 25.3 26.1 26.7 30 30.4 30.5 30.8 30.8 31.4 32.3 33.5 33.7 34.7 35.1 ~ 30 fps
73%
Arc 130T:
21.8  fps
high 1920x1080
100%
Arc 140T:
17 21.3 22.8 23.8 24.3 25.2 26.4 26.6 26.7 27 27.5 27.7 28.7 29 29.7 30 ~ 26 fps
68%
Arc 130T:
17.6  fps
ultra 1920x1080
100%
Arc 140T:
15.4 18.6 20.7 20.7 20.9 21.7 22.8 23.5 23.9 24.1 24.5 24.7 24.8 24.8 25.6 26.5 27.1 27.3 ~ 23 fps
68%
Arc 130T:
15.6  fps
QHD 2560x1440
100%
Arc 140T:
15.8  fps
low 1920x1080
100%
Arc 140T:
25.6 31.3 32 33.4 35.6 35.8 36.1 36.9 37.8 38.8 39.1 39.4 39.5 39.8 40.9 41.5 42.4 ~ 37 fps
69%
Arc 130T:
25.7  fps
med. 1920x1080
100%
Arc 140T:
20.3 25.7 26.1 26.6 28.4 28.8 28.8 29.8 29.9 30 30.3 30.5 30.7 31.2 31.4 32.6 33.3 ~ 29 fps
71%
Arc 130T:
20.5  fps
high 1920x1080
100%
Arc 140T:
17.6 21.8 22.8 23.6 24.8 25.1 25.3 25.7 25.7 25.8 26 26 26.1 26.2 26.9 27.8 28.3 ~ 25 fps
110%
Arc 130T:
27.5  fps
ultra 1920x1080
100%
Arc 140T:
17.2 21 22.5 23 23 24.4 24.4 24.7 24.8 25.2 25.3 25.3 25.4 25.5 26 26.4 27.1 27.8 ~ 24 fps
113%
Arc 130T:
27.2  fps
QHD 2560x1440
100%
Arc 140T:
19.5  fps
low 1920x1080
100%
Arc 140T:
54.1  fps
med. 1920x1080
100%
Arc 140T:
42.7  fps
high 1920x1080
100%
Arc 140T:
37.5  fps
ultra 1920x1080
100%
Arc 140T:
32.8  fps
Anno 1800

Anno 1800

2019
low 1280x720
100%
Arc 140T:
92.7  fps
med. 1920x1080
100%
Arc 140T:
50.4  fps
high 1920x1080
100%
Arc 140T:
37  fps
ultra 1920x1080
100%
Arc 140T:
28  fps
Strange Brigade

Strange Brigade

2018
low 1280x720
100%
Arc 140T:
102.2 158.1 160.5 162.3 167.7 178.7 187.7 190.3 194.2 198.3 198.9 200 208 216 ~ 180 fps
53%
Arc 130T:
94.7  fps
med. 1920x1080
100%
Arc 140T:
36 61.6 73.1 74.1 75.8 79.4 80.3 81.9 83.6 87 87.6 90.2 90.9 92.1 ~ 78 fps
47%
Arc 130T:
36.3  fps
high 1920x1080
100%
Arc 140T:
32.1 56.6 60.9 62.7 64.3 64.8 67 68.2 71 71.2 71.4 75.1 75.1 76.5 ~ 65 fps
47%
Arc 130T:
30.3  fps
ultra 1920x1080
100%
Arc 140T:
30.8 46.2 48.6 50.7 51.9 52.7 53.9 56.2 56.3 57.7 59 60.9 61.2 61.6 63.1 ~ 54 fps
55%
Arc 130T:
29.9  fps
Far Cry 5

Far Cry 5

2018
low 1280x720
100%
Arc 140T:
80 87 ~ 84 fps
med. 1920x1080
100%
Arc 140T:
48 48 ~ 48 fps
high 1920x1080
100%
Arc 140T:
44 45 ~ 45 fps
ultra 1920x1080
100%
Arc 140T:
38 42 ~ 40 fps
low 1280x720
100%
Arc 140T:
51.5 52.1 53.1 53.3 55.2 55.7 56.3 56.4 56.5 56.5 58.8 58.8 61.7 61.7 62.9 63.5 64.3 71.4 73.4 ~ 59 fps
87%
Arc 130T:
51.1  fps
med. 1920x1080
100%
Arc 140T:
39.2 42.7 43.2 43.3 44.4 44.5 44.7 44.9 45.1 47.1 47.3 47.3 47.7 50.2 52 53.1 54.9 55.7 57.7 ~ 48 fps
77%
Arc 130T:
37  fps
high 1920x1080
100%
Arc 140T:
33.2 34.3 35.4 36.1 37 37.2 37.7 38.1 38.1 38.4 38.5 38.6 38.8 41 42.9 43.3 46.3 48.3 49.2 ~ 40 fps
79%
Arc 130T:
31.5  fps
low 1280x720
100%
Arc 140T:
47 66.6 67.5 69.1 72.3 72.9 74.2 75.2 77.9 80.1 80.1 80.6 80.8 81.6 81.8 88.7 90.1 95.1 ~ 77 fps
59%
Arc 130T:
45.1  fps
med. 1920x1080
100%
Arc 140T:
25.4 38.8 38.9 39.3 40.1 40.6 40.8 42 43.6 43.9 44.2 44.3 44.9 46.9 47.1 47.1 47.8 47.9 ~ 42 fps
57%
Arc 130T:
24  fps
high 1920x1080
100%
Arc 140T:
19.5 25.8 26 27.2 27.9 28.3 28.6 28.9 29.4 29.5 29.8 30.6 30.9 31.4 31.7 31.7 33 33.1 ~ 29 fps
65%
Arc 130T:
18.8  fps
QHD 2560x1440
100%
Arc 140T:
23.4  fps
low 1280x720
100%
Arc 140T:
97.3 97.7 98.9 100.1 100.1 102.9 103.5 104.1 104.7 104.8 105.6 105.6 105.9 106.6 107.3 107.7 107.9 109.1 109.7 ~ 104 fps
98%
Arc 130T:
101.4  fps
med. 1366x768
100%
Arc 140T:
61.9 63.9 68.8 72.4 75.4 76.8 78.3 79.6 82.2 82.9 83.5 84.7 89.6 91.1 91.2 94.5 94.9 98 100.4 ~ 83 fps
92%
Arc 130T:
76  fps
high 1920x1080
100%
Arc 140T:
49.7 51.8 53.1 53.6 59.7 63.6 65 69.6 74.7 75.8 76.8 80.1 82.5 82.6 83.5 84.8 87.6 88.1 91.1 ~ 72 fps
75%
Arc 130T:
53.7  fps
ultra 1920x1080
100%
Arc 140T:
51.5 61.1 61.9 68.9 69.5 71.2 71.5 75.5 76.7 77.5 77.9 80.1 81.4 82.1 83.2 83.8 85.2 92.2 94.9 ~ 76 fps
69%
Arc 130T:
52.5  fps
low 1024x768
100%
Arc 140T:
158.7 164.4 166.8 180 ~ 167 fps
med. 1366x768
100%
Arc 140T:
100.9 107.2 109.9 112.9 ~ 108 fps
high 1920x1080
100%
Arc 140T:
54.9 56.8 58.4 63.6 ~ 58 fps
ultra 1920x1080
100%
Arc 140T:
28.1 31 31.2 32.2 ~ 31 fps
GTA V

GTA V

2015
low 1024x768
100%
Arc 140T:
134.6 140.4 156.4 163.6 164 164.1 168.4 168.9 171 172 176.4 176.5 176.6 178.3 179.2 179.5 ~ 167 fps
75%
Arc 130T:
125.9  fps
med. 1366x768
100%
Arc 140T:
111.4 133.6 150.4 152.3 152.6 153.9 154 155 160 161.1 164.9 165.2 168.9 169.1 169.3 174.4 ~ 156 fps
67%
Arc 130T:
104.3  fps
high 1920x1080
100%
Arc 140T:
25.5 37.3 37.5 38.1 39 39.7 40.9 41.2 41.7 41.7 43.2 43.8 44.2 44.4 45.3 46.9 ~ 41 fps
60%
Arc 130T:
24.4  fps
ultra 1920x1080
100%
Arc 140T:
10.4 15.4 15.6 15.7 15.9 16.3 16.6 16.8 17 17 17.1 17.1 18 18.1 18.1 18.1 18.5 ~ 17 fps
57%
Arc 130T:
9.8  fps
QHD 2560x1440
100%
Arc 140T:
12.3  fps

Average Gaming Intel Arc Graphics 140T → 100%

Average Gaming 30-70 fps → 100%

Average Gaming Intel Arc Graphics 130T → 71%

Average Gaming 30-70 fps → 68%

Intel Arc Graphics 140TIntel Arc Graphics 130T
lowmed.highultraQHD4Klowmed.highultraQHD4K
F1 2563544230.29.58
Kingdom Come Deliverance 237.329.824.518
F1 247770541852.948.337.2
Total War Pharaoh118866558
Cyberpunk 20773730262315.825.921.817.615.6
Baldur's Gate 33729252419.525.720.527.527.2
The Witcher 3 v454.142.737.532.8
Anno 180092.750.43728
Strange Brigade18078655494.736.330.329.9
Far Cry 584484540
X-Plane 11.1159484051.13731.5
Final Fantasy XV Benchmark77422923.445.12418.8
Dota 2 Reborn104837276101.47653.752.5
The Witcher 31671085831
GTA V167156411712.3125.9104.324.49.75
Intel Arc Graphics 140TIntel Arc Graphics 130T
lowmed.highultraQHD4Klowmed.highultraQHD4K
< 30 fps
< 60 fps
< 120 fps
≥ 120 fps

5
7
3
2
7
5
1
4
8
3
6
6
1
5


< 30 fps
< 60 fps
< 120 fps
≥ 120 fps
2
3
2
1
3
3
2
4
4

4
1


For more games that might be playable and a list of all games and graphics cards visit our Gaming List

Add one or more devices and compare

In the following list you can select (and also search for) devices that should be added to the comparison. You can select more than one device.

restrict list:
v1.35
log 11. 11:33:44

#0 ran 0s before starting gpusingle class +0s ... 0s

#1 checking url part for id 12966 +0s ... 0s

#2 checking url part for id 12967 +0s ... 0s

#3 redirected to Ajax server, took 1768127624s time from redirect:0 +0s ... 0s

#4 did not recreate cache, as it is less than 5 days old! Created at Sat, 10 Jan 2026 05:19:12 +0100 +0s ... 0s

#5 composed specs +0.003s ... 0.004s

#6 did output specs +0s ... 0.004s

#7 start showIntegratedCPUs +0s ... 0.004s

#8 getting avg benchmarks for device 12966 +0.021s ... 0.025s

#9 got single benchmarks 12966 +0.027s ... 0.052s

#10 getting avg benchmarks for device 12967 +0s ... 0.052s

#11 got single benchmarks 12967 +0.005s ... 0.057s

#12 got avg benchmarks for devices +0s ... 0.057s

#13 min, max, avg, median took s +0.049s ... 0.106s

#14 before gaming benchmark output +0s ... 0.106s

#15 Got 719 rows for game benchmarks. +0.048s ... 0.154s

#16 composed SQL query for gamebenchmarks +0s ... 0.154s

#17 got data and put it in $dataArray +0.002s ... 0.156s

#18 benchmarks composed for output. +0.007s ... 0.163s

#19 calculated avg scores. +0s ... 0.163s

#20 return log +0.001s ... 0.164s

Please share our article, every link counts!
Mail Logo
Google Logo Add as a preferred
source on Google
> Expert Reviews and News on Laptops, Smartphones and Tech Innovations > Benchmarks / Tech > Graphics Card Comparison - Head 2 Head
Redaktion, 2017-09- 8 (Update: 2023-07- 1)