ZOTAC Gaming Zone handheld review: Precision controller, brilliant OLED and compact
In the zone:
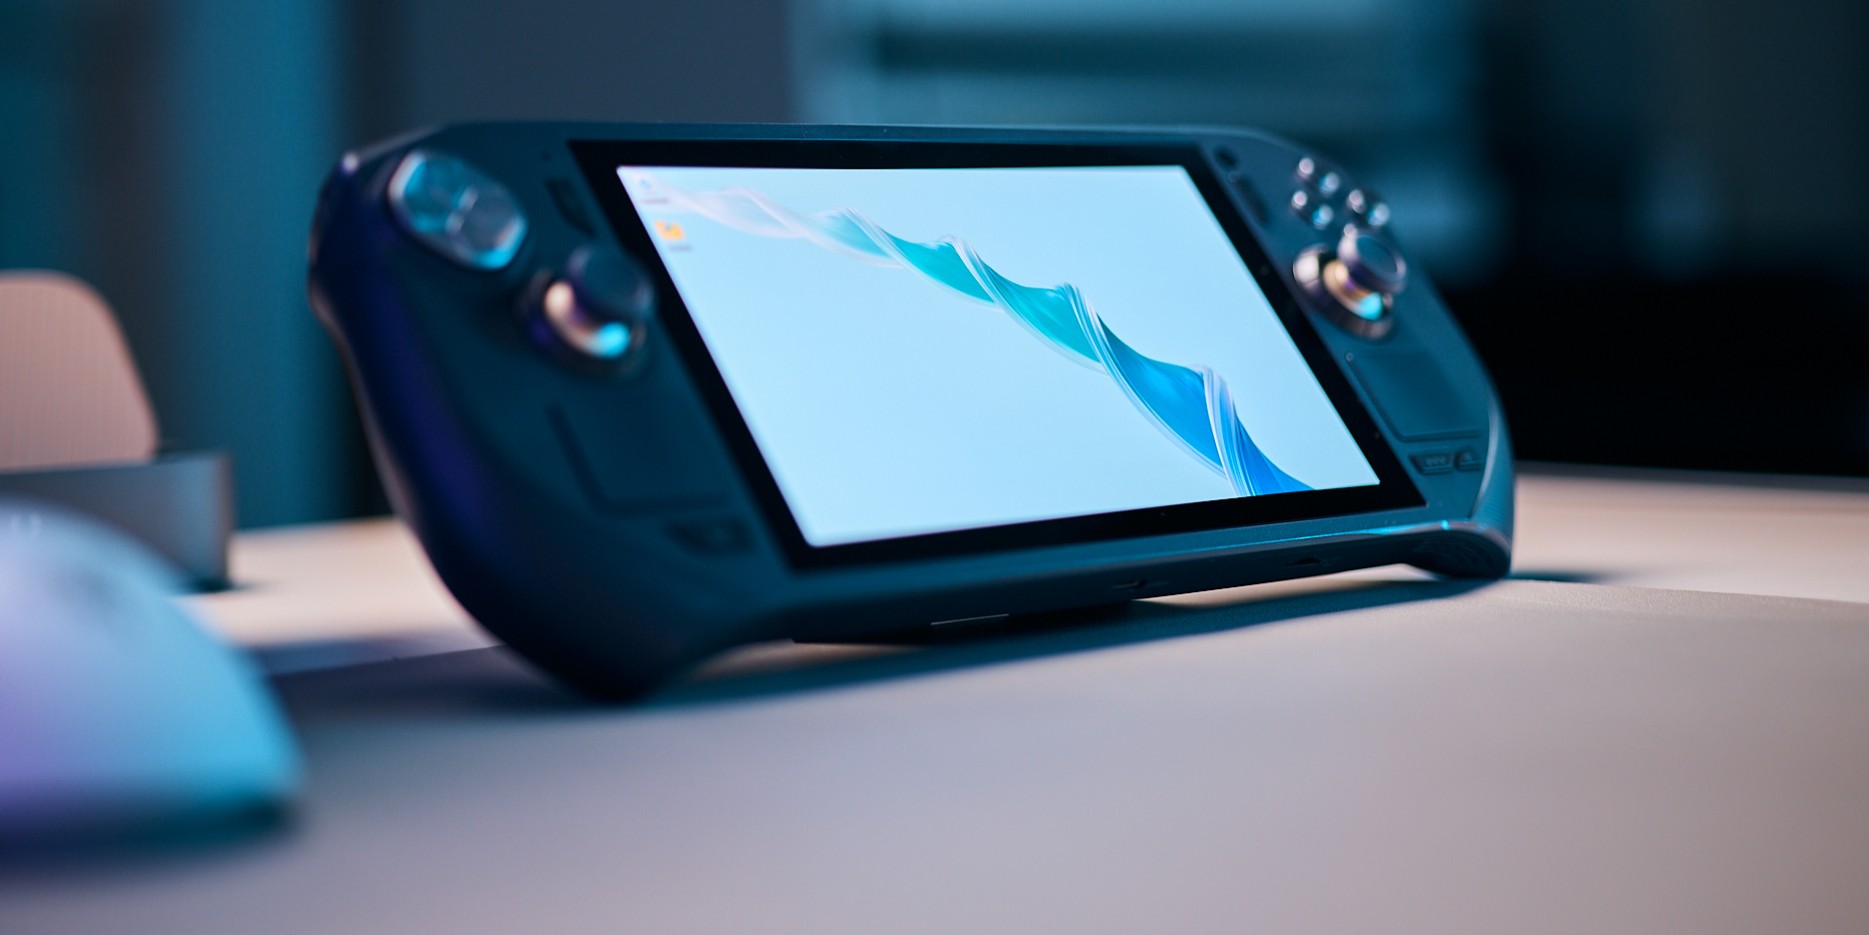
The Zotac Gaming Zone is a hot contender in the handheld market. An OLED display, powerful AMD Ryzen 7 and an excellent controller make it a gamer's dream and ensure an immersive experience. Unfortunately, the handheld with a 7-inch screen suffers one small weakness to make up for its low weight.Marc Herter, 👁 Marc Herter (translated by Daisy Dickson) Published 🇩🇪 🇫🇷 ...
Verdict
The Zotac Zone is totally shaking up the world of handheld PCs. With its powerful gaming performance, boosted by FSR for outstanding frame rates, and a case that boasts great stability and a high-quality build, it sets new standards in the field. Its controller is not only ergonomic and customizable, but also pampers your fingertips with rich haptic feedback.
Admittedly, its battery is a little weak. But lots of other gaming handhelds also skimp out on battery life in order to improve their haptics with a lower overall weight. A comparison with other devices of a similar size shows that its performance data, benchmark results and the values we measured are largely on par with them.
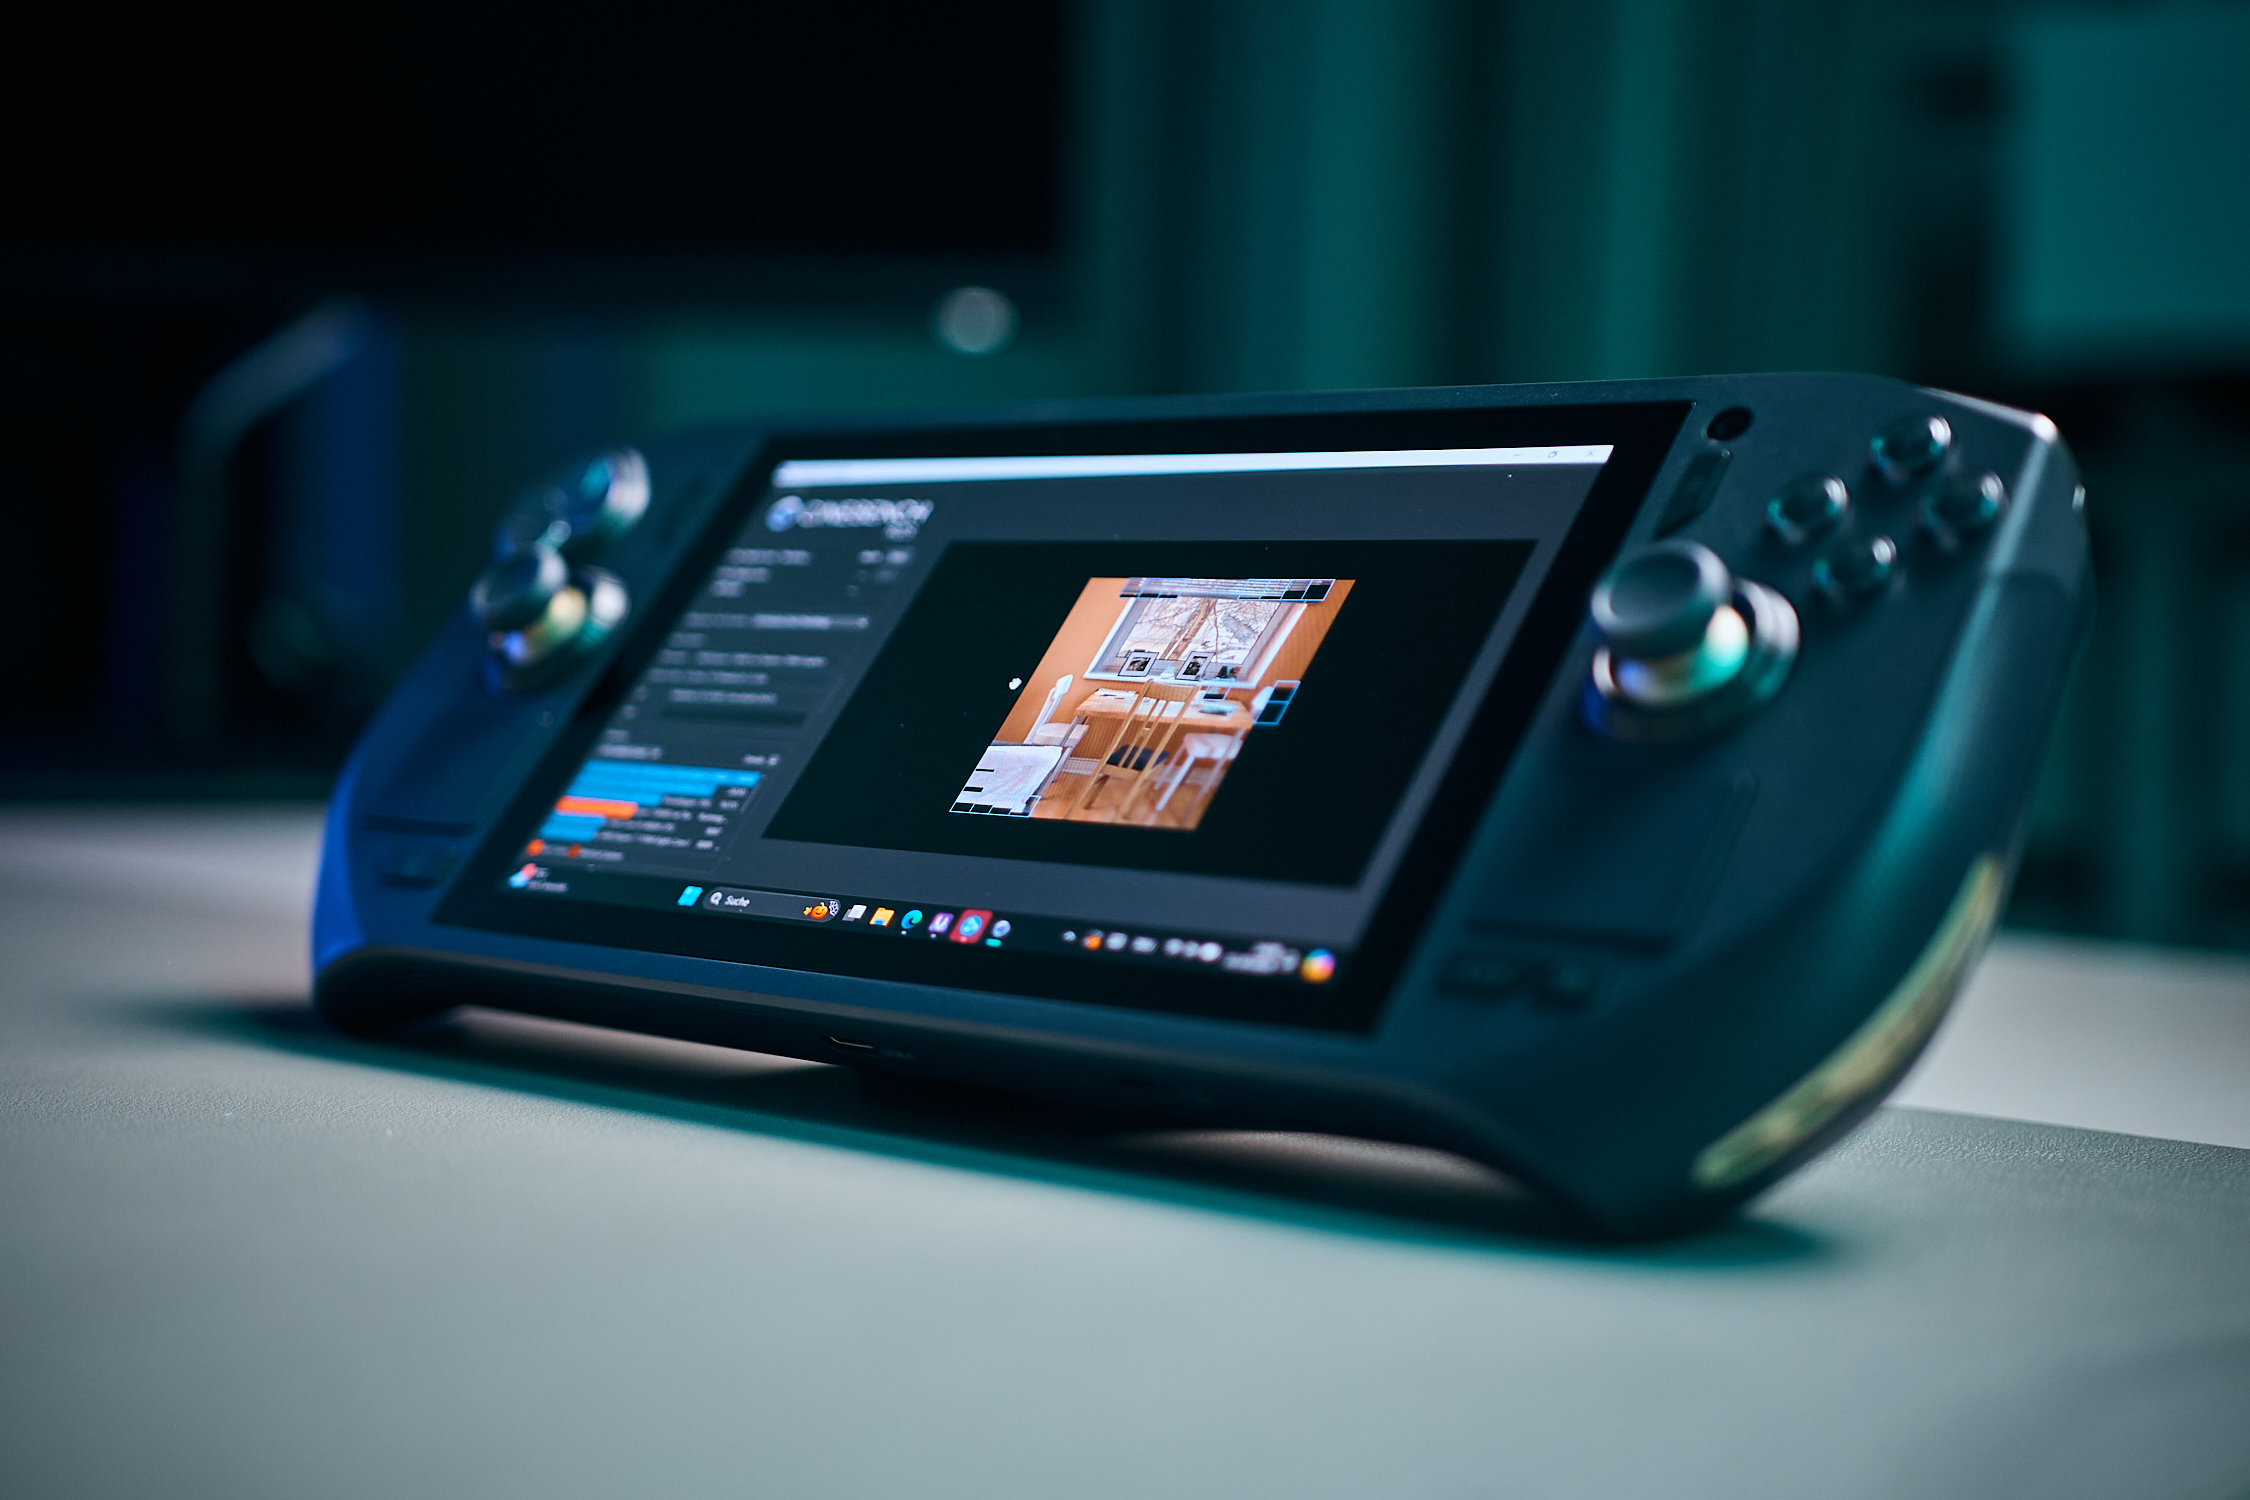
The Zotac software (Zotac Gaming One Launcher) fulfills its purpose but feels a little rudimentary. Zotac could do with making some improvements in this respect and should take inspiration from the competition, such as Ayaneo.
Despite some minor weaknesses, the Zotac Zone is a good handheld PC that will appeal primarily to gamers who value haptics, performance and a high-quality screen. Its haptics in particular create a real premium feeling.
Pros
Cons
Price and availability
The Zotac Zone isn't one of the cheapest handheld PCs. It usually costs just over $800. At the moment, it still has limited availability in the USA.
Possible alternatives compared
Image | Model / Review | Price | Weight | Height | Display |
|---|---|---|---|---|---|
1. 79.3%  | Zotac ZGC-G1A1W-01 AMD Ryzen 7 8840U ⎘ AMD Radeon 780M ⎘ 16 GB Memory, 512 GB SSD | Amazon: | 692 g | 35 mm | 7.00" 1920x1080 315 PPI OLED |
2. 85.2% v7 (old)  | Ayaneo Kun AMD Ryzen 7 7840U ⎘ AMD Radeon 780M ⎘ 64 GB Memory, SSD | Amazon: 1. $489.99 Zestioe AYANEO Pocket S-6 In... 2. $670.95 AYA NEO Pocket S Android Gam... 3. $12.98 Puccy 3 Pack Screen Protecto... List Price: 999€ | 942 g | 22 mm | 8.40" 2560x1600 359 PPI IPS |
3. 84.9% v7 (old)  | ONEXPLAYER 2 Pro AR18 AMD Ryzen 7 7840U ⎘ AMD Radeon 780M ⎘ 32 GB Memory | Amazon: 1. $1,969.00 WEELIAO ONEXPLAYER X1 PRO AM... 2. $27.99 Voikoli Protective Eva Hard ... 3. $1,989.99 OneXPlayer X1 Pro 3-in-1 Gam... List Price: 1017 USD | 876 g | 43 mm | 8.40" 2560x1600 IPS |
4. 77.4%  | MSI Claw Intel Core Ultra 7 155H ⎘ Intel Arc 8-Core iGPU ⎘ 16 GB Memory, 1024 GB SSD | Amazon: List Price: 849€ | 672 g | 33 mm | 7.00" 1920x1080 315 PPI IPS |
5. 66.3%  | Lenovo Legion Go AMD Ryzen Z1 Extreme ⎘ AMD Radeon 780M ⎘ 16 GB Memory, 512 GB SSD | Amazon: List Price: 800€ | 845 g | 41 mm | 8.80" 2560x1600 343 PPI IPS |
6. 84.6%  | Asus ROG Ally X AMD Ryzen Z1 Extreme ⎘ AMD Radeon 780M ⎘ 24 GB Memory, 1024 GB SSD | Amazon: List Price: 899€ | 685 g | 36.9 mm | 7.00" 1920x1080 315 PPI IPS |
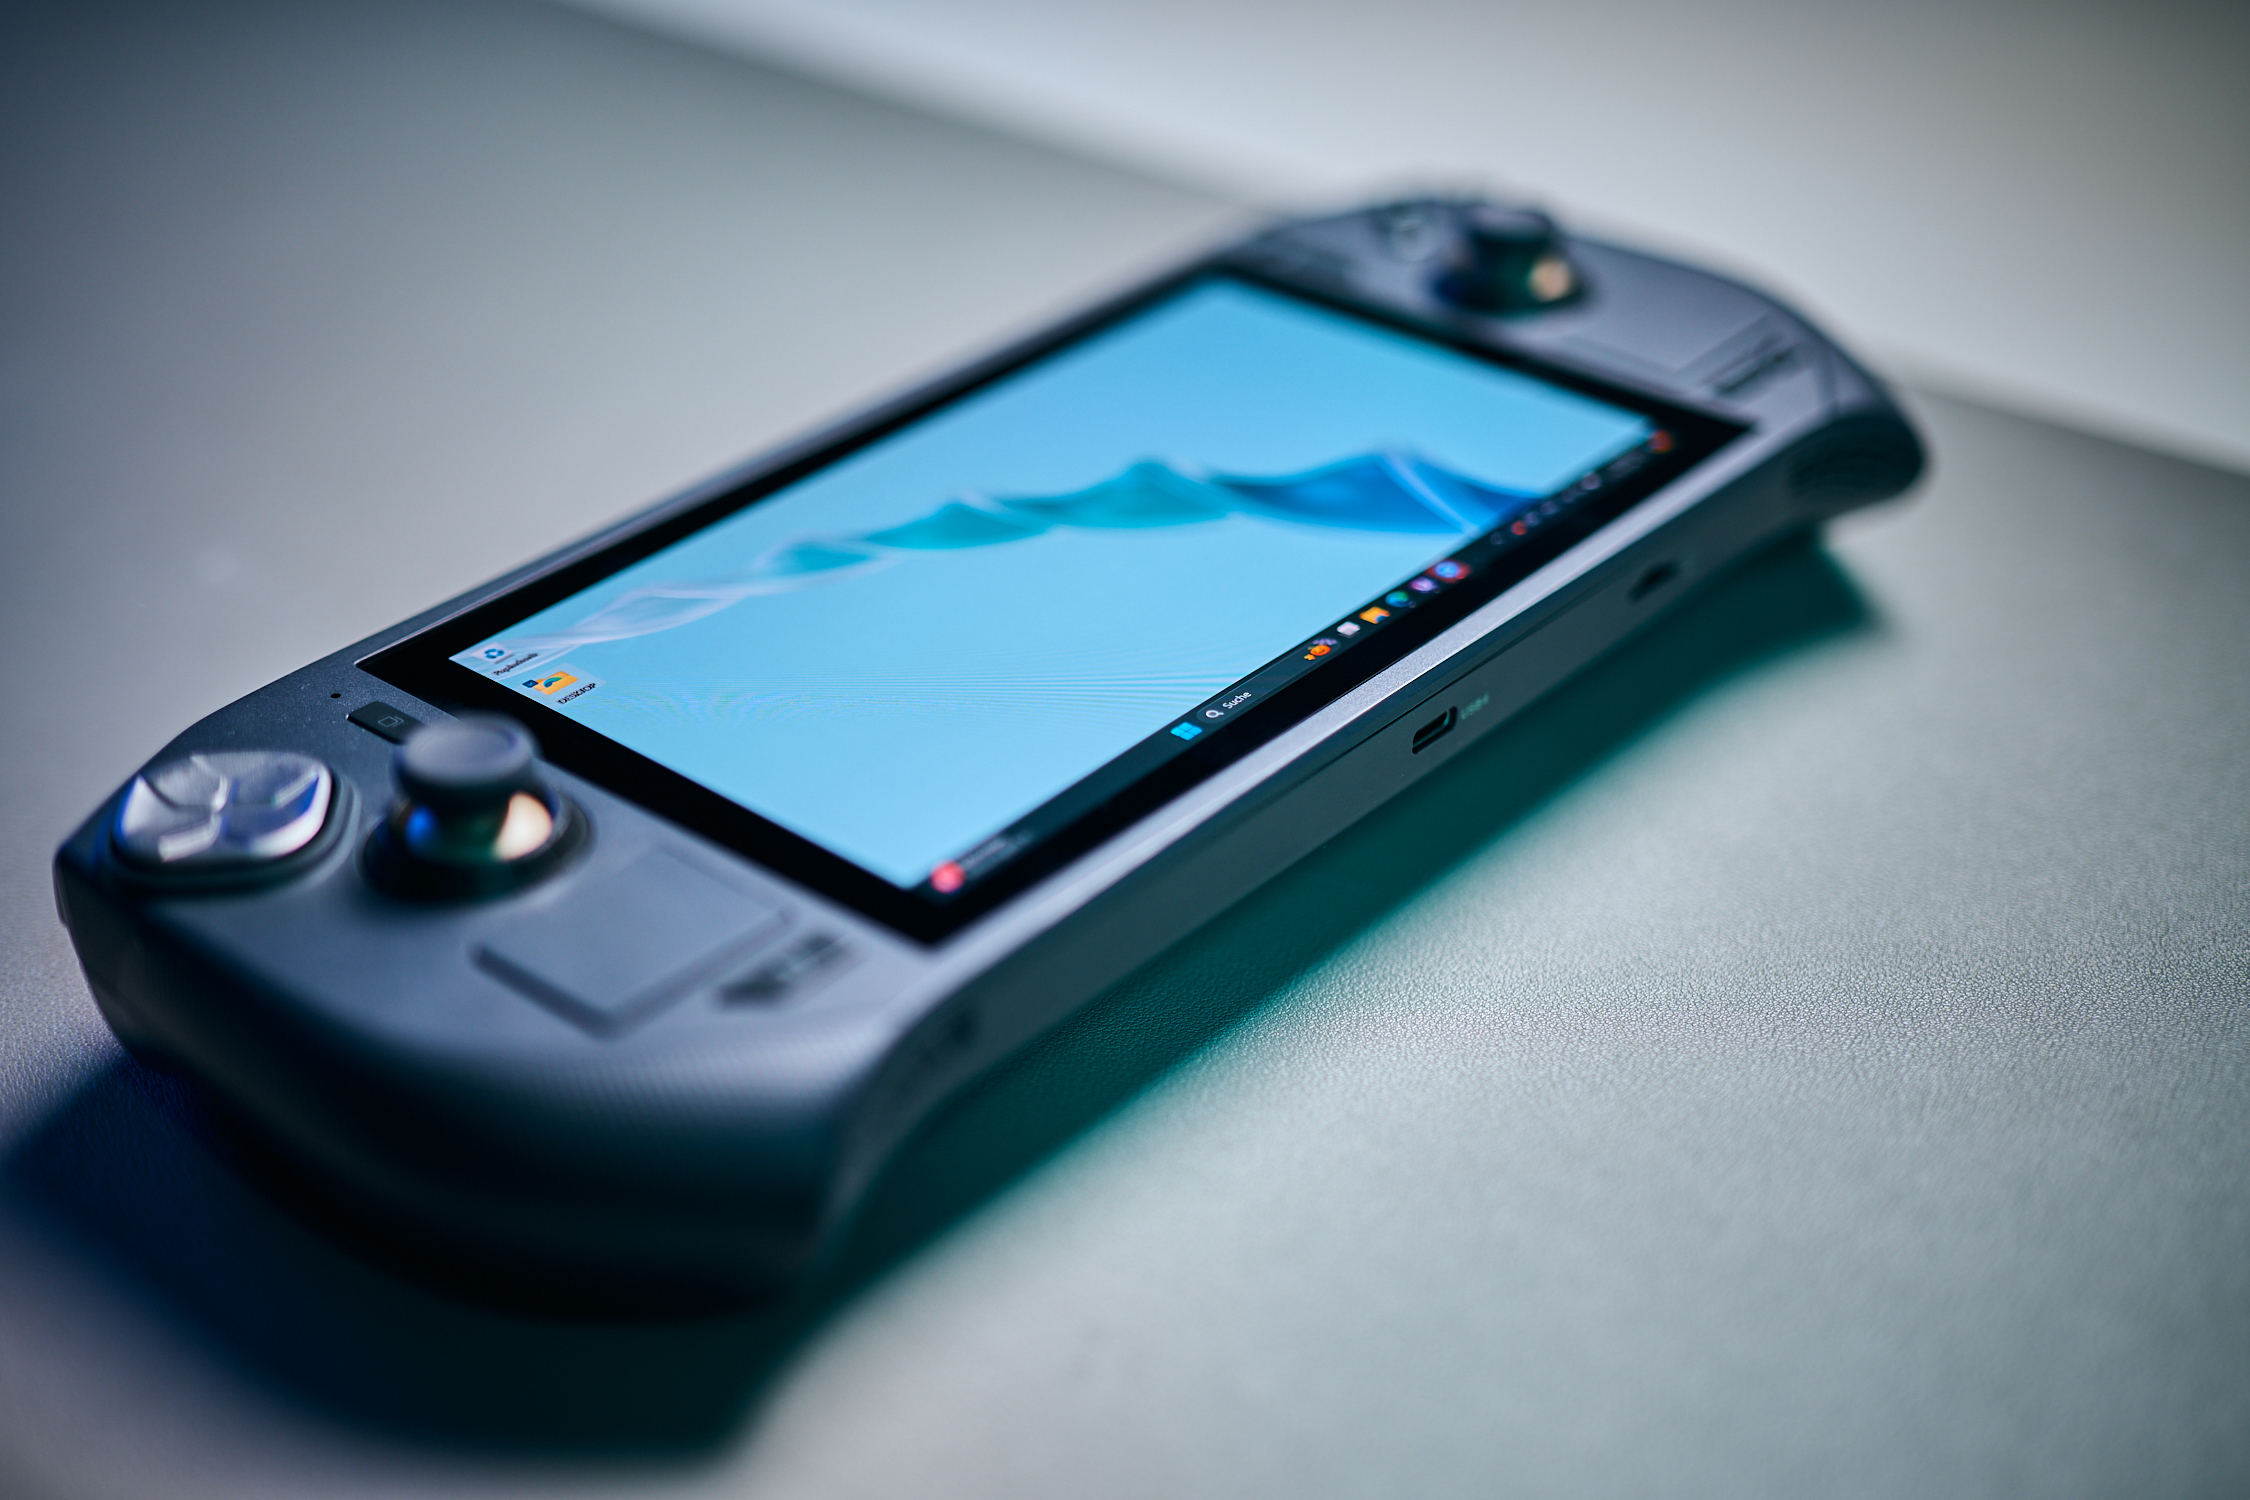
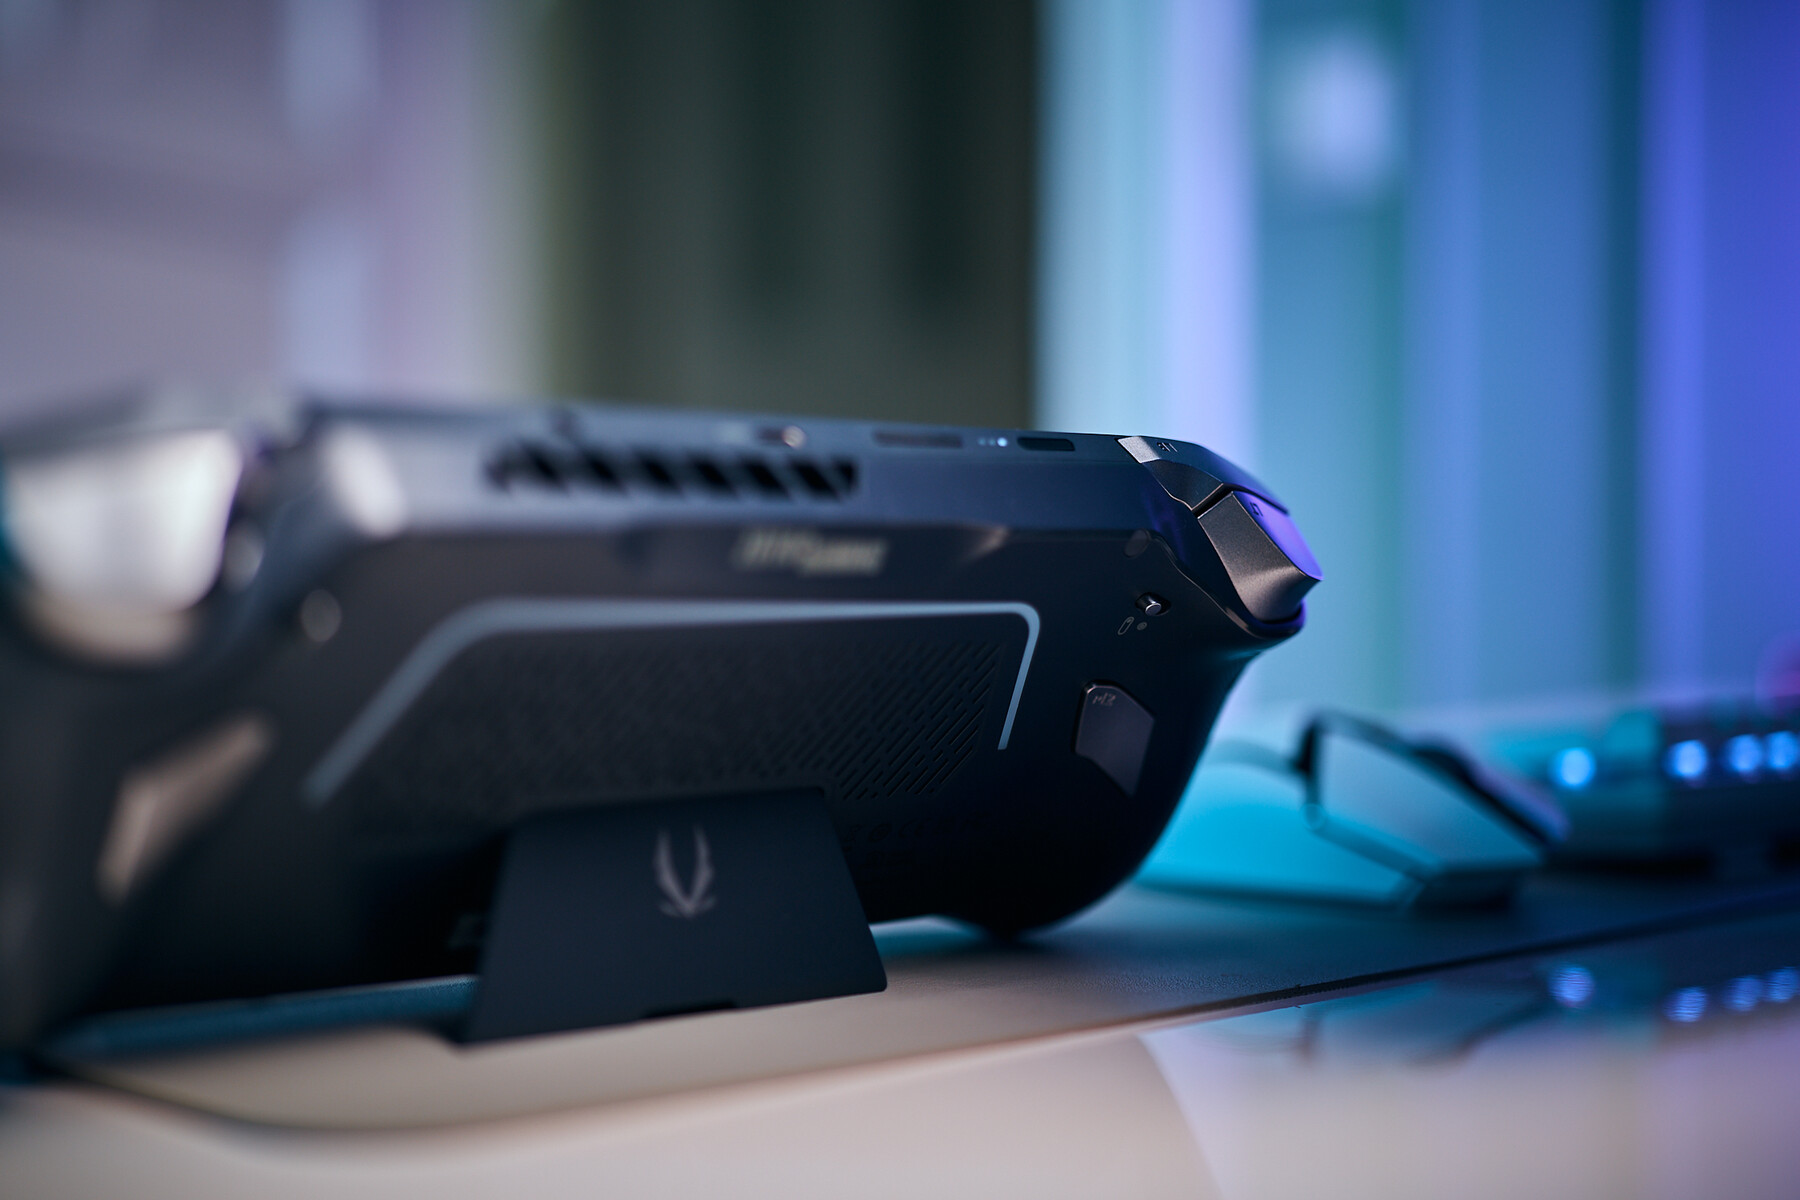
The market for gaming handhelds is on the move! New devices are being launched with ever more powerful hardware and innovative features. One of these new challengers is the Zotac Gaming Zone, which we were able to test as a pre-production device. Although not all the rough edges had yet been rounded off on its software at the time of testing, it already became clear to us that the Zotac Gaming Zone has the potential to turn the gaming world on its head. An outstanding OLED screen, excellent controller and powerful AMD Ryzen 7 combine to form an impressive overall package that will make gamers' hearts beat faster. It is worth taking a look at our previously published report, as we would like to go into more detail about the handheld's technology here.
Specifications
Case & connectivity
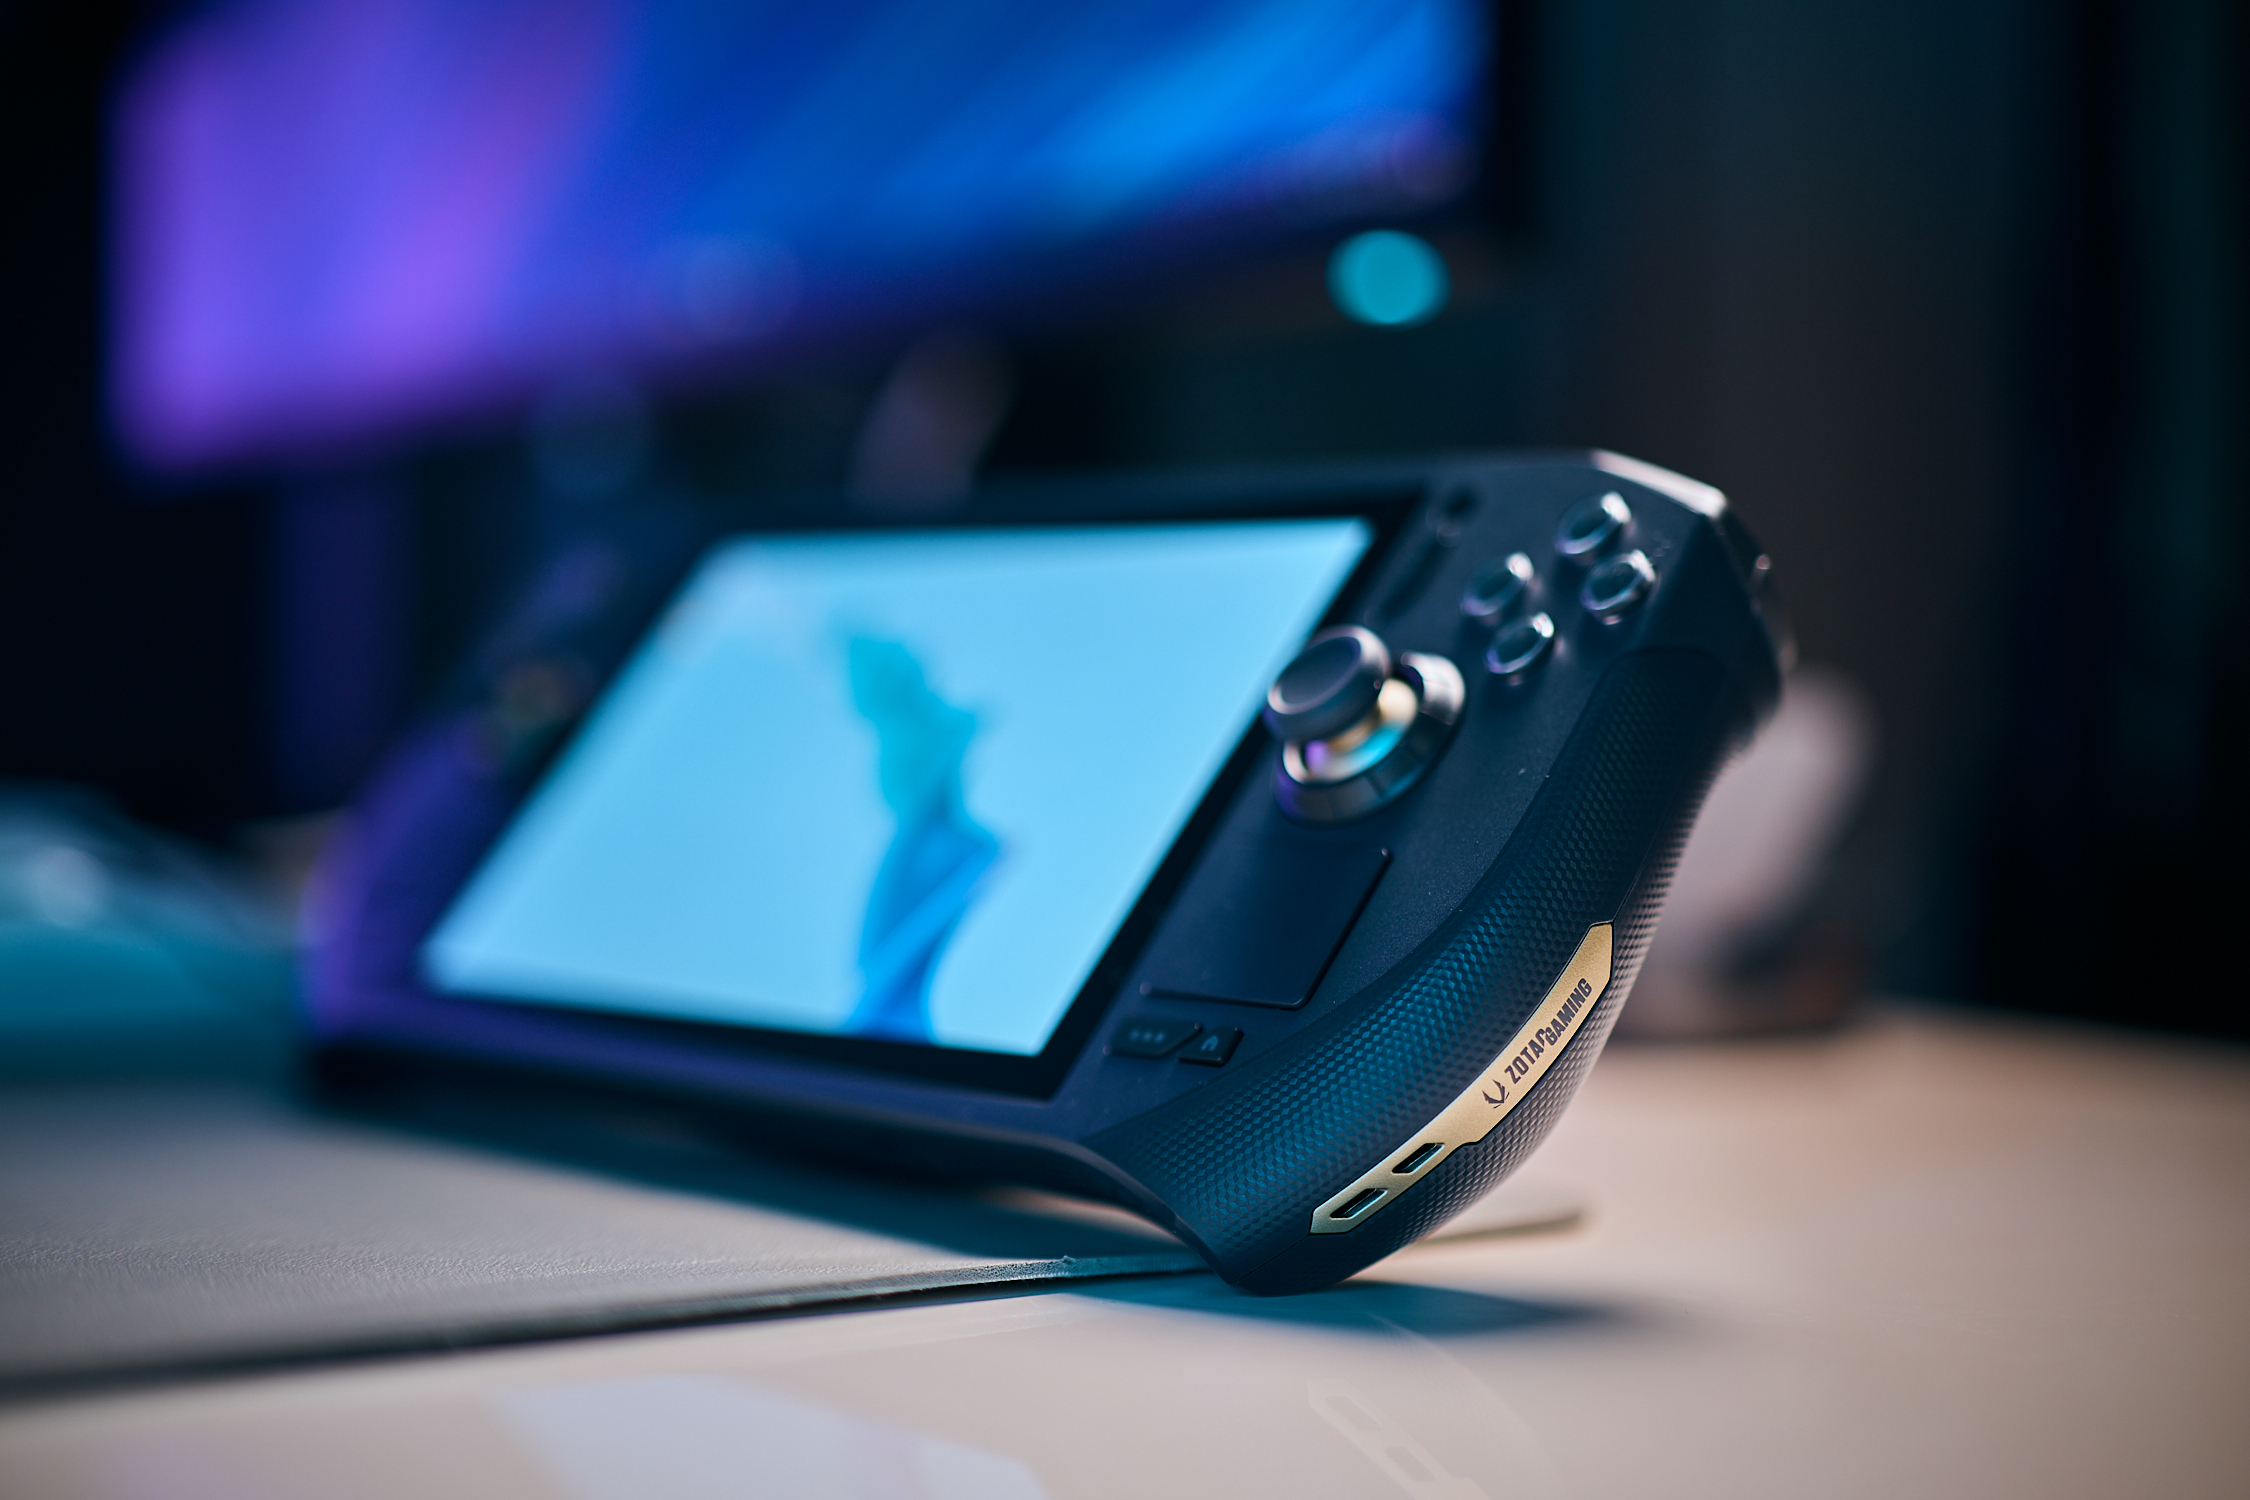
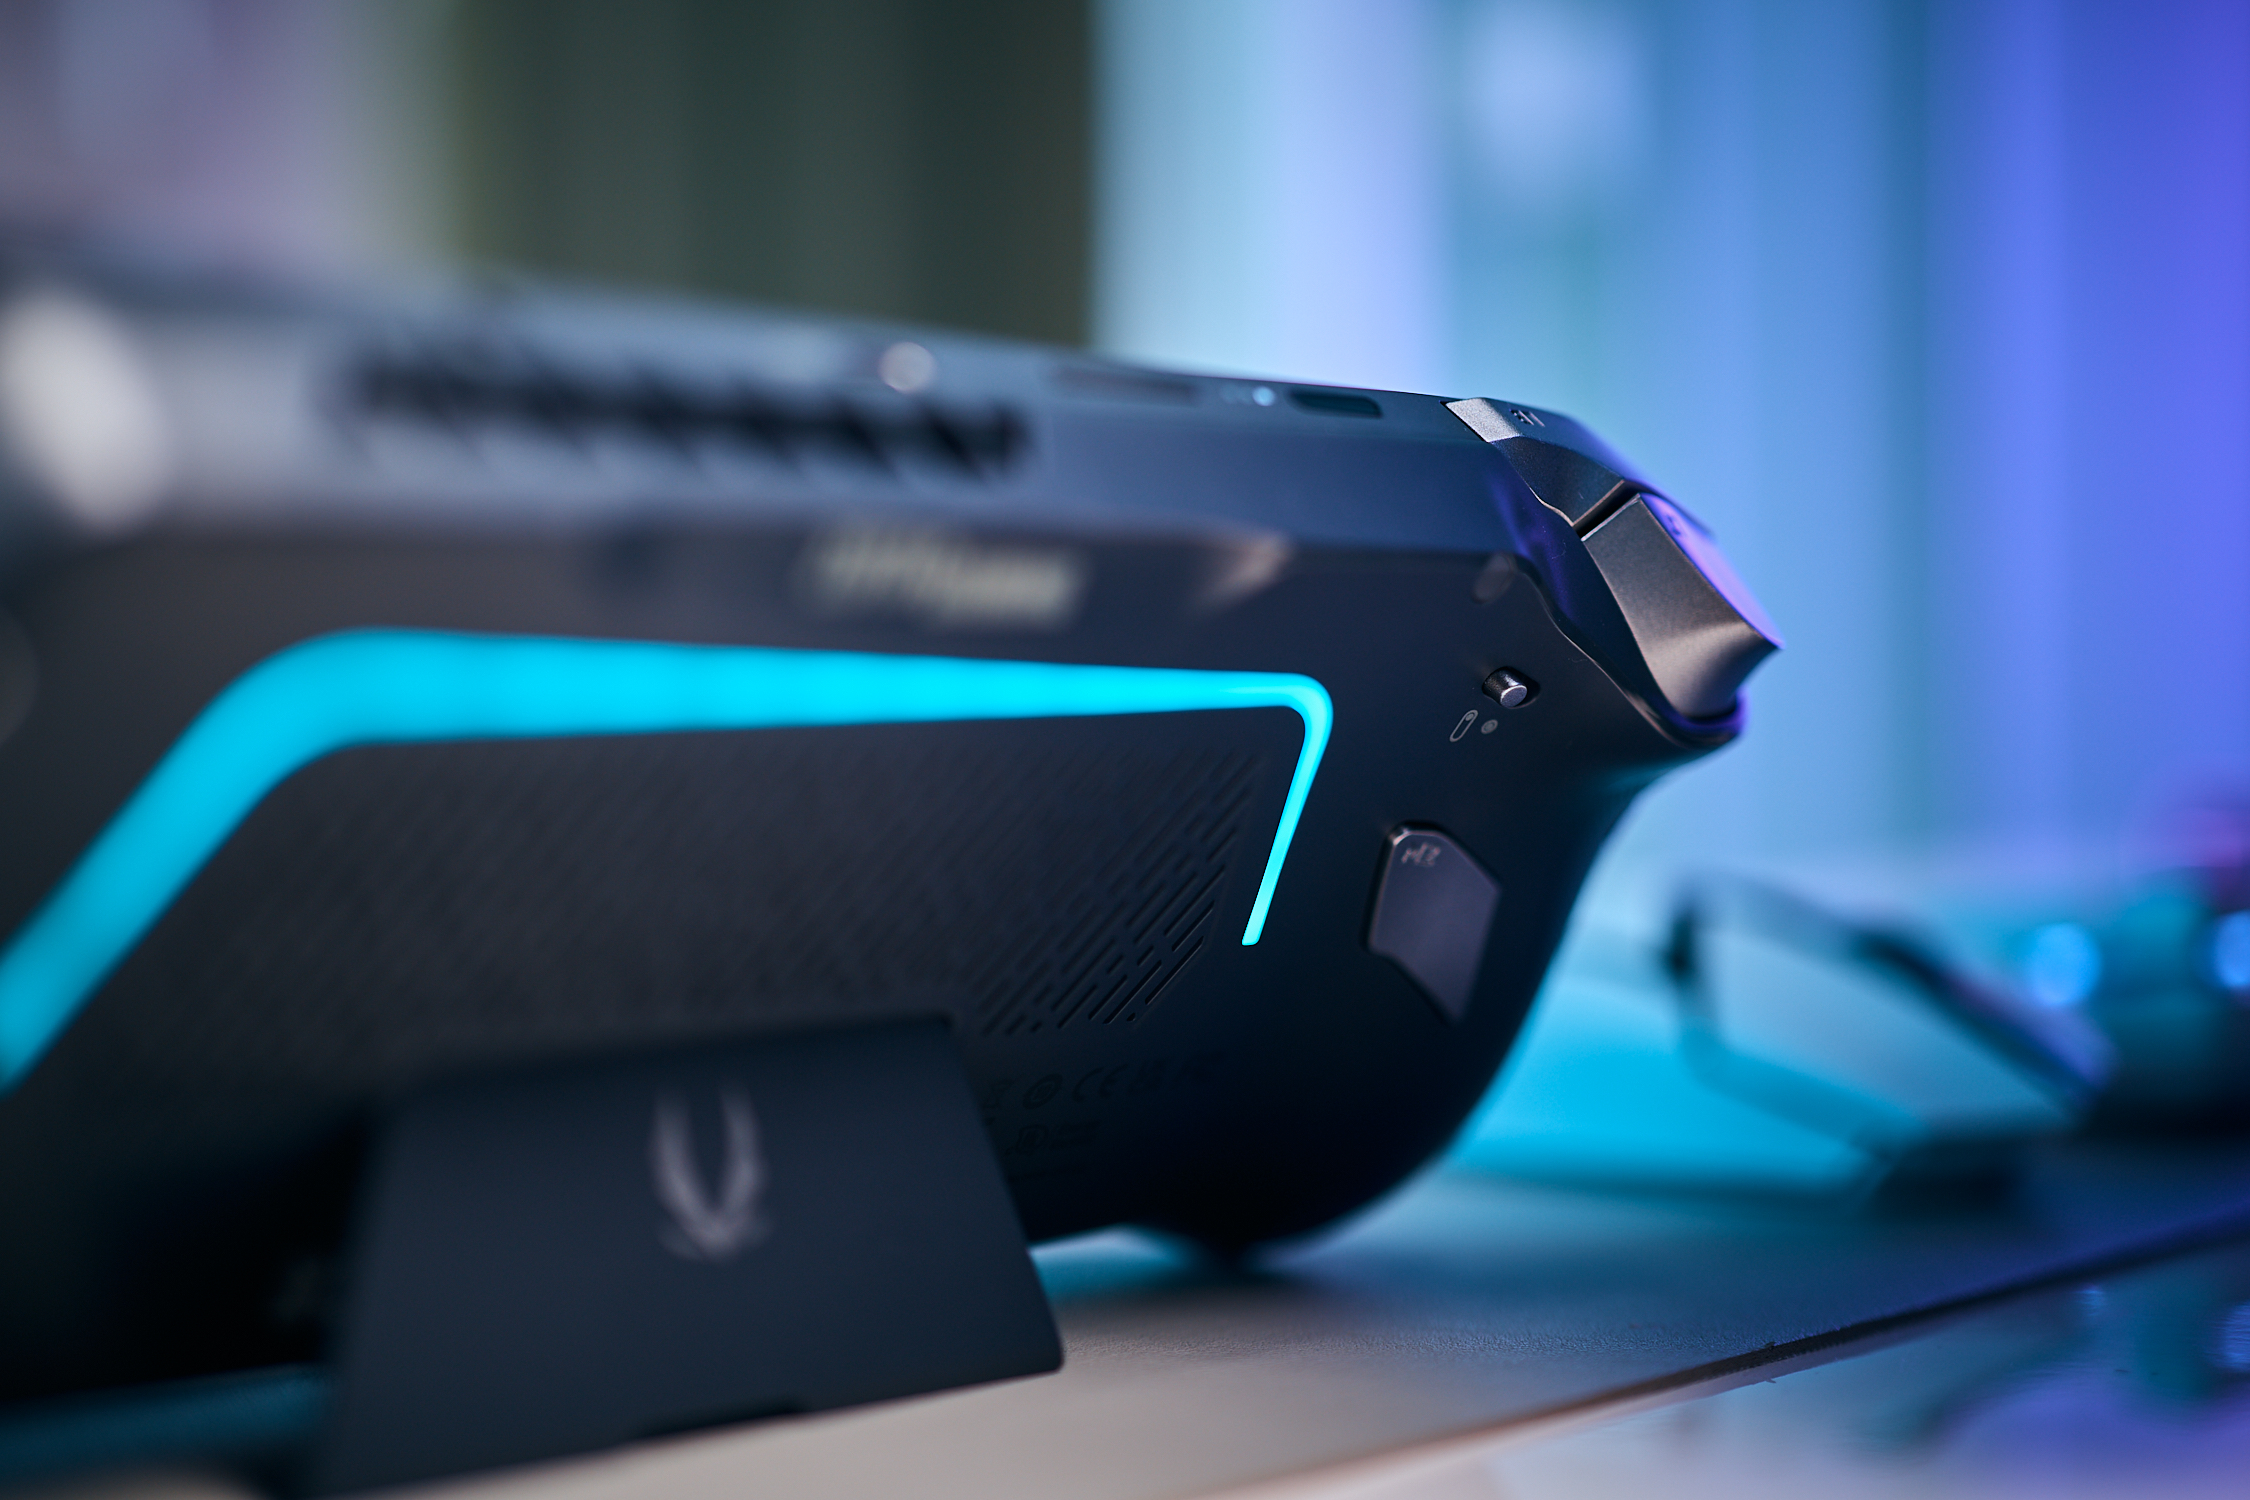
The Zotac Gaming Zone boasts a high-quality build and a design that combines stability and ergonomics. Its case is made of durable plastic, making a robust impression. All controller elements are easily accessible and ergonomically arranged, making even longer gaming sessions remain comfortable. The device's compact design makes it easy to transport and makes it the ideal companion for on the go. Details on the case and connectivity of the Zotac Gaming Zone can be found in our review of the pre-production device. Visually and haptically, nothing has changed.
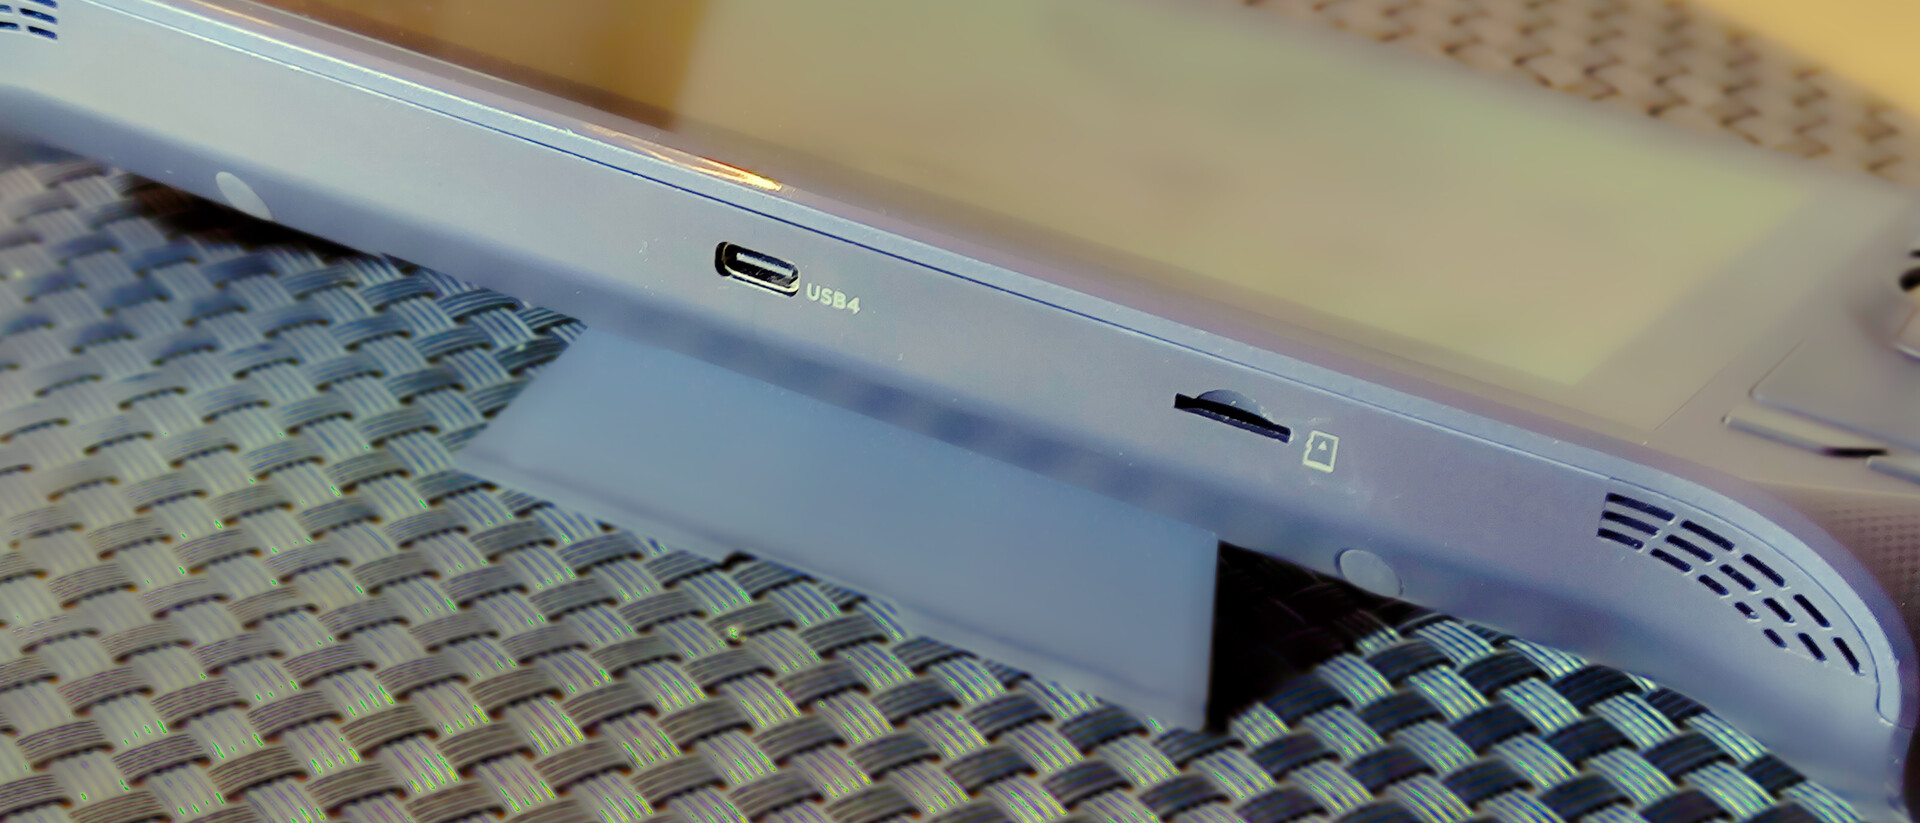
In addition to the aforementioned controller layout, the Zotac Gaming Zone features solid connectivity that enriches everyday mobile gaming. Its integrated card reader reads data at a speed of up to 187 MB/s, enabling fast loading times. Its Wi-Fi connection boasts great stability and high speeds, so you can play games online without facing any annoying lags and disconnections. An unusual feature for handhelds is its integrated webcam. Although it doesn't deliver high-resolution images and is instead limited to a 720p resolution, its color reproduction is good, enabling video calls or live streams in an acceptable quality.
| SD Card Reader | |
| average JPG Copy Test (av. of 3 runs) | |
| Average of class Handheld / UMPC (32.9 - 569, n=10, last 2 years) | |
| ONEXPLAYER 2 Pro AR18 (Angelbird AV PRO microSD) | |
| Zotac ZGC-G1A1W-01 | |
| Lenovo Legion Go | |
| Ayaneo Kun | |
| MSI Claw (Angelbird AV Pro V60) | |
| Asus ROG Ally X (Angelbird AV Pro v60) | |
| maximum AS SSD Seq Read Test (1GB) | |
| Asus ROG Ally X (Angelbird AV Pro v60) | |
| ONEXPLAYER 2 Pro AR18 (Angelbird AV PRO microSD) | |
| Average of class Handheld / UMPC (74.7 - 817, n=10, last 2 years) | |
| MSI Claw (Angelbird AV Pro V60) | |
| Ayaneo Kun | |
| Zotac ZGC-G1A1W-01 | |
| Lenovo Legion Go | |


Sustainability
When it comes to sustainability, the Zotac Gaming Zone shows light and shade. Unfortunately, its shipping box contains foam and film that are neither environmentally friendly nor easy to recycle. There is also no information about the proportion of recycled materials used in the device itself or about its production conditions and CO₂ emissions (PCF information).
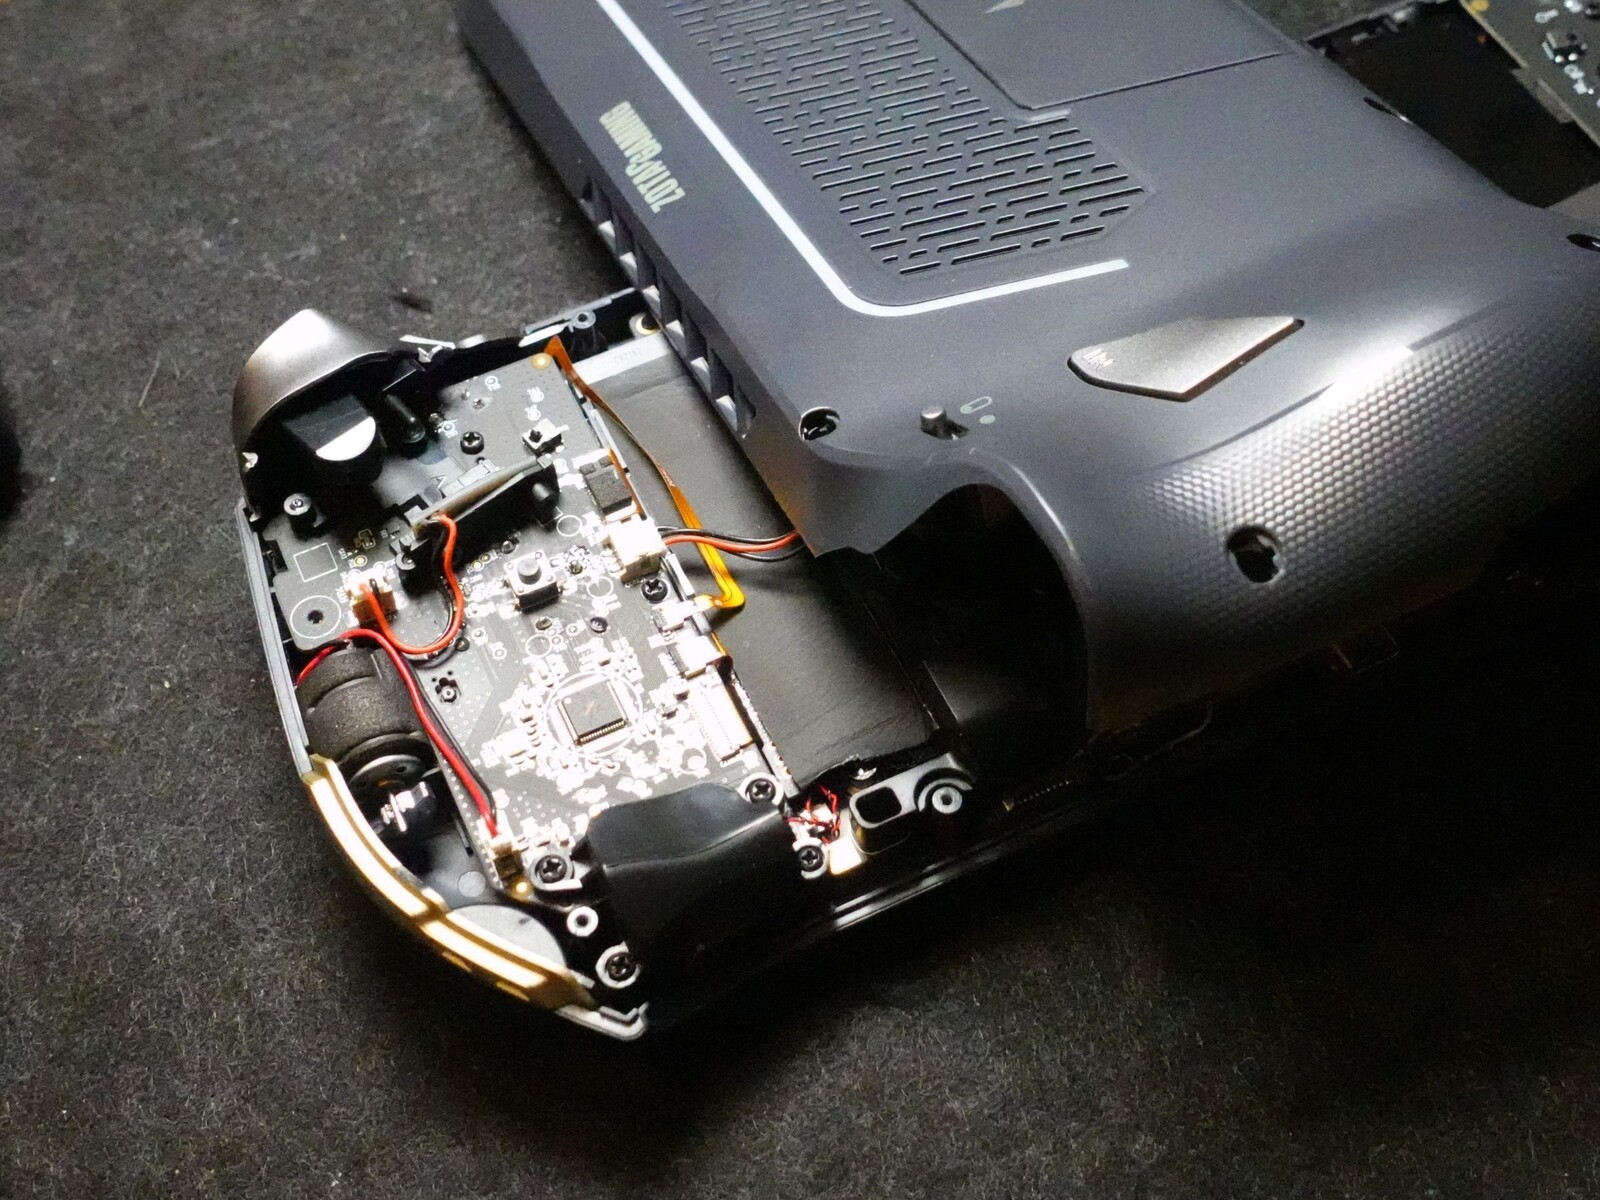
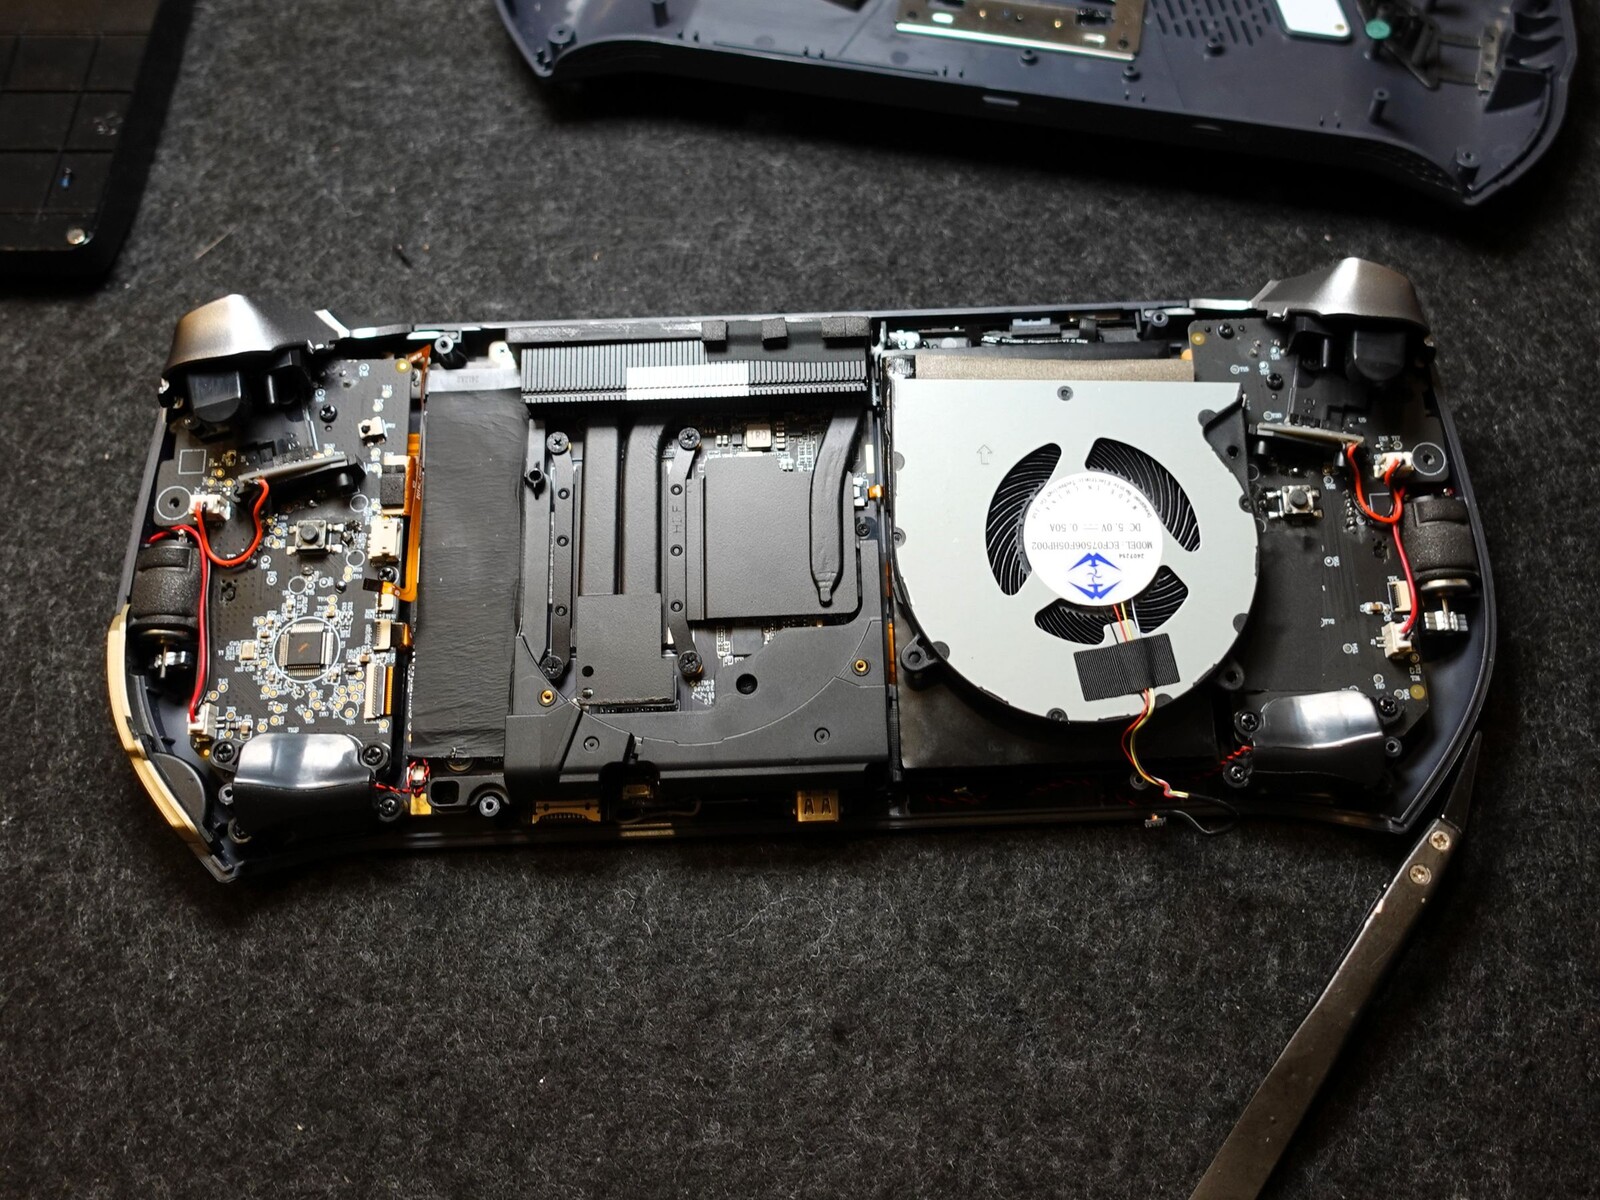
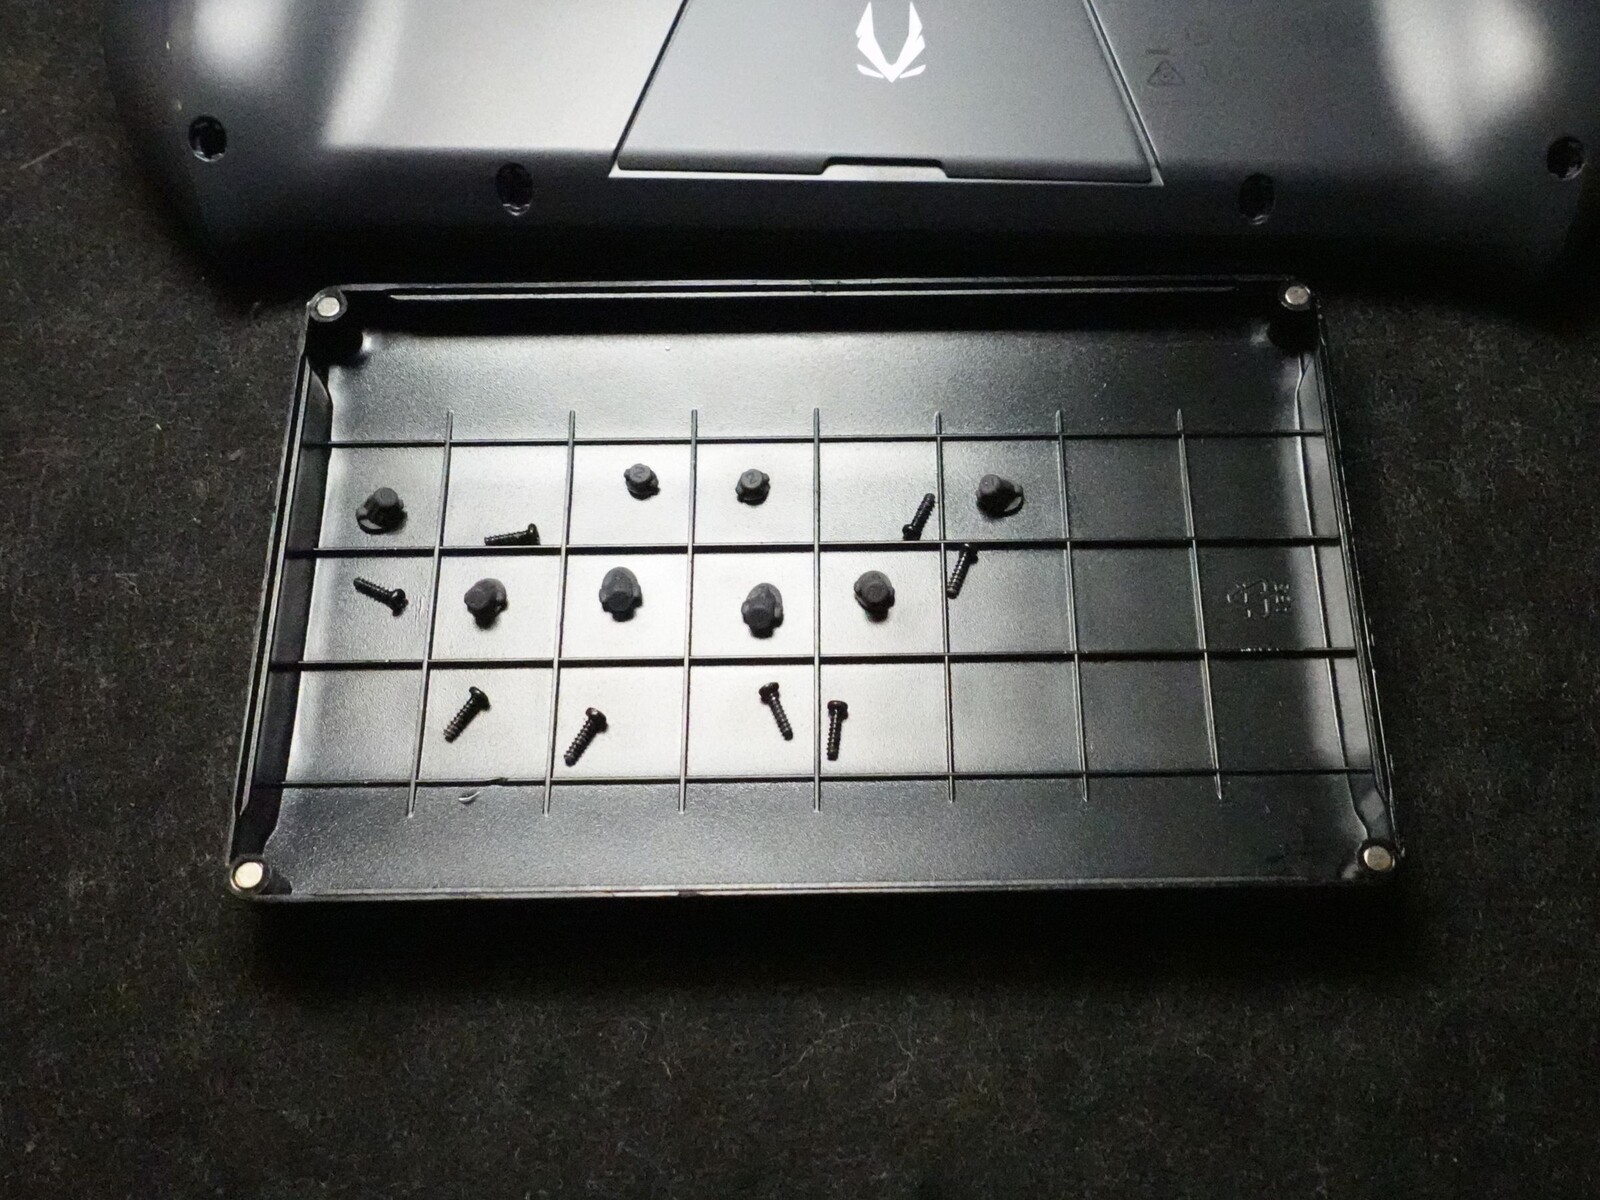
On a positive note, however, the Zotac Zone is easy to repair. The back of the case can be opened with little effort. Eight screws—hidden under rubber covers—hold the back panel in place. There are no clips, so the panel can be easily removed after loosening the screws. A little tip: The back plate can be released even more easily by lightly pressing the shoulder buttons. You should still take care when opening it, as the cable to the RGB light strip is quite short.
Inside the device, you have the option to replace the SSD with a larger model, but no further upgrades are possible. Still, opening the case allows you to clean and maintain the device, which can extend its service life. Spare parts for the Zotac Zone are currently difficult to find.
Accessories
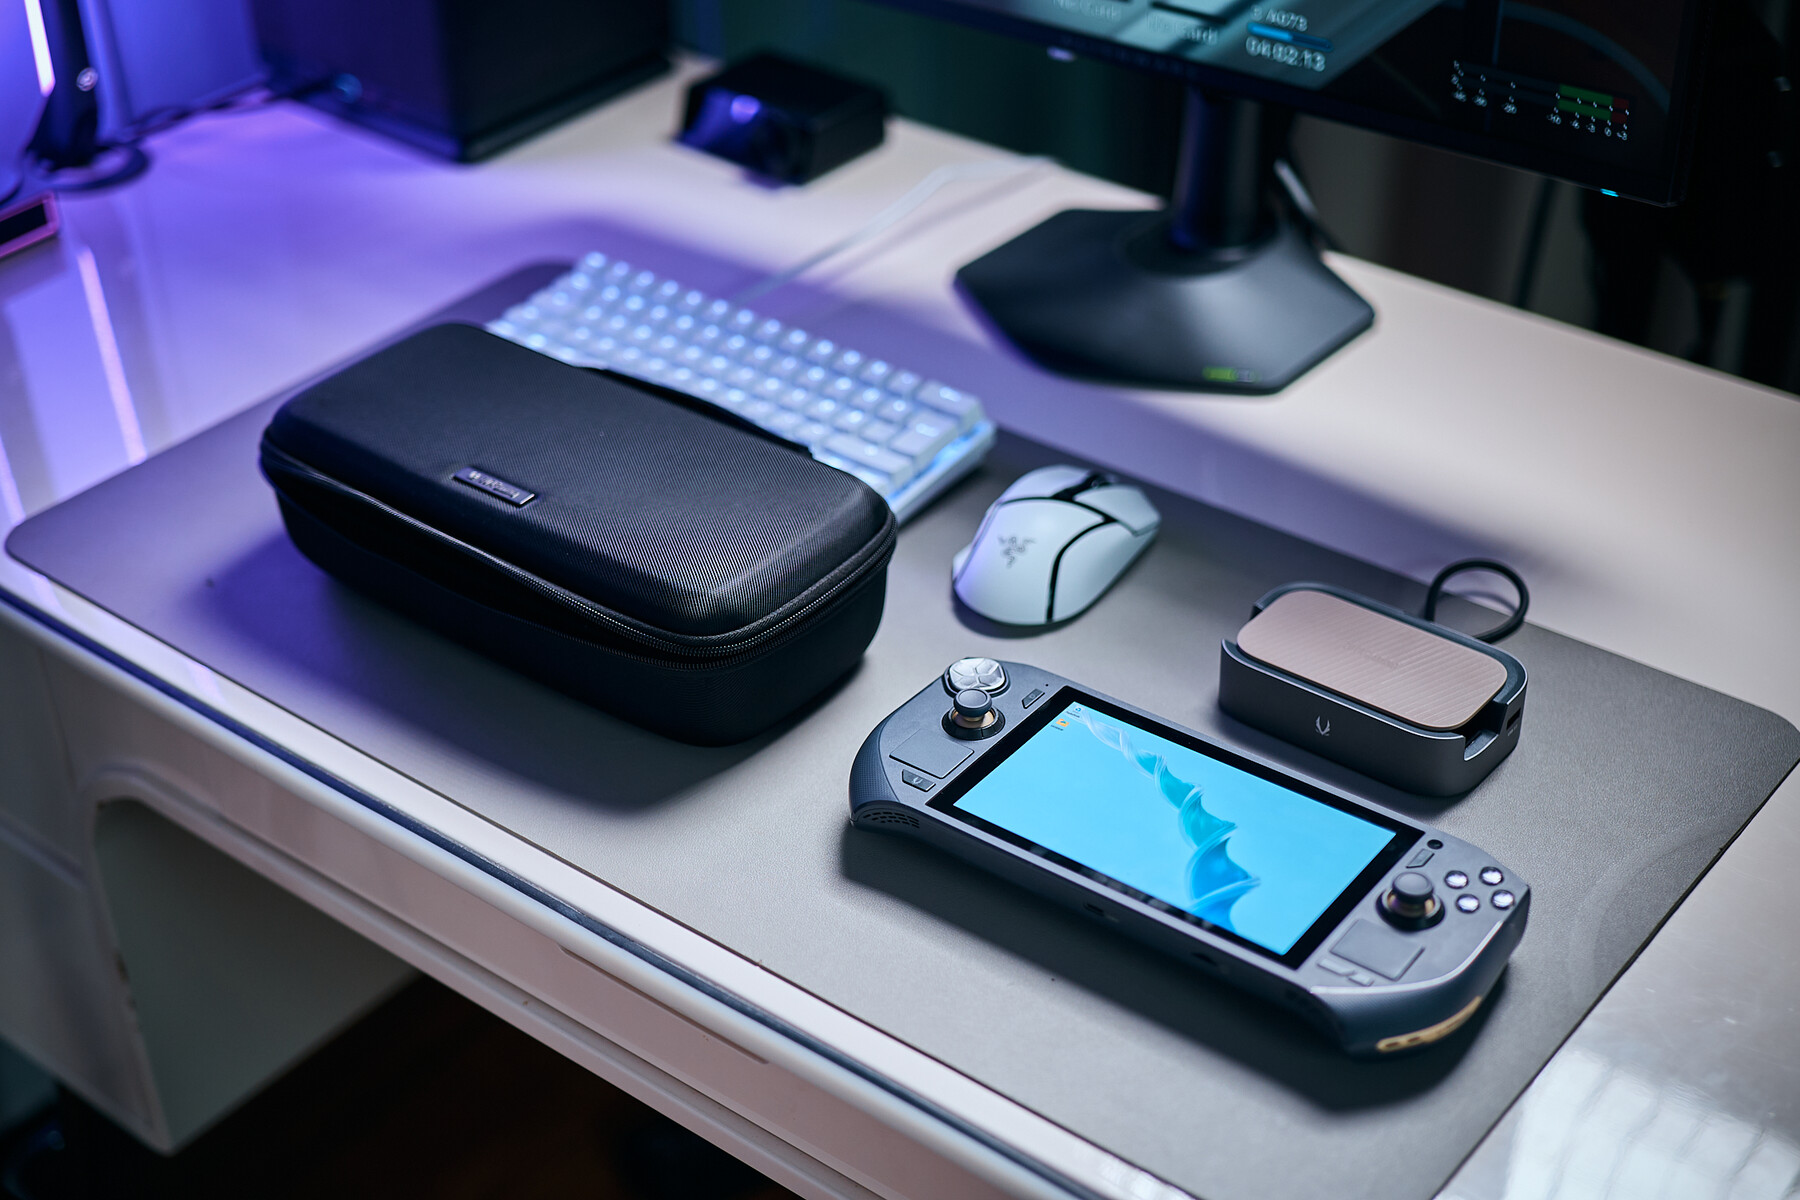
ZOTAC offers practical accessories for the Zone that expand its use on the go. The docking station not only features space for an additional NVMe SSD, but also numerous connections such as DisplayPort, USB and LAN. A stylish hard case with a fabric cover is available to safely transport the Zone.
If you want to use the ZOTAC Zone not only for gaming but also for mobile working, portable monitors with an integrated keyboard—such as the Elecrow CrowView Note—are an interesting addition.
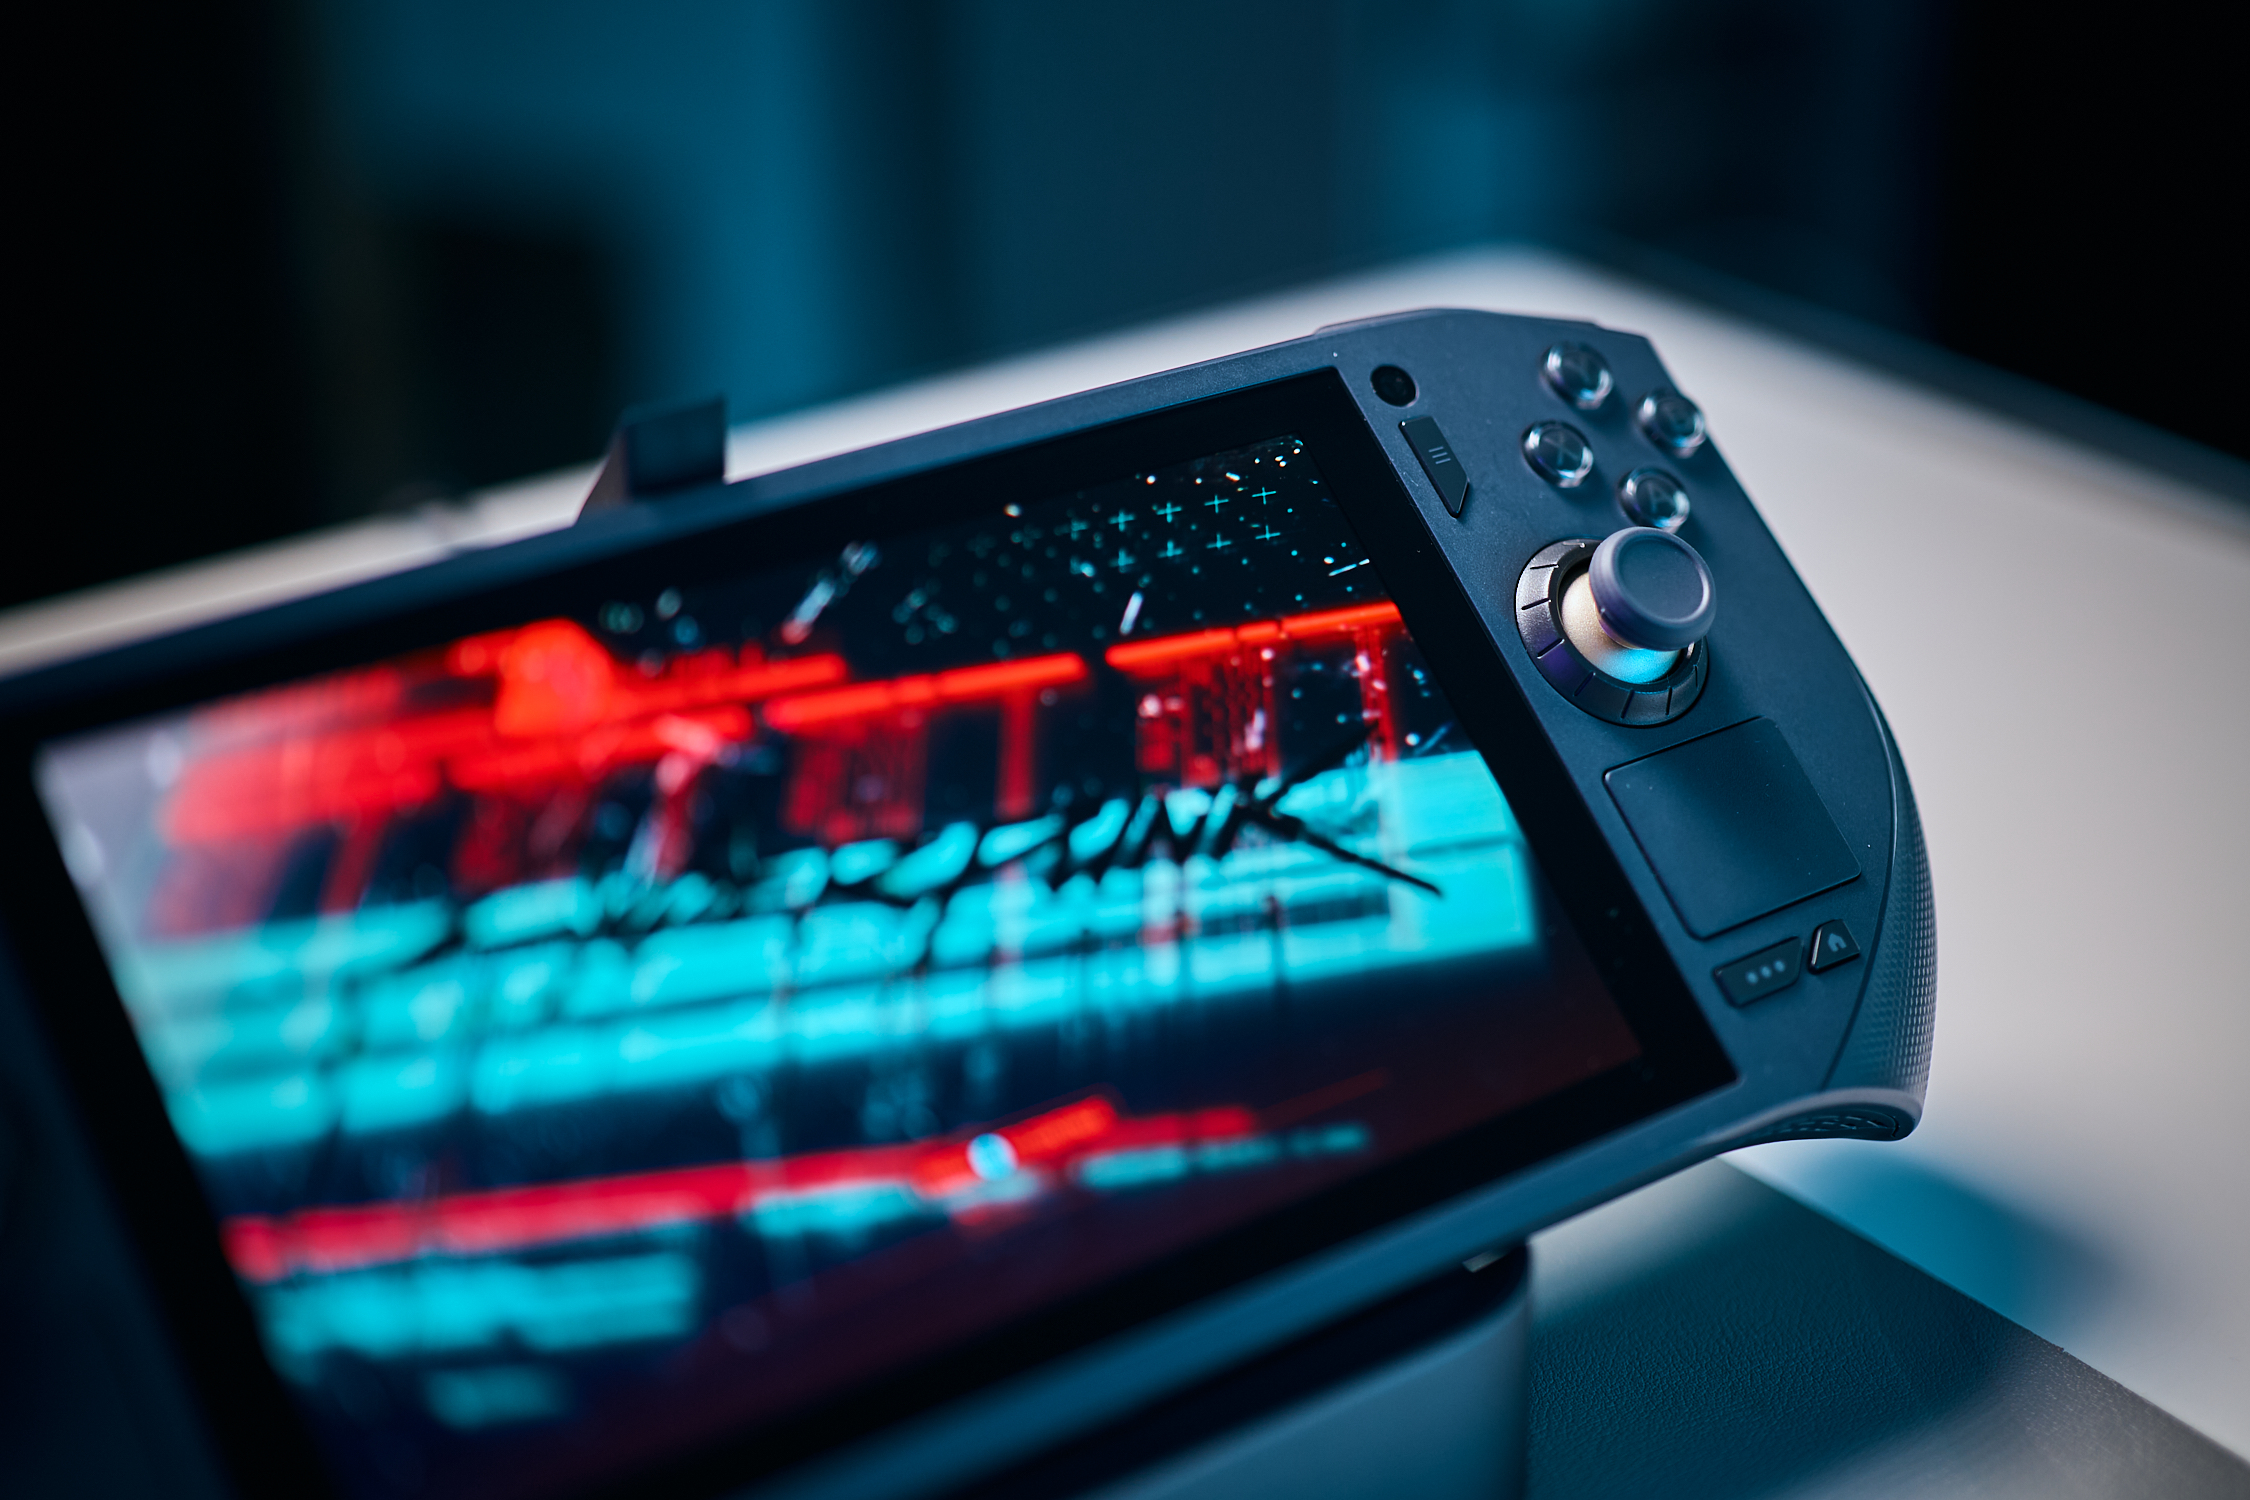
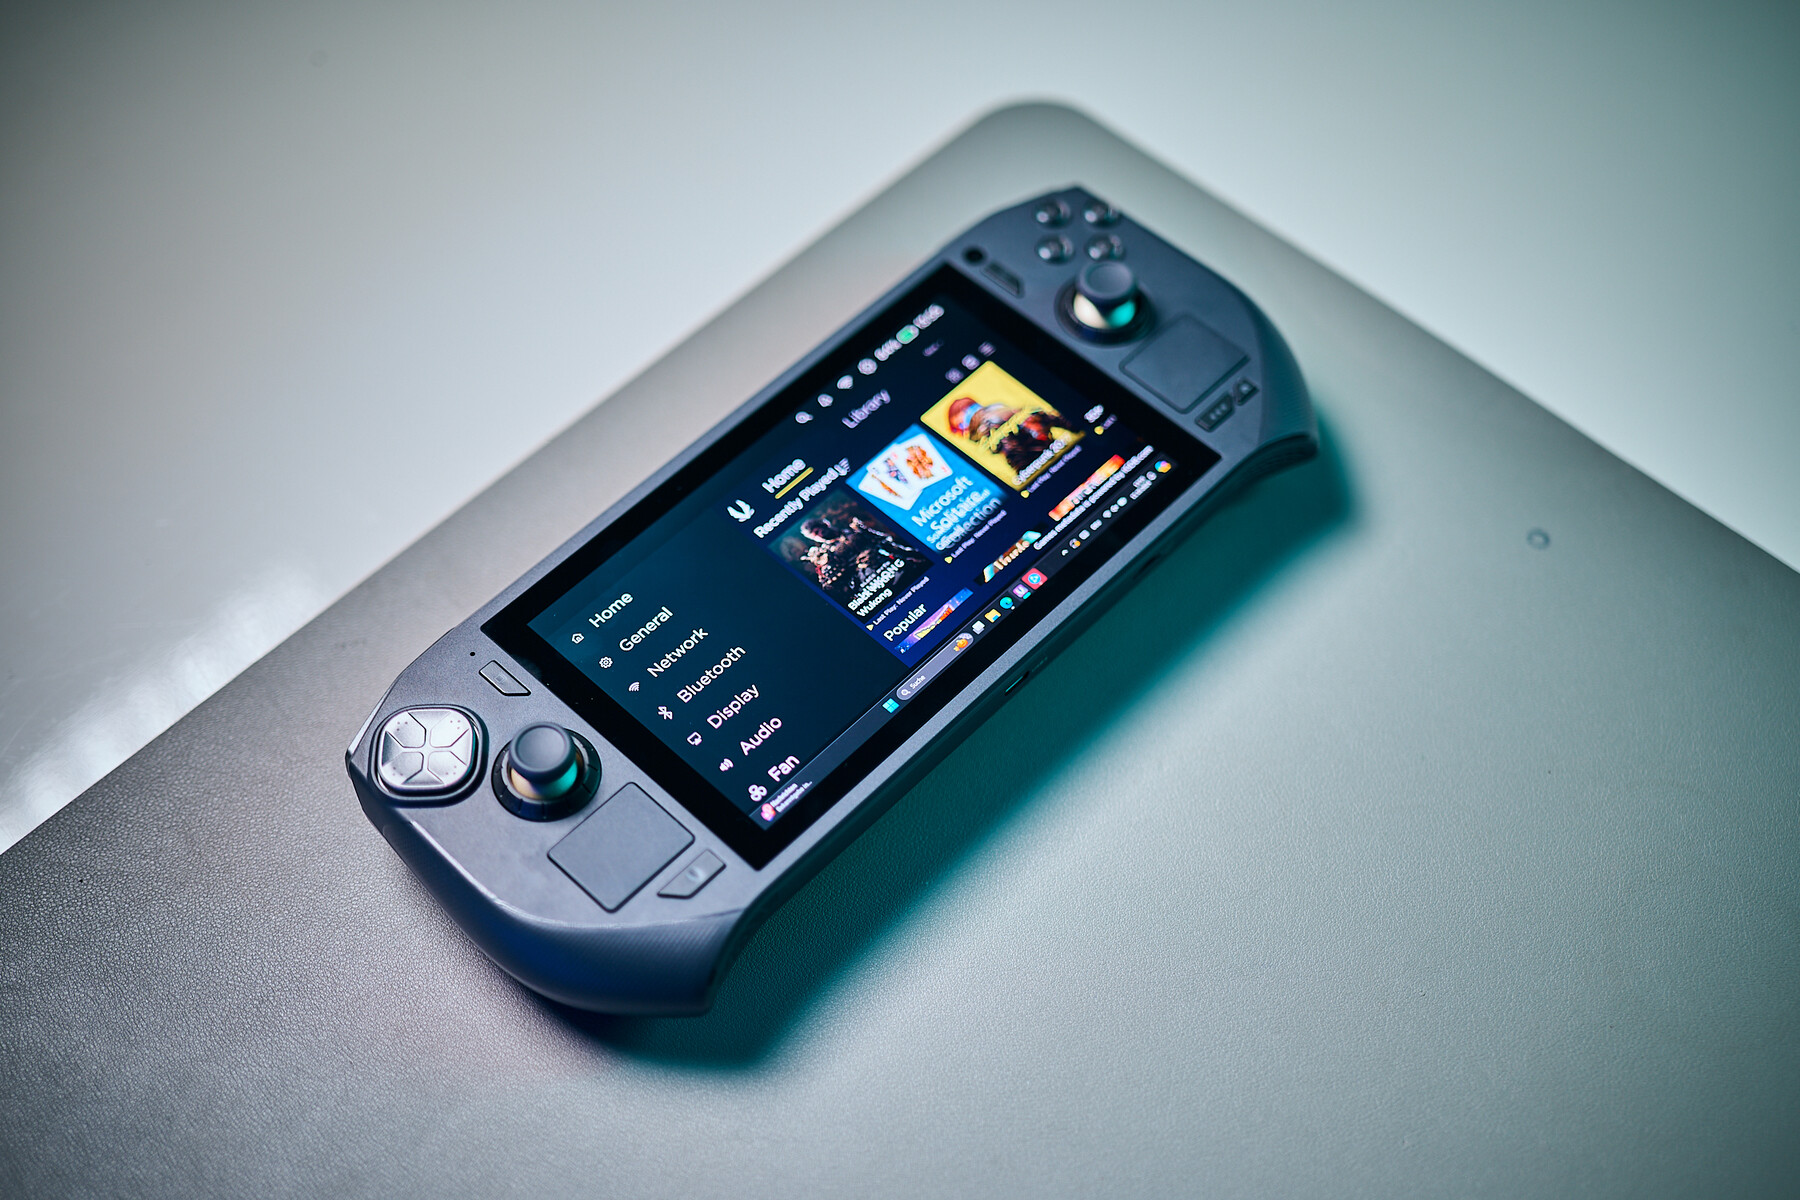
Input devices
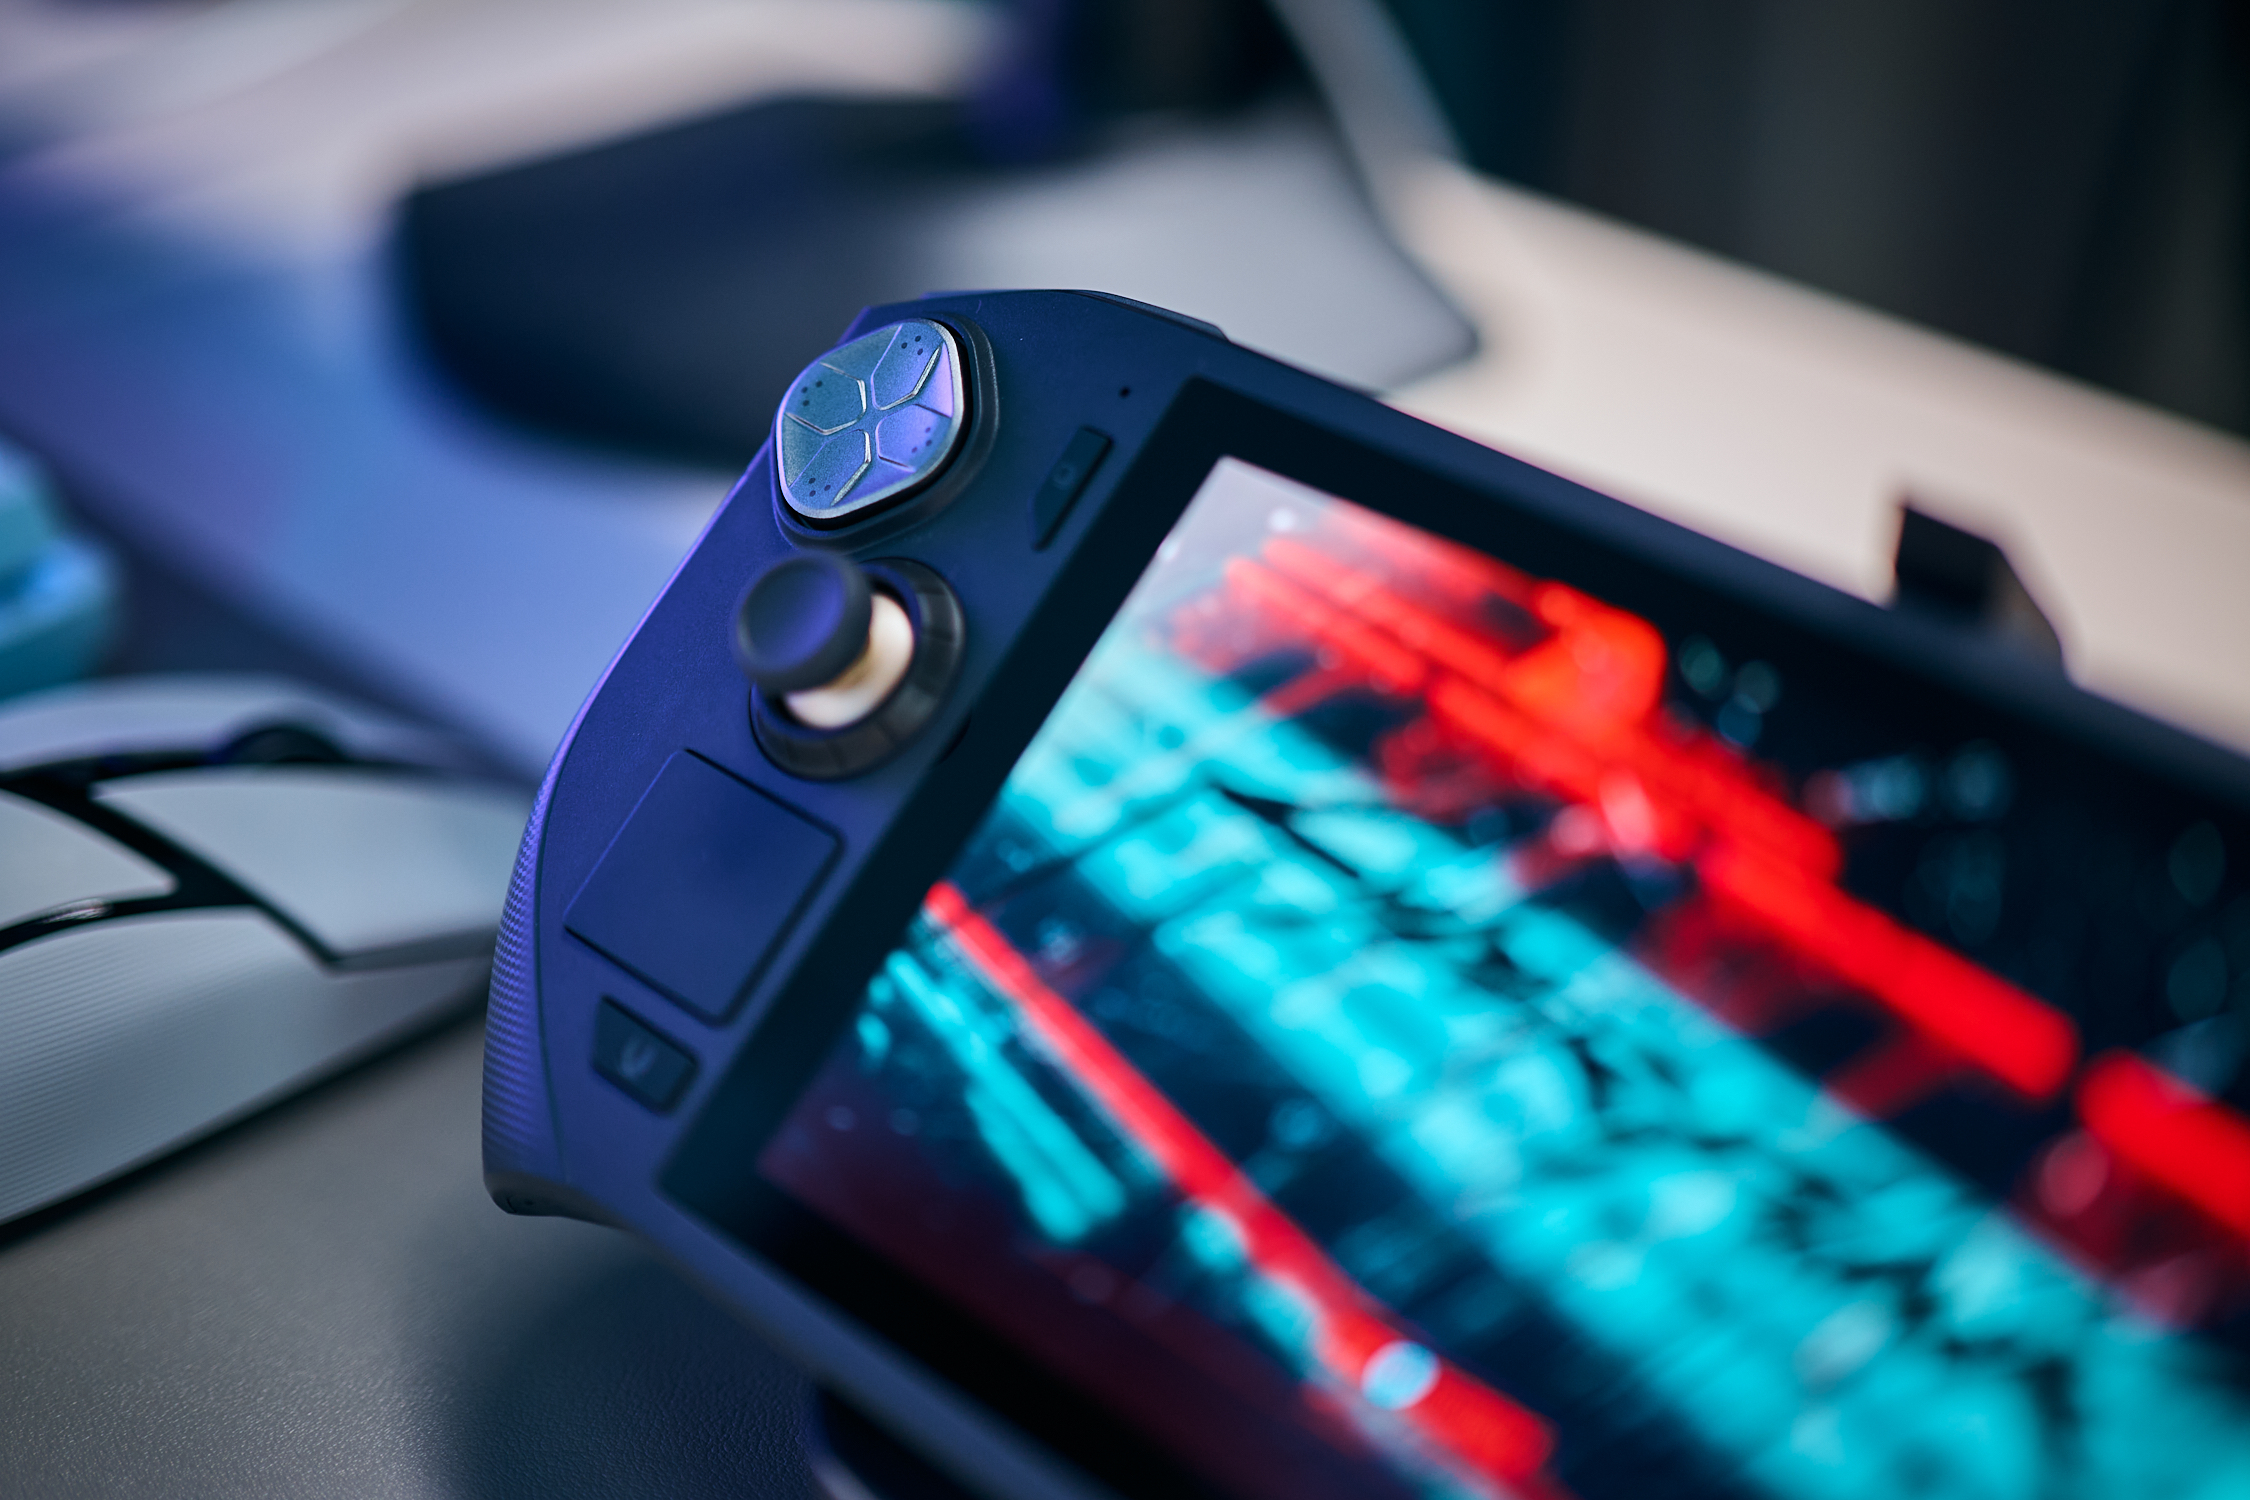
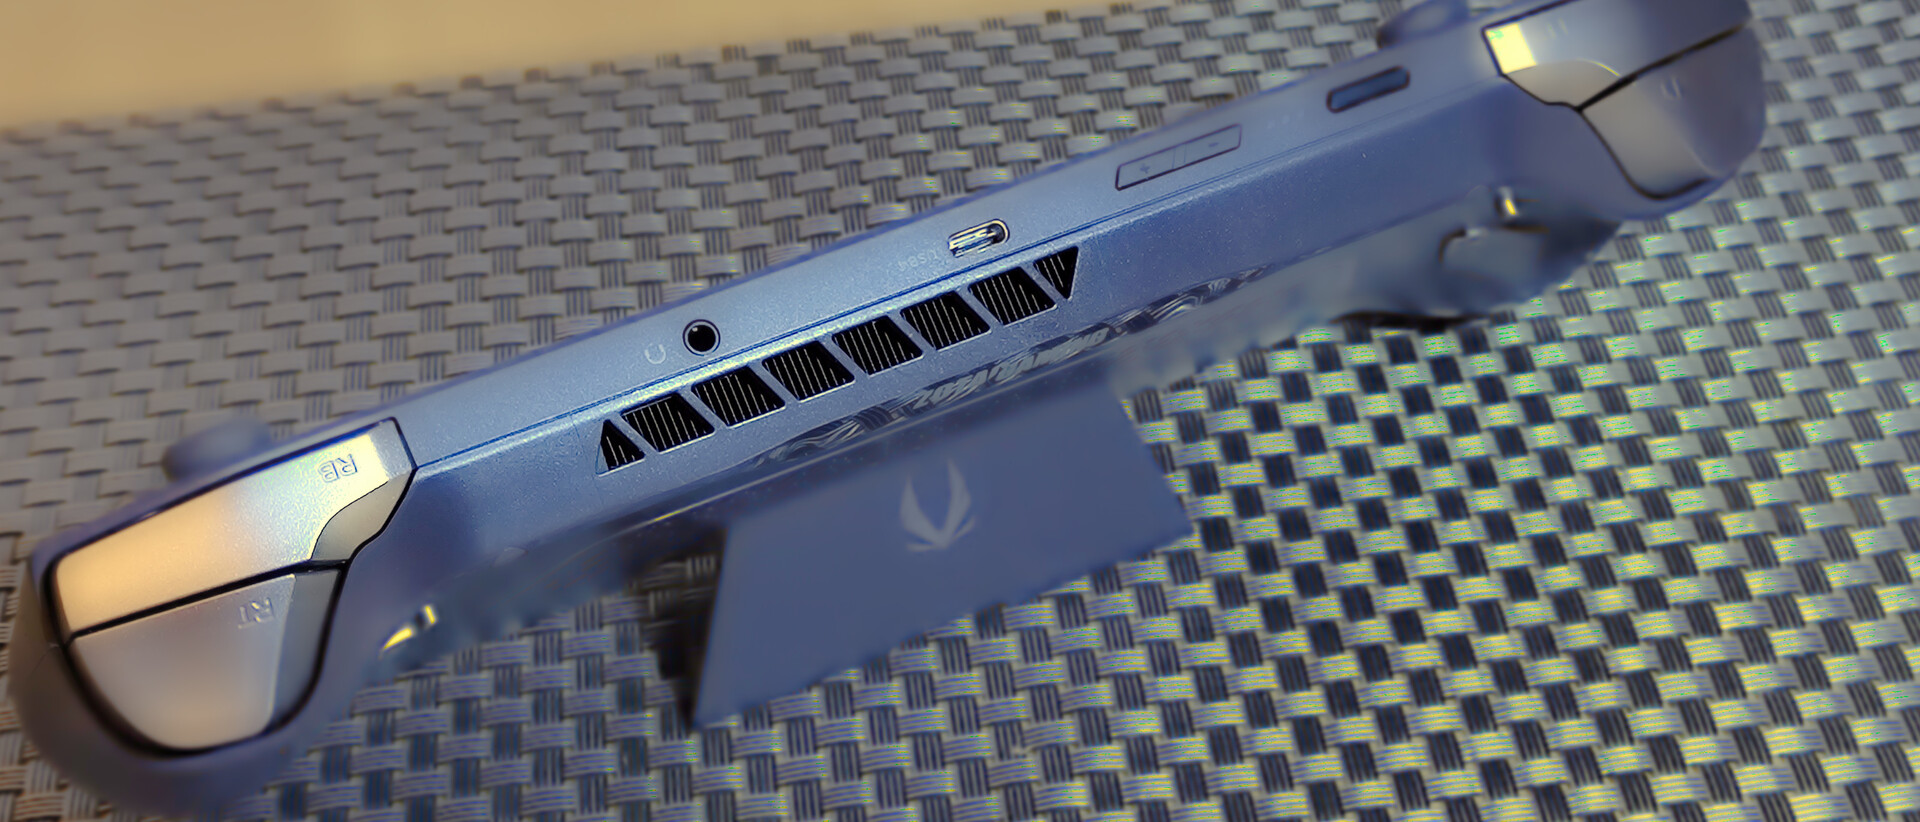
The Zotac Zone features a classic controller layout that gamers will be familiar with. Two precise analog sticks, a D-pad, ABXY buttons as well as shoulder buttons and triggers make controlling the device feel intuitive. The buttons have a pleasant pressure point and provide good feedback—there is no spongy feeling whatsoever. The analog sticks with Hall effect sensors are particularly noteworthy. This technology not only promises precise control, but also a long service life and effectively prevents problems with stick drift. The triggers can be adjusted in two stages and therefore offer either analog or digital input, which is particularly advantageous for racing games or shooters. You can change the mode quickly using the slide switches on the back.
In addition to the classic controller layout, the Zotac Zone offers additional input options. Two touchpads enable precise mouse control, which is useful for strategy games or navigating the Windows desktop, for example. What's new for us is that the right touchpad even differentiates between right and left clicks. We have never experienced this before on a handheld. The integrated touchscreen further expands its operating options.
Three more buttons are located below the touchpads. On the left is a button that starts the Zotac Zone Launcher. On the right are two buttons that can be assigned various functions, such as minimizing applications, calling up an overlay menu or the Windows security screen (task manager, etc.). On the back of the device, the Zotac Zone has two freely programmable buttons that can be individually adapted to the user's needs. There are rotary knobs around the analog sticks, which unfortunately cannot be used for game control. Instead, they are used to control the volume, screen brightness and RGB lighting.
Display
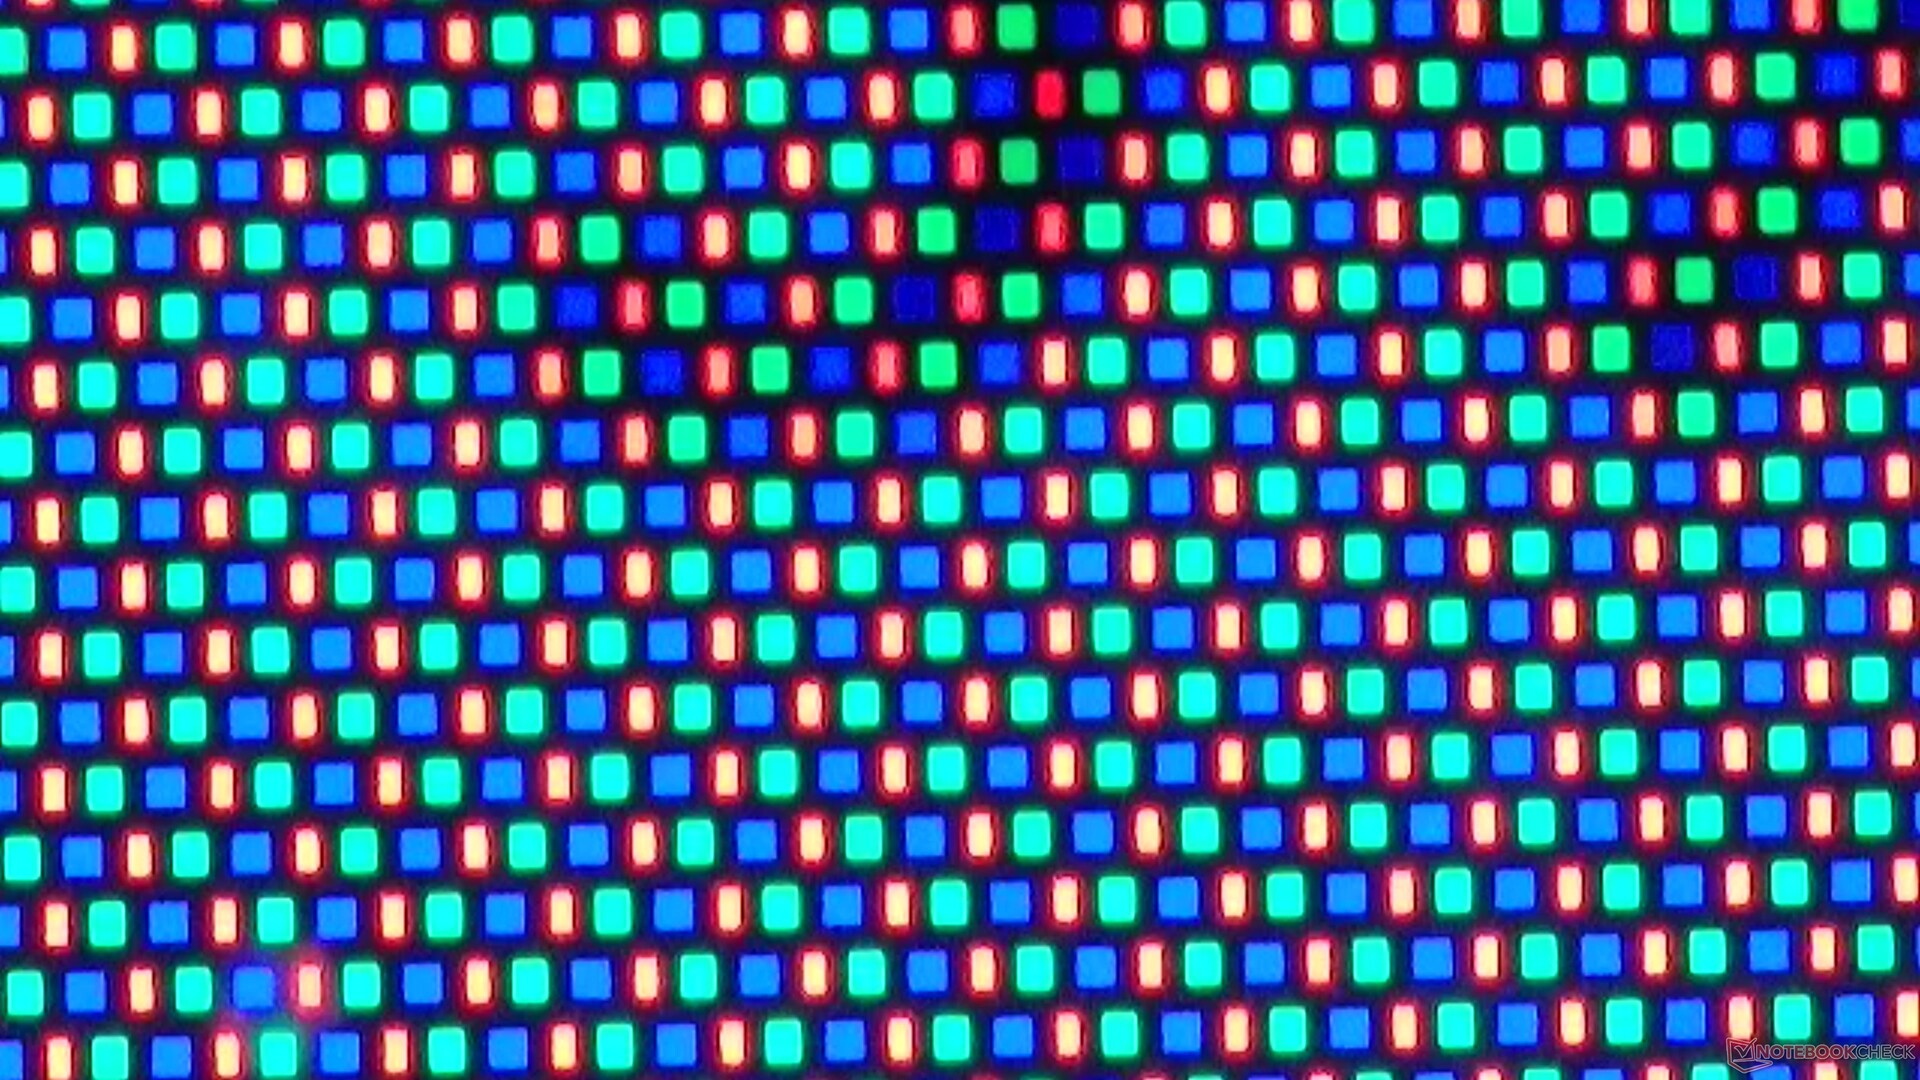
The Zotac Zone uses a brilliant 7-inch OLED display, which is still a rarity in the world of handheld PCs. Alongside the Ayaneo Air, the Zotac Zone is currently one of the few devices in our database to boast this display technology. OLED displays feature perfect black levels, vivid colors and strong contrasts, resulting in an impressive picture experience on the Zotac Zone.
Thanks to its refresh rate of 120 Hz, games are displayed smoothly and without any annoying stuttering. Its Full HD resolution ensures sharp images and a high level of detail. The display's brightness reaches up to 830 cd/m², which ensures good visibility even in bright ambient conditions. Its response times are fast, so there are no unsightly streaks even when playing action-packed games.
| |||||||||||||||||||||||||
Brightness Distribution: 90 %
Center on Battery: 826 cd/m²
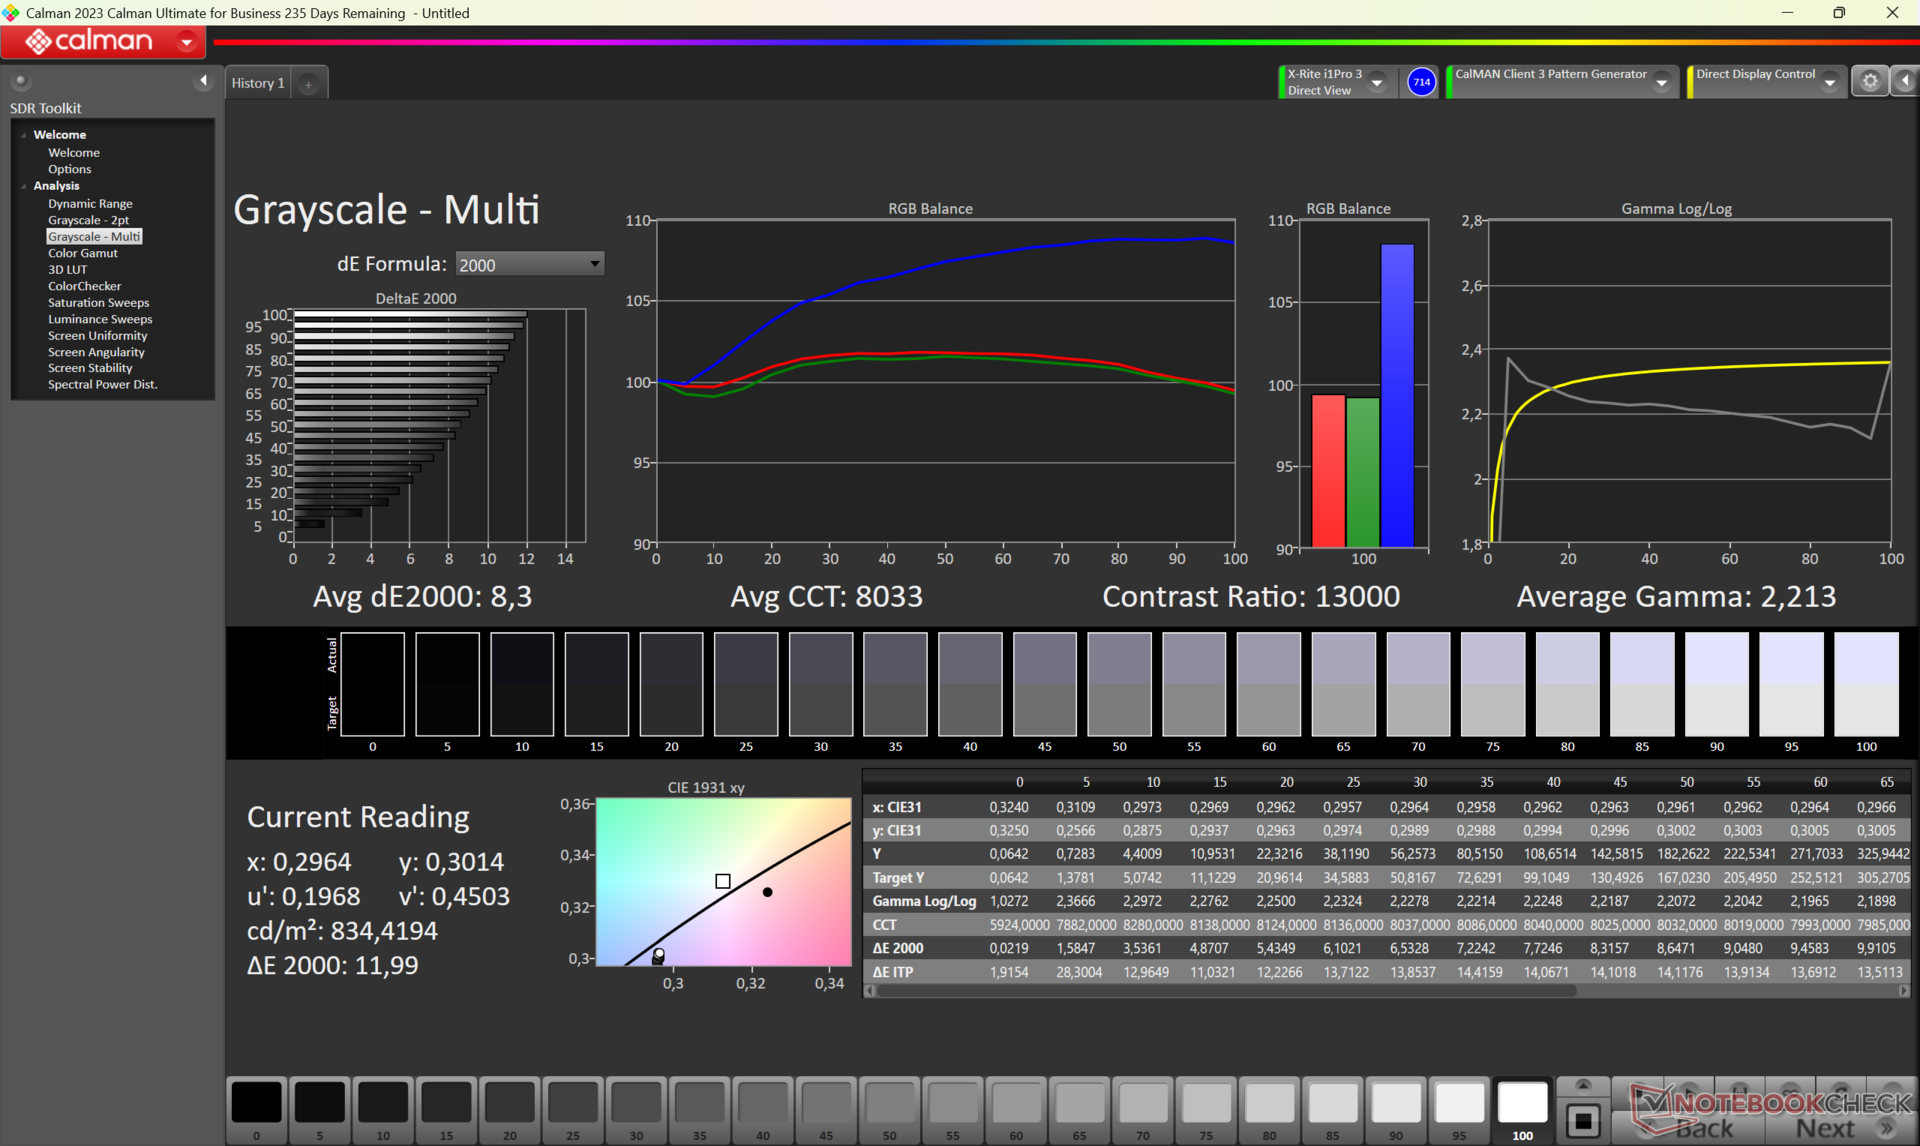
Contrast: 13016:1 (Black: 0.064 cd/m²)
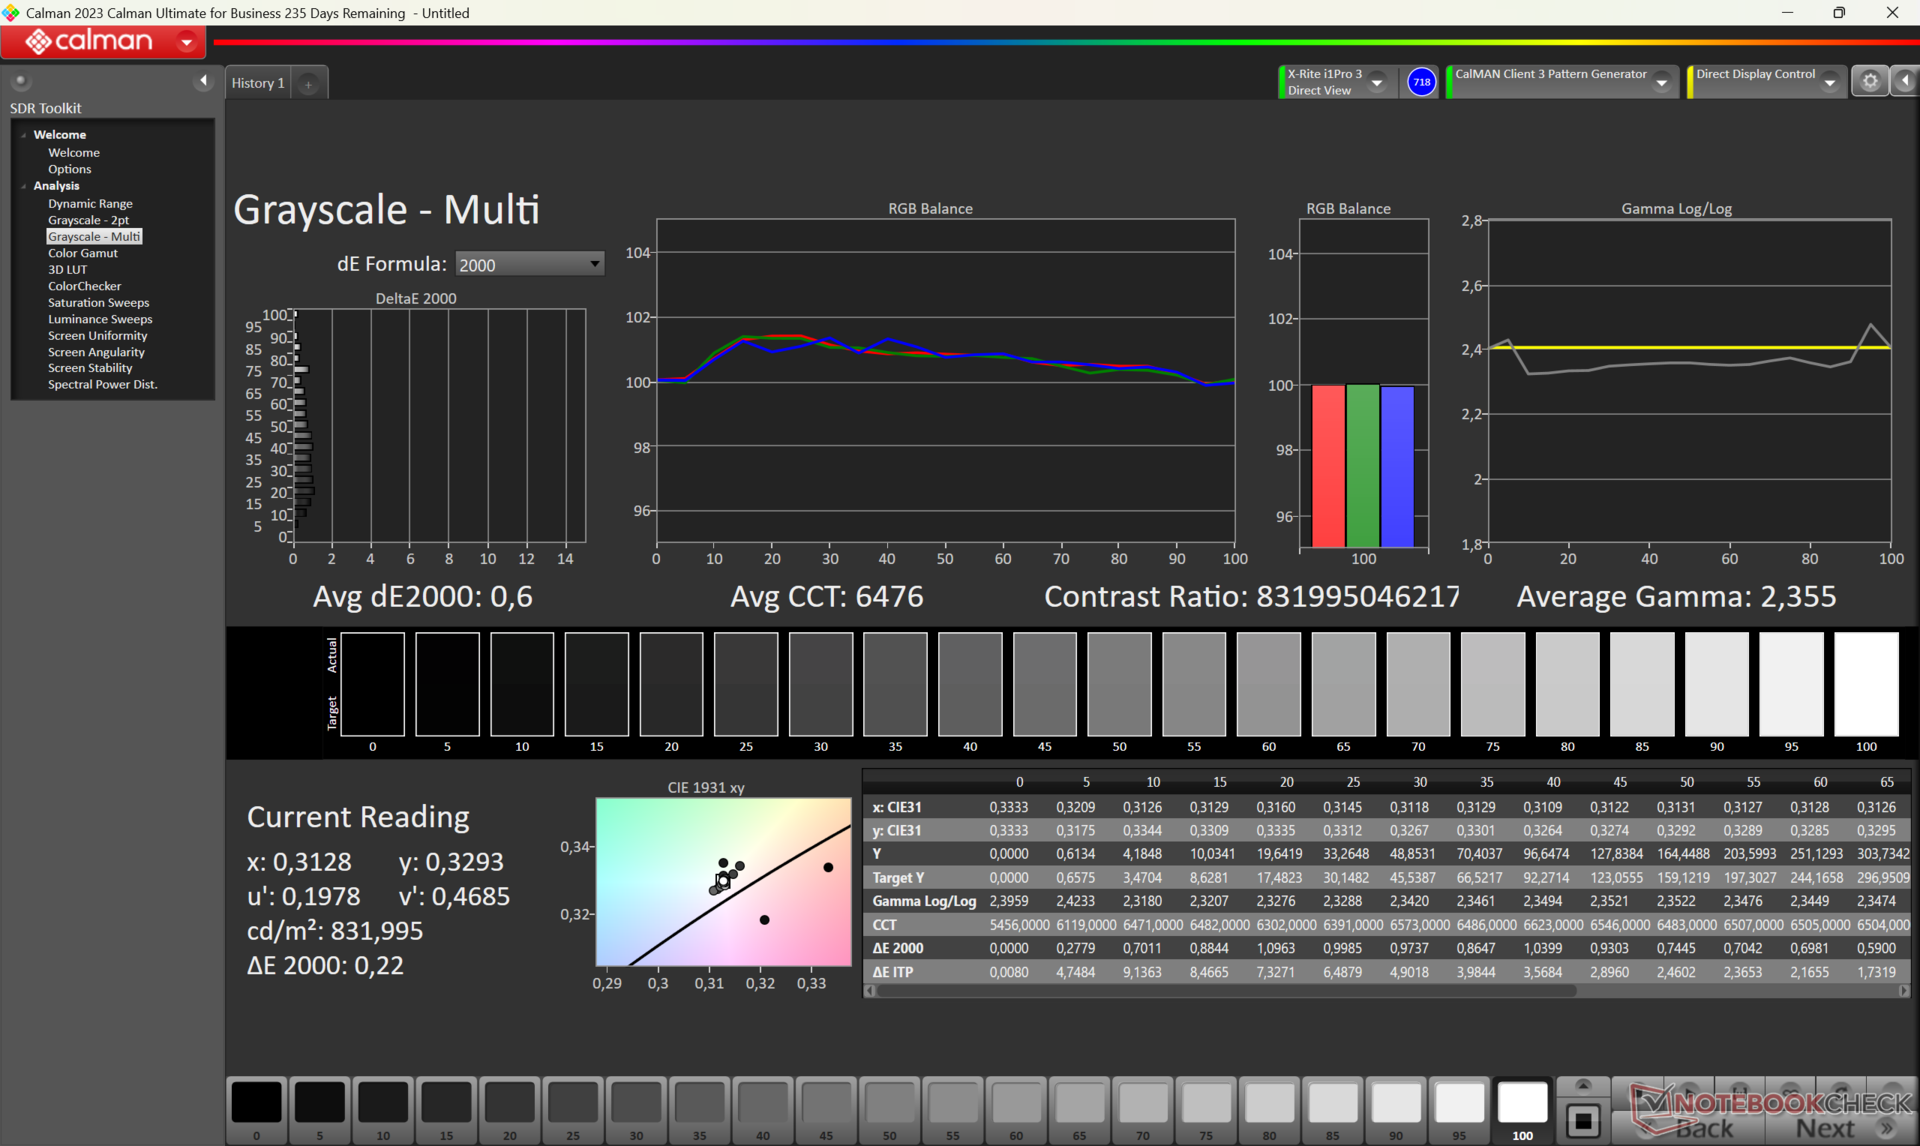
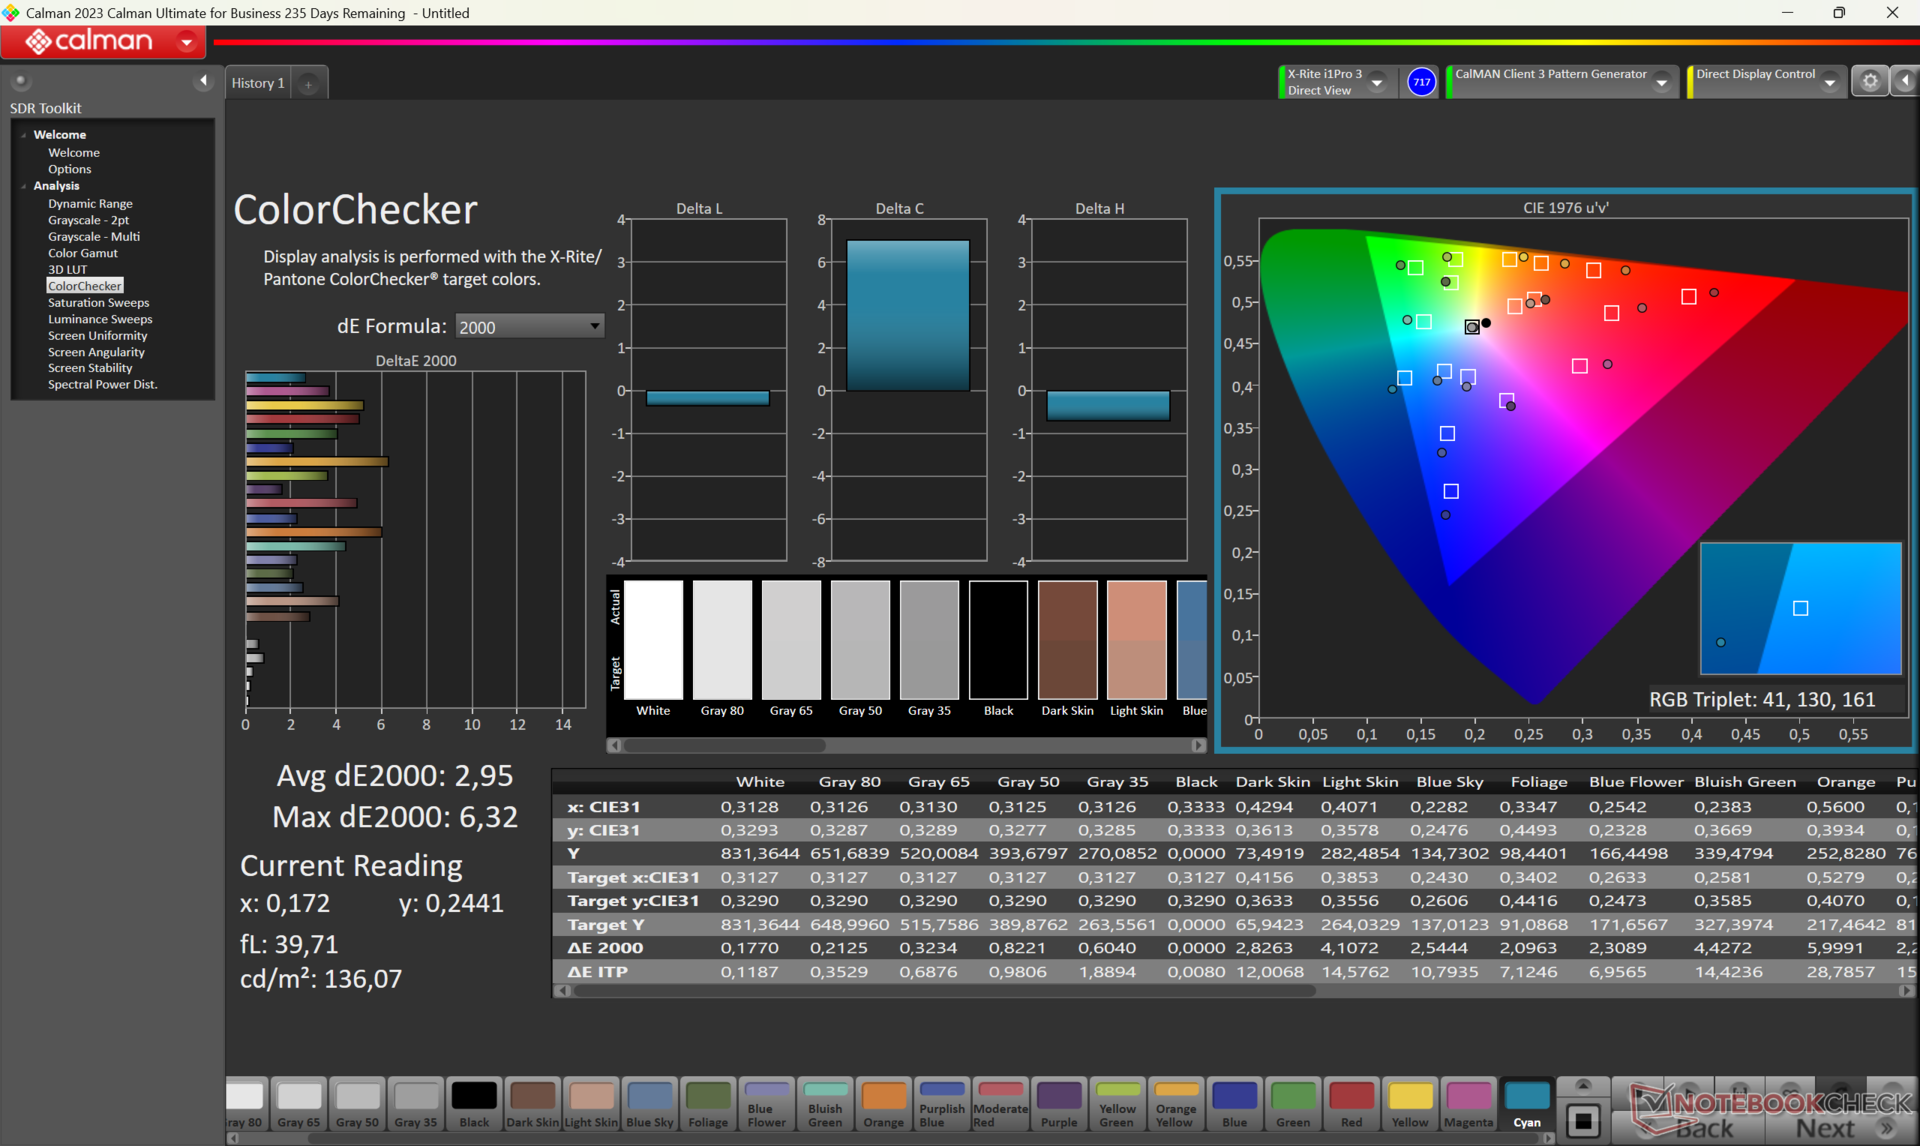
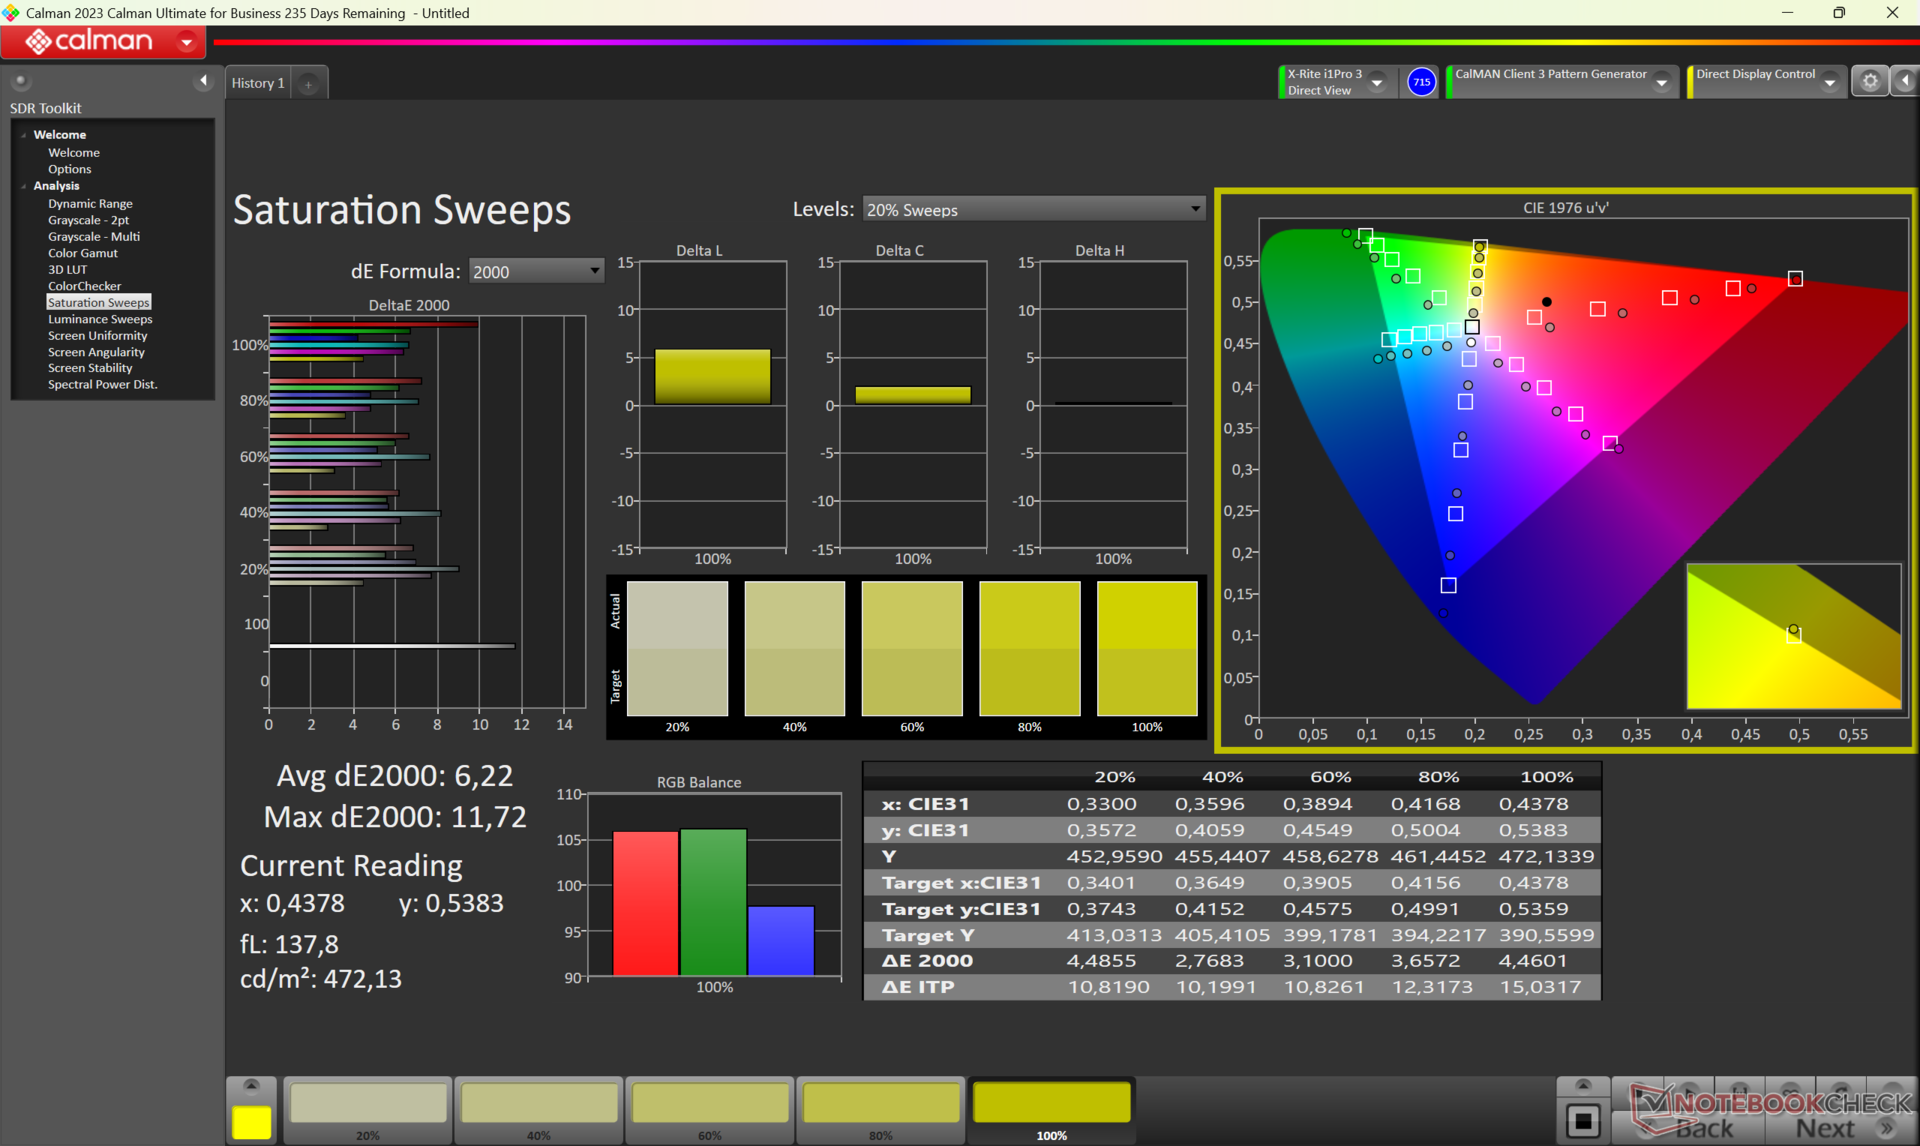
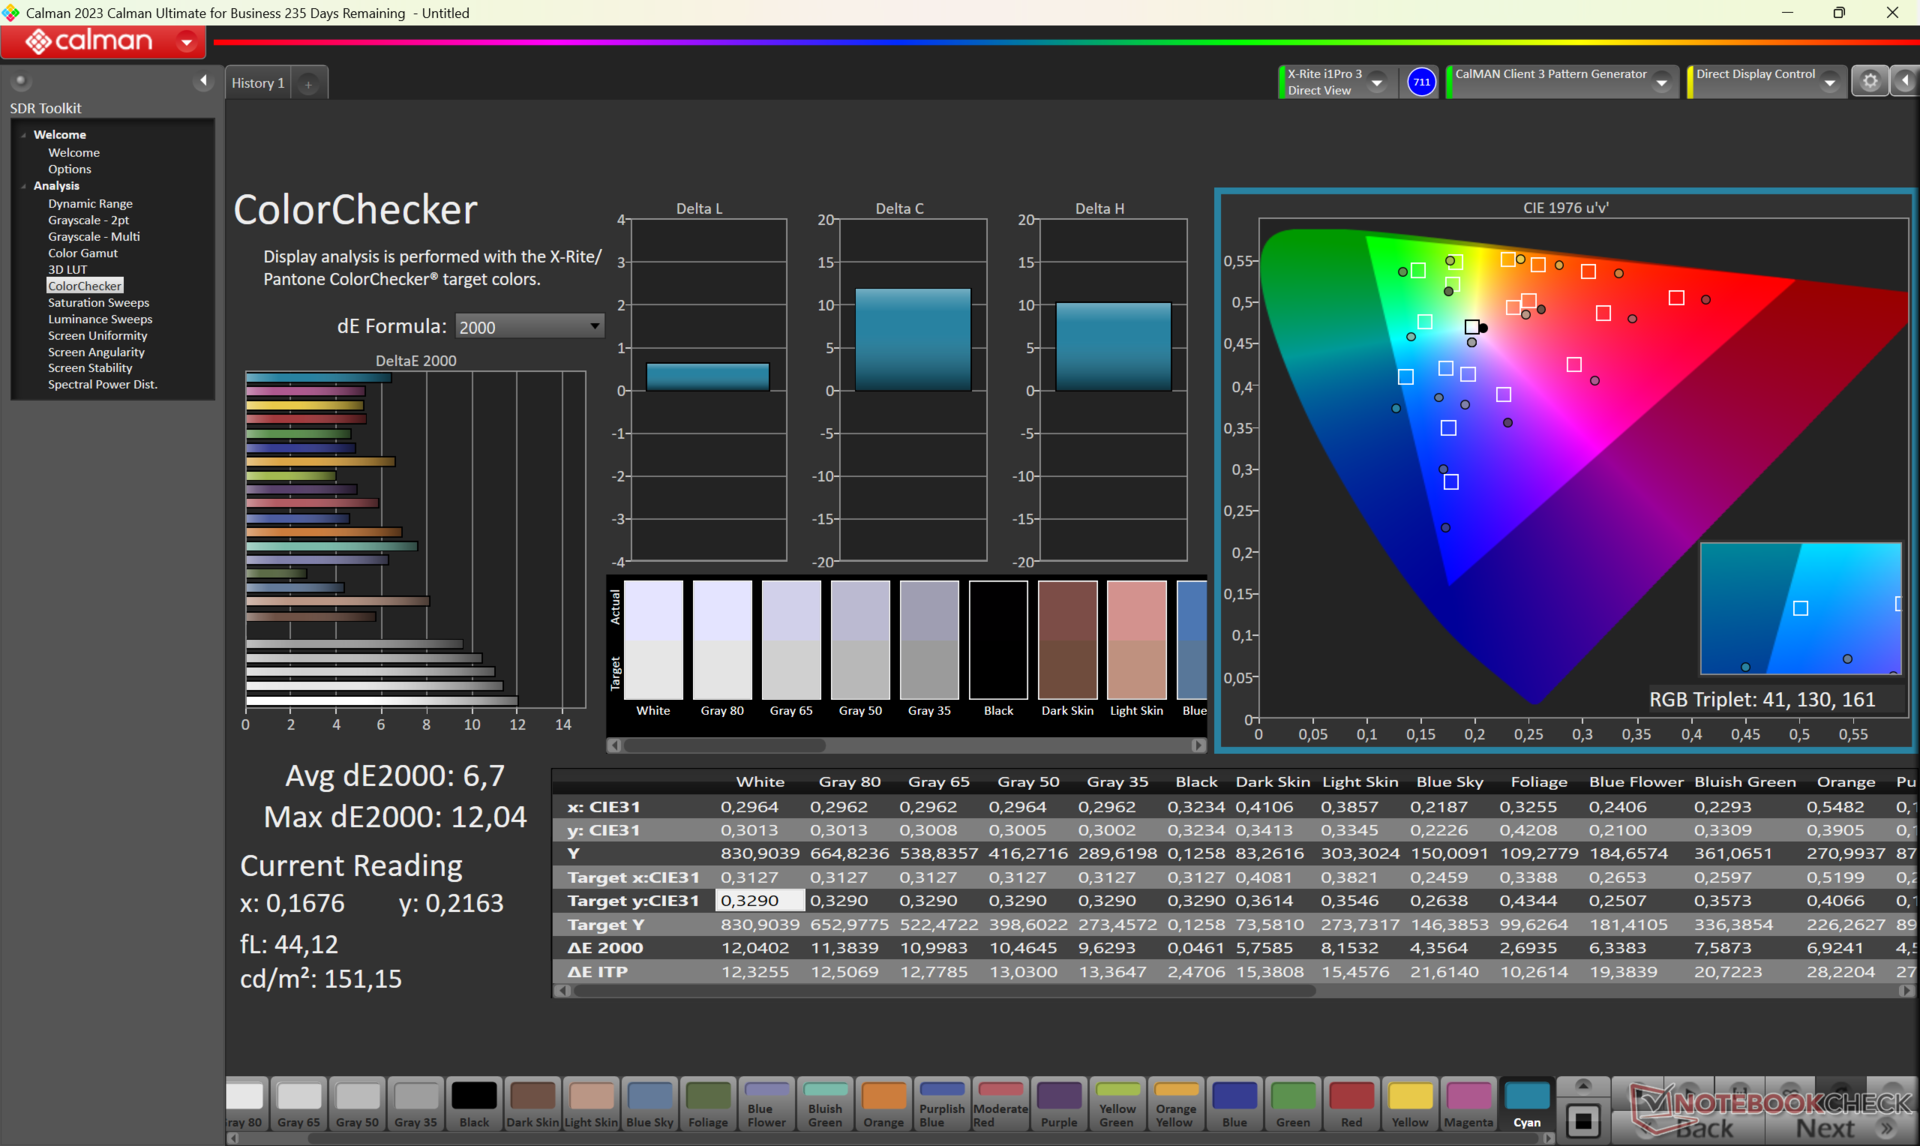
ΔE ColorChecker Calman: 6.7 | ∀{0.5-29.43 Ø4.71}
calibrated: 2.95
ΔE Greyscale Calman: 11.99 | ∀{0.09-98 Ø4.96}
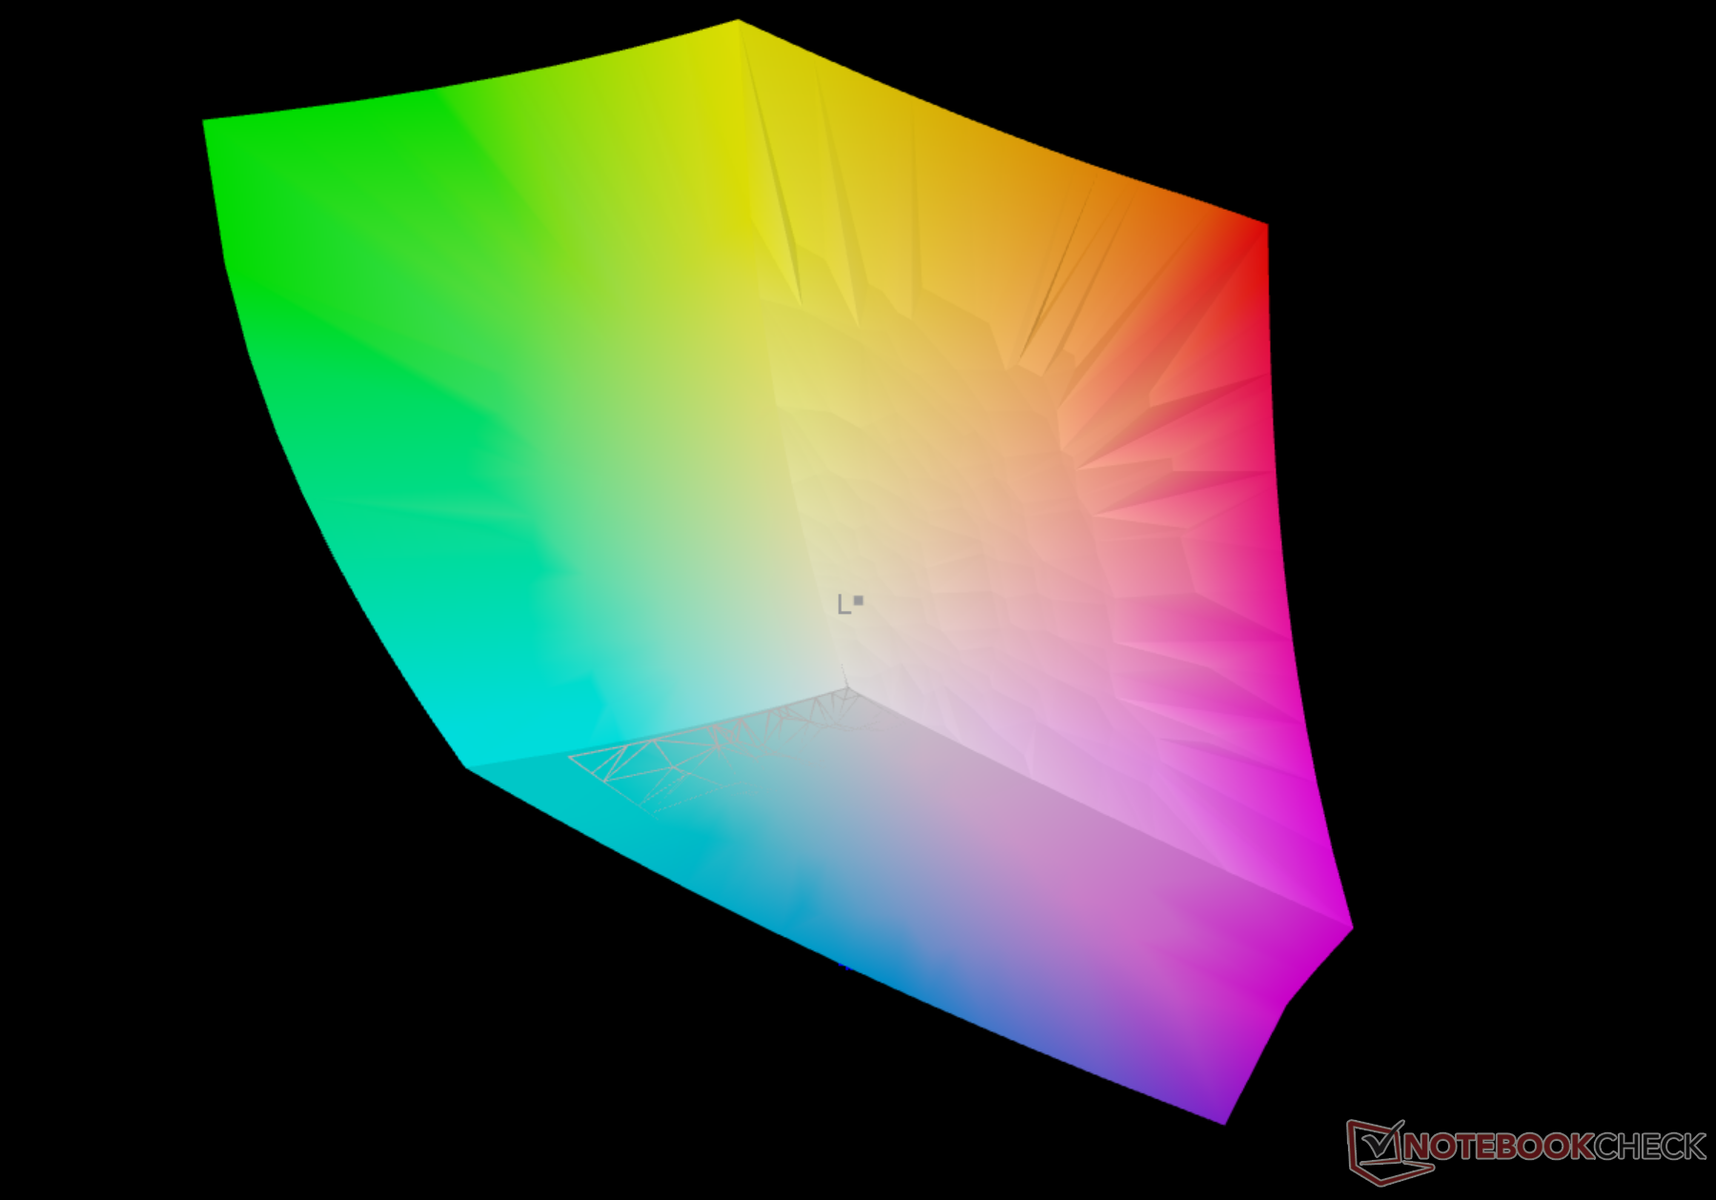
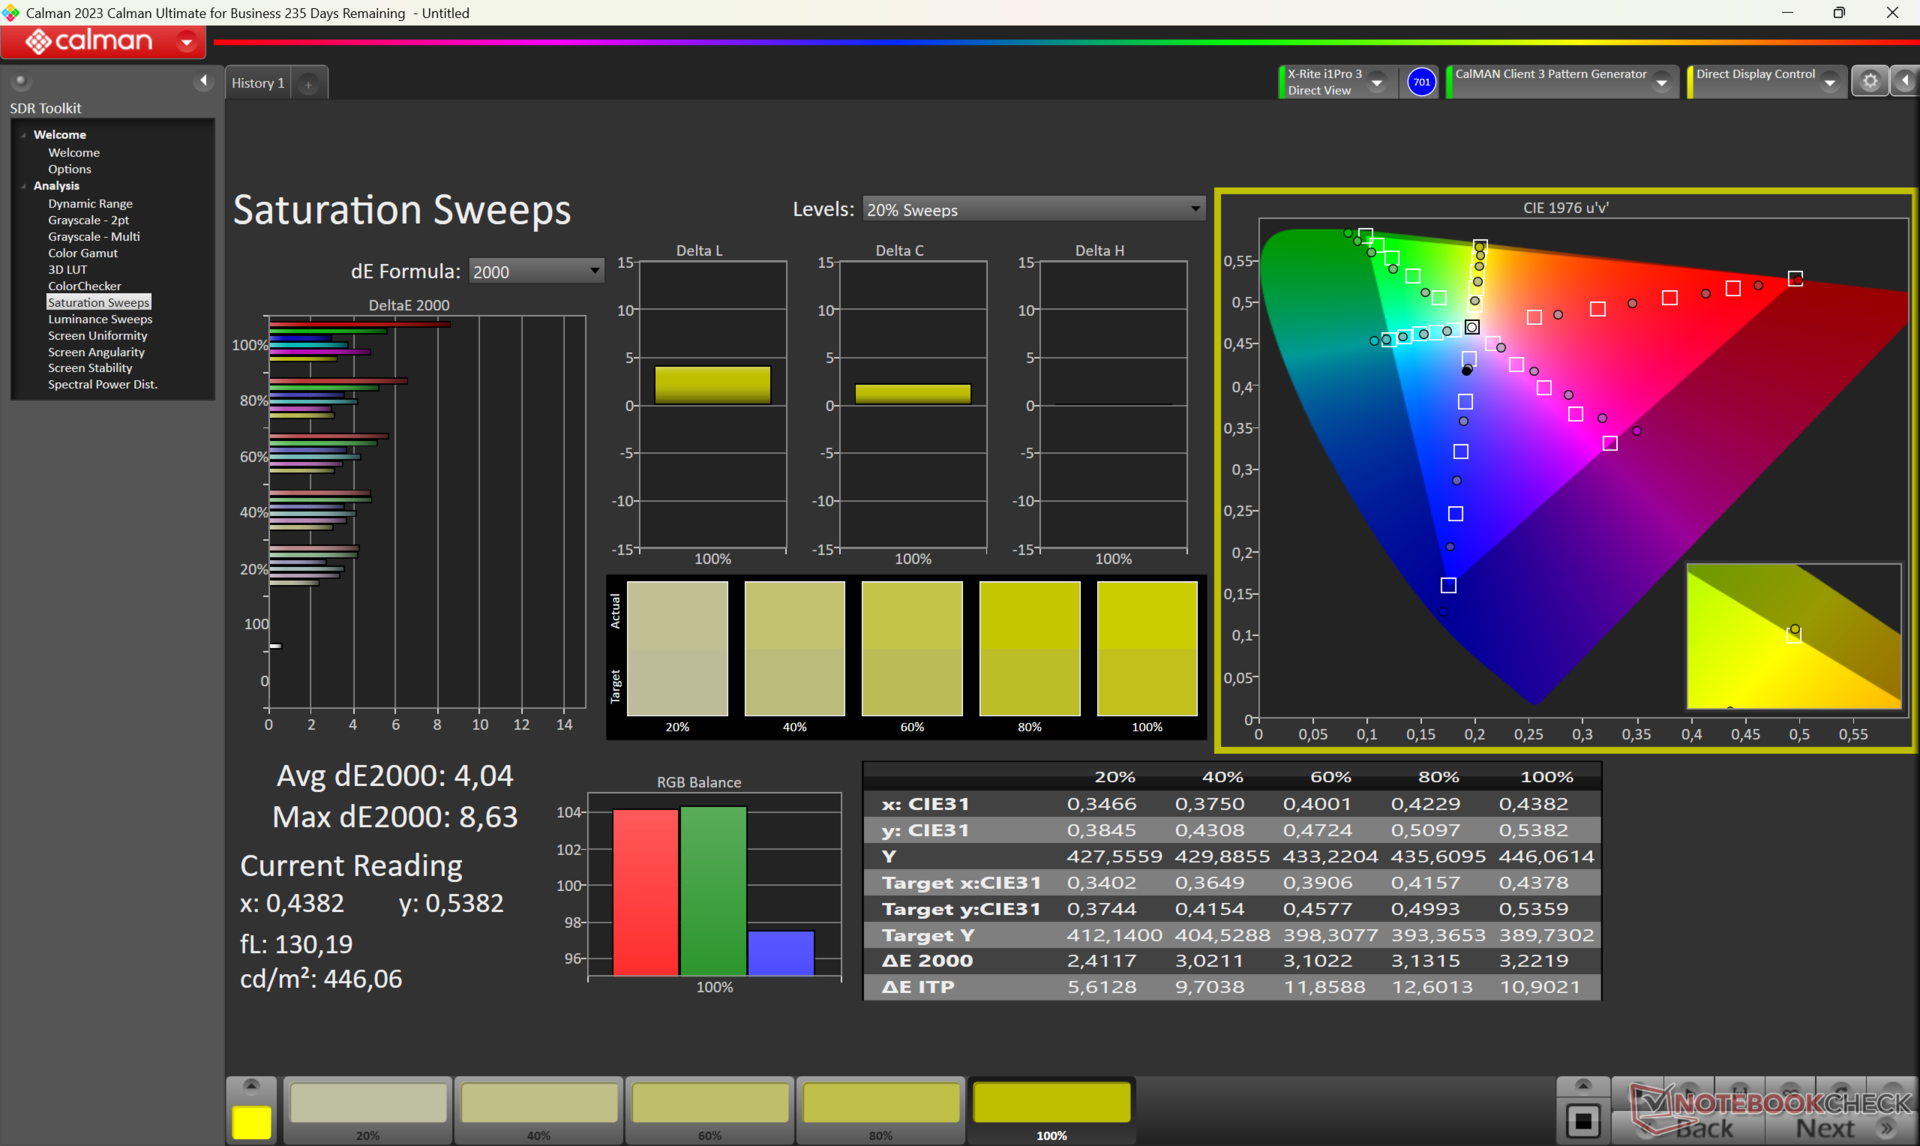
99.89% AdobeRGB 1998 (Argyll 3D)
99.93% sRGB (Argyll 3D)
99.43% Display P3 (Argyll 3D)
Gamma: 2.213
CCT: 8033 K
| Zotac ZGC-G1A1W-01 ZDZ0501, OLED, 1920x1080, 7", 120 Hz | ONEXPLAYER 2 Pro AR18 FLQ8423-24L0, IPS, 2560x1600, 8.4", 60 Hz | MSI Claw TL070FVXS02-0, IPS, 1920x1080, 7", 120 Hz | Lenovo Legion Go Legion Go Display, IPS, 2560x1600, 8.8", 144 Hz | Asus ROG Ally X TL070FVXS01-0, IPS, 1920x1080, 7", 120 Hz | Ayaneo Air 1S Retro Power Ayaneo-OLED, OLED, 1920x1080, 5.5", 60 Hz | |
|---|---|---|---|---|---|---|
| Display | -9% | -23% | -6% | -24% | 0% | |
| Display P3 Coverage (%) | 99.43 | 91.9 -8% | 67 -33% | 92.1 -7% | 66.2 -33% | 99.85 0% |
| sRGB Coverage (%) | 99.93 | 99.3 -1% | 94.4 -6% | 99.56 0% | 93.4 -7% | 100 0% |
| AdobeRGB 1998 Coverage (%) | 99.89 | 81.6 -18% | 69.4 -31% | 90.09 -10% | 68.5 -31% | 99.71 0% |
| Response Times | -1203% | -362% | -941% | -380% | -131% | |
| Response Time Grey 50% / Grey 80% * (ms) | 1.08 ? | 25.5 ? -2261% | 9.2 ? -752% | 20.8 ? -1826% | 9.7 ? -798% | 4.4 ? -307% |
| Response Time Black / White * (ms) | 9.3 ? | 22.73 ? -144% | 6.6 ? 29% | 14.4 ? -55% | 5.7 ? 39% | 5 ? 46% |
| PWM Frequency (Hz) | 120 ? | 700 | 240 ? | |||
| PWM Amplitude * (%) | 10 | |||||
| Screen | -18% | -39% | -72% | -46% | -20% | |
| Brightness middle (cd/m²) | 833 | 318 -62% | 477 -43% | 411 -51% | 484 -42% | 331 -60% |
| Brightness (cd/m²) | 830 | 287 -65% | 461 -44% | 413 -50% | 456 -45% | 339 -59% |
| Brightness Distribution (%) | 90 | 48 -47% | 88 -2% | 80 -11% | 88 -2% | 90 0% |
| Black Level * (cd/m²) | 0.064 | 0.1118 -75% | 0.32 -400% | 0.42 -556% | 0.35 -447% | 0.07 -9% |
| Contrast (:1) | 13016 | 2844 -78% | 1491 -89% | 979 -92% | 1383 -89% | 4729 -64% |
| Colorchecker dE 2000 * | 6.7 | 4.81 28% | 2.6 61% | 5.94 11% | 2.9 57% | 4.76 29% |
| Colorchecker dE 2000 max. * | 12.04 | 6.93 42% | 5.8 52% | 10.56 12% | 7.1 41% | 9.2 24% |
| Colorchecker dE 2000 calibrated * | 2.95 | 1.53 48% | 1.5 49% | 2.95 -0% | 1.4 53% | 5.04 -71% |
| Greyscale dE 2000 * | 11.99 | 6.12 49% | 3.9 67% | 0.92 92% | 4.5 62% | 8.79 27% |
| Gamma | 2.213 99% | 2.003 110% | 2.17 101% | 1.93 114% | 2.24 98% | 2.155 102% |
| CCT | 8033 81% | 7707 84% | 7250 90% | 8064 81% | 7534 86% | 7571 86% |
| Total Average (Program / Settings) | -410% /
-185% | -141% /
-82% | -340% /
-182% | -150% /
-89% | -50% /
-32% |
* ... smaller is better


Display Response Times
| ↔ Response Time Black to White | ||
|---|---|---|
| 9.3 ms ... rise ↗ and fall ↘ combined | ↗ 8.7 ms rise | 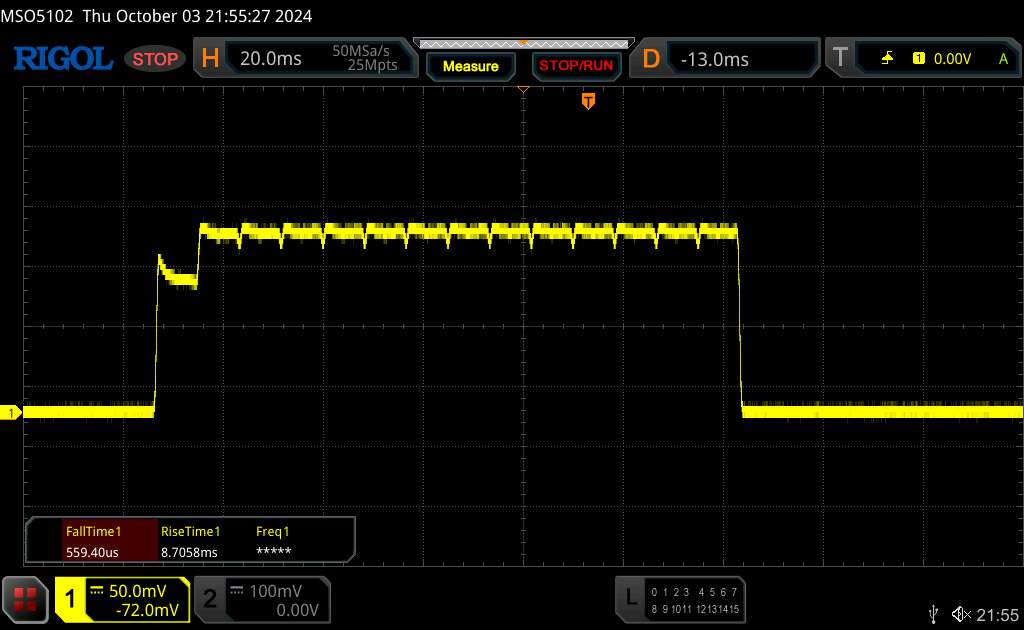 |
| ↘ 0.6 ms fall | ||
| The screen shows fast response rates in our tests and should be suited for gaming. In comparison, all tested devices range from 0.1 (minimum) to 240 (maximum) ms. » 26 % of all devices are better. This means that the measured response time is better than the average of all tested devices (19.8 ms). | ||
| ↔ Response Time 50% Grey to 80% Grey | ||
| 1.08 ms ... rise ↗ and fall ↘ combined | ↗ 0.54 ms rise | 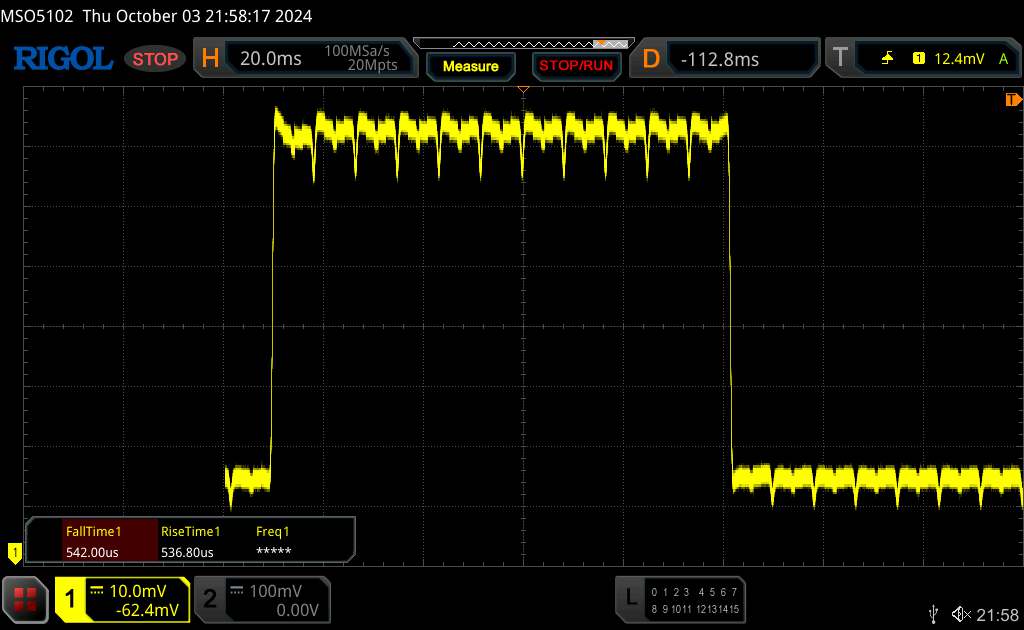 |
| ↘ 0.54 ms fall | ||
| The screen shows very fast response rates in our tests and should be very well suited for fast-paced gaming. In comparison, all tested devices range from 0.165 (minimum) to 636 (maximum) ms. » 5 % of all devices are better. This means that the measured response time is better than the average of all tested devices (31 ms). | ||
Screen Flickering / PWM (Pulse-Width Modulation)
| Screen flickering / PWM detected | 120 Hz Amplitude: 10 % Secondary Frequency: 240 Hz | ≤ 100 % brightness setting |  |
The display backlight flickers at 120 Hz (worst case, e.g., utilizing PWM) Flickering detected at a brightness setting of 100 % and below. There should be no flickering or PWM above this brightness setting. The frequency of 120 Hz is very low, so the flickering may cause eyestrain and headaches after extended use. In comparison: 52 % of all tested devices do not use PWM to dim the display. If PWM was detected, an average of 7747 (minimum: 5 - maximum: 343500) Hz was measured. | |||
Unfortunately, the OLED display shows some typical flickering at 120 Hz, which is caused by the line-by-line refresh of the pixels. However, this shouldn't cause any disturbances on the Zotac Zone's small display.
Despite its high brightness, outdoor use may be somewhat difficult as the screen is very reflective.
Performance

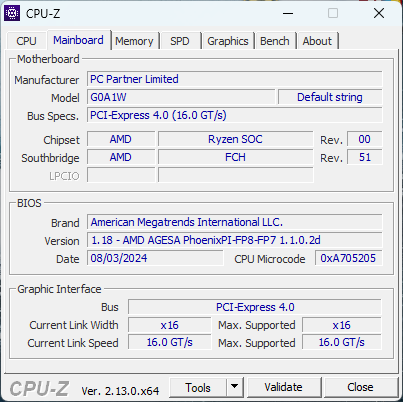
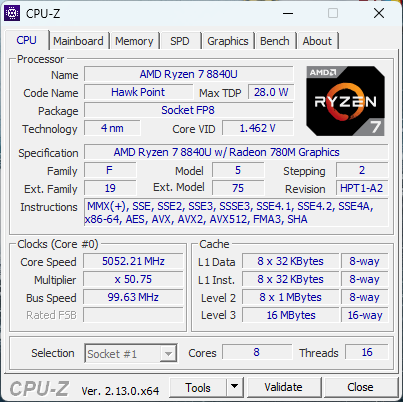
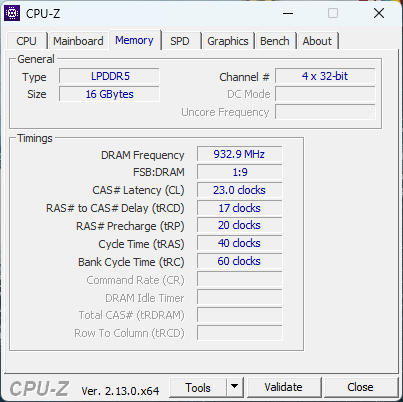
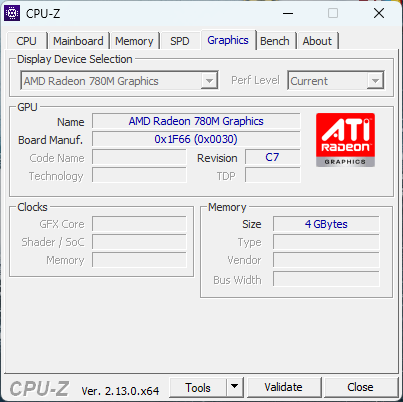
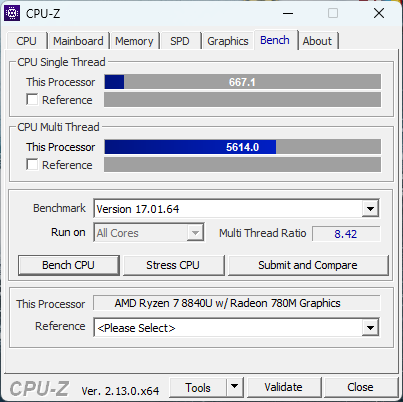
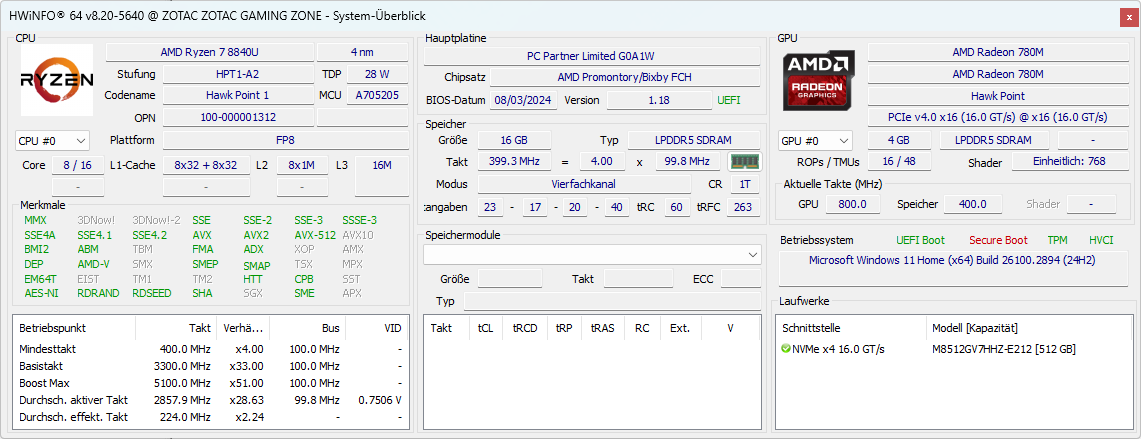
At the heart of the Zotac Zone lies an AMD Ryzen 7 8840U—a processor using Zen 4 architecture—which ensures sufficient performance thanks to its 8 cores and 16 threads. The integrated AMD Radeon 780M is responsible for displaying graphics. 16 GB LPDDR5 RAM ensures smooth multitasking, while a 512 GB NVMe SSD provides storage space for games, applications and the operating system.
Testing conditions
The Zotac software (Zotac Gaming One Launcher) offers various power modes that influence the device's power consumption and performance. The processor's power consumption can be set to a maximum of 30 watts and a minimum of 8 watts. For our tests, we opted for "Performance" mode, which has a balanced power distribution between CPU and GPU with a power consumption of 28 watts. This limits the CPU/boost somewhat, which doesn't necessarily ensure the best results in the processor benchmarks.
You can also create custom settings for the fan control and even custom fan curves. We stuck to the automatic fan control setting.
Processor
The AMD Ryzen 7 8840U delivers the typical performance you would expect from a modern handheld PC. In the Cinebench R23 multicore test, for example, it achieved 13016 points, positioning itself between the Lenovo Legion Go and the OneXPlayer 2 Pro. In comparison with other typical handheld processors such as the AMD Ryzen 7 7840U, the Intel Core Ultra 7 155H and the AMD Ryzen Z1 Extreme, there are no real differences in CPU performance. The Ryzen 7 8840U's 8 cores and 16 threads master demanding games and applications without any problems.
Cinebench R15 Multi continuous test
Cinebench R23: Multi Core | Single Core
Cinebench R20: CPU (Multi Core) | CPU (Single Core)
Cinebench R15: CPU Multi 64Bit | CPU Single 64Bit
Blender: v2.79 BMW27 CPU
7-Zip 18.03: 7z b 4 | 7z b 4 -mmt1
Geekbench 6.7: Multi-Core | Single-Core
Geekbench 5.5: Multi-Core | Single-Core
HWBOT x265 Benchmark v2.2: 4k Preset
LibreOffice : 20 Documents To PDF
R Benchmark 2.5: Overall mean
| CPU Performance rating | |
| Asus ROG Ally X | |
| Lenovo Legion Go -2! | |
| Zotac ZGC-G1A1W-01 | |
| MSI Claw | |
| Ayaneo Kun | |
| Average AMD Ryzen 7 8840U | |
| ONEXPLAYER 2 Pro AR18 | |
| Average of class Handheld / UMPC | |
| Cinebench R23 / Multi Core | |
| Asus ROG Ally X | |
| Ayaneo Kun | |
| MSI Claw | |
| ONEXPLAYER 2 Pro AR18 | |
| Zotac ZGC-G1A1W-01 | |
| Lenovo Legion Go | |
| Average AMD Ryzen 7 8840U (10162 - 13563, n=7) | |
| Average of class Handheld / UMPC (4953 - 16841, n=14, last 2 years) | |
| Cinebench R23 / Single Core | |
| MSI Claw | |
| Lenovo Legion Go | |
| Asus ROG Ally X | |
| ONEXPLAYER 2 Pro AR18 | |
| Zotac ZGC-G1A1W-01 | |
| Average of class Handheld / UMPC (1071 - 2006, n=14, last 2 years) | |
| Average AMD Ryzen 7 8840U (1088 - 1740, n=7) | |
| Ayaneo Kun | |
| Cinebench R20 / CPU (Multi Core) | |
| Ayaneo Kun | |
| Asus ROG Ally X | |
| ONEXPLAYER 2 Pro AR18 | |
| Lenovo Legion Go | |
| Zotac ZGC-G1A1W-01 | |
| Average AMD Ryzen 7 8840U (3987 - 5336, n=5) | |
| MSI Claw | |
| Average of class Handheld / UMPC (1904 - 6577, n=12, last 2 years) | |
| Cinebench R20 / CPU (Single Core) | |
| MSI Claw | |
| ONEXPLAYER 2 Pro AR18 | |
| Lenovo Legion Go | |
| Asus ROG Ally X | |
| Zotac ZGC-G1A1W-01 | |
| Average of class Handheld / UMPC (390 - 787, n=12, last 2 years) | |
| Ayaneo Kun | |
| Average AMD Ryzen 7 8840U (427 - 680, n=5) | |
| Cinebench R15 / CPU Multi 64Bit | |
| Ayaneo Kun | |
| Asus ROG Ally X | |
| ONEXPLAYER 2 Pro AR18 | |
| Zotac ZGC-G1A1W-01 | |
| Lenovo Legion Go | |
| Average AMD Ryzen 7 8840U (1539 - 2453, n=5) | |
| MSI Claw | |
| Average of class Handheld / UMPC (855 - 2533, n=12, last 2 years) | |
| Cinebench R15 / CPU Single 64Bit | |
| Lenovo Legion Go | |
| Zotac ZGC-G1A1W-01 | |
| ONEXPLAYER 2 Pro AR18 | |
| Asus ROG Ally X | |
| MSI Claw | |
| Average AMD Ryzen 7 8840U (176.6 - 275, n=5) | |
| Ayaneo Kun | |
| Average of class Handheld / UMPC (155.1 - 304, n=12, last 2 years) | |
| Blender / v2.79 BMW27 CPU | |
| Average of class Handheld / UMPC (189 - 588, n=12, last 2 years) | |
| Average AMD Ryzen 7 8840U (239 - 315, n=5) | |
| MSI Claw | |
| ONEXPLAYER 2 Pro AR18 | |
| Zotac ZGC-G1A1W-01 | |
| Asus ROG Ally X | |
| Ayaneo Kun | |
| 7-Zip 18.03 / 7z b 4 | |
| Asus ROG Ally X | |
| Ayaneo Kun | |
| Zotac ZGC-G1A1W-01 | |
| Lenovo Legion Go | |
| ONEXPLAYER 2 Pro AR18 | |
| Average AMD Ryzen 7 8840U (47579 - 59549, n=5) | |
| MSI Claw | |
| Average of class Handheld / UMPC (23417 - 66618, n=11, last 2 years) | |
| 7-Zip 18.03 / 7z b 4 -mmt1 | |
| Asus ROG Ally X | |
| Zotac ZGC-G1A1W-01 | |
| Average AMD Ryzen 7 8840U (4168 - 6469, n=5) | |
| ONEXPLAYER 2 Pro AR18 | |
| Ayaneo Kun | |
| MSI Claw | |
| Average of class Handheld / UMPC (3675 - 6143, n=12, last 2 years) | |
| Geekbench 6.7 / Multi-Core | |
| Asus ROG Ally X | |
| Lenovo Legion Go | |
| Lenovo Legion Go | |
| Average AMD Ryzen 7 8840U (9609 - 12664, n=5) | |
| MSI Claw | |
| Zotac ZGC-G1A1W-01 | |
| Average of class Handheld / UMPC (3950 - 13426, n=13, last 2 years) | |
| Ayaneo Kun | |
| ONEXPLAYER 2 Pro AR18 | |
| Geekbench 6.7 / Single-Core | |
| Asus ROG Ally X | |
| Lenovo Legion Go | |
| Lenovo Legion Go | |
| Zotac ZGC-G1A1W-01 | |
| MSI Claw | |
| Average AMD Ryzen 7 8840U (1654 - 2607, n=5) | |
| Average of class Handheld / UMPC (1333 - 2904, n=13, last 2 years) | |
| ONEXPLAYER 2 Pro AR18 | |
| Ayaneo Kun | |
| Geekbench 5.5 / Multi-Core | |
| Asus ROG Ally X | |
| MSI Claw | |
| Lenovo Legion Go | |
| Lenovo Legion Go | |
| Average AMD Ryzen 7 8840U (8205 - 11296, n=5) | |
| Zotac ZGC-G1A1W-01 | |
| Average of class Handheld / UMPC (3932 - 13086, n=13, last 2 years) | |
| Ayaneo Kun | |
| ONEXPLAYER 2 Pro AR18 | |
| Geekbench 5.5 / Single-Core | |
| Asus ROG Ally X | |
| Lenovo Legion Go | |
| Lenovo Legion Go | |
| Zotac ZGC-G1A1W-01 | |
| MSI Claw | |
| Average AMD Ryzen 7 8840U (1278 - 1937, n=5) | |
| Average of class Handheld / UMPC (875 - 2134, n=13, last 2 years) | |
| ONEXPLAYER 2 Pro AR18 | |
| Ayaneo Kun | |
| HWBOT x265 Benchmark v2.2 / 4k Preset | |
| Asus ROG Ally X | |
| Ayaneo Kun | |
| Lenovo Legion Go | |
| ONEXPLAYER 2 Pro AR18 | |
| Zotac ZGC-G1A1W-01 | |
| Average AMD Ryzen 7 8840U (12.5 - 16.5, n=5) | |
| MSI Claw | |
| Average of class Handheld / UMPC (6.21 - 20.8, n=12, last 2 years) | |
| LibreOffice / 20 Documents To PDF | |
| Average of class Handheld / UMPC (41.1 - 92.8, n=12, last 2 years) | |
| ONEXPLAYER 2 Pro AR18 | |
| Zotac ZGC-G1A1W-01 | |
| Average AMD Ryzen 7 8840U (49 - 63.8, n=5) | |
| Ayaneo Kun | |
| Lenovo Legion Go | |
| Asus ROG Ally X | |
| MSI Claw | |
| R Benchmark 2.5 / Overall mean | |
| Average of class Handheld / UMPC (0.4167 - 0.756, n=12, last 2 years) | |
| Average AMD Ryzen 7 8840U (0.4514 - 0.678, n=5) | |
| Ayaneo Kun | |
| Ayaneo Kun | |
| ONEXPLAYER 2 Pro AR18 | |
| Zotac ZGC-G1A1W-01 | |
| MSI Claw | |
| Lenovo Legion Go | |
| Asus ROG Ally X | |
* ... smaller is better
AIDA64: FP32 Ray-Trace | FPU Julia | CPU SHA3 | CPU Queen | FPU SinJulia | FPU Mandel | CPU AES | CPU ZLib | FP64 Ray-Trace | CPU PhotoWorxx
| Performance rating | |
| Ayaneo Kun | |
| Asus ROG Ally X | |
| ONEXPLAYER 2 Pro AR18 | |
| Zotac ZGC-G1A1W-01 | |
| Lenovo Legion Go | |
| Average AMD Ryzen 7 8840U | |
| Average of class Handheld / UMPC | |
| MSI Claw | |
| AIDA64 / FP32 Ray-Trace | |
| Ayaneo Kun | |
| Ayaneo Kun | |
| Asus ROG Ally X | |
| ONEXPLAYER 2 Pro AR18 | |
| ONEXPLAYER 2 Pro AR18 | |
| Lenovo Legion Go | |
| Zotac ZGC-G1A1W-01 | |
| Average AMD Ryzen 7 8840U (15166 - 20723, n=5) | |
| Average of class Handheld / UMPC (6544 - 26450, n=12, last 2 years) | |
| MSI Claw | |
| AIDA64 / FPU Julia | |
| Ayaneo Kun | |
| Ayaneo Kun | |
| Asus ROG Ally X | |
| ONEXPLAYER 2 Pro AR18 | |
| ONEXPLAYER 2 Pro AR18 | |
| Lenovo Legion Go | |
| Zotac ZGC-G1A1W-01 | |
| Average AMD Ryzen 7 8840U (64229 - 87120, n=5) | |
| Average of class Handheld / UMPC (36464 - 99389, n=12, last 2 years) | |
| MSI Claw | |
| AIDA64 / CPU SHA3 | |
| Ayaneo Kun | |
| Ayaneo Kun | |
| Asus ROG Ally X | |
| ONEXPLAYER 2 Pro AR18 | |
| ONEXPLAYER 2 Pro AR18 | |
| Zotac ZGC-G1A1W-01 | |
| Lenovo Legion Go | |
| Average AMD Ryzen 7 8840U (3156 - 3896, n=5) | |
| Average of class Handheld / UMPC (1157 - 4484, n=12, last 2 years) | |
| MSI Claw | |
| AIDA64 / CPU Queen | |
| Ayaneo Kun | |
| Ayaneo Kun | |
| Asus ROG Ally X | |
| ONEXPLAYER 2 Pro AR18 | |
| Zotac ZGC-G1A1W-01 | |
| Lenovo Legion Go | |
| Average AMD Ryzen 7 8840U (76873 - 110682, n=5) | |
| MSI Claw | |
| Average of class Handheld / UMPC (41744 - 95230, n=11, last 2 years) | |
| AIDA64 / FPU SinJulia | |
| Ayaneo Kun | |
| Ayaneo Kun | |
| Asus ROG Ally X | |
| ONEXPLAYER 2 Pro AR18 | |
| ONEXPLAYER 2 Pro AR18 | |
| Lenovo Legion Go | |
| Zotac ZGC-G1A1W-01 | |
| Average AMD Ryzen 7 8840U (10289 - 13143, n=5) | |
| Average of class Handheld / UMPC (4023 - 16980, n=12, last 2 years) | |
| MSI Claw | |
| AIDA64 / FPU Mandel | |
| Ayaneo Kun | |
| Ayaneo Kun | |
| Asus ROG Ally X | |
| ONEXPLAYER 2 Pro AR18 | |
| ONEXPLAYER 2 Pro AR18 | |
| Lenovo Legion Go | |
| Zotac ZGC-G1A1W-01 | |
| Average AMD Ryzen 7 8840U (34209 - 45793, n=5) | |
| Average of class Handheld / UMPC (19153 - 52245, n=12, last 2 years) | |
| MSI Claw | |
| AIDA64 / CPU AES | |
| Ayaneo Kun | |
| Ayaneo Kun | |
| ONEXPLAYER 2 Pro AR18 | |
| ONEXPLAYER 2 Pro AR18 | |
| Average AMD Ryzen 7 8840U (70017 - 119040, n=5) | |
| Asus ROG Ally X | |
| Zotac ZGC-G1A1W-01 | |
| MSI Claw | |
| Average of class Handheld / UMPC (18552 - 119040, n=11, last 2 years) | |
| Lenovo Legion Go | |
| AIDA64 / CPU ZLib | |
| Ayaneo Kun | |
| Ayaneo Kun | |
| Asus ROG Ally X | |
| ONEXPLAYER 2 Pro AR18 | |
| ONEXPLAYER 2 Pro AR18 | |
| Zotac ZGC-G1A1W-01 | |
| Average AMD Ryzen 7 8840U (654 - 869, n=5) | |
| MSI Claw | |
| Average of class Handheld / UMPC (356 - 1112, n=12, last 2 years) | |
| Lenovo Legion Go | |
| AIDA64 / FP64 Ray-Trace | |
| Ayaneo Kun | |
| Ayaneo Kun | |
| Asus ROG Ally X | |
| ONEXPLAYER 2 Pro AR18 | |
| ONEXPLAYER 2 Pro AR18 | |
| Lenovo Legion Go | |
| Zotac ZGC-G1A1W-01 | |
| Average AMD Ryzen 7 8840U (7715 - 10812, n=5) | |
| Average of class Handheld / UMPC (3585 - 14181, n=12, last 2 years) | |
| MSI Claw | |
| AIDA64 / CPU PhotoWorxx | |
| MSI Claw | |
| Average of class Handheld / UMPC (19472 - 59897, n=12, last 2 years) | |
| Asus ROG Ally X | |
| Average AMD Ryzen 7 8840U (34561 - 40481, n=5) | |
| Lenovo Legion Go | |
| Zotac ZGC-G1A1W-01 | |
| Ayaneo Kun | |
| Ayaneo Kun | |
| ONEXPLAYER 2 Pro AR18 | |
| ONEXPLAYER 2 Pro AR18 | |
System performance
The Zotac Zone also showed no surprises when it came to its general system performance. In various benchmarks such as PCMark 10 and CrossMark, it ranked seamlessly between the other handheld PCs we tested. Its combination of a powerful CPU, fast RAM and an NVMe SSD ensures a smooth and responsive system.
CrossMark: Overall | Productivity | Creativity | Responsiveness
WebXPRT 3: Overall
WebXPRT 4: Overall
Mozilla Kraken 1.1: Total
| PCMark 10 / Score | |
| Asus ROG Ally X | |
| Average of class Handheld / UMPC (3592 - 9701, n=12, last 2 years) | |
| Zotac ZGC-G1A1W-01 | |
| Average AMD Ryzen 7 8840U, AMD Radeon 780M (5940 - 7098, n=5) | |
| MSI Claw | |
| Lenovo Legion Go | |
| Ayaneo Kun | |
| ONEXPLAYER 2 Pro AR18 | |
| PCMark 10 / Essentials | |
| Asus ROG Ally X | |
| Average AMD Ryzen 7 8840U, AMD Radeon 780M (9541 - 10664, n=5) | |
| Zotac ZGC-G1A1W-01 | |
| Lenovo Legion Go | |
| Average of class Handheld / UMPC (7542 - 11262, n=12, last 2 years) | |
| MSI Claw | |
| Ayaneo Kun | |
| ONEXPLAYER 2 Pro AR18 | |
| PCMark 10 / Productivity | |
| Average of class Handheld / UMPC (5015 - 19236, n=12, last 2 years) | |
| Asus ROG Ally X | |
| Average AMD Ryzen 7 8840U, AMD Radeon 780M (7522 - 10386, n=5) | |
| Zotac ZGC-G1A1W-01 | |
| Lenovo Legion Go | |
| MSI Claw | |
| Ayaneo Kun | |
| ONEXPLAYER 2 Pro AR18 | |
| PCMark 10 / Digital Content Creation | |
| Asus ROG Ally X | |
| MSI Claw | |
| Ayaneo Kun | |
| Average of class Handheld / UMPC (3326 - 12612, n=12, last 2 years) | |
| Zotac ZGC-G1A1W-01 | |
| Average AMD Ryzen 7 8840U, AMD Radeon 780M (7690 - 8762, n=5) | |
| ONEXPLAYER 2 Pro AR18 | |
| Lenovo Legion Go | |
| CrossMark / Overall | |
| MSI Claw | |
| Asus ROG Ally X | |
| Zotac ZGC-G1A1W-01 | |
| Average AMD Ryzen 7 8840U, AMD Radeon 780M (1541 - 1766, n=4) | |
| Average of class Handheld / UMPC (865 - 1881, n=11, last 2 years) | |
| Ayaneo Kun | |
| ONEXPLAYER 2 Pro AR18 | |
| CrossMark / Productivity | |
| Zotac ZGC-G1A1W-01 | |
| MSI Claw | |
| Asus ROG Ally X | |
| Average AMD Ryzen 7 8840U, AMD Radeon 780M (1514 - 1695, n=4) | |
| Average of class Handheld / UMPC (878 - 1719, n=11, last 2 years) | |
| Ayaneo Kun | |
| ONEXPLAYER 2 Pro AR18 | |
| CrossMark / Creativity | |
| Asus ROG Ally X | |
| MSI Claw | |
| Average AMD Ryzen 7 8840U, AMD Radeon 780M (1677 - 1948, n=4) | |
| Zotac ZGC-G1A1W-01 | |
| Average of class Handheld / UMPC (891 - 2150, n=11, last 2 years) | |
| ONEXPLAYER 2 Pro AR18 | |
| Ayaneo Kun | |
| CrossMark / Responsiveness | |
| Zotac ZGC-G1A1W-01 | |
| MSI Claw | |
| Ayaneo Kun | |
| Average AMD Ryzen 7 8840U, AMD Radeon 780M (1262 - 1543, n=4) | |
| Asus ROG Ally X | |
| Average of class Handheld / UMPC (759 - 1677, n=11, last 2 years) | |
| ONEXPLAYER 2 Pro AR18 | |
| WebXPRT 3 / Overall | |
| Asus ROG Ally X | |
| Zotac ZGC-G1A1W-01 | |
| Lenovo Legion Go | |
| Average AMD Ryzen 7 8840U, AMD Radeon 780M (216 - 306, n=5) | |
| MSI Claw | |
| Average of class Handheld / UMPC (170.3 - 325, n=13, last 2 years) | |
| ONEXPLAYER 2 Pro AR18 | |
| Ayaneo Kun | |
| Ayaneo Kun | |
| WebXPRT 4 / Overall | |
| MSI Claw | |
| Asus ROG Ally X | |
| Zotac ZGC-G1A1W-01 | |
| Average of class Handheld / UMPC (134.4 - 291, n=13, last 2 years) | |
| Average AMD Ryzen 7 8840U, AMD Radeon 780M (170.4 - 249, n=4) | |
| Ayaneo Kun | |
| Mozilla Kraken 1.1 / Total | |
| Ayaneo Kun | |
| Ayaneo Kun | |
| Average of class Handheld / UMPC (428 - 931, n=12, last 2 years) | |
| Average AMD Ryzen 7 8840U, AMD Radeon 780M (515 - 779, n=5) | |
| Lenovo Legion Go | |
| Zotac ZGC-G1A1W-01 | |
| Asus ROG Ally X | |
| MSI Claw | |
| ONEXPLAYER 2 Pro AR18 | |
* ... smaller is better
| PCMark 10 Score | 6636 points | |
Help | ||
| AIDA64 / Memory Copy | |
| MSI Claw | |
| Average of class Handheld / UMPC (33517 - 107929, n=12, last 2 years) | |
| Lenovo Legion Go | |
| Zotac ZGC-G1A1W-01 | |
| Asus ROG Ally X | |
| Average AMD Ryzen 7 8840U (65911 - 76458, n=5) | |
| Ayaneo Kun | |
| Ayaneo Kun | |
| ONEXPLAYER 2 Pro AR18 | |
| ONEXPLAYER 2 Pro AR18 | |
| AIDA64 / Memory Read | |
| MSI Claw | |
| Average of class Handheld / UMPC (25476 - 103022, n=12, last 2 years) | |
| Zotac ZGC-G1A1W-01 | |
| Asus ROG Ally X | |
| Lenovo Legion Go | |
| Average AMD Ryzen 7 8840U (49381 - 61307, n=5) | |
| Ayaneo Kun | |
| ONEXPLAYER 2 Pro AR18 | |
| ONEXPLAYER 2 Pro AR18 | |
| AIDA64 / Memory Write | |
| Lenovo Legion Go | |
| Asus ROG Ally X | |
| Zotac ZGC-G1A1W-01 | |
| Average AMD Ryzen 7 8840U (83400 - 106180, n=5) | |
| Average of class Handheld / UMPC (25595 - 117883, n=12, last 2 years) | |
| MSI Claw | |
| Ayaneo Kun | |
| Ayaneo Kun | |
| Ayaneo Kun | |
| ONEXPLAYER 2 Pro AR18 | |
| ONEXPLAYER 2 Pro AR18 | |
| AIDA64 / Memory Latency | |
| MSI Claw | |
| Ayaneo Kun | |
| Ayaneo Kun | |
| ONEXPLAYER 2 Pro AR18 | |
| ONEXPLAYER 2 Pro AR18 | |
| Asus ROG Ally X | |
| Zotac ZGC-G1A1W-01 | |
| Lenovo Legion Go | |
| Average AMD Ryzen 7 8840U (98.9 - 133.7, n=5) | |
| Average of class Handheld / UMPC (99.8 - 147.6, n=12, last 2 years) | |
* ... smaller is better
DPC latencies
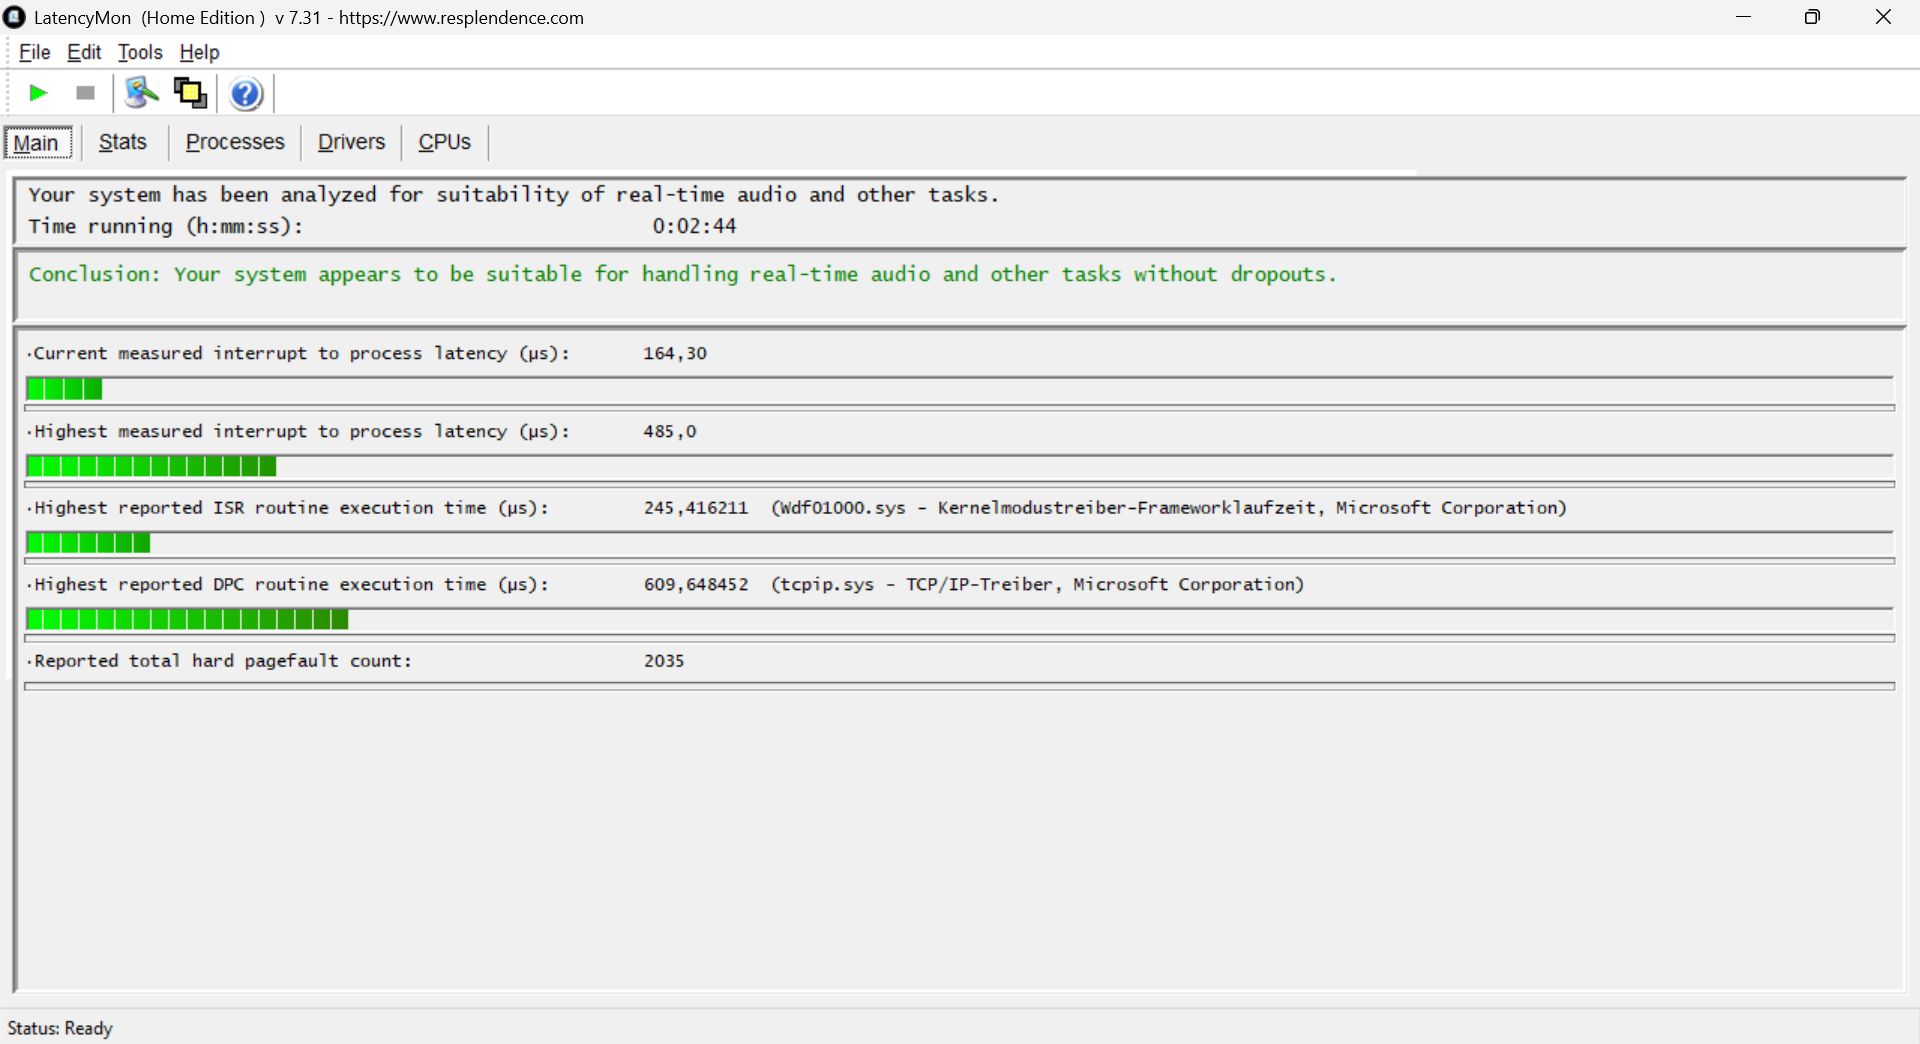
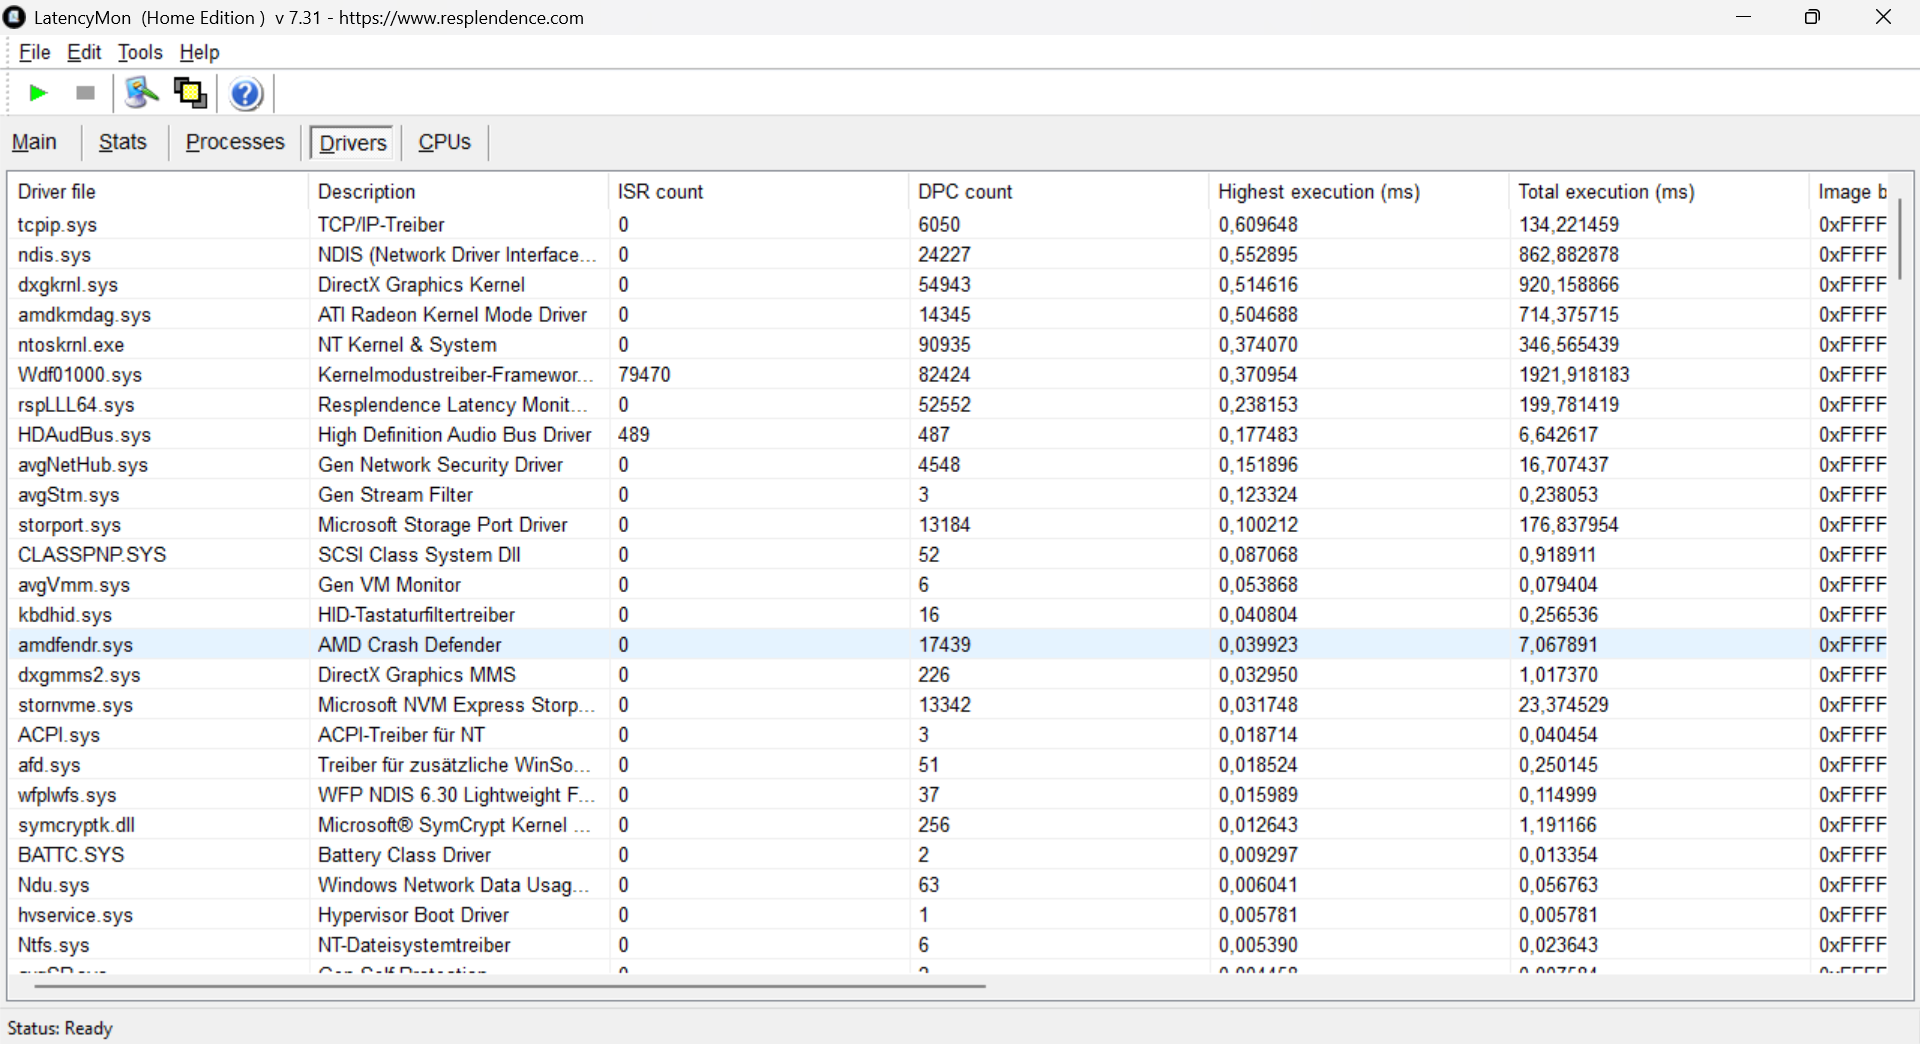
| DPC Latencies / LatencyMon - interrupt to process latency (max), Web, Youtube, Prime95 | |
| Zotac ZGC-G1A1W-01 | |
* ... smaller is better
Storage device
The Zotac Zone is equipped with a 512 GB NVMe SSD that performed well in our tests. Its read and write speeds were within the expected range, ensuring short loading times in games and applications. However, its capacity of 512 GB could be a little tight for some gamers. Current games often require between 30 and 90 GB of storage space, meaning that only a tiny fraction of the Steam library can be downloaded on the Zotac Zone in an emergency.

| Drive Performance rating - Percent | |
| Zotac ZGC-G1A1W-01 | |
| Average Phison PS5021-E21 512GB | |
| Ayaneo Kun | |
| Average of class Handheld / UMPC | |
| Lenovo Legion Go | |
| MSI Claw | |
| Asus ROG Ally X | |
* ... smaller is better
Reading continuous performance: DiskSpd Read Loop, Queue Depth 8
Graphics card
The integrated AMD Radeon 780M shows what it is capable of inside the Zotac Zone. Modern games such as Cyberpunk 2077 and F1 2024 run in the display's native Full HD resolution with frame rates between 30 and 60fps. However, if you want to avoid annoying tearing, it is better to limit the frame rate to 60fps. Thanks to modern upscaling technologies such as FSR, you can enjoy running current games smoothly using the highest graphics settings.
Most games offer various setting options to adjust graphics and performance. FPS limiters and upscaling technologies such as FSR can reduce energy consumption and significantly reduce the device's temperatures and fan noise. After all, a gaming handheld is not always about the maximum frame rate, but about a smooth and enjoyable gaming experience. This is where the Zotac Zone really delivers.
| 3DMark Performance rating - Percent | |
| Average of class Handheld / UMPC | |
| Ayaneo Kun | |
| Asus ROG Ally X -1! | |
| MSI Claw -1! | |
| Zotac ZGC-G1A1W-01 | |
| Lenovo Legion Go | |
| ONEXPLAYER 2 Pro AR18 | |
| Average AMD Radeon 780M | |
| 3DMark 11 Performance | 12670 points | |
| 3DMark Ice Storm Standard Score | 181792 points | |
| 3DMark Cloud Gate Standard Score | 28734 points | |
| 3DMark Fire Strike Score | 7793 points | |
| 3DMark Fire Strike Extreme Score | 4128 points | |
| 3DMark Time Spy Score | 3337 points | |
| 3DMark Steel Nomad Score | 504 points | |
| 3DMark Steel Nomad Light Score | 2786 points | |
Help | ||
* ... smaller is better
| Performance rating - Percent | |
| Average of class Handheld / UMPC | |
| Asus ROG Ally X | |
| Lenovo Legion Go -2! | |
| Zotac ZGC-G1A1W-01 | |
| ONEXPLAYER 2 Pro AR18 -2! | |
| Ayaneo Kun -1! | |
| MSI Claw -1! | |
| Cyberpunk 2077 - 1920x1080 Ultra Preset (FSR off) | |
| Average of class Handheld / UMPC (12.4 - 91.4, n=18, last 2 years) | |
| Asus ROG Ally X | |
| MSI Claw | |
| Zotac ZGC-G1A1W-01 | |
| Baldur's Gate 3 - 1920x1080 Ultra Preset AA:T | |
| Average of class Handheld / UMPC (16.8 - 118.8, n=16, last 2 years) | |
| Ayaneo Kun | |
| Asus ROG Ally X | |
| Zotac ZGC-G1A1W-01 | |
| MSI Claw | |
| GTA V - 1920x1080 Highest AA:4xMSAA + FX AF:16x | |
| Zotac ZGC-G1A1W-01 | |
| Average of class Handheld / UMPC (14 - 39.2, n=11, last 2 years) | |
| Asus ROG Ally X | |
| Ayaneo Kun | |
| Ayaneo Kun | |
| ONEXPLAYER 2 Pro AR18 | |
| Lenovo Legion Go | |
| Final Fantasy XV Benchmark - 1920x1080 High Quality | |
| Average of class Handheld / UMPC (17.9 - 50.3, n=16, last 2 years) | |
| Asus ROG Ally X | |
| Ayaneo Kun | |
| Zotac ZGC-G1A1W-01 | |
| ONEXPLAYER 2 Pro AR18 | |
| Lenovo Legion Go | |
| MSI Claw | |
| Strange Brigade - 1920x1080 ultra AA:ultra AF:16 | |
| Average of class Handheld / UMPC (33.6 - 96.8, n=17, last 2 years) | |
| Asus ROG Ally X | |
| Zotac ZGC-G1A1W-01 | |
| Ayaneo Kun | |
| ONEXPLAYER 2 Pro AR18 | |
| MSI Claw | |
| Lenovo Legion Go | |
| Dota 2 Reborn - 1920x1080 ultra (3/3) best looking | |
| Lenovo Legion Go | |
| Asus ROG Ally X | |
| Zotac ZGC-G1A1W-01 | |
| Average of class Handheld / UMPC (30.8 - 103.8, n=16, last 2 years) | |
| MSI Claw | |
| ONEXPLAYER 2 Pro AR18 | |
| Ayaneo Kun | |
| Ayaneo Kun | |
| X-Plane 11.11 - 1920x1080 high (fps_test=3) | |
| MSI Claw | |
| Average of class Handheld / UMPC (22.7 - 50.5, n=16, last 2 years) | |
| Lenovo Legion Go | |
| Asus ROG Ally X | |
| Zotac ZGC-G1A1W-01 | |
| ONEXPLAYER 2 Pro AR18 | |
| Ayaneo Kun | |
| Ayaneo Kun | |
Cyberpunk 2077 ultra FPS diagram
| low | med. | high | ultra | |
|---|---|---|---|---|
| GTA V (2015) | 67.7 | 29 | ||
| Dota 2 Reborn (2015) | 127 | 106.9 | 83.8 | 74.5 |
| Final Fantasy XV Benchmark (2018) | 38.3 | 28.5 | ||
| X-Plane 11.11 (2018) | 53.4 | 39.3 | 32.9 | |
| Strange Brigade (2018) | 178.9 | 72.5 | 58.1 | 49.9 |
| Baldur's Gate 3 (2023) | 30.2 | 25.4 | 24.5 | |
| Cyberpunk 2077 (2023) | 39.2 | 24.9 | 25.9 | 19.5 |
| Horizon Forbidden West (2024) | 27.2 | 24.1 | ||
| F1 24 (2024) | 63.8 | 46.3 |
Emissions & energy
Noise emissions
The Zotac Zone is not silent, but it is not a nuisance either. In idle mode and during simple tasks, the built-in fan usually spins along, but it mostly blends into the background at 30 to 32 dB(A). Under load, the volume increases, but doesn't quite reach the 40 dB(A) mark. The fan is therefore barely annoying and is normally not noticeable during gaming sessions. It is worth mentioning that no unpleasant whistling noises are produced. The whirring noise is nice and even.
Noise level
| Idle |
| 25.6 / 28.4 / 33.4 dB(A) |
| Load |
| / 38.9 dB(A) |
 | ||
30 dB silent 40 dB(A) audible 50 dB(A) loud |
||
min: | ||
| Zotac ZGC-G1A1W-01 Radeon 780M, R7 8840U, Phison PS5021-E21 512GB | Ayaneo Kun Radeon 780M, R7 7840U, Phison M.2 2280 E18 4000GB | ONEXPLAYER 2 Pro AR18 Radeon 780M, R7 7840U | MSI Claw Arc 8-Core, Ultra 7 155H, Kioxia BG5 KBG50ZNS1T02 | Lenovo Legion Go Radeon 780M, Z1 Extreme, WD PC SN740 512GB SDDPMQD-512G-1101 | Asus ROG Ally X Radeon 780M, Z1 Extreme, WD PC SN560 SDDPNQE-1T00 | |
|---|---|---|---|---|---|---|
| Noise | -6% | 6% | -8% | 14% | 2% | |
| off / environment * (dB) | 25.6 | 24.4 5% | 25.7 -0% | 23 10% | 24.7 4% | |
| Idle Minimum * (dB) | 25.6 | 25.31 1% | 24.4 5% | 25.7 -0% | 23 10% | 24.7 4% |
| Idle Average * (dB) | 28.4 | 25.31 11% | 24.4 14% | 31.7 -12% | 23 19% | 24.7 13% |
| Idle Maximum * (dB) | 33.4 | 34.5 -3% | 30.6 8% | 31.7 5% | 25 25% | 28.5 15% |
| Cyberpunk 2077 ultra * (dB) | 37.6 | 45.5 -21% | 42.6 -13% | |||
| Load Maximum * (dB) | 38.9 | 50.78 -31% | 39.3 -1% | 45.5 -17% | 37 5% | 42.6 -10% |
| Load Average * (dB) | 34.9 | 36 | 36.6 | 37 | 42.6 | |
| Witcher 3 ultra * (dB) | 46 |
* ... smaller is better
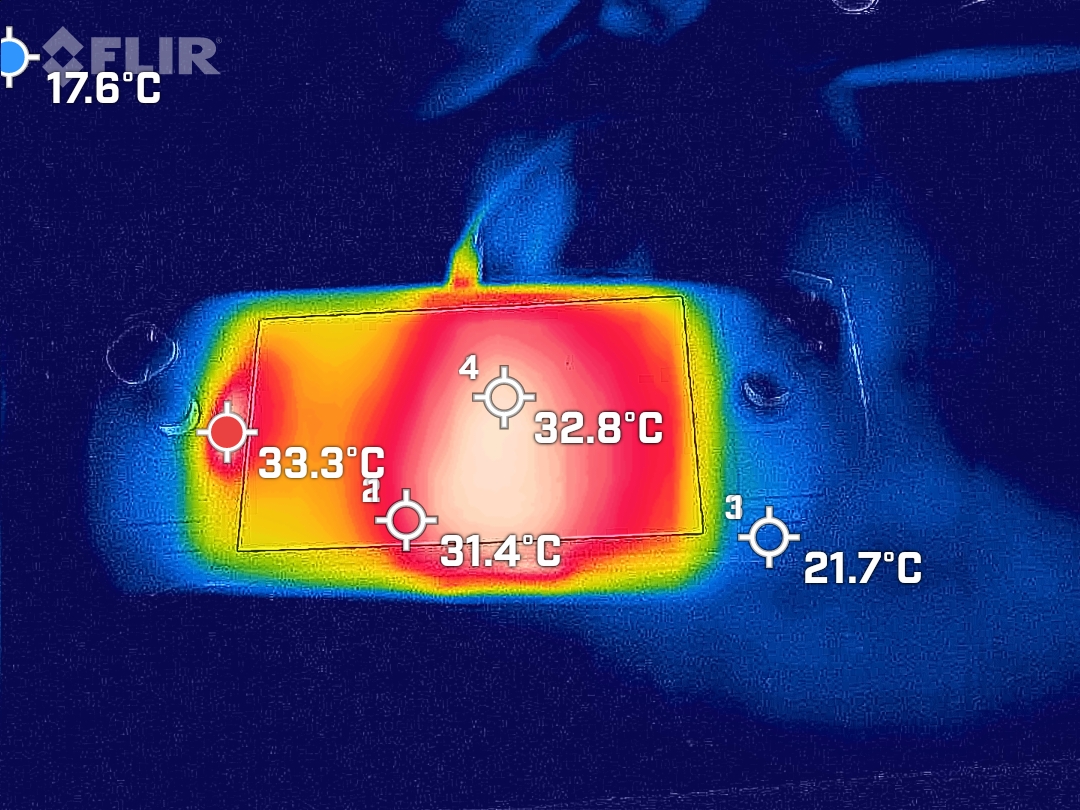
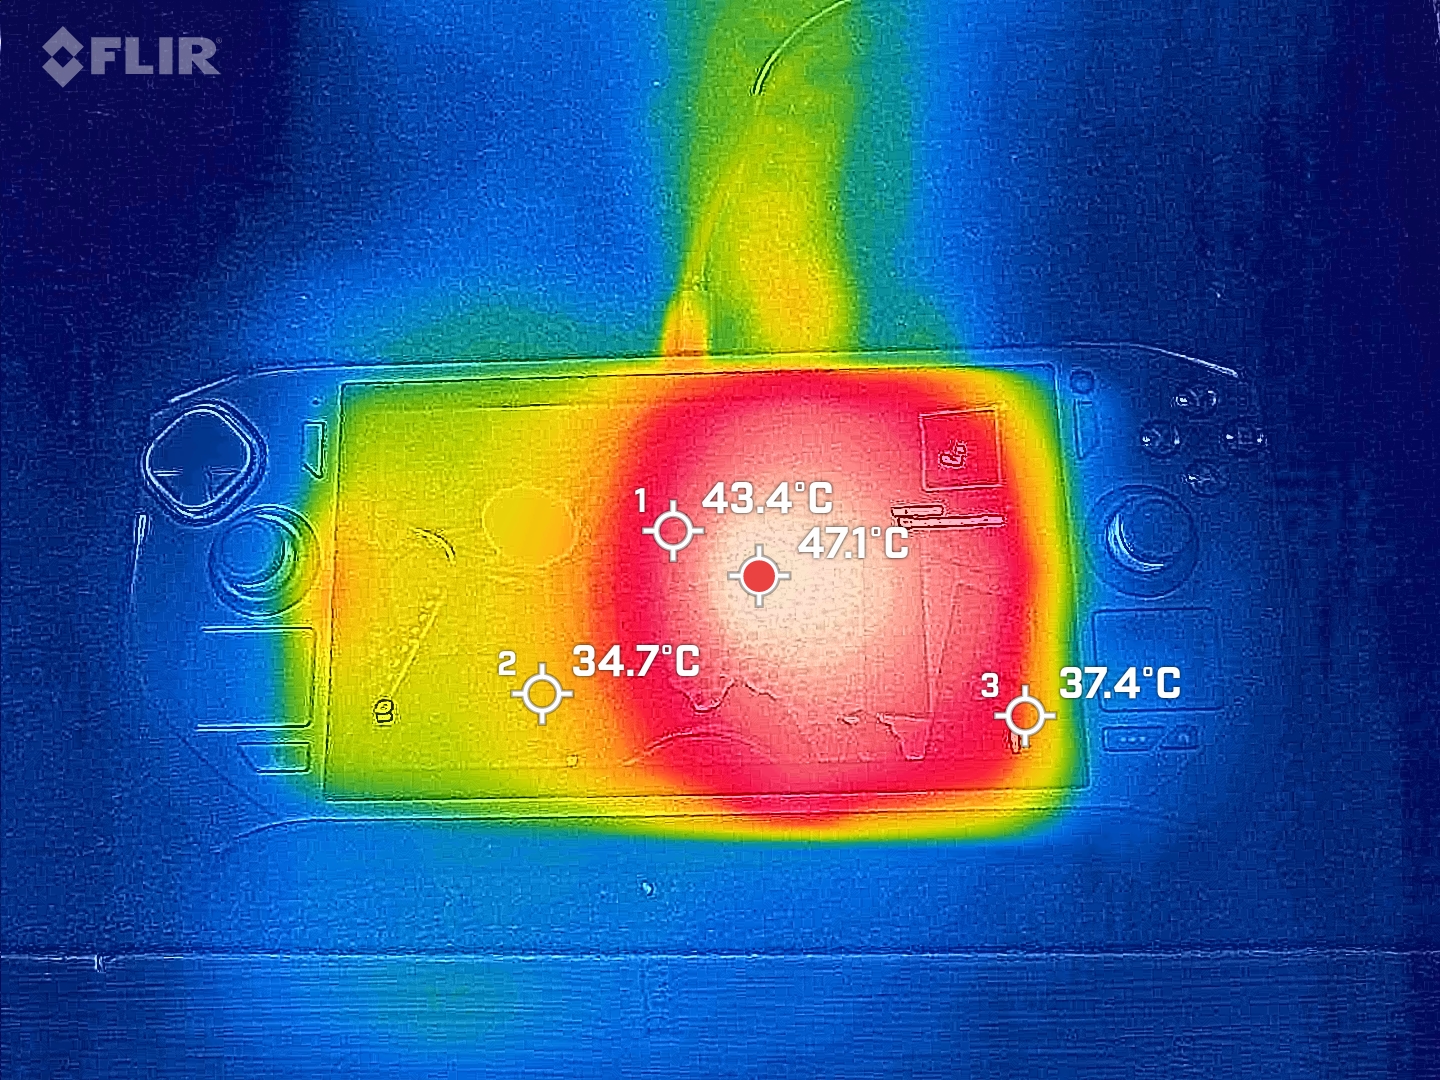
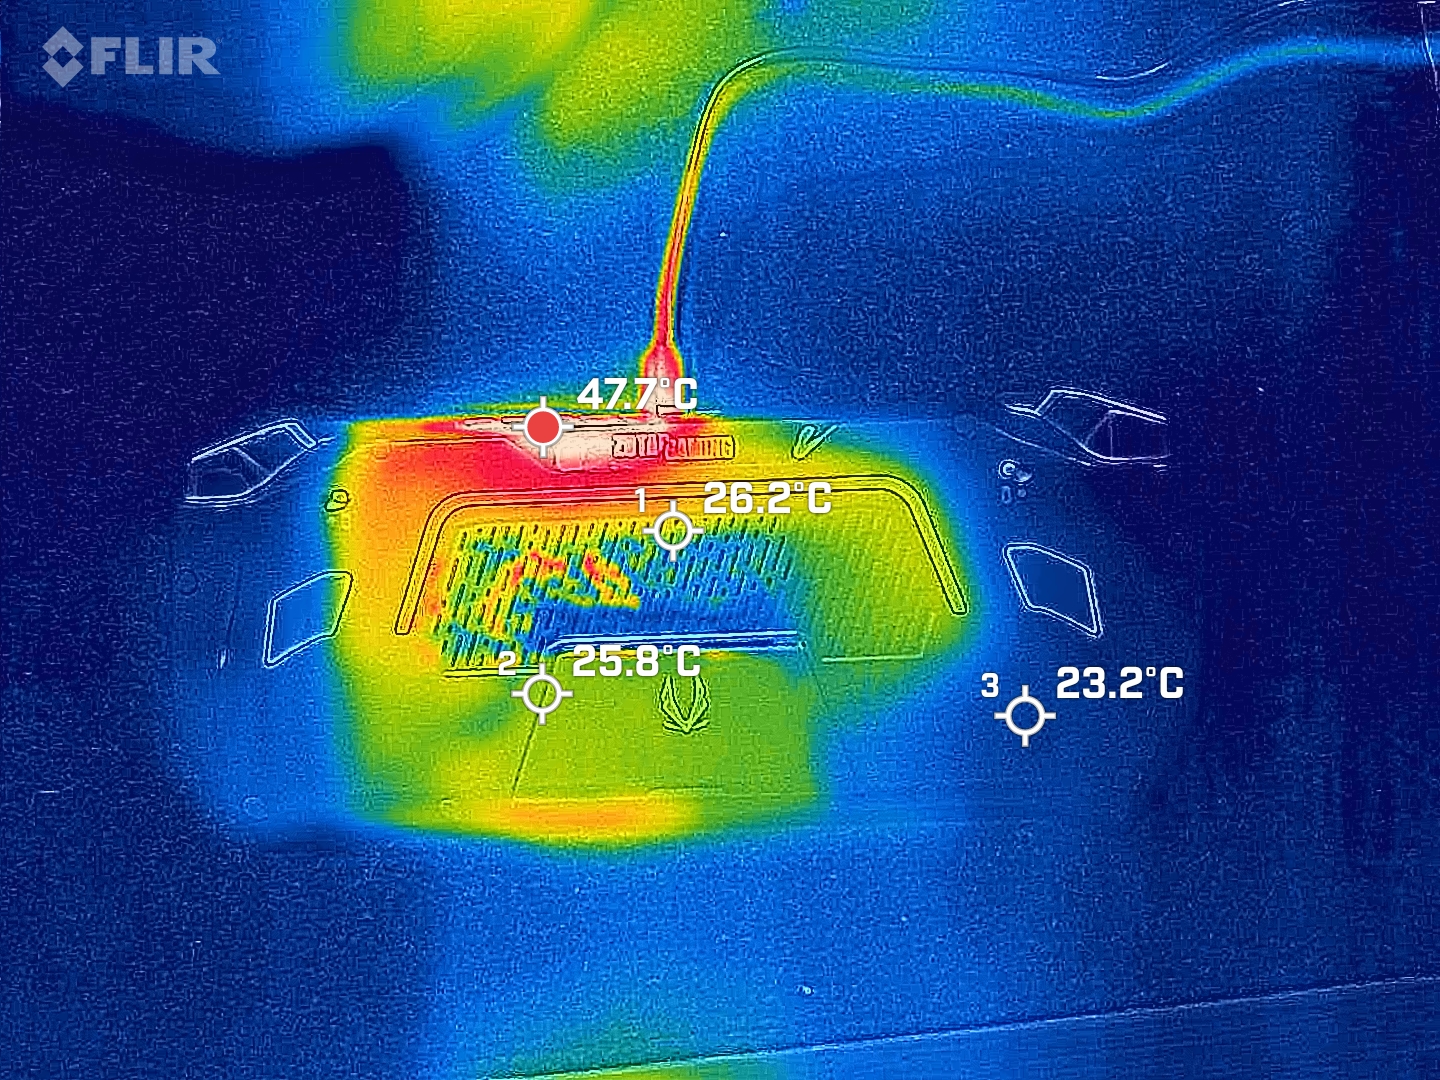
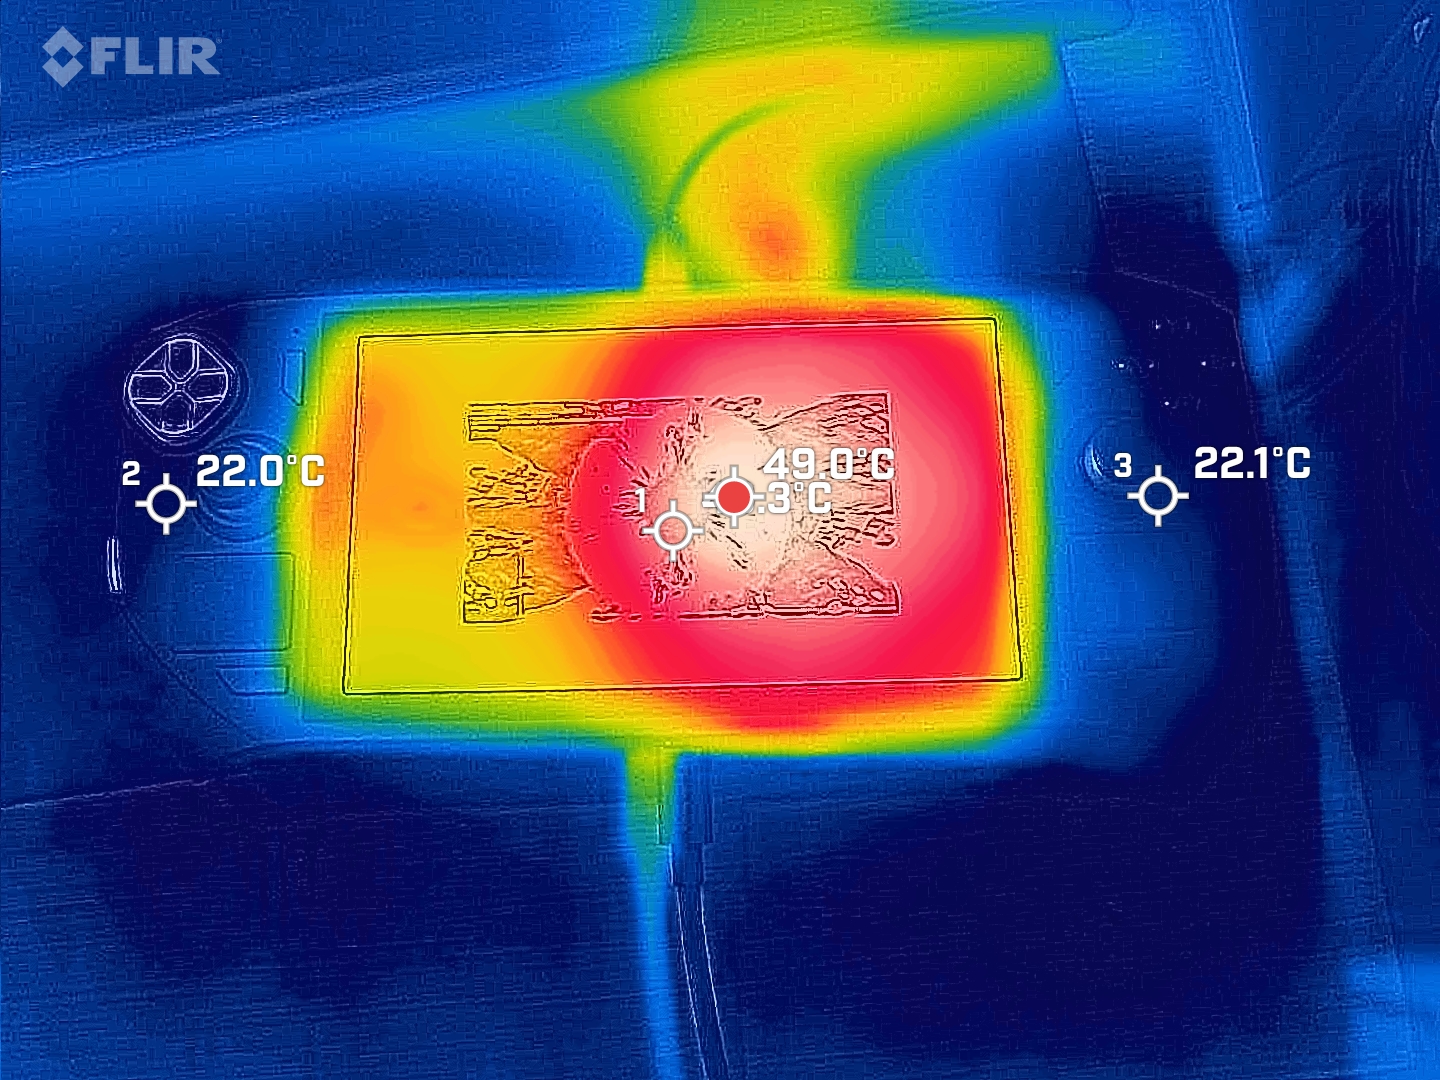
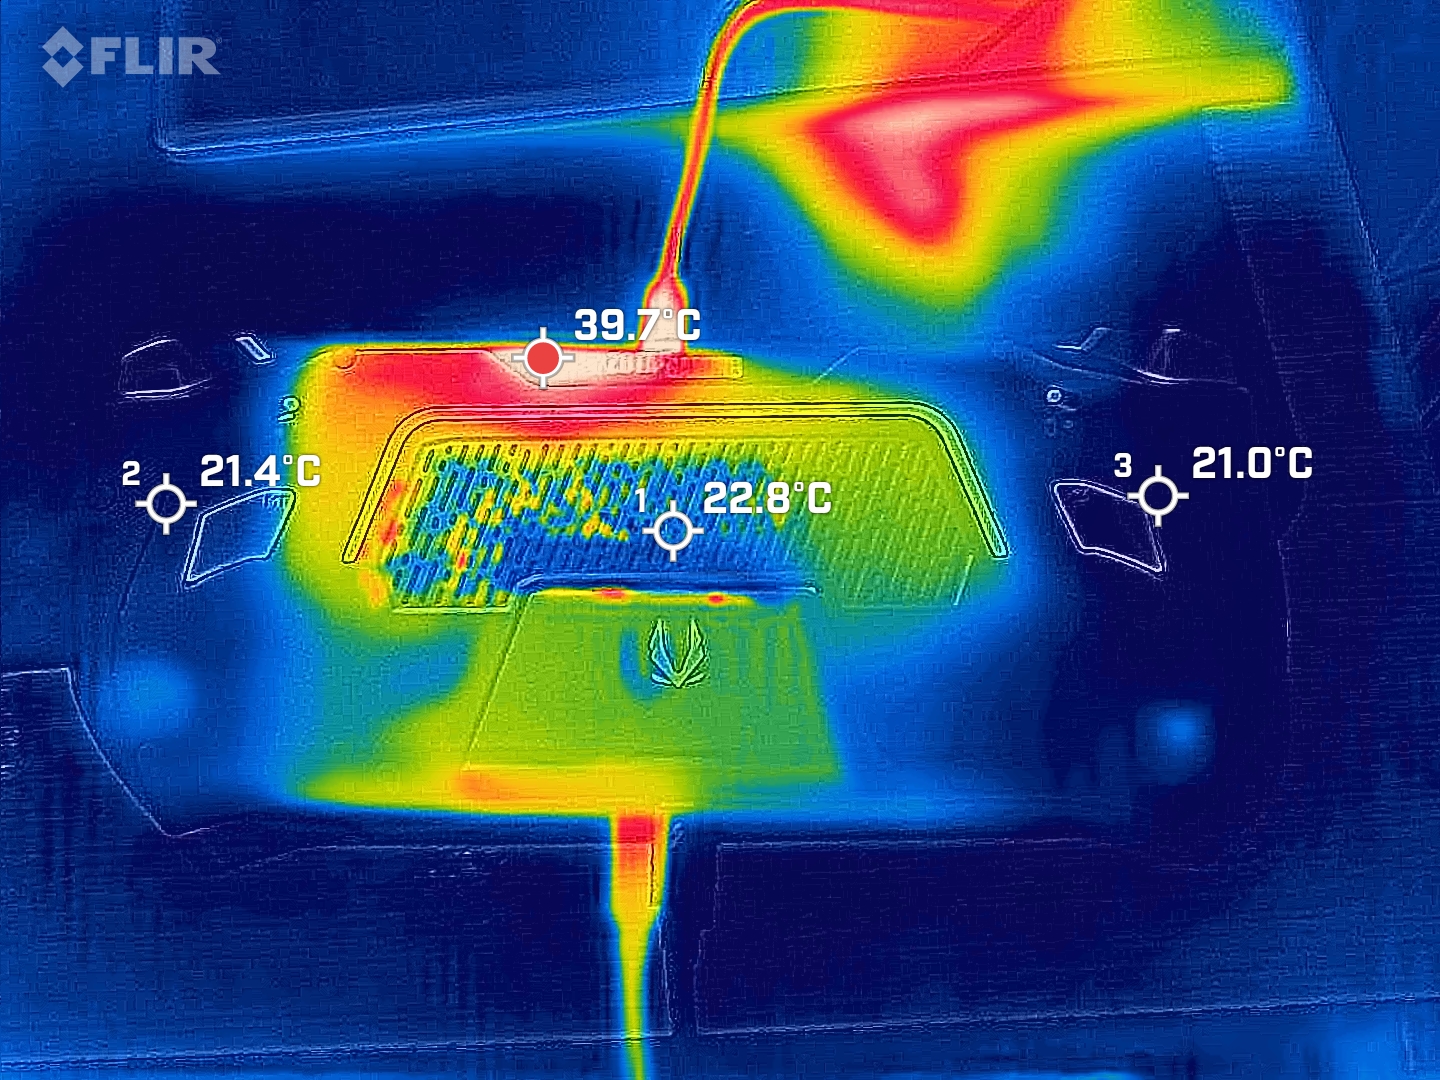
Temperature
While the handles of the Zotac Zone always stay nice and cool, the touchscreen and the back can heat up considerably under load. The temperatures on the plastic parts never reach alarming values, but the glass touchscreen reaches a temperature of up to 50 °C, which makes longer inputs uncomfortable.

Speakers
The speakers of the Zotac Zone deliver a sound that is typical for handheld PCs. The bass is a little reduced and the trebles aren't terribly balanced, resulting in a somewhat dull sound. The quality is sufficient for games and movies, but audiophile users will probably prefer to connect headphones.
Zotac ZGC-G1A1W-01 audio analysis
(±) | speaker loudness is average but good (79 dB)
Bass 100 - 315 Hz
(-) | nearly no bass - on average 18.8% lower than median
(+) | bass is linear (6.5% delta to prev. frequency)
Mids 400 - 2000 Hz
(±) | higher mids - on average 5.2% higher than median
(±) | linearity of mids is average (9% delta to prev. frequency)
Highs 2 - 16 kHz
(+) | balanced highs - only 3.7% away from median
(+) | highs are linear (5.7% delta to prev. frequency)
Overall 100 - 16.000 Hz
(±) | linearity of overall sound is average (19.8% difference to median)
Compared to same class
» 71% of all tested devices in this class were better, 13% similar, 17% worse
» The best had a delta of 12%, average was 17%, worst was 23%
Compared to all devices tested
» 50% of all tested devices were better, 7% similar, 42% worse
» The best had a delta of 4%, average was 23%, worst was 134%
Lenovo Legion Go audio analysis
(±) | speaker loudness is average but good (73.1 dB)
Bass 100 - 315 Hz
(-) | nearly no bass - on average 16.4% lower than median
(±) | linearity of bass is average (8.1% delta to prev. frequency)
Mids 400 - 2000 Hz
(±) | higher mids - on average 5.2% higher than median
(+) | mids are linear (6% delta to prev. frequency)
Highs 2 - 16 kHz
(±) | higher highs - on average 5.7% higher than median
(±) | linearity of highs is average (9.7% delta to prev. frequency)
Overall 100 - 16.000 Hz
(±) | linearity of overall sound is average (22.7% difference to median)
Compared to same class
» 92% of all tested devices in this class were better, 4% similar, 4% worse
» The best had a delta of 12%, average was 17%, worst was 23%
Compared to all devices tested
» 67% of all tested devices were better, 6% similar, 27% worse
» The best had a delta of 4%, average was 23%, worst was 134%
Power consumption
The Zotac Zone comes delivered with a compact and practical 65-watt USB-C power supply, which is suitable for worldwide use thanks to the included adapter. During our tests, we measured a maximum power consumption of 50 watts in the stress test. The device consumes a minimum of around 10 watts when switched on.
| Idle | |
Key:
min: | |
Power consumption Cyberpunk / stress test
Power consumption with external monitor
Runtimes
Unfortunately, the Zotac Zone—with its 3-cell Li-Ion battery (48.5 Wh)—doesn't last very long. Six hours of Wi-Fi web surfing is okay, but the battery runs out after just over an hour when playing demanding games. Gamers on the go should therefore make sure to have a power bank in their bag or a power socket nearby.
| Zotac ZGC-G1A1W-01 R7 8840U, Radeon 780M, 48.5 Wh | Ayaneo Kun R7 7840U, Radeon 780M, 75 Wh | ONEXPLAYER 2 Pro AR18 R7 7840U, Radeon 780M, 65 Wh | MSI Claw Ultra 7 155H, Arc 8-Core, 53 Wh | Lenovo Legion Go Z1 Extreme, Radeon 780M, 49.2 Wh | Asus ROG Ally X Z1 Extreme, Radeon 780M, 80 Wh | Ayaneo Air 1S Retro Power R7 7840U, Radeon 780M, 37.5 Wh | Average of class Handheld / UMPC | |
|---|---|---|---|---|---|---|---|---|
| Battery runtime | 67% | 80% | 19% | 0% | 119% | -2% | 95% | |
| WiFi v1.3 (h) | 6 | 10 67% | 10.8 80% | 7.8 30% | 6 0% | 15.8 163% | 5.9 -2% | 11.7 ? 95% |
| Cyberpunk 2077 ultra 150cd (h) | 1.2 | 1.3 8% | 2.1 75% | |||||
| Witcher 3 ultra (h) | 1.7 | 1.2 | ||||||
| Gaming (h) | 2 | 1.6 | 1.2 | 1.683 ? | ||||
| Load (h) | 0.8 | 1.3 | 2.1 | 1.1 | 1.05 ? | |||
| H.264 (h) | 8.8 | 19.6 | 3.1 |
Notebookcheck total rating

The Zotac Zone scores with its excellent haptics, professional-level controller, brilliant OLED screen and relatively quiet fan. Its battery life and speakers could be improved. Overall, this is an almost all-round successful handheld for anyone looking for a mobile gaming device with a premium feel.
Zotac ZGC-G1A1W-01
- 01/30/2025 v8
Marc Herter
 Total Sustainability Score:
 Transparency
The selection of devices to be reviewed is made by our editorial team. The test sample was provided to the author as a loan by the manufacturer or retailer for the purpose of this review. The lender had no influence on this review, nor did the manufacturer receive a copy of this review before publication. There was no obligation to publish this review. As an independent media company, Notebookcheck is not subjected to the authority of manufacturers, retailers or publishers.
This is how Notebookcheck is testing
Every year, Notebookcheck independently reviews hundreds of laptops and smartphones using standardized procedures to ensure that all results are comparable. We have continuously developed our test methods for around 20 years and set industry standards in the process. In our test labs, high-quality measuring equipment is utilized by experienced technicians and editors. These tests involve a multi-stage validation process. Our complex rating system is based on hundreds of well-founded measurements and benchmarks, which maintains objectivity. Further information on our test methods can be found here.

